Demopolis, AL Map & Demographics
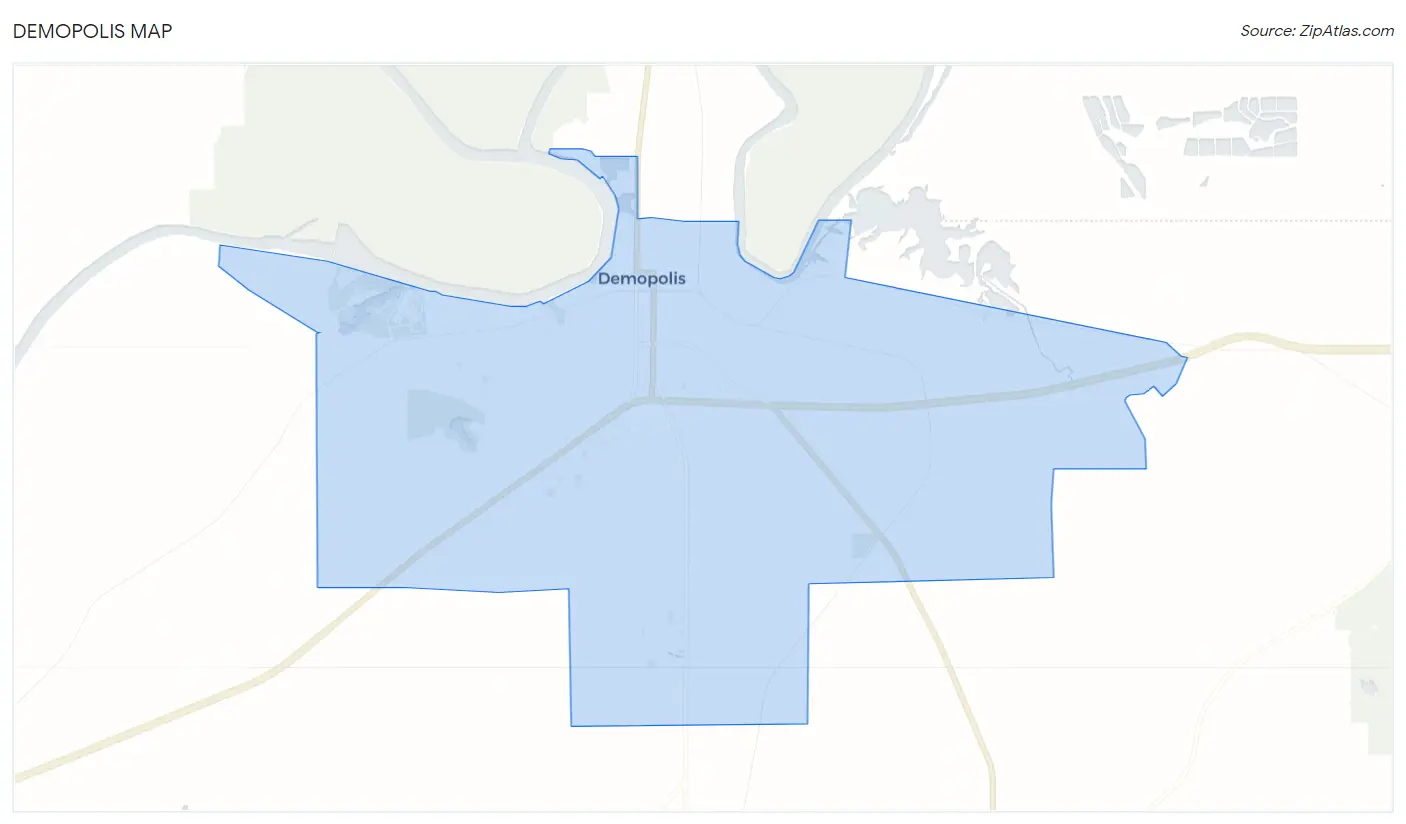
Demopolis Map
Demopolis Overview
$32,799
PER CAPITA INCOME
$68,323
AVG FAMILY INCOME
$51,364
AVG HOUSEHOLD INCOME
30.0%
WAGE / INCOME GAP [ % ]
70.0¢/ $1
WAGE / INCOME GAP [ $ ]
0.54
INEQUALITY / GINI INDEX
7,080
TOTAL POPULATION
2,971
MALE POPULATION
4,109
FEMALE POPULATION
72.30
MALES / 100 FEMALES
138.30
FEMALES / 100 MALES
39.8
MEDIAN AGE
3.1
AVG FAMILY SIZE
2.3
AVG HOUSEHOLD SIZE
3,330
LABOR FORCE [ PEOPLE ]
59.8%
PERCENT IN LABOR FORCE
Demopolis Zip Codes
Demopolis Area Codes
Income in Demopolis
Income Overview in Demopolis
Per Capita Income in Demopolis is $32,799, while median incomes of families and households are $68,323 and $51,364 respectively.
| Characteristic | Number | Measure |
| Per Capita Income | 7,080 | $32,799 |
| Median Family Income | 1,690 | $68,323 |
| Mean Family Income | 1,690 | $101,602 |
| Median Household Income | 3,064 | $51,364 |
| Mean Household Income | 3,064 | $75,084 |
| Income Deficit | 1,690 | $0 |
| Wage / Income Gap (%) | 7,080 | 30.04% |
| Wage / Income Gap ($) | 7,080 | 69.96¢ per $1 |
| Gini / Inequality Index | 7,080 | 0.54 |
Earnings by Sex in Demopolis
Average Earnings in Demopolis are $32,514, $40,659 for men and $28,446 for women, a difference of 30.0%.
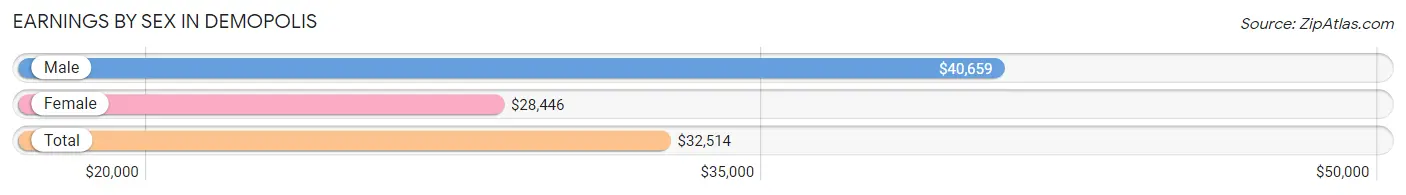
| Sex | Number | Average Earnings |
| Male | 1,569 (43.8%) | $40,659 |
| Female | 2,011 (56.2%) | $28,446 |
| Total | 3,580 (100.0%) | $32,514 |
Earnings by Sex by Income Bracket in Demopolis
The most common earnings brackets in Demopolis are $100,000+ for men (372 | 23.7%) and $15,000 to $17,499 for women (347 | 17.3%).
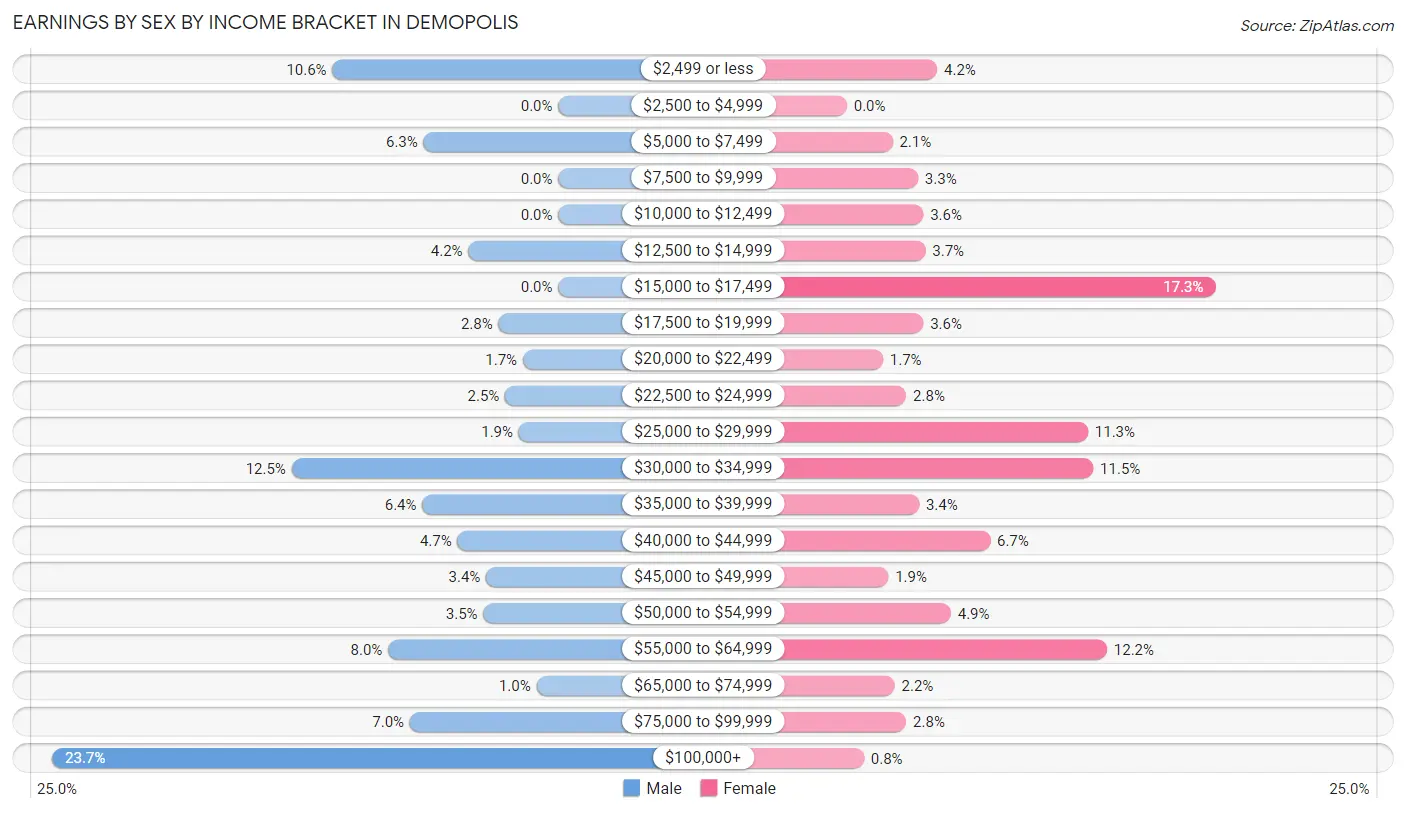
| Income | Male | Female |
| $2,499 or less | 166 (10.6%) | 85 (4.2%) |
| $2,500 to $4,999 | 0 (0.0%) | 0 (0.0%) |
| $5,000 to $7,499 | 99 (6.3%) | 43 (2.1%) |
| $7,500 to $9,999 | 0 (0.0%) | 67 (3.3%) |
| $10,000 to $12,499 | 0 (0.0%) | 72 (3.6%) |
| $12,500 to $14,999 | 66 (4.2%) | 74 (3.7%) |
| $15,000 to $17,499 | 0 (0.0%) | 347 (17.3%) |
| $17,500 to $19,999 | 44 (2.8%) | 72 (3.6%) |
| $20,000 to $22,499 | 26 (1.7%) | 34 (1.7%) |
| $22,500 to $24,999 | 39 (2.5%) | 56 (2.8%) |
| $25,000 to $29,999 | 29 (1.8%) | 227 (11.3%) |
| $30,000 to $34,999 | 196 (12.5%) | 232 (11.5%) |
| $35,000 to $39,999 | 100 (6.4%) | 68 (3.4%) |
| $40,000 to $44,999 | 74 (4.7%) | 135 (6.7%) |
| $45,000 to $49,999 | 53 (3.4%) | 39 (1.9%) |
| $50,000 to $54,999 | 55 (3.5%) | 98 (4.9%) |
| $55,000 to $64,999 | 125 (8.0%) | 245 (12.2%) |
| $65,000 to $74,999 | 16 (1.0%) | 45 (2.2%) |
| $75,000 to $99,999 | 109 (7.0%) | 56 (2.8%) |
| $100,000+ | 372 (23.7%) | 16 (0.8%) |
| Total | 1,569 (100.0%) | 2,011 (100.0%) |
Earnings by Sex by Educational Attainment in Demopolis
Average earnings in Demopolis are $41,436 for men and $33,446 for women, a difference of 19.3%. Men with an educational attainment of graduate degree enjoy the highest average annual earnings of $115,729, while those with high school diploma education earn the least with $32,448. Women with an educational attainment of graduate degree earn the most with the average annual earnings of $52,903, while those with high school diploma education have the smallest earnings of $27,722.
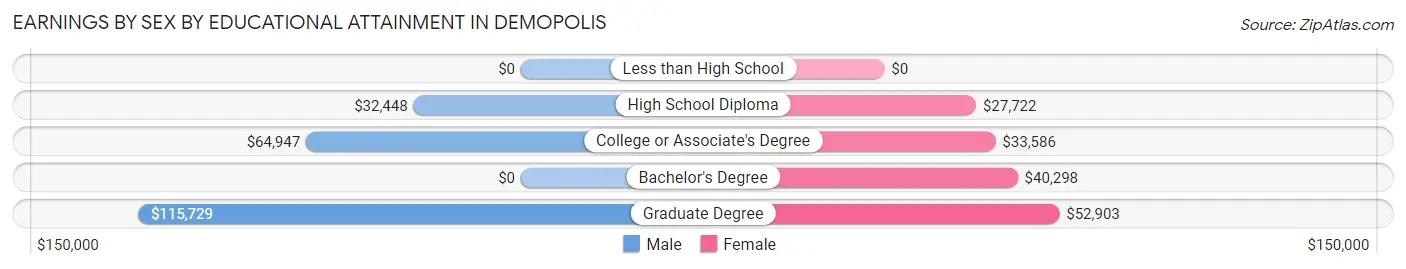
| Educational Attainment | Male Income | Female Income |
| Less than High School | - | - |
| High School Diploma | $32,448 | $27,722 |
| College or Associate's Degree | $64,947 | $33,586 |
| Bachelor's Degree | - | - |
| Graduate Degree | $115,729 | $52,903 |
| Total | $41,436 | $33,446 |
Family Income in Demopolis
Family Income Brackets in Demopolis
According to the Demopolis family income data, there are 509 families falling into the $50,000 to $74,999 income range, which is the most common income bracket and makes up 30.1% of all families.
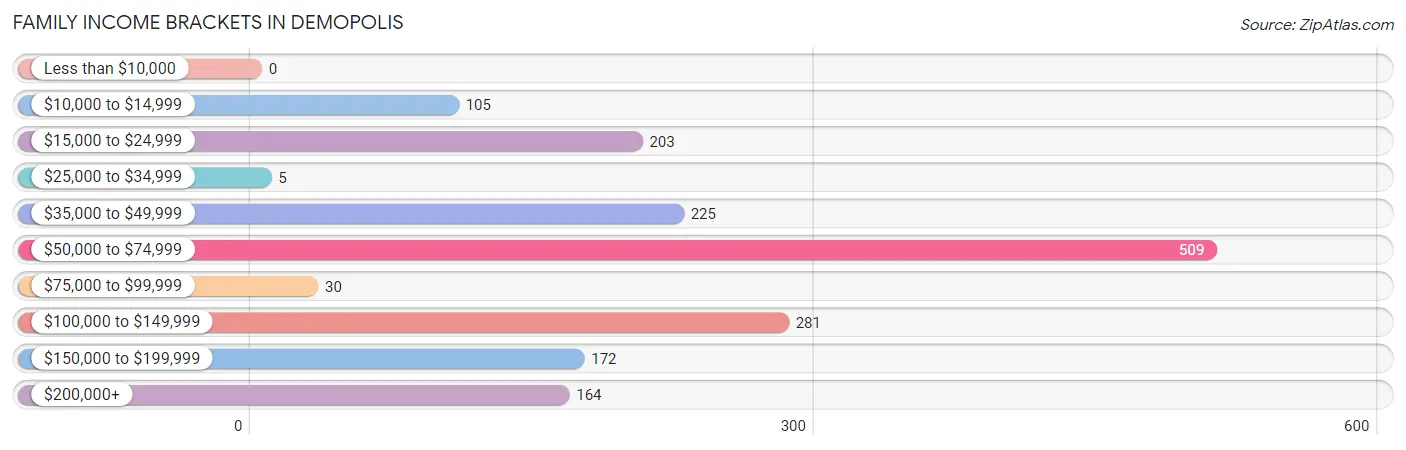
| Income Bracket | # Families | % Families |
| Less than $10,000 | 0 | 0.0% |
| $10,000 to $14,999 | 105 | 6.2% |
| $15,000 to $24,999 | 203 | 12.0% |
| $25,000 to $34,999 | 5 | 0.3% |
| $35,000 to $49,999 | 225 | 13.3% |
| $50,000 to $74,999 | 509 | 30.1% |
| $75,000 to $99,999 | 30 | 1.8% |
| $100,000 to $149,999 | 281 | 16.6% |
| $150,000 to $199,999 | 172 | 10.2% |
| $200,000+ | 164 | 9.7% |
Family Income by Famaliy Size in Demopolis
4-person families (239 | 14.1%) account for the highest median family income in Demopolis with $117,109 per family, while 2-person families (1,103 | 65.3%) have the highest median income of $32,958 per family member.
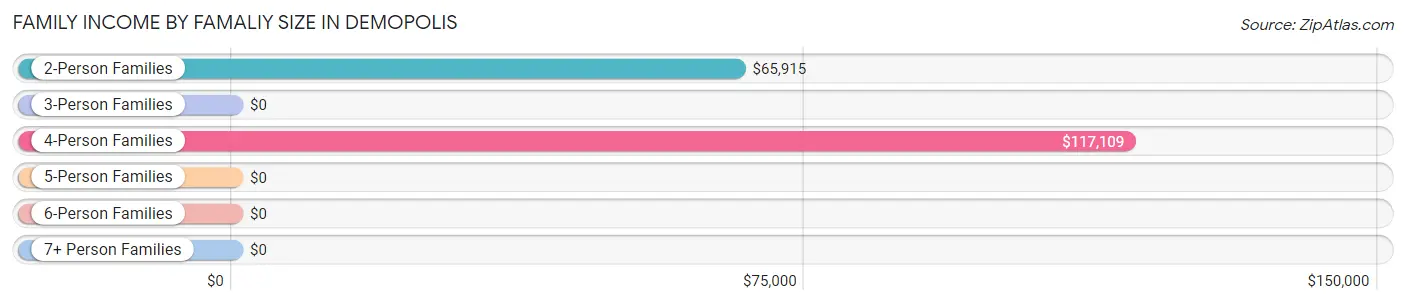
| Income Bracket | # Families | Median Income |
| 2-Person Families | 1,103 (65.3%) | $65,915 |
| 3-Person Families | 325 (19.2%) | $0 |
| 4-Person Families | 239 (14.1%) | $117,109 |
| 5-Person Families | 23 (1.4%) | $0 |
| 6-Person Families | 0 (0.0%) | $0 |
| 7+ Person Families | 0 (0.0%) | $0 |
| Total | 1,690 (100.0%) | $68,323 |
Family Income by Number of Earners in Demopolis
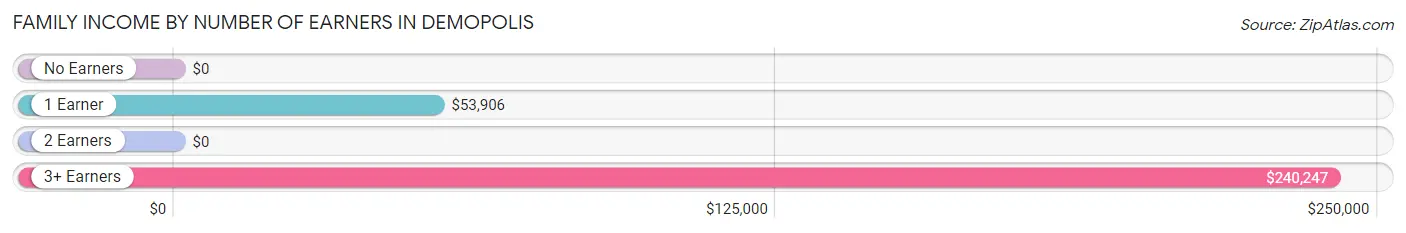
| Number of Earners | # Families | Median Income |
| No Earners | 319 (18.9%) | $0 |
| 1 Earner | 476 (28.2%) | $53,906 |
| 2 Earners | 758 (44.9%) | $0 |
| 3+ Earners | 137 (8.1%) | $240,247 |
| Total | 1,690 (100.0%) | $68,323 |
Household Income in Demopolis
Household Income Brackets in Demopolis
With 552 households falling in the category, the $50,000 to $74,999 income range is the most frequent in Demopolis, accounting for 18.0% of all households. In contrast, only 132 households (4.3%) fall into the $25,000 to $34,999 income bracket, making it the least populous group.
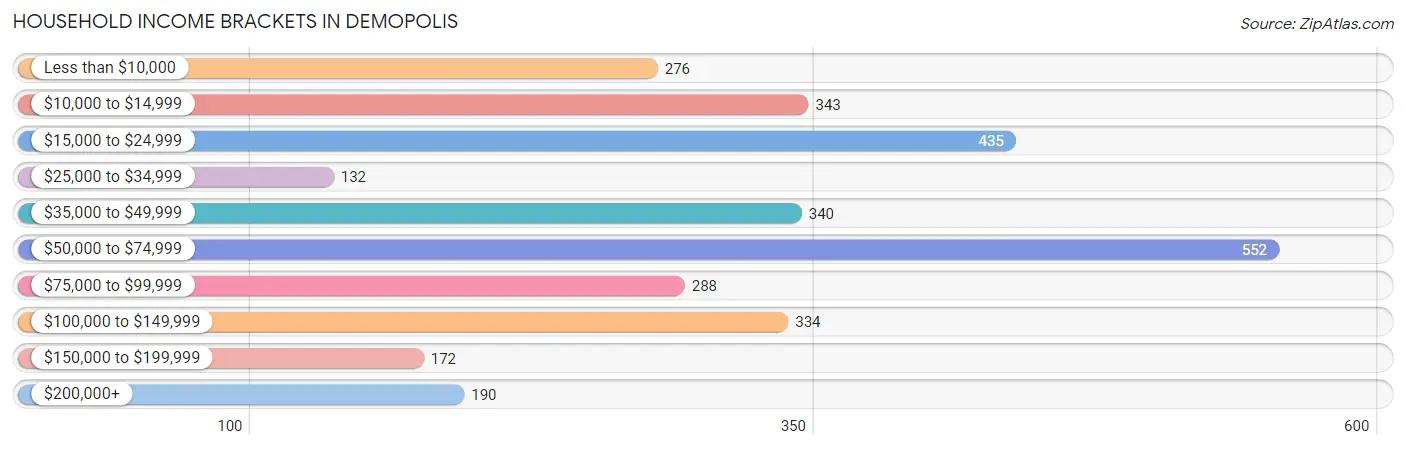
| Income Bracket | # Households | % Households |
| Less than $10,000 | 276 | 9.0% |
| $10,000 to $14,999 | 343 | 11.2% |
| $15,000 to $24,999 | 435 | 14.2% |
| $25,000 to $34,999 | 132 | 4.3% |
| $35,000 to $49,999 | 340 | 11.1% |
| $50,000 to $74,999 | 552 | 18.0% |
| $75,000 to $99,999 | 288 | 9.4% |
| $100,000 to $149,999 | 334 | 10.9% |
| $150,000 to $199,999 | 172 | 5.6% |
| $200,000+ | 190 | 6.2% |
Household Income by Householder Age in Demopolis
The median household income in Demopolis is $51,364, with the highest median household income of $73,500 found in the 45 to 64 years age bracket for the primary householder. A total of 1,124 households (36.7%) fall into this category. Meanwhile, the 15 to 24 years age bracket for the primary householder has the lowest median household income of $12,000, with 156 households (5.1%) in this group.
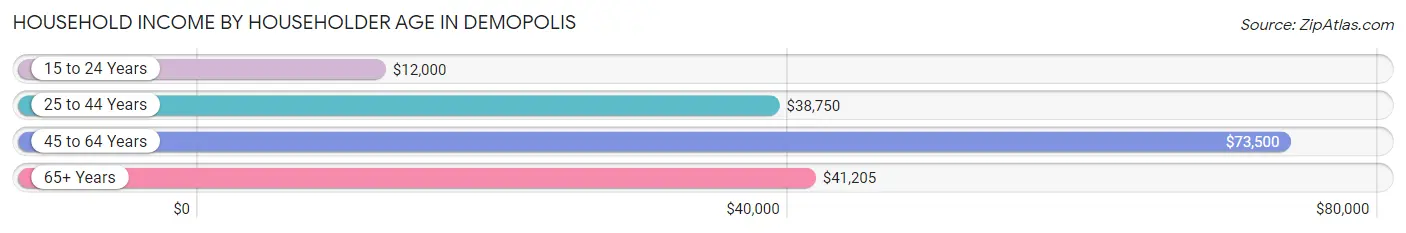
| Income Bracket | # Households | Median Income |
| 15 to 24 Years | 156 (5.1%) | $12,000 |
| 25 to 44 Years | 859 (28.0%) | $38,750 |
| 45 to 64 Years | 1,124 (36.7%) | $73,500 |
| 65+ Years | 925 (30.2%) | $41,205 |
| Total | 3,064 (100.0%) | $51,364 |
Poverty in Demopolis
Income Below Poverty by Sex and Age in Demopolis
With 19.7% poverty level for males and 24.6% for females among the residents of Demopolis, 15 year old males and 5 year old females are the most vulnerable to poverty, with 28 males (100.0%) and 38 females (100.0%) in their respective age groups living below the poverty level.
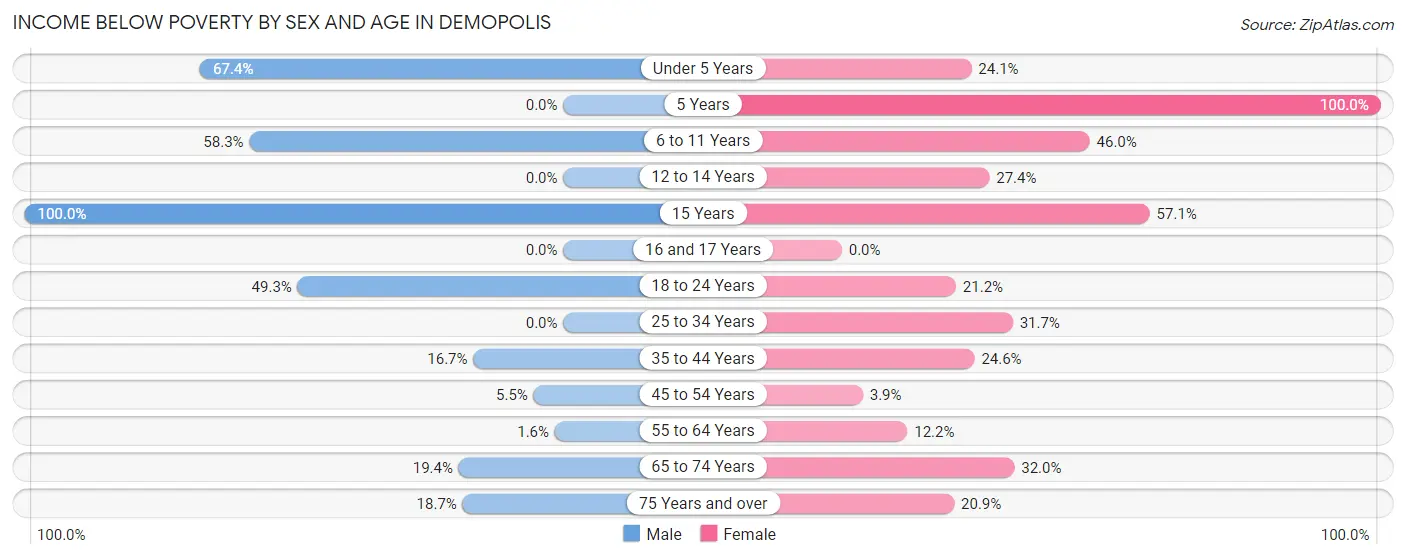
| Age Bracket | Male | Female |
| Under 5 Years | 174 (67.4%) | 45 (24.1%) |
| 5 Years | 0 (0.0%) | 38 (100.0%) |
| 6 to 11 Years | 74 (58.3%) | 236 (46.0%) |
| 12 to 14 Years | 0 (0.0%) | 46 (27.4%) |
| 15 Years | 28 (100.0%) | 20 (57.1%) |
| 16 and 17 Years | 0 (0.0%) | 0 (0.0%) |
| 18 to 24 Years | 72 (49.3%) | 104 (21.2%) |
| 25 to 34 Years | 0 (0.0%) | 144 (31.7%) |
| 35 to 44 Years | 81 (16.7%) | 97 (24.6%) |
| 45 to 54 Years | 24 (5.5%) | 21 (3.9%) |
| 55 to 64 Years | 4 (1.6%) | 58 (12.2%) |
| 65 to 74 Years | 84 (19.4%) | 138 (32.0%) |
| 75 Years and over | 37 (18.7%) | 49 (20.8%) |
| Total | 578 (19.7%) | 996 (24.6%) |
Income Above Poverty by Sex and Age in Demopolis
According to the poverty statistics in Demopolis, males aged 5 years and females aged 16 and 17 years are the age groups that are most secure financially, with 100.0% of males and 100.0% of females in these age groups living above the poverty line.
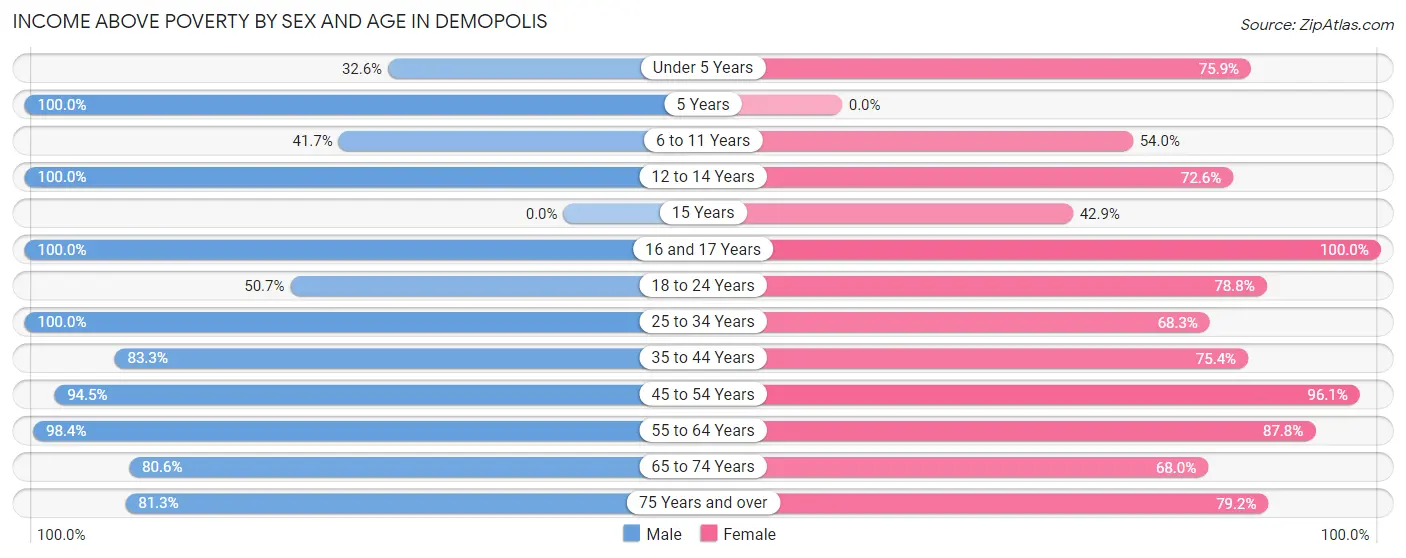
| Age Bracket | Male | Female |
| Under 5 Years | 84 (32.6%) | 142 (75.9%) |
| 5 Years | 20 (100.0%) | 0 (0.0%) |
| 6 to 11 Years | 53 (41.7%) | 277 (54.0%) |
| 12 to 14 Years | 138 (100.0%) | 122 (72.6%) |
| 15 Years | 0 (0.0%) | 15 (42.9%) |
| 16 and 17 Years | 7 (100.0%) | 84 (100.0%) |
| 18 to 24 Years | 74 (50.7%) | 387 (78.8%) |
| 25 to 34 Years | 403 (100.0%) | 310 (68.3%) |
| 35 to 44 Years | 404 (83.3%) | 297 (75.4%) |
| 45 to 54 Years | 412 (94.5%) | 519 (96.1%) |
| 55 to 64 Years | 251 (98.4%) | 419 (87.8%) |
| 65 to 74 Years | 349 (80.6%) | 293 (68.0%) |
| 75 Years and over | 161 (81.3%) | 186 (79.1%) |
| Total | 2,356 (80.3%) | 3,051 (75.4%) |
Income Below Poverty Among Married-Couple Families in Demopolis
The poverty statistics for married-couple families in Demopolis show that 6.3% or 58 of the total 920 families live below the poverty line. Families with 1 or 2 children have the highest poverty rate of 12.9%, comprising of 39 families. On the other hand, families with 3 or 4 children have the lowest poverty rate of 0.0%, which includes 0 families.
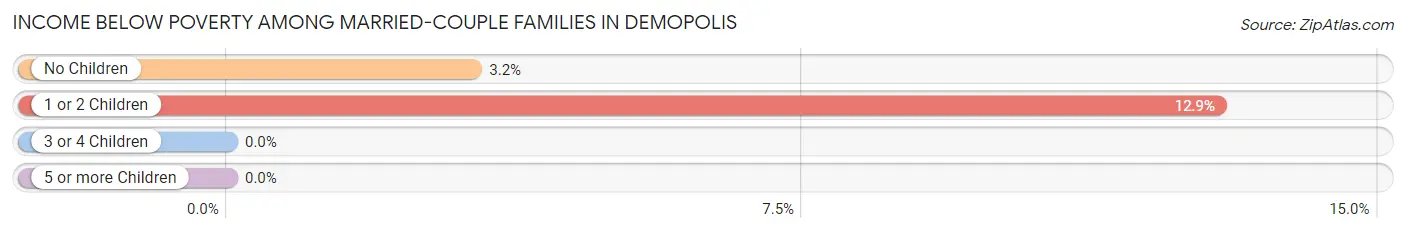
| Children | Above Poverty | Below Poverty |
| No Children | 576 (96.8%) | 19 (3.2%) |
| 1 or 2 Children | 263 (87.1%) | 39 (12.9%) |
| 3 or 4 Children | 23 (100.0%) | 0 (0.0%) |
| 5 or more Children | 0 (0.0%) | 0 (0.0%) |
| Total | 862 (93.7%) | 58 (6.3%) |
Income Below Poverty Among Single-Parent Households in Demopolis
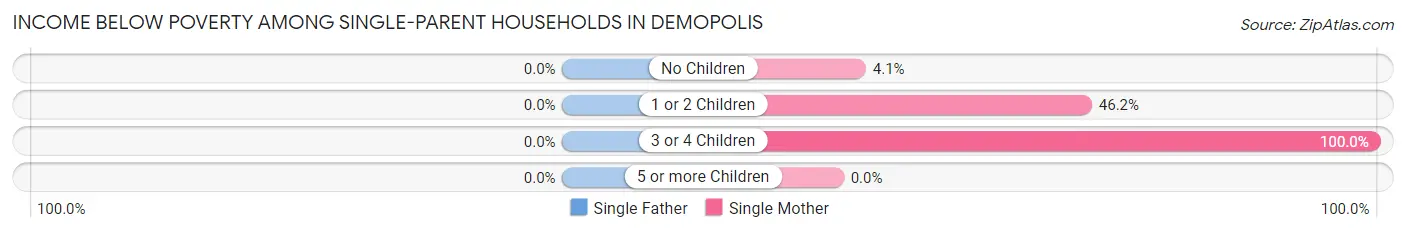
| Children | Single Father | Single Mother |
| No Children | 0 (0.0%) | 13 (4.1%) |
| 1 or 2 Children | 0 (0.0%) | 141 (46.2%) |
| 3 or 4 Children | 0 (0.0%) | 13 (100.0%) |
| 5 or more Children | 0 (0.0%) | 0 (0.0%) |
| Total | 0 (0.0%) | 167 (26.4%) |
Income Below Poverty Among Married-Couple vs Single-Parent Households in Demopolis
The poverty data for Demopolis shows that 58 of the married-couple family households (6.3%) and 167 of the single-parent households (21.7%) are living below the poverty level. Within the married-couple family households, those with 1 or 2 children have the highest poverty rate, with 39 households (12.9%) falling below the poverty line. Among the single-parent households, those with 3 or 4 children have the highest poverty rate, with 13 household (100.0%) living below poverty.
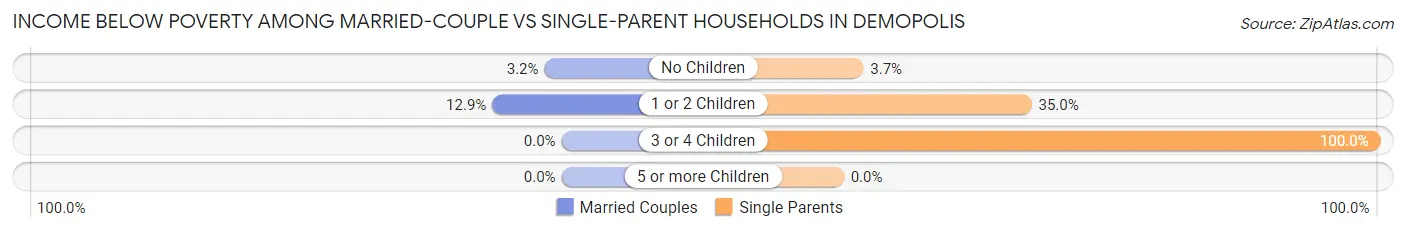
| Children | Married-Couple Families | Single-Parent Households |
| No Children | 19 (3.2%) | 13 (3.7%) |
| 1 or 2 Children | 39 (12.9%) | 141 (35.0%) |
| 3 or 4 Children | 0 (0.0%) | 13 (100.0%) |
| 5 or more Children | 0 (0.0%) | 0 (0.0%) |
| Total | 58 (6.3%) | 167 (21.7%) |
Race in Demopolis
The most populous races in Demopolis are Black / African American (3,351 | 47.3%), White / Caucasian (3,326 | 47.0%), and Hispanic or Latino (278 | 3.9%).
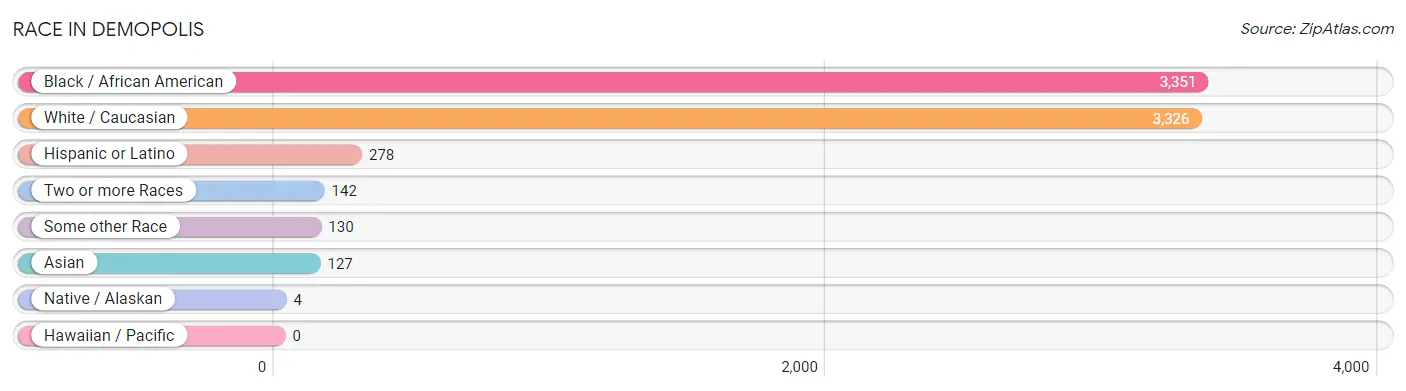
| Race | # Population | % Population |
| Asian | 127 | 1.8% |
| Black / African American | 3,351 | 47.3% |
| Hawaiian / Pacific | 0 | 0.0% |
| Hispanic or Latino | 278 | 3.9% |
| Native / Alaskan | 4 | 0.1% |
| White / Caucasian | 3,326 | 47.0% |
| Two or more Races | 142 | 2.0% |
| Some other Race | 130 | 1.8% |
| Total | 7,080 | 100.0% |
Ancestry in Demopolis
The most populous ancestries reported in Demopolis are Irish (750 | 10.6%), American (735 | 10.4%), German (359 | 5.1%), English (291 | 4.1%), and Mexican (256 | 3.6%), together accounting for 33.8% of all Demopolis residents.
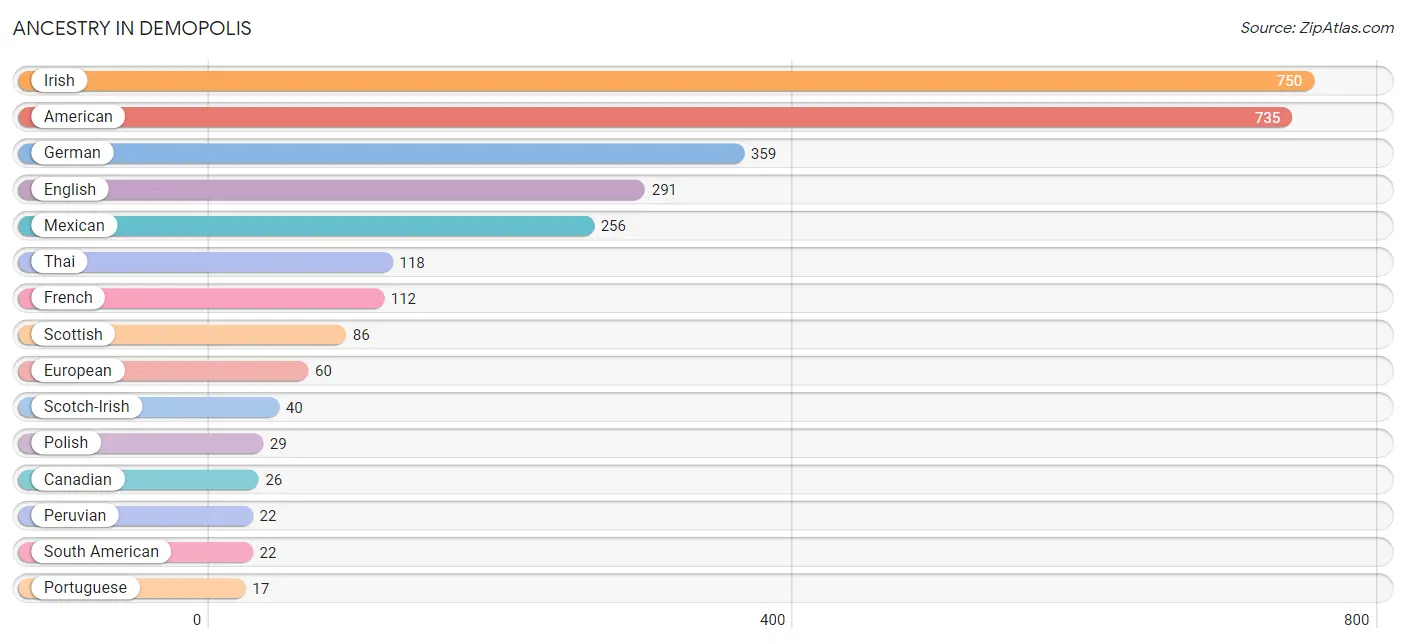
| Ancestry | # Population | % Population |
| American | 735 | 10.4% |
| Canadian | 26 | 0.4% |
| Cherokee | 8 | 0.1% |
| Dutch | 4 | 0.1% |
| English | 291 | 4.1% |
| European | 60 | 0.9% |
| Finnish | 16 | 0.2% |
| French | 112 | 1.6% |
| German | 359 | 5.1% |
| Greek | 9 | 0.1% |
| Hungarian | 11 | 0.2% |
| Irish | 750 | 10.6% |
| Italian | 16 | 0.2% |
| Korean | 9 | 0.1% |
| Mexican | 256 | 3.6% |
| Peruvian | 22 | 0.3% |
| Polish | 29 | 0.4% |
| Portuguese | 17 | 0.2% |
| Scotch-Irish | 40 | 0.6% |
| Scottish | 86 | 1.2% |
| Slovak | 10 | 0.1% |
| South American | 22 | 0.3% |
| Swedish | 10 | 0.1% |
| Thai | 118 | 1.7% |
| Welsh | 11 | 0.2% | View All 25 Rows |
Immigrants in Demopolis
The most numerous immigrant groups reported in Demopolis came from Latin America (130 | 1.8%), Central America (120 | 1.7%), Mexico (120 | 1.7%), Asia (21 | 0.3%), and India (12 | 0.2%), together accounting for 5.7% of all Demopolis residents.
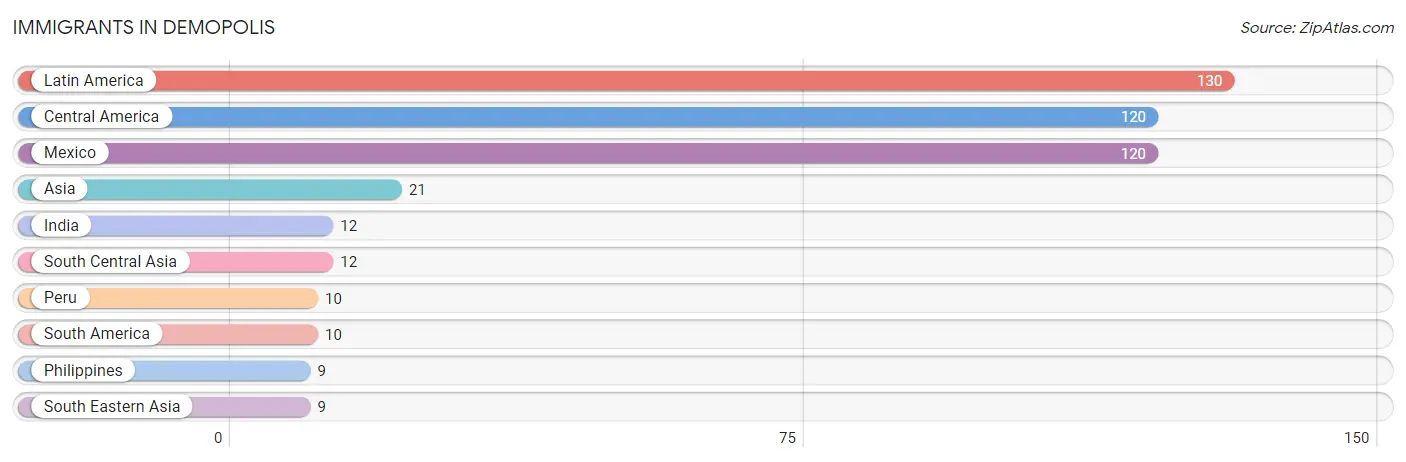
| Immigration Origin | # Population | % Population |
| Asia | 21 | 0.3% |
| Central America | 120 | 1.7% |
| India | 12 | 0.2% |
| Latin America | 130 | 1.8% |
| Mexico | 120 | 1.7% |
| Peru | 10 | 0.1% |
| Philippines | 9 | 0.1% |
| South America | 10 | 0.1% |
| South Central Asia | 12 | 0.2% |
| South Eastern Asia | 9 | 0.1% | View All 10 Rows |
Sex and Age in Demopolis
Sex and Age in Demopolis
The most populous age groups in Demopolis are 40 to 44 Years (332 | 11.2%) for men and 10 to 14 Years (387 | 9.4%) for women.
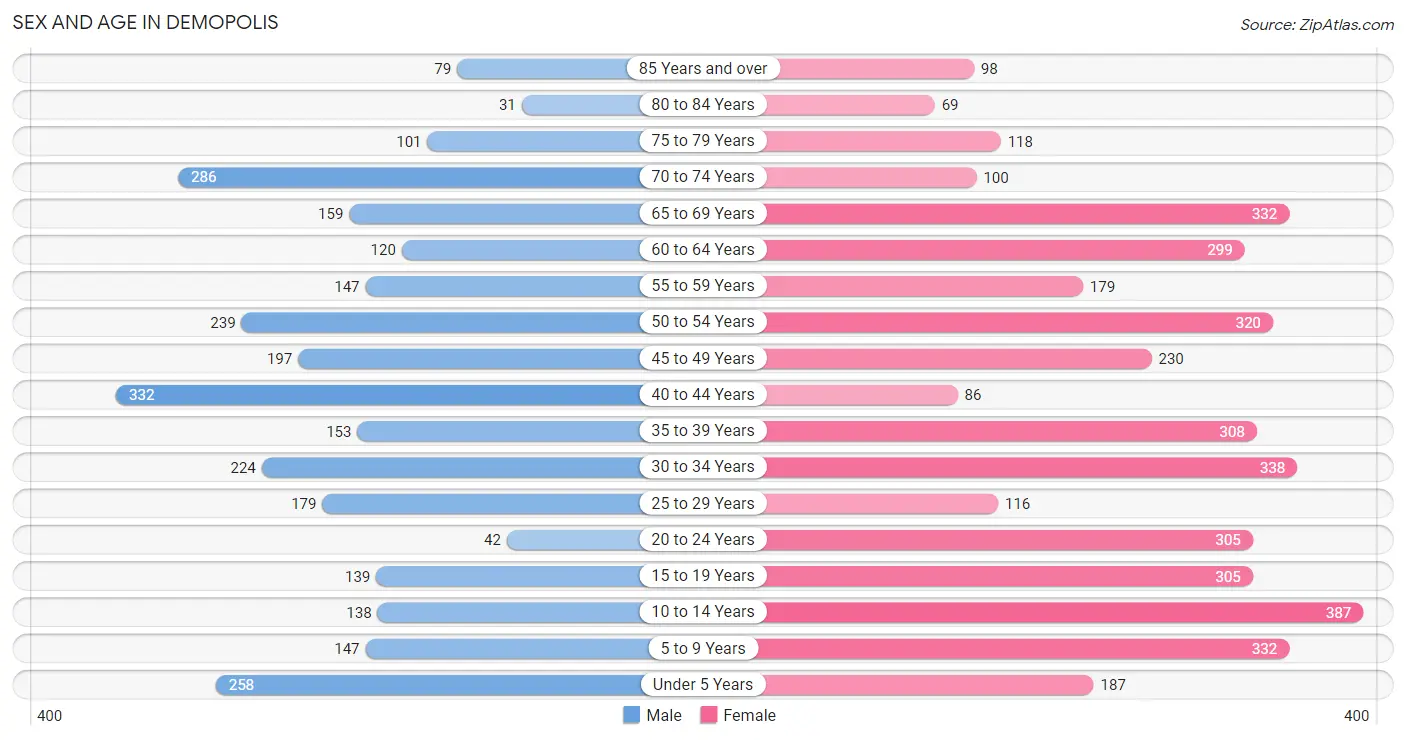
| Age Bracket | Male | Female |
| Under 5 Years | 258 (8.7%) | 187 (4.5%) |
| 5 to 9 Years | 147 (5.0%) | 332 (8.1%) |
| 10 to 14 Years | 138 (4.6%) | 387 (9.4%) |
| 15 to 19 Years | 139 (4.7%) | 305 (7.4%) |
| 20 to 24 Years | 42 (1.4%) | 305 (7.4%) |
| 25 to 29 Years | 179 (6.0%) | 116 (2.8%) |
| 30 to 34 Years | 224 (7.5%) | 338 (8.2%) |
| 35 to 39 Years | 153 (5.1%) | 308 (7.5%) |
| 40 to 44 Years | 332 (11.2%) | 86 (2.1%) |
| 45 to 49 Years | 197 (6.6%) | 230 (5.6%) |
| 50 to 54 Years | 239 (8.0%) | 320 (7.8%) |
| 55 to 59 Years | 147 (5.0%) | 179 (4.4%) |
| 60 to 64 Years | 120 (4.0%) | 299 (7.3%) |
| 65 to 69 Years | 159 (5.3%) | 332 (8.1%) |
| 70 to 74 Years | 286 (9.6%) | 100 (2.4%) |
| 75 to 79 Years | 101 (3.4%) | 118 (2.9%) |
| 80 to 84 Years | 31 (1.0%) | 69 (1.7%) |
| 85 Years and over | 79 (2.7%) | 98 (2.4%) |
| Total | 2,971 (100.0%) | 4,109 (100.0%) |
Families and Households in Demopolis
Median Family Size in Demopolis
The median family size in Demopolis is 3.13 persons per family, with single female/mother families (633 | 37.5%) accounting for the largest median family size of 3.67 persons per family. On the other hand, married-couple families (920 | 54.4%) represent the smallest median family size with 2.74 persons per family.
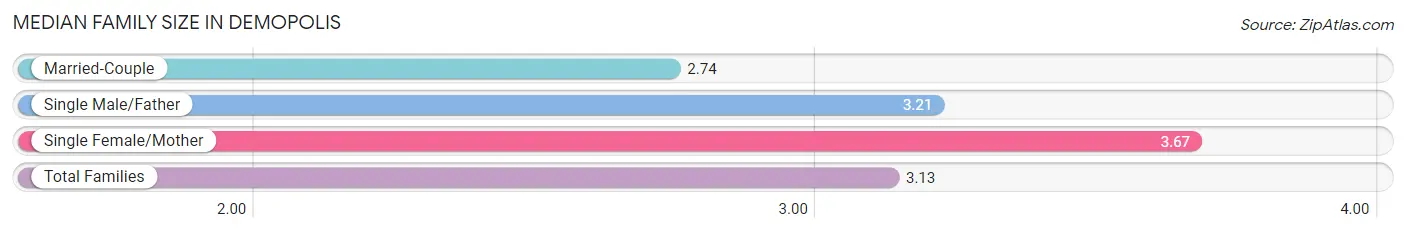
| Family Type | # Families | Family Size |
| Married-Couple | 920 (54.4%) | 2.74 |
| Single Male/Father | 137 (8.1%) | 3.21 |
| Single Female/Mother | 633 (37.5%) | 3.67 |
| Total Families | 1,690 (100.0%) | 3.13 |
Median Household Size in Demopolis
The median household size in Demopolis is 2.27 persons per household, with single female/mother households (633 | 20.7%) accounting for the largest median household size of 3.83 persons per household. non-family households (1,374 | 44.8%) represent the smallest median household size with 1.12 persons per household.
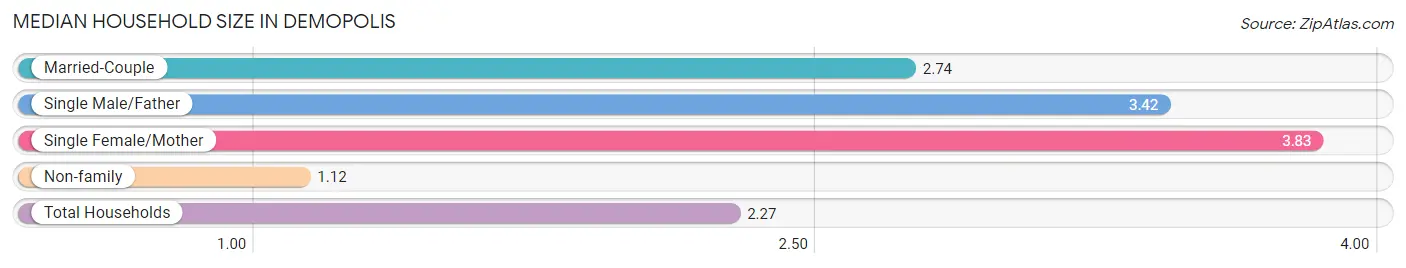
| Household Type | # Households | Household Size |
| Married-Couple | 920 (30.0%) | 2.74 |
| Single Male/Father | 137 (4.5%) | 3.42 |
| Single Female/Mother | 633 (20.7%) | 3.83 |
| Non-family | 1,374 (44.8%) | 1.12 |
| Total Households | 3,064 (100.0%) | 2.27 |
Household Size by Marriage Status in Demopolis
Out of a total of 3,064 households in Demopolis, 1,690 (55.2%) are family households, while 1,374 (44.8%) are nonfamily households. The most numerous type of family households are 2-person households, comprising 1,031, and the most common type of nonfamily households are 1-person households, comprising 1,327.
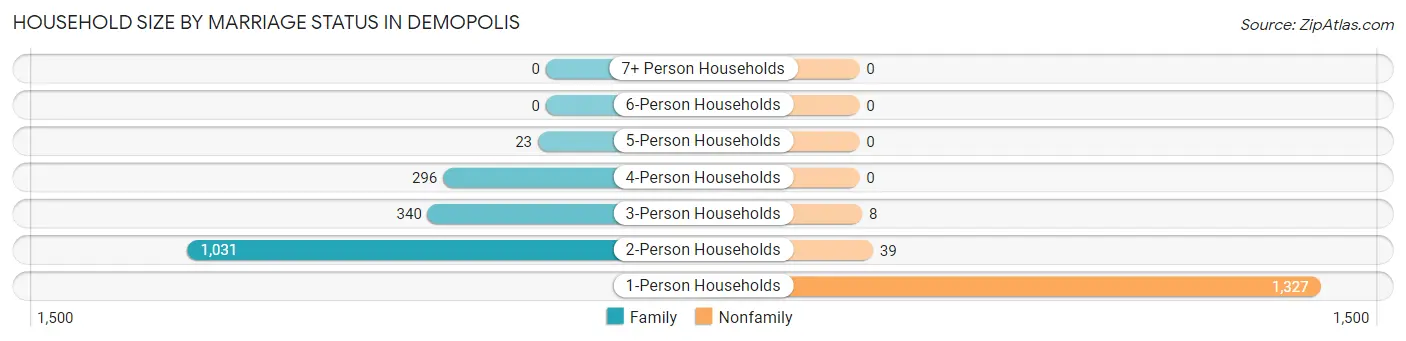
| Household Size | Family Households | Nonfamily Households |
| 1-Person Households | - | 1,327 (43.3%) |
| 2-Person Households | 1,031 (33.7%) | 39 (1.3%) |
| 3-Person Households | 340 (11.1%) | 8 (0.3%) |
| 4-Person Households | 296 (9.7%) | 0 (0.0%) |
| 5-Person Households | 23 (0.7%) | 0 (0.0%) |
| 6-Person Households | 0 (0.0%) | 0 (0.0%) |
| 7+ Person Households | 0 (0.0%) | 0 (0.0%) |
| Total | 1,690 (55.2%) | 1,374 (44.8%) |
Female Fertility in Demopolis
Fertility by Age in Demopolis
Average fertility rate in Demopolis is 19.0 births per 1,000 women. Women in the age bracket of 20 to 34 years have the highest fertility rate with 43.0 births per 1,000 women. Women in the age bracket of 20 to 34 years acount for 100.0% of all women with births.
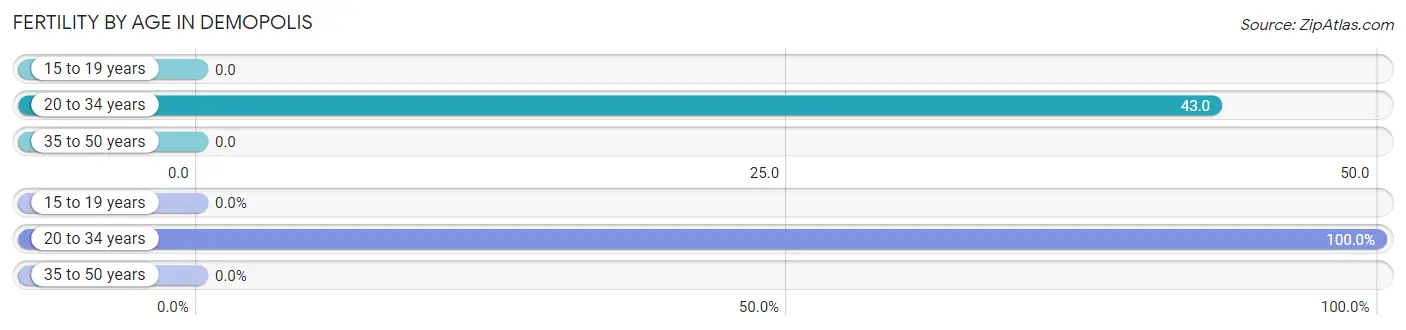
| Age Bracket | Women with Births | Births / 1,000 Women |
| 15 to 19 years | 0 (0.0%) | 0.0 |
| 20 to 34 years | 33 (100.0%) | 43.0 |
| 35 to 50 years | 0 (0.0%) | 0.0 |
| Total | 33 (100.0%) | 19.0 |
Fertility by Age by Marriage Status in Demopolis
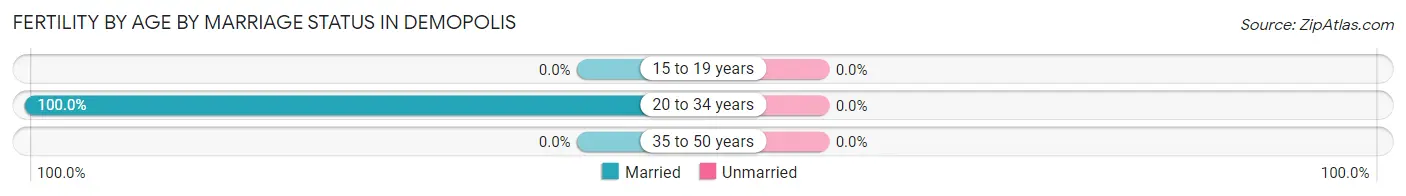
| Age Bracket | Married | Unmarried |
| 15 to 19 years | 0 (0.0%) | 0 (0.0%) |
| 20 to 34 years | 33 (100.0%) | 0 (0.0%) |
| 35 to 50 years | 0 (0.0%) | 0 (0.0%) |
| Total | 33 (100.0%) | 0 (0.0%) |
Fertility by Education in Demopolis
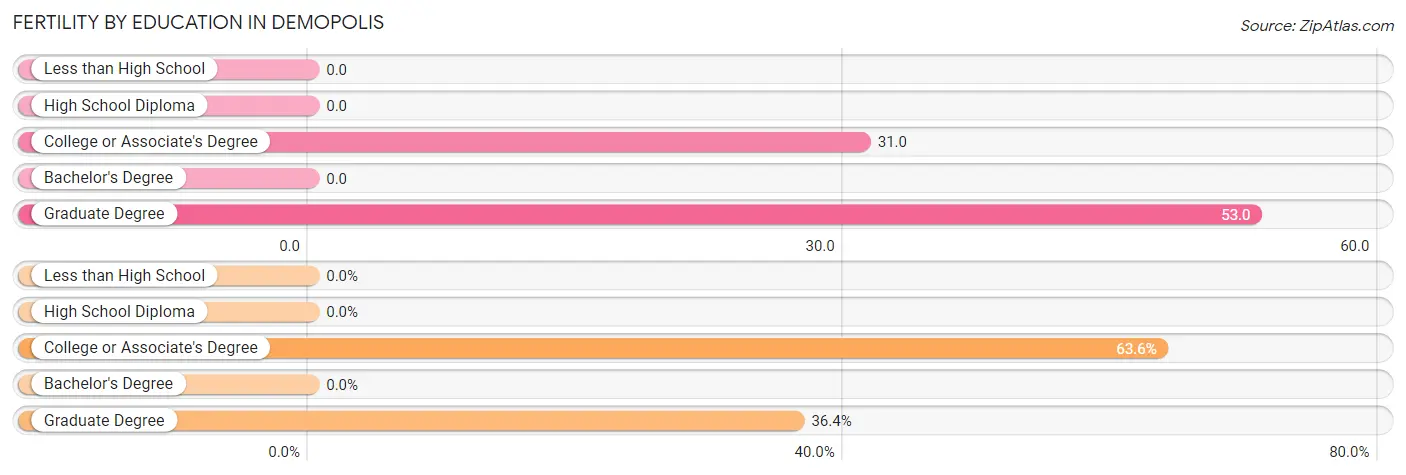
| Educational Attainment | Women with Births | Births / 1,000 Women |
| Less than High School | 0 (0.0%) | 0.0 |
| High School Diploma | 0 (0.0%) | 0.0 |
| College or Associate's Degree | 21 (63.6%) | 31.0 |
| Bachelor's Degree | 0 (0.0%) | 0.0 |
| Graduate Degree | 12 (36.4%) | 53.0 |
| Total | 33 (100.0%) | 19.0 |
Fertility by Education by Marriage Status in Demopolis
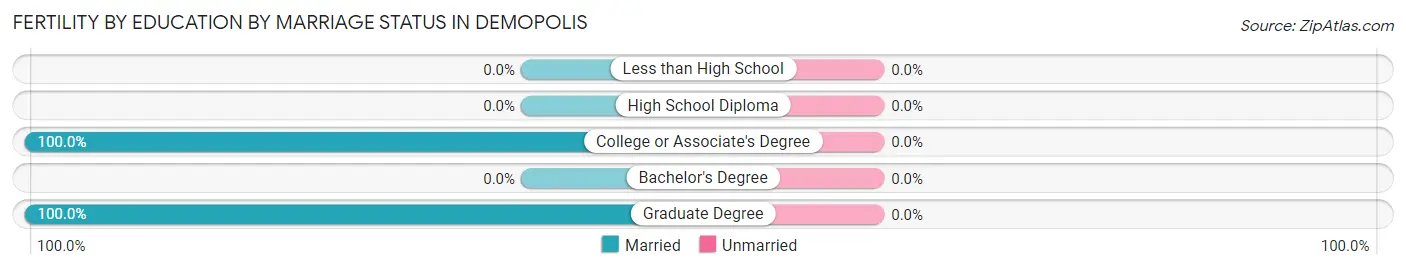
| Educational Attainment | Married | Unmarried |
| Less than High School | 0 (0.0%) | 0 (0.0%) |
| High School Diploma | 0 (0.0%) | 0 (0.0%) |
| College or Associate's Degree | 21 (100.0%) | 0 (0.0%) |
| Bachelor's Degree | 0 (0.0%) | 0 (0.0%) |
| Graduate Degree | 12 (100.0%) | 0 (0.0%) |
| Total | 33 (100.0%) | 0 (0.0%) |
Employment Characteristics in Demopolis
Employment by Class of Employer in Demopolis
Among the 3,189 employed individuals in Demopolis, private company employees (1,877 | 58.9%), not-for-profit organizations (450 | 14.1%), and local government employees (379 | 11.9%) make up the most common classes of employment.
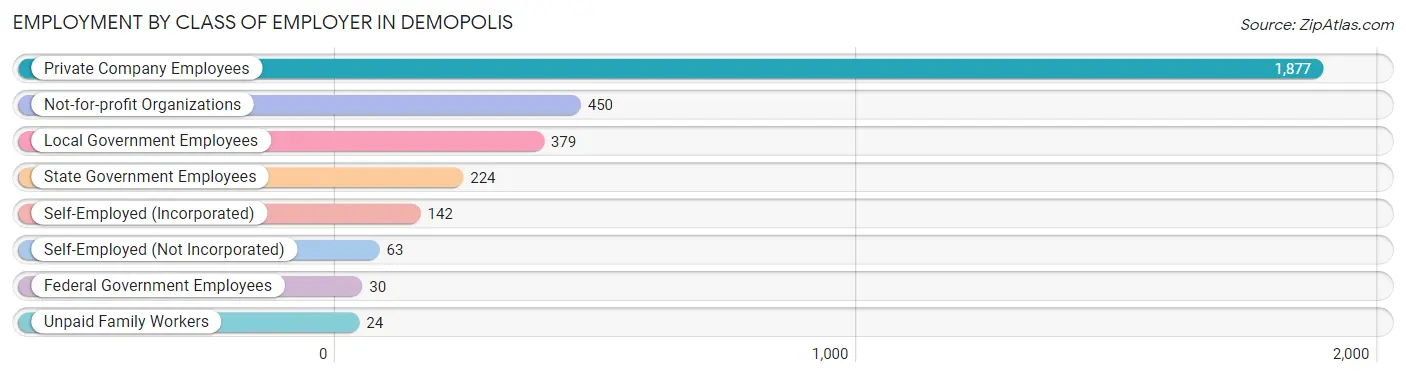
| Employer Class | # Employees | % Employees |
| Private Company Employees | 1,877 | 58.9% |
| Self-Employed (Incorporated) | 142 | 4.4% |
| Self-Employed (Not Incorporated) | 63 | 2.0% |
| Not-for-profit Organizations | 450 | 14.1% |
| Local Government Employees | 379 | 11.9% |
| State Government Employees | 224 | 7.0% |
| Federal Government Employees | 30 | 0.9% |
| Unpaid Family Workers | 24 | 0.7% |
| Total | 3,189 | 100.0% |
Employment Status by Age in Demopolis
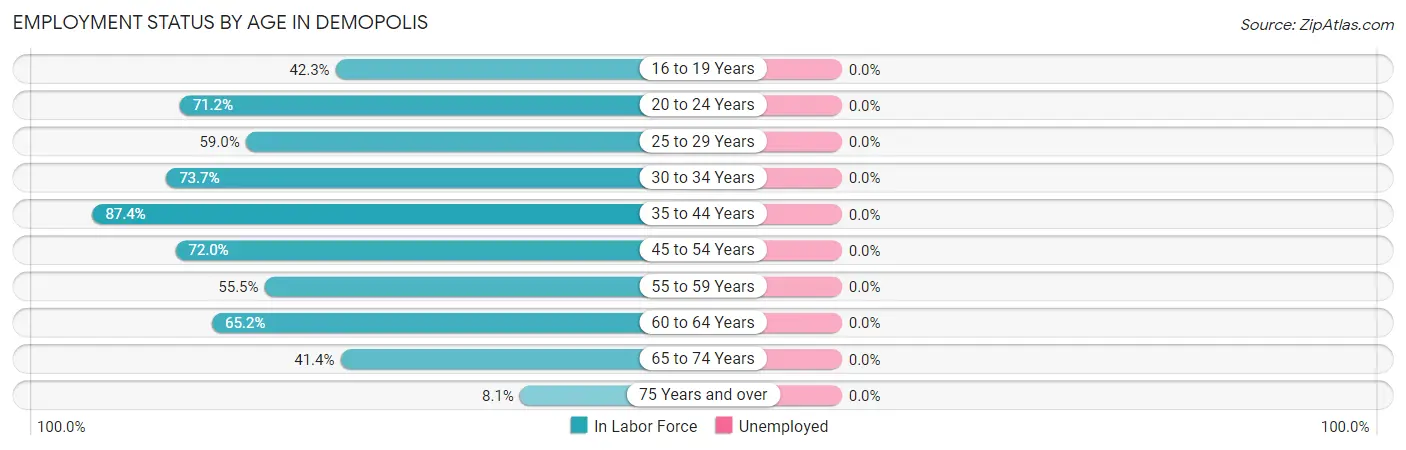
| Age Bracket | In Labor Force | Unemployed |
| 16 to 19 Years | 161 (42.3%) | 0 (0.0%) |
| 20 to 24 Years | 247 (71.2%) | 0 (0.0%) |
| 25 to 29 Years | 174 (59.0%) | 0 (0.0%) |
| 30 to 34 Years | 414 (73.7%) | 0 (0.0%) |
| 35 to 44 Years | 768 (87.4%) | 0 (0.0%) |
| 45 to 54 Years | 710 (72.0%) | 0 (0.0%) |
| 55 to 59 Years | 181 (55.5%) | 0 (0.0%) |
| 60 to 64 Years | 273 (65.2%) | 0 (0.0%) |
| 65 to 74 Years | 363 (41.4%) | 0 (0.0%) |
| 75 Years and over | 40 (8.1%) | 0 (0.0%) |
| Total | 3,330 (59.8%) | 0 (0.0%) |
Employment Status by Educational Attainment in Demopolis
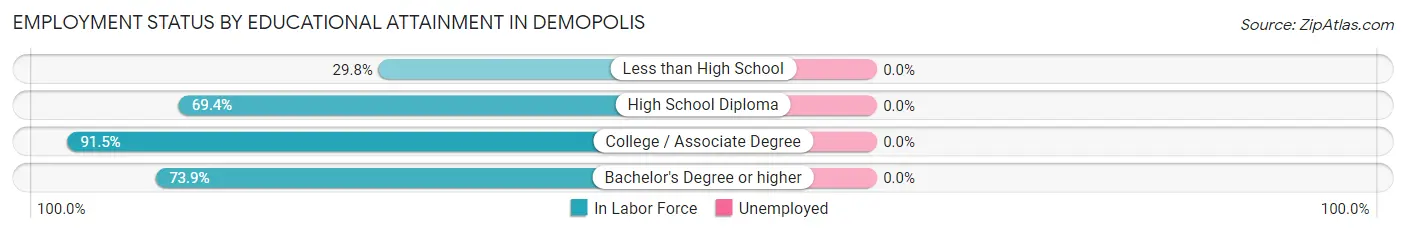
| Educational Attainment | In Labor Force | Unemployed |
| Less than High School | 107 (29.8%) | 0 (0.0%) |
| High School Diploma | 779 (69.4%) | 0 (0.0%) |
| College / Associate Degree | 866 (91.5%) | 0 (0.0%) |
| Bachelor's Degree or higher | 768 (73.9%) | 0 (0.0%) |
| Total | 2,521 (72.7%) | 0 (0.0%) |
Employment Occupations by Sex in Demopolis
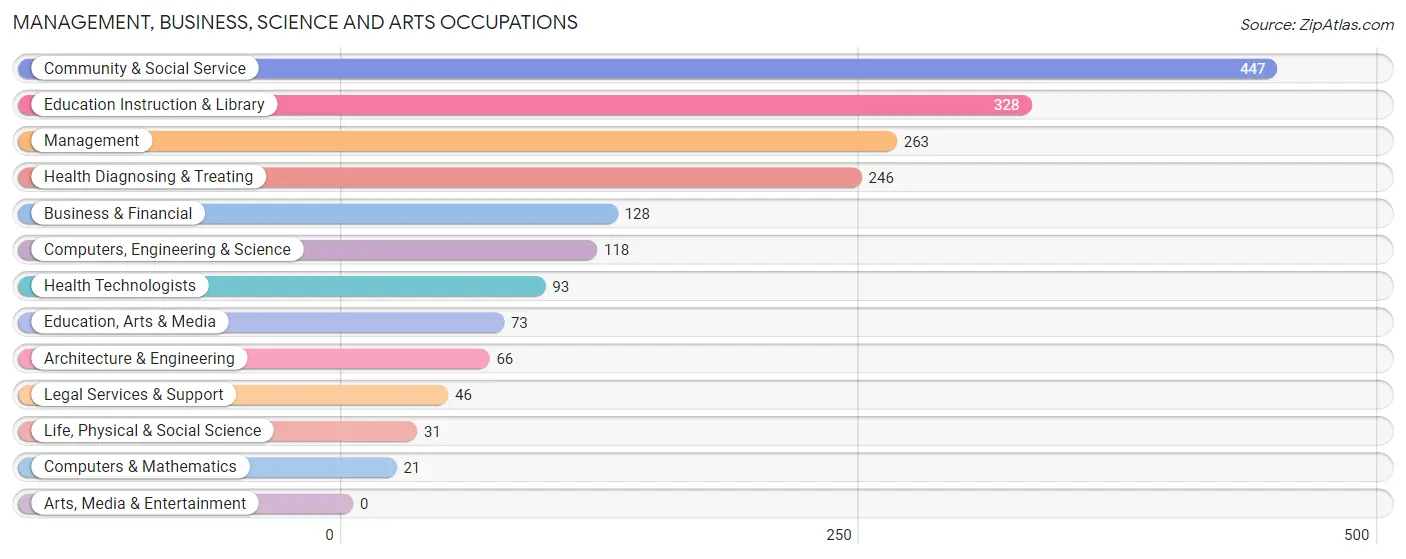
Management, Business, Science and Arts Occupations
The most common Management, Business, Science and Arts occupations in Demopolis are Community & Social Service (447 | 13.4%), Education Instruction & Library (328 | 9.9%), Management (263 | 7.9%), Health Diagnosing & Treating (246 | 7.4%), and Business & Financial (128 | 3.8%).
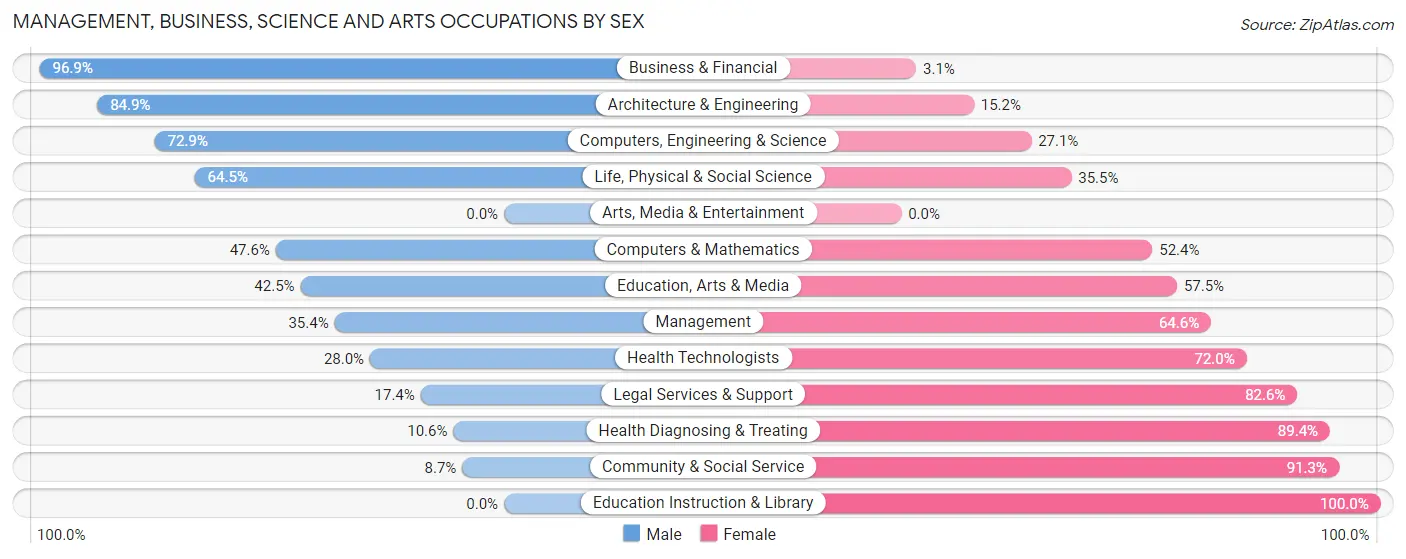
Management, Business, Science and Arts Occupations by Sex
Within the Management, Business, Science and Arts occupations in Demopolis, the most male-oriented occupations are Business & Financial (96.9%), Architecture & Engineering (84.9%), and Computers, Engineering & Science (72.9%), while the most female-oriented occupations are Education Instruction & Library (100.0%), Community & Social Service (91.3%), and Health Diagnosing & Treating (89.4%).
| Occupation | Male | Female |
| Management | 93 (35.4%) | 170 (64.6%) |
| Business & Financial | 124 (96.9%) | 4 (3.1%) |
| Computers, Engineering & Science | 86 (72.9%) | 32 (27.1%) |
| Computers & Mathematics | 10 (47.6%) | 11 (52.4%) |
| Architecture & Engineering | 56 (84.9%) | 10 (15.1%) |
| Life, Physical & Social Science | 20 (64.5%) | 11 (35.5%) |
| Community & Social Service | 39 (8.7%) | 408 (91.3%) |
| Education, Arts & Media | 31 (42.5%) | 42 (57.5%) |
| Legal Services & Support | 8 (17.4%) | 38 (82.6%) |
| Education Instruction & Library | 0 (0.0%) | 328 (100.0%) |
| Arts, Media & Entertainment | 0 (0.0%) | 0 (0.0%) |
| Health Diagnosing & Treating | 26 (10.6%) | 220 (89.4%) |
| Health Technologists | 26 (28.0%) | 67 (72.0%) |
| Total (Category) | 368 (30.6%) | 834 (69.4%) |
| Total (Overall) | 1,378 (41.4%) | 1,953 (58.6%) |
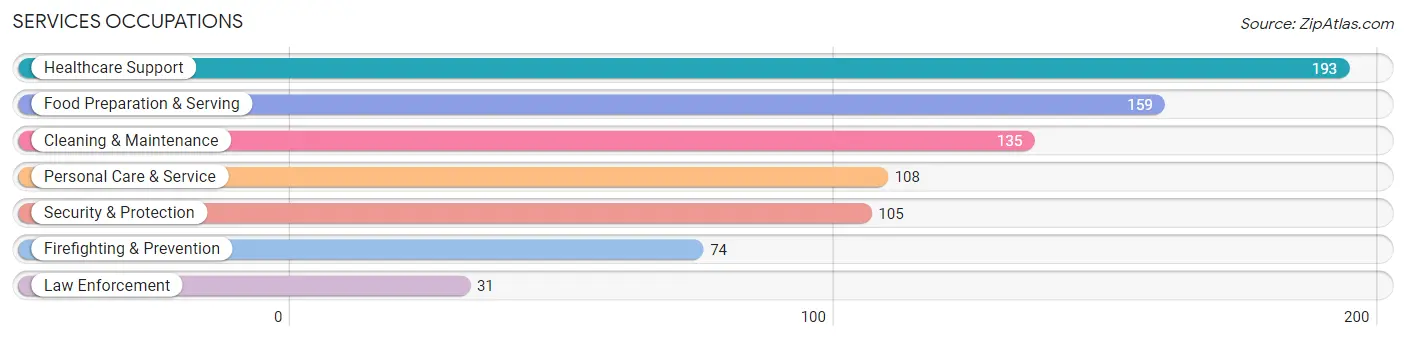
Services Occupations
The most common Services occupations in Demopolis are Healthcare Support (193 | 5.8%), Food Preparation & Serving (159 | 4.8%), Cleaning & Maintenance (135 | 4.1%), Personal Care & Service (108 | 3.2%), and Security & Protection (105 | 3.2%).
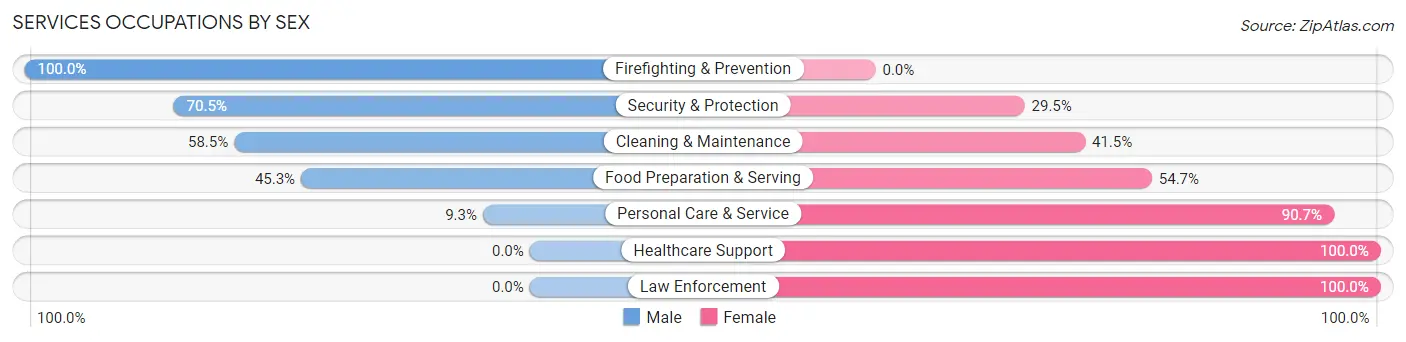
Services Occupations by Sex
Within the Services occupations in Demopolis, the most male-oriented occupations are Firefighting & Prevention (100.0%), Security & Protection (70.5%), and Cleaning & Maintenance (58.5%), while the most female-oriented occupations are Healthcare Support (100.0%), Law Enforcement (100.0%), and Personal Care & Service (90.7%).
| Occupation | Male | Female |
| Healthcare Support | 0 (0.0%) | 193 (100.0%) |
| Security & Protection | 74 (70.5%) | 31 (29.5%) |
| Firefighting & Prevention | 74 (100.0%) | 0 (0.0%) |
| Law Enforcement | 0 (0.0%) | 31 (100.0%) |
| Food Preparation & Serving | 72 (45.3%) | 87 (54.7%) |
| Cleaning & Maintenance | 79 (58.5%) | 56 (41.5%) |
| Personal Care & Service | 10 (9.3%) | 98 (90.7%) |
| Total (Category) | 235 (33.6%) | 465 (66.4%) |
| Total (Overall) | 1,378 (41.4%) | 1,953 (58.6%) |
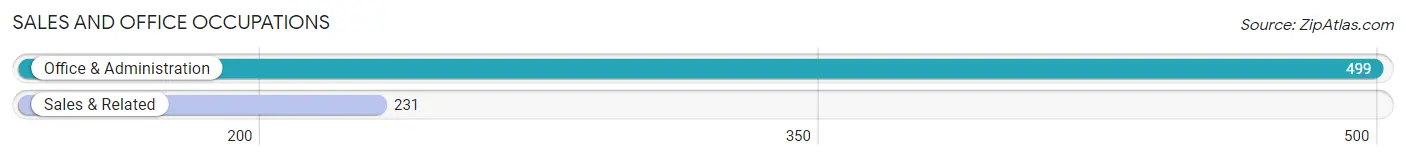
Sales and Office Occupations
The most common Sales and Office occupations in Demopolis are Office & Administration (499 | 15.0%), and Sales & Related (231 | 6.9%).
Sales and Office Occupations by Sex
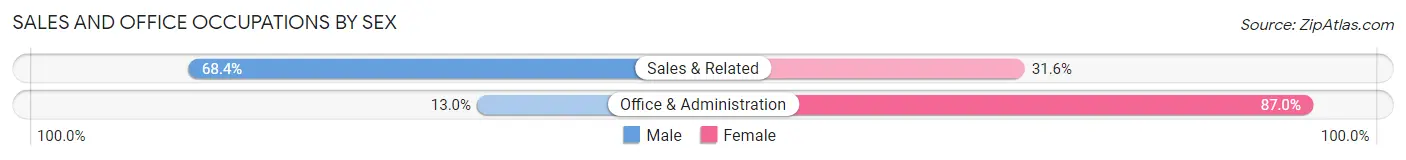
| Occupation | Male | Female |
| Sales & Related | 158 (68.4%) | 73 (31.6%) |
| Office & Administration | 65 (13.0%) | 434 (87.0%) |
| Total (Category) | 223 (30.5%) | 507 (69.5%) |
| Total (Overall) | 1,378 (41.4%) | 1,953 (58.6%) |
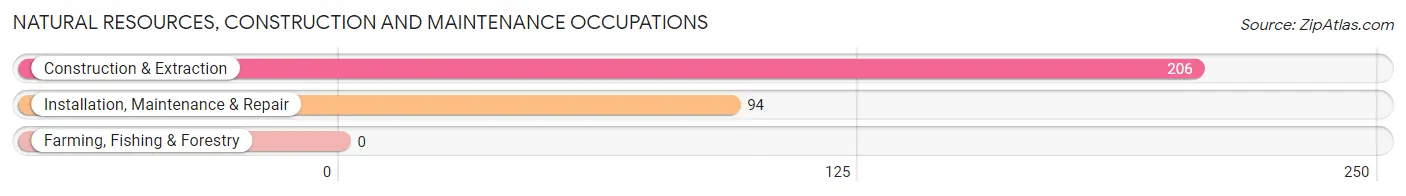
Natural Resources, Construction and Maintenance Occupations
The most common Natural Resources, Construction and Maintenance occupations in Demopolis are Construction & Extraction (206 | 6.2%), and Installation, Maintenance & Repair (94 | 2.8%).
Natural Resources, Construction and Maintenance Occupations by Sex
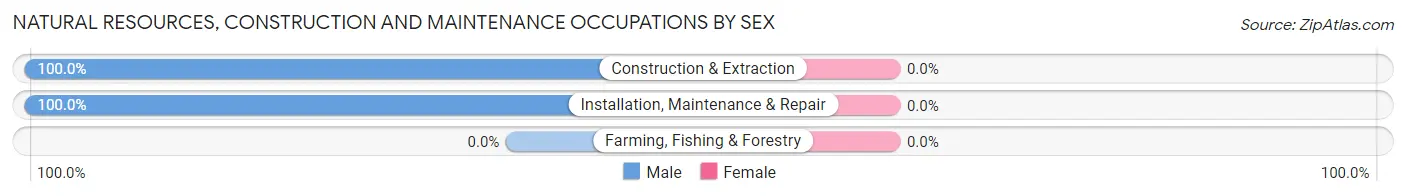
| Occupation | Male | Female |
| Farming, Fishing & Forestry | 0 (0.0%) | 0 (0.0%) |
| Construction & Extraction | 206 (100.0%) | 0 (0.0%) |
| Installation, Maintenance & Repair | 94 (100.0%) | 0 (0.0%) |
| Total (Category) | 300 (100.0%) | 0 (0.0%) |
| Total (Overall) | 1,378 (41.4%) | 1,953 (58.6%) |
Production, Transportation and Moving Occupations
The most common Production, Transportation and Moving occupations in Demopolis are Production (158 | 4.7%), Transportation (140 | 4.2%), and Material Moving (101 | 3.0%).
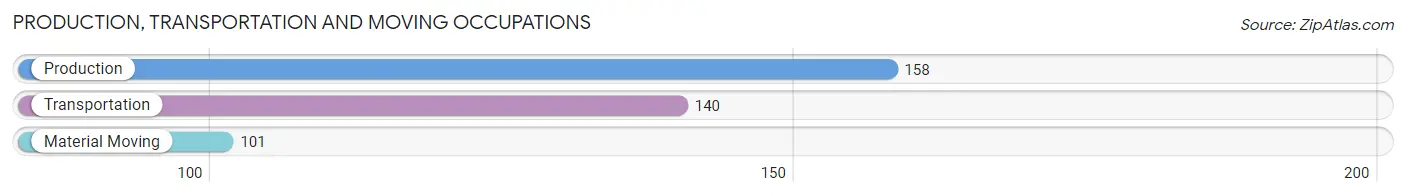
Production, Transportation and Moving Occupations by Sex
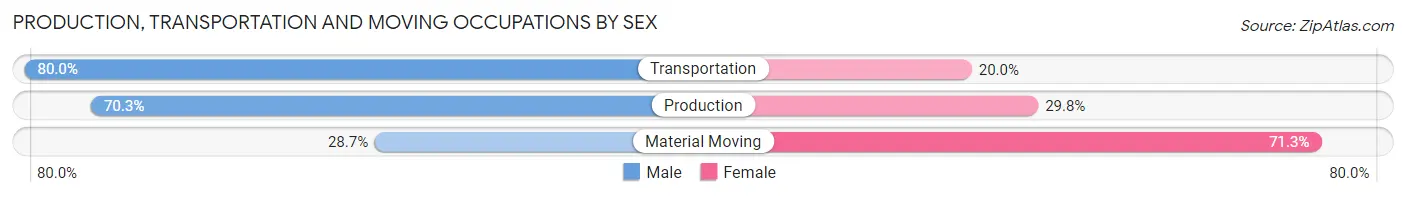
| Occupation | Male | Female |
| Production | 111 (70.3%) | 47 (29.7%) |
| Transportation | 112 (80.0%) | 28 (20.0%) |
| Material Moving | 29 (28.7%) | 72 (71.3%) |
| Total (Category) | 252 (63.2%) | 147 (36.8%) |
| Total (Overall) | 1,378 (41.4%) | 1,953 (58.6%) |
Employment Industries by Sex in Demopolis
Employment Industries in Demopolis
The major employment industries in Demopolis include Health Care & Social Assistance (487 | 14.6%), Manufacturing (467 | 14.0%), Accommodation & Food Services (425 | 12.8%), Educational Services (395 | 11.9%), and Retail Trade (393 | 11.8%).
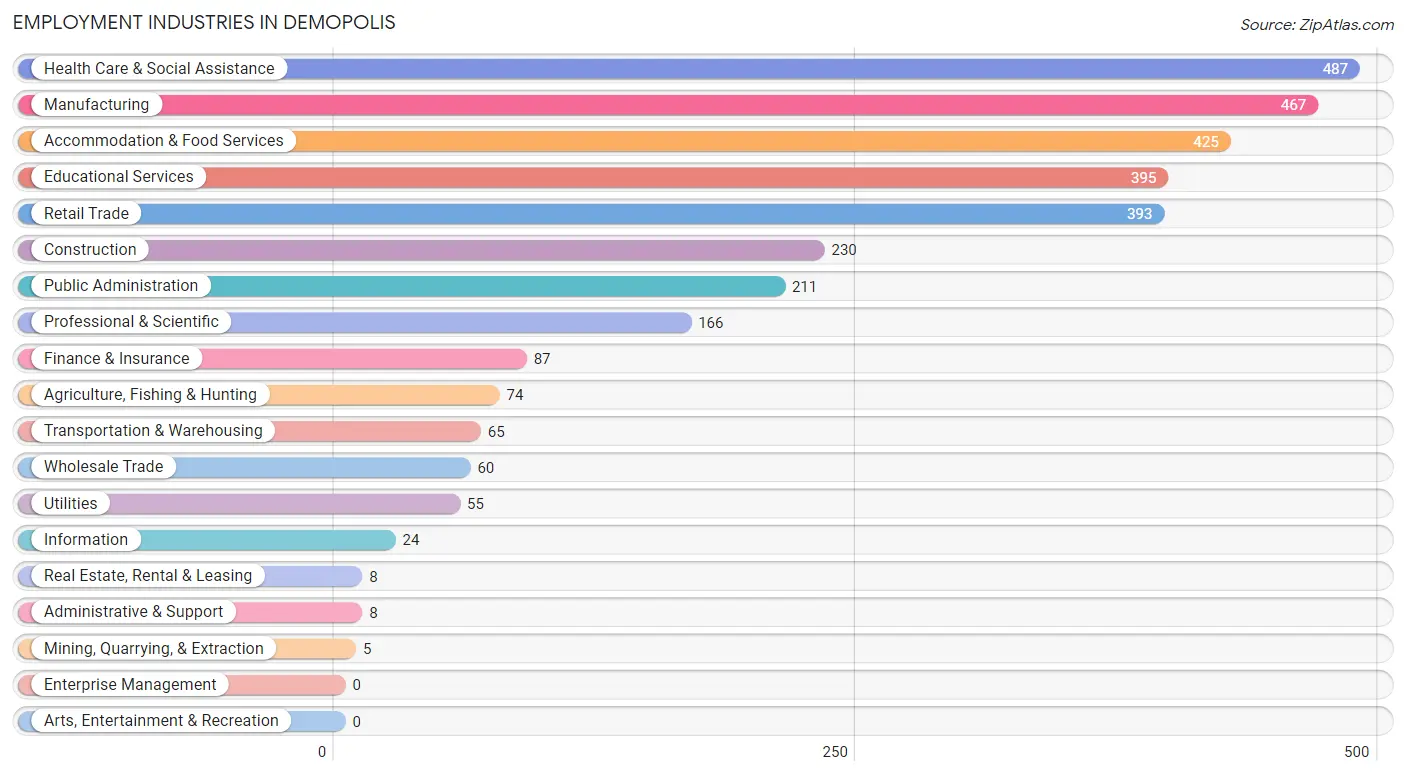
Employment Industries by Sex in Demopolis
The Demopolis industries that see more men than women are Agriculture, Fishing & Hunting (100.0%), Mining, Quarrying, & Extraction (100.0%), and Information (100.0%), whereas the industries that tend to have a higher number of women are Administrative & Support (100.0%), Health Care & Social Assistance (92.8%), and Educational Services (91.6%).
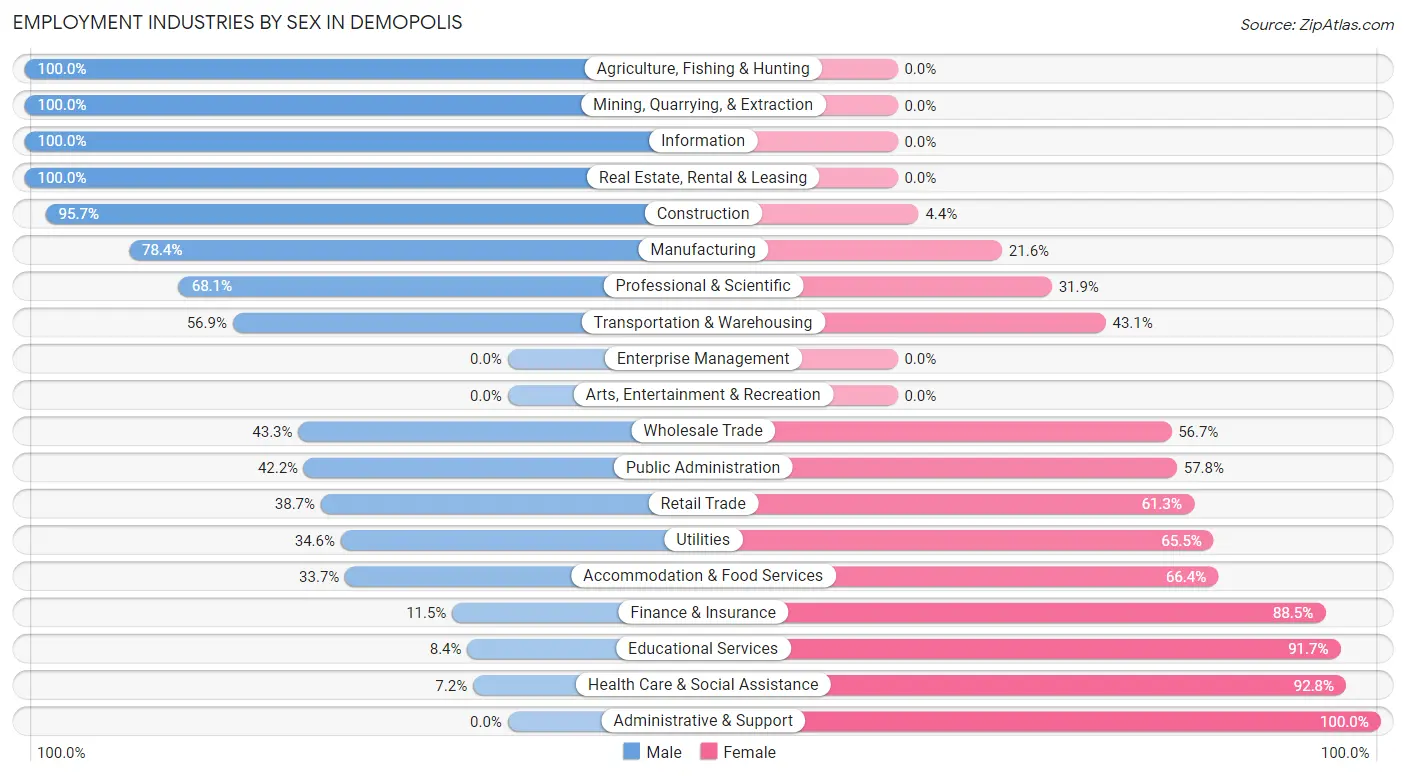
| Industry | Male | Female |
| Agriculture, Fishing & Hunting | 74 (100.0%) | 0 (0.0%) |
| Mining, Quarrying, & Extraction | 5 (100.0%) | 0 (0.0%) |
| Construction | 220 (95.7%) | 10 (4.3%) |
| Manufacturing | 366 (78.4%) | 101 (21.6%) |
| Wholesale Trade | 26 (43.3%) | 34 (56.7%) |
| Retail Trade | 152 (38.7%) | 241 (61.3%) |
| Transportation & Warehousing | 37 (56.9%) | 28 (43.1%) |
| Utilities | 19 (34.5%) | 36 (65.4%) |
| Information | 24 (100.0%) | 0 (0.0%) |
| Finance & Insurance | 10 (11.5%) | 77 (88.5%) |
| Real Estate, Rental & Leasing | 8 (100.0%) | 0 (0.0%) |
| Professional & Scientific | 113 (68.1%) | 53 (31.9%) |
| Enterprise Management | 0 (0.0%) | 0 (0.0%) |
| Administrative & Support | 0 (0.0%) | 8 (100.0%) |
| Educational Services | 33 (8.4%) | 362 (91.6%) |
| Health Care & Social Assistance | 35 (7.2%) | 452 (92.8%) |
| Arts, Entertainment & Recreation | 0 (0.0%) | 0 (0.0%) |
| Accommodation & Food Services | 143 (33.7%) | 282 (66.3%) |
| Public Administration | 89 (42.2%) | 122 (57.8%) |
| Total | 1,378 (41.4%) | 1,953 (58.6%) |
Education in Demopolis
School Enrollment in Demopolis
The most common levels of schooling among the 1,804 students in Demopolis are elementary school (453 | 25.1%), college / undergraduate (432 | 23.9%), and middle school (416 | 23.1%).
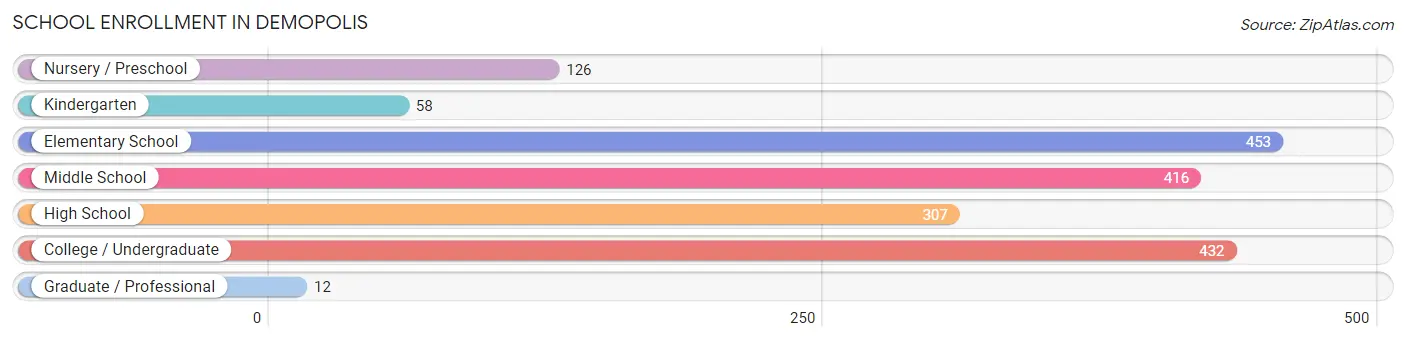
| School Level | # Students | % Students |
| Nursery / Preschool | 126 | 7.0% |
| Kindergarten | 58 | 3.2% |
| Elementary School | 453 | 25.1% |
| Middle School | 416 | 23.1% |
| High School | 307 | 17.0% |
| College / Undergraduate | 432 | 23.9% |
| Graduate / Professional | 12 | 0.7% |
| Total | 1,804 | 100.0% |
School Enrollment by Age by Funding Source in Demopolis
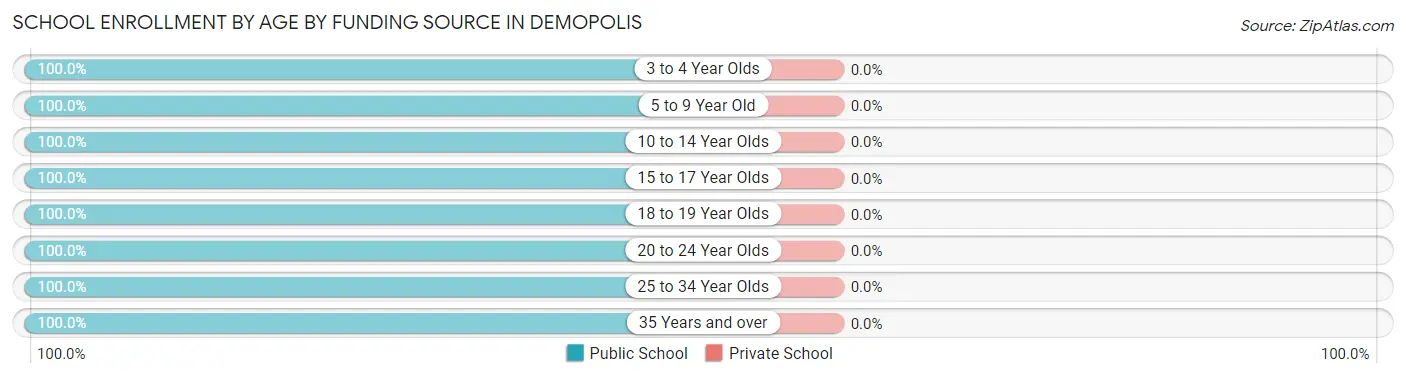
| Age Bracket | Public School | Private School |
| 3 to 4 Year Olds | 126 (100.0%) | 0 (0.0%) |
| 5 to 9 Year Old | 479 (100.0%) | 0 (0.0%) |
| 10 to 14 Year Olds | 525 (100.0%) | 0 (0.0%) |
| 15 to 17 Year Olds | 154 (100.0%) | 0 (0.0%) |
| 18 to 19 Year Olds | 290 (100.0%) | 0 (0.0%) |
| 20 to 24 Year Olds | 177 (100.0%) | 0 (0.0%) |
| 25 to 34 Year Olds | 35 (100.0%) | 0 (0.0%) |
| 35 Years and over | 18 (100.0%) | 0 (0.0%) |
| Total | 1,804 (100.0%) | 0 (0.0%) |
Educational Attainment by Field of Study in Demopolis
Business (527 | 35.8%), education (416 | 28.2%), science & technology (178 | 12.1%), liberal arts & history (94 | 6.4%), and bio, nature & agricultural (72 | 4.9%) are the most common fields of study among 1,473 individuals in Demopolis who have obtained a bachelor's degree or higher.
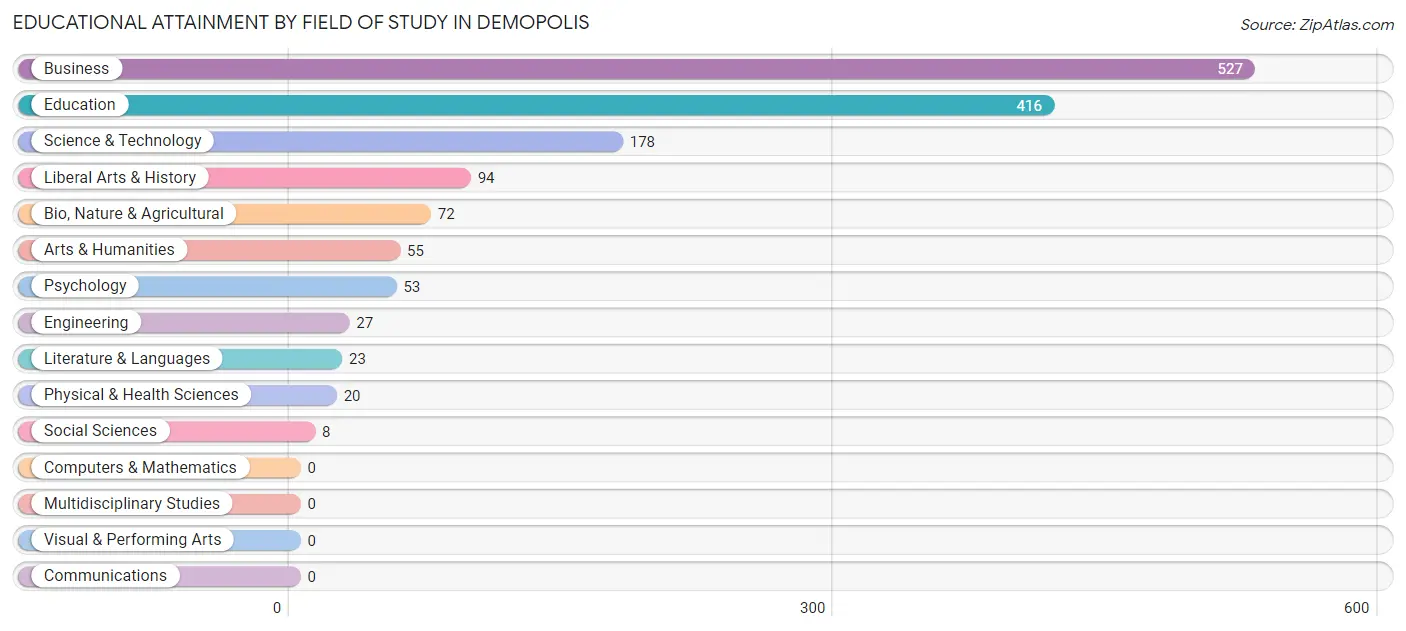
| Field of Study | # Graduates | % Graduates |
| Computers & Mathematics | 0 | 0.0% |
| Bio, Nature & Agricultural | 72 | 4.9% |
| Physical & Health Sciences | 20 | 1.4% |
| Psychology | 53 | 3.6% |
| Social Sciences | 8 | 0.5% |
| Engineering | 27 | 1.8% |
| Multidisciplinary Studies | 0 | 0.0% |
| Science & Technology | 178 | 12.1% |
| Business | 527 | 35.8% |
| Education | 416 | 28.2% |
| Literature & Languages | 23 | 1.6% |
| Liberal Arts & History | 94 | 6.4% |
| Visual & Performing Arts | 0 | 0.0% |
| Communications | 0 | 0.0% |
| Arts & Humanities | 55 | 3.7% |
| Total | 1,473 | 100.0% |
Transportation & Commute in Demopolis
Vehicle Availability by Sex in Demopolis
The most prevalent vehicle ownership categories in Demopolis are males with 2 vehicles (577, accounting for 45.9%) and females with 2 vehicles (991, making up 29.9%).
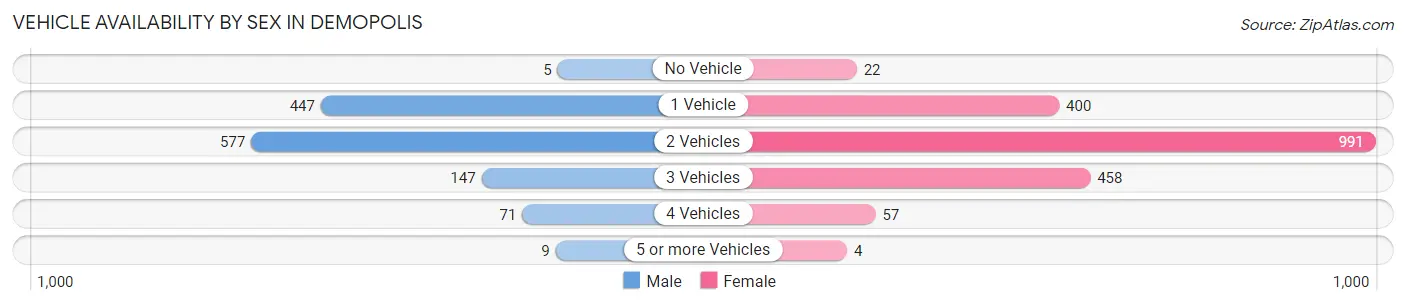
| Vehicles Available | Male | Female |
| No Vehicle | 5 (0.4%) | 22 (1.1%) |
| 1 Vehicle | 447 (35.6%) | 400 (20.7%) |
| 2 Vehicles | 577 (45.9%) | 991 (51.3%) |
| 3 Vehicles | 147 (11.7%) | 458 (23.7%) |
| 4 Vehicles | 71 (5.7%) | 57 (2.9%) |
| 5 or more Vehicles | 9 (0.7%) | 4 (0.2%) |
| Total | 1,256 (100.0%) | 1,932 (100.0%) |
Commute Time in Demopolis
The most frequently occuring commute durations in Demopolis are 5 to 9 minutes (969 commuters, 32.3%), 10 to 14 minutes (431 commuters, 14.3%), and 60 to 89 minutes (429 commuters, 14.3%).
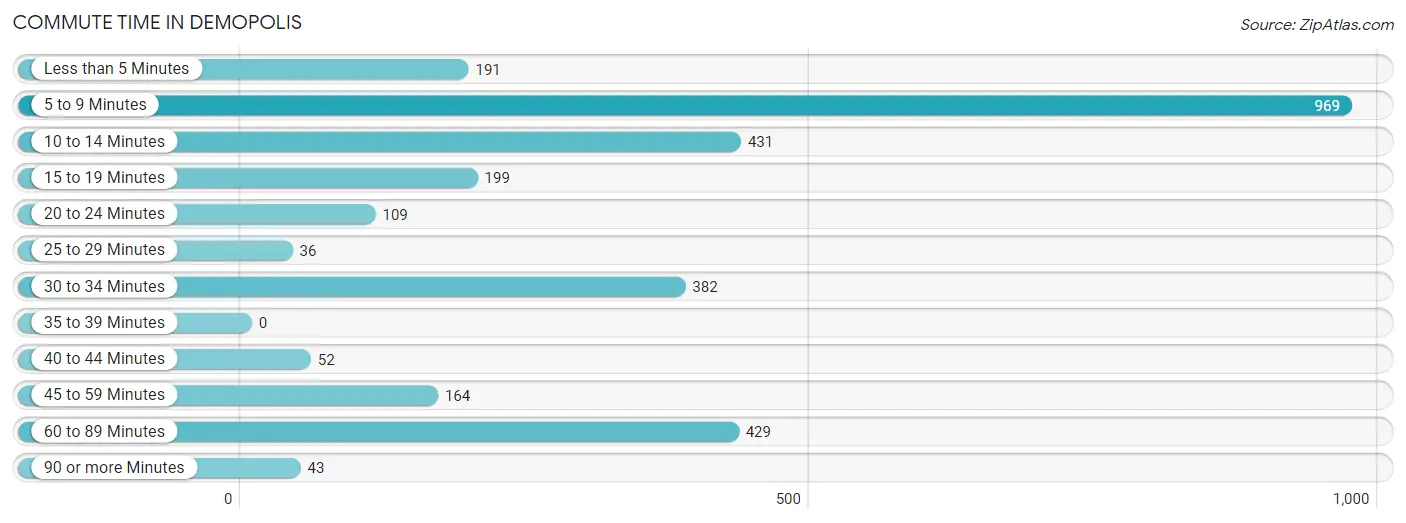
| Commute Time | # Commuters | % Commuters |
| Less than 5 Minutes | 191 | 6.4% |
| 5 to 9 Minutes | 969 | 32.3% |
| 10 to 14 Minutes | 431 | 14.3% |
| 15 to 19 Minutes | 199 | 6.6% |
| 20 to 24 Minutes | 109 | 3.6% |
| 25 to 29 Minutes | 36 | 1.2% |
| 30 to 34 Minutes | 382 | 12.7% |
| 35 to 39 Minutes | 0 | 0.0% |
| 40 to 44 Minutes | 52 | 1.7% |
| 45 to 59 Minutes | 164 | 5.5% |
| 60 to 89 Minutes | 429 | 14.3% |
| 90 or more Minutes | 43 | 1.4% |
Commute Time by Sex in Demopolis
The most common commute times in Demopolis are 5 to 9 minutes (339 commuters, 30.7%) for males and 5 to 9 minutes (630 commuters, 33.2%) for females.
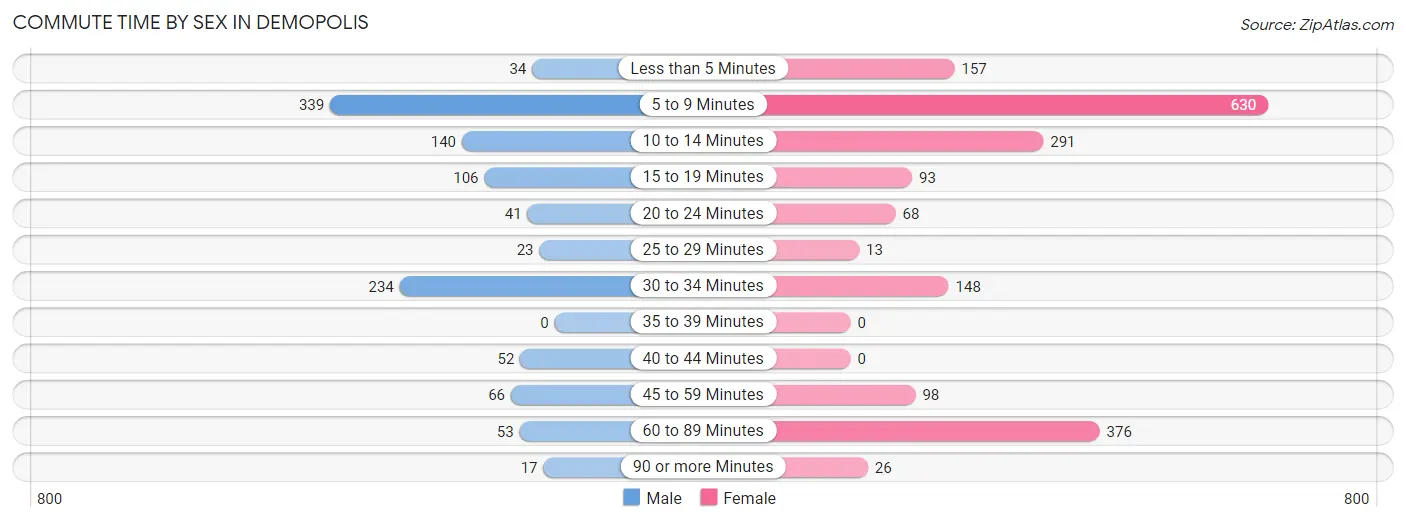
| Commute Time | Male | Female |
| Less than 5 Minutes | 34 (3.1%) | 157 (8.3%) |
| 5 to 9 Minutes | 339 (30.7%) | 630 (33.2%) |
| 10 to 14 Minutes | 140 (12.7%) | 291 (15.3%) |
| 15 to 19 Minutes | 106 (9.6%) | 93 (4.9%) |
| 20 to 24 Minutes | 41 (3.7%) | 68 (3.6%) |
| 25 to 29 Minutes | 23 (2.1%) | 13 (0.7%) |
| 30 to 34 Minutes | 234 (21.2%) | 148 (7.8%) |
| 35 to 39 Minutes | 0 (0.0%) | 0 (0.0%) |
| 40 to 44 Minutes | 52 (4.7%) | 0 (0.0%) |
| 45 to 59 Minutes | 66 (6.0%) | 98 (5.2%) |
| 60 to 89 Minutes | 53 (4.8%) | 376 (19.8%) |
| 90 or more Minutes | 17 (1.5%) | 26 (1.4%) |
Time of Departure to Work by Sex in Demopolis
The most frequent times of departure to work in Demopolis are 6:00 AM to 6:29 AM (246, 22.3%) for males and 7:00 AM to 7:29 AM (434, 22.8%) for females.
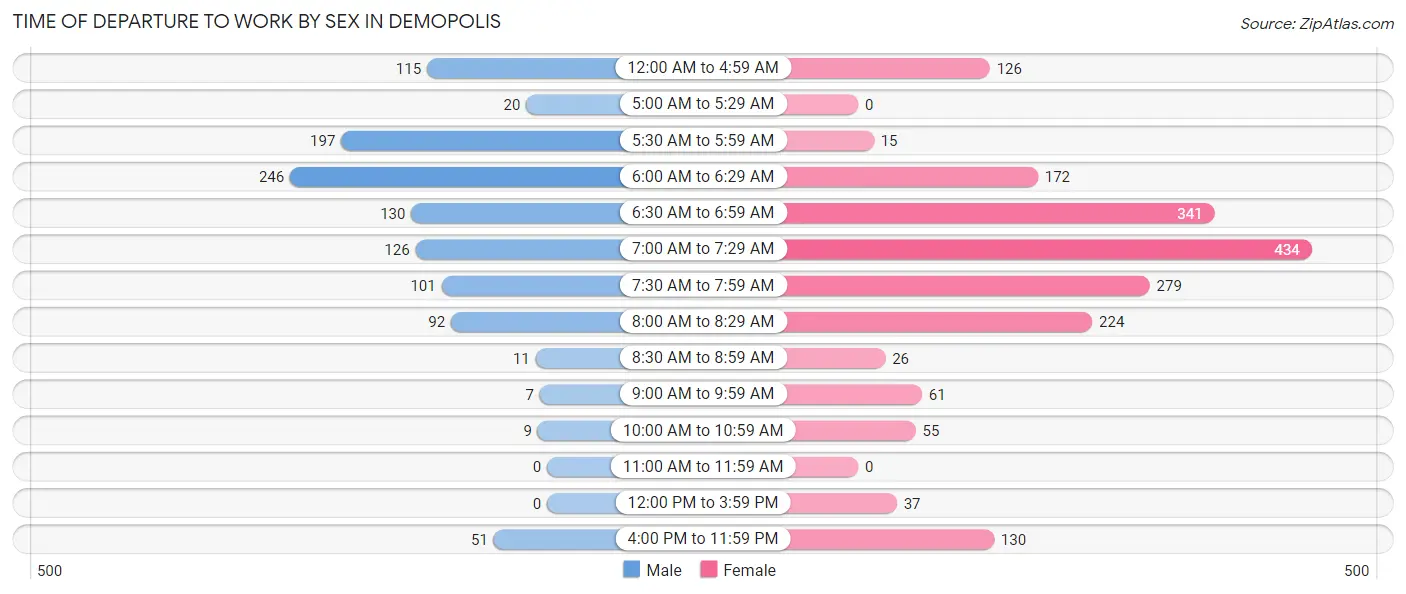
| Time of Departure | Male | Female |
| 12:00 AM to 4:59 AM | 115 (10.4%) | 126 (6.6%) |
| 5:00 AM to 5:29 AM | 20 (1.8%) | 0 (0.0%) |
| 5:30 AM to 5:59 AM | 197 (17.8%) | 15 (0.8%) |
| 6:00 AM to 6:29 AM | 246 (22.3%) | 172 (9.0%) |
| 6:30 AM to 6:59 AM | 130 (11.8%) | 341 (17.9%) |
| 7:00 AM to 7:29 AM | 126 (11.4%) | 434 (22.8%) |
| 7:30 AM to 7:59 AM | 101 (9.1%) | 279 (14.7%) |
| 8:00 AM to 8:29 AM | 92 (8.3%) | 224 (11.8%) |
| 8:30 AM to 8:59 AM | 11 (1.0%) | 26 (1.4%) |
| 9:00 AM to 9:59 AM | 7 (0.6%) | 61 (3.2%) |
| 10:00 AM to 10:59 AM | 9 (0.8%) | 55 (2.9%) |
| 11:00 AM to 11:59 AM | 0 (0.0%) | 0 (0.0%) |
| 12:00 PM to 3:59 PM | 0 (0.0%) | 37 (1.9%) |
| 4:00 PM to 11:59 PM | 51 (4.6%) | 130 (6.8%) |
| Total | 1,105 (100.0%) | 1,900 (100.0%) |
Housing Occupancy in Demopolis
Occupancy by Ownership in Demopolis
Of the total 3,064 dwellings in Demopolis, owner-occupied units account for 1,639 (53.5%), while renter-occupied units make up 1,425 (46.5%).
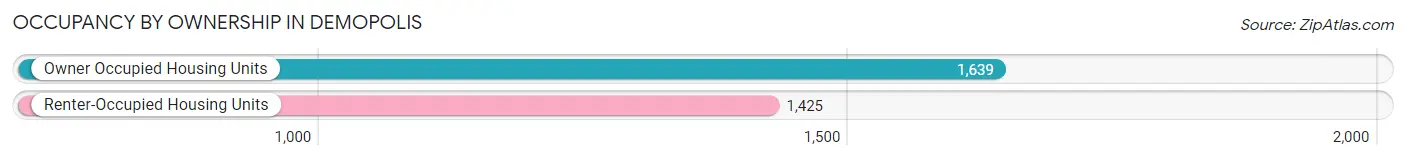
| Occupancy | # Housing Units | % Housing Units |
| Owner Occupied Housing Units | 1,639 | 53.5% |
| Renter-Occupied Housing Units | 1,425 | 46.5% |
| Total Occupied Housing Units | 3,064 | 100.0% |
Occupancy by Household Size in Demopolis
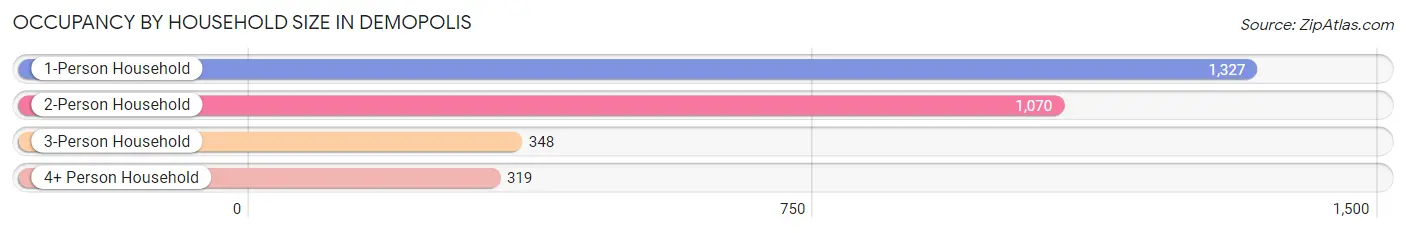
| Household Size | # Housing Units | % Housing Units |
| 1-Person Household | 1,327 | 43.3% |
| 2-Person Household | 1,070 | 34.9% |
| 3-Person Household | 348 | 11.4% |
| 4+ Person Household | 319 | 10.4% |
| Total Housing Units | 3,064 | 100.0% |
Occupancy by Ownership by Household Size in Demopolis
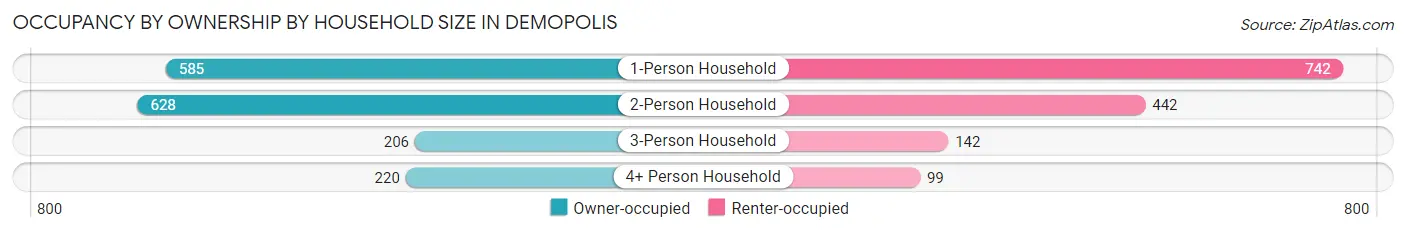
| Household Size | Owner-occupied | Renter-occupied |
| 1-Person Household | 585 (44.1%) | 742 (55.9%) |
| 2-Person Household | 628 (58.7%) | 442 (41.3%) |
| 3-Person Household | 206 (59.2%) | 142 (40.8%) |
| 4+ Person Household | 220 (69.0%) | 99 (31.0%) |
| Total Housing Units | 1,639 (53.5%) | 1,425 (46.5%) |
Occupancy by Educational Attainment in Demopolis
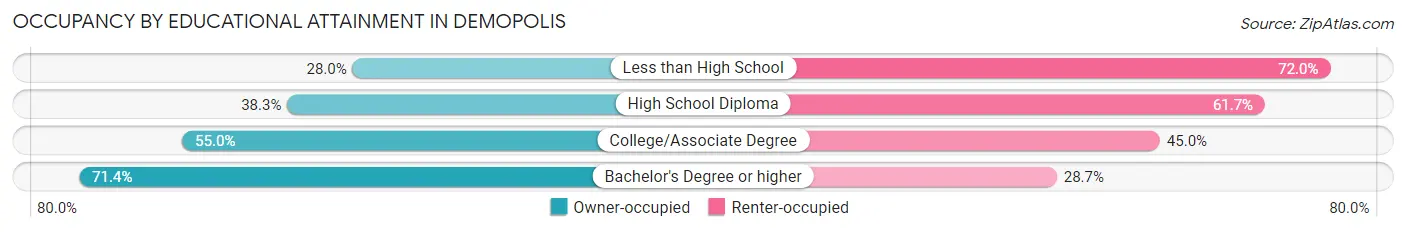
| Household Size | Owner-occupied | Renter-occupied |
| Less than High School | 47 (28.0%) | 121 (72.0%) |
| High School Diploma | 355 (38.3%) | 571 (61.7%) |
| College/Associate Degree | 567 (55.0%) | 464 (45.0%) |
| Bachelor's Degree or higher | 670 (71.4%) | 269 (28.6%) |
Occupancy by Age of Householder in Demopolis
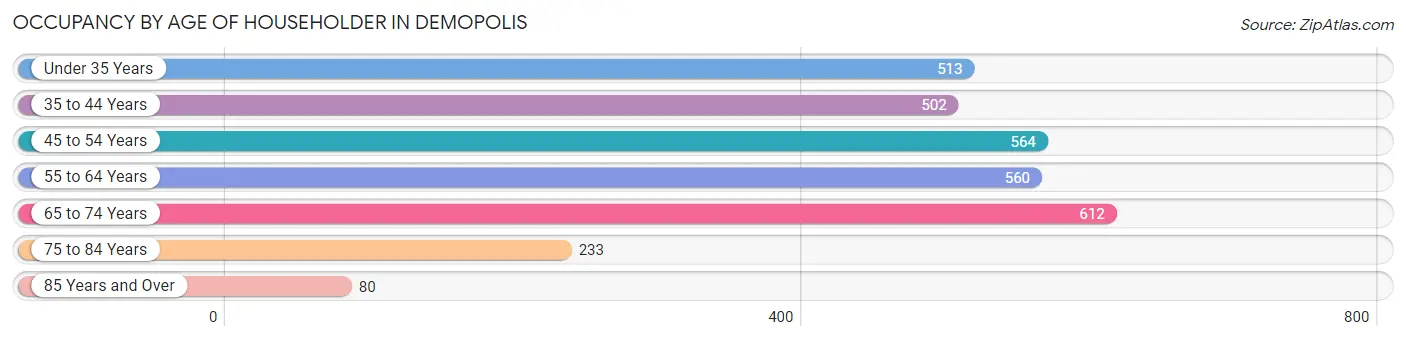
| Age Bracket | # Households | % Households |
| Under 35 Years | 513 | 16.7% |
| 35 to 44 Years | 502 | 16.4% |
| 45 to 54 Years | 564 | 18.4% |
| 55 to 64 Years | 560 | 18.3% |
| 65 to 74 Years | 612 | 20.0% |
| 75 to 84 Years | 233 | 7.6% |
| 85 Years and Over | 80 | 2.6% |
| Total | 3,064 | 100.0% |
Housing Finances in Demopolis
Median Income by Occupancy in Demopolis
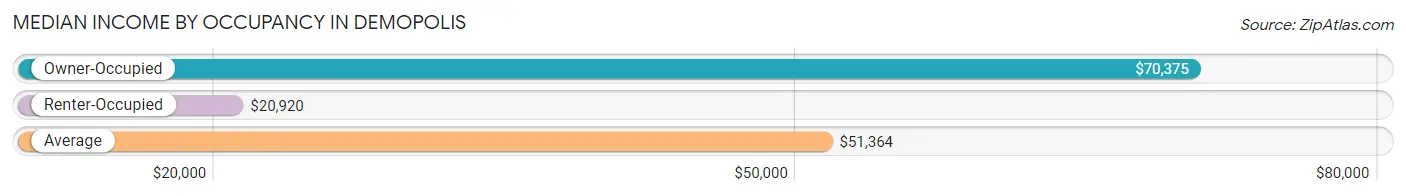
| Occupancy Type | # Households | Median Income |
| Owner-Occupied | 1,639 (53.5%) | $70,375 |
| Renter-Occupied | 1,425 (46.5%) | $20,920 |
| Average | 3,064 (100.0%) | $51,364 |
Occupancy by Householder Income Bracket in Demopolis
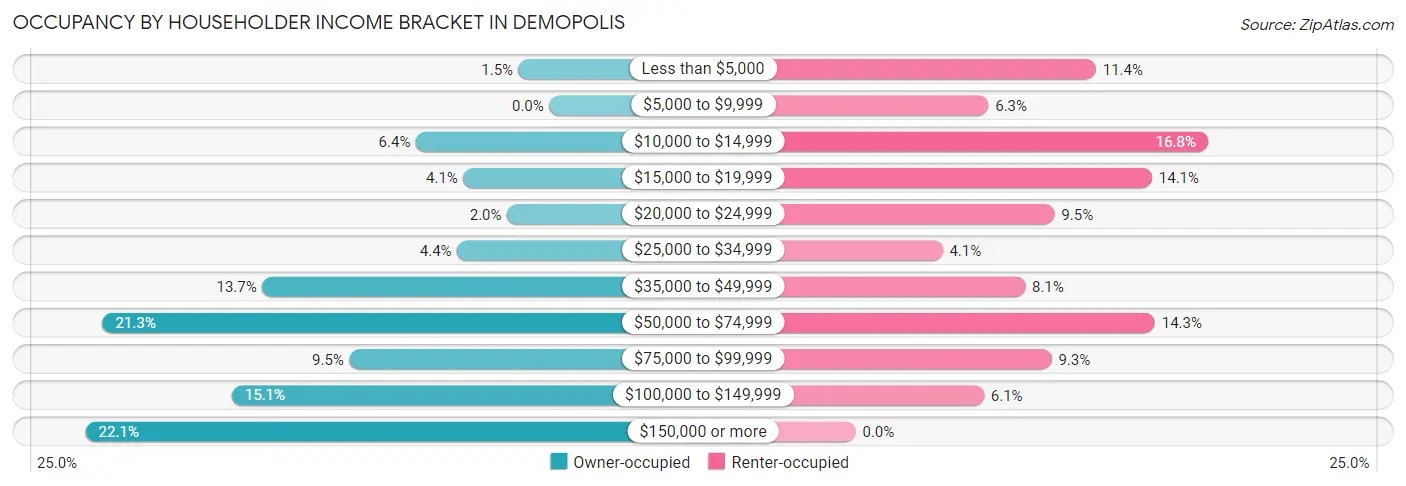
| Income Bracket | Owner-occupied | Renter-occupied |
| Less than $5,000 | 24 (1.5%) | 163 (11.4%) |
| $5,000 to $9,999 | 0 (0.0%) | 90 (6.3%) |
| $10,000 to $14,999 | 104 (6.4%) | 239 (16.8%) |
| $15,000 to $19,999 | 67 (4.1%) | 201 (14.1%) |
| $20,000 to $24,999 | 33 (2.0%) | 135 (9.5%) |
| $25,000 to $34,999 | 72 (4.4%) | 59 (4.1%) |
| $35,000 to $49,999 | 224 (13.7%) | 115 (8.1%) |
| $50,000 to $74,999 | 349 (21.3%) | 203 (14.2%) |
| $75,000 to $99,999 | 156 (9.5%) | 133 (9.3%) |
| $100,000 to $149,999 | 248 (15.1%) | 87 (6.1%) |
| $150,000 or more | 362 (22.1%) | 0 (0.0%) |
| Total | 1,639 (100.0%) | 1,425 (100.0%) |
Monthly Housing Cost Tiers in Demopolis
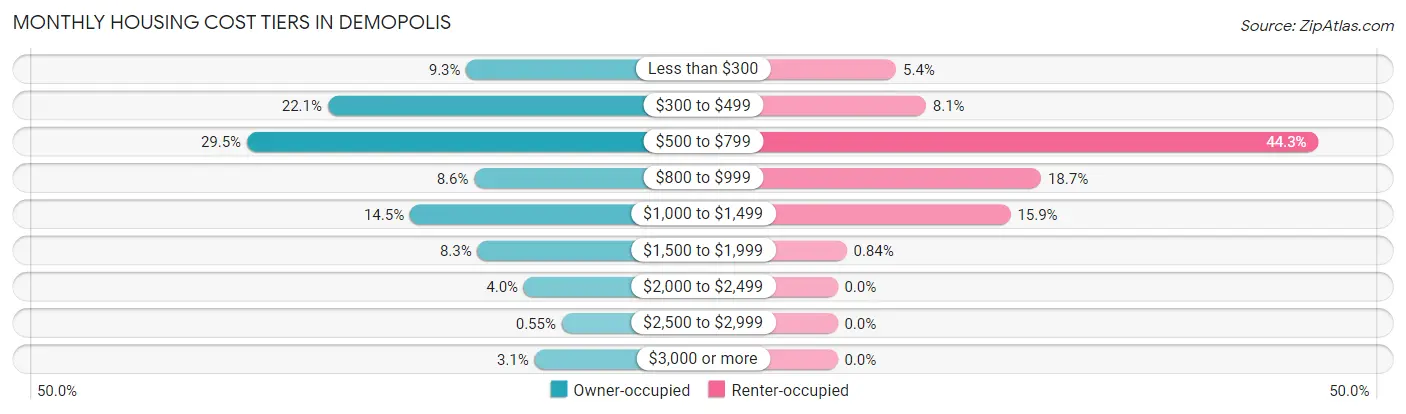
| Monthly Cost | Owner-occupied | Renter-occupied |
| Less than $300 | 153 (9.3%) | 77 (5.4%) |
| $300 to $499 | 362 (22.1%) | 116 (8.1%) |
| $500 to $799 | 484 (29.5%) | 631 (44.3%) |
| $800 to $999 | 141 (8.6%) | 267 (18.7%) |
| $1,000 to $1,499 | 238 (14.5%) | 227 (15.9%) |
| $1,500 to $1,999 | 136 (8.3%) | 12 (0.8%) |
| $2,000 to $2,499 | 66 (4.0%) | 0 (0.0%) |
| $2,500 to $2,999 | 9 (0.5%) | 0 (0.0%) |
| $3,000 or more | 50 (3.0%) | 0 (0.0%) |
| Total | 1,639 (100.0%) | 1,425 (100.0%) |
Physical Housing Characteristics in Demopolis
Housing Structures in Demopolis
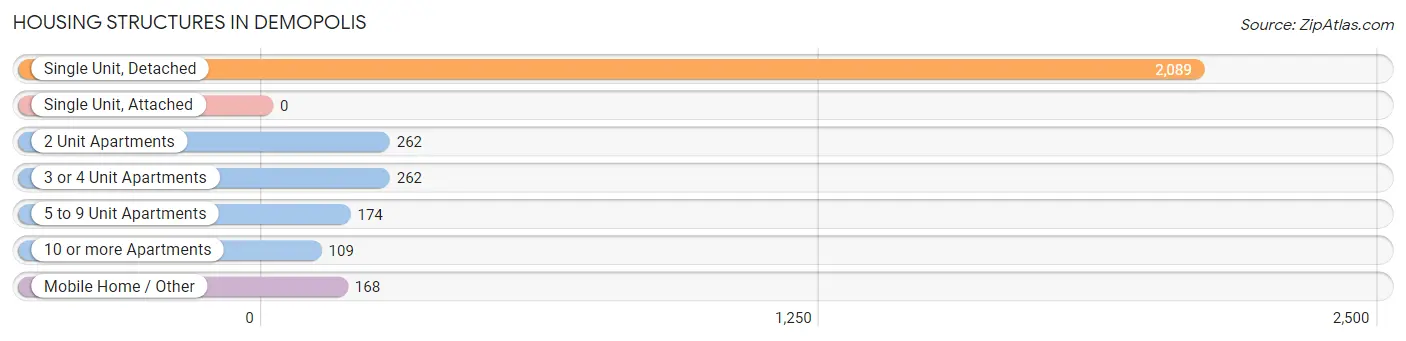
| Structure Type | # Housing Units | % Housing Units |
| Single Unit, Detached | 2,089 | 68.2% |
| Single Unit, Attached | 0 | 0.0% |
| 2 Unit Apartments | 262 | 8.6% |
| 3 or 4 Unit Apartments | 262 | 8.6% |
| 5 to 9 Unit Apartments | 174 | 5.7% |
| 10 or more Apartments | 109 | 3.6% |
| Mobile Home / Other | 168 | 5.5% |
| Total | 3,064 | 100.0% |
Housing Structures by Occupancy in Demopolis
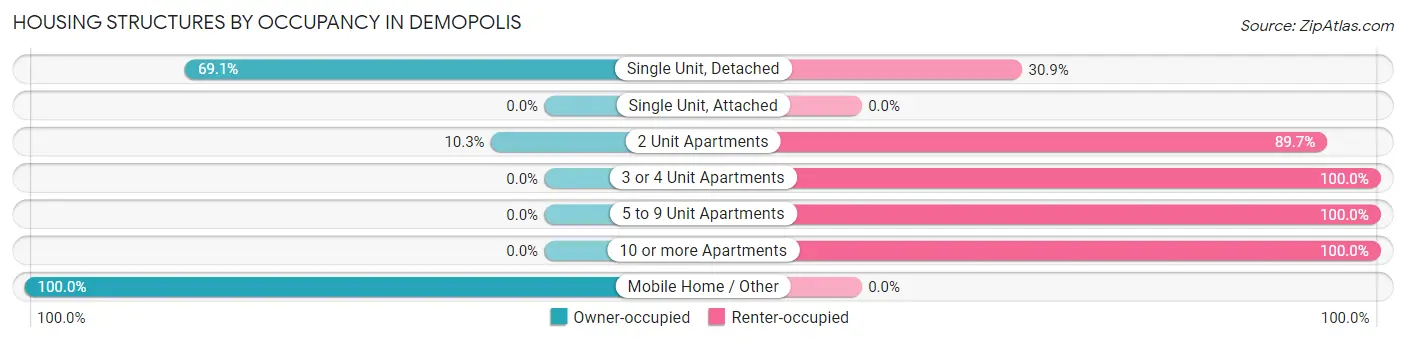
| Structure Type | Owner-occupied | Renter-occupied |
| Single Unit, Detached | 1,444 (69.1%) | 645 (30.9%) |
| Single Unit, Attached | 0 (0.0%) | 0 (0.0%) |
| 2 Unit Apartments | 27 (10.3%) | 235 (89.7%) |
| 3 or 4 Unit Apartments | 0 (0.0%) | 262 (100.0%) |
| 5 to 9 Unit Apartments | 0 (0.0%) | 174 (100.0%) |
| 10 or more Apartments | 0 (0.0%) | 109 (100.0%) |
| Mobile Home / Other | 168 (100.0%) | 0 (0.0%) |
| Total | 1,639 (53.5%) | 1,425 (46.5%) |
Housing Structures by Number of Rooms in Demopolis
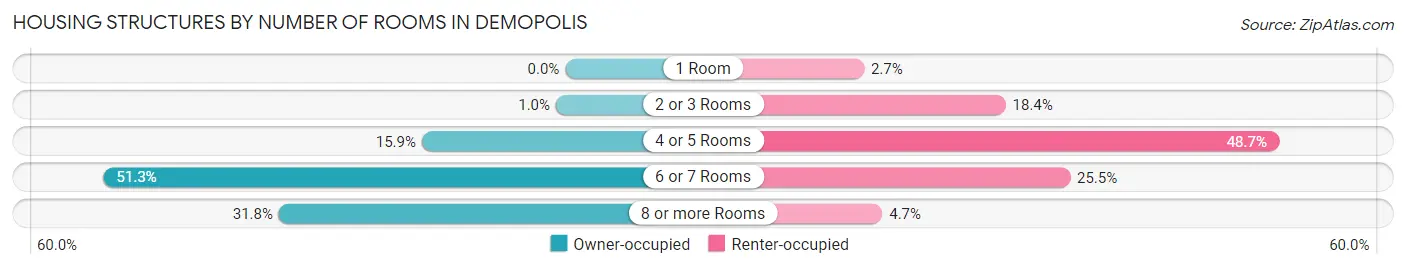
| Number of Rooms | Owner-occupied | Renter-occupied |
| 1 Room | 0 (0.0%) | 38 (2.7%) |
| 2 or 3 Rooms | 17 (1.0%) | 262 (18.4%) |
| 4 or 5 Rooms | 261 (15.9%) | 694 (48.7%) |
| 6 or 7 Rooms | 840 (51.2%) | 364 (25.5%) |
| 8 or more Rooms | 521 (31.8%) | 67 (4.7%) |
| Total | 1,639 (100.0%) | 1,425 (100.0%) |
Housing Structure by Heating Type in Demopolis
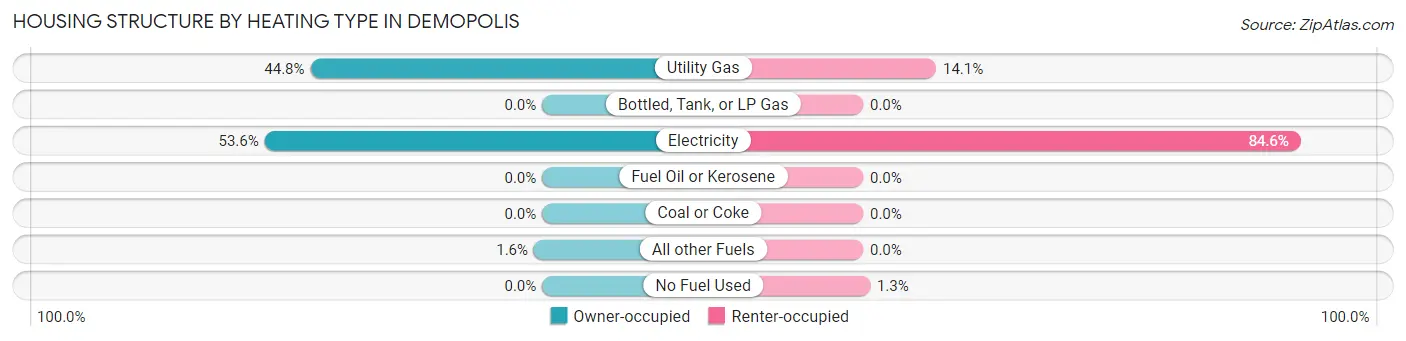
| Heating Type | Owner-occupied | Renter-occupied |
| Utility Gas | 734 (44.8%) | 201 (14.1%) |
| Bottled, Tank, or LP Gas | 0 (0.0%) | 0 (0.0%) |
| Electricity | 879 (53.6%) | 1,205 (84.6%) |
| Fuel Oil or Kerosene | 0 (0.0%) | 0 (0.0%) |
| Coal or Coke | 0 (0.0%) | 0 (0.0%) |
| All other Fuels | 26 (1.6%) | 0 (0.0%) |
| No Fuel Used | 0 (0.0%) | 19 (1.3%) |
| Total | 1,639 (100.0%) | 1,425 (100.0%) |
Household Vehicle Usage in Demopolis
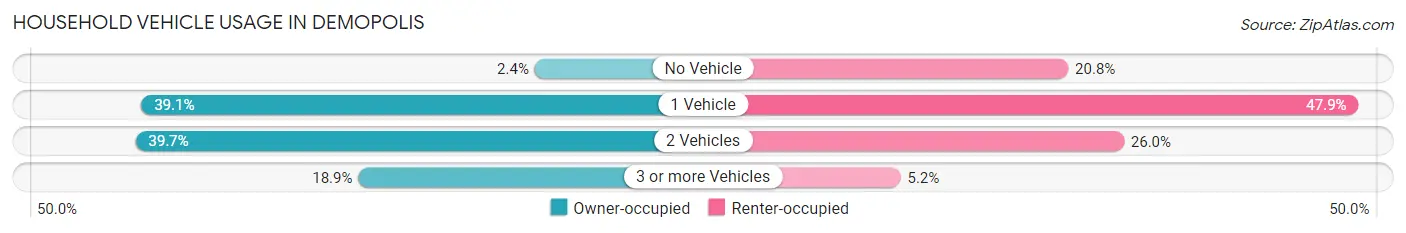
| Vehicles per Household | Owner-occupied | Renter-occupied |
| No Vehicle | 39 (2.4%) | 297 (20.8%) |
| 1 Vehicle | 641 (39.1%) | 683 (47.9%) |
| 2 Vehicles | 650 (39.7%) | 371 (26.0%) |
| 3 or more Vehicles | 309 (18.9%) | 74 (5.2%) |
| Total | 1,639 (100.0%) | 1,425 (100.0%) |
Real Estate & Mortgages in Demopolis
Real Estate and Mortgage Overview in Demopolis
| Characteristic | Without Mortgage | With Mortgage |
| Housing Units | 991 | 648 |
| Median Property Value | $195,900 | $203,300 |
| Median Household Income | $72,806 | $171 |
| Monthly Housing Costs | $492 | $50 |
| Real Estate Taxes | $804 | $132 |
Property Value by Mortgage Status in Demopolis
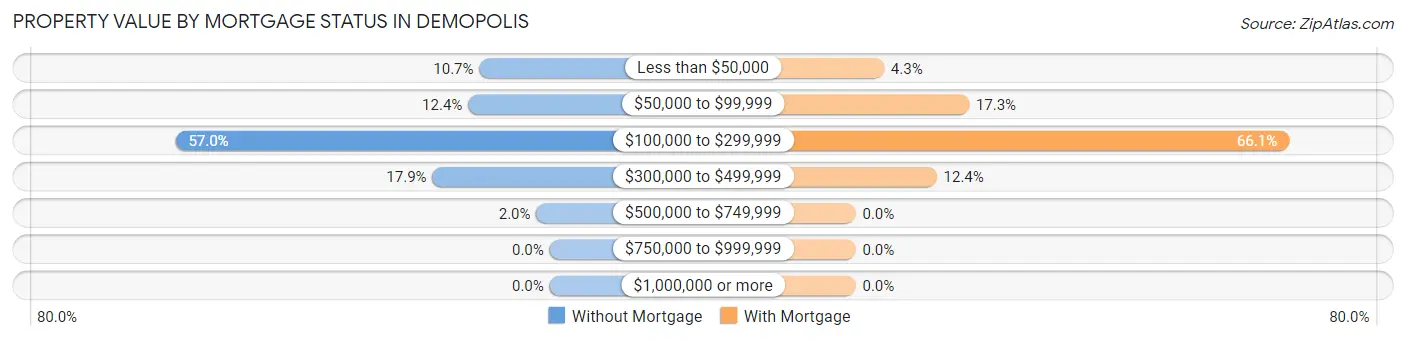
| Property Value | Without Mortgage | With Mortgage |
| Less than $50,000 | 106 (10.7%) | 28 (4.3%) |
| $50,000 to $99,999 | 123 (12.4%) | 112 (17.3%) |
| $100,000 to $299,999 | 565 (57.0%) | 428 (66.0%) |
| $300,000 to $499,999 | 177 (17.9%) | 80 (12.3%) |
| $500,000 to $749,999 | 20 (2.0%) | 0 (0.0%) |
| $750,000 to $999,999 | 0 (0.0%) | 0 (0.0%) |
| $1,000,000 or more | 0 (0.0%) | 0 (0.0%) |
| Total | 991 (100.0%) | 648 (100.0%) |
Household Income by Mortgage Status in Demopolis
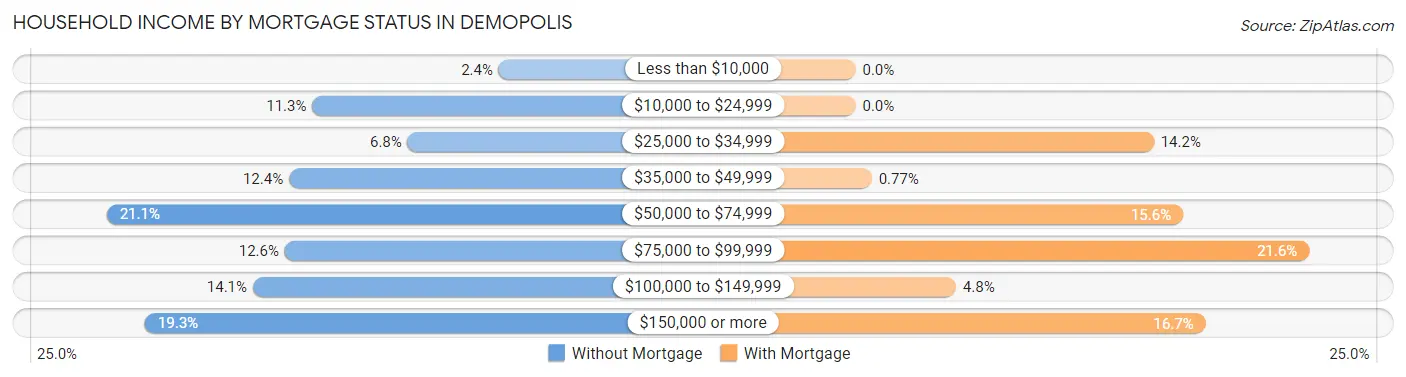
| Household Income | Without Mortgage | With Mortgage |
| Less than $10,000 | 24 (2.4%) | 0 (0.0%) |
| $10,000 to $24,999 | 112 (11.3%) | 0 (0.0%) |
| $25,000 to $34,999 | 67 (6.8%) | 92 (14.2%) |
| $35,000 to $49,999 | 123 (12.4%) | 5 (0.8%) |
| $50,000 to $74,999 | 209 (21.1%) | 101 (15.6%) |
| $75,000 to $99,999 | 125 (12.6%) | 140 (21.6%) |
| $100,000 to $149,999 | 140 (14.1%) | 31 (4.8%) |
| $150,000 or more | 191 (19.3%) | 108 (16.7%) |
| Total | 991 (100.0%) | 648 (100.0%) |
Property Value to Household Income Ratio in Demopolis
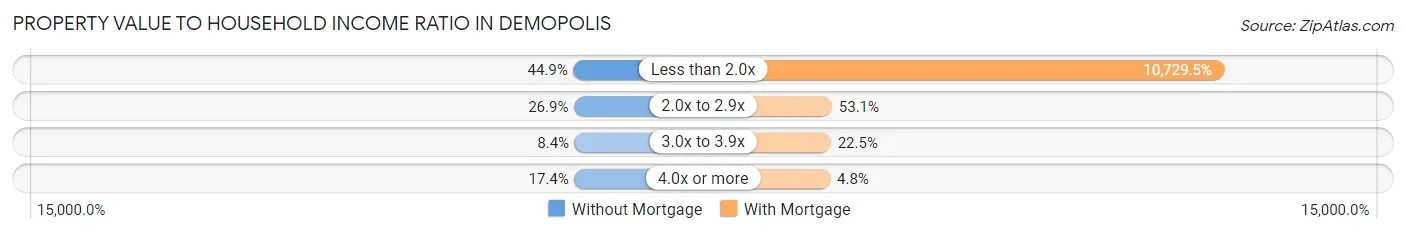
| Value-to-Income Ratio | Without Mortgage | With Mortgage |
| Less than 2.0x | 445 (44.9%) | 69,527 (10,729.5%) |
| 2.0x to 2.9x | 267 (26.9%) | 344 (53.1%) |
| 3.0x to 3.9x | 83 (8.4%) | 146 (22.5%) |
| 4.0x or more | 172 (17.4%) | 31 (4.8%) |
| Total | 991 (100.0%) | 648 (100.0%) |
Real Estate Taxes by Mortgage Status in Demopolis
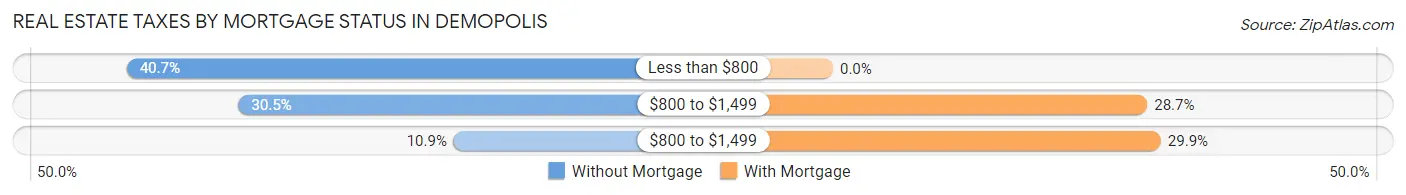
| Property Taxes | Without Mortgage | With Mortgage |
| Less than $800 | 403 (40.7%) | 0 (0.0%) |
| $800 to $1,499 | 302 (30.5%) | 186 (28.7%) |
| $800 to $1,499 | 108 (10.9%) | 194 (29.9%) |
| Total | 991 (100.0%) | 648 (100.0%) |
Health & Disability in Demopolis
Health Insurance Coverage by Age in Demopolis
| Age Bracket | With Coverage | Without Coverage |
| Under 6 Years | 503 (100.0%) | 0 (0.0%) |
| 6 to 18 Years | 1,314 (100.0%) | 0 (0.0%) |
| 19 to 25 Years | 455 (90.5%) | 48 (9.5%) |
| 26 to 34 Years | 474 (61.0%) | 303 (39.0%) |
| 35 to 44 Years | 700 (79.6%) | 179 (20.4%) |
| 45 to 54 Years | 875 (89.6%) | 101 (10.3%) |
| 55 to 64 Years | 732 (100.0%) | 0 (0.0%) |
| 65 to 74 Years | 815 (94.3%) | 49 (5.7%) |
| 75 Years and older | 433 (100.0%) | 0 (0.0%) |
| Total | 6,301 (90.3%) | 680 (9.7%) |
Health Insurance Coverage by Citizenship Status in Demopolis
| Citizenship Status | With Coverage | Without Coverage |
| Native Born | 503 (100.0%) | 0 (0.0%) |
| Foreign Born, Citizen | 1,314 (100.0%) | 0 (0.0%) |
| Foreign Born, not a Citizen | 455 (90.5%) | 48 (9.5%) |
Health Insurance Coverage by Household Income in Demopolis
| Household Income | With Coverage | Without Coverage |
| Under $25,000 | 1,818 (89.1%) | 223 (10.9%) |
| $25,000 to $49,999 | 792 (83.9%) | 152 (16.1%) |
| $50,000 to $74,999 | 1,283 (90.2%) | 140 (9.8%) |
| $75,000 to $99,999 | 499 (76.6%) | 152 (23.4%) |
| $100,000 and over | 1,887 (99.3%) | 13 (0.7%) |
Public vs Private Health Insurance Coverage by Age in Demopolis
| Age Bracket | Public Insurance | Private Insurance |
| Under 6 | 281 (55.9%) | 260 (51.7%) |
| 6 to 18 Years | 684 (52.0%) | 659 (50.1%) |
| 19 to 25 Years | 173 (34.4%) | 332 (66.0%) |
| 25 to 34 Years | 112 (14.4%) | 362 (46.6%) |
| 35 to 44 Years | 149 (17.0%) | 552 (62.8%) |
| 45 to 54 Years | 241 (24.7%) | 655 (67.1%) |
| 55 to 64 Years | 269 (36.7%) | 510 (69.7%) |
| 65 to 74 Years | 781 (90.4%) | 633 (73.3%) |
| 75 Years and over | 433 (100.0%) | 263 (60.7%) |
| Total | 3,123 (44.7%) | 4,226 (60.5%) |
Disability Status by Sex by Age in Demopolis
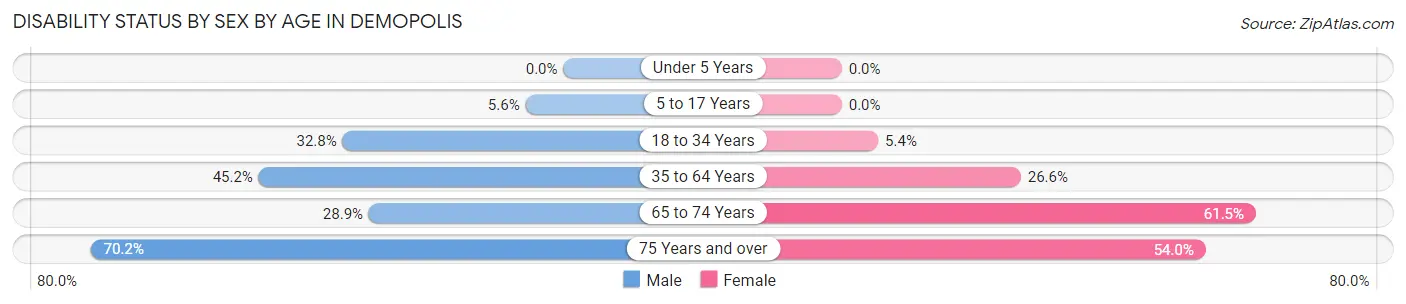
| Age Bracket | Male | Female |
| Under 5 Years | 0 (0.0%) | 0 (0.0%) |
| 5 to 17 Years | 18 (5.6%) | 0 (0.0%) |
| 18 to 34 Years | 180 (32.8%) | 51 (5.4%) |
| 35 to 64 Years | 532 (45.2%) | 375 (26.6%) |
| 65 to 74 Years | 125 (28.9%) | 265 (61.5%) |
| 75 Years and over | 139 (70.2%) | 127 (54.0%) |
Disability Class by Sex by Age in Demopolis
Disability Class: Hearing Difficulty
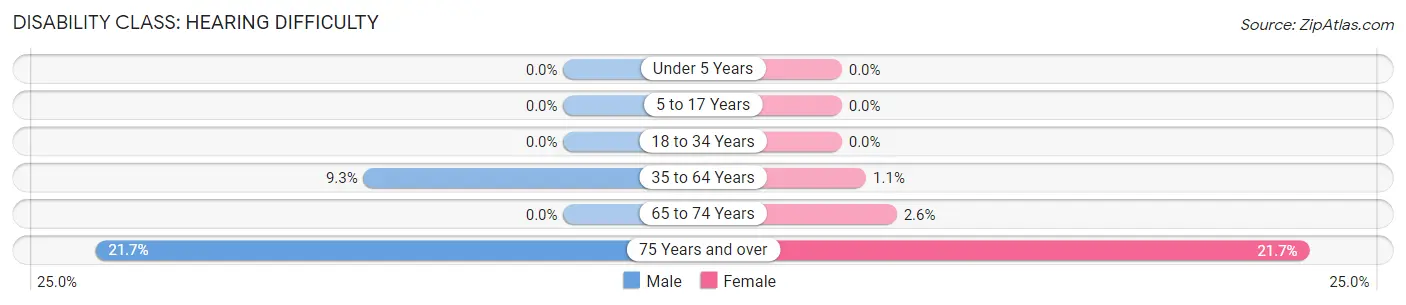
| Age Bracket | Male | Female |
| Under 5 Years | 0 (0.0%) | 0 (0.0%) |
| 5 to 17 Years | 0 (0.0%) | 0 (0.0%) |
| 18 to 34 Years | 0 (0.0%) | 0 (0.0%) |
| 35 to 64 Years | 109 (9.3%) | 16 (1.1%) |
| 65 to 74 Years | 0 (0.0%) | 11 (2.5%) |
| 75 Years and over | 43 (21.7%) | 51 (21.7%) |
Disability Class: Vision Difficulty
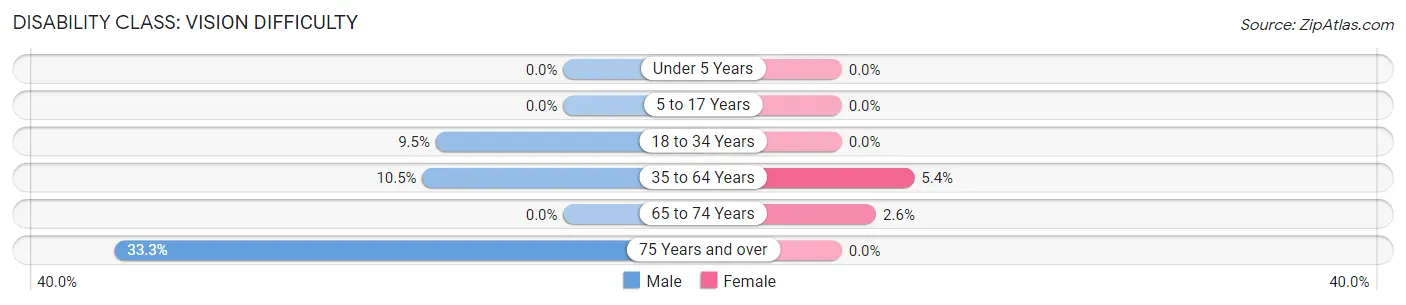
| Age Bracket | Male | Female |
| Under 5 Years | 0 (0.0%) | 0 (0.0%) |
| 5 to 17 Years | 0 (0.0%) | 0 (0.0%) |
| 18 to 34 Years | 52 (9.5%) | 0 (0.0%) |
| 35 to 64 Years | 123 (10.5%) | 76 (5.4%) |
| 65 to 74 Years | 0 (0.0%) | 11 (2.5%) |
| 75 Years and over | 66 (33.3%) | 0 (0.0%) |
Disability Class: Cognitive Difficulty
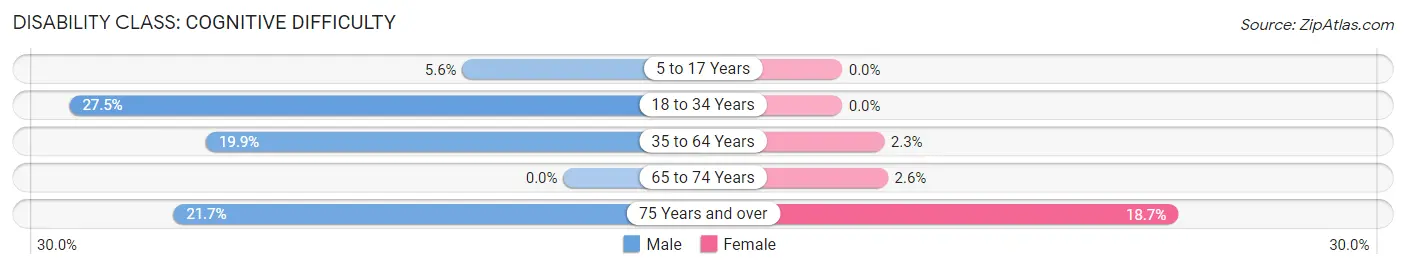
| Age Bracket | Male | Female |
| 5 to 17 Years | 18 (5.6%) | 0 (0.0%) |
| 18 to 34 Years | 151 (27.5%) | 0 (0.0%) |
| 35 to 64 Years | 234 (19.9%) | 33 (2.3%) |
| 65 to 74 Years | 0 (0.0%) | 11 (2.5%) |
| 75 Years and over | 43 (21.7%) | 44 (18.7%) |
Disability Class: Ambulatory Difficulty
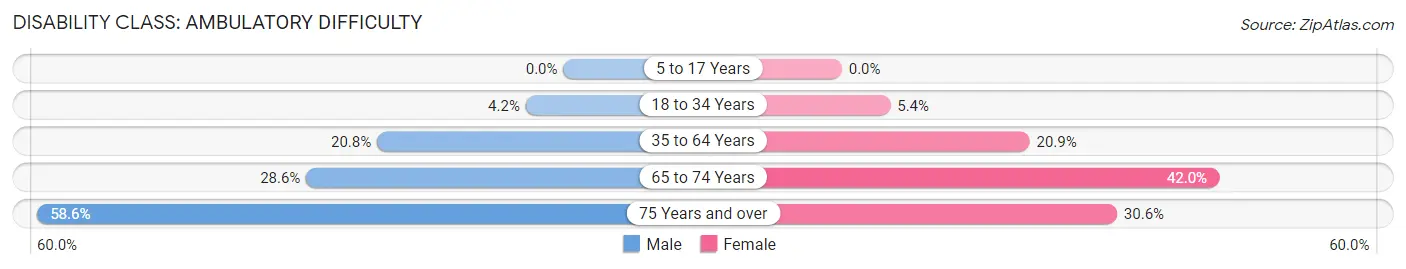
| Age Bracket | Male | Female |
| 5 to 17 Years | 0 (0.0%) | 0 (0.0%) |
| 18 to 34 Years | 23 (4.2%) | 51 (5.4%) |
| 35 to 64 Years | 244 (20.7%) | 295 (20.9%) |
| 65 to 74 Years | 124 (28.6%) | 181 (42.0%) |
| 75 Years and over | 116 (58.6%) | 72 (30.6%) |
Disability Class: Self-Care Difficulty
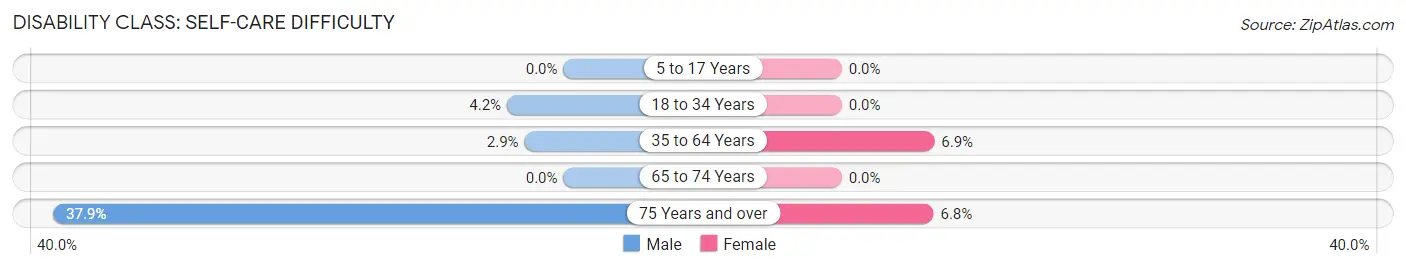
| Age Bracket | Male | Female |
| 5 to 17 Years | 0 (0.0%) | 0 (0.0%) |
| 18 to 34 Years | 23 (4.2%) | 0 (0.0%) |
| 35 to 64 Years | 34 (2.9%) | 97 (6.9%) |
| 65 to 74 Years | 0 (0.0%) | 0 (0.0%) |
| 75 Years and over | 75 (37.9%) | 16 (6.8%) |
Technology Access in Demopolis
Computing Device Access in Demopolis
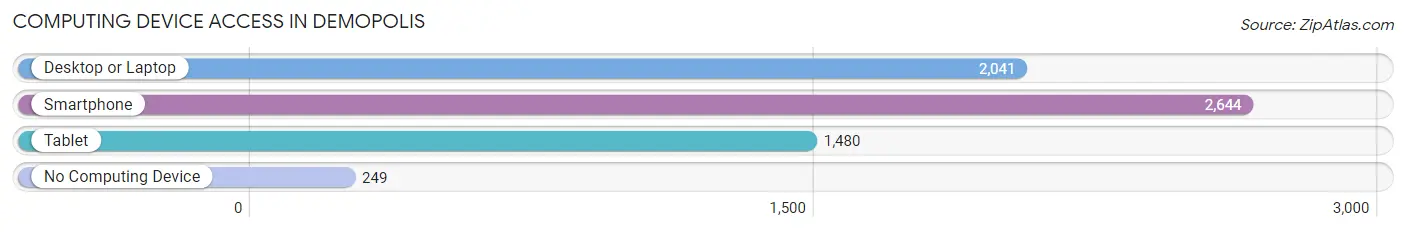
| Device Type | # Households | % Households |
| Desktop or Laptop | 2,041 | 66.6% |
| Smartphone | 2,644 | 86.3% |
| Tablet | 1,480 | 48.3% |
| No Computing Device | 249 | 8.1% |
| Total | 3,064 | 100.0% |
Internet Access in Demopolis
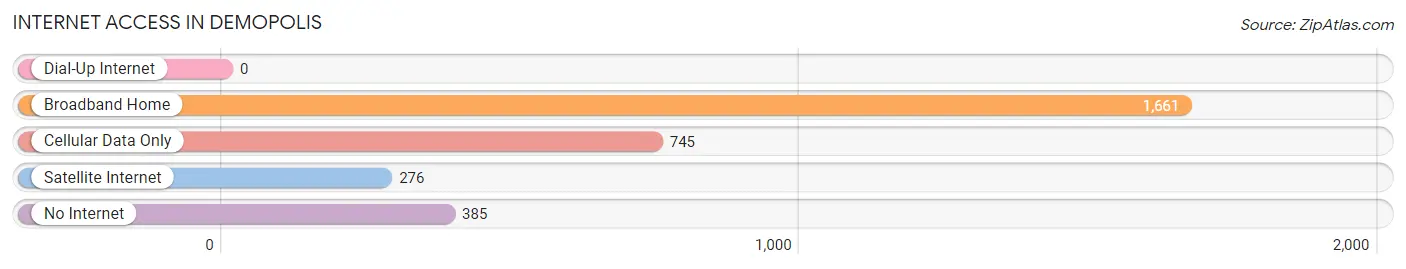
| Internet Type | # Households | % Households |
| Dial-Up Internet | 0 | 0.0% |
| Broadband Home | 1,661 | 54.2% |
| Cellular Data Only | 745 | 24.3% |
| Satellite Internet | 276 | 9.0% |
| No Internet | 385 | 12.6% |
| Total | 3,064 | 100.0% |
Demopolis Summary
Demopolis, Alabama is a city located in Marengo County, Alabama, United States. It is the county seat of Marengo County and is located along the Tombigbee River. The city is known for its historic downtown area, which is listed on the National Register of Historic Places. As of the 2010 census, the population of Demopolis was 7,483.
History
Demopolis was founded in 1817 by French exiles from the island of San Domingo (now Haiti). The exiles were led by General Marquis de Lafayette and were part of a group of French settlers who had been promised land in the area by the Spanish government. The settlers named the city after the Greek word for “people” and established a government based on the principles of the French Revolution.
The city quickly grew and became an important port on the Tombigbee River. It was a major center for cotton production and was home to several large plantations. During the Civil War, Demopolis was the site of several battles, including the Battle of Demopolis in 1864.
Geography
Demopolis is located at 32°30'25" North, 87°51'25" West (32.506944, -87.856944). It is situated along the Tombigbee River in the Black Belt region of Alabama. The city has a total area of 11.2 square miles, of which 10.9 square miles is land and 0.3 square miles is water.
Demopolis is located approximately 50 miles west of Tuscaloosa and 80 miles northwest of Mobile. It is part of the Tuscaloosa Metropolitan Statistical Area.
Economy
Demopolis is a major center for agriculture in the region. The city is home to several large farms and ranches, as well as several processing plants. The city is also home to several manufacturing companies, including a paper mill and a furniture factory.
Demopolis is also home to several retail stores, restaurants, and other businesses. The city is served by the Demopolis Municipal Airport, which offers general aviation services.
Demographics
As of the 2010 census, there were 7,483 people, 2,945 households, and 1,945 families residing in the city. The population density was 686.2 people per square mile. There were 3,310 housing units at an average density of 302.3 per square mile. The racial makeup of the city was 57.2% White, 40.2% African American, 0.3% Native American, 0.5% Asian, 0.1% Pacific Islander, 0.7% from other races, and 1.0% from two or more races. Hispanic or Latino of any race were 1.7% of the population.
There were 2,945 households, out of which 28.2% had children under the age of 18 living with them, 39.2% were married couples living together, 21.2% had a female householder with no husband present, and 35.2% were non-families. 30.3% of all households were made up of individuals, and 13.2% had someone living alone who was 65 years of age or older. The average household size was 2.45 and the average family size was 3.05.
In the city, the population was spread out, with 25.2% under the age of 18, 8.7% from 18 to 24, 25.3% from 25 to 44, 24.2% from 45 to 64, and 16.6% who were 65 years of age or older. The median age was 38 years. For every 100 females, there were 86.2 males. For every 100 females age 18 and over, there were 81.2 males.
The median income for a household in the city was $30,917, and the median income for a family was $37,917. Males had a median income of $31,917 versus $21,917 for females. The per capita income for the city was $17,917. About 17.2% of families and 20.2% of the population were below the poverty line, including 28.2% of those under age 18 and 16.2% of those age 65 or over.
Common Questions
What is Per Capita Income in Demopolis?
Per Capita income in Demopolis is $32,799.
What is the Median Family Income in Demopolis?
Median Family Income in Demopolis is $68,323.
What is the Median Household income in Demopolis?
Median Household Income in Demopolis is $51,364.
What is Income or Wage Gap in Demopolis?
Income or Wage Gap in Demopolis is 30.0%.
Women in Demopolis earn 70.0 cents for every dollar earned by a man.
What is Inequality or Gini Index in Demopolis?
Inequality or Gini Index in Demopolis is 0.54.
What is the Total Population of Demopolis?
Total Population of Demopolis is 7,080.
What is the Total Male Population of Demopolis?
Total Male Population of Demopolis is 2,971.
What is the Total Female Population of Demopolis?
Total Female Population of Demopolis is 4,109.
What is the Ratio of Males per 100 Females in Demopolis?
There are 72.30 Males per 100 Females in Demopolis.
What is the Ratio of Females per 100 Males in Demopolis?
There are 138.30 Females per 100 Males in Demopolis.
What is the Median Population Age in Demopolis?
Median Population Age in Demopolis is 39.8 Years.
What is the Average Family Size in Demopolis
Average Family Size in Demopolis is 3.1 People.
What is the Average Household Size in Demopolis
Average Household Size in Demopolis is 2.3 People.
How Large is the Labor Force in Demopolis?
There are 3,330 People in the Labor Forcein in Demopolis.
What is the Percentage of People in the Labor Force in Demopolis?
59.8% of People are in the Labor Force in Demopolis.