Daleville, AL Map & Demographics
Daleville Map
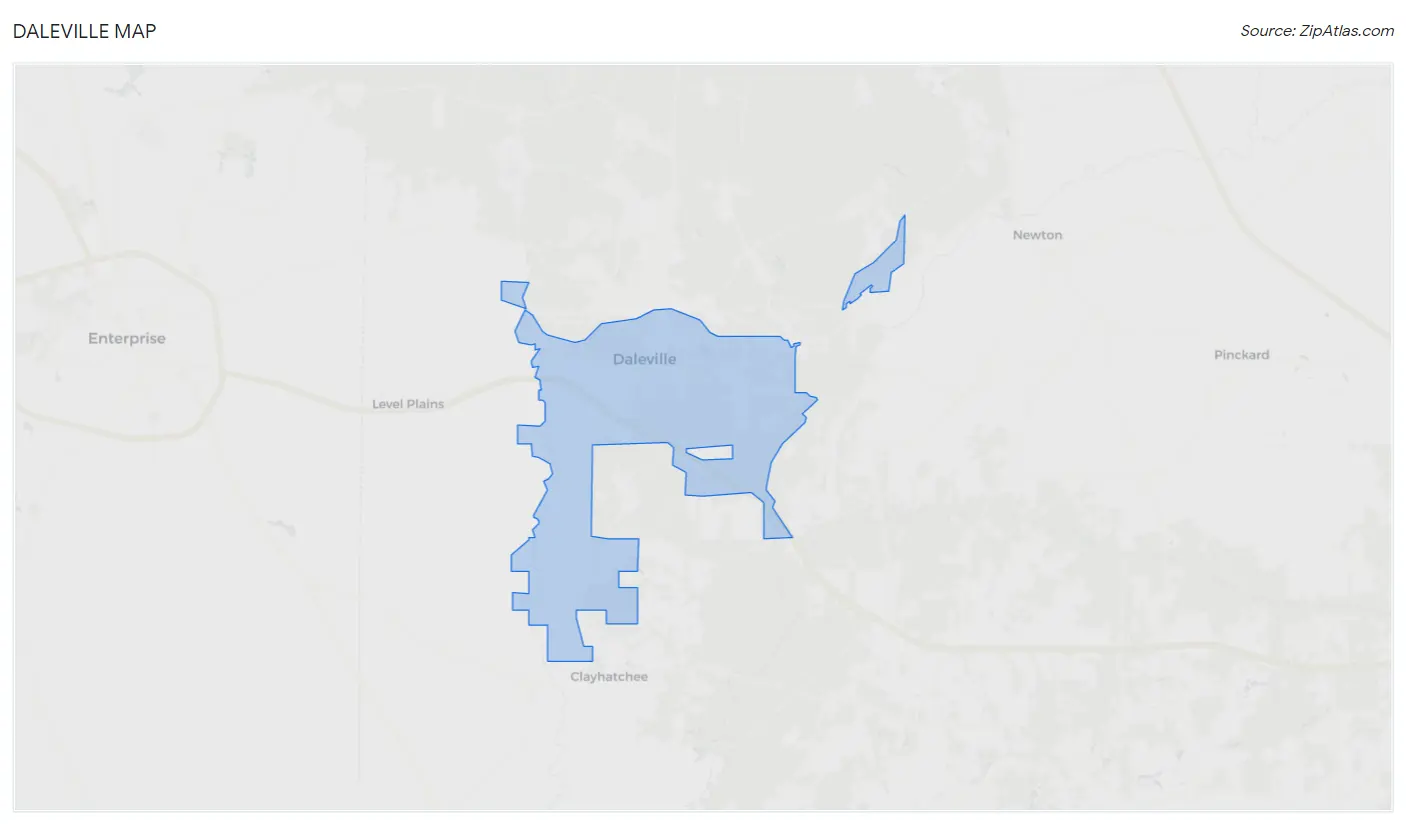
Daleville Overview
$29,185
PER CAPITA INCOME
$54,583
AVG FAMILY INCOME
$42,969
AVG HOUSEHOLD INCOME
31.5%
WAGE / INCOME GAP [ % ]
68.5¢/ $1
WAGE / INCOME GAP [ $ ]
0.44
INEQUALITY / GINI INDEX
4,901
TOTAL POPULATION
2,149
MALE POPULATION
2,752
FEMALE POPULATION
78.09
MALES / 100 FEMALES
128.06
FEMALES / 100 MALES
40.6
MEDIAN AGE
2.8
AVG FAMILY SIZE
2.1
AVG HOUSEHOLD SIZE
2,533
LABOR FORCE [ PEOPLE ]
60.2%
PERCENT IN LABOR FORCE
6.8%
UNEMPLOYMENT RATE
Daleville Zip Codes
Daleville Area Codes
Income in Daleville
Income Overview in Daleville
Per Capita Income in Daleville is $29,185, while median incomes of families and households are $54,583 and $42,969 respectively.
| Characteristic | Number | Measure |
| Per Capita Income | 4,901 | $29,185 |
| Median Family Income | 1,276 | $54,583 |
| Mean Family Income | 1,276 | $68,464 |
| Median Household Income | 2,277 | $42,969 |
| Mean Household Income | 2,277 | $59,420 |
| Income Deficit | 1,276 | $0 |
| Wage / Income Gap (%) | 4,901 | 31.50% |
| Wage / Income Gap ($) | 4,901 | 68.50¢ per $1 |
| Gini / Inequality Index | 4,901 | 0.44 |
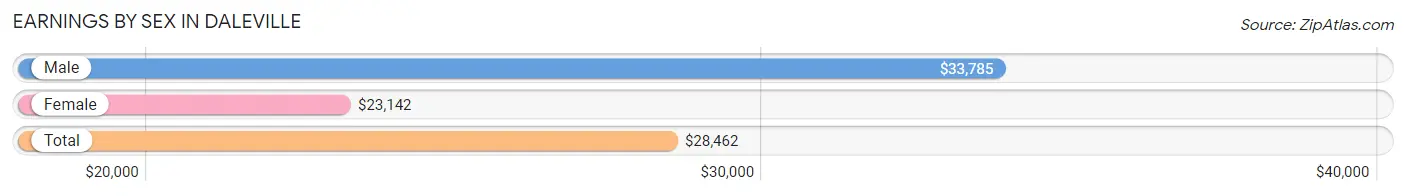
Earnings by Sex in Daleville
Average Earnings in Daleville are $28,462, $33,785 for men and $23,142 for women, a difference of 31.5%.
| Sex | Number | Average Earnings |
| Male | 1,119 (44.2%) | $33,785 |
| Female | 1,413 (55.8%) | $23,142 |
| Total | 2,532 (100.0%) | $28,462 |
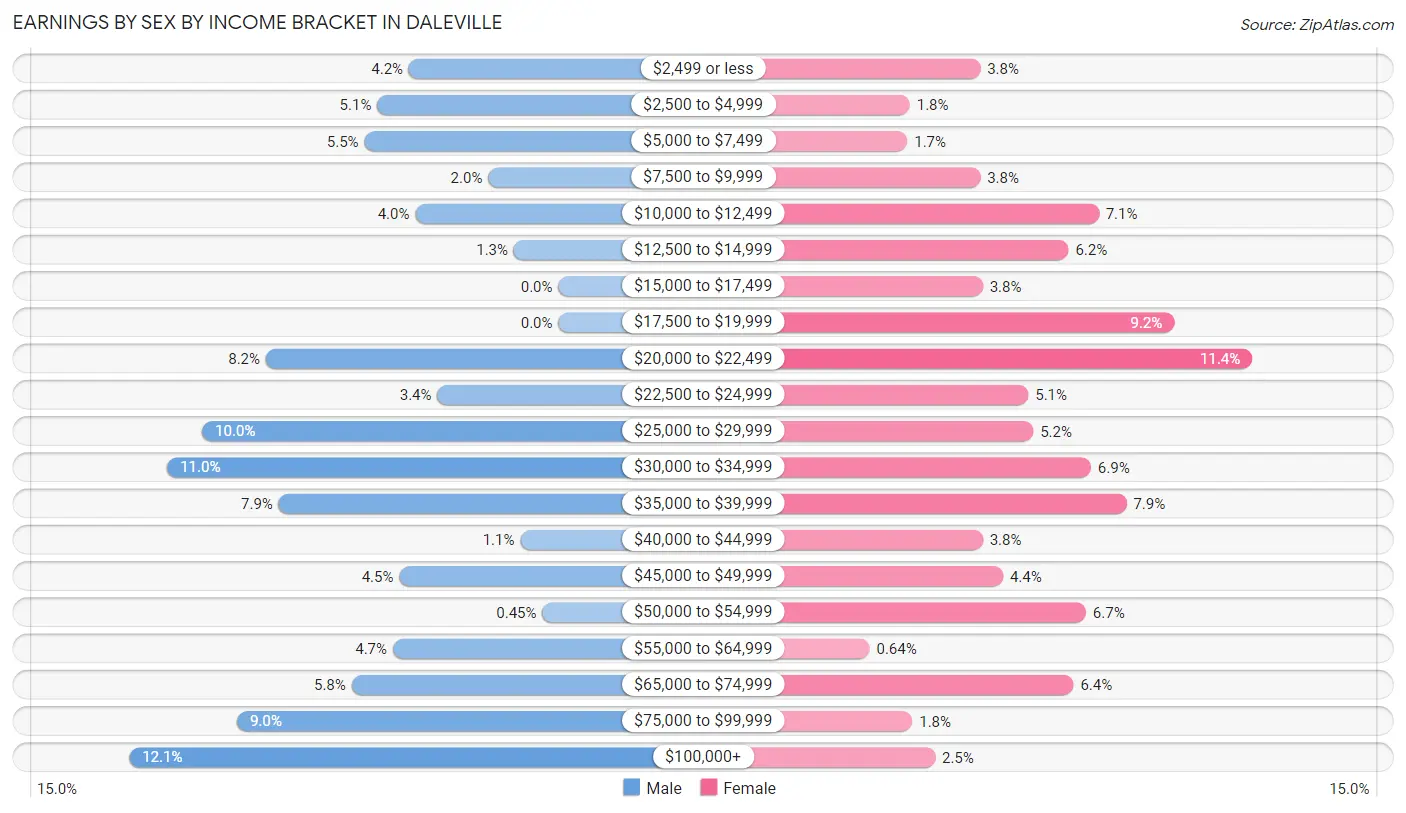
Earnings by Sex by Income Bracket in Daleville
The most common earnings brackets in Daleville are $100,000+ for men (135 | 12.1%) and $20,000 to $22,499 for women (161 | 11.4%).
| Income | Male | Female |
| $2,499 or less | 47 (4.2%) | 53 (3.7%) |
| $2,500 to $4,999 | 57 (5.1%) | 25 (1.8%) |
| $5,000 to $7,499 | 61 (5.4%) | 24 (1.7%) |
| $7,500 to $9,999 | 22 (2.0%) | 53 (3.7%) |
| $10,000 to $12,499 | 45 (4.0%) | 100 (7.1%) |
| $12,500 to $14,999 | 14 (1.3%) | 88 (6.2%) |
| $15,000 to $17,499 | 0 (0.0%) | 54 (3.8%) |
| $17,500 to $19,999 | 0 (0.0%) | 130 (9.2%) |
| $20,000 to $22,499 | 92 (8.2%) | 161 (11.4%) |
| $22,500 to $24,999 | 38 (3.4%) | 72 (5.1%) |
| $25,000 to $29,999 | 112 (10.0%) | 74 (5.2%) |
| $30,000 to $34,999 | 123 (11.0%) | 97 (6.9%) |
| $35,000 to $39,999 | 88 (7.9%) | 111 (7.9%) |
| $40,000 to $44,999 | 12 (1.1%) | 54 (3.8%) |
| $45,000 to $49,999 | 50 (4.5%) | 62 (4.4%) |
| $50,000 to $54,999 | 5 (0.4%) | 95 (6.7%) |
| $55,000 to $64,999 | 52 (4.6%) | 9 (0.6%) |
| $65,000 to $74,999 | 65 (5.8%) | 90 (6.4%) |
| $75,000 to $99,999 | 101 (9.0%) | 26 (1.8%) |
| $100,000+ | 135 (12.1%) | 35 (2.5%) |
| Total | 1,119 (100.0%) | 1,413 (100.0%) |
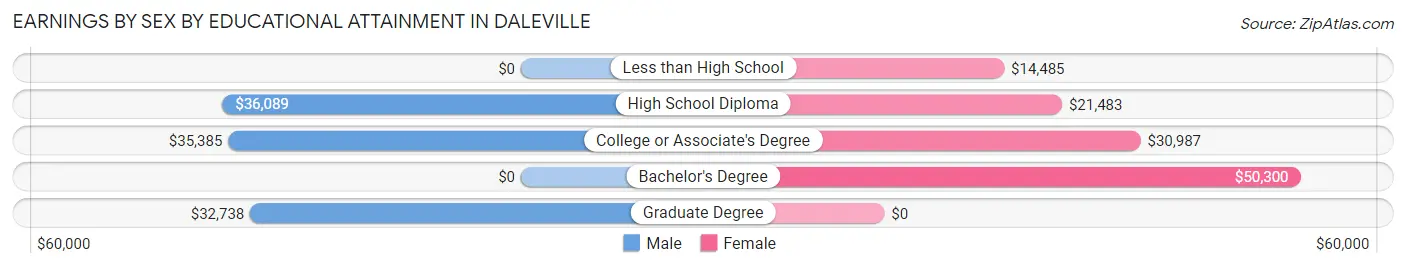
Earnings by Sex by Educational Attainment in Daleville
Average earnings in Daleville are $34,953 for men and $28,000 for women, a difference of 19.9%. Men with an educational attainment of high school diploma enjoy the highest average annual earnings of $36,089, while those with graduate degree education earn the least with $32,738. Women with an educational attainment of bachelor's degree earn the most with the average annual earnings of $50,300, while those with less than high school education have the smallest earnings of $14,485.
| Educational Attainment | Male Income | Female Income |
| Less than High School | - | - |
| High School Diploma | $36,089 | $21,483 |
| College or Associate's Degree | $35,385 | $30,987 |
| Bachelor's Degree | - | - |
| Graduate Degree | $32,738 | $0 |
| Total | $34,953 | $28,000 |
Family Income in Daleville
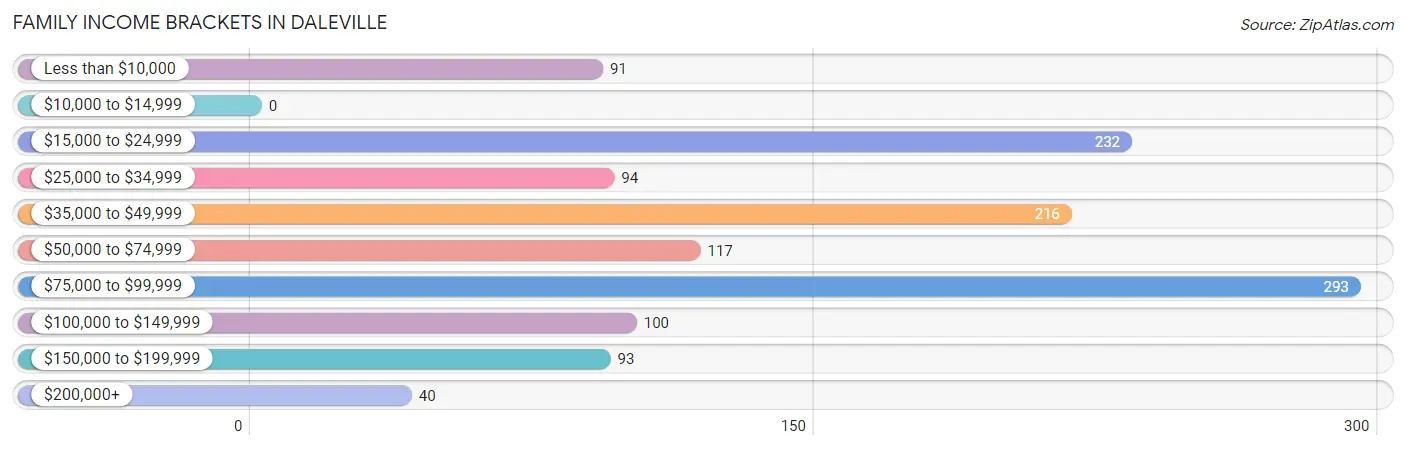
Family Income Brackets in Daleville
According to the Daleville family income data, there are 293 families falling into the $75,000 to $99,999 income range, which is the most common income bracket and makes up 23.0% of all families.
| Income Bracket | # Families | % Families |
| Less than $10,000 | 91 | 7.1% |
| $10,000 to $14,999 | 0 | 0.0% |
| $15,000 to $24,999 | 232 | 18.2% |
| $25,000 to $34,999 | 94 | 7.4% |
| $35,000 to $49,999 | 216 | 16.9% |
| $50,000 to $74,999 | 117 | 9.2% |
| $75,000 to $99,999 | 293 | 23.0% |
| $100,000 to $149,999 | 100 | 7.8% |
| $150,000 to $199,999 | 93 | 7.3% |
| $200,000+ | 40 | 3.1% |
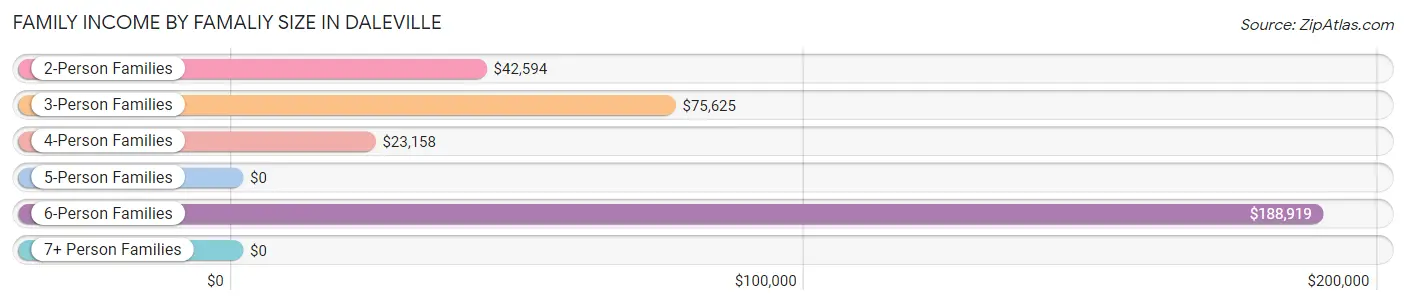
Family Income by Famaliy Size in Daleville
6-person families (56 | 4.4%) account for the highest median family income in Daleville with $188,919 per family, while 6-person families (56 | 4.4%) have the highest median income of $31,486 per family member.
| Income Bracket | # Families | Median Income |
| 2-Person Families | 867 (67.9%) | $42,594 |
| 3-Person Families | 241 (18.9%) | $75,625 |
| 4-Person Families | 44 (3.5%) | $23,158 |
| 5-Person Families | 60 (4.7%) | $0 |
| 6-Person Families | 56 (4.4%) | $188,919 |
| 7+ Person Families | 8 (0.6%) | $0 |
| Total | 1,276 (100.0%) | $54,583 |
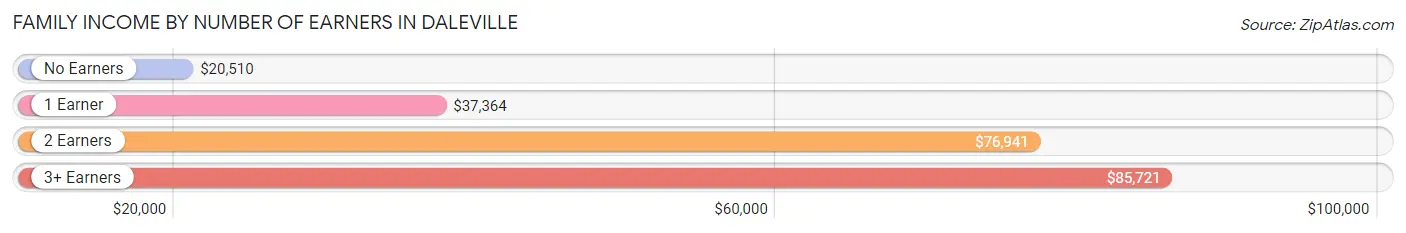
Family Income by Number of Earners in Daleville
The median family income in Daleville is $54,583, with families comprising 3+ earners (125) having the highest median family income of $85,721, while families with no earners (238) have the lowest median family income of $20,510, accounting for 9.8% and 18.6% of families, respectively.
| Number of Earners | # Families | Median Income |
| No Earners | 238 (18.6%) | $20,510 |
| 1 Earner | 566 (44.4%) | $37,364 |
| 2 Earners | 347 (27.2%) | $76,941 |
| 3+ Earners | 125 (9.8%) | $85,721 |
| Total | 1,276 (100.0%) | $54,583 |
Household Income in Daleville
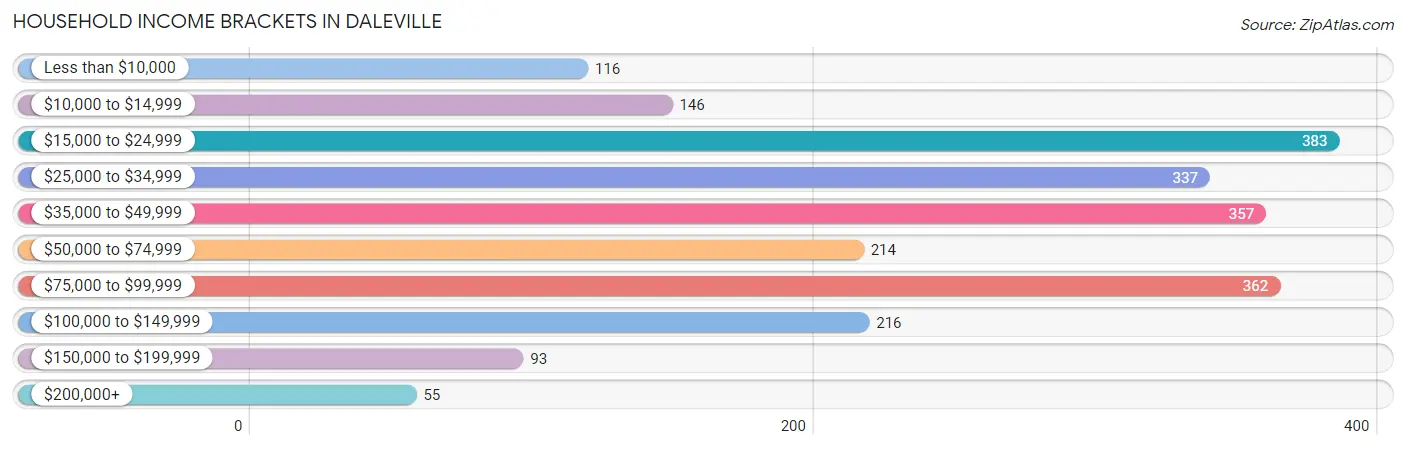
Household Income Brackets in Daleville
With 383 households falling in the category, the $15,000 to $24,999 income range is the most frequent in Daleville, accounting for 16.8% of all households. In contrast, only 55 households (2.4%) fall into the $200,000+ income bracket, making it the least populous group.
| Income Bracket | # Households | % Households |
| Less than $10,000 | 116 | 5.1% |
| $10,000 to $14,999 | 146 | 6.4% |
| $15,000 to $24,999 | 383 | 16.8% |
| $25,000 to $34,999 | 337 | 14.8% |
| $35,000 to $49,999 | 357 | 15.7% |
| $50,000 to $74,999 | 214 | 9.4% |
| $75,000 to $99,999 | 362 | 15.9% |
| $100,000 to $149,999 | 216 | 9.5% |
| $150,000 to $199,999 | 93 | 4.1% |
| $200,000+ | 55 | 2.4% |
Household Income by Householder Age in Daleville
The median household income in Daleville is $42,969, with the highest median household income of $47,487 found in the 65+ years age bracket for the primary householder. A total of 529 households (23.2%) fall into this category. Meanwhile, the 45 to 64 years age bracket for the primary householder has the lowest median household income of $34,734, with 1,056 households (46.4%) in this group.
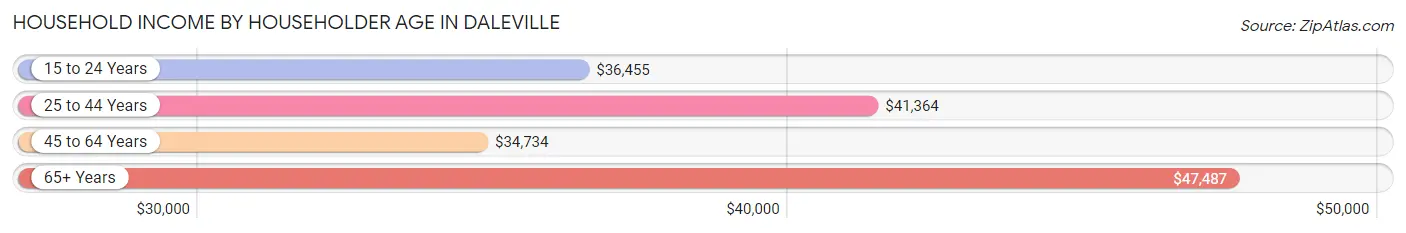
| Income Bracket | # Households | Median Income |
| 15 to 24 Years | 102 (4.5%) | $36,455 |
| 25 to 44 Years | 590 (25.9%) | $41,364 |
| 45 to 64 Years | 1,056 (46.4%) | $34,734 |
| 65+ Years | 529 (23.2%) | $47,487 |
| Total | 2,277 (100.0%) | $42,969 |
Poverty in Daleville
Income Below Poverty by Sex and Age in Daleville
With 15.7% poverty level for males and 20.3% for females among the residents of Daleville, 16 and 17 year old males and 5 year old females are the most vulnerable to poverty, with 17 males (48.6%) and 14 females (100.0%) in their respective age groups living below the poverty level.
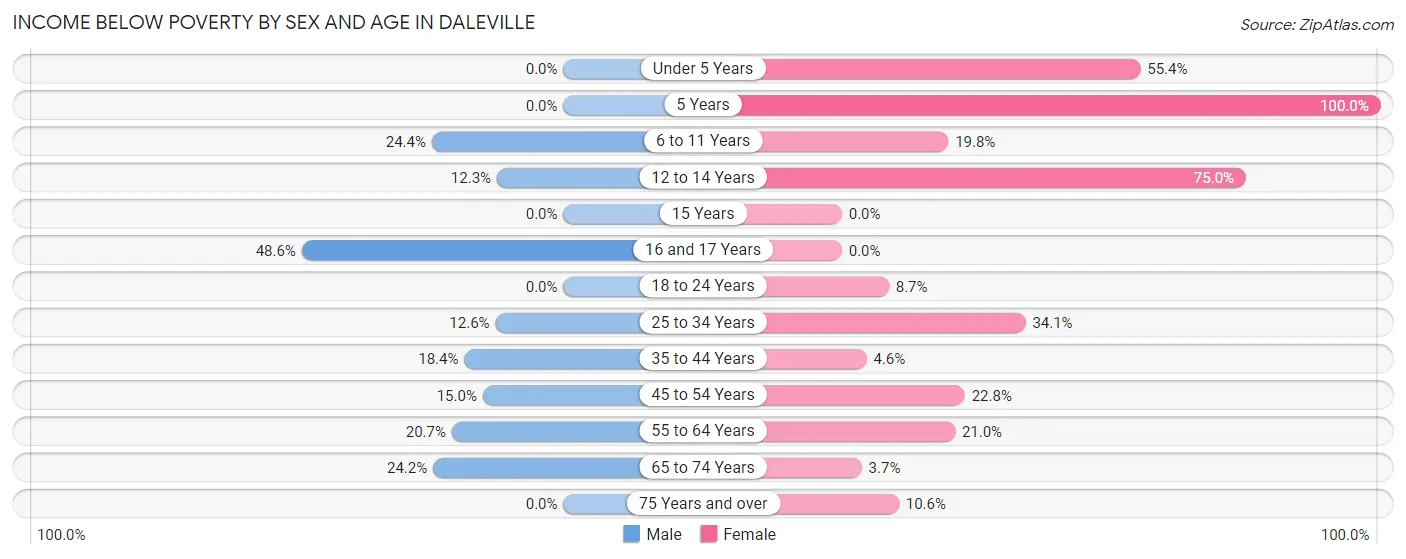
| Age Bracket | Male | Female |
| Under 5 Years | 0 (0.0%) | 128 (55.4%) |
| 5 Years | 0 (0.0%) | 14 (100.0%) |
| 6 to 11 Years | 42 (24.4%) | 16 (19.8%) |
| 12 to 14 Years | 9 (12.3%) | 15 (75.0%) |
| 15 Years | 0 (0.0%) | 0 (0.0%) |
| 16 and 17 Years | 17 (48.6%) | 0 (0.0%) |
| 18 to 24 Years | 0 (0.0%) | 19 (8.7%) |
| 25 to 34 Years | 57 (12.6%) | 136 (34.1%) |
| 35 to 44 Years | 48 (18.4%) | 14 (4.6%) |
| 45 to 54 Years | 35 (15.0%) | 81 (22.8%) |
| 55 to 64 Years | 58 (20.7%) | 105 (21.0%) |
| 65 to 74 Years | 67 (24.2%) | 10 (3.7%) |
| 75 Years and over | 0 (0.0%) | 20 (10.6%) |
| Total | 333 (15.7%) | 558 (20.3%) |
Income Above Poverty by Sex and Age in Daleville
According to the poverty statistics in Daleville, males aged under 5 years and females aged 15 years are the age groups that are most secure financially, with 100.0% of males and 100.0% of females in these age groups living above the poverty line.
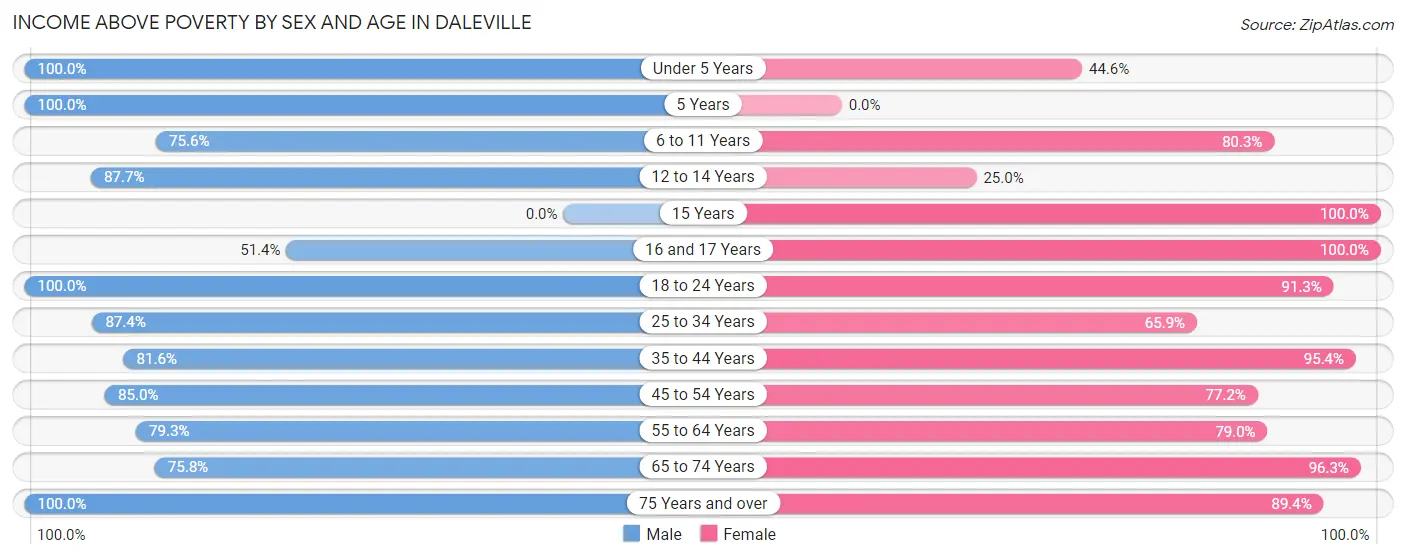
| Age Bracket | Male | Female |
| Under 5 Years | 34 (100.0%) | 103 (44.6%) |
| 5 Years | 15 (100.0%) | 0 (0.0%) |
| 6 to 11 Years | 130 (75.6%) | 65 (80.2%) |
| 12 to 14 Years | 64 (87.7%) | 5 (25.0%) |
| 15 Years | 0 (0.0%) | 53 (100.0%) |
| 16 and 17 Years | 18 (51.4%) | 116 (100.0%) |
| 18 to 24 Years | 221 (100.0%) | 199 (91.3%) |
| 25 to 34 Years | 395 (87.4%) | 263 (65.9%) |
| 35 to 44 Years | 213 (81.6%) | 291 (95.4%) |
| 45 to 54 Years | 199 (85.0%) | 274 (77.2%) |
| 55 to 64 Years | 222 (79.3%) | 395 (79.0%) |
| 65 to 74 Years | 210 (75.8%) | 261 (96.3%) |
| 75 Years and over | 69 (100.0%) | 169 (89.4%) |
| Total | 1,790 (84.3%) | 2,194 (79.7%) |
Income Below Poverty Among Married-Couple Families in Daleville
The poverty statistics for married-couple families in Daleville show that 9.2% or 54 of the total 586 families live below the poverty line. Families with 1 or 2 children have the highest poverty rate of 13.3%, comprising of 17 families. On the other hand, families with 3 or 4 children have the lowest poverty rate of 0.0%, which includes 0 families.
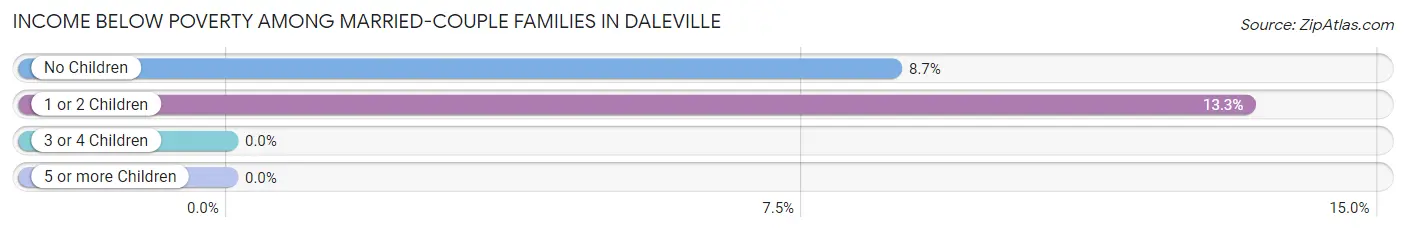
| Children | Above Poverty | Below Poverty |
| No Children | 390 (91.3%) | 37 (8.7%) |
| 1 or 2 Children | 111 (86.7%) | 17 (13.3%) |
| 3 or 4 Children | 31 (100.0%) | 0 (0.0%) |
| 5 or more Children | 0 (0.0%) | 0 (0.0%) |
| Total | 532 (90.8%) | 54 (9.2%) |
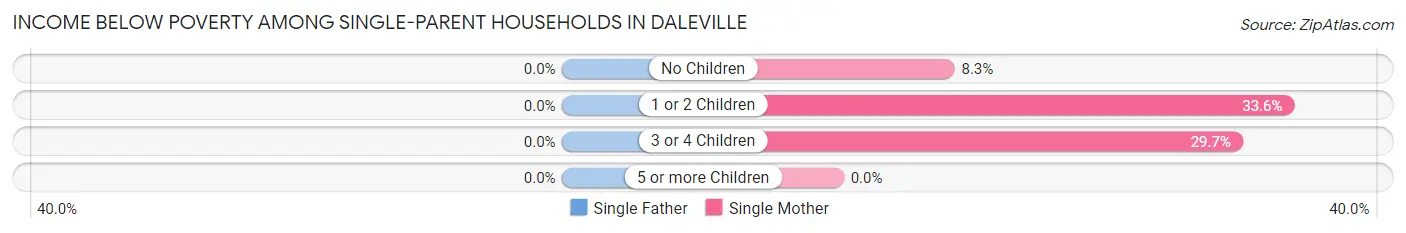
Income Below Poverty Among Single-Parent Households in Daleville
| Children | Single Father | Single Mother |
| No Children | 0 (0.0%) | 29 (8.3%) |
| 1 or 2 Children | 0 (0.0%) | 94 (33.6%) |
| 3 or 4 Children | 0 (0.0%) | 11 (29.7%) |
| 5 or more Children | 0 (0.0%) | 0 (0.0%) |
| Total | 0 (0.0%) | 134 (20.1%) |
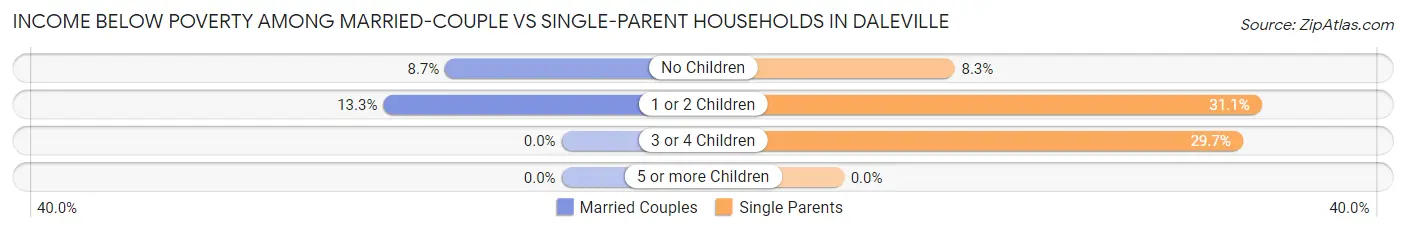
Income Below Poverty Among Married-Couple vs Single-Parent Households in Daleville
The poverty data for Daleville shows that 54 of the married-couple family households (9.2%) and 134 of the single-parent households (19.4%) are living below the poverty level. Within the married-couple family households, those with 1 or 2 children have the highest poverty rate, with 17 households (13.3%) falling below the poverty line. Among the single-parent households, those with 1 or 2 children have the highest poverty rate, with 94 household (31.1%) living below poverty.
| Children | Married-Couple Families | Single-Parent Households |
| No Children | 37 (8.7%) | 29 (8.3%) |
| 1 or 2 Children | 17 (13.3%) | 94 (31.1%) |
| 3 or 4 Children | 0 (0.0%) | 11 (29.7%) |
| 5 or more Children | 0 (0.0%) | 0 (0.0%) |
| Total | 54 (9.2%) | 134 (19.4%) |
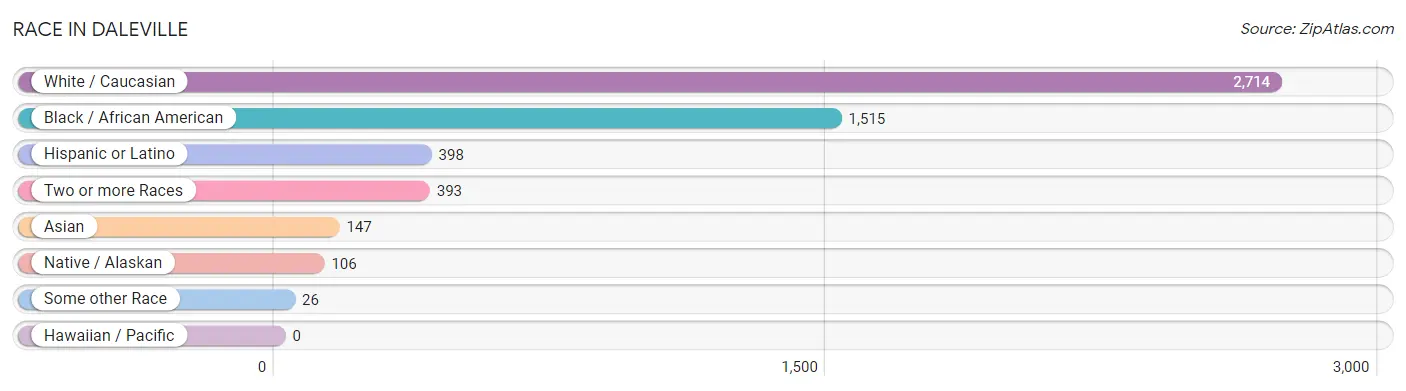
Race in Daleville
The most populous races in Daleville are White / Caucasian (2,714 | 55.4%), Black / African American (1,515 | 30.9%), and Hispanic or Latino (398 | 8.1%).
| Race | # Population | % Population |
| Asian | 147 | 3.0% |
| Black / African American | 1,515 | 30.9% |
| Hawaiian / Pacific | 0 | 0.0% |
| Hispanic or Latino | 398 | 8.1% |
| Native / Alaskan | 106 | 2.2% |
| White / Caucasian | 2,714 | 55.4% |
| Two or more Races | 393 | 8.0% |
| Some other Race | 26 | 0.5% |
| Total | 4,901 | 100.0% |
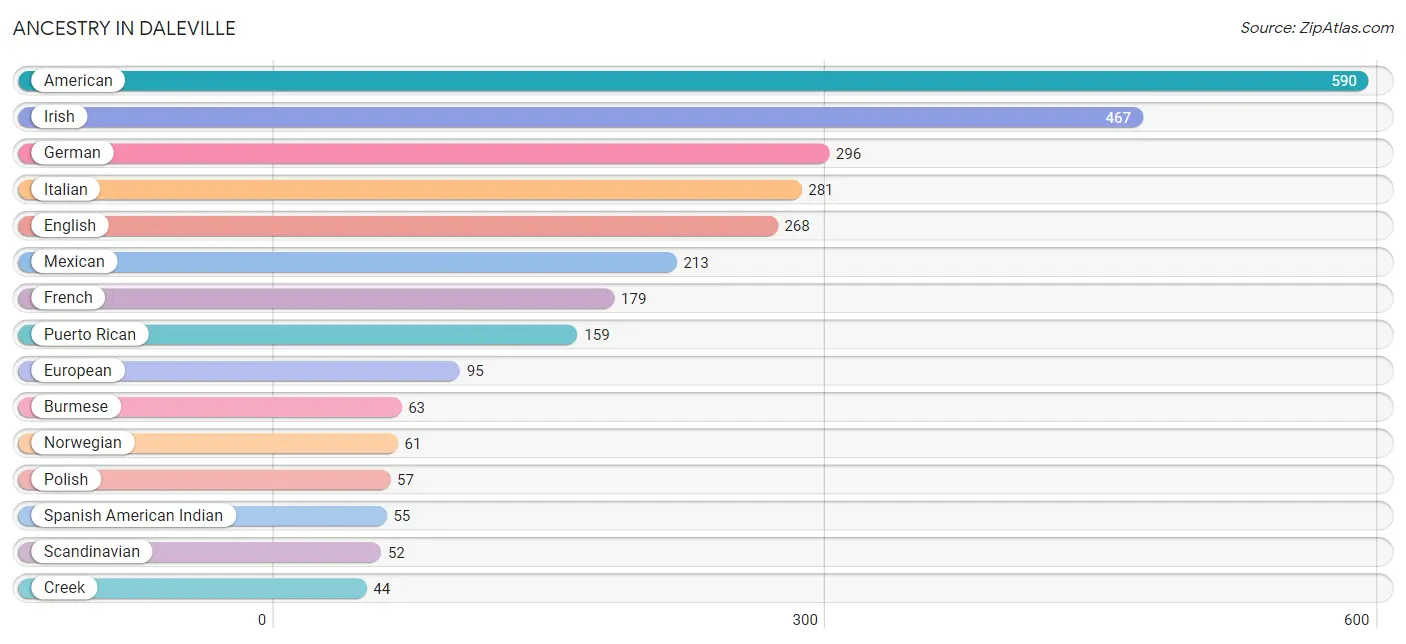
Ancestry in Daleville
The most populous ancestries reported in Daleville are American (590 | 12.0%), Irish (467 | 9.5%), German (296 | 6.0%), Italian (281 | 5.7%), and English (268 | 5.5%), together accounting for 38.8% of all Daleville residents.
| Ancestry | # Population | % Population |
| African | 21 | 0.4% |
| American | 590 | 12.0% |
| Bhutanese | 23 | 0.5% |
| Burmese | 63 | 1.3% |
| Central American | 11 | 0.2% |
| Cherokee | 32 | 0.6% |
| Creek | 44 | 0.9% |
| Czech | 34 | 0.7% |
| Dutch | 14 | 0.3% |
| English | 268 | 5.5% |
| European | 95 | 1.9% |
| Filipino | 6 | 0.1% |
| French | 179 | 3.6% |
| German | 296 | 6.0% |
| Hungarian | 18 | 0.4% |
| Irish | 467 | 9.5% |
| Iroquois | 10 | 0.2% |
| Italian | 281 | 5.7% |
| Korean | 20 | 0.4% |
| Mexican | 213 | 4.3% |
| Native Hawaiian | 8 | 0.2% |
| Norwegian | 61 | 1.2% |
| Pakistani | 34 | 0.7% |
| Panamanian | 11 | 0.2% |
| Polish | 57 | 1.2% |
| Puerto Rican | 159 | 3.2% |
| Scandinavian | 52 | 1.1% |
| Scotch-Irish | 38 | 0.8% |
| Scottish | 35 | 0.7% |
| Spanish | 7 | 0.1% |
| Spanish American Indian | 55 | 1.1% |
| Sri Lankan | 13 | 0.3% |
| Subsaharan African | 21 | 0.4% |
| Swiss | 13 | 0.3% |
| Ute | 10 | 0.2% |
| Welsh | 18 | 0.4% | View All 36 Rows |
Immigrants in Daleville
The most numerous immigrant groups reported in Daleville came from Europe (134 | 2.7%), Asia (130 | 2.6%), Italy (72 | 1.5%), Southern Europe (72 | 1.5%), and South Eastern Asia (67 | 1.4%), together accounting for 9.7% of all Daleville residents.
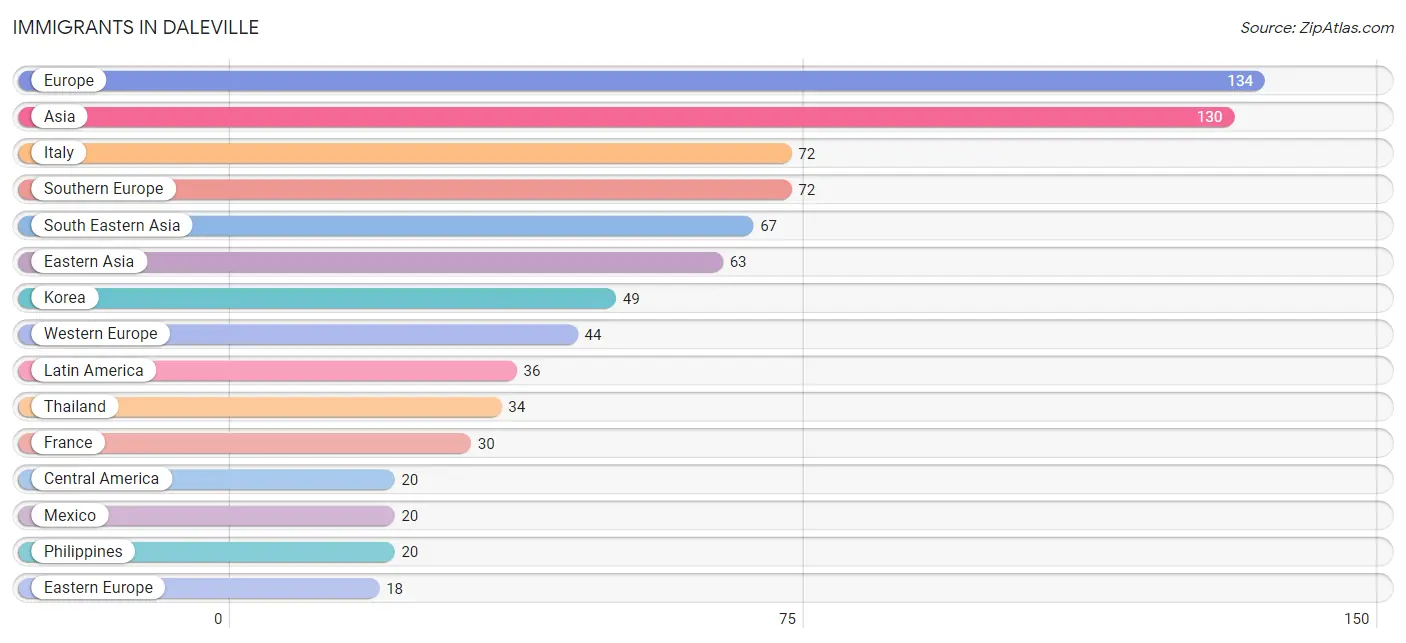
| Immigration Origin | # Population | % Population |
| Asia | 130 | 2.6% |
| Barbados | 16 | 0.3% |
| Belgium | 14 | 0.3% |
| Caribbean | 16 | 0.3% |
| Central America | 20 | 0.4% |
| Eastern Asia | 63 | 1.3% |
| Eastern Europe | 18 | 0.4% |
| Europe | 134 | 2.7% |
| France | 30 | 0.6% |
| Hungary | 18 | 0.4% |
| Italy | 72 | 1.5% |
| Japan | 14 | 0.3% |
| Korea | 49 | 1.0% |
| Latin America | 36 | 0.7% |
| Mexico | 20 | 0.4% |
| Philippines | 20 | 0.4% |
| South Eastern Asia | 67 | 1.4% |
| Southern Europe | 72 | 1.5% |
| Thailand | 34 | 0.7% |
| Vietnam | 13 | 0.3% |
| Western Europe | 44 | 0.9% | View All 21 Rows |
Sex and Age in Daleville
Sex and Age in Daleville
The most populous age groups in Daleville are 30 to 34 Years (304 | 14.1%) for men and 60 to 64 Years (350 | 12.7%) for women.
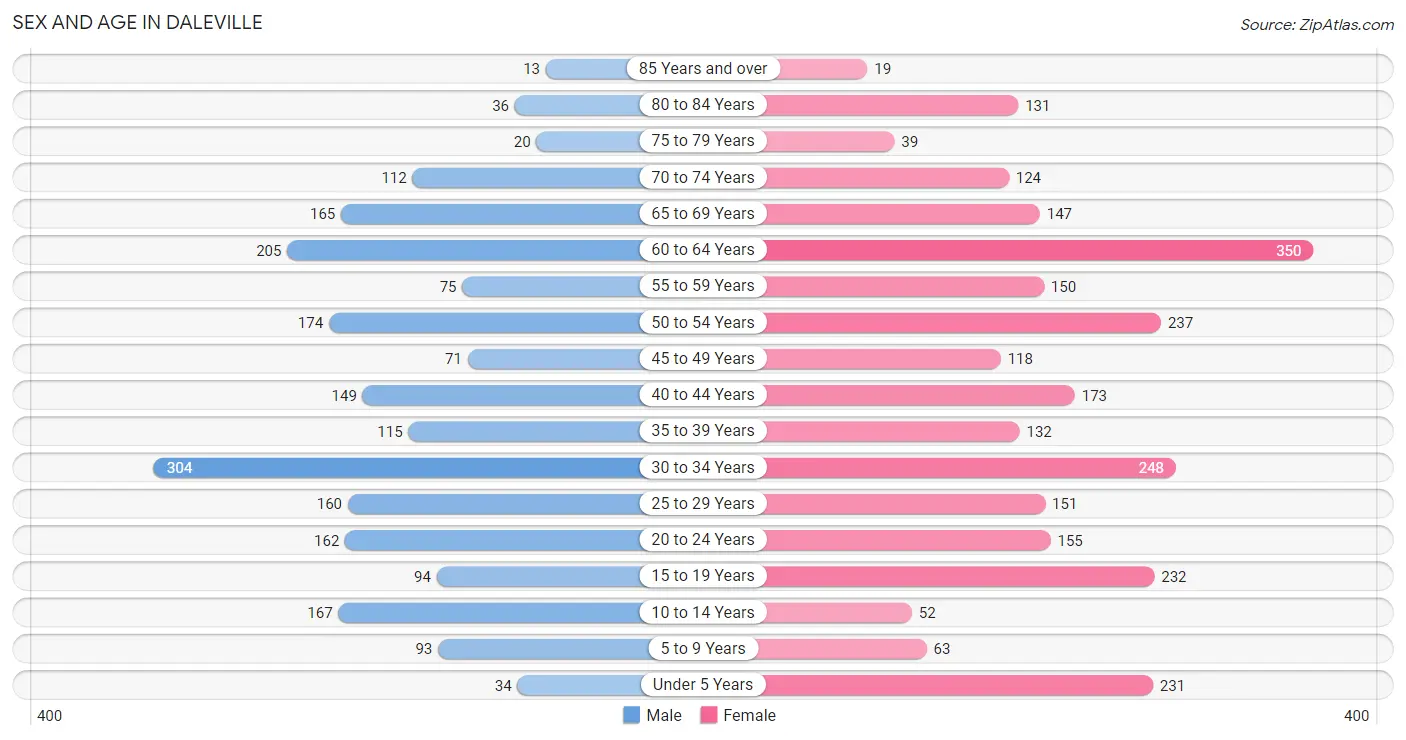
| Age Bracket | Male | Female |
| Under 5 Years | 34 (1.6%) | 231 (8.4%) |
| 5 to 9 Years | 93 (4.3%) | 63 (2.3%) |
| 10 to 14 Years | 167 (7.8%) | 52 (1.9%) |
| 15 to 19 Years | 94 (4.4%) | 232 (8.4%) |
| 20 to 24 Years | 162 (7.5%) | 155 (5.6%) |
| 25 to 29 Years | 160 (7.4%) | 151 (5.5%) |
| 30 to 34 Years | 304 (14.1%) | 248 (9.0%) |
| 35 to 39 Years | 115 (5.3%) | 132 (4.8%) |
| 40 to 44 Years | 149 (6.9%) | 173 (6.3%) |
| 45 to 49 Years | 71 (3.3%) | 118 (4.3%) |
| 50 to 54 Years | 174 (8.1%) | 237 (8.6%) |
| 55 to 59 Years | 75 (3.5%) | 150 (5.4%) |
| 60 to 64 Years | 205 (9.5%) | 350 (12.7%) |
| 65 to 69 Years | 165 (7.7%) | 147 (5.3%) |
| 70 to 74 Years | 112 (5.2%) | 124 (4.5%) |
| 75 to 79 Years | 20 (0.9%) | 39 (1.4%) |
| 80 to 84 Years | 36 (1.7%) | 131 (4.8%) |
| 85 Years and over | 13 (0.6%) | 19 (0.7%) |
| Total | 2,149 (100.0%) | 2,752 (100.0%) |
Families and Households in Daleville
Median Family Size in Daleville
The median family size in Daleville is 2.81 persons per family, with married-couple families (586 | 45.9%) accounting for the largest median family size of 3 persons per family. On the other hand, single male/father families (22 | 1.7%) represent the smallest median family size with 2.09 persons per family.
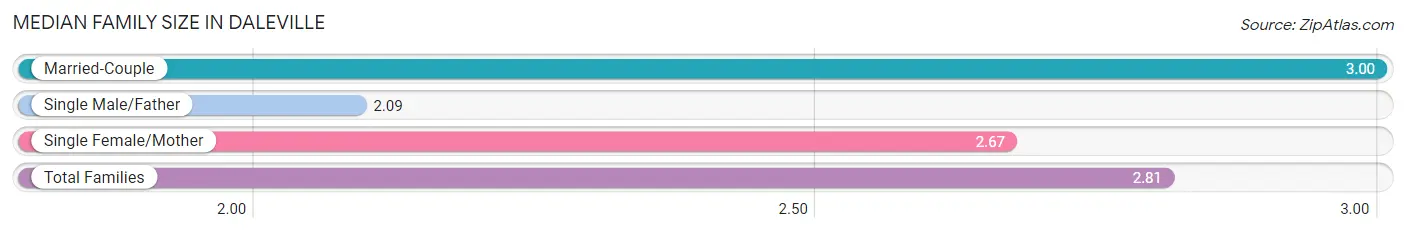
| Family Type | # Families | Family Size |
| Married-Couple | 586 (45.9%) | 3.00 |
| Single Male/Father | 22 (1.7%) | 2.09 |
| Single Female/Mother | 668 (52.3%) | 2.67 |
| Total Families | 1,276 (100.0%) | 2.81 |
Median Household Size in Daleville
The median household size in Daleville is 2.14 persons per household, with married-couple households (586 | 25.7%) accounting for the largest median household size of 3 persons per household. non-family households (1,001 | 44.0%) represent the smallest median household size with 1.13 persons per household.
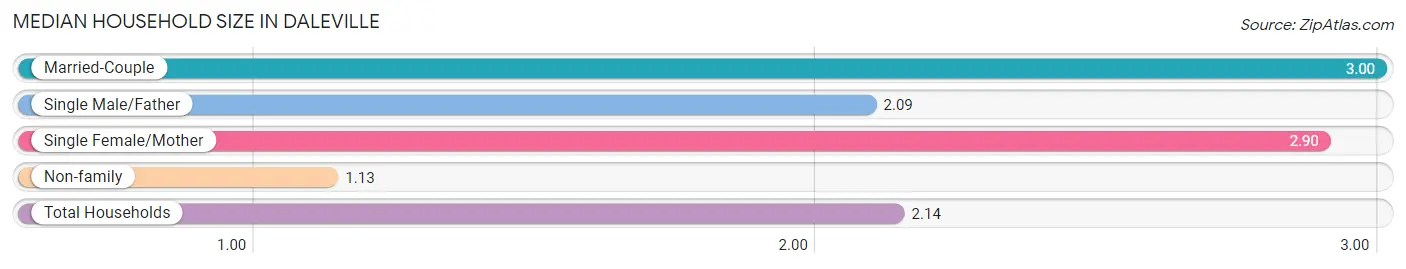
| Household Type | # Households | Household Size |
| Married-Couple | 586 (25.7%) | 3.00 |
| Single Male/Father | 22 (1.0%) | 2.09 |
| Single Female/Mother | 668 (29.3%) | 2.90 |
| Non-family | 1,001 (44.0%) | 1.13 |
| Total Households | 2,277 (100.0%) | 2.14 |
Household Size by Marriage Status in Daleville
Out of a total of 2,277 households in Daleville, 1,276 (56.0%) are family households, while 1,001 (44.0%) are nonfamily households. The most numerous type of family households are 2-person households, comprising 843, and the most common type of nonfamily households are 1-person households, comprising 889.
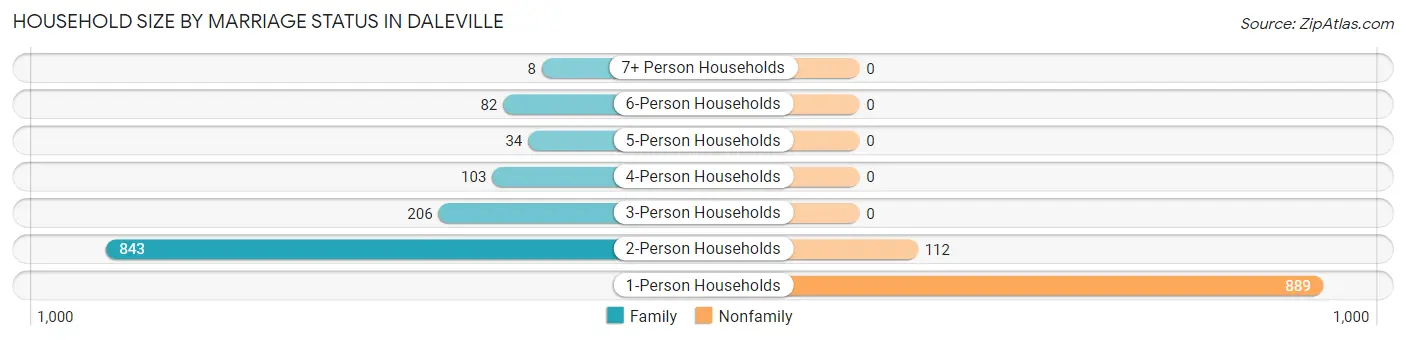
| Household Size | Family Households | Nonfamily Households |
| 1-Person Households | - | 889 (39.0%) |
| 2-Person Households | 843 (37.0%) | 112 (4.9%) |
| 3-Person Households | 206 (9.0%) | 0 (0.0%) |
| 4-Person Households | 103 (4.5%) | 0 (0.0%) |
| 5-Person Households | 34 (1.5%) | 0 (0.0%) |
| 6-Person Households | 82 (3.6%) | 0 (0.0%) |
| 7+ Person Households | 8 (0.4%) | 0 (0.0%) |
| Total | 1,276 (56.0%) | 1,001 (44.0%) |
Female Fertility in Daleville
Fertility by Age in Daleville
Average fertility rate in Daleville is 11.0 births per 1,000 women. Women in the age bracket of 20 to 34 years have the highest fertility rate with 23.0 births per 1,000 women. Women in the age bracket of 20 to 34 years acount for 100.0% of all women with births.
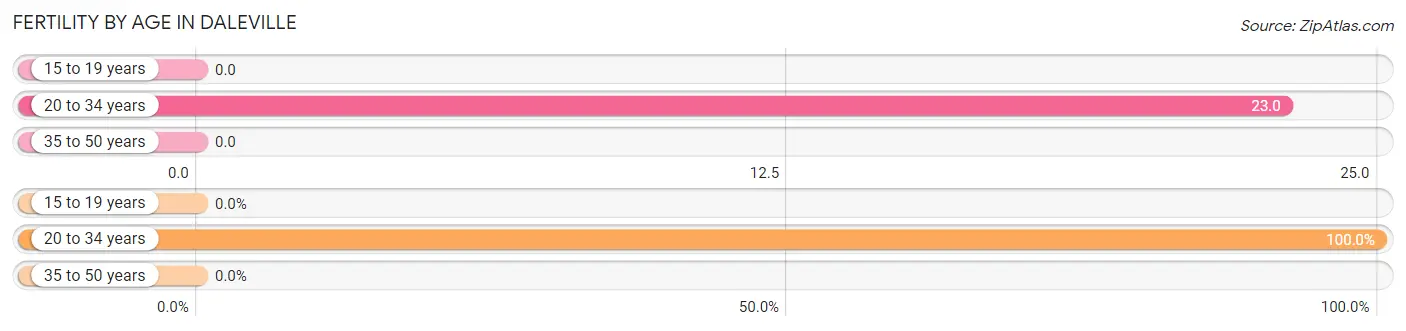
| Age Bracket | Women with Births | Births / 1,000 Women |
| 15 to 19 years | 0 (0.0%) | 0.0 |
| 20 to 34 years | 13 (100.0%) | 23.0 |
| 35 to 50 years | 0 (0.0%) | 0.0 |
| Total | 13 (100.0%) | 11.0 |
Fertility by Age by Marriage Status in Daleville
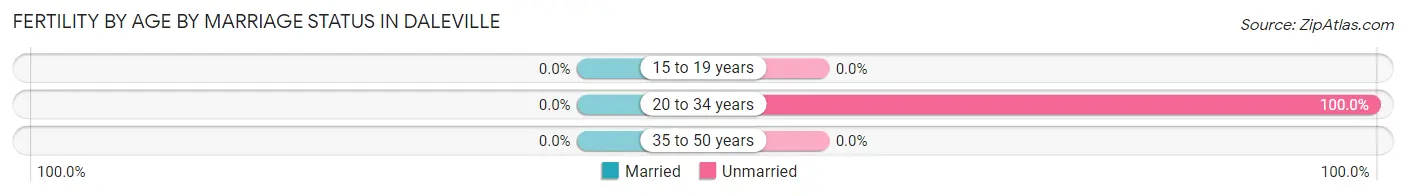
| Age Bracket | Married | Unmarried |
| 15 to 19 years | 0 (0.0%) | 0 (0.0%) |
| 20 to 34 years | 0 (0.0%) | 13 (100.0%) |
| 35 to 50 years | 0 (0.0%) | 0 (0.0%) |
| Total | 0 (0.0%) | 13 (100.0%) |
Fertility by Education in Daleville
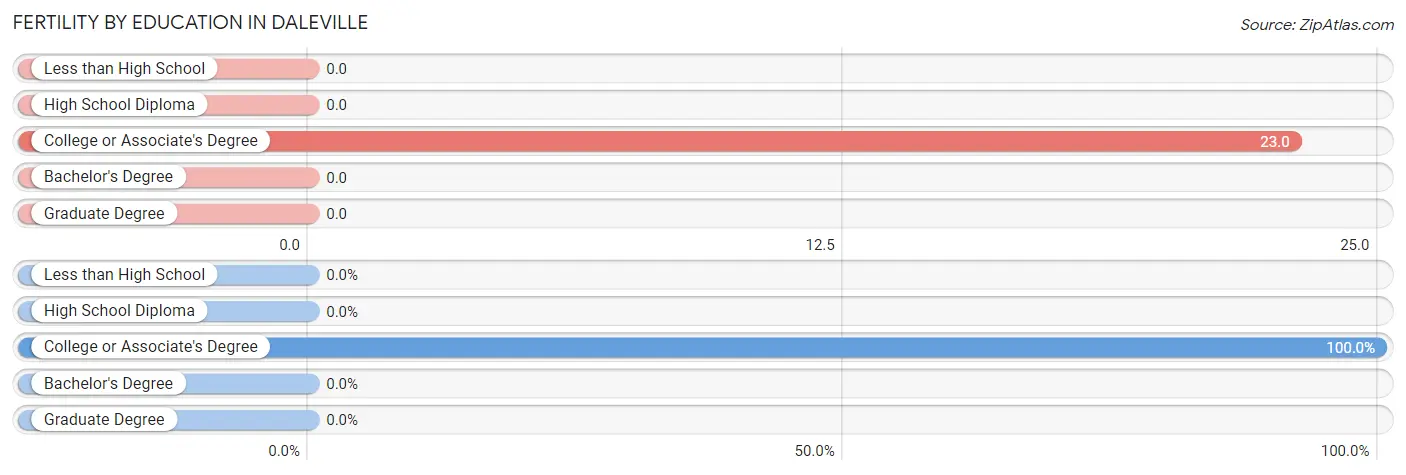
| Educational Attainment | Women with Births | Births / 1,000 Women |
| Less than High School | 0 (0.0%) | 0.0 |
| High School Diploma | 0 (0.0%) | 0.0 |
| College or Associate's Degree | 13 (100.0%) | 23.0 |
| Bachelor's Degree | 0 (0.0%) | 0.0 |
| Graduate Degree | 0 (0.0%) | 0.0 |
| Total | 13 (100.0%) | 11.0 |
Fertility by Education by Marriage Status in Daleville
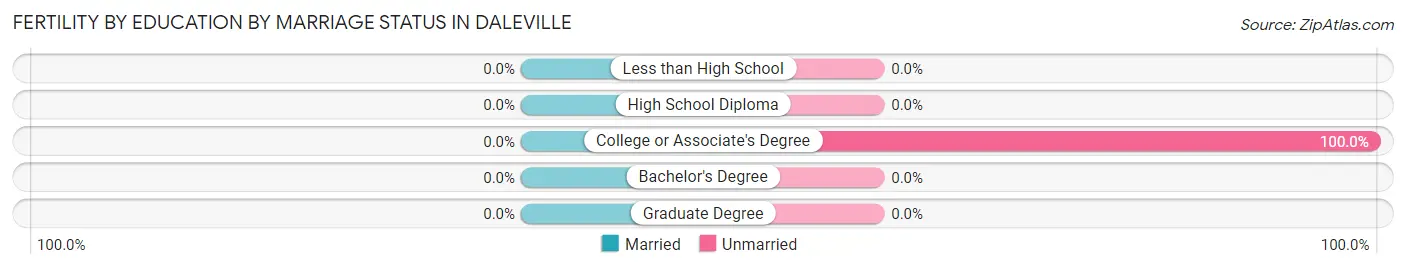
| Educational Attainment | Married | Unmarried |
| Less than High School | 0 (0.0%) | 0 (0.0%) |
| High School Diploma | 0 (0.0%) | 0 (0.0%) |
| College or Associate's Degree | 0 (0.0%) | 13 (100.0%) |
| Bachelor's Degree | 0 (0.0%) | 0 (0.0%) |
| Graduate Degree | 0 (0.0%) | 0 (0.0%) |
| Total | 0 (0.0%) | 13 (100.0%) |
Employment Characteristics in Daleville
Employment by Class of Employer in Daleville
Among the 2,327 employed individuals in Daleville, private company employees (1,526 | 65.6%), federal government employees (399 | 17.2%), and local government employees (184 | 7.9%) make up the most common classes of employment.
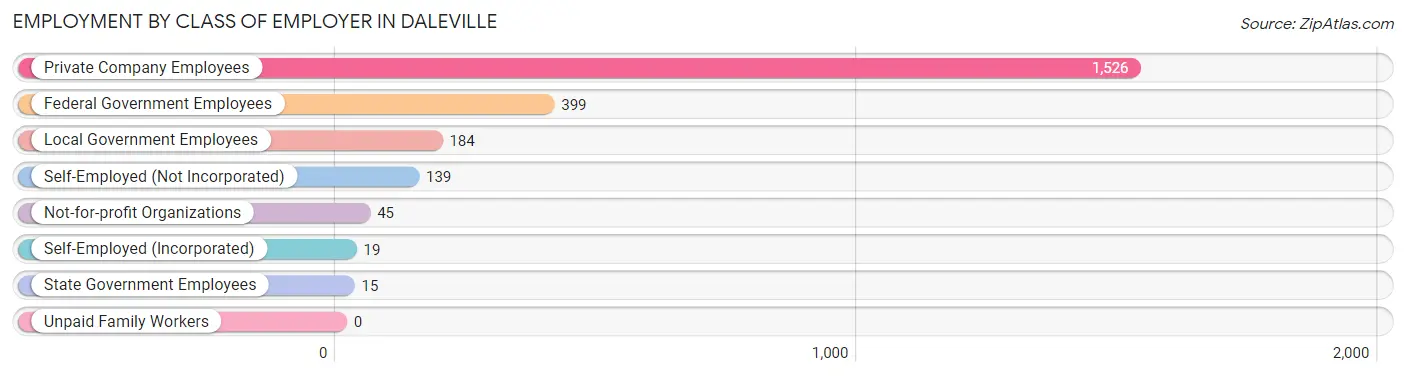
| Employer Class | # Employees | % Employees |
| Private Company Employees | 1,526 | 65.6% |
| Self-Employed (Incorporated) | 19 | 0.8% |
| Self-Employed (Not Incorporated) | 139 | 6.0% |
| Not-for-profit Organizations | 45 | 1.9% |
| Local Government Employees | 184 | 7.9% |
| State Government Employees | 15 | 0.6% |
| Federal Government Employees | 399 | 17.2% |
| Unpaid Family Workers | 0 | 0.0% |
| Total | 2,327 | 100.0% |
Employment Status by Age in Daleville
According to the labor force statistics for Daleville, out of the total population over 16 years of age (4,208), 60.2% or 2,533 individuals are in the labor force, with 6.8% or 172 of them unemployed. The age group with the highest labor force participation rate is 20 to 24 years, with 92.4% or 293 individuals in the labor force. Within the labor force, the 16 to 19 years age range has the highest percentage of unemployed individuals, with 28.6% or 59 of them being unemployed.
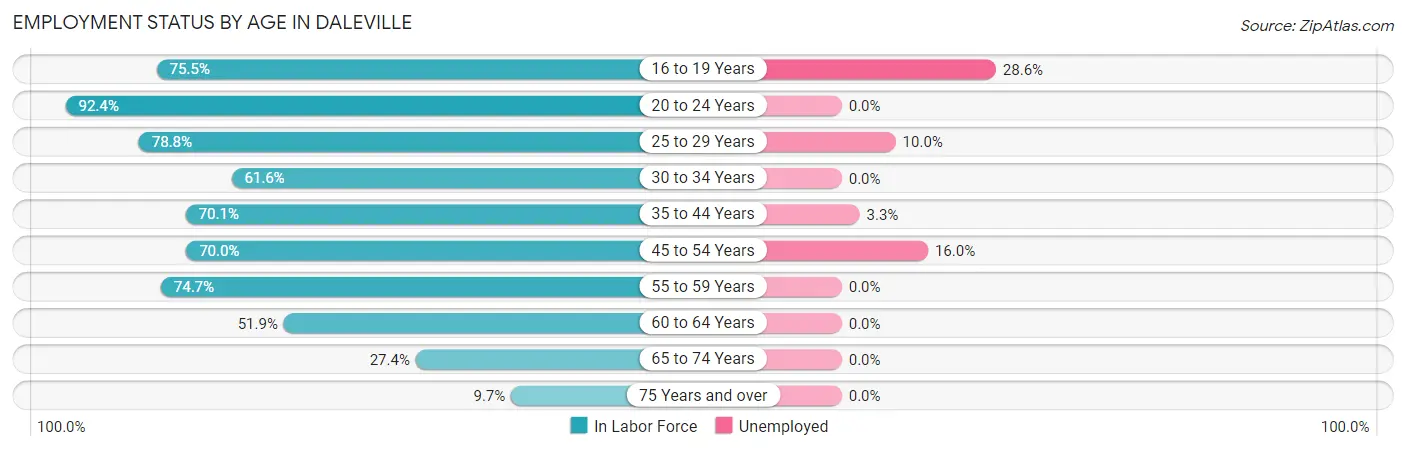
| Age Bracket | In Labor Force | Unemployed |
| 16 to 19 Years | 206 (75.5%) | 59 (28.6%) |
| 20 to 24 Years | 293 (92.4%) | 0 (0.0%) |
| 25 to 29 Years | 245 (78.8%) | 24 (10.0%) |
| 30 to 34 Years | 340 (61.6%) | 0 (0.0%) |
| 35 to 44 Years | 399 (70.1%) | 13 (3.3%) |
| 45 to 54 Years | 420 (70.0%) | 67 (16.0%) |
| 55 to 59 Years | 168 (74.7%) | 0 (0.0%) |
| 60 to 64 Years | 288 (51.9%) | 0 (0.0%) |
| 65 to 74 Years | 150 (27.4%) | 0 (0.0%) |
| 75 Years and over | 25 (9.7%) | 0 (0.0%) |
| Total | 2,533 (60.2%) | 172 (6.8%) |
Employment Status by Educational Attainment in Daleville
According to labor force statistics for Daleville, 66.1% of individuals (1,859) out of the total population between 25 and 64 years of age (2,812) are in the labor force, with 5.7% or 106 of them being unemployed. The group with the highest labor force participation rate are those with the educational attainment of college / associate degree, with 79.8% or 867 individuals in the labor force. Within the labor force, individuals with college / associate degree education have the highest percentage of unemployment, with 11.9% or 103 of them being unemployed.
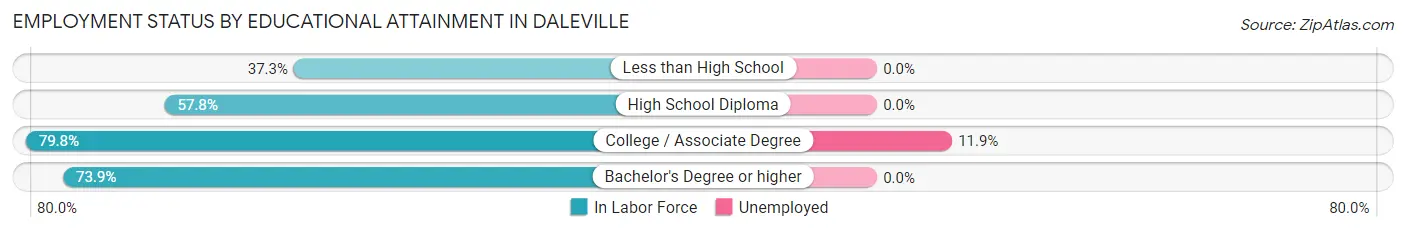
| Educational Attainment | In Labor Force | Unemployed |
| Less than High School | 152 (37.3%) | 0 (0.0%) |
| High School Diploma | 476 (57.8%) | 0 (0.0%) |
| College / Associate Degree | 867 (79.8%) | 129 (11.9%) |
| Bachelor's Degree or higher | 365 (73.9%) | 0 (0.0%) |
| Total | 1,859 (66.1%) | 160 (5.7%) |
Employment Occupations by Sex in Daleville
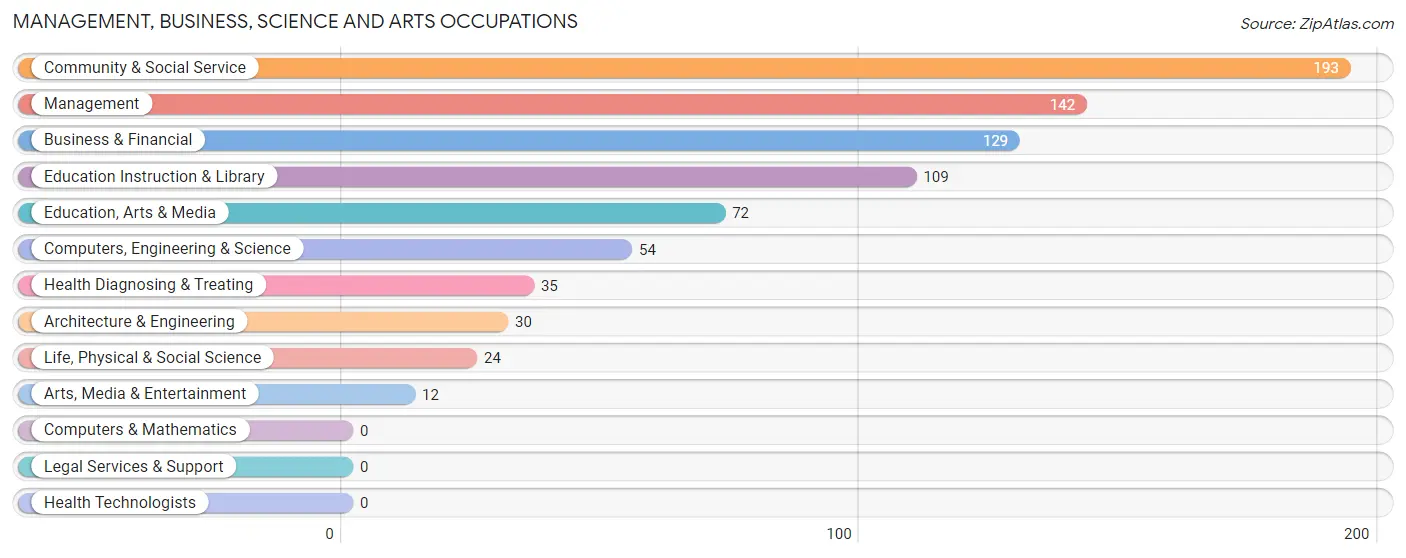
Management, Business, Science and Arts Occupations
The most common Management, Business, Science and Arts occupations in Daleville are Community & Social Service (193 | 8.7%), Management (142 | 6.4%), Business & Financial (129 | 5.8%), Education Instruction & Library (109 | 4.9%), and Education, Arts & Media (72 | 3.2%).
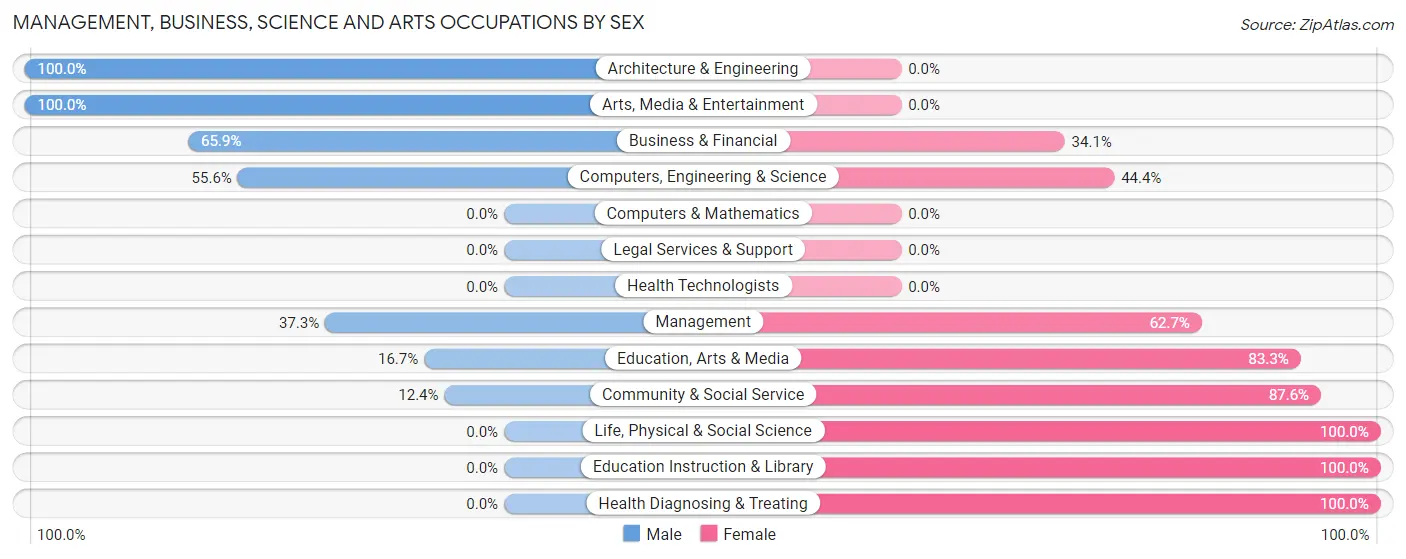
Management, Business, Science and Arts Occupations by Sex
Within the Management, Business, Science and Arts occupations in Daleville, the most male-oriented occupations are Architecture & Engineering (100.0%), Arts, Media & Entertainment (100.0%), and Business & Financial (65.9%), while the most female-oriented occupations are Life, Physical & Social Science (100.0%), Education Instruction & Library (100.0%), and Health Diagnosing & Treating (100.0%).
| Occupation | Male | Female |
| Management | 53 (37.3%) | 89 (62.7%) |
| Business & Financial | 85 (65.9%) | 44 (34.1%) |
| Computers, Engineering & Science | 30 (55.6%) | 24 (44.4%) |
| Computers & Mathematics | 0 (0.0%) | 0 (0.0%) |
| Architecture & Engineering | 30 (100.0%) | 0 (0.0%) |
| Life, Physical & Social Science | 0 (0.0%) | 24 (100.0%) |
| Community & Social Service | 24 (12.4%) | 169 (87.6%) |
| Education, Arts & Media | 12 (16.7%) | 60 (83.3%) |
| Legal Services & Support | 0 (0.0%) | 0 (0.0%) |
| Education Instruction & Library | 0 (0.0%) | 109 (100.0%) |
| Arts, Media & Entertainment | 12 (100.0%) | 0 (0.0%) |
| Health Diagnosing & Treating | 0 (0.0%) | 35 (100.0%) |
| Health Technologists | 0 (0.0%) | 0 (0.0%) |
| Total (Category) | 192 (34.7%) | 361 (65.3%) |
| Total (Overall) | 893 (40.1%) | 1,336 (59.9%) |
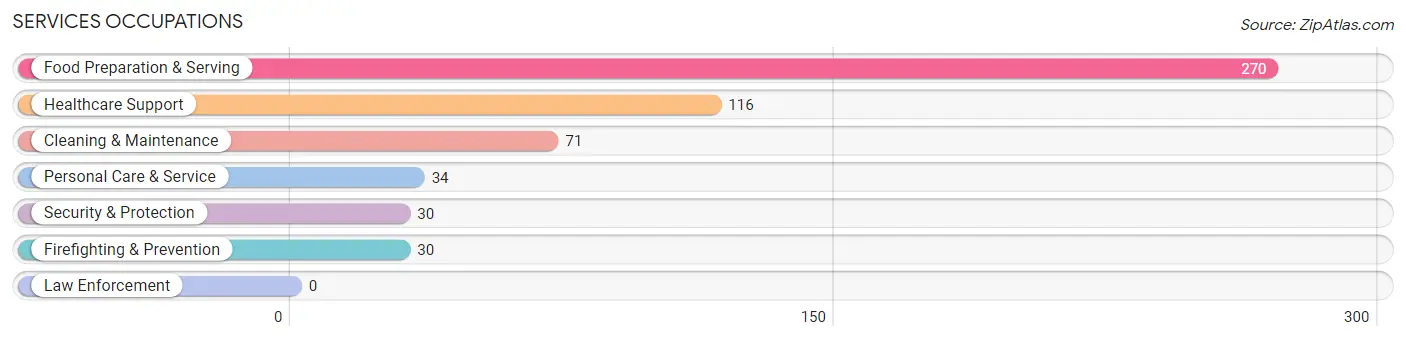
Services Occupations
The most common Services occupations in Daleville are Food Preparation & Serving (270 | 12.1%), Healthcare Support (116 | 5.2%), Cleaning & Maintenance (71 | 3.2%), Personal Care & Service (34 | 1.5%), and Security & Protection (30 | 1.3%).
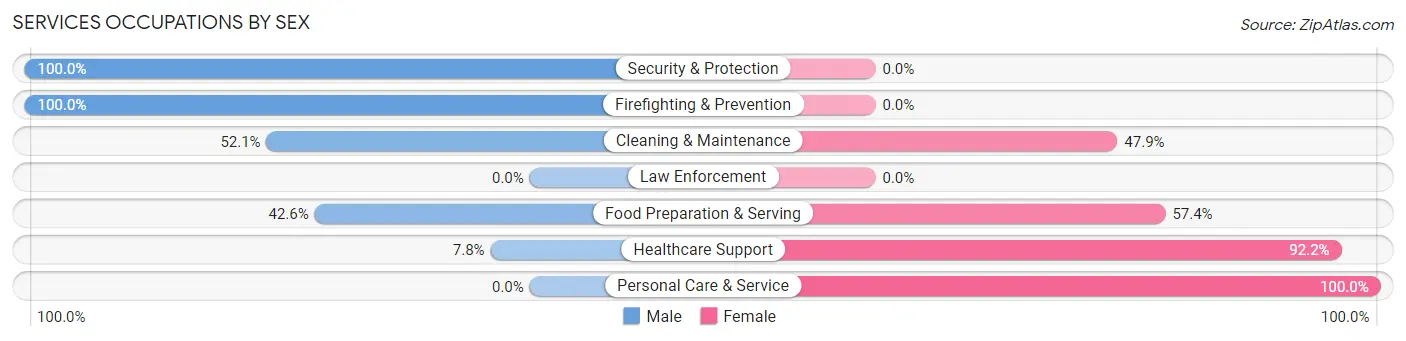
Services Occupations by Sex
Within the Services occupations in Daleville, the most male-oriented occupations are Security & Protection (100.0%), Firefighting & Prevention (100.0%), and Cleaning & Maintenance (52.1%), while the most female-oriented occupations are Personal Care & Service (100.0%), Healthcare Support (92.2%), and Food Preparation & Serving (57.4%).
| Occupation | Male | Female |
| Healthcare Support | 9 (7.8%) | 107 (92.2%) |
| Security & Protection | 30 (100.0%) | 0 (0.0%) |
| Firefighting & Prevention | 30 (100.0%) | 0 (0.0%) |
| Law Enforcement | 0 (0.0%) | 0 (0.0%) |
| Food Preparation & Serving | 115 (42.6%) | 155 (57.4%) |
| Cleaning & Maintenance | 37 (52.1%) | 34 (47.9%) |
| Personal Care & Service | 0 (0.0%) | 34 (100.0%) |
| Total (Category) | 191 (36.7%) | 330 (63.3%) |
| Total (Overall) | 893 (40.1%) | 1,336 (59.9%) |
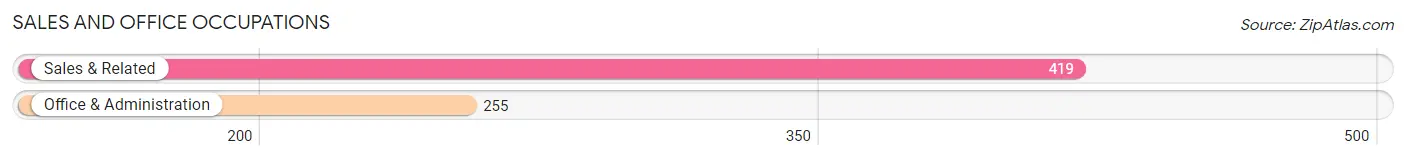
Sales and Office Occupations
The most common Sales and Office occupations in Daleville are Sales & Related (419 | 18.8%), and Office & Administration (255 | 11.4%).
Sales and Office Occupations by Sex
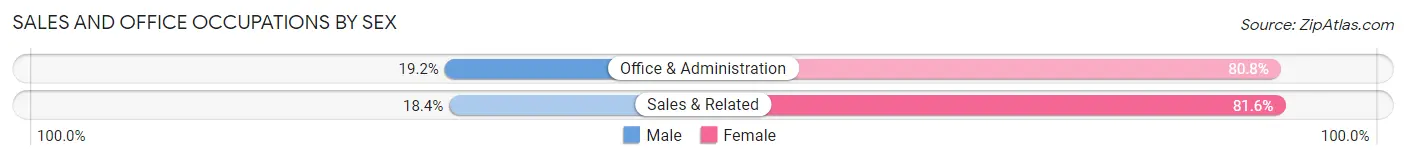
| Occupation | Male | Female |
| Sales & Related | 77 (18.4%) | 342 (81.6%) |
| Office & Administration | 49 (19.2%) | 206 (80.8%) |
| Total (Category) | 126 (18.7%) | 548 (81.3%) |
| Total (Overall) | 893 (40.1%) | 1,336 (59.9%) |
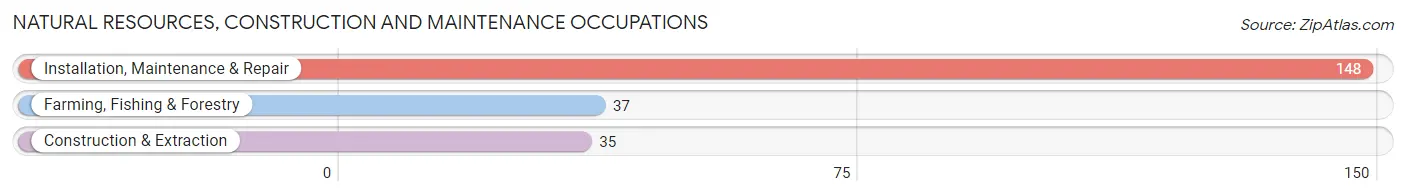
Natural Resources, Construction and Maintenance Occupations
The most common Natural Resources, Construction and Maintenance occupations in Daleville are Installation, Maintenance & Repair (148 | 6.6%), Farming, Fishing & Forestry (37 | 1.7%), and Construction & Extraction (35 | 1.6%).
Natural Resources, Construction and Maintenance Occupations by Sex
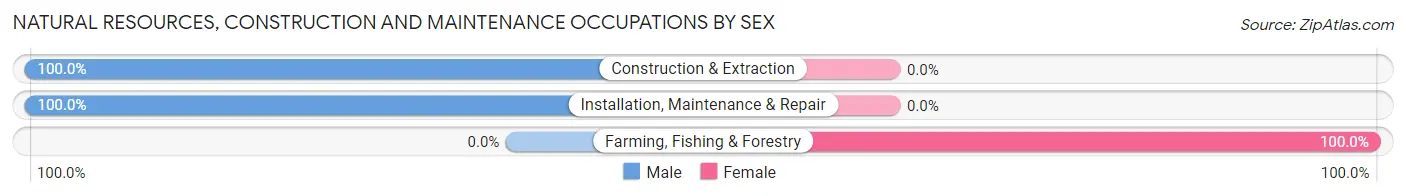
| Occupation | Male | Female |
| Farming, Fishing & Forestry | 0 (0.0%) | 37 (100.0%) |
| Construction & Extraction | 35 (100.0%) | 0 (0.0%) |
| Installation, Maintenance & Repair | 148 (100.0%) | 0 (0.0%) |
| Total (Category) | 183 (83.2%) | 37 (16.8%) |
| Total (Overall) | 893 (40.1%) | 1,336 (59.9%) |
Production, Transportation and Moving Occupations
The most common Production, Transportation and Moving occupations in Daleville are Production (123 | 5.5%), Material Moving (98 | 4.4%), and Transportation (40 | 1.8%).

Production, Transportation and Moving Occupations by Sex
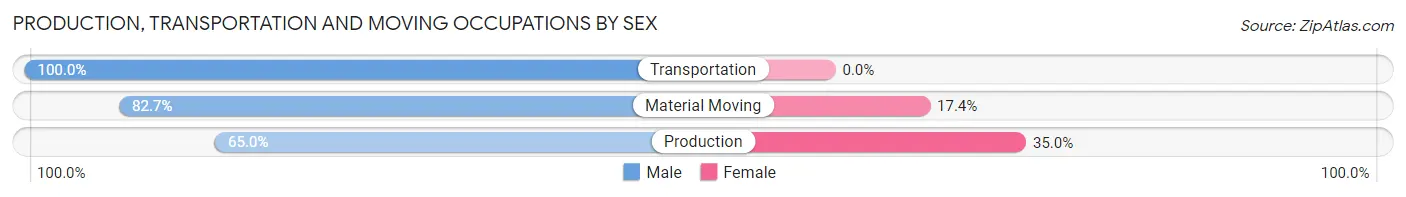
| Occupation | Male | Female |
| Production | 80 (65.0%) | 43 (35.0%) |
| Transportation | 40 (100.0%) | 0 (0.0%) |
| Material Moving | 81 (82.7%) | 17 (17.3%) |
| Total (Category) | 201 (77.0%) | 60 (23.0%) |
| Total (Overall) | 893 (40.1%) | 1,336 (59.9%) |
Employment Industries by Sex in Daleville
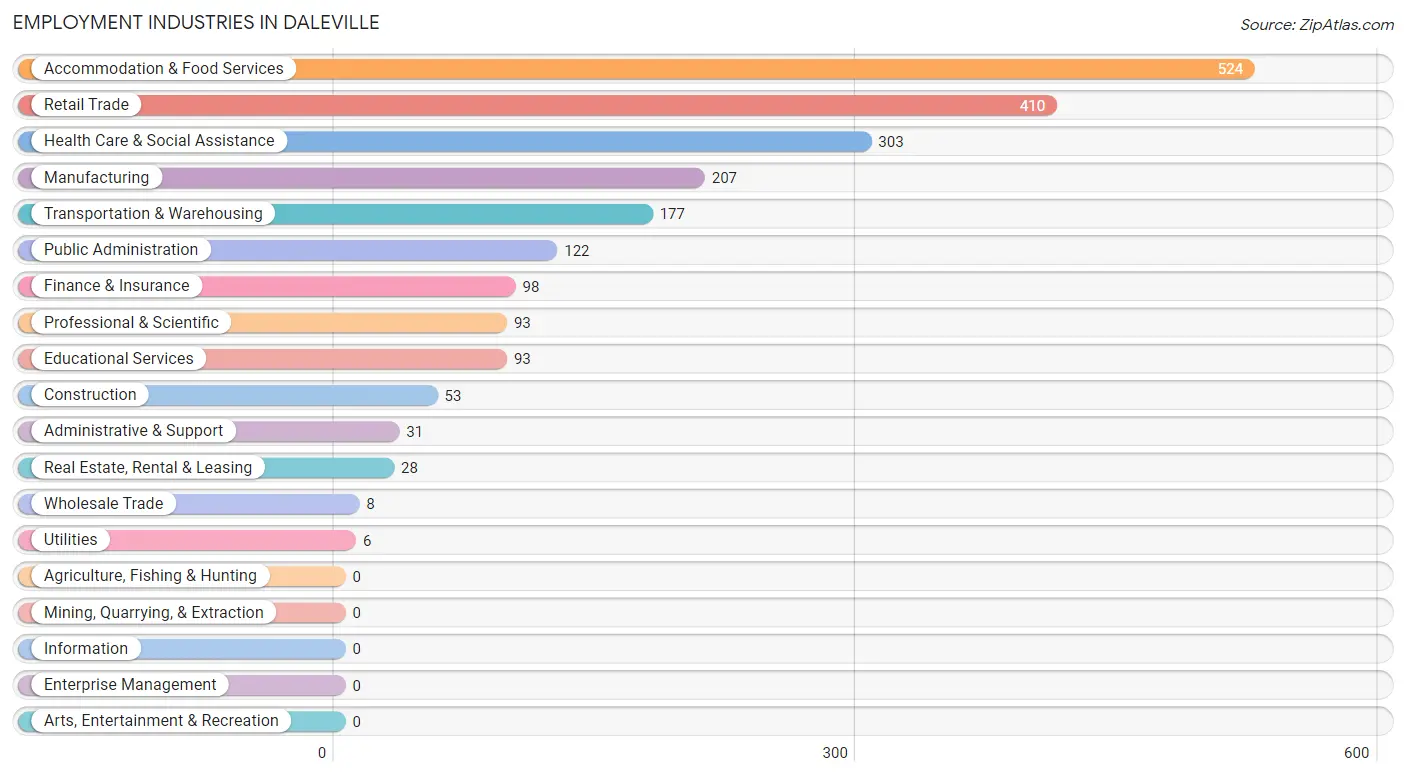
Employment Industries in Daleville
The major employment industries in Daleville include Accommodation & Food Services (524 | 23.5%), Retail Trade (410 | 18.4%), Health Care & Social Assistance (303 | 13.6%), Manufacturing (207 | 9.3%), and Transportation & Warehousing (177 | 7.9%).
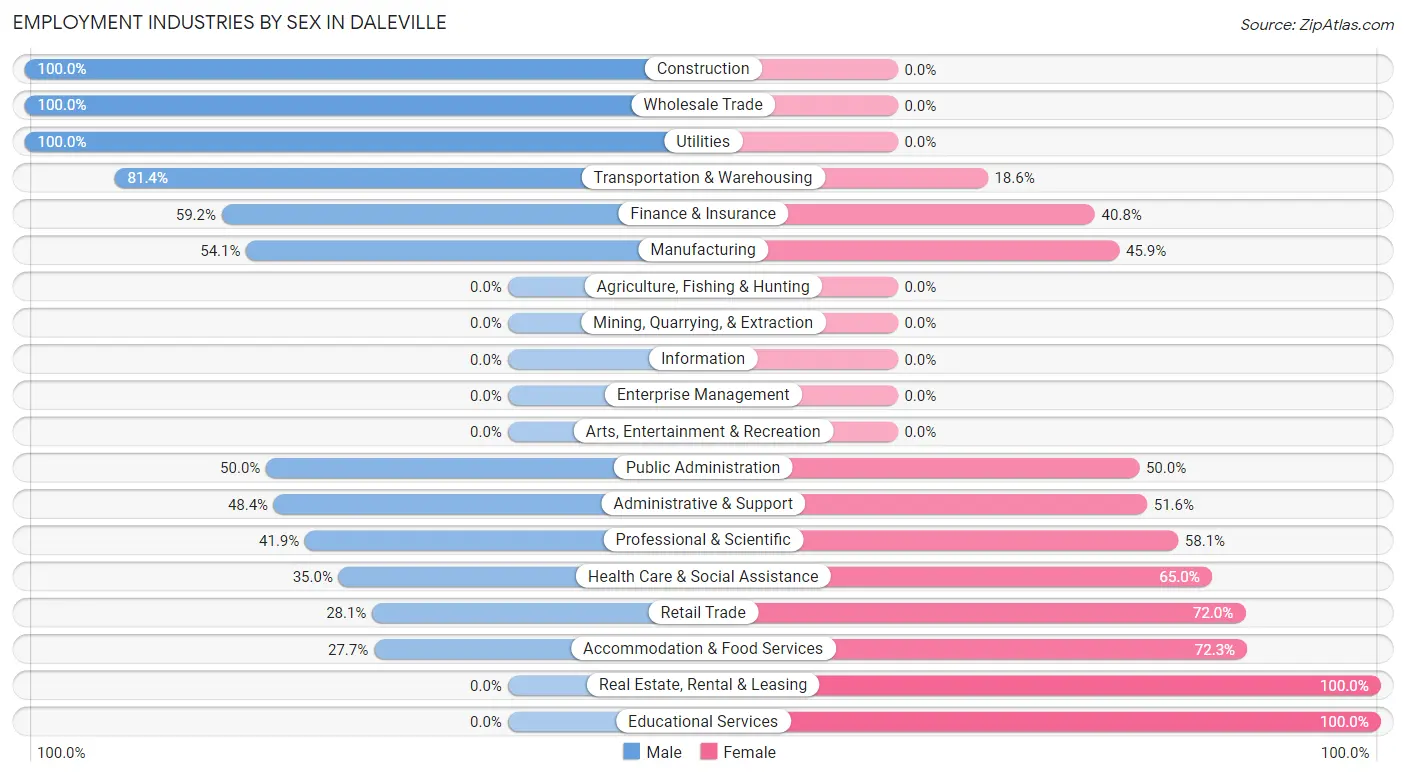
Employment Industries by Sex in Daleville
The Daleville industries that see more men than women are Construction (100.0%), Wholesale Trade (100.0%), and Utilities (100.0%), whereas the industries that tend to have a higher number of women are Real Estate, Rental & Leasing (100.0%), Educational Services (100.0%), and Accommodation & Food Services (72.3%).
| Industry | Male | Female |
| Agriculture, Fishing & Hunting | 0 (0.0%) | 0 (0.0%) |
| Mining, Quarrying, & Extraction | 0 (0.0%) | 0 (0.0%) |
| Construction | 53 (100.0%) | 0 (0.0%) |
| Manufacturing | 112 (54.1%) | 95 (45.9%) |
| Wholesale Trade | 8 (100.0%) | 0 (0.0%) |
| Retail Trade | 115 (28.1%) | 295 (72.0%) |
| Transportation & Warehousing | 144 (81.4%) | 33 (18.6%) |
| Utilities | 6 (100.0%) | 0 (0.0%) |
| Information | 0 (0.0%) | 0 (0.0%) |
| Finance & Insurance | 58 (59.2%) | 40 (40.8%) |
| Real Estate, Rental & Leasing | 0 (0.0%) | 28 (100.0%) |
| Professional & Scientific | 39 (41.9%) | 54 (58.1%) |
| Enterprise Management | 0 (0.0%) | 0 (0.0%) |
| Administrative & Support | 15 (48.4%) | 16 (51.6%) |
| Educational Services | 0 (0.0%) | 93 (100.0%) |
| Health Care & Social Assistance | 106 (35.0%) | 197 (65.0%) |
| Arts, Entertainment & Recreation | 0 (0.0%) | 0 (0.0%) |
| Accommodation & Food Services | 145 (27.7%) | 379 (72.3%) |
| Public Administration | 61 (50.0%) | 61 (50.0%) |
| Total | 893 (40.1%) | 1,336 (59.9%) |
Education in Daleville
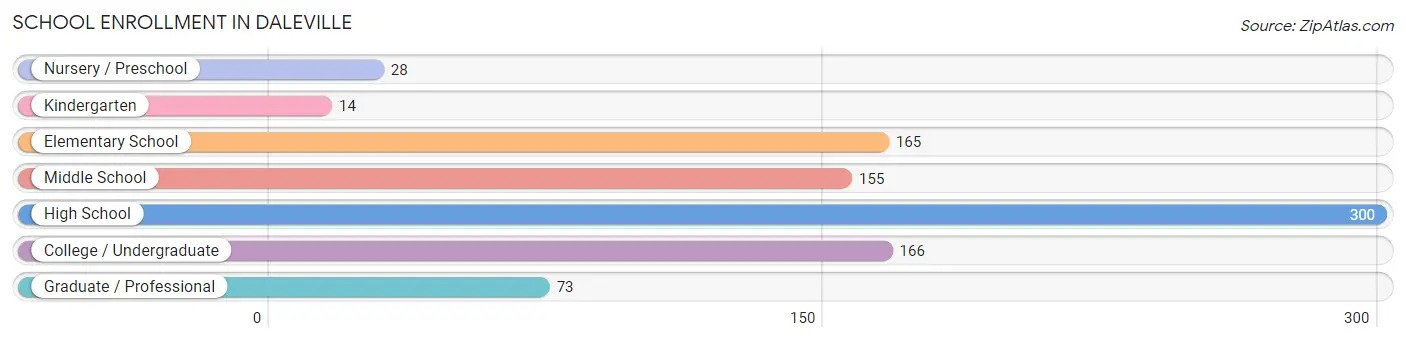
School Enrollment in Daleville
The most common levels of schooling among the 901 students in Daleville are high school (300 | 33.3%), college / undergraduate (166 | 18.4%), and elementary school (165 | 18.3%).
| School Level | # Students | % Students |
| Nursery / Preschool | 28 | 3.1% |
| Kindergarten | 14 | 1.5% |
| Elementary School | 165 | 18.3% |
| Middle School | 155 | 17.2% |
| High School | 300 | 33.3% |
| College / Undergraduate | 166 | 18.4% |
| Graduate / Professional | 73 | 8.1% |
| Total | 901 | 100.0% |
School Enrollment by Age by Funding Source in Daleville
Out of a total of 901 students who are enrolled in schools in Daleville, 113 (12.5%) attend a private institution, while the remaining 788 (87.5%) are enrolled in public schools. The age group of 3 to 4 year olds has the highest likelihood of being enrolled in private schools, with 13 (100.0% in the age bracket) enrolled. Conversely, the age group of 10 to 14 year olds has the lowest likelihood of being enrolled in a private school, with 219 (100.0% in the age bracket) attending a public institution.
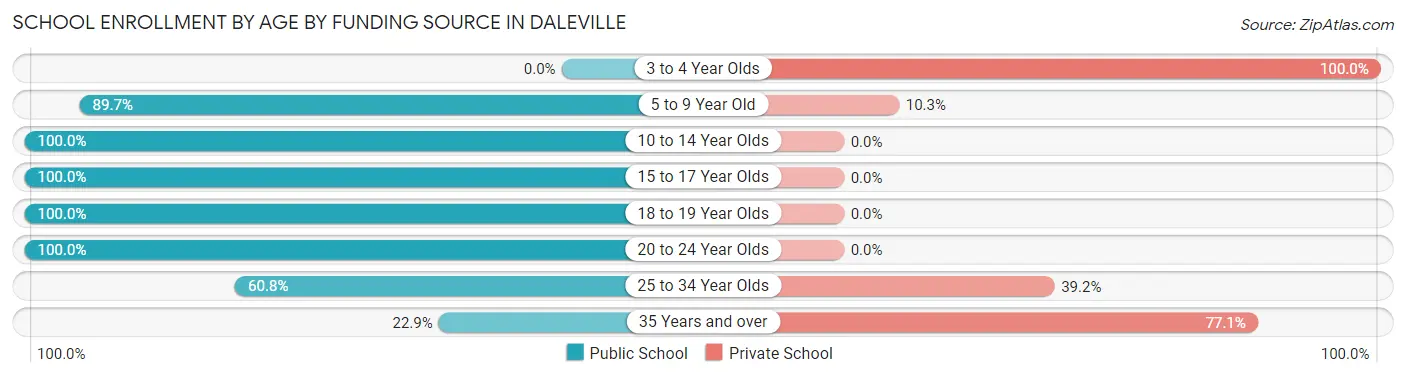
| Age Bracket | Public School | Private School |
| 3 to 4 Year Olds | 0 (0.0%) | 13 (100.0%) |
| 5 to 9 Year Old | 140 (89.7%) | 16 (10.3%) |
| 10 to 14 Year Olds | 219 (100.0%) | 0 (0.0%) |
| 15 to 17 Year Olds | 204 (100.0%) | 0 (0.0%) |
| 18 to 19 Year Olds | 122 (100.0%) | 0 (0.0%) |
| 20 to 24 Year Olds | 53 (100.0%) | 0 (0.0%) |
| 25 to 34 Year Olds | 31 (60.8%) | 20 (39.2%) |
| 35 Years and over | 19 (22.9%) | 64 (77.1%) |
| Total | 788 (87.5%) | 113 (12.5%) |
Educational Attainment by Field of Study in Daleville
Education (156 | 22.0%), business (90 | 12.7%), arts & humanities (88 | 12.4%), psychology (79 | 11.1%), and science & technology (79 | 11.1%) are the most common fields of study among 710 individuals in Daleville who have obtained a bachelor's degree or higher.
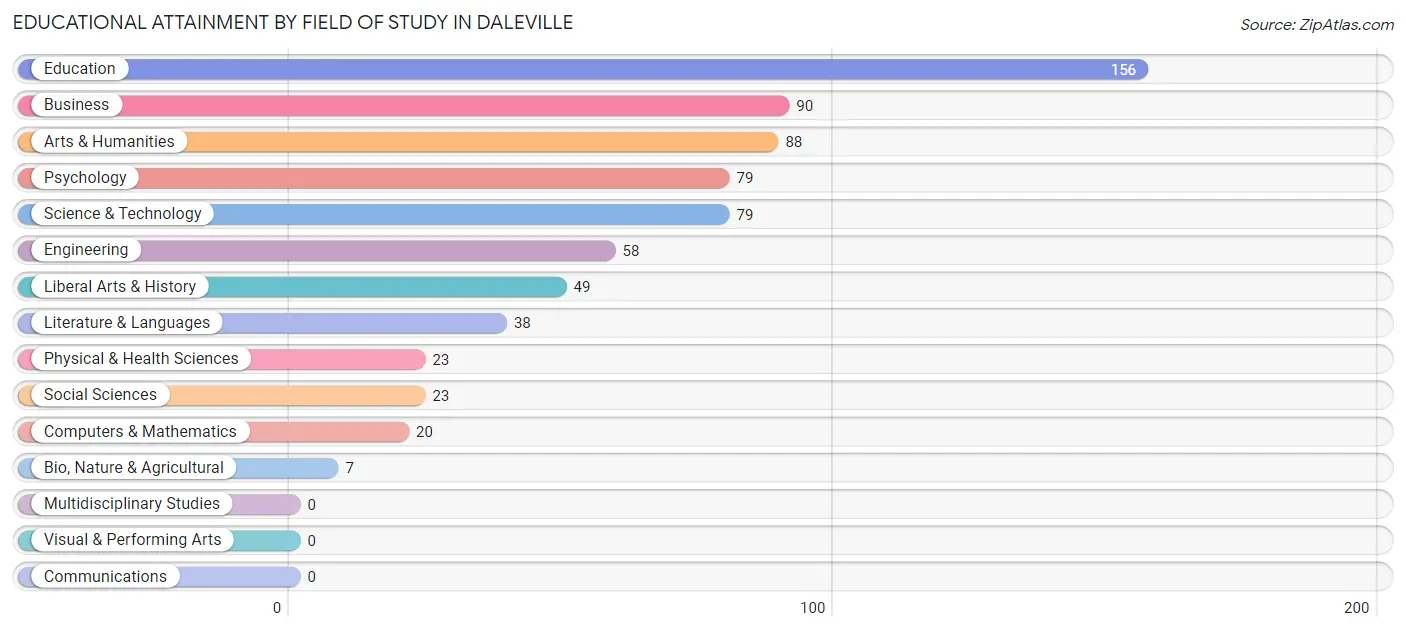
| Field of Study | # Graduates | % Graduates |
| Computers & Mathematics | 20 | 2.8% |
| Bio, Nature & Agricultural | 7 | 1.0% |
| Physical & Health Sciences | 23 | 3.2% |
| Psychology | 79 | 11.1% |
| Social Sciences | 23 | 3.2% |
| Engineering | 58 | 8.2% |
| Multidisciplinary Studies | 0 | 0.0% |
| Science & Technology | 79 | 11.1% |
| Business | 90 | 12.7% |
| Education | 156 | 22.0% |
| Literature & Languages | 38 | 5.3% |
| Liberal Arts & History | 49 | 6.9% |
| Visual & Performing Arts | 0 | 0.0% |
| Communications | 0 | 0.0% |
| Arts & Humanities | 88 | 12.4% |
| Total | 710 | 100.0% |
Transportation & Commute in Daleville
Vehicle Availability by Sex in Daleville
The most prevalent vehicle ownership categories in Daleville are males with 2 vehicles (362, accounting for 37.3%) and females with 2 vehicles (415, making up 26.7%).
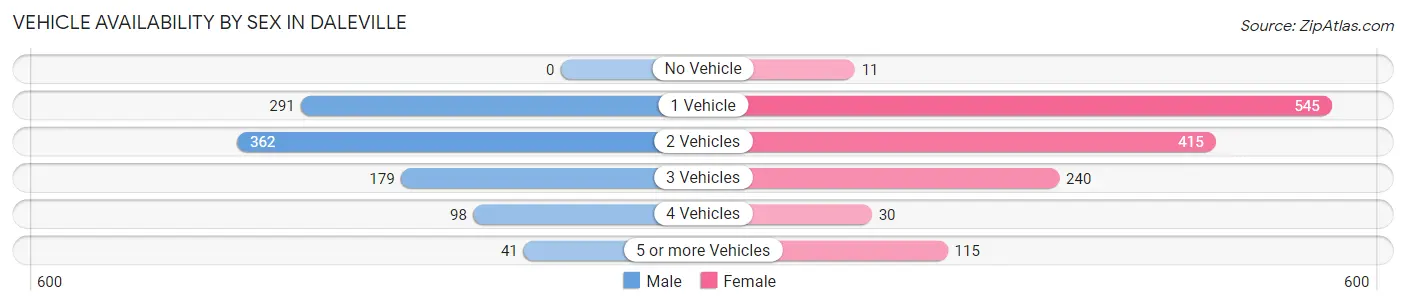
| Vehicles Available | Male | Female |
| No Vehicle | 0 (0.0%) | 11 (0.8%) |
| 1 Vehicle | 291 (30.0%) | 545 (40.2%) |
| 2 Vehicles | 362 (37.3%) | 415 (30.6%) |
| 3 Vehicles | 179 (18.4%) | 240 (17.7%) |
| 4 Vehicles | 98 (10.1%) | 30 (2.2%) |
| 5 or more Vehicles | 41 (4.2%) | 115 (8.5%) |
| Total | 971 (100.0%) | 1,356 (100.0%) |
Commute Time in Daleville
The most frequently occuring commute durations in Daleville are 10 to 14 minutes (580 commuters, 25.8%), 15 to 19 minutes (512 commuters, 22.7%), and 5 to 9 minutes (264 commuters, 11.7%).
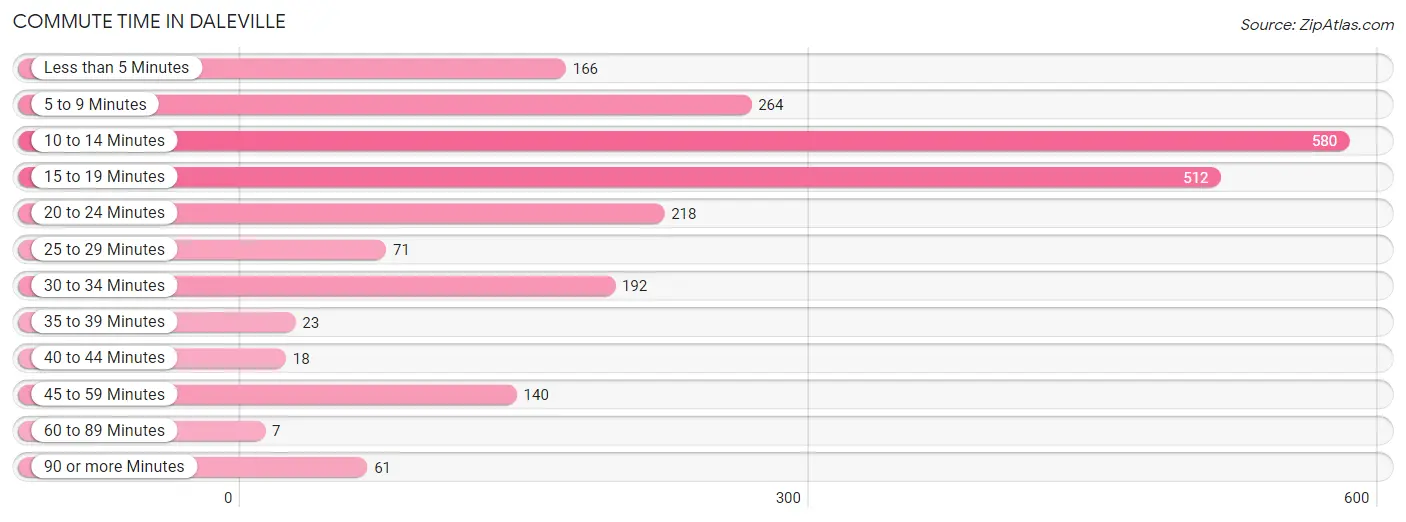
| Commute Time | # Commuters | % Commuters |
| Less than 5 Minutes | 166 | 7.4% |
| 5 to 9 Minutes | 264 | 11.7% |
| 10 to 14 Minutes | 580 | 25.8% |
| 15 to 19 Minutes | 512 | 22.7% |
| 20 to 24 Minutes | 218 | 9.7% |
| 25 to 29 Minutes | 71 | 3.2% |
| 30 to 34 Minutes | 192 | 8.5% |
| 35 to 39 Minutes | 23 | 1.0% |
| 40 to 44 Minutes | 18 | 0.8% |
| 45 to 59 Minutes | 140 | 6.2% |
| 60 to 89 Minutes | 7 | 0.3% |
| 90 or more Minutes | 61 | 2.7% |
Commute Time by Sex in Daleville
The most common commute times in Daleville are 10 to 14 minutes (216 commuters, 22.7%) for males and 10 to 14 minutes (364 commuters, 28.0%) for females.
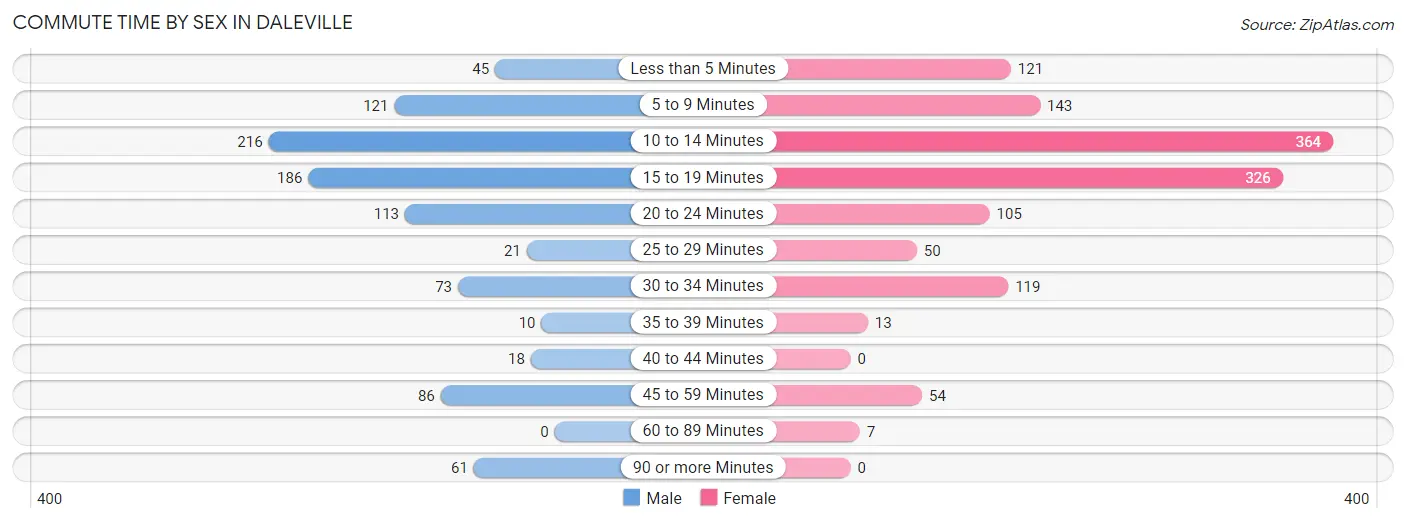
| Commute Time | Male | Female |
| Less than 5 Minutes | 45 (4.7%) | 121 (9.3%) |
| 5 to 9 Minutes | 121 (12.7%) | 143 (11.0%) |
| 10 to 14 Minutes | 216 (22.7%) | 364 (28.0%) |
| 15 to 19 Minutes | 186 (19.6%) | 326 (25.0%) |
| 20 to 24 Minutes | 113 (11.9%) | 105 (8.1%) |
| 25 to 29 Minutes | 21 (2.2%) | 50 (3.8%) |
| 30 to 34 Minutes | 73 (7.7%) | 119 (9.1%) |
| 35 to 39 Minutes | 10 (1.1%) | 13 (1.0%) |
| 40 to 44 Minutes | 18 (1.9%) | 0 (0.0%) |
| 45 to 59 Minutes | 86 (9.0%) | 54 (4.2%) |
| 60 to 89 Minutes | 0 (0.0%) | 7 (0.5%) |
| 90 or more Minutes | 61 (6.4%) | 0 (0.0%) |
Time of Departure to Work by Sex in Daleville
The most frequent times of departure to work in Daleville are 5:00 AM to 5:29 AM (153, 16.1%) for males and 7:00 AM to 7:29 AM (189, 14.5%) for females.
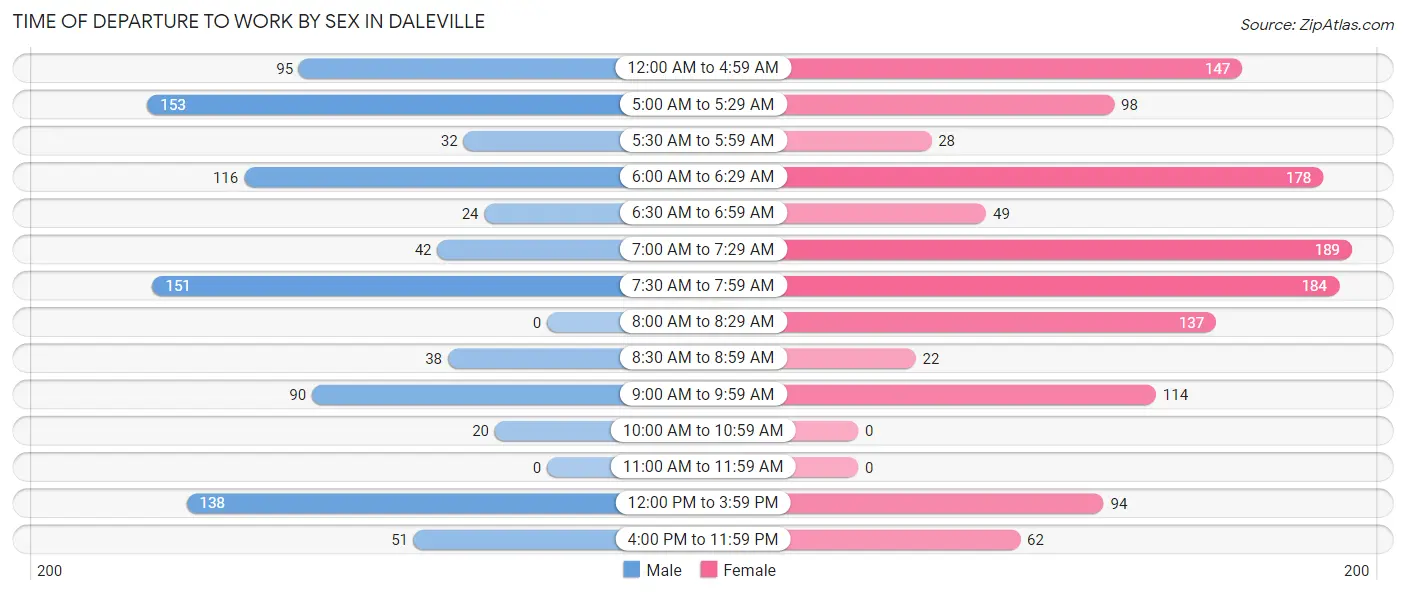
| Time of Departure | Male | Female |
| 12:00 AM to 4:59 AM | 95 (10.0%) | 147 (11.3%) |
| 5:00 AM to 5:29 AM | 153 (16.1%) | 98 (7.5%) |
| 5:30 AM to 5:59 AM | 32 (3.4%) | 28 (2.1%) |
| 6:00 AM to 6:29 AM | 116 (12.2%) | 178 (13.7%) |
| 6:30 AM to 6:59 AM | 24 (2.5%) | 49 (3.8%) |
| 7:00 AM to 7:29 AM | 42 (4.4%) | 189 (14.5%) |
| 7:30 AM to 7:59 AM | 151 (15.9%) | 184 (14.1%) |
| 8:00 AM to 8:29 AM | 0 (0.0%) | 137 (10.5%) |
| 8:30 AM to 8:59 AM | 38 (4.0%) | 22 (1.7%) |
| 9:00 AM to 9:59 AM | 90 (9.5%) | 114 (8.8%) |
| 10:00 AM to 10:59 AM | 20 (2.1%) | 0 (0.0%) |
| 11:00 AM to 11:59 AM | 0 (0.0%) | 0 (0.0%) |
| 12:00 PM to 3:59 PM | 138 (14.5%) | 94 (7.2%) |
| 4:00 PM to 11:59 PM | 51 (5.4%) | 62 (4.8%) |
| Total | 950 (100.0%) | 1,302 (100.0%) |
Housing Occupancy in Daleville
Occupancy by Ownership in Daleville
Of the total 2,277 dwellings in Daleville, owner-occupied units account for 1,210 (53.1%), while renter-occupied units make up 1,067 (46.9%).
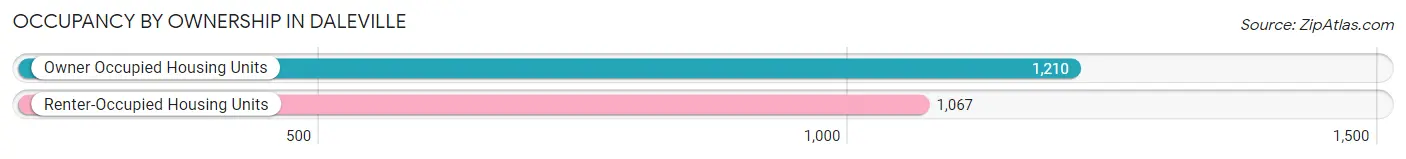
| Occupancy | # Housing Units | % Housing Units |
| Owner Occupied Housing Units | 1,210 | 53.1% |
| Renter-Occupied Housing Units | 1,067 | 46.9% |
| Total Occupied Housing Units | 2,277 | 100.0% |
Occupancy by Household Size in Daleville
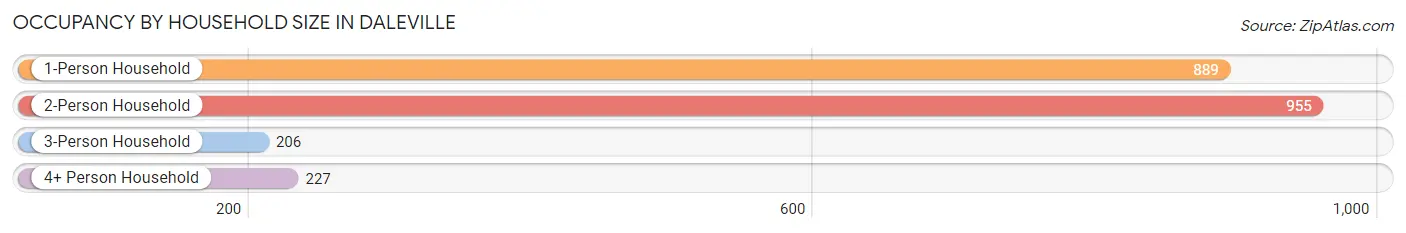
| Household Size | # Housing Units | % Housing Units |
| 1-Person Household | 889 | 39.0% |
| 2-Person Household | 955 | 41.9% |
| 3-Person Household | 206 | 9.0% |
| 4+ Person Household | 227 | 10.0% |
| Total Housing Units | 2,277 | 100.0% |
Occupancy by Ownership by Household Size in Daleville
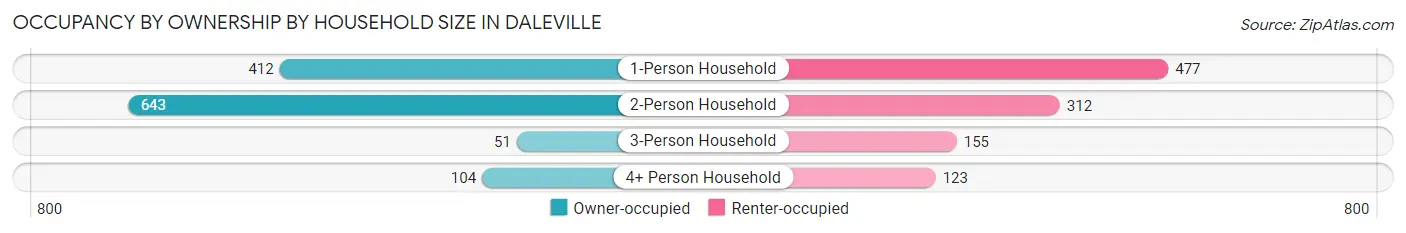
| Household Size | Owner-occupied | Renter-occupied |
| 1-Person Household | 412 (46.3%) | 477 (53.7%) |
| 2-Person Household | 643 (67.3%) | 312 (32.7%) |
| 3-Person Household | 51 (24.8%) | 155 (75.2%) |
| 4+ Person Household | 104 (45.8%) | 123 (54.2%) |
| Total Housing Units | 1,210 (53.1%) | 1,067 (46.9%) |
Occupancy by Educational Attainment in Daleville
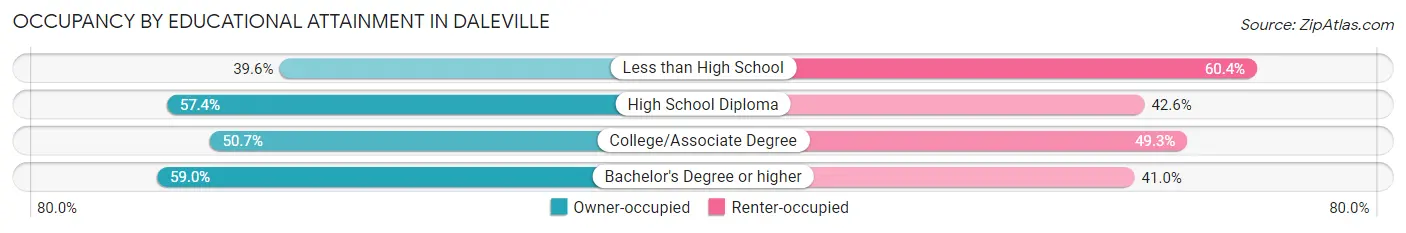
| Household Size | Owner-occupied | Renter-occupied |
| Less than High School | 101 (39.6%) | 154 (60.4%) |
| High School Diploma | 363 (57.4%) | 269 (42.6%) |
| College/Associate Degree | 451 (50.7%) | 439 (49.3%) |
| Bachelor's Degree or higher | 295 (59.0%) | 205 (41.0%) |
Occupancy by Age of Householder in Daleville
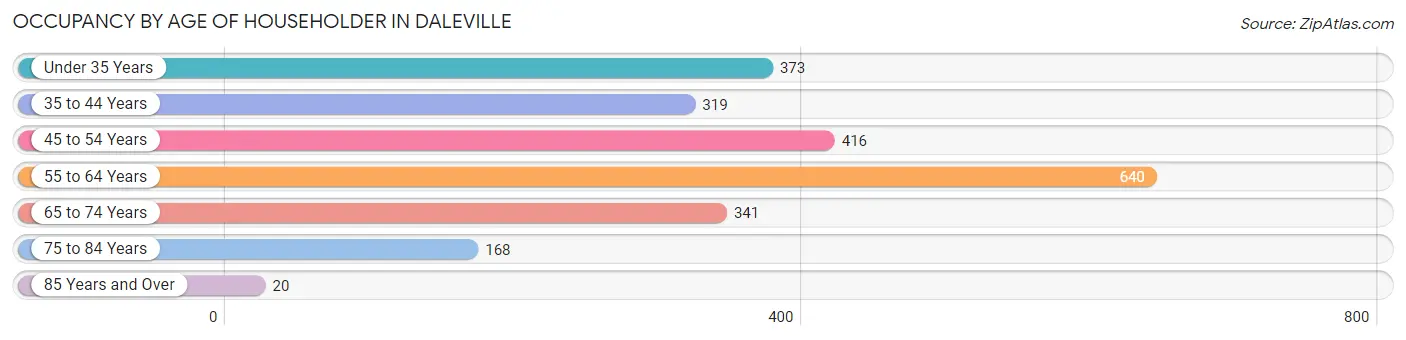
| Age Bracket | # Households | % Households |
| Under 35 Years | 373 | 16.4% |
| 35 to 44 Years | 319 | 14.0% |
| 45 to 54 Years | 416 | 18.3% |
| 55 to 64 Years | 640 | 28.1% |
| 65 to 74 Years | 341 | 15.0% |
| 75 to 84 Years | 168 | 7.4% |
| 85 Years and Over | 20 | 0.9% |
| Total | 2,277 | 100.0% |
Housing Finances in Daleville
Median Income by Occupancy in Daleville
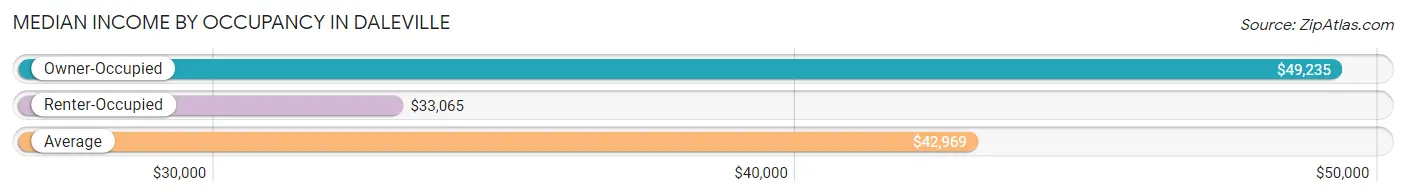
| Occupancy Type | # Households | Median Income |
| Owner-Occupied | 1,210 (53.1%) | $49,235 |
| Renter-Occupied | 1,067 (46.9%) | $33,065 |
| Average | 2,277 (100.0%) | $42,969 |
Occupancy by Householder Income Bracket in Daleville
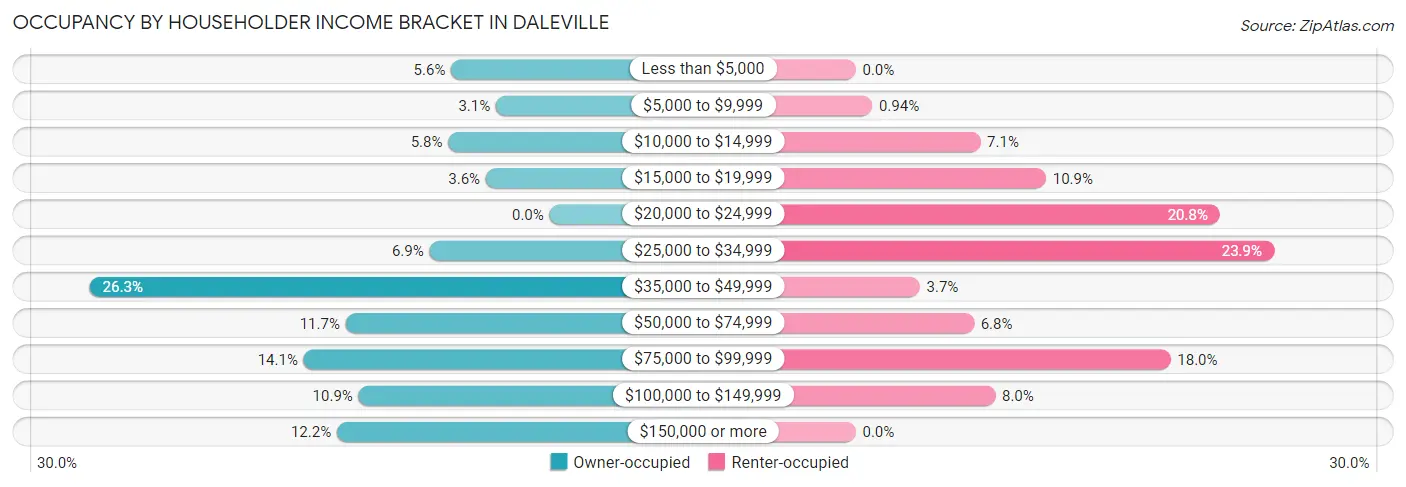
| Income Bracket | Owner-occupied | Renter-occupied |
| Less than $5,000 | 68 (5.6%) | 0 (0.0%) |
| $5,000 to $9,999 | 37 (3.1%) | 10 (0.9%) |
| $10,000 to $14,999 | 70 (5.8%) | 76 (7.1%) |
| $15,000 to $19,999 | 44 (3.6%) | 116 (10.9%) |
| $20,000 to $24,999 | 0 (0.0%) | 222 (20.8%) |
| $25,000 to $34,999 | 83 (6.9%) | 255 (23.9%) |
| $35,000 to $49,999 | 318 (26.3%) | 39 (3.7%) |
| $50,000 to $74,999 | 141 (11.7%) | 72 (6.8%) |
| $75,000 to $99,999 | 170 (14.1%) | 192 (18.0%) |
| $100,000 to $149,999 | 132 (10.9%) | 85 (8.0%) |
| $150,000 or more | 147 (12.1%) | 0 (0.0%) |
| Total | 1,210 (100.0%) | 1,067 (100.0%) |
Monthly Housing Cost Tiers in Daleville
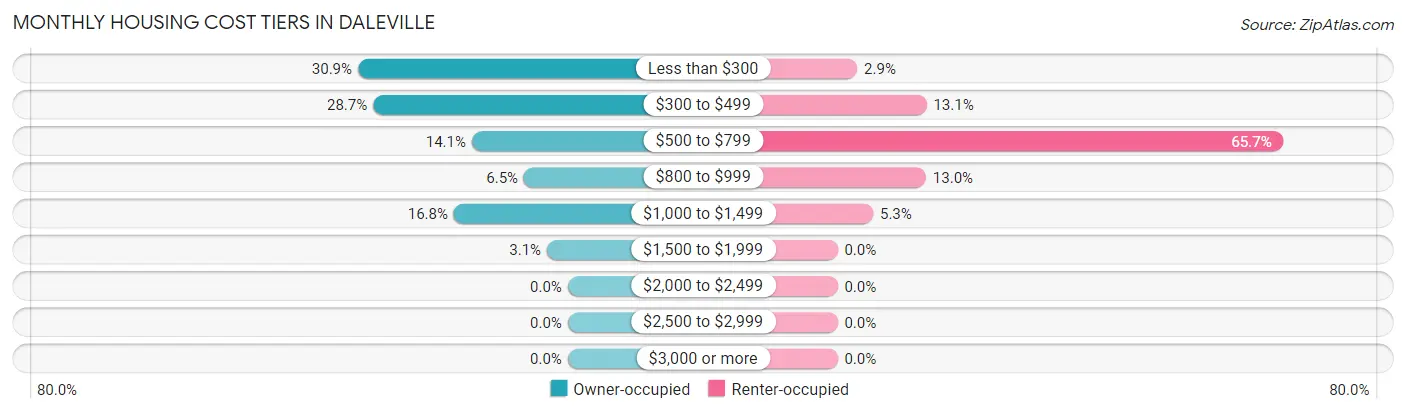
| Monthly Cost | Owner-occupied | Renter-occupied |
| Less than $300 | 374 (30.9%) | 31 (2.9%) |
| $300 to $499 | 347 (28.7%) | 140 (13.1%) |
| $500 to $799 | 171 (14.1%) | 701 (65.7%) |
| $800 to $999 | 78 (6.5%) | 139 (13.0%) |
| $1,000 to $1,499 | 203 (16.8%) | 56 (5.2%) |
| $1,500 to $1,999 | 37 (3.1%) | 0 (0.0%) |
| $2,000 to $2,499 | 0 (0.0%) | 0 (0.0%) |
| $2,500 to $2,999 | 0 (0.0%) | 0 (0.0%) |
| $3,000 or more | 0 (0.0%) | 0 (0.0%) |
| Total | 1,210 (100.0%) | 1,067 (100.0%) |
Physical Housing Characteristics in Daleville
Housing Structures in Daleville
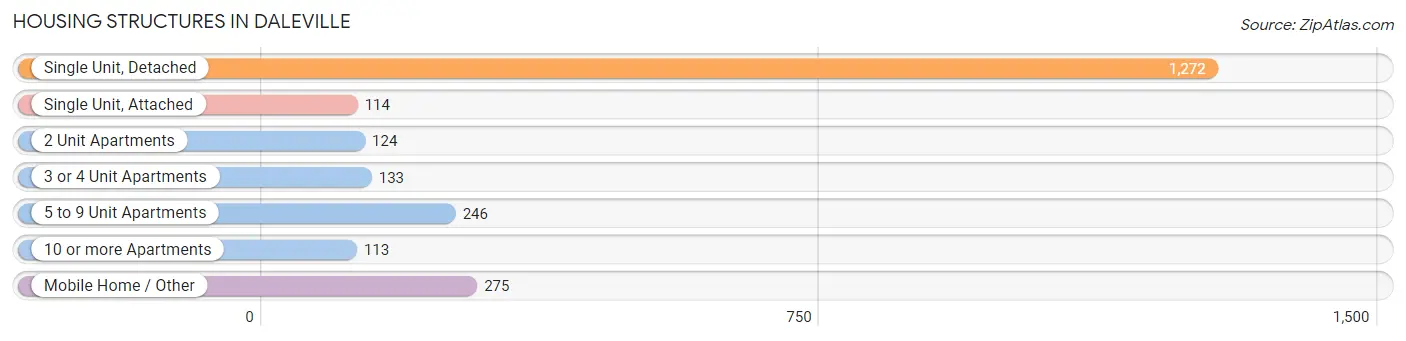
| Structure Type | # Housing Units | % Housing Units |
| Single Unit, Detached | 1,272 | 55.9% |
| Single Unit, Attached | 114 | 5.0% |
| 2 Unit Apartments | 124 | 5.4% |
| 3 or 4 Unit Apartments | 133 | 5.8% |
| 5 to 9 Unit Apartments | 246 | 10.8% |
| 10 or more Apartments | 113 | 5.0% |
| Mobile Home / Other | 275 | 12.1% |
| Total | 2,277 | 100.0% |
Housing Structures by Occupancy in Daleville
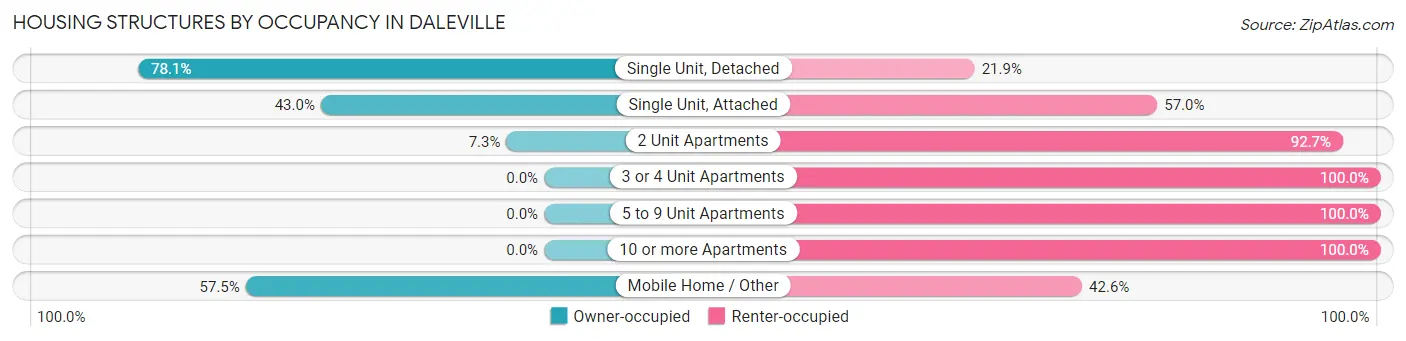
| Structure Type | Owner-occupied | Renter-occupied |
| Single Unit, Detached | 994 (78.1%) | 278 (21.9%) |
| Single Unit, Attached | 49 (43.0%) | 65 (57.0%) |
| 2 Unit Apartments | 9 (7.3%) | 115 (92.7%) |
| 3 or 4 Unit Apartments | 0 (0.0%) | 133 (100.0%) |
| 5 to 9 Unit Apartments | 0 (0.0%) | 246 (100.0%) |
| 10 or more Apartments | 0 (0.0%) | 113 (100.0%) |
| Mobile Home / Other | 158 (57.5%) | 117 (42.5%) |
| Total | 1,210 (53.1%) | 1,067 (46.9%) |
Housing Structures by Number of Rooms in Daleville
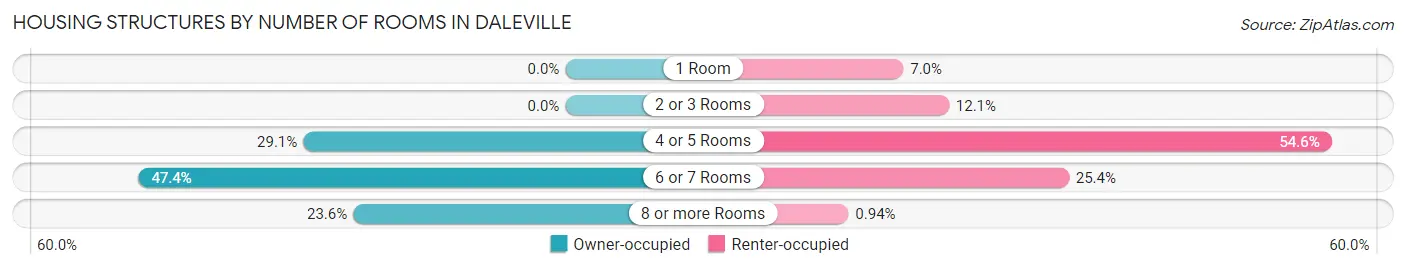
| Number of Rooms | Owner-occupied | Renter-occupied |
| 1 Room | 0 (0.0%) | 75 (7.0%) |
| 2 or 3 Rooms | 0 (0.0%) | 129 (12.1%) |
| 4 or 5 Rooms | 352 (29.1%) | 582 (54.5%) |
| 6 or 7 Rooms | 573 (47.4%) | 271 (25.4%) |
| 8 or more Rooms | 285 (23.5%) | 10 (0.9%) |
| Total | 1,210 (100.0%) | 1,067 (100.0%) |
Housing Structure by Heating Type in Daleville
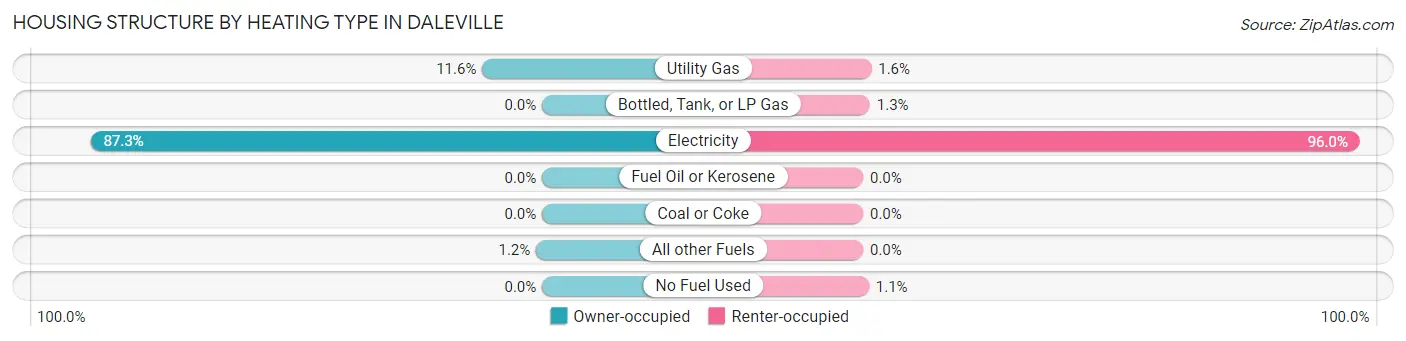
| Heating Type | Owner-occupied | Renter-occupied |
| Utility Gas | 140 (11.6%) | 17 (1.6%) |
| Bottled, Tank, or LP Gas | 0 (0.0%) | 14 (1.3%) |
| Electricity | 1,056 (87.3%) | 1,024 (96.0%) |
| Fuel Oil or Kerosene | 0 (0.0%) | 0 (0.0%) |
| Coal or Coke | 0 (0.0%) | 0 (0.0%) |
| All other Fuels | 14 (1.2%) | 0 (0.0%) |
| No Fuel Used | 0 (0.0%) | 12 (1.1%) |
| Total | 1,210 (100.0%) | 1,067 (100.0%) |
Household Vehicle Usage in Daleville
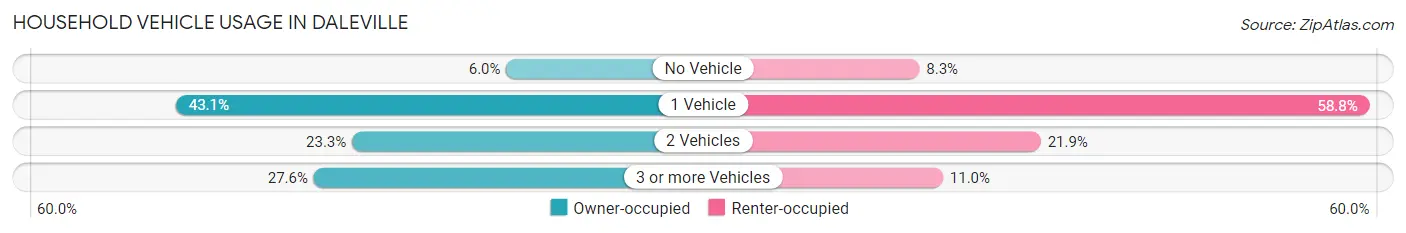
| Vehicles per Household | Owner-occupied | Renter-occupied |
| No Vehicle | 73 (6.0%) | 89 (8.3%) |
| 1 Vehicle | 521 (43.1%) | 627 (58.8%) |
| 2 Vehicles | 282 (23.3%) | 234 (21.9%) |
| 3 or more Vehicles | 334 (27.6%) | 117 (11.0%) |
| Total | 1,210 (100.0%) | 1,067 (100.0%) |
Real Estate & Mortgages in Daleville
Real Estate and Mortgage Overview in Daleville
| Characteristic | Without Mortgage | With Mortgage |
| Housing Units | 815 | 395 |
| Median Property Value | $98,700 | $152,700 |
| Median Household Income | $49,281 | $85 |
| Monthly Housing Costs | $311 | $0 |
| Real Estate Taxes | $335 | $41 |
Property Value by Mortgage Status in Daleville
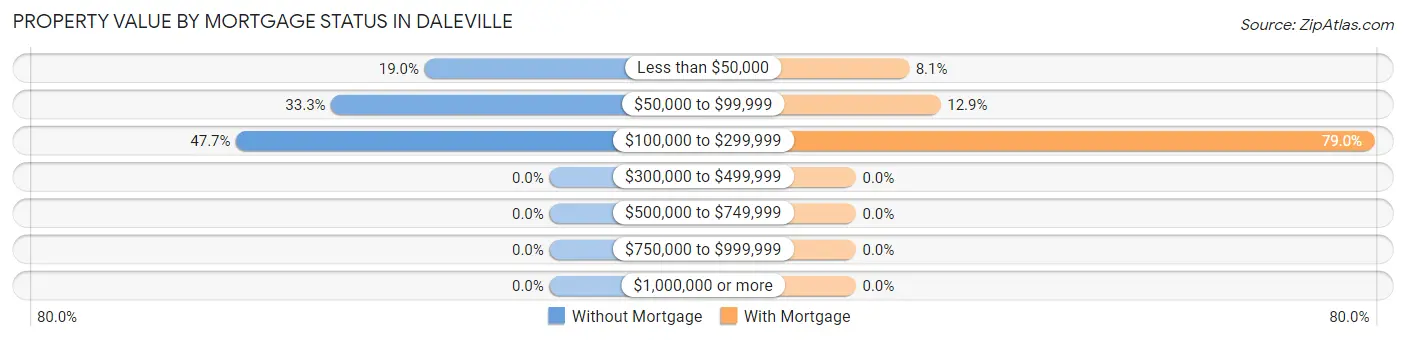
| Property Value | Without Mortgage | With Mortgage |
| Less than $50,000 | 155 (19.0%) | 32 (8.1%) |
| $50,000 to $99,999 | 271 (33.3%) | 51 (12.9%) |
| $100,000 to $299,999 | 389 (47.7%) | 312 (79.0%) |
| $300,000 to $499,999 | 0 (0.0%) | 0 (0.0%) |
| $500,000 to $749,999 | 0 (0.0%) | 0 (0.0%) |
| $750,000 to $999,999 | 0 (0.0%) | 0 (0.0%) |
| $1,000,000 or more | 0 (0.0%) | 0 (0.0%) |
| Total | 815 (100.0%) | 395 (100.0%) |
Household Income by Mortgage Status in Daleville
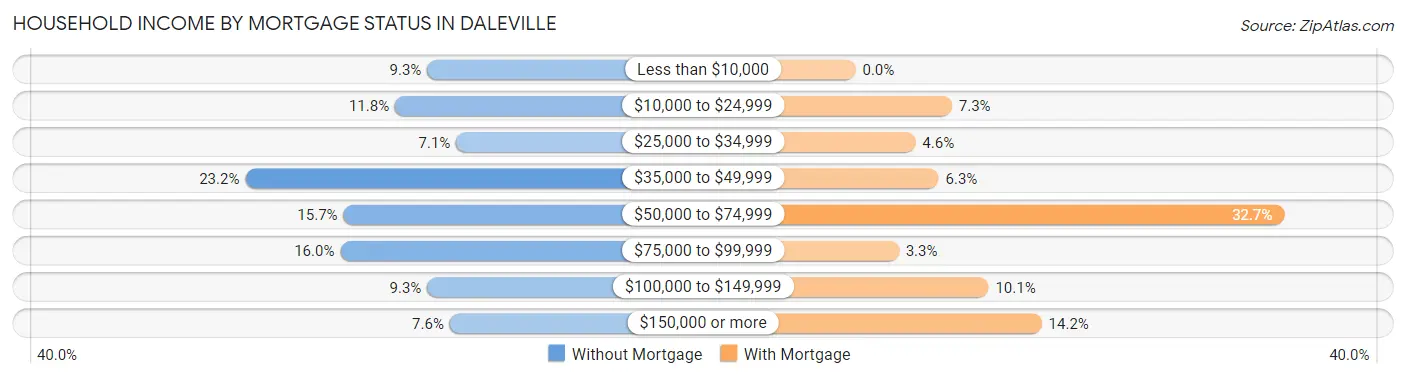
| Household Income | Without Mortgage | With Mortgage |
| Less than $10,000 | 76 (9.3%) | 0 (0.0%) |
| $10,000 to $24,999 | 96 (11.8%) | 29 (7.3%) |
| $25,000 to $34,999 | 58 (7.1%) | 18 (4.6%) |
| $35,000 to $49,999 | 189 (23.2%) | 25 (6.3%) |
| $50,000 to $74,999 | 128 (15.7%) | 129 (32.7%) |
| $75,000 to $99,999 | 130 (16.0%) | 13 (3.3%) |
| $100,000 to $149,999 | 76 (9.3%) | 40 (10.1%) |
| $150,000 or more | 62 (7.6%) | 56 (14.2%) |
| Total | 815 (100.0%) | 395 (100.0%) |
Property Value to Household Income Ratio in Daleville
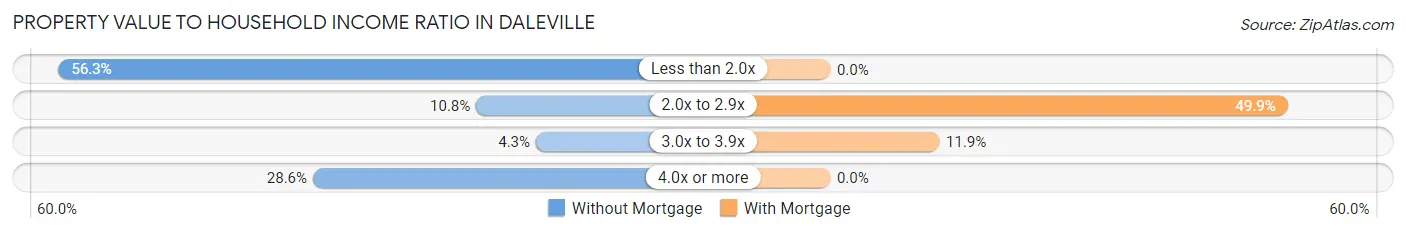
| Value-to-Income Ratio | Without Mortgage | With Mortgage |
| Less than 2.0x | 459 (56.3%) | 0 (0.0%) |
| 2.0x to 2.9x | 88 (10.8%) | 197 (49.9%) |
| 3.0x to 3.9x | 35 (4.3%) | 47 (11.9%) |
| 4.0x or more | 233 (28.6%) | 0 (0.0%) |
| Total | 815 (100.0%) | 395 (100.0%) |
Real Estate Taxes by Mortgage Status in Daleville
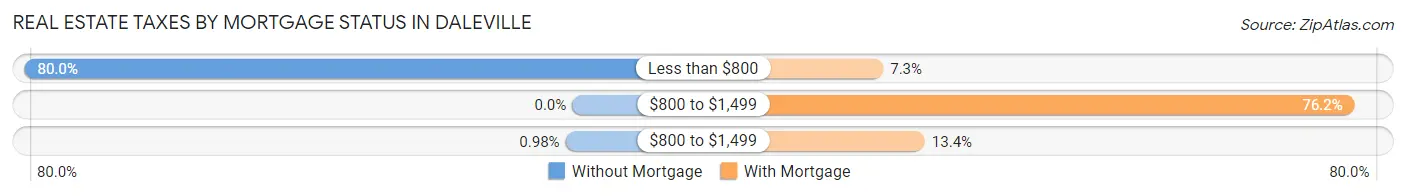
| Property Taxes | Without Mortgage | With Mortgage |
| Less than $800 | 652 (80.0%) | 29 (7.3%) |
| $800 to $1,499 | 0 (0.0%) | 301 (76.2%) |
| $800 to $1,499 | 8 (1.0%) | 53 (13.4%) |
| Total | 815 (100.0%) | 395 (100.0%) |
Health & Disability in Daleville
Health Insurance Coverage by Age in Daleville
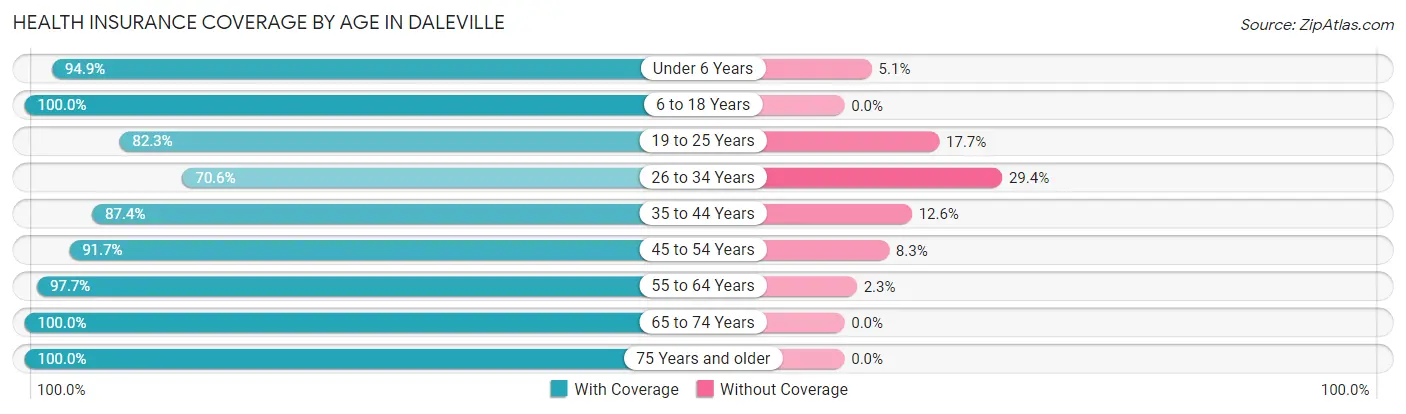
| Age Bracket | With Coverage | Without Coverage |
| Under 6 Years | 279 (94.9%) | 15 (5.1%) |
| 6 to 18 Years | 620 (100.0%) | 0 (0.0%) |
| 19 to 25 Years | 312 (82.3%) | 67 (17.7%) |
| 26 to 34 Years | 516 (70.6%) | 215 (29.4%) |
| 35 to 44 Years | 466 (87.4%) | 67 (12.6%) |
| 45 to 54 Years | 540 (91.7%) | 49 (8.3%) |
| 55 to 64 Years | 762 (97.7%) | 18 (2.3%) |
| 65 to 74 Years | 548 (100.0%) | 0 (0.0%) |
| 75 Years and older | 258 (100.0%) | 0 (0.0%) |
| Total | 4,301 (90.9%) | 431 (9.1%) |
Health Insurance Coverage by Citizenship Status in Daleville
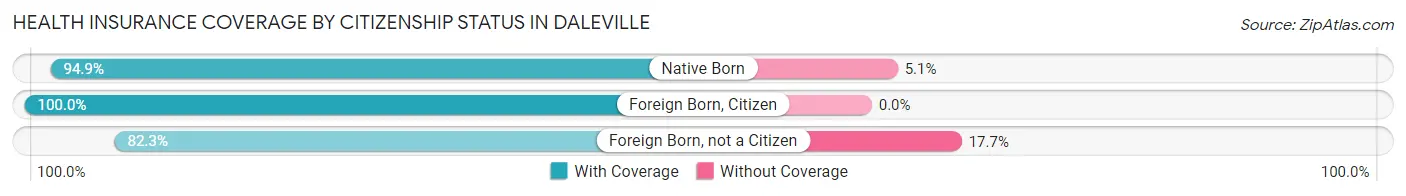
| Citizenship Status | With Coverage | Without Coverage |
| Native Born | 279 (94.9%) | 15 (5.1%) |
| Foreign Born, Citizen | 620 (100.0%) | 0 (0.0%) |
| Foreign Born, not a Citizen | 312 (82.3%) | 67 (17.7%) |
Health Insurance Coverage by Household Income in Daleville
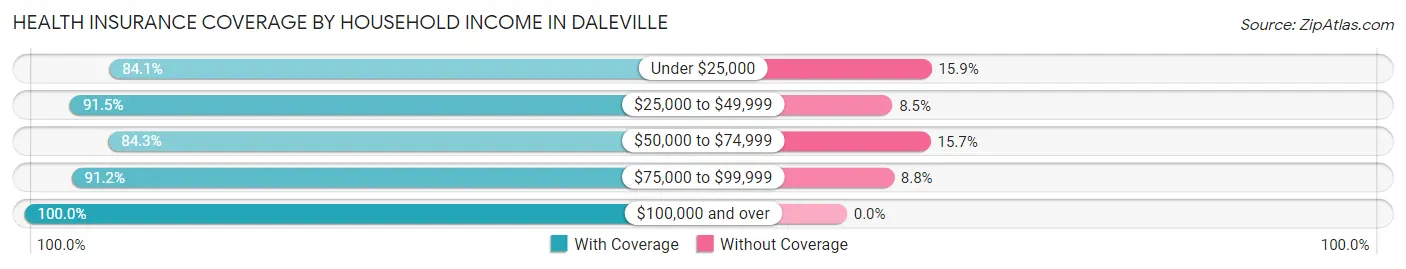
| Household Income | With Coverage | Without Coverage |
| Under $25,000 | 896 (84.1%) | 169 (15.9%) |
| $25,000 to $49,999 | 1,065 (91.5%) | 99 (8.5%) |
| $50,000 to $74,999 | 473 (84.3%) | 88 (15.7%) |
| $75,000 to $99,999 | 776 (91.2%) | 75 (8.8%) |
| $100,000 and over | 1,091 (100.0%) | 0 (0.0%) |
Public vs Private Health Insurance Coverage by Age in Daleville
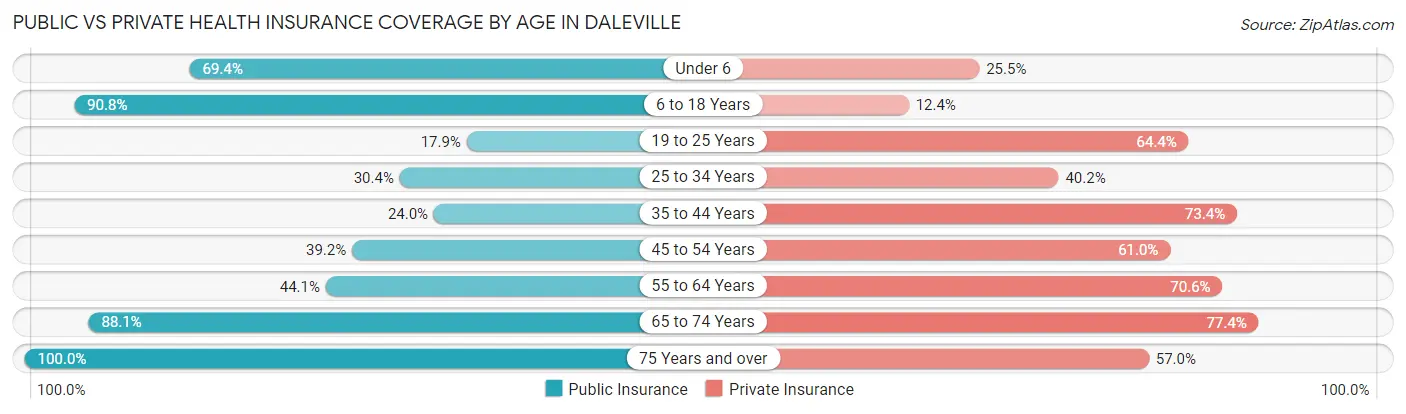
| Age Bracket | Public Insurance | Private Insurance |
| Under 6 | 204 (69.4%) | 75 (25.5%) |
| 6 to 18 Years | 563 (90.8%) | 77 (12.4%) |
| 19 to 25 Years | 68 (17.9%) | 244 (64.4%) |
| 25 to 34 Years | 222 (30.4%) | 294 (40.2%) |
| 35 to 44 Years | 128 (24.0%) | 391 (73.4%) |
| 45 to 54 Years | 231 (39.2%) | 359 (61.0%) |
| 55 to 64 Years | 344 (44.1%) | 551 (70.6%) |
| 65 to 74 Years | 483 (88.1%) | 424 (77.4%) |
| 75 Years and over | 258 (100.0%) | 147 (57.0%) |
| Total | 2,501 (52.8%) | 2,562 (54.1%) |
Disability Status by Sex by Age in Daleville
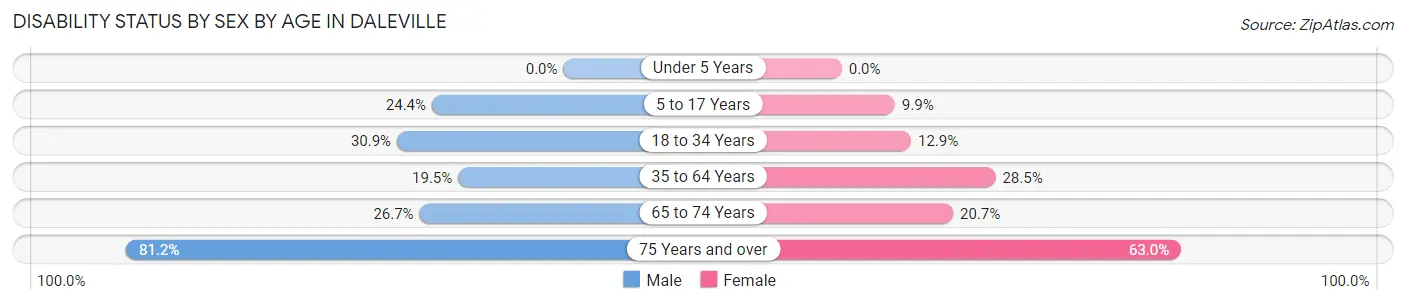
| Age Bracket | Male | Female |
| Under 5 Years | 0 (0.0%) | 0 (0.0%) |
| 5 to 17 Years | 72 (24.4%) | 28 (9.9%) |
| 18 to 34 Years | 194 (30.9%) | 71 (12.9%) |
| 35 to 64 Years | 145 (19.5%) | 331 (28.5%) |
| 65 to 74 Years | 74 (26.7%) | 56 (20.7%) |
| 75 Years and over | 56 (81.2%) | 119 (63.0%) |
Disability Class by Sex by Age in Daleville
Disability Class: Hearing Difficulty
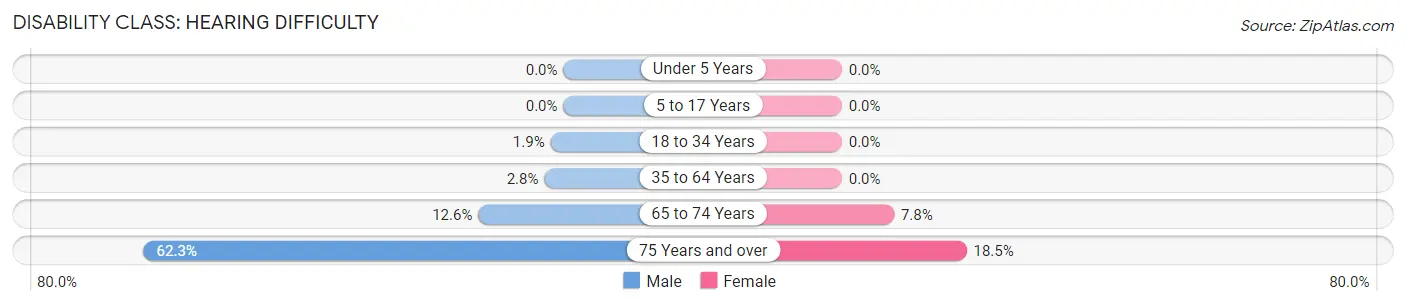
| Age Bracket | Male | Female |
| Under 5 Years | 0 (0.0%) | 0 (0.0%) |
| 5 to 17 Years | 0 (0.0%) | 0 (0.0%) |
| 18 to 34 Years | 12 (1.9%) | 0 (0.0%) |
| 35 to 64 Years | 21 (2.8%) | 0 (0.0%) |
| 65 to 74 Years | 35 (12.6%) | 21 (7.7%) |
| 75 Years and over | 43 (62.3%) | 35 (18.5%) |
Disability Class: Vision Difficulty
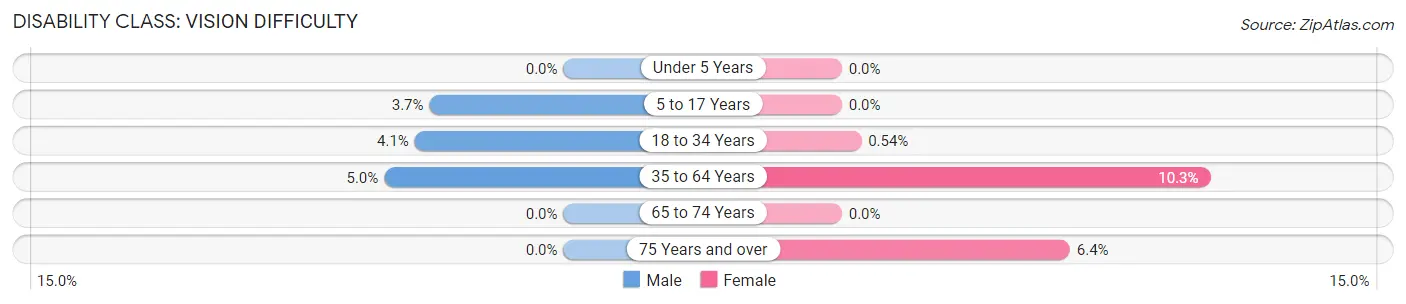
| Age Bracket | Male | Female |
| Under 5 Years | 0 (0.0%) | 0 (0.0%) |
| 5 to 17 Years | 11 (3.7%) | 0 (0.0%) |
| 18 to 34 Years | 26 (4.1%) | 3 (0.5%) |
| 35 to 64 Years | 37 (5.0%) | 119 (10.3%) |
| 65 to 74 Years | 0 (0.0%) | 0 (0.0%) |
| 75 Years and over | 0 (0.0%) | 12 (6.4%) |
Disability Class: Cognitive Difficulty
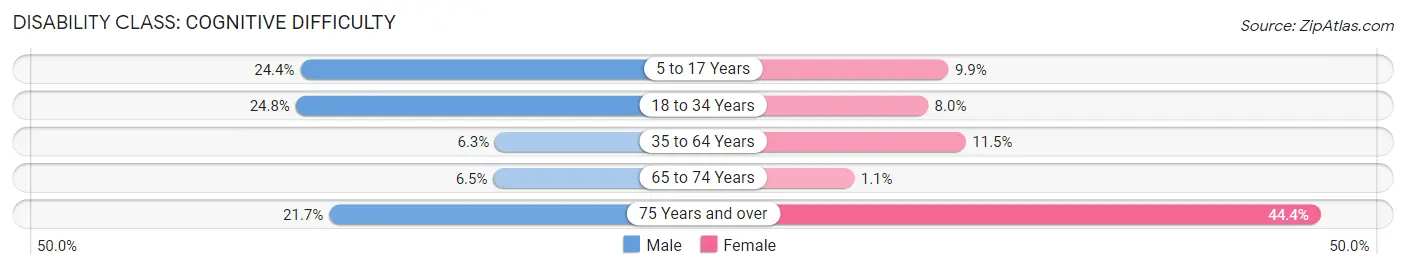
| Age Bracket | Male | Female |
| 5 to 17 Years | 72 (24.4%) | 28 (9.9%) |
| 18 to 34 Years | 156 (24.8%) | 44 (8.0%) |
| 35 to 64 Years | 47 (6.3%) | 133 (11.5%) |
| 65 to 74 Years | 18 (6.5%) | 3 (1.1%) |
| 75 Years and over | 15 (21.7%) | 84 (44.4%) |
Disability Class: Ambulatory Difficulty
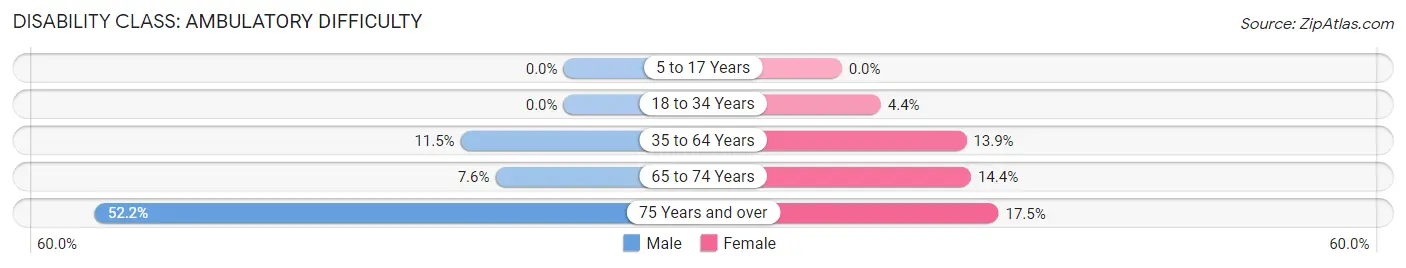
| Age Bracket | Male | Female |
| 5 to 17 Years | 0 (0.0%) | 0 (0.0%) |
| 18 to 34 Years | 0 (0.0%) | 24 (4.3%) |
| 35 to 64 Years | 85 (11.5%) | 161 (13.9%) |
| 65 to 74 Years | 21 (7.6%) | 39 (14.4%) |
| 75 Years and over | 36 (52.2%) | 33 (17.5%) |
Disability Class: Self-Care Difficulty
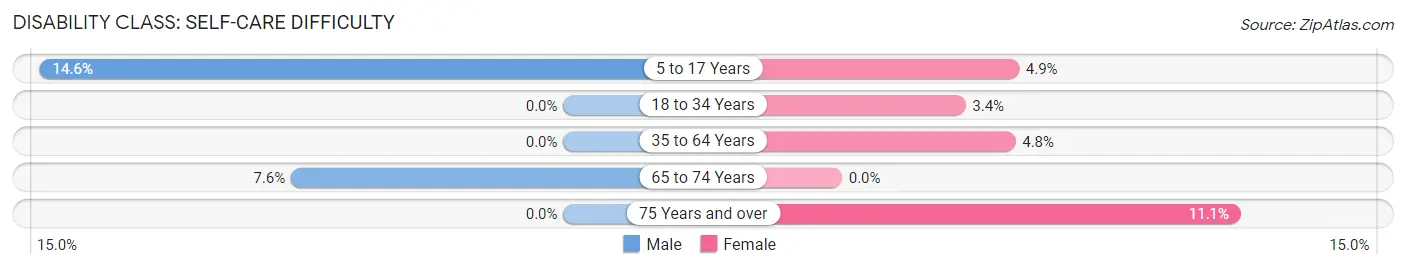
| Age Bracket | Male | Female |
| 5 to 17 Years | 43 (14.6%) | 14 (4.9%) |
| 18 to 34 Years | 0 (0.0%) | 19 (3.4%) |
| 35 to 64 Years | 0 (0.0%) | 56 (4.8%) |
| 65 to 74 Years | 21 (7.6%) | 0 (0.0%) |
| 75 Years and over | 0 (0.0%) | 21 (11.1%) |
Technology Access in Daleville
Computing Device Access in Daleville
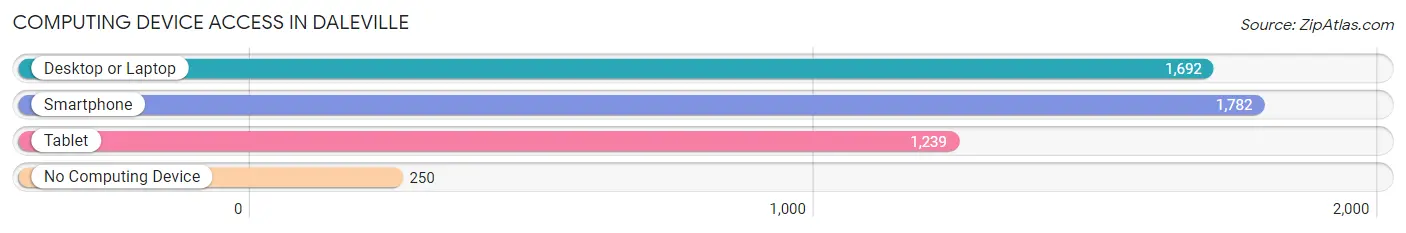
| Device Type | # Households | % Households |
| Desktop or Laptop | 1,692 | 74.3% |
| Smartphone | 1,782 | 78.3% |
| Tablet | 1,239 | 54.4% |
| No Computing Device | 250 | 11.0% |
| Total | 2,277 | 100.0% |
Internet Access in Daleville
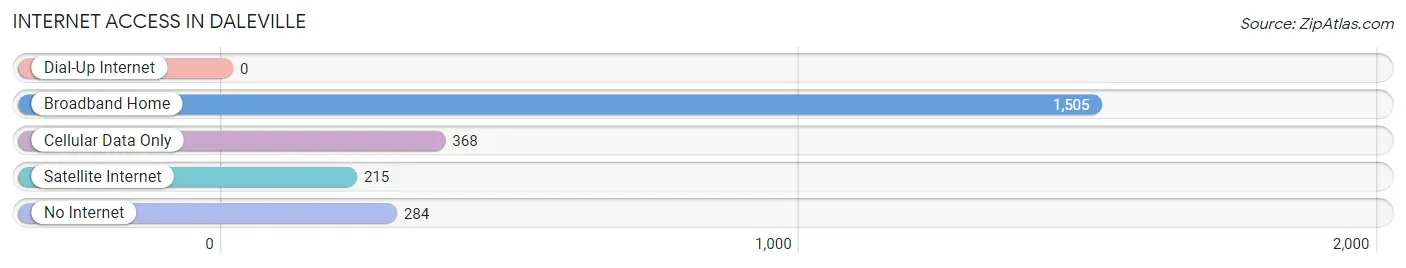
| Internet Type | # Households | % Households |
| Dial-Up Internet | 0 | 0.0% |
| Broadband Home | 1,505 | 66.1% |
| Cellular Data Only | 368 | 16.2% |
| Satellite Internet | 215 | 9.4% |
| No Internet | 284 | 12.5% |
| Total | 2,277 | 100.0% |
Daleville Summary
Daleville, Alabama is a small city located in the southeastern corner of the state, in Dale County. It is situated on the banks of the Choctawhatchee River, and is part of the Dothan metropolitan area. The city has a population of approximately 4,000 people, and is known for its rural charm and friendly atmosphere.
History
Daleville was founded in 1820 by settlers from Georgia and South Carolina. The city was named after General Sam Dale, a Revolutionary War hero who fought in the Battle of New Orleans. The city was incorporated in 1887, and the first mayor was elected in 1888.
In the early 1900s, Daleville was a thriving agricultural community, with cotton, corn, and peanuts being the main crops. The city also had a thriving timber industry, and the local sawmill was one of the largest in the state.
In the 1950s, Daleville began to experience a period of growth and development. The city was chosen as the site of the new Fort Rucker Army base, which brought an influx of military personnel and their families to the area. This growth continued into the 1960s and 1970s, and Daleville became a popular destination for retirees and vacationers.
Geography
Daleville is located in the southeastern corner of Alabama, in Dale County. It is situated on the banks of the Choctawhatchee River, and is part of the Dothan metropolitan area. The city has a total area of 8.3 square miles, all of which is land.
The city is located in a humid subtropical climate zone, with hot, humid summers and mild winters. The average annual temperature is around 70 degrees Fahrenheit, and the average annual precipitation is around 50 inches.
Economy
Daleville’s economy is largely based on the military presence at Fort Rucker. The base is the largest employer in the city, and provides jobs for thousands of people. Other major employers in the city include the local school system, the hospital, and various retail and service businesses.
The city also has a thriving tourism industry, with many visitors coming to the area to enjoy the natural beauty of the Choctawhatchee River and the surrounding countryside.
Demographics
As of the 2010 census, Daleville had a population of 4,039 people. The racial makeup of the city was 79.3% White, 16.2% African American, 0.4% Native American, 0.7% Asian, 0.1% Pacific Islander, and 3.3% from other races. Hispanic or Latino of any race were 2.2% of the population.
The median income for a household in the city was $37,917, and the median income for a family was $45,938. The per capita income for the city was $19,945. About 15.2% of families and 18.2% of the population were below the poverty line, including 25.2% of those under age 18 and 11.2% of those age 65 or over.
Common Questions
What is Per Capita Income in Daleville?
Per Capita income in Daleville is $29,185.
What is the Median Family Income in Daleville?
Median Family Income in Daleville is $54,583.
What is the Median Household income in Daleville?
Median Household Income in Daleville is $42,969.
What is Income or Wage Gap in Daleville?
Income or Wage Gap in Daleville is 31.5%.
Women in Daleville earn 68.5 cents for every dollar earned by a man.
What is Inequality or Gini Index in Daleville?
Inequality or Gini Index in Daleville is 0.44.
What is the Total Population of Daleville?
Total Population of Daleville is 4,901.
What is the Total Male Population of Daleville?
Total Male Population of Daleville is 2,149.
What is the Total Female Population of Daleville?
Total Female Population of Daleville is 2,752.
What is the Ratio of Males per 100 Females in Daleville?
There are 78.09 Males per 100 Females in Daleville.
What is the Ratio of Females per 100 Males in Daleville?
There are 128.06 Females per 100 Males in Daleville.
What is the Median Population Age in Daleville?
Median Population Age in Daleville is 40.6 Years.
What is the Average Family Size in Daleville
Average Family Size in Daleville is 2.8 People.
What is the Average Household Size in Daleville
Average Household Size in Daleville is 2.1 People.
How Large is the Labor Force in Daleville?
There are 2,533 People in the Labor Forcein in Daleville.
What is the Percentage of People in the Labor Force in Daleville?
60.2% of People are in the Labor Force in Daleville.
What is the Unemployment Rate in Daleville?
Unemployment Rate in Daleville is 6.8%.