Cottondale, AL Map & Demographics
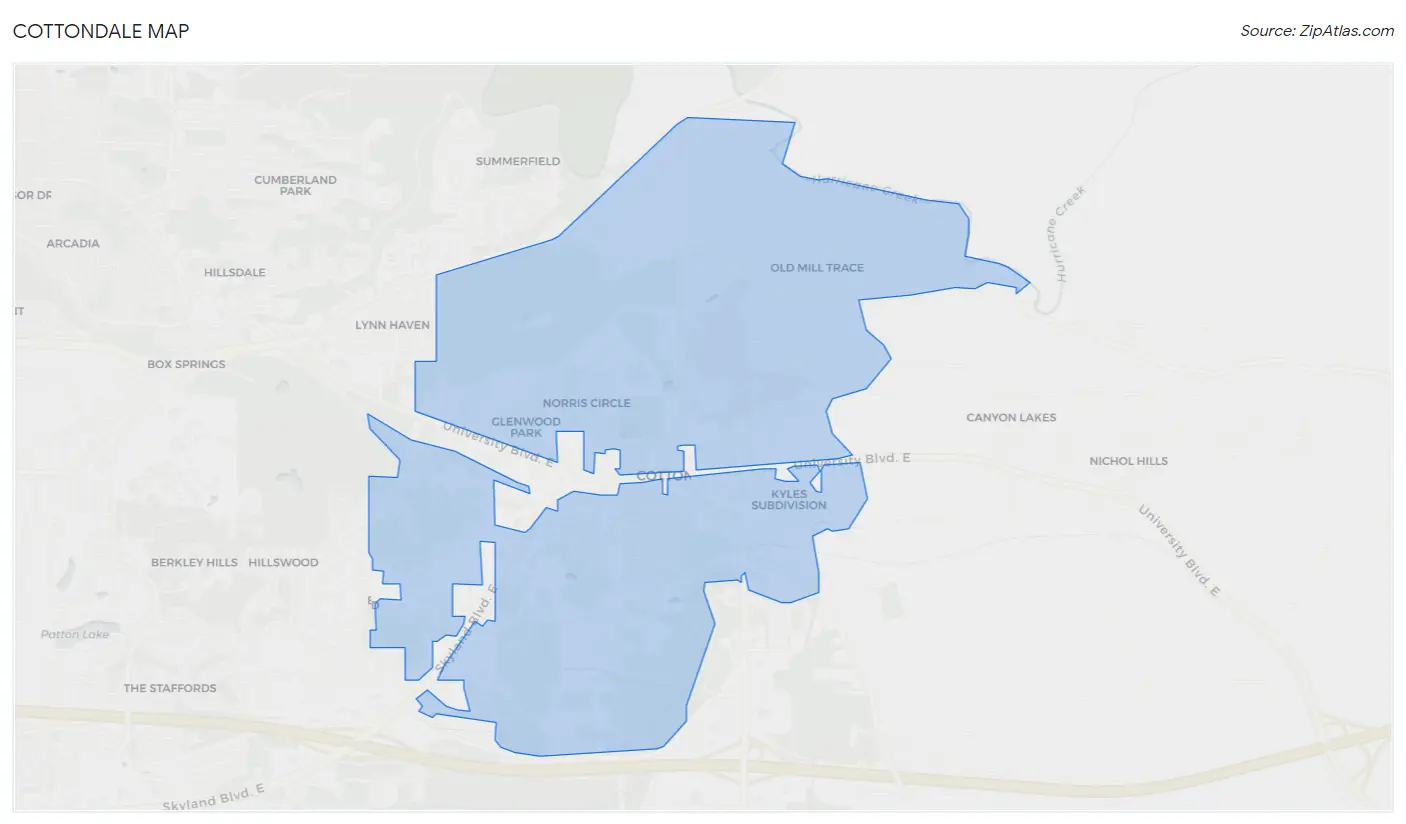
Cottondale Map
Cottondale Overview
$28,402
PER CAPITA INCOME
$76,250
AVG FAMILY INCOME
$54,688
AVG HOUSEHOLD INCOME
37.1%
WAGE / INCOME GAP [ % ]
62.9¢/ $1
WAGE / INCOME GAP [ $ ]
0.37
INEQUALITY / GINI INDEX
3,211
TOTAL POPULATION
1,664
MALE POPULATION
1,547
FEMALE POPULATION
107.56
MALES / 100 FEMALES
92.97
FEMALES / 100 MALES
43.5
MEDIAN AGE
2.6
AVG FAMILY SIZE
2.4
AVG HOUSEHOLD SIZE
1,495
LABOR FORCE [ PEOPLE ]
53.2%
PERCENT IN LABOR FORCE
5.3%
UNEMPLOYMENT RATE
Cottondale Zip Codes
Cottondale Area Codes
Income in Cottondale
Income Overview in Cottondale
Per Capita Income in Cottondale is $28,402, while median incomes of families and households are $76,250 and $54,688 respectively.
| Characteristic | Number | Measure |
| Per Capita Income | 3,211 | $28,402 |
| Median Family Income | 907 | $76,250 |
| Mean Family Income | 907 | $72,519 |
| Median Household Income | 1,330 | $54,688 |
| Mean Household Income | 1,330 | $65,788 |
| Income Deficit | 907 | $0 |
| Wage / Income Gap (%) | 3,211 | 37.07% |
| Wage / Income Gap ($) | 3,211 | 62.93¢ per $1 |
| Gini / Inequality Index | 3,211 | 0.37 |
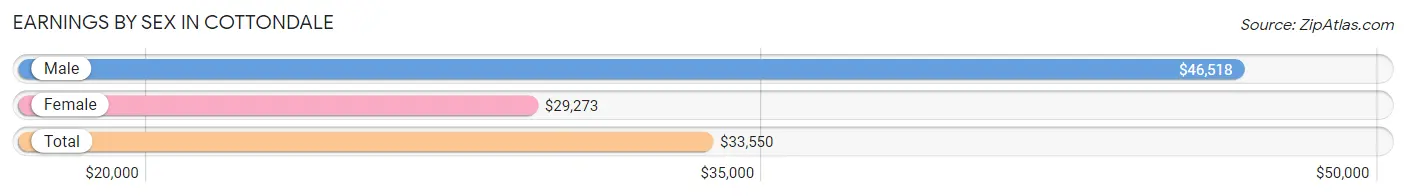
Earnings by Sex in Cottondale
Average Earnings in Cottondale are $33,550, $46,518 for men and $29,273 for women, a difference of 37.1%.
| Sex | Number | Average Earnings |
| Male | 788 (47.2%) | $46,518 |
| Female | 882 (52.8%) | $29,273 |
| Total | 1,670 (100.0%) | $33,550 |
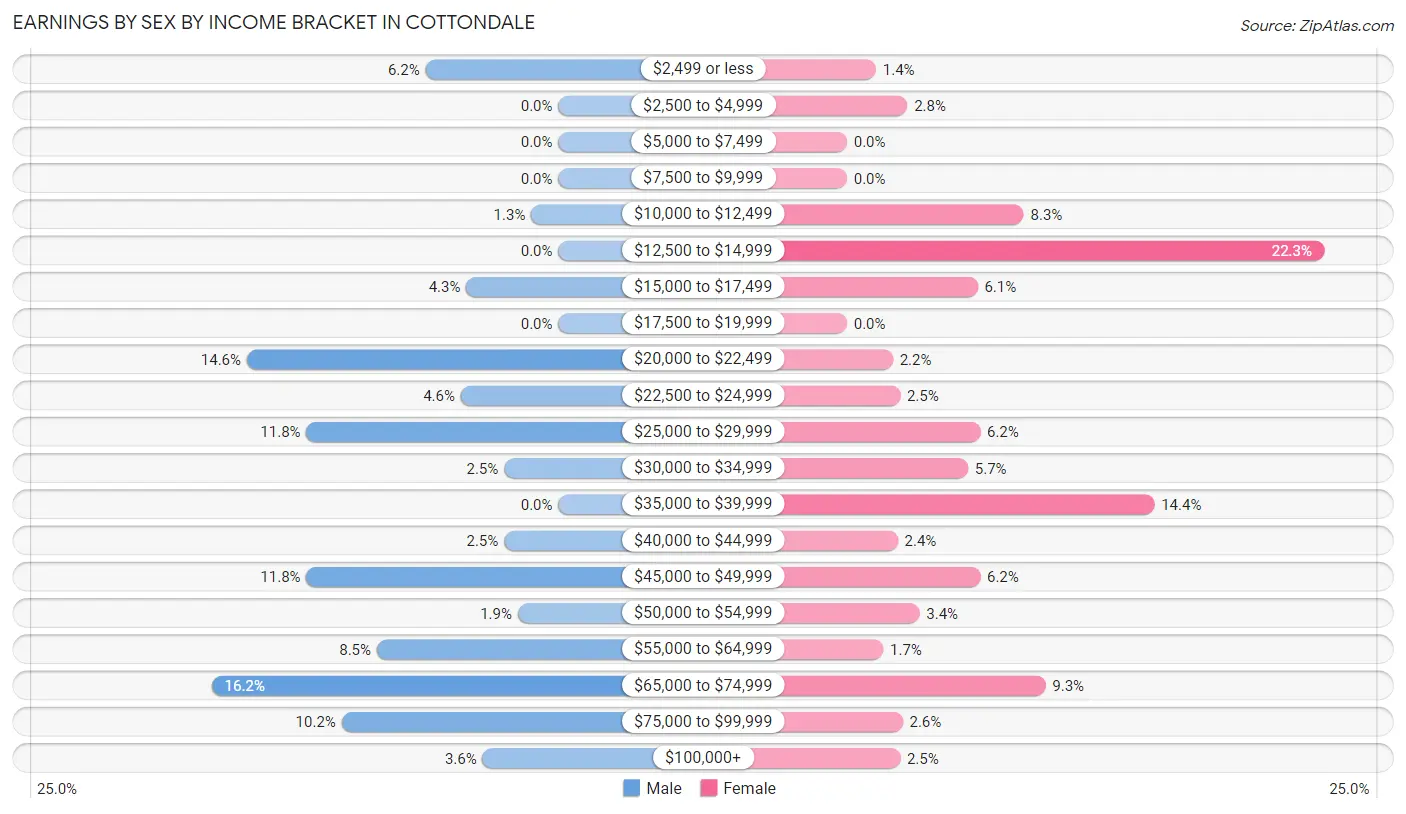
Earnings by Sex by Income Bracket in Cottondale
The most common earnings brackets in Cottondale are $65,000 to $74,999 for men (128 | 16.2%) and $12,500 to $14,999 for women (197 | 22.3%).
| Income | Male | Female |
| $2,499 or less | 49 (6.2%) | 12 (1.4%) |
| $2,500 to $4,999 | 0 (0.0%) | 25 (2.8%) |
| $5,000 to $7,499 | 0 (0.0%) | 0 (0.0%) |
| $7,500 to $9,999 | 0 (0.0%) | 0 (0.0%) |
| $10,000 to $12,499 | 10 (1.3%) | 73 (8.3%) |
| $12,500 to $14,999 | 0 (0.0%) | 197 (22.3%) |
| $15,000 to $17,499 | 34 (4.3%) | 54 (6.1%) |
| $17,500 to $19,999 | 0 (0.0%) | 0 (0.0%) |
| $20,000 to $22,499 | 115 (14.6%) | 19 (2.1%) |
| $22,500 to $24,999 | 36 (4.6%) | 22 (2.5%) |
| $25,000 to $29,999 | 93 (11.8%) | 55 (6.2%) |
| $30,000 to $34,999 | 20 (2.5%) | 50 (5.7%) |
| $35,000 to $39,999 | 0 (0.0%) | 127 (14.4%) |
| $40,000 to $44,999 | 20 (2.5%) | 21 (2.4%) |
| $45,000 to $49,999 | 93 (11.8%) | 55 (6.2%) |
| $50,000 to $54,999 | 15 (1.9%) | 30 (3.4%) |
| $55,000 to $64,999 | 67 (8.5%) | 15 (1.7%) |
| $65,000 to $74,999 | 128 (16.2%) | 82 (9.3%) |
| $75,000 to $99,999 | 80 (10.2%) | 23 (2.6%) |
| $100,000+ | 28 (3.5%) | 22 (2.5%) |
| Total | 788 (100.0%) | 882 (100.0%) |
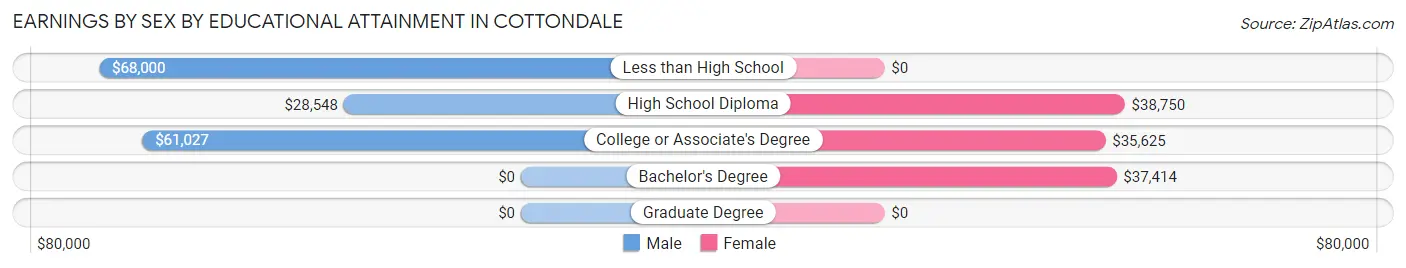
Earnings by Sex by Educational Attainment in Cottondale
Average earnings in Cottondale are $45,759 for men and $34,025 for women, a difference of 25.6%. Men with an educational attainment of less than high school enjoy the highest average annual earnings of $68,000, while those with high school diploma education earn the least with $28,548. Women with an educational attainment of high school diploma earn the most with the average annual earnings of $38,750, while those with college or associate's degree education have the smallest earnings of $35,625.
| Educational Attainment | Male Income | Female Income |
| Less than High School | $68,000 | $0 |
| High School Diploma | $28,548 | $38,750 |
| College or Associate's Degree | $61,027 | $35,625 |
| Bachelor's Degree | - | - |
| Graduate Degree | - | - |
| Total | $45,759 | $34,025 |
Family Income in Cottondale
Family Income Brackets in Cottondale
According to the Cottondale family income data, there are 241 families falling into the $100,000 to $149,999 income range, which is the most common income bracket and makes up 26.6% of all families. Conversely, the $10,000 to $14,999 income bracket is the least frequent group with only 4 families (0.4%) belonging to this category.
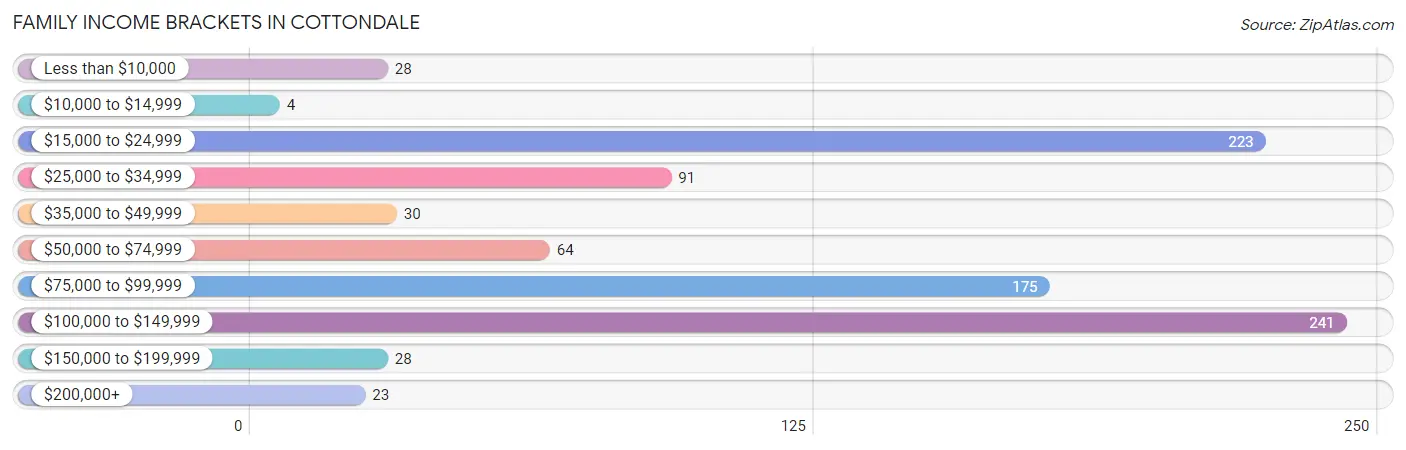
| Income Bracket | # Families | % Families |
| Less than $10,000 | 28 | 3.1% |
| $10,000 to $14,999 | 4 | 0.4% |
| $15,000 to $24,999 | 223 | 24.6% |
| $25,000 to $34,999 | 91 | 10.0% |
| $35,000 to $49,999 | 30 | 3.3% |
| $50,000 to $74,999 | 64 | 7.1% |
| $75,000 to $99,999 | 175 | 19.3% |
| $100,000 to $149,999 | 241 | 26.6% |
| $150,000 to $199,999 | 28 | 3.1% |
| $200,000+ | 23 | 2.5% |
Family Income by Famaliy Size in Cottondale
4-person families (87 | 9.6%) account for the highest median family income in Cottondale with $94,950 per family, while 2-person families (450 | 49.6%) have the highest median income of $39,312 per family member.
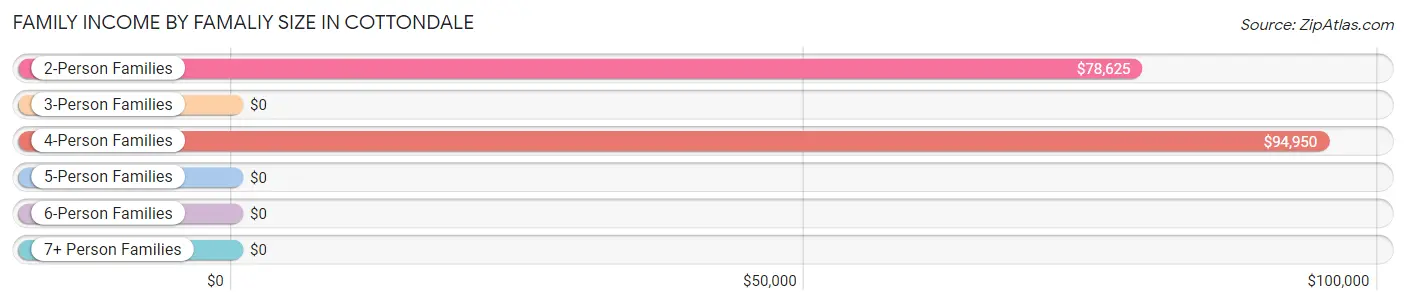
| Income Bracket | # Families | Median Income |
| 2-Person Families | 450 (49.6%) | $78,625 |
| 3-Person Families | 331 (36.5%) | $0 |
| 4-Person Families | 87 (9.6%) | $94,950 |
| 5-Person Families | 35 (3.9%) | $0 |
| 6-Person Families | 4 (0.4%) | $0 |
| 7+ Person Families | 0 (0.0%) | $0 |
| Total | 907 (100.0%) | $76,250 |
Family Income by Number of Earners in Cottondale
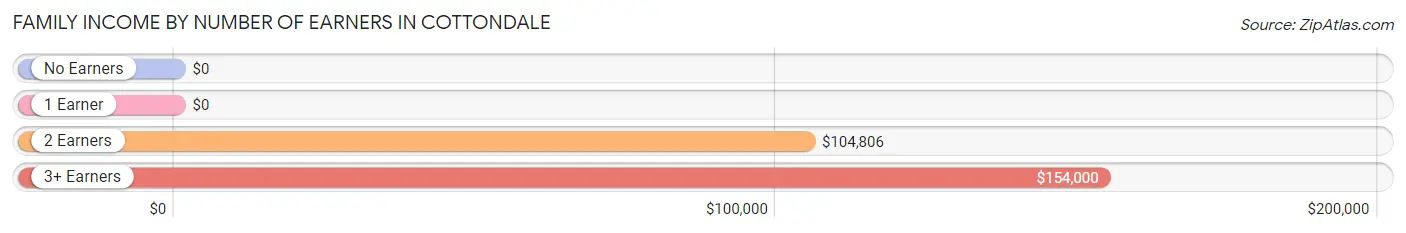
| Number of Earners | # Families | Median Income |
| No Earners | 69 (7.6%) | $0 |
| 1 Earner | 557 (61.4%) | $0 |
| 2 Earners | 223 (24.6%) | $104,806 |
| 3+ Earners | 58 (6.4%) | $154,000 |
| Total | 907 (100.0%) | $76,250 |
Household Income in Cottondale
Household Income Brackets in Cottondale
With 332 households falling in the category, the $25,000 to $34,999 income range is the most frequent in Cottondale, accounting for 25.0% of all households. In contrast, only 23 households (1.7%) fall into the $200,000+ income bracket, making it the least populous group.
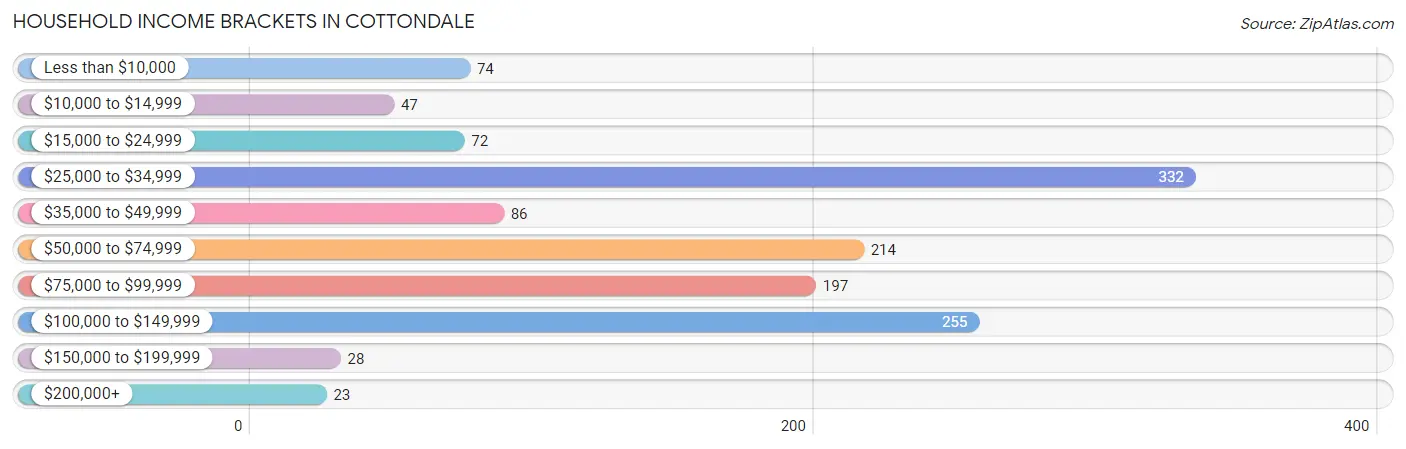
| Income Bracket | # Households | % Households |
| Less than $10,000 | 74 | 5.6% |
| $10,000 to $14,999 | 47 | 3.5% |
| $15,000 to $24,999 | 72 | 5.4% |
| $25,000 to $34,999 | 332 | 25.0% |
| $35,000 to $49,999 | 86 | 6.5% |
| $50,000 to $74,999 | 214 | 16.1% |
| $75,000 to $99,999 | 197 | 14.8% |
| $100,000 to $149,999 | 255 | 19.2% |
| $150,000 to $199,999 | 28 | 2.1% |
| $200,000+ | 23 | 1.7% |
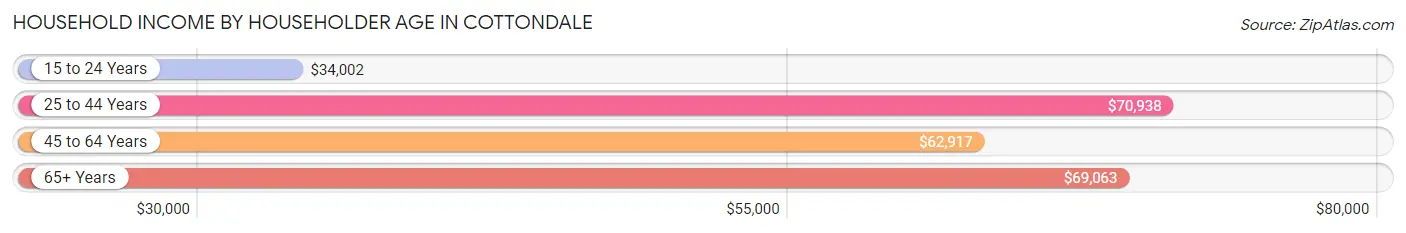
Household Income by Householder Age in Cottondale
The median household income in Cottondale is $54,688, with the highest median household income of $70,938 found in the 25 to 44 years age bracket for the primary householder. A total of 349 households (26.2%) fall into this category. Meanwhile, the 15 to 24 years age bracket for the primary householder has the lowest median household income of $34,002, with 244 households (18.3%) in this group.
| Income Bracket | # Households | Median Income |
| 15 to 24 Years | 244 (18.3%) | $34,002 |
| 25 to 44 Years | 349 (26.2%) | $70,938 |
| 45 to 64 Years | 499 (37.5%) | $62,917 |
| 65+ Years | 238 (17.9%) | $69,063 |
| Total | 1,330 (100.0%) | $54,688 |
Poverty in Cottondale
Income Below Poverty by Sex and Age in Cottondale
With 30.6% poverty level for males and 20.8% for females among the residents of Cottondale, 5 year old males and 18 to 24 year old females are the most vulnerable to poverty, with 36 males (100.0%) and 69 females (89.6%) in their respective age groups living below the poverty level.
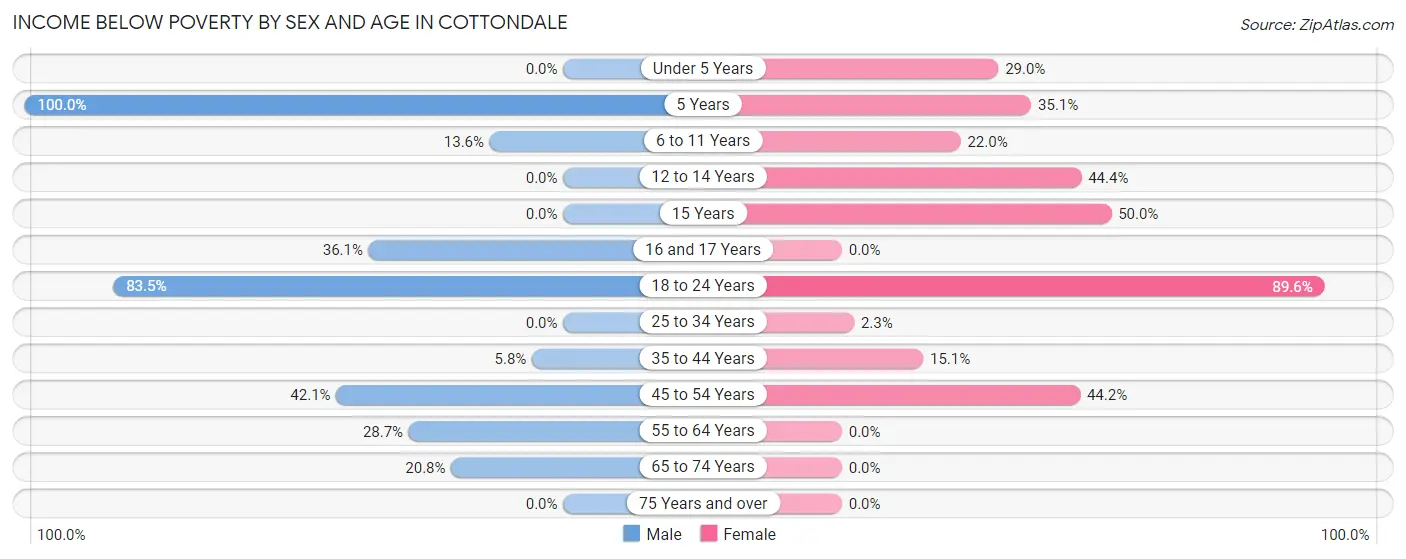
| Age Bracket | Male | Female |
| Under 5 Years | 0 (0.0%) | 9 (29.0%) |
| 5 Years | 36 (100.0%) | 13 (35.1%) |
| 6 to 11 Years | 12 (13.6%) | 13 (22.0%) |
| 12 to 14 Years | 0 (0.0%) | 12 (44.4%) |
| 15 Years | 0 (0.0%) | 11 (50.0%) |
| 16 and 17 Years | 13 (36.1%) | 0 (0.0%) |
| 18 to 24 Years | 203 (83.5%) | 69 (89.6%) |
| 25 to 34 Years | 0 (0.0%) | 4 (2.3%) |
| 35 to 44 Years | 10 (5.8%) | 38 (15.1%) |
| 45 to 54 Years | 115 (42.1%) | 149 (44.2%) |
| 55 to 64 Years | 88 (28.7%) | 0 (0.0%) |
| 65 to 74 Years | 21 (20.8%) | 0 (0.0%) |
| 75 Years and over | 0 (0.0%) | 0 (0.0%) |
| Total | 498 (30.6%) | 318 (20.8%) |
Income Above Poverty by Sex and Age in Cottondale
According to the poverty statistics in Cottondale, males aged 12 to 14 years and females aged 16 and 17 years are the age groups that are most secure financially, with 100.0% of males and 100.0% of females in these age groups living above the poverty line.
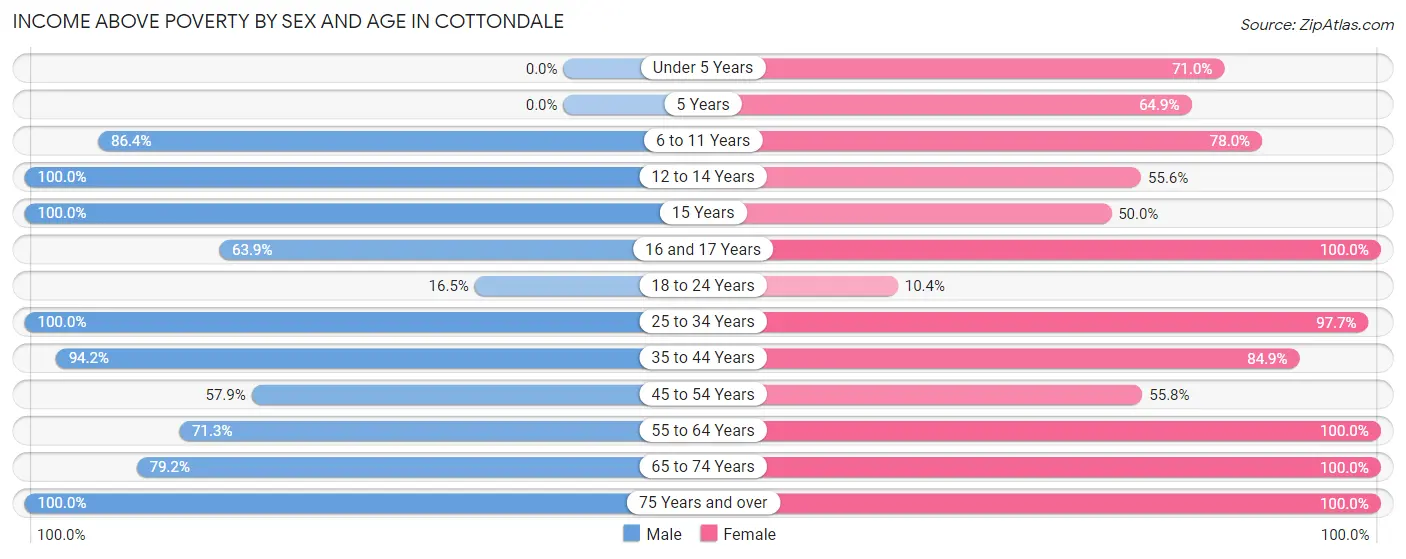
| Age Bracket | Male | Female |
| Under 5 Years | 0 (0.0%) | 22 (71.0%) |
| 5 Years | 0 (0.0%) | 24 (64.9%) |
| 6 to 11 Years | 76 (86.4%) | 46 (78.0%) |
| 12 to 14 Years | 15 (100.0%) | 15 (55.6%) |
| 15 Years | 26 (100.0%) | 11 (50.0%) |
| 16 and 17 Years | 23 (63.9%) | 61 (100.0%) |
| 18 to 24 Years | 40 (16.5%) | 8 (10.4%) |
| 25 to 34 Years | 243 (100.0%) | 173 (97.7%) |
| 35 to 44 Years | 163 (94.2%) | 214 (84.9%) |
| 45 to 54 Years | 158 (57.9%) | 188 (55.8%) |
| 55 to 64 Years | 219 (71.3%) | 278 (100.0%) |
| 65 to 74 Years | 80 (79.2%) | 91 (100.0%) |
| 75 Years and over | 84 (100.0%) | 77 (100.0%) |
| Total | 1,127 (69.4%) | 1,208 (79.2%) |
Income Below Poverty Among Married-Couple Families in Cottondale
The poverty statistics for married-couple families in Cottondale show that 28.6% or 203 of the total 709 families live below the poverty line. Families with 1 or 2 children have the highest poverty rate of 68.3%, comprising of 203 families. On the other hand, families with no children have the lowest poverty rate of 0.0%, which includes 0 families.
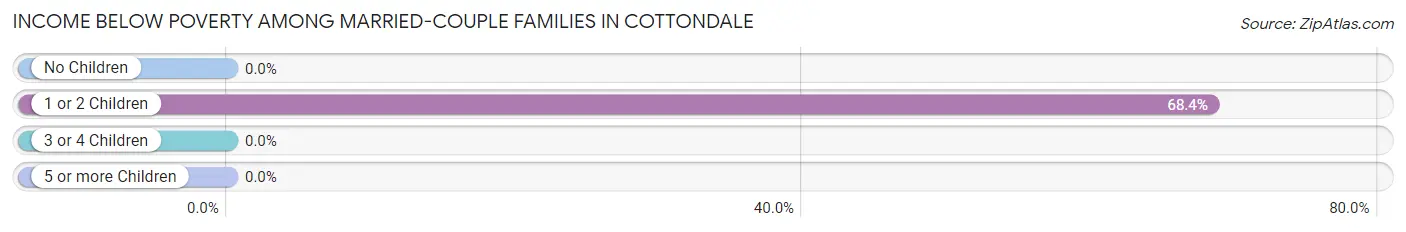
| Children | Above Poverty | Below Poverty |
| No Children | 397 (100.0%) | 0 (0.0%) |
| 1 or 2 Children | 94 (31.7%) | 203 (68.3%) |
| 3 or 4 Children | 15 (100.0%) | 0 (0.0%) |
| 5 or more Children | 0 (0.0%) | 0 (0.0%) |
| Total | 506 (71.4%) | 203 (28.6%) |
Income Below Poverty Among Single-Parent Households in Cottondale
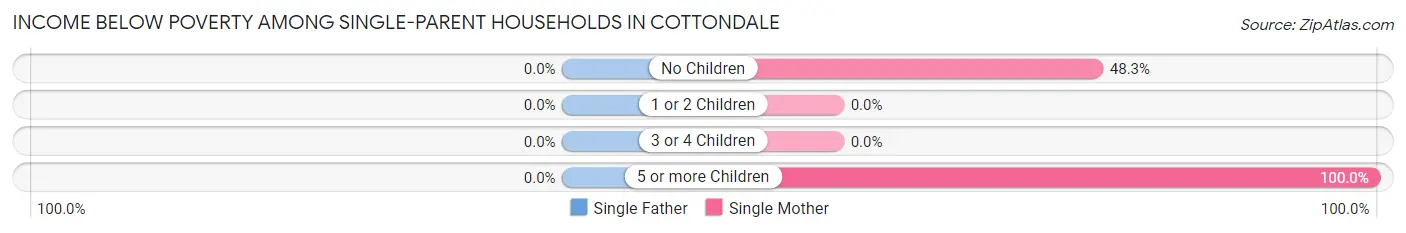
| Children | Single Father | Single Mother |
| No Children | 0 (0.0%) | 28 (48.3%) |
| 1 or 2 Children | 0 (0.0%) | 0 (0.0%) |
| 3 or 4 Children | 0 (0.0%) | 0 (0.0%) |
| 5 or more Children | 0 (0.0%) | 4 (100.0%) |
| Total | 0 (0.0%) | 32 (19.6%) |
Income Below Poverty Among Married-Couple vs Single-Parent Households in Cottondale
The poverty data for Cottondale shows that 203 of the married-couple family households (28.6%) and 32 of the single-parent households (16.2%) are living below the poverty level. Within the married-couple family households, those with 1 or 2 children have the highest poverty rate, with 203 households (68.3%) falling below the poverty line. Among the single-parent households, those with 5 or more children have the highest poverty rate, with 4 household (100.0%) living below poverty.
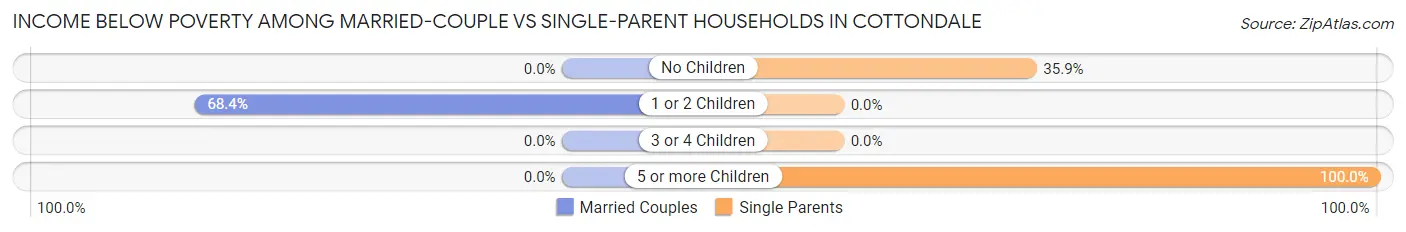
| Children | Married-Couple Families | Single-Parent Households |
| No Children | 0 (0.0%) | 28 (35.9%) |
| 1 or 2 Children | 203 (68.3%) | 0 (0.0%) |
| 3 or 4 Children | 0 (0.0%) | 0 (0.0%) |
| 5 or more Children | 0 (0.0%) | 4 (100.0%) |
| Total | 203 (28.6%) | 32 (16.2%) |
Race in Cottondale
The most populous races in Cottondale are Black / African American (1,542 | 48.0%), White / Caucasian (1,540 | 48.0%), and Hispanic or Latino (146 | 4.5%).
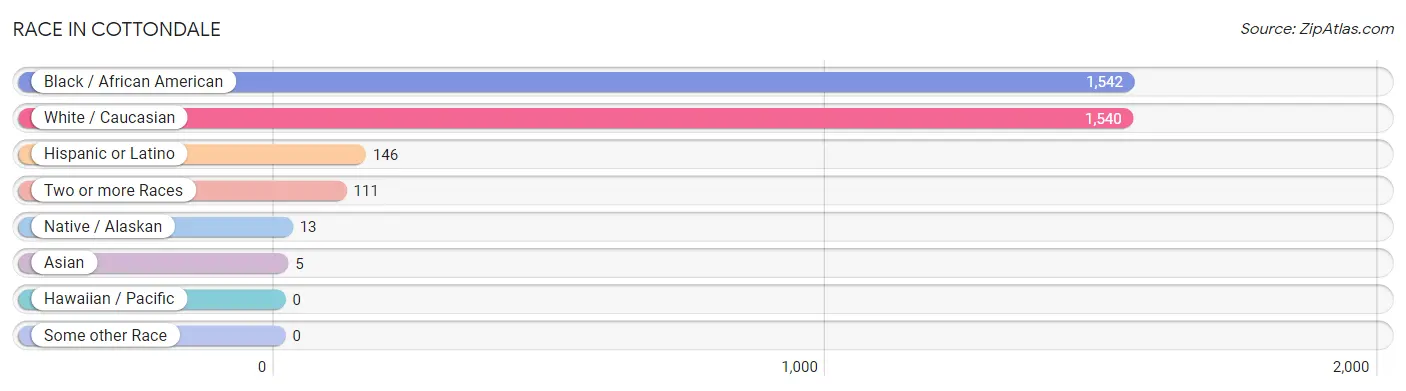
| Race | # Population | % Population |
| Asian | 5 | 0.2% |
| Black / African American | 1,542 | 48.0% |
| Hawaiian / Pacific | 0 | 0.0% |
| Hispanic or Latino | 146 | 4.5% |
| Native / Alaskan | 13 | 0.4% |
| White / Caucasian | 1,540 | 48.0% |
| Two or more Races | 111 | 3.5% |
| Some other Race | 0 | 0.0% |
| Total | 3,211 | 100.0% |
Ancestry in Cottondale
The most populous ancestries reported in Cottondale are American (561 | 17.5%), English (296 | 9.2%), Irish (210 | 6.5%), German (170 | 5.3%), and Mexican (69 | 2.1%), together accounting for 40.7% of all Cottondale residents.
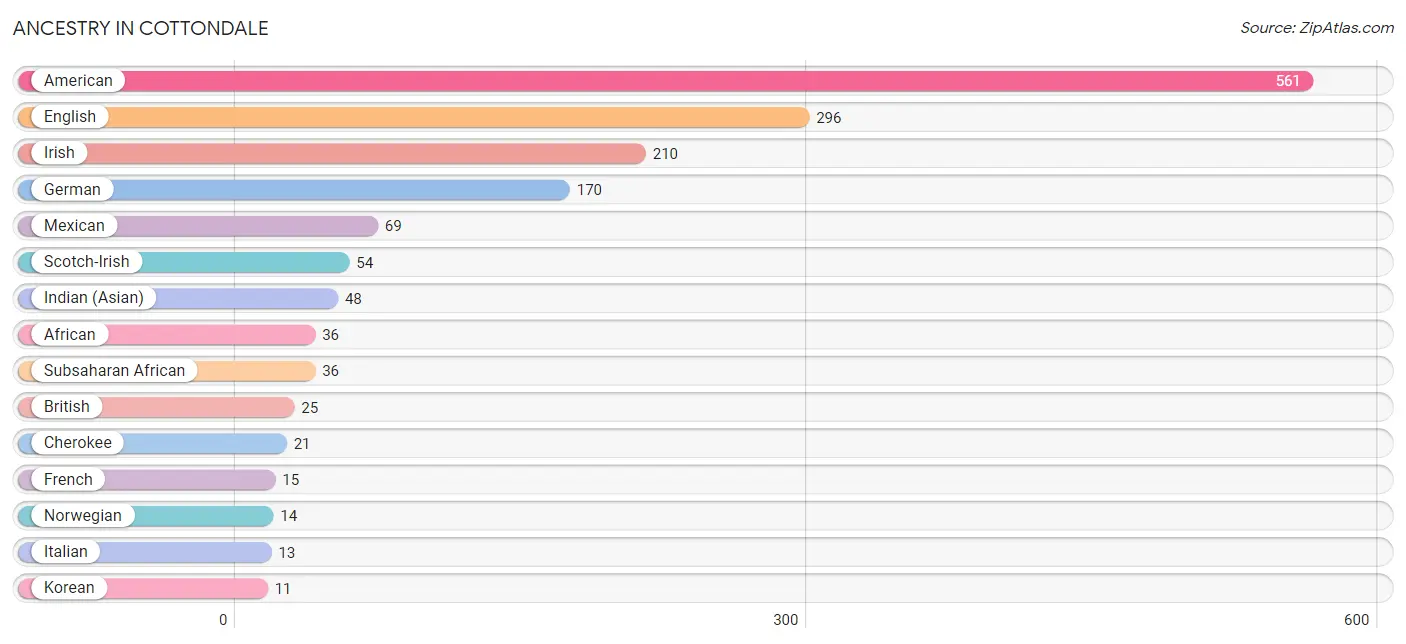
| Ancestry | # Population | % Population |
| African | 36 | 1.1% |
| American | 561 | 17.5% |
| Belgian | 7 | 0.2% |
| British | 25 | 0.8% |
| Cherokee | 21 | 0.6% |
| English | 296 | 9.2% |
| French | 15 | 0.5% |
| German | 170 | 5.3% |
| Indian (Asian) | 48 | 1.5% |
| Irish | 210 | 6.5% |
| Italian | 13 | 0.4% |
| Korean | 11 | 0.3% |
| Mexican | 69 | 2.1% |
| Norwegian | 14 | 0.4% |
| Scotch-Irish | 54 | 1.7% |
| Subsaharan African | 36 | 1.1% | View All 16 Rows |
Immigrants in Cottondale
The most numerous immigrant groups reported in Cottondale came from Central America (53 | 1.7%), Latin America (53 | 1.7%), Mexico (53 | 1.7%), Belgium (7 | 0.2%), and Europe (7 | 0.2%), together accounting for 5.4% of all Cottondale residents.
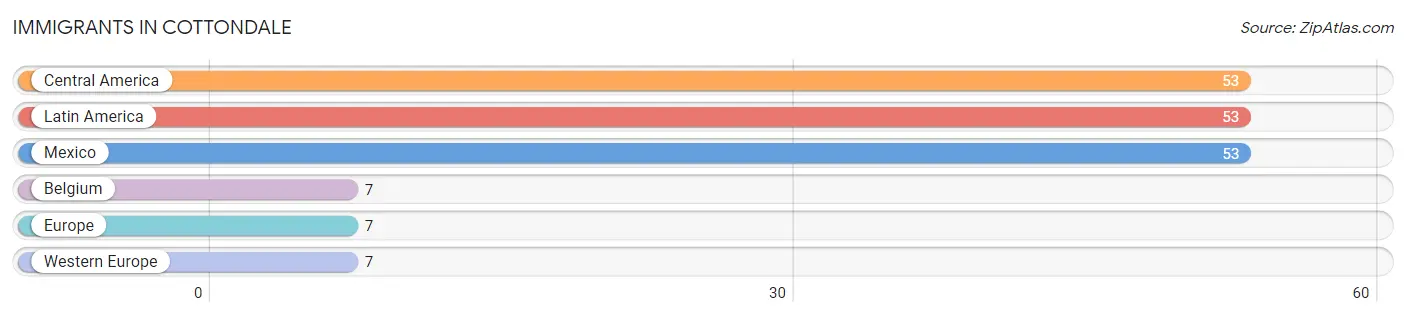
| Immigration Origin | # Population | % Population |
| Belgium | 7 | 0.2% |
| Central America | 53 | 1.7% |
| Europe | 7 | 0.2% |
| Latin America | 53 | 1.7% |
| Mexico | 53 | 1.7% |
| Western Europe | 7 | 0.2% | View All 6 Rows |
Sex and Age in Cottondale
Sex and Age in Cottondale
The most populous age groups in Cottondale are 50 to 54 Years (258 | 15.5%) for men and 50 to 54 Years (275 | 17.8%) for women.
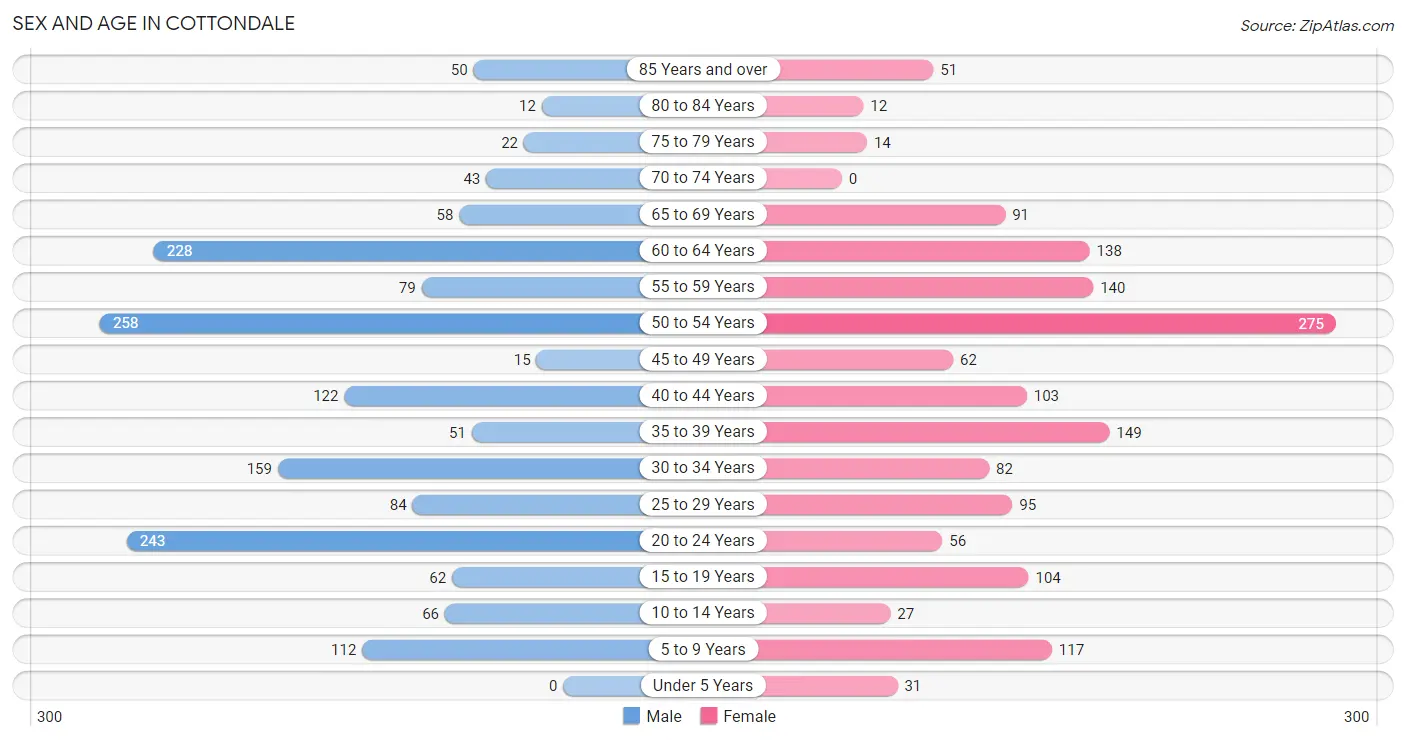
| Age Bracket | Male | Female |
| Under 5 Years | 0 (0.0%) | 31 (2.0%) |
| 5 to 9 Years | 112 (6.7%) | 117 (7.6%) |
| 10 to 14 Years | 66 (4.0%) | 27 (1.8%) |
| 15 to 19 Years | 62 (3.7%) | 104 (6.7%) |
| 20 to 24 Years | 243 (14.6%) | 56 (3.6%) |
| 25 to 29 Years | 84 (5.1%) | 95 (6.1%) |
| 30 to 34 Years | 159 (9.6%) | 82 (5.3%) |
| 35 to 39 Years | 51 (3.1%) | 149 (9.6%) |
| 40 to 44 Years | 122 (7.3%) | 103 (6.7%) |
| 45 to 49 Years | 15 (0.9%) | 62 (4.0%) |
| 50 to 54 Years | 258 (15.5%) | 275 (17.8%) |
| 55 to 59 Years | 79 (4.8%) | 140 (9.0%) |
| 60 to 64 Years | 228 (13.7%) | 138 (8.9%) |
| 65 to 69 Years | 58 (3.5%) | 91 (5.9%) |
| 70 to 74 Years | 43 (2.6%) | 0 (0.0%) |
| 75 to 79 Years | 22 (1.3%) | 14 (0.9%) |
| 80 to 84 Years | 12 (0.7%) | 12 (0.8%) |
| 85 Years and over | 50 (3.0%) | 51 (3.3%) |
| Total | 1,664 (100.0%) | 1,547 (100.0%) |
Families and Households in Cottondale
Median Family Size in Cottondale
The median family size in Cottondale is 2.60 persons per family, with single male/father families (35 | 3.9%) accounting for the largest median family size of 3.31 persons per family. On the other hand, married-couple families (709 | 78.2%) represent the smallest median family size with 2.42 persons per family.
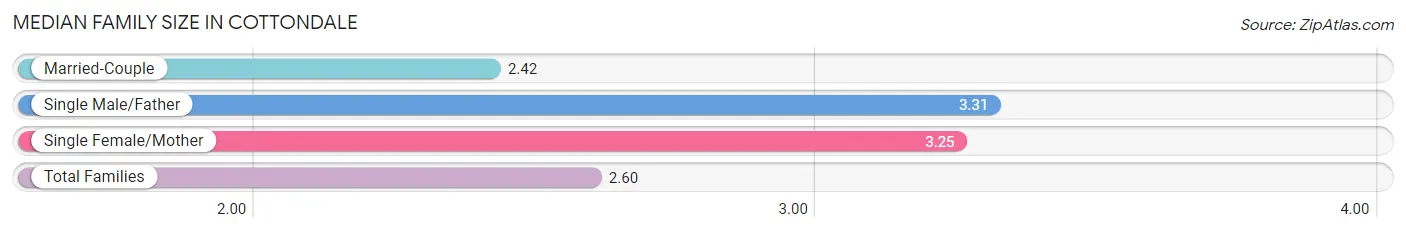
| Family Type | # Families | Family Size |
| Married-Couple | 709 (78.2%) | 2.42 |
| Single Male/Father | 35 (3.9%) | 3.31 |
| Single Female/Mother | 163 (18.0%) | 3.25 |
| Total Families | 907 (100.0%) | 2.60 |
Median Household Size in Cottondale
The median household size in Cottondale is 2.41 persons per household, with single male/father households (35 | 2.6%) accounting for the largest median household size of 3.74 persons per household. non-family households (423 | 31.8%) represent the smallest median household size with 1.43 persons per household.
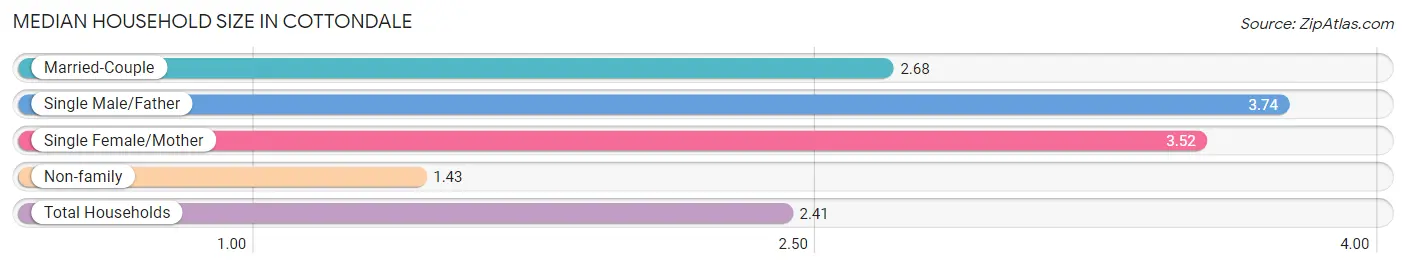
| Household Type | # Households | Household Size |
| Married-Couple | 709 (53.3%) | 2.68 |
| Single Male/Father | 35 (2.6%) | 3.74 |
| Single Female/Mother | 163 (12.3%) | 3.52 |
| Non-family | 423 (31.8%) | 1.43 |
| Total Households | 1,330 (100.0%) | 2.41 |
Household Size by Marriage Status in Cottondale
Out of a total of 1,330 households in Cottondale, 907 (68.2%) are family households, while 423 (31.8%) are nonfamily households. The most numerous type of family households are 2-person households, comprising 392, and the most common type of nonfamily households are 1-person households, comprising 281.
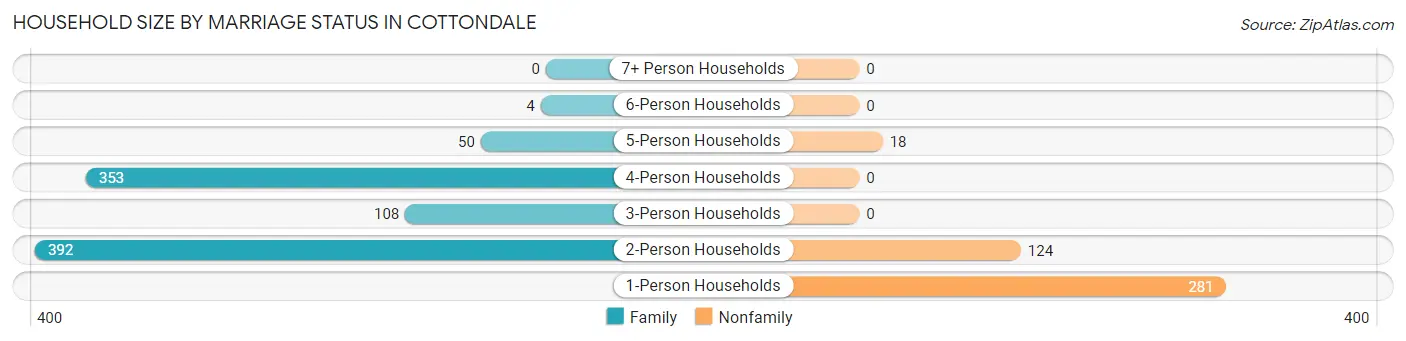
| Household Size | Family Households | Nonfamily Households |
| 1-Person Households | - | 281 (21.1%) |
| 2-Person Households | 392 (29.5%) | 124 (9.3%) |
| 3-Person Households | 108 (8.1%) | 0 (0.0%) |
| 4-Person Households | 353 (26.5%) | 0 (0.0%) |
| 5-Person Households | 50 (3.8%) | 18 (1.3%) |
| 6-Person Households | 4 (0.3%) | 0 (0.0%) |
| 7+ Person Households | 0 (0.0%) | 0 (0.0%) |
| Total | 907 (68.2%) | 423 (31.8%) |
Female Fertility in Cottondale
Fertility by Age in Cottondale
Average fertility rate in Cottondale is 5.0 births per 1,000 women. Women in the age bracket of 20 to 34 years have the highest fertility rate with 17.0 births per 1,000 women. Women in the age bracket of 20 to 34 years acount for 100.0% of all women with births.
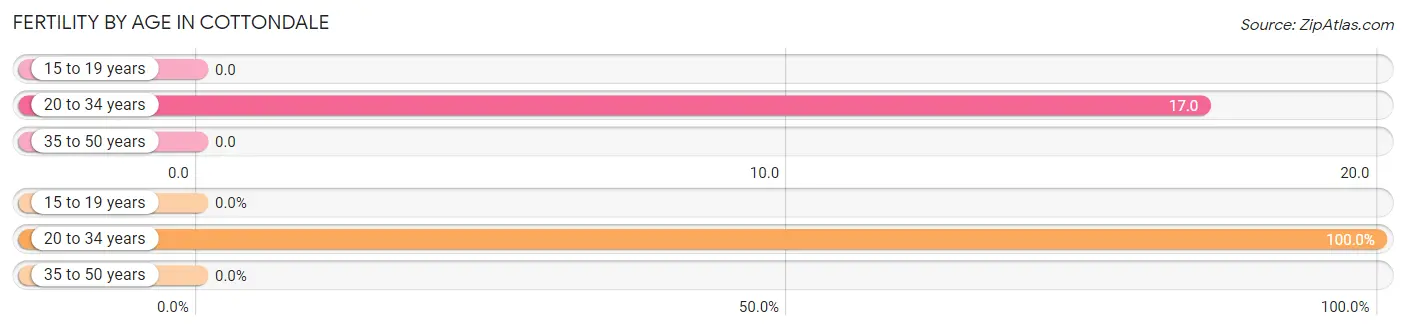
| Age Bracket | Women with Births | Births / 1,000 Women |
| 15 to 19 years | 0 (0.0%) | 0.0 |
| 20 to 34 years | 4 (100.0%) | 17.0 |
| 35 to 50 years | 0 (0.0%) | 0.0 |
| Total | 4 (100.0%) | 5.0 |
Fertility by Age by Marriage Status in Cottondale
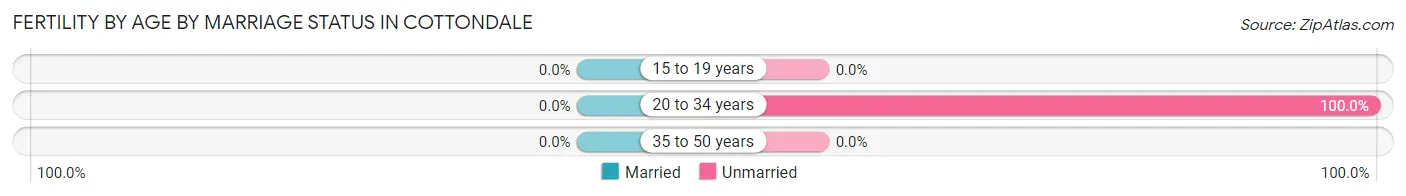
| Age Bracket | Married | Unmarried |
| 15 to 19 years | 0 (0.0%) | 0 (0.0%) |
| 20 to 34 years | 0 (0.0%) | 4 (100.0%) |
| 35 to 50 years | 0 (0.0%) | 0 (0.0%) |
| Total | 0 (0.0%) | 4 (100.0%) |
Fertility by Education in Cottondale
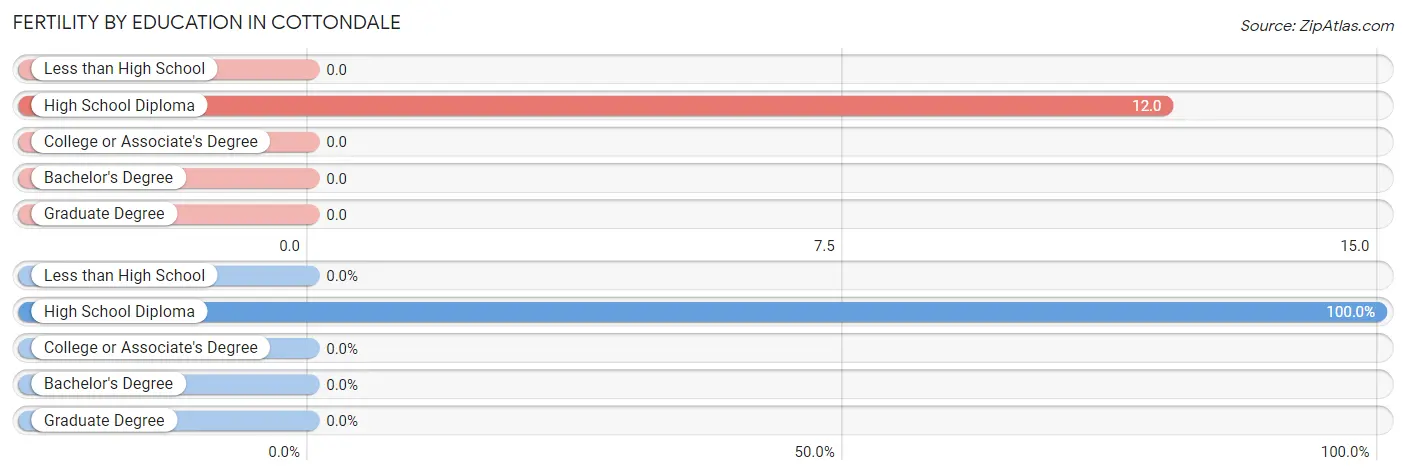
| Educational Attainment | Women with Births | Births / 1,000 Women |
| Less than High School | 0 (0.0%) | 0.0 |
| High School Diploma | 4 (100.0%) | 12.0 |
| College or Associate's Degree | 0 (0.0%) | 0.0 |
| Bachelor's Degree | 0 (0.0%) | 0.0 |
| Graduate Degree | 0 (0.0%) | 0.0 |
| Total | 4 (100.0%) | 5.0 |
Fertility by Education by Marriage Status in Cottondale
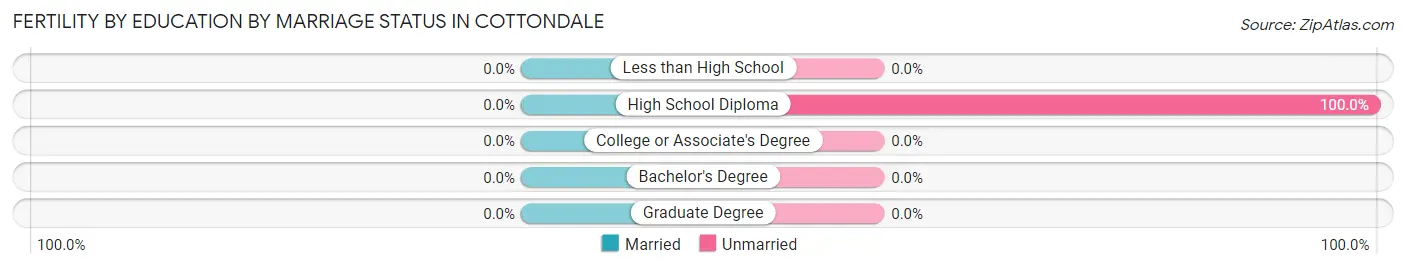
| Educational Attainment | Married | Unmarried |
| Less than High School | 0 (0.0%) | 0 (0.0%) |
| High School Diploma | 0 (0.0%) | 4 (100.0%) |
| College or Associate's Degree | 0 (0.0%) | 0 (0.0%) |
| Bachelor's Degree | 0 (0.0%) | 0 (0.0%) |
| Graduate Degree | 0 (0.0%) | 0 (0.0%) |
| Total | 0 (0.0%) | 4 (100.0%) |
Employment Characteristics in Cottondale
Employment by Class of Employer in Cottondale
Among the 1,416 employed individuals in Cottondale, private company employees (954 | 67.4%), not-for-profit organizations (230 | 16.2%), and state government employees (120 | 8.5%) make up the most common classes of employment.
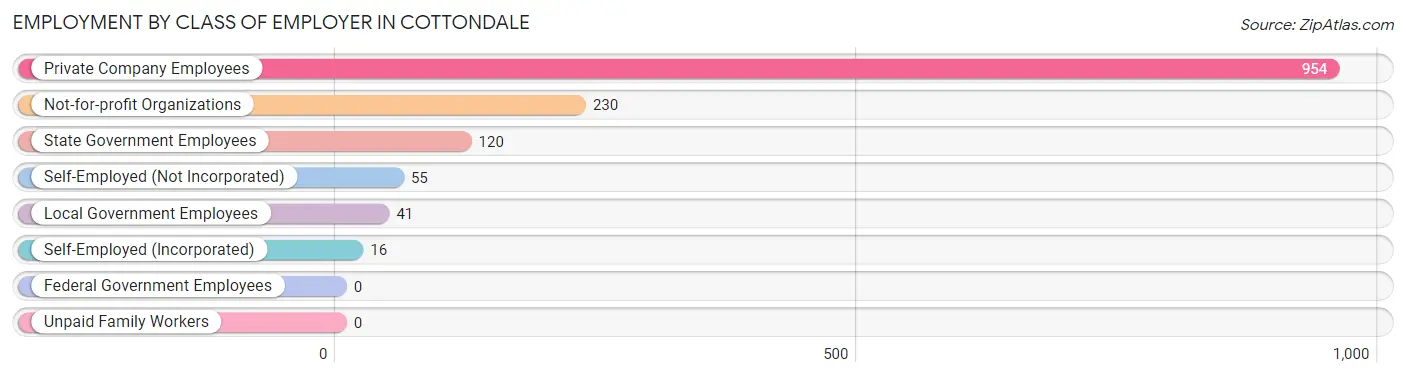
| Employer Class | # Employees | % Employees |
| Private Company Employees | 954 | 67.4% |
| Self-Employed (Incorporated) | 16 | 1.1% |
| Self-Employed (Not Incorporated) | 55 | 3.9% |
| Not-for-profit Organizations | 230 | 16.2% |
| Local Government Employees | 41 | 2.9% |
| State Government Employees | 120 | 8.5% |
| Federal Government Employees | 0 | 0.0% |
| Unpaid Family Workers | 0 | 0.0% |
| Total | 1,416 | 100.0% |
Employment Status by Age in Cottondale
According to the labor force statistics for Cottondale, out of the total population over 16 years of age (2,810), 53.2% or 1,495 individuals are in the labor force, with 5.3% or 79 of them unemployed. The age group with the highest labor force participation rate is 30 to 34 years, with 88.0% or 212 individuals in the labor force. Within the labor force, the 20 to 24 years age range has the highest percentage of unemployed individuals, with 50.0% or 48 of them being unemployed.
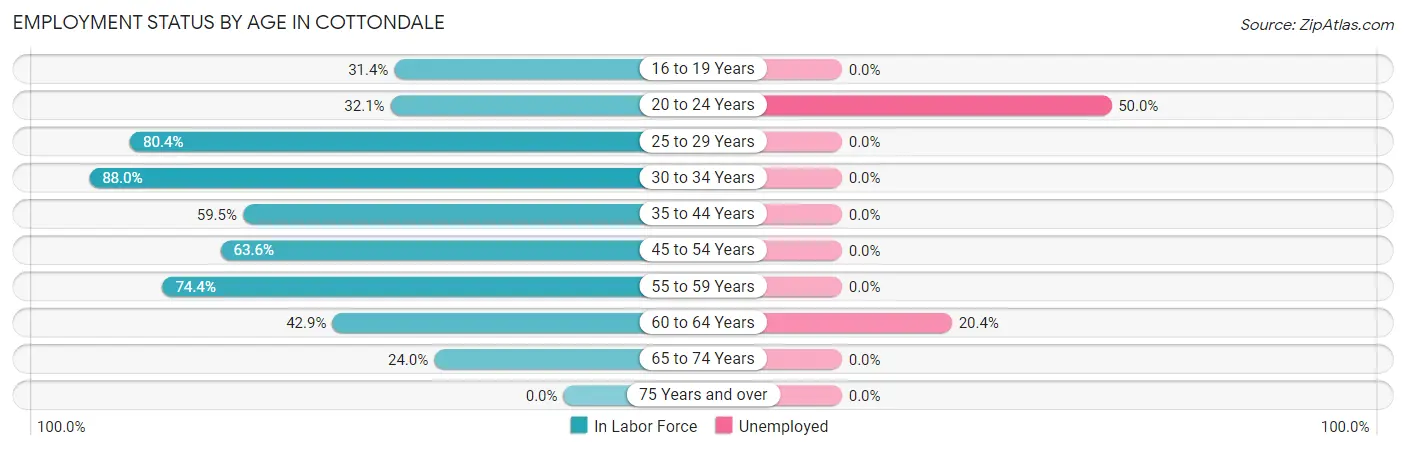
| Age Bracket | In Labor Force | Unemployed |
| 16 to 19 Years | 37 (31.4%) | 0 (0.0%) |
| 20 to 24 Years | 96 (32.1%) | 48 (50.0%) |
| 25 to 29 Years | 144 (80.4%) | 0 (0.0%) |
| 30 to 34 Years | 212 (88.0%) | 0 (0.0%) |
| 35 to 44 Years | 253 (59.5%) | 0 (0.0%) |
| 45 to 54 Years | 388 (63.6%) | 0 (0.0%) |
| 55 to 59 Years | 163 (74.4%) | 0 (0.0%) |
| 60 to 64 Years | 157 (42.9%) | 32 (20.4%) |
| 65 to 74 Years | 46 (24.0%) | 0 (0.0%) |
| 75 Years and over | 0 (0.0%) | 0 (0.0%) |
| Total | 1,495 (53.2%) | 79 (5.3%) |
Employment Status by Educational Attainment in Cottondale
According to labor force statistics for Cottondale, 64.6% of individuals (1,318) out of the total population between 25 and 64 years of age (2,040) are in the labor force, with 2.4% or 32 of them being unemployed. The group with the highest labor force participation rate are those with the educational attainment of bachelor's degree or higher, with 83.1% or 226 individuals in the labor force. Within the labor force, individuals with bachelor's degree or higher education have the highest percentage of unemployment, with 14.2% or 32 of them being unemployed.
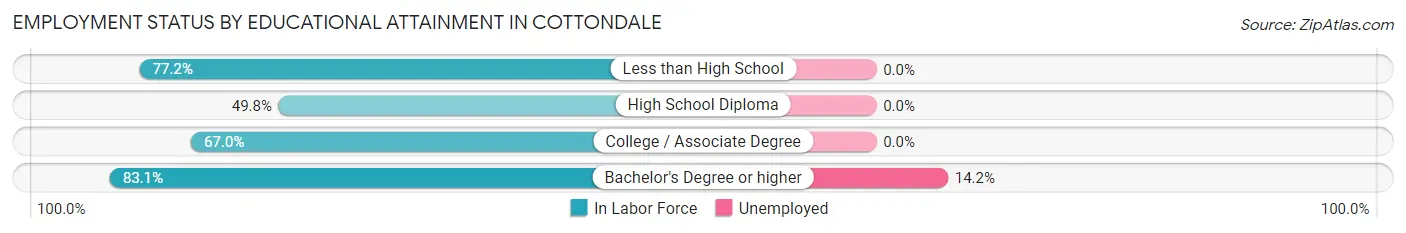
| Educational Attainment | In Labor Force | Unemployed |
| Less than High School | 186 (77.2%) | 0 (0.0%) |
| High School Diploma | 342 (49.8%) | 0 (0.0%) |
| College / Associate Degree | 563 (67.0%) | 0 (0.0%) |
| Bachelor's Degree or higher | 226 (83.1%) | 39 (14.2%) |
| Total | 1,318 (64.6%) | 49 (2.4%) |
Employment Occupations by Sex in Cottondale
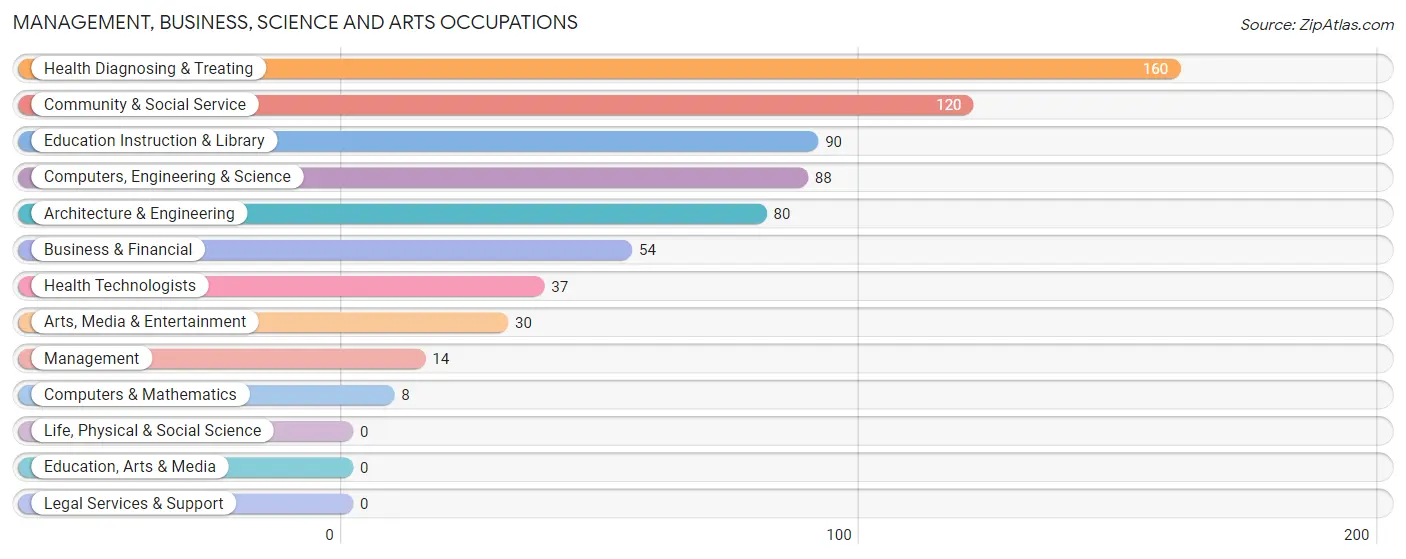
Management, Business, Science and Arts Occupations
The most common Management, Business, Science and Arts occupations in Cottondale are Health Diagnosing & Treating (160 | 11.3%), Community & Social Service (120 | 8.5%), Education Instruction & Library (90 | 6.4%), Computers, Engineering & Science (88 | 6.2%), and Architecture & Engineering (80 | 5.7%).
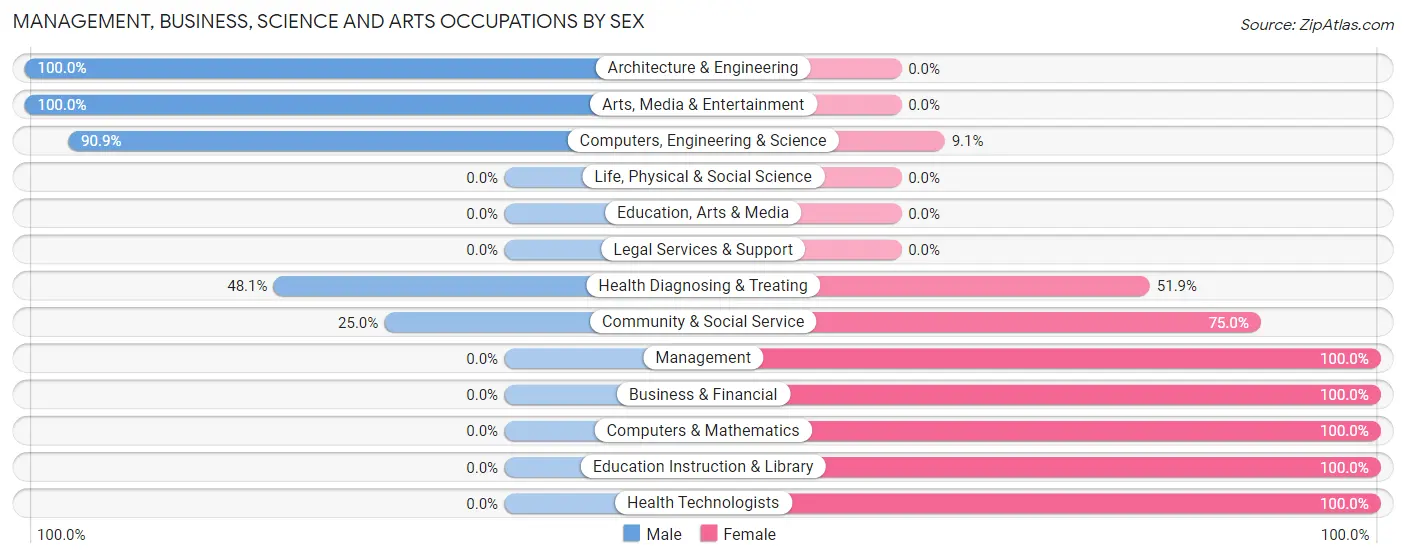
Management, Business, Science and Arts Occupations by Sex
Within the Management, Business, Science and Arts occupations in Cottondale, the most male-oriented occupations are Architecture & Engineering (100.0%), Arts, Media & Entertainment (100.0%), and Computers, Engineering & Science (90.9%), while the most female-oriented occupations are Management (100.0%), Business & Financial (100.0%), and Computers & Mathematics (100.0%).
| Occupation | Male | Female |
| Management | 0 (0.0%) | 14 (100.0%) |
| Business & Financial | 0 (0.0%) | 54 (100.0%) |
| Computers, Engineering & Science | 80 (90.9%) | 8 (9.1%) |
| Computers & Mathematics | 0 (0.0%) | 8 (100.0%) |
| Architecture & Engineering | 80 (100.0%) | 0 (0.0%) |
| Life, Physical & Social Science | 0 (0.0%) | 0 (0.0%) |
| Community & Social Service | 30 (25.0%) | 90 (75.0%) |
| Education, Arts & Media | 0 (0.0%) | 0 (0.0%) |
| Legal Services & Support | 0 (0.0%) | 0 (0.0%) |
| Education Instruction & Library | 0 (0.0%) | 90 (100.0%) |
| Arts, Media & Entertainment | 30 (100.0%) | 0 (0.0%) |
| Health Diagnosing & Treating | 77 (48.1%) | 83 (51.9%) |
| Health Technologists | 0 (0.0%) | 37 (100.0%) |
| Total (Category) | 187 (42.9%) | 249 (57.1%) |
| Total (Overall) | 591 (41.7%) | 825 (58.3%) |
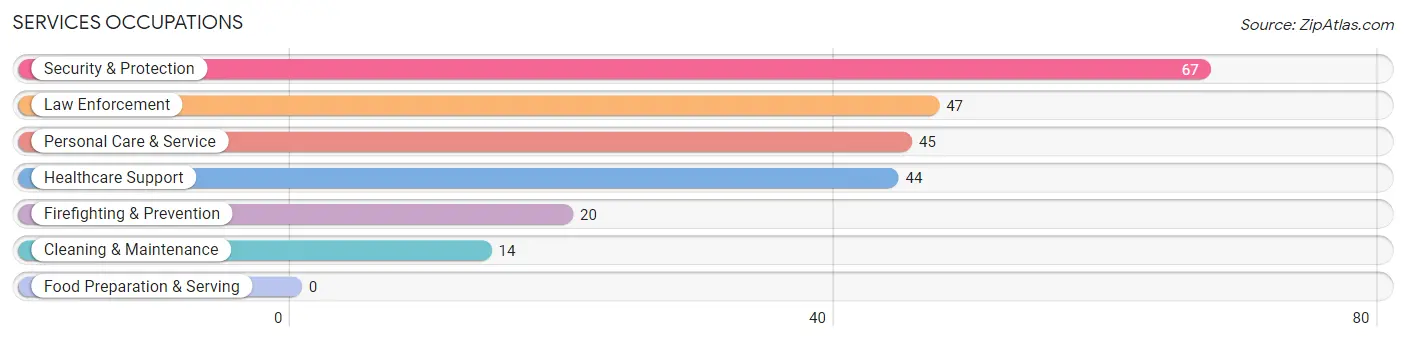
Services Occupations
The most common Services occupations in Cottondale are Security & Protection (67 | 4.7%), Law Enforcement (47 | 3.3%), Personal Care & Service (45 | 3.2%), Healthcare Support (44 | 3.1%), and Firefighting & Prevention (20 | 1.4%).
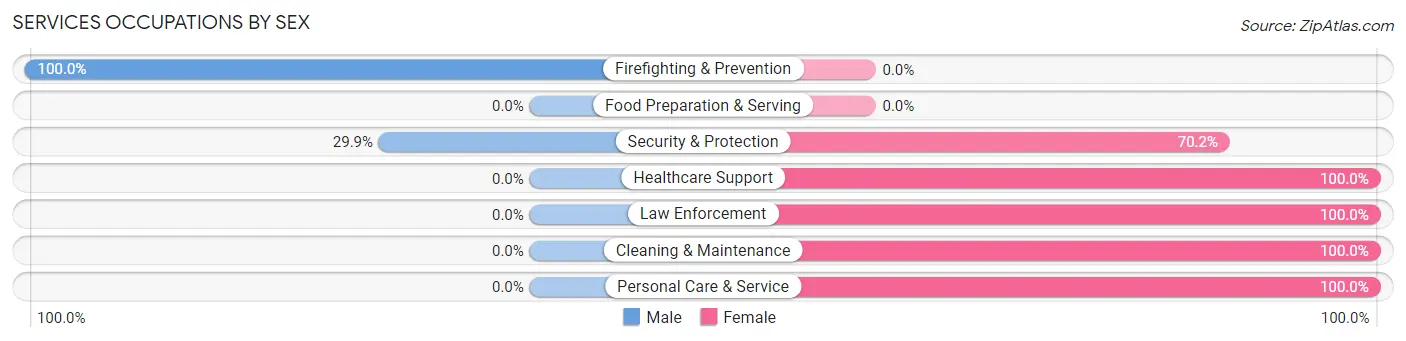
Services Occupations by Sex
Within the Services occupations in Cottondale, the most male-oriented occupations are Firefighting & Prevention (100.0%), and Security & Protection (29.8%), while the most female-oriented occupations are Healthcare Support (100.0%), Law Enforcement (100.0%), and Cleaning & Maintenance (100.0%).
| Occupation | Male | Female |
| Healthcare Support | 0 (0.0%) | 44 (100.0%) |
| Security & Protection | 20 (29.8%) | 47 (70.2%) |
| Firefighting & Prevention | 20 (100.0%) | 0 (0.0%) |
| Law Enforcement | 0 (0.0%) | 47 (100.0%) |
| Food Preparation & Serving | 0 (0.0%) | 0 (0.0%) |
| Cleaning & Maintenance | 0 (0.0%) | 14 (100.0%) |
| Personal Care & Service | 0 (0.0%) | 45 (100.0%) |
| Total (Category) | 20 (11.8%) | 150 (88.2%) |
| Total (Overall) | 591 (41.7%) | 825 (58.3%) |
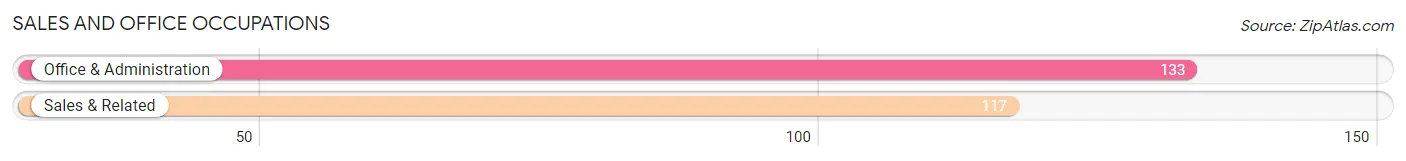
Sales and Office Occupations
The most common Sales and Office occupations in Cottondale are Office & Administration (133 | 9.4%), and Sales & Related (117 | 8.3%).
Sales and Office Occupations by Sex
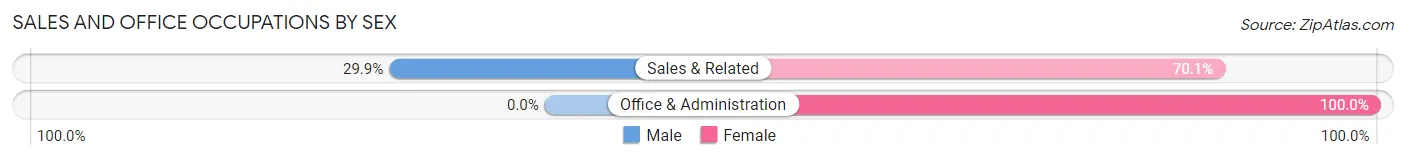
| Occupation | Male | Female |
| Sales & Related | 35 (29.9%) | 82 (70.1%) |
| Office & Administration | 0 (0.0%) | 133 (100.0%) |
| Total (Category) | 35 (14.0%) | 215 (86.0%) |
| Total (Overall) | 591 (41.7%) | 825 (58.3%) |
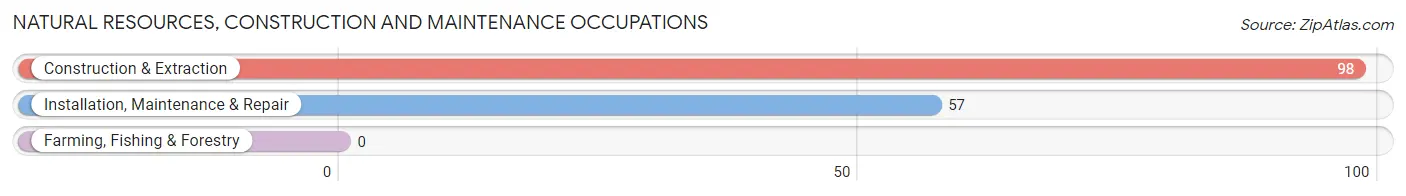
Natural Resources, Construction and Maintenance Occupations
The most common Natural Resources, Construction and Maintenance occupations in Cottondale are Construction & Extraction (98 | 6.9%), and Installation, Maintenance & Repair (57 | 4.0%).
Natural Resources, Construction and Maintenance Occupations by Sex
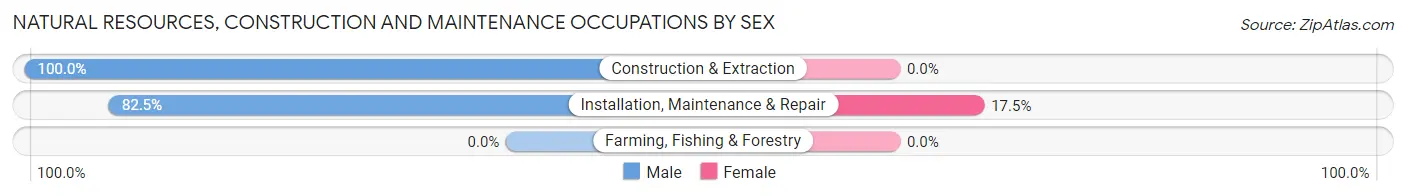
| Occupation | Male | Female |
| Farming, Fishing & Forestry | 0 (0.0%) | 0 (0.0%) |
| Construction & Extraction | 98 (100.0%) | 0 (0.0%) |
| Installation, Maintenance & Repair | 47 (82.5%) | 10 (17.5%) |
| Total (Category) | 145 (93.5%) | 10 (6.5%) |
| Total (Overall) | 591 (41.7%) | 825 (58.3%) |
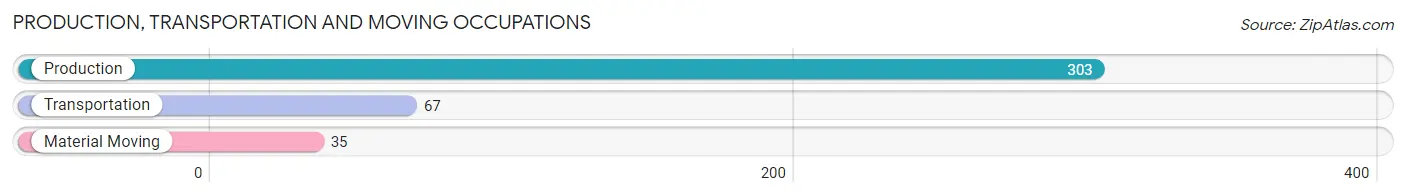
Production, Transportation and Moving Occupations
The most common Production, Transportation and Moving occupations in Cottondale are Production (303 | 21.4%), Transportation (67 | 4.7%), and Material Moving (35 | 2.5%).
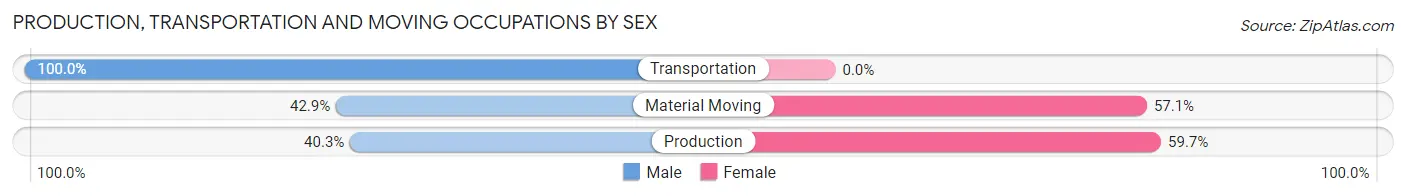
Production, Transportation and Moving Occupations by Sex
| Occupation | Male | Female |
| Production | 122 (40.3%) | 181 (59.7%) |
| Transportation | 67 (100.0%) | 0 (0.0%) |
| Material Moving | 15 (42.9%) | 20 (57.1%) |
| Total (Category) | 204 (50.4%) | 201 (49.6%) |
| Total (Overall) | 591 (41.7%) | 825 (58.3%) |
Employment Industries by Sex in Cottondale
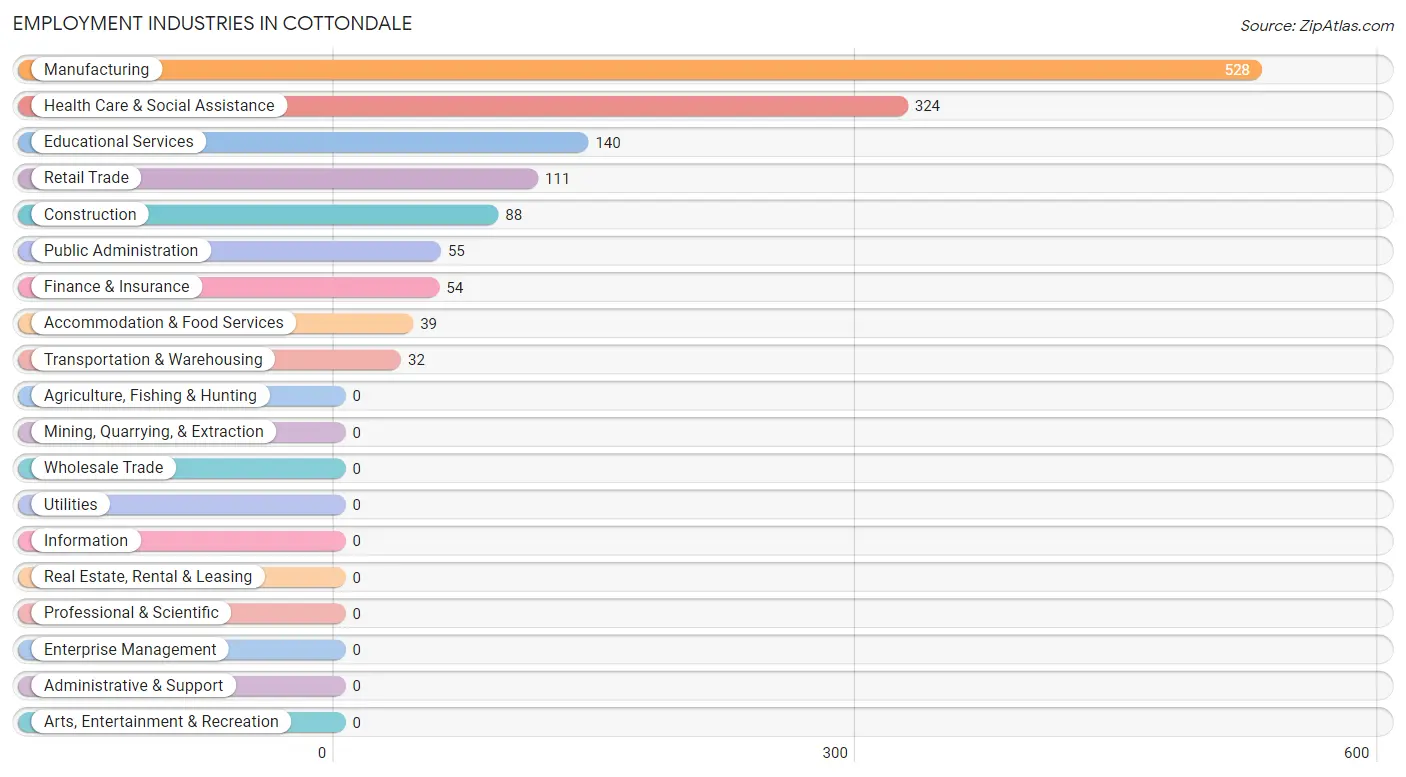
Employment Industries in Cottondale
The major employment industries in Cottondale include Manufacturing (528 | 37.3%), Health Care & Social Assistance (324 | 22.9%), Educational Services (140 | 9.9%), Retail Trade (111 | 7.8%), and Construction (88 | 6.2%).
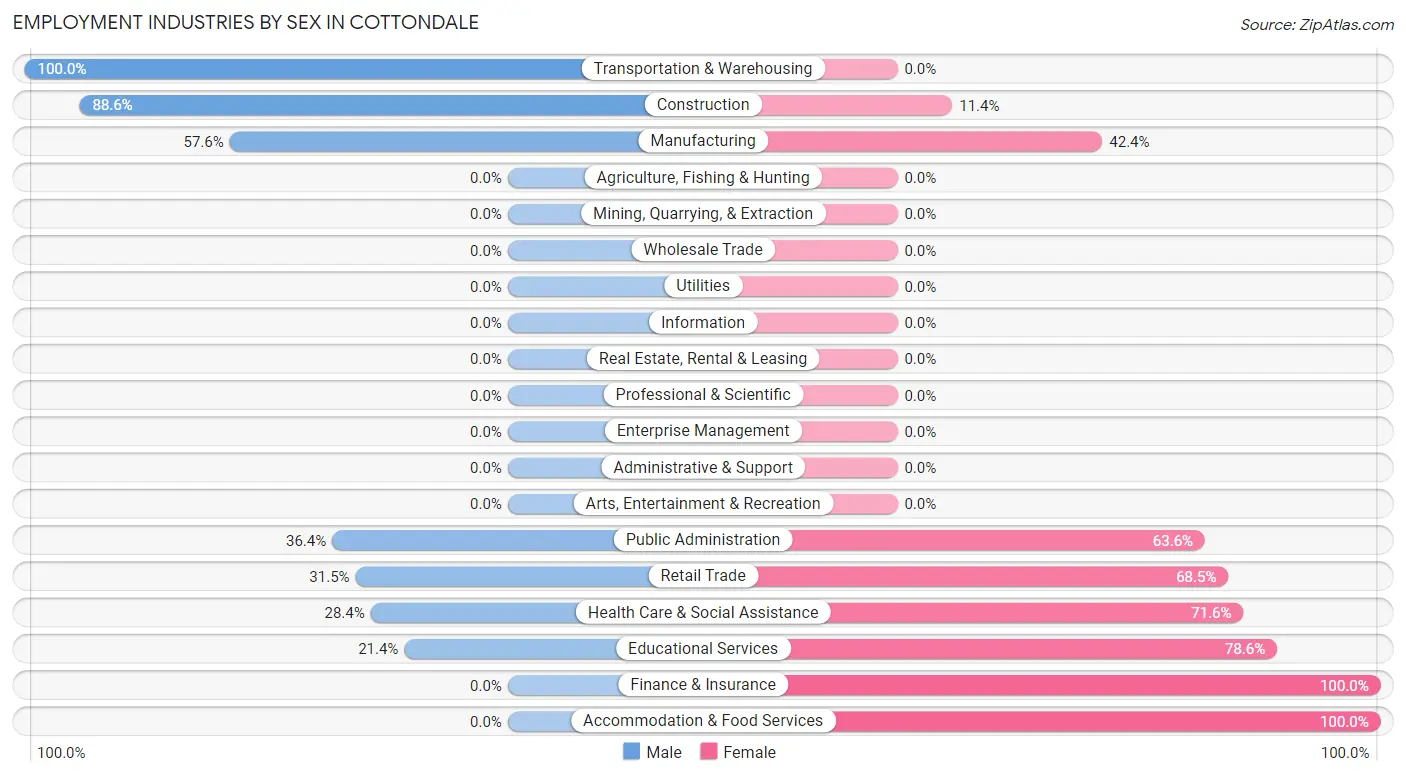
Employment Industries by Sex in Cottondale
The Cottondale industries that see more men than women are Transportation & Warehousing (100.0%), Construction (88.6%), and Manufacturing (57.6%), whereas the industries that tend to have a higher number of women are Finance & Insurance (100.0%), Accommodation & Food Services (100.0%), and Educational Services (78.6%).
| Industry | Male | Female |
| Agriculture, Fishing & Hunting | 0 (0.0%) | 0 (0.0%) |
| Mining, Quarrying, & Extraction | 0 (0.0%) | 0 (0.0%) |
| Construction | 78 (88.6%) | 10 (11.4%) |
| Manufacturing | 304 (57.6%) | 224 (42.4%) |
| Wholesale Trade | 0 (0.0%) | 0 (0.0%) |
| Retail Trade | 35 (31.5%) | 76 (68.5%) |
| Transportation & Warehousing | 32 (100.0%) | 0 (0.0%) |
| Utilities | 0 (0.0%) | 0 (0.0%) |
| Information | 0 (0.0%) | 0 (0.0%) |
| Finance & Insurance | 0 (0.0%) | 54 (100.0%) |
| Real Estate, Rental & Leasing | 0 (0.0%) | 0 (0.0%) |
| Professional & Scientific | 0 (0.0%) | 0 (0.0%) |
| Enterprise Management | 0 (0.0%) | 0 (0.0%) |
| Administrative & Support | 0 (0.0%) | 0 (0.0%) |
| Educational Services | 30 (21.4%) | 110 (78.6%) |
| Health Care & Social Assistance | 92 (28.4%) | 232 (71.6%) |
| Arts, Entertainment & Recreation | 0 (0.0%) | 0 (0.0%) |
| Accommodation & Food Services | 0 (0.0%) | 39 (100.0%) |
| Public Administration | 20 (36.4%) | 35 (63.6%) |
| Total | 591 (41.7%) | 825 (58.3%) |
Education in Cottondale
School Enrollment in Cottondale
The most common levels of schooling among the 804 students in Cottondale are college / undergraduate (289 | 35.9%), elementary school (135 | 16.8%), and middle school (130 | 16.2%).
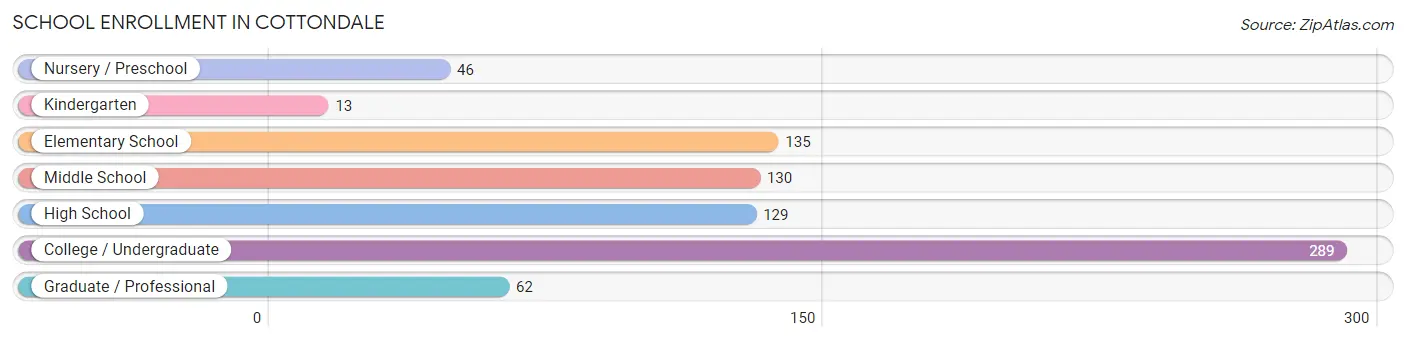
| School Level | # Students | % Students |
| Nursery / Preschool | 46 | 5.7% |
| Kindergarten | 13 | 1.6% |
| Elementary School | 135 | 16.8% |
| Middle School | 130 | 16.2% |
| High School | 129 | 16.0% |
| College / Undergraduate | 289 | 35.9% |
| Graduate / Professional | 62 | 7.7% |
| Total | 804 | 100.0% |
School Enrollment by Age by Funding Source in Cottondale
Out of a total of 804 students who are enrolled in schools in Cottondale, 93 (11.6%) attend a private institution, while the remaining 711 (88.4%) are enrolled in public schools. The age group of 3 to 4 year olds has the highest likelihood of being enrolled in private schools, with 16 (72.7% in the age bracket) enrolled. Conversely, the age group of 10 to 14 year olds has the lowest likelihood of being enrolled in a private school, with 93 (100.0% in the age bracket) attending a public institution.
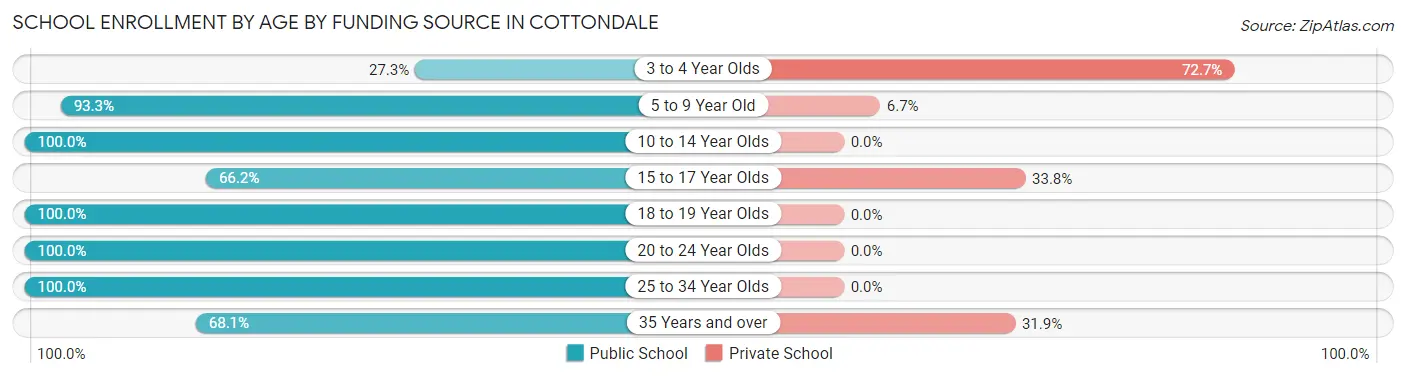
| Age Bracket | Public School | Private School |
| 3 to 4 Year Olds | 6 (27.3%) | 16 (72.7%) |
| 5 to 9 Year Old | 180 (93.3%) | 13 (6.7%) |
| 10 to 14 Year Olds | 93 (100.0%) | 0 (0.0%) |
| 15 to 17 Year Olds | 96 (66.2%) | 49 (33.8%) |
| 18 to 19 Year Olds | 21 (100.0%) | 0 (0.0%) |
| 20 to 24 Year Olds | 203 (100.0%) | 0 (0.0%) |
| 25 to 34 Year Olds | 80 (100.0%) | 0 (0.0%) |
| 35 Years and over | 32 (68.1%) | 15 (31.9%) |
| Total | 711 (88.4%) | 93 (11.6%) |
Educational Attainment by Field of Study in Cottondale
Business (109 | 31.4%), science & technology (64 | 18.4%), computers & mathematics (50 | 14.4%), physical & health sciences (32 | 9.2%), and social sciences (32 | 9.2%) are the most common fields of study among 347 individuals in Cottondale who have obtained a bachelor's degree or higher.
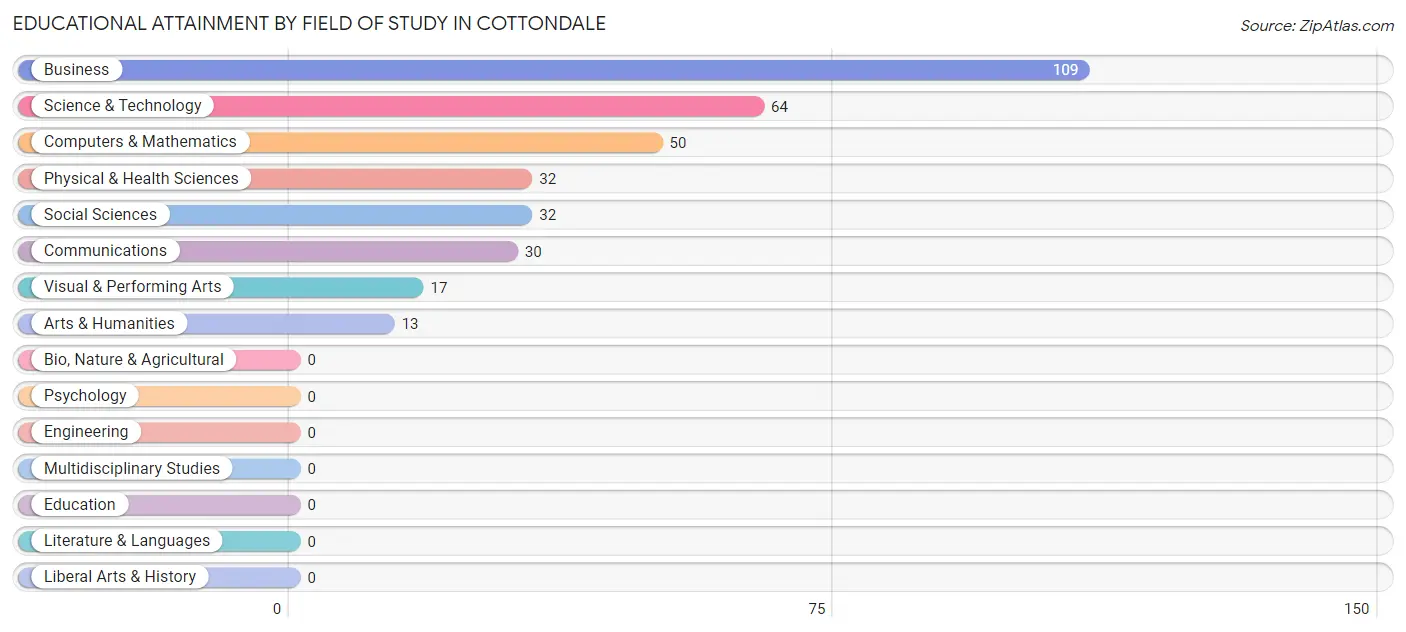
| Field of Study | # Graduates | % Graduates |
| Computers & Mathematics | 50 | 14.4% |
| Bio, Nature & Agricultural | 0 | 0.0% |
| Physical & Health Sciences | 32 | 9.2% |
| Psychology | 0 | 0.0% |
| Social Sciences | 32 | 9.2% |
| Engineering | 0 | 0.0% |
| Multidisciplinary Studies | 0 | 0.0% |
| Science & Technology | 64 | 18.4% |
| Business | 109 | 31.4% |
| Education | 0 | 0.0% |
| Literature & Languages | 0 | 0.0% |
| Liberal Arts & History | 0 | 0.0% |
| Visual & Performing Arts | 17 | 4.9% |
| Communications | 30 | 8.6% |
| Arts & Humanities | 13 | 3.7% |
| Total | 347 | 100.0% |
Transportation & Commute in Cottondale
Vehicle Availability by Sex in Cottondale
The most prevalent vehicle ownership categories in Cottondale are males with 3 vehicles (251, accounting for 42.5%) and females with 3 vehicles (217, making up 30.4%).
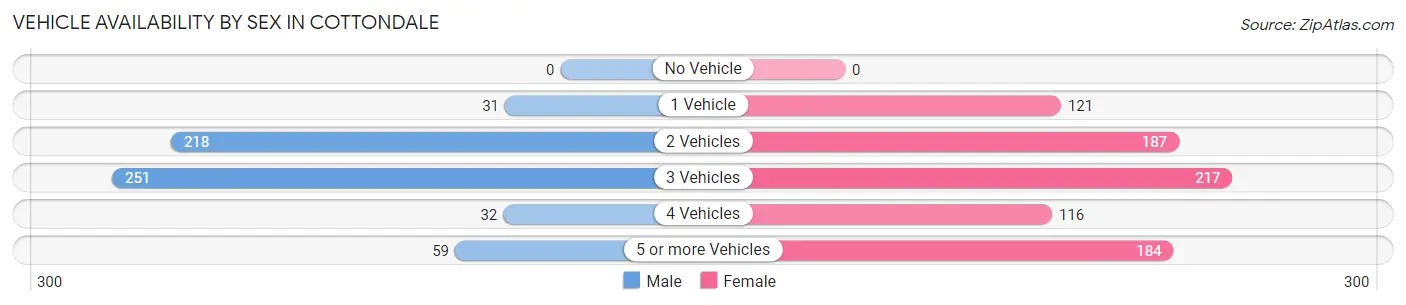
| Vehicles Available | Male | Female |
| No Vehicle | 0 (0.0%) | 0 (0.0%) |
| 1 Vehicle | 31 (5.2%) | 121 (14.7%) |
| 2 Vehicles | 218 (36.9%) | 187 (22.7%) |
| 3 Vehicles | 251 (42.5%) | 217 (26.3%) |
| 4 Vehicles | 32 (5.4%) | 116 (14.1%) |
| 5 or more Vehicles | 59 (10.0%) | 184 (22.3%) |
| Total | 591 (100.0%) | 825 (100.0%) |
Commute Time in Cottondale
The most frequently occuring commute durations in Cottondale are 10 to 14 minutes (370 commuters, 26.3%), 45 to 59 minutes (186 commuters, 13.2%), and 15 to 19 minutes (178 commuters, 12.6%).
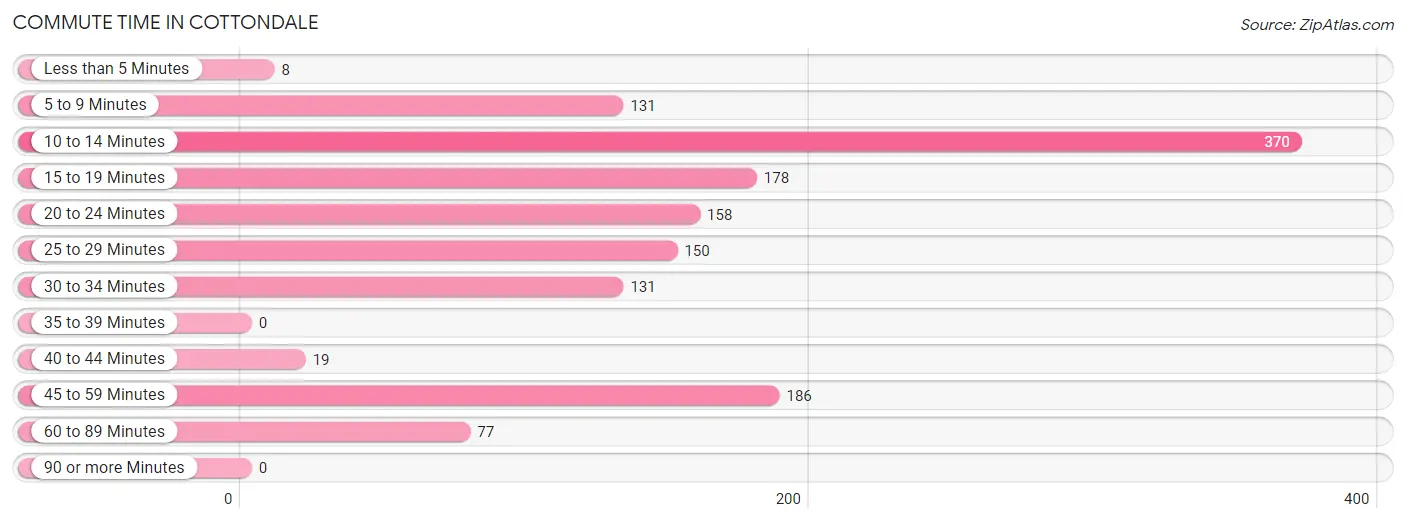
| Commute Time | # Commuters | % Commuters |
| Less than 5 Minutes | 8 | 0.6% |
| 5 to 9 Minutes | 131 | 9.3% |
| 10 to 14 Minutes | 370 | 26.3% |
| 15 to 19 Minutes | 178 | 12.6% |
| 20 to 24 Minutes | 158 | 11.2% |
| 25 to 29 Minutes | 150 | 10.6% |
| 30 to 34 Minutes | 131 | 9.3% |
| 35 to 39 Minutes | 0 | 0.0% |
| 40 to 44 Minutes | 19 | 1.3% |
| 45 to 59 Minutes | 186 | 13.2% |
| 60 to 89 Minutes | 77 | 5.5% |
| 90 or more Minutes | 0 | 0.0% |
Commute Time by Sex in Cottondale
The most common commute times in Cottondale are 30 to 34 minutes (131 commuters, 22.2%) for males and 10 to 14 minutes (299 commuters, 36.6%) for females.
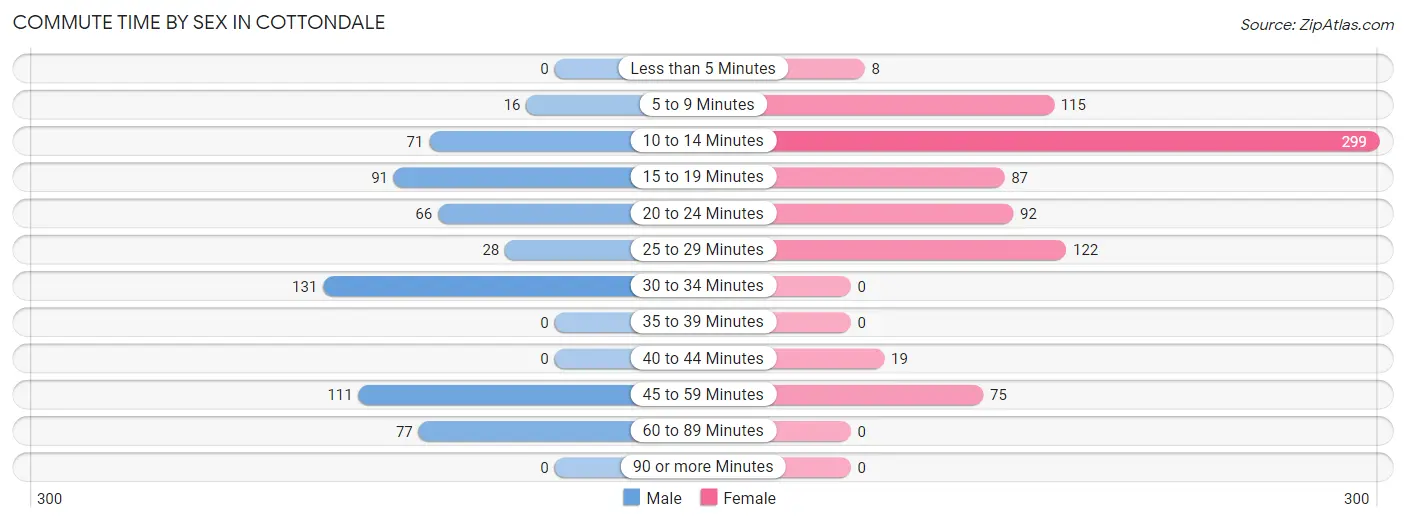
| Commute Time | Male | Female |
| Less than 5 Minutes | 0 (0.0%) | 8 (1.0%) |
| 5 to 9 Minutes | 16 (2.7%) | 115 (14.1%) |
| 10 to 14 Minutes | 71 (12.0%) | 299 (36.6%) |
| 15 to 19 Minutes | 91 (15.4%) | 87 (10.6%) |
| 20 to 24 Minutes | 66 (11.2%) | 92 (11.3%) |
| 25 to 29 Minutes | 28 (4.7%) | 122 (14.9%) |
| 30 to 34 Minutes | 131 (22.2%) | 0 (0.0%) |
| 35 to 39 Minutes | 0 (0.0%) | 0 (0.0%) |
| 40 to 44 Minutes | 0 (0.0%) | 19 (2.3%) |
| 45 to 59 Minutes | 111 (18.8%) | 75 (9.2%) |
| 60 to 89 Minutes | 77 (13.0%) | 0 (0.0%) |
| 90 or more Minutes | 0 (0.0%) | 0 (0.0%) |
Time of Departure to Work by Sex in Cottondale
The most frequent times of departure to work in Cottondale are 6:00 AM to 6:29 AM (113, 19.1%) for males and 6:00 AM to 6:29 AM (194, 23.7%) for females.
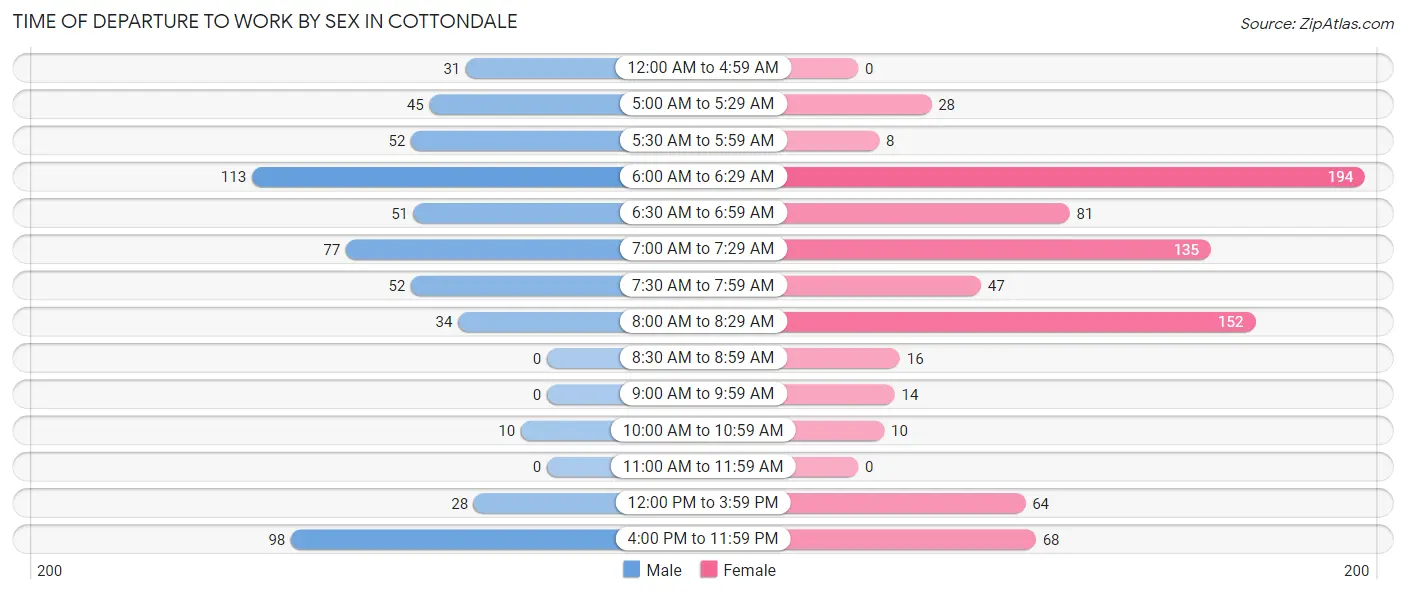
| Time of Departure | Male | Female |
| 12:00 AM to 4:59 AM | 31 (5.2%) | 0 (0.0%) |
| 5:00 AM to 5:29 AM | 45 (7.6%) | 28 (3.4%) |
| 5:30 AM to 5:59 AM | 52 (8.8%) | 8 (1.0%) |
| 6:00 AM to 6:29 AM | 113 (19.1%) | 194 (23.7%) |
| 6:30 AM to 6:59 AM | 51 (8.6%) | 81 (9.9%) |
| 7:00 AM to 7:29 AM | 77 (13.0%) | 135 (16.5%) |
| 7:30 AM to 7:59 AM | 52 (8.8%) | 47 (5.8%) |
| 8:00 AM to 8:29 AM | 34 (5.8%) | 152 (18.6%) |
| 8:30 AM to 8:59 AM | 0 (0.0%) | 16 (2.0%) |
| 9:00 AM to 9:59 AM | 0 (0.0%) | 14 (1.7%) |
| 10:00 AM to 10:59 AM | 10 (1.7%) | 10 (1.2%) |
| 11:00 AM to 11:59 AM | 0 (0.0%) | 0 (0.0%) |
| 12:00 PM to 3:59 PM | 28 (4.7%) | 64 (7.8%) |
| 4:00 PM to 11:59 PM | 98 (16.6%) | 68 (8.3%) |
| Total | 591 (100.0%) | 817 (100.0%) |
Housing Occupancy in Cottondale
Occupancy by Ownership in Cottondale
Of the total 1,330 dwellings in Cottondale, owner-occupied units account for 1,037 (78.0%), while renter-occupied units make up 293 (22.0%).
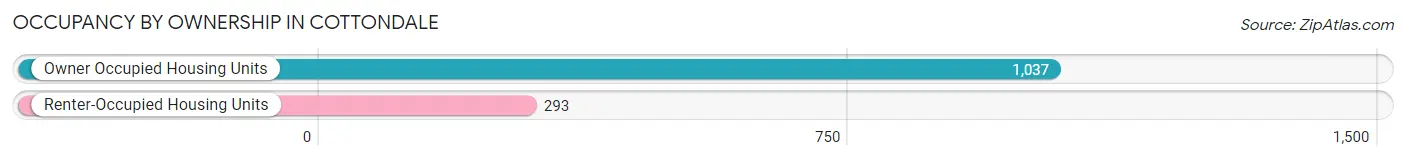
| Occupancy | # Housing Units | % Housing Units |
| Owner Occupied Housing Units | 1,037 | 78.0% |
| Renter-Occupied Housing Units | 293 | 22.0% |
| Total Occupied Housing Units | 1,330 | 100.0% |
Occupancy by Household Size in Cottondale
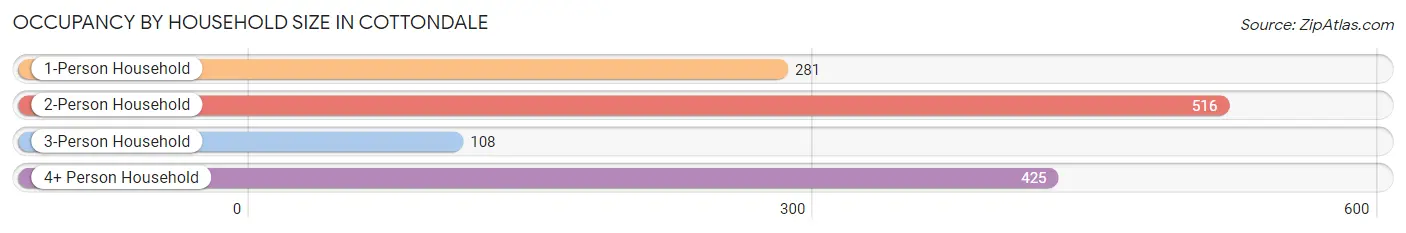
| Household Size | # Housing Units | % Housing Units |
| 1-Person Household | 281 | 21.1% |
| 2-Person Household | 516 | 38.8% |
| 3-Person Household | 108 | 8.1% |
| 4+ Person Household | 425 | 32.0% |
| Total Housing Units | 1,330 | 100.0% |
Occupancy by Ownership by Household Size in Cottondale
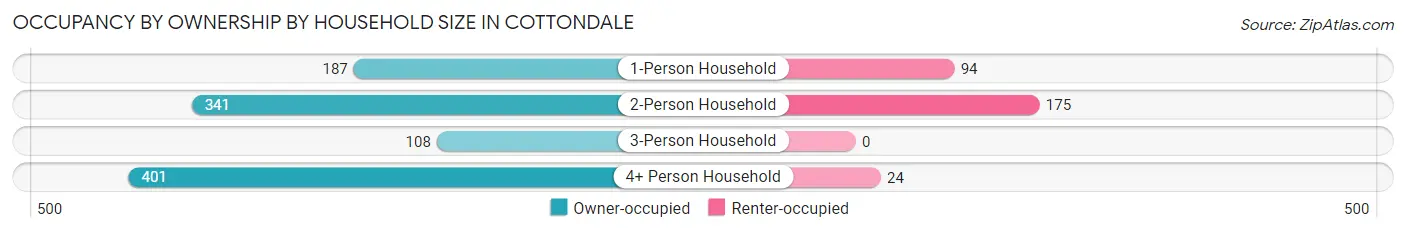
| Household Size | Owner-occupied | Renter-occupied |
| 1-Person Household | 187 (66.5%) | 94 (33.5%) |
| 2-Person Household | 341 (66.1%) | 175 (33.9%) |
| 3-Person Household | 108 (100.0%) | 0 (0.0%) |
| 4+ Person Household | 401 (94.4%) | 24 (5.7%) |
| Total Housing Units | 1,037 (78.0%) | 293 (22.0%) |
Occupancy by Educational Attainment in Cottondale
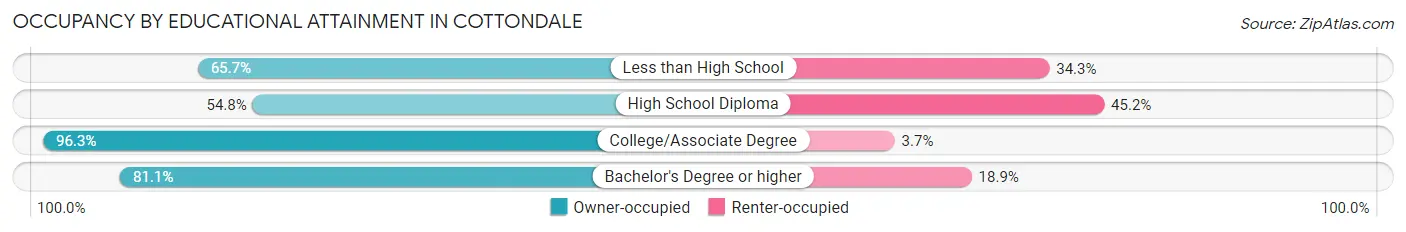
| Household Size | Owner-occupied | Renter-occupied |
| Less than High School | 88 (65.7%) | 46 (34.3%) |
| High School Diploma | 234 (54.8%) | 193 (45.2%) |
| College/Associate Degree | 578 (96.3%) | 22 (3.7%) |
| Bachelor's Degree or higher | 137 (81.1%) | 32 (18.9%) |
Occupancy by Age of Householder in Cottondale
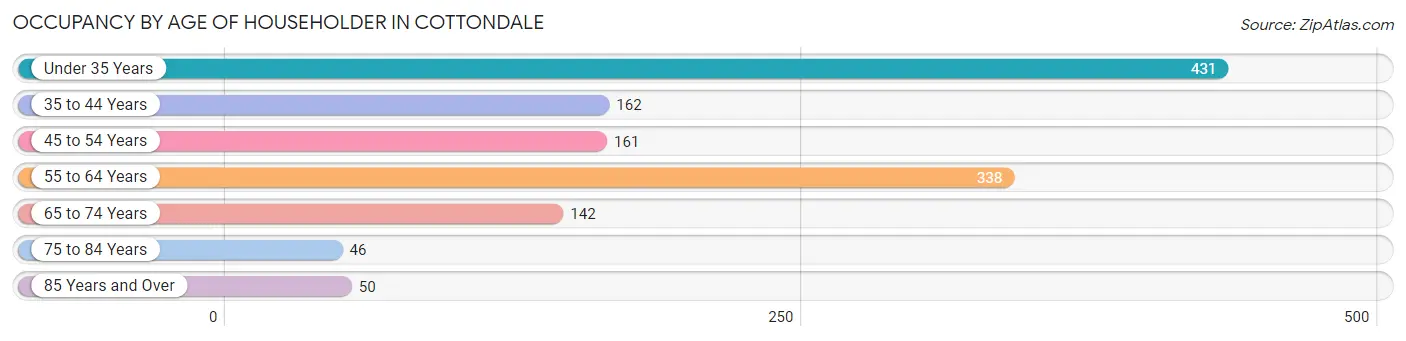
| Age Bracket | # Households | % Households |
| Under 35 Years | 431 | 32.4% |
| 35 to 44 Years | 162 | 12.2% |
| 45 to 54 Years | 161 | 12.1% |
| 55 to 64 Years | 338 | 25.4% |
| 65 to 74 Years | 142 | 10.7% |
| 75 to 84 Years | 46 | 3.5% |
| 85 Years and Over | 50 | 3.8% |
| Total | 1,330 | 100.0% |
Housing Finances in Cottondale
Median Income by Occupancy in Cottondale
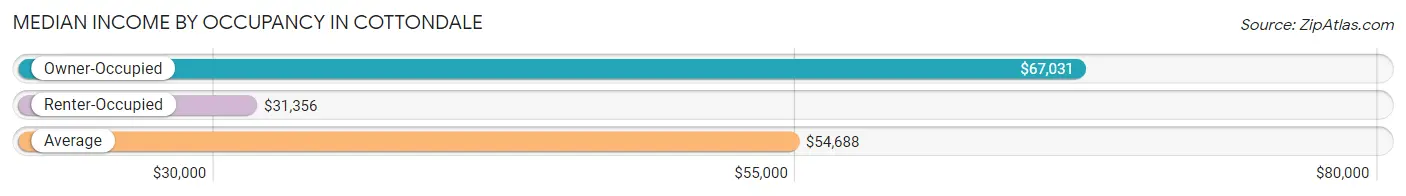
| Occupancy Type | # Households | Median Income |
| Owner-Occupied | 1,037 (78.0%) | $67,031 |
| Renter-Occupied | 293 (22.0%) | $31,356 |
| Average | 1,330 (100.0%) | $54,688 |
Occupancy by Householder Income Bracket in Cottondale
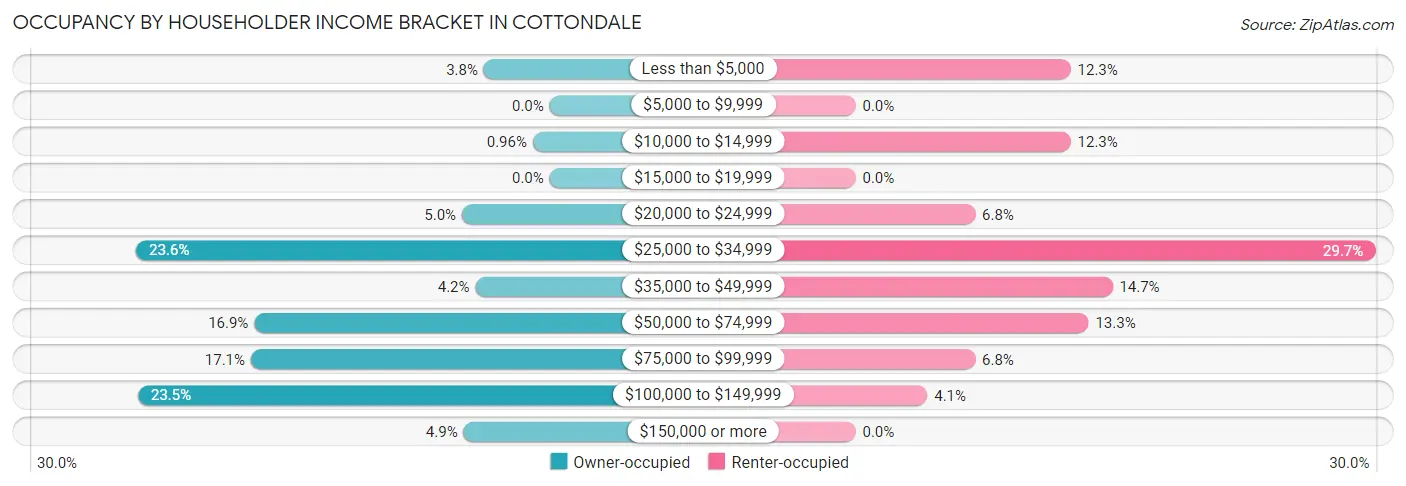
| Income Bracket | Owner-occupied | Renter-occupied |
| Less than $5,000 | 39 (3.8%) | 36 (12.3%) |
| $5,000 to $9,999 | 0 (0.0%) | 0 (0.0%) |
| $10,000 to $14,999 | 10 (1.0%) | 36 (12.3%) |
| $15,000 to $19,999 | 0 (0.0%) | 0 (0.0%) |
| $20,000 to $24,999 | 52 (5.0%) | 20 (6.8%) |
| $25,000 to $34,999 | 245 (23.6%) | 87 (29.7%) |
| $35,000 to $49,999 | 44 (4.2%) | 43 (14.7%) |
| $50,000 to $74,999 | 175 (16.9%) | 39 (13.3%) |
| $75,000 to $99,999 | 177 (17.1%) | 20 (6.8%) |
| $100,000 to $149,999 | 244 (23.5%) | 12 (4.1%) |
| $150,000 or more | 51 (4.9%) | 0 (0.0%) |
| Total | 1,037 (100.0%) | 293 (100.0%) |
Monthly Housing Cost Tiers in Cottondale
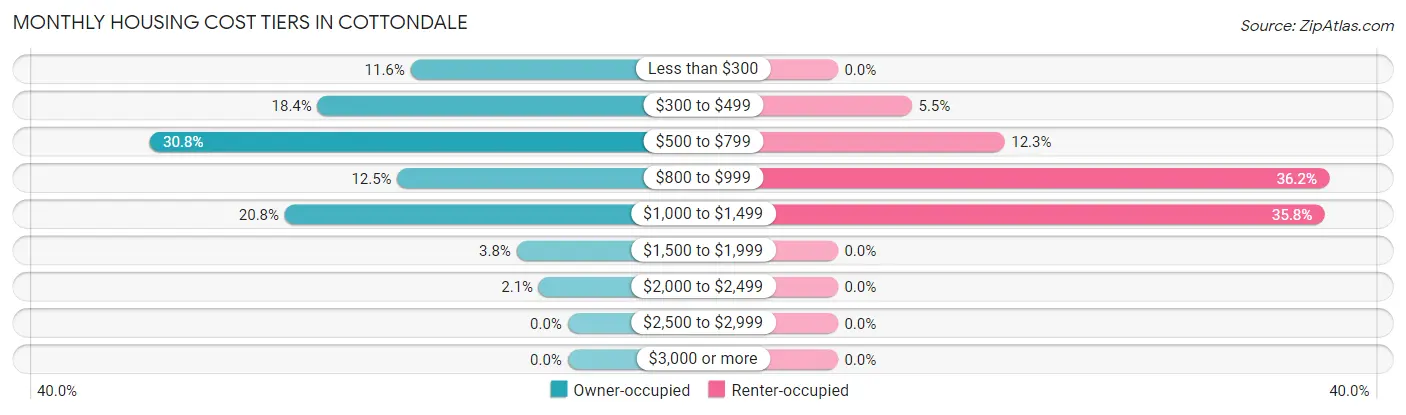
| Monthly Cost | Owner-occupied | Renter-occupied |
| Less than $300 | 120 (11.6%) | 0 (0.0%) |
| $300 to $499 | 191 (18.4%) | 16 (5.5%) |
| $500 to $799 | 319 (30.8%) | 36 (12.3%) |
| $800 to $999 | 130 (12.5%) | 106 (36.2%) |
| $1,000 to $1,499 | 216 (20.8%) | 105 (35.8%) |
| $1,500 to $1,999 | 39 (3.8%) | 0 (0.0%) |
| $2,000 to $2,499 | 22 (2.1%) | 0 (0.0%) |
| $2,500 to $2,999 | 0 (0.0%) | 0 (0.0%) |
| $3,000 or more | 0 (0.0%) | 0 (0.0%) |
| Total | 1,037 (100.0%) | 293 (100.0%) |
Physical Housing Characteristics in Cottondale
Housing Structures in Cottondale
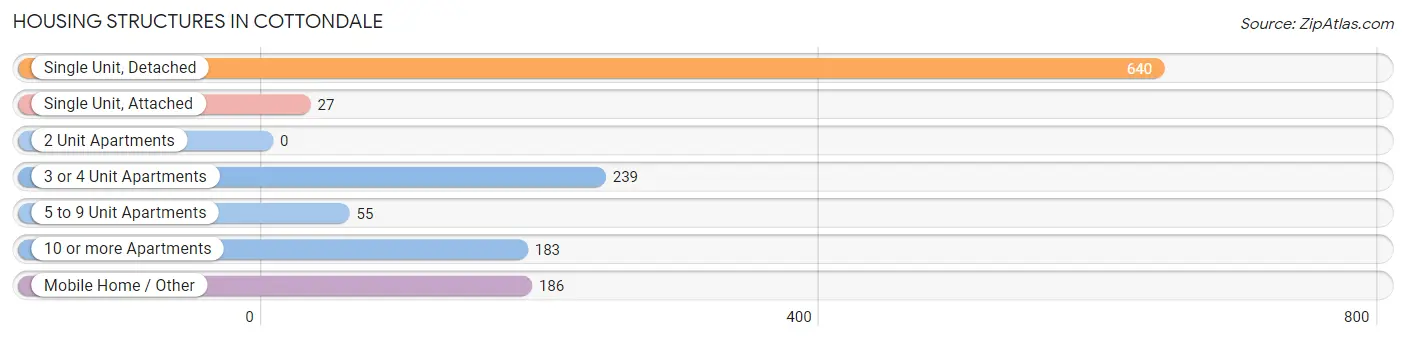
| Structure Type | # Housing Units | % Housing Units |
| Single Unit, Detached | 640 | 48.1% |
| Single Unit, Attached | 27 | 2.0% |
| 2 Unit Apartments | 0 | 0.0% |
| 3 or 4 Unit Apartments | 239 | 18.0% |
| 5 to 9 Unit Apartments | 55 | 4.1% |
| 10 or more Apartments | 183 | 13.8% |
| Mobile Home / Other | 186 | 14.0% |
| Total | 1,330 | 100.0% |
Housing Structures by Occupancy in Cottondale
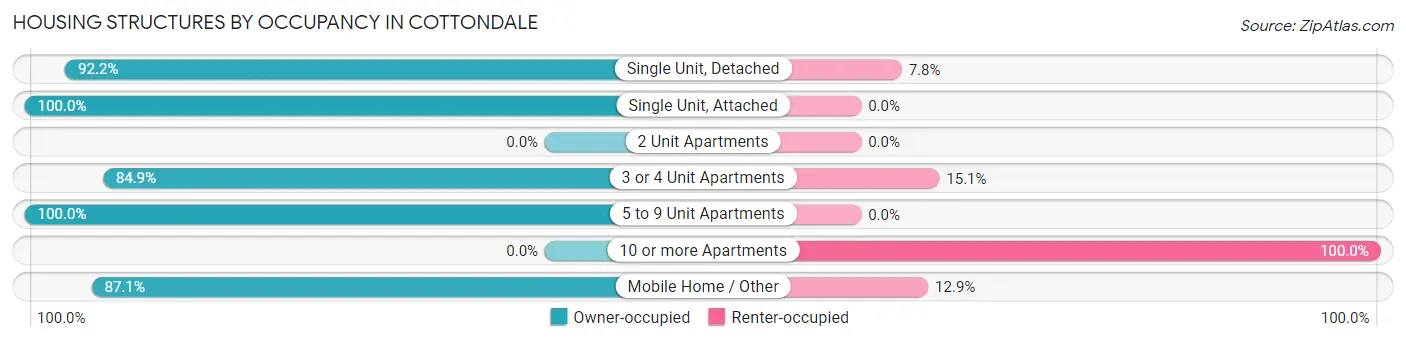
| Structure Type | Owner-occupied | Renter-occupied |
| Single Unit, Detached | 590 (92.2%) | 50 (7.8%) |
| Single Unit, Attached | 27 (100.0%) | 0 (0.0%) |
| 2 Unit Apartments | 0 (0.0%) | 0 (0.0%) |
| 3 or 4 Unit Apartments | 203 (84.9%) | 36 (15.1%) |
| 5 to 9 Unit Apartments | 55 (100.0%) | 0 (0.0%) |
| 10 or more Apartments | 0 (0.0%) | 183 (100.0%) |
| Mobile Home / Other | 162 (87.1%) | 24 (12.9%) |
| Total | 1,037 (78.0%) | 293 (22.0%) |
Housing Structures by Number of Rooms in Cottondale
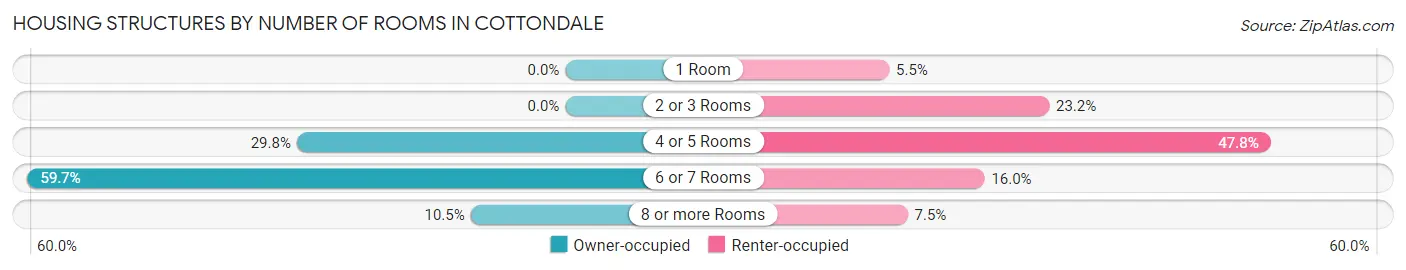
| Number of Rooms | Owner-occupied | Renter-occupied |
| 1 Room | 0 (0.0%) | 16 (5.5%) |
| 2 or 3 Rooms | 0 (0.0%) | 68 (23.2%) |
| 4 or 5 Rooms | 309 (29.8%) | 140 (47.8%) |
| 6 or 7 Rooms | 619 (59.7%) | 47 (16.0%) |
| 8 or more Rooms | 109 (10.5%) | 22 (7.5%) |
| Total | 1,037 (100.0%) | 293 (100.0%) |
Housing Structure by Heating Type in Cottondale
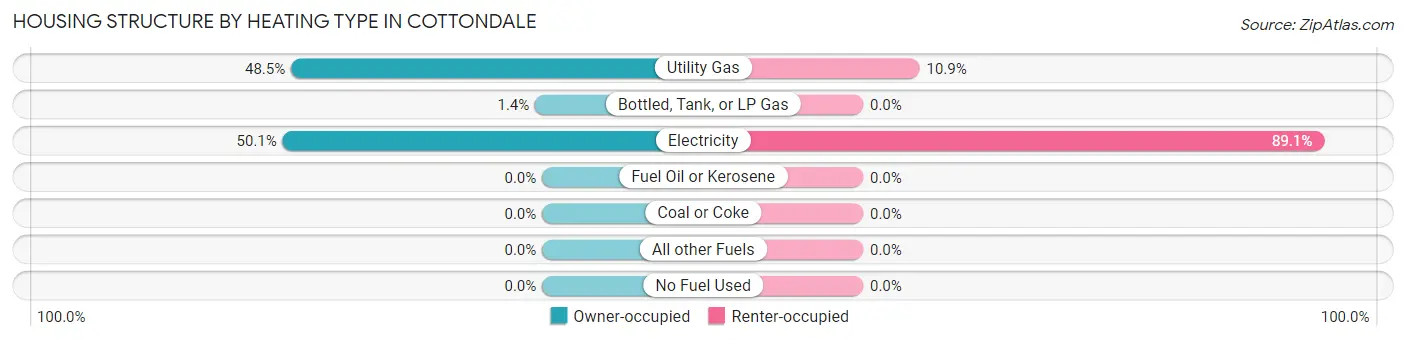
| Heating Type | Owner-occupied | Renter-occupied |
| Utility Gas | 503 (48.5%) | 32 (10.9%) |
| Bottled, Tank, or LP Gas | 14 (1.3%) | 0 (0.0%) |
| Electricity | 520 (50.1%) | 261 (89.1%) |
| Fuel Oil or Kerosene | 0 (0.0%) | 0 (0.0%) |
| Coal or Coke | 0 (0.0%) | 0 (0.0%) |
| All other Fuels | 0 (0.0%) | 0 (0.0%) |
| No Fuel Used | 0 (0.0%) | 0 (0.0%) |
| Total | 1,037 (100.0%) | 293 (100.0%) |
Household Vehicle Usage in Cottondale
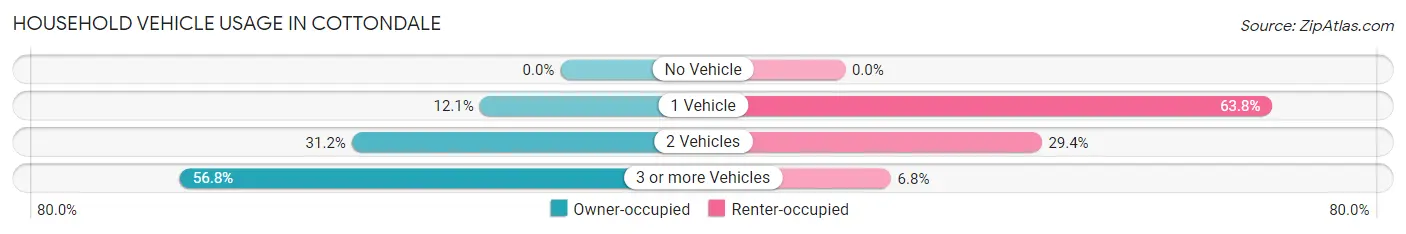
| Vehicles per Household | Owner-occupied | Renter-occupied |
| No Vehicle | 0 (0.0%) | 0 (0.0%) |
| 1 Vehicle | 125 (12.0%) | 187 (63.8%) |
| 2 Vehicles | 323 (31.1%) | 86 (29.3%) |
| 3 or more Vehicles | 589 (56.8%) | 20 (6.8%) |
| Total | 1,037 (100.0%) | 293 (100.0%) |
Real Estate & Mortgages in Cottondale
Real Estate and Mortgage Overview in Cottondale
| Characteristic | Without Mortgage | With Mortgage |
| Housing Units | 428 | 609 |
| Median Property Value | $115,100 | $95,000 |
| Median Household Income | $75,463 | $15 |
| Monthly Housing Costs | $355 | $0 |
| Real Estate Taxes | $348 | $57 |
Property Value by Mortgage Status in Cottondale
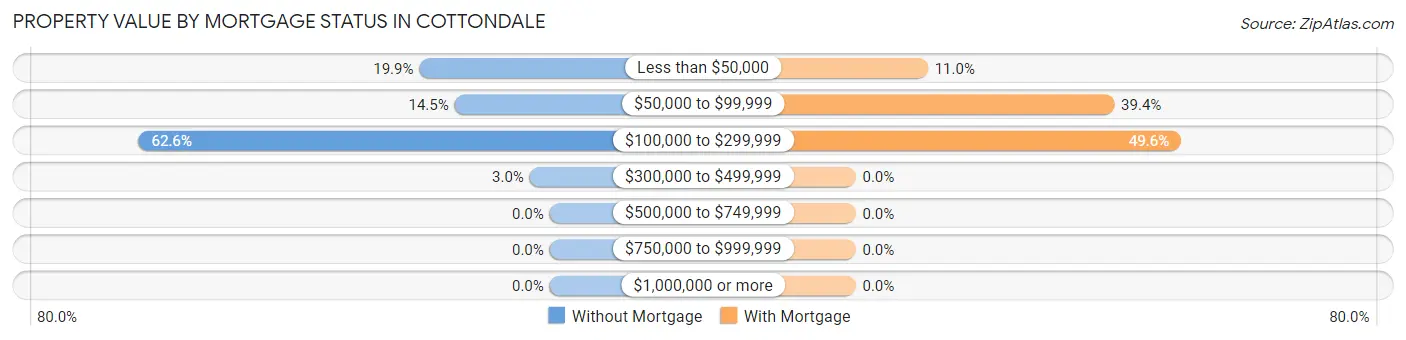
| Property Value | Without Mortgage | With Mortgage |
| Less than $50,000 | 85 (19.9%) | 67 (11.0%) |
| $50,000 to $99,999 | 62 (14.5%) | 240 (39.4%) |
| $100,000 to $299,999 | 268 (62.6%) | 302 (49.6%) |
| $300,000 to $499,999 | 13 (3.0%) | 0 (0.0%) |
| $500,000 to $749,999 | 0 (0.0%) | 0 (0.0%) |
| $750,000 to $999,999 | 0 (0.0%) | 0 (0.0%) |
| $1,000,000 or more | 0 (0.0%) | 0 (0.0%) |
| Total | 428 (100.0%) | 609 (100.0%) |
Household Income by Mortgage Status in Cottondale
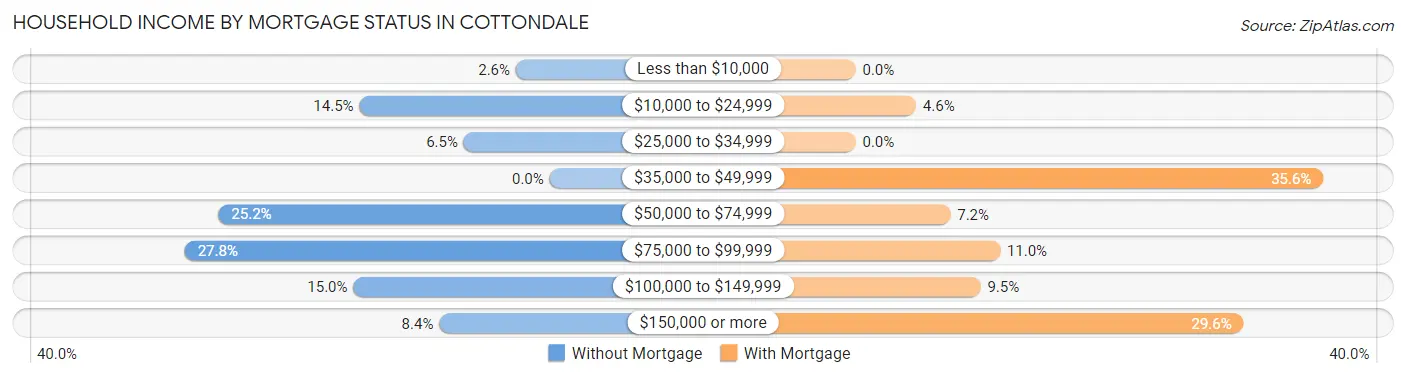
| Household Income | Without Mortgage | With Mortgage |
| Less than $10,000 | 11 (2.6%) | 0 (0.0%) |
| $10,000 to $24,999 | 62 (14.5%) | 28 (4.6%) |
| $25,000 to $34,999 | 28 (6.5%) | 0 (0.0%) |
| $35,000 to $49,999 | 0 (0.0%) | 217 (35.6%) |
| $50,000 to $74,999 | 108 (25.2%) | 44 (7.2%) |
| $75,000 to $99,999 | 119 (27.8%) | 67 (11.0%) |
| $100,000 to $149,999 | 64 (14.9%) | 58 (9.5%) |
| $150,000 or more | 36 (8.4%) | 180 (29.6%) |
| Total | 428 (100.0%) | 609 (100.0%) |
Property Value to Household Income Ratio in Cottondale
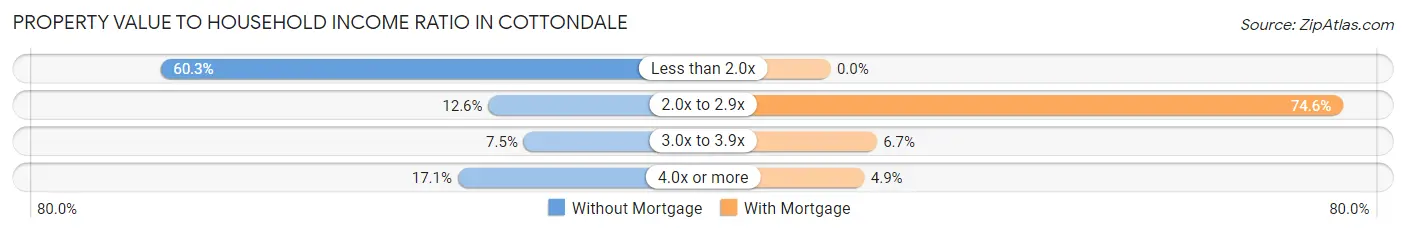
| Value-to-Income Ratio | Without Mortgage | With Mortgage |
| Less than 2.0x | 258 (60.3%) | 0 (0.0%) |
| 2.0x to 2.9x | 54 (12.6%) | 454 (74.6%) |
| 3.0x to 3.9x | 32 (7.5%) | 41 (6.7%) |
| 4.0x or more | 73 (17.1%) | 30 (4.9%) |
| Total | 428 (100.0%) | 609 (100.0%) |
Real Estate Taxes by Mortgage Status in Cottondale
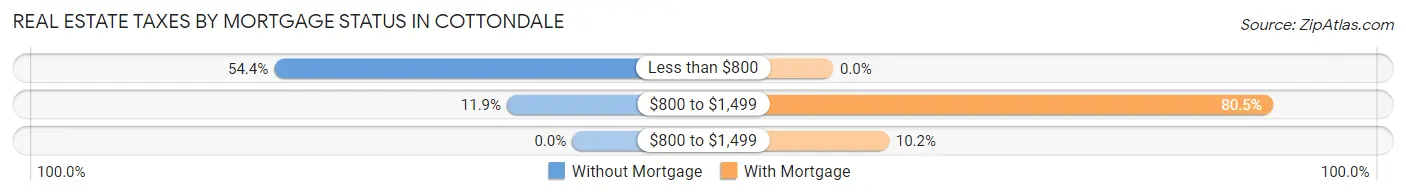
| Property Taxes | Without Mortgage | With Mortgage |
| Less than $800 | 233 (54.4%) | 0 (0.0%) |
| $800 to $1,499 | 51 (11.9%) | 490 (80.5%) |
| $800 to $1,499 | 0 (0.0%) | 62 (10.2%) |
| Total | 428 (100.0%) | 609 (100.0%) |
Health & Disability in Cottondale
Health Insurance Coverage by Age in Cottondale
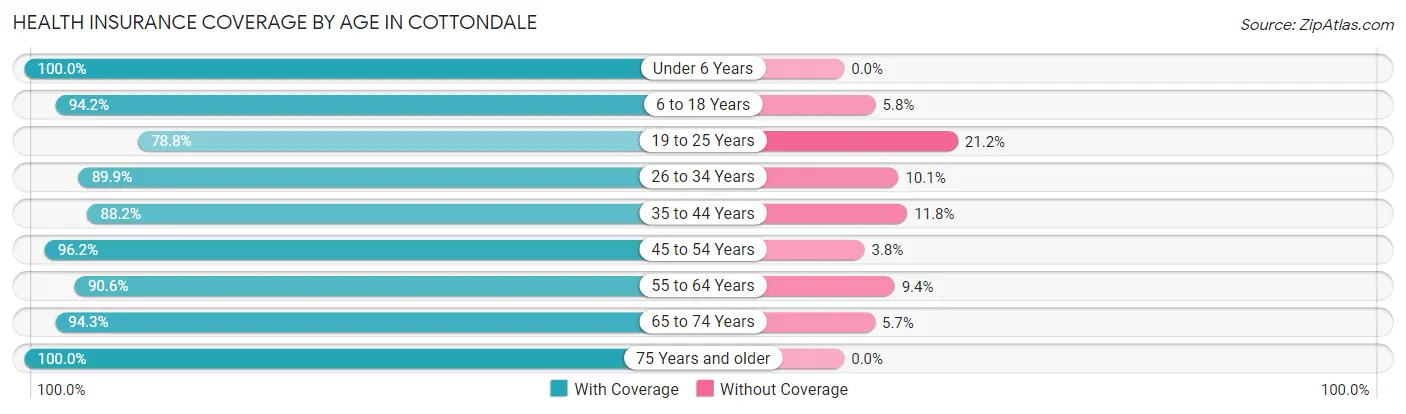
| Age Bracket | With Coverage | Without Coverage |
| Under 6 Years | 104 (100.0%) | 0 (0.0%) |
| 6 to 18 Years | 371 (94.2%) | 23 (5.8%) |
| 19 to 25 Years | 279 (78.8%) | 75 (21.2%) |
| 26 to 34 Years | 347 (89.9%) | 39 (10.1%) |
| 35 to 44 Years | 375 (88.2%) | 50 (11.8%) |
| 45 to 54 Years | 587 (96.2%) | 23 (3.8%) |
| 55 to 64 Years | 530 (90.6%) | 55 (9.4%) |
| 65 to 74 Years | 181 (94.3%) | 11 (5.7%) |
| 75 Years and older | 161 (100.0%) | 0 (0.0%) |
| Total | 2,935 (91.4%) | 276 (8.6%) |
Health Insurance Coverage by Citizenship Status in Cottondale
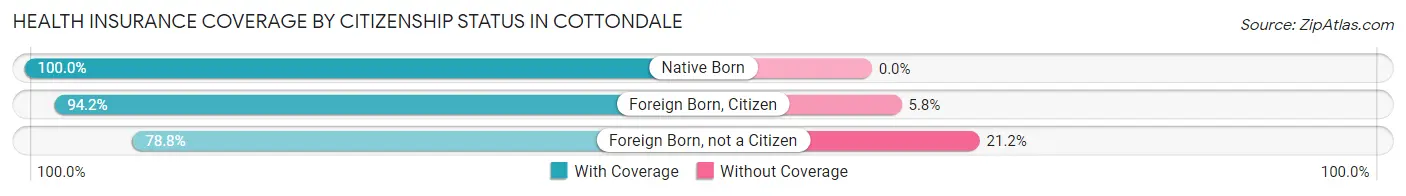
| Citizenship Status | With Coverage | Without Coverage |
| Native Born | 104 (100.0%) | 0 (0.0%) |
| Foreign Born, Citizen | 371 (94.2%) | 23 (5.8%) |
| Foreign Born, not a Citizen | 279 (78.8%) | 75 (21.2%) |
Health Insurance Coverage by Household Income in Cottondale
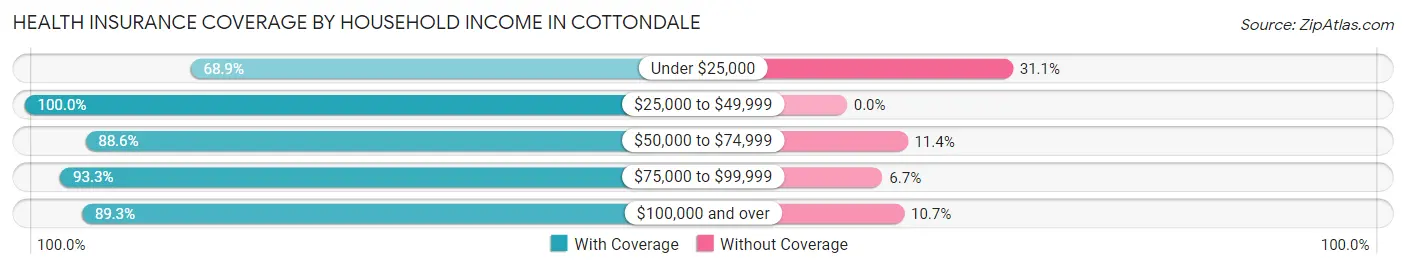
| Household Income | With Coverage | Without Coverage |
| Under $25,000 | 195 (68.9%) | 88 (31.1%) |
| $25,000 to $49,999 | 926 (100.0%) | 0 (0.0%) |
| $50,000 to $74,999 | 374 (88.6%) | 48 (11.4%) |
| $75,000 to $99,999 | 672 (93.3%) | 48 (6.7%) |
| $100,000 and over | 766 (89.3%) | 92 (10.7%) |
Public vs Private Health Insurance Coverage by Age in Cottondale
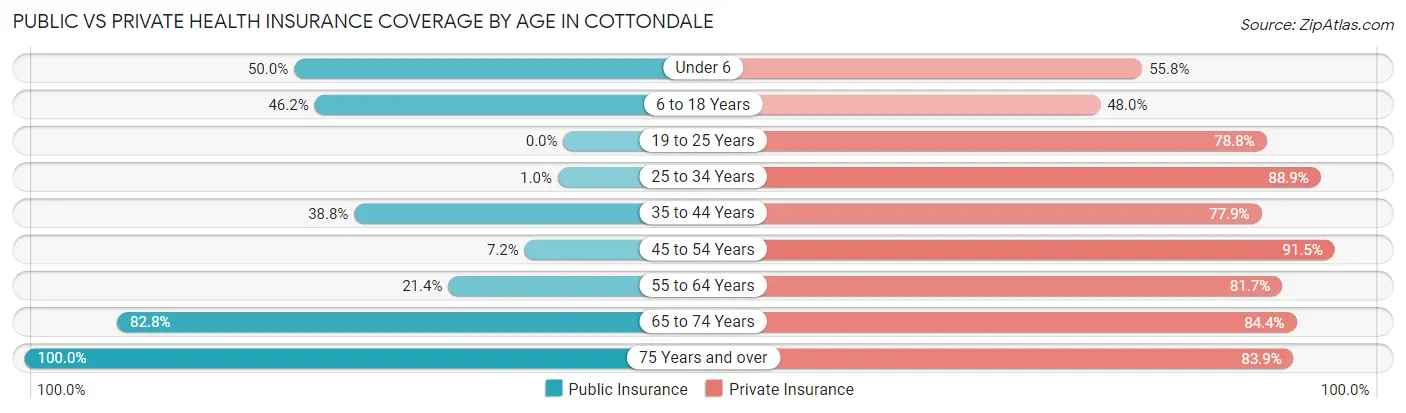
| Age Bracket | Public Insurance | Private Insurance |
| Under 6 | 52 (50.0%) | 58 (55.8%) |
| 6 to 18 Years | 182 (46.2%) | 189 (48.0%) |
| 19 to 25 Years | 0 (0.0%) | 279 (78.8%) |
| 25 to 34 Years | 4 (1.0%) | 343 (88.9%) |
| 35 to 44 Years | 165 (38.8%) | 331 (77.9%) |
| 45 to 54 Years | 44 (7.2%) | 558 (91.5%) |
| 55 to 64 Years | 125 (21.4%) | 478 (81.7%) |
| 65 to 74 Years | 159 (82.8%) | 162 (84.4%) |
| 75 Years and over | 161 (100.0%) | 135 (83.9%) |
| Total | 892 (27.8%) | 2,533 (78.9%) |
Disability Status by Sex by Age in Cottondale
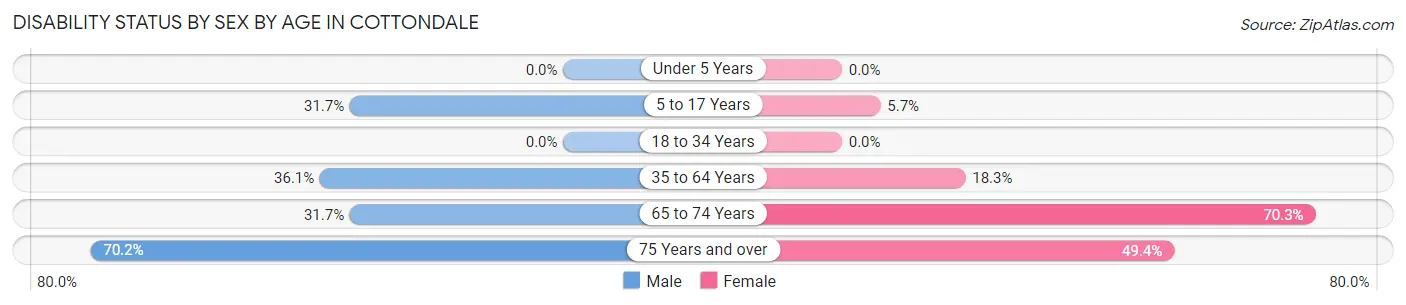
| Age Bracket | Male | Female |
| Under 5 Years | 0 (0.0%) | 0 (0.0%) |
| 5 to 17 Years | 76 (31.7%) | 13 (5.7%) |
| 18 to 34 Years | 0 (0.0%) | 0 (0.0%) |
| 35 to 64 Years | 272 (36.1%) | 159 (18.3%) |
| 65 to 74 Years | 32 (31.7%) | 64 (70.3%) |
| 75 Years and over | 59 (70.2%) | 38 (49.3%) |
Disability Class by Sex by Age in Cottondale
Disability Class: Hearing Difficulty
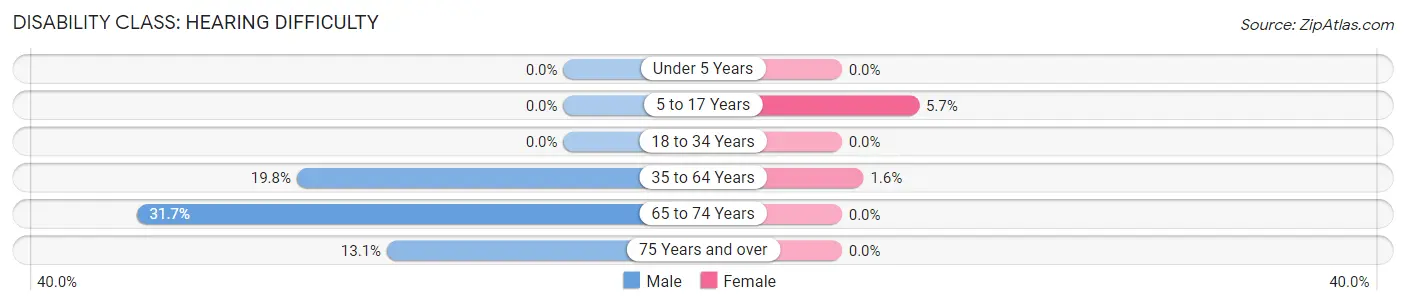
| Age Bracket | Male | Female |
| Under 5 Years | 0 (0.0%) | 0 (0.0%) |
| 5 to 17 Years | 0 (0.0%) | 13 (5.7%) |
| 18 to 34 Years | 0 (0.0%) | 0 (0.0%) |
| 35 to 64 Years | 149 (19.8%) | 14 (1.6%) |
| 65 to 74 Years | 32 (31.7%) | 0 (0.0%) |
| 75 Years and over | 11 (13.1%) | 0 (0.0%) |
Disability Class: Vision Difficulty
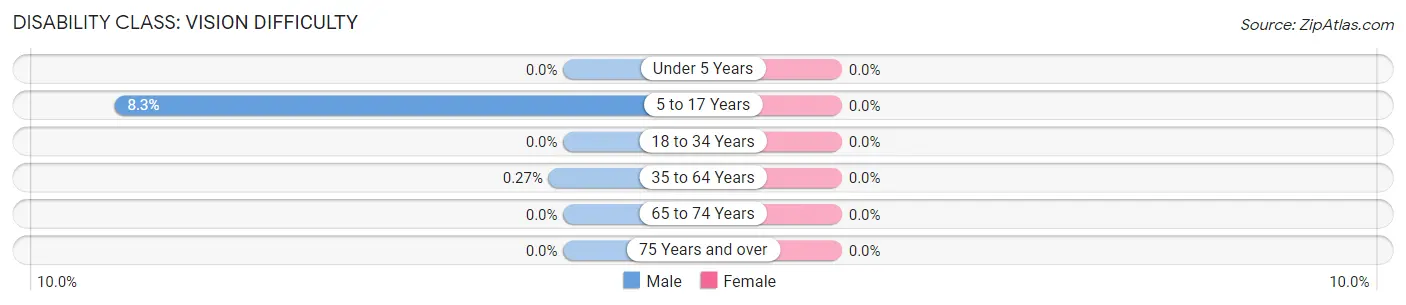
| Age Bracket | Male | Female |
| Under 5 Years | 0 (0.0%) | 0 (0.0%) |
| 5 to 17 Years | 20 (8.3%) | 0 (0.0%) |
| 18 to 34 Years | 0 (0.0%) | 0 (0.0%) |
| 35 to 64 Years | 2 (0.3%) | 0 (0.0%) |
| 65 to 74 Years | 0 (0.0%) | 0 (0.0%) |
| 75 Years and over | 0 (0.0%) | 0 (0.0%) |
Disability Class: Cognitive Difficulty
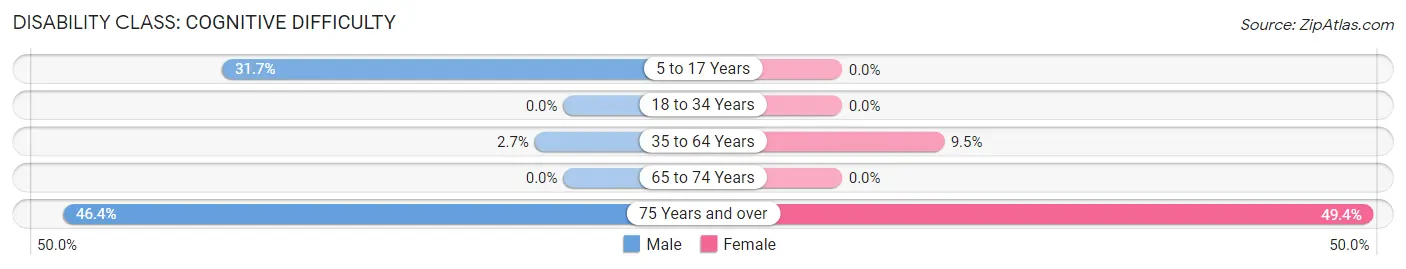
| Age Bracket | Male | Female |
| 5 to 17 Years | 76 (31.7%) | 0 (0.0%) |
| 18 to 34 Years | 0 (0.0%) | 0 (0.0%) |
| 35 to 64 Years | 20 (2.7%) | 82 (9.5%) |
| 65 to 74 Years | 0 (0.0%) | 0 (0.0%) |
| 75 Years and over | 39 (46.4%) | 38 (49.3%) |
Disability Class: Ambulatory Difficulty
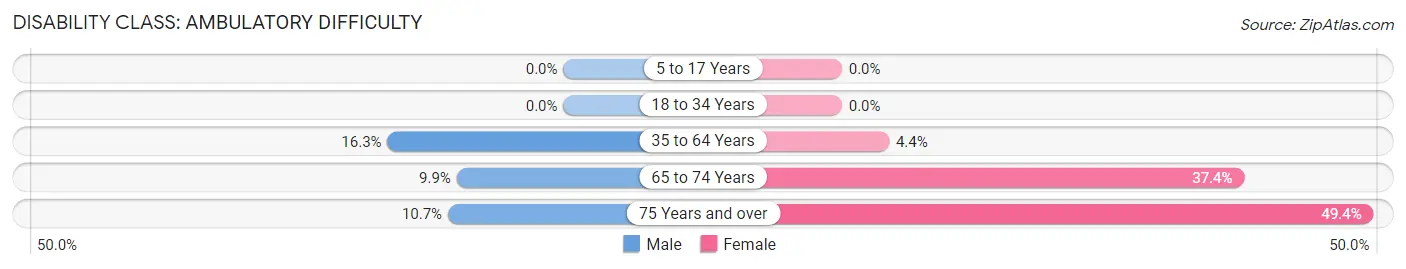
| Age Bracket | Male | Female |
| 5 to 17 Years | 0 (0.0%) | 0 (0.0%) |
| 18 to 34 Years | 0 (0.0%) | 0 (0.0%) |
| 35 to 64 Years | 123 (16.3%) | 38 (4.4%) |
| 65 to 74 Years | 10 (9.9%) | 34 (37.4%) |
| 75 Years and over | 9 (10.7%) | 38 (49.3%) |
Disability Class: Self-Care Difficulty
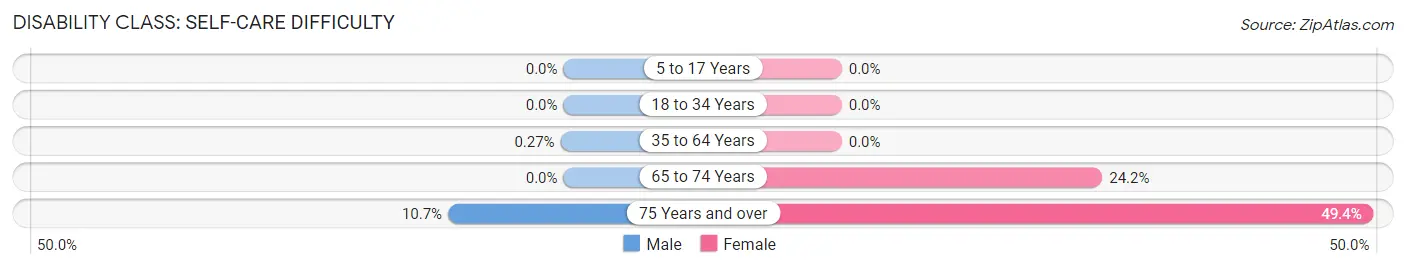
| Age Bracket | Male | Female |
| 5 to 17 Years | 0 (0.0%) | 0 (0.0%) |
| 18 to 34 Years | 0 (0.0%) | 0 (0.0%) |
| 35 to 64 Years | 2 (0.3%) | 0 (0.0%) |
| 65 to 74 Years | 0 (0.0%) | 22 (24.2%) |
| 75 Years and over | 9 (10.7%) | 38 (49.3%) |
Technology Access in Cottondale
Computing Device Access in Cottondale
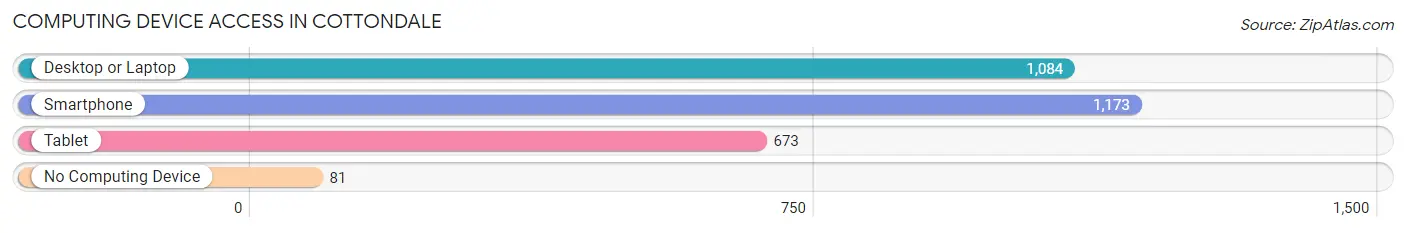
| Device Type | # Households | % Households |
| Desktop or Laptop | 1,084 | 81.5% |
| Smartphone | 1,173 | 88.2% |
| Tablet | 673 | 50.6% |
| No Computing Device | 81 | 6.1% |
| Total | 1,330 | 100.0% |
Internet Access in Cottondale
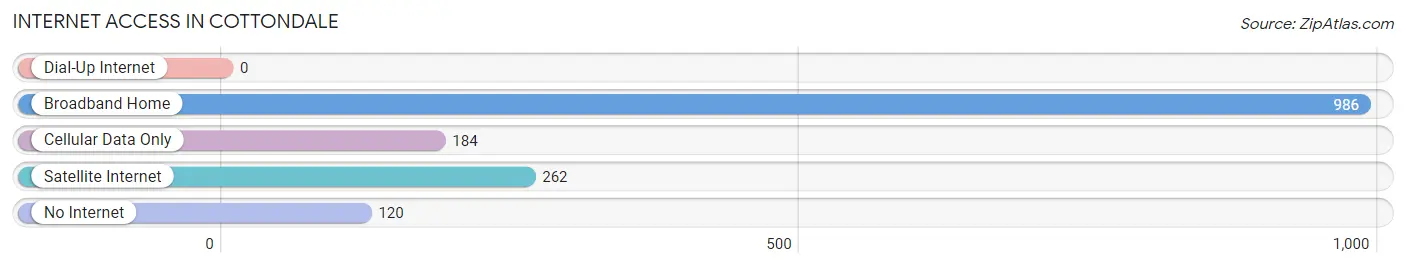
| Internet Type | # Households | % Households |
| Dial-Up Internet | 0 | 0.0% |
| Broadband Home | 986 | 74.1% |
| Cellular Data Only | 184 | 13.8% |
| Satellite Internet | 262 | 19.7% |
| No Internet | 120 | 9.0% |
| Total | 1,330 | 100.0% |
Cottondale Summary
Cottondale is a small town located in Tuscaloosa County, Alabama. It is situated in the western part of the state, approximately 10 miles east of Tuscaloosa. The town was founded in 1881 and was named after the cotton industry that was prevalent in the area at the time. The population of Cottondale was 1,845 as of the 2010 census.
History
Cottondale was founded in 1881 by a group of settlers from Georgia. The town was named after the cotton industry that was prevalent in the area at the time. The first post office was established in 1883 and the town was incorporated in 1887.
The town grew rapidly in the early 20th century, with the population reaching 1,000 by 1910. The town was home to several cotton mills, which provided employment for many of the town’s residents. The town also had a railroad station, which connected it to other parts of the state.
The town experienced a decline in the mid-20th century, as the cotton industry declined and the railroad station closed. The population of Cottondale decreased to just over 1,000 by the 1970s.
Geography
Cottondale is located in western Tuscaloosa County, approximately 10 miles east of Tuscaloosa. The town is situated at the intersection of U.S. Route 11 and Alabama State Route 216. The town is located in the Black Warrior River Valley, which is part of the Appalachian Mountains.
The town has a total area of 2.2 square miles, all of which is land. The town is located at an elevation of 545 feet above sea level.
Economy
The economy of Cottondale is largely based on agriculture. The town is home to several farms, which produce a variety of crops, including cotton, corn, soybeans, and wheat. The town is also home to several small businesses, including restaurants, retail stores, and service providers.
The town is also home to several manufacturing companies, including a paper mill and a furniture factory. The town is also home to a number of educational institutions, including a community college and a technical school.
Demographics
As of the 2010 census, the population of Cottondale was 1,845. The racial makeup of the town was 79.3% White, 17.7% African American, 0.3% Native American, 0.2% Asian, 0.1% Pacific Islander, 0.7% from other races, and 1.9% from two or more races. Hispanic or Latino of any race were 2.2% of the population.
The median income for a household in the town was $30,938, and the median income for a family was $37,813. The per capita income for the town was $15,945. About 17.2% of families and 20.3% of the population were below the poverty line, including 28.3% of those under age 18 and 15.2% of those age 65 or over.
Common Questions
What is Per Capita Income in Cottondale?
Per Capita income in Cottondale is $28,402.
What is the Median Family Income in Cottondale?
Median Family Income in Cottondale is $76,250.
What is the Median Household income in Cottondale?
Median Household Income in Cottondale is $54,688.
What is Income or Wage Gap in Cottondale?
Income or Wage Gap in Cottondale is 37.1%.
Women in Cottondale earn 62.9 cents for every dollar earned by a man.
What is Inequality or Gini Index in Cottondale?
Inequality or Gini Index in Cottondale is 0.37.
What is the Total Population of Cottondale?
Total Population of Cottondale is 3,211.
What is the Total Male Population of Cottondale?
Total Male Population of Cottondale is 1,664.
What is the Total Female Population of Cottondale?
Total Female Population of Cottondale is 1,547.
What is the Ratio of Males per 100 Females in Cottondale?
There are 107.56 Males per 100 Females in Cottondale.
What is the Ratio of Females per 100 Males in Cottondale?
There are 92.97 Females per 100 Males in Cottondale.
What is the Median Population Age in Cottondale?
Median Population Age in Cottondale is 43.5 Years.
What is the Average Family Size in Cottondale
Average Family Size in Cottondale is 2.6 People.
What is the Average Household Size in Cottondale
Average Household Size in Cottondale is 2.4 People.
How Large is the Labor Force in Cottondale?
There are 1,495 People in the Labor Forcein in Cottondale.
What is the Percentage of People in the Labor Force in Cottondale?
53.2% of People are in the Labor Force in Cottondale.
What is the Unemployment Rate in Cottondale?
Unemployment Rate in Cottondale is 5.3%.