Columbiana, AL Map & Demographics
Columbiana Map
Columbiana Overview
$27,560
PER CAPITA INCOME
$77,480
AVG FAMILY INCOME
$58,214
AVG HOUSEHOLD INCOME
0.5%
WAGE / INCOME GAP [ % ]
99.5¢/ $1
WAGE / INCOME GAP [ $ ]
$8,016
FAMILY INCOME DEFICIT
0.45
INEQUALITY / GINI INDEX
4,552
TOTAL POPULATION
2,472
MALE POPULATION
2,080
FEMALE POPULATION
118.85
MALES / 100 FEMALES
84.14
FEMALES / 100 MALES
43.6
MEDIAN AGE
2.9
AVG FAMILY SIZE
2.3
AVG HOUSEHOLD SIZE
1,846
LABOR FORCE [ PEOPLE ]
46.4%
PERCENT IN LABOR FORCE
0.9%
UNEMPLOYMENT RATE
Columbiana Zip Codes
Columbiana Area Codes
Income in Columbiana
Income Overview in Columbiana
Per Capita Income in Columbiana is $27,560, while median incomes of families and households are $77,480 and $58,214 respectively.
| Characteristic | Number | Measure |
| Per Capita Income | 4,552 | $27,560 |
| Median Family Income | 1,009 | $77,480 |
| Mean Family Income | 1,009 | $93,713 |
| Median Household Income | 1,486 | $58,214 |
| Mean Household Income | 1,486 | $74,984 |
| Income Deficit | 1,009 | $8,016 |
| Wage / Income Gap (%) | 4,552 | 0.52% |
| Wage / Income Gap ($) | 4,552 | 99.48¢ per $1 |
| Gini / Inequality Index | 4,552 | 0.45 |
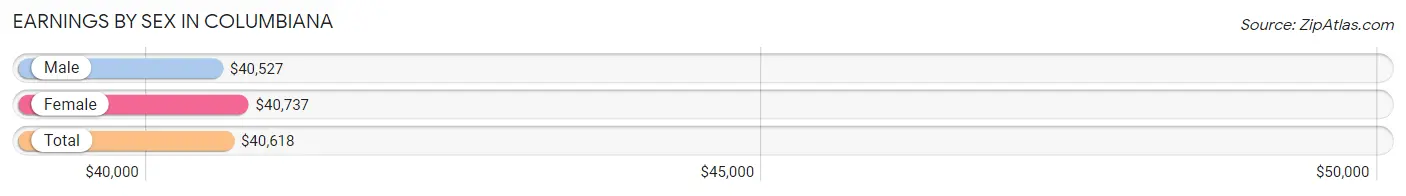
Earnings by Sex in Columbiana
Average Earnings in Columbiana are $40,618, $40,527 for men and $40,737 for women, a difference of 0.5%.
| Sex | Number | Average Earnings |
| Male | 1,205 (54.2%) | $40,527 |
| Female | 1,020 (45.8%) | $40,737 |
| Total | 2,225 (100.0%) | $40,618 |
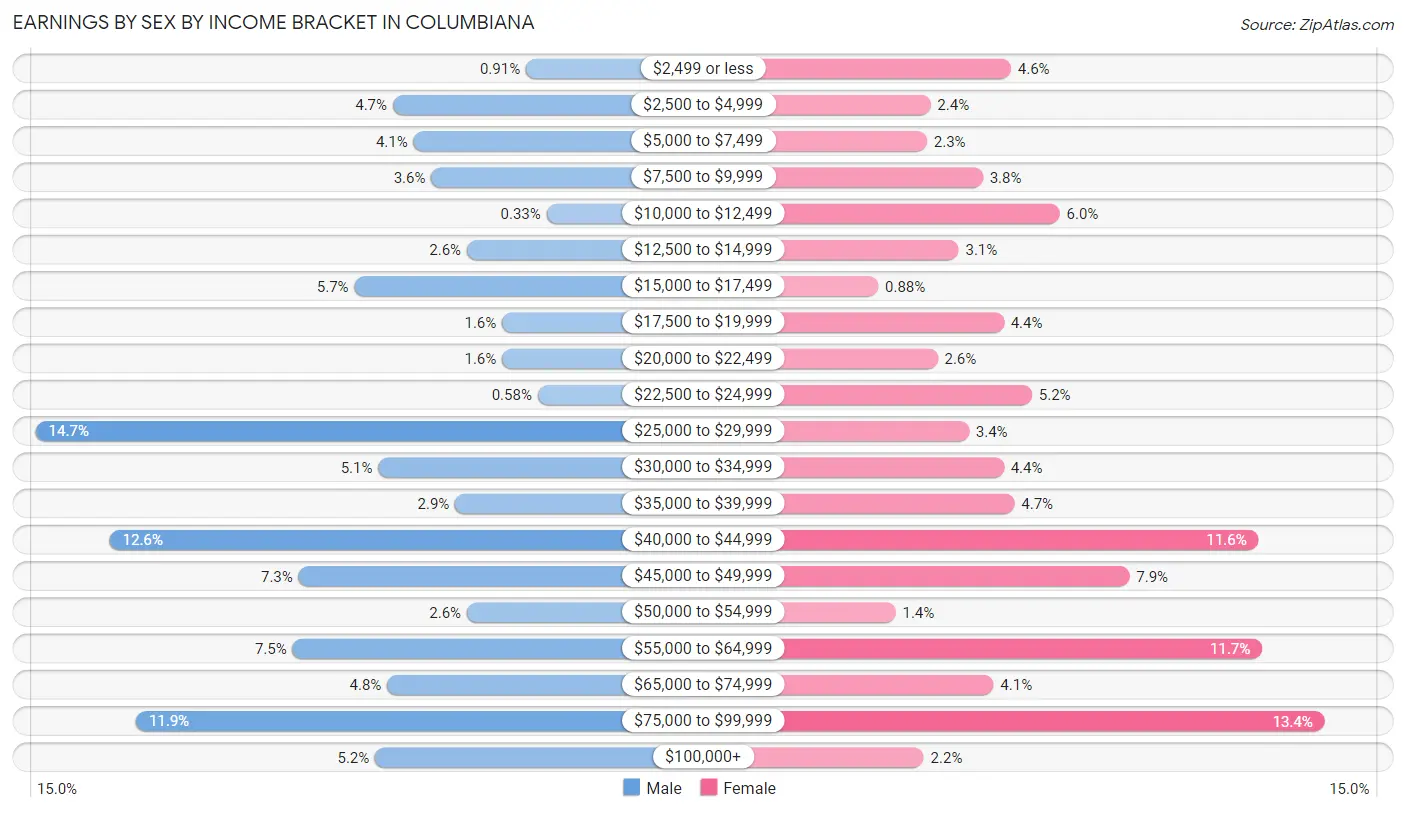
Earnings by Sex by Income Bracket in Columbiana
The most common earnings brackets in Columbiana are $25,000 to $29,999 for men (177 | 14.7%) and $75,000 to $99,999 for women (137 | 13.4%).
| Income | Male | Female |
| $2,499 or less | 11 (0.9%) | 47 (4.6%) |
| $2,500 to $4,999 | 56 (4.6%) | 24 (2.4%) |
| $5,000 to $7,499 | 49 (4.1%) | 23 (2.2%) |
| $7,500 to $9,999 | 43 (3.6%) | 39 (3.8%) |
| $10,000 to $12,499 | 4 (0.3%) | 61 (6.0%) |
| $12,500 to $14,999 | 31 (2.6%) | 32 (3.1%) |
| $15,000 to $17,499 | 69 (5.7%) | 9 (0.9%) |
| $17,500 to $19,999 | 19 (1.6%) | 45 (4.4%) |
| $20,000 to $22,499 | 19 (1.6%) | 26 (2.5%) |
| $22,500 to $24,999 | 7 (0.6%) | 53 (5.2%) |
| $25,000 to $29,999 | 177 (14.7%) | 35 (3.4%) |
| $30,000 to $34,999 | 61 (5.1%) | 45 (4.4%) |
| $35,000 to $39,999 | 35 (2.9%) | 48 (4.7%) |
| $40,000 to $44,999 | 152 (12.6%) | 118 (11.6%) |
| $45,000 to $49,999 | 88 (7.3%) | 81 (7.9%) |
| $50,000 to $54,999 | 31 (2.6%) | 14 (1.4%) |
| $55,000 to $64,999 | 90 (7.5%) | 119 (11.7%) |
| $65,000 to $74,999 | 58 (4.8%) | 42 (4.1%) |
| $75,000 to $99,999 | 143 (11.9%) | 137 (13.4%) |
| $100,000+ | 62 (5.1%) | 22 (2.2%) |
| Total | 1,205 (100.0%) | 1,020 (100.0%) |
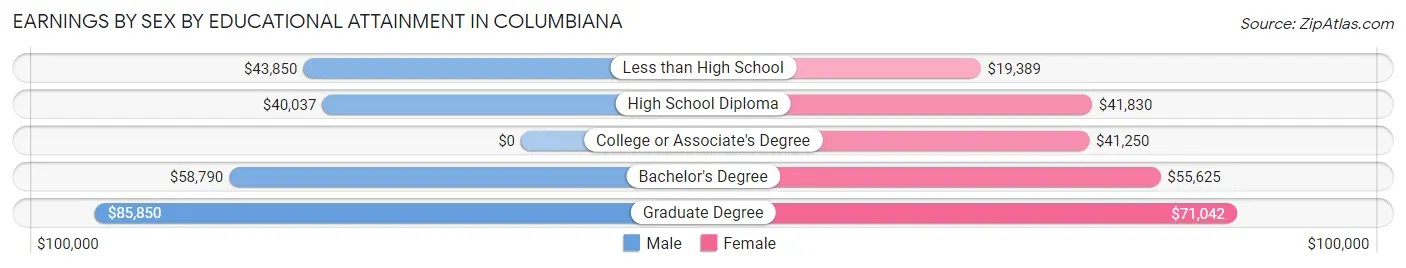
Earnings by Sex by Educational Attainment in Columbiana
Average earnings in Columbiana are $40,907 for men and $42,340 for women, a difference of 3.4%. Men with an educational attainment of graduate degree enjoy the highest average annual earnings of $85,850, while those with high school diploma education earn the least with $40,037. Women with an educational attainment of graduate degree earn the most with the average annual earnings of $71,042, while those with less than high school education have the smallest earnings of $19,389.
| Educational Attainment | Male Income | Female Income |
| Less than High School | $43,850 | $19,389 |
| High School Diploma | $40,037 | $41,830 |
| College or Associate's Degree | - | - |
| Bachelor's Degree | $58,790 | $55,625 |
| Graduate Degree | $85,850 | $71,042 |
| Total | $40,907 | $42,340 |
Family Income in Columbiana
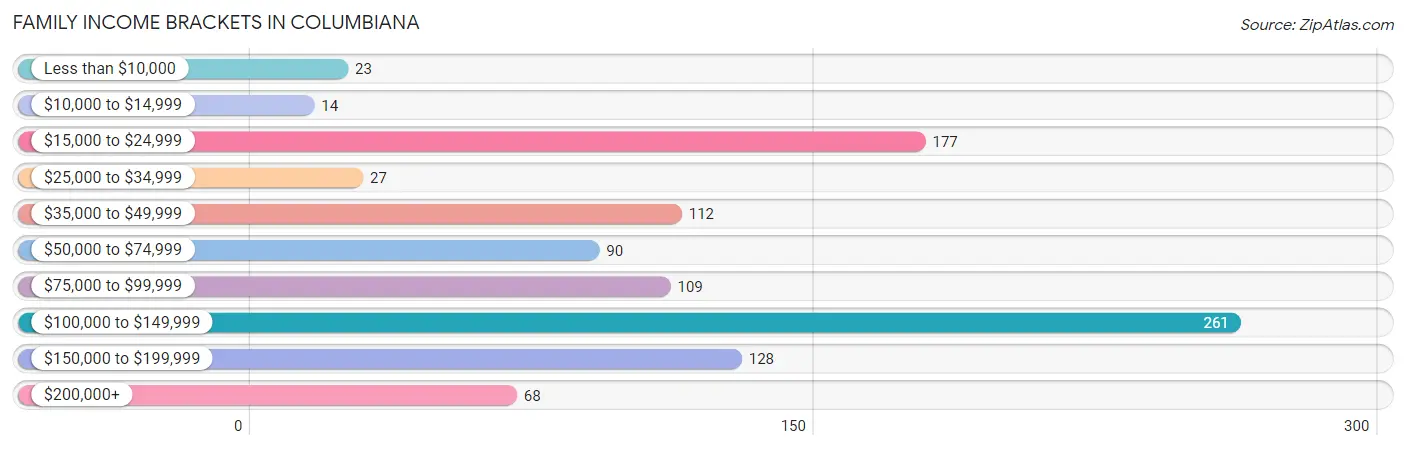
Family Income Brackets in Columbiana
According to the Columbiana family income data, there are 261 families falling into the $100,000 to $149,999 income range, which is the most common income bracket and makes up 25.9% of all families. Conversely, the $10,000 to $14,999 income bracket is the least frequent group with only 14 families (1.4%) belonging to this category.
| Income Bracket | # Families | % Families |
| Less than $10,000 | 23 | 2.3% |
| $10,000 to $14,999 | 14 | 1.4% |
| $15,000 to $24,999 | 177 | 17.5% |
| $25,000 to $34,999 | 27 | 2.7% |
| $35,000 to $49,999 | 112 | 11.1% |
| $50,000 to $74,999 | 90 | 8.9% |
| $75,000 to $99,999 | 109 | 10.8% |
| $100,000 to $149,999 | 261 | 25.9% |
| $150,000 to $199,999 | 128 | 12.7% |
| $200,000+ | 68 | 6.7% |
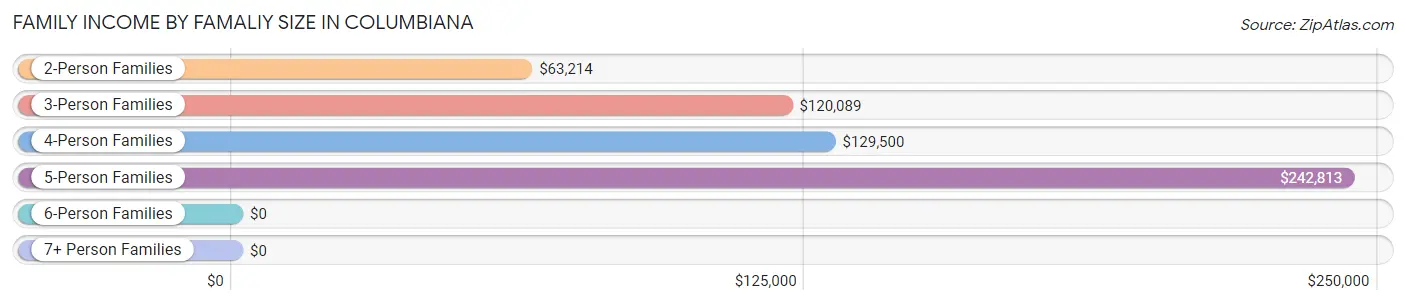
Family Income by Famaliy Size in Columbiana
5-person families (28 | 2.8%) account for the highest median family income in Columbiana with $242,813 per family, while 5-person families (28 | 2.8%) have the highest median income of $48,563 per family member.
| Income Bracket | # Families | Median Income |
| 2-Person Families | 726 (72.0%) | $63,214 |
| 3-Person Families | 115 (11.4%) | $120,089 |
| 4-Person Families | 62 (6.1%) | $129,500 |
| 5-Person Families | 28 (2.8%) | $242,813 |
| 6-Person Families | 78 (7.7%) | $0 |
| 7+ Person Families | 0 (0.0%) | $0 |
| Total | 1,009 (100.0%) | $77,480 |
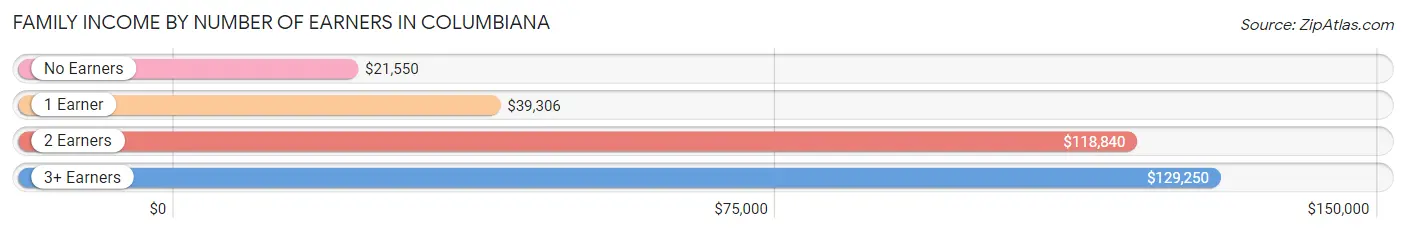
Family Income by Number of Earners in Columbiana
The median family income in Columbiana is $77,480, with families comprising 3+ earners (77) having the highest median family income of $129,250, while families with no earners (210) have the lowest median family income of $21,550, accounting for 7.6% and 20.8% of families, respectively.
| Number of Earners | # Families | Median Income |
| No Earners | 210 (20.8%) | $21,550 |
| 1 Earner | 251 (24.9%) | $39,306 |
| 2 Earners | 471 (46.7%) | $118,840 |
| 3+ Earners | 77 (7.6%) | $129,250 |
| Total | 1,009 (100.0%) | $77,480 |
Household Income in Columbiana
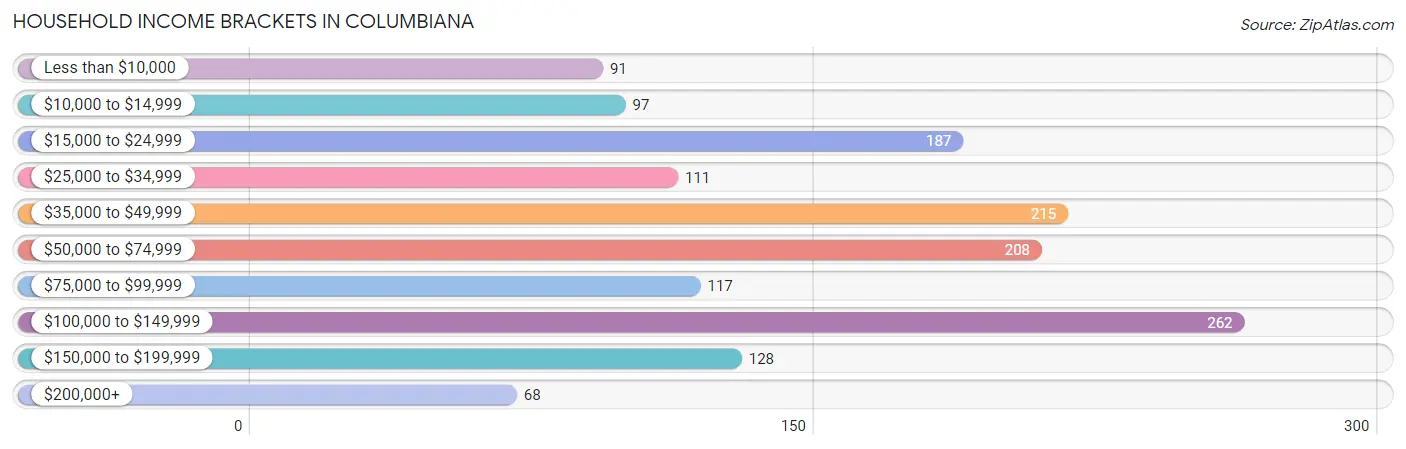
Household Income Brackets in Columbiana
With 262 households falling in the category, the $100,000 to $149,999 income range is the most frequent in Columbiana, accounting for 17.6% of all households. In contrast, only 68 households (4.6%) fall into the $200,000+ income bracket, making it the least populous group.
| Income Bracket | # Households | % Households |
| Less than $10,000 | 91 | 6.1% |
| $10,000 to $14,999 | 97 | 6.5% |
| $15,000 to $24,999 | 187 | 12.6% |
| $25,000 to $34,999 | 111 | 7.5% |
| $35,000 to $49,999 | 215 | 14.5% |
| $50,000 to $74,999 | 208 | 14.0% |
| $75,000 to $99,999 | 117 | 7.9% |
| $100,000 to $149,999 | 262 | 17.6% |
| $150,000 to $199,999 | 128 | 8.6% |
| $200,000+ | 68 | 4.6% |
Household Income by Householder Age in Columbiana
The median household income in Columbiana is $58,214, with the highest median household income of $69,426 found in the 25 to 44 years age bracket for the primary householder. A total of 307 households (20.7%) fall into this category.
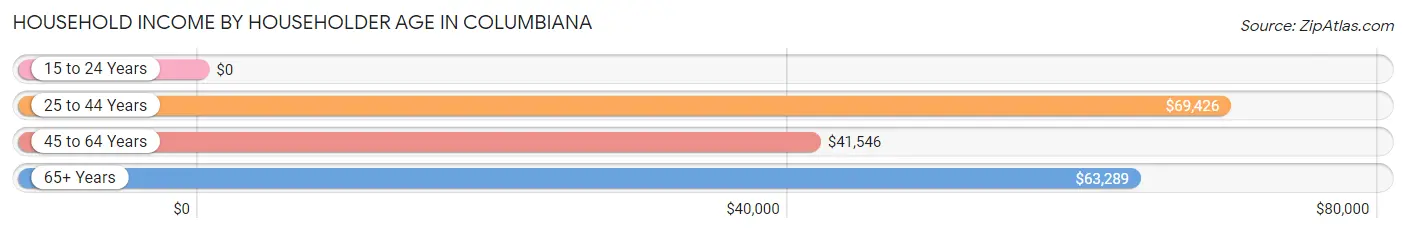
| Income Bracket | # Households | Median Income |
| 15 to 24 Years | 0 (0.0%) | $0 |
| 25 to 44 Years | 307 (20.7%) | $69,426 |
| 45 to 64 Years | 857 (57.7%) | $41,546 |
| 65+ Years | 322 (21.7%) | $63,289 |
| Total | 1,486 (100.0%) | $58,214 |
Poverty in Columbiana
Income Below Poverty by Sex and Age in Columbiana
With 8.3% poverty level for males and 11.2% for females among the residents of Columbiana, under 5 year old males and 55 to 64 year old females are the most vulnerable to poverty, with 26 males (61.9%) and 121 females (24.6%) in their respective age groups living below the poverty level.
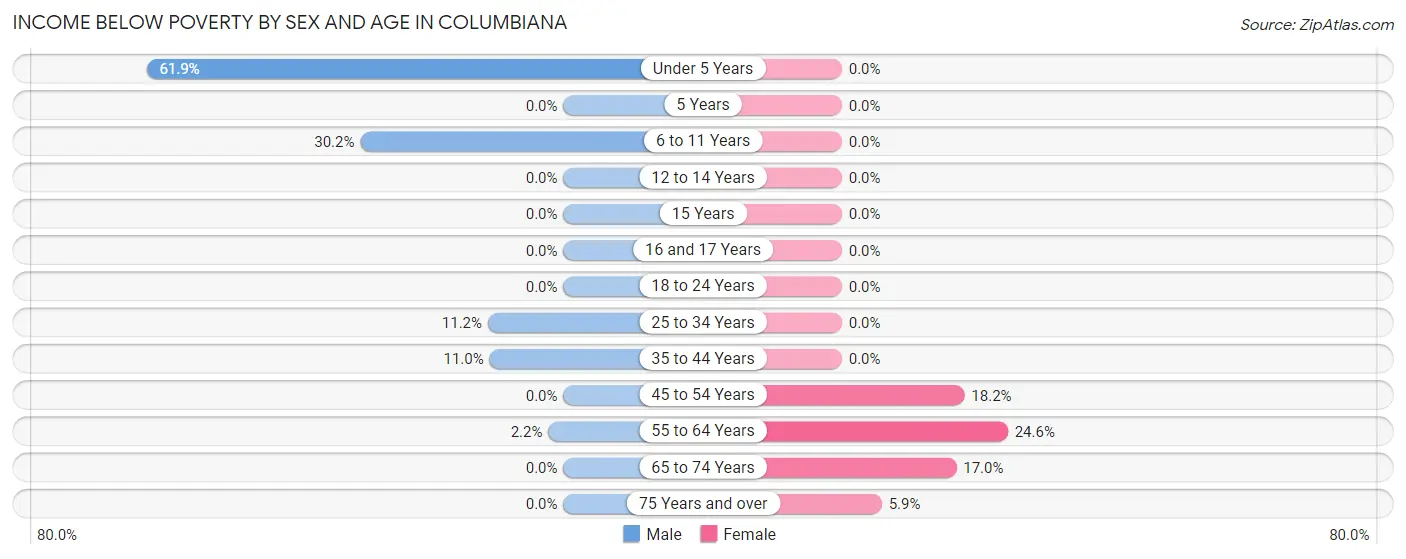
| Age Bracket | Male | Female |
| Under 5 Years | 26 (61.9%) | 0 (0.0%) |
| 5 Years | 0 (0.0%) | 0 (0.0%) |
| 6 to 11 Years | 41 (30.1%) | 0 (0.0%) |
| 12 to 14 Years | 0 (0.0%) | 0 (0.0%) |
| 15 Years | 0 (0.0%) | 0 (0.0%) |
| 16 and 17 Years | 0 (0.0%) | 0 (0.0%) |
| 18 to 24 Years | 0 (0.0%) | 0 (0.0%) |
| 25 to 34 Years | 38 (11.2%) | 0 (0.0%) |
| 35 to 44 Years | 16 (11.0%) | 0 (0.0%) |
| 45 to 54 Years | 0 (0.0%) | 51 (18.2%) |
| 55 to 64 Years | 7 (2.2%) | 121 (24.6%) |
| 65 to 74 Years | 0 (0.0%) | 34 (17.0%) |
| 75 Years and over | 0 (0.0%) | 8 (5.9%) |
| Total | 128 (8.3%) | 214 (11.2%) |
Income Above Poverty by Sex and Age in Columbiana
According to the poverty statistics in Columbiana, males aged 5 years and females aged under 5 years are the age groups that are most secure financially, with 100.0% of males and 100.0% of females in these age groups living above the poverty line.
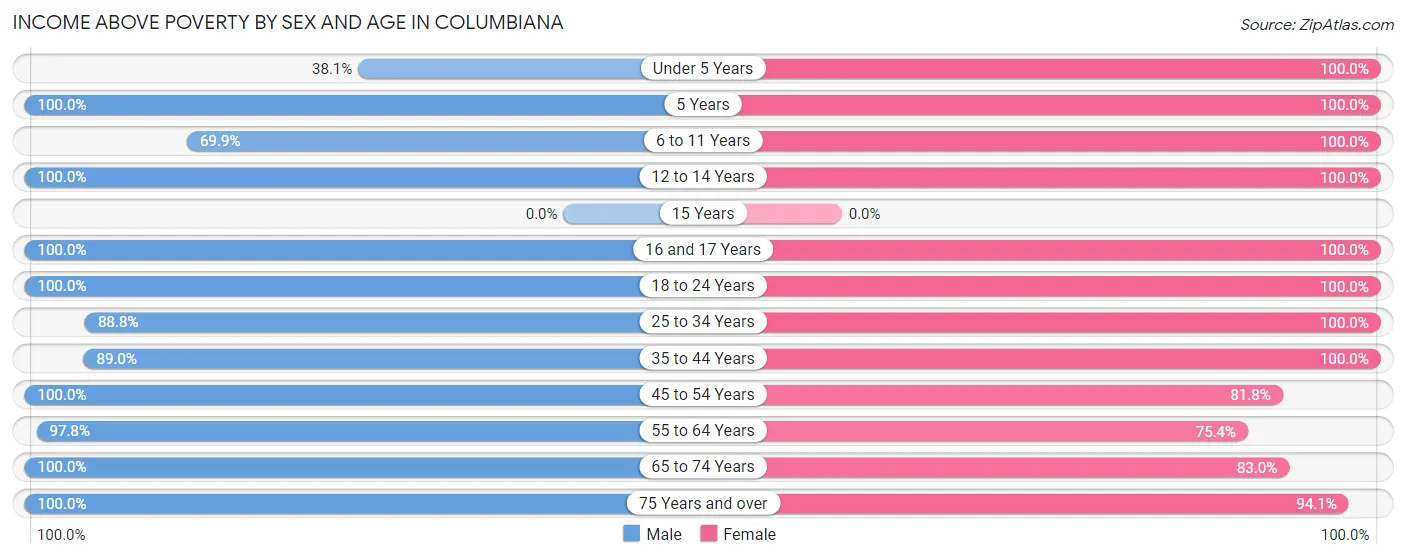
| Age Bracket | Male | Female |
| Under 5 Years | 16 (38.1%) | 74 (100.0%) |
| 5 Years | 34 (100.0%) | 50 (100.0%) |
| 6 to 11 Years | 95 (69.9%) | 50 (100.0%) |
| 12 to 14 Years | 89 (100.0%) | 98 (100.0%) |
| 15 Years | 0 (0.0%) | 0 (0.0%) |
| 16 and 17 Years | 34 (100.0%) | 132 (100.0%) |
| 18 to 24 Years | 34 (100.0%) | 86 (100.0%) |
| 25 to 34 Years | 301 (88.8%) | 98 (100.0%) |
| 35 to 44 Years | 130 (89.0%) | 226 (100.0%) |
| 45 to 54 Years | 193 (100.0%) | 229 (81.8%) |
| 55 to 64 Years | 305 (97.8%) | 370 (75.4%) |
| 65 to 74 Years | 151 (100.0%) | 166 (83.0%) |
| 75 Years and over | 28 (100.0%) | 127 (94.1%) |
| Total | 1,410 (91.7%) | 1,706 (88.8%) |
Income Below Poverty Among Married-Couple Families in Columbiana
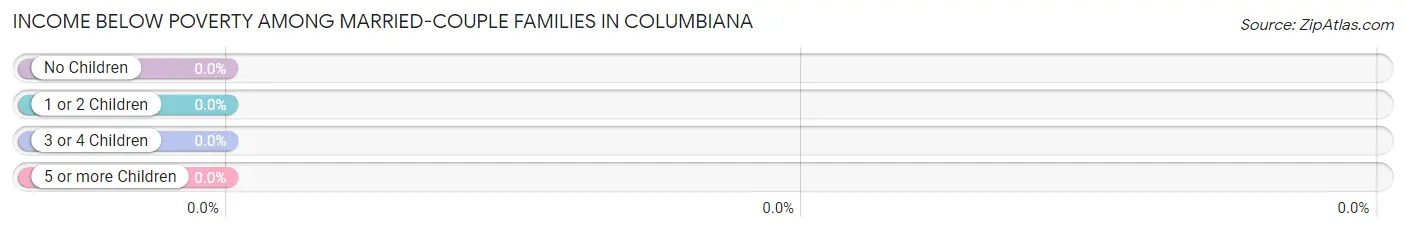
| Children | Above Poverty | Below Poverty |
| No Children | 522 (100.0%) | 0 (0.0%) |
| 1 or 2 Children | 86 (100.0%) | 0 (0.0%) |
| 3 or 4 Children | 78 (100.0%) | 0 (0.0%) |
| 5 or more Children | 0 (0.0%) | 0 (0.0%) |
| Total | 686 (100.0%) | 0 (0.0%) |
Income Below Poverty Among Single-Parent Households in Columbiana
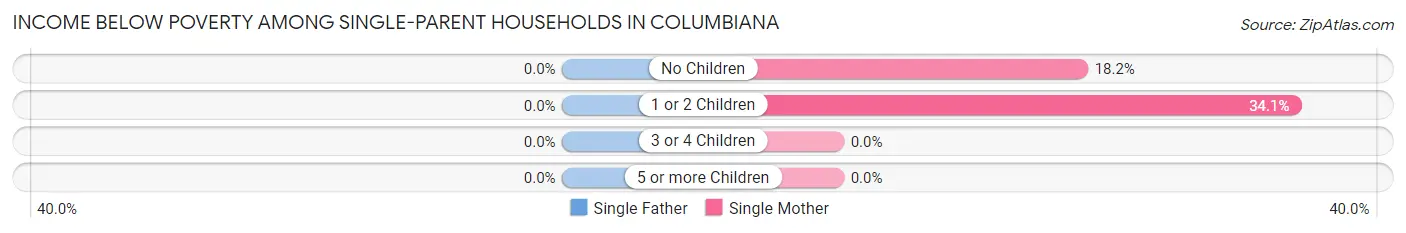
| Children | Single Father | Single Mother |
| No Children | 0 (0.0%) | 14 (18.2%) |
| 1 or 2 Children | 0 (0.0%) | 60 (34.1%) |
| 3 or 4 Children | 0 (0.0%) | 0 (0.0%) |
| 5 or more Children | 0 (0.0%) | 0 (0.0%) |
| Total | 0 (0.0%) | 74 (27.5%) |
Income Below Poverty Among Married-Couple vs Single-Parent Households in Columbiana
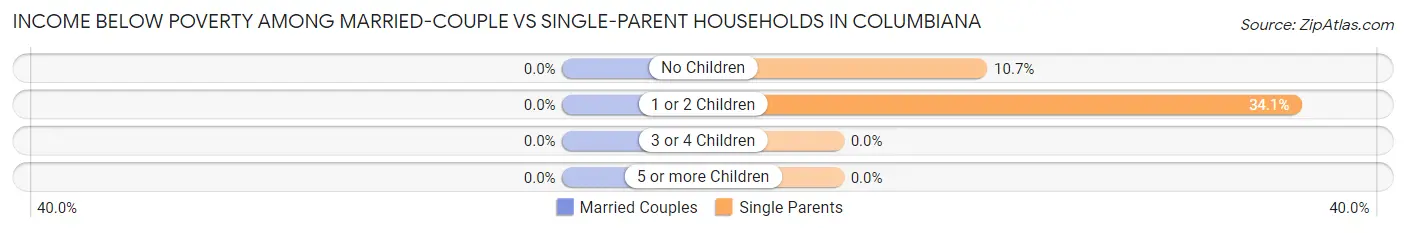
| Children | Married-Couple Families | Single-Parent Households |
| No Children | 0 (0.0%) | 14 (10.7%) |
| 1 or 2 Children | 0 (0.0%) | 60 (34.1%) |
| 3 or 4 Children | 0 (0.0%) | 0 (0.0%) |
| 5 or more Children | 0 (0.0%) | 0 (0.0%) |
| Total | 0 (0.0%) | 74 (22.9%) |
Race in Columbiana
The most populous races in Columbiana are White / Caucasian (3,185 | 70.0%), Black / African American (1,136 | 25.0%), and Hispanic or Latino (198 | 4.3%).
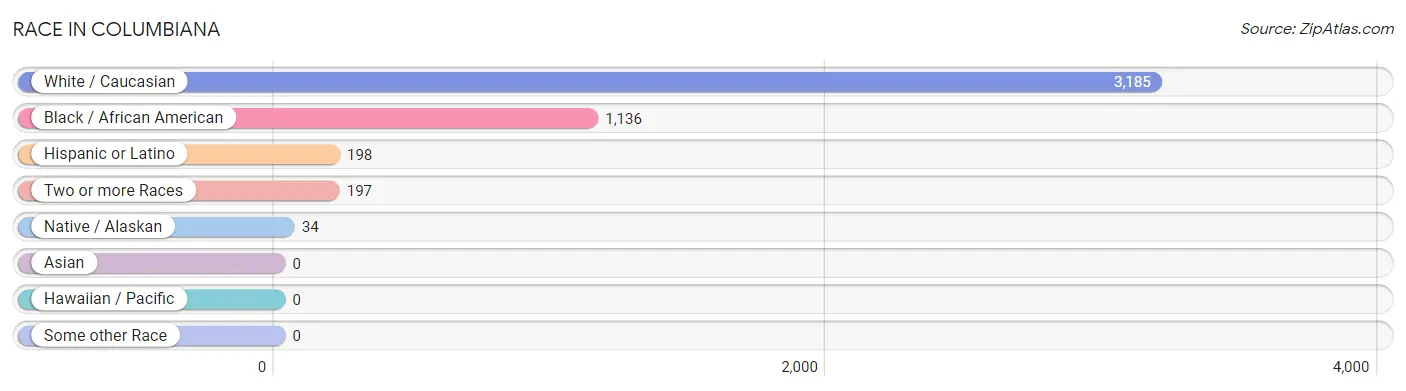
| Race | # Population | % Population |
| Asian | 0 | 0.0% |
| Black / African American | 1,136 | 25.0% |
| Hawaiian / Pacific | 0 | 0.0% |
| Hispanic or Latino | 198 | 4.3% |
| Native / Alaskan | 34 | 0.7% |
| White / Caucasian | 3,185 | 70.0% |
| Two or more Races | 197 | 4.3% |
| Some other Race | 0 | 0.0% |
| Total | 4,552 | 100.0% |
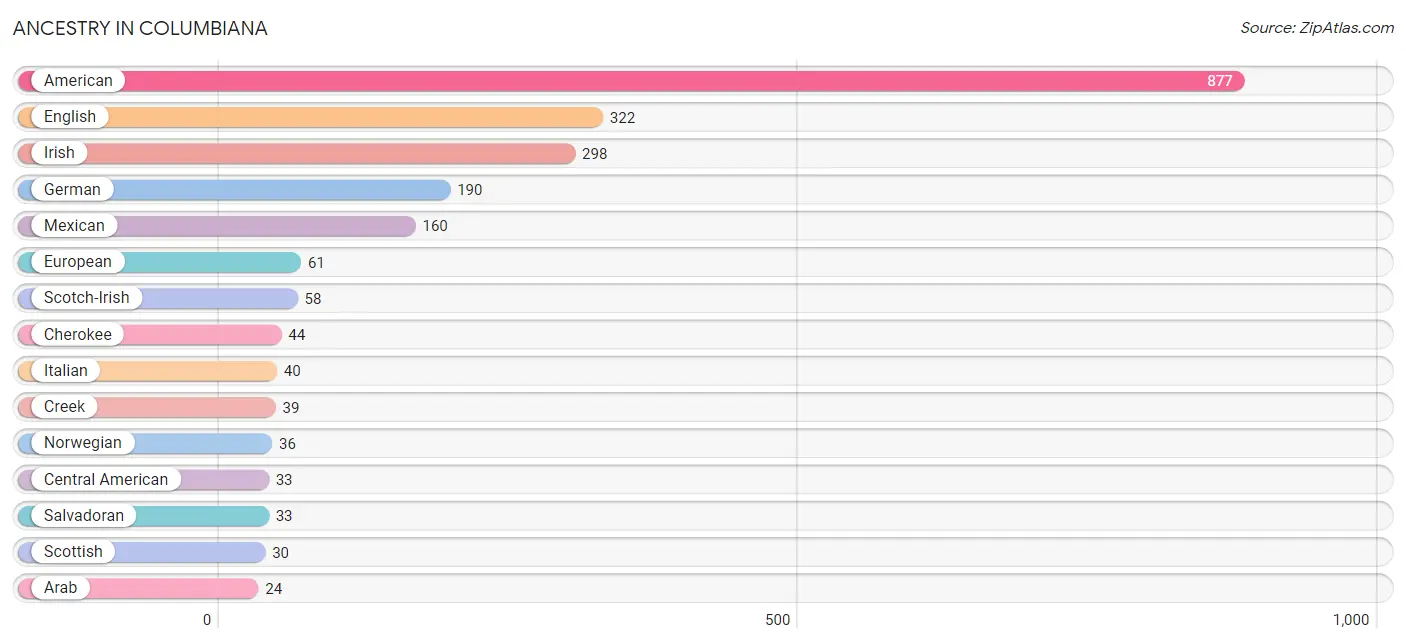
Ancestry in Columbiana
The most populous ancestries reported in Columbiana are American (877 | 19.3%), English (322 | 7.1%), Irish (298 | 6.6%), German (190 | 4.2%), and Mexican (160 | 3.5%), together accounting for 40.6% of all Columbiana residents.
| Ancestry | # Population | % Population |
| African | 10 | 0.2% |
| American | 877 | 19.3% |
| Arab | 24 | 0.5% |
| Blackfeet | 2 | 0.0% |
| British | 12 | 0.3% |
| Central American | 33 | 0.7% |
| Cherokee | 44 | 1.0% |
| Creek | 39 | 0.9% |
| English | 322 | 7.1% |
| European | 61 | 1.3% |
| French | 8 | 0.2% |
| French Canadian | 23 | 0.5% |
| German | 190 | 4.2% |
| Greek | 9 | 0.2% |
| Hungarian | 14 | 0.3% |
| Irish | 298 | 6.6% |
| Israeli | 7 | 0.2% |
| Italian | 40 | 0.9% |
| Jamaican | 5 | 0.1% |
| Lebanese | 24 | 0.5% |
| Mexican | 160 | 3.5% |
| Norwegian | 36 | 0.8% |
| Polish | 19 | 0.4% |
| Puerto Rican | 5 | 0.1% |
| Salvadoran | 33 | 0.7% |
| Scandinavian | 20 | 0.4% |
| Scotch-Irish | 58 | 1.3% |
| Scottish | 30 | 0.7% |
| Subsaharan African | 10 | 0.2% |
| Welsh | 7 | 0.2% | View All 30 Rows |
Immigrants in Columbiana
The most numerous immigrant groups reported in Columbiana came from Central America (63 | 1.4%), Latin America (63 | 1.4%), El Salvador (33 | 0.7%), Mexico (30 | 0.7%), and Asia (7 | 0.2%), together accounting for 4.3% of all Columbiana residents.
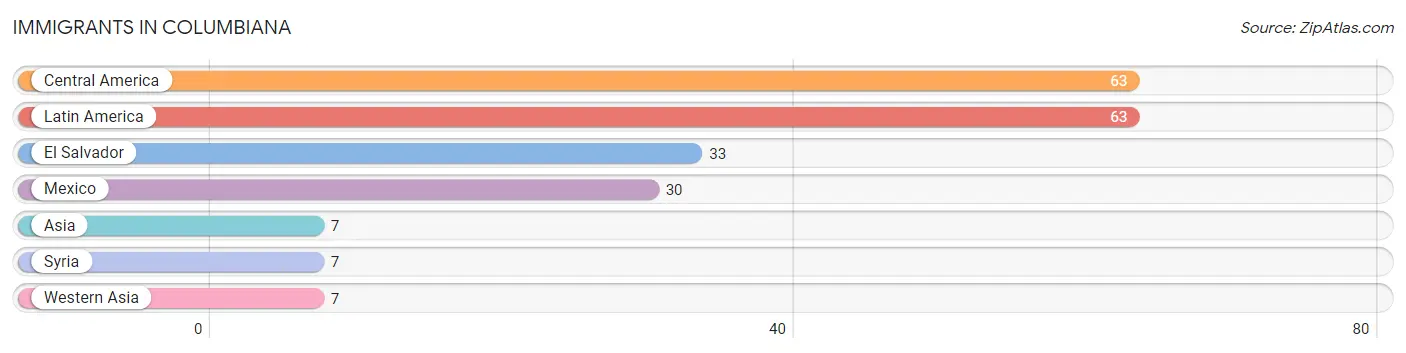
| Immigration Origin | # Population | % Population |
| Asia | 7 | 0.2% |
| Central America | 63 | 1.4% |
| El Salvador | 33 | 0.7% |
| Latin America | 63 | 1.4% |
| Mexico | 30 | 0.7% |
| Syria | 7 | 0.2% |
| Western Asia | 7 | 0.2% | View All 7 Rows |
Sex and Age in Columbiana
Sex and Age in Columbiana
The most populous age groups in Columbiana are 25 to 29 Years (378 | 15.3%) for men and 55 to 59 Years (284 | 13.7%) for women.
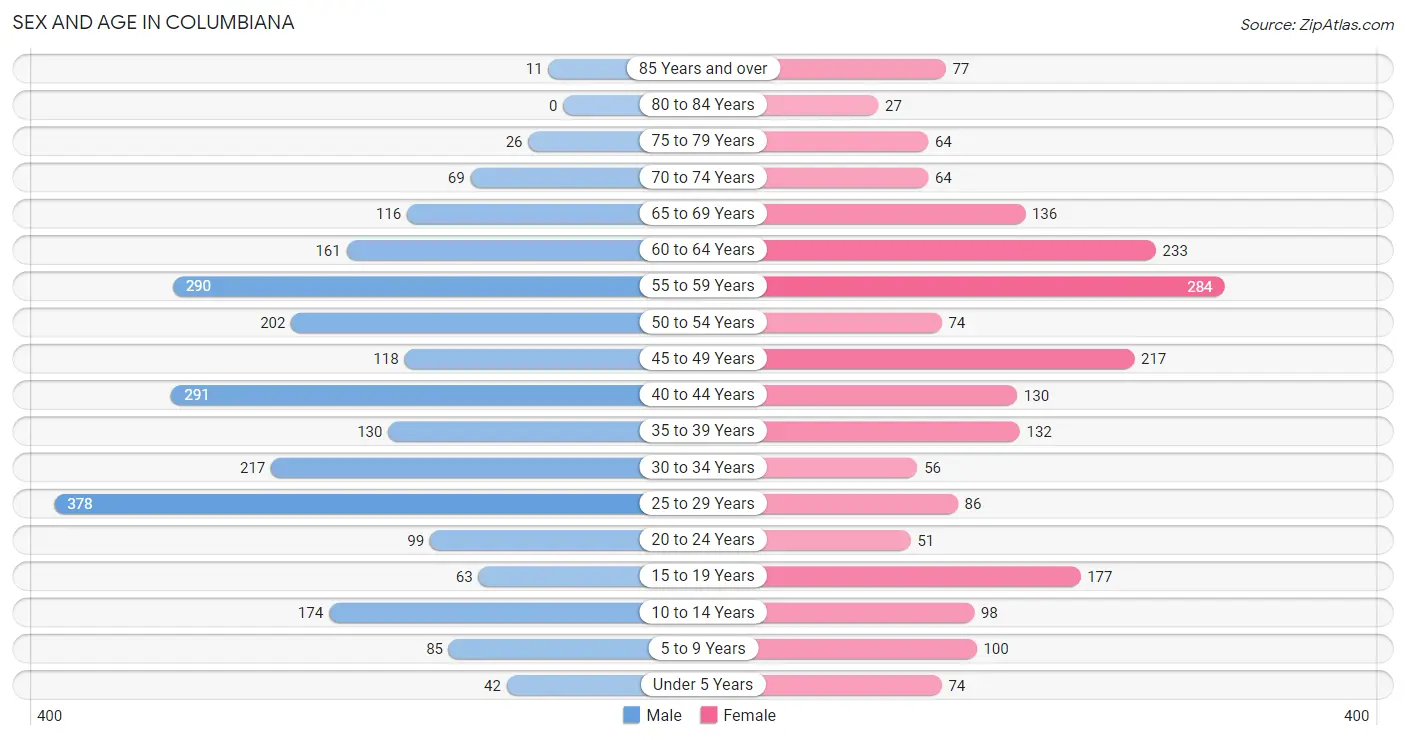
| Age Bracket | Male | Female |
| Under 5 Years | 42 (1.7%) | 74 (3.6%) |
| 5 to 9 Years | 85 (3.4%) | 100 (4.8%) |
| 10 to 14 Years | 174 (7.0%) | 98 (4.7%) |
| 15 to 19 Years | 63 (2.5%) | 177 (8.5%) |
| 20 to 24 Years | 99 (4.0%) | 51 (2.5%) |
| 25 to 29 Years | 378 (15.3%) | 86 (4.1%) |
| 30 to 34 Years | 217 (8.8%) | 56 (2.7%) |
| 35 to 39 Years | 130 (5.3%) | 132 (6.4%) |
| 40 to 44 Years | 291 (11.8%) | 130 (6.2%) |
| 45 to 49 Years | 118 (4.8%) | 217 (10.4%) |
| 50 to 54 Years | 202 (8.2%) | 74 (3.6%) |
| 55 to 59 Years | 290 (11.7%) | 284 (13.7%) |
| 60 to 64 Years | 161 (6.5%) | 233 (11.2%) |
| 65 to 69 Years | 116 (4.7%) | 136 (6.5%) |
| 70 to 74 Years | 69 (2.8%) | 64 (3.1%) |
| 75 to 79 Years | 26 (1.1%) | 64 (3.1%) |
| 80 to 84 Years | 0 (0.0%) | 27 (1.3%) |
| 85 Years and over | 11 (0.4%) | 77 (3.7%) |
| Total | 2,472 (100.0%) | 2,080 (100.0%) |
Families and Households in Columbiana
Median Family Size in Columbiana
The median family size in Columbiana is 2.87 persons per family, with married-couple families (686 | 68.0%) accounting for the largest median family size of 3 persons per family. On the other hand, single female/mother families (269 | 26.7%) represent the smallest median family size with 2.57 persons per family.
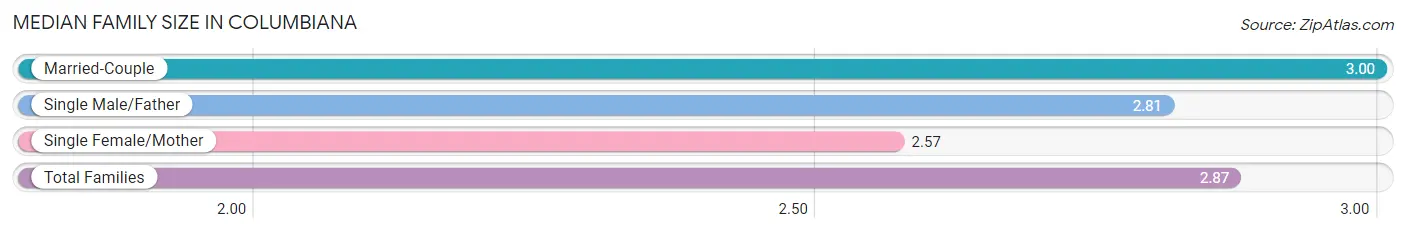
| Family Type | # Families | Family Size |
| Married-Couple | 686 (68.0%) | 3.00 |
| Single Male/Father | 54 (5.3%) | 2.81 |
| Single Female/Mother | 269 (26.7%) | 2.57 |
| Total Families | 1,009 (100.0%) | 2.87 |
Median Household Size in Columbiana
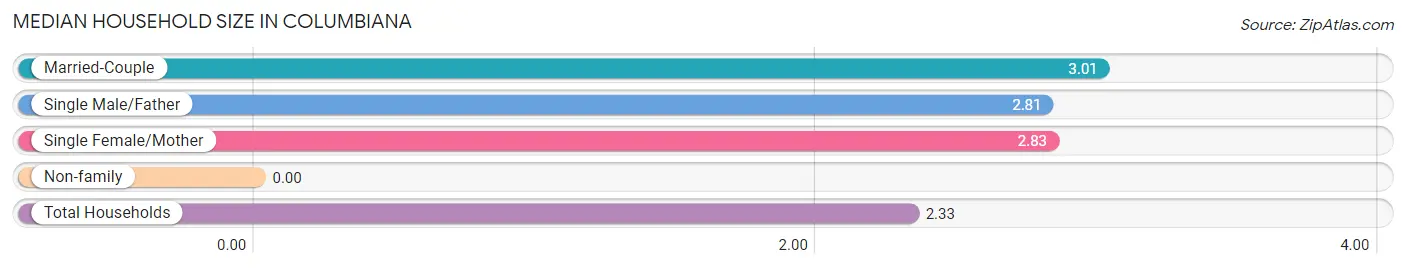
| Household Type | # Households | Household Size |
| Married-Couple | 686 (46.2%) | 3.01 |
| Single Male/Father | 54 (3.6%) | 2.81 |
| Single Female/Mother | 269 (18.1%) | 2.83 |
| Non-family | 477 (32.1%) | - |
| Total Households | 1,486 (100.0%) | 2.33 |
Household Size by Marriage Status in Columbiana
Out of a total of 1,486 households in Columbiana, 1,009 (67.9%) are family households, while 477 (32.1%) are nonfamily households. The most numerous type of family households are 2-person households, comprising 689, and the most common type of nonfamily households are 1-person households, comprising 477.
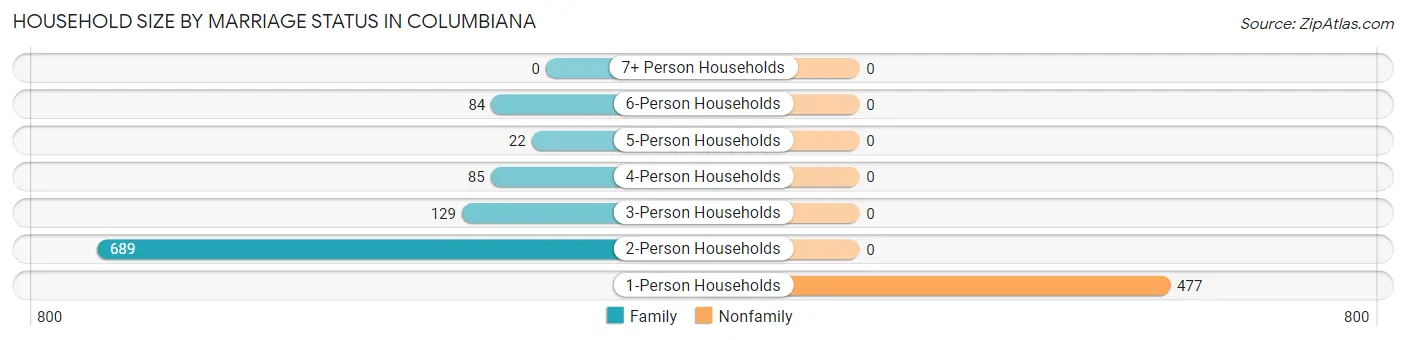
| Household Size | Family Households | Nonfamily Households |
| 1-Person Households | - | 477 (32.1%) |
| 2-Person Households | 689 (46.4%) | 0 (0.0%) |
| 3-Person Households | 129 (8.7%) | 0 (0.0%) |
| 4-Person Households | 85 (5.7%) | 0 (0.0%) |
| 5-Person Households | 22 (1.5%) | 0 (0.0%) |
| 6-Person Households | 84 (5.7%) | 0 (0.0%) |
| 7+ Person Households | 0 (0.0%) | 0 (0.0%) |
| Total | 1,009 (67.9%) | 477 (32.1%) |
Female Fertility in Columbiana
Fertility by Age in Columbiana
Average fertility rate in Columbiana is 47.0 births per 1,000 women. Women in the age bracket of 20 to 34 years have the highest fertility rate with 73.0 births per 1,000 women. Women in the age bracket of 35 to 50 years acount for 65.0% of all women with births.
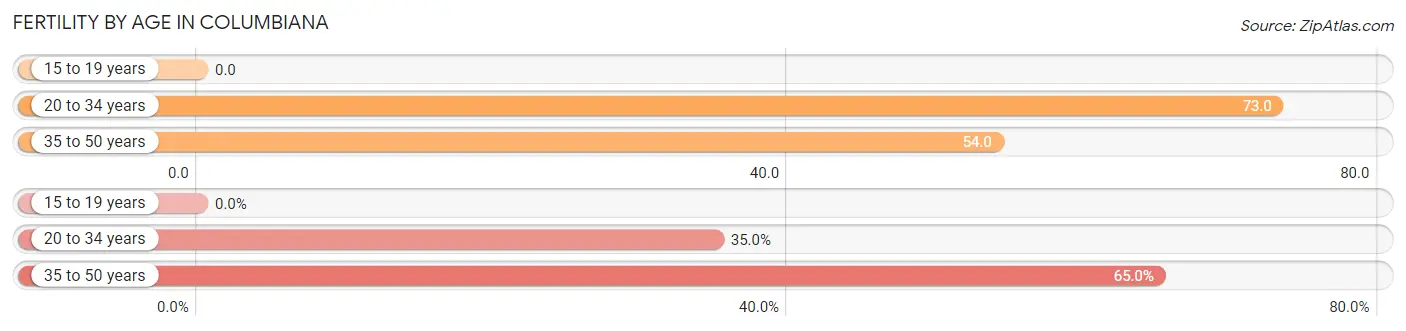
| Age Bracket | Women with Births | Births / 1,000 Women |
| 15 to 19 years | 0 (0.0%) | 0.0 |
| 20 to 34 years | 14 (35.0%) | 73.0 |
| 35 to 50 years | 26 (65.0%) | 54.0 |
| Total | 40 (100.0%) | 47.0 |
Fertility by Age by Marriage Status in Columbiana
35.0% of women with births (40) in Columbiana are married. The highest percentage of unmarried women with births falls into 35 to 50 years age bracket with 100.0% of them unmarried at the time of birth, while the lowest percentage of unmarried women with births belong to 20 to 34 years age bracket with 0.0% of them unmarried.
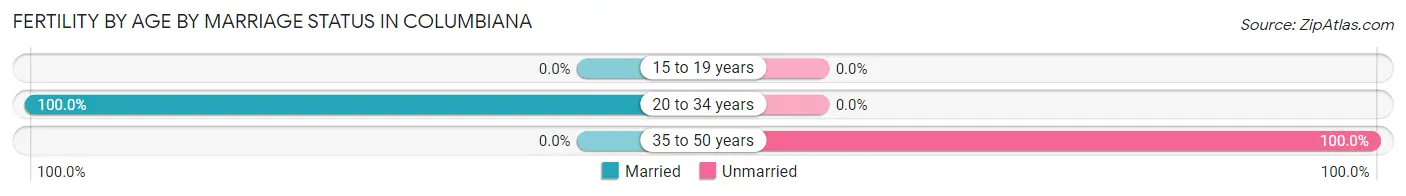
| Age Bracket | Married | Unmarried |
| 15 to 19 years | 0 (0.0%) | 0 (0.0%) |
| 20 to 34 years | 14 (100.0%) | 0 (0.0%) |
| 35 to 50 years | 0 (0.0%) | 26 (100.0%) |
| Total | 14 (35.0%) | 26 (65.0%) |
Fertility by Education in Columbiana
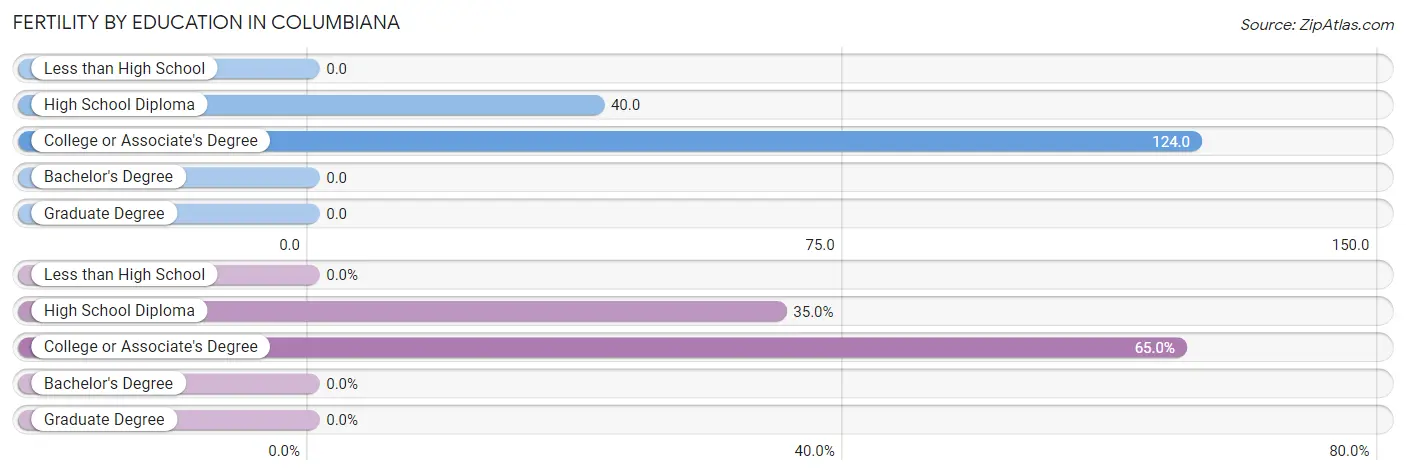
| Educational Attainment | Women with Births | Births / 1,000 Women |
| Less than High School | 0 (0.0%) | 0.0 |
| High School Diploma | 14 (35.0%) | 40.0 |
| College or Associate's Degree | 26 (65.0%) | 124.0 |
| Bachelor's Degree | 0 (0.0%) | 0.0 |
| Graduate Degree | 0 (0.0%) | 0.0 |
| Total | 40 (100.0%) | 47.0 |
Fertility by Education by Marriage Status in Columbiana
65.0% of women with births in Columbiana are unmarried. Women with the educational attainment of high school diploma are most likely to be married with 100.0% of them married at childbirth, while women with the educational attainment of college or associate's degree are least likely to be married with 100.0% of them unmarried at childbirth.
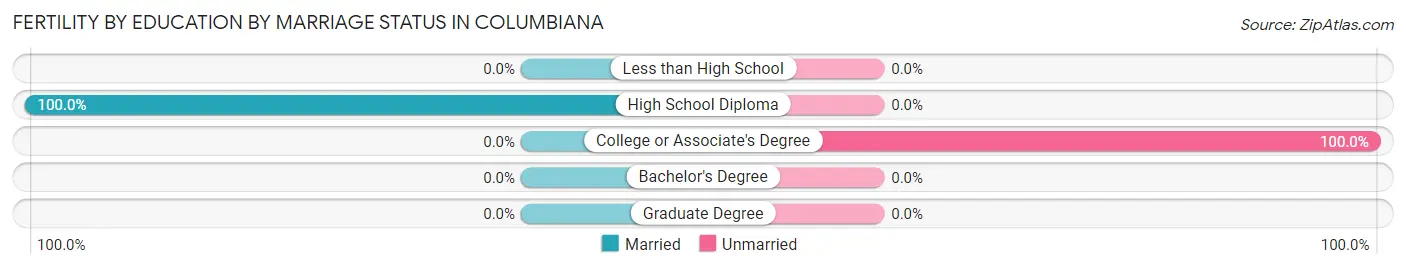
| Educational Attainment | Married | Unmarried |
| Less than High School | 0 (0.0%) | 0 (0.0%) |
| High School Diploma | 14 (100.0%) | 0 (0.0%) |
| College or Associate's Degree | 0 (0.0%) | 26 (100.0%) |
| Bachelor's Degree | 0 (0.0%) | 0 (0.0%) |
| Graduate Degree | 0 (0.0%) | 0 (0.0%) |
| Total | 14 (35.0%) | 26 (65.0%) |
Employment Characteristics in Columbiana
Employment by Class of Employer in Columbiana
Among the 1,819 employed individuals in Columbiana, private company employees (1,246 | 68.5%), local government employees (227 | 12.5%), and not-for-profit organizations (118 | 6.5%) make up the most common classes of employment.

| Employer Class | # Employees | % Employees |
| Private Company Employees | 1,246 | 68.5% |
| Self-Employed (Incorporated) | 62 | 3.4% |
| Self-Employed (Not Incorporated) | 23 | 1.3% |
| Not-for-profit Organizations | 118 | 6.5% |
| Local Government Employees | 227 | 12.5% |
| State Government Employees | 69 | 3.8% |
| Federal Government Employees | 74 | 4.1% |
| Unpaid Family Workers | 0 | 0.0% |
| Total | 1,819 | 100.0% |
Employment Status by Age in Columbiana
According to the labor force statistics for Columbiana, out of the total population over 16 years of age (3,979), 46.4% or 1,846 individuals are in the labor force, with 0.9% or 17 of them unemployed. The age group with the highest labor force participation rate is 60 to 64 years, with 71.6% or 282 individuals in the labor force. Within the labor force, the 35 to 44 years age range has the highest percentage of unemployed individuals, with 4.6% or 16 of them being unemployed.
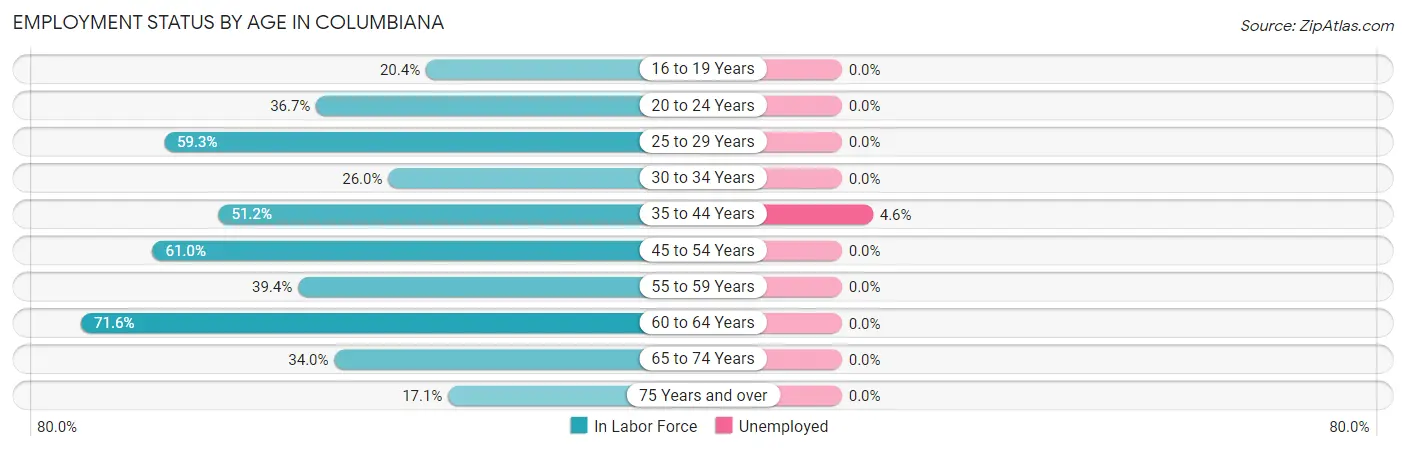
| Age Bracket | In Labor Force | Unemployed |
| 16 to 19 Years | 49 (20.4%) | 0 (0.0%) |
| 20 to 24 Years | 55 (36.7%) | 0 (0.0%) |
| 25 to 29 Years | 275 (59.3%) | 0 (0.0%) |
| 30 to 34 Years | 71 (26.0%) | 0 (0.0%) |
| 35 to 44 Years | 350 (51.2%) | 16 (4.6%) |
| 45 to 54 Years | 373 (61.0%) | 0 (0.0%) |
| 55 to 59 Years | 226 (39.4%) | 0 (0.0%) |
| 60 to 64 Years | 282 (71.6%) | 0 (0.0%) |
| 65 to 74 Years | 131 (34.0%) | 0 (0.0%) |
| 75 Years and over | 35 (17.1%) | 0 (0.0%) |
| Total | 1,846 (46.4%) | 17 (0.9%) |
Employment Status by Educational Attainment in Columbiana
According to labor force statistics for Columbiana, 52.6% of individuals (1,577) out of the total population between 25 and 64 years of age (2,999) are in the labor force, with 1.0% or 16 of them being unemployed. The group with the highest labor force participation rate are those with the educational attainment of bachelor's degree or higher, with 89.6% or 361 individuals in the labor force. Within the labor force, individuals with high school diploma education have the highest percentage of unemployment, with 2.0% or 16 of them being unemployed.
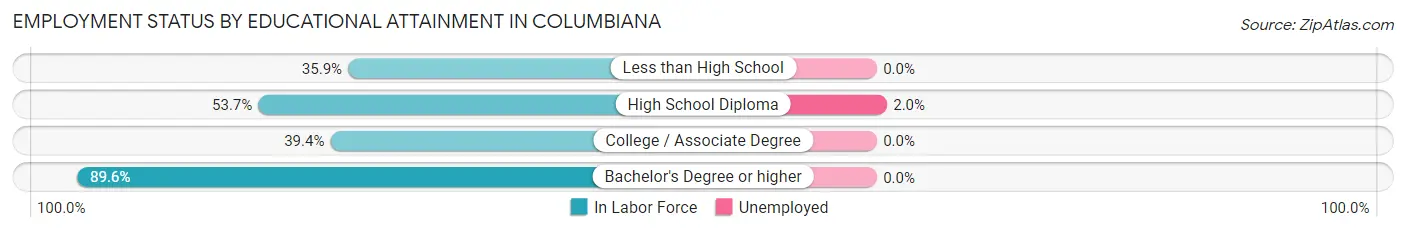
| Educational Attainment | In Labor Force | Unemployed |
| Less than High School | 179 (35.9%) | 0 (0.0%) |
| High School Diploma | 790 (53.7%) | 29 (2.0%) |
| College / Associate Degree | 246 (39.4%) | 0 (0.0%) |
| Bachelor's Degree or higher | 361 (89.6%) | 0 (0.0%) |
| Total | 1,577 (52.6%) | 30 (1.0%) |
Employment Occupations by Sex in Columbiana
Management, Business, Science and Arts Occupations
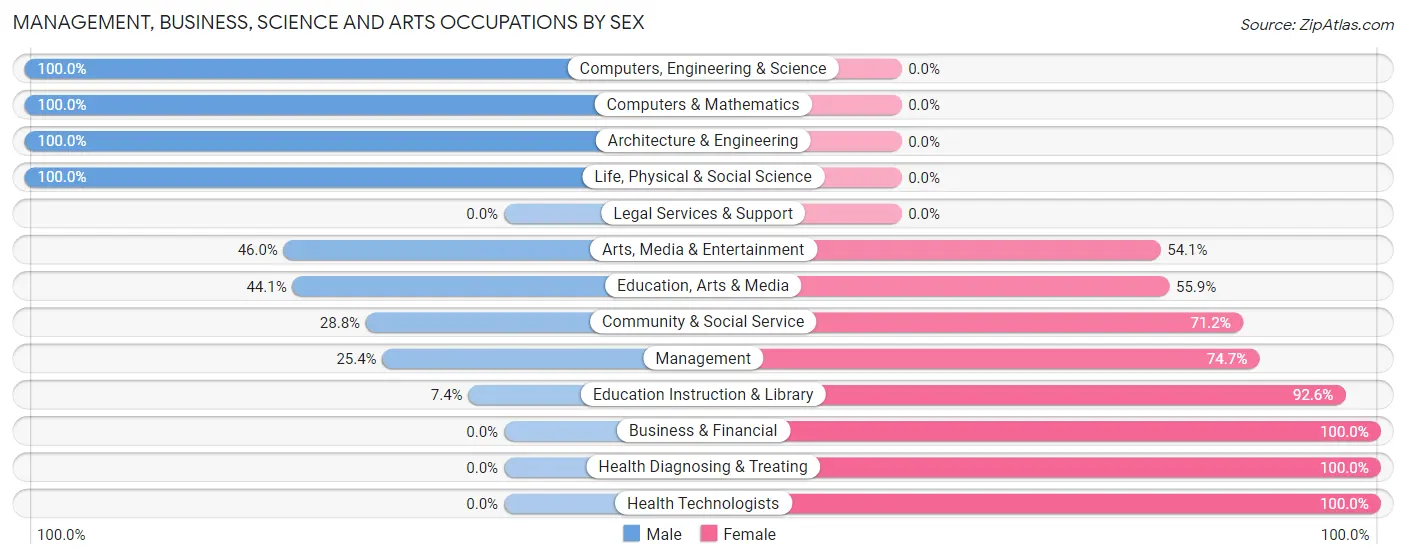
The most common Management, Business, Science and Arts occupations in Columbiana are Management (217 | 12.1%), Community & Social Service (125 | 7.0%), Computers, Engineering & Science (68 | 3.8%), Health Diagnosing & Treating (55 | 3.1%), and Education Instruction & Library (54 | 3.0%).
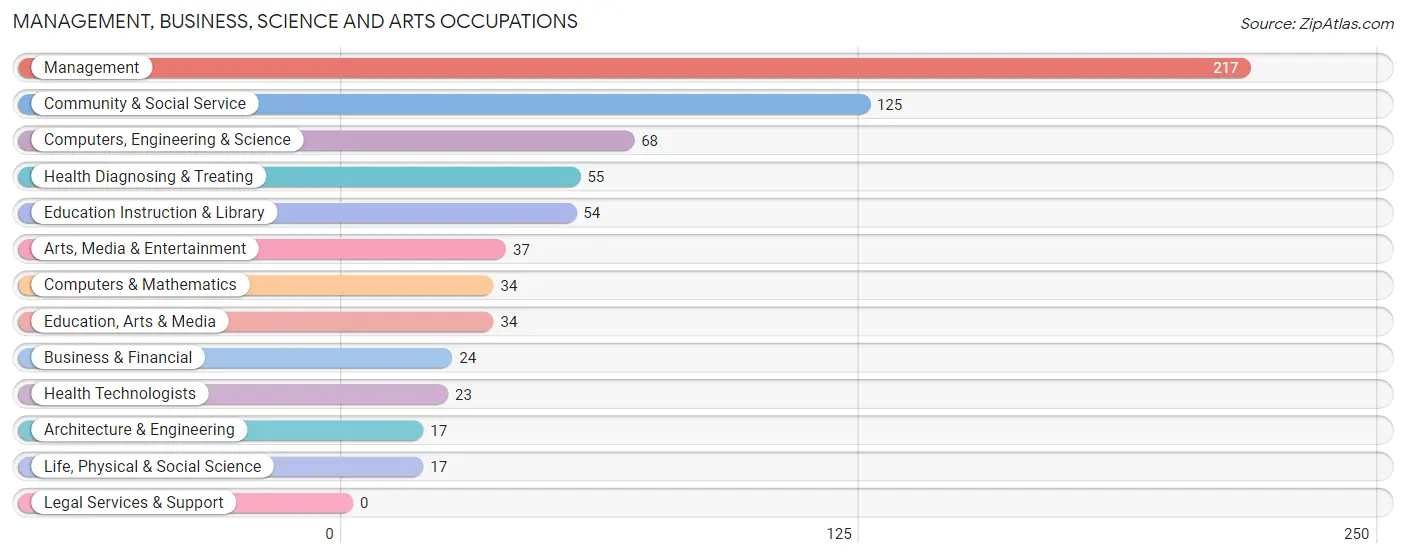
Management, Business, Science and Arts Occupations by Sex
Within the Management, Business, Science and Arts occupations in Columbiana, the most male-oriented occupations are Computers, Engineering & Science (100.0%), Computers & Mathematics (100.0%), and Architecture & Engineering (100.0%), while the most female-oriented occupations are Business & Financial (100.0%), Health Diagnosing & Treating (100.0%), and Health Technologists (100.0%).
| Occupation | Male | Female |
| Management | 55 (25.4%) | 162 (74.7%) |
| Business & Financial | 0 (0.0%) | 24 (100.0%) |
| Computers, Engineering & Science | 68 (100.0%) | 0 (0.0%) |
| Computers & Mathematics | 34 (100.0%) | 0 (0.0%) |
| Architecture & Engineering | 17 (100.0%) | 0 (0.0%) |
| Life, Physical & Social Science | 17 (100.0%) | 0 (0.0%) |
| Community & Social Service | 36 (28.8%) | 89 (71.2%) |
| Education, Arts & Media | 15 (44.1%) | 19 (55.9%) |
| Legal Services & Support | 0 (0.0%) | 0 (0.0%) |
| Education Instruction & Library | 4 (7.4%) | 50 (92.6%) |
| Arts, Media & Entertainment | 17 (46.0%) | 20 (54.0%) |
| Health Diagnosing & Treating | 0 (0.0%) | 55 (100.0%) |
| Health Technologists | 0 (0.0%) | 23 (100.0%) |
| Total (Category) | 159 (32.5%) | 330 (67.5%) |
| Total (Overall) | 882 (49.1%) | 915 (50.9%) |
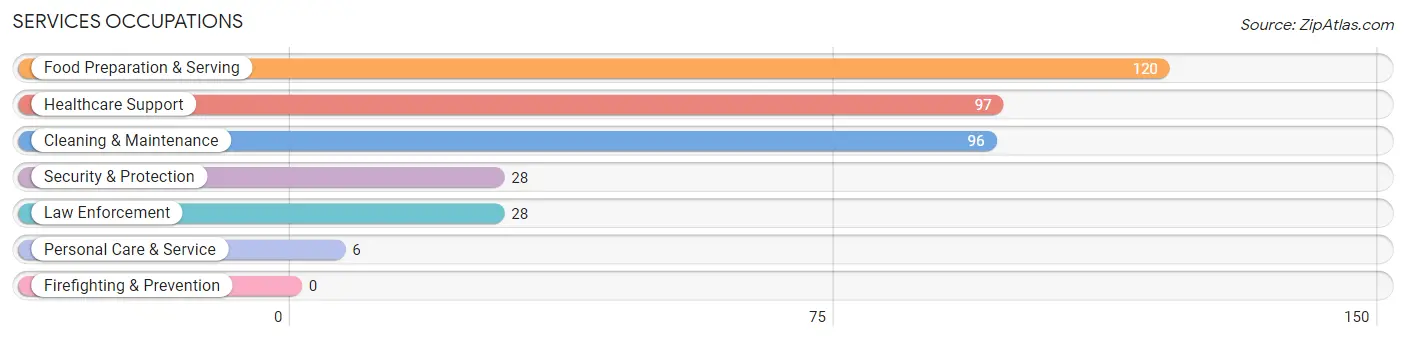
Services Occupations
The most common Services occupations in Columbiana are Food Preparation & Serving (120 | 6.7%), Healthcare Support (97 | 5.4%), Cleaning & Maintenance (96 | 5.3%), Security & Protection (28 | 1.6%), and Law Enforcement (28 | 1.6%).
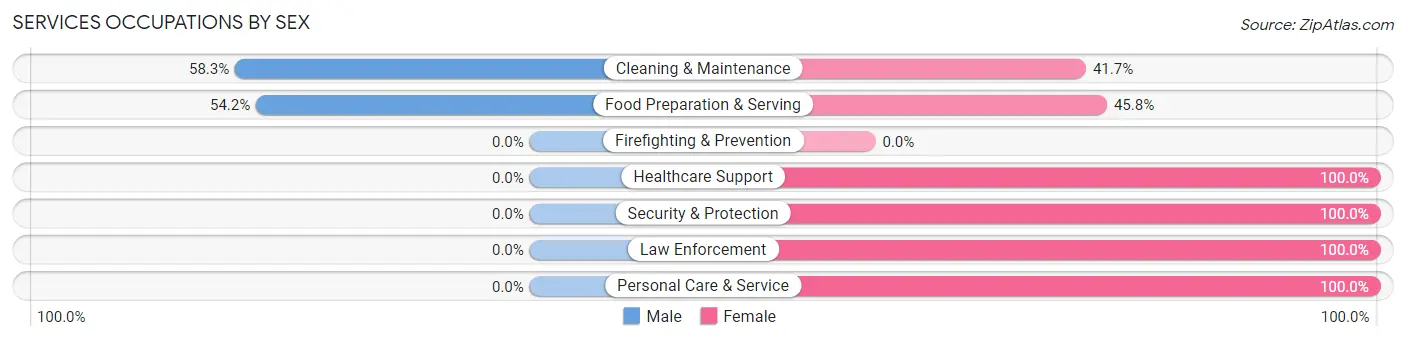
Services Occupations by Sex
Within the Services occupations in Columbiana, the most male-oriented occupations are Cleaning & Maintenance (58.3%), and Food Preparation & Serving (54.2%), while the most female-oriented occupations are Healthcare Support (100.0%), Security & Protection (100.0%), and Law Enforcement (100.0%).
| Occupation | Male | Female |
| Healthcare Support | 0 (0.0%) | 97 (100.0%) |
| Security & Protection | 0 (0.0%) | 28 (100.0%) |
| Firefighting & Prevention | 0 (0.0%) | 0 (0.0%) |
| Law Enforcement | 0 (0.0%) | 28 (100.0%) |
| Food Preparation & Serving | 65 (54.2%) | 55 (45.8%) |
| Cleaning & Maintenance | 56 (58.3%) | 40 (41.7%) |
| Personal Care & Service | 0 (0.0%) | 6 (100.0%) |
| Total (Category) | 121 (34.9%) | 226 (65.1%) |
| Total (Overall) | 882 (49.1%) | 915 (50.9%) |
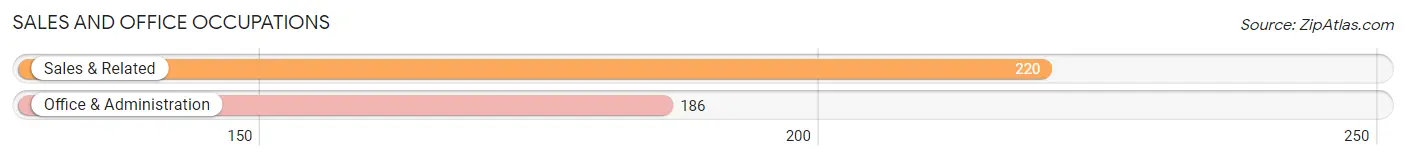
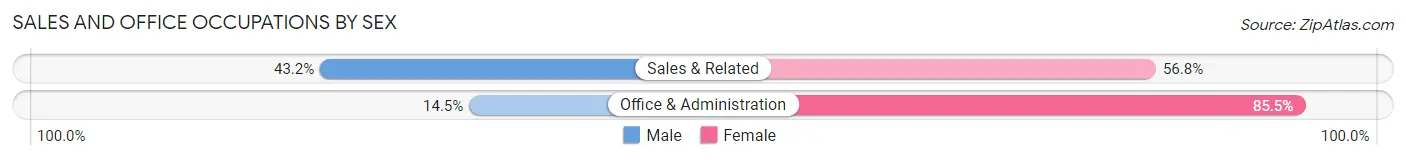
Sales and Office Occupations
The most common Sales and Office occupations in Columbiana are Sales & Related (220 | 12.2%), and Office & Administration (186 | 10.3%).
Sales and Office Occupations by Sex
| Occupation | Male | Female |
| Sales & Related | 95 (43.2%) | 125 (56.8%) |
| Office & Administration | 27 (14.5%) | 159 (85.5%) |
| Total (Category) | 122 (30.0%) | 284 (70.0%) |
| Total (Overall) | 882 (49.1%) | 915 (50.9%) |
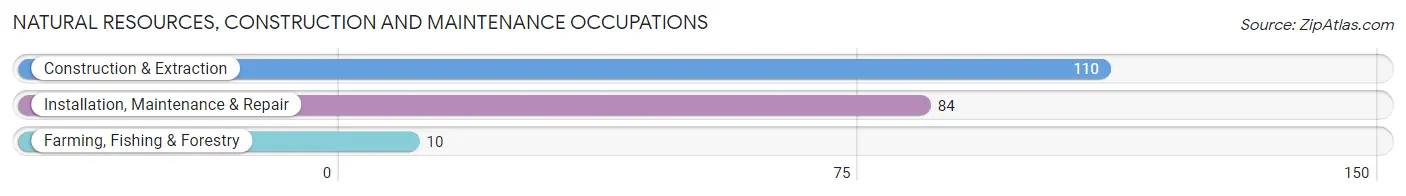
Natural Resources, Construction and Maintenance Occupations
The most common Natural Resources, Construction and Maintenance occupations in Columbiana are Construction & Extraction (110 | 6.1%), Installation, Maintenance & Repair (84 | 4.7%), and Farming, Fishing & Forestry (10 | 0.6%).
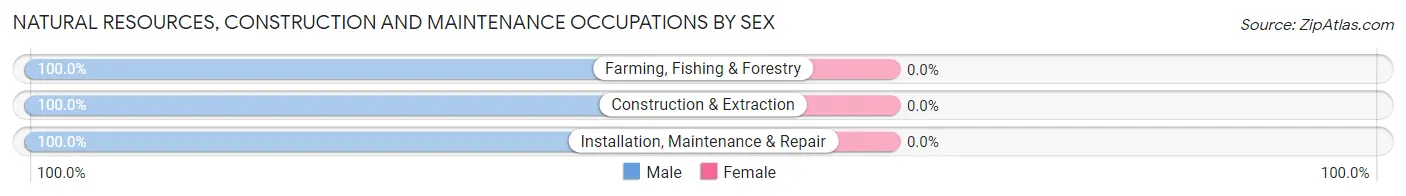
Natural Resources, Construction and Maintenance Occupations by Sex
| Occupation | Male | Female |
| Farming, Fishing & Forestry | 10 (100.0%) | 0 (0.0%) |
| Construction & Extraction | 110 (100.0%) | 0 (0.0%) |
| Installation, Maintenance & Repair | 84 (100.0%) | 0 (0.0%) |
| Total (Category) | 204 (100.0%) | 0 (0.0%) |
| Total (Overall) | 882 (49.1%) | 915 (50.9%) |
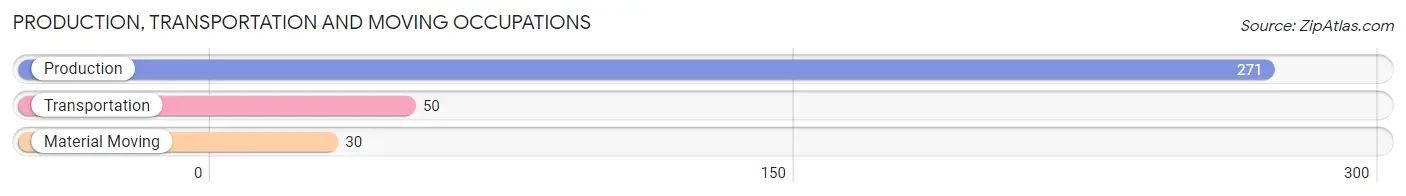
Production, Transportation and Moving Occupations
The most common Production, Transportation and Moving occupations in Columbiana are Production (271 | 15.1%), Transportation (50 | 2.8%), and Material Moving (30 | 1.7%).
Production, Transportation and Moving Occupations by Sex
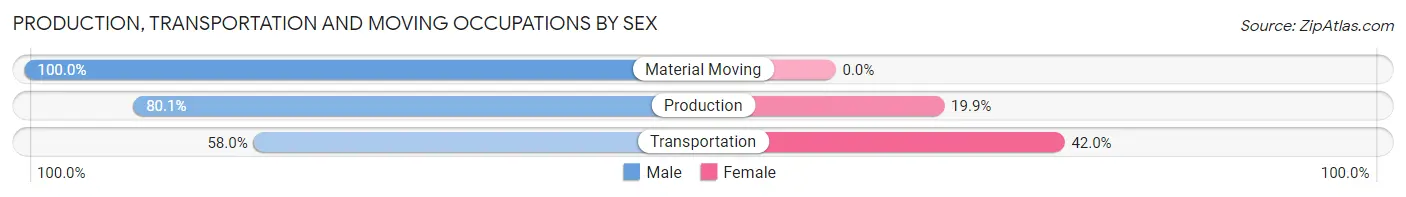
| Occupation | Male | Female |
| Production | 217 (80.1%) | 54 (19.9%) |
| Transportation | 29 (58.0%) | 21 (42.0%) |
| Material Moving | 30 (100.0%) | 0 (0.0%) |
| Total (Category) | 276 (78.6%) | 75 (21.4%) |
| Total (Overall) | 882 (49.1%) | 915 (50.9%) |
Employment Industries by Sex in Columbiana
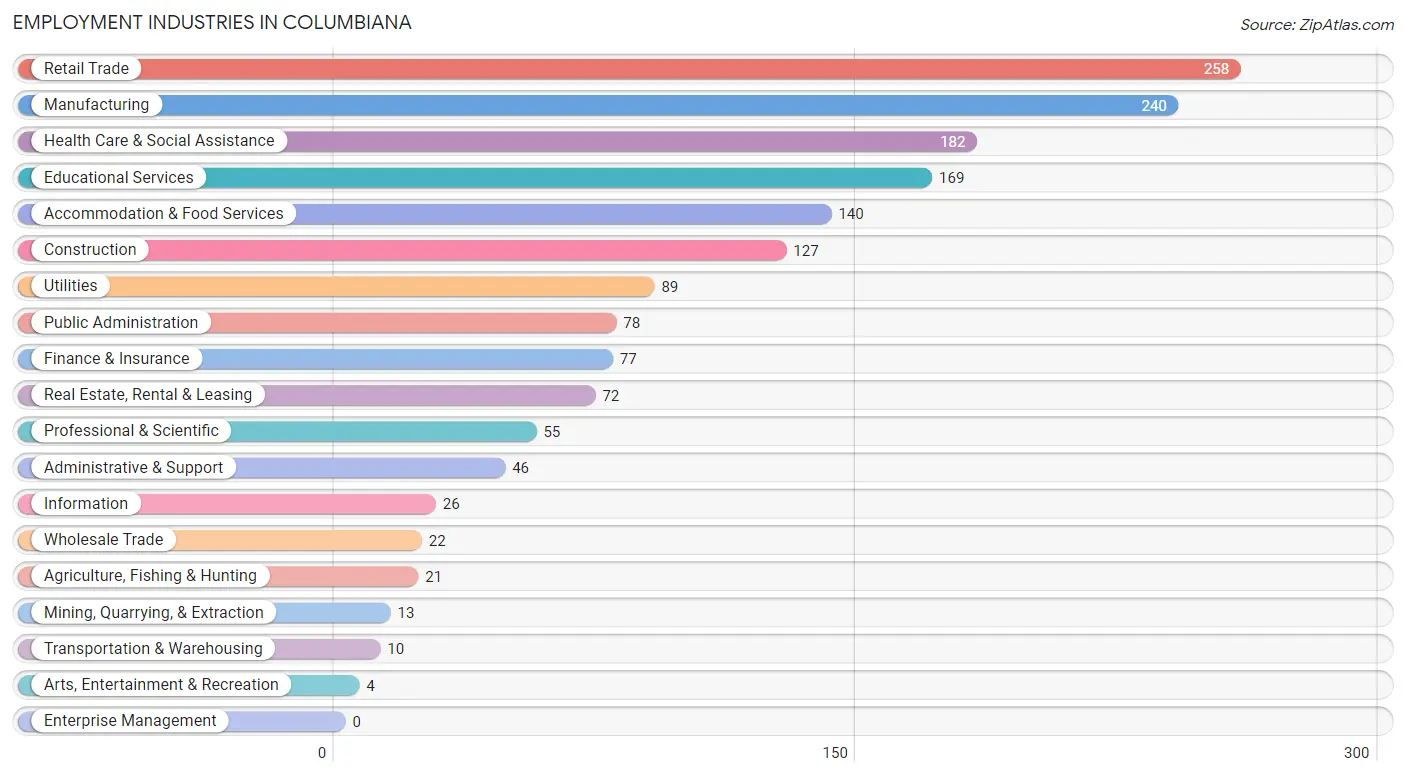
Employment Industries in Columbiana
The major employment industries in Columbiana include Retail Trade (258 | 14.4%), Manufacturing (240 | 13.4%), Health Care & Social Assistance (182 | 10.1%), Educational Services (169 | 9.4%), and Accommodation & Food Services (140 | 7.8%).
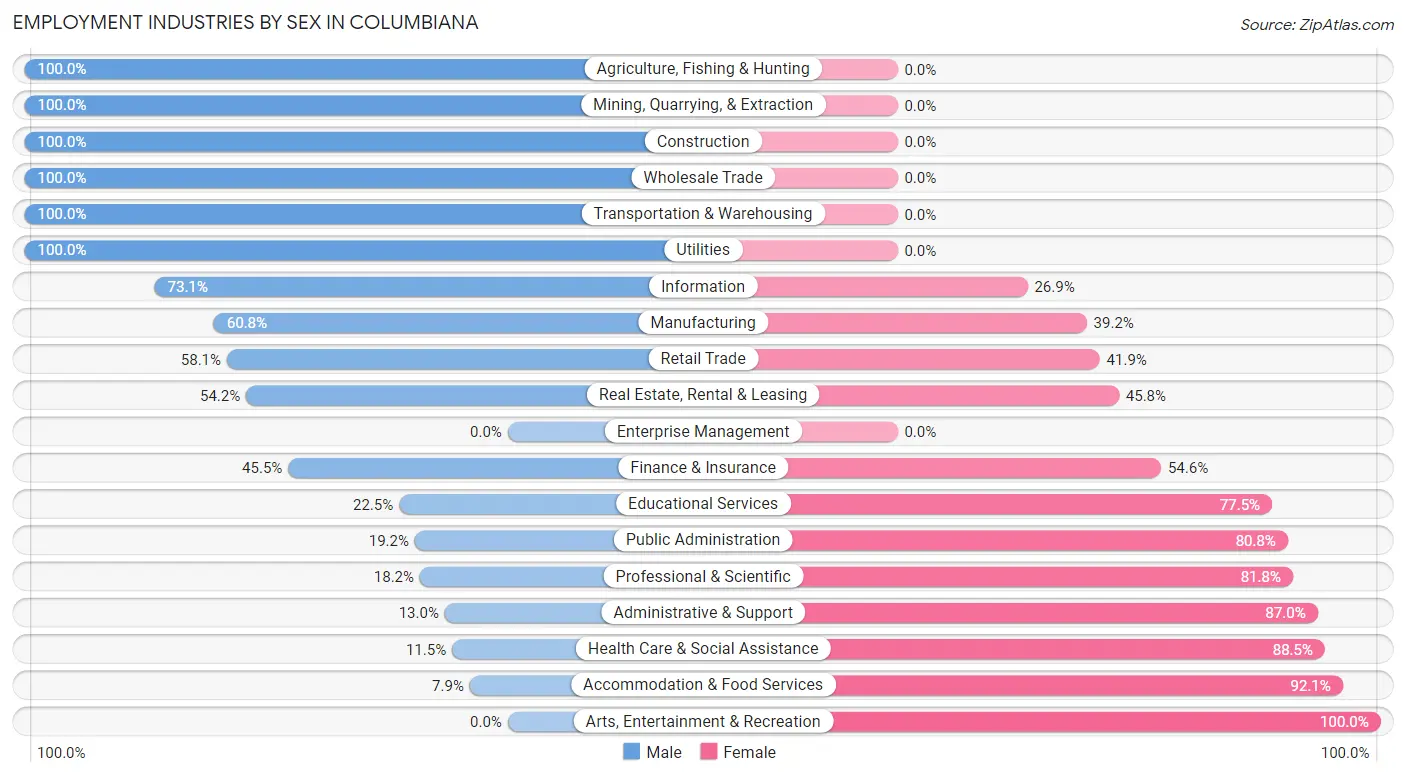
Employment Industries by Sex in Columbiana
The Columbiana industries that see more men than women are Agriculture, Fishing & Hunting (100.0%), Mining, Quarrying, & Extraction (100.0%), and Construction (100.0%), whereas the industries that tend to have a higher number of women are Arts, Entertainment & Recreation (100.0%), Accommodation & Food Services (92.1%), and Health Care & Social Assistance (88.5%).
| Industry | Male | Female |
| Agriculture, Fishing & Hunting | 21 (100.0%) | 0 (0.0%) |
| Mining, Quarrying, & Extraction | 13 (100.0%) | 0 (0.0%) |
| Construction | 127 (100.0%) | 0 (0.0%) |
| Manufacturing | 146 (60.8%) | 94 (39.2%) |
| Wholesale Trade | 22 (100.0%) | 0 (0.0%) |
| Retail Trade | 150 (58.1%) | 108 (41.9%) |
| Transportation & Warehousing | 10 (100.0%) | 0 (0.0%) |
| Utilities | 89 (100.0%) | 0 (0.0%) |
| Information | 19 (73.1%) | 7 (26.9%) |
| Finance & Insurance | 35 (45.5%) | 42 (54.5%) |
| Real Estate, Rental & Leasing | 39 (54.2%) | 33 (45.8%) |
| Professional & Scientific | 10 (18.2%) | 45 (81.8%) |
| Enterprise Management | 0 (0.0%) | 0 (0.0%) |
| Administrative & Support | 6 (13.0%) | 40 (87.0%) |
| Educational Services | 38 (22.5%) | 131 (77.5%) |
| Health Care & Social Assistance | 21 (11.5%) | 161 (88.5%) |
| Arts, Entertainment & Recreation | 0 (0.0%) | 4 (100.0%) |
| Accommodation & Food Services | 11 (7.9%) | 129 (92.1%) |
| Public Administration | 15 (19.2%) | 63 (80.8%) |
| Total | 882 (49.1%) | 915 (50.9%) |
Education in Columbiana
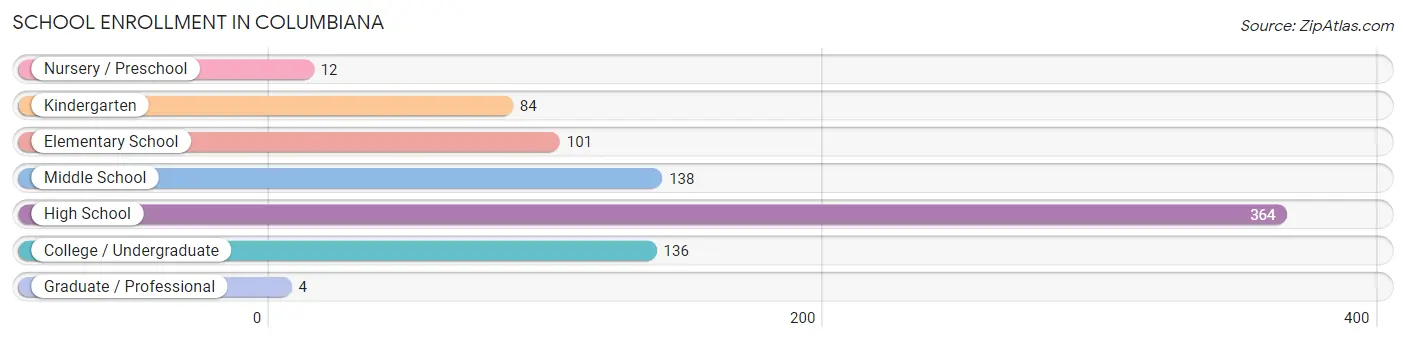
School Enrollment in Columbiana
The most common levels of schooling among the 839 students in Columbiana are high school (364 | 43.4%), middle school (138 | 16.5%), and college / undergraduate (136 | 16.2%).
| School Level | # Students | % Students |
| Nursery / Preschool | 12 | 1.4% |
| Kindergarten | 84 | 10.0% |
| Elementary School | 101 | 12.0% |
| Middle School | 138 | 16.5% |
| High School | 364 | 43.4% |
| College / Undergraduate | 136 | 16.2% |
| Graduate / Professional | 4 | 0.5% |
| Total | 839 | 100.0% |
School Enrollment by Age by Funding Source in Columbiana
Out of a total of 839 students who are enrolled in schools in Columbiana, 259 (30.9%) attend a private institution, while the remaining 580 (69.1%) are enrolled in public schools. The age group of 3 to 4 year olds has the highest likelihood of being enrolled in private schools, with 12 (100.0% in the age bracket) enrolled. Conversely, the age group of 20 to 24 year olds has the lowest likelihood of being enrolled in a private school, with 47 (100.0% in the age bracket) attending a public institution.
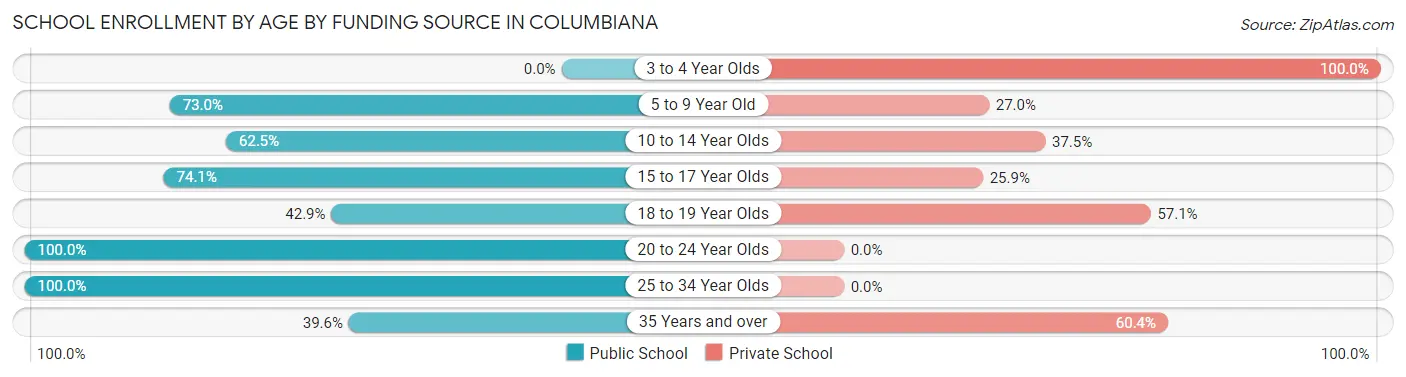
| Age Bracket | Public School | Private School |
| 3 to 4 Year Olds | 0 (0.0%) | 12 (100.0%) |
| 5 to 9 Year Old | 135 (73.0%) | 50 (27.0%) |
| 10 to 14 Year Olds | 170 (62.5%) | 102 (37.5%) |
| 15 to 17 Year Olds | 123 (74.1%) | 43 (25.9%) |
| 18 to 19 Year Olds | 15 (42.9%) | 20 (57.1%) |
| 20 to 24 Year Olds | 47 (100.0%) | 0 (0.0%) |
| 25 to 34 Year Olds | 69 (100.0%) | 0 (0.0%) |
| 35 Years and over | 21 (39.6%) | 32 (60.4%) |
| Total | 580 (69.1%) | 259 (30.9%) |
Educational Attainment by Field of Study in Columbiana
Business (146 | 25.2%), education (143 | 24.7%), arts & humanities (83 | 14.3%), science & technology (76 | 13.1%), and communications (62 | 10.7%) are the most common fields of study among 579 individuals in Columbiana who have obtained a bachelor's degree or higher.
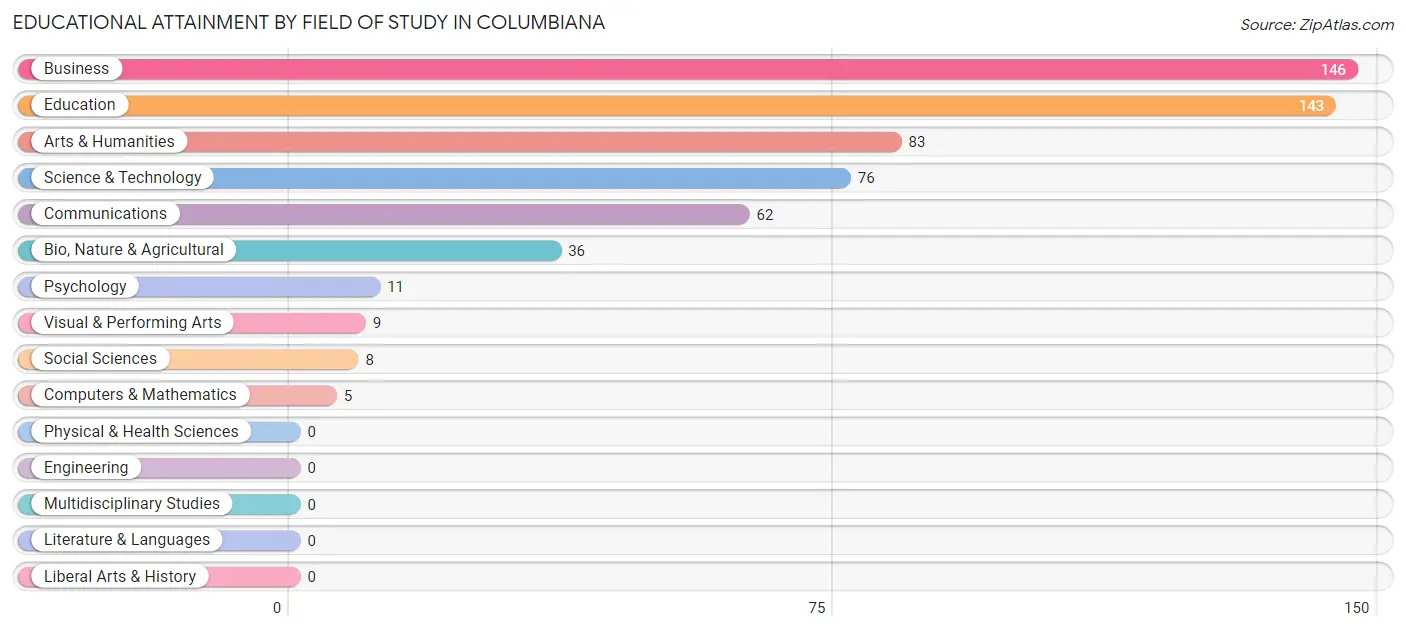
| Field of Study | # Graduates | % Graduates |
| Computers & Mathematics | 5 | 0.9% |
| Bio, Nature & Agricultural | 36 | 6.2% |
| Physical & Health Sciences | 0 | 0.0% |
| Psychology | 11 | 1.9% |
| Social Sciences | 8 | 1.4% |
| Engineering | 0 | 0.0% |
| Multidisciplinary Studies | 0 | 0.0% |
| Science & Technology | 76 | 13.1% |
| Business | 146 | 25.2% |
| Education | 143 | 24.7% |
| Literature & Languages | 0 | 0.0% |
| Liberal Arts & History | 0 | 0.0% |
| Visual & Performing Arts | 9 | 1.5% |
| Communications | 62 | 10.7% |
| Arts & Humanities | 83 | 14.3% |
| Total | 579 | 100.0% |
Transportation & Commute in Columbiana
Vehicle Availability by Sex in Columbiana
The most prevalent vehicle ownership categories in Columbiana are males with 2 vehicles (363, accounting for 39.6%) and females with 2 vehicles (248, making up 40.2%).
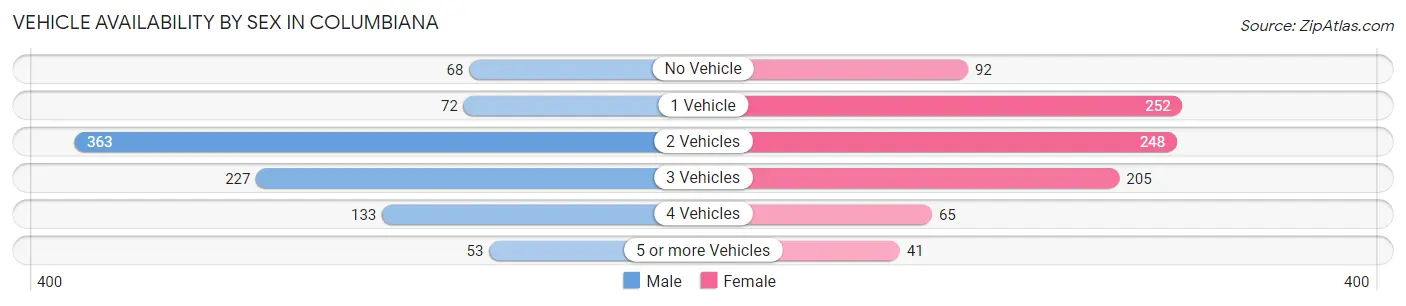
| Vehicles Available | Male | Female |
| No Vehicle | 68 (7.4%) | 92 (10.2%) |
| 1 Vehicle | 72 (7.9%) | 252 (27.9%) |
| 2 Vehicles | 363 (39.6%) | 248 (27.5%) |
| 3 Vehicles | 227 (24.8%) | 205 (22.7%) |
| 4 Vehicles | 133 (14.5%) | 65 (7.2%) |
| 5 or more Vehicles | 53 (5.8%) | 41 (4.5%) |
| Total | 916 (100.0%) | 903 (100.0%) |
Commute Time in Columbiana
The most frequently occuring commute durations in Columbiana are 10 to 14 minutes (274 commuters, 15.3%), 45 to 59 minutes (250 commuters, 14.0%), and 30 to 34 minutes (220 commuters, 12.3%).
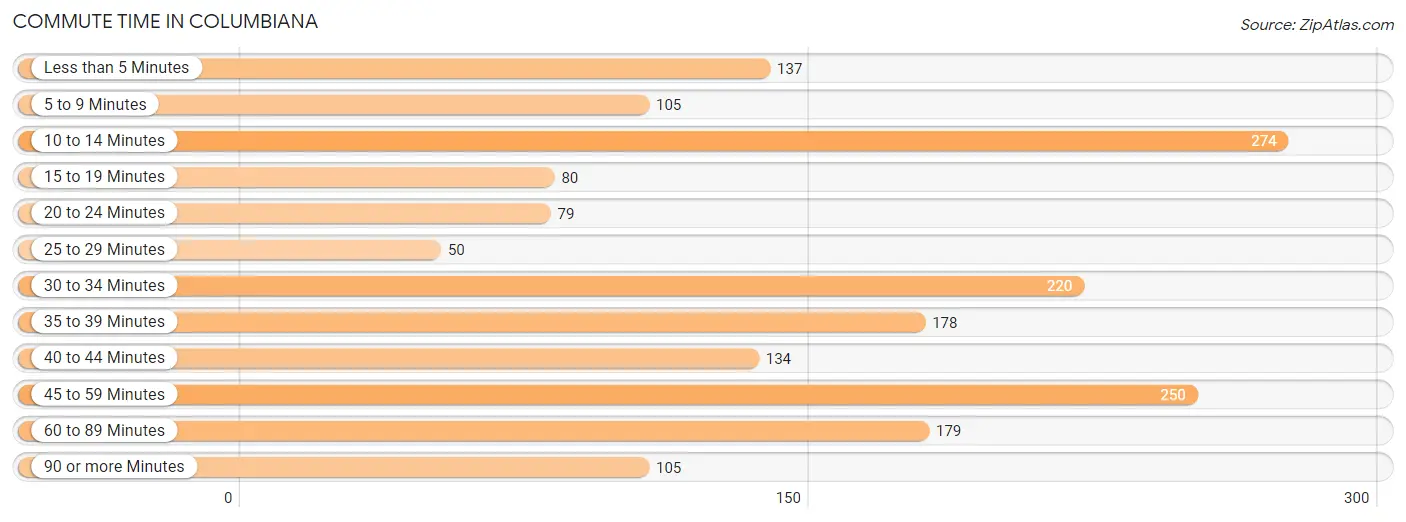
| Commute Time | # Commuters | % Commuters |
| Less than 5 Minutes | 137 | 7.6% |
| 5 to 9 Minutes | 105 | 5.9% |
| 10 to 14 Minutes | 274 | 15.3% |
| 15 to 19 Minutes | 80 | 4.5% |
| 20 to 24 Minutes | 79 | 4.4% |
| 25 to 29 Minutes | 50 | 2.8% |
| 30 to 34 Minutes | 220 | 12.3% |
| 35 to 39 Minutes | 178 | 9.9% |
| 40 to 44 Minutes | 134 | 7.5% |
| 45 to 59 Minutes | 250 | 14.0% |
| 60 to 89 Minutes | 179 | 10.0% |
| 90 or more Minutes | 105 | 5.9% |
Commute Time by Sex in Columbiana
The most common commute times in Columbiana are 10 to 14 minutes (157 commuters, 17.7%) for males and 45 to 59 minutes (173 commuters, 19.2%) for females.
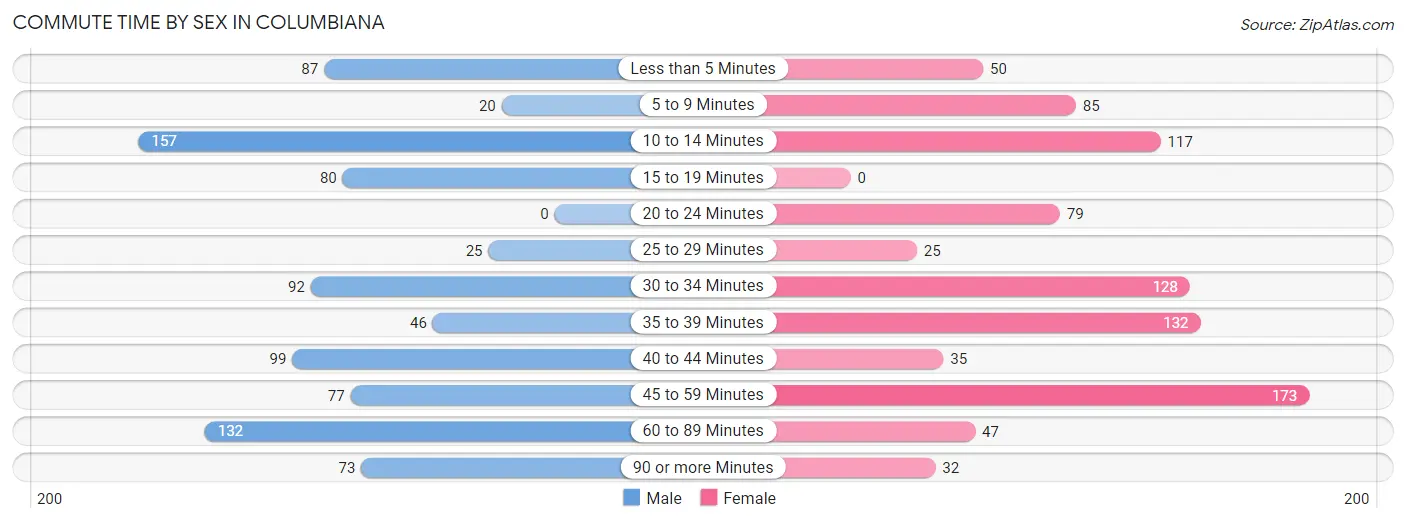
| Commute Time | Male | Female |
| Less than 5 Minutes | 87 (9.8%) | 50 (5.5%) |
| 5 to 9 Minutes | 20 (2.2%) | 85 (9.4%) |
| 10 to 14 Minutes | 157 (17.7%) | 117 (13.0%) |
| 15 to 19 Minutes | 80 (9.0%) | 0 (0.0%) |
| 20 to 24 Minutes | 0 (0.0%) | 79 (8.7%) |
| 25 to 29 Minutes | 25 (2.8%) | 25 (2.8%) |
| 30 to 34 Minutes | 92 (10.4%) | 128 (14.2%) |
| 35 to 39 Minutes | 46 (5.2%) | 132 (14.6%) |
| 40 to 44 Minutes | 99 (11.2%) | 35 (3.9%) |
| 45 to 59 Minutes | 77 (8.7%) | 173 (19.2%) |
| 60 to 89 Minutes | 132 (14.9%) | 47 (5.2%) |
| 90 or more Minutes | 73 (8.2%) | 32 (3.5%) |
Time of Departure to Work by Sex in Columbiana
The most frequent times of departure to work in Columbiana are 6:30 AM to 6:59 AM (203, 22.9%) for males and 7:00 AM to 7:29 AM (217, 24.0%) for females.
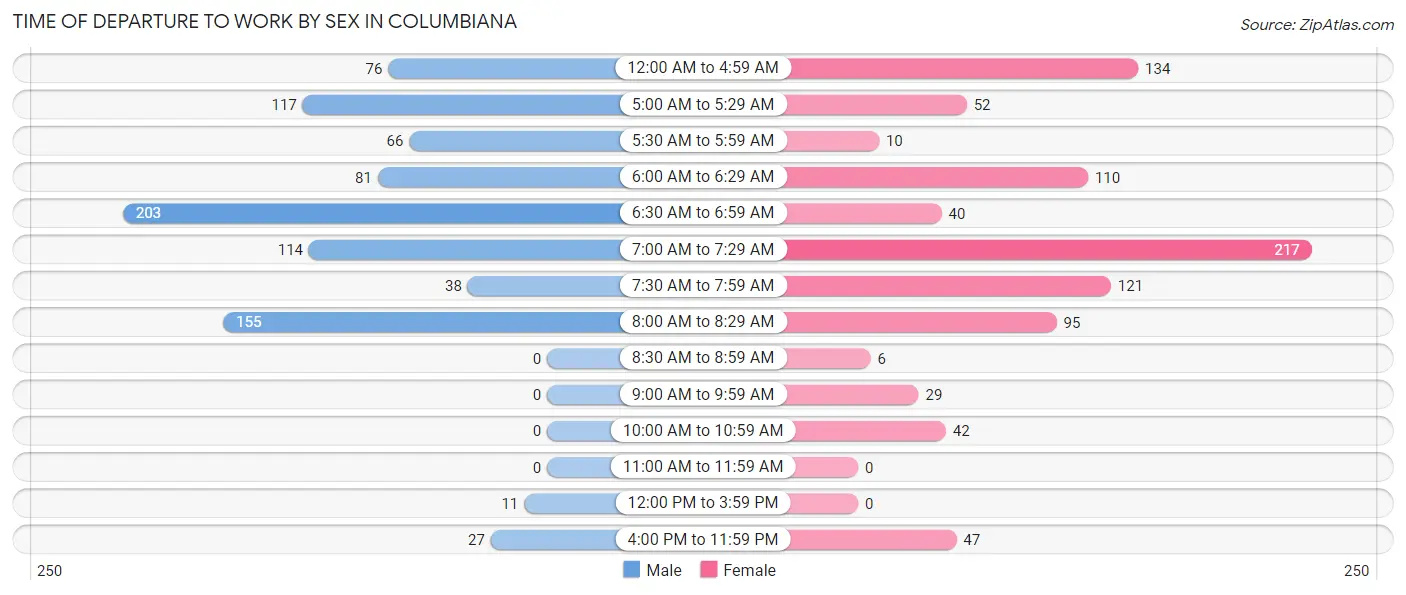
| Time of Departure | Male | Female |
| 12:00 AM to 4:59 AM | 76 (8.6%) | 134 (14.8%) |
| 5:00 AM to 5:29 AM | 117 (13.2%) | 52 (5.8%) |
| 5:30 AM to 5:59 AM | 66 (7.4%) | 10 (1.1%) |
| 6:00 AM to 6:29 AM | 81 (9.1%) | 110 (12.2%) |
| 6:30 AM to 6:59 AM | 203 (22.9%) | 40 (4.4%) |
| 7:00 AM to 7:29 AM | 114 (12.8%) | 217 (24.0%) |
| 7:30 AM to 7:59 AM | 38 (4.3%) | 121 (13.4%) |
| 8:00 AM to 8:29 AM | 155 (17.4%) | 95 (10.5%) |
| 8:30 AM to 8:59 AM | 0 (0.0%) | 6 (0.7%) |
| 9:00 AM to 9:59 AM | 0 (0.0%) | 29 (3.2%) |
| 10:00 AM to 10:59 AM | 0 (0.0%) | 42 (4.6%) |
| 11:00 AM to 11:59 AM | 0 (0.0%) | 0 (0.0%) |
| 12:00 PM to 3:59 PM | 11 (1.2%) | 0 (0.0%) |
| 4:00 PM to 11:59 PM | 27 (3.0%) | 47 (5.2%) |
| Total | 888 (100.0%) | 903 (100.0%) |
Housing Occupancy in Columbiana
Occupancy by Ownership in Columbiana
Of the total 1,486 dwellings in Columbiana, owner-occupied units account for 969 (65.2%), while renter-occupied units make up 517 (34.8%).
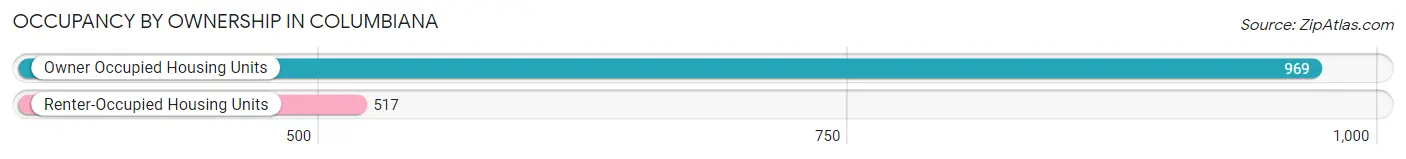
| Occupancy | # Housing Units | % Housing Units |
| Owner Occupied Housing Units | 969 | 65.2% |
| Renter-Occupied Housing Units | 517 | 34.8% |
| Total Occupied Housing Units | 1,486 | 100.0% |
Occupancy by Household Size in Columbiana
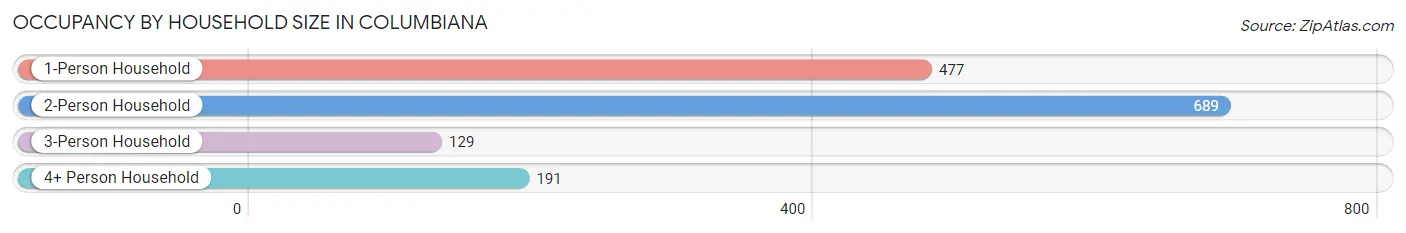
| Household Size | # Housing Units | % Housing Units |
| 1-Person Household | 477 | 32.1% |
| 2-Person Household | 689 | 46.4% |
| 3-Person Household | 129 | 8.7% |
| 4+ Person Household | 191 | 12.9% |
| Total Housing Units | 1,486 | 100.0% |
Occupancy by Ownership by Household Size in Columbiana
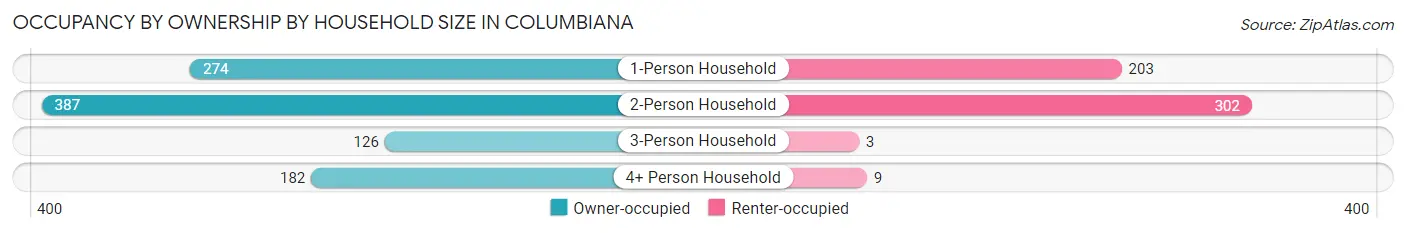
| Household Size | Owner-occupied | Renter-occupied |
| 1-Person Household | 274 (57.4%) | 203 (42.6%) |
| 2-Person Household | 387 (56.2%) | 302 (43.8%) |
| 3-Person Household | 126 (97.7%) | 3 (2.3%) |
| 4+ Person Household | 182 (95.3%) | 9 (4.7%) |
| Total Housing Units | 969 (65.2%) | 517 (34.8%) |
Occupancy by Educational Attainment in Columbiana
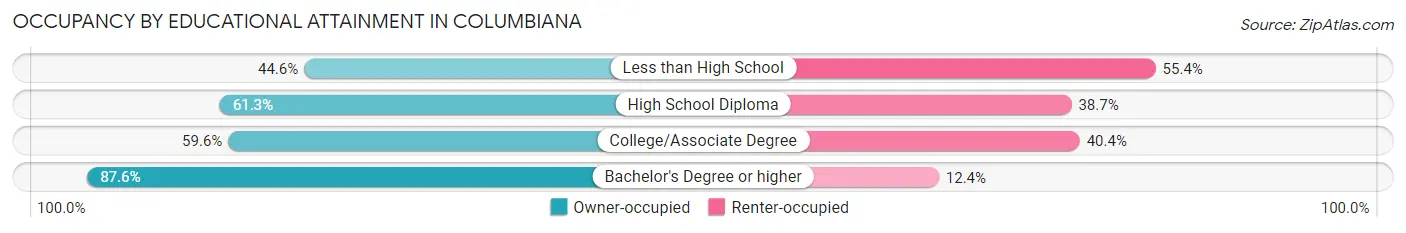
| Household Size | Owner-occupied | Renter-occupied |
| Less than High School | 70 (44.6%) | 87 (55.4%) |
| High School Diploma | 364 (61.3%) | 230 (38.7%) |
| College/Associate Degree | 232 (59.6%) | 157 (40.4%) |
| Bachelor's Degree or higher | 303 (87.6%) | 43 (12.4%) |
Occupancy by Age of Householder in Columbiana
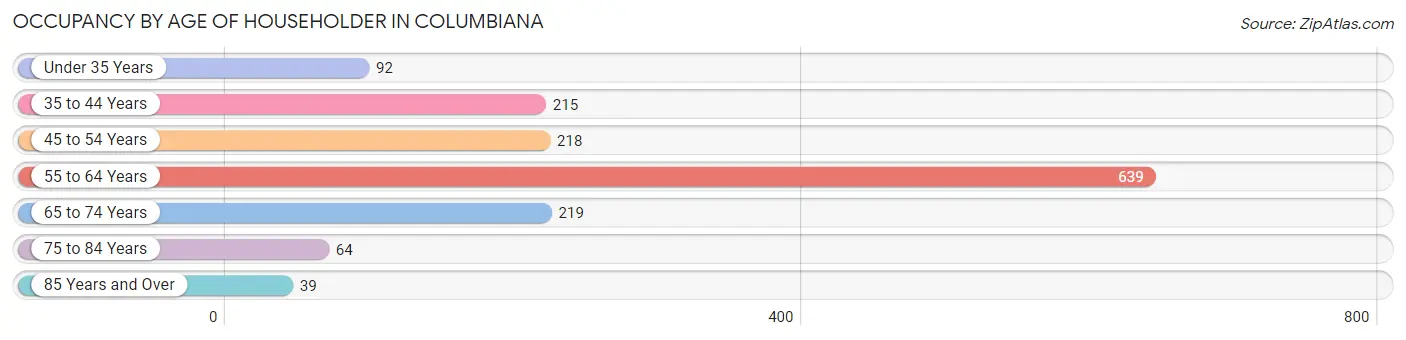
| Age Bracket | # Households | % Households |
| Under 35 Years | 92 | 6.2% |
| 35 to 44 Years | 215 | 14.5% |
| 45 to 54 Years | 218 | 14.7% |
| 55 to 64 Years | 639 | 43.0% |
| 65 to 74 Years | 219 | 14.7% |
| 75 to 84 Years | 64 | 4.3% |
| 85 Years and Over | 39 | 2.6% |
| Total | 1,486 | 100.0% |
Housing Finances in Columbiana
Median Income by Occupancy in Columbiana
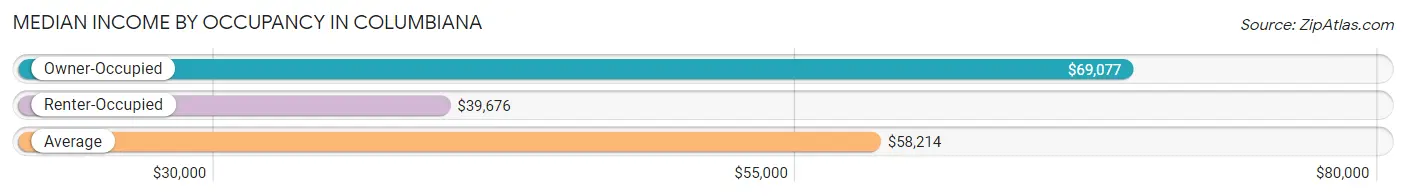
| Occupancy Type | # Households | Median Income |
| Owner-Occupied | 969 (65.2%) | $69,077 |
| Renter-Occupied | 517 (34.8%) | $39,676 |
| Average | 1,486 (100.0%) | $58,214 |
Occupancy by Householder Income Bracket in Columbiana
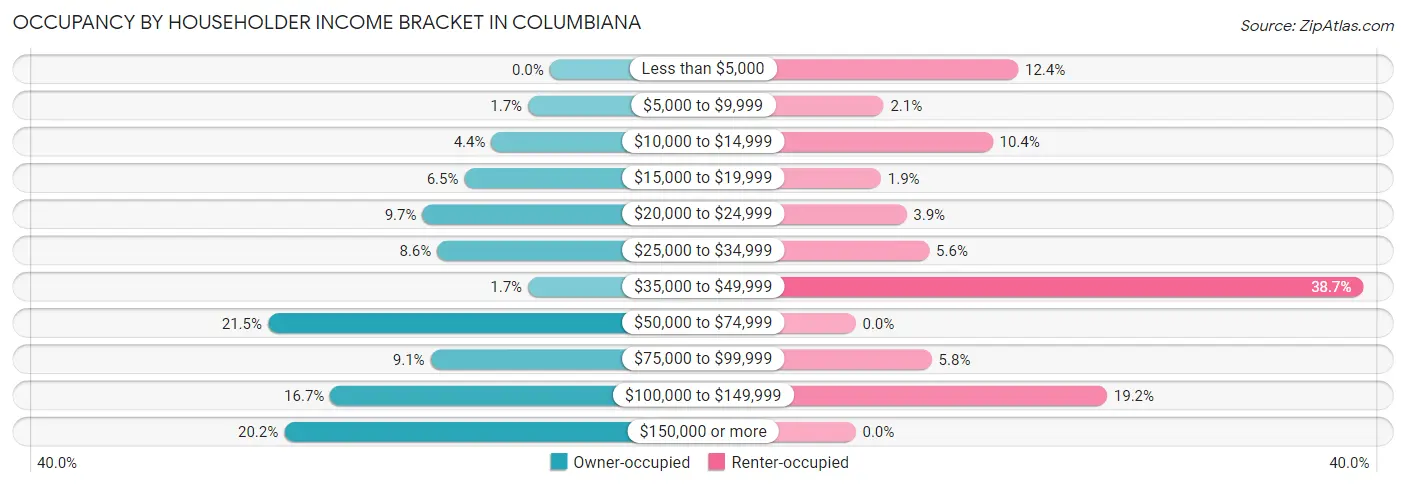
| Income Bracket | Owner-occupied | Renter-occupied |
| Less than $5,000 | 0 (0.0%) | 64 (12.4%) |
| $5,000 to $9,999 | 16 (1.7%) | 11 (2.1%) |
| $10,000 to $14,999 | 43 (4.4%) | 54 (10.4%) |
| $15,000 to $19,999 | 63 (6.5%) | 10 (1.9%) |
| $20,000 to $24,999 | 94 (9.7%) | 20 (3.9%) |
| $25,000 to $34,999 | 83 (8.6%) | 29 (5.6%) |
| $35,000 to $49,999 | 16 (1.7%) | 200 (38.7%) |
| $50,000 to $74,999 | 208 (21.5%) | 0 (0.0%) |
| $75,000 to $99,999 | 88 (9.1%) | 30 (5.8%) |
| $100,000 to $149,999 | 162 (16.7%) | 99 (19.2%) |
| $150,000 or more | 196 (20.2%) | 0 (0.0%) |
| Total | 969 (100.0%) | 517 (100.0%) |
Monthly Housing Cost Tiers in Columbiana
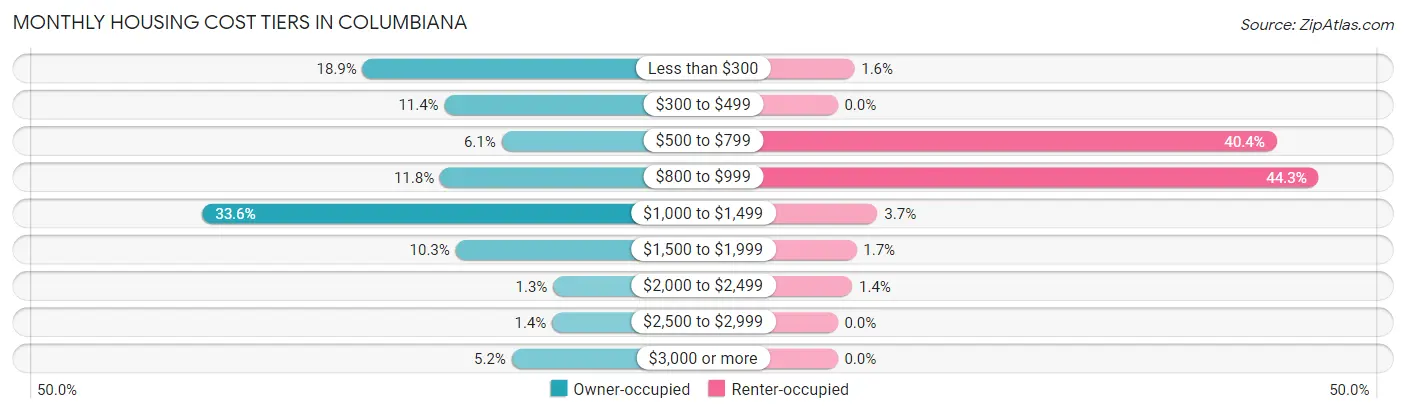
| Monthly Cost | Owner-occupied | Renter-occupied |
| Less than $300 | 183 (18.9%) | 8 (1.5%) |
| $300 to $499 | 110 (11.4%) | 0 (0.0%) |
| $500 to $799 | 59 (6.1%) | 209 (40.4%) |
| $800 to $999 | 114 (11.8%) | 229 (44.3%) |
| $1,000 to $1,499 | 326 (33.6%) | 19 (3.7%) |
| $1,500 to $1,999 | 100 (10.3%) | 9 (1.7%) |
| $2,000 to $2,499 | 13 (1.3%) | 7 (1.3%) |
| $2,500 to $2,999 | 14 (1.4%) | 0 (0.0%) |
| $3,000 or more | 50 (5.2%) | 0 (0.0%) |
| Total | 969 (100.0%) | 517 (100.0%) |
Physical Housing Characteristics in Columbiana
Housing Structures in Columbiana
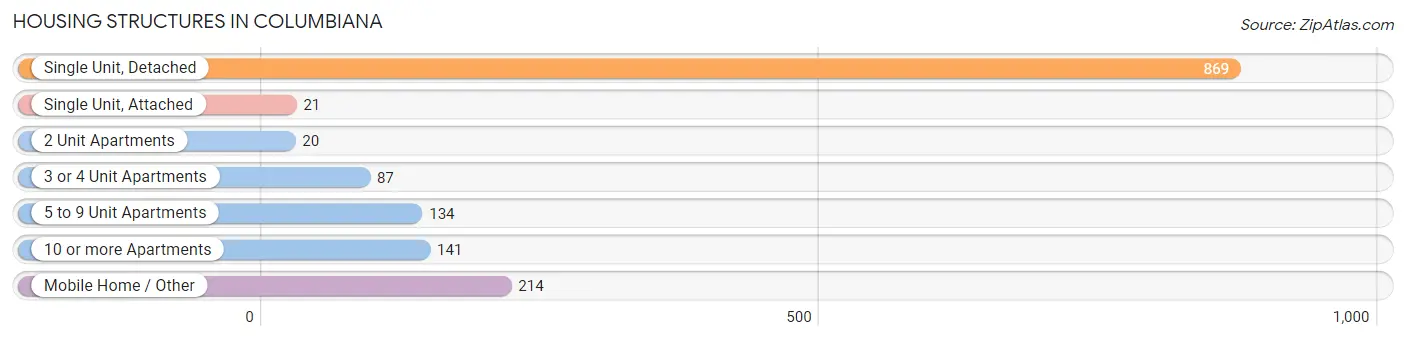
| Structure Type | # Housing Units | % Housing Units |
| Single Unit, Detached | 869 | 58.5% |
| Single Unit, Attached | 21 | 1.4% |
| 2 Unit Apartments | 20 | 1.3% |
| 3 or 4 Unit Apartments | 87 | 5.9% |
| 5 to 9 Unit Apartments | 134 | 9.0% |
| 10 or more Apartments | 141 | 9.5% |
| Mobile Home / Other | 214 | 14.4% |
| Total | 1,486 | 100.0% |
Housing Structures by Occupancy in Columbiana
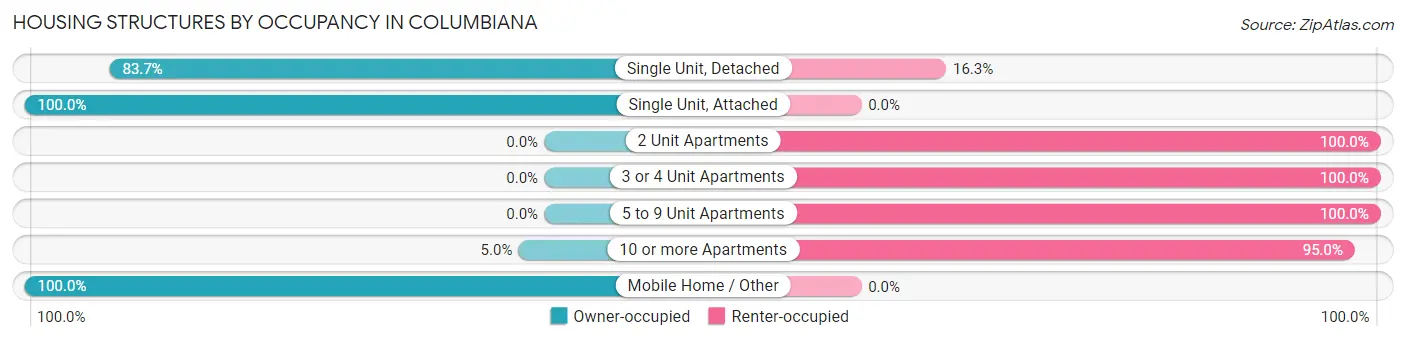
| Structure Type | Owner-occupied | Renter-occupied |
| Single Unit, Detached | 727 (83.7%) | 142 (16.3%) |
| Single Unit, Attached | 21 (100.0%) | 0 (0.0%) |
| 2 Unit Apartments | 0 (0.0%) | 20 (100.0%) |
| 3 or 4 Unit Apartments | 0 (0.0%) | 87 (100.0%) |
| 5 to 9 Unit Apartments | 0 (0.0%) | 134 (100.0%) |
| 10 or more Apartments | 7 (5.0%) | 134 (95.0%) |
| Mobile Home / Other | 214 (100.0%) | 0 (0.0%) |
| Total | 969 (65.2%) | 517 (34.8%) |
Housing Structures by Number of Rooms in Columbiana
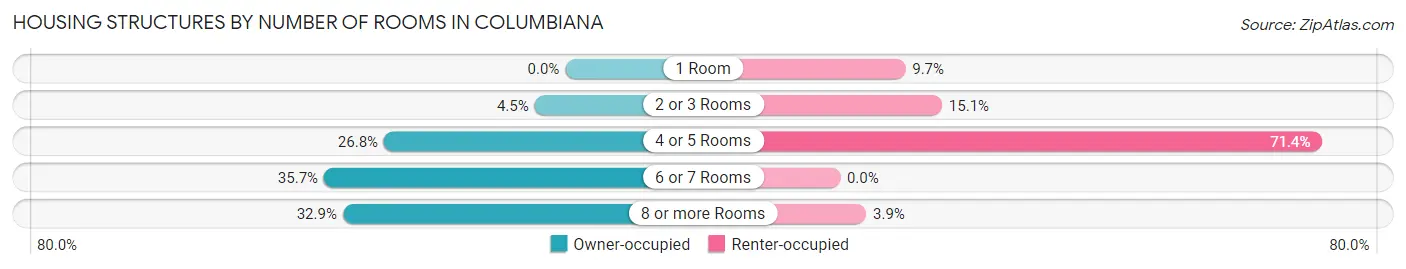
| Number of Rooms | Owner-occupied | Renter-occupied |
| 1 Room | 0 (0.0%) | 50 (9.7%) |
| 2 or 3 Rooms | 44 (4.5%) | 78 (15.1%) |
| 4 or 5 Rooms | 260 (26.8%) | 369 (71.4%) |
| 6 or 7 Rooms | 346 (35.7%) | 0 (0.0%) |
| 8 or more Rooms | 319 (32.9%) | 20 (3.9%) |
| Total | 969 (100.0%) | 517 (100.0%) |
Housing Structure by Heating Type in Columbiana
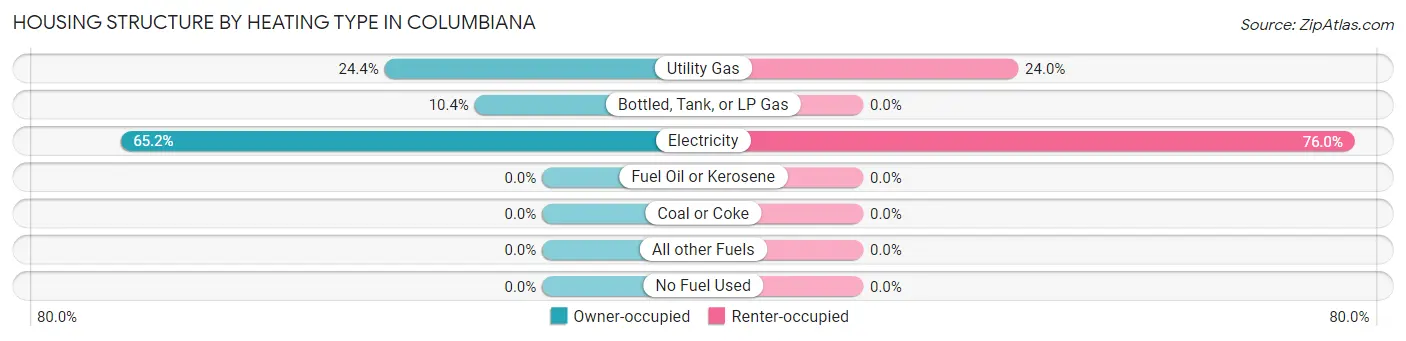
| Heating Type | Owner-occupied | Renter-occupied |
| Utility Gas | 236 (24.4%) | 124 (24.0%) |
| Bottled, Tank, or LP Gas | 101 (10.4%) | 0 (0.0%) |
| Electricity | 632 (65.2%) | 393 (76.0%) |
| Fuel Oil or Kerosene | 0 (0.0%) | 0 (0.0%) |
| Coal or Coke | 0 (0.0%) | 0 (0.0%) |
| All other Fuels | 0 (0.0%) | 0 (0.0%) |
| No Fuel Used | 0 (0.0%) | 0 (0.0%) |
| Total | 969 (100.0%) | 517 (100.0%) |
Household Vehicle Usage in Columbiana
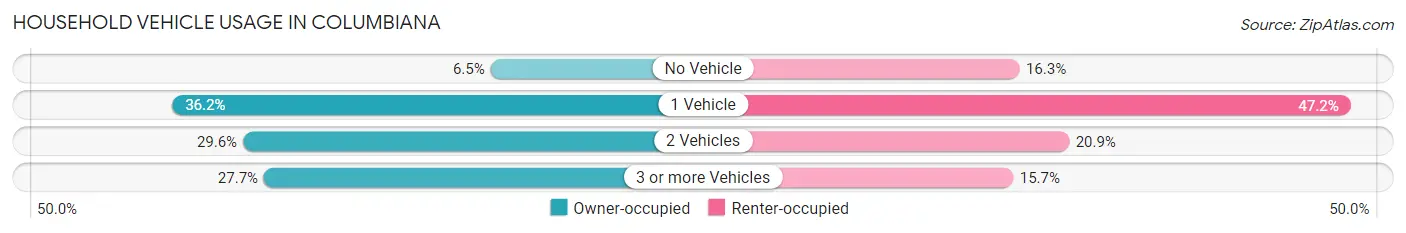
| Vehicles per Household | Owner-occupied | Renter-occupied |
| No Vehicle | 63 (6.5%) | 84 (16.3%) |
| 1 Vehicle | 351 (36.2%) | 244 (47.2%) |
| 2 Vehicles | 287 (29.6%) | 108 (20.9%) |
| 3 or more Vehicles | 268 (27.7%) | 81 (15.7%) |
| Total | 969 (100.0%) | 517 (100.0%) |
Real Estate & Mortgages in Columbiana
Real Estate and Mortgage Overview in Columbiana
| Characteristic | Without Mortgage | With Mortgage |
| Housing Units | 391 | 578 |
| Median Property Value | $199,600 | $204,000 |
| Median Household Income | - | - |
| Monthly Housing Costs | $311 | $50 |
| Real Estate Taxes | $544 | $91 |
Property Value by Mortgage Status in Columbiana
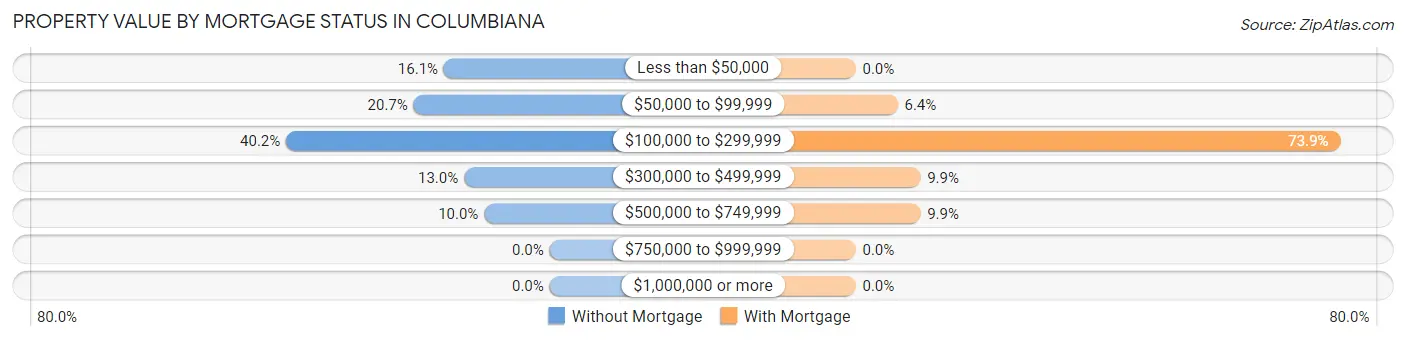
| Property Value | Without Mortgage | With Mortgage |
| Less than $50,000 | 63 (16.1%) | 0 (0.0%) |
| $50,000 to $99,999 | 81 (20.7%) | 37 (6.4%) |
| $100,000 to $299,999 | 157 (40.2%) | 427 (73.9%) |
| $300,000 to $499,999 | 51 (13.0%) | 57 (9.9%) |
| $500,000 to $749,999 | 39 (10.0%) | 57 (9.9%) |
| $750,000 to $999,999 | 0 (0.0%) | 0 (0.0%) |
| $1,000,000 or more | 0 (0.0%) | 0 (0.0%) |
| Total | 391 (100.0%) | 578 (100.0%) |
Household Income by Mortgage Status in Columbiana
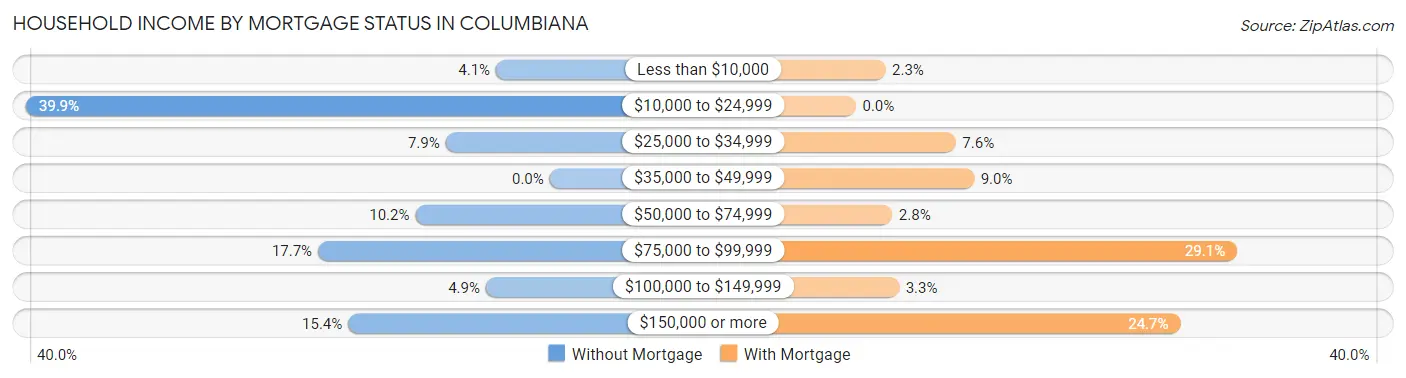
| Household Income | Without Mortgage | With Mortgage |
| Less than $10,000 | 16 (4.1%) | 13 (2.2%) |
| $10,000 to $24,999 | 156 (39.9%) | 0 (0.0%) |
| $25,000 to $34,999 | 31 (7.9%) | 44 (7.6%) |
| $35,000 to $49,999 | 0 (0.0%) | 52 (9.0%) |
| $50,000 to $74,999 | 40 (10.2%) | 16 (2.8%) |
| $75,000 to $99,999 | 69 (17.6%) | 168 (29.1%) |
| $100,000 to $149,999 | 19 (4.9%) | 19 (3.3%) |
| $150,000 or more | 60 (15.3%) | 143 (24.7%) |
| Total | 391 (100.0%) | 578 (100.0%) |
Property Value to Household Income Ratio in Columbiana
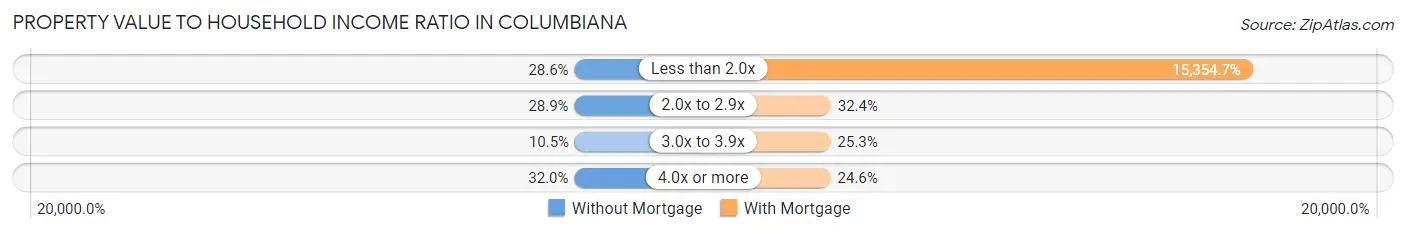
| Value-to-Income Ratio | Without Mortgage | With Mortgage |
| Less than 2.0x | 112 (28.6%) | 88,750 (15,354.7%) |
| 2.0x to 2.9x | 113 (28.9%) | 187 (32.4%) |
| 3.0x to 3.9x | 41 (10.5%) | 146 (25.3%) |
| 4.0x or more | 125 (32.0%) | 142 (24.6%) |
| Total | 391 (100.0%) | 578 (100.0%) |
Real Estate Taxes by Mortgage Status in Columbiana
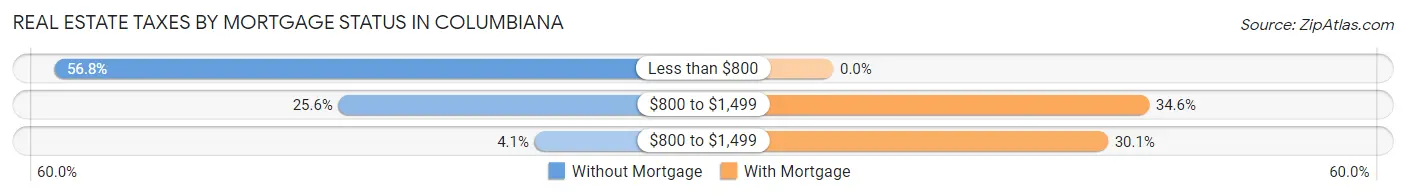
| Property Taxes | Without Mortgage | With Mortgage |
| Less than $800 | 222 (56.8%) | 0 (0.0%) |
| $800 to $1,499 | 100 (25.6%) | 200 (34.6%) |
| $800 to $1,499 | 16 (4.1%) | 174 (30.1%) |
| Total | 391 (100.0%) | 578 (100.0%) |
Health & Disability in Columbiana
Health Insurance Coverage by Age in Columbiana
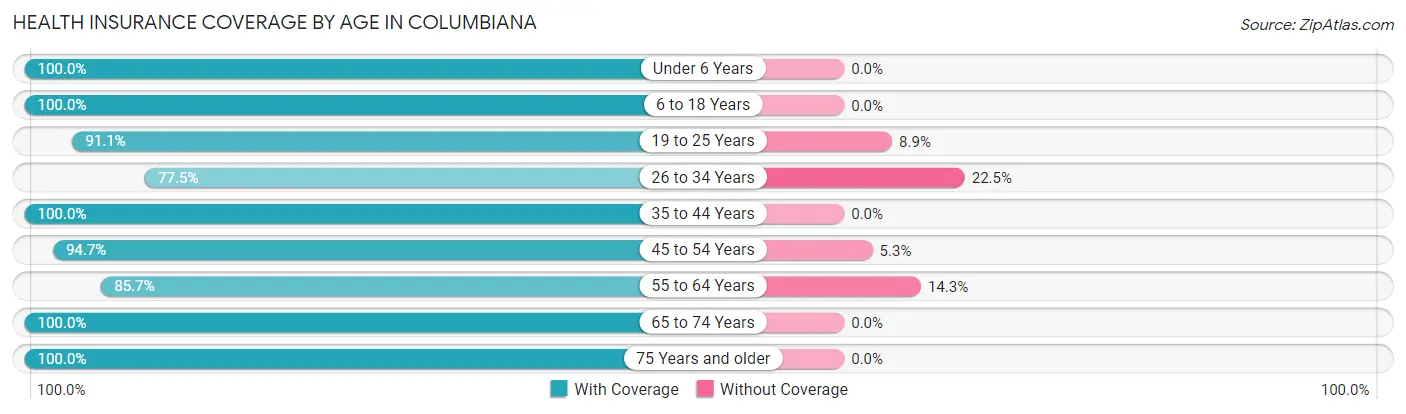
| Age Bracket | With Coverage | Without Coverage |
| Under 6 Years | 200 (100.0%) | 0 (0.0%) |
| 6 to 18 Years | 574 (100.0%) | 0 (0.0%) |
| 19 to 25 Years | 143 (91.1%) | 14 (8.9%) |
| 26 to 34 Years | 283 (77.5%) | 82 (22.5%) |
| 35 to 44 Years | 372 (100.0%) | 0 (0.0%) |
| 45 to 54 Years | 448 (94.7%) | 25 (5.3%) |
| 55 to 64 Years | 659 (85.7%) | 110 (14.3%) |
| 65 to 74 Years | 351 (100.0%) | 0 (0.0%) |
| 75 Years and older | 163 (100.0%) | 0 (0.0%) |
| Total | 3,193 (93.2%) | 231 (6.8%) |
Health Insurance Coverage by Citizenship Status in Columbiana
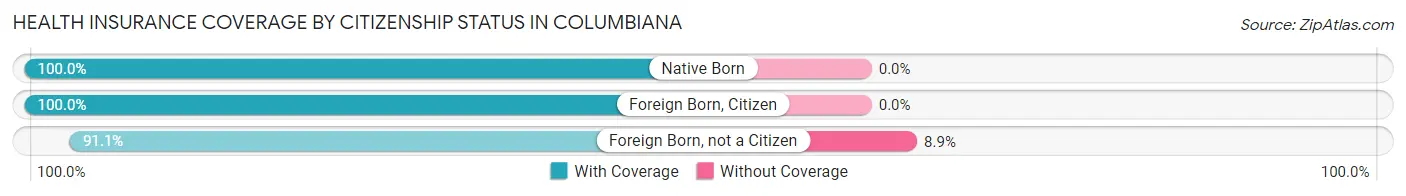
| Citizenship Status | With Coverage | Without Coverage |
| Native Born | 200 (100.0%) | 0 (0.0%) |
| Foreign Born, Citizen | 574 (100.0%) | 0 (0.0%) |
| Foreign Born, not a Citizen | 143 (91.1%) | 14 (8.9%) |
Health Insurance Coverage by Household Income in Columbiana
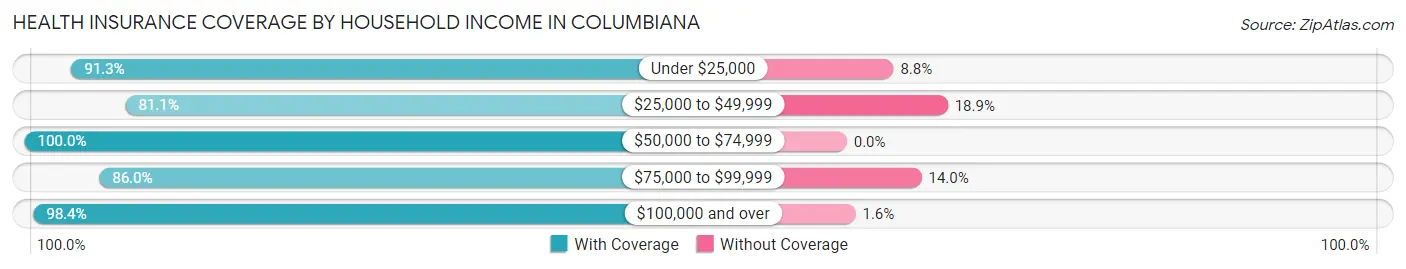
| Household Income | With Coverage | Without Coverage |
| Under $25,000 | 532 (91.2%) | 51 (8.7%) |
| $25,000 to $49,999 | 403 (81.1%) | 94 (18.9%) |
| $50,000 to $74,999 | 437 (100.0%) | 0 (0.0%) |
| $75,000 to $99,999 | 381 (86.0%) | 62 (14.0%) |
| $100,000 and over | 1,440 (98.4%) | 24 (1.6%) |
Public vs Private Health Insurance Coverage by Age in Columbiana
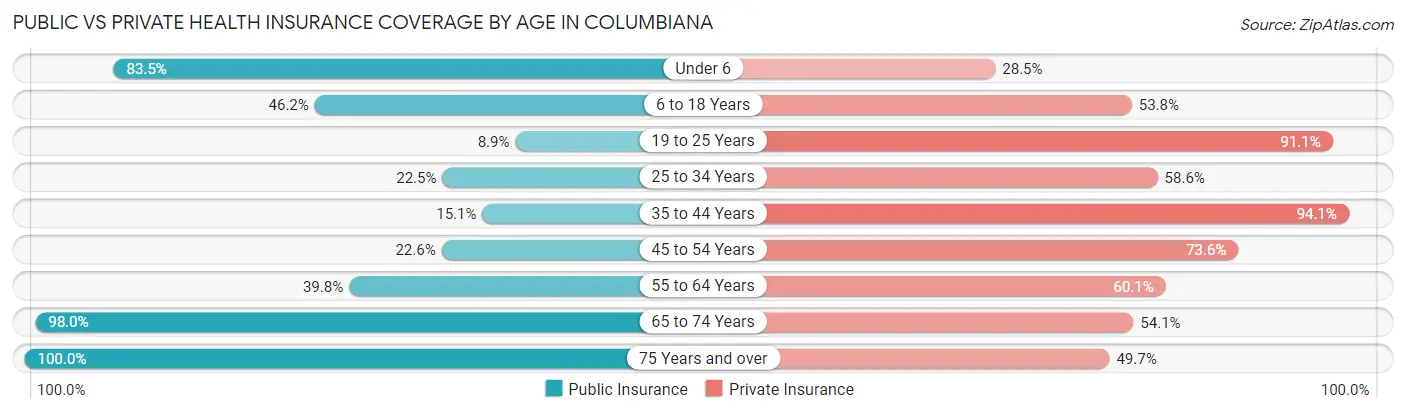
| Age Bracket | Public Insurance | Private Insurance |
| Under 6 | 167 (83.5%) | 57 (28.5%) |
| 6 to 18 Years | 265 (46.2%) | 309 (53.8%) |
| 19 to 25 Years | 14 (8.9%) | 143 (91.1%) |
| 25 to 34 Years | 82 (22.5%) | 214 (58.6%) |
| 35 to 44 Years | 56 (15.0%) | 350 (94.1%) |
| 45 to 54 Years | 107 (22.6%) | 348 (73.6%) |
| 55 to 64 Years | 306 (39.8%) | 462 (60.1%) |
| 65 to 74 Years | 344 (98.0%) | 190 (54.1%) |
| 75 Years and over | 163 (100.0%) | 81 (49.7%) |
| Total | 1,504 (43.9%) | 2,154 (62.9%) |
Disability Status by Sex by Age in Columbiana
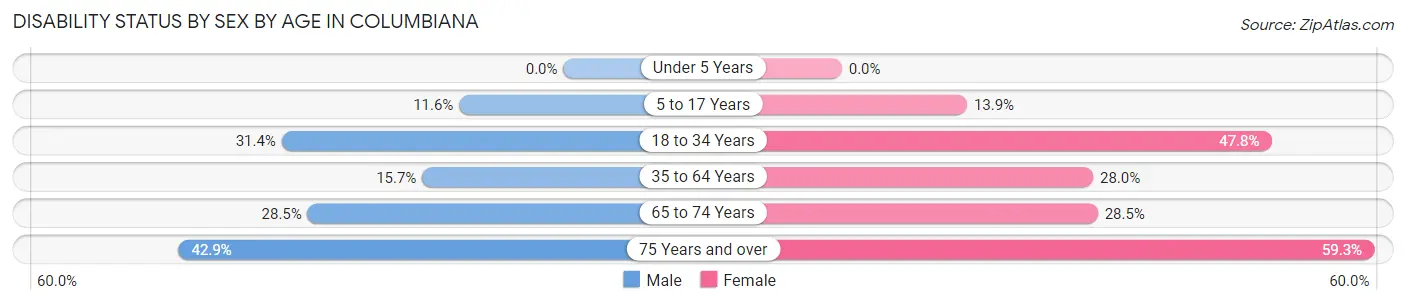
| Age Bracket | Male | Female |
| Under 5 Years | 0 (0.0%) | 0 (0.0%) |
| 5 to 17 Years | 34 (11.6%) | 46 (13.9%) |
| 18 to 34 Years | 117 (31.4%) | 88 (47.8%) |
| 35 to 64 Years | 97 (15.7%) | 279 (28.0%) |
| 65 to 74 Years | 43 (28.5%) | 57 (28.5%) |
| 75 Years and over | 12 (42.9%) | 80 (59.3%) |
Disability Class by Sex by Age in Columbiana
Disability Class: Hearing Difficulty
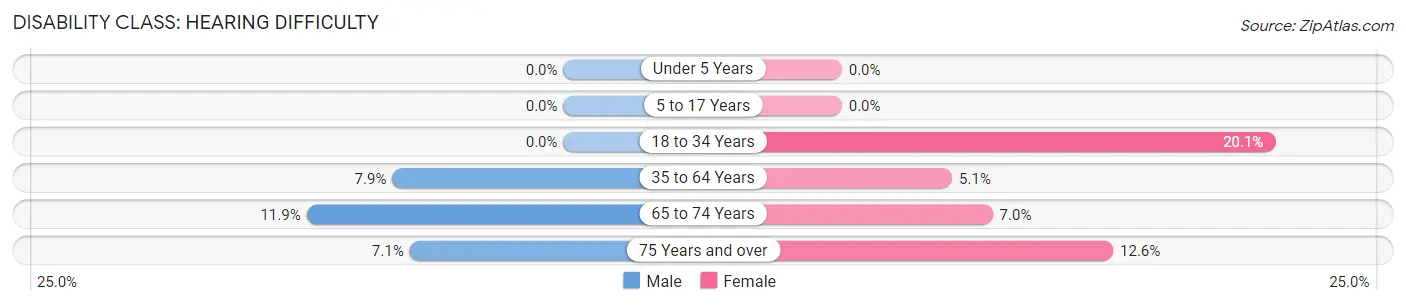
| Age Bracket | Male | Female |
| Under 5 Years | 0 (0.0%) | 0 (0.0%) |
| 5 to 17 Years | 0 (0.0%) | 0 (0.0%) |
| 18 to 34 Years | 0 (0.0%) | 37 (20.1%) |
| 35 to 64 Years | 49 (7.9%) | 51 (5.1%) |
| 65 to 74 Years | 18 (11.9%) | 14 (7.0%) |
| 75 Years and over | 2 (7.1%) | 17 (12.6%) |
Disability Class: Vision Difficulty
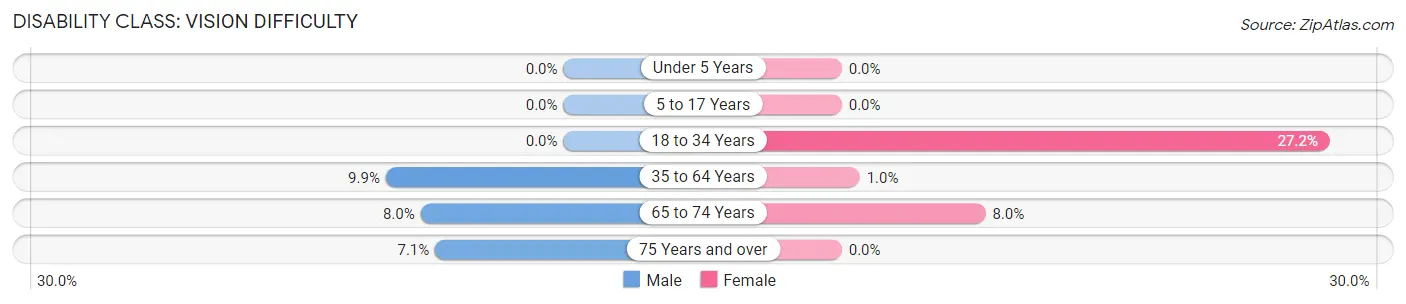
| Age Bracket | Male | Female |
| Under 5 Years | 0 (0.0%) | 0 (0.0%) |
| 5 to 17 Years | 0 (0.0%) | 0 (0.0%) |
| 18 to 34 Years | 0 (0.0%) | 50 (27.2%) |
| 35 to 64 Years | 61 (9.9%) | 10 (1.0%) |
| 65 to 74 Years | 12 (8.0%) | 16 (8.0%) |
| 75 Years and over | 2 (7.1%) | 0 (0.0%) |
Disability Class: Cognitive Difficulty
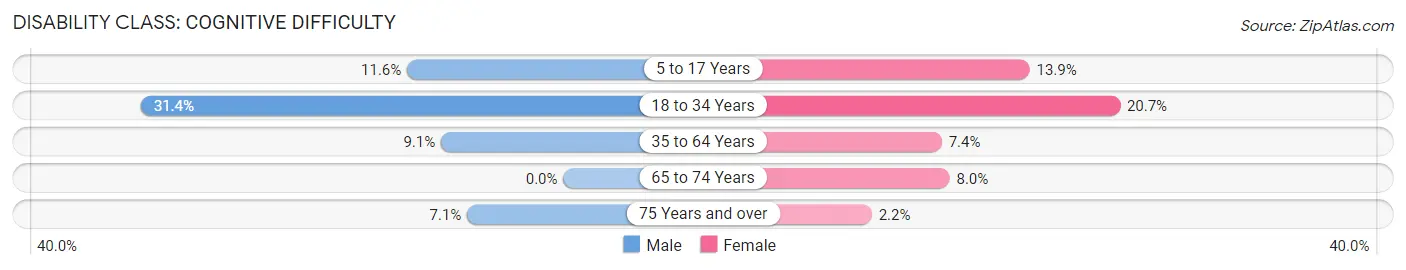
| Age Bracket | Male | Female |
| 5 to 17 Years | 34 (11.6%) | 46 (13.9%) |
| 18 to 34 Years | 117 (31.4%) | 38 (20.6%) |
| 35 to 64 Years | 56 (9.1%) | 74 (7.4%) |
| 65 to 74 Years | 0 (0.0%) | 16 (8.0%) |
| 75 Years and over | 2 (7.1%) | 3 (2.2%) |
Disability Class: Ambulatory Difficulty
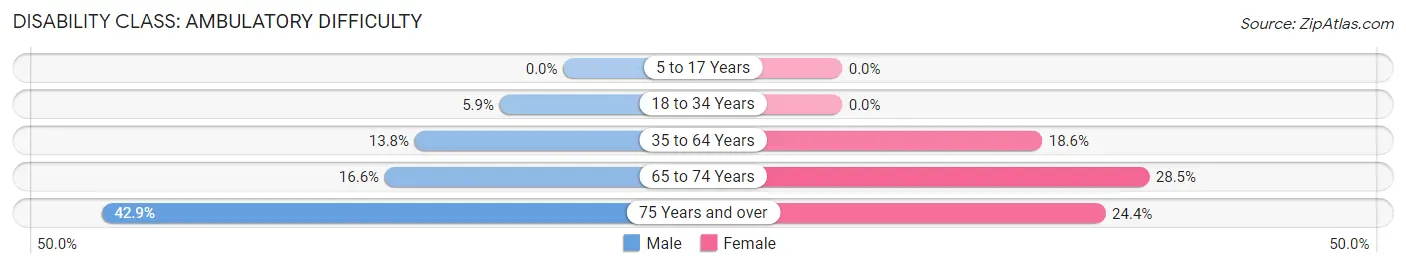
| Age Bracket | Male | Female |
| 5 to 17 Years | 0 (0.0%) | 0 (0.0%) |
| 18 to 34 Years | 22 (5.9%) | 0 (0.0%) |
| 35 to 64 Years | 85 (13.8%) | 185 (18.6%) |
| 65 to 74 Years | 25 (16.6%) | 57 (28.5%) |
| 75 Years and over | 12 (42.9%) | 33 (24.4%) |
Disability Class: Self-Care Difficulty
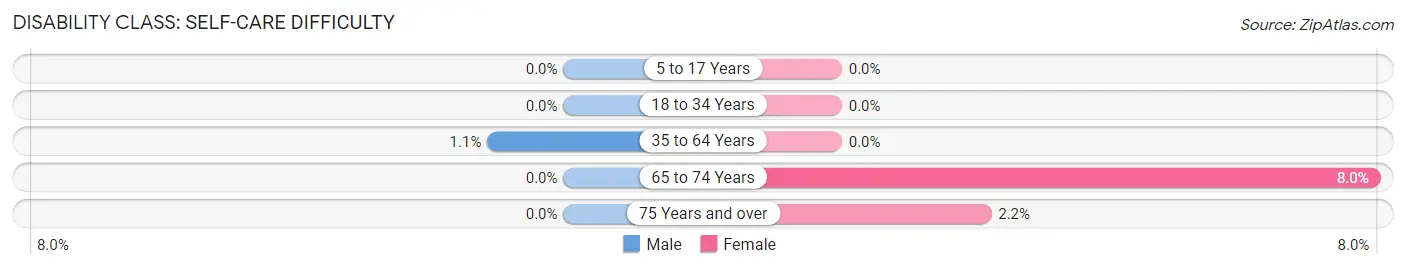
| Age Bracket | Male | Female |
| 5 to 17 Years | 0 (0.0%) | 0 (0.0%) |
| 18 to 34 Years | 0 (0.0%) | 0 (0.0%) |
| 35 to 64 Years | 7 (1.1%) | 0 (0.0%) |
| 65 to 74 Years | 0 (0.0%) | 16 (8.0%) |
| 75 Years and over | 0 (0.0%) | 3 (2.2%) |
Technology Access in Columbiana
Computing Device Access in Columbiana
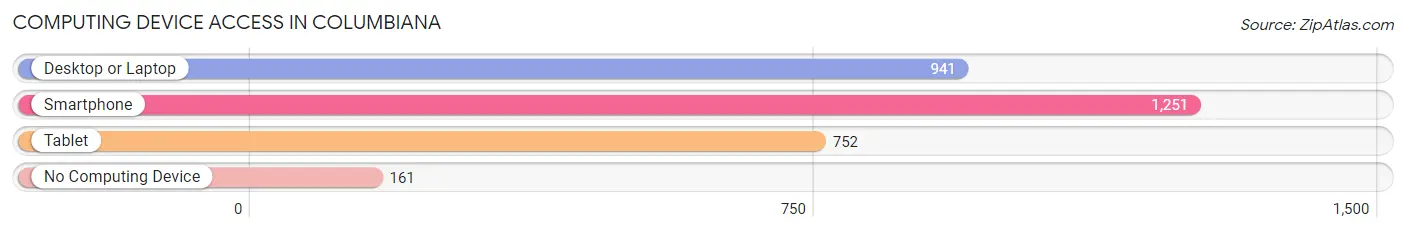
| Device Type | # Households | % Households |
| Desktop or Laptop | 941 | 63.3% |
| Smartphone | 1,251 | 84.2% |
| Tablet | 752 | 50.6% |
| No Computing Device | 161 | 10.8% |
| Total | 1,486 | 100.0% |
Internet Access in Columbiana
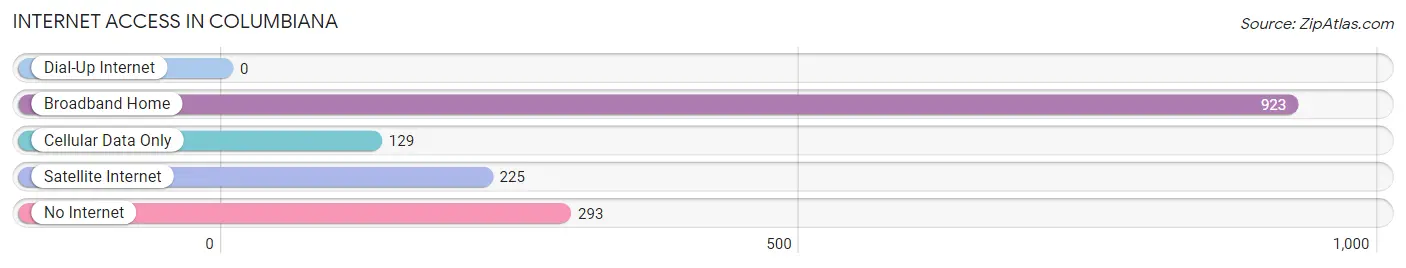
| Internet Type | # Households | % Households |
| Dial-Up Internet | 0 | 0.0% |
| Broadband Home | 923 | 62.1% |
| Cellular Data Only | 129 | 8.7% |
| Satellite Internet | 225 | 15.1% |
| No Internet | 293 | 19.7% |
| Total | 1,486 | 100.0% |
Columbiana Summary
Columbiana, Alabama is a small town located in Shelby County, Alabama. It is situated in the foothills of the Appalachian Mountains, approximately 30 miles south of Birmingham. The town was founded in 1819 and is the oldest town in Shelby County. The population of Columbiana was 2,094 in the 2010 census.
History
The town of Columbiana was founded in 1819 by settlers from North Carolina. The town was named after Christopher Columbus, the explorer who discovered the New World. The town was originally known as "Columbus Town" and was later changed to "Columbiana" in 1821.
The town was an important trading center in the early 19th century. It was the site of the first post office in Shelby County and the first courthouse in the county was built in Columbiana in 1821.
The town was also an important stop on the stagecoach route between Birmingham and Montgomery. The stagecoach route was used by many prominent figures of the time, including President Andrew Jackson and General Robert E. Lee.
The town was also the site of the first cotton gin in Shelby County. The cotton gin was built in 1825 and was used to process cotton grown in the area.
Geography
Columbiana is located in the foothills of the Appalachian Mountains in Shelby County, Alabama. The town is situated at the intersection of U.S. Highway 31 and Alabama State Highway 25.
The town is located approximately 30 miles south of Birmingham and is part of the Birmingham-Hoover Metropolitan Statistical Area.
The town is located in a hilly area and is surrounded by forests and farmland. The town is located near the Cahaba River, which is a popular destination for fishing and canoeing.
Economy
The economy of Columbiana is largely based on agriculture and manufacturing. The town is home to several large manufacturing companies, including a paper mill, a steel mill, and a plastics plant.
The town is also home to several small businesses, including restaurants, retail stores, and service providers.
Demographics
The population of Columbiana was 2,094 in the 2010 census. The population is predominantly white (90.2%) and African American (7.7%). The median household income in the town is $37,917.
The town has a low unemployment rate (3.7%) and a high rate of homeownership (77.2%). The town is served by the Shelby County School System.
Conclusion
Columbiana, Alabama is a small town located in Shelby County, Alabama. It is situated in the foothills of the Appalachian Mountains, approximately 30 miles south of Birmingham. The town was founded in 1819 and is the oldest town in Shelby County. The population of Columbiana was 2,094 in the 2010 census. The economy of Columbiana is largely based on agriculture and manufacturing. The town is predominantly white (90.2%) and African American (7.7%). The median household income in the town is $37,917 and the town has a low unemployment rate (3.7%) and a high rate of homeownership (77.2%).
Common Questions
What is Per Capita Income in Columbiana?
Per Capita income in Columbiana is $27,560.
What is the Median Family Income in Columbiana?
Median Family Income in Columbiana is $77,480.
What is the Median Household income in Columbiana?
Median Household Income in Columbiana is $58,214.
What is Income or Wage Gap in Columbiana?
Income or Wage Gap in Columbiana is 0.5%.
Women in Columbiana earn 99.5 cents for every dollar earned by a man.
What is Family Income Deficit in Columbiana?
Family Income Deficit in Columbiana is $8,016.
Families that are below poverty line in Columbiana earn $8,016 less on average than the poverty threshold level.
What is Inequality or Gini Index in Columbiana?
Inequality or Gini Index in Columbiana is 0.45.
What is the Total Population of Columbiana?
Total Population of Columbiana is 4,552.
What is the Total Male Population of Columbiana?
Total Male Population of Columbiana is 2,472.
What is the Total Female Population of Columbiana?
Total Female Population of Columbiana is 2,080.
What is the Ratio of Males per 100 Females in Columbiana?
There are 118.85 Males per 100 Females in Columbiana.
What is the Ratio of Females per 100 Males in Columbiana?
There are 84.14 Females per 100 Males in Columbiana.
What is the Median Population Age in Columbiana?
Median Population Age in Columbiana is 43.6 Years.
What is the Average Family Size in Columbiana
Average Family Size in Columbiana is 2.9 People.
What is the Average Household Size in Columbiana
Average Household Size in Columbiana is 2.3 People.
How Large is the Labor Force in Columbiana?
There are 1,846 People in the Labor Forcein in Columbiana.
What is the Percentage of People in the Labor Force in Columbiana?
46.4% of People are in the Labor Force in Columbiana.
What is the Unemployment Rate in Columbiana?
Unemployment Rate in Columbiana is 0.9%.