Clio, AL Map & Demographics
Clio Map
Clio Overview
$15,008
PER CAPITA INCOME
$27,027
AVG FAMILY INCOME
$25,290
AVG HOUSEHOLD INCOME
28.3%
WAGE / INCOME GAP [ % ]
71.7¢/ $1
WAGE / INCOME GAP [ $ ]
0.45
INEQUALITY / GINI INDEX
1,415
TOTAL POPULATION
797
MALE POPULATION
618
FEMALE POPULATION
128.96
MALES / 100 FEMALES
77.54
FEMALES / 100 MALES
43.5
MEDIAN AGE
2.9
AVG FAMILY SIZE
2.2
AVG HOUSEHOLD SIZE
450
LABOR FORCE [ PEOPLE ]
39.0%
PERCENT IN LABOR FORCE
5.3%
UNEMPLOYMENT RATE
Clio Zip Codes
Clio Area Codes
Income in Clio
Income Overview in Clio
Per Capita Income in Clio is $15,008, while median incomes of families and households are $27,027 and $25,290 respectively.
| Characteristic | Number | Measure |
| Per Capita Income | 1,415 | $15,008 |
| Median Family Income | 338 | $27,027 |
| Mean Family Income | 338 | $40,378 |
| Median Household Income | 541 | $25,290 |
| Mean Household Income | 541 | $33,736 |
| Income Deficit | 338 | $0 |
| Wage / Income Gap (%) | 1,415 | 28.31% |
| Wage / Income Gap ($) | 1,415 | 71.69¢ per $1 |
| Gini / Inequality Index | 1,415 | 0.45 |
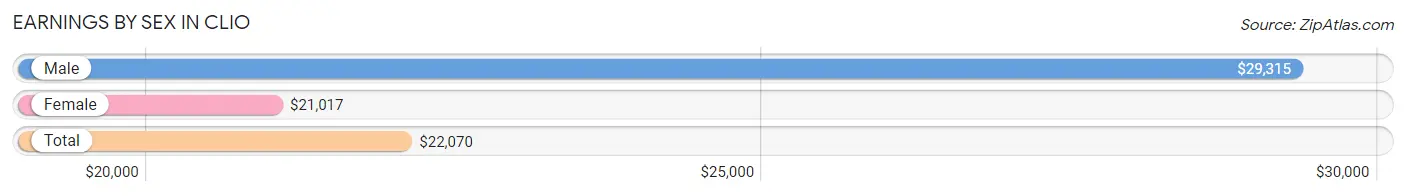
Earnings by Sex in Clio
Average Earnings in Clio are $22,070, $29,315 for men and $21,017 for women, a difference of 28.3%.
| Sex | Number | Average Earnings |
| Male | 293 (56.9%) | $29,315 |
| Female | 222 (43.1%) | $21,017 |
| Total | 515 (100.0%) | $22,070 |
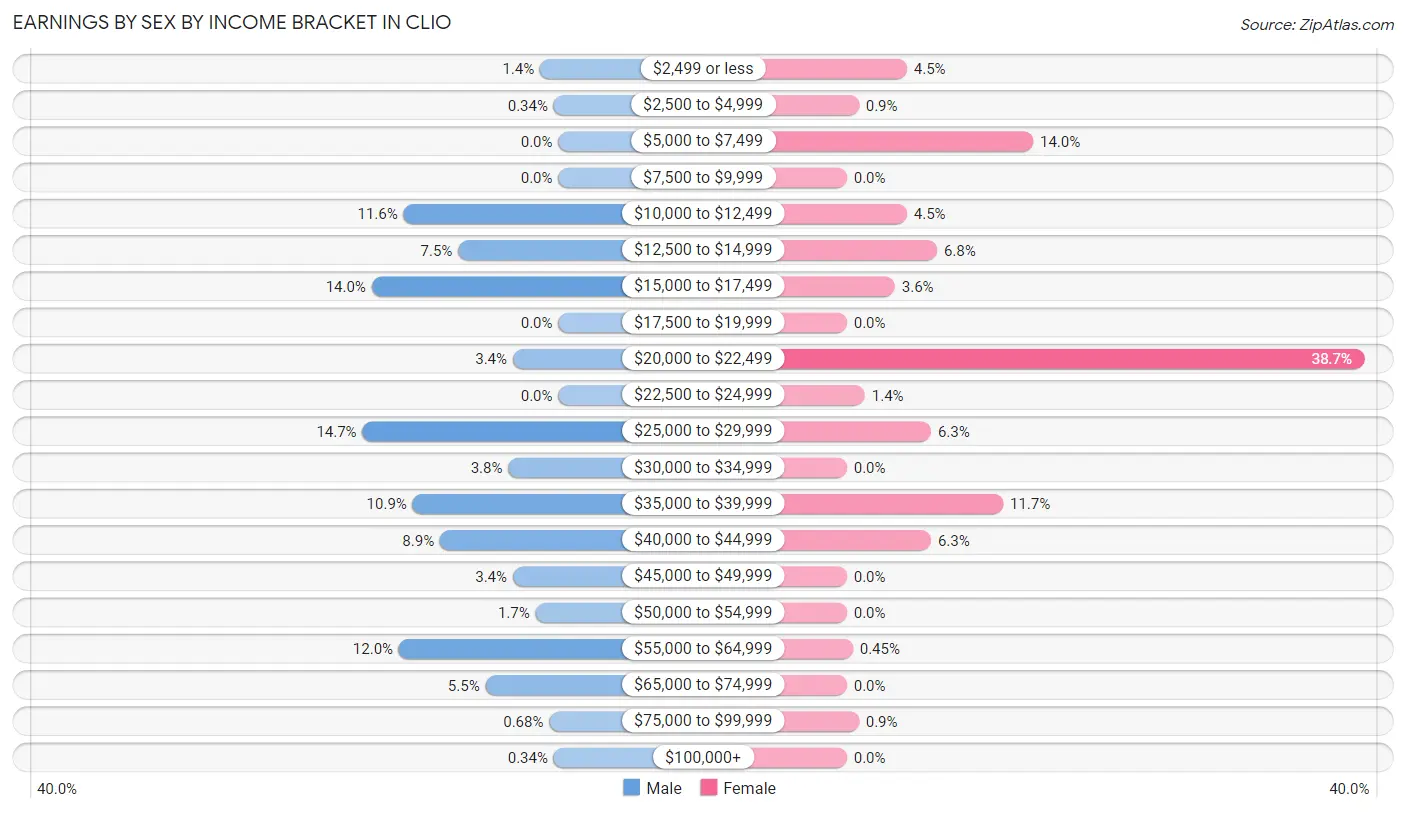
Earnings by Sex by Income Bracket in Clio
The most common earnings brackets in Clio are $25,000 to $29,999 for men (43 | 14.7%) and $20,000 to $22,499 for women (86 | 38.7%).
| Income | Male | Female |
| $2,499 or less | 4 (1.4%) | 10 (4.5%) |
| $2,500 to $4,999 | 1 (0.3%) | 2 (0.9%) |
| $5,000 to $7,499 | 0 (0.0%) | 31 (14.0%) |
| $7,500 to $9,999 | 0 (0.0%) | 0 (0.0%) |
| $10,000 to $12,499 | 34 (11.6%) | 10 (4.5%) |
| $12,500 to $14,999 | 22 (7.5%) | 15 (6.8%) |
| $15,000 to $17,499 | 41 (14.0%) | 8 (3.6%) |
| $17,500 to $19,999 | 0 (0.0%) | 0 (0.0%) |
| $20,000 to $22,499 | 10 (3.4%) | 86 (38.7%) |
| $22,500 to $24,999 | 0 (0.0%) | 3 (1.3%) |
| $25,000 to $29,999 | 43 (14.7%) | 14 (6.3%) |
| $30,000 to $34,999 | 11 (3.7%) | 0 (0.0%) |
| $35,000 to $39,999 | 32 (10.9%) | 26 (11.7%) |
| $40,000 to $44,999 | 26 (8.9%) | 14 (6.3%) |
| $45,000 to $49,999 | 10 (3.4%) | 0 (0.0%) |
| $50,000 to $54,999 | 5 (1.7%) | 0 (0.0%) |
| $55,000 to $64,999 | 35 (11.9%) | 1 (0.4%) |
| $65,000 to $74,999 | 16 (5.5%) | 0 (0.0%) |
| $75,000 to $99,999 | 2 (0.7%) | 2 (0.9%) |
| $100,000+ | 1 (0.3%) | 0 (0.0%) |
| Total | 293 (100.0%) | 222 (100.0%) |
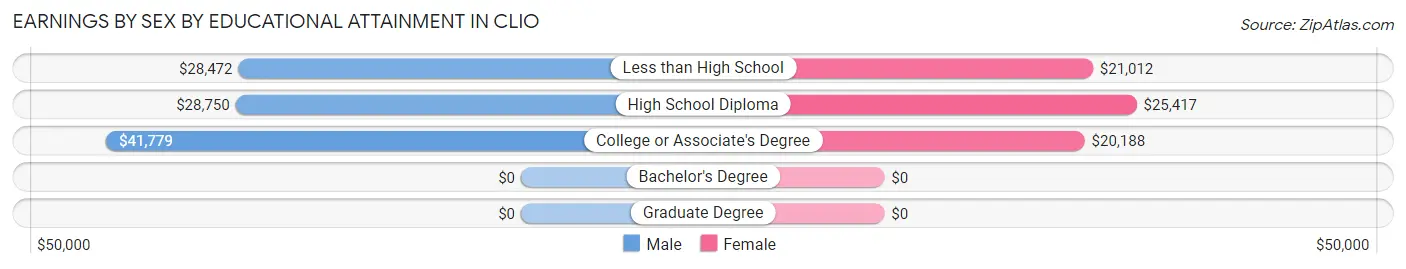
Earnings by Sex by Educational Attainment in Clio
Average earnings in Clio are $30,833 for men and $21,017 for women, a difference of 31.8%. Men with an educational attainment of college or associate's degree enjoy the highest average annual earnings of $41,779, while those with less than high school education earn the least with $28,472. Women with an educational attainment of high school diploma earn the most with the average annual earnings of $25,417, while those with college or associate's degree education have the smallest earnings of $20,188.
| Educational Attainment | Male Income | Female Income |
| Less than High School | $28,472 | $21,012 |
| High School Diploma | $28,750 | $25,417 |
| College or Associate's Degree | $41,779 | $20,188 |
| Bachelor's Degree | - | - |
| Graduate Degree | - | - |
| Total | $30,833 | $21,017 |
Family Income in Clio
Family Income Brackets in Clio
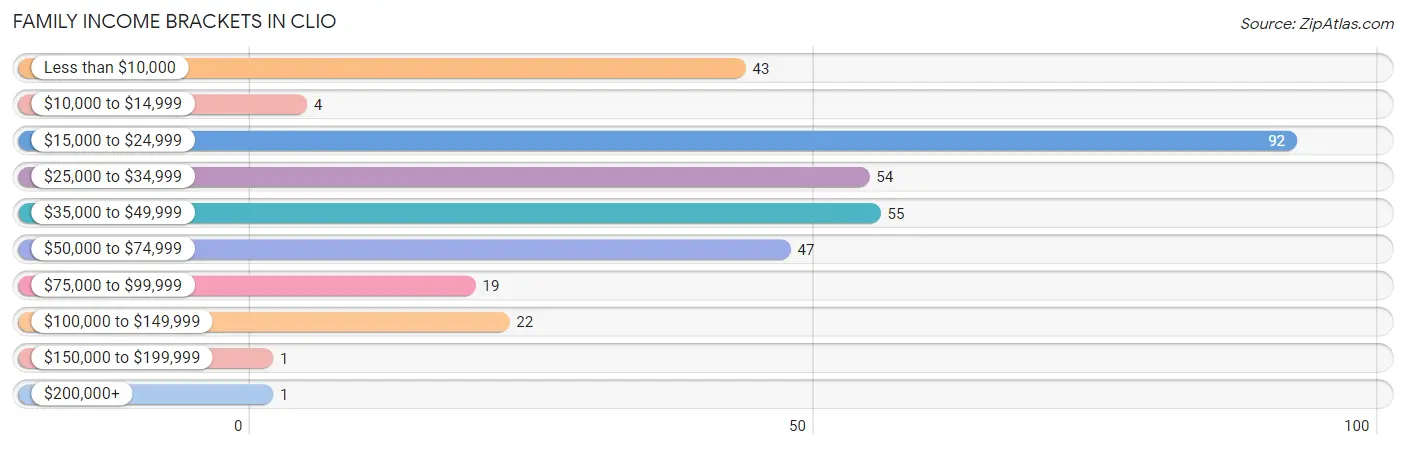
According to the Clio family income data, there are 92 families falling into the $15,000 to $24,999 income range, which is the most common income bracket and makes up 27.2% of all families. Conversely, the $150,000 to $199,999 income bracket is the least frequent group with only 1 families (0.3%) belonging to this category.
| Income Bracket | # Families | % Families |
| Less than $10,000 | 43 | 12.7% |
| $10,000 to $14,999 | 4 | 1.2% |
| $15,000 to $24,999 | 92 | 27.2% |
| $25,000 to $34,999 | 54 | 16.0% |
| $35,000 to $49,999 | 55 | 16.3% |
| $50,000 to $74,999 | 47 | 13.9% |
| $75,000 to $99,999 | 19 | 5.6% |
| $100,000 to $149,999 | 22 | 6.5% |
| $150,000 to $199,999 | 1 | 0.3% |
| $200,000+ | 1 | 0.3% |
Family Income by Famaliy Size in Clio
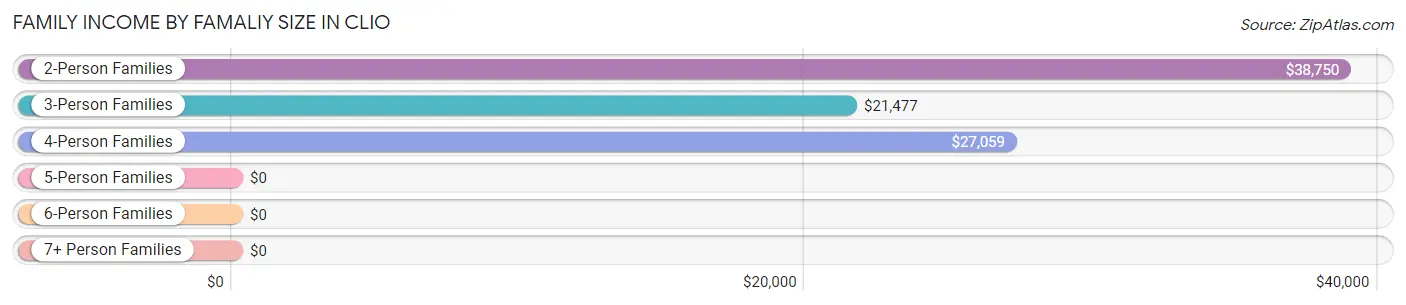
2-person families (133 | 39.4%) account for the highest median family income in Clio with $38,750 per family, while 2-person families (133 | 39.4%) have the highest median income of $19,375 per family member.
| Income Bracket | # Families | Median Income |
| 2-Person Families | 133 (39.4%) | $38,750 |
| 3-Person Families | 109 (32.3%) | $21,477 |
| 4-Person Families | 72 (21.3%) | $27,059 |
| 5-Person Families | 10 (3.0%) | $0 |
| 6-Person Families | 0 (0.0%) | $0 |
| 7+ Person Families | 14 (4.1%) | $0 |
| Total | 338 (100.0%) | $27,027 |
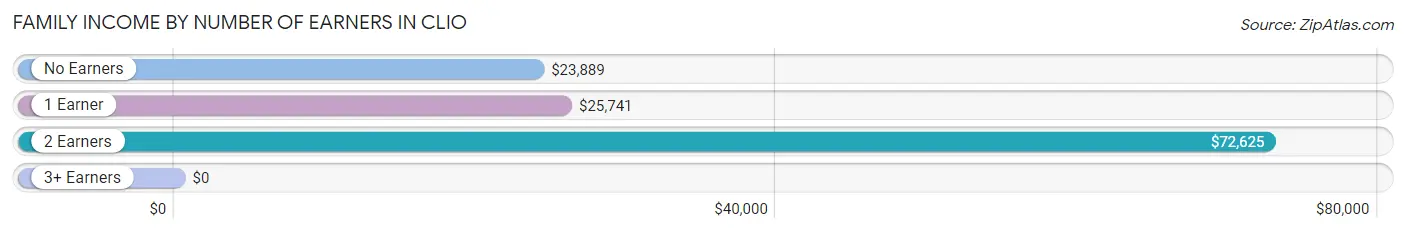
Family Income by Number of Earners in Clio
| Number of Earners | # Families | Median Income |
| No Earners | 92 (27.2%) | $23,889 |
| 1 Earner | 188 (55.6%) | $25,741 |
| 2 Earners | 49 (14.5%) | $72,625 |
| 3+ Earners | 9 (2.7%) | $0 |
| Total | 338 (100.0%) | $27,027 |
Household Income in Clio
Household Income Brackets in Clio
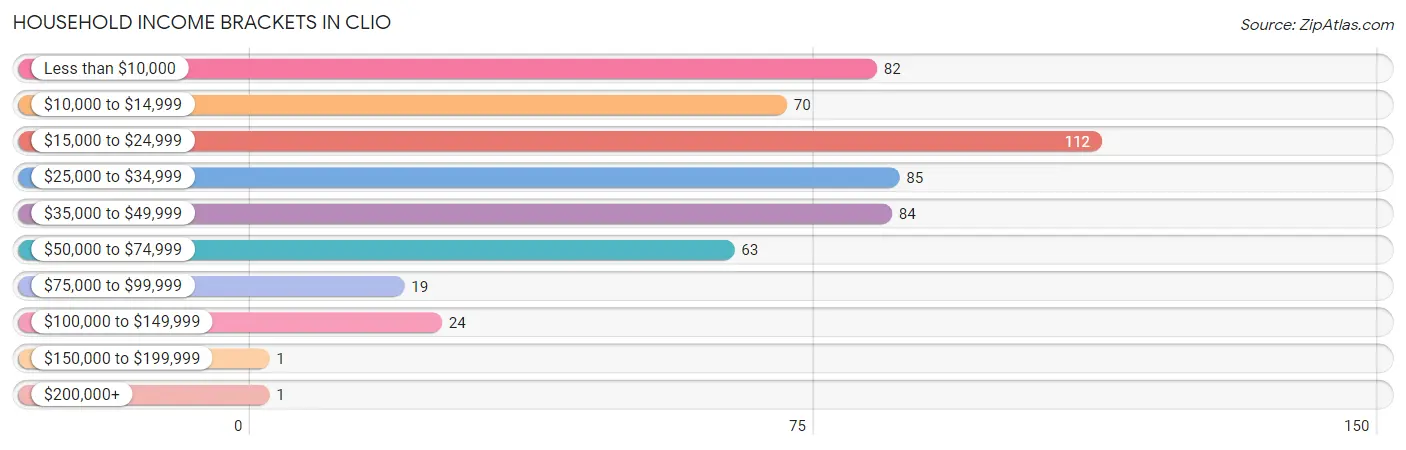
With 112 households falling in the category, the $15,000 to $24,999 income range is the most frequent in Clio, accounting for 20.7% of all households. In contrast, only 1 households (0.2%) fall into the $150,000 to $199,999 income bracket, making it the least populous group.
| Income Bracket | # Households | % Households |
| Less than $10,000 | 82 | 15.2% |
| $10,000 to $14,999 | 70 | 12.9% |
| $15,000 to $24,999 | 112 | 20.7% |
| $25,000 to $34,999 | 85 | 15.7% |
| $35,000 to $49,999 | 84 | 15.5% |
| $50,000 to $74,999 | 63 | 11.6% |
| $75,000 to $99,999 | 19 | 3.5% |
| $100,000 to $149,999 | 24 | 4.4% |
| $150,000 to $199,999 | 1 | 0.2% |
| $200,000+ | 1 | 0.2% |
Household Income by Householder Age in Clio
The median household income in Clio is $25,290, with the highest median household income of $25,809 found in the 65+ years age bracket for the primary householder. A total of 185 households (34.2%) fall into this category. Meanwhile, the 15 to 24 years age bracket for the primary householder has the lowest median household income of $0, with 5 households (0.9%) in this group.
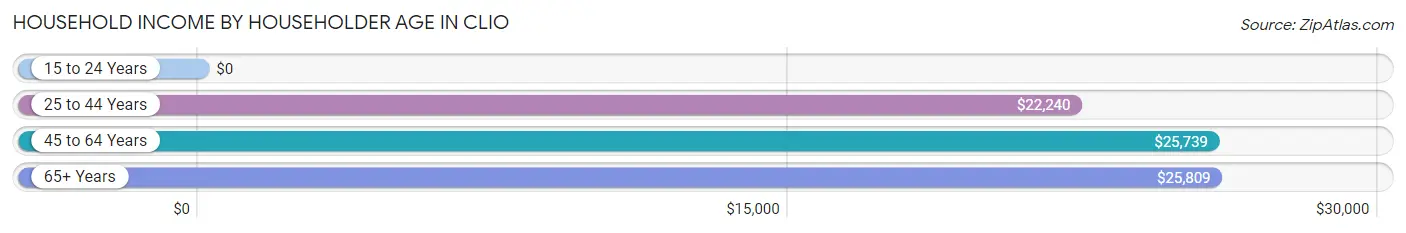
| Income Bracket | # Households | Median Income |
| 15 to 24 Years | 5 (0.9%) | $0 |
| 25 to 44 Years | 216 (39.9%) | $22,240 |
| 45 to 64 Years | 135 (24.9%) | $25,739 |
| 65+ Years | 185 (34.2%) | $25,809 |
| Total | 541 (100.0%) | $25,290 |
Poverty in Clio
Income Below Poverty by Sex and Age in Clio
With 34.2% poverty level for males and 50.8% for females among the residents of Clio, 5 year old males and 15 year old females are the most vulnerable to poverty, with 26 males (78.8%) and 31 females (100.0%) in their respective age groups living below the poverty level.
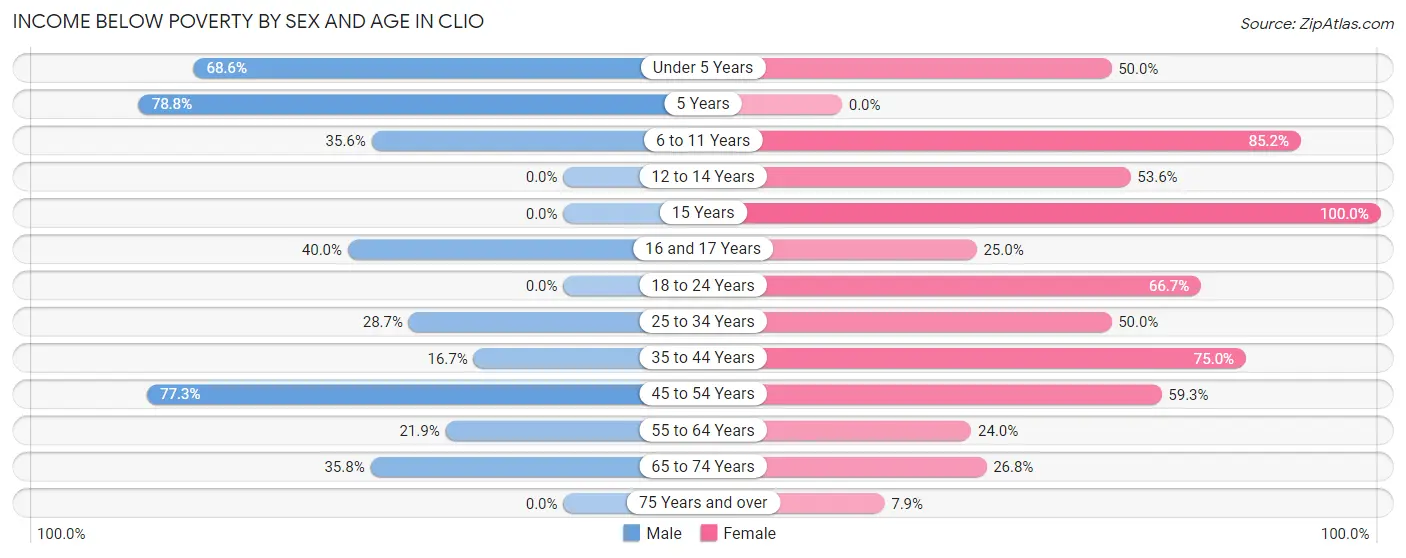
| Age Bracket | Male | Female |
| Under 5 Years | 35 (68.6%) | 8 (50.0%) |
| 5 Years | 26 (78.8%) | 0 (0.0%) |
| 6 to 11 Years | 21 (35.6%) | 23 (85.2%) |
| 12 to 14 Years | 0 (0.0%) | 15 (53.6%) |
| 15 Years | 0 (0.0%) | 31 (100.0%) |
| 16 and 17 Years | 6 (40.0%) | 2 (25.0%) |
| 18 to 24 Years | 0 (0.0%) | 10 (66.7%) |
| 25 to 34 Years | 37 (28.7%) | 44 (50.0%) |
| 35 to 44 Years | 11 (16.7%) | 99 (75.0%) |
| 45 to 54 Years | 17 (77.3%) | 35 (59.3%) |
| 55 to 64 Years | 14 (21.9%) | 18 (24.0%) |
| 65 to 74 Years | 29 (35.8%) | 26 (26.8%) |
| 75 Years and over | 0 (0.0%) | 3 (7.9%) |
| Total | 196 (34.2%) | 314 (50.8%) |
Income Above Poverty by Sex and Age in Clio
According to the poverty statistics in Clio, males aged 12 to 14 years and females aged 5 years are the age groups that are most secure financially, with 100.0% of males and 100.0% of females in these age groups living above the poverty line.
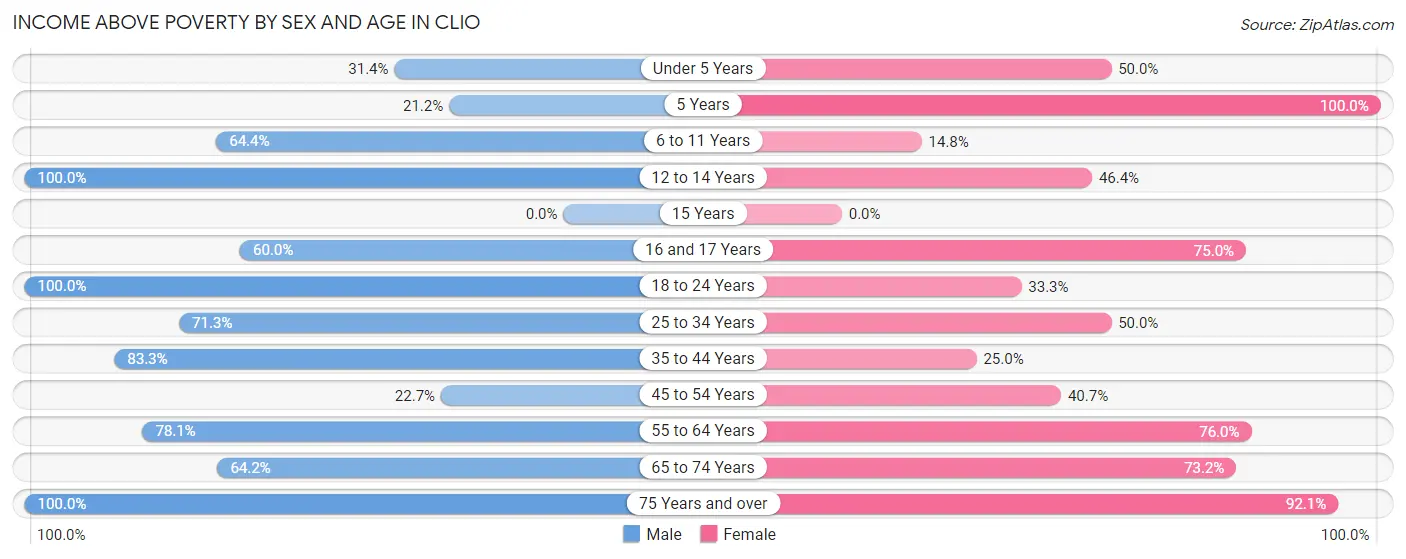
| Age Bracket | Male | Female |
| Under 5 Years | 16 (31.4%) | 8 (50.0%) |
| 5 Years | 7 (21.2%) | 4 (100.0%) |
| 6 to 11 Years | 38 (64.4%) | 4 (14.8%) |
| 12 to 14 Years | 12 (100.0%) | 13 (46.4%) |
| 15 Years | 0 (0.0%) | 0 (0.0%) |
| 16 and 17 Years | 9 (60.0%) | 6 (75.0%) |
| 18 to 24 Years | 19 (100.0%) | 5 (33.3%) |
| 25 to 34 Years | 92 (71.3%) | 44 (50.0%) |
| 35 to 44 Years | 55 (83.3%) | 33 (25.0%) |
| 45 to 54 Years | 5 (22.7%) | 24 (40.7%) |
| 55 to 64 Years | 50 (78.1%) | 57 (76.0%) |
| 65 to 74 Years | 52 (64.2%) | 71 (73.2%) |
| 75 Years and over | 23 (100.0%) | 35 (92.1%) |
| Total | 378 (65.8%) | 304 (49.2%) |
Income Below Poverty Among Married-Couple Families in Clio
The poverty statistics for married-couple families in Clio show that 21.7% or 39 of the total 180 families live below the poverty line. Families with 5 or more children have the highest poverty rate of 42.9%, comprising of 6 families. On the other hand, families with 3 or 4 children have the lowest poverty rate of 0.0%, which includes 0 families.
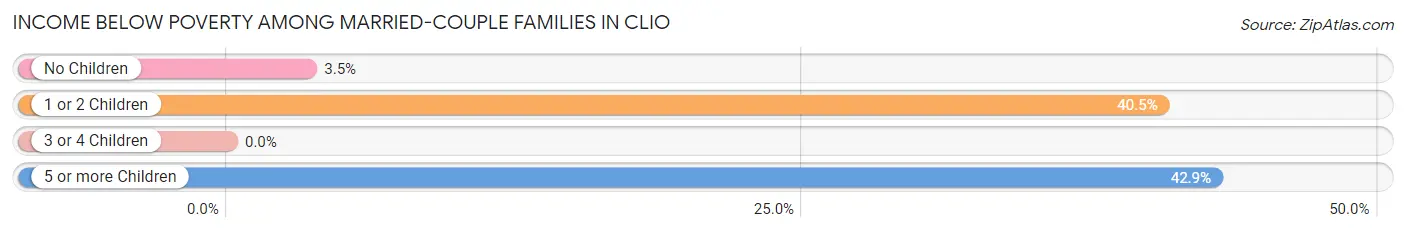
| Children | Above Poverty | Below Poverty |
| No Children | 84 (96.6%) | 3 (3.5%) |
| 1 or 2 Children | 44 (59.5%) | 30 (40.5%) |
| 3 or 4 Children | 5 (100.0%) | 0 (0.0%) |
| 5 or more Children | 8 (57.1%) | 6 (42.9%) |
| Total | 141 (78.3%) | 39 (21.7%) |
Income Below Poverty Among Single-Parent Households in Clio
According to the poverty data in Clio, 13.6% or 3 single-father households and 77.2% or 105 single-mother households are living below the poverty line. Among single-father households, those with 3 or 4 children have the highest poverty rate, with 3 households (100.0%) experiencing poverty. Likewise, among single-mother households, those with 1 or 2 children have the highest poverty rate, with 92 households (100.0%) falling below the poverty line.
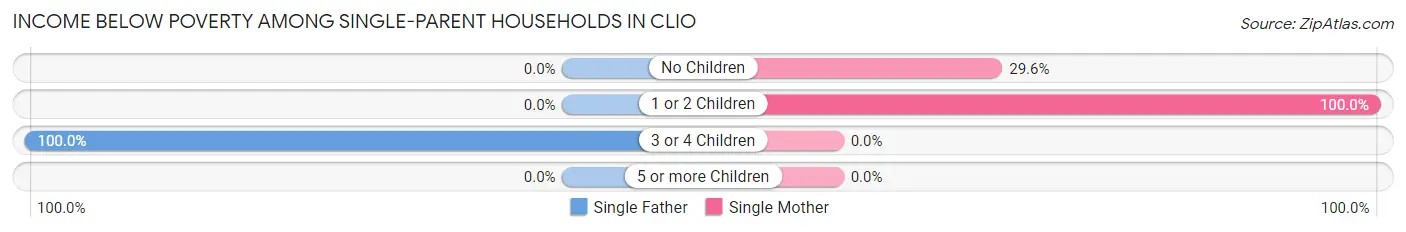
| Children | Single Father | Single Mother |
| No Children | 0 (0.0%) | 13 (29.5%) |
| 1 or 2 Children | 0 (0.0%) | 92 (100.0%) |
| 3 or 4 Children | 3 (100.0%) | 0 (0.0%) |
| 5 or more Children | 0 (0.0%) | 0 (0.0%) |
| Total | 3 (13.6%) | 105 (77.2%) |
Income Below Poverty Among Married-Couple vs Single-Parent Households in Clio
The poverty data for Clio shows that 39 of the married-couple family households (21.7%) and 108 of the single-parent households (68.3%) are living below the poverty level. Within the married-couple family households, those with 5 or more children have the highest poverty rate, with 6 households (42.9%) falling below the poverty line. Among the single-parent households, those with 3 or 4 children have the highest poverty rate, with 3 household (100.0%) living below poverty.
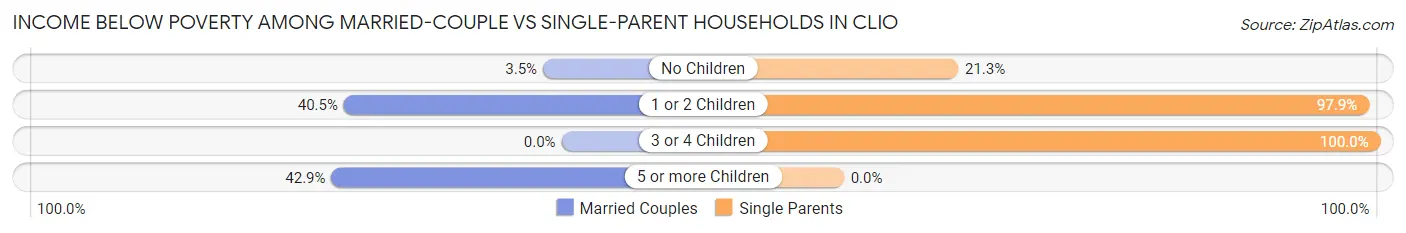
| Children | Married-Couple Families | Single-Parent Households |
| No Children | 3 (3.5%) | 13 (21.3%) |
| 1 or 2 Children | 30 (40.5%) | 92 (97.9%) |
| 3 or 4 Children | 0 (0.0%) | 3 (100.0%) |
| 5 or more Children | 6 (42.9%) | 0 (0.0%) |
| Total | 39 (21.7%) | 108 (68.3%) |
Race in Clio
The most populous races in Clio are Black / African American (730 | 51.6%), Hispanic or Latino (407 | 28.8%), and Some other Race (338 | 23.9%).
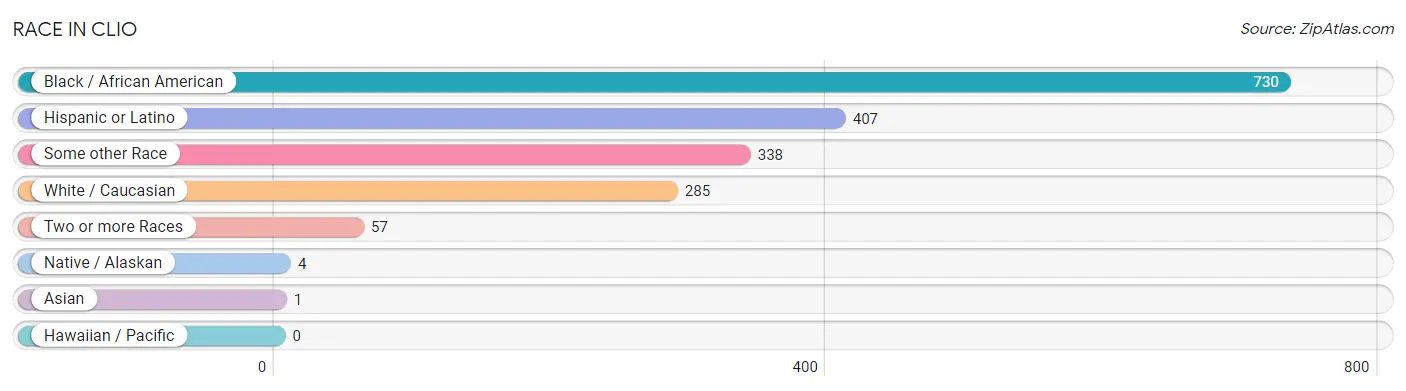
| Race | # Population | % Population |
| Asian | 1 | 0.1% |
| Black / African American | 730 | 51.6% |
| Hawaiian / Pacific | 0 | 0.0% |
| Hispanic or Latino | 407 | 28.8% |
| Native / Alaskan | 4 | 0.3% |
| White / Caucasian | 285 | 20.1% |
| Two or more Races | 57 | 4.0% |
| Some other Race | 338 | 23.9% |
| Total | 1,415 | 100.0% |
Ancestry in Clio
The most populous ancestries reported in Clio are Mexican (367 | 25.9%), American (321 | 22.7%), Central American (40 | 2.8%), Irish (38 | 2.7%), and English (34 | 2.4%), together accounting for 56.6% of all Clio residents.
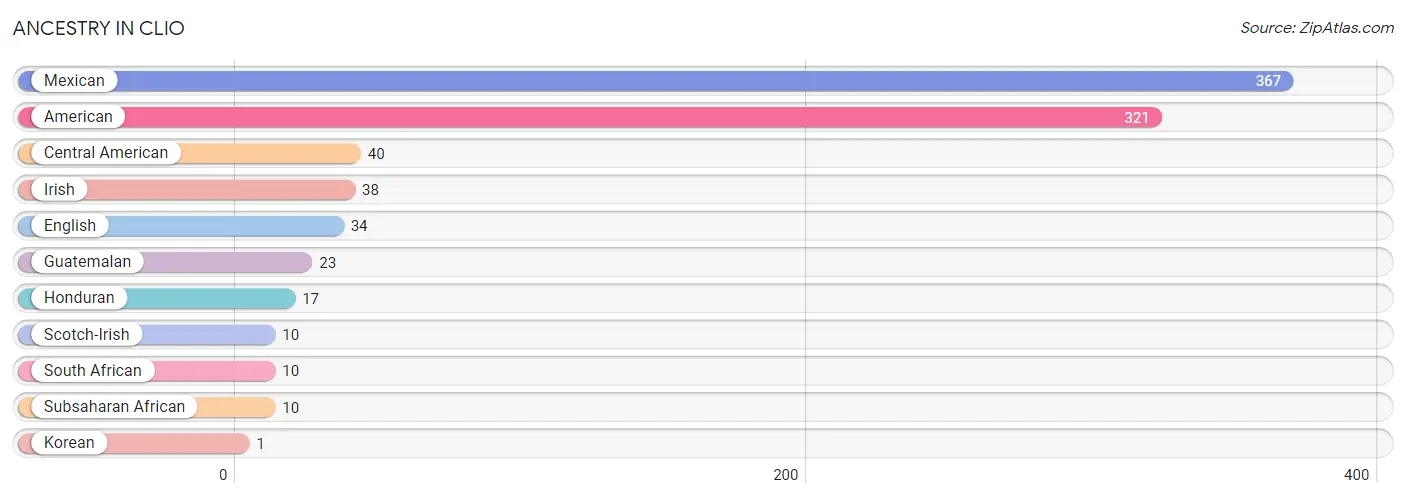
| Ancestry | # Population | % Population |
| American | 321 | 22.7% |
| Central American | 40 | 2.8% |
| English | 34 | 2.4% |
| Guatemalan | 23 | 1.6% |
| Honduran | 17 | 1.2% |
| Irish | 38 | 2.7% |
| Korean | 1 | 0.1% |
| Mexican | 367 | 25.9% |
| Scotch-Irish | 10 | 0.7% |
| South African | 10 | 0.7% |
| Subsaharan African | 10 | 0.7% | View All 11 Rows |
Immigrants in Clio
The most numerous immigrant groups reported in Clio came from Central America (238 | 16.8%), Latin America (238 | 16.8%), Mexico (211 | 14.9%), Guatemala (23 | 1.6%), and Honduras (4 | 0.3%), together accounting for 50.5% of all Clio residents.
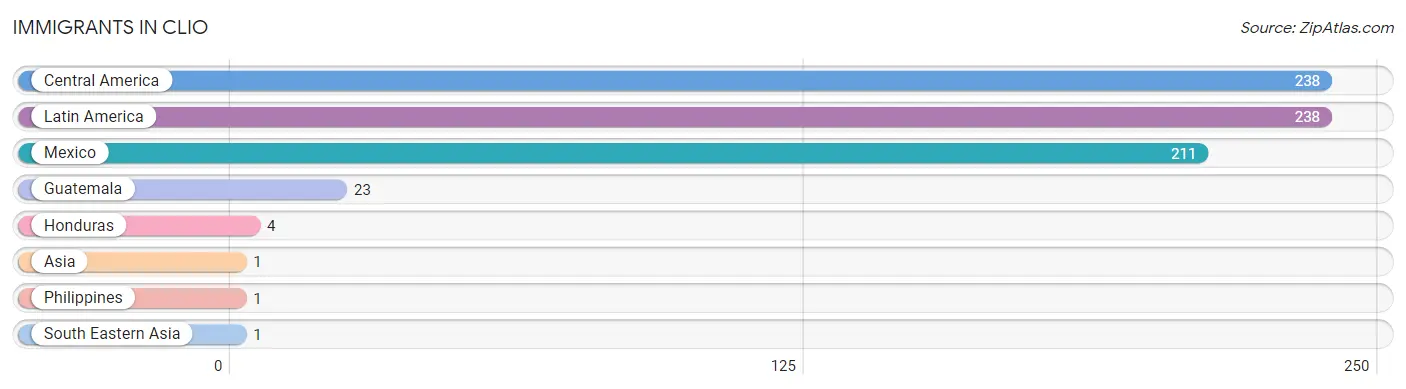
| Immigration Origin | # Population | % Population |
| Asia | 1 | 0.1% |
| Central America | 238 | 16.8% |
| Guatemala | 23 | 1.6% |
| Honduras | 4 | 0.3% |
| Latin America | 238 | 16.8% |
| Mexico | 211 | 14.9% |
| Philippines | 1 | 0.1% |
| South Eastern Asia | 1 | 0.1% | View All 8 Rows |
Sex and Age in Clio
Sex and Age in Clio
The most populous age groups in Clio are 60 to 64 Years (107 | 13.4%) for men and 35 to 39 Years (110 | 17.8%) for women.
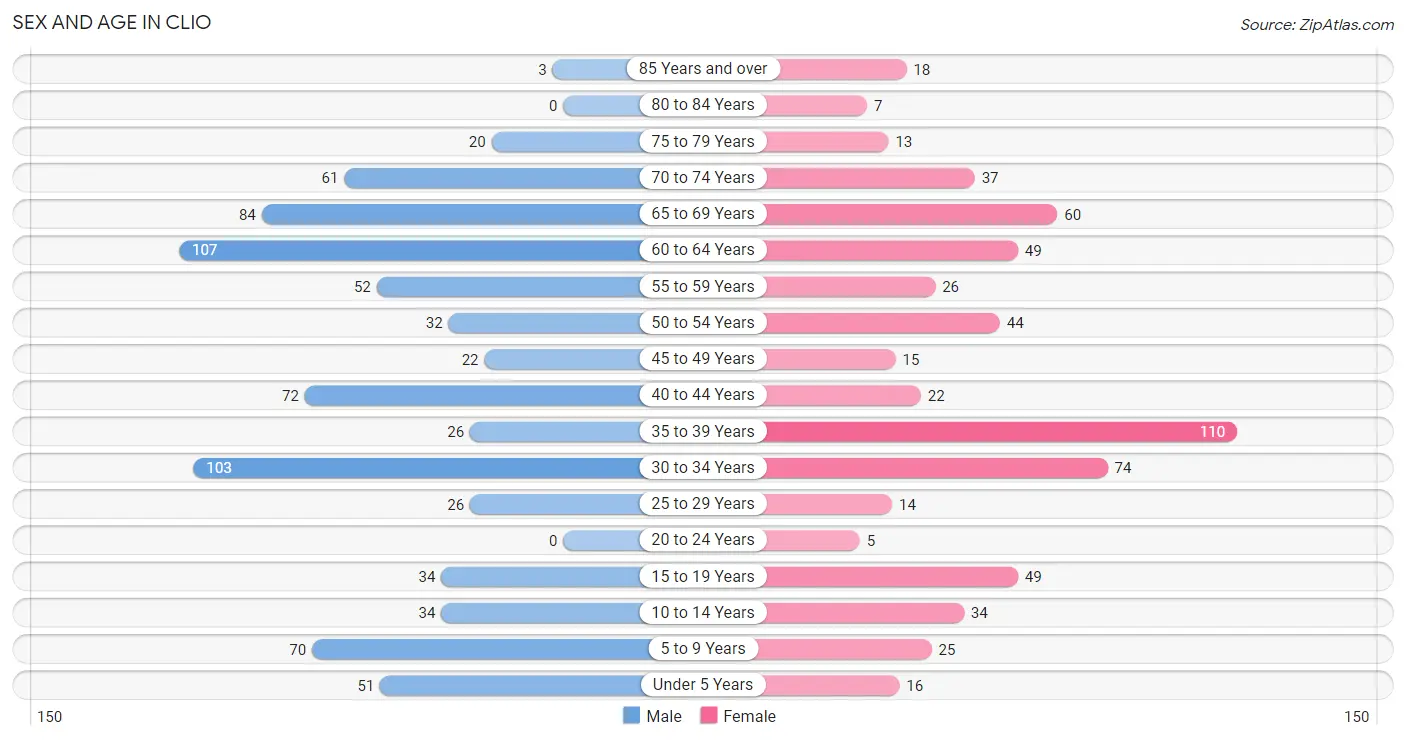
| Age Bracket | Male | Female |
| Under 5 Years | 51 (6.4%) | 16 (2.6%) |
| 5 to 9 Years | 70 (8.8%) | 25 (4.1%) |
| 10 to 14 Years | 34 (4.3%) | 34 (5.5%) |
| 15 to 19 Years | 34 (4.3%) | 49 (7.9%) |
| 20 to 24 Years | 0 (0.0%) | 5 (0.8%) |
| 25 to 29 Years | 26 (3.3%) | 14 (2.3%) |
| 30 to 34 Years | 103 (12.9%) | 74 (12.0%) |
| 35 to 39 Years | 26 (3.3%) | 110 (17.8%) |
| 40 to 44 Years | 72 (9.0%) | 22 (3.6%) |
| 45 to 49 Years | 22 (2.8%) | 15 (2.4%) |
| 50 to 54 Years | 32 (4.0%) | 44 (7.1%) |
| 55 to 59 Years | 52 (6.5%) | 26 (4.2%) |
| 60 to 64 Years | 107 (13.4%) | 49 (7.9%) |
| 65 to 69 Years | 84 (10.5%) | 60 (9.7%) |
| 70 to 74 Years | 61 (7.6%) | 37 (6.0%) |
| 75 to 79 Years | 20 (2.5%) | 13 (2.1%) |
| 80 to 84 Years | 0 (0.0%) | 7 (1.1%) |
| 85 Years and over | 3 (0.4%) | 18 (2.9%) |
| Total | 797 (100.0%) | 618 (100.0%) |
Families and Households in Clio
Median Family Size in Clio
The median family size in Clio is 2.91 persons per family, with single male/father families (22 | 6.5%) accounting for the largest median family size of 3.68 persons per family. On the other hand, single female/mother families (136 | 40.2%) represent the smallest median family size with 2.05 persons per family.
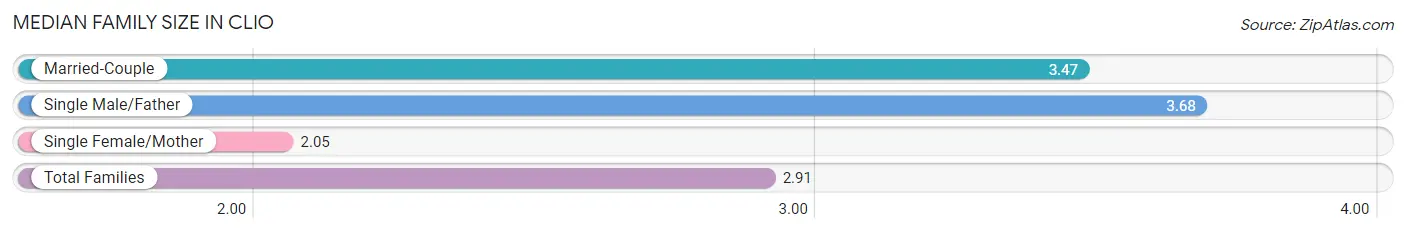
| Family Type | # Families | Family Size |
| Married-Couple | 180 (53.2%) | 3.47 |
| Single Male/Father | 22 (6.5%) | 3.68 |
| Single Female/Mother | 136 (40.2%) | 2.05 |
| Total Families | 338 (100.0%) | 2.91 |
Median Household Size in Clio
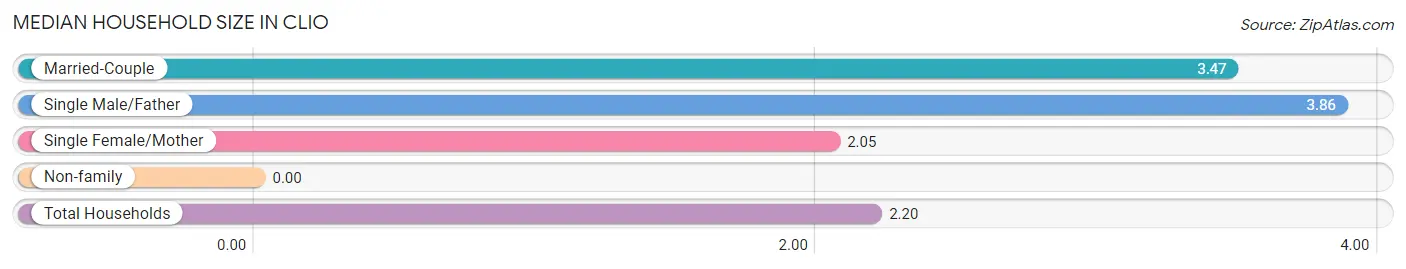
| Household Type | # Households | Household Size |
| Married-Couple | 180 (33.3%) | 3.47 |
| Single Male/Father | 22 (4.1%) | 3.86 |
| Single Female/Mother | 136 (25.1%) | 2.05 |
| Non-family | 203 (37.5%) | - |
| Total Households | 541 (100.0%) | 2.20 |
Household Size by Marriage Status in Clio
Out of a total of 541 households in Clio, 338 (62.5%) are family households, while 203 (37.5%) are nonfamily households. The most numerous type of family households are 2-person households, comprising 133, and the most common type of nonfamily households are 1-person households, comprising 203.
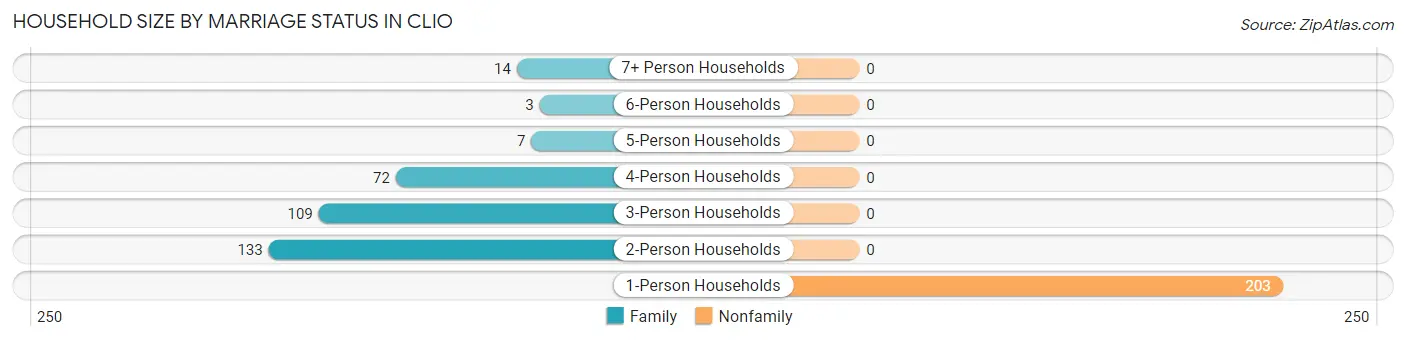
| Household Size | Family Households | Nonfamily Households |
| 1-Person Households | - | 203 (37.5%) |
| 2-Person Households | 133 (24.6%) | 0 (0.0%) |
| 3-Person Households | 109 (20.2%) | 0 (0.0%) |
| 4-Person Households | 72 (13.3%) | 0 (0.0%) |
| 5-Person Households | 7 (1.3%) | 0 (0.0%) |
| 6-Person Households | 3 (0.5%) | 0 (0.0%) |
| 7+ Person Households | 14 (2.6%) | 0 (0.0%) |
| Total | 338 (62.5%) | 203 (37.5%) |
Female Fertility in Clio
Fertility by Age in Clio
Average fertility rate in Clio is 101.0 births per 1,000 women. Women in the age bracket of 20 to 34 years have the highest fertility rate with 323.0 births per 1,000 women. Women in the age bracket of 20 to 34 years acount for 100.0% of all women with births.
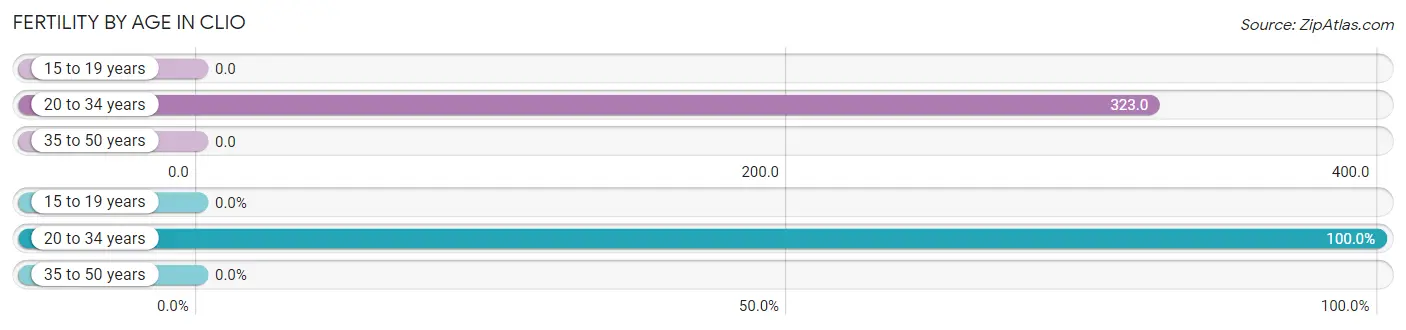
| Age Bracket | Women with Births | Births / 1,000 Women |
| 15 to 19 years | 0 (0.0%) | 0.0 |
| 20 to 34 years | 30 (100.0%) | 323.0 |
| 35 to 50 years | 0 (0.0%) | 0.0 |
| Total | 30 (100.0%) | 101.0 |
Fertility by Age by Marriage Status in Clio
26.7% of women with births (30) in Clio are married. The highest percentage of unmarried women with births falls into 20 to 34 years age bracket with 73.3% of them unmarried at the time of birth, while the lowest percentage of unmarried women with births belong to 20 to 34 years age bracket with 73.3% of them unmarried.
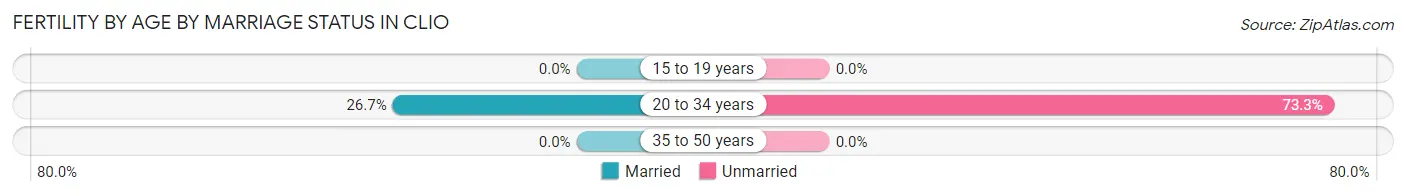
| Age Bracket | Married | Unmarried |
| 15 to 19 years | 0 (0.0%) | 0 (0.0%) |
| 20 to 34 years | 8 (26.7%) | 22 (73.3%) |
| 35 to 50 years | 0 (0.0%) | 0 (0.0%) |
| Total | 8 (26.7%) | 22 (73.3%) |
Fertility by Education in Clio
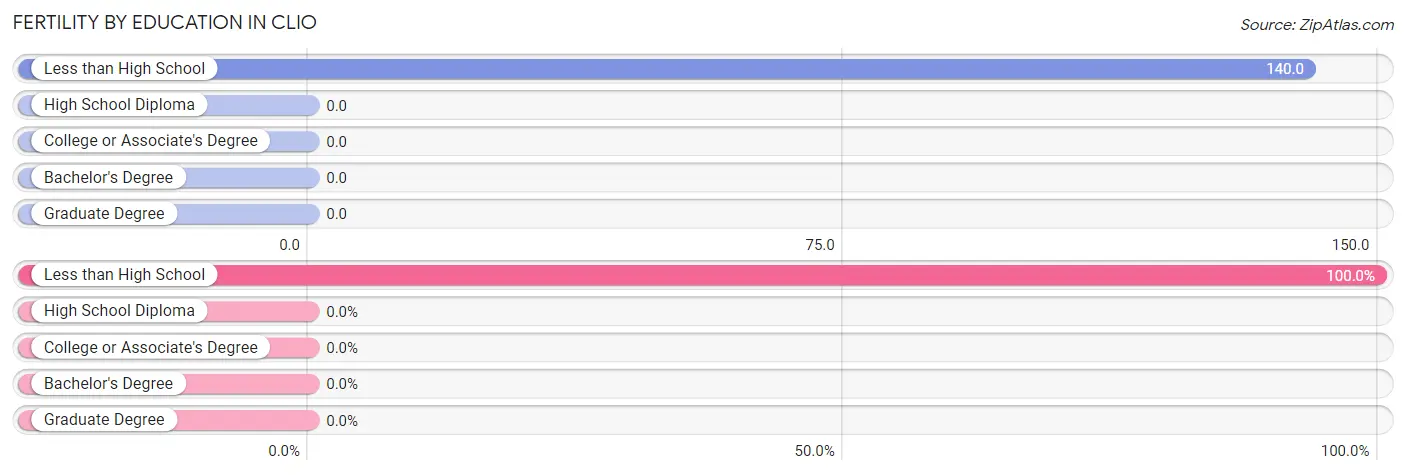
| Educational Attainment | Women with Births | Births / 1,000 Women |
| Less than High School | 30 (100.0%) | 140.0 |
| High School Diploma | 0 (0.0%) | 0.0 |
| College or Associate's Degree | 0 (0.0%) | 0.0 |
| Bachelor's Degree | 0 (0.0%) | 0.0 |
| Graduate Degree | 0 (0.0%) | 0.0 |
| Total | 30 (100.0%) | 101.0 |
Fertility by Education by Marriage Status in Clio
73.3% of women with births in Clio are unmarried. Women with the educational attainment of less than high school are most likely to be married with 26.7% of them married at childbirth, while women with the educational attainment of less than high school are least likely to be married with 73.3% of them unmarried at childbirth.
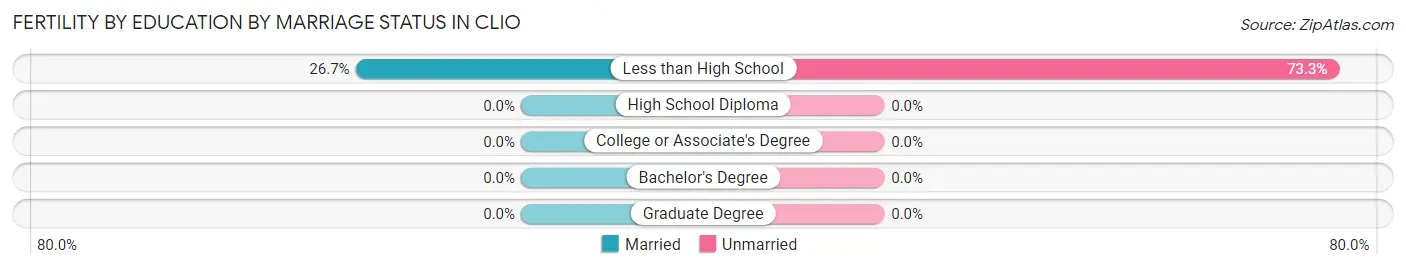
| Educational Attainment | Married | Unmarried |
| Less than High School | 8 (26.7%) | 22 (73.3%) |
| High School Diploma | 0 (0.0%) | 0 (0.0%) |
| College or Associate's Degree | 0 (0.0%) | 0 (0.0%) |
| Bachelor's Degree | 0 (0.0%) | 0 (0.0%) |
| Graduate Degree | 0 (0.0%) | 0 (0.0%) |
| Total | 8 (26.7%) | 22 (73.3%) |
Employment Characteristics in Clio
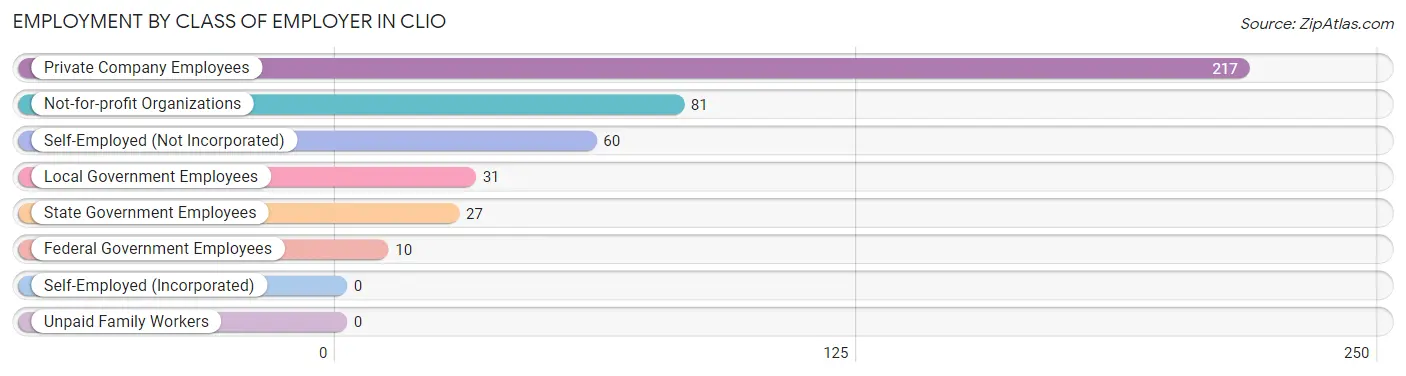
Employment by Class of Employer in Clio
Among the 426 employed individuals in Clio, private company employees (217 | 50.9%), not-for-profit organizations (81 | 19.0%), and self-employed (not incorporated) (60 | 14.1%) make up the most common classes of employment.
| Employer Class | # Employees | % Employees |
| Private Company Employees | 217 | 50.9% |
| Self-Employed (Incorporated) | 0 | 0.0% |
| Self-Employed (Not Incorporated) | 60 | 14.1% |
| Not-for-profit Organizations | 81 | 19.0% |
| Local Government Employees | 31 | 7.3% |
| State Government Employees | 27 | 6.3% |
| Federal Government Employees | 10 | 2.4% |
| Unpaid Family Workers | 0 | 0.0% |
| Total | 426 | 100.0% |
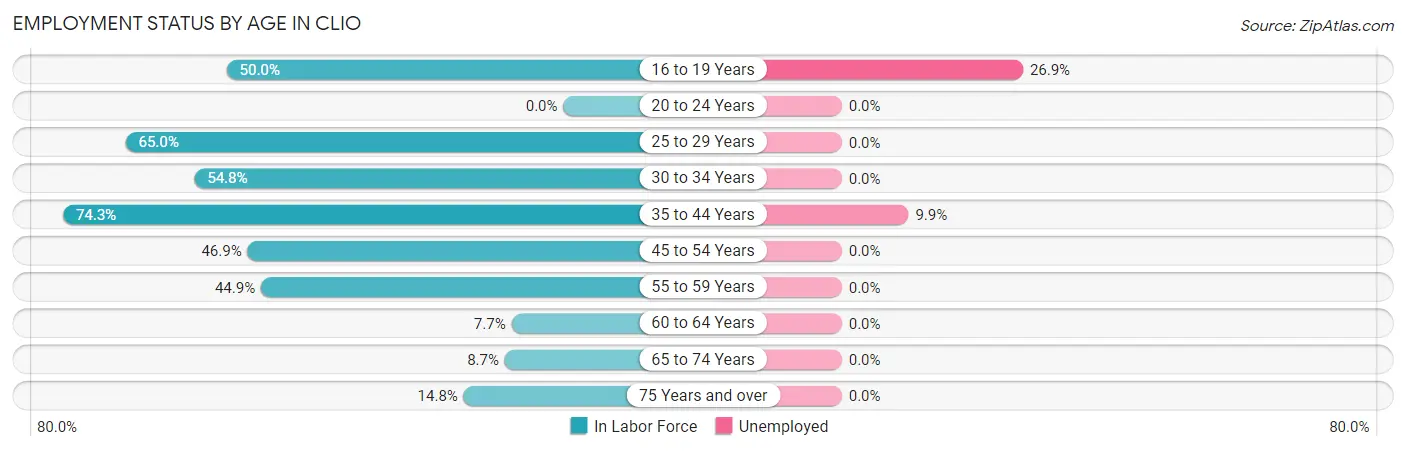
Employment Status by Age in Clio
According to the labor force statistics for Clio, out of the total population over 16 years of age (1,154), 39.0% or 450 individuals are in the labor force, with 5.3% or 24 of them unemployed. The age group with the highest labor force participation rate is 35 to 44 years, with 74.3% or 171 individuals in the labor force. Within the labor force, the 16 to 19 years age range has the highest percentage of unemployed individuals, with 26.9% or 7 of them being unemployed.
| Age Bracket | In Labor Force | Unemployed |
| 16 to 19 Years | 26 (50.0%) | 7 (26.9%) |
| 20 to 24 Years | 0 (0.0%) | 0 (0.0%) |
| 25 to 29 Years | 26 (65.0%) | 0 (0.0%) |
| 30 to 34 Years | 97 (54.8%) | 0 (0.0%) |
| 35 to 44 Years | 171 (74.3%) | 17 (9.9%) |
| 45 to 54 Years | 53 (46.9%) | 0 (0.0%) |
| 55 to 59 Years | 35 (44.9%) | 0 (0.0%) |
| 60 to 64 Years | 12 (7.7%) | 0 (0.0%) |
| 65 to 74 Years | 21 (8.7%) | 0 (0.0%) |
| 75 Years and over | 9 (14.8%) | 0 (0.0%) |
| Total | 450 (39.0%) | 24 (5.3%) |
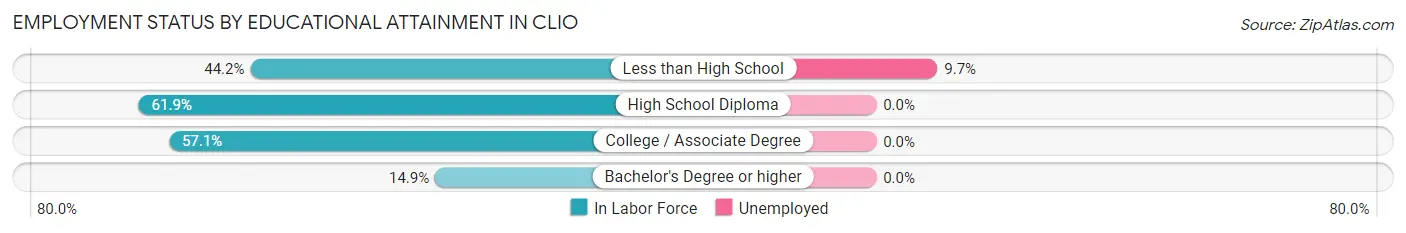
Employment Status by Educational Attainment in Clio
According to labor force statistics for Clio, 49.6% of individuals (394) out of the total population between 25 and 64 years of age (794) are in the labor force, with 4.3% or 17 of them being unemployed. The group with the highest labor force participation rate are those with the educational attainment of high school diploma, with 61.9% or 151 individuals in the labor force. Within the labor force, individuals with less than high school education have the highest percentage of unemployment, with 9.7% or 17 of them being unemployed.
| Educational Attainment | In Labor Force | Unemployed |
| Less than High School | 176 (44.2%) | 39 (9.7%) |
| High School Diploma | 151 (61.9%) | 0 (0.0%) |
| College / Associate Degree | 60 (57.1%) | 0 (0.0%) |
| Bachelor's Degree or higher | 7 (14.9%) | 0 (0.0%) |
| Total | 394 (49.6%) | 34 (4.3%) |
Employment Occupations by Sex in Clio
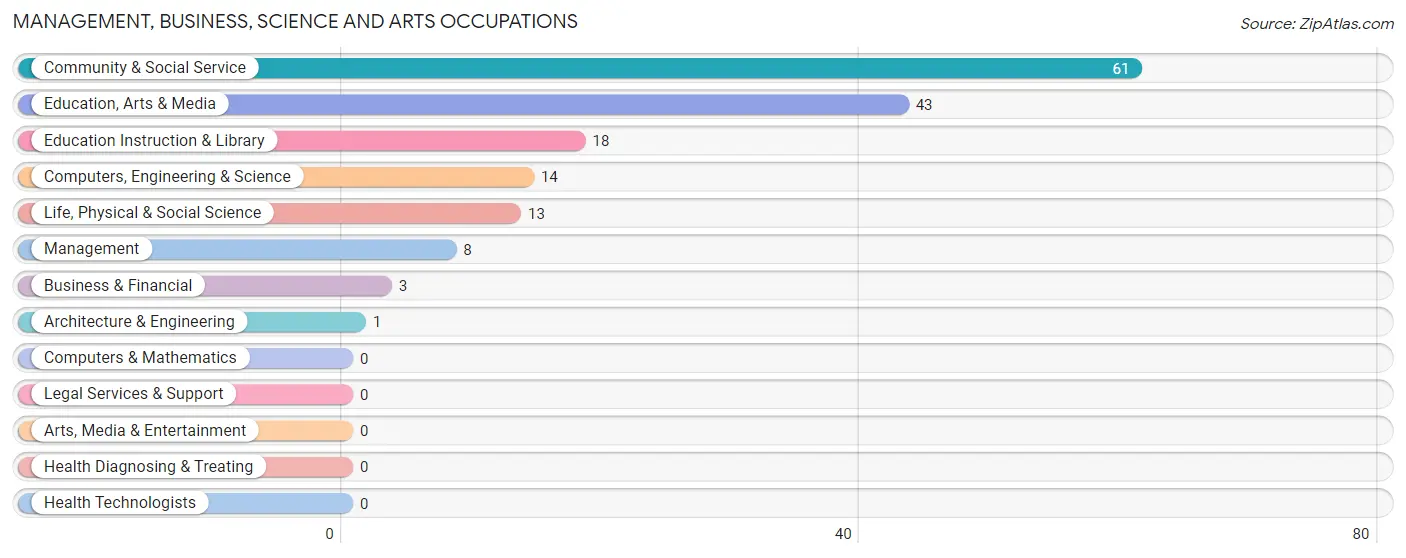
Management, Business, Science and Arts Occupations
The most common Management, Business, Science and Arts occupations in Clio are Community & Social Service (61 | 14.3%), Education, Arts & Media (43 | 10.1%), Education Instruction & Library (18 | 4.2%), Computers, Engineering & Science (14 | 3.3%), and Life, Physical & Social Science (13 | 3.0%).
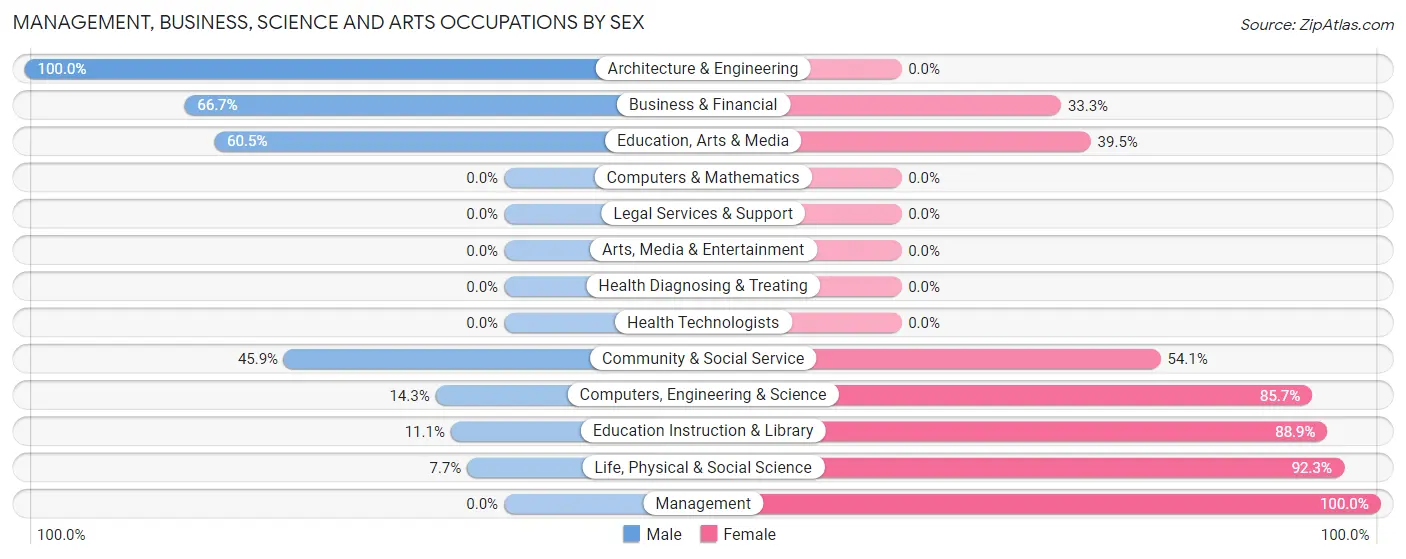
Management, Business, Science and Arts Occupations by Sex
Within the Management, Business, Science and Arts occupations in Clio, the most male-oriented occupations are Architecture & Engineering (100.0%), Business & Financial (66.7%), and Education, Arts & Media (60.5%), while the most female-oriented occupations are Management (100.0%), Life, Physical & Social Science (92.3%), and Education Instruction & Library (88.9%).
| Occupation | Male | Female |
| Management | 0 (0.0%) | 8 (100.0%) |
| Business & Financial | 2 (66.7%) | 1 (33.3%) |
| Computers, Engineering & Science | 2 (14.3%) | 12 (85.7%) |
| Computers & Mathematics | 0 (0.0%) | 0 (0.0%) |
| Architecture & Engineering | 1 (100.0%) | 0 (0.0%) |
| Life, Physical & Social Science | 1 (7.7%) | 12 (92.3%) |
| Community & Social Service | 28 (45.9%) | 33 (54.1%) |
| Education, Arts & Media | 26 (60.5%) | 17 (39.5%) |
| Legal Services & Support | 0 (0.0%) | 0 (0.0%) |
| Education Instruction & Library | 2 (11.1%) | 16 (88.9%) |
| Arts, Media & Entertainment | 0 (0.0%) | 0 (0.0%) |
| Health Diagnosing & Treating | 0 (0.0%) | 0 (0.0%) |
| Health Technologists | 0 (0.0%) | 0 (0.0%) |
| Total (Category) | 32 (37.2%) | 54 (62.8%) |
| Total (Overall) | 226 (53.0%) | 200 (46.9%) |
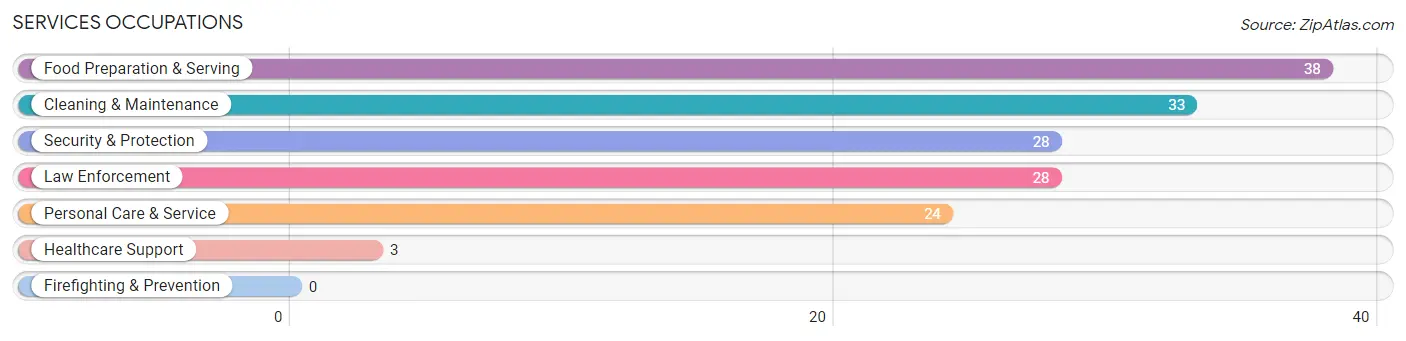
Services Occupations
The most common Services occupations in Clio are Food Preparation & Serving (38 | 8.9%), Cleaning & Maintenance (33 | 7.7%), Security & Protection (28 | 6.6%), Law Enforcement (28 | 6.6%), and Personal Care & Service (24 | 5.6%).
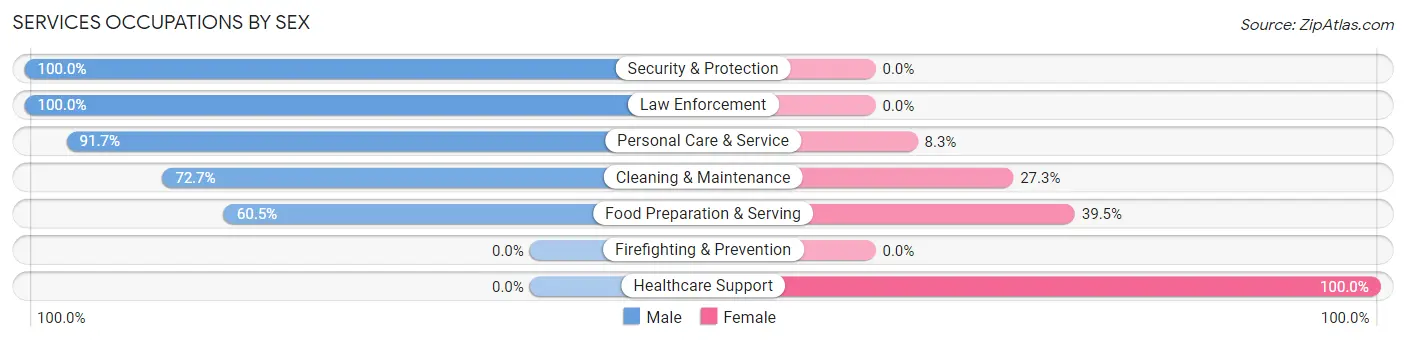
Services Occupations by Sex
Within the Services occupations in Clio, the most male-oriented occupations are Security & Protection (100.0%), Law Enforcement (100.0%), and Personal Care & Service (91.7%), while the most female-oriented occupations are Healthcare Support (100.0%), Food Preparation & Serving (39.5%), and Cleaning & Maintenance (27.3%).
| Occupation | Male | Female |
| Healthcare Support | 0 (0.0%) | 3 (100.0%) |
| Security & Protection | 28 (100.0%) | 0 (0.0%) |
| Firefighting & Prevention | 0 (0.0%) | 0 (0.0%) |
| Law Enforcement | 28 (100.0%) | 0 (0.0%) |
| Food Preparation & Serving | 23 (60.5%) | 15 (39.5%) |
| Cleaning & Maintenance | 24 (72.7%) | 9 (27.3%) |
| Personal Care & Service | 22 (91.7%) | 2 (8.3%) |
| Total (Category) | 97 (77.0%) | 29 (23.0%) |
| Total (Overall) | 226 (53.0%) | 200 (46.9%) |
Sales and Office Occupations
The most common Sales and Office occupations in Clio are Sales & Related (12 | 2.8%), and Office & Administration (4 | 0.9%).
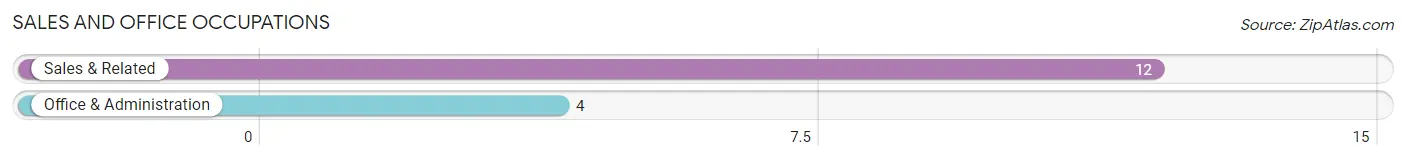
Sales and Office Occupations by Sex

| Occupation | Male | Female |
| Sales & Related | 0 (0.0%) | 12 (100.0%) |
| Office & Administration | 0 (0.0%) | 4 (100.0%) |
| Total (Category) | 0 (0.0%) | 16 (100.0%) |
| Total (Overall) | 226 (53.0%) | 200 (46.9%) |
Natural Resources, Construction and Maintenance Occupations
The most common Natural Resources, Construction and Maintenance occupations in Clio are Construction & Extraction (51 | 12.0%), Farming, Fishing & Forestry (27 | 6.3%), and Installation, Maintenance & Repair (8 | 1.9%).

Natural Resources, Construction and Maintenance Occupations by Sex

| Occupation | Male | Female |
| Farming, Fishing & Forestry | 19 (70.4%) | 8 (29.6%) |
| Construction & Extraction | 51 (100.0%) | 0 (0.0%) |
| Installation, Maintenance & Repair | 8 (100.0%) | 0 (0.0%) |
| Total (Category) | 78 (90.7%) | 8 (9.3%) |
| Total (Overall) | 226 (53.0%) | 200 (46.9%) |
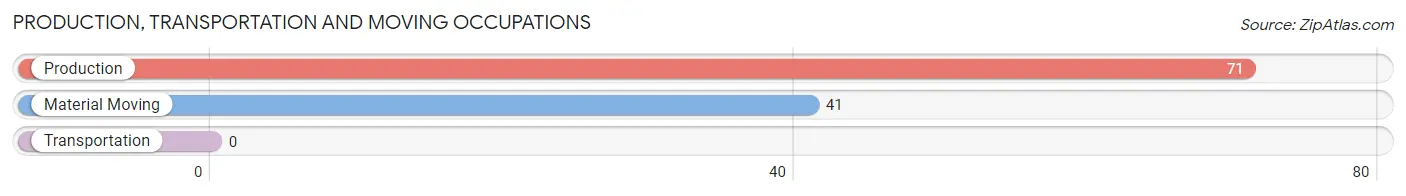
Production, Transportation and Moving Occupations
The most common Production, Transportation and Moving occupations in Clio are Production (71 | 16.7%), and Material Moving (41 | 9.6%).
Production, Transportation and Moving Occupations by Sex
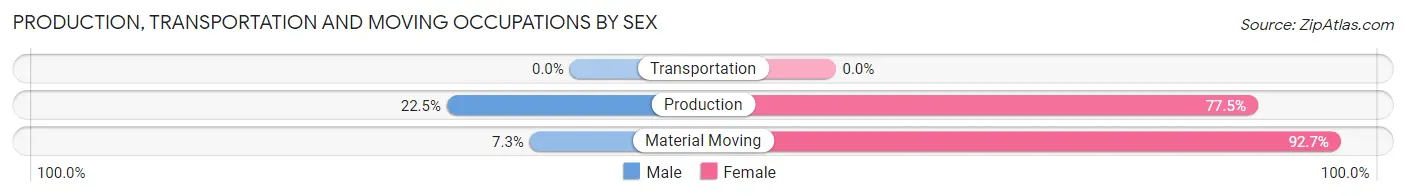
| Occupation | Male | Female |
| Production | 16 (22.5%) | 55 (77.5%) |
| Transportation | 0 (0.0%) | 0 (0.0%) |
| Material Moving | 3 (7.3%) | 38 (92.7%) |
| Total (Category) | 19 (17.0%) | 93 (83.0%) |
| Total (Overall) | 226 (53.0%) | 200 (46.9%) |
Employment Industries by Sex in Clio
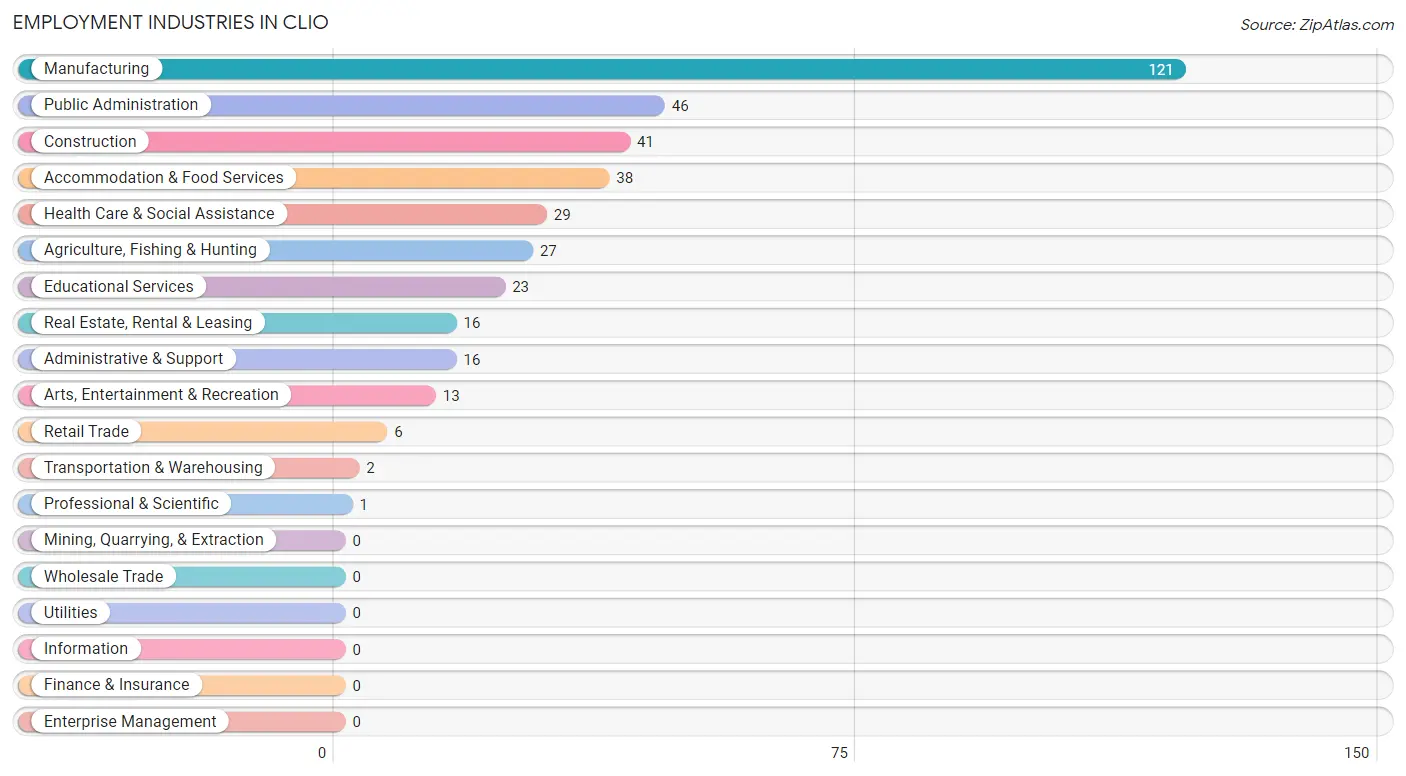
Employment Industries in Clio
The major employment industries in Clio include Manufacturing (121 | 28.4%), Public Administration (46 | 10.8%), Construction (41 | 9.6%), Accommodation & Food Services (38 | 8.9%), and Health Care & Social Assistance (29 | 6.8%).
Employment Industries by Sex in Clio
The Clio industries that see more men than women are Construction (100.0%), Transportation & Warehousing (100.0%), and Professional & Scientific (100.0%), whereas the industries that tend to have a higher number of women are Real Estate, Rental & Leasing (100.0%), Manufacturing (87.6%), and Educational Services (78.3%).
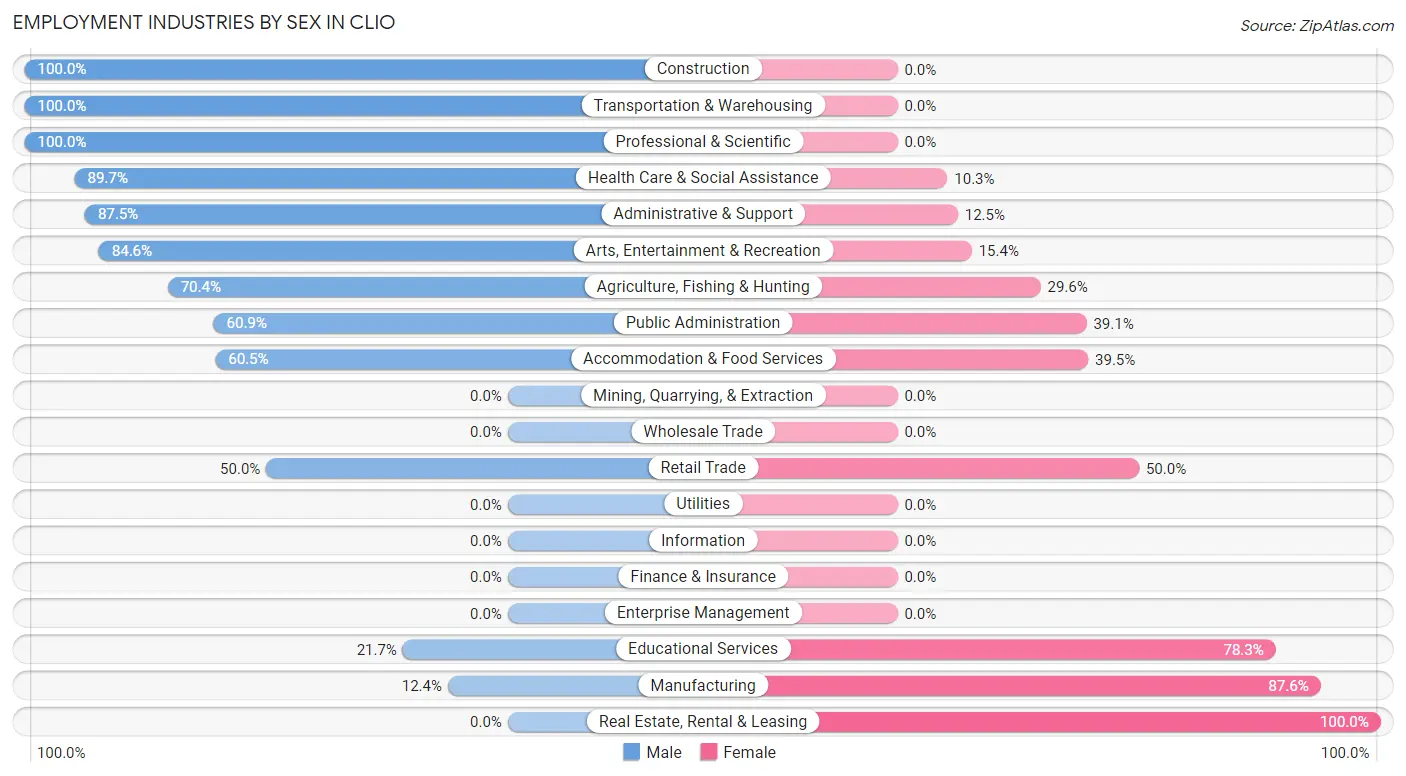
| Industry | Male | Female |
| Agriculture, Fishing & Hunting | 19 (70.4%) | 8 (29.6%) |
| Mining, Quarrying, & Extraction | 0 (0.0%) | 0 (0.0%) |
| Construction | 41 (100.0%) | 0 (0.0%) |
| Manufacturing | 15 (12.4%) | 106 (87.6%) |
| Wholesale Trade | 0 (0.0%) | 0 (0.0%) |
| Retail Trade | 3 (50.0%) | 3 (50.0%) |
| Transportation & Warehousing | 2 (100.0%) | 0 (0.0%) |
| Utilities | 0 (0.0%) | 0 (0.0%) |
| Information | 0 (0.0%) | 0 (0.0%) |
| Finance & Insurance | 0 (0.0%) | 0 (0.0%) |
| Real Estate, Rental & Leasing | 0 (0.0%) | 16 (100.0%) |
| Professional & Scientific | 1 (100.0%) | 0 (0.0%) |
| Enterprise Management | 0 (0.0%) | 0 (0.0%) |
| Administrative & Support | 14 (87.5%) | 2 (12.5%) |
| Educational Services | 5 (21.7%) | 18 (78.3%) |
| Health Care & Social Assistance | 26 (89.7%) | 3 (10.3%) |
| Arts, Entertainment & Recreation | 11 (84.6%) | 2 (15.4%) |
| Accommodation & Food Services | 23 (60.5%) | 15 (39.5%) |
| Public Administration | 28 (60.9%) | 18 (39.1%) |
| Total | 226 (53.0%) | 200 (46.9%) |
Education in Clio
School Enrollment in Clio
The most common levels of schooling among the 238 students in Clio are high school (88 | 37.0%), elementary school (64 | 26.9%), and middle school (50 | 21.0%).
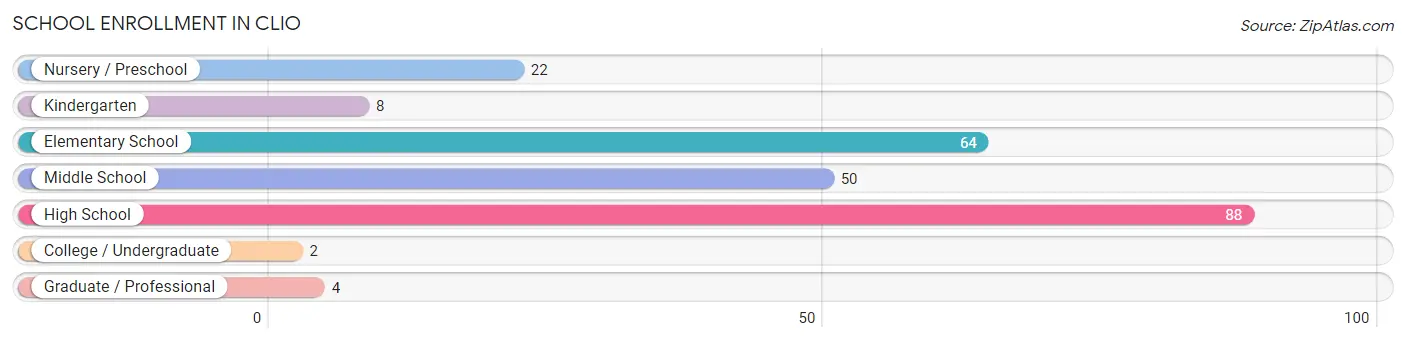
| School Level | # Students | % Students |
| Nursery / Preschool | 22 | 9.2% |
| Kindergarten | 8 | 3.4% |
| Elementary School | 64 | 26.9% |
| Middle School | 50 | 21.0% |
| High School | 88 | 37.0% |
| College / Undergraduate | 2 | 0.8% |
| Graduate / Professional | 4 | 1.7% |
| Total | 238 | 100.0% |
School Enrollment by Age by Funding Source in Clio
Out of a total of 238 students who are enrolled in schools in Clio, 10 (4.2%) attend a private institution, while the remaining 228 (95.8%) are enrolled in public schools. The age group of 35 years and over has the highest likelihood of being enrolled in private schools, with 4 (66.7% in the age bracket) enrolled. Conversely, the age group of 10 to 14 year olds has the lowest likelihood of being enrolled in a private school, with 68 (100.0% in the age bracket) attending a public institution.
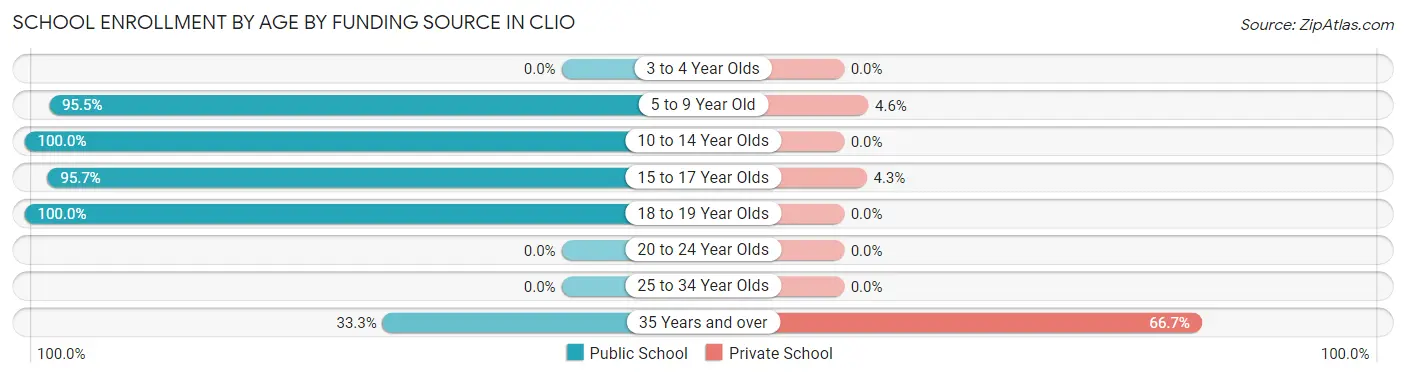
| Age Bracket | Public School | Private School |
| 3 to 4 Year Olds | 0 (0.0%) | 0 (0.0%) |
| 5 to 9 Year Old | 84 (95.5%) | 4 (4.5%) |
| 10 to 14 Year Olds | 68 (100.0%) | 0 (0.0%) |
| 15 to 17 Year Olds | 45 (95.7%) | 2 (4.3%) |
| 18 to 19 Year Olds | 29 (100.0%) | 0 (0.0%) |
| 20 to 24 Year Olds | 0 (0.0%) | 0 (0.0%) |
| 25 to 34 Year Olds | 0 (0.0%) | 0 (0.0%) |
| 35 Years and over | 2 (33.3%) | 4 (66.7%) |
| Total | 228 (95.8%) | 10 (4.2%) |
Educational Attainment by Field of Study in Clio
Business (35 | 39.8%), arts & humanities (34 | 38.6%), education (11 | 12.5%), liberal arts & history (6 | 6.8%), and bio, nature & agricultural (1 | 1.1%) are the most common fields of study among 88 individuals in Clio who have obtained a bachelor's degree or higher.
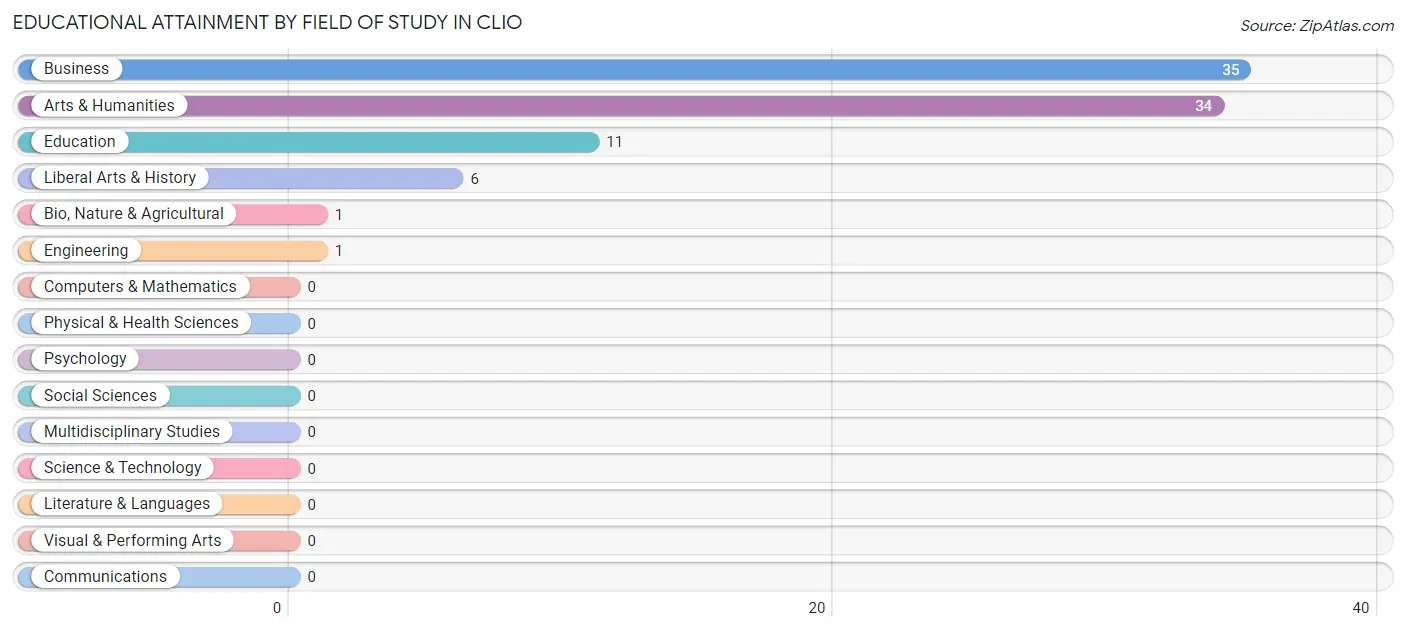
| Field of Study | # Graduates | % Graduates |
| Computers & Mathematics | 0 | 0.0% |
| Bio, Nature & Agricultural | 1 | 1.1% |
| Physical & Health Sciences | 0 | 0.0% |
| Psychology | 0 | 0.0% |
| Social Sciences | 0 | 0.0% |
| Engineering | 1 | 1.1% |
| Multidisciplinary Studies | 0 | 0.0% |
| Science & Technology | 0 | 0.0% |
| Business | 35 | 39.8% |
| Education | 11 | 12.5% |
| Literature & Languages | 0 | 0.0% |
| Liberal Arts & History | 6 | 6.8% |
| Visual & Performing Arts | 0 | 0.0% |
| Communications | 0 | 0.0% |
| Arts & Humanities | 34 | 38.6% |
| Total | 88 | 100.0% |
Transportation & Commute in Clio
Vehicle Availability by Sex in Clio
The most prevalent vehicle ownership categories in Clio are males with 1 vehicle (91, accounting for 40.3%) and females with 1 vehicle (57, making up 45.5%).
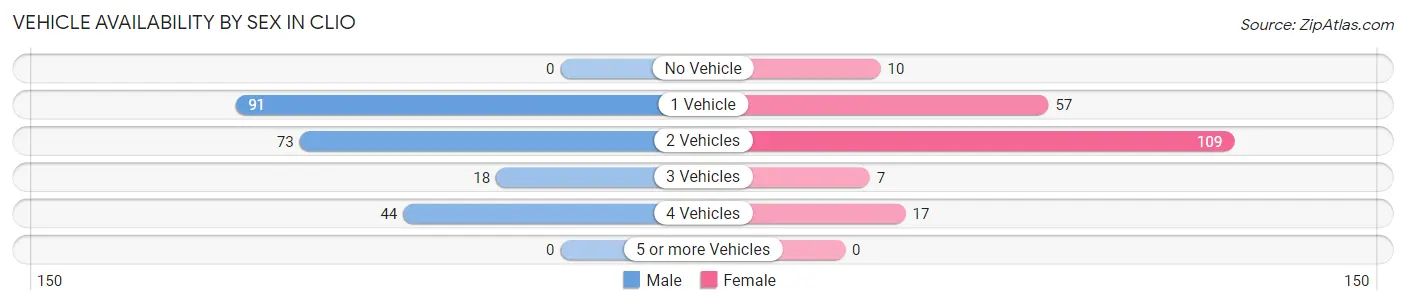
| Vehicles Available | Male | Female |
| No Vehicle | 0 (0.0%) | 10 (5.0%) |
| 1 Vehicle | 91 (40.3%) | 57 (28.5%) |
| 2 Vehicles | 73 (32.3%) | 109 (54.5%) |
| 3 Vehicles | 18 (8.0%) | 7 (3.5%) |
| 4 Vehicles | 44 (19.5%) | 17 (8.5%) |
| 5 or more Vehicles | 0 (0.0%) | 0 (0.0%) |
| Total | 226 (100.0%) | 200 (100.0%) |
Commute Time in Clio
The most frequently occuring commute durations in Clio are 30 to 34 minutes (106 commuters, 25.4%), 45 to 59 minutes (85 commuters, 20.3%), and 20 to 24 minutes (46 commuters, 11.0%).
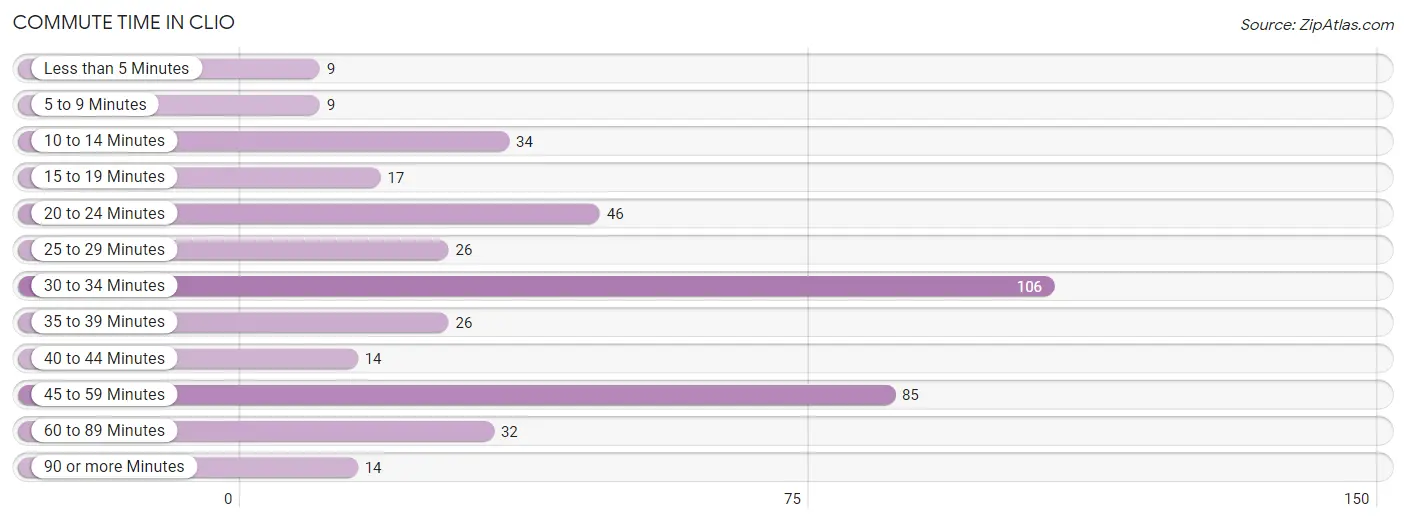
| Commute Time | # Commuters | % Commuters |
| Less than 5 Minutes | 9 | 2.1% |
| 5 to 9 Minutes | 9 | 2.1% |
| 10 to 14 Minutes | 34 | 8.1% |
| 15 to 19 Minutes | 17 | 4.1% |
| 20 to 24 Minutes | 46 | 11.0% |
| 25 to 29 Minutes | 26 | 6.2% |
| 30 to 34 Minutes | 106 | 25.4% |
| 35 to 39 Minutes | 26 | 6.2% |
| 40 to 44 Minutes | 14 | 3.4% |
| 45 to 59 Minutes | 85 | 20.3% |
| 60 to 89 Minutes | 32 | 7.7% |
| 90 or more Minutes | 14 | 3.4% |
Commute Time by Sex in Clio
The most common commute times in Clio are 30 to 34 minutes (67 commuters, 29.6%) for males and 45 to 59 minutes (85 commuters, 44.3%) for females.
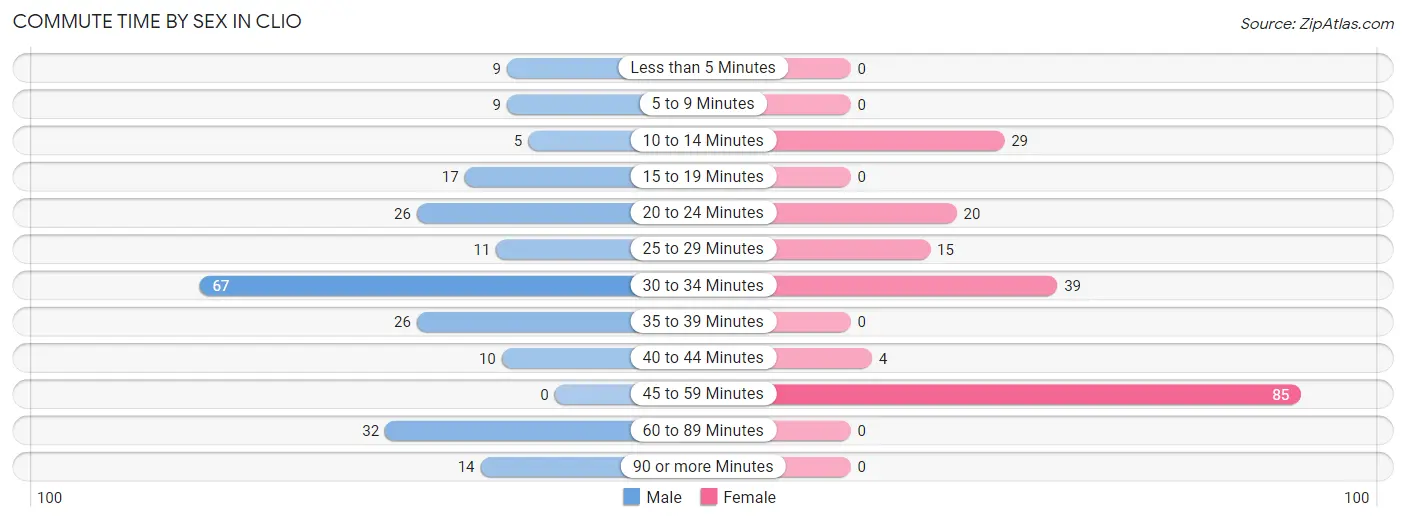
| Commute Time | Male | Female |
| Less than 5 Minutes | 9 (4.0%) | 0 (0.0%) |
| 5 to 9 Minutes | 9 (4.0%) | 0 (0.0%) |
| 10 to 14 Minutes | 5 (2.2%) | 29 (15.1%) |
| 15 to 19 Minutes | 17 (7.5%) | 0 (0.0%) |
| 20 to 24 Minutes | 26 (11.5%) | 20 (10.4%) |
| 25 to 29 Minutes | 11 (4.9%) | 15 (7.8%) |
| 30 to 34 Minutes | 67 (29.6%) | 39 (20.3%) |
| 35 to 39 Minutes | 26 (11.5%) | 0 (0.0%) |
| 40 to 44 Minutes | 10 (4.4%) | 4 (2.1%) |
| 45 to 59 Minutes | 0 (0.0%) | 85 (44.3%) |
| 60 to 89 Minutes | 32 (14.2%) | 0 (0.0%) |
| 90 or more Minutes | 14 (6.2%) | 0 (0.0%) |
Time of Departure to Work by Sex in Clio
The most frequent times of departure to work in Clio are 6:30 AM to 6:59 AM (87, 38.5%) for males and 12:00 PM to 3:59 PM (55, 28.6%) for females.
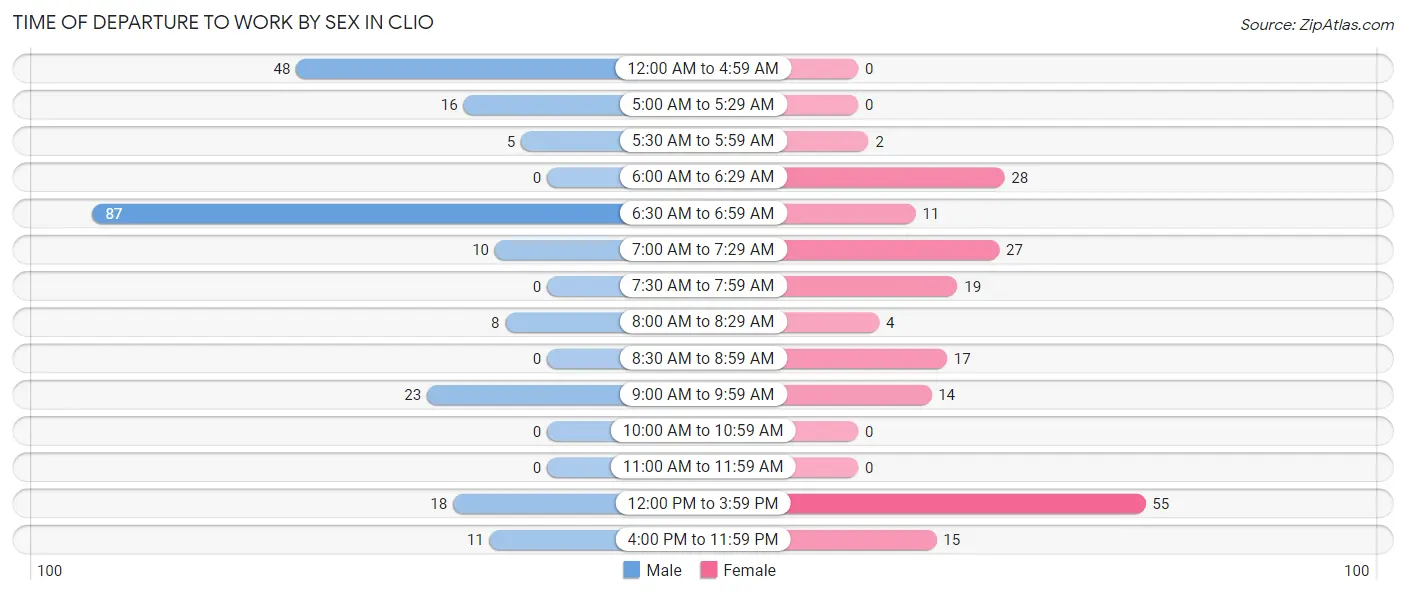
| Time of Departure | Male | Female |
| 12:00 AM to 4:59 AM | 48 (21.2%) | 0 (0.0%) |
| 5:00 AM to 5:29 AM | 16 (7.1%) | 0 (0.0%) |
| 5:30 AM to 5:59 AM | 5 (2.2%) | 2 (1.0%) |
| 6:00 AM to 6:29 AM | 0 (0.0%) | 28 (14.6%) |
| 6:30 AM to 6:59 AM | 87 (38.5%) | 11 (5.7%) |
| 7:00 AM to 7:29 AM | 10 (4.4%) | 27 (14.1%) |
| 7:30 AM to 7:59 AM | 0 (0.0%) | 19 (9.9%) |
| 8:00 AM to 8:29 AM | 8 (3.5%) | 4 (2.1%) |
| 8:30 AM to 8:59 AM | 0 (0.0%) | 17 (8.8%) |
| 9:00 AM to 9:59 AM | 23 (10.2%) | 14 (7.3%) |
| 10:00 AM to 10:59 AM | 0 (0.0%) | 0 (0.0%) |
| 11:00 AM to 11:59 AM | 0 (0.0%) | 0 (0.0%) |
| 12:00 PM to 3:59 PM | 18 (8.0%) | 55 (28.6%) |
| 4:00 PM to 11:59 PM | 11 (4.9%) | 15 (7.8%) |
| Total | 226 (100.0%) | 192 (100.0%) |
Housing Occupancy in Clio
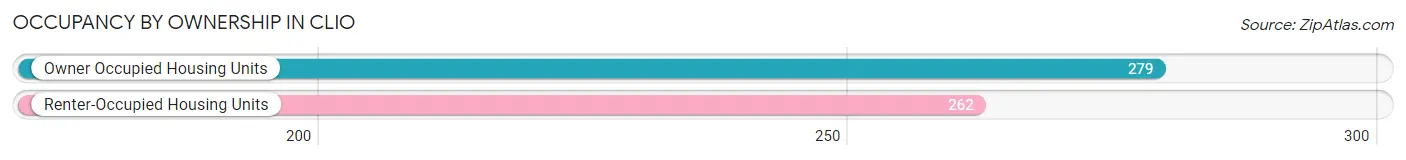
Occupancy by Ownership in Clio
Of the total 541 dwellings in Clio, owner-occupied units account for 279 (51.6%), while renter-occupied units make up 262 (48.4%).
| Occupancy | # Housing Units | % Housing Units |
| Owner Occupied Housing Units | 279 | 51.6% |
| Renter-Occupied Housing Units | 262 | 48.4% |
| Total Occupied Housing Units | 541 | 100.0% |
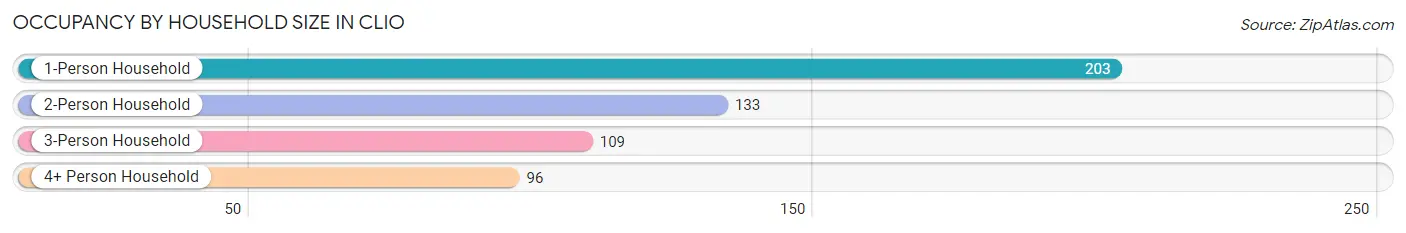
Occupancy by Household Size in Clio
| Household Size | # Housing Units | % Housing Units |
| 1-Person Household | 203 | 37.5% |
| 2-Person Household | 133 | 24.6% |
| 3-Person Household | 109 | 20.2% |
| 4+ Person Household | 96 | 17.7% |
| Total Housing Units | 541 | 100.0% |
Occupancy by Ownership by Household Size in Clio
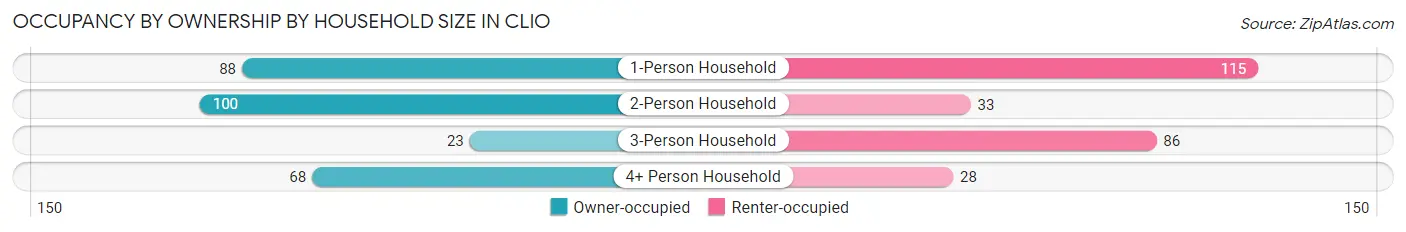
| Household Size | Owner-occupied | Renter-occupied |
| 1-Person Household | 88 (43.3%) | 115 (56.7%) |
| 2-Person Household | 100 (75.2%) | 33 (24.8%) |
| 3-Person Household | 23 (21.1%) | 86 (78.9%) |
| 4+ Person Household | 68 (70.8%) | 28 (29.2%) |
| Total Housing Units | 279 (51.6%) | 262 (48.4%) |
Occupancy by Educational Attainment in Clio
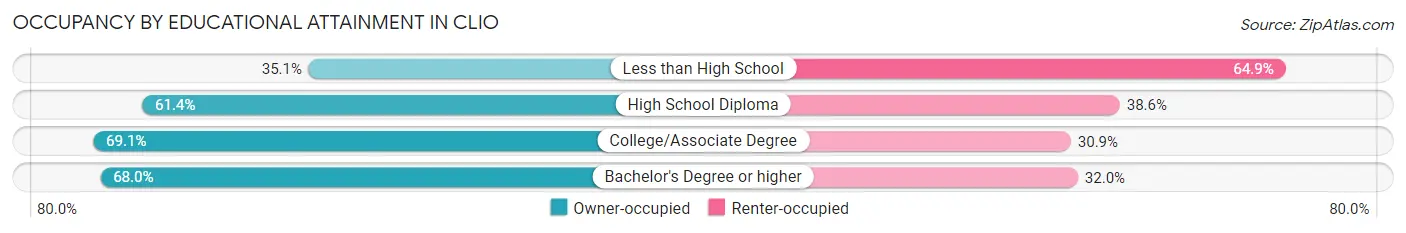
| Household Size | Owner-occupied | Renter-occupied |
| Less than High School | 87 (35.1%) | 161 (64.9%) |
| High School Diploma | 81 (61.4%) | 51 (38.6%) |
| College/Associate Degree | 94 (69.1%) | 42 (30.9%) |
| Bachelor's Degree or higher | 17 (68.0%) | 8 (32.0%) |
Occupancy by Age of Householder in Clio
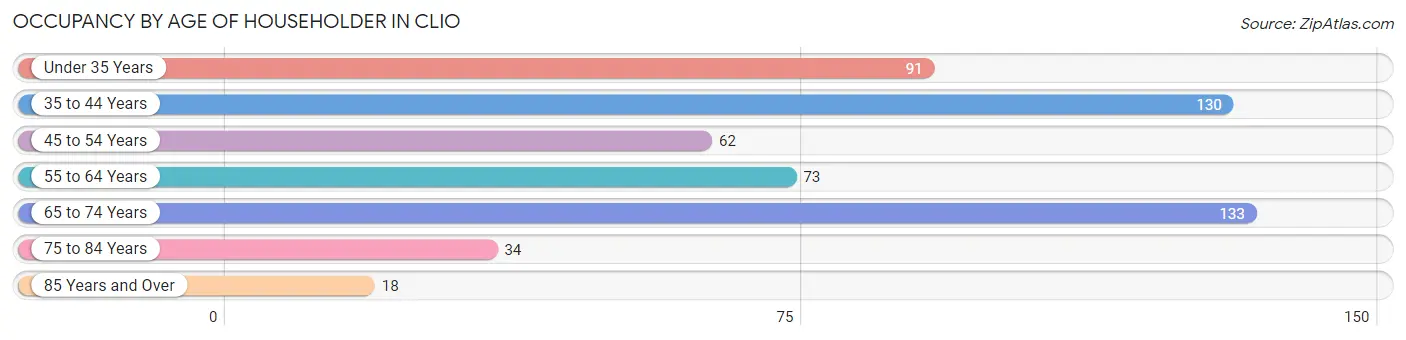
| Age Bracket | # Households | % Households |
| Under 35 Years | 91 | 16.8% |
| 35 to 44 Years | 130 | 24.0% |
| 45 to 54 Years | 62 | 11.5% |
| 55 to 64 Years | 73 | 13.5% |
| 65 to 74 Years | 133 | 24.6% |
| 75 to 84 Years | 34 | 6.3% |
| 85 Years and Over | 18 | 3.3% |
| Total | 541 | 100.0% |
Housing Finances in Clio
Median Income by Occupancy in Clio
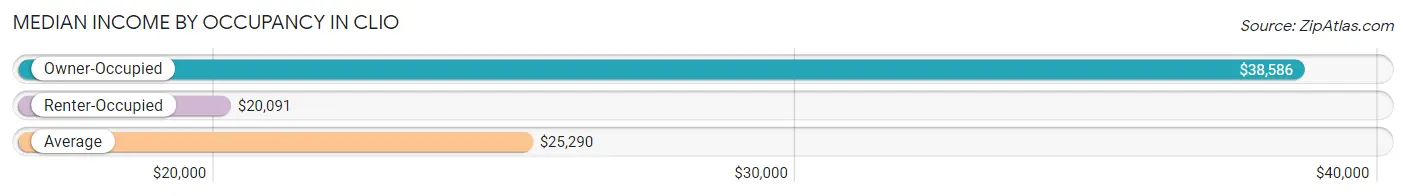
| Occupancy Type | # Households | Median Income |
| Owner-Occupied | 279 (51.6%) | $38,586 |
| Renter-Occupied | 262 (48.4%) | $20,091 |
| Average | 541 (100.0%) | $25,290 |
Occupancy by Householder Income Bracket in Clio
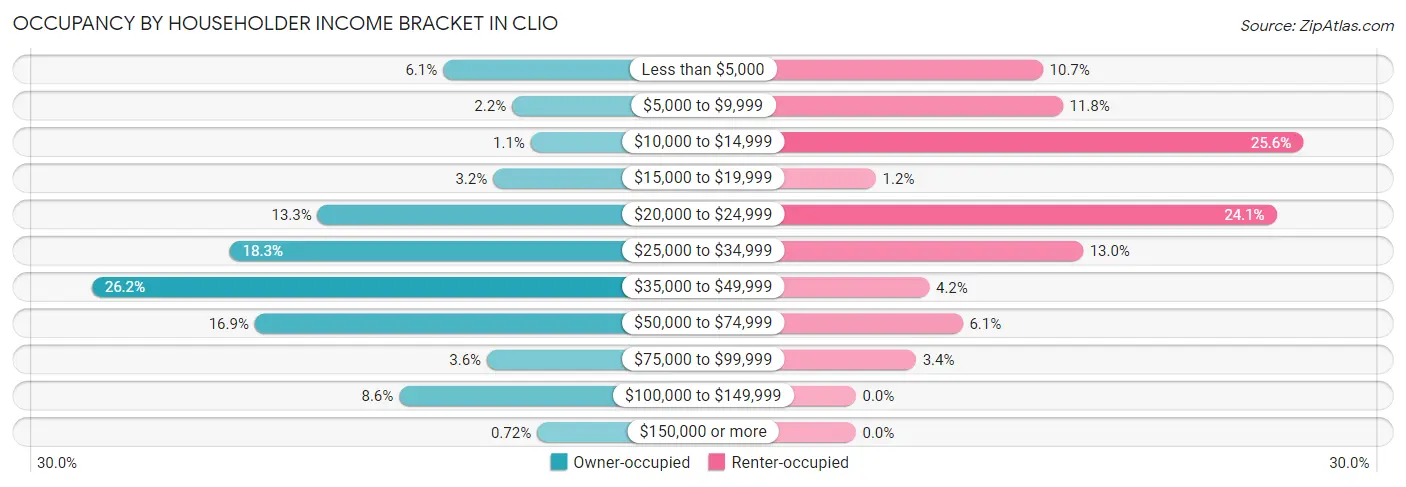
| Income Bracket | Owner-occupied | Renter-occupied |
| Less than $5,000 | 17 (6.1%) | 28 (10.7%) |
| $5,000 to $9,999 | 6 (2.1%) | 31 (11.8%) |
| $10,000 to $14,999 | 3 (1.1%) | 67 (25.6%) |
| $15,000 to $19,999 | 9 (3.2%) | 3 (1.1%) |
| $20,000 to $24,999 | 37 (13.3%) | 63 (24.0%) |
| $25,000 to $34,999 | 51 (18.3%) | 34 (13.0%) |
| $35,000 to $49,999 | 73 (26.2%) | 11 (4.2%) |
| $50,000 to $74,999 | 47 (16.9%) | 16 (6.1%) |
| $75,000 to $99,999 | 10 (3.6%) | 9 (3.4%) |
| $100,000 to $149,999 | 24 (8.6%) | 0 (0.0%) |
| $150,000 or more | 2 (0.7%) | 0 (0.0%) |
| Total | 279 (100.0%) | 262 (100.0%) |
Monthly Housing Cost Tiers in Clio
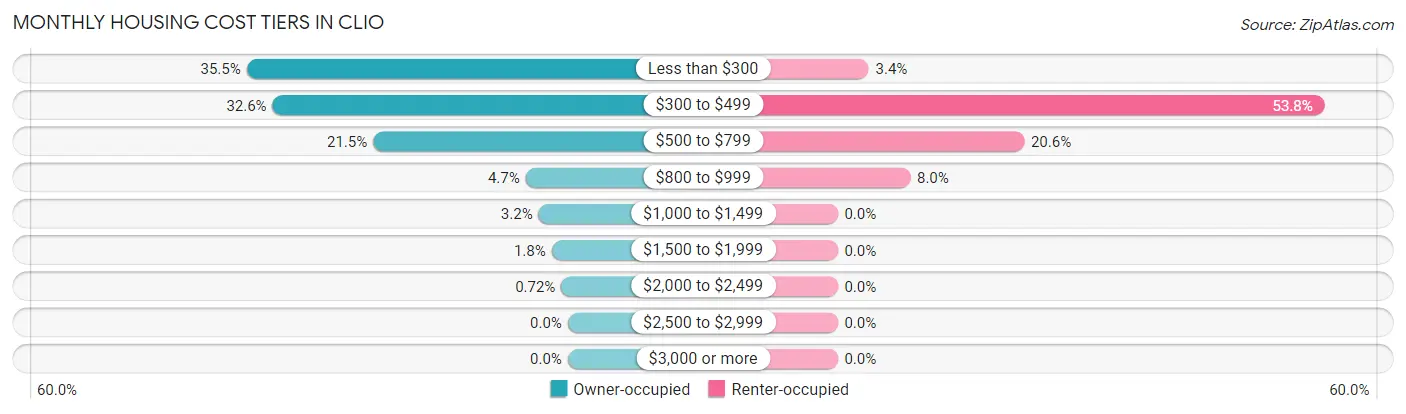
| Monthly Cost | Owner-occupied | Renter-occupied |
| Less than $300 | 99 (35.5%) | 9 (3.4%) |
| $300 to $499 | 91 (32.6%) | 141 (53.8%) |
| $500 to $799 | 60 (21.5%) | 54 (20.6%) |
| $800 to $999 | 13 (4.7%) | 21 (8.0%) |
| $1,000 to $1,499 | 9 (3.2%) | 0 (0.0%) |
| $1,500 to $1,999 | 5 (1.8%) | 0 (0.0%) |
| $2,000 to $2,499 | 2 (0.7%) | 0 (0.0%) |
| $2,500 to $2,999 | 0 (0.0%) | 0 (0.0%) |
| $3,000 or more | 0 (0.0%) | 0 (0.0%) |
| Total | 279 (100.0%) | 262 (100.0%) |
Physical Housing Characteristics in Clio
Housing Structures in Clio
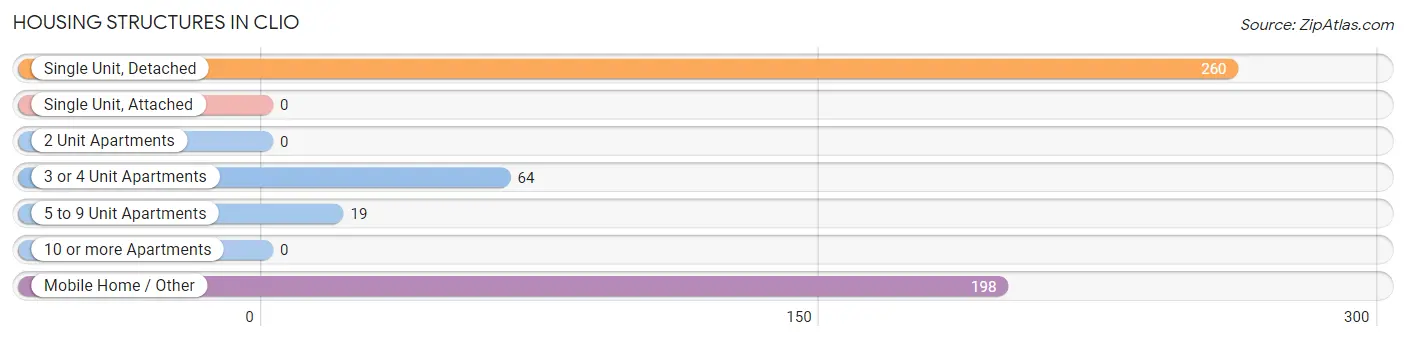
| Structure Type | # Housing Units | % Housing Units |
| Single Unit, Detached | 260 | 48.1% |
| Single Unit, Attached | 0 | 0.0% |
| 2 Unit Apartments | 0 | 0.0% |
| 3 or 4 Unit Apartments | 64 | 11.8% |
| 5 to 9 Unit Apartments | 19 | 3.5% |
| 10 or more Apartments | 0 | 0.0% |
| Mobile Home / Other | 198 | 36.6% |
| Total | 541 | 100.0% |
Housing Structures by Occupancy in Clio
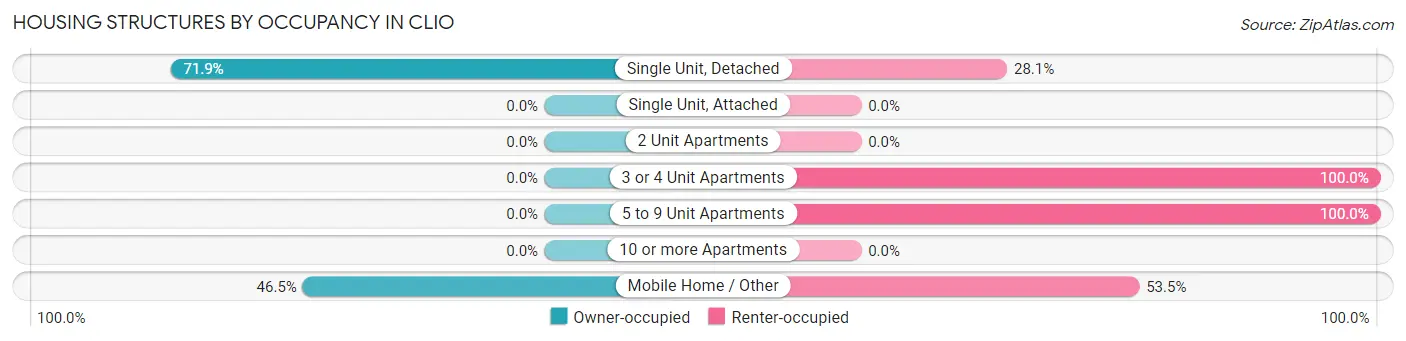
| Structure Type | Owner-occupied | Renter-occupied |
| Single Unit, Detached | 187 (71.9%) | 73 (28.1%) |
| Single Unit, Attached | 0 (0.0%) | 0 (0.0%) |
| 2 Unit Apartments | 0 (0.0%) | 0 (0.0%) |
| 3 or 4 Unit Apartments | 0 (0.0%) | 64 (100.0%) |
| 5 to 9 Unit Apartments | 0 (0.0%) | 19 (100.0%) |
| 10 or more Apartments | 0 (0.0%) | 0 (0.0%) |
| Mobile Home / Other | 92 (46.5%) | 106 (53.5%) |
| Total | 279 (51.6%) | 262 (48.4%) |
Housing Structures by Number of Rooms in Clio
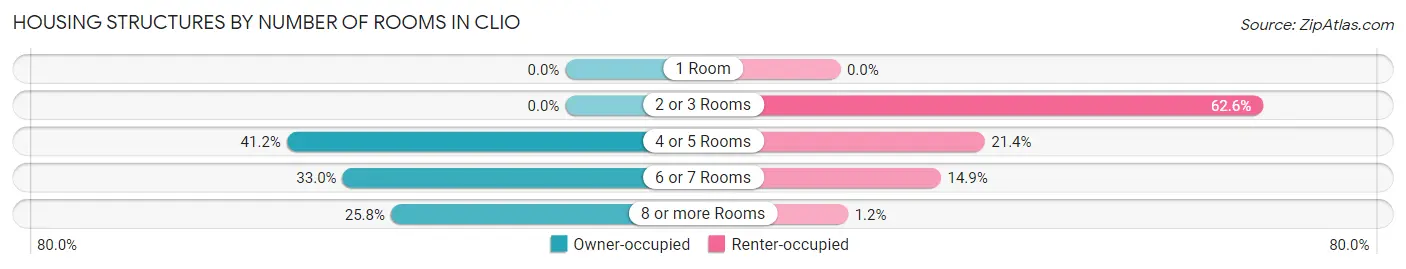
| Number of Rooms | Owner-occupied | Renter-occupied |
| 1 Room | 0 (0.0%) | 0 (0.0%) |
| 2 or 3 Rooms | 0 (0.0%) | 164 (62.6%) |
| 4 or 5 Rooms | 115 (41.2%) | 56 (21.4%) |
| 6 or 7 Rooms | 92 (33.0%) | 39 (14.9%) |
| 8 or more Rooms | 72 (25.8%) | 3 (1.1%) |
| Total | 279 (100.0%) | 262 (100.0%) |
Housing Structure by Heating Type in Clio
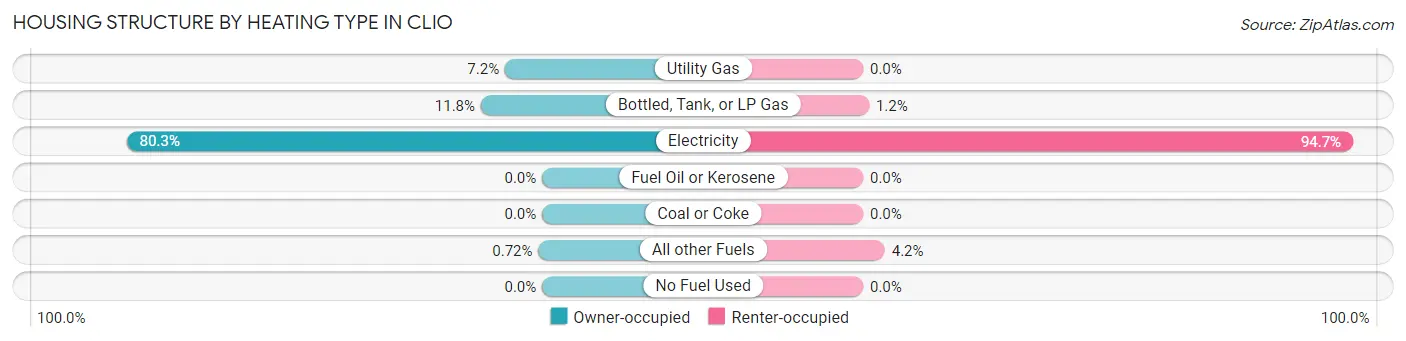
| Heating Type | Owner-occupied | Renter-occupied |
| Utility Gas | 20 (7.2%) | 0 (0.0%) |
| Bottled, Tank, or LP Gas | 33 (11.8%) | 3 (1.1%) |
| Electricity | 224 (80.3%) | 248 (94.7%) |
| Fuel Oil or Kerosene | 0 (0.0%) | 0 (0.0%) |
| Coal or Coke | 0 (0.0%) | 0 (0.0%) |
| All other Fuels | 2 (0.7%) | 11 (4.2%) |
| No Fuel Used | 0 (0.0%) | 0 (0.0%) |
| Total | 279 (100.0%) | 262 (100.0%) |
Household Vehicle Usage in Clio
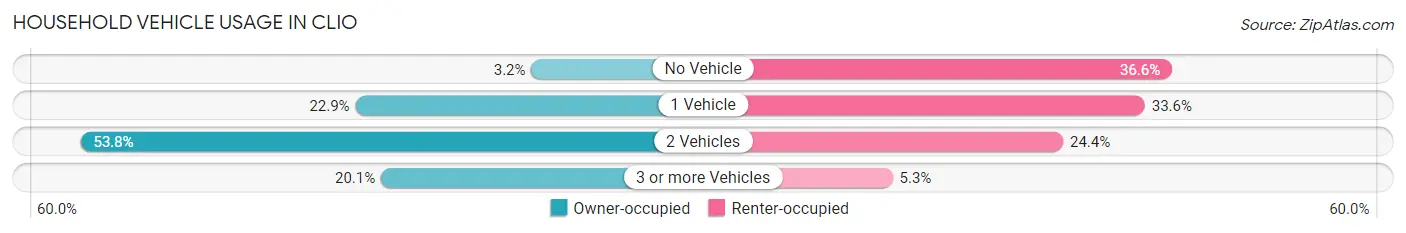
| Vehicles per Household | Owner-occupied | Renter-occupied |
| No Vehicle | 9 (3.2%) | 96 (36.6%) |
| 1 Vehicle | 64 (22.9%) | 88 (33.6%) |
| 2 Vehicles | 150 (53.8%) | 64 (24.4%) |
| 3 or more Vehicles | 56 (20.1%) | 14 (5.3%) |
| Total | 279 (100.0%) | 262 (100.0%) |
Real Estate & Mortgages in Clio
Real Estate and Mortgage Overview in Clio
| Characteristic | Without Mortgage | With Mortgage |
| Housing Units | 255 | 24 |
| Median Property Value | $54,300 | $110,000 |
| Median Household Income | $37,796 | $0 |
| Monthly Housing Costs | $355 | $0 |
| Real Estate Taxes | $204 | $0 |
Property Value by Mortgage Status in Clio
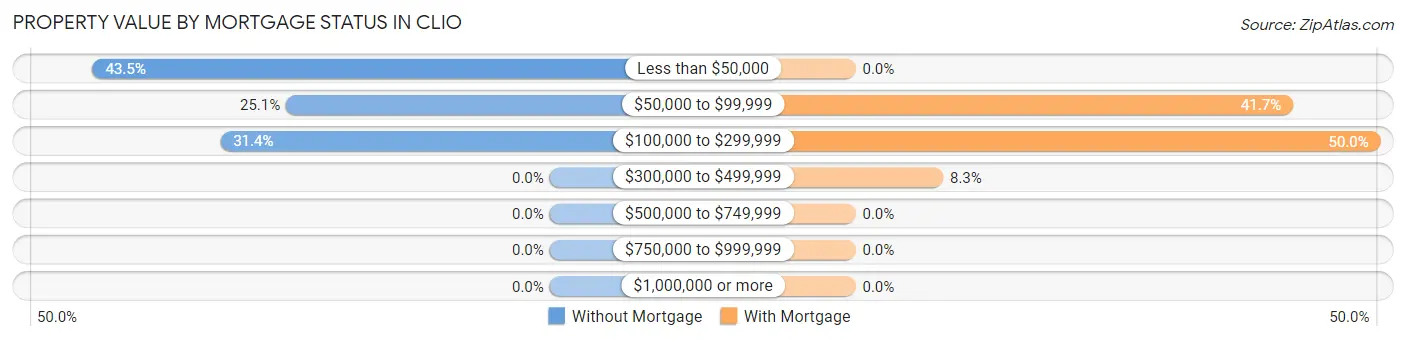
| Property Value | Without Mortgage | With Mortgage |
| Less than $50,000 | 111 (43.5%) | 0 (0.0%) |
| $50,000 to $99,999 | 64 (25.1%) | 10 (41.7%) |
| $100,000 to $299,999 | 80 (31.4%) | 12 (50.0%) |
| $300,000 to $499,999 | 0 (0.0%) | 2 (8.3%) |
| $500,000 to $749,999 | 0 (0.0%) | 0 (0.0%) |
| $750,000 to $999,999 | 0 (0.0%) | 0 (0.0%) |
| $1,000,000 or more | 0 (0.0%) | 0 (0.0%) |
| Total | 255 (100.0%) | 24 (100.0%) |
Household Income by Mortgage Status in Clio
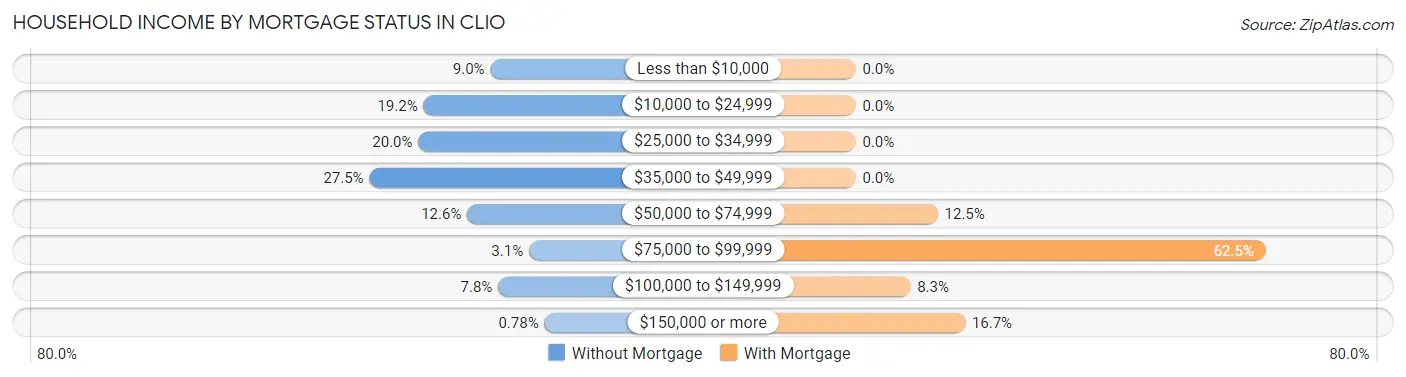
| Household Income | Without Mortgage | With Mortgage |
| Less than $10,000 | 23 (9.0%) | 0 (0.0%) |
| $10,000 to $24,999 | 49 (19.2%) | 0 (0.0%) |
| $25,000 to $34,999 | 51 (20.0%) | 0 (0.0%) |
| $35,000 to $49,999 | 70 (27.5%) | 0 (0.0%) |
| $50,000 to $74,999 | 32 (12.6%) | 3 (12.5%) |
| $75,000 to $99,999 | 8 (3.1%) | 15 (62.5%) |
| $100,000 to $149,999 | 20 (7.8%) | 2 (8.3%) |
| $150,000 or more | 2 (0.8%) | 4 (16.7%) |
| Total | 255 (100.0%) | 24 (100.0%) |
Property Value to Household Income Ratio in Clio
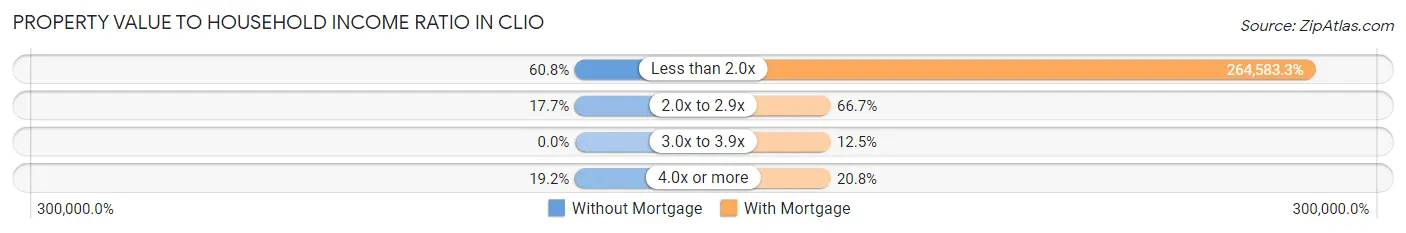
| Value-to-Income Ratio | Without Mortgage | With Mortgage |
| Less than 2.0x | 155 (60.8%) | 63,500 (264,583.3%) |
| 2.0x to 2.9x | 45 (17.6%) | 16 (66.7%) |
| 3.0x to 3.9x | 0 (0.0%) | 3 (12.5%) |
| 4.0x or more | 49 (19.2%) | 5 (20.8%) |
| Total | 255 (100.0%) | 24 (100.0%) |
Real Estate Taxes by Mortgage Status in Clio
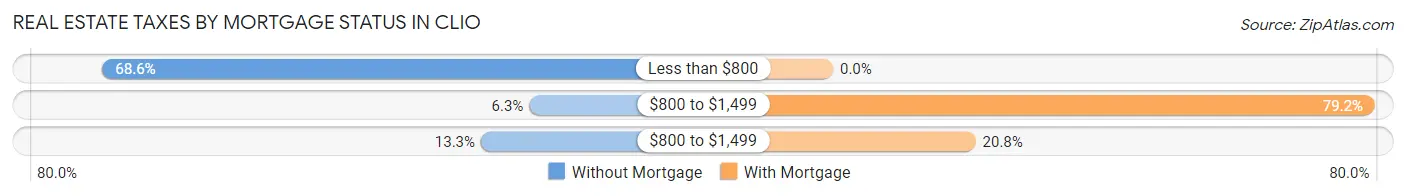
| Property Taxes | Without Mortgage | With Mortgage |
| Less than $800 | 175 (68.6%) | 0 (0.0%) |
| $800 to $1,499 | 16 (6.3%) | 19 (79.2%) |
| $800 to $1,499 | 34 (13.3%) | 5 (20.8%) |
| Total | 255 (100.0%) | 24 (100.0%) |
Health & Disability in Clio
Health Insurance Coverage by Age in Clio
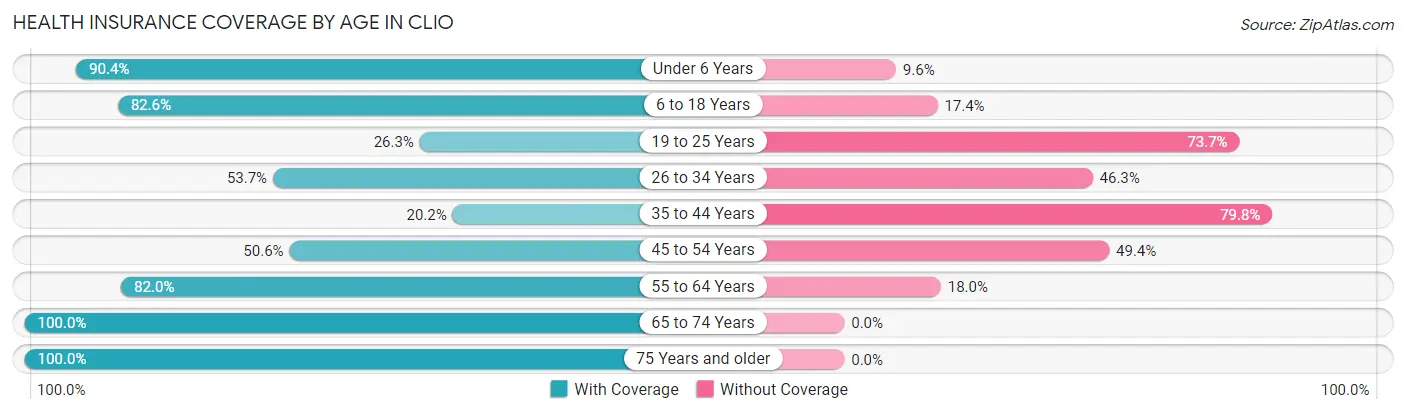
| Age Bracket | With Coverage | Without Coverage |
| Under 6 Years | 94 (90.4%) | 10 (9.6%) |
| 6 to 18 Years | 157 (82.6%) | 33 (17.4%) |
| 19 to 25 Years | 10 (26.3%) | 28 (73.7%) |
| 26 to 34 Years | 109 (53.7%) | 94 (46.3%) |
| 35 to 44 Years | 40 (20.2%) | 158 (79.8%) |
| 45 to 54 Years | 41 (50.6%) | 40 (49.4%) |
| 55 to 64 Years | 114 (82.0%) | 25 (18.0%) |
| 65 to 74 Years | 178 (100.0%) | 0 (0.0%) |
| 75 Years and older | 61 (100.0%) | 0 (0.0%) |
| Total | 804 (67.4%) | 388 (32.6%) |
Health Insurance Coverage by Citizenship Status in Clio
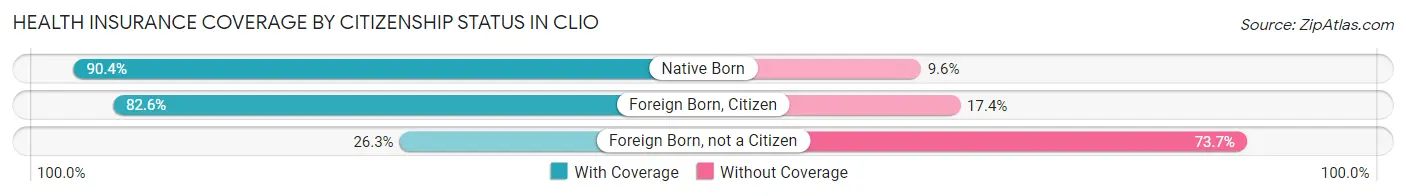
| Citizenship Status | With Coverage | Without Coverage |
| Native Born | 94 (90.4%) | 10 (9.6%) |
| Foreign Born, Citizen | 157 (82.6%) | 33 (17.4%) |
| Foreign Born, not a Citizen | 10 (26.3%) | 28 (73.7%) |
Health Insurance Coverage by Household Income in Clio
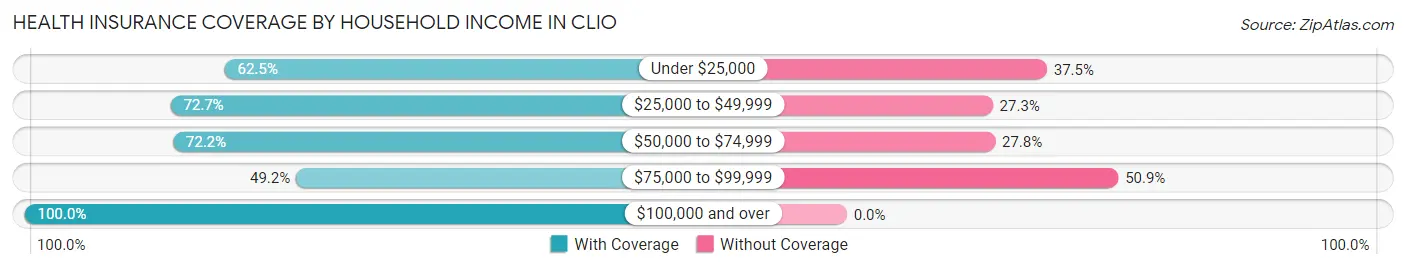
| Household Income | With Coverage | Without Coverage |
| Under $25,000 | 307 (62.5%) | 184 (37.5%) |
| $25,000 to $49,999 | 250 (72.7%) | 94 (27.3%) |
| $50,000 to $74,999 | 130 (72.2%) | 50 (27.8%) |
| $75,000 to $99,999 | 58 (49.1%) | 60 (50.8%) |
| $100,000 and over | 59 (100.0%) | 0 (0.0%) |
Public vs Private Health Insurance Coverage by Age in Clio
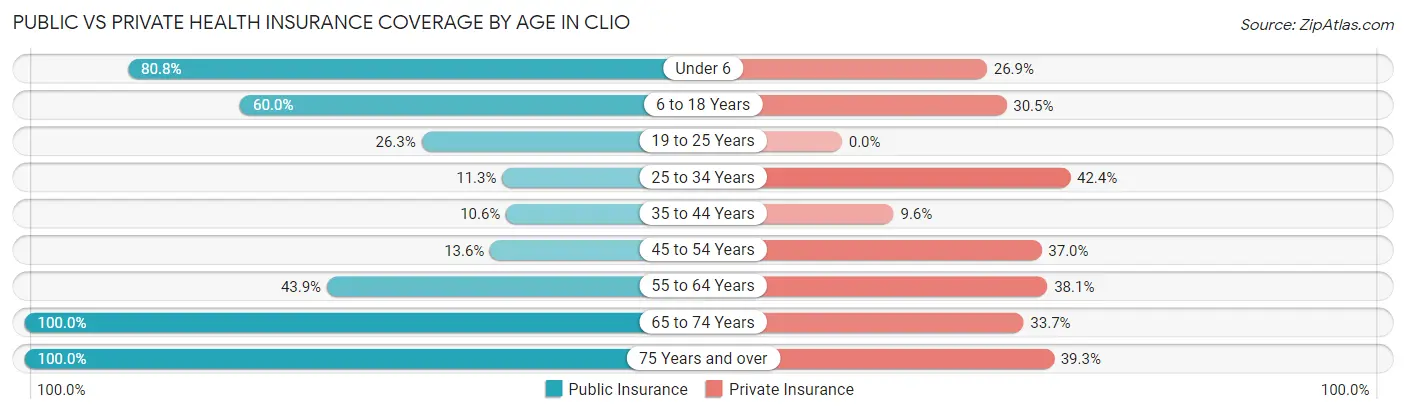
| Age Bracket | Public Insurance | Private Insurance |
| Under 6 | 84 (80.8%) | 28 (26.9%) |
| 6 to 18 Years | 114 (60.0%) | 58 (30.5%) |
| 19 to 25 Years | 10 (26.3%) | 0 (0.0%) |
| 25 to 34 Years | 23 (11.3%) | 86 (42.4%) |
| 35 to 44 Years | 21 (10.6%) | 19 (9.6%) |
| 45 to 54 Years | 11 (13.6%) | 30 (37.0%) |
| 55 to 64 Years | 61 (43.9%) | 53 (38.1%) |
| 65 to 74 Years | 178 (100.0%) | 60 (33.7%) |
| 75 Years and over | 61 (100.0%) | 24 (39.3%) |
| Total | 563 (47.2%) | 358 (30.0%) |
Disability Status by Sex by Age in Clio
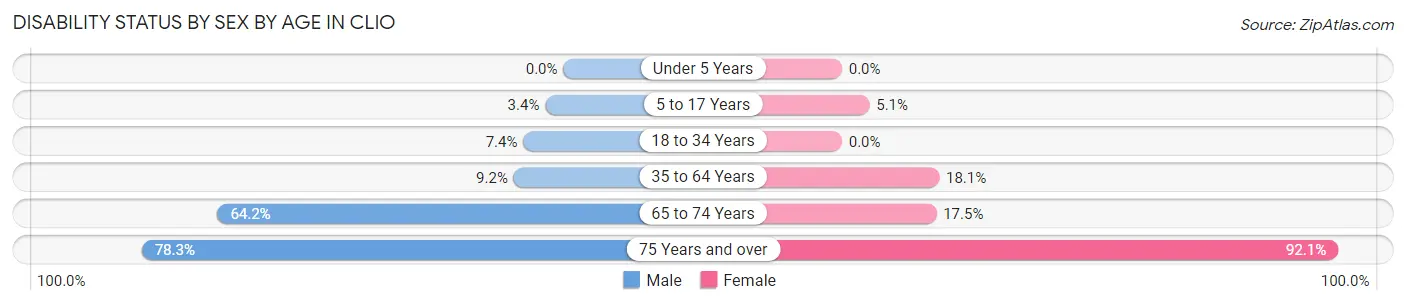
| Age Bracket | Male | Female |
| Under 5 Years | 0 (0.0%) | 0 (0.0%) |
| 5 to 17 Years | 4 (3.4%) | 5 (5.1%) |
| 18 to 34 Years | 11 (7.4%) | 0 (0.0%) |
| 35 to 64 Years | 14 (9.2%) | 48 (18.0%) |
| 65 to 74 Years | 52 (64.2%) | 17 (17.5%) |
| 75 Years and over | 18 (78.3%) | 35 (92.1%) |
Disability Class by Sex by Age in Clio
Disability Class: Hearing Difficulty
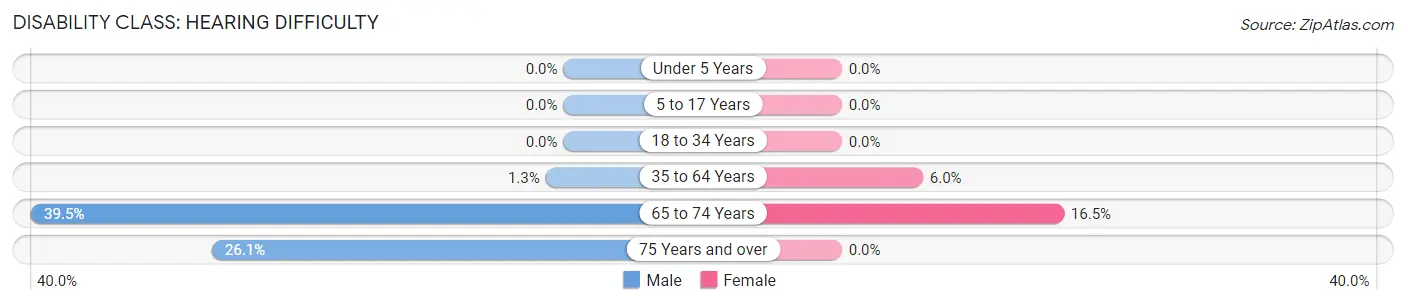
| Age Bracket | Male | Female |
| Under 5 Years | 0 (0.0%) | 0 (0.0%) |
| 5 to 17 Years | 0 (0.0%) | 0 (0.0%) |
| 18 to 34 Years | 0 (0.0%) | 0 (0.0%) |
| 35 to 64 Years | 2 (1.3%) | 16 (6.0%) |
| 65 to 74 Years | 32 (39.5%) | 16 (16.5%) |
| 75 Years and over | 6 (26.1%) | 0 (0.0%) |
Disability Class: Vision Difficulty
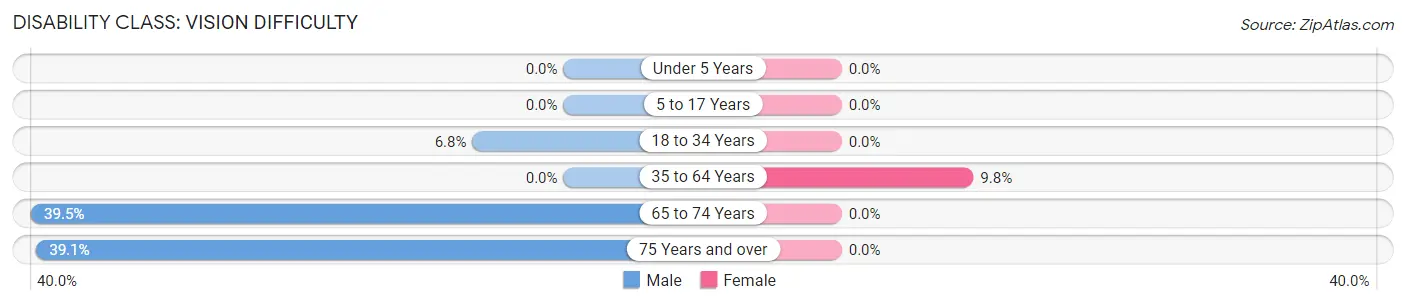
| Age Bracket | Male | Female |
| Under 5 Years | 0 (0.0%) | 0 (0.0%) |
| 5 to 17 Years | 0 (0.0%) | 0 (0.0%) |
| 18 to 34 Years | 10 (6.8%) | 0 (0.0%) |
| 35 to 64 Years | 0 (0.0%) | 26 (9.8%) |
| 65 to 74 Years | 32 (39.5%) | 0 (0.0%) |
| 75 Years and over | 9 (39.1%) | 0 (0.0%) |
Disability Class: Cognitive Difficulty
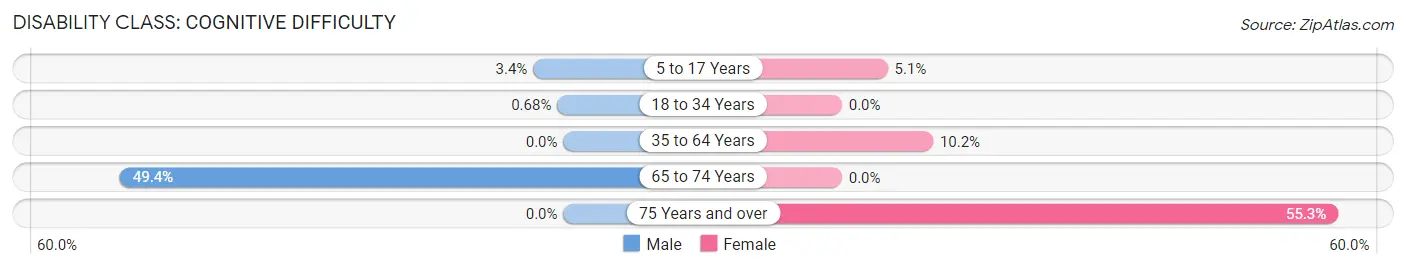
| Age Bracket | Male | Female |
| 5 to 17 Years | 4 (3.4%) | 5 (5.1%) |
| 18 to 34 Years | 1 (0.7%) | 0 (0.0%) |
| 35 to 64 Years | 0 (0.0%) | 27 (10.2%) |
| 65 to 74 Years | 40 (49.4%) | 0 (0.0%) |
| 75 Years and over | 0 (0.0%) | 21 (55.3%) |
Disability Class: Ambulatory Difficulty
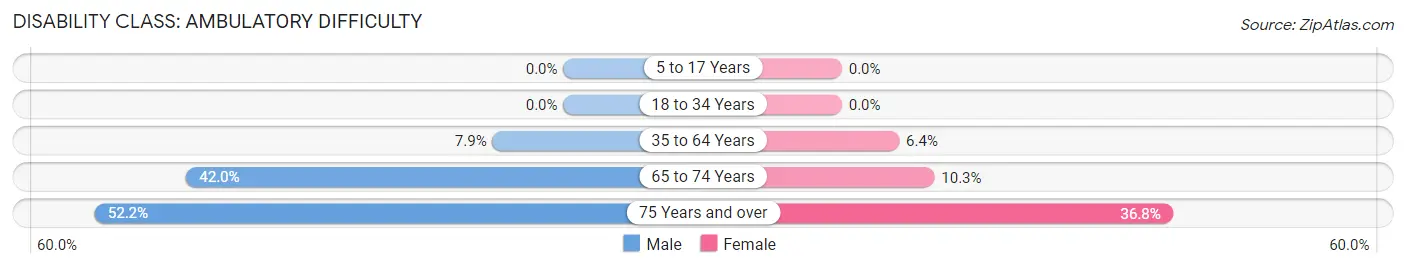
| Age Bracket | Male | Female |
| 5 to 17 Years | 0 (0.0%) | 0 (0.0%) |
| 18 to 34 Years | 0 (0.0%) | 0 (0.0%) |
| 35 to 64 Years | 12 (7.9%) | 17 (6.4%) |
| 65 to 74 Years | 34 (42.0%) | 10 (10.3%) |
| 75 Years and over | 12 (52.2%) | 14 (36.8%) |
Disability Class: Self-Care Difficulty
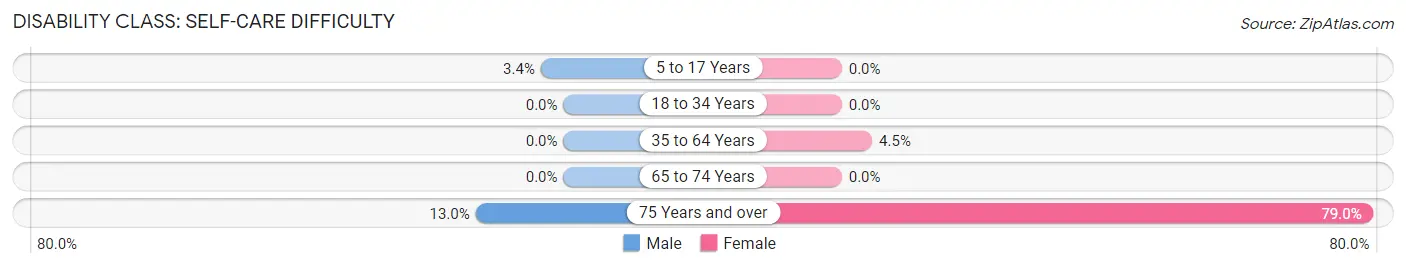
| Age Bracket | Male | Female |
| 5 to 17 Years | 4 (3.4%) | 0 (0.0%) |
| 18 to 34 Years | 0 (0.0%) | 0 (0.0%) |
| 35 to 64 Years | 0 (0.0%) | 12 (4.5%) |
| 65 to 74 Years | 0 (0.0%) | 0 (0.0%) |
| 75 Years and over | 3 (13.0%) | 30 (78.9%) |
Technology Access in Clio
Computing Device Access in Clio
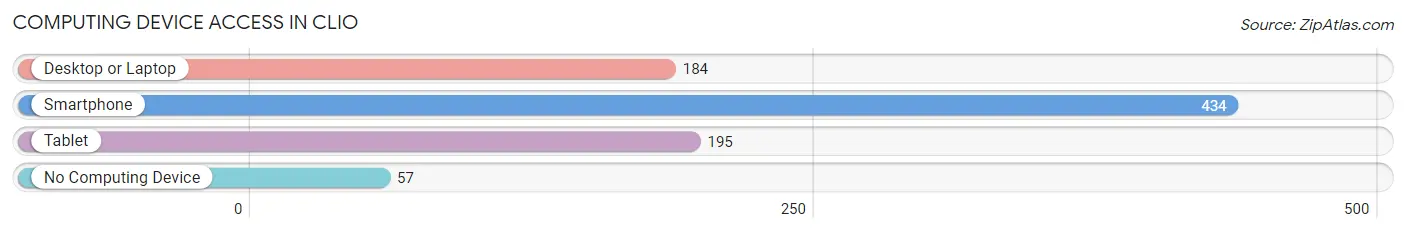
| Device Type | # Households | % Households |
| Desktop or Laptop | 184 | 34.0% |
| Smartphone | 434 | 80.2% |
| Tablet | 195 | 36.0% |
| No Computing Device | 57 | 10.5% |
| Total | 541 | 100.0% |
Internet Access in Clio
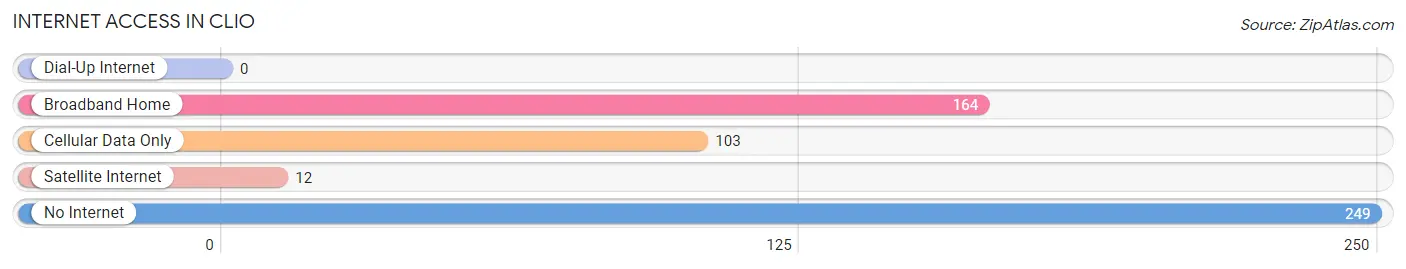
| Internet Type | # Households | % Households |
| Dial-Up Internet | 0 | 0.0% |
| Broadband Home | 164 | 30.3% |
| Cellular Data Only | 103 | 19.0% |
| Satellite Internet | 12 | 2.2% |
| No Internet | 249 | 46.0% |
| Total | 541 | 100.0% |
Clio Summary
Clio, Alabama is a small town located in Barbour County, Alabama. It is situated on the banks of the Choctawhatchee River, and is home to approximately 1,000 people. The town was founded in 1837 and was named after the Greek muse of history, Clio.
Geography
Clio is located in the southeastern corner of Barbour County, Alabama. It is situated on the banks of the Choctawhatchee River, which is a tributary of the Chattahoochee River. The town is located approximately 20 miles south of the state capital of Montgomery. The town is surrounded by rolling hills and is home to a variety of wildlife, including deer, turkey, and quail.
The climate in Clio is humid subtropical, with hot summers and mild winters. The average annual temperature is around 68 degrees Fahrenheit, with an average high of around 90 degrees in the summer and an average low of around 40 degrees in the winter. The town receives an average of around 50 inches of rain per year.
Economy
The economy of Clio is largely based on agriculture. The town is home to several farms, which produce a variety of crops, including cotton, corn, soybeans, and peanuts. The town is also home to several small businesses, including a grocery store, a hardware store, and a few restaurants.
The town is also home to a few manufacturing companies, including a furniture factory and a paper mill. The town is also home to a few small service businesses, including a barber shop, a beauty salon, and a few auto repair shops.
Demographics
As of the 2010 census, the population of Clio was 1,039. The racial makeup of the town was 79.3% White, 18.2% African American, 0.3% Native American, 0.2% Asian, 0.1% Pacific Islander, 0.7% from other races, and 1.4% from two or more races. Hispanic or Latino of any race were 1.7% of the population.
The median household income in Clio was $30,938, and the median family income was $37,500. The per capita income for the town was $15,945. About 18.2% of families and 22.2% of the population were below the poverty line, including 28.3% of those under age 18 and 16.7% of those age 65 or over.
Conclusion
Clio, Alabama is a small town located in Barbour County, Alabama. It is situated on the banks of the Choctawhatchee River, and is home to approximately 1,000 people. The town was founded in 1837 and was named after the Greek muse of history, Clio. The economy of Clio is largely based on agriculture, with a few small businesses and manufacturing companies. The population of Clio is mostly White, with a small percentage of African Americans and other races. The median household income in Clio is lower than the national average, and the poverty rate is higher than the national average. Despite its small size, Clio is a vibrant and diverse community with a rich history and culture.
Common Questions
What is Per Capita Income in Clio?
Per Capita income in Clio is $15,008.
What is the Median Family Income in Clio?
Median Family Income in Clio is $27,027.
What is the Median Household income in Clio?
Median Household Income in Clio is $25,290.
What is Income or Wage Gap in Clio?
Income or Wage Gap in Clio is 28.3%.
Women in Clio earn 71.7 cents for every dollar earned by a man.
What is Inequality or Gini Index in Clio?
Inequality or Gini Index in Clio is 0.45.
What is the Total Population of Clio?
Total Population of Clio is 1,415.
What is the Total Male Population of Clio?
Total Male Population of Clio is 797.
What is the Total Female Population of Clio?
Total Female Population of Clio is 618.
What is the Ratio of Males per 100 Females in Clio?
There are 128.96 Males per 100 Females in Clio.
What is the Ratio of Females per 100 Males in Clio?
There are 77.54 Females per 100 Males in Clio.
What is the Median Population Age in Clio?
Median Population Age in Clio is 43.5 Years.
What is the Average Family Size in Clio
Average Family Size in Clio is 2.9 People.
What is the Average Household Size in Clio
Average Household Size in Clio is 2.2 People.
How Large is the Labor Force in Clio?
There are 450 People in the Labor Forcein in Clio.
What is the Percentage of People in the Labor Force in Clio?
39.0% of People are in the Labor Force in Clio.
What is the Unemployment Rate in Clio?
Unemployment Rate in Clio is 5.3%.