Cleveland, AL Map & Demographics
Cleveland Map
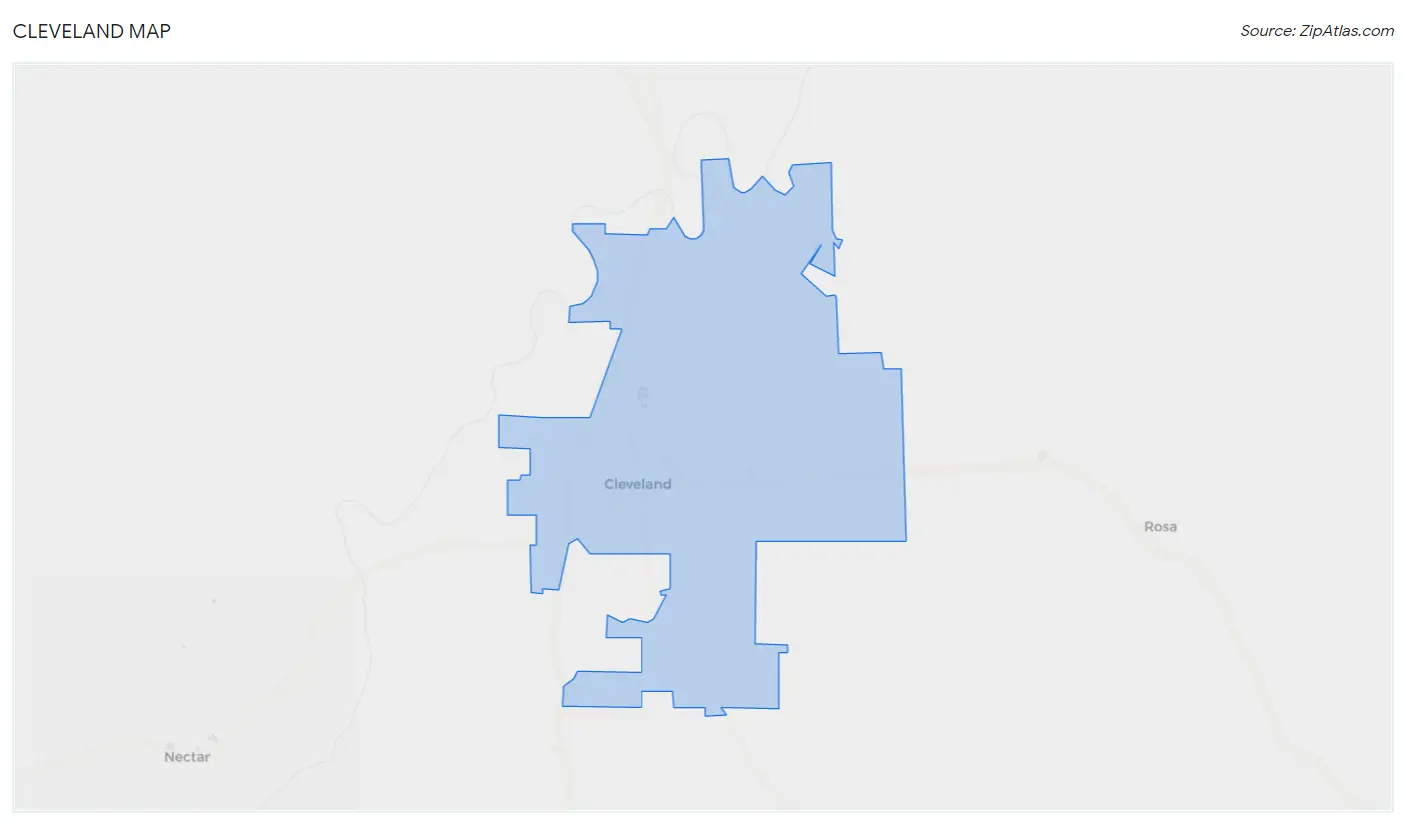
Cleveland Overview
$25,767
PER CAPITA INCOME
$66,458
AVG FAMILY INCOME
$49,387
AVG HOUSEHOLD INCOME
27.4%
WAGE / INCOME GAP [ % ]
72.6¢/ $1
WAGE / INCOME GAP [ $ ]
0.37
INEQUALITY / GINI INDEX
1,252
TOTAL POPULATION
610
MALE POPULATION
642
FEMALE POPULATION
95.02
MALES / 100 FEMALES
105.25
FEMALES / 100 MALES
40.6
MEDIAN AGE
3.0
AVG FAMILY SIZE
2.6
AVG HOUSEHOLD SIZE
625
LABOR FORCE [ PEOPLE ]
65.4%
PERCENT IN LABOR FORCE
6.2%
UNEMPLOYMENT RATE
Cleveland Zip Codes
Cleveland Area Codes
Income in Cleveland
Income Overview in Cleveland
Per Capita Income in Cleveland is $25,767, while median incomes of families and households are $66,458 and $49,387 respectively.
| Characteristic | Number | Measure |
| Per Capita Income | 1,252 | $25,767 |
| Median Family Income | 371 | $66,458 |
| Mean Family Income | 371 | $76,871 |
| Median Household Income | 475 | $49,387 |
| Mean Household Income | 475 | $67,449 |
| Income Deficit | 371 | $0 |
| Wage / Income Gap (%) | 1,252 | 27.42% |
| Wage / Income Gap ($) | 1,252 | 72.58¢ per $1 |
| Gini / Inequality Index | 1,252 | 0.37 |
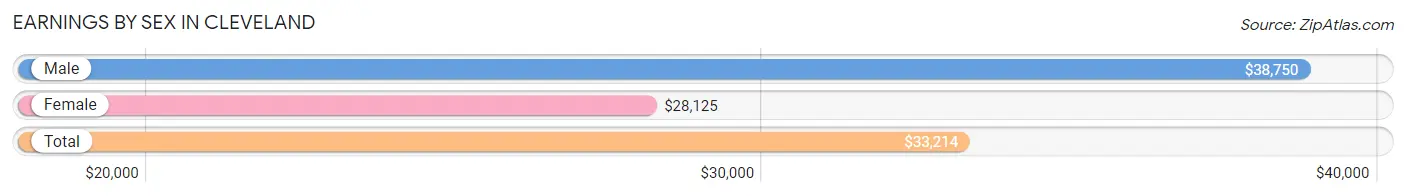
Earnings by Sex in Cleveland
Average Earnings in Cleveland are $33,214, $38,750 for men and $28,125 for women, a difference of 27.4%.
| Sex | Number | Average Earnings |
| Male | 330 (54.6%) | $38,750 |
| Female | 274 (45.4%) | $28,125 |
| Total | 604 (100.0%) | $33,214 |
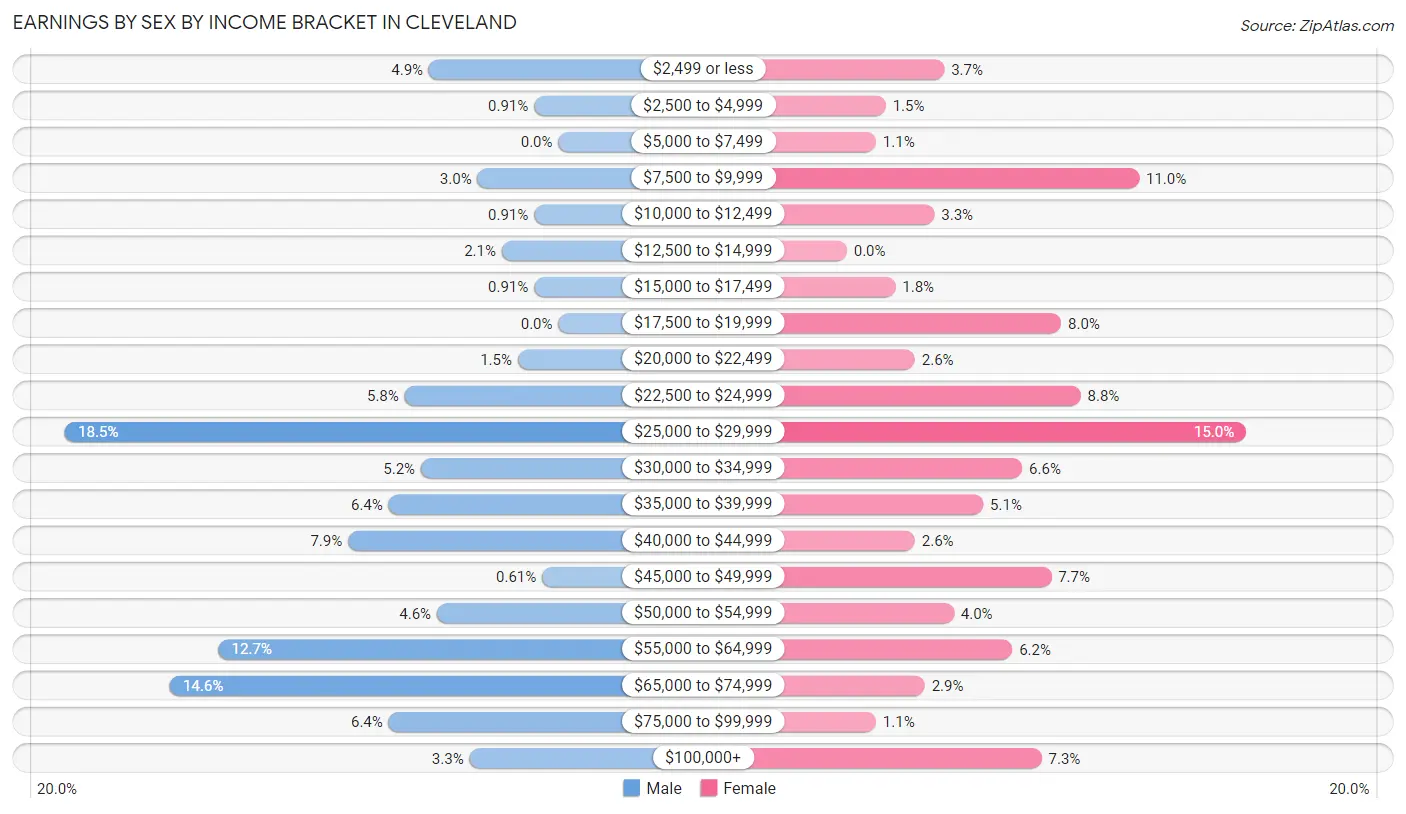
Earnings by Sex by Income Bracket in Cleveland
The most common earnings brackets in Cleveland are $25,000 to $29,999 for men (61 | 18.5%) and $25,000 to $29,999 for women (41 | 15.0%).
| Income | Male | Female |
| $2,499 or less | 16 (4.9%) | 10 (3.6%) |
| $2,500 to $4,999 | 3 (0.9%) | 4 (1.5%) |
| $5,000 to $7,499 | 0 (0.0%) | 3 (1.1%) |
| $7,500 to $9,999 | 10 (3.0%) | 30 (11.0%) |
| $10,000 to $12,499 | 3 (0.9%) | 9 (3.3%) |
| $12,500 to $14,999 | 7 (2.1%) | 0 (0.0%) |
| $15,000 to $17,499 | 3 (0.9%) | 5 (1.8%) |
| $17,500 to $19,999 | 0 (0.0%) | 22 (8.0%) |
| $20,000 to $22,499 | 5 (1.5%) | 7 (2.5%) |
| $22,500 to $24,999 | 19 (5.8%) | 24 (8.8%) |
| $25,000 to $29,999 | 61 (18.5%) | 41 (15.0%) |
| $30,000 to $34,999 | 17 (5.1%) | 18 (6.6%) |
| $35,000 to $39,999 | 21 (6.4%) | 14 (5.1%) |
| $40,000 to $44,999 | 26 (7.9%) | 7 (2.5%) |
| $45,000 to $49,999 | 2 (0.6%) | 21 (7.7%) |
| $50,000 to $54,999 | 15 (4.5%) | 11 (4.0%) |
| $55,000 to $64,999 | 42 (12.7%) | 17 (6.2%) |
| $65,000 to $74,999 | 48 (14.5%) | 8 (2.9%) |
| $75,000 to $99,999 | 21 (6.4%) | 3 (1.1%) |
| $100,000+ | 11 (3.3%) | 20 (7.3%) |
| Total | 330 (100.0%) | 274 (100.0%) |
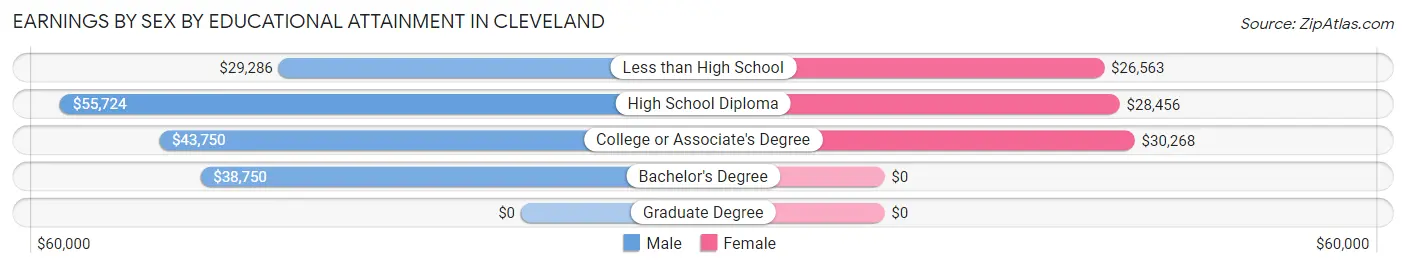
Earnings by Sex by Educational Attainment in Cleveland
Average earnings in Cleveland are $42,917 for men and $30,179 for women, a difference of 29.7%. Men with an educational attainment of high school diploma enjoy the highest average annual earnings of $55,724, while those with less than high school education earn the least with $29,286. Women with an educational attainment of college or associate's degree earn the most with the average annual earnings of $30,268, while those with less than high school education have the smallest earnings of $26,563.
| Educational Attainment | Male Income | Female Income |
| Less than High School | $29,286 | $26,563 |
| High School Diploma | $55,724 | $28,456 |
| College or Associate's Degree | $43,750 | $30,268 |
| Bachelor's Degree | $38,750 | $0 |
| Graduate Degree | - | - |
| Total | $42,917 | $30,179 |
Family Income in Cleveland
Family Income Brackets in Cleveland
According to the Cleveland family income data, there are 110 families falling into the $35,000 to $49,999 income range, which is the most common income bracket and makes up 29.6% of all families.
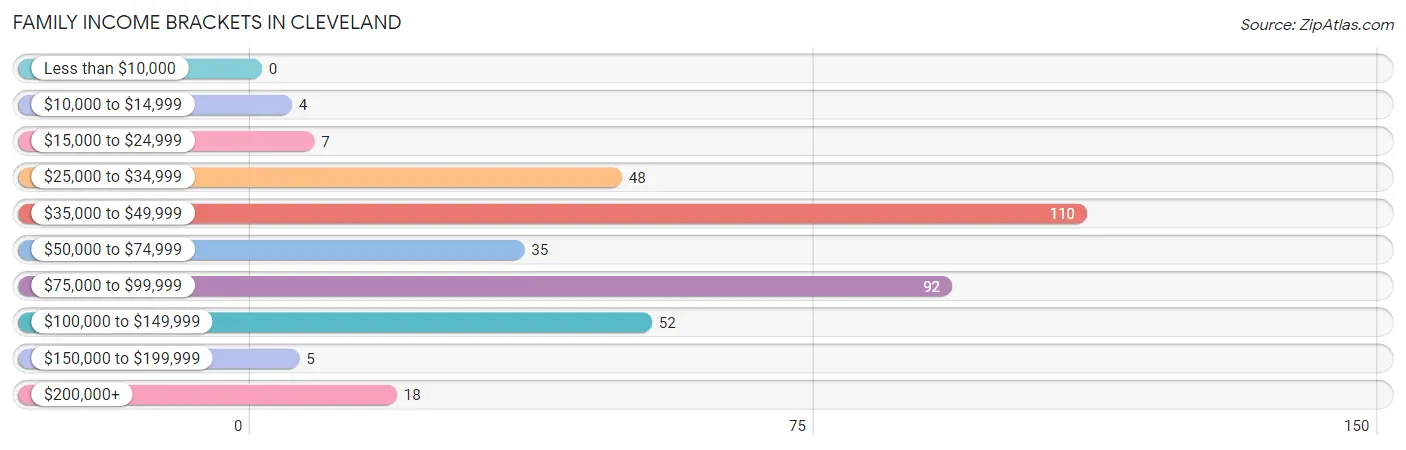
| Income Bracket | # Families | % Families |
| Less than $10,000 | 0 | 0.0% |
| $10,000 to $14,999 | 4 | 1.1% |
| $15,000 to $24,999 | 7 | 1.9% |
| $25,000 to $34,999 | 48 | 12.9% |
| $35,000 to $49,999 | 110 | 29.6% |
| $50,000 to $74,999 | 35 | 9.4% |
| $75,000 to $99,999 | 92 | 24.8% |
| $100,000 to $149,999 | 52 | 14.0% |
| $150,000 to $199,999 | 5 | 1.3% |
| $200,000+ | 18 | 4.9% |
Family Income by Famaliy Size in Cleveland
4-person families (90 | 24.3%) account for the highest median family income in Cleveland with $79,500 per family, while 2-person families (150 | 40.4%) have the highest median income of $24,802 per family member.
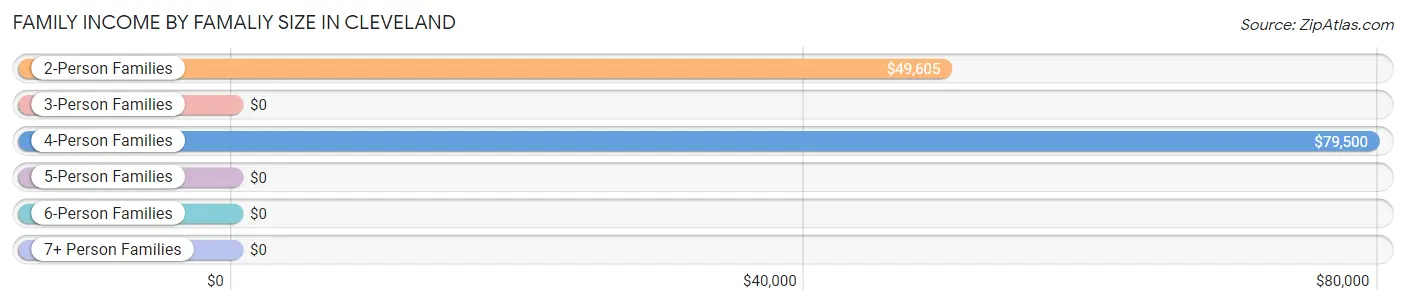
| Income Bracket | # Families | Median Income |
| 2-Person Families | 150 (40.4%) | $49,605 |
| 3-Person Families | 105 (28.3%) | $0 |
| 4-Person Families | 90 (24.3%) | $79,500 |
| 5-Person Families | 17 (4.6%) | $0 |
| 6-Person Families | 0 (0.0%) | $0 |
| 7+ Person Families | 9 (2.4%) | $0 |
| Total | 371 (100.0%) | $66,458 |
Family Income by Number of Earners in Cleveland
The median family income in Cleveland is $66,458, with families comprising 3+ earners (58) having the highest median family income of $88,929, while families with no earners (36) have the lowest median family income of $41,250, accounting for 15.6% and 9.7% of families, respectively.
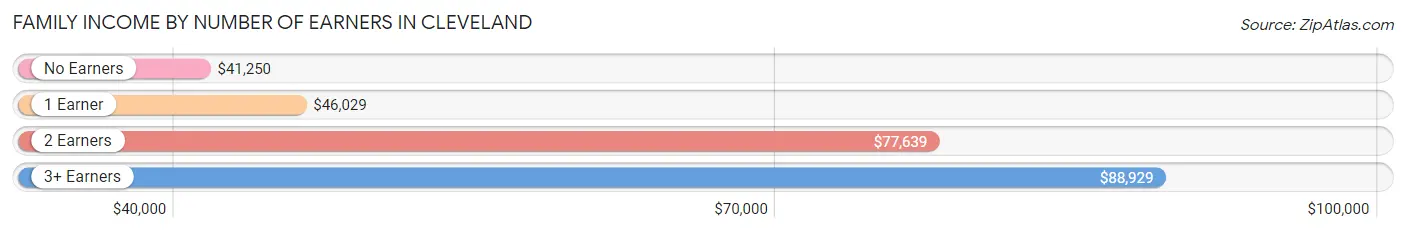
| Number of Earners | # Families | Median Income |
| No Earners | 36 (9.7%) | $41,250 |
| 1 Earner | 148 (39.9%) | $46,029 |
| 2 Earners | 129 (34.8%) | $77,639 |
| 3+ Earners | 58 (15.6%) | $88,929 |
| Total | 371 (100.0%) | $66,458 |
Household Income in Cleveland
Household Income Brackets in Cleveland
With 142 households falling in the category, the $35,000 to $49,999 income range is the most frequent in Cleveland, accounting for 29.9% of all households. In contrast, only 5 households (1.1%) fall into the $150,000 to $199,999 income bracket, making it the least populous group.
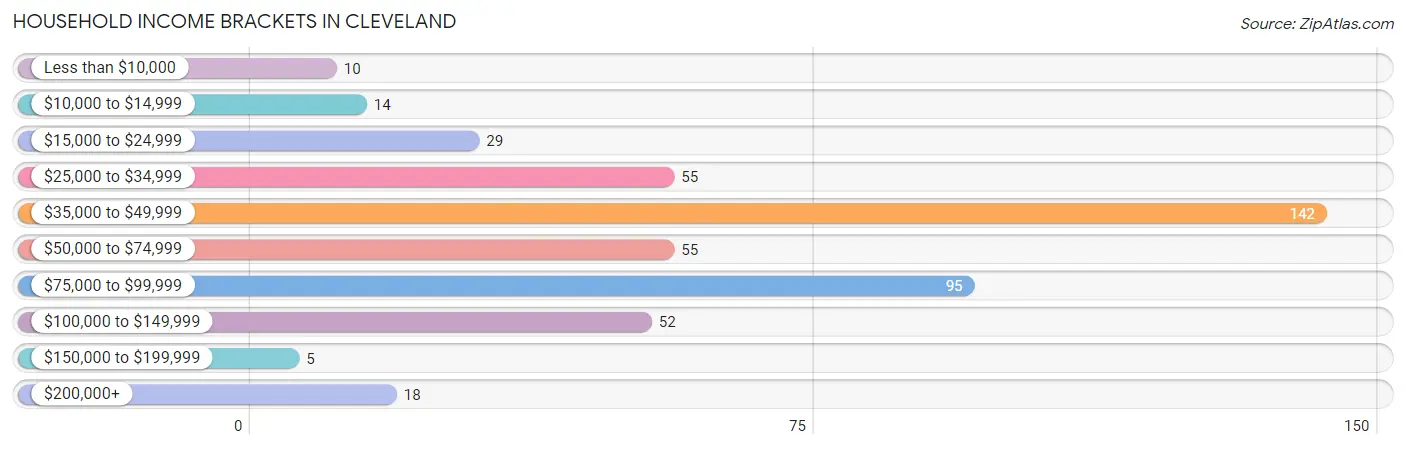
| Income Bracket | # Households | % Households |
| Less than $10,000 | 10 | 2.1% |
| $10,000 to $14,999 | 14 | 2.9% |
| $15,000 to $24,999 | 29 | 6.1% |
| $25,000 to $34,999 | 55 | 11.6% |
| $35,000 to $49,999 | 142 | 29.9% |
| $50,000 to $74,999 | 55 | 11.6% |
| $75,000 to $99,999 | 95 | 20.0% |
| $100,000 to $149,999 | 52 | 10.9% |
| $150,000 to $199,999 | 5 | 1.1% |
| $200,000+ | 18 | 3.8% |
Household Income by Householder Age in Cleveland
The median household income in Cleveland is $49,387, with the highest median household income of $78,173 found in the 45 to 64 years age bracket for the primary householder. A total of 207 households (43.6%) fall into this category.
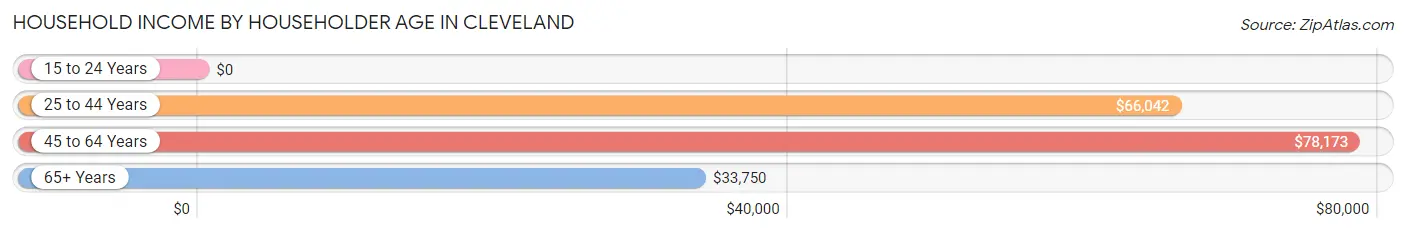
| Income Bracket | # Households | Median Income |
| 15 to 24 Years | 0 (0.0%) | $0 |
| 25 to 44 Years | 143 (30.1%) | $66,042 |
| 45 to 64 Years | 207 (43.6%) | $78,173 |
| 65+ Years | 125 (26.3%) | $33,750 |
| Total | 475 (100.0%) | $49,387 |
Poverty in Cleveland
Income Below Poverty by Sex and Age in Cleveland
With 1.6% poverty level for males and 4.8% for females among the residents of Cleveland, 75 year old and over males and 75 year old and over females are the most vulnerable to poverty, with 7 males (15.9%) and 14 females (22.6%) in their respective age groups living below the poverty level.
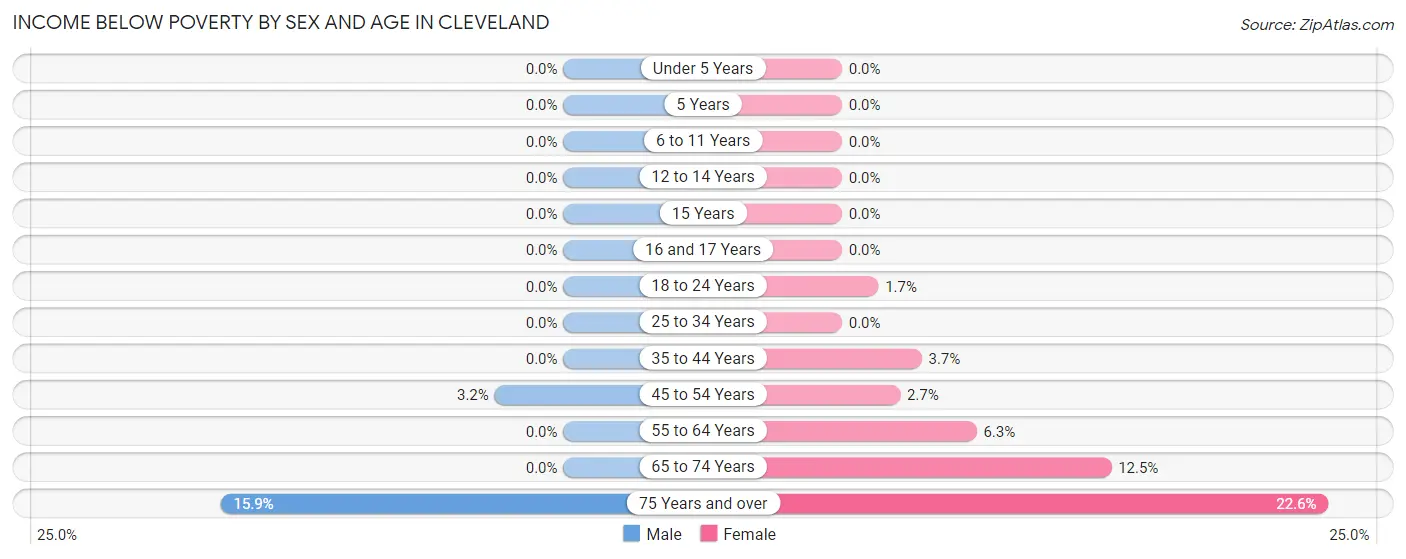
| Age Bracket | Male | Female |
| Under 5 Years | 0 (0.0%) | 0 (0.0%) |
| 5 Years | 0 (0.0%) | 0 (0.0%) |
| 6 to 11 Years | 0 (0.0%) | 0 (0.0%) |
| 12 to 14 Years | 0 (0.0%) | 0 (0.0%) |
| 15 Years | 0 (0.0%) | 0 (0.0%) |
| 16 and 17 Years | 0 (0.0%) | 0 (0.0%) |
| 18 to 24 Years | 0 (0.0%) | 1 (1.7%) |
| 25 to 34 Years | 0 (0.0%) | 0 (0.0%) |
| 35 to 44 Years | 0 (0.0%) | 3 (3.7%) |
| 45 to 54 Years | 3 (3.2%) | 3 (2.7%) |
| 55 to 64 Years | 0 (0.0%) | 4 (6.2%) |
| 65 to 74 Years | 0 (0.0%) | 6 (12.5%) |
| 75 Years and over | 7 (15.9%) | 14 (22.6%) |
| Total | 10 (1.6%) | 31 (4.8%) |
Income Above Poverty by Sex and Age in Cleveland
According to the poverty statistics in Cleveland, males aged under 5 years and females aged under 5 years are the age groups that are most secure financially, with 100.0% of males and 100.0% of females in these age groups living above the poverty line.
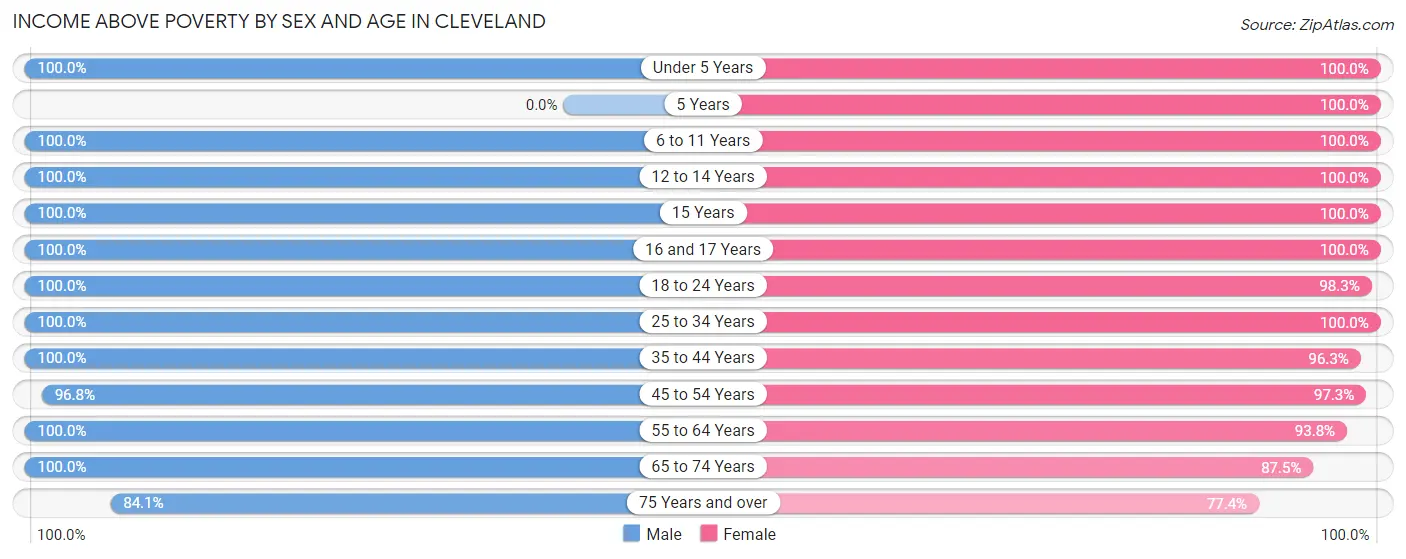
| Age Bracket | Male | Female |
| Under 5 Years | 34 (100.0%) | 66 (100.0%) |
| 5 Years | 0 (0.0%) | 9 (100.0%) |
| 6 to 11 Years | 50 (100.0%) | 43 (100.0%) |
| 12 to 14 Years | 12 (100.0%) | 35 (100.0%) |
| 15 Years | 37 (100.0%) | 11 (100.0%) |
| 16 and 17 Years | 32 (100.0%) | 11 (100.0%) |
| 18 to 24 Years | 58 (100.0%) | 58 (98.3%) |
| 25 to 34 Years | 40 (100.0%) | 42 (100.0%) |
| 35 to 44 Years | 67 (100.0%) | 78 (96.3%) |
| 45 to 54 Years | 91 (96.8%) | 108 (97.3%) |
| 55 to 64 Years | 99 (100.0%) | 60 (93.8%) |
| 65 to 74 Years | 43 (100.0%) | 42 (87.5%) |
| 75 Years and over | 37 (84.1%) | 48 (77.4%) |
| Total | 600 (98.4%) | 611 (95.2%) |
Income Below Poverty Among Married-Couple Families in Cleveland
The poverty statistics for married-couple families in Cleveland show that 2.3% or 7 of the total 301 families live below the poverty line. Families with no children have the highest poverty rate of 4.1%, comprising of 7 families. On the other hand, families with 1 or 2 children have the lowest poverty rate of 0.0%, which includes 0 families.
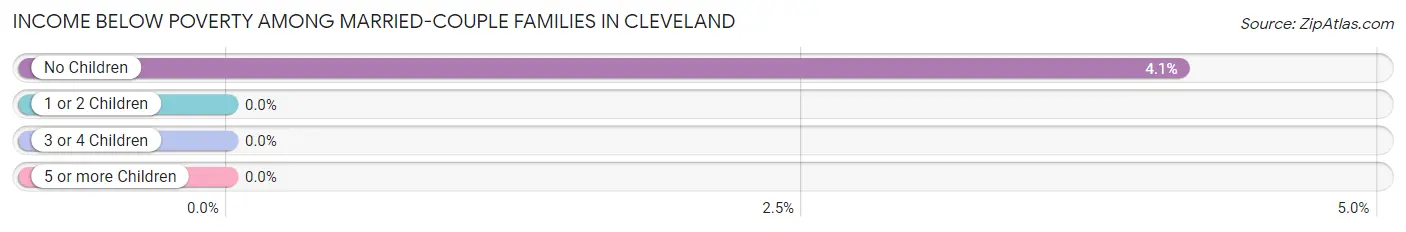
| Children | Above Poverty | Below Poverty |
| No Children | 162 (95.9%) | 7 (4.1%) |
| 1 or 2 Children | 113 (100.0%) | 0 (0.0%) |
| 3 or 4 Children | 10 (100.0%) | 0 (0.0%) |
| 5 or more Children | 9 (100.0%) | 0 (0.0%) |
| Total | 294 (97.7%) | 7 (2.3%) |
Income Below Poverty Among Single-Parent Households in Cleveland
| Children | Single Father | Single Mother |
| No Children | 0 (0.0%) | 0 (0.0%) |
| 1 or 2 Children | 0 (0.0%) | 0 (0.0%) |
| 3 or 4 Children | 0 (0.0%) | 0 (0.0%) |
| 5 or more Children | 0 (0.0%) | 0 (0.0%) |
| Total | 0 (0.0%) | 0 (0.0%) |
Income Below Poverty Among Married-Couple vs Single-Parent Households in Cleveland
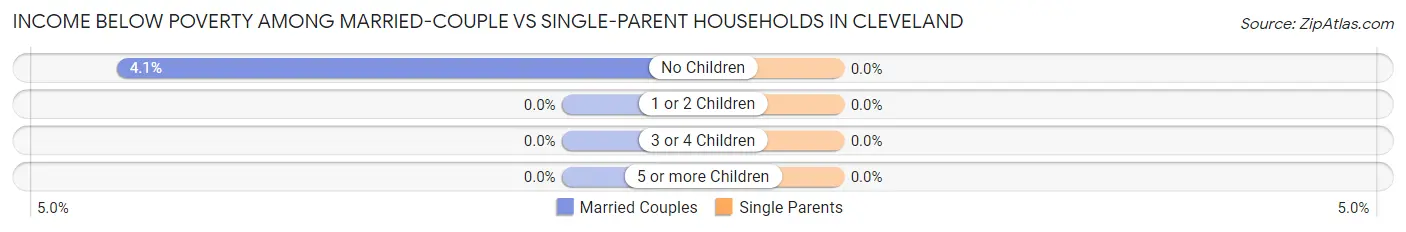
| Children | Married-Couple Families | Single-Parent Households |
| No Children | 7 (4.1%) | 0 (0.0%) |
| 1 or 2 Children | 0 (0.0%) | 0 (0.0%) |
| 3 or 4 Children | 0 (0.0%) | 0 (0.0%) |
| 5 or more Children | 0 (0.0%) | 0 (0.0%) |
| Total | 7 (2.3%) | 0 (0.0%) |
Race in Cleveland
The most populous races in Cleveland are White / Caucasian (1,001 | 79.9%), Hispanic or Latino (292 | 23.3%), and Two or more Races (195 | 15.6%).
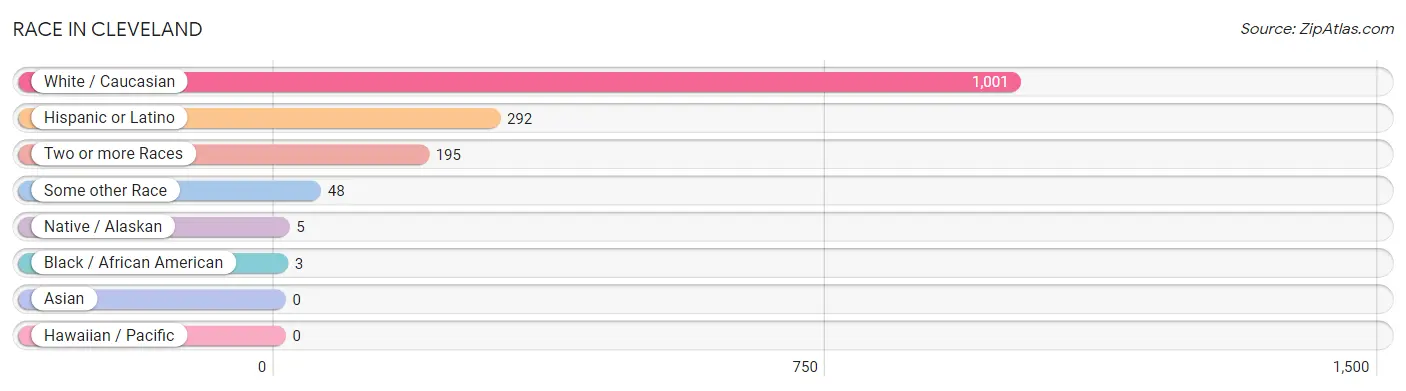
| Race | # Population | % Population |
| Asian | 0 | 0.0% |
| Black / African American | 3 | 0.2% |
| Hawaiian / Pacific | 0 | 0.0% |
| Hispanic or Latino | 292 | 23.3% |
| Native / Alaskan | 5 | 0.4% |
| White / Caucasian | 1,001 | 79.9% |
| Two or more Races | 195 | 15.6% |
| Some other Race | 48 | 3.8% |
| Total | 1,252 | 100.0% |
Ancestry in Cleveland
The most populous ancestries reported in Cleveland are Mexican (268 | 21.4%), American (213 | 17.0%), English (207 | 16.5%), Irish (115 | 9.2%), and German (87 | 7.0%), together accounting for 71.1% of all Cleveland residents.
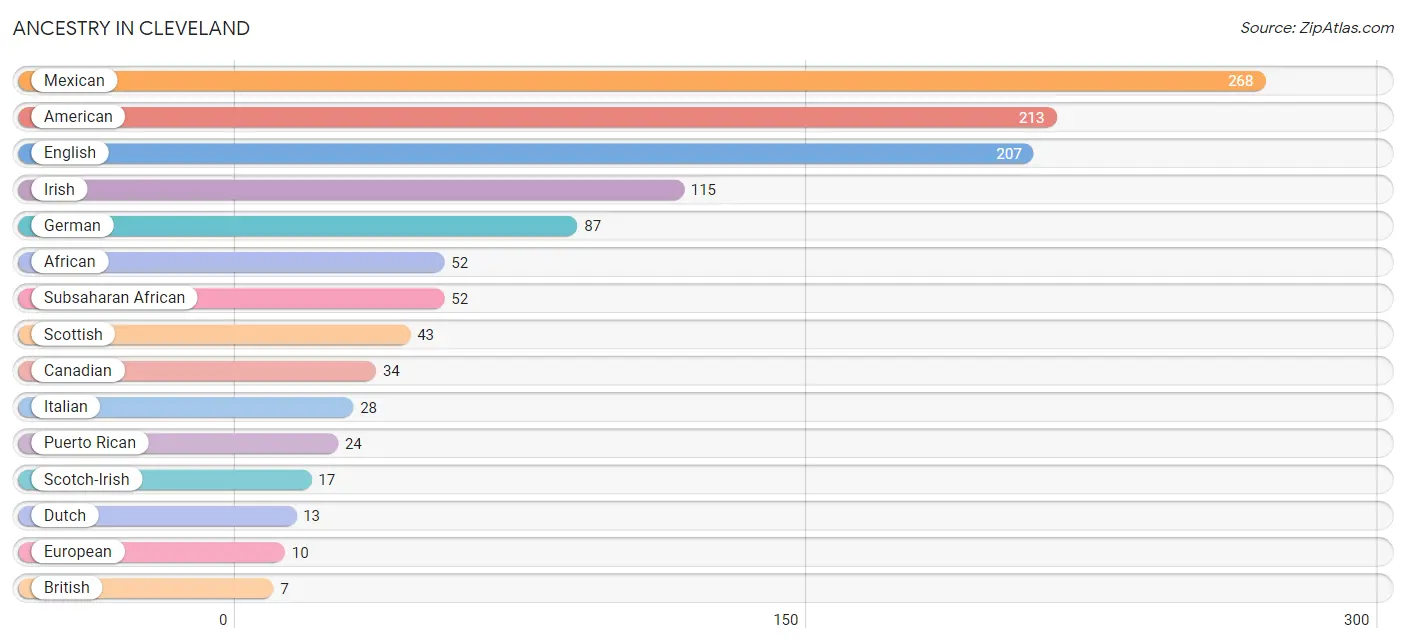
| Ancestry | # Population | % Population |
| African | 52 | 4.2% |
| American | 213 | 17.0% |
| British | 7 | 0.6% |
| Burmese | 6 | 0.5% |
| Canadian | 34 | 2.7% |
| Cherokee | 3 | 0.2% |
| Dutch | 13 | 1.0% |
| English | 207 | 16.5% |
| European | 10 | 0.8% |
| French Canadian | 4 | 0.3% |
| German | 87 | 7.0% |
| Irish | 115 | 9.2% |
| Italian | 28 | 2.2% |
| Mexican | 268 | 21.4% |
| Polish | 3 | 0.2% |
| Puerto Rican | 24 | 1.9% |
| Russian | 3 | 0.2% |
| Scotch-Irish | 17 | 1.4% |
| Scottish | 43 | 3.4% |
| Subsaharan African | 52 | 4.2% |
| Swedish | 3 | 0.2% |
| Thai | 3 | 0.2% | View All 22 Rows |
Immigrants in Cleveland
The most numerous immigrant groups reported in Cleveland came from Central America (168 | 13.4%), Latin America (168 | 13.4%), Mexico (168 | 13.4%), Asia (3 | 0.2%), and Kazakhstan (3 | 0.2%), together accounting for 40.7% of all Cleveland residents.
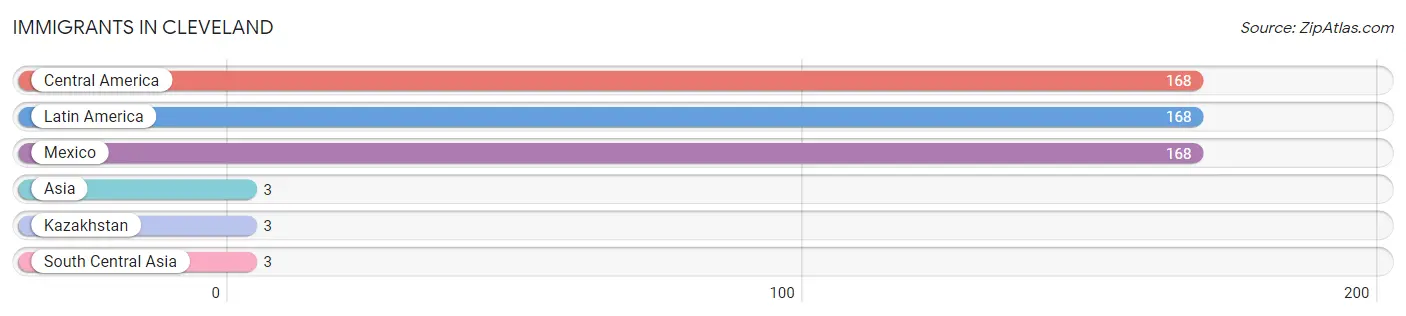
| Immigration Origin | # Population | % Population |
| Asia | 3 | 0.2% |
| Central America | 168 | 13.4% |
| Kazakhstan | 3 | 0.2% |
| Latin America | 168 | 13.4% |
| Mexico | 168 | 13.4% |
| South Central Asia | 3 | 0.2% | View All 6 Rows |
Sex and Age in Cleveland
Sex and Age in Cleveland
The most populous age groups in Cleveland are 15 to 19 Years (85 | 13.9%) for men and Under 5 Years (66 | 10.3%) for women.
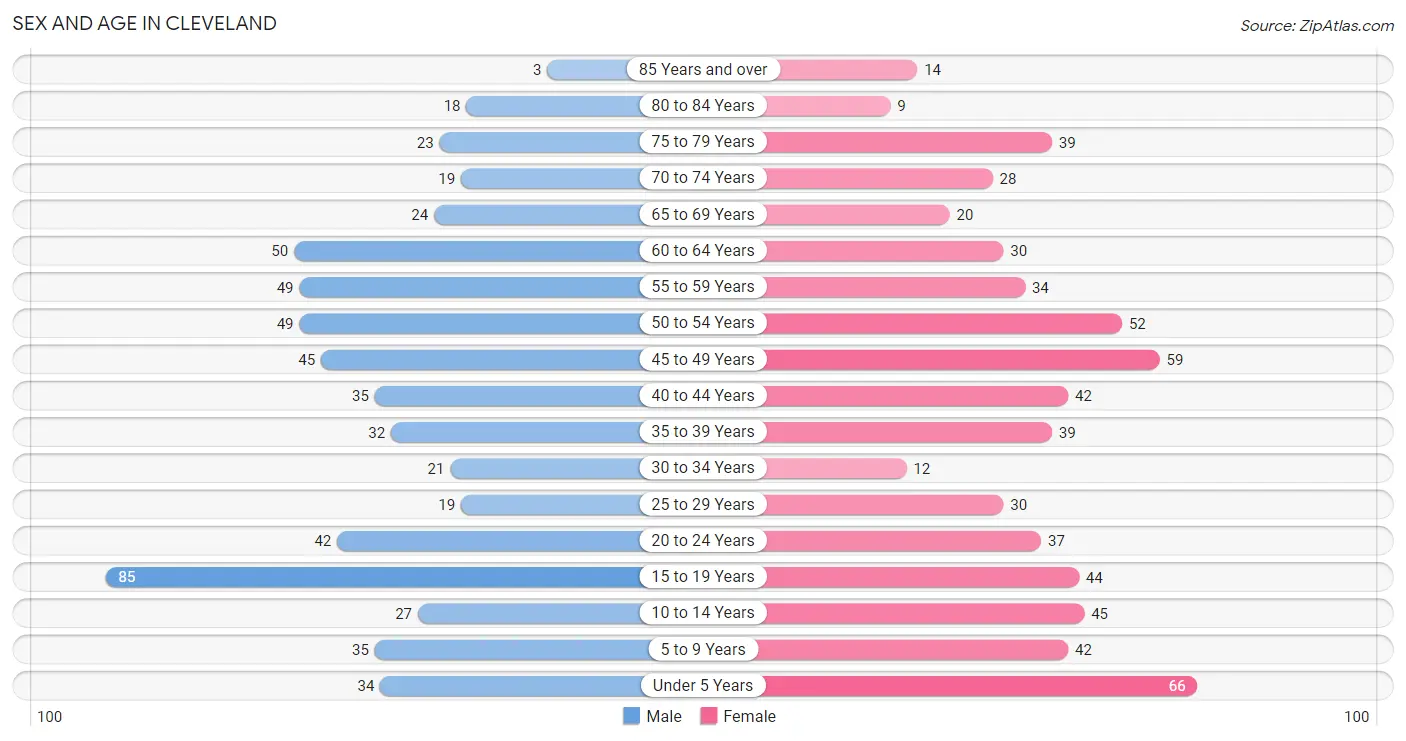
| Age Bracket | Male | Female |
| Under 5 Years | 34 (5.6%) | 66 (10.3%) |
| 5 to 9 Years | 35 (5.7%) | 42 (6.5%) |
| 10 to 14 Years | 27 (4.4%) | 45 (7.0%) |
| 15 to 19 Years | 85 (13.9%) | 44 (6.9%) |
| 20 to 24 Years | 42 (6.9%) | 37 (5.8%) |
| 25 to 29 Years | 19 (3.1%) | 30 (4.7%) |
| 30 to 34 Years | 21 (3.4%) | 12 (1.9%) |
| 35 to 39 Years | 32 (5.2%) | 39 (6.1%) |
| 40 to 44 Years | 35 (5.7%) | 42 (6.5%) |
| 45 to 49 Years | 45 (7.4%) | 59 (9.2%) |
| 50 to 54 Years | 49 (8.0%) | 52 (8.1%) |
| 55 to 59 Years | 49 (8.0%) | 34 (5.3%) |
| 60 to 64 Years | 50 (8.2%) | 30 (4.7%) |
| 65 to 69 Years | 24 (3.9%) | 20 (3.1%) |
| 70 to 74 Years | 19 (3.1%) | 28 (4.4%) |
| 75 to 79 Years | 23 (3.8%) | 39 (6.1%) |
| 80 to 84 Years | 18 (2.9%) | 9 (1.4%) |
| 85 Years and over | 3 (0.5%) | 14 (2.2%) |
| Total | 610 (100.0%) | 642 (100.0%) |
Families and Households in Cleveland
Median Family Size in Cleveland
The median family size in Cleveland is 3.05 persons per family, with single female/mother families (57 | 15.4%) accounting for the largest median family size of 3.4 persons per family. On the other hand, married-couple families (301 | 81.1%) represent the smallest median family size with 2.99 persons per family.
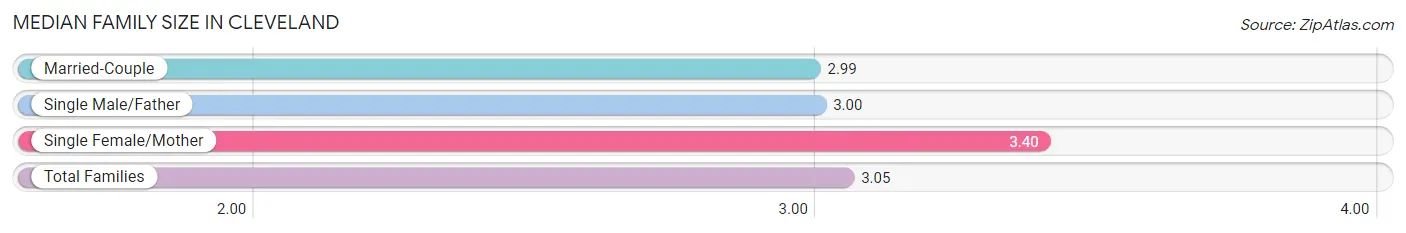
| Family Type | # Families | Family Size |
| Married-Couple | 301 (81.1%) | 2.99 |
| Single Male/Father | 13 (3.5%) | 3.00 |
| Single Female/Mother | 57 (15.4%) | 3.40 |
| Total Families | 371 (100.0%) | 3.05 |
Median Household Size in Cleveland
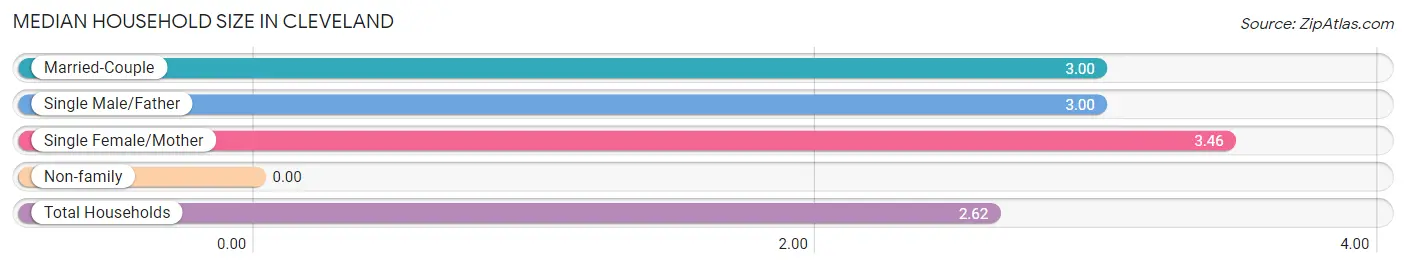
| Household Type | # Households | Household Size |
| Married-Couple | 301 (63.4%) | 3.00 |
| Single Male/Father | 13 (2.7%) | 3.00 |
| Single Female/Mother | 57 (12.0%) | 3.46 |
| Non-family | 104 (21.9%) | - |
| Total Households | 475 (100.0%) | 2.62 |
Household Size by Marriage Status in Cleveland
Out of a total of 475 households in Cleveland, 371 (78.1%) are family households, while 104 (21.9%) are nonfamily households. The most numerous type of family households are 2-person households, comprising 142, and the most common type of nonfamily households are 1-person households, comprising 104.
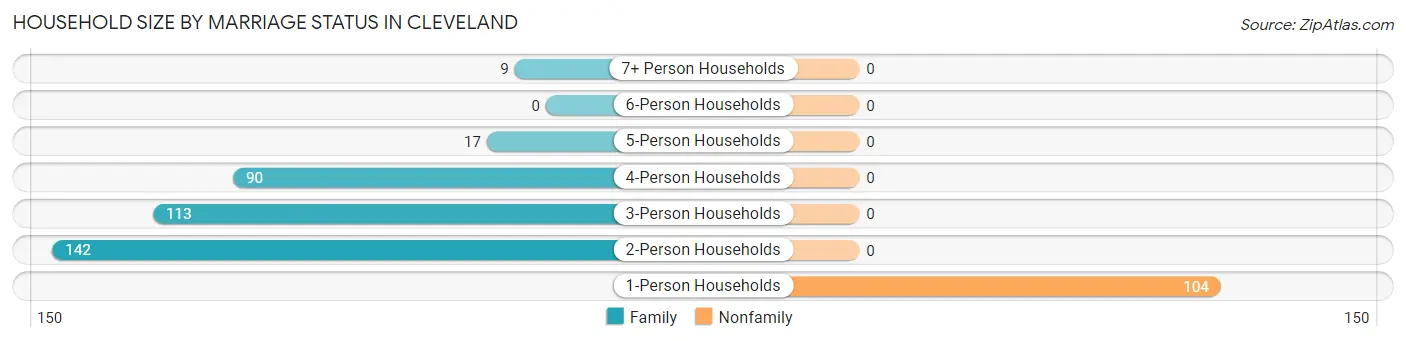
| Household Size | Family Households | Nonfamily Households |
| 1-Person Households | - | 104 (21.9%) |
| 2-Person Households | 142 (29.9%) | 0 (0.0%) |
| 3-Person Households | 113 (23.8%) | 0 (0.0%) |
| 4-Person Households | 90 (19.0%) | 0 (0.0%) |
| 5-Person Households | 17 (3.6%) | 0 (0.0%) |
| 6-Person Households | 0 (0.0%) | 0 (0.0%) |
| 7+ Person Households | 9 (1.9%) | 0 (0.0%) |
| Total | 371 (78.1%) | 104 (21.9%) |
Female Fertility in Cleveland
Fertility by Age in Cleveland
Average fertility rate in Cleveland is 26.0 births per 1,000 women. Women in the age bracket of 20 to 34 years have the highest fertility rate with 76.0 births per 1,000 women. Women in the age bracket of 20 to 34 years acount for 85.7% of all women with births.
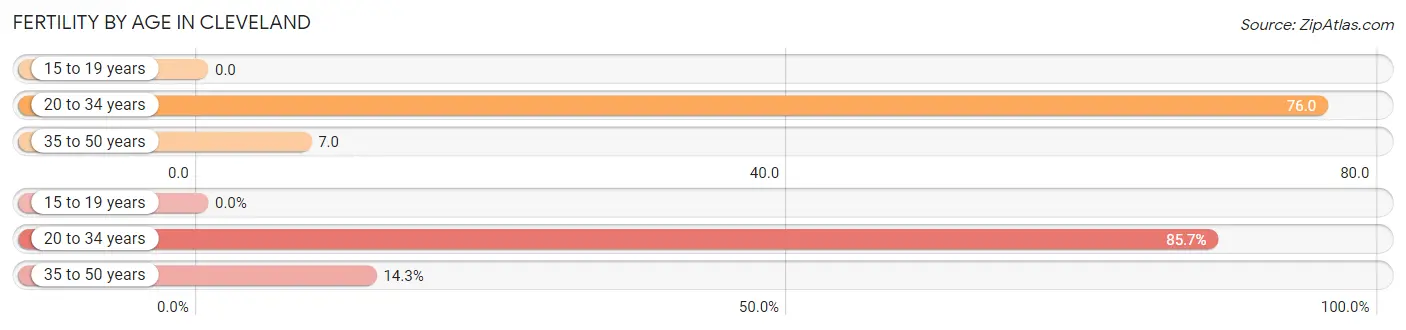
| Age Bracket | Women with Births | Births / 1,000 Women |
| 15 to 19 years | 0 (0.0%) | 0.0 |
| 20 to 34 years | 6 (85.7%) | 76.0 |
| 35 to 50 years | 1 (14.3%) | 7.0 |
| Total | 7 (100.0%) | 26.0 |
Fertility by Age by Marriage Status in Cleveland
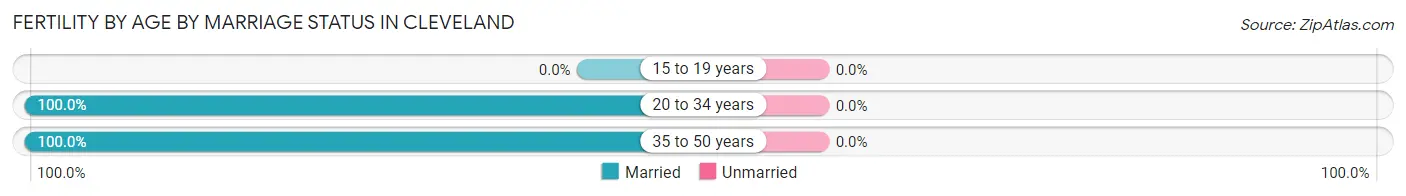
| Age Bracket | Married | Unmarried |
| 15 to 19 years | 0 (0.0%) | 0 (0.0%) |
| 20 to 34 years | 6 (100.0%) | 0 (0.0%) |
| 35 to 50 years | 1 (100.0%) | 0 (0.0%) |
| Total | 7 (100.0%) | 0 (0.0%) |
Fertility by Education in Cleveland
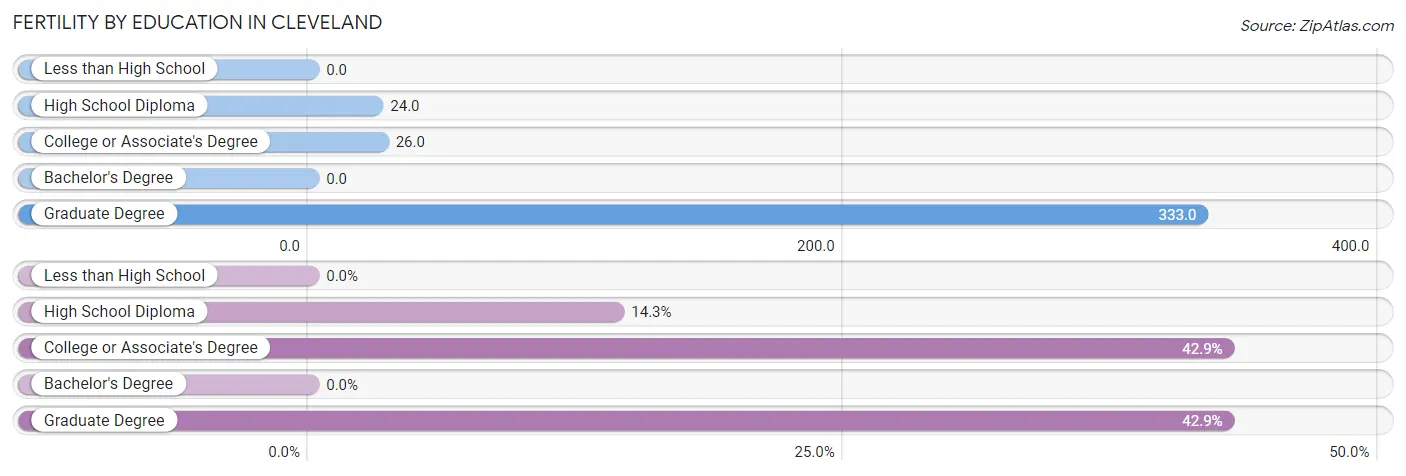
| Educational Attainment | Women with Births | Births / 1,000 Women |
| Less than High School | 0 (0.0%) | 0.0 |
| High School Diploma | 1 (14.3%) | 24.0 |
| College or Associate's Degree | 3 (42.9%) | 26.0 |
| Bachelor's Degree | 0 (0.0%) | 0.0 |
| Graduate Degree | 3 (42.9%) | 333.0 |
| Total | 7 (100.0%) | 26.0 |
Fertility by Education by Marriage Status in Cleveland
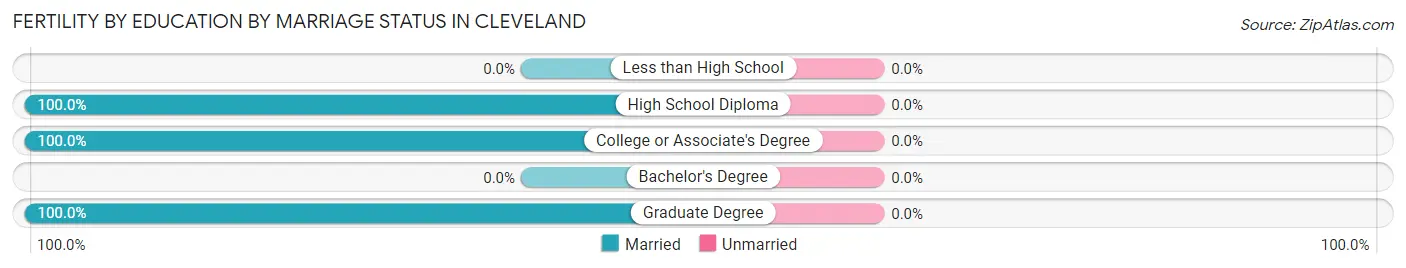
| Educational Attainment | Married | Unmarried |
| Less than High School | 0 (0.0%) | 0 (0.0%) |
| High School Diploma | 1 (100.0%) | 0 (0.0%) |
| College or Associate's Degree | 3 (100.0%) | 0 (0.0%) |
| Bachelor's Degree | 0 (0.0%) | 0 (0.0%) |
| Graduate Degree | 3 (100.0%) | 0 (0.0%) |
| Total | 7 (100.0%) | 0 (0.0%) |
Employment Characteristics in Cleveland
Employment by Class of Employer in Cleveland
Among the 567 employed individuals in Cleveland, private company employees (379 | 66.8%), local government employees (71 | 12.5%), and self-employed (not incorporated) (41 | 7.2%) make up the most common classes of employment.
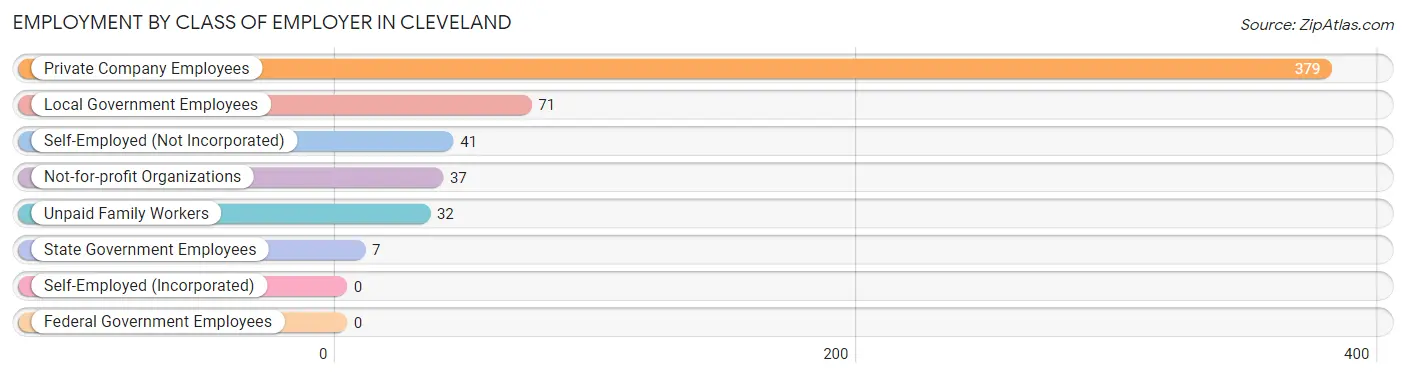
| Employer Class | # Employees | % Employees |
| Private Company Employees | 379 | 66.8% |
| Self-Employed (Incorporated) | 0 | 0.0% |
| Self-Employed (Not Incorporated) | 41 | 7.2% |
| Not-for-profit Organizations | 37 | 6.5% |
| Local Government Employees | 71 | 12.5% |
| State Government Employees | 7 | 1.2% |
| Federal Government Employees | 0 | 0.0% |
| Unpaid Family Workers | 32 | 5.6% |
| Total | 567 | 100.0% |
Employment Status by Age in Cleveland
According to the labor force statistics for Cleveland, out of the total population over 16 years of age (955), 65.4% or 625 individuals are in the labor force, with 6.2% or 39 of them unemployed. The age group with the highest labor force participation rate is 25 to 29 years, with 91.8% or 45 individuals in the labor force. Within the labor force, the 16 to 19 years age range has the highest percentage of unemployed individuals, with 52.6% or 10 of them being unemployed.
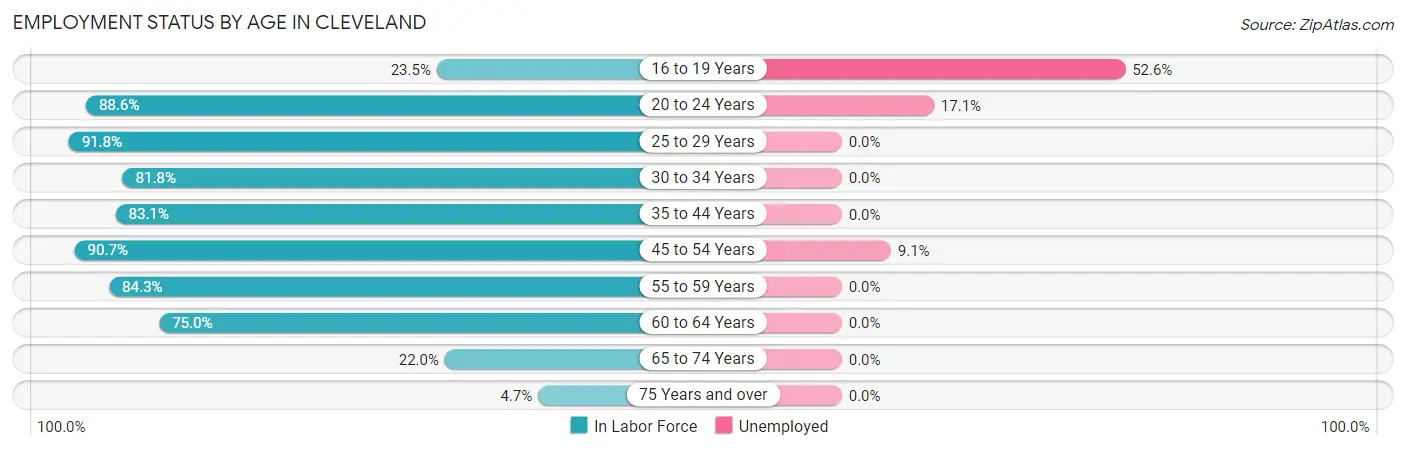
| Age Bracket | In Labor Force | Unemployed |
| 16 to 19 Years | 19 (23.5%) | 10 (52.6%) |
| 20 to 24 Years | 70 (88.6%) | 12 (17.1%) |
| 25 to 29 Years | 45 (91.8%) | 0 (0.0%) |
| 30 to 34 Years | 27 (81.8%) | 0 (0.0%) |
| 35 to 44 Years | 123 (83.1%) | 0 (0.0%) |
| 45 to 54 Years | 186 (90.7%) | 17 (9.1%) |
| 55 to 59 Years | 70 (84.3%) | 0 (0.0%) |
| 60 to 64 Years | 60 (75.0%) | 0 (0.0%) |
| 65 to 74 Years | 20 (22.0%) | 0 (0.0%) |
| 75 Years and over | 5 (4.7%) | 0 (0.0%) |
| Total | 625 (65.4%) | 39 (6.2%) |
Employment Status by Educational Attainment in Cleveland
According to labor force statistics for Cleveland, 85.5% of individuals (511) out of the total population between 25 and 64 years of age (598) are in the labor force, with 3.3% or 17 of them being unemployed. The group with the highest labor force participation rate are those with the educational attainment of bachelor's degree or higher, with 94.8% or 91 individuals in the labor force. Within the labor force, individuals with college / associate degree education have the highest percentage of unemployment, with 10.6% or 17 of them being unemployed.
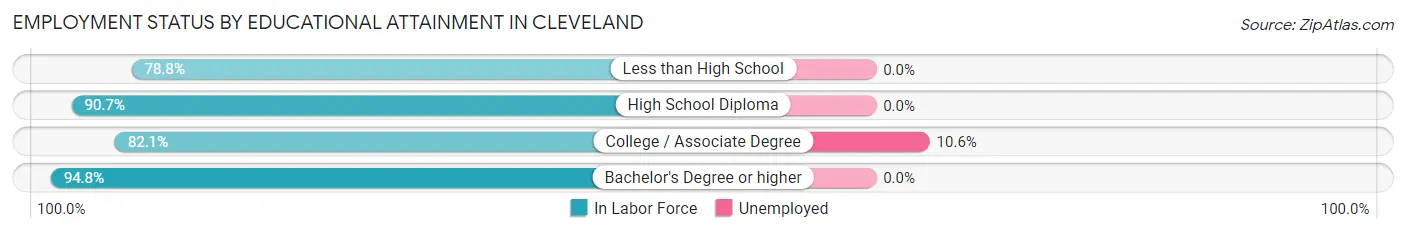
| Educational Attainment | In Labor Force | Unemployed |
| Less than High School | 123 (78.8%) | 0 (0.0%) |
| High School Diploma | 136 (90.7%) | 0 (0.0%) |
| College / Associate Degree | 161 (82.1%) | 21 (10.6%) |
| Bachelor's Degree or higher | 91 (94.8%) | 0 (0.0%) |
| Total | 511 (85.5%) | 20 (3.3%) |
Employment Occupations by Sex in Cleveland
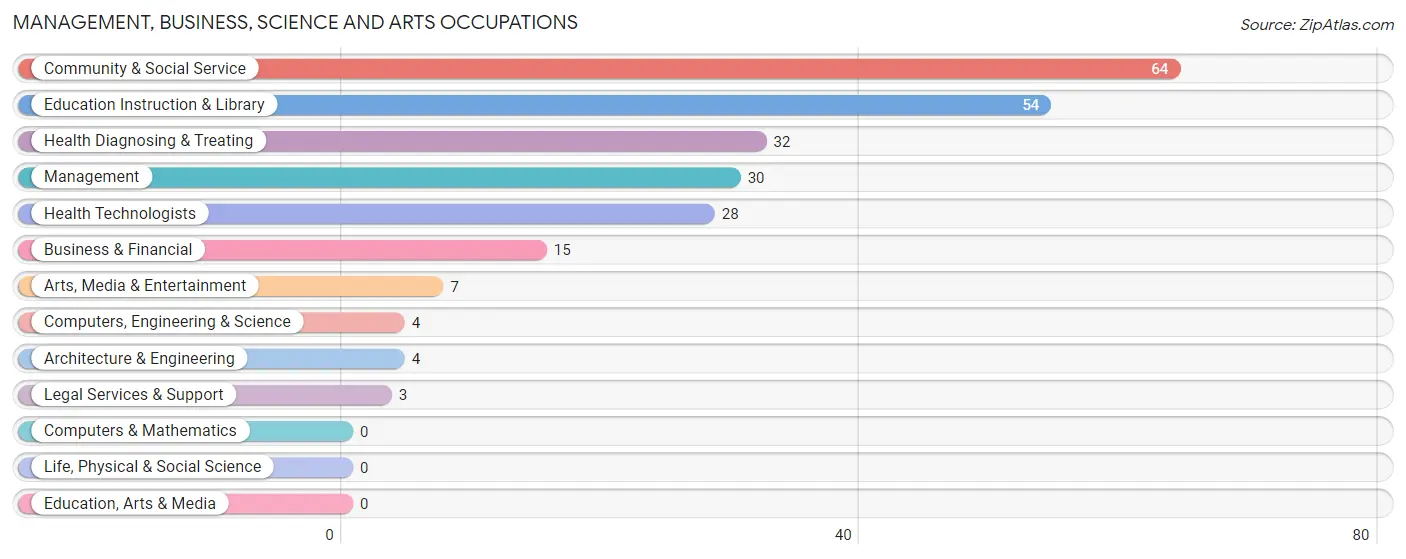
Management, Business, Science and Arts Occupations
The most common Management, Business, Science and Arts occupations in Cleveland are Community & Social Service (64 | 10.9%), Education Instruction & Library (54 | 9.2%), Health Diagnosing & Treating (32 | 5.5%), Management (30 | 5.1%), and Health Technologists (28 | 4.8%).
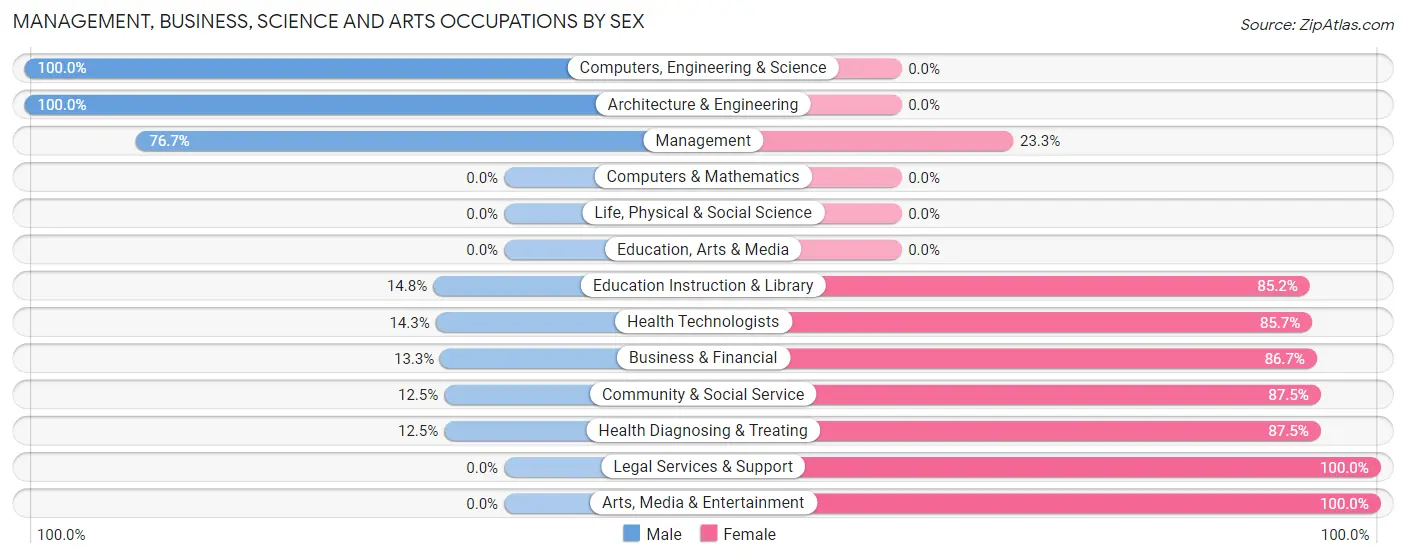
Management, Business, Science and Arts Occupations by Sex
Within the Management, Business, Science and Arts occupations in Cleveland, the most male-oriented occupations are Computers, Engineering & Science (100.0%), Architecture & Engineering (100.0%), and Management (76.7%), while the most female-oriented occupations are Legal Services & Support (100.0%), Arts, Media & Entertainment (100.0%), and Community & Social Service (87.5%).
| Occupation | Male | Female |
| Management | 23 (76.7%) | 7 (23.3%) |
| Business & Financial | 2 (13.3%) | 13 (86.7%) |
| Computers, Engineering & Science | 4 (100.0%) | 0 (0.0%) |
| Computers & Mathematics | 0 (0.0%) | 0 (0.0%) |
| Architecture & Engineering | 4 (100.0%) | 0 (0.0%) |
| Life, Physical & Social Science | 0 (0.0%) | 0 (0.0%) |
| Community & Social Service | 8 (12.5%) | 56 (87.5%) |
| Education, Arts & Media | 0 (0.0%) | 0 (0.0%) |
| Legal Services & Support | 0 (0.0%) | 3 (100.0%) |
| Education Instruction & Library | 8 (14.8%) | 46 (85.2%) |
| Arts, Media & Entertainment | 0 (0.0%) | 7 (100.0%) |
| Health Diagnosing & Treating | 4 (12.5%) | 28 (87.5%) |
| Health Technologists | 4 (14.3%) | 24 (85.7%) |
| Total (Category) | 41 (28.3%) | 104 (71.7%) |
| Total (Overall) | 330 (56.3%) | 256 (43.7%) |
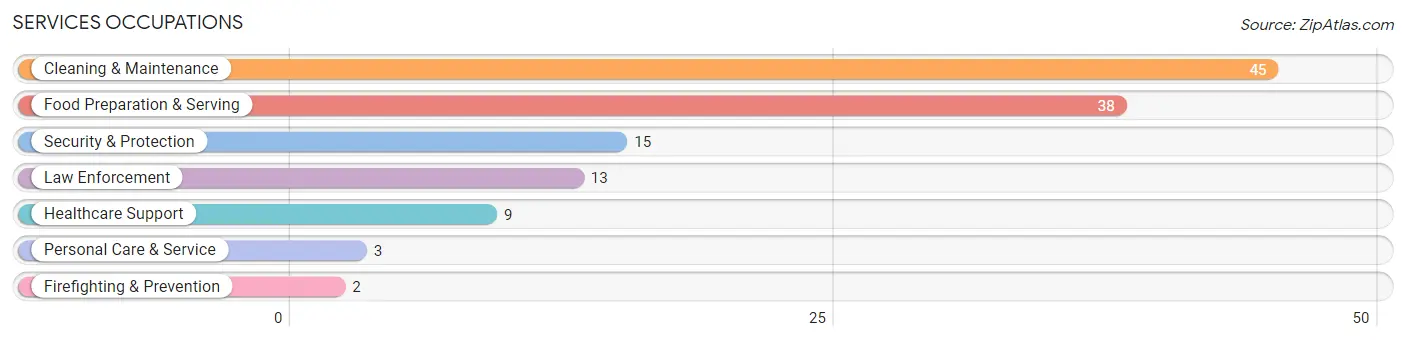
Services Occupations
The most common Services occupations in Cleveland are Cleaning & Maintenance (45 | 7.7%), Food Preparation & Serving (38 | 6.5%), Security & Protection (15 | 2.6%), Law Enforcement (13 | 2.2%), and Healthcare Support (9 | 1.5%).
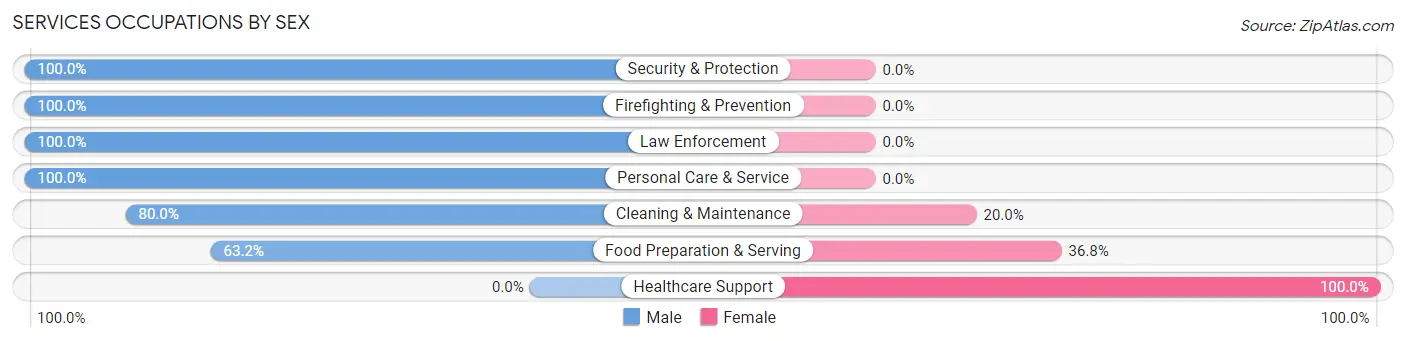
Services Occupations by Sex
Within the Services occupations in Cleveland, the most male-oriented occupations are Security & Protection (100.0%), Firefighting & Prevention (100.0%), and Law Enforcement (100.0%), while the most female-oriented occupations are Healthcare Support (100.0%), Food Preparation & Serving (36.8%), and Cleaning & Maintenance (20.0%).
| Occupation | Male | Female |
| Healthcare Support | 0 (0.0%) | 9 (100.0%) |
| Security & Protection | 15 (100.0%) | 0 (0.0%) |
| Firefighting & Prevention | 2 (100.0%) | 0 (0.0%) |
| Law Enforcement | 13 (100.0%) | 0 (0.0%) |
| Food Preparation & Serving | 24 (63.2%) | 14 (36.8%) |
| Cleaning & Maintenance | 36 (80.0%) | 9 (20.0%) |
| Personal Care & Service | 3 (100.0%) | 0 (0.0%) |
| Total (Category) | 78 (70.9%) | 32 (29.1%) |
| Total (Overall) | 330 (56.3%) | 256 (43.7%) |
Sales and Office Occupations
The most common Sales and Office occupations in Cleveland are Sales & Related (53 | 9.0%), and Office & Administration (48 | 8.2%).
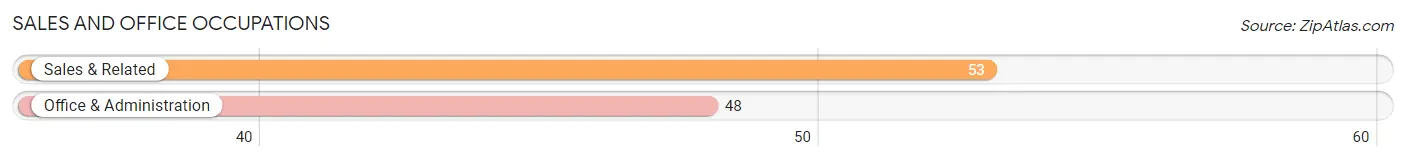
Sales and Office Occupations by Sex
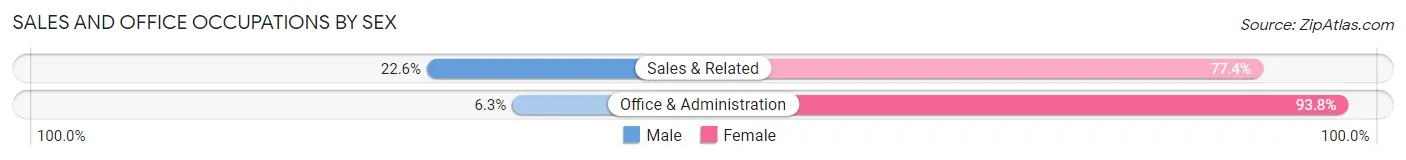
| Occupation | Male | Female |
| Sales & Related | 12 (22.6%) | 41 (77.4%) |
| Office & Administration | 3 (6.2%) | 45 (93.8%) |
| Total (Category) | 15 (14.8%) | 86 (85.2%) |
| Total (Overall) | 330 (56.3%) | 256 (43.7%) |
Natural Resources, Construction and Maintenance Occupations
The most common Natural Resources, Construction and Maintenance occupations in Cleveland are Construction & Extraction (49 | 8.4%), Installation, Maintenance & Repair (47 | 8.0%), and Farming, Fishing & Forestry (3 | 0.5%).
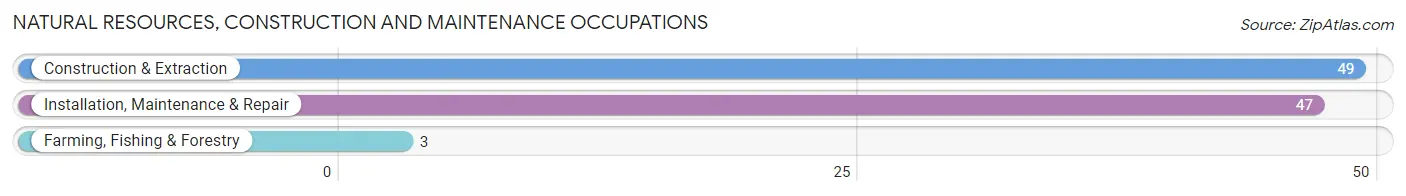
Natural Resources, Construction and Maintenance Occupations by Sex
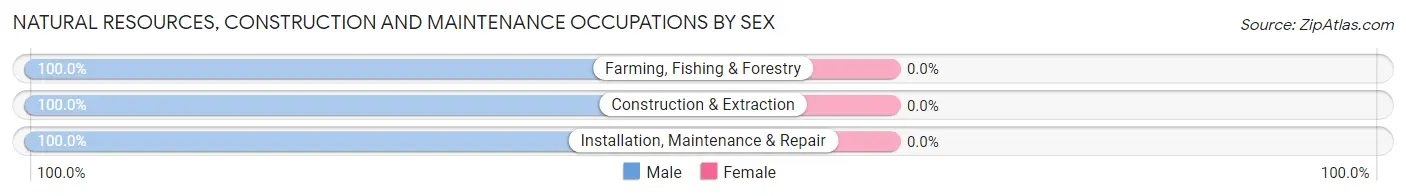
| Occupation | Male | Female |
| Farming, Fishing & Forestry | 3 (100.0%) | 0 (0.0%) |
| Construction & Extraction | 49 (100.0%) | 0 (0.0%) |
| Installation, Maintenance & Repair | 47 (100.0%) | 0 (0.0%) |
| Total (Category) | 99 (100.0%) | 0 (0.0%) |
| Total (Overall) | 330 (56.3%) | 256 (43.7%) |
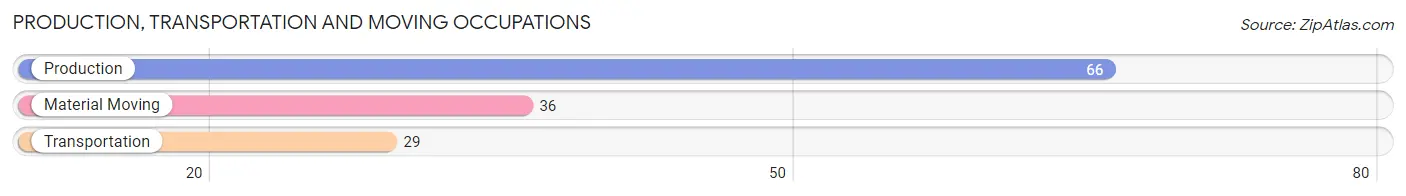
Production, Transportation and Moving Occupations
The most common Production, Transportation and Moving occupations in Cleveland are Production (66 | 11.3%), Material Moving (36 | 6.1%), and Transportation (29 | 5.0%).
Production, Transportation and Moving Occupations by Sex
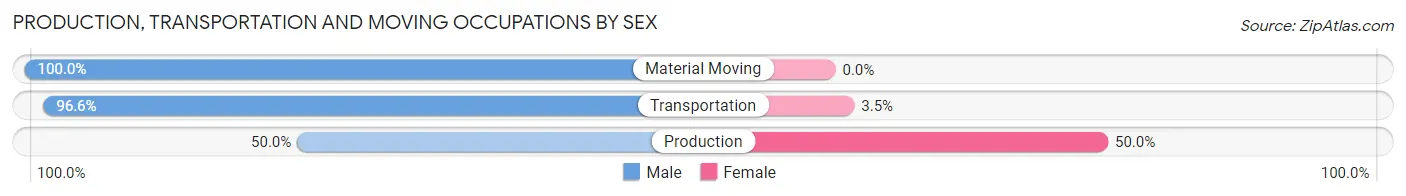
| Occupation | Male | Female |
| Production | 33 (50.0%) | 33 (50.0%) |
| Transportation | 28 (96.6%) | 1 (3.5%) |
| Material Moving | 36 (100.0%) | 0 (0.0%) |
| Total (Category) | 97 (74.1%) | 34 (26.0%) |
| Total (Overall) | 330 (56.3%) | 256 (43.7%) |
Employment Industries by Sex in Cleveland
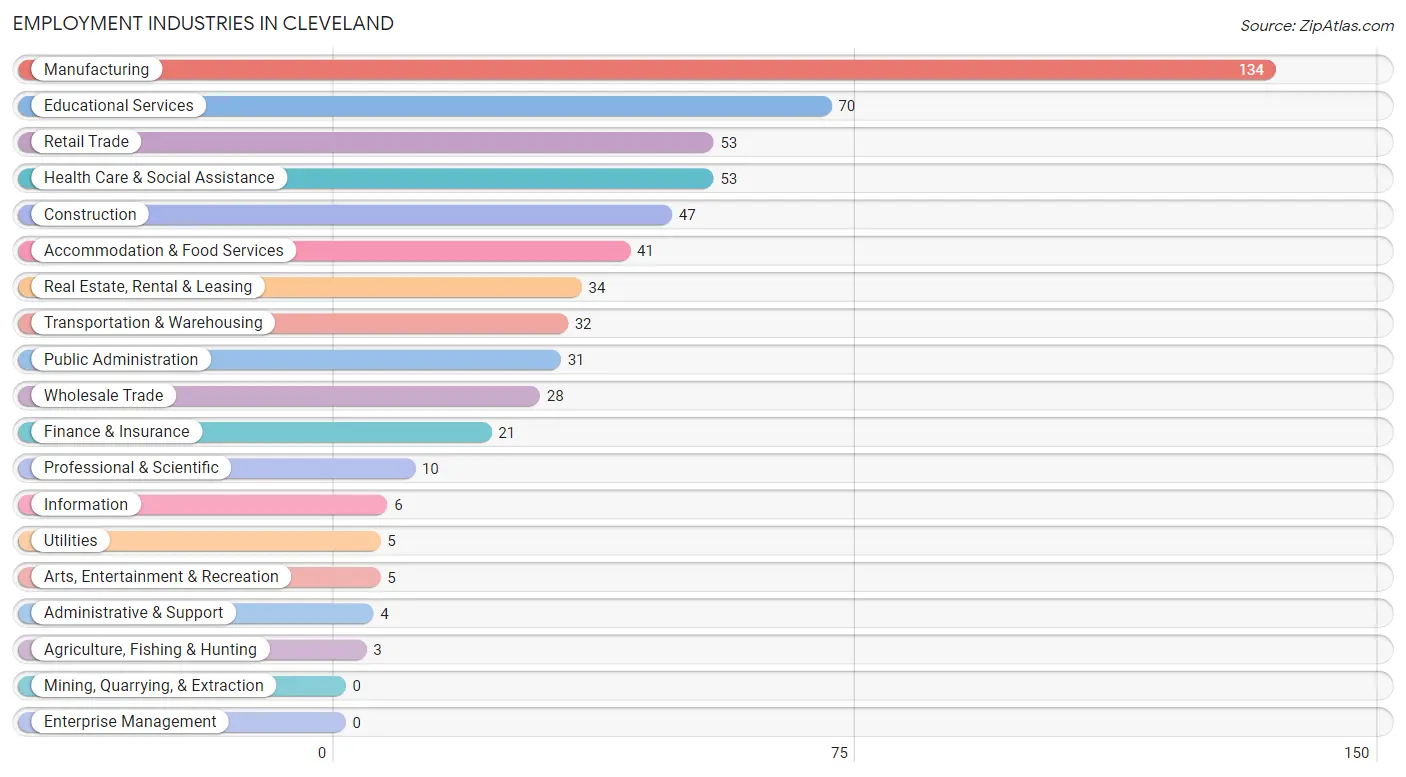
Employment Industries in Cleveland
The major employment industries in Cleveland include Manufacturing (134 | 22.9%), Educational Services (70 | 11.9%), Retail Trade (53 | 9.0%), Health Care & Social Assistance (53 | 9.0%), and Construction (47 | 8.0%).
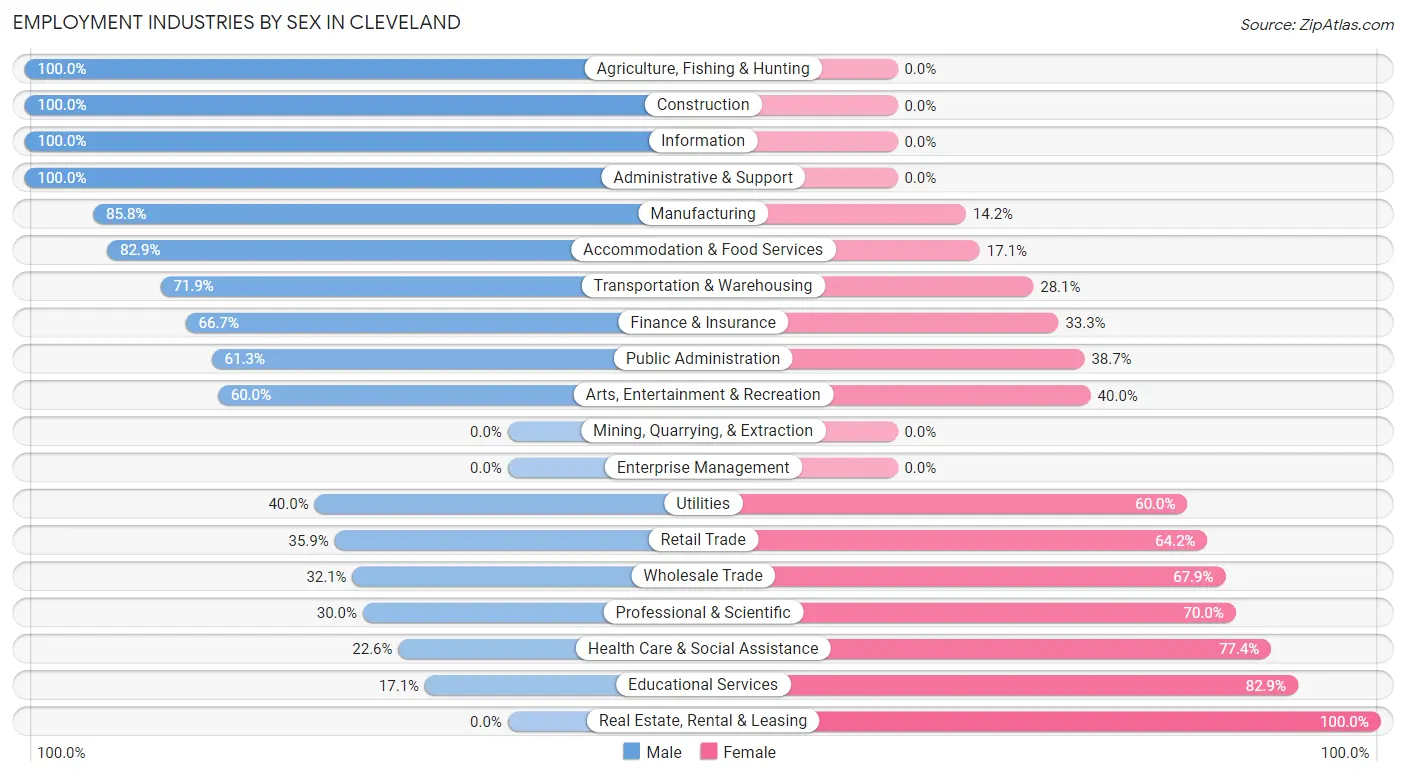
Employment Industries by Sex in Cleveland
The Cleveland industries that see more men than women are Agriculture, Fishing & Hunting (100.0%), Construction (100.0%), and Information (100.0%), whereas the industries that tend to have a higher number of women are Real Estate, Rental & Leasing (100.0%), Educational Services (82.9%), and Health Care & Social Assistance (77.4%).
| Industry | Male | Female |
| Agriculture, Fishing & Hunting | 3 (100.0%) | 0 (0.0%) |
| Mining, Quarrying, & Extraction | 0 (0.0%) | 0 (0.0%) |
| Construction | 47 (100.0%) | 0 (0.0%) |
| Manufacturing | 115 (85.8%) | 19 (14.2%) |
| Wholesale Trade | 9 (32.1%) | 19 (67.9%) |
| Retail Trade | 19 (35.8%) | 34 (64.1%) |
| Transportation & Warehousing | 23 (71.9%) | 9 (28.1%) |
| Utilities | 2 (40.0%) | 3 (60.0%) |
| Information | 6 (100.0%) | 0 (0.0%) |
| Finance & Insurance | 14 (66.7%) | 7 (33.3%) |
| Real Estate, Rental & Leasing | 0 (0.0%) | 34 (100.0%) |
| Professional & Scientific | 3 (30.0%) | 7 (70.0%) |
| Enterprise Management | 0 (0.0%) | 0 (0.0%) |
| Administrative & Support | 4 (100.0%) | 0 (0.0%) |
| Educational Services | 12 (17.1%) | 58 (82.9%) |
| Health Care & Social Assistance | 12 (22.6%) | 41 (77.4%) |
| Arts, Entertainment & Recreation | 3 (60.0%) | 2 (40.0%) |
| Accommodation & Food Services | 34 (82.9%) | 7 (17.1%) |
| Public Administration | 19 (61.3%) | 12 (38.7%) |
| Total | 330 (56.3%) | 256 (43.7%) |
Education in Cleveland
School Enrollment in Cleveland
The most common levels of schooling among the 298 students in Cleveland are high school (109 | 36.6%), elementary school (77 | 25.8%), and middle school (72 | 24.2%).
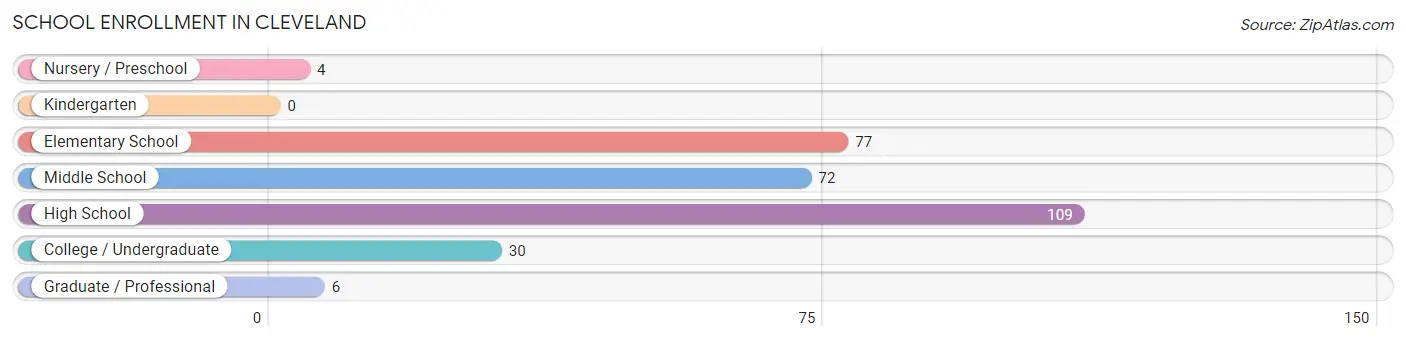
| School Level | # Students | % Students |
| Nursery / Preschool | 4 | 1.3% |
| Kindergarten | 0 | 0.0% |
| Elementary School | 77 | 25.8% |
| Middle School | 72 | 24.2% |
| High School | 109 | 36.6% |
| College / Undergraduate | 30 | 10.1% |
| Graduate / Professional | 6 | 2.0% |
| Total | 298 | 100.0% |
School Enrollment by Age by Funding Source in Cleveland
Out of a total of 298 students who are enrolled in schools in Cleveland, 6 (2.0%) attend a private institution, while the remaining 292 (98.0%) are enrolled in public schools. The age group of 35 years and over has the highest likelihood of being enrolled in private schools, with 3 (10.3% in the age bracket) enrolled. Conversely, the age group of 3 to 4 year olds has the lowest likelihood of being enrolled in a private school, with 4 (100.0% in the age bracket) attending a public institution.
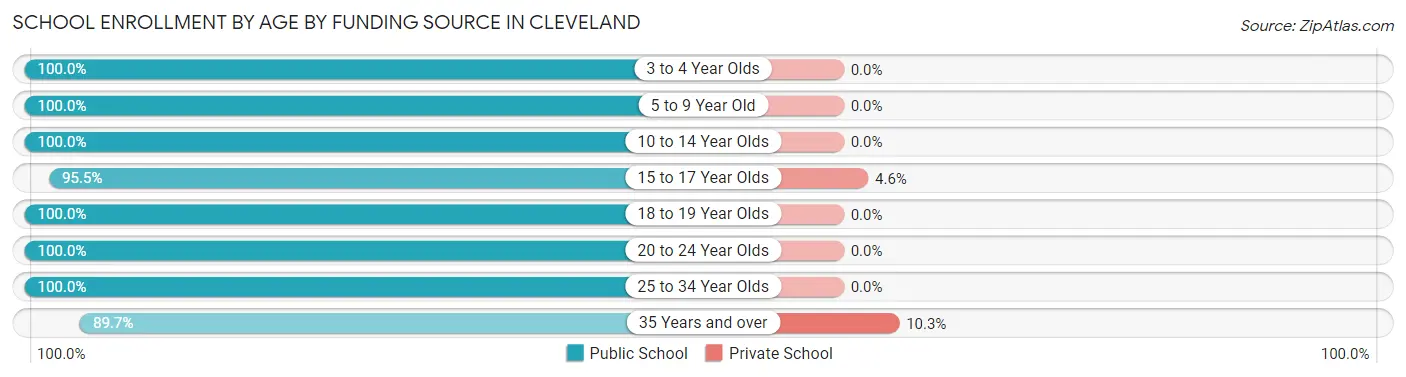
| Age Bracket | Public School | Private School |
| 3 to 4 Year Olds | 4 (100.0%) | 0 (0.0%) |
| 5 to 9 Year Old | 77 (100.0%) | 0 (0.0%) |
| 10 to 14 Year Olds | 69 (100.0%) | 0 (0.0%) |
| 15 to 17 Year Olds | 63 (95.5%) | 3 (4.5%) |
| 18 to 19 Year Olds | 29 (100.0%) | 0 (0.0%) |
| 20 to 24 Year Olds | 17 (100.0%) | 0 (0.0%) |
| 25 to 34 Year Olds | 7 (100.0%) | 0 (0.0%) |
| 35 Years and over | 26 (89.7%) | 3 (10.3%) |
| Total | 292 (98.0%) | 6 (2.0%) |
Educational Attainment by Field of Study in Cleveland
Business (46 | 40.7%), education (35 | 31.0%), engineering (19 | 16.8%), literature & languages (4 | 3.5%), and psychology (3 | 2.6%) are the most common fields of study among 113 individuals in Cleveland who have obtained a bachelor's degree or higher.
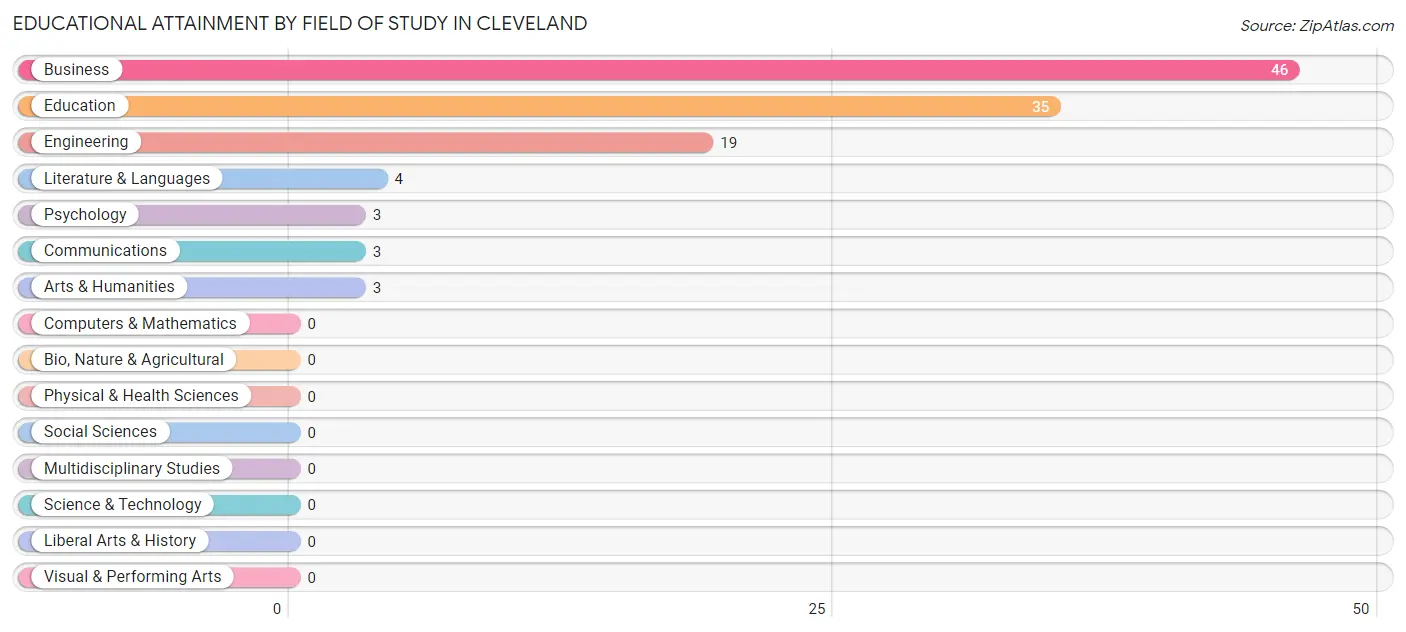
| Field of Study | # Graduates | % Graduates |
| Computers & Mathematics | 0 | 0.0% |
| Bio, Nature & Agricultural | 0 | 0.0% |
| Physical & Health Sciences | 0 | 0.0% |
| Psychology | 3 | 2.6% |
| Social Sciences | 0 | 0.0% |
| Engineering | 19 | 16.8% |
| Multidisciplinary Studies | 0 | 0.0% |
| Science & Technology | 0 | 0.0% |
| Business | 46 | 40.7% |
| Education | 35 | 31.0% |
| Literature & Languages | 4 | 3.5% |
| Liberal Arts & History | 0 | 0.0% |
| Visual & Performing Arts | 0 | 0.0% |
| Communications | 3 | 2.6% |
| Arts & Humanities | 3 | 2.6% |
| Total | 113 | 100.0% |
Transportation & Commute in Cleveland
Vehicle Availability by Sex in Cleveland
The most prevalent vehicle ownership categories in Cleveland are males with 3 vehicles (97, accounting for 30.9%) and females with 3 vehicles (80, making up 38.8%).
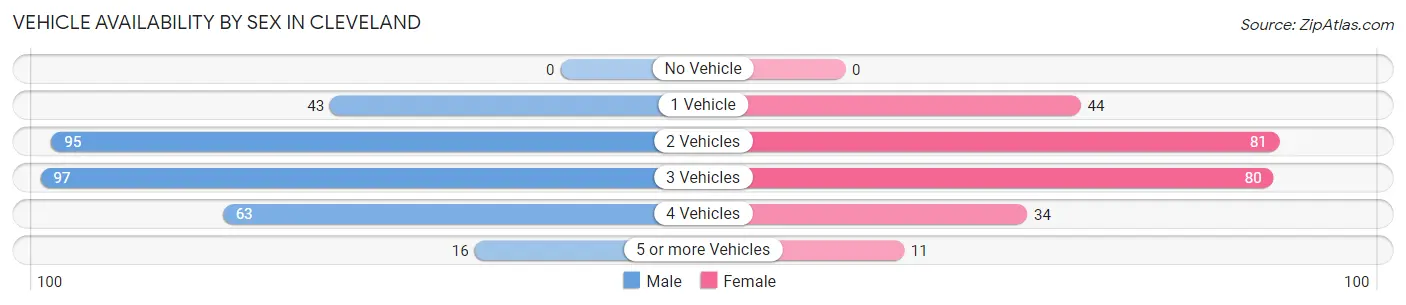
| Vehicles Available | Male | Female |
| No Vehicle | 0 (0.0%) | 0 (0.0%) |
| 1 Vehicle | 43 (13.7%) | 44 (17.6%) |
| 2 Vehicles | 95 (30.2%) | 81 (32.4%) |
| 3 Vehicles | 97 (30.9%) | 80 (32.0%) |
| 4 Vehicles | 63 (20.1%) | 34 (13.6%) |
| 5 or more Vehicles | 16 (5.1%) | 11 (4.4%) |
| Total | 314 (100.0%) | 250 (100.0%) |
Commute Time in Cleveland
The most frequently occuring commute durations in Cleveland are 15 to 19 minutes (152 commuters, 27.4%), 45 to 59 minutes (82 commuters, 14.8%), and 60 to 89 minutes (81 commuters, 14.6%).
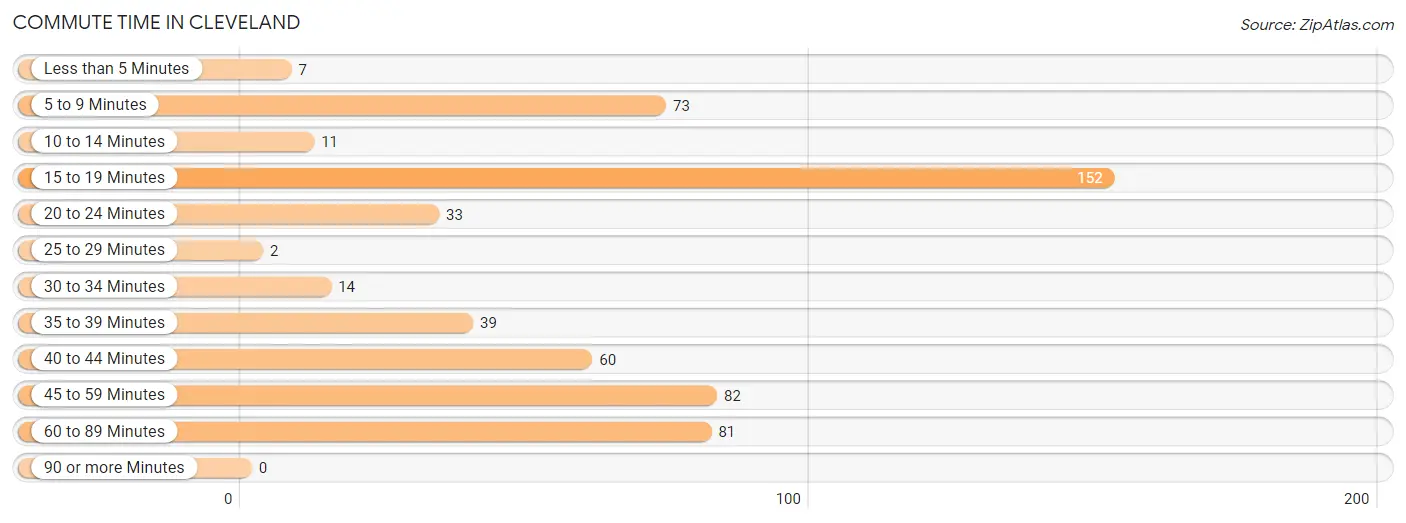
| Commute Time | # Commuters | % Commuters |
| Less than 5 Minutes | 7 | 1.3% |
| 5 to 9 Minutes | 73 | 13.2% |
| 10 to 14 Minutes | 11 | 2.0% |
| 15 to 19 Minutes | 152 | 27.4% |
| 20 to 24 Minutes | 33 | 6.0% |
| 25 to 29 Minutes | 2 | 0.4% |
| 30 to 34 Minutes | 14 | 2.5% |
| 35 to 39 Minutes | 39 | 7.0% |
| 40 to 44 Minutes | 60 | 10.8% |
| 45 to 59 Minutes | 82 | 14.8% |
| 60 to 89 Minutes | 81 | 14.6% |
| 90 or more Minutes | 0 | 0.0% |
Commute Time by Sex in Cleveland
The most common commute times in Cleveland are 15 to 19 minutes (77 commuters, 24.6%) for males and 15 to 19 minutes (75 commuters, 31.1%) for females.
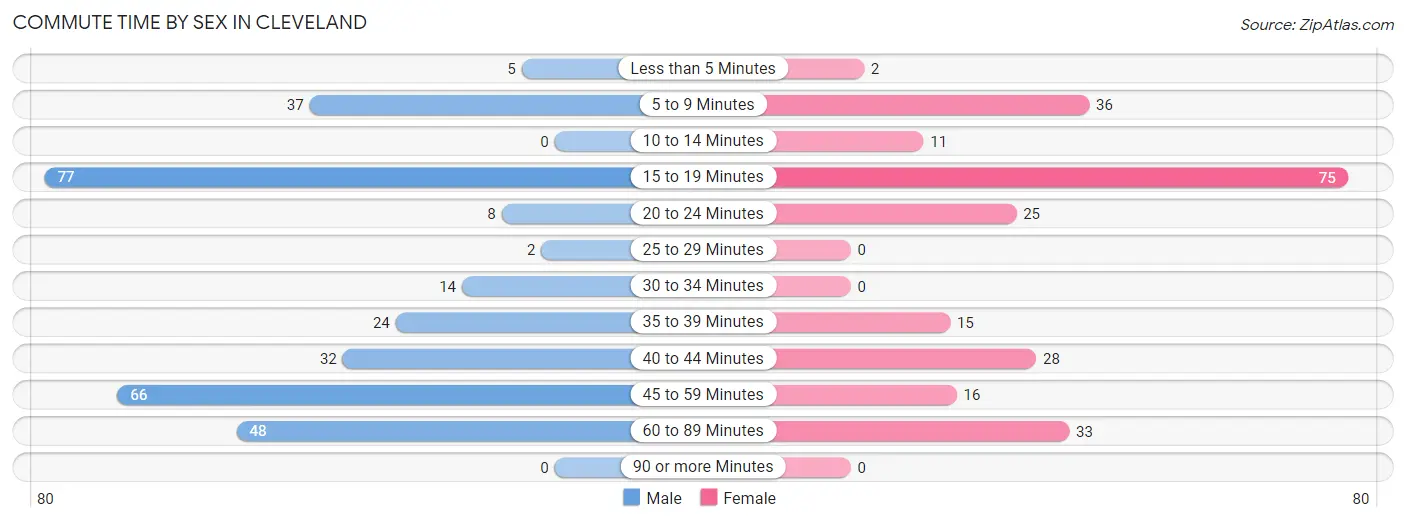
| Commute Time | Male | Female |
| Less than 5 Minutes | 5 (1.6%) | 2 (0.8%) |
| 5 to 9 Minutes | 37 (11.8%) | 36 (14.9%) |
| 10 to 14 Minutes | 0 (0.0%) | 11 (4.6%) |
| 15 to 19 Minutes | 77 (24.6%) | 75 (31.1%) |
| 20 to 24 Minutes | 8 (2.6%) | 25 (10.4%) |
| 25 to 29 Minutes | 2 (0.6%) | 0 (0.0%) |
| 30 to 34 Minutes | 14 (4.5%) | 0 (0.0%) |
| 35 to 39 Minutes | 24 (7.7%) | 15 (6.2%) |
| 40 to 44 Minutes | 32 (10.2%) | 28 (11.6%) |
| 45 to 59 Minutes | 66 (21.1%) | 16 (6.6%) |
| 60 to 89 Minutes | 48 (15.3%) | 33 (13.7%) |
| 90 or more Minutes | 0 (0.0%) | 0 (0.0%) |
Time of Departure to Work by Sex in Cleveland
The most frequent times of departure to work in Cleveland are 12:00 PM to 3:59 PM (71, 22.7%) for males and 5:00 AM to 5:29 AM (56, 23.2%) for females.
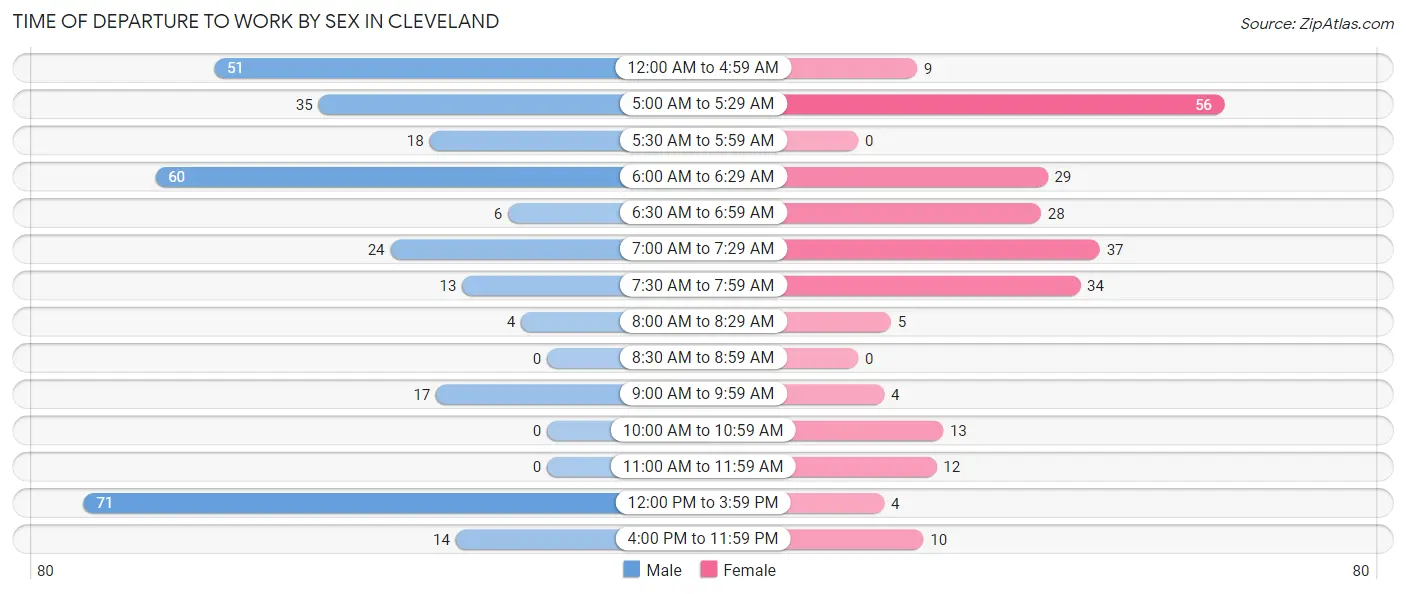
| Time of Departure | Male | Female |
| 12:00 AM to 4:59 AM | 51 (16.3%) | 9 (3.7%) |
| 5:00 AM to 5:29 AM | 35 (11.2%) | 56 (23.2%) |
| 5:30 AM to 5:59 AM | 18 (5.8%) | 0 (0.0%) |
| 6:00 AM to 6:29 AM | 60 (19.2%) | 29 (12.0%) |
| 6:30 AM to 6:59 AM | 6 (1.9%) | 28 (11.6%) |
| 7:00 AM to 7:29 AM | 24 (7.7%) | 37 (15.3%) |
| 7:30 AM to 7:59 AM | 13 (4.2%) | 34 (14.1%) |
| 8:00 AM to 8:29 AM | 4 (1.3%) | 5 (2.1%) |
| 8:30 AM to 8:59 AM | 0 (0.0%) | 0 (0.0%) |
| 9:00 AM to 9:59 AM | 17 (5.4%) | 4 (1.7%) |
| 10:00 AM to 10:59 AM | 0 (0.0%) | 13 (5.4%) |
| 11:00 AM to 11:59 AM | 0 (0.0%) | 12 (5.0%) |
| 12:00 PM to 3:59 PM | 71 (22.7%) | 4 (1.7%) |
| 4:00 PM to 11:59 PM | 14 (4.5%) | 10 (4.2%) |
| Total | 313 (100.0%) | 241 (100.0%) |
Housing Occupancy in Cleveland
Occupancy by Ownership in Cleveland
Of the total 475 dwellings in Cleveland, owner-occupied units account for 392 (82.5%), while renter-occupied units make up 83 (17.5%).
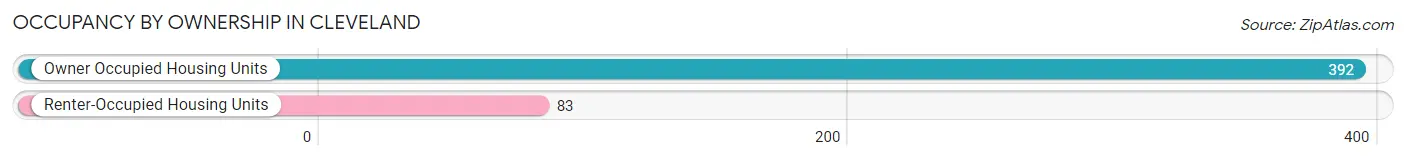
| Occupancy | # Housing Units | % Housing Units |
| Owner Occupied Housing Units | 392 | 82.5% |
| Renter-Occupied Housing Units | 83 | 17.5% |
| Total Occupied Housing Units | 475 | 100.0% |
Occupancy by Household Size in Cleveland
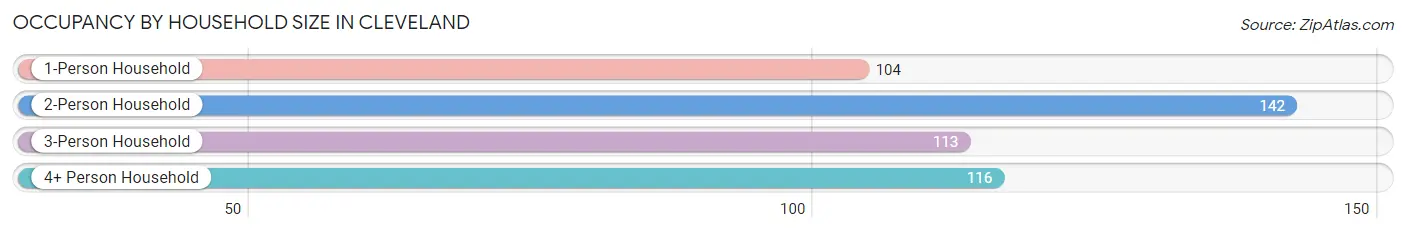
| Household Size | # Housing Units | % Housing Units |
| 1-Person Household | 104 | 21.9% |
| 2-Person Household | 142 | 29.9% |
| 3-Person Household | 113 | 23.8% |
| 4+ Person Household | 116 | 24.4% |
| Total Housing Units | 475 | 100.0% |
Occupancy by Ownership by Household Size in Cleveland
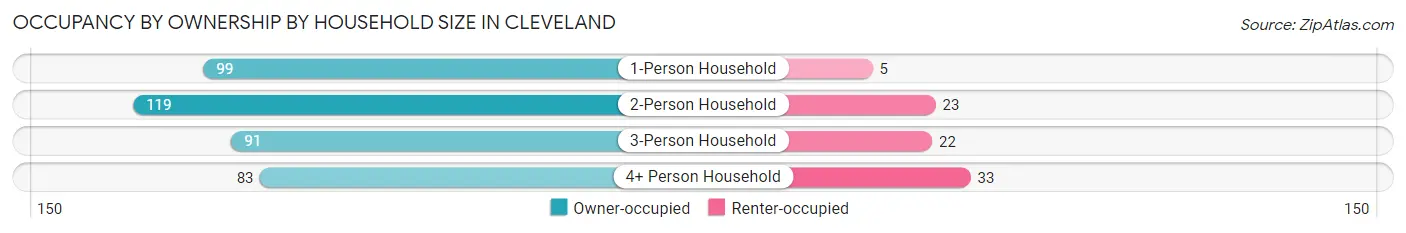
| Household Size | Owner-occupied | Renter-occupied |
| 1-Person Household | 99 (95.2%) | 5 (4.8%) |
| 2-Person Household | 119 (83.8%) | 23 (16.2%) |
| 3-Person Household | 91 (80.5%) | 22 (19.5%) |
| 4+ Person Household | 83 (71.6%) | 33 (28.4%) |
| Total Housing Units | 392 (82.5%) | 83 (17.5%) |
Occupancy by Educational Attainment in Cleveland
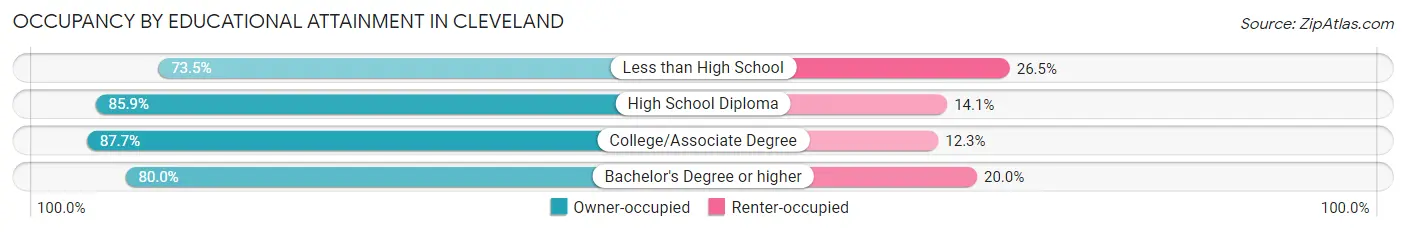
| Household Size | Owner-occupied | Renter-occupied |
| Less than High School | 86 (73.5%) | 31 (26.5%) |
| High School Diploma | 122 (85.9%) | 20 (14.1%) |
| College/Associate Degree | 128 (87.7%) | 18 (12.3%) |
| Bachelor's Degree or higher | 56 (80.0%) | 14 (20.0%) |
Occupancy by Age of Householder in Cleveland
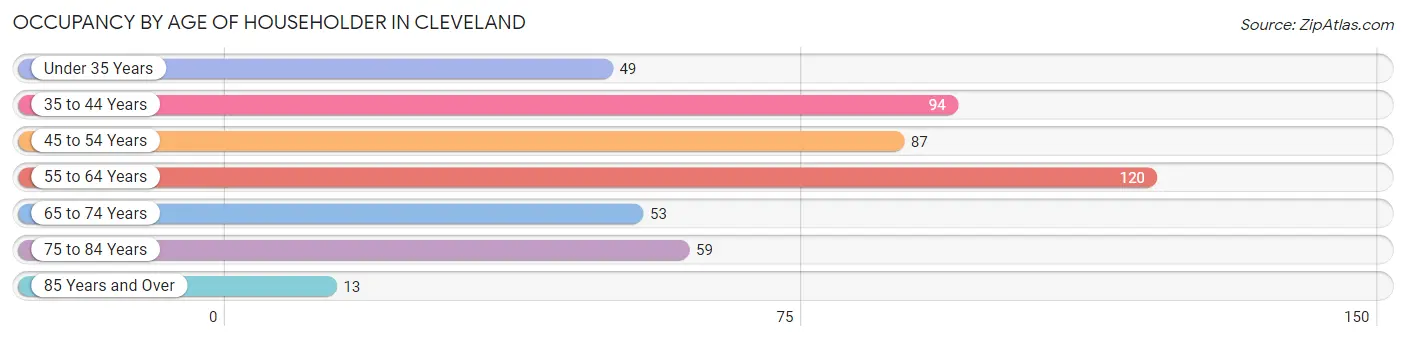
| Age Bracket | # Households | % Households |
| Under 35 Years | 49 | 10.3% |
| 35 to 44 Years | 94 | 19.8% |
| 45 to 54 Years | 87 | 18.3% |
| 55 to 64 Years | 120 | 25.3% |
| 65 to 74 Years | 53 | 11.2% |
| 75 to 84 Years | 59 | 12.4% |
| 85 Years and Over | 13 | 2.7% |
| Total | 475 | 100.0% |
Housing Finances in Cleveland
Median Income by Occupancy in Cleveland
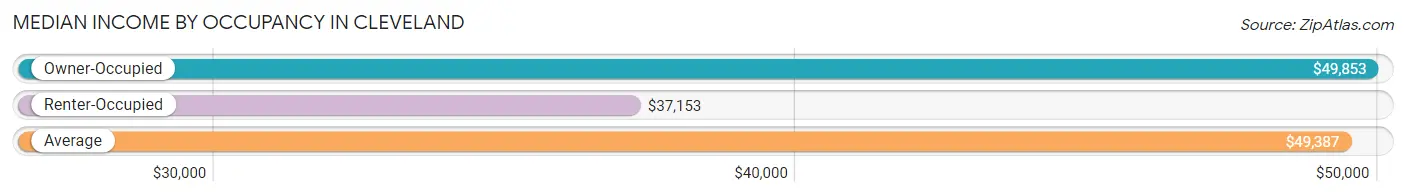
| Occupancy Type | # Households | Median Income |
| Owner-Occupied | 392 (82.5%) | $49,853 |
| Renter-Occupied | 83 (17.5%) | $37,153 |
| Average | 475 (100.0%) | $49,387 |
Occupancy by Householder Income Bracket in Cleveland
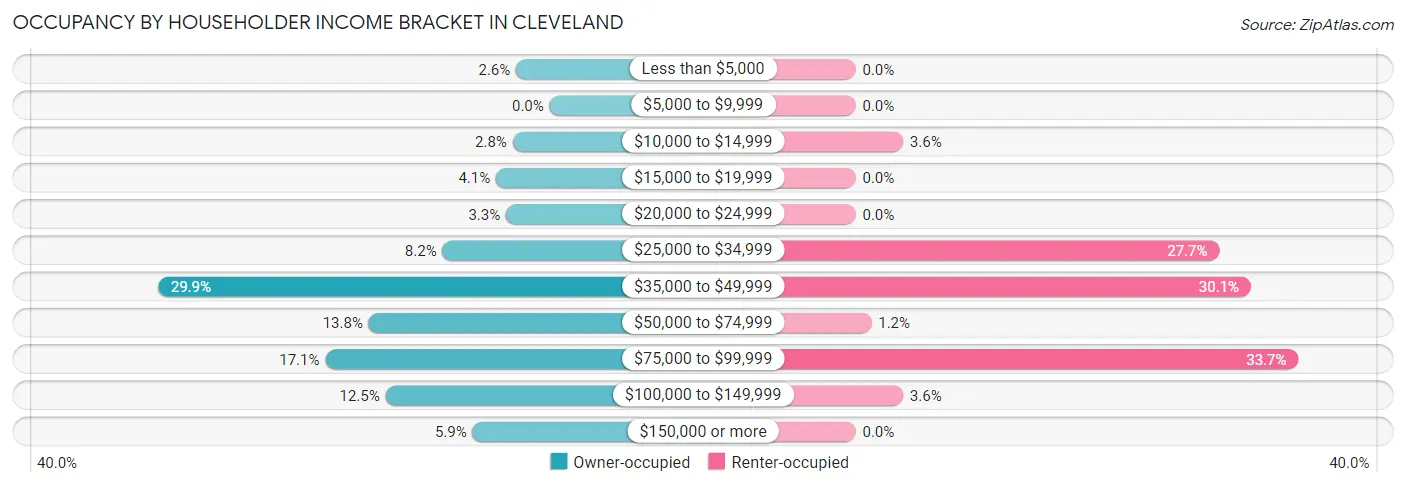
| Income Bracket | Owner-occupied | Renter-occupied |
| Less than $5,000 | 10 (2.5%) | 0 (0.0%) |
| $5,000 to $9,999 | 0 (0.0%) | 0 (0.0%) |
| $10,000 to $14,999 | 11 (2.8%) | 3 (3.6%) |
| $15,000 to $19,999 | 16 (4.1%) | 0 (0.0%) |
| $20,000 to $24,999 | 13 (3.3%) | 0 (0.0%) |
| $25,000 to $34,999 | 32 (8.2%) | 23 (27.7%) |
| $35,000 to $49,999 | 117 (29.8%) | 25 (30.1%) |
| $50,000 to $74,999 | 54 (13.8%) | 1 (1.2%) |
| $75,000 to $99,999 | 67 (17.1%) | 28 (33.7%) |
| $100,000 to $149,999 | 49 (12.5%) | 3 (3.6%) |
| $150,000 or more | 23 (5.9%) | 0 (0.0%) |
| Total | 392 (100.0%) | 83 (100.0%) |
Monthly Housing Cost Tiers in Cleveland
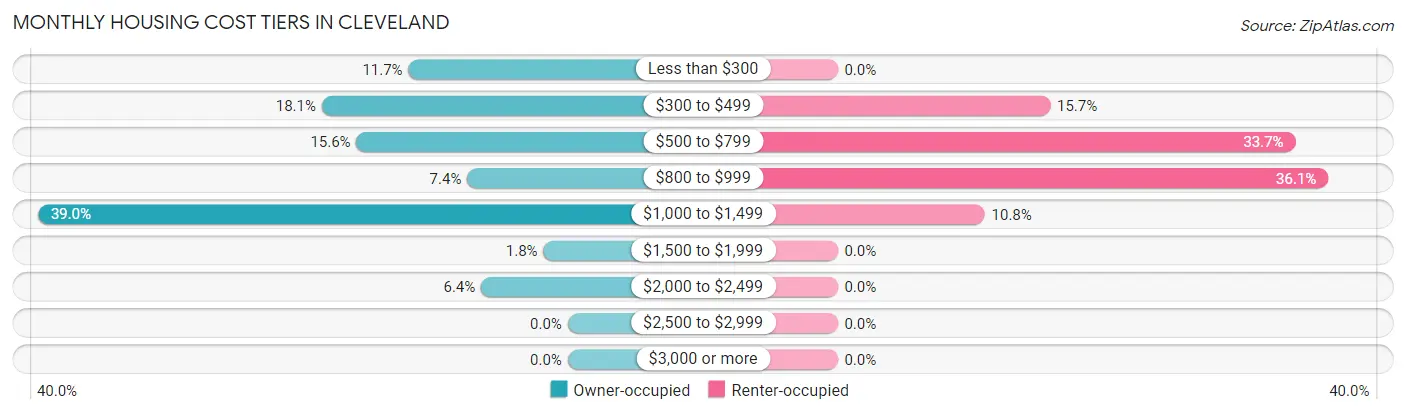
| Monthly Cost | Owner-occupied | Renter-occupied |
| Less than $300 | 46 (11.7%) | 0 (0.0%) |
| $300 to $499 | 71 (18.1%) | 13 (15.7%) |
| $500 to $799 | 61 (15.6%) | 28 (33.7%) |
| $800 to $999 | 29 (7.4%) | 30 (36.1%) |
| $1,000 to $1,499 | 153 (39.0%) | 9 (10.8%) |
| $1,500 to $1,999 | 7 (1.8%) | 0 (0.0%) |
| $2,000 to $2,499 | 25 (6.4%) | 0 (0.0%) |
| $2,500 to $2,999 | 0 (0.0%) | 0 (0.0%) |
| $3,000 or more | 0 (0.0%) | 0 (0.0%) |
| Total | 392 (100.0%) | 83 (100.0%) |
Physical Housing Characteristics in Cleveland
Housing Structures in Cleveland
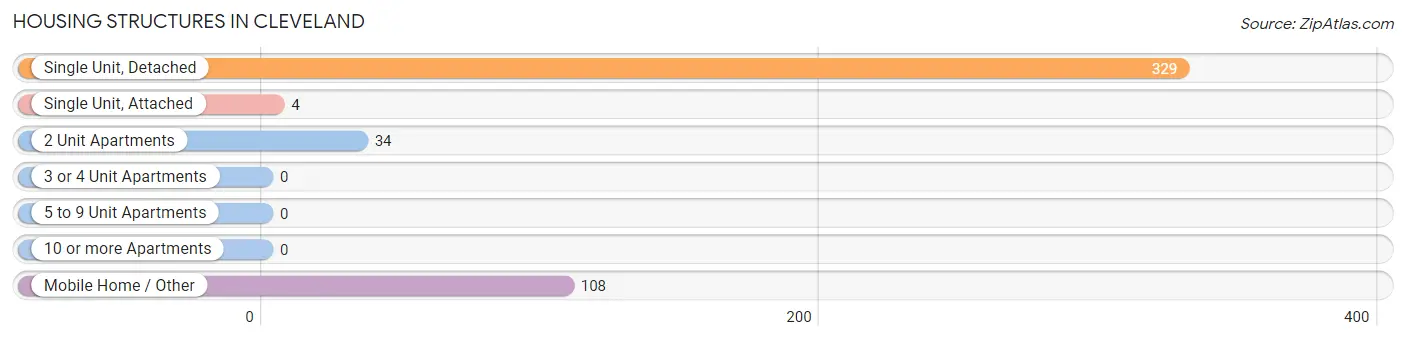
| Structure Type | # Housing Units | % Housing Units |
| Single Unit, Detached | 329 | 69.3% |
| Single Unit, Attached | 4 | 0.8% |
| 2 Unit Apartments | 34 | 7.2% |
| 3 or 4 Unit Apartments | 0 | 0.0% |
| 5 to 9 Unit Apartments | 0 | 0.0% |
| 10 or more Apartments | 0 | 0.0% |
| Mobile Home / Other | 108 | 22.7% |
| Total | 475 | 100.0% |
Housing Structures by Occupancy in Cleveland
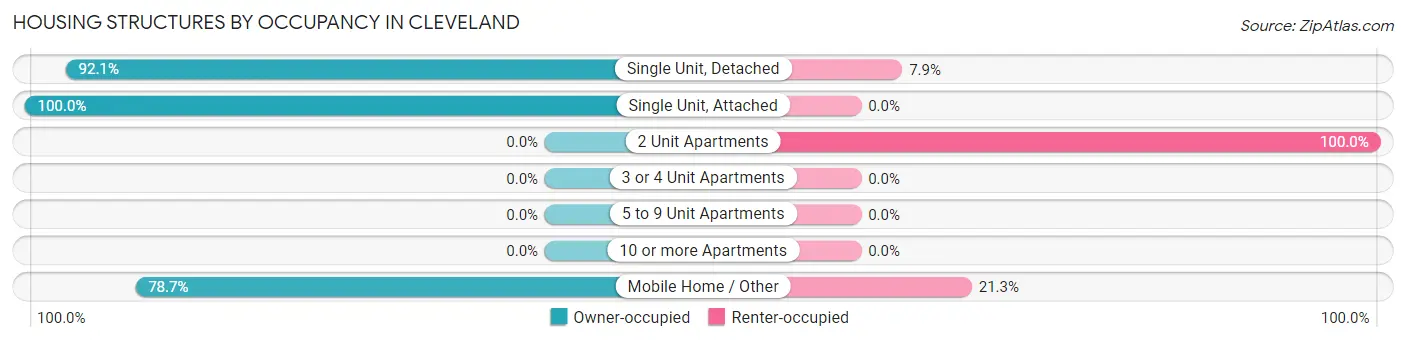
| Structure Type | Owner-occupied | Renter-occupied |
| Single Unit, Detached | 303 (92.1%) | 26 (7.9%) |
| Single Unit, Attached | 4 (100.0%) | 0 (0.0%) |
| 2 Unit Apartments | 0 (0.0%) | 34 (100.0%) |
| 3 or 4 Unit Apartments | 0 (0.0%) | 0 (0.0%) |
| 5 to 9 Unit Apartments | 0 (0.0%) | 0 (0.0%) |
| 10 or more Apartments | 0 (0.0%) | 0 (0.0%) |
| Mobile Home / Other | 85 (78.7%) | 23 (21.3%) |
| Total | 392 (82.5%) | 83 (17.5%) |
Housing Structures by Number of Rooms in Cleveland
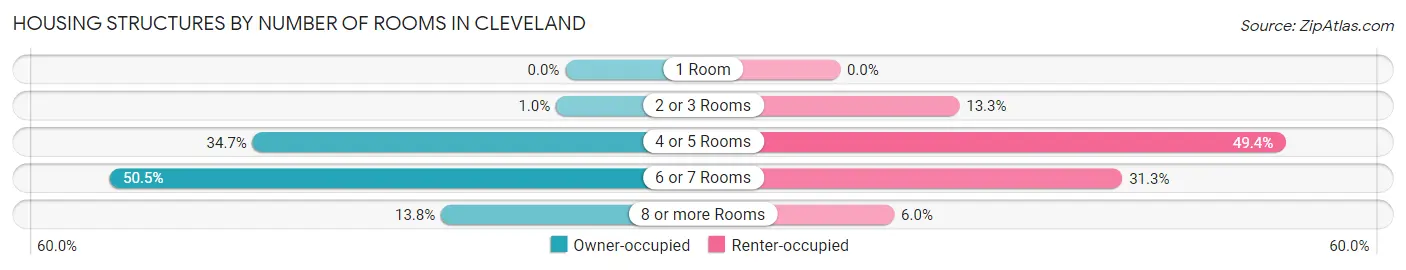
| Number of Rooms | Owner-occupied | Renter-occupied |
| 1 Room | 0 (0.0%) | 0 (0.0%) |
| 2 or 3 Rooms | 4 (1.0%) | 11 (13.3%) |
| 4 or 5 Rooms | 136 (34.7%) | 41 (49.4%) |
| 6 or 7 Rooms | 198 (50.5%) | 26 (31.3%) |
| 8 or more Rooms | 54 (13.8%) | 5 (6.0%) |
| Total | 392 (100.0%) | 83 (100.0%) |
Housing Structure by Heating Type in Cleveland
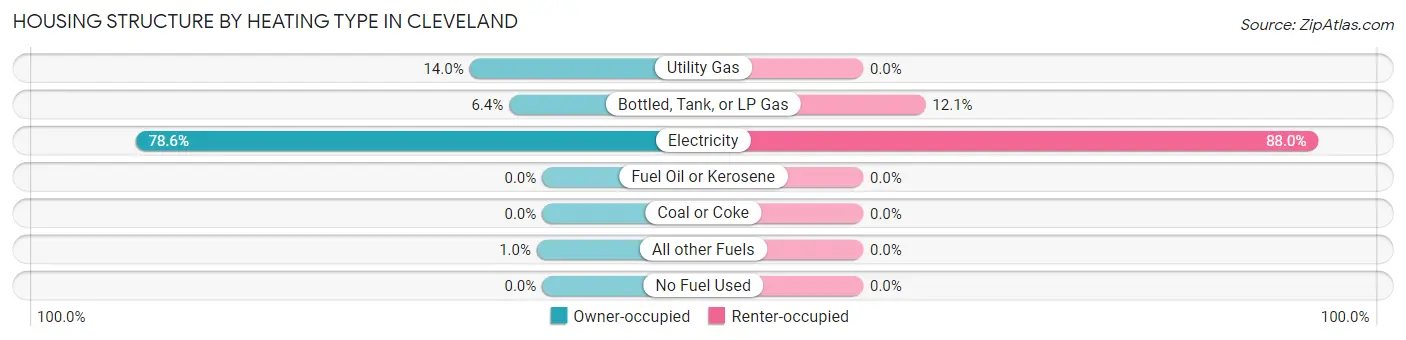
| Heating Type | Owner-occupied | Renter-occupied |
| Utility Gas | 55 (14.0%) | 0 (0.0%) |
| Bottled, Tank, or LP Gas | 25 (6.4%) | 10 (12.0%) |
| Electricity | 308 (78.6%) | 73 (87.9%) |
| Fuel Oil or Kerosene | 0 (0.0%) | 0 (0.0%) |
| Coal or Coke | 0 (0.0%) | 0 (0.0%) |
| All other Fuels | 4 (1.0%) | 0 (0.0%) |
| No Fuel Used | 0 (0.0%) | 0 (0.0%) |
| Total | 392 (100.0%) | 83 (100.0%) |
Household Vehicle Usage in Cleveland
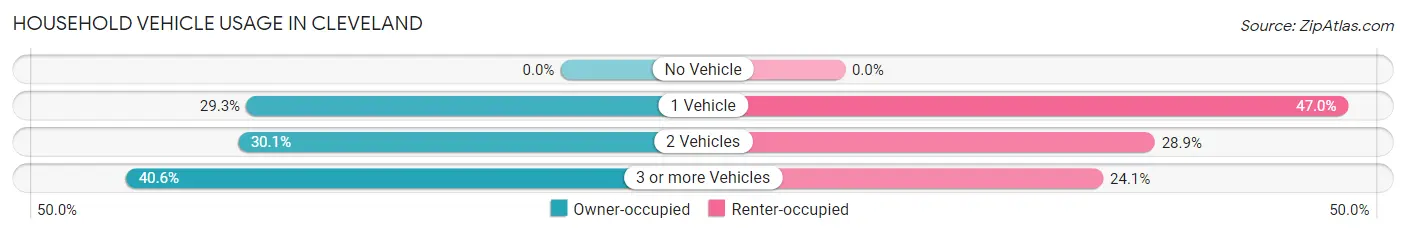
| Vehicles per Household | Owner-occupied | Renter-occupied |
| No Vehicle | 0 (0.0%) | 0 (0.0%) |
| 1 Vehicle | 115 (29.3%) | 39 (47.0%) |
| 2 Vehicles | 118 (30.1%) | 24 (28.9%) |
| 3 or more Vehicles | 159 (40.6%) | 20 (24.1%) |
| Total | 392 (100.0%) | 83 (100.0%) |
Real Estate & Mortgages in Cleveland
Real Estate and Mortgage Overview in Cleveland
| Characteristic | Without Mortgage | With Mortgage |
| Housing Units | 147 | 245 |
| Median Property Value | $107,500 | $153,100 |
| Median Household Income | $37,446 | $18 |
| Monthly Housing Costs | $432 | $0 |
| Real Estate Taxes | $306 | $38 |
Property Value by Mortgage Status in Cleveland
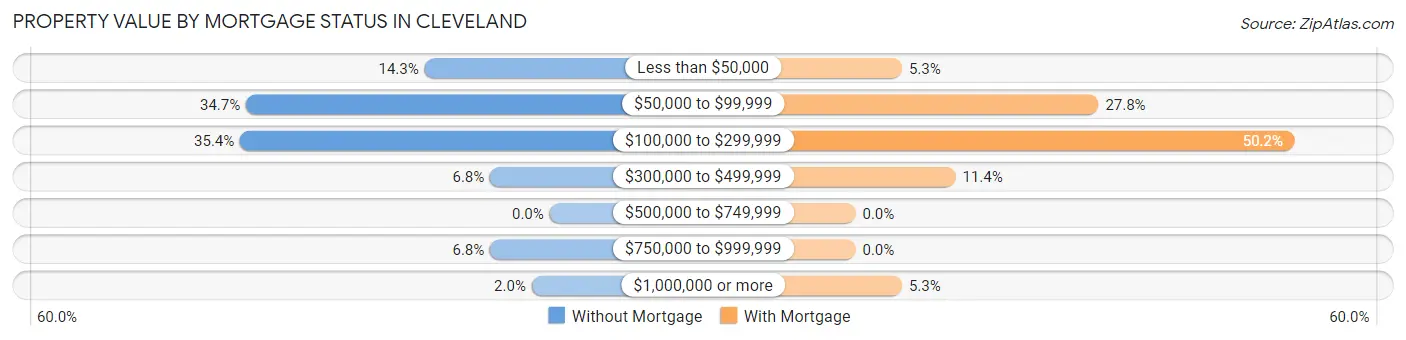
| Property Value | Without Mortgage | With Mortgage |
| Less than $50,000 | 21 (14.3%) | 13 (5.3%) |
| $50,000 to $99,999 | 51 (34.7%) | 68 (27.8%) |
| $100,000 to $299,999 | 52 (35.4%) | 123 (50.2%) |
| $300,000 to $499,999 | 10 (6.8%) | 28 (11.4%) |
| $500,000 to $749,999 | 0 (0.0%) | 0 (0.0%) |
| $750,000 to $999,999 | 10 (6.8%) | 0 (0.0%) |
| $1,000,000 or more | 3 (2.0%) | 13 (5.3%) |
| Total | 147 (100.0%) | 245 (100.0%) |
Household Income by Mortgage Status in Cleveland
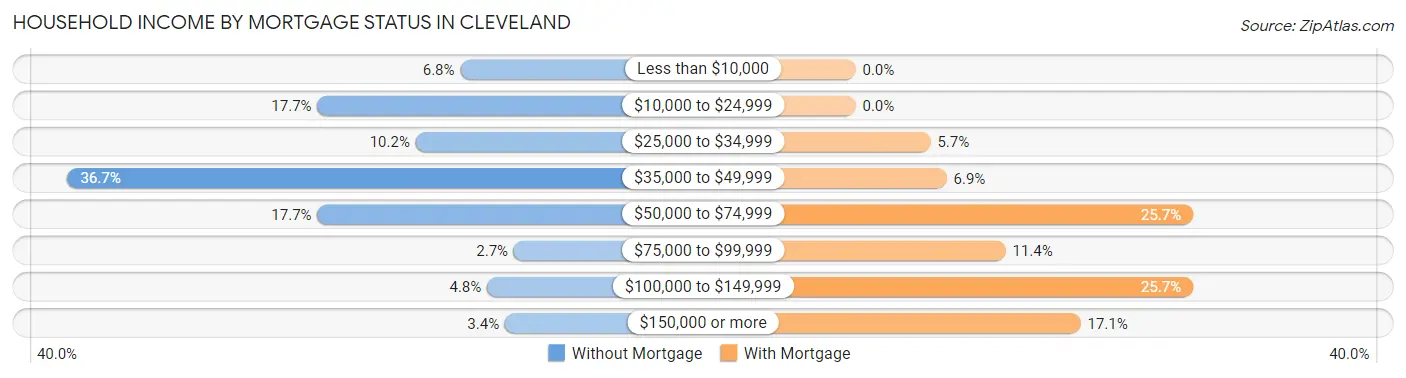
| Household Income | Without Mortgage | With Mortgage |
| Less than $10,000 | 10 (6.8%) | 0 (0.0%) |
| $10,000 to $24,999 | 26 (17.7%) | 0 (0.0%) |
| $25,000 to $34,999 | 15 (10.2%) | 14 (5.7%) |
| $35,000 to $49,999 | 54 (36.7%) | 17 (6.9%) |
| $50,000 to $74,999 | 26 (17.7%) | 63 (25.7%) |
| $75,000 to $99,999 | 4 (2.7%) | 28 (11.4%) |
| $100,000 to $149,999 | 7 (4.8%) | 63 (25.7%) |
| $150,000 or more | 5 (3.4%) | 42 (17.1%) |
| Total | 147 (100.0%) | 245 (100.0%) |
Property Value to Household Income Ratio in Cleveland
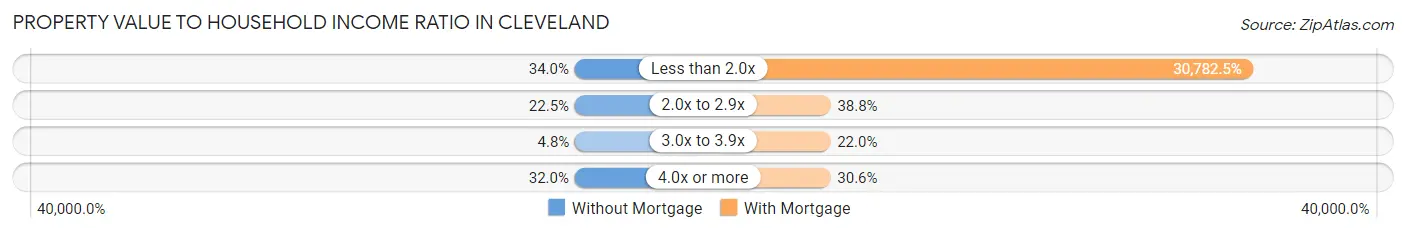
| Value-to-Income Ratio | Without Mortgage | With Mortgage |
| Less than 2.0x | 50 (34.0%) | 75,417 (30,782.5%) |
| 2.0x to 2.9x | 33 (22.5%) | 95 (38.8%) |
| 3.0x to 3.9x | 7 (4.8%) | 54 (22.0%) |
| 4.0x or more | 47 (32.0%) | 75 (30.6%) |
| Total | 147 (100.0%) | 245 (100.0%) |
Real Estate Taxes by Mortgage Status in Cleveland
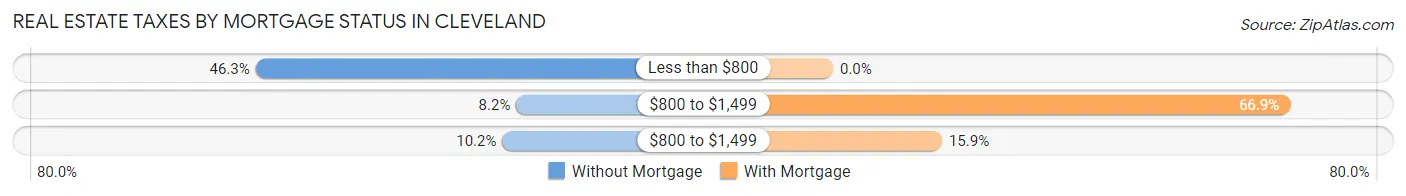
| Property Taxes | Without Mortgage | With Mortgage |
| Less than $800 | 68 (46.3%) | 0 (0.0%) |
| $800 to $1,499 | 12 (8.2%) | 164 (66.9%) |
| $800 to $1,499 | 15 (10.2%) | 39 (15.9%) |
| Total | 147 (100.0%) | 245 (100.0%) |
Health & Disability in Cleveland
Health Insurance Coverage by Age in Cleveland
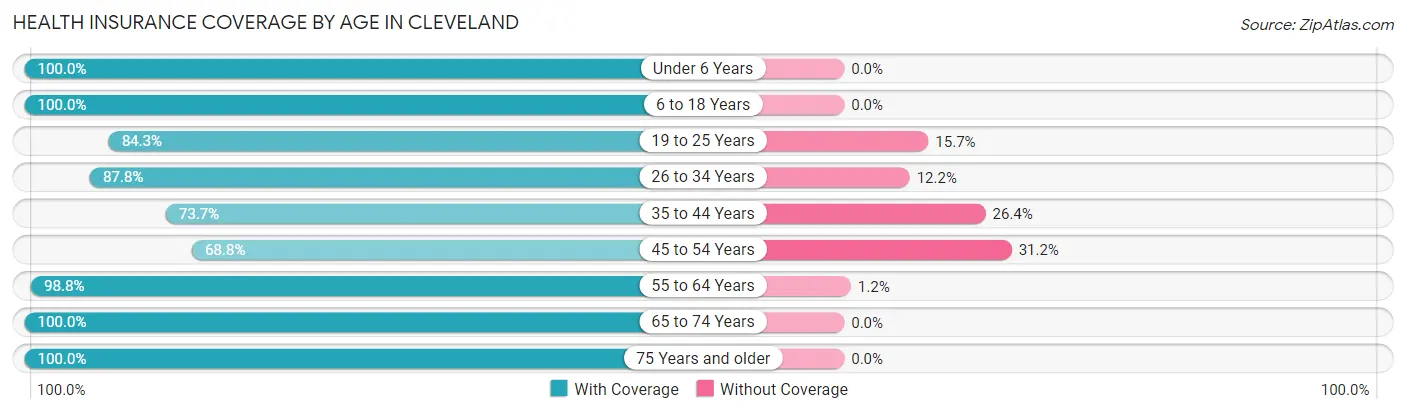
| Age Bracket | With Coverage | Without Coverage |
| Under 6 Years | 109 (100.0%) | 0 (0.0%) |
| 6 to 18 Years | 246 (100.0%) | 0 (0.0%) |
| 19 to 25 Years | 86 (84.3%) | 16 (15.7%) |
| 26 to 34 Years | 72 (87.8%) | 10 (12.2%) |
| 35 to 44 Years | 109 (73.7%) | 39 (26.4%) |
| 45 to 54 Years | 141 (68.8%) | 64 (31.2%) |
| 55 to 64 Years | 161 (98.8%) | 2 (1.2%) |
| 65 to 74 Years | 91 (100.0%) | 0 (0.0%) |
| 75 Years and older | 106 (100.0%) | 0 (0.0%) |
| Total | 1,121 (89.5%) | 131 (10.5%) |
Health Insurance Coverage by Citizenship Status in Cleveland
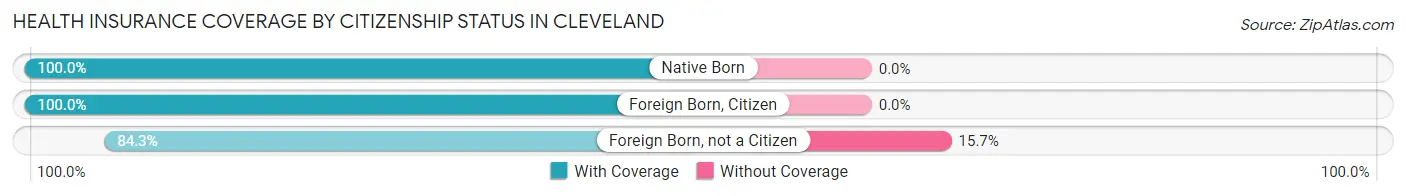
| Citizenship Status | With Coverage | Without Coverage |
| Native Born | 109 (100.0%) | 0 (0.0%) |
| Foreign Born, Citizen | 246 (100.0%) | 0 (0.0%) |
| Foreign Born, not a Citizen | 86 (84.3%) | 16 (15.7%) |
Health Insurance Coverage by Household Income in Cleveland
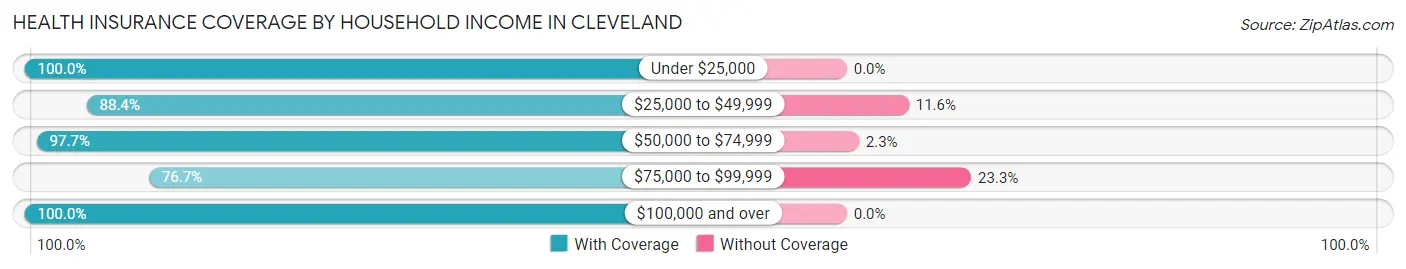
| Household Income | With Coverage | Without Coverage |
| Under $25,000 | 63 (100.0%) | 0 (0.0%) |
| $25,000 to $49,999 | 403 (88.4%) | 53 (11.6%) |
| $50,000 to $74,999 | 130 (97.7%) | 3 (2.3%) |
| $75,000 to $99,999 | 237 (76.7%) | 72 (23.3%) |
| $100,000 and over | 283 (100.0%) | 0 (0.0%) |
Public vs Private Health Insurance Coverage by Age in Cleveland
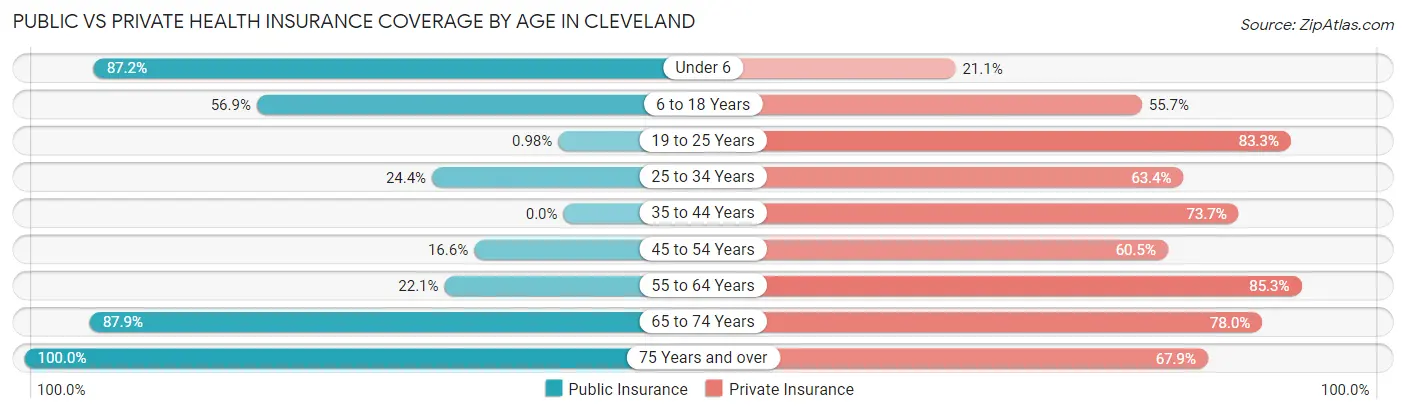
| Age Bracket | Public Insurance | Private Insurance |
| Under 6 | 95 (87.2%) | 23 (21.1%) |
| 6 to 18 Years | 140 (56.9%) | 137 (55.7%) |
| 19 to 25 Years | 1 (1.0%) | 85 (83.3%) |
| 25 to 34 Years | 20 (24.4%) | 52 (63.4%) |
| 35 to 44 Years | 0 (0.0%) | 109 (73.7%) |
| 45 to 54 Years | 34 (16.6%) | 124 (60.5%) |
| 55 to 64 Years | 36 (22.1%) | 139 (85.3%) |
| 65 to 74 Years | 80 (87.9%) | 71 (78.0%) |
| 75 Years and over | 106 (100.0%) | 72 (67.9%) |
| Total | 512 (40.9%) | 812 (64.9%) |
Disability Status by Sex by Age in Cleveland
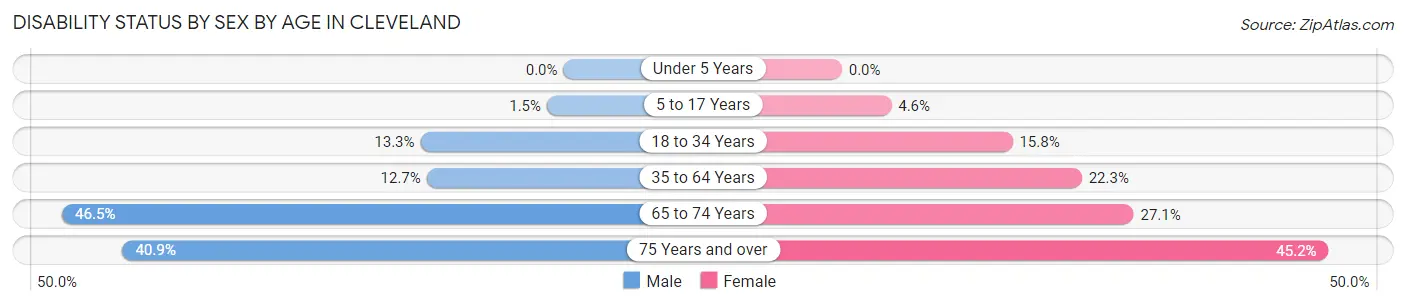
| Age Bracket | Male | Female |
| Under 5 Years | 0 (0.0%) | 0 (0.0%) |
| 5 to 17 Years | 2 (1.5%) | 5 (4.6%) |
| 18 to 34 Years | 13 (13.3%) | 16 (15.8%) |
| 35 to 64 Years | 33 (12.7%) | 57 (22.3%) |
| 65 to 74 Years | 20 (46.5%) | 13 (27.1%) |
| 75 Years and over | 18 (40.9%) | 28 (45.2%) |
Disability Class by Sex by Age in Cleveland
Disability Class: Hearing Difficulty
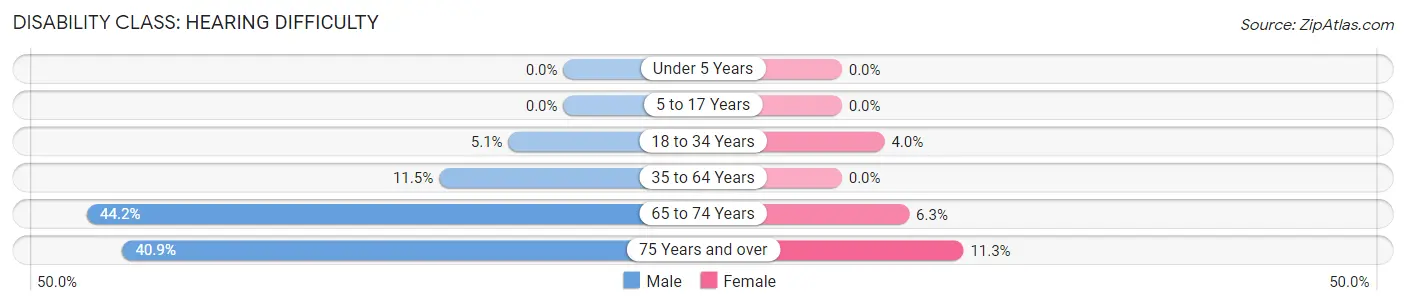
| Age Bracket | Male | Female |
| Under 5 Years | 0 (0.0%) | 0 (0.0%) |
| 5 to 17 Years | 0 (0.0%) | 0 (0.0%) |
| 18 to 34 Years | 5 (5.1%) | 4 (4.0%) |
| 35 to 64 Years | 30 (11.5%) | 0 (0.0%) |
| 65 to 74 Years | 19 (44.2%) | 3 (6.2%) |
| 75 Years and over | 18 (40.9%) | 7 (11.3%) |
Disability Class: Vision Difficulty
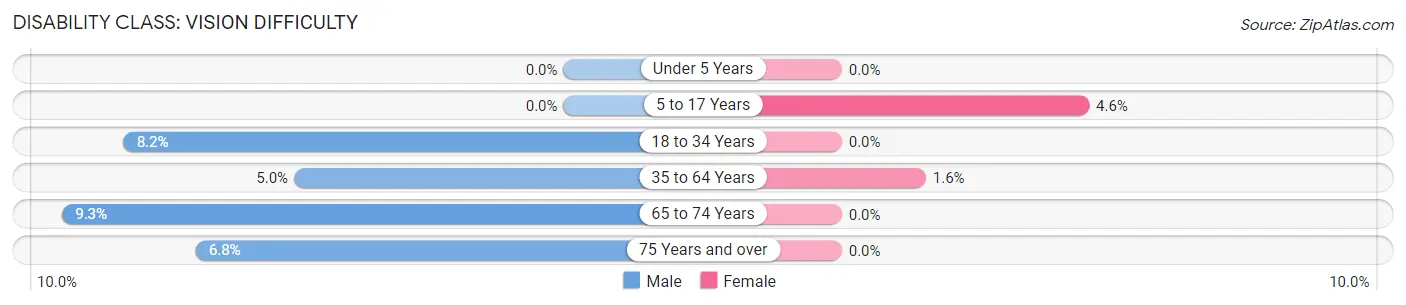
| Age Bracket | Male | Female |
| Under 5 Years | 0 (0.0%) | 0 (0.0%) |
| 5 to 17 Years | 0 (0.0%) | 5 (4.6%) |
| 18 to 34 Years | 8 (8.2%) | 0 (0.0%) |
| 35 to 64 Years | 13 (5.0%) | 4 (1.6%) |
| 65 to 74 Years | 4 (9.3%) | 0 (0.0%) |
| 75 Years and over | 3 (6.8%) | 0 (0.0%) |
Disability Class: Cognitive Difficulty
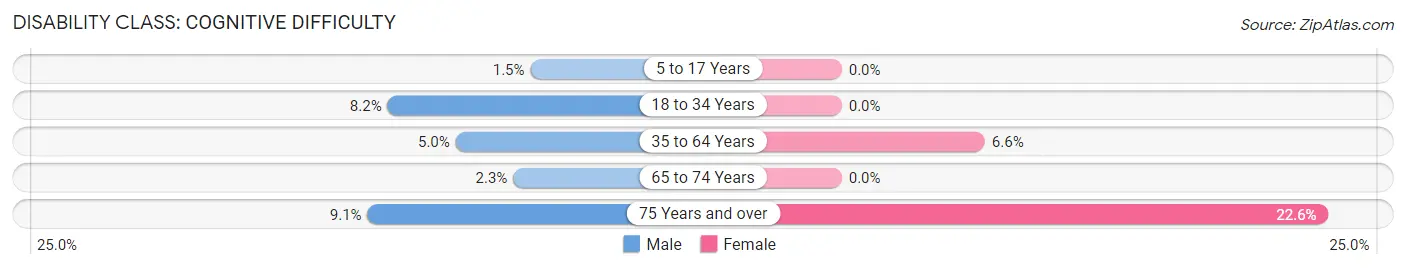
| Age Bracket | Male | Female |
| 5 to 17 Years | 2 (1.5%) | 0 (0.0%) |
| 18 to 34 Years | 8 (8.2%) | 0 (0.0%) |
| 35 to 64 Years | 13 (5.0%) | 17 (6.6%) |
| 65 to 74 Years | 1 (2.3%) | 0 (0.0%) |
| 75 Years and over | 4 (9.1%) | 14 (22.6%) |
Disability Class: Ambulatory Difficulty
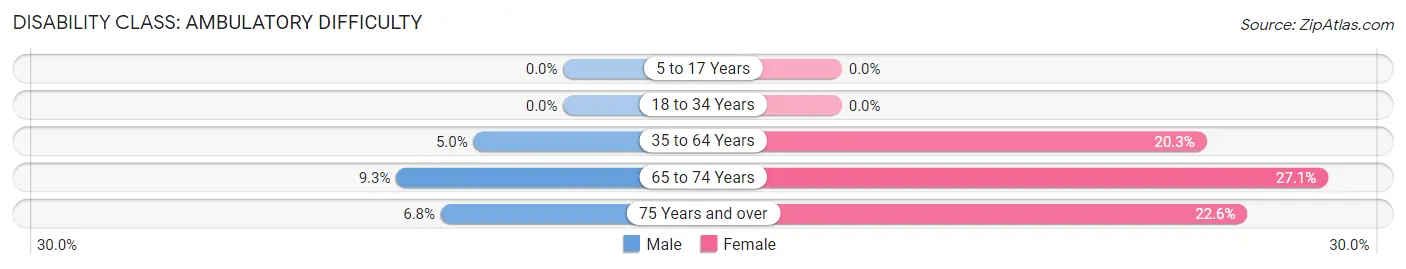
| Age Bracket | Male | Female |
| 5 to 17 Years | 0 (0.0%) | 0 (0.0%) |
| 18 to 34 Years | 0 (0.0%) | 0 (0.0%) |
| 35 to 64 Years | 13 (5.0%) | 52 (20.3%) |
| 65 to 74 Years | 4 (9.3%) | 13 (27.1%) |
| 75 Years and over | 3 (6.8%) | 14 (22.6%) |
Disability Class: Self-Care Difficulty
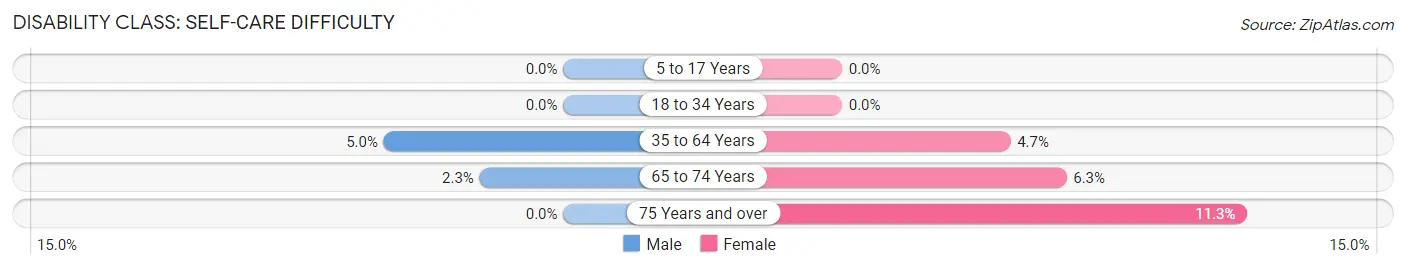
| Age Bracket | Male | Female |
| 5 to 17 Years | 0 (0.0%) | 0 (0.0%) |
| 18 to 34 Years | 0 (0.0%) | 0 (0.0%) |
| 35 to 64 Years | 13 (5.0%) | 12 (4.7%) |
| 65 to 74 Years | 1 (2.3%) | 3 (6.2%) |
| 75 Years and over | 0 (0.0%) | 7 (11.3%) |
Technology Access in Cleveland
Computing Device Access in Cleveland
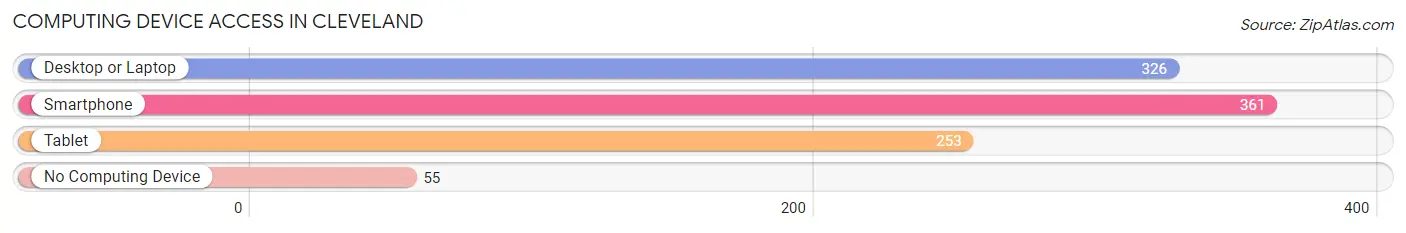
| Device Type | # Households | % Households |
| Desktop or Laptop | 326 | 68.6% |
| Smartphone | 361 | 76.0% |
| Tablet | 253 | 53.3% |
| No Computing Device | 55 | 11.6% |
| Total | 475 | 100.0% |
Internet Access in Cleveland
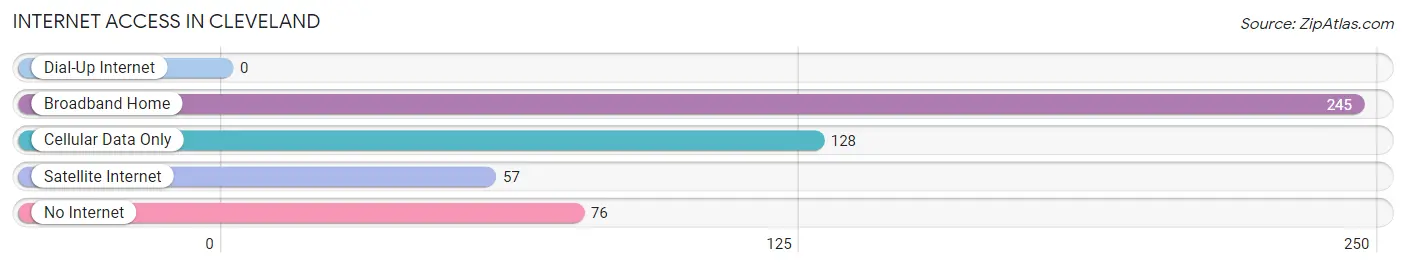
| Internet Type | # Households | % Households |
| Dial-Up Internet | 0 | 0.0% |
| Broadband Home | 245 | 51.6% |
| Cellular Data Only | 128 | 27.0% |
| Satellite Internet | 57 | 12.0% |
| No Internet | 76 | 16.0% |
| Total | 475 | 100.0% |
Cleveland Summary
Cleveland is a small town located in Blount County, Alabama. It is situated in the foothills of the Appalachian Mountains and is part of the Birmingham-Hoover Metropolitan Statistical Area. The town has a population of approximately 1,500 people and is known for its rural charm and friendly atmosphere.
Geography
Cleveland is located in the foothills of the Appalachian Mountains in Blount County, Alabama. The town is situated at the intersection of US Highway 231 and Alabama State Route 79. The terrain is mostly hilly and the area is known for its scenic beauty. The town is located approximately 30 miles northeast of Birmingham and is part of the Birmingham-Hoover Metropolitan Statistical Area.
History
Cleveland was founded in 1818 by settlers from North Carolina. The town was named after Colonel Benjamin Cleveland, a Revolutionary War hero. The town was incorporated in 1891 and has remained relatively unchanged since then. The town was once a thriving center of commerce and industry, but has since become a quiet, rural community.
Economy
Cleveland’s economy is largely based on agriculture and tourism. The town is home to several small businesses, including a grocery store, a hardware store, and a few restaurants. The town also has a few small manufacturing plants. The town is also home to a few small farms, which produce a variety of crops, including corn, soybeans, and hay.
Demographics
As of the 2010 census, the population of Cleveland was 1,500. The racial makeup of the town was 95.2% White, 2.7% African American, 0.2% Native American, 0.2% Asian, 0.2% from other races, and 1.7% from two or more races. The median household income was $35,000 and the median family income was $41,000. The per capita income was $17,000.
Conclusion
Cleveland is a small town located in Blount County, Alabama. It is situated in the foothills of the Appalachian Mountains and is part of the Birmingham-Hoover Metropolitan Statistical Area. The town has a population of approximately 1,500 people and is known for its rural charm and friendly atmosphere. The economy of the town is largely based on agriculture and tourism, and the town is home to several small businesses. The racial makeup of the town is mostly White, with a small percentage of African Americans, Native Americans, and Asians. The median household income is $35,000 and the median family income is $41,000.
Common Questions
What is Per Capita Income in Cleveland?
Per Capita income in Cleveland is $25,767.
What is the Median Family Income in Cleveland?
Median Family Income in Cleveland is $66,458.
What is the Median Household income in Cleveland?
Median Household Income in Cleveland is $49,387.
What is Income or Wage Gap in Cleveland?
Income or Wage Gap in Cleveland is 27.4%.
Women in Cleveland earn 72.6 cents for every dollar earned by a man.
What is Inequality or Gini Index in Cleveland?
Inequality or Gini Index in Cleveland is 0.37.
What is the Total Population of Cleveland?
Total Population of Cleveland is 1,252.
What is the Total Male Population of Cleveland?
Total Male Population of Cleveland is 610.
What is the Total Female Population of Cleveland?
Total Female Population of Cleveland is 642.
What is the Ratio of Males per 100 Females in Cleveland?
There are 95.02 Males per 100 Females in Cleveland.
What is the Ratio of Females per 100 Males in Cleveland?
There are 105.25 Females per 100 Males in Cleveland.
What is the Median Population Age in Cleveland?
Median Population Age in Cleveland is 40.6 Years.
What is the Average Family Size in Cleveland
Average Family Size in Cleveland is 3.0 People.
What is the Average Household Size in Cleveland
Average Household Size in Cleveland is 2.6 People.
How Large is the Labor Force in Cleveland?
There are 625 People in the Labor Forcein in Cleveland.
What is the Percentage of People in the Labor Force in Cleveland?
65.4% of People are in the Labor Force in Cleveland.
What is the Unemployment Rate in Cleveland?
Unemployment Rate in Cleveland is 6.2%.