Clayton, AL Map & Demographics
Clayton Map
Clayton Overview
$12,446
PER CAPITA INCOME
$40,313
AVG FAMILY INCOME
$30,938
AVG HOUSEHOLD INCOME
0.56
INEQUALITY / GINI INDEX
2,230
TOTAL POPULATION
1,738
MALE POPULATION
492
FEMALE POPULATION
353.25
MALES / 100 FEMALES
28.31
FEMALES / 100 MALES
42.6
MEDIAN AGE
2.7
AVG FAMILY SIZE
2.0
AVG HOUSEHOLD SIZE
321
LABOR FORCE [ PEOPLE ]
15.3%
PERCENT IN LABOR FORCE
3.7%
UNEMPLOYMENT RATE
Clayton Zip Codes
Clayton Area Codes
Income in Clayton
Income Overview in Clayton
Per Capita Income in Clayton is $12,446, while median incomes of families and households are $40,313 and $30,938 respectively.
| Characteristic | Number | Measure |
| Per Capita Income | 2,230 | $12,446 |
| Median Family Income | 222 | $40,313 |
| Mean Family Income | 222 | $70,260 |
| Median Household Income | 412 | $30,938 |
| Mean Household Income | 412 | $52,690 |
| Income Deficit | 222 | $0 |
| Wage / Income Gap (%) | 2,230 | 0.00% |
| Wage / Income Gap ($) | 2,230 | 100.00¢ per $1 |
| Gini / Inequality Index | 2,230 | 0.56 |
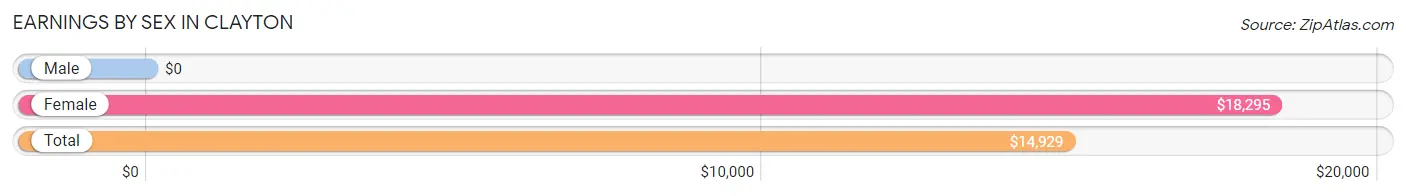
Earnings by Sex in Clayton
| Sex | Number | Average Earnings |
| Male | 296 (53.9%) | $0 |
| Female | 253 (46.1%) | $18,295 |
| Total | 549 (100.0%) | $14,929 |
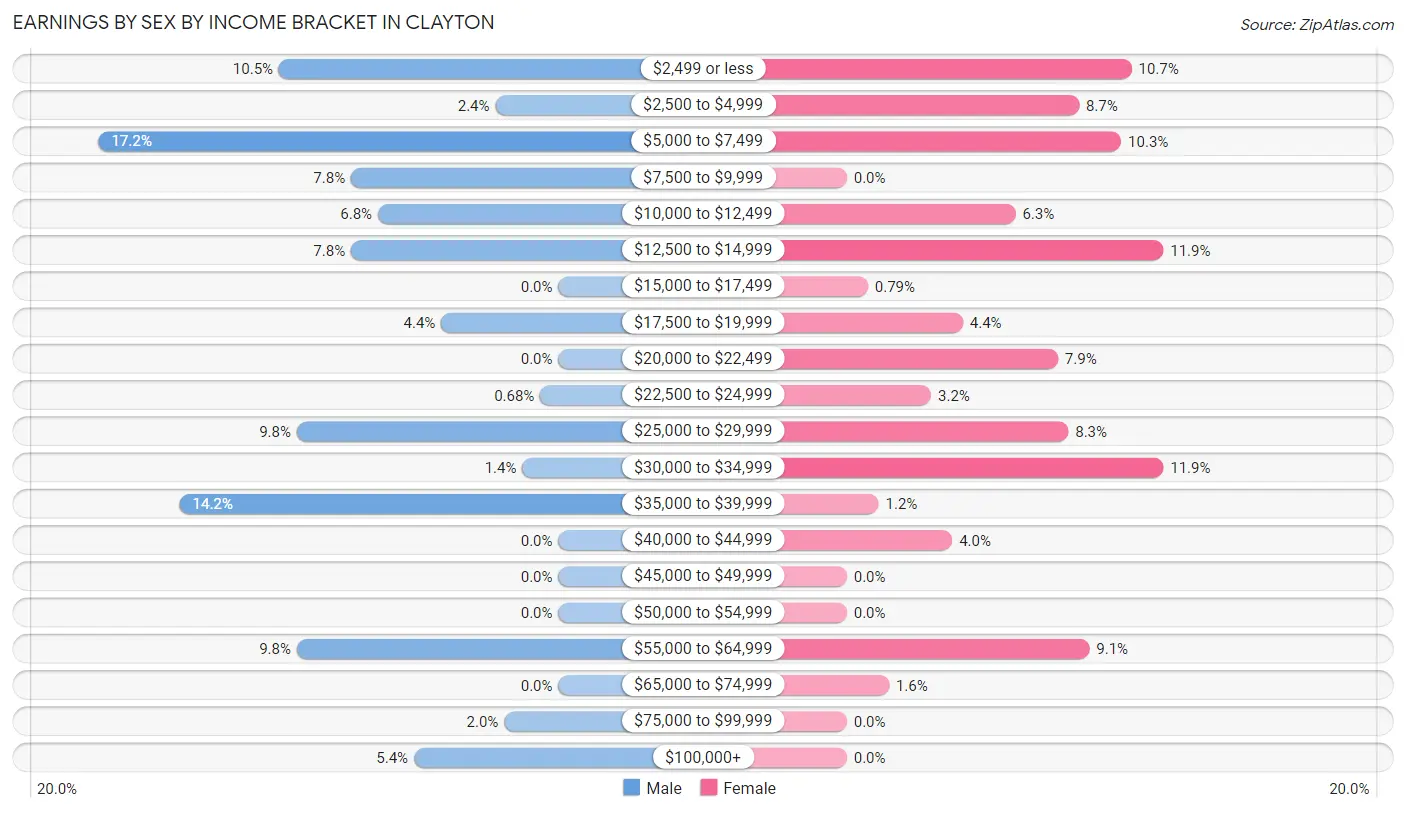
Earnings by Sex by Income Bracket in Clayton
The most common earnings brackets in Clayton are $5,000 to $7,499 for men (51 | 17.2%) and $12,500 to $14,999 for women (30 | 11.9%).
| Income | Male | Female |
| $2,499 or less | 31 (10.5%) | 27 (10.7%) |
| $2,500 to $4,999 | 7 (2.4%) | 22 (8.7%) |
| $5,000 to $7,499 | 51 (17.2%) | 26 (10.3%) |
| $7,500 to $9,999 | 23 (7.8%) | 0 (0.0%) |
| $10,000 to $12,499 | 20 (6.8%) | 16 (6.3%) |
| $12,500 to $14,999 | 23 (7.8%) | 30 (11.9%) |
| $15,000 to $17,499 | 0 (0.0%) | 2 (0.8%) |
| $17,500 to $19,999 | 13 (4.4%) | 11 (4.3%) |
| $20,000 to $22,499 | 0 (0.0%) | 20 (7.9%) |
| $22,500 to $24,999 | 2 (0.7%) | 8 (3.2%) |
| $25,000 to $29,999 | 29 (9.8%) | 21 (8.3%) |
| $30,000 to $34,999 | 4 (1.3%) | 30 (11.9%) |
| $35,000 to $39,999 | 42 (14.2%) | 3 (1.2%) |
| $40,000 to $44,999 | 0 (0.0%) | 10 (4.0%) |
| $45,000 to $49,999 | 0 (0.0%) | 0 (0.0%) |
| $50,000 to $54,999 | 0 (0.0%) | 0 (0.0%) |
| $55,000 to $64,999 | 29 (9.8%) | 23 (9.1%) |
| $65,000 to $74,999 | 0 (0.0%) | 4 (1.6%) |
| $75,000 to $99,999 | 6 (2.0%) | 0 (0.0%) |
| $100,000+ | 16 (5.4%) | 0 (0.0%) |
| Total | 296 (100.0%) | 253 (100.0%) |
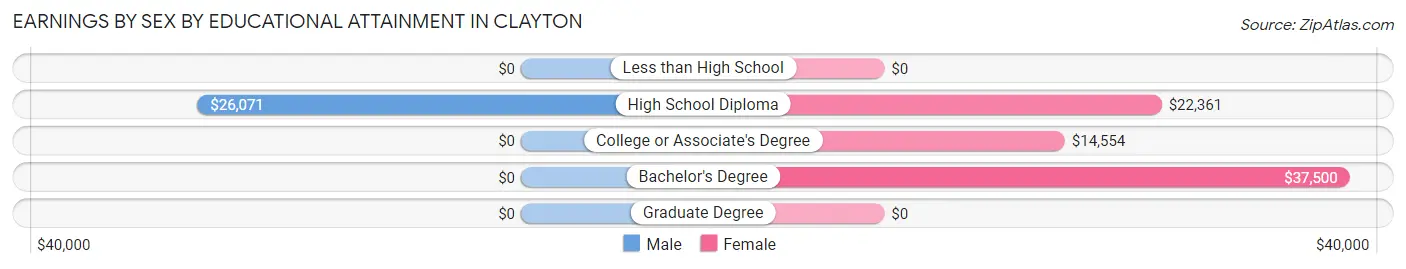
Earnings by Sex by Educational Attainment in Clayton
| Educational Attainment | Male Income | Female Income |
| Less than High School | - | - |
| High School Diploma | $26,071 | $22,361 |
| College or Associate's Degree | - | - |
| Bachelor's Degree | - | - |
| Graduate Degree | - | - |
| Total | - | - |
Family Income in Clayton
Family Income Brackets in Clayton
According to the Clayton family income data, there are 60 families falling into the $50,000 to $74,999 income range, which is the most common income bracket and makes up 27.0% of all families. Conversely, the $100,000 to $149,999 income bracket is the least frequent group with only 10 families (4.5%) belonging to this category.
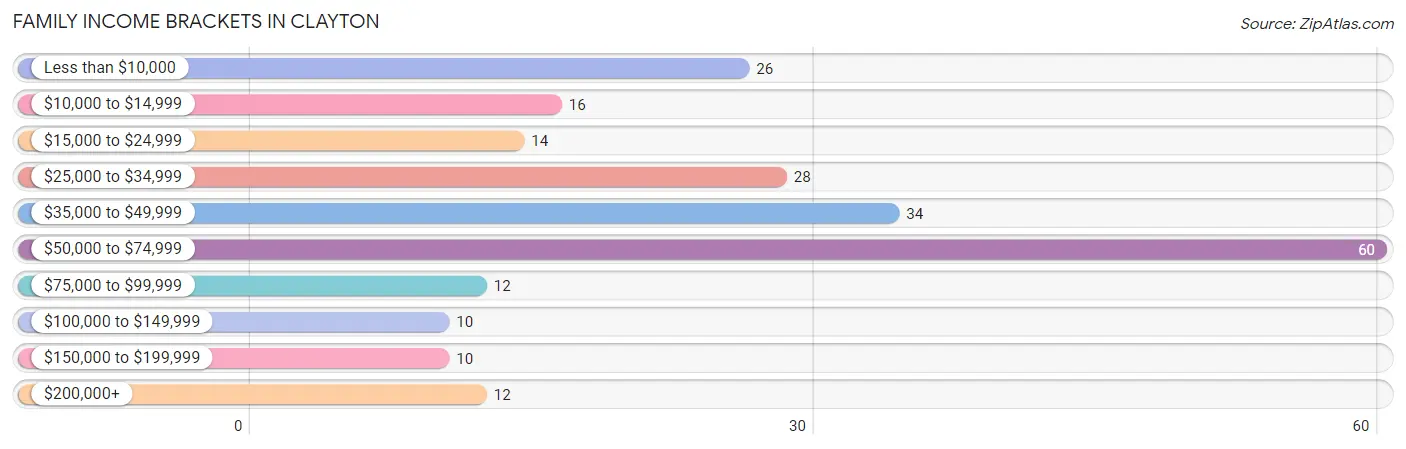
| Income Bracket | # Families | % Families |
| Less than $10,000 | 26 | 11.7% |
| $10,000 to $14,999 | 16 | 7.2% |
| $15,000 to $24,999 | 14 | 6.3% |
| $25,000 to $34,999 | 28 | 12.6% |
| $35,000 to $49,999 | 34 | 15.3% |
| $50,000 to $74,999 | 60 | 27.0% |
| $75,000 to $99,999 | 12 | 5.4% |
| $100,000 to $149,999 | 10 | 4.5% |
| $150,000 to $199,999 | 10 | 4.5% |
| $200,000+ | 12 | 5.4% |
Family Income by Famaliy Size in Clayton
2-person families (140 | 63.1%) account for the highest median family income in Clayton with $37,750 per family, while 2-person families (140 | 63.1%) have the highest median income of $18,875 per family member.
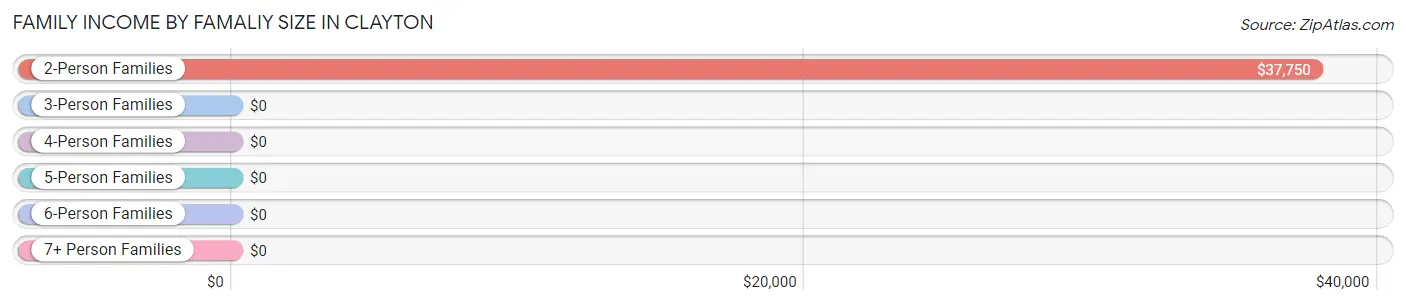
| Income Bracket | # Families | Median Income |
| 2-Person Families | 140 (63.1%) | $37,750 |
| 3-Person Families | 37 (16.7%) | $0 |
| 4-Person Families | 11 (5.0%) | $0 |
| 5-Person Families | 34 (15.3%) | $0 |
| 6-Person Families | 0 (0.0%) | $0 |
| 7+ Person Families | 0 (0.0%) | $0 |
| Total | 222 (100.0%) | $40,313 |
Family Income by Number of Earners in Clayton
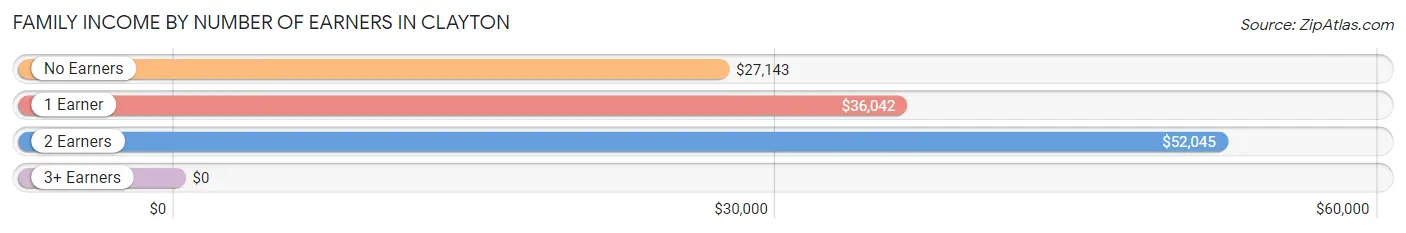
| Number of Earners | # Families | Median Income |
| No Earners | 58 (26.1%) | $27,143 |
| 1 Earner | 55 (24.8%) | $36,042 |
| 2 Earners | 100 (45.1%) | $52,045 |
| 3+ Earners | 9 (4.1%) | $0 |
| Total | 222 (100.0%) | $40,313 |
Household Income in Clayton
Household Income Brackets in Clayton
With 71 households falling in the category, the $50,000 to $74,999 income range is the most frequent in Clayton, accounting for 17.2% of all households. In contrast, only 10 households (2.4%) fall into the $150,000 to $199,999 income bracket, making it the least populous group.
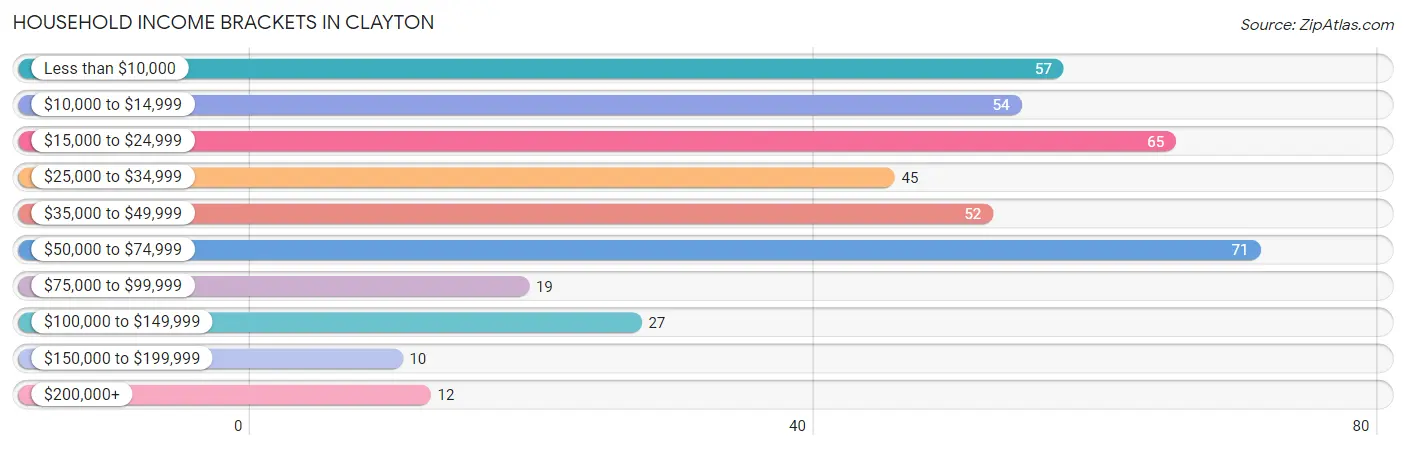
| Income Bracket | # Households | % Households |
| Less than $10,000 | 57 | 13.8% |
| $10,000 to $14,999 | 54 | 13.1% |
| $15,000 to $24,999 | 65 | 15.8% |
| $25,000 to $34,999 | 45 | 10.9% |
| $35,000 to $49,999 | 52 | 12.6% |
| $50,000 to $74,999 | 71 | 17.2% |
| $75,000 to $99,999 | 19 | 4.6% |
| $100,000 to $149,999 | 27 | 6.6% |
| $150,000 to $199,999 | 10 | 2.4% |
| $200,000+ | 12 | 2.9% |
Household Income by Householder Age in Clayton
The median household income in Clayton is $30,938, with the highest median household income of $38,813 found in the 25 to 44 years age bracket for the primary householder. A total of 97 households (23.5%) fall into this category.
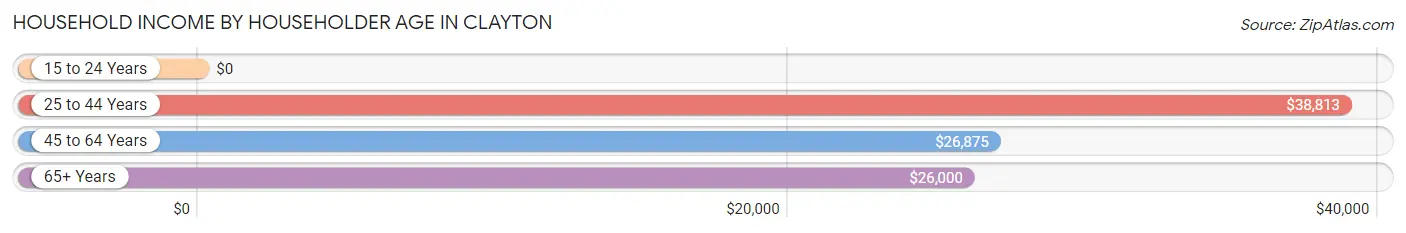
| Income Bracket | # Households | Median Income |
| 15 to 24 Years | 0 (0.0%) | $0 |
| 25 to 44 Years | 97 (23.5%) | $38,813 |
| 45 to 64 Years | 155 (37.6%) | $26,875 |
| 65+ Years | 160 (38.8%) | $26,000 |
| Total | 412 (100.0%) | $30,938 |
Poverty in Clayton
Income Below Poverty by Sex and Age in Clayton
With 24.8% poverty level for males and 32.7% for females among the residents of Clayton, 35 to 44 year old males and 18 to 24 year old females are the most vulnerable to poverty, with 22 males (50.0%) and 33 females (64.7%) in their respective age groups living below the poverty level.
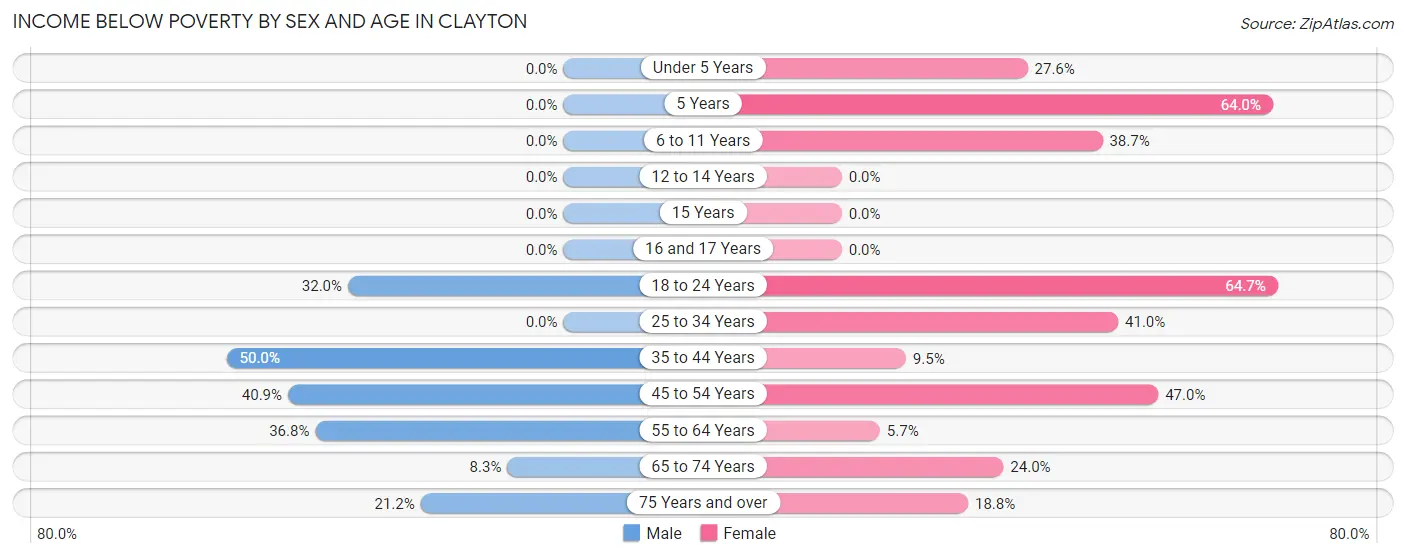
| Age Bracket | Male | Female |
| Under 5 Years | 0 (0.0%) | 8 (27.6%) |
| 5 Years | 0 (0.0%) | 16 (64.0%) |
| 6 to 11 Years | 0 (0.0%) | 12 (38.7%) |
| 12 to 14 Years | 0 (0.0%) | 0 (0.0%) |
| 15 Years | 0 (0.0%) | 0 (0.0%) |
| 16 and 17 Years | 0 (0.0%) | 0 (0.0%) |
| 18 to 24 Years | 8 (32.0%) | 33 (64.7%) |
| 25 to 34 Years | 0 (0.0%) | 16 (41.0%) |
| 35 to 44 Years | 22 (50.0%) | 4 (9.5%) |
| 45 to 54 Years | 18 (40.9%) | 39 (47.0%) |
| 55 to 64 Years | 21 (36.8%) | 3 (5.7%) |
| 65 to 74 Years | 3 (8.3%) | 18 (24.0%) |
| 75 Years and over | 7 (21.2%) | 12 (18.8%) |
| Total | 79 (24.8%) | 161 (32.7%) |
Income Above Poverty by Sex and Age in Clayton
According to the poverty statistics in Clayton, males aged 6 to 11 years and females aged 55 to 64 years are the age groups that are most secure financially, with 100.0% of males and 94.3% of females in these age groups living above the poverty line.
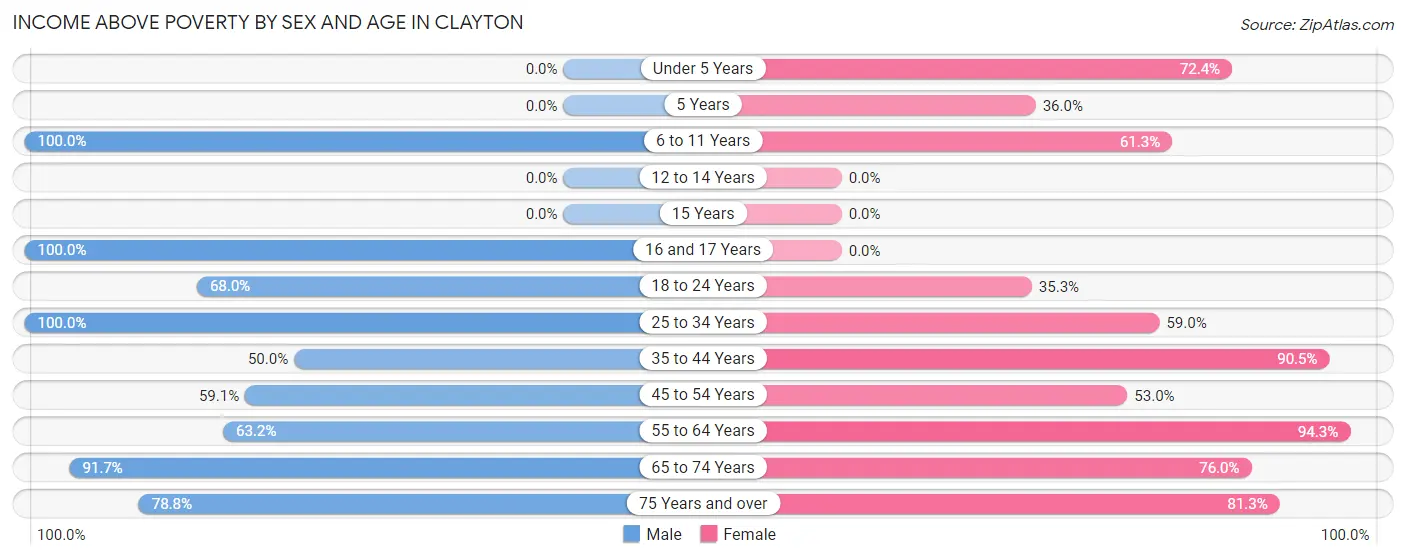
| Age Bracket | Male | Female |
| Under 5 Years | 0 (0.0%) | 21 (72.4%) |
| 5 Years | 0 (0.0%) | 9 (36.0%) |
| 6 to 11 Years | 44 (100.0%) | 19 (61.3%) |
| 12 to 14 Years | 0 (0.0%) | 0 (0.0%) |
| 15 Years | 0 (0.0%) | 0 (0.0%) |
| 16 and 17 Years | 7 (100.0%) | 0 (0.0%) |
| 18 to 24 Years | 17 (68.0%) | 18 (35.3%) |
| 25 to 34 Years | 29 (100.0%) | 23 (59.0%) |
| 35 to 44 Years | 22 (50.0%) | 38 (90.5%) |
| 45 to 54 Years | 26 (59.1%) | 44 (53.0%) |
| 55 to 64 Years | 36 (63.2%) | 50 (94.3%) |
| 65 to 74 Years | 33 (91.7%) | 57 (76.0%) |
| 75 Years and over | 26 (78.8%) | 52 (81.2%) |
| Total | 240 (75.2%) | 331 (67.3%) |
Income Below Poverty Among Married-Couple Families in Clayton
The poverty statistics for married-couple families in Clayton show that 8.1% or 10 of the total 124 families live below the poverty line. Families with 1 or 2 children have the highest poverty rate of 55.6%, comprising of 5 families. On the other hand, families with 3 or 4 children have the lowest poverty rate of 0.0%, which includes 0 families.
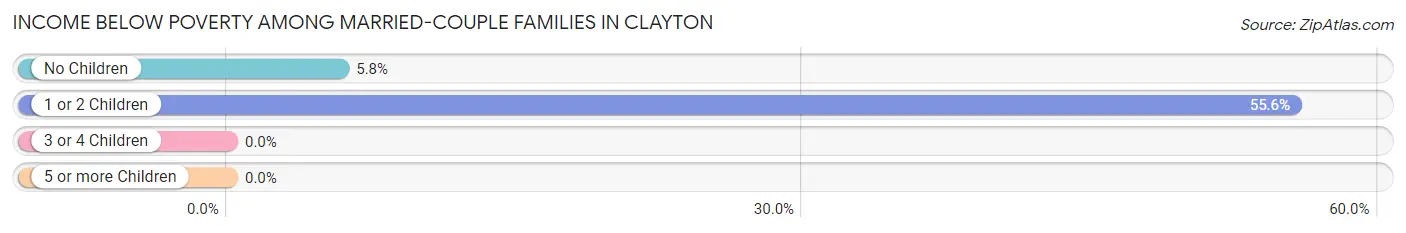
| Children | Above Poverty | Below Poverty |
| No Children | 81 (94.2%) | 5 (5.8%) |
| 1 or 2 Children | 4 (44.4%) | 5 (55.6%) |
| 3 or 4 Children | 29 (100.0%) | 0 (0.0%) |
| 5 or more Children | 0 (0.0%) | 0 (0.0%) |
| Total | 114 (91.9%) | 10 (8.1%) |
Income Below Poverty Among Single-Parent Households in Clayton
According to the poverty data in Clayton, 100.0% or 10 single-father households and 30.7% or 27 single-mother households are living below the poverty line. Among single-father households, those with no children have the highest poverty rate, with 10 households (100.0%) experiencing poverty. Likewise, among single-mother households, those with 1 or 2 children have the highest poverty rate, with 16 households (45.7%) falling below the poverty line.
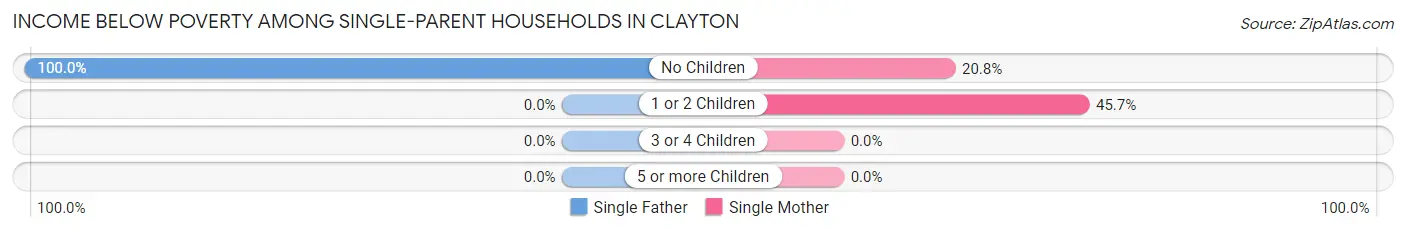
| Children | Single Father | Single Mother |
| No Children | 10 (100.0%) | 11 (20.7%) |
| 1 or 2 Children | 0 (0.0%) | 16 (45.7%) |
| 3 or 4 Children | 0 (0.0%) | 0 (0.0%) |
| 5 or more Children | 0 (0.0%) | 0 (0.0%) |
| Total | 10 (100.0%) | 27 (30.7%) |
Income Below Poverty Among Married-Couple vs Single-Parent Households in Clayton
The poverty data for Clayton shows that 10 of the married-couple family households (8.1%) and 37 of the single-parent households (37.8%) are living below the poverty level. Within the married-couple family households, those with 1 or 2 children have the highest poverty rate, with 5 households (55.6%) falling below the poverty line. Among the single-parent households, those with 1 or 2 children have the highest poverty rate, with 16 household (45.7%) living below poverty.
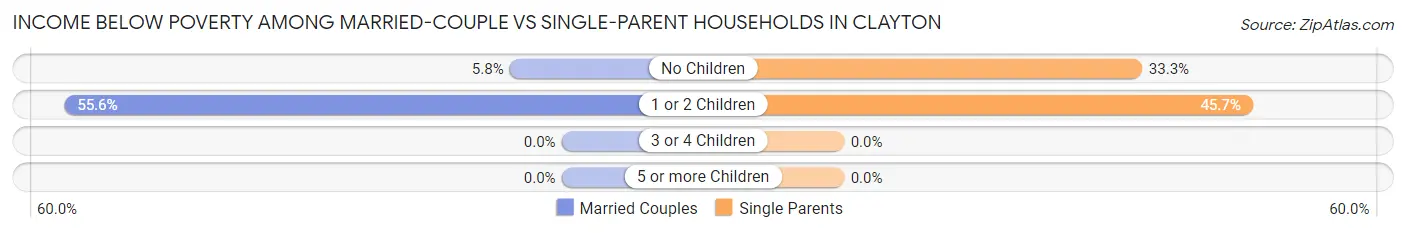
| Children | Married-Couple Families | Single-Parent Households |
| No Children | 5 (5.8%) | 21 (33.3%) |
| 1 or 2 Children | 5 (55.6%) | 16 (45.7%) |
| 3 or 4 Children | 0 (0.0%) | 0 (0.0%) |
| 5 or more Children | 0 (0.0%) | 0 (0.0%) |
| Total | 10 (8.1%) | 37 (37.8%) |
Race in Clayton
The most populous races in Clayton are Black / African American (1,380 | 61.9%), White / Caucasian (764 | 34.3%), and Two or more Races (59 | 2.6%).
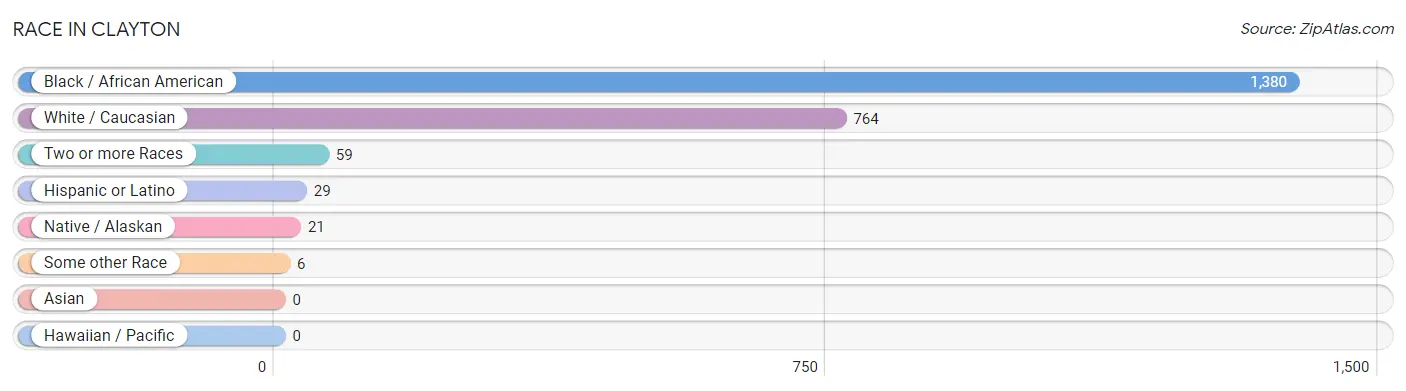
| Race | # Population | % Population |
| Asian | 0 | 0.0% |
| Black / African American | 1,380 | 61.9% |
| Hawaiian / Pacific | 0 | 0.0% |
| Hispanic or Latino | 29 | 1.3% |
| Native / Alaskan | 21 | 0.9% |
| White / Caucasian | 764 | 34.3% |
| Two or more Races | 59 | 2.6% |
| Some other Race | 6 | 0.3% |
| Total | 2,230 | 100.0% |
Ancestry in Clayton
The most populous ancestries reported in Clayton are American (592 | 26.6%), Irish (101 | 4.5%), German (69 | 3.1%), Subsaharan African (41 | 1.8%), and African (36 | 1.6%), together accounting for 37.6% of all Clayton residents.
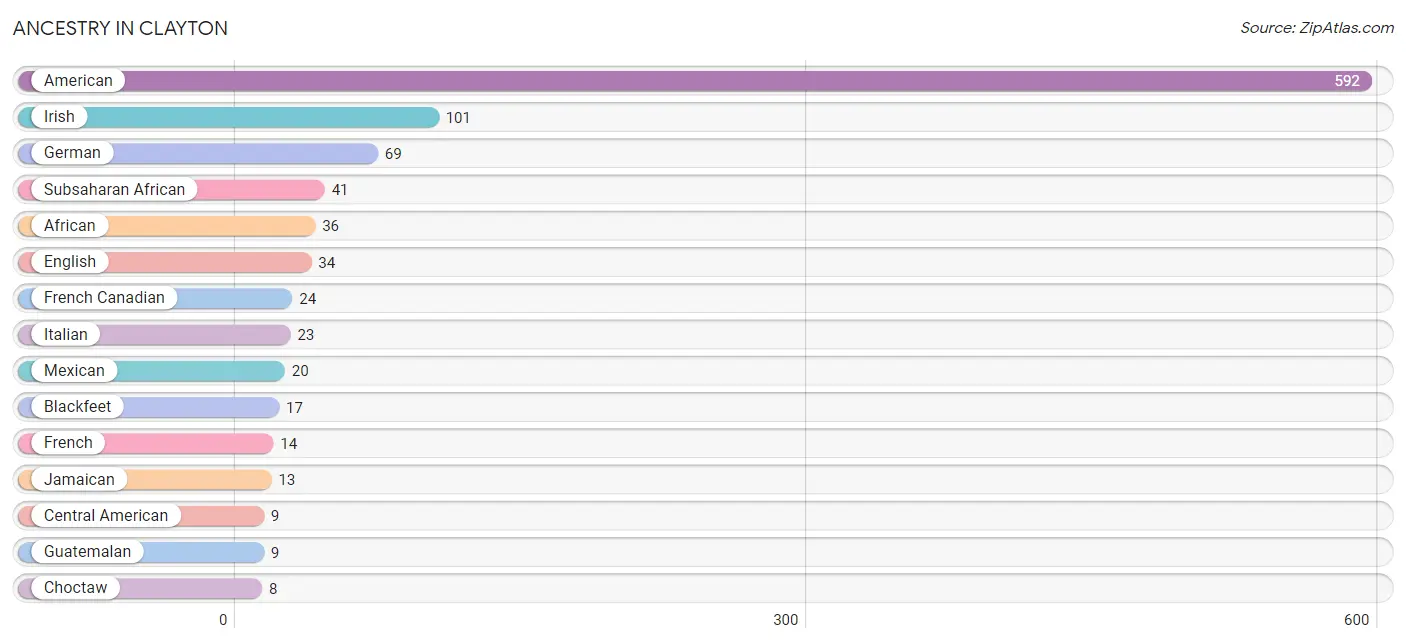
| Ancestry | # Population | % Population |
| African | 36 | 1.6% |
| American | 592 | 26.6% |
| Arab | 6 | 0.3% |
| Austrian | 3 | 0.1% |
| Blackfeet | 17 | 0.8% |
| British | 7 | 0.3% |
| Central American | 9 | 0.4% |
| Cherokee | 7 | 0.3% |
| Choctaw | 8 | 0.4% |
| English | 34 | 1.5% |
| Finnish | 4 | 0.2% |
| French | 14 | 0.6% |
| French Canadian | 24 | 1.1% |
| German | 69 | 3.1% |
| Ghanaian | 5 | 0.2% |
| Guatemalan | 9 | 0.4% |
| Haitian | 6 | 0.3% |
| Irish | 101 | 4.5% |
| Italian | 23 | 1.0% |
| Jamaican | 13 | 0.6% |
| Mexican | 20 | 0.9% |
| Moroccan | 6 | 0.3% |
| Polish | 7 | 0.3% |
| Russian | 6 | 0.3% |
| Scotch-Irish | 7 | 0.3% |
| Scottish | 6 | 0.3% |
| Subsaharan African | 41 | 1.8% |
| Welsh | 3 | 0.1% | View All 28 Rows |
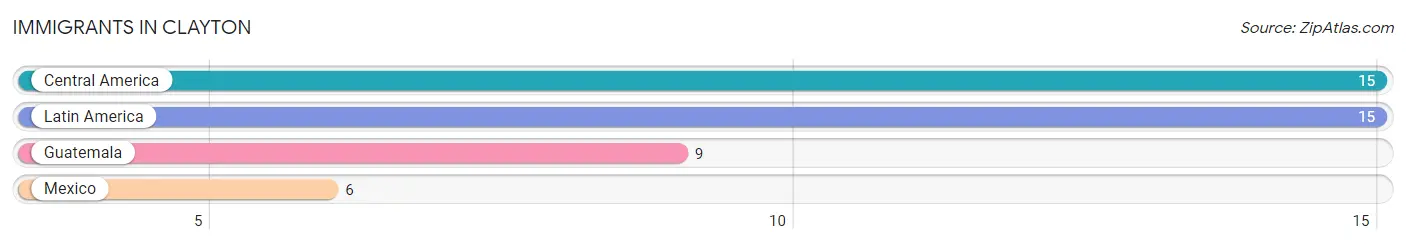
Immigrants in Clayton
The most numerous immigrant groups reported in Clayton came from Central America (15 | 0.7%), Latin America (15 | 0.7%), Guatemala (9 | 0.4%), and Mexico (6 | 0.3%), together accounting for 2.0% of all Clayton residents.
| Immigration Origin | # Population | % Population |
| Central America | 15 | 0.7% |
| Guatemala | 9 | 0.4% |
| Latin America | 15 | 0.7% |
| Mexico | 6 | 0.3% | View All 4 Rows |
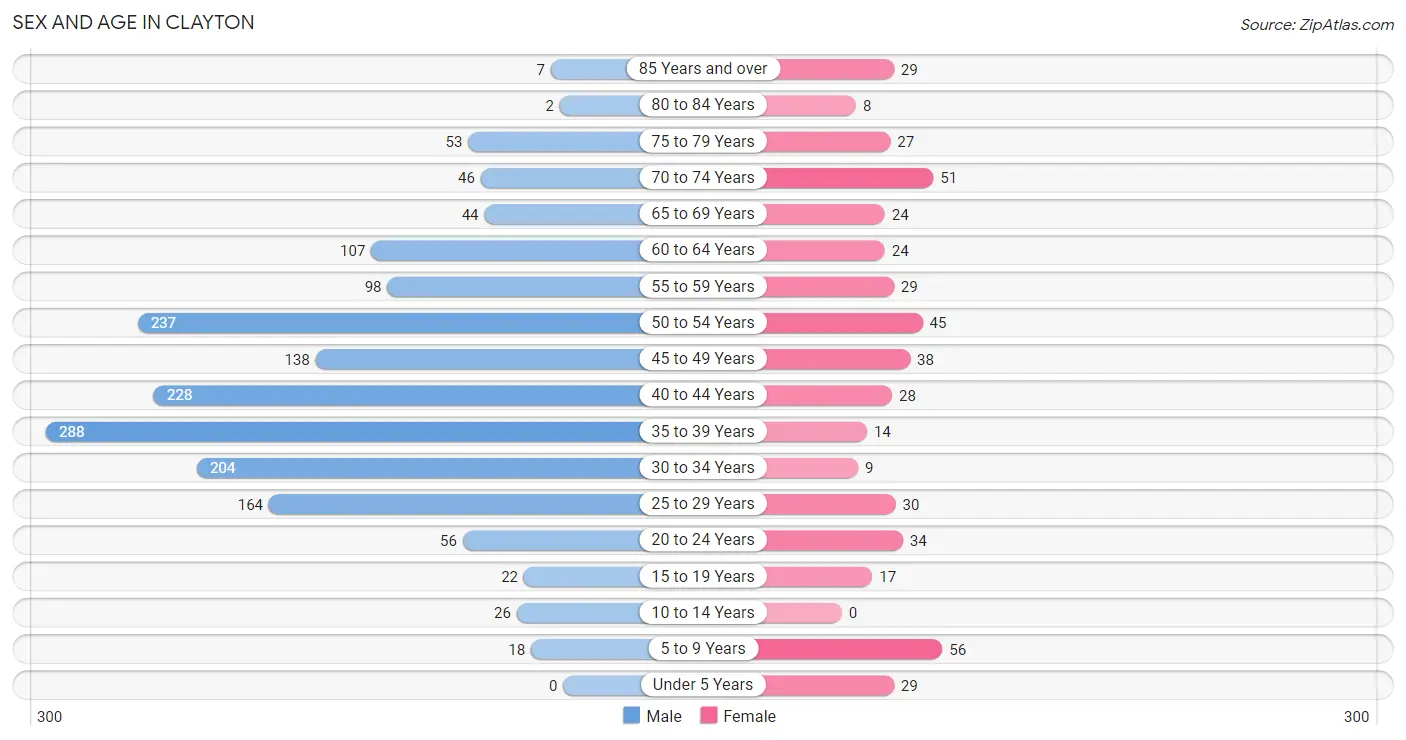
Sex and Age in Clayton
Sex and Age in Clayton
The most populous age groups in Clayton are 35 to 39 Years (288 | 16.6%) for men and 5 to 9 Years (56 | 11.4%) for women.
| Age Bracket | Male | Female |
| Under 5 Years | 0 (0.0%) | 29 (5.9%) |
| 5 to 9 Years | 18 (1.0%) | 56 (11.4%) |
| 10 to 14 Years | 26 (1.5%) | 0 (0.0%) |
| 15 to 19 Years | 22 (1.3%) | 17 (3.5%) |
| 20 to 24 Years | 56 (3.2%) | 34 (6.9%) |
| 25 to 29 Years | 164 (9.4%) | 30 (6.1%) |
| 30 to 34 Years | 204 (11.7%) | 9 (1.8%) |
| 35 to 39 Years | 288 (16.6%) | 14 (2.9%) |
| 40 to 44 Years | 228 (13.1%) | 28 (5.7%) |
| 45 to 49 Years | 138 (7.9%) | 38 (7.7%) |
| 50 to 54 Years | 237 (13.6%) | 45 (9.1%) |
| 55 to 59 Years | 98 (5.6%) | 29 (5.9%) |
| 60 to 64 Years | 107 (6.2%) | 24 (4.9%) |
| 65 to 69 Years | 44 (2.5%) | 24 (4.9%) |
| 70 to 74 Years | 46 (2.6%) | 51 (10.4%) |
| 75 to 79 Years | 53 (3.0%) | 27 (5.5%) |
| 80 to 84 Years | 2 (0.1%) | 8 (1.6%) |
| 85 Years and over | 7 (0.4%) | 29 (5.9%) |
| Total | 1,738 (100.0%) | 492 (100.0%) |
Families and Households in Clayton
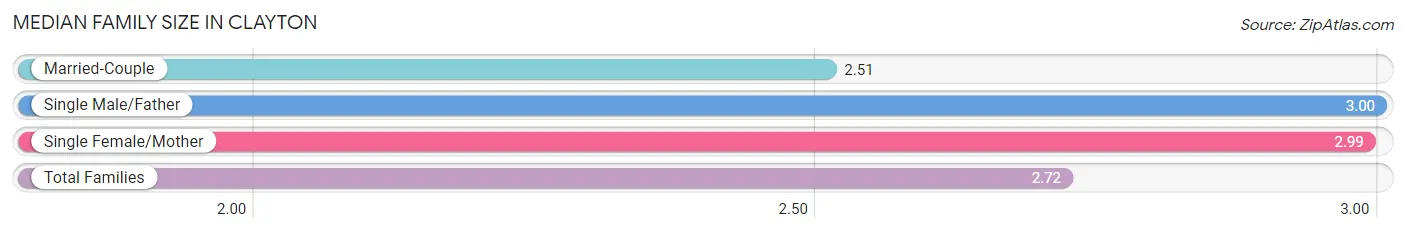
Median Family Size in Clayton
The median family size in Clayton is 2.72 persons per family, with single male/father families (10 | 4.5%) accounting for the largest median family size of 3 persons per family. On the other hand, married-couple families (124 | 55.9%) represent the smallest median family size with 2.51 persons per family.
| Family Type | # Families | Family Size |
| Married-Couple | 124 (55.9%) | 2.51 |
| Single Male/Father | 10 (4.5%) | 3.00 |
| Single Female/Mother | 88 (39.6%) | 2.99 |
| Total Families | 222 (100.0%) | 2.72 |
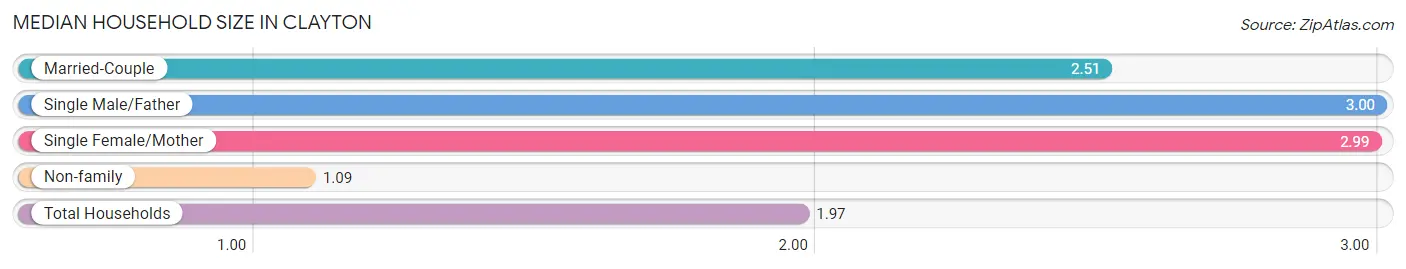
Median Household Size in Clayton
The median household size in Clayton is 1.97 persons per household, with single male/father households (10 | 2.4%) accounting for the largest median household size of 3 persons per household. non-family households (190 | 46.1%) represent the smallest median household size with 1.09 persons per household.
| Household Type | # Households | Household Size |
| Married-Couple | 124 (30.1%) | 2.51 |
| Single Male/Father | 10 (2.4%) | 3.00 |
| Single Female/Mother | 88 (21.4%) | 2.99 |
| Non-family | 190 (46.1%) | 1.09 |
| Total Households | 412 (100.0%) | 1.97 |
Household Size by Marriage Status in Clayton
Out of a total of 412 households in Clayton, 222 (53.9%) are family households, while 190 (46.1%) are nonfamily households. The most numerous type of family households are 2-person households, comprising 140, and the most common type of nonfamily households are 1-person households, comprising 179.
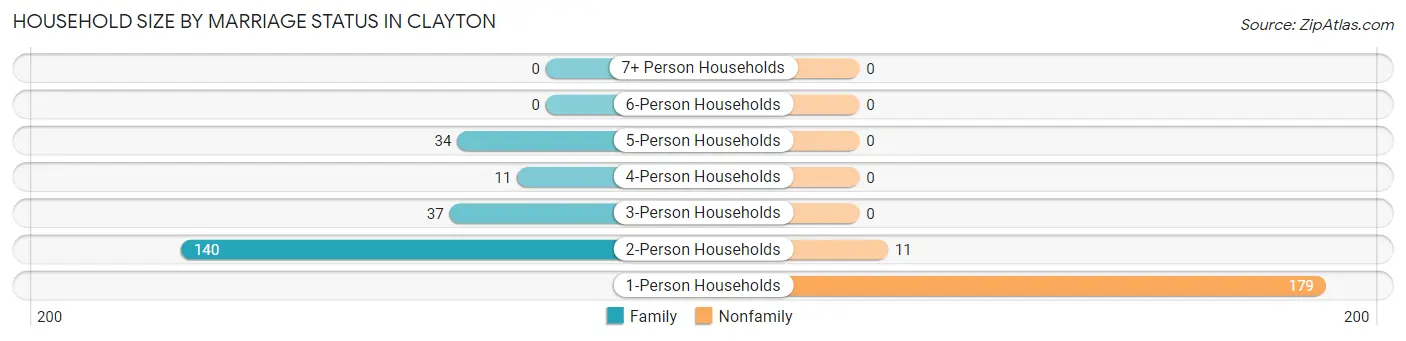
| Household Size | Family Households | Nonfamily Households |
| 1-Person Households | - | 179 (43.4%) |
| 2-Person Households | 140 (34.0%) | 11 (2.7%) |
| 3-Person Households | 37 (9.0%) | 0 (0.0%) |
| 4-Person Households | 11 (2.7%) | 0 (0.0%) |
| 5-Person Households | 34 (8.3%) | 0 (0.0%) |
| 6-Person Households | 0 (0.0%) | 0 (0.0%) |
| 7+ Person Households | 0 (0.0%) | 0 (0.0%) |
| Total | 222 (53.9%) | 190 (46.1%) |
Female Fertility in Clayton
Fertility by Age in Clayton
Average fertility rate in Clayton is 99.0 births per 1,000 women. Women in the age bracket of 20 to 34 years have the highest fertility rate with 151.0 births per 1,000 women. Women in the age bracket of 20 to 34 years acount for 55.0% of all women with births.
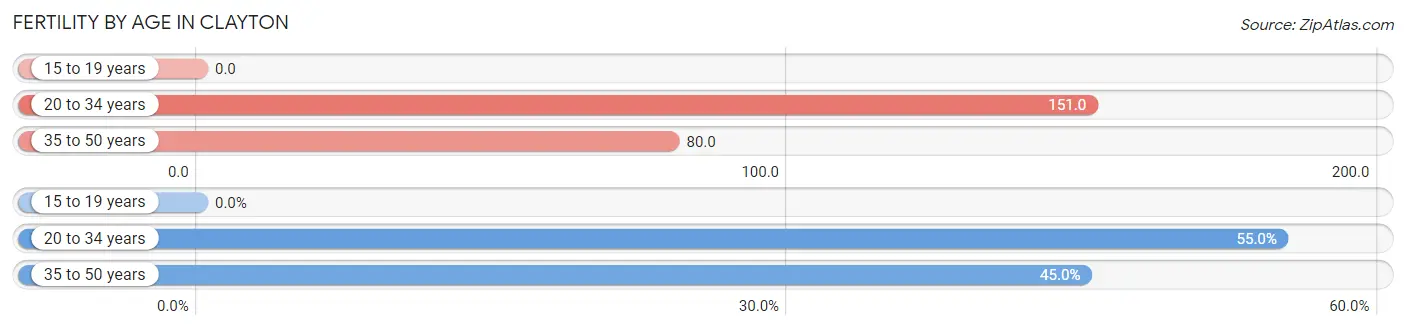
| Age Bracket | Women with Births | Births / 1,000 Women |
| 15 to 19 years | 0 (0.0%) | 0.0 |
| 20 to 34 years | 11 (55.0%) | 151.0 |
| 35 to 50 years | 9 (45.0%) | 80.0 |
| Total | 20 (100.0%) | 99.0 |
Fertility by Age by Marriage Status in Clayton
80.0% of women with births (20) in Clayton are married. The highest percentage of unmarried women with births falls into 35 to 50 years age bracket with 44.4% of them unmarried at the time of birth, while the lowest percentage of unmarried women with births belong to 20 to 34 years age bracket with 0.0% of them unmarried.
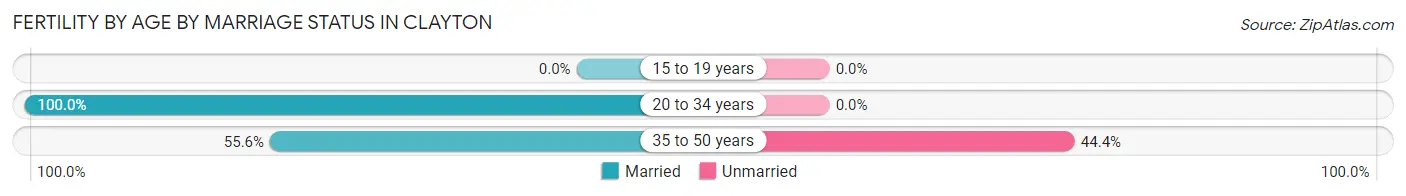
| Age Bracket | Married | Unmarried |
| 15 to 19 years | 0 (0.0%) | 0 (0.0%) |
| 20 to 34 years | 11 (100.0%) | 0 (0.0%) |
| 35 to 50 years | 5 (55.6%) | 4 (44.4%) |
| Total | 16 (80.0%) | 4 (20.0%) |
Fertility by Education in Clayton
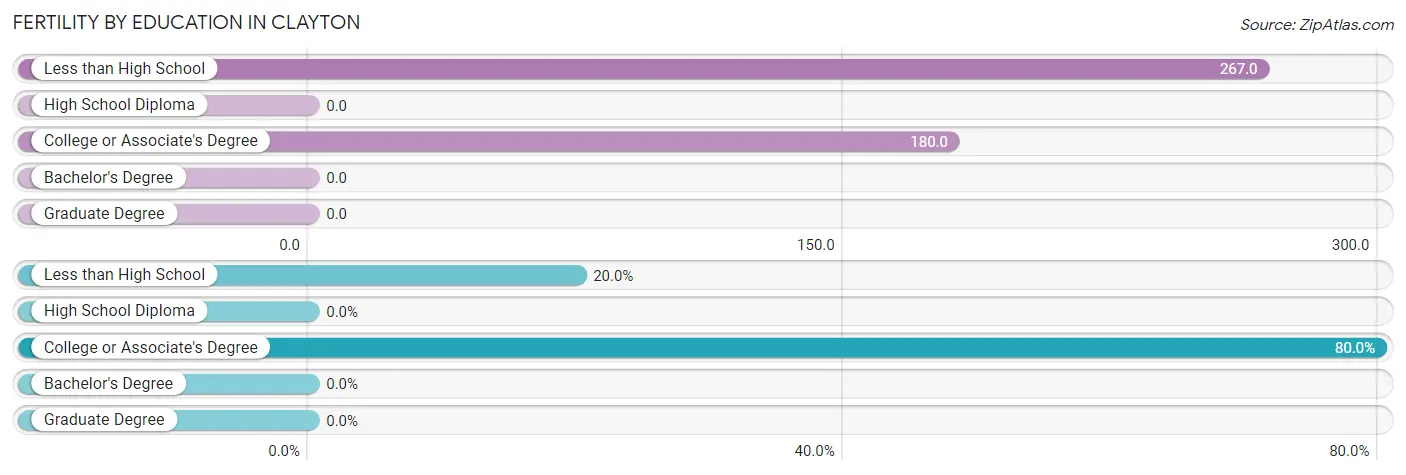
| Educational Attainment | Women with Births | Births / 1,000 Women |
| Less than High School | 4 (20.0%) | 267.0 |
| High School Diploma | 0 (0.0%) | 0.0 |
| College or Associate's Degree | 16 (80.0%) | 180.0 |
| Bachelor's Degree | 0 (0.0%) | 0.0 |
| Graduate Degree | 0 (0.0%) | 0.0 |
| Total | 20 (100.0%) | 99.0 |
Fertility by Education by Marriage Status in Clayton
20.0% of women with births in Clayton are unmarried. Women with the educational attainment of college or associate's degree are most likely to be married with 100.0% of them married at childbirth, while women with the educational attainment of less than high school are least likely to be married with 100.0% of them unmarried at childbirth.
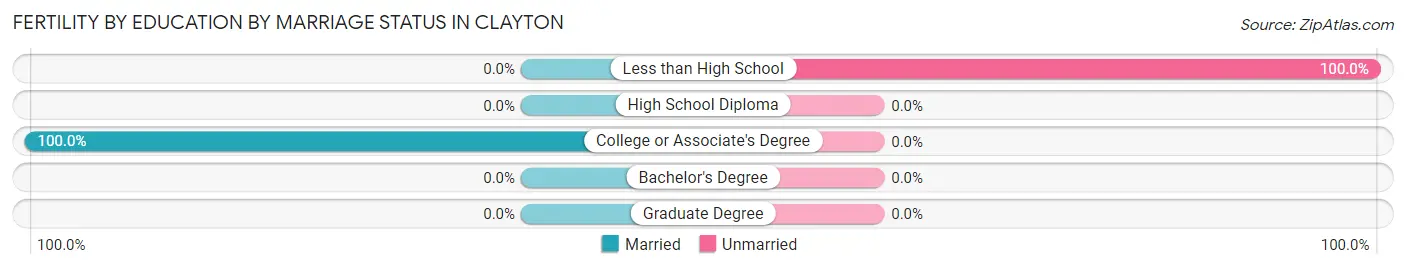
| Educational Attainment | Married | Unmarried |
| Less than High School | 0 (0.0%) | 4 (100.0%) |
| High School Diploma | 0 (0.0%) | 0 (0.0%) |
| College or Associate's Degree | 16 (100.0%) | 0 (0.0%) |
| Bachelor's Degree | 0 (0.0%) | 0 (0.0%) |
| Graduate Degree | 0 (0.0%) | 0 (0.0%) |
| Total | 16 (80.0%) | 4 (20.0%) |
Employment Characteristics in Clayton
Employment by Class of Employer in Clayton
Among the 295 employed individuals in Clayton, private company employees (223 | 75.6%), local government employees (30 | 10.2%), and state government employees (17 | 5.8%) make up the most common classes of employment.
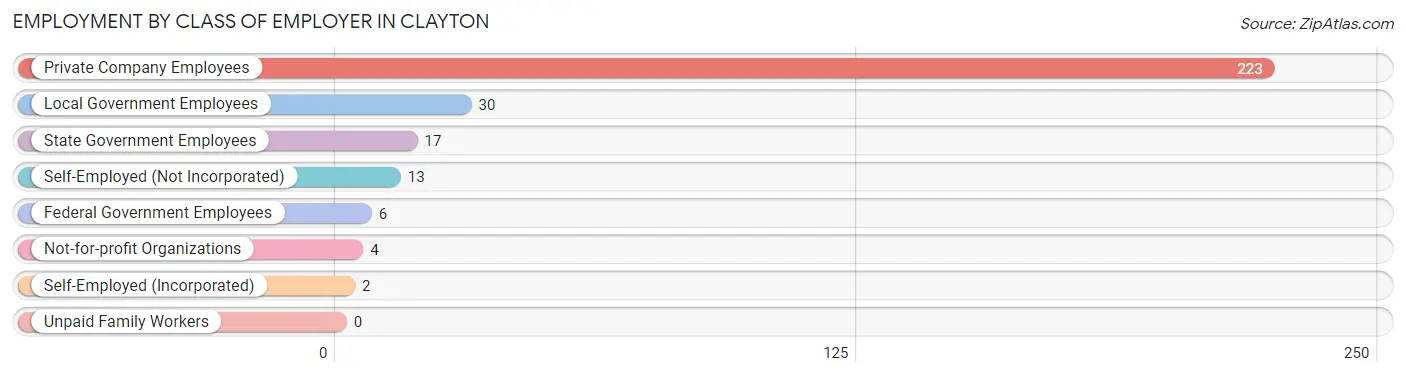
| Employer Class | # Employees | % Employees |
| Private Company Employees | 223 | 75.6% |
| Self-Employed (Incorporated) | 2 | 0.7% |
| Self-Employed (Not Incorporated) | 13 | 4.4% |
| Not-for-profit Organizations | 4 | 1.4% |
| Local Government Employees | 30 | 10.2% |
| State Government Employees | 17 | 5.8% |
| Federal Government Employees | 6 | 2.0% |
| Unpaid Family Workers | 0 | 0.0% |
| Total | 295 | 100.0% |
Employment Status by Age in Clayton
According to the labor force statistics for Clayton, out of the total population over 16 years of age (2,101), 15.3% or 321 individuals are in the labor force, with 3.7% or 12 of them unemployed. The age group with the highest labor force participation rate is 16 to 19 years, with 43.6% or 17 individuals in the labor force. Within the labor force, the 25 to 29 years age range has the highest percentage of unemployed individuals, with 38.9% or 7 of them being unemployed.
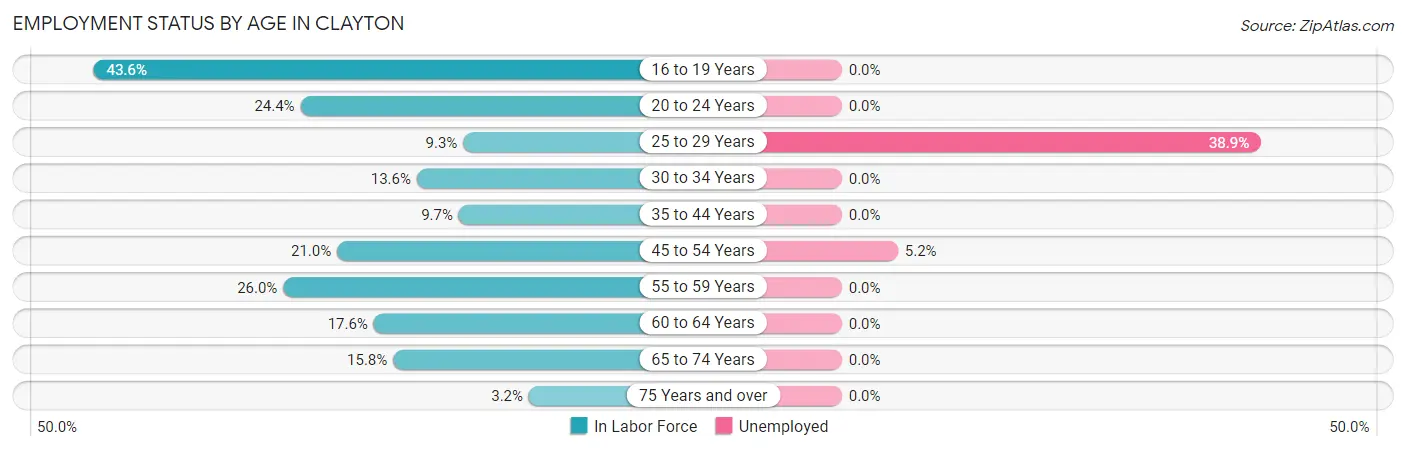
| Age Bracket | In Labor Force | Unemployed |
| 16 to 19 Years | 17 (43.6%) | 0 (0.0%) |
| 20 to 24 Years | 22 (24.4%) | 0 (0.0%) |
| 25 to 29 Years | 18 (9.3%) | 7 (38.9%) |
| 30 to 34 Years | 29 (13.6%) | 0 (0.0%) |
| 35 to 44 Years | 54 (9.7%) | 0 (0.0%) |
| 45 to 54 Years | 96 (21.0%) | 5 (5.2%) |
| 55 to 59 Years | 33 (26.0%) | 0 (0.0%) |
| 60 to 64 Years | 23 (17.6%) | 0 (0.0%) |
| 65 to 74 Years | 26 (15.8%) | 0 (0.0%) |
| 75 Years and over | 4 (3.2%) | 0 (0.0%) |
| Total | 321 (15.3%) | 12 (3.7%) |
Employment Status by Educational Attainment in Clayton
According to labor force statistics for Clayton, 15.1% of individuals (254) out of the total population between 25 and 64 years of age (1,681) are in the labor force, with 4.7% or 12 of them being unemployed. The group with the highest labor force participation rate are those with the educational attainment of bachelor's degree or higher, with 36.2% or 17 individuals in the labor force. Within the labor force, individuals with college / associate degree education have the highest percentage of unemployment, with 7.7% or 5 of them being unemployed.
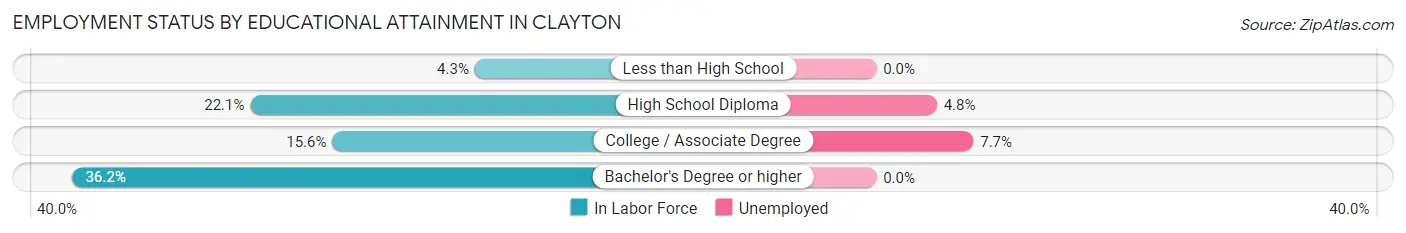
| Educational Attainment | In Labor Force | Unemployed |
| Less than High School | 24 (4.3%) | 0 (0.0%) |
| High School Diploma | 147 (22.1%) | 32 (4.8%) |
| College / Associate Degree | 65 (15.6%) | 32 (7.7%) |
| Bachelor's Degree or higher | 17 (36.2%) | 0 (0.0%) |
| Total | 254 (15.1%) | 79 (4.7%) |
Employment Occupations by Sex in Clayton
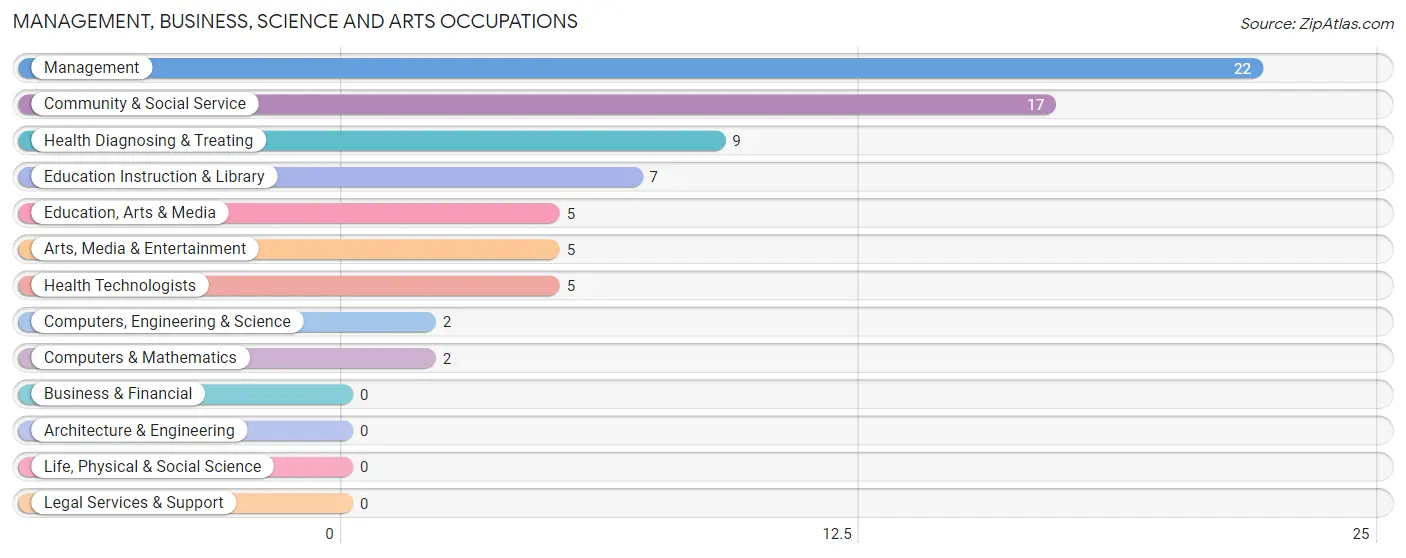
Management, Business, Science and Arts Occupations
The most common Management, Business, Science and Arts occupations in Clayton are Management (22 | 7.1%), Community & Social Service (17 | 5.5%), Health Diagnosing & Treating (9 | 2.9%), Education Instruction & Library (7 | 2.3%), and Education, Arts & Media (5 | 1.6%).
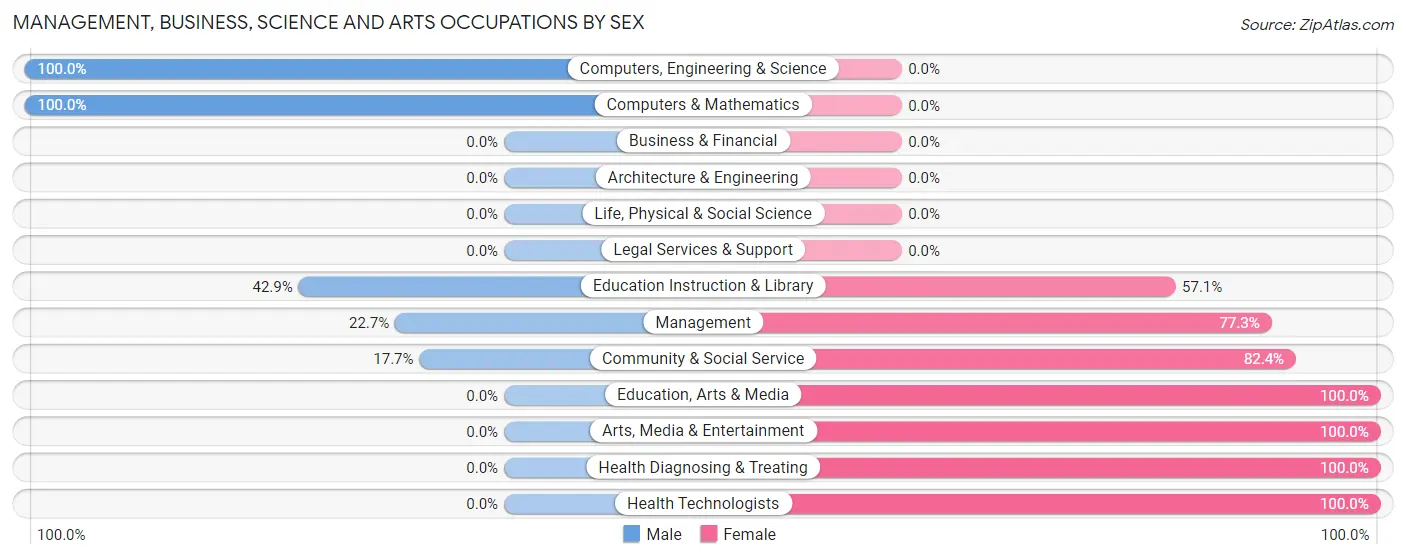
Management, Business, Science and Arts Occupations by Sex
Within the Management, Business, Science and Arts occupations in Clayton, the most male-oriented occupations are Computers, Engineering & Science (100.0%), Computers & Mathematics (100.0%), and Education Instruction & Library (42.9%), while the most female-oriented occupations are Education, Arts & Media (100.0%), Arts, Media & Entertainment (100.0%), and Health Diagnosing & Treating (100.0%).
| Occupation | Male | Female |
| Management | 5 (22.7%) | 17 (77.3%) |
| Business & Financial | 0 (0.0%) | 0 (0.0%) |
| Computers, Engineering & Science | 2 (100.0%) | 0 (0.0%) |
| Computers & Mathematics | 2 (100.0%) | 0 (0.0%) |
| Architecture & Engineering | 0 (0.0%) | 0 (0.0%) |
| Life, Physical & Social Science | 0 (0.0%) | 0 (0.0%) |
| Community & Social Service | 3 (17.6%) | 14 (82.4%) |
| Education, Arts & Media | 0 (0.0%) | 5 (100.0%) |
| Legal Services & Support | 0 (0.0%) | 0 (0.0%) |
| Education Instruction & Library | 3 (42.9%) | 4 (57.1%) |
| Arts, Media & Entertainment | 0 (0.0%) | 5 (100.0%) |
| Health Diagnosing & Treating | 0 (0.0%) | 9 (100.0%) |
| Health Technologists | 0 (0.0%) | 5 (100.0%) |
| Total (Category) | 10 (20.0%) | 40 (80.0%) |
| Total (Overall) | 113 (36.4%) | 197 (63.5%) |
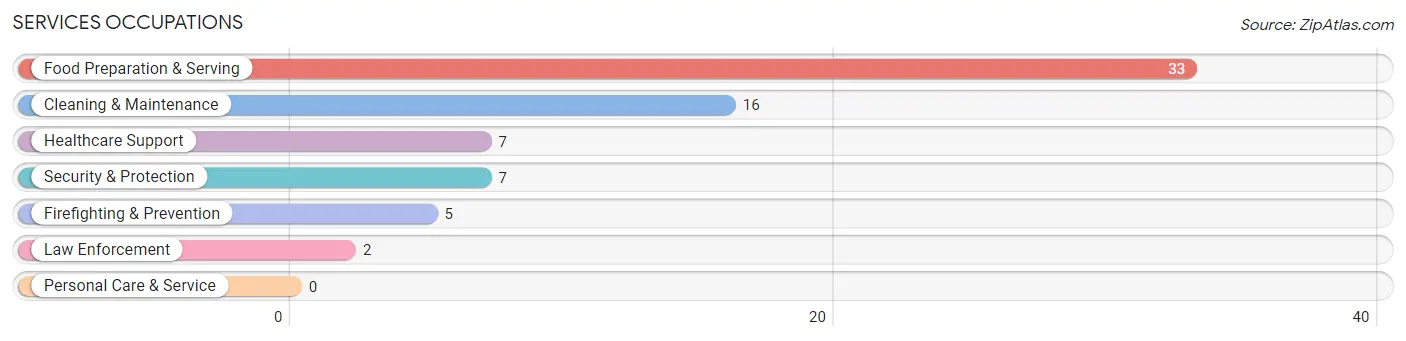
Services Occupations
The most common Services occupations in Clayton are Food Preparation & Serving (33 | 10.6%), Cleaning & Maintenance (16 | 5.2%), Healthcare Support (7 | 2.3%), Security & Protection (7 | 2.3%), and Firefighting & Prevention (5 | 1.6%).
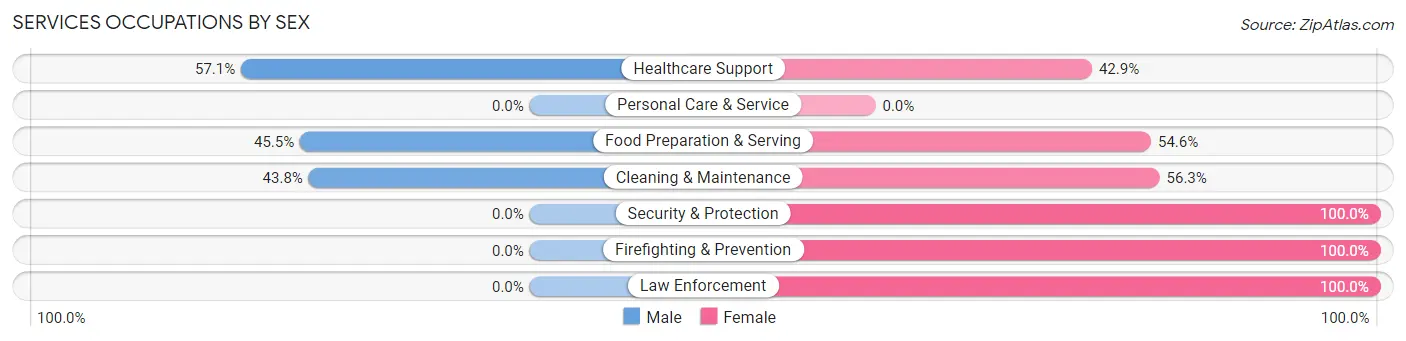
Services Occupations by Sex
Within the Services occupations in Clayton, the most male-oriented occupations are Healthcare Support (57.1%), Food Preparation & Serving (45.5%), and Cleaning & Maintenance (43.8%), while the most female-oriented occupations are Security & Protection (100.0%), Firefighting & Prevention (100.0%), and Law Enforcement (100.0%).
| Occupation | Male | Female |
| Healthcare Support | 4 (57.1%) | 3 (42.9%) |
| Security & Protection | 0 (0.0%) | 7 (100.0%) |
| Firefighting & Prevention | 0 (0.0%) | 5 (100.0%) |
| Law Enforcement | 0 (0.0%) | 2 (100.0%) |
| Food Preparation & Serving | 15 (45.5%) | 18 (54.5%) |
| Cleaning & Maintenance | 7 (43.8%) | 9 (56.2%) |
| Personal Care & Service | 0 (0.0%) | 0 (0.0%) |
| Total (Category) | 26 (41.3%) | 37 (58.7%) |
| Total (Overall) | 113 (36.4%) | 197 (63.5%) |
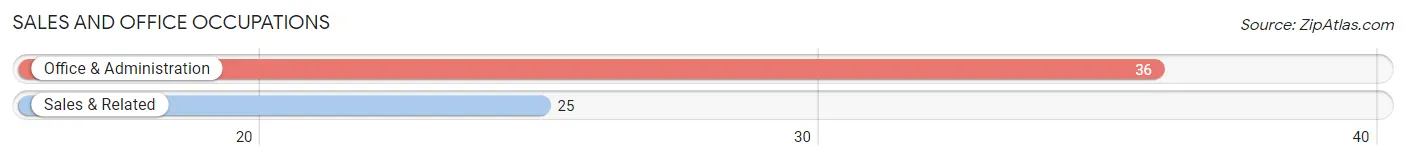
Sales and Office Occupations
The most common Sales and Office occupations in Clayton are Office & Administration (36 | 11.6%), and Sales & Related (25 | 8.1%).
Sales and Office Occupations by Sex
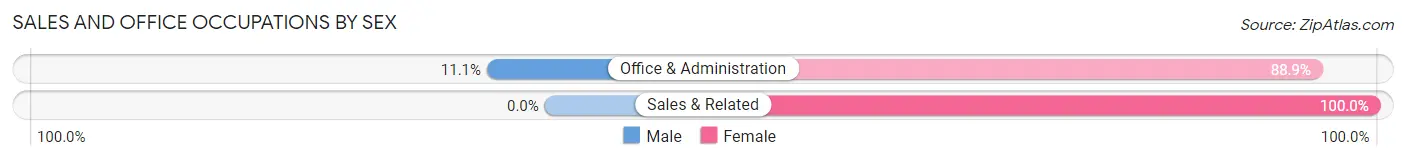
| Occupation | Male | Female |
| Sales & Related | 0 (0.0%) | 25 (100.0%) |
| Office & Administration | 4 (11.1%) | 32 (88.9%) |
| Total (Category) | 4 (6.6%) | 57 (93.4%) |
| Total (Overall) | 113 (36.4%) | 197 (63.5%) |
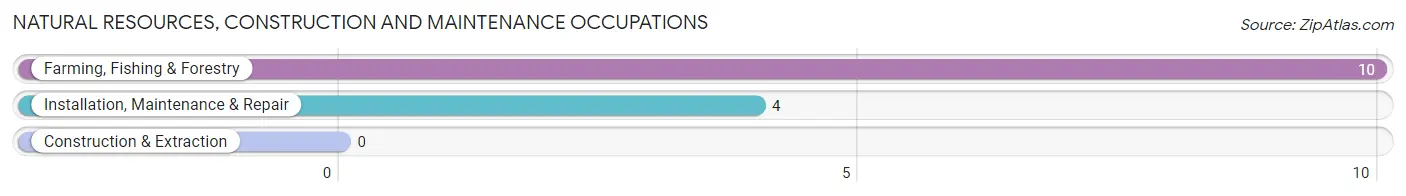
Natural Resources, Construction and Maintenance Occupations
The most common Natural Resources, Construction and Maintenance occupations in Clayton are Farming, Fishing & Forestry (10 | 3.2%), and Installation, Maintenance & Repair (4 | 1.3%).
Natural Resources, Construction and Maintenance Occupations by Sex
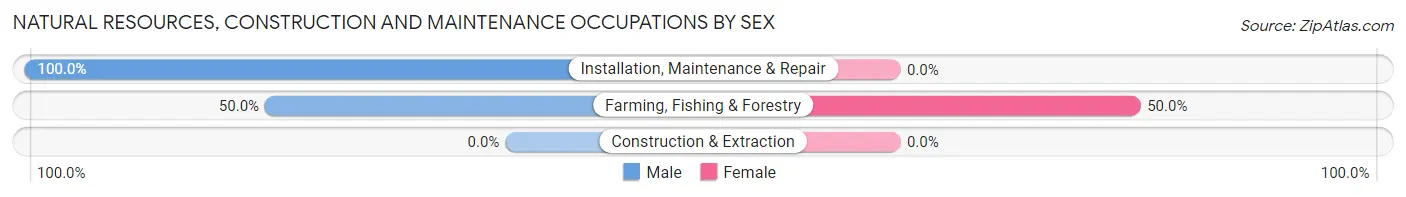
| Occupation | Male | Female |
| Farming, Fishing & Forestry | 5 (50.0%) | 5 (50.0%) |
| Construction & Extraction | 0 (0.0%) | 0 (0.0%) |
| Installation, Maintenance & Repair | 4 (100.0%) | 0 (0.0%) |
| Total (Category) | 9 (64.3%) | 5 (35.7%) |
| Total (Overall) | 113 (36.4%) | 197 (63.5%) |
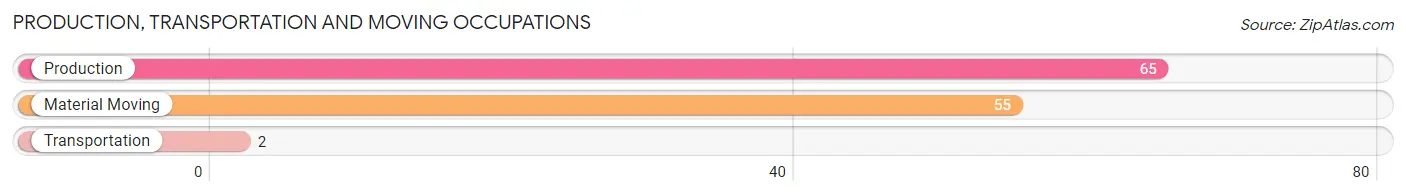
Production, Transportation and Moving Occupations
The most common Production, Transportation and Moving occupations in Clayton are Production (65 | 21.0%), Material Moving (55 | 17.7%), and Transportation (2 | 0.6%).
Production, Transportation and Moving Occupations by Sex
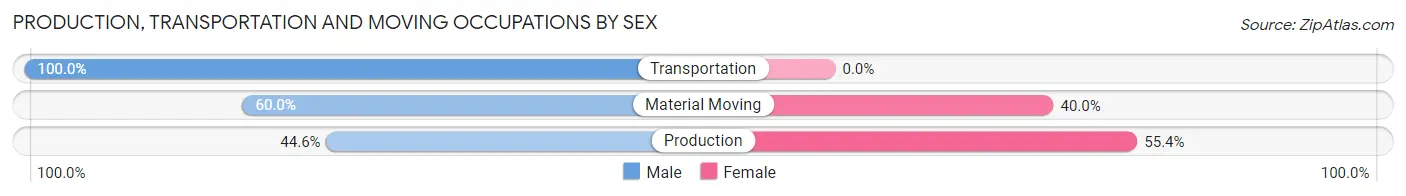
| Occupation | Male | Female |
| Production | 29 (44.6%) | 36 (55.4%) |
| Transportation | 2 (100.0%) | 0 (0.0%) |
| Material Moving | 33 (60.0%) | 22 (40.0%) |
| Total (Category) | 64 (52.5%) | 58 (47.5%) |
| Total (Overall) | 113 (36.4%) | 197 (63.5%) |
Employment Industries by Sex in Clayton
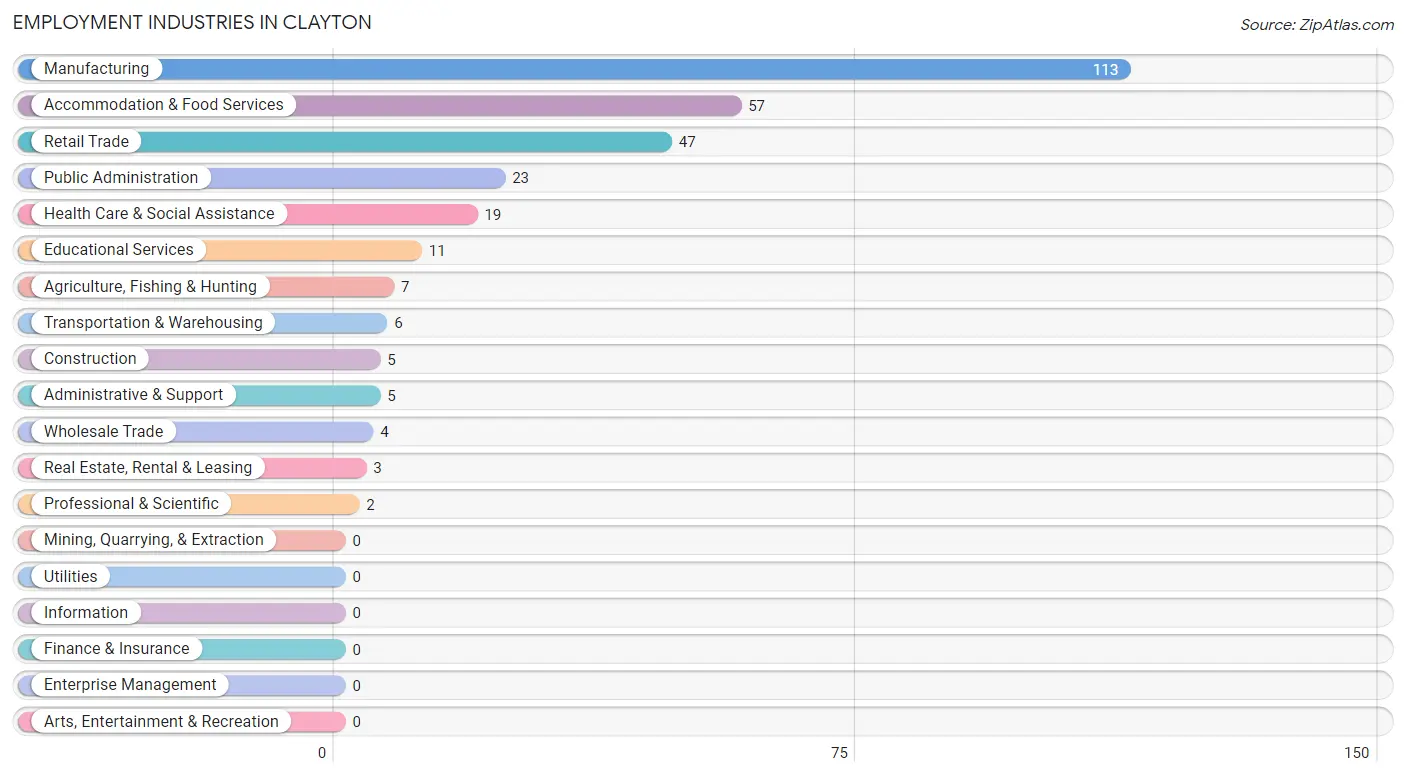
Employment Industries in Clayton
The major employment industries in Clayton include Manufacturing (113 | 36.4%), Accommodation & Food Services (57 | 18.4%), Retail Trade (47 | 15.2%), Public Administration (23 | 7.4%), and Health Care & Social Assistance (19 | 6.1%).
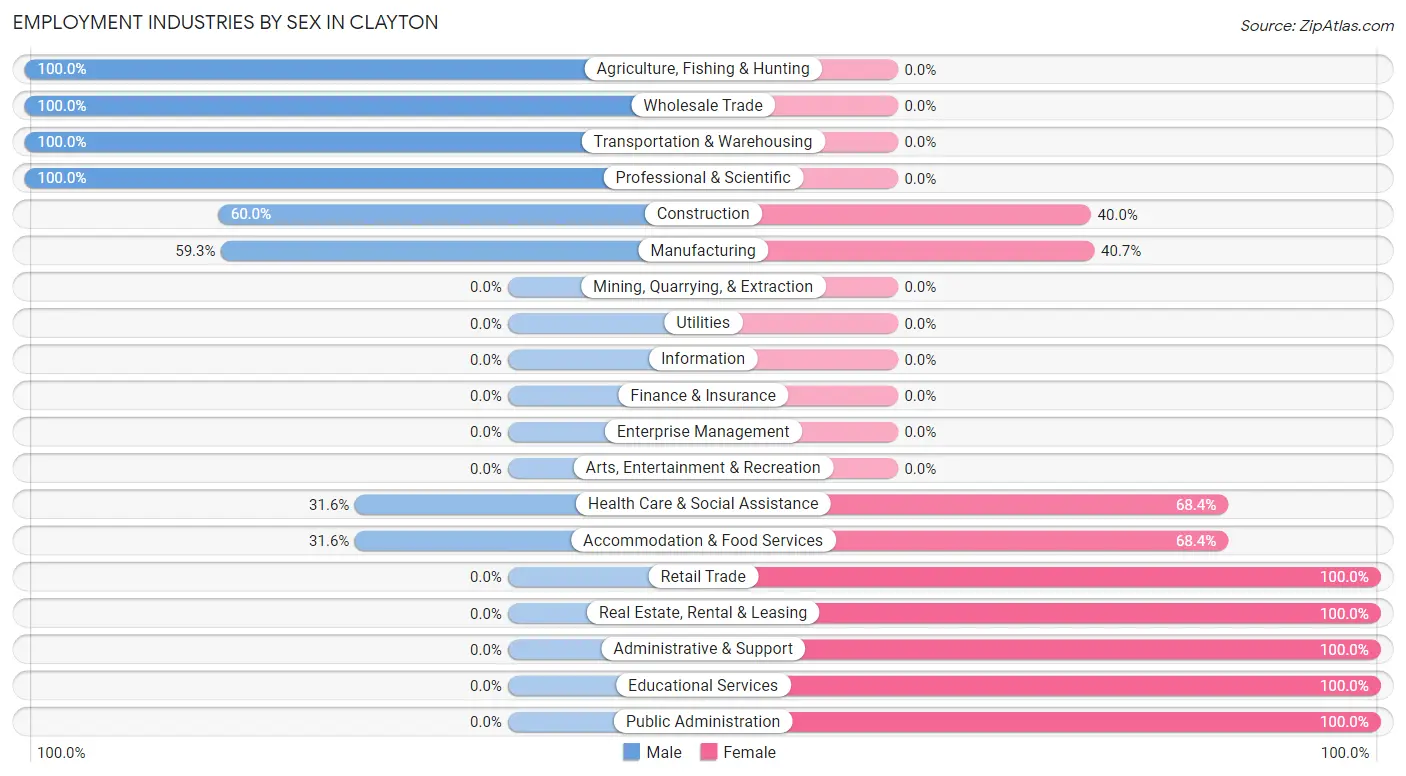
Employment Industries by Sex in Clayton
The Clayton industries that see more men than women are Agriculture, Fishing & Hunting (100.0%), Wholesale Trade (100.0%), and Transportation & Warehousing (100.0%), whereas the industries that tend to have a higher number of women are Retail Trade (100.0%), Real Estate, Rental & Leasing (100.0%), and Administrative & Support (100.0%).
| Industry | Male | Female |
| Agriculture, Fishing & Hunting | 7 (100.0%) | 0 (0.0%) |
| Mining, Quarrying, & Extraction | 0 (0.0%) | 0 (0.0%) |
| Construction | 3 (60.0%) | 2 (40.0%) |
| Manufacturing | 67 (59.3%) | 46 (40.7%) |
| Wholesale Trade | 4 (100.0%) | 0 (0.0%) |
| Retail Trade | 0 (0.0%) | 47 (100.0%) |
| Transportation & Warehousing | 6 (100.0%) | 0 (0.0%) |
| Utilities | 0 (0.0%) | 0 (0.0%) |
| Information | 0 (0.0%) | 0 (0.0%) |
| Finance & Insurance | 0 (0.0%) | 0 (0.0%) |
| Real Estate, Rental & Leasing | 0 (0.0%) | 3 (100.0%) |
| Professional & Scientific | 2 (100.0%) | 0 (0.0%) |
| Enterprise Management | 0 (0.0%) | 0 (0.0%) |
| Administrative & Support | 0 (0.0%) | 5 (100.0%) |
| Educational Services | 0 (0.0%) | 11 (100.0%) |
| Health Care & Social Assistance | 6 (31.6%) | 13 (68.4%) |
| Arts, Entertainment & Recreation | 0 (0.0%) | 0 (0.0%) |
| Accommodation & Food Services | 18 (31.6%) | 39 (68.4%) |
| Public Administration | 0 (0.0%) | 23 (100.0%) |
| Total | 113 (36.4%) | 197 (63.5%) |
Education in Clayton
School Enrollment in Clayton
The most common levels of schooling among the 262 students in Clayton are college / undergraduate (101 | 38.6%), high school (52 | 19.9%), and elementary school (37 | 14.1%).
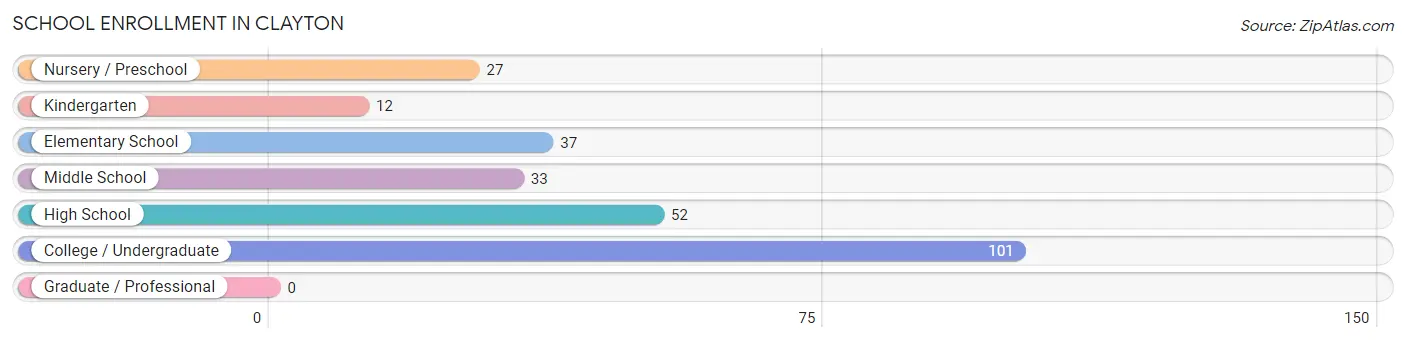
| School Level | # Students | % Students |
| Nursery / Preschool | 27 | 10.3% |
| Kindergarten | 12 | 4.6% |
| Elementary School | 37 | 14.1% |
| Middle School | 33 | 12.6% |
| High School | 52 | 19.9% |
| College / Undergraduate | 101 | 38.6% |
| Graduate / Professional | 0 | 0.0% |
| Total | 262 | 100.0% |
School Enrollment by Age by Funding Source in Clayton
Out of a total of 262 students who are enrolled in schools in Clayton, 32 (12.2%) attend a private institution, while the remaining 230 (87.8%) are enrolled in public schools. The age group of 35 years and over has the highest likelihood of being enrolled in private schools, with 32 (47.1% in the age bracket) enrolled. Conversely, the age group of 3 to 4 year olds has the lowest likelihood of being enrolled in a private school, with 11 (100.0% in the age bracket) attending a public institution.
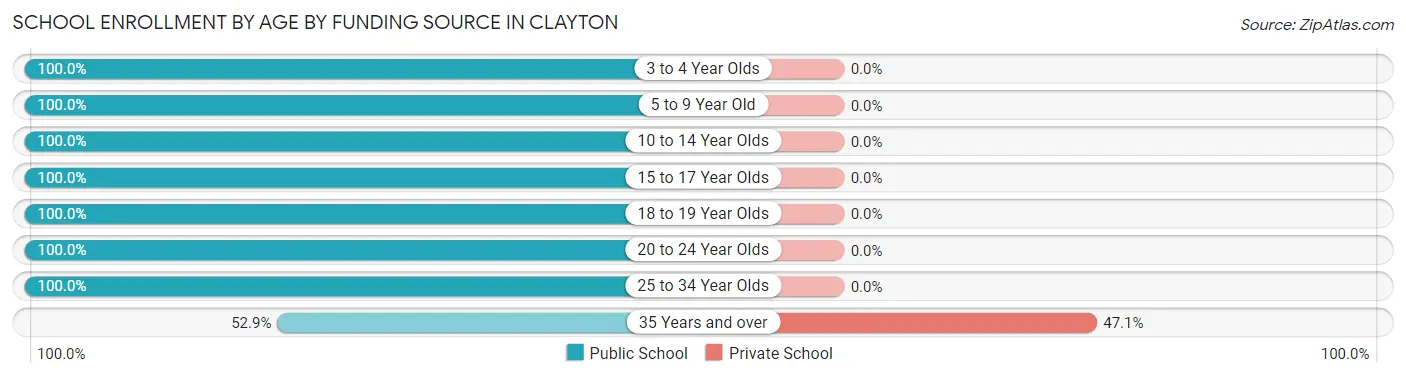
| Age Bracket | Public School | Private School |
| 3 to 4 Year Olds | 11 (100.0%) | 0 (0.0%) |
| 5 to 9 Year Old | 65 (100.0%) | 0 (0.0%) |
| 10 to 14 Year Olds | 26 (100.0%) | 0 (0.0%) |
| 15 to 17 Year Olds | 7 (100.0%) | 0 (0.0%) |
| 18 to 19 Year Olds | 32 (100.0%) | 0 (0.0%) |
| 20 to 24 Year Olds | 34 (100.0%) | 0 (0.0%) |
| 25 to 34 Year Olds | 19 (100.0%) | 0 (0.0%) |
| 35 Years and over | 36 (52.9%) | 32 (47.1%) |
| Total | 230 (87.8%) | 32 (12.2%) |
Educational Attainment by Field of Study in Clayton
Business (19 | 26.8%), education (14 | 19.7%), arts & humanities (13 | 18.3%), literature & languages (8 | 11.3%), and engineering (6 | 8.5%) are the most common fields of study among 71 individuals in Clayton who have obtained a bachelor's degree or higher.
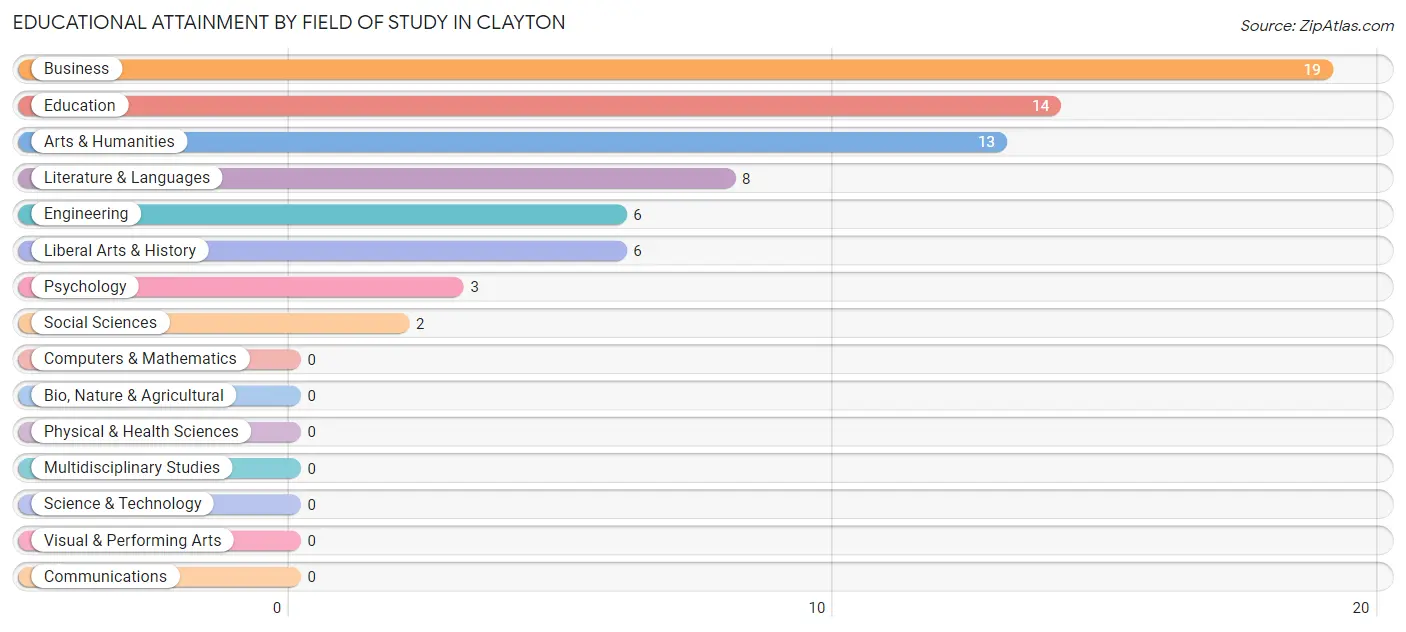
| Field of Study | # Graduates | % Graduates |
| Computers & Mathematics | 0 | 0.0% |
| Bio, Nature & Agricultural | 0 | 0.0% |
| Physical & Health Sciences | 0 | 0.0% |
| Psychology | 3 | 4.2% |
| Social Sciences | 2 | 2.8% |
| Engineering | 6 | 8.5% |
| Multidisciplinary Studies | 0 | 0.0% |
| Science & Technology | 0 | 0.0% |
| Business | 19 | 26.8% |
| Education | 14 | 19.7% |
| Literature & Languages | 8 | 11.3% |
| Liberal Arts & History | 6 | 8.5% |
| Visual & Performing Arts | 0 | 0.0% |
| Communications | 0 | 0.0% |
| Arts & Humanities | 13 | 18.3% |
| Total | 71 | 100.0% |
Transportation & Commute in Clayton
Vehicle Availability by Sex in Clayton
The most prevalent vehicle ownership categories in Clayton are males with 2 vehicles (48, accounting for 42.5%) and females with 2 vehicles (90, making up 26.4%).
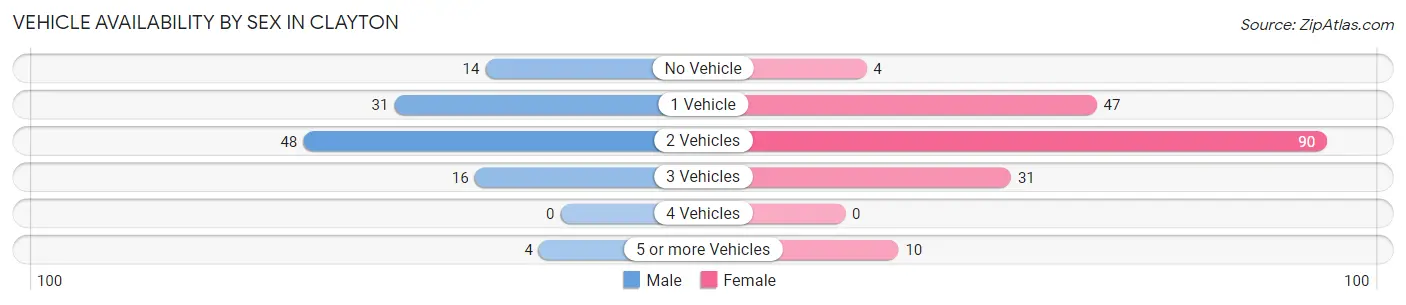
| Vehicles Available | Male | Female |
| No Vehicle | 14 (12.4%) | 4 (2.2%) |
| 1 Vehicle | 31 (27.4%) | 47 (25.8%) |
| 2 Vehicles | 48 (42.5%) | 90 (49.4%) |
| 3 Vehicles | 16 (14.2%) | 31 (17.0%) |
| 4 Vehicles | 0 (0.0%) | 0 (0.0%) |
| 5 or more Vehicles | 4 (3.5%) | 10 (5.5%) |
| Total | 113 (100.0%) | 182 (100.0%) |
Commute Time in Clayton
The most frequently occuring commute durations in Clayton are 5 to 9 minutes (57 commuters, 20.9%), 35 to 39 minutes (33 commuters, 12.1%), and 20 to 24 minutes (32 commuters, 11.7%).
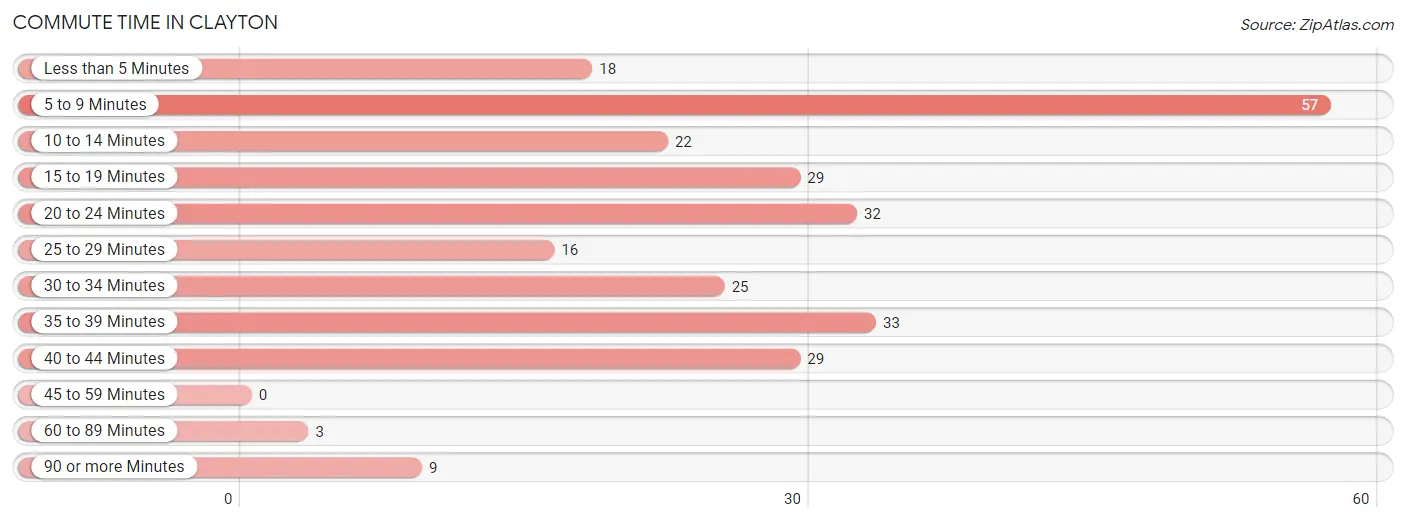
| Commute Time | # Commuters | % Commuters |
| Less than 5 Minutes | 18 | 6.6% |
| 5 to 9 Minutes | 57 | 20.9% |
| 10 to 14 Minutes | 22 | 8.1% |
| 15 to 19 Minutes | 29 | 10.6% |
| 20 to 24 Minutes | 32 | 11.7% |
| 25 to 29 Minutes | 16 | 5.9% |
| 30 to 34 Minutes | 25 | 9.2% |
| 35 to 39 Minutes | 33 | 12.1% |
| 40 to 44 Minutes | 29 | 10.6% |
| 45 to 59 Minutes | 0 | 0.0% |
| 60 to 89 Minutes | 3 | 1.1% |
| 90 or more Minutes | 9 | 3.3% |
Commute Time by Sex in Clayton
The most common commute times in Clayton are 35 to 39 minutes (33 commuters, 32.4%) for males and 5 to 9 minutes (51 commuters, 29.8%) for females.
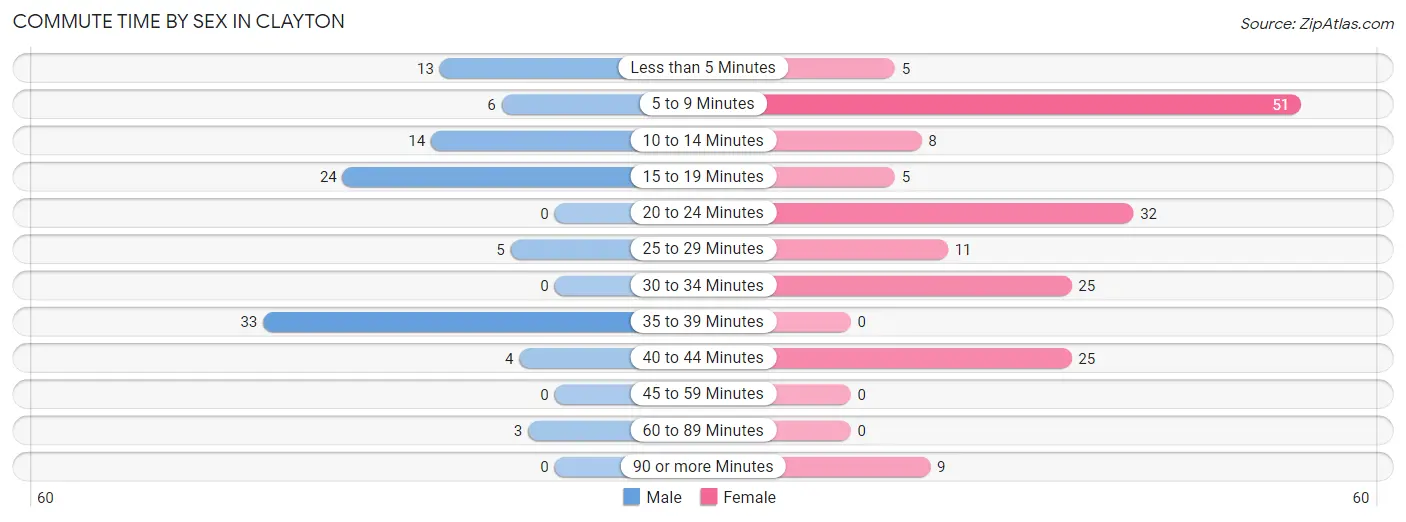
| Commute Time | Male | Female |
| Less than 5 Minutes | 13 (12.8%) | 5 (2.9%) |
| 5 to 9 Minutes | 6 (5.9%) | 51 (29.8%) |
| 10 to 14 Minutes | 14 (13.7%) | 8 (4.7%) |
| 15 to 19 Minutes | 24 (23.5%) | 5 (2.9%) |
| 20 to 24 Minutes | 0 (0.0%) | 32 (18.7%) |
| 25 to 29 Minutes | 5 (4.9%) | 11 (6.4%) |
| 30 to 34 Minutes | 0 (0.0%) | 25 (14.6%) |
| 35 to 39 Minutes | 33 (32.4%) | 0 (0.0%) |
| 40 to 44 Minutes | 4 (3.9%) | 25 (14.6%) |
| 45 to 59 Minutes | 0 (0.0%) | 0 (0.0%) |
| 60 to 89 Minutes | 3 (2.9%) | 0 (0.0%) |
| 90 or more Minutes | 0 (0.0%) | 9 (5.3%) |
Time of Departure to Work by Sex in Clayton
The most frequent times of departure to work in Clayton are 7:30 AM to 7:59 AM (29, 28.4%) for males and 7:00 AM to 7:29 AM (82, 47.9%) for females.
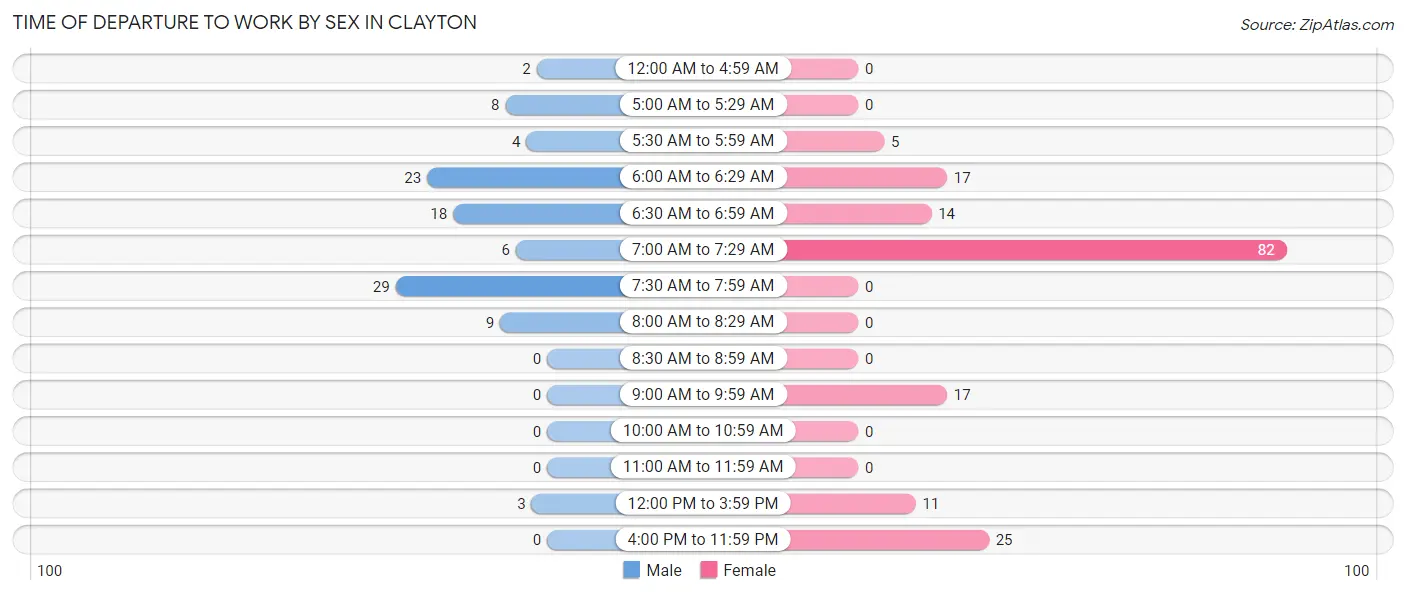
| Time of Departure | Male | Female |
| 12:00 AM to 4:59 AM | 2 (2.0%) | 0 (0.0%) |
| 5:00 AM to 5:29 AM | 8 (7.8%) | 0 (0.0%) |
| 5:30 AM to 5:59 AM | 4 (3.9%) | 5 (2.9%) |
| 6:00 AM to 6:29 AM | 23 (22.6%) | 17 (9.9%) |
| 6:30 AM to 6:59 AM | 18 (17.6%) | 14 (8.2%) |
| 7:00 AM to 7:29 AM | 6 (5.9%) | 82 (47.9%) |
| 7:30 AM to 7:59 AM | 29 (28.4%) | 0 (0.0%) |
| 8:00 AM to 8:29 AM | 9 (8.8%) | 0 (0.0%) |
| 8:30 AM to 8:59 AM | 0 (0.0%) | 0 (0.0%) |
| 9:00 AM to 9:59 AM | 0 (0.0%) | 17 (9.9%) |
| 10:00 AM to 10:59 AM | 0 (0.0%) | 0 (0.0%) |
| 11:00 AM to 11:59 AM | 0 (0.0%) | 0 (0.0%) |
| 12:00 PM to 3:59 PM | 3 (2.9%) | 11 (6.4%) |
| 4:00 PM to 11:59 PM | 0 (0.0%) | 25 (14.6%) |
| Total | 102 (100.0%) | 171 (100.0%) |
Housing Occupancy in Clayton
Occupancy by Ownership in Clayton
Of the total 412 dwellings in Clayton, owner-occupied units account for 197 (47.8%), while renter-occupied units make up 215 (52.2%).
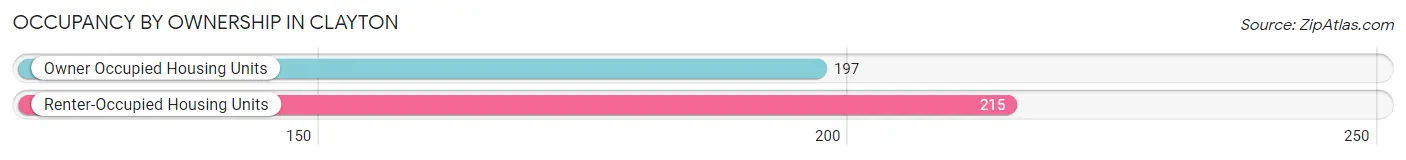
| Occupancy | # Housing Units | % Housing Units |
| Owner Occupied Housing Units | 197 | 47.8% |
| Renter-Occupied Housing Units | 215 | 52.2% |
| Total Occupied Housing Units | 412 | 100.0% |
Occupancy by Household Size in Clayton
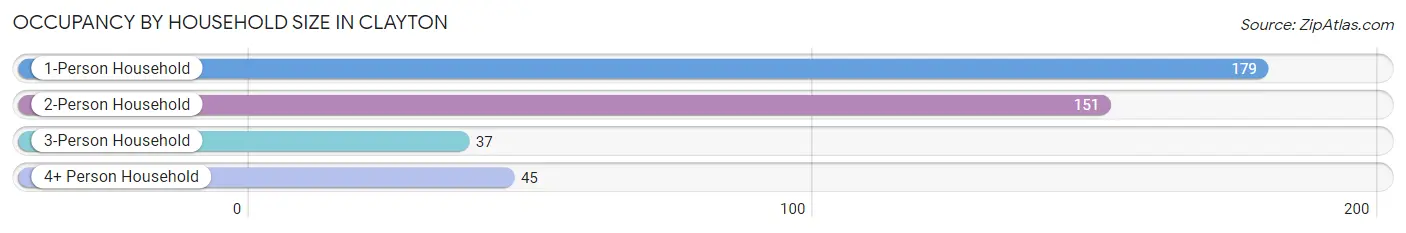
| Household Size | # Housing Units | % Housing Units |
| 1-Person Household | 179 | 43.4% |
| 2-Person Household | 151 | 36.6% |
| 3-Person Household | 37 | 9.0% |
| 4+ Person Household | 45 | 10.9% |
| Total Housing Units | 412 | 100.0% |
Occupancy by Ownership by Household Size in Clayton
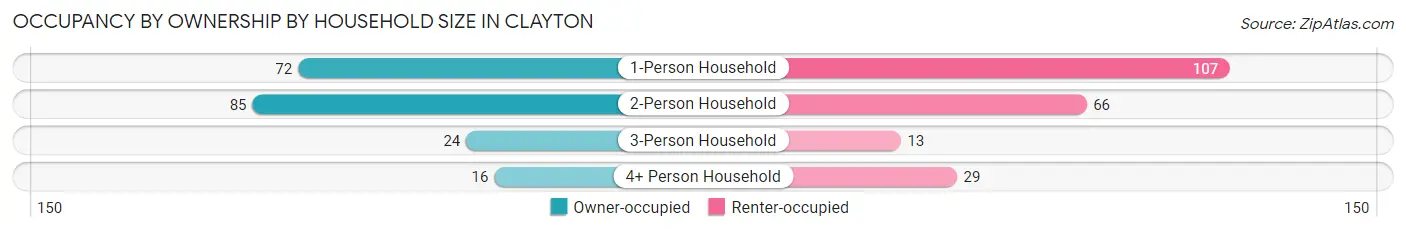
| Household Size | Owner-occupied | Renter-occupied |
| 1-Person Household | 72 (40.2%) | 107 (59.8%) |
| 2-Person Household | 85 (56.3%) | 66 (43.7%) |
| 3-Person Household | 24 (64.9%) | 13 (35.1%) |
| 4+ Person Household | 16 (35.6%) | 29 (64.4%) |
| Total Housing Units | 197 (47.8%) | 215 (52.2%) |
Occupancy by Educational Attainment in Clayton
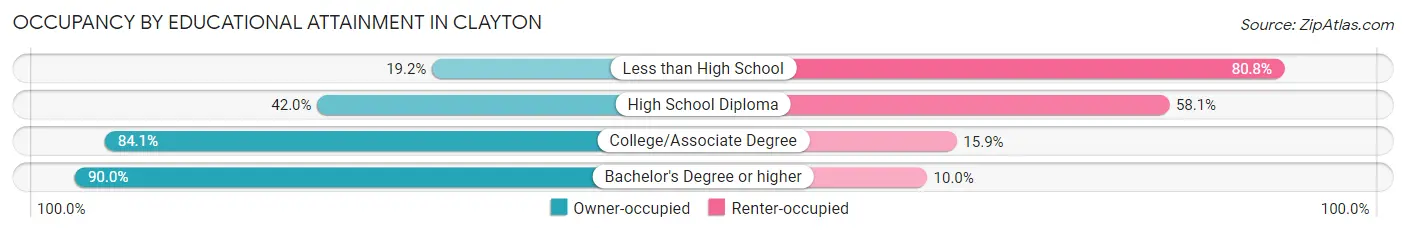
| Household Size | Owner-occupied | Renter-occupied |
| Less than High School | 19 (19.2%) | 80 (80.8%) |
| High School Diploma | 86 (41.9%) | 119 (58.1%) |
| College/Associate Degree | 74 (84.1%) | 14 (15.9%) |
| Bachelor's Degree or higher | 18 (90.0%) | 2 (10.0%) |
Occupancy by Age of Householder in Clayton
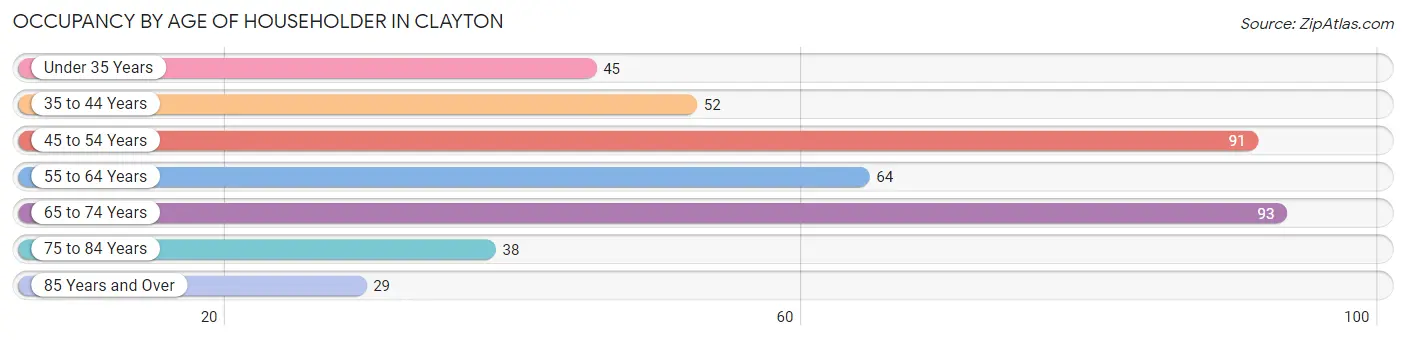
| Age Bracket | # Households | % Households |
| Under 35 Years | 45 | 10.9% |
| 35 to 44 Years | 52 | 12.6% |
| 45 to 54 Years | 91 | 22.1% |
| 55 to 64 Years | 64 | 15.5% |
| 65 to 74 Years | 93 | 22.6% |
| 75 to 84 Years | 38 | 9.2% |
| 85 Years and Over | 29 | 7.0% |
| Total | 412 | 100.0% |
Housing Finances in Clayton
Median Income by Occupancy in Clayton
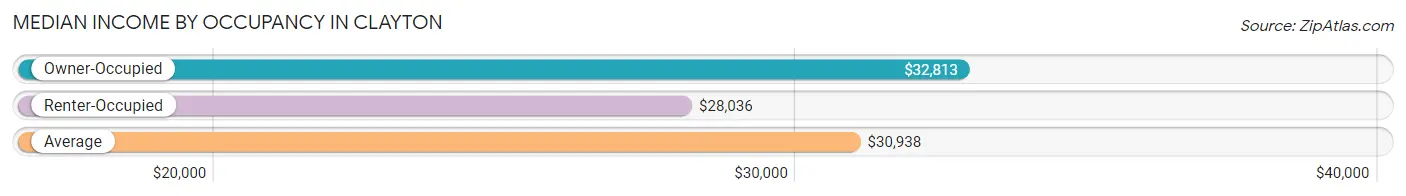
| Occupancy Type | # Households | Median Income |
| Owner-Occupied | 197 (47.8%) | $32,813 |
| Renter-Occupied | 215 (52.2%) | $28,036 |
| Average | 412 (100.0%) | $30,938 |
Occupancy by Householder Income Bracket in Clayton
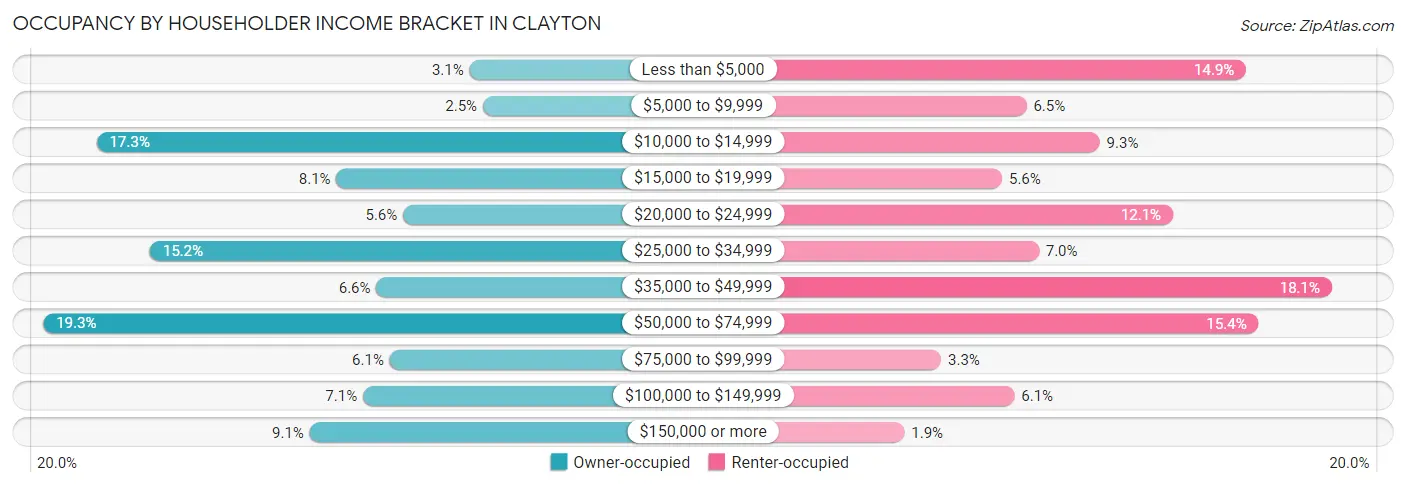
| Income Bracket | Owner-occupied | Renter-occupied |
| Less than $5,000 | 6 (3.0%) | 32 (14.9%) |
| $5,000 to $9,999 | 5 (2.5%) | 14 (6.5%) |
| $10,000 to $14,999 | 34 (17.3%) | 20 (9.3%) |
| $15,000 to $19,999 | 16 (8.1%) | 12 (5.6%) |
| $20,000 to $24,999 | 11 (5.6%) | 26 (12.1%) |
| $25,000 to $34,999 | 30 (15.2%) | 15 (7.0%) |
| $35,000 to $49,999 | 13 (6.6%) | 39 (18.1%) |
| $50,000 to $74,999 | 38 (19.3%) | 33 (15.3%) |
| $75,000 to $99,999 | 12 (6.1%) | 7 (3.3%) |
| $100,000 to $149,999 | 14 (7.1%) | 13 (6.0%) |
| $150,000 or more | 18 (9.1%) | 4 (1.9%) |
| Total | 197 (100.0%) | 215 (100.0%) |
Monthly Housing Cost Tiers in Clayton
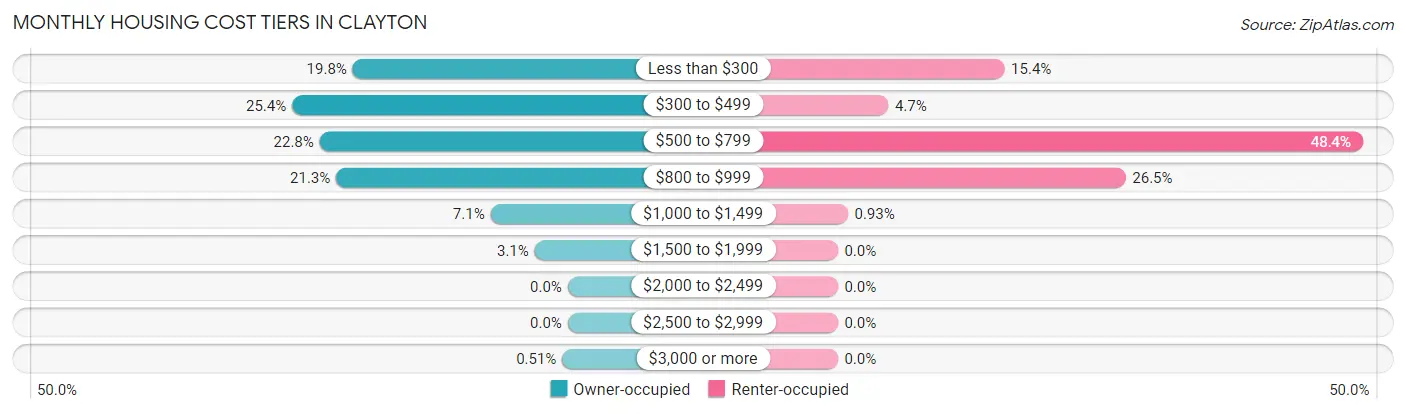
| Monthly Cost | Owner-occupied | Renter-occupied |
| Less than $300 | 39 (19.8%) | 33 (15.3%) |
| $300 to $499 | 50 (25.4%) | 10 (4.6%) |
| $500 to $799 | 45 (22.8%) | 104 (48.4%) |
| $800 to $999 | 42 (21.3%) | 57 (26.5%) |
| $1,000 to $1,499 | 14 (7.1%) | 2 (0.9%) |
| $1,500 to $1,999 | 6 (3.0%) | 0 (0.0%) |
| $2,000 to $2,499 | 0 (0.0%) | 0 (0.0%) |
| $2,500 to $2,999 | 0 (0.0%) | 0 (0.0%) |
| $3,000 or more | 1 (0.5%) | 0 (0.0%) |
| Total | 197 (100.0%) | 215 (100.0%) |
Physical Housing Characteristics in Clayton
Housing Structures in Clayton
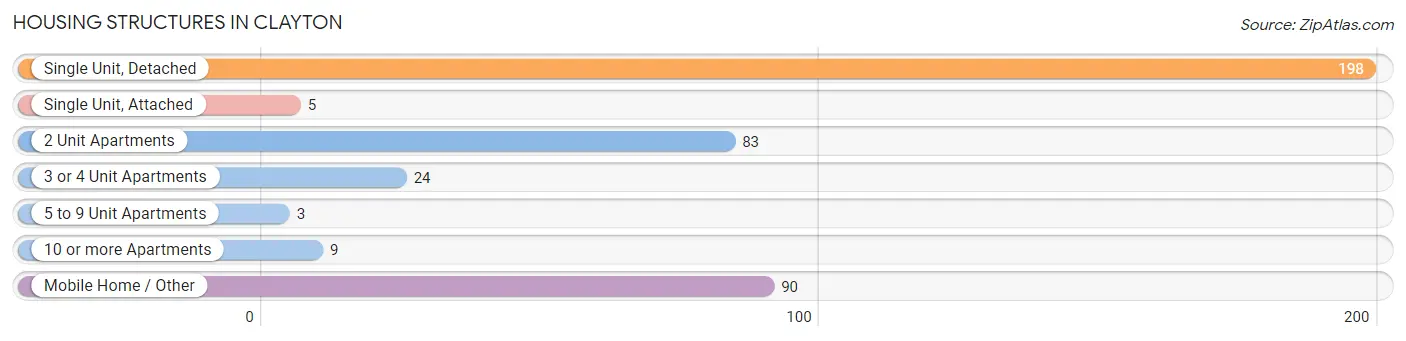
| Structure Type | # Housing Units | % Housing Units |
| Single Unit, Detached | 198 | 48.1% |
| Single Unit, Attached | 5 | 1.2% |
| 2 Unit Apartments | 83 | 20.2% |
| 3 or 4 Unit Apartments | 24 | 5.8% |
| 5 to 9 Unit Apartments | 3 | 0.7% |
| 10 or more Apartments | 9 | 2.2% |
| Mobile Home / Other | 90 | 21.8% |
| Total | 412 | 100.0% |
Housing Structures by Occupancy in Clayton
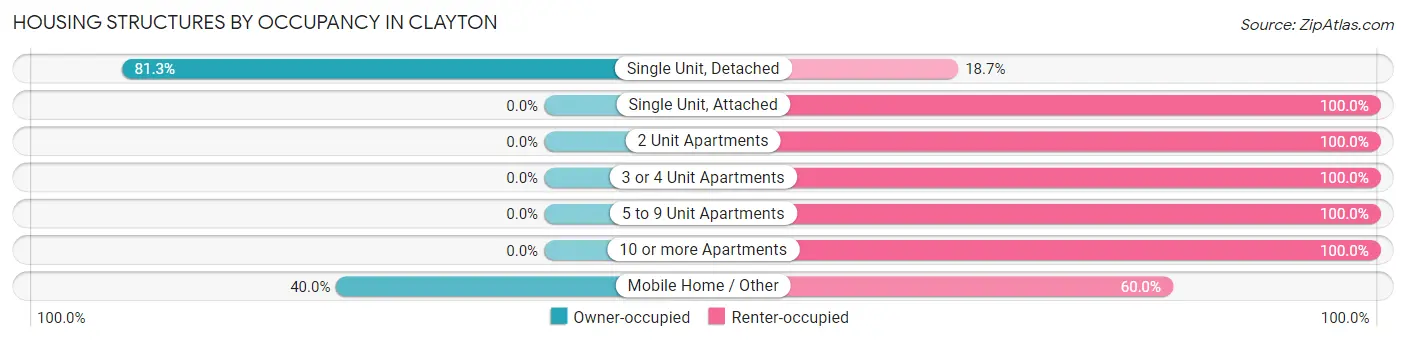
| Structure Type | Owner-occupied | Renter-occupied |
| Single Unit, Detached | 161 (81.3%) | 37 (18.7%) |
| Single Unit, Attached | 0 (0.0%) | 5 (100.0%) |
| 2 Unit Apartments | 0 (0.0%) | 83 (100.0%) |
| 3 or 4 Unit Apartments | 0 (0.0%) | 24 (100.0%) |
| 5 to 9 Unit Apartments | 0 (0.0%) | 3 (100.0%) |
| 10 or more Apartments | 0 (0.0%) | 9 (100.0%) |
| Mobile Home / Other | 36 (40.0%) | 54 (60.0%) |
| Total | 197 (47.8%) | 215 (52.2%) |
Housing Structures by Number of Rooms in Clayton
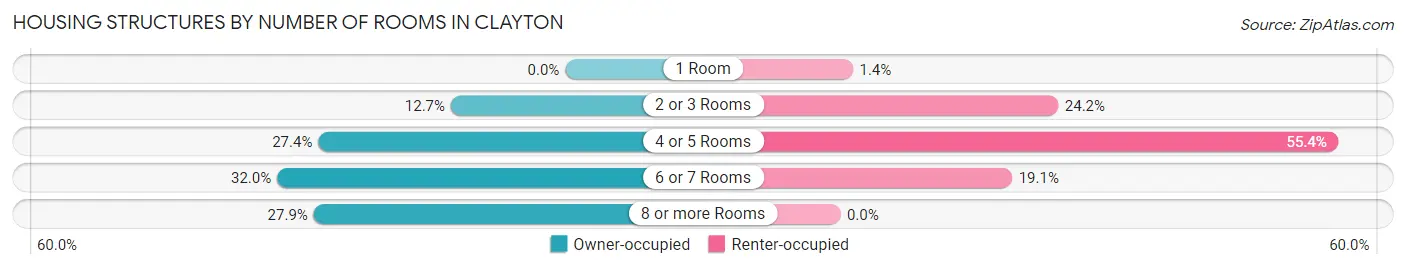
| Number of Rooms | Owner-occupied | Renter-occupied |
| 1 Room | 0 (0.0%) | 3 (1.4%) |
| 2 or 3 Rooms | 25 (12.7%) | 52 (24.2%) |
| 4 or 5 Rooms | 54 (27.4%) | 119 (55.3%) |
| 6 or 7 Rooms | 63 (32.0%) | 41 (19.1%) |
| 8 or more Rooms | 55 (27.9%) | 0 (0.0%) |
| Total | 197 (100.0%) | 215 (100.0%) |
Housing Structure by Heating Type in Clayton
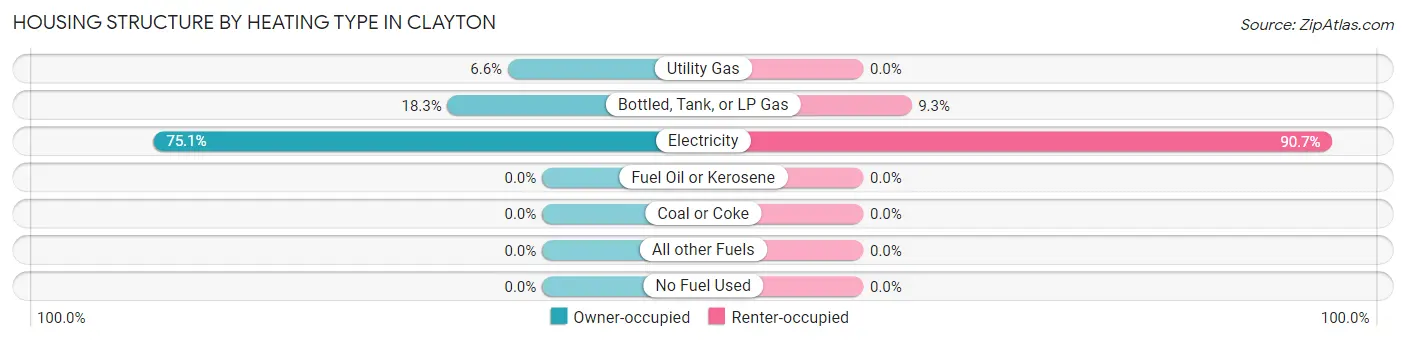
| Heating Type | Owner-occupied | Renter-occupied |
| Utility Gas | 13 (6.6%) | 0 (0.0%) |
| Bottled, Tank, or LP Gas | 36 (18.3%) | 20 (9.3%) |
| Electricity | 148 (75.1%) | 195 (90.7%) |
| Fuel Oil or Kerosene | 0 (0.0%) | 0 (0.0%) |
| Coal or Coke | 0 (0.0%) | 0 (0.0%) |
| All other Fuels | 0 (0.0%) | 0 (0.0%) |
| No Fuel Used | 0 (0.0%) | 0 (0.0%) |
| Total | 197 (100.0%) | 215 (100.0%) |
Household Vehicle Usage in Clayton
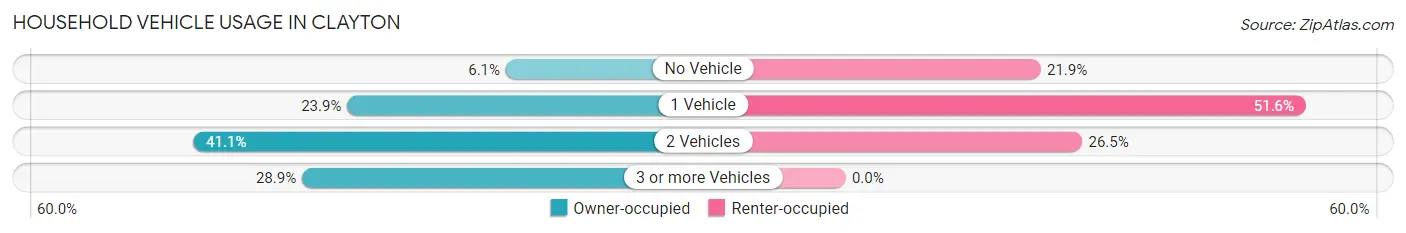
| Vehicles per Household | Owner-occupied | Renter-occupied |
| No Vehicle | 12 (6.1%) | 47 (21.9%) |
| 1 Vehicle | 47 (23.9%) | 111 (51.6%) |
| 2 Vehicles | 81 (41.1%) | 57 (26.5%) |
| 3 or more Vehicles | 57 (28.9%) | 0 (0.0%) |
| Total | 197 (100.0%) | 215 (100.0%) |
Real Estate & Mortgages in Clayton
Real Estate and Mortgage Overview in Clayton
| Characteristic | Without Mortgage | With Mortgage |
| Housing Units | 127 | 70 |
| Median Property Value | $90,200 | $128,600 |
| Median Household Income | $30,469 | $4 |
| Monthly Housing Costs | $377 | $1 |
| Real Estate Taxes | $318 | $0 |
Property Value by Mortgage Status in Clayton
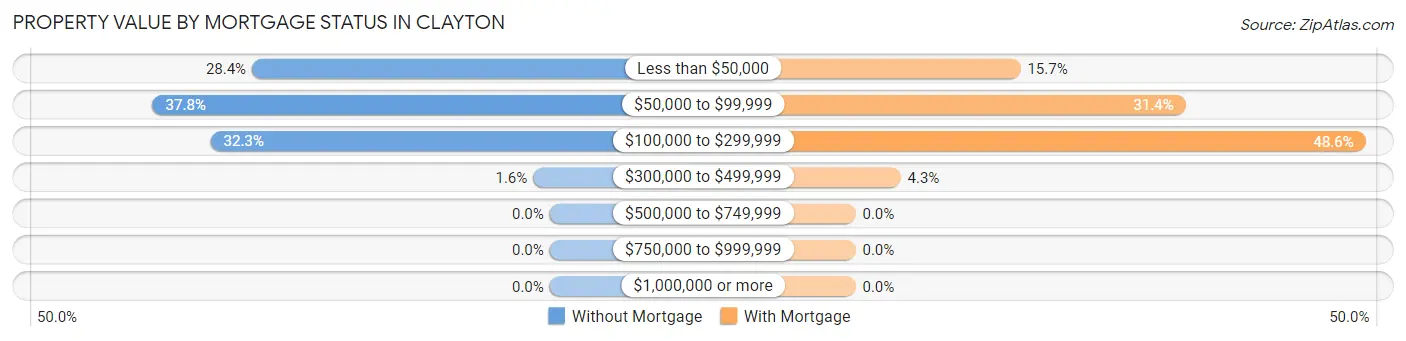
| Property Value | Without Mortgage | With Mortgage |
| Less than $50,000 | 36 (28.3%) | 11 (15.7%) |
| $50,000 to $99,999 | 48 (37.8%) | 22 (31.4%) |
| $100,000 to $299,999 | 41 (32.3%) | 34 (48.6%) |
| $300,000 to $499,999 | 2 (1.6%) | 3 (4.3%) |
| $500,000 to $749,999 | 0 (0.0%) | 0 (0.0%) |
| $750,000 to $999,999 | 0 (0.0%) | 0 (0.0%) |
| $1,000,000 or more | 0 (0.0%) | 0 (0.0%) |
| Total | 127 (100.0%) | 70 (100.0%) |
Household Income by Mortgage Status in Clayton
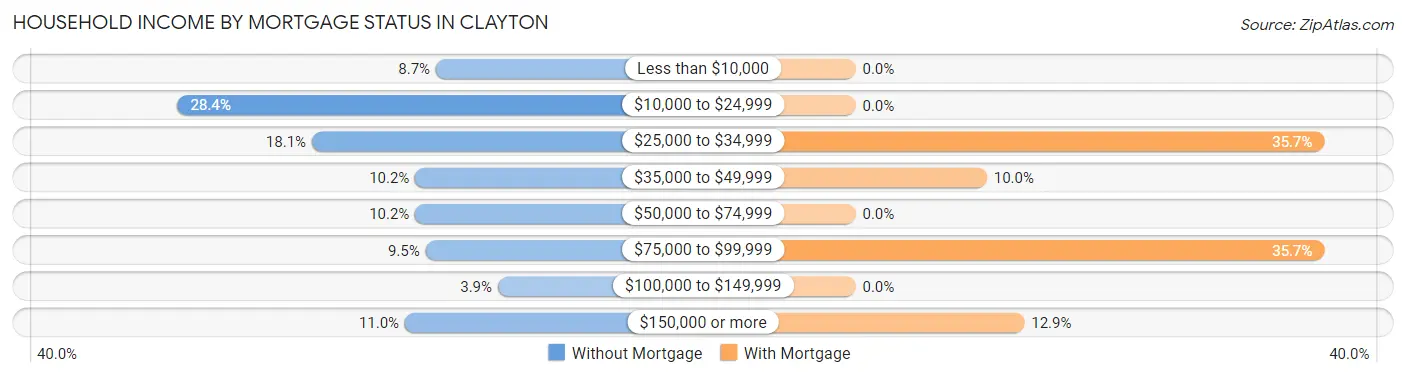
| Household Income | Without Mortgage | With Mortgage |
| Less than $10,000 | 11 (8.7%) | 0 (0.0%) |
| $10,000 to $24,999 | 36 (28.3%) | 0 (0.0%) |
| $25,000 to $34,999 | 23 (18.1%) | 25 (35.7%) |
| $35,000 to $49,999 | 13 (10.2%) | 7 (10.0%) |
| $50,000 to $74,999 | 13 (10.2%) | 0 (0.0%) |
| $75,000 to $99,999 | 12 (9.5%) | 25 (35.7%) |
| $100,000 to $149,999 | 5 (3.9%) | 0 (0.0%) |
| $150,000 or more | 14 (11.0%) | 9 (12.9%) |
| Total | 127 (100.0%) | 70 (100.0%) |
Property Value to Household Income Ratio in Clayton
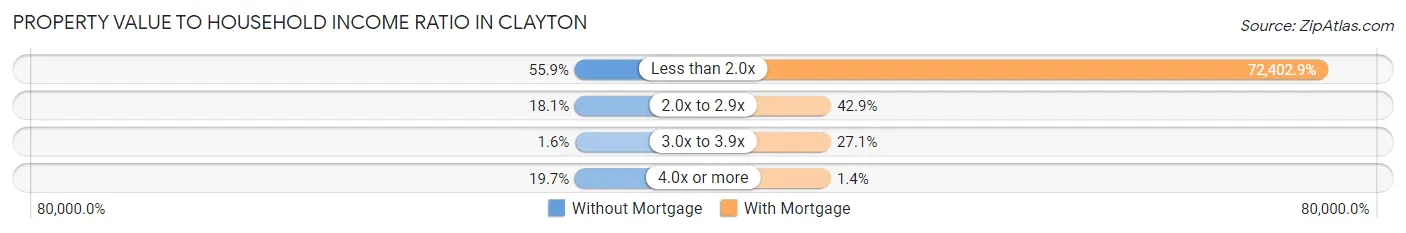
| Value-to-Income Ratio | Without Mortgage | With Mortgage |
| Less than 2.0x | 71 (55.9%) | 50,682 (72,402.9%) |
| 2.0x to 2.9x | 23 (18.1%) | 30 (42.9%) |
| 3.0x to 3.9x | 2 (1.6%) | 19 (27.1%) |
| 4.0x or more | 25 (19.7%) | 1 (1.4%) |
| Total | 127 (100.0%) | 70 (100.0%) |
Real Estate Taxes by Mortgage Status in Clayton
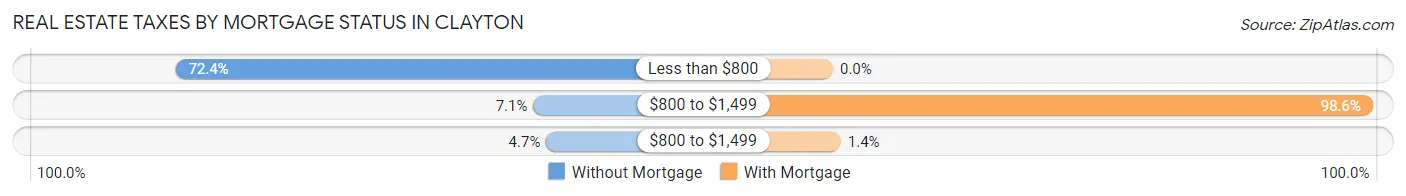
| Property Taxes | Without Mortgage | With Mortgage |
| Less than $800 | 92 (72.4%) | 0 (0.0%) |
| $800 to $1,499 | 9 (7.1%) | 69 (98.6%) |
| $800 to $1,499 | 6 (4.7%) | 1 (1.4%) |
| Total | 127 (100.0%) | 70 (100.0%) |
Health & Disability in Clayton
Health Insurance Coverage by Age in Clayton
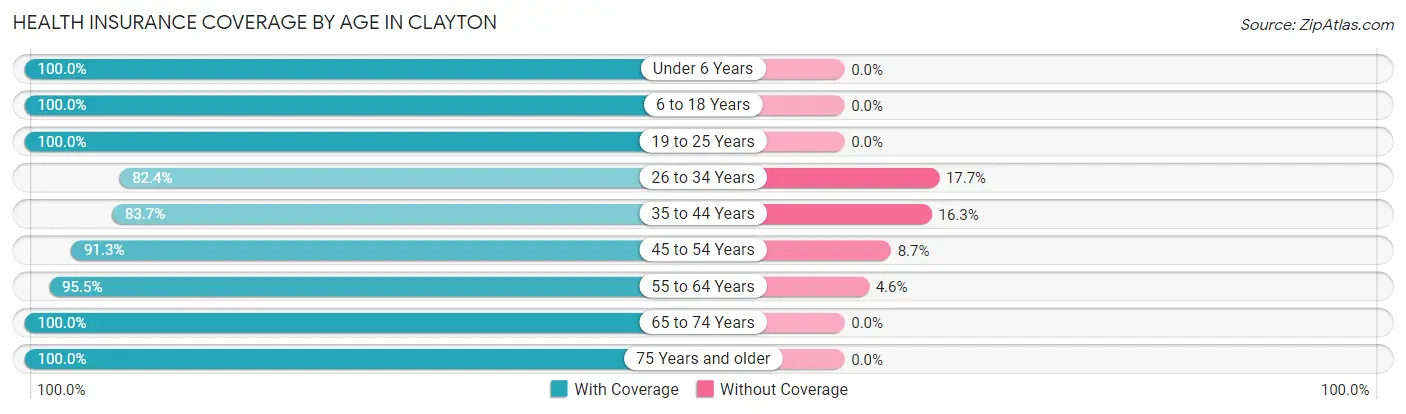
| Age Bracket | With Coverage | Without Coverage |
| Under 6 Years | 54 (100.0%) | 0 (0.0%) |
| 6 to 18 Years | 107 (100.0%) | 0 (0.0%) |
| 19 to 25 Years | 51 (100.0%) | 0 (0.0%) |
| 26 to 34 Years | 56 (82.4%) | 12 (17.6%) |
| 35 to 44 Years | 72 (83.7%) | 14 (16.3%) |
| 45 to 54 Years | 116 (91.3%) | 11 (8.7%) |
| 55 to 64 Years | 105 (95.5%) | 5 (4.5%) |
| 65 to 74 Years | 111 (100.0%) | 0 (0.0%) |
| 75 Years and older | 97 (100.0%) | 0 (0.0%) |
| Total | 769 (94.8%) | 42 (5.2%) |
Health Insurance Coverage by Citizenship Status in Clayton
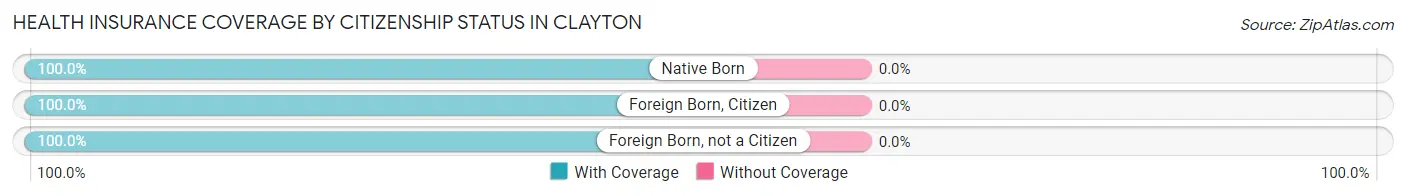
| Citizenship Status | With Coverage | Without Coverage |
| Native Born | 54 (100.0%) | 0 (0.0%) |
| Foreign Born, Citizen | 107 (100.0%) | 0 (0.0%) |
| Foreign Born, not a Citizen | 51 (100.0%) | 0 (0.0%) |
Health Insurance Coverage by Household Income in Clayton
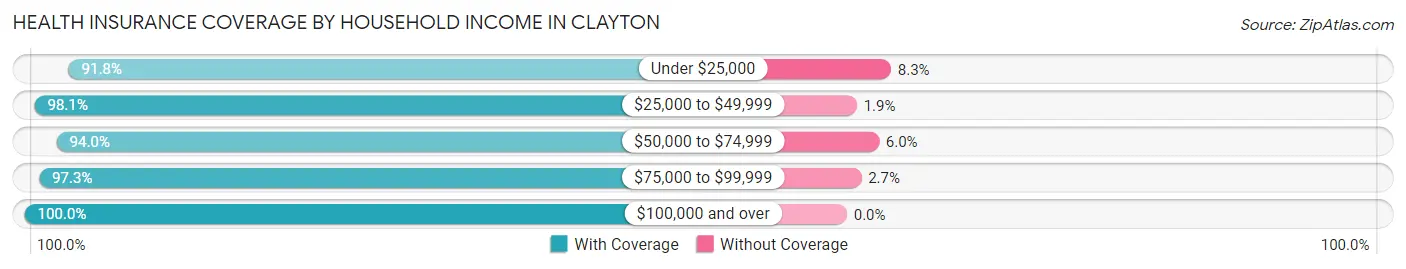
| Household Income | With Coverage | Without Coverage |
| Under $25,000 | 289 (91.7%) | 26 (8.3%) |
| $25,000 to $49,999 | 158 (98.1%) | 3 (1.9%) |
| $50,000 to $74,999 | 188 (94.0%) | 12 (6.0%) |
| $75,000 to $99,999 | 36 (97.3%) | 1 (2.7%) |
| $100,000 and over | 98 (100.0%) | 0 (0.0%) |
Public vs Private Health Insurance Coverage by Age in Clayton
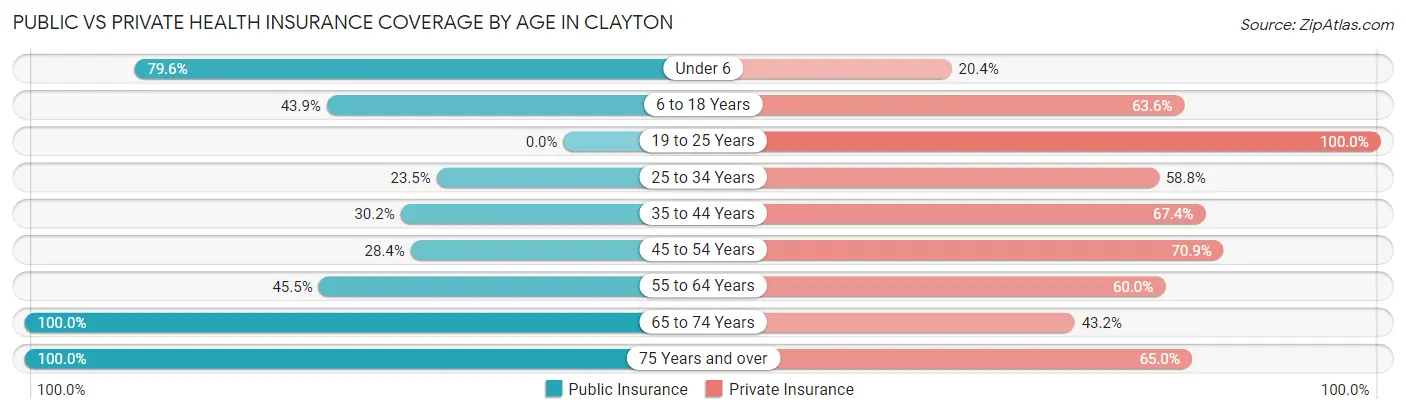
| Age Bracket | Public Insurance | Private Insurance |
| Under 6 | 43 (79.6%) | 11 (20.4%) |
| 6 to 18 Years | 47 (43.9%) | 68 (63.5%) |
| 19 to 25 Years | 0 (0.0%) | 51 (100.0%) |
| 25 to 34 Years | 16 (23.5%) | 40 (58.8%) |
| 35 to 44 Years | 26 (30.2%) | 58 (67.4%) |
| 45 to 54 Years | 36 (28.3%) | 90 (70.9%) |
| 55 to 64 Years | 50 (45.5%) | 66 (60.0%) |
| 65 to 74 Years | 111 (100.0%) | 48 (43.2%) |
| 75 Years and over | 97 (100.0%) | 63 (64.9%) |
| Total | 426 (52.5%) | 495 (61.0%) |
Disability Status by Sex by Age in Clayton
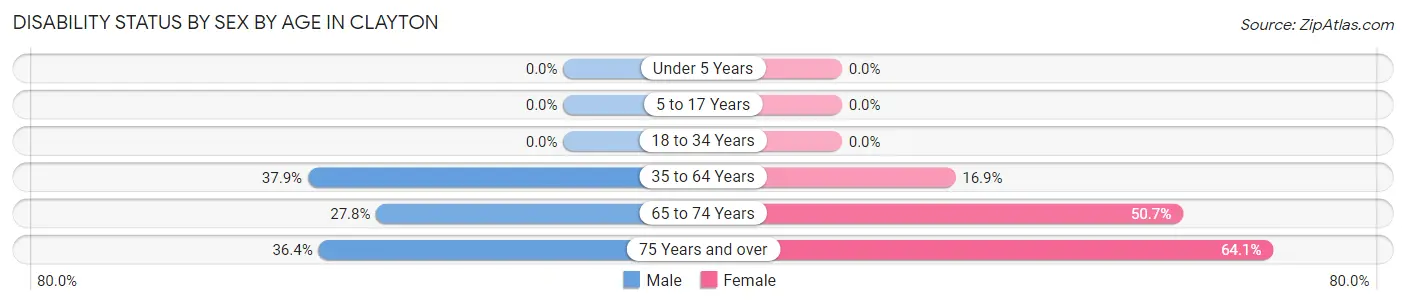
| Age Bracket | Male | Female |
| Under 5 Years | 0 (0.0%) | 0 (0.0%) |
| 5 to 17 Years | 0 (0.0%) | 0 (0.0%) |
| 18 to 34 Years | 0 (0.0%) | 0 (0.0%) |
| 35 to 64 Years | 55 (37.9%) | 30 (16.9%) |
| 65 to 74 Years | 10 (27.8%) | 38 (50.7%) |
| 75 Years and over | 12 (36.4%) | 41 (64.1%) |
Disability Class by Sex by Age in Clayton
Disability Class: Hearing Difficulty
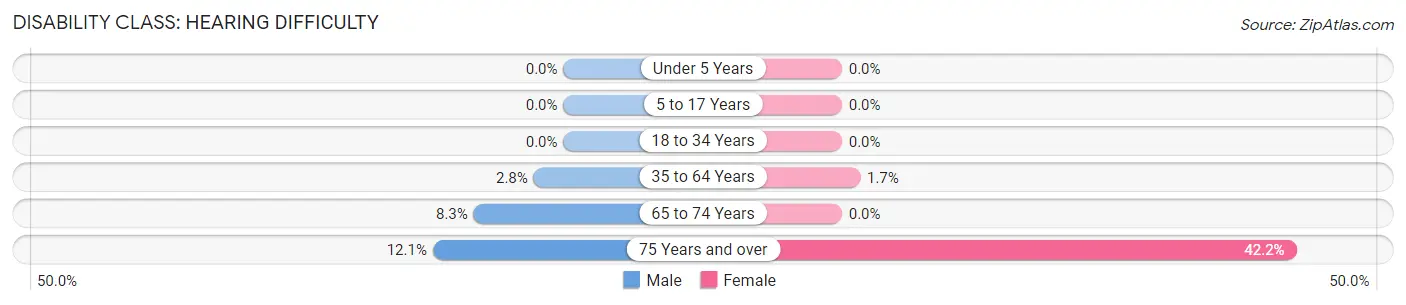
| Age Bracket | Male | Female |
| Under 5 Years | 0 (0.0%) | 0 (0.0%) |
| 5 to 17 Years | 0 (0.0%) | 0 (0.0%) |
| 18 to 34 Years | 0 (0.0%) | 0 (0.0%) |
| 35 to 64 Years | 4 (2.8%) | 3 (1.7%) |
| 65 to 74 Years | 3 (8.3%) | 0 (0.0%) |
| 75 Years and over | 4 (12.1%) | 27 (42.2%) |
Disability Class: Vision Difficulty
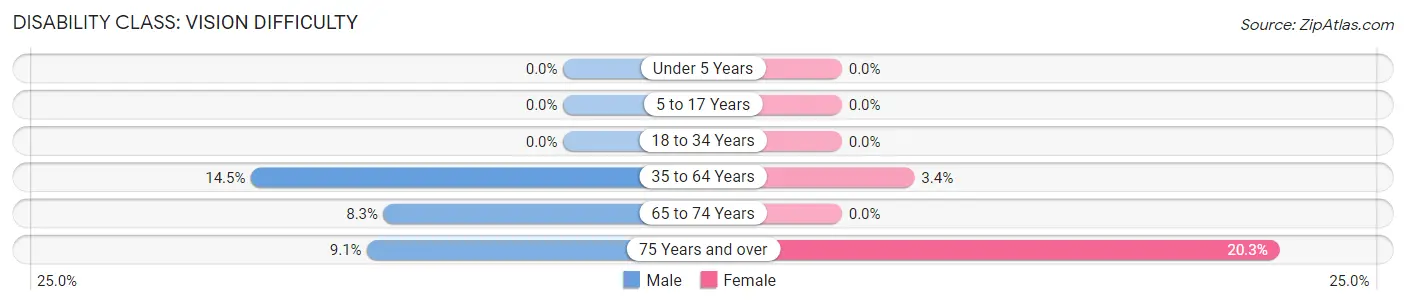
| Age Bracket | Male | Female |
| Under 5 Years | 0 (0.0%) | 0 (0.0%) |
| 5 to 17 Years | 0 (0.0%) | 0 (0.0%) |
| 18 to 34 Years | 0 (0.0%) | 0 (0.0%) |
| 35 to 64 Years | 21 (14.5%) | 6 (3.4%) |
| 65 to 74 Years | 3 (8.3%) | 0 (0.0%) |
| 75 Years and over | 3 (9.1%) | 13 (20.3%) |
Disability Class: Cognitive Difficulty
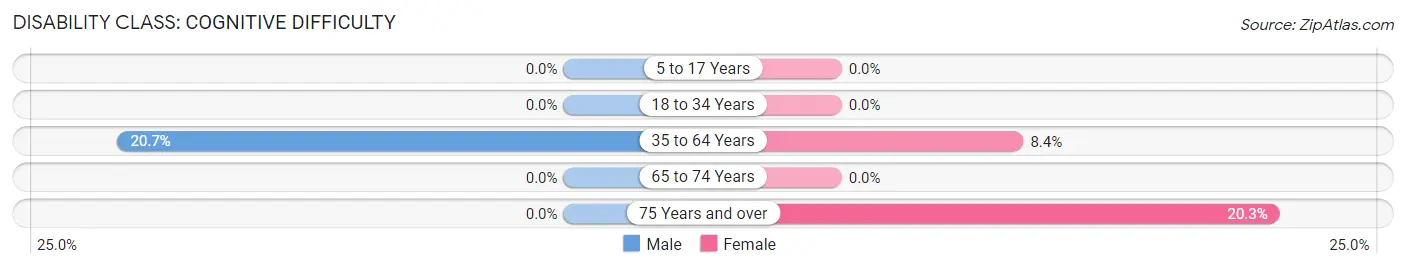
| Age Bracket | Male | Female |
| 5 to 17 Years | 0 (0.0%) | 0 (0.0%) |
| 18 to 34 Years | 0 (0.0%) | 0 (0.0%) |
| 35 to 64 Years | 30 (20.7%) | 15 (8.4%) |
| 65 to 74 Years | 0 (0.0%) | 0 (0.0%) |
| 75 Years and over | 0 (0.0%) | 13 (20.3%) |
Disability Class: Ambulatory Difficulty
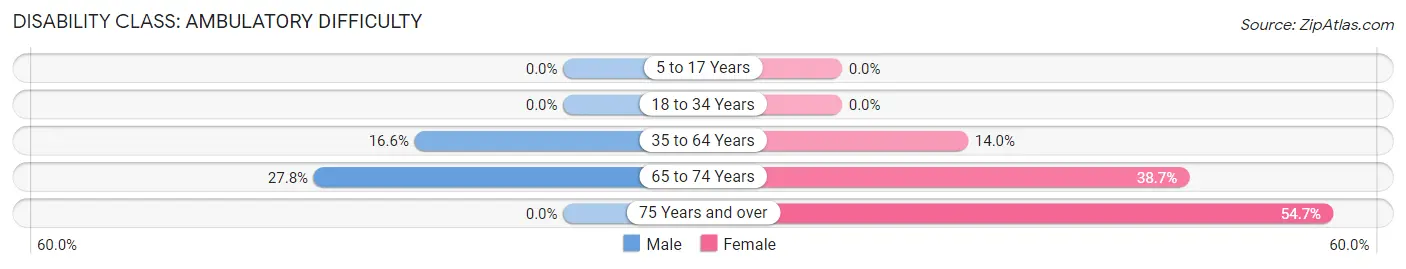
| Age Bracket | Male | Female |
| 5 to 17 Years | 0 (0.0%) | 0 (0.0%) |
| 18 to 34 Years | 0 (0.0%) | 0 (0.0%) |
| 35 to 64 Years | 24 (16.6%) | 25 (14.0%) |
| 65 to 74 Years | 10 (27.8%) | 29 (38.7%) |
| 75 Years and over | 0 (0.0%) | 35 (54.7%) |
Disability Class: Self-Care Difficulty
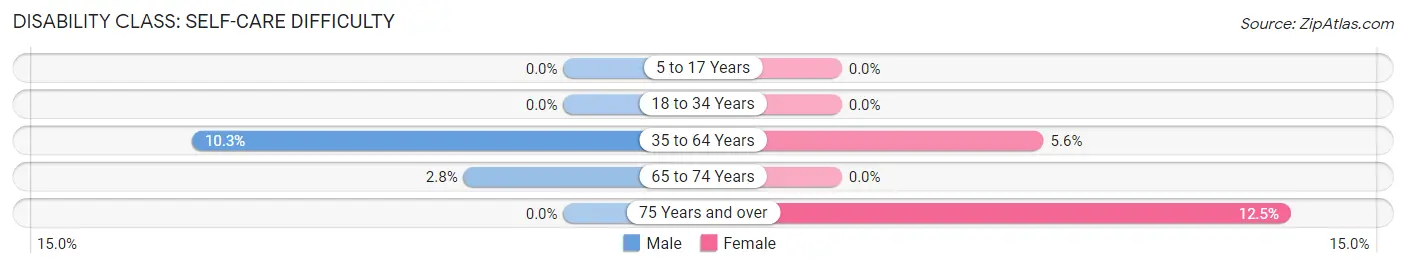
| Age Bracket | Male | Female |
| 5 to 17 Years | 0 (0.0%) | 0 (0.0%) |
| 18 to 34 Years | 0 (0.0%) | 0 (0.0%) |
| 35 to 64 Years | 15 (10.3%) | 10 (5.6%) |
| 65 to 74 Years | 1 (2.8%) | 0 (0.0%) |
| 75 Years and over | 0 (0.0%) | 8 (12.5%) |
Technology Access in Clayton
Computing Device Access in Clayton
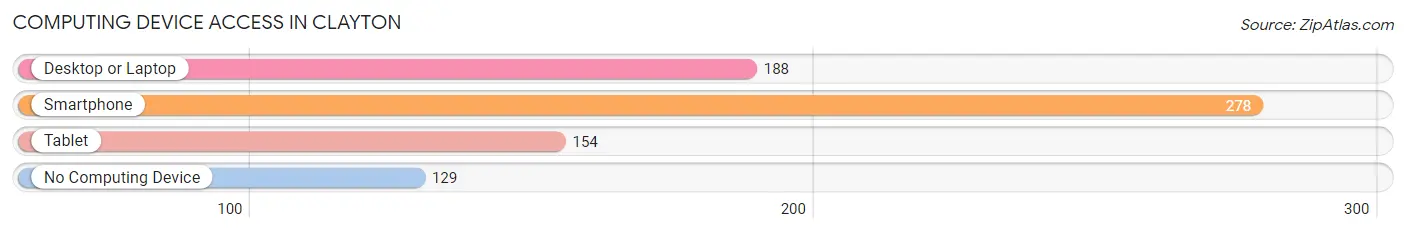
| Device Type | # Households | % Households |
| Desktop or Laptop | 188 | 45.6% |
| Smartphone | 278 | 67.5% |
| Tablet | 154 | 37.4% |
| No Computing Device | 129 | 31.3% |
| Total | 412 | 100.0% |
Internet Access in Clayton
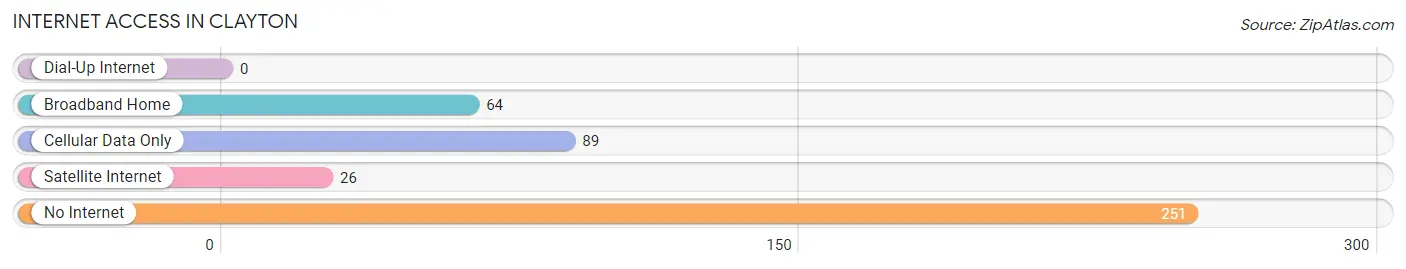
| Internet Type | # Households | % Households |
| Dial-Up Internet | 0 | 0.0% |
| Broadband Home | 64 | 15.5% |
| Cellular Data Only | 89 | 21.6% |
| Satellite Internet | 26 | 6.3% |
| No Internet | 251 | 60.9% |
| Total | 412 | 100.0% |
Clayton Summary
Clayton is a small town located in Barbour County, Alabama. It is situated in the southeastern corner of the state, near the Georgia border. The town was founded in 1883 and has a population of approximately 1,000 people.
Geography
Clayton is located in the southeastern corner of Alabama, near the Georgia border. It is situated in the foothills of the Appalachian Mountains, and is surrounded by rolling hills and forests. The town is located on the banks of the Choctawhatchee River, which flows through the area. The climate in Clayton is humid subtropical, with hot summers and mild winters.
Economy
The economy of Clayton is largely based on agriculture. The town is home to several farms, which produce a variety of crops, including cotton, corn, soybeans, and peanuts. The town also has a small manufacturing sector, which produces furniture, clothing, and other goods. In addition, Clayton is home to several small businesses, including restaurants, stores, and service providers.
Demographics
As of the 2010 census, the population of Clayton was 1,000. The racial makeup of the town was 79.2% White, 18.2% African American, 0.7% Native American, 0.2% Asian, and 1.9% from other races. The median household income was $25,000, and the median age was 37.
History
Clayton was founded in 1883 by a group of settlers from Georgia. The town was named after the nearby Choctawhatchee River, which was named after the Choctaw Indians who once lived in the area. The town quickly grew, and by the early 1900s, it had become a thriving agricultural center. In the 1920s, the town was home to several cotton mills, which provided employment for many of the town’s residents.
In the 1950s, Clayton began to decline as the cotton mills closed and the population began to decline. However, in recent years, the town has seen a resurgence in population and economic activity. Today, Clayton is a small but vibrant community, with a strong sense of community and pride.
Common Questions
What is Per Capita Income in Clayton?
Per Capita income in Clayton is $12,446.
What is the Median Family Income in Clayton?
Median Family Income in Clayton is $40,313.
What is the Median Household income in Clayton?
Median Household Income in Clayton is $30,938.
What is Inequality or Gini Index in Clayton?
Inequality or Gini Index in Clayton is 0.56.
What is the Total Population of Clayton?
Total Population of Clayton is 2,230.
What is the Total Male Population of Clayton?
Total Male Population of Clayton is 1,738.
What is the Total Female Population of Clayton?
Total Female Population of Clayton is 492.
What is the Ratio of Males per 100 Females in Clayton?
There are 353.25 Males per 100 Females in Clayton.
What is the Ratio of Females per 100 Males in Clayton?
There are 28.31 Females per 100 Males in Clayton.
What is the Median Population Age in Clayton?
Median Population Age in Clayton is 42.6 Years.
What is the Average Family Size in Clayton
Average Family Size in Clayton is 2.7 People.
What is the Average Household Size in Clayton
Average Household Size in Clayton is 2.0 People.
How Large is the Labor Force in Clayton?
There are 321 People in the Labor Forcein in Clayton.
What is the Percentage of People in the Labor Force in Clayton?
15.3% of People are in the Labor Force in Clayton.
What is the Unemployment Rate in Clayton?
Unemployment Rate in Clayton is 3.7%.