Camden, AL Map & Demographics
Camden Map
Camden Overview
$17,535
PER CAPITA INCOME
$41,333
AVG FAMILY INCOME
$35,583
AVG HOUSEHOLD INCOME
51.9%
WAGE / INCOME GAP [ % ]
48.1¢/ $1
WAGE / INCOME GAP [ $ ]
0.46
INEQUALITY / GINI INDEX
2,149
TOTAL POPULATION
914
MALE POPULATION
1,235
FEMALE POPULATION
74.01
MALES / 100 FEMALES
135.12
FEMALES / 100 MALES
34.8
MEDIAN AGE
4.5
AVG FAMILY SIZE
3.8
AVG HOUSEHOLD SIZE
786
LABOR FORCE [ PEOPLE ]
46.2%
PERCENT IN LABOR FORCE
11.7%
UNEMPLOYMENT RATE
Camden Zip Codes
Camden Area Codes
Income in Camden
Income Overview in Camden
Per Capita Income in Camden is $17,535, while median incomes of families and households are $41,333 and $35,583 respectively.
| Characteristic | Number | Measure |
| Per Capita Income | 2,149 | $17,535 |
| Median Family Income | 428 | $41,333 |
| Mean Family Income | 428 | $56,234 |
| Median Household Income | 541 | $35,583 |
| Mean Household Income | 541 | $50,788 |
| Income Deficit | 428 | $0 |
| Wage / Income Gap (%) | 2,149 | 51.94% |
| Wage / Income Gap ($) | 2,149 | 48.06¢ per $1 |
| Gini / Inequality Index | 2,149 | 0.46 |
Earnings by Sex in Camden
Average Earnings in Camden are $27,396, $37,750 for men and $18,141 for women, a difference of 51.9%.
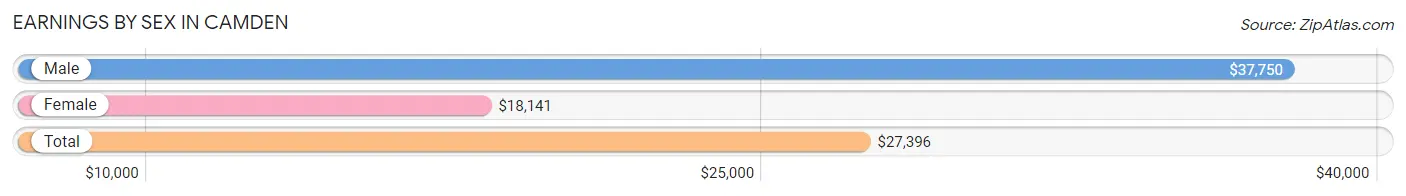
| Sex | Number | Average Earnings |
| Male | 345 (45.8%) | $37,750 |
| Female | 408 (54.2%) | $18,141 |
| Total | 753 (100.0%) | $27,396 |
Earnings by Sex by Income Bracket in Camden
The most common earnings brackets in Camden are $35,000 to $39,999 for men (110 | 31.9%) and $17,500 to $19,999 for women (78 | 19.1%).
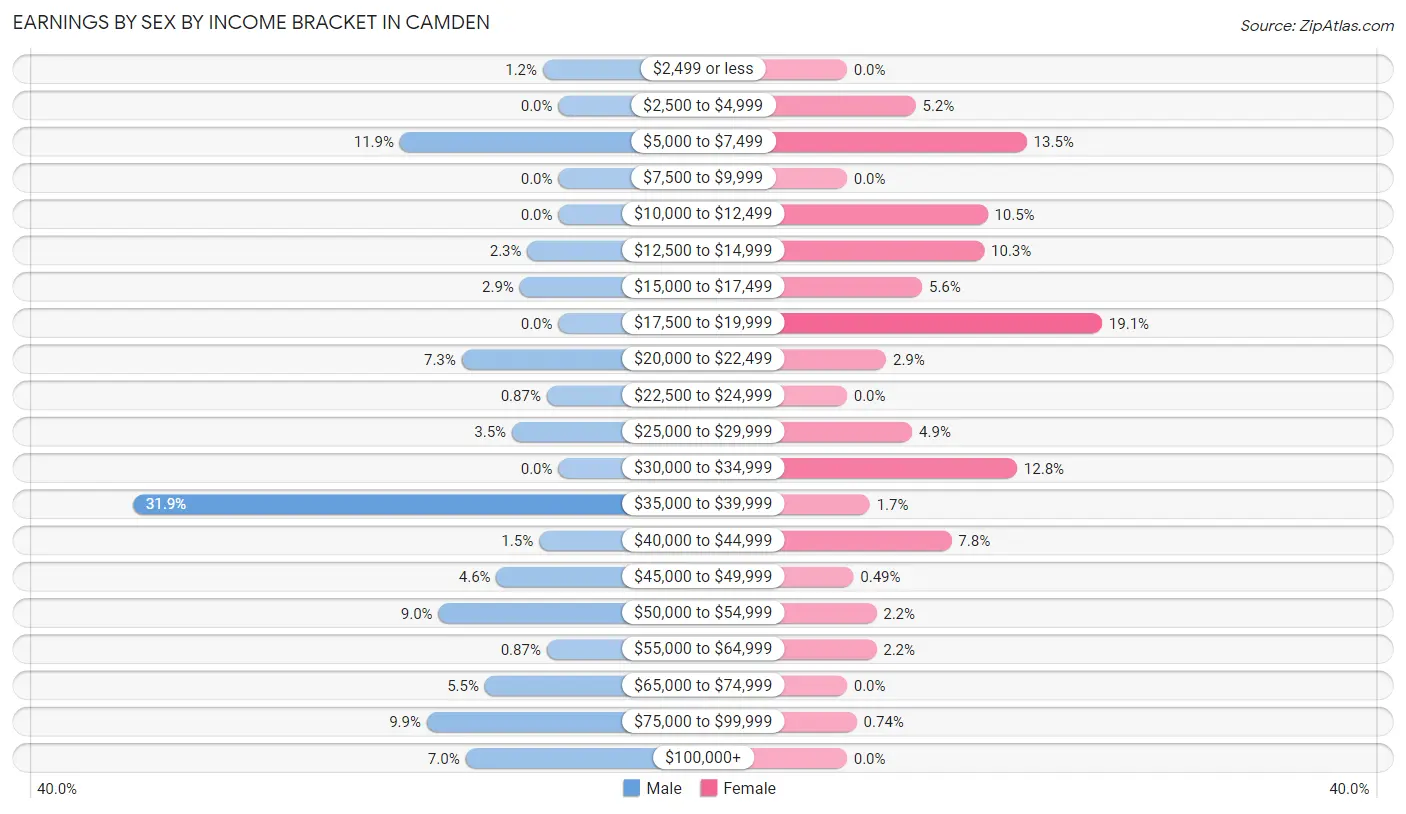
| Income | Male | Female |
| $2,499 or less | 4 (1.2%) | 0 (0.0%) |
| $2,500 to $4,999 | 0 (0.0%) | 21 (5.1%) |
| $5,000 to $7,499 | 41 (11.9%) | 55 (13.5%) |
| $7,500 to $9,999 | 0 (0.0%) | 0 (0.0%) |
| $10,000 to $12,499 | 0 (0.0%) | 43 (10.5%) |
| $12,500 to $14,999 | 8 (2.3%) | 42 (10.3%) |
| $15,000 to $17,499 | 10 (2.9%) | 23 (5.6%) |
| $17,500 to $19,999 | 0 (0.0%) | 78 (19.1%) |
| $20,000 to $22,499 | 25 (7.2%) | 12 (2.9%) |
| $22,500 to $24,999 | 3 (0.9%) | 0 (0.0%) |
| $25,000 to $29,999 | 12 (3.5%) | 20 (4.9%) |
| $30,000 to $34,999 | 0 (0.0%) | 52 (12.8%) |
| $35,000 to $39,999 | 110 (31.9%) | 7 (1.7%) |
| $40,000 to $44,999 | 5 (1.5%) | 32 (7.8%) |
| $45,000 to $49,999 | 16 (4.6%) | 2 (0.5%) |
| $50,000 to $54,999 | 31 (9.0%) | 9 (2.2%) |
| $55,000 to $64,999 | 3 (0.9%) | 9 (2.2%) |
| $65,000 to $74,999 | 19 (5.5%) | 0 (0.0%) |
| $75,000 to $99,999 | 34 (9.9%) | 3 (0.7%) |
| $100,000+ | 24 (7.0%) | 0 (0.0%) |
| Total | 345 (100.0%) | 408 (100.0%) |
Earnings by Sex by Educational Attainment in Camden
Average earnings in Camden are $37,889 for men and $18,077 for women, a difference of 52.3%. Men with an educational attainment of bachelor's degree enjoy the highest average annual earnings of $91,250, while those with college or associate's degree education earn the least with $36,019. Women with an educational attainment of high school diploma earn the most with the average annual earnings of $30,284, while those with graduate degree education have the smallest earnings of $11,806.
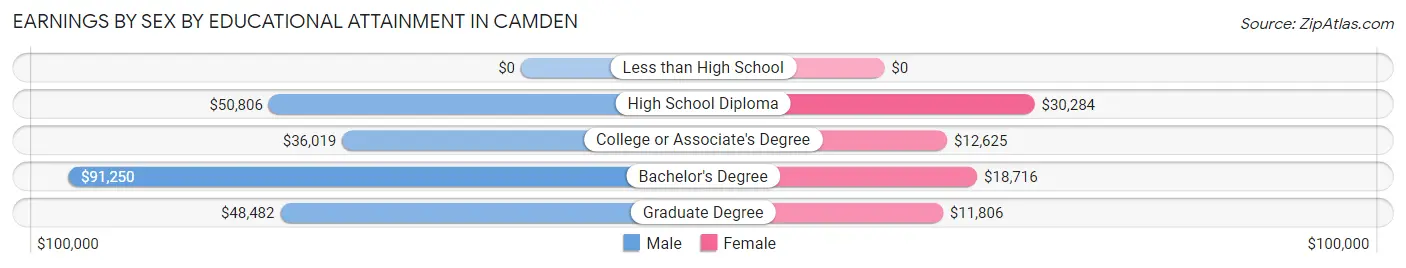
| Educational Attainment | Male Income | Female Income |
| Less than High School | - | - |
| High School Diploma | $50,806 | $30,284 |
| College or Associate's Degree | $36,019 | $12,625 |
| Bachelor's Degree | $91,250 | $18,716 |
| Graduate Degree | $48,482 | $11,806 |
| Total | $37,889 | $18,077 |
Family Income in Camden
Family Income Brackets in Camden
According to the Camden family income data, there are 103 families falling into the $15,000 to $24,999 income range, which is the most common income bracket and makes up 24.1% of all families.
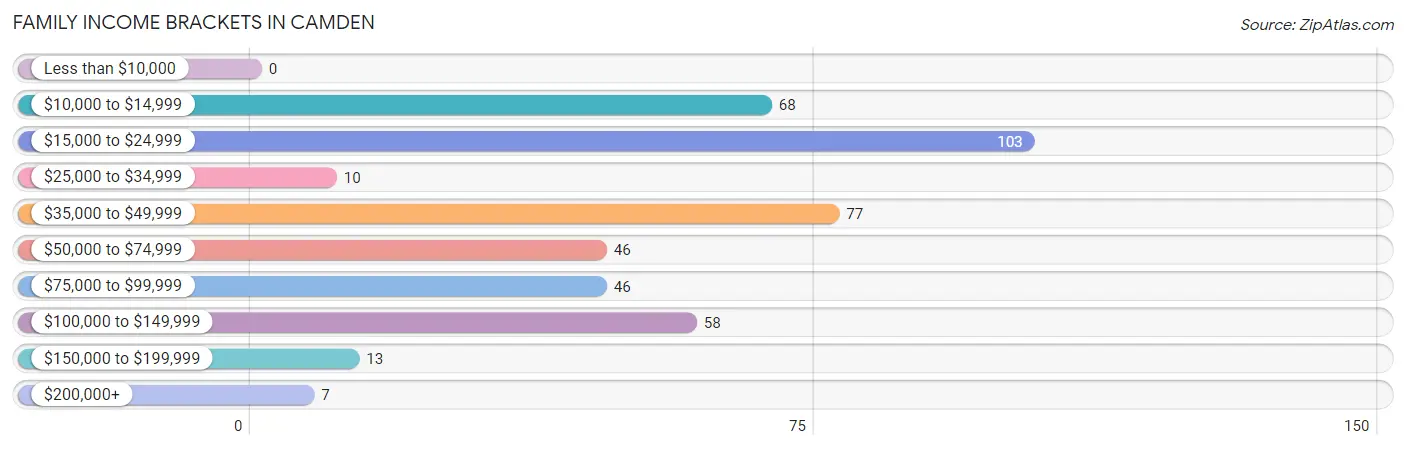
| Income Bracket | # Families | % Families |
| Less than $10,000 | 0 | 0.0% |
| $10,000 to $14,999 | 68 | 15.9% |
| $15,000 to $24,999 | 103 | 24.1% |
| $25,000 to $34,999 | 10 | 2.3% |
| $35,000 to $49,999 | 77 | 18.0% |
| $50,000 to $74,999 | 46 | 10.7% |
| $75,000 to $99,999 | 46 | 10.7% |
| $100,000 to $149,999 | 58 | 13.6% |
| $150,000 to $199,999 | 13 | 3.0% |
| $200,000+ | 7 | 1.6% |
Family Income by Famaliy Size in Camden
| Income Bracket | # Families | Median Income |
| 2-Person Families | 223 (52.1%) | $0 |
| 3-Person Families | 88 (20.6%) | $0 |
| 4-Person Families | 74 (17.3%) | $0 |
| 5-Person Families | 16 (3.7%) | $0 |
| 6-Person Families | 4 (0.9%) | $0 |
| 7+ Person Families | 23 (5.4%) | $0 |
| Total | 428 (100.0%) | $41,333 |
Family Income by Number of Earners in Camden
The median family income in Camden is $41,333, with families comprising 3+ earners (29) having the highest median family income of $167,596, while families with no earners (170) have the lowest median family income of $21,642, accounting for 6.8% and 39.7% of families, respectively.

| Number of Earners | # Families | Median Income |
| No Earners | 170 (39.7%) | $21,642 |
| 1 Earner | 109 (25.5%) | $39,375 |
| 2 Earners | 120 (28.0%) | $82,500 |
| 3+ Earners | 29 (6.8%) | $167,596 |
| Total | 428 (100.0%) | $41,333 |
Household Income in Camden
Household Income Brackets in Camden
With 117 households falling in the category, the $15,000 to $24,999 income range is the most frequent in Camden, accounting for 21.6% of all households. In contrast, only 7 households (1.3%) fall into the $200,000+ income bracket, making it the least populous group.
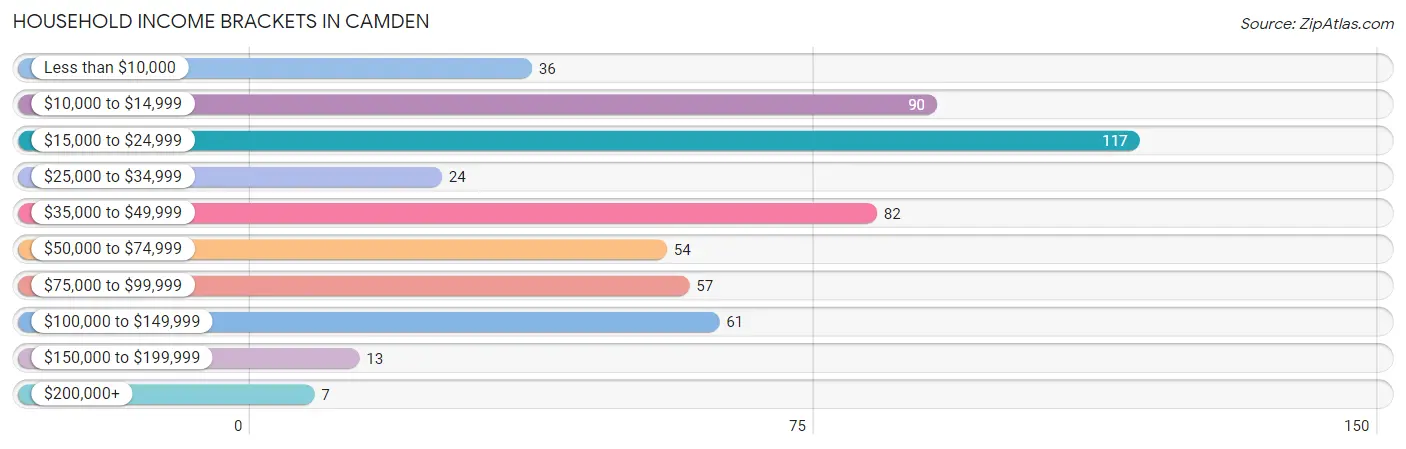
| Income Bracket | # Households | % Households |
| Less than $10,000 | 36 | 6.7% |
| $10,000 to $14,999 | 90 | 16.6% |
| $15,000 to $24,999 | 117 | 21.6% |
| $25,000 to $34,999 | 24 | 4.4% |
| $35,000 to $49,999 | 82 | 15.2% |
| $50,000 to $74,999 | 54 | 10.0% |
| $75,000 to $99,999 | 57 | 10.5% |
| $100,000 to $149,999 | 61 | 11.3% |
| $150,000 to $199,999 | 13 | 2.4% |
| $200,000+ | 7 | 1.3% |
Household Income by Householder Age in Camden
The median household income in Camden is $35,583, with the highest median household income of $50,563 found in the 45 to 64 years age bracket for the primary householder. A total of 195 households (36.0%) fall into this category. Meanwhile, the 15 to 24 years age bracket for the primary householder has the lowest median household income of $0, with 12 households (2.2%) in this group.
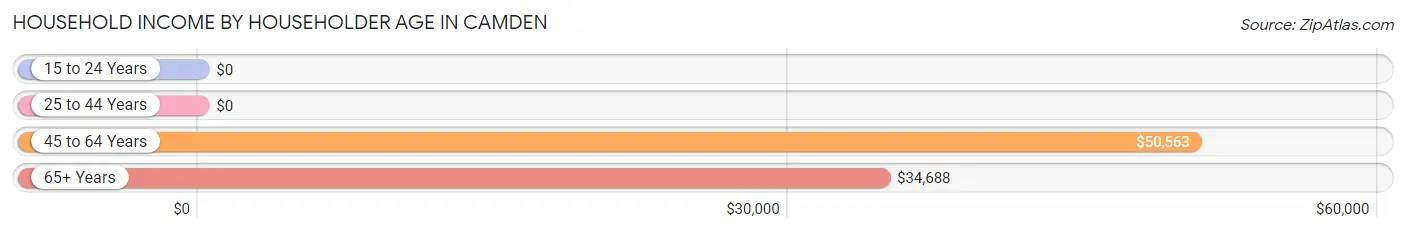
| Income Bracket | # Households | Median Income |
| 15 to 24 Years | 12 (2.2%) | $0 |
| 25 to 44 Years | 89 (16.5%) | $0 |
| 45 to 64 Years | 195 (36.0%) | $50,563 |
| 65+ Years | 245 (45.3%) | $34,688 |
| Total | 541 (100.0%) | $35,583 |
Poverty in Camden
Income Below Poverty by Sex and Age in Camden
With 21.8% poverty level for males and 26.7% for females among the residents of Camden, under 5 year old males and 12 to 14 year old females are the most vulnerable to poverty, with 64 males (61.0%) and 43 females (87.8%) in their respective age groups living below the poverty level.
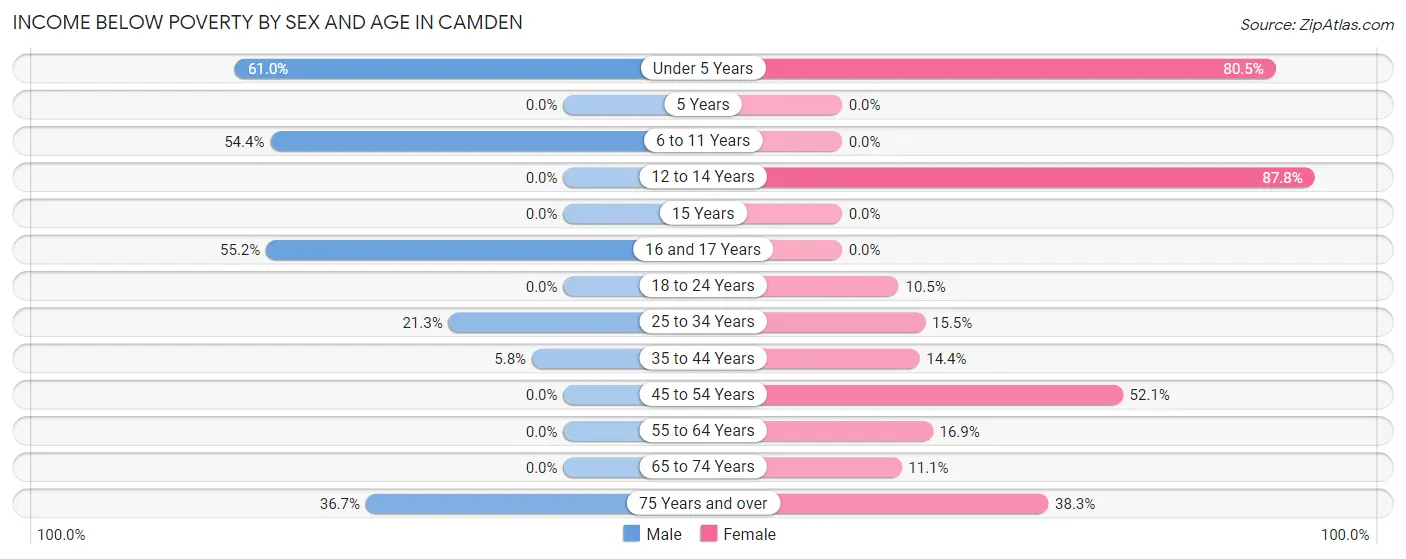
| Age Bracket | Male | Female |
| Under 5 Years | 64 (61.0%) | 95 (80.5%) |
| 5 Years | 0 (0.0%) | 0 (0.0%) |
| 6 to 11 Years | 37 (54.4%) | 0 (0.0%) |
| 12 to 14 Years | 0 (0.0%) | 43 (87.8%) |
| 15 Years | 0 (0.0%) | 0 (0.0%) |
| 16 and 17 Years | 16 (55.2%) | 0 (0.0%) |
| 18 to 24 Years | 0 (0.0%) | 12 (10.5%) |
| 25 to 34 Years | 55 (21.3%) | 32 (15.5%) |
| 35 to 44 Years | 7 (5.8%) | 20 (14.4%) |
| 45 to 54 Years | 0 (0.0%) | 49 (52.1%) |
| 55 to 64 Years | 0 (0.0%) | 30 (16.9%) |
| 65 to 74 Years | 0 (0.0%) | 21 (11.1%) |
| 75 Years and over | 11 (36.7%) | 18 (38.3%) |
| Total | 190 (21.8%) | 320 (26.7%) |
Income Above Poverty by Sex and Age in Camden
According to the poverty statistics in Camden, males aged 12 to 14 years and females aged 5 years are the age groups that are most secure financially, with 100.0% of males and 100.0% of females in these age groups living above the poverty line.
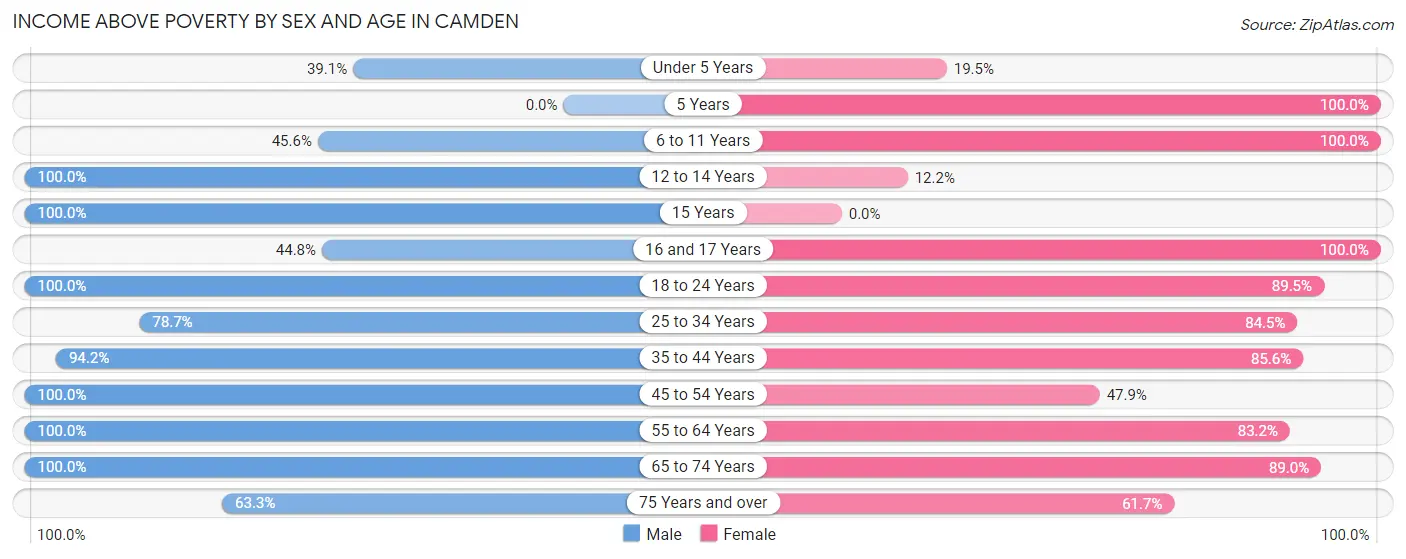
| Age Bracket | Male | Female |
| Under 5 Years | 41 (39.1%) | 23 (19.5%) |
| 5 Years | 0 (0.0%) | 26 (100.0%) |
| 6 to 11 Years | 31 (45.6%) | 30 (100.0%) |
| 12 to 14 Years | 20 (100.0%) | 6 (12.2%) |
| 15 Years | 31 (100.0%) | 0 (0.0%) |
| 16 and 17 Years | 13 (44.8%) | 5 (100.0%) |
| 18 to 24 Years | 18 (100.0%) | 102 (89.5%) |
| 25 to 34 Years | 203 (78.7%) | 175 (84.5%) |
| 35 to 44 Years | 113 (94.2%) | 119 (85.6%) |
| 45 to 54 Years | 33 (100.0%) | 45 (47.9%) |
| 55 to 64 Years | 74 (100.0%) | 148 (83.2%) |
| 65 to 74 Years | 87 (100.0%) | 169 (88.9%) |
| 75 Years and over | 19 (63.3%) | 29 (61.7%) |
| Total | 683 (78.2%) | 877 (73.3%) |
Income Below Poverty Among Married-Couple Families in Camden
The poverty statistics for married-couple families in Camden show that 6.4% or 12 of the total 188 families live below the poverty line. Families with no children have the highest poverty rate of 8.3%, comprising of 12 families. On the other hand, families with 1 or 2 children have the lowest poverty rate of 0.0%, which includes 0 families.
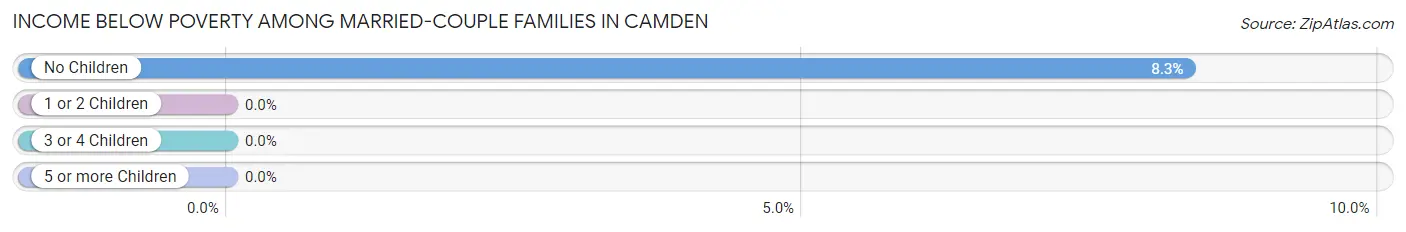
| Children | Above Poverty | Below Poverty |
| No Children | 132 (91.7%) | 12 (8.3%) |
| 1 or 2 Children | 21 (100.0%) | 0 (0.0%) |
| 3 or 4 Children | 23 (100.0%) | 0 (0.0%) |
| 5 or more Children | 0 (0.0%) | 0 (0.0%) |
| Total | 176 (93.6%) | 12 (6.4%) |
Income Below Poverty Among Single-Parent Households in Camden
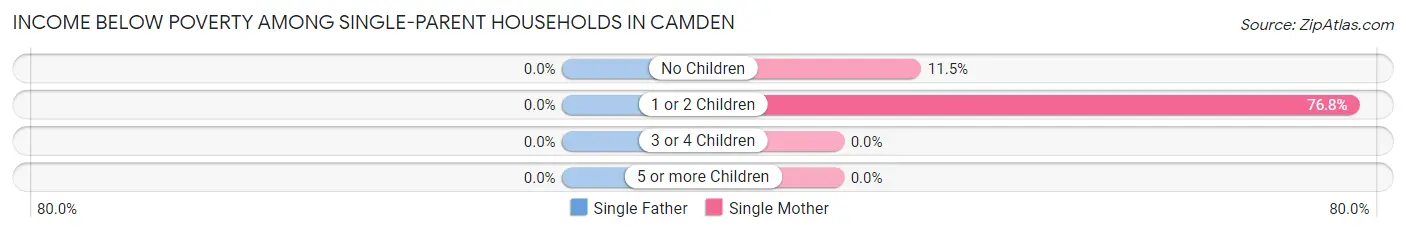
| Children | Single Father | Single Mother |
| No Children | 0 (0.0%) | 16 (11.5%) |
| 1 or 2 Children | 0 (0.0%) | 73 (76.8%) |
| 3 or 4 Children | 0 (0.0%) | 0 (0.0%) |
| 5 or more Children | 0 (0.0%) | 0 (0.0%) |
| Total | 0 (0.0%) | 89 (38.0%) |
Income Below Poverty Among Married-Couple vs Single-Parent Households in Camden
The poverty data for Camden shows that 12 of the married-couple family households (6.4%) and 89 of the single-parent households (37.1%) are living below the poverty level. Within the married-couple family households, those with no children have the highest poverty rate, with 12 households (8.3%) falling below the poverty line. Among the single-parent households, those with 1 or 2 children have the highest poverty rate, with 73 household (76.8%) living below poverty.
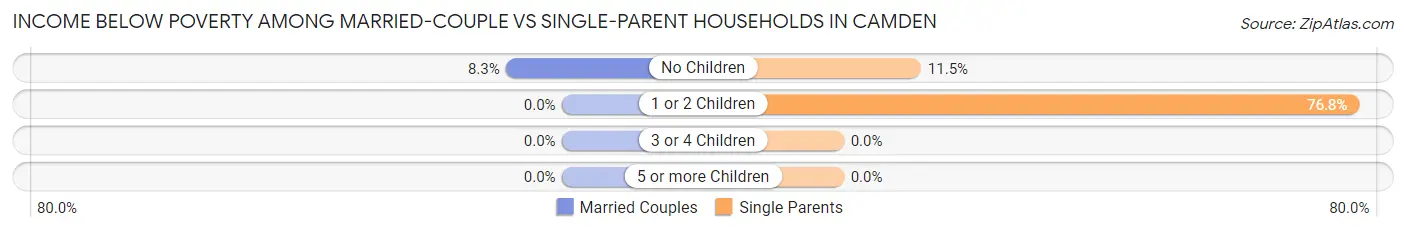
| Children | Married-Couple Families | Single-Parent Households |
| No Children | 12 (8.3%) | 16 (11.5%) |
| 1 or 2 Children | 0 (0.0%) | 73 (76.8%) |
| 3 or 4 Children | 0 (0.0%) | 0 (0.0%) |
| 5 or more Children | 0 (0.0%) | 0 (0.0%) |
| Total | 12 (6.4%) | 89 (37.1%) |
Race in Camden
The most populous races in Camden are Black / African American (1,475 | 68.6%), and White / Caucasian (674 | 31.4%).
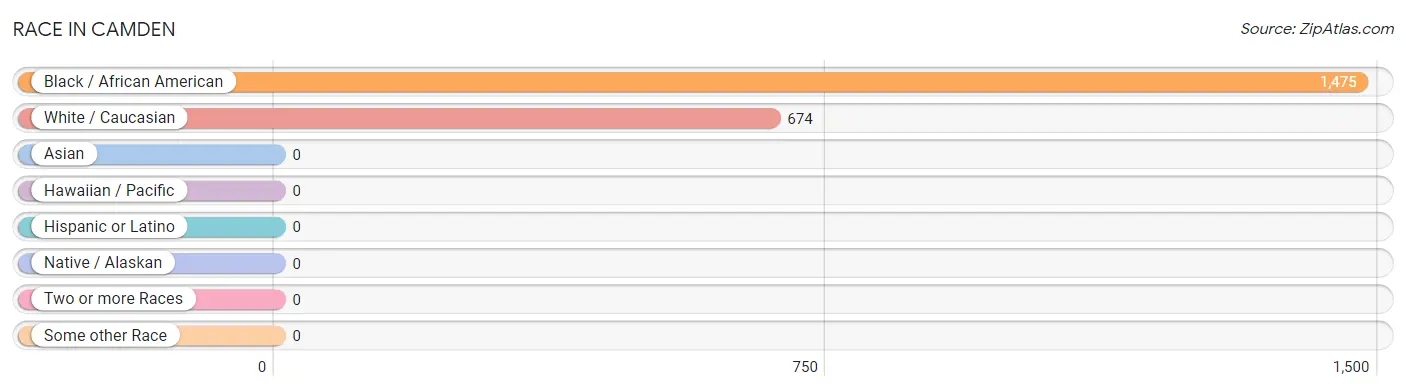
| Race | # Population | % Population |
| Asian | 0 | 0.0% |
| Black / African American | 1,475 | 68.6% |
| Hawaiian / Pacific | 0 | 0.0% |
| Hispanic or Latino | 0 | 0.0% |
| Native / Alaskan | 0 | 0.0% |
| White / Caucasian | 674 | 31.4% |
| Two or more Races | 0 | 0.0% |
| Some other Race | 0 | 0.0% |
| Total | 2,149 | 100.0% |
Ancestry in Camden
The most populous ancestries reported in Camden are American (314 | 14.6%), English (55 | 2.6%), German (55 | 2.6%), Irish (47 | 2.2%), and Scotch-Irish (22 | 1.0%), together accounting for 22.9% of all Camden residents.
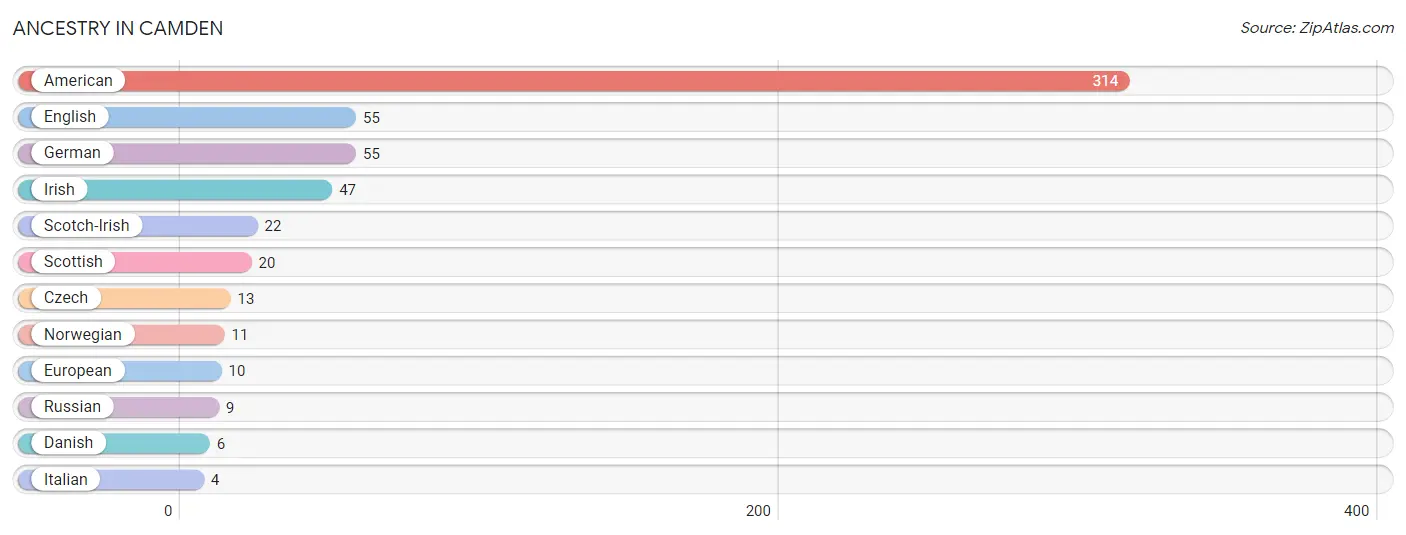
| Ancestry | # Population | % Population |
| American | 314 | 14.6% |
| Czech | 13 | 0.6% |
| Danish | 6 | 0.3% |
| English | 55 | 2.6% |
| European | 10 | 0.5% |
| German | 55 | 2.6% |
| Irish | 47 | 2.2% |
| Italian | 4 | 0.2% |
| Norwegian | 11 | 0.5% |
| Russian | 9 | 0.4% |
| Scotch-Irish | 22 | 1.0% |
| Scottish | 20 | 0.9% | View All 12 Rows |
Immigrants in Camden

| Immigration Origin | # Population | % Population | View All 0 Rows |
Sex and Age in Camden
Sex and Age in Camden
The most populous age groups in Camden are 25 to 29 Years (141 | 15.4%) for men and 65 to 69 Years (139 | 11.3%) for women.
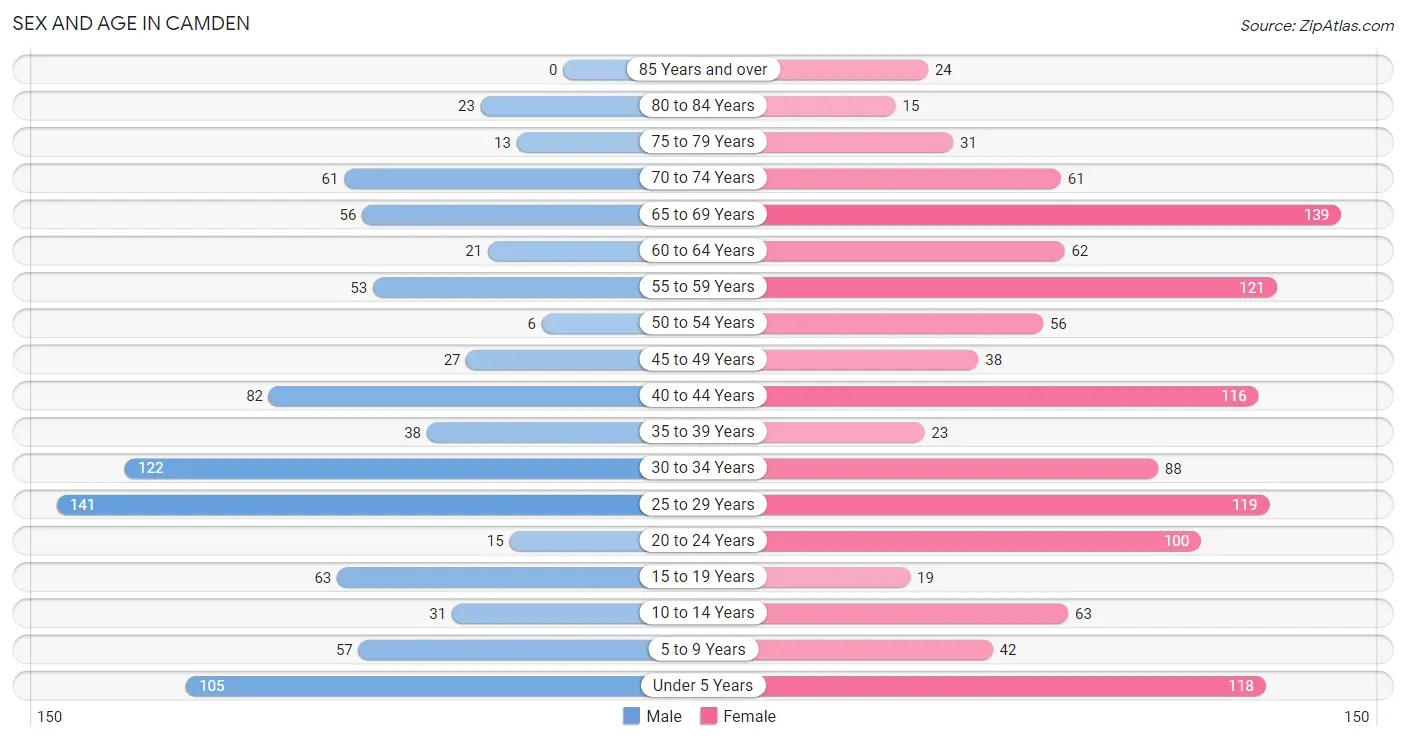
| Age Bracket | Male | Female |
| Under 5 Years | 105 (11.5%) | 118 (9.6%) |
| 5 to 9 Years | 57 (6.2%) | 42 (3.4%) |
| 10 to 14 Years | 31 (3.4%) | 63 (5.1%) |
| 15 to 19 Years | 63 (6.9%) | 19 (1.5%) |
| 20 to 24 Years | 15 (1.6%) | 100 (8.1%) |
| 25 to 29 Years | 141 (15.4%) | 119 (9.6%) |
| 30 to 34 Years | 122 (13.4%) | 88 (7.1%) |
| 35 to 39 Years | 38 (4.2%) | 23 (1.9%) |
| 40 to 44 Years | 82 (9.0%) | 116 (9.4%) |
| 45 to 49 Years | 27 (2.9%) | 38 (3.1%) |
| 50 to 54 Years | 6 (0.7%) | 56 (4.5%) |
| 55 to 59 Years | 53 (5.8%) | 121 (9.8%) |
| 60 to 64 Years | 21 (2.3%) | 62 (5.0%) |
| 65 to 69 Years | 56 (6.1%) | 139 (11.3%) |
| 70 to 74 Years | 61 (6.7%) | 61 (4.9%) |
| 75 to 79 Years | 13 (1.4%) | 31 (2.5%) |
| 80 to 84 Years | 23 (2.5%) | 15 (1.2%) |
| 85 Years and over | 0 (0.0%) | 24 (1.9%) |
| Total | 914 (100.0%) | 1,235 (100.0%) |
Families and Households in Camden
Median Family Size in Camden
The median family size in Camden is 4.54 persons per family, with single male/father families (6 | 1.4%) accounting for the largest median family size of 8.67 persons per family. On the other hand, married-couple families (188 | 43.9%) represent the smallest median family size with 3.76 persons per family.
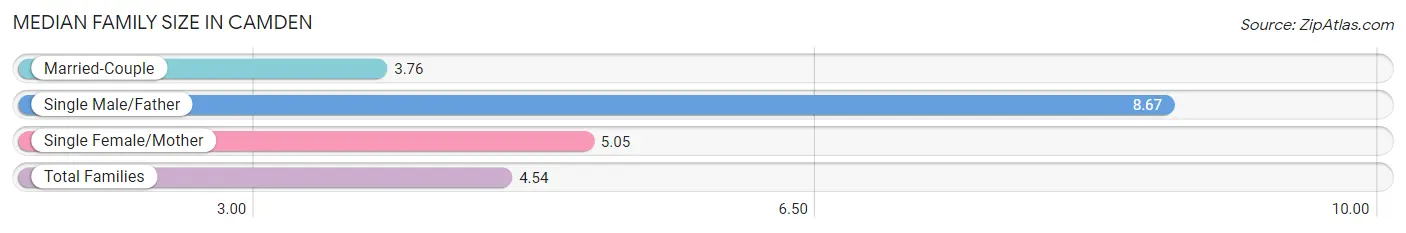
| Family Type | # Families | Family Size |
| Married-Couple | 188 (43.9%) | 3.76 |
| Single Male/Father | 6 (1.4%) | 8.67 |
| Single Female/Mother | 234 (54.7%) | 5.05 |
| Total Families | 428 (100.0%) | 4.54 |
Median Household Size in Camden
The median household size in Camden is 3.83 persons per household, with single male/father households (6 | 1.1%) accounting for the largest median household size of 8.67 persons per household. non-family households (113 | 20.9%) represent the smallest median household size with 1.14 persons per household.
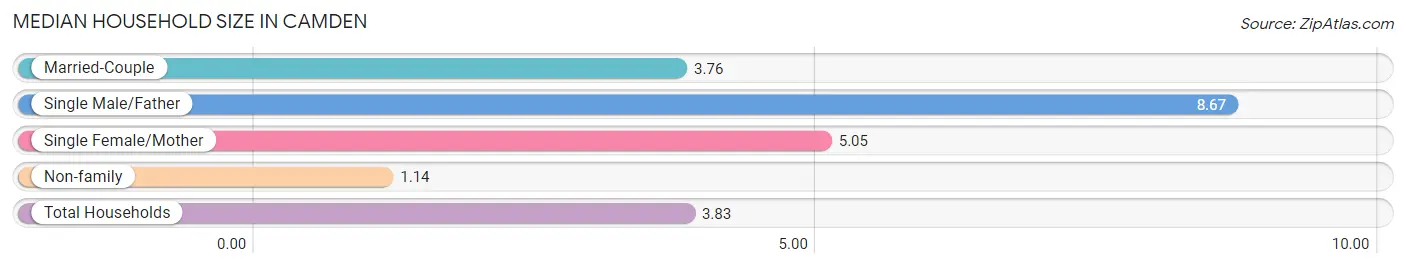
| Household Type | # Households | Household Size |
| Married-Couple | 188 (34.7%) | 3.76 |
| Single Male/Father | 6 (1.1%) | 8.67 |
| Single Female/Mother | 234 (43.2%) | 5.05 |
| Non-family | 113 (20.9%) | 1.14 |
| Total Households | 541 (100.0%) | 3.83 |
Household Size by Marriage Status in Camden
Out of a total of 541 households in Camden, 428 (79.1%) are family households, while 113 (20.9%) are nonfamily households. The most numerous type of family households are 2-person households, comprising 223, and the most common type of nonfamily households are 1-person households, comprising 104.
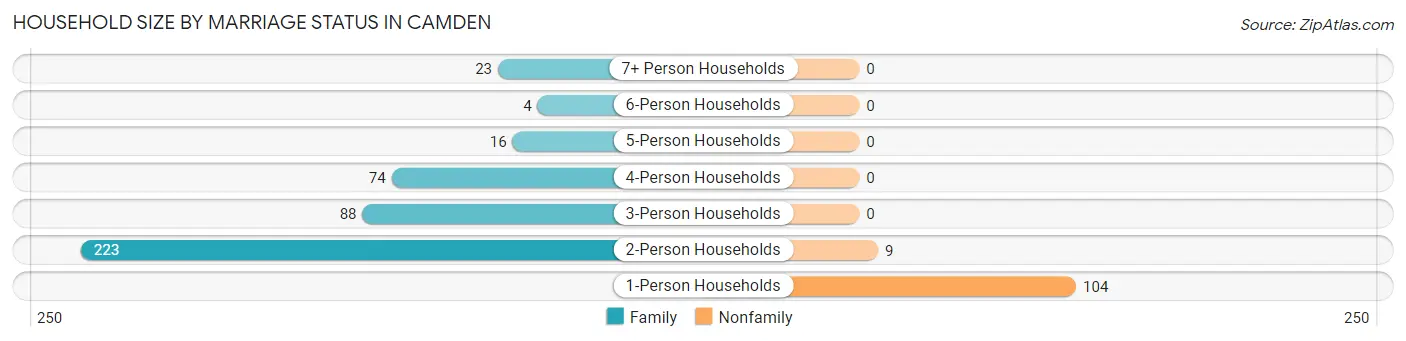
| Household Size | Family Households | Nonfamily Households |
| 1-Person Households | - | 104 (19.2%) |
| 2-Person Households | 223 (41.2%) | 9 (1.7%) |
| 3-Person Households | 88 (16.3%) | 0 (0.0%) |
| 4-Person Households | 74 (13.7%) | 0 (0.0%) |
| 5-Person Households | 16 (3.0%) | 0 (0.0%) |
| 6-Person Households | 4 (0.7%) | 0 (0.0%) |
| 7+ Person Households | 23 (4.3%) | 0 (0.0%) |
| Total | 428 (79.1%) | 113 (20.9%) |
Female Fertility in Camden
Fertility by Age in Camden
Average fertility rate in Camden is 25.0 births per 1,000 women. Women in the age bracket of 20 to 34 years have the highest fertility rate with 42.0 births per 1,000 women. Women in the age bracket of 20 to 34 years acount for 100.0% of all women with births.
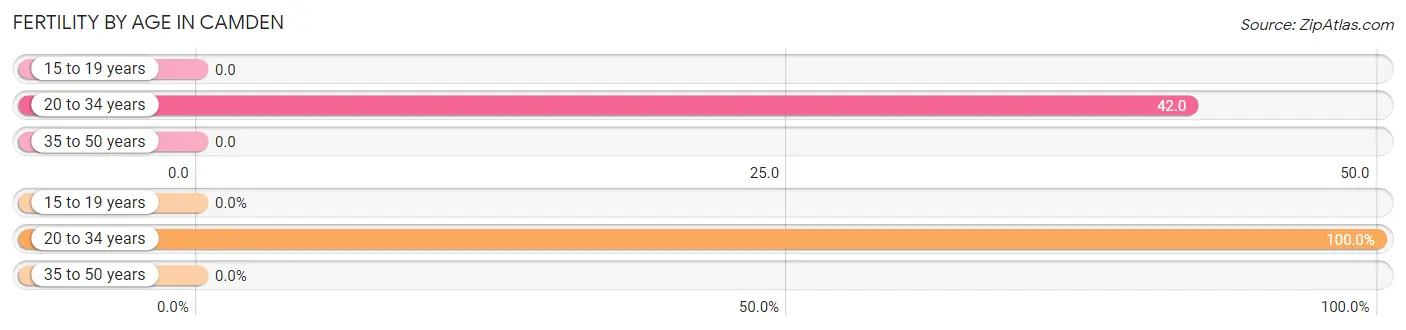
| Age Bracket | Women with Births | Births / 1,000 Women |
| 15 to 19 years | 0 (0.0%) | 0.0 |
| 20 to 34 years | 13 (100.0%) | 42.0 |
| 35 to 50 years | 0 (0.0%) | 0.0 |
| Total | 13 (100.0%) | 25.0 |
Fertility by Age by Marriage Status in Camden
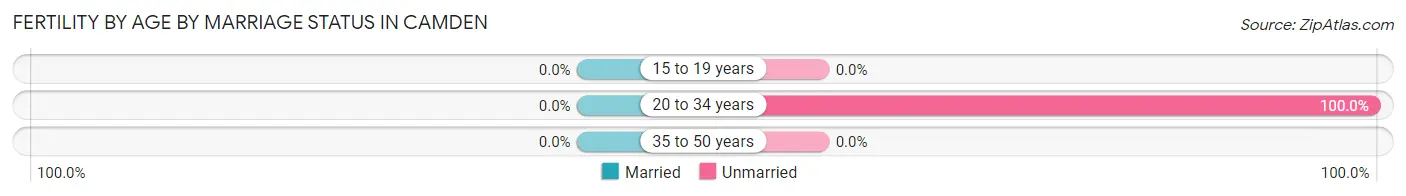
| Age Bracket | Married | Unmarried |
| 15 to 19 years | 0 (0.0%) | 0 (0.0%) |
| 20 to 34 years | 0 (0.0%) | 13 (100.0%) |
| 35 to 50 years | 0 (0.0%) | 0 (0.0%) |
| Total | 0 (0.0%) | 13 (100.0%) |
Fertility by Education in Camden
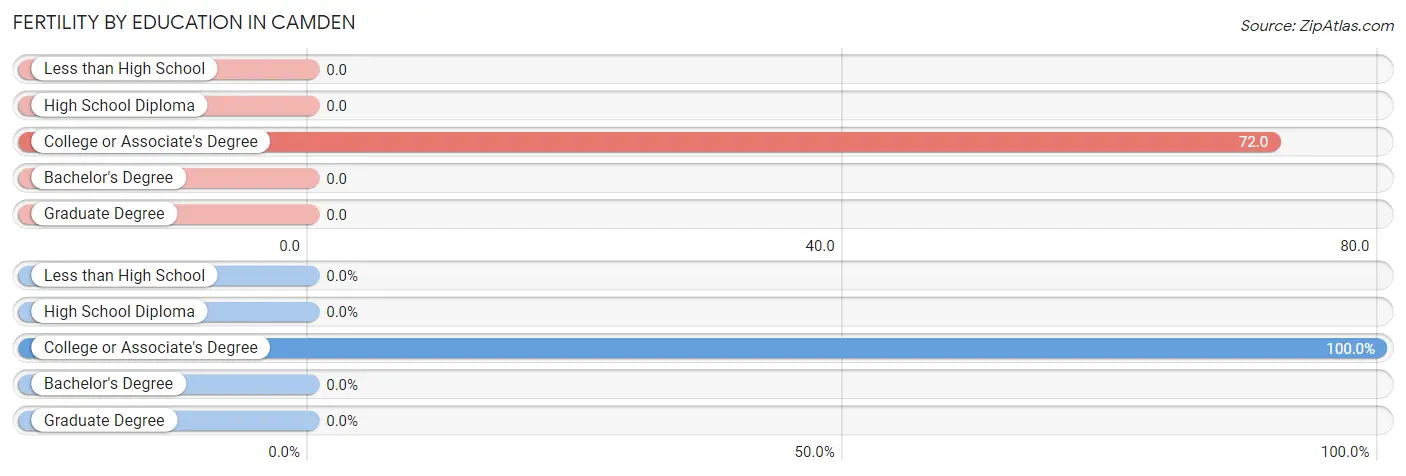
| Educational Attainment | Women with Births | Births / 1,000 Women |
| Less than High School | 0 (0.0%) | 0.0 |
| High School Diploma | 0 (0.0%) | 0.0 |
| College or Associate's Degree | 13 (100.0%) | 72.0 |
| Bachelor's Degree | 0 (0.0%) | 0.0 |
| Graduate Degree | 0 (0.0%) | 0.0 |
| Total | 13 (100.0%) | 25.0 |
Fertility by Education by Marriage Status in Camden
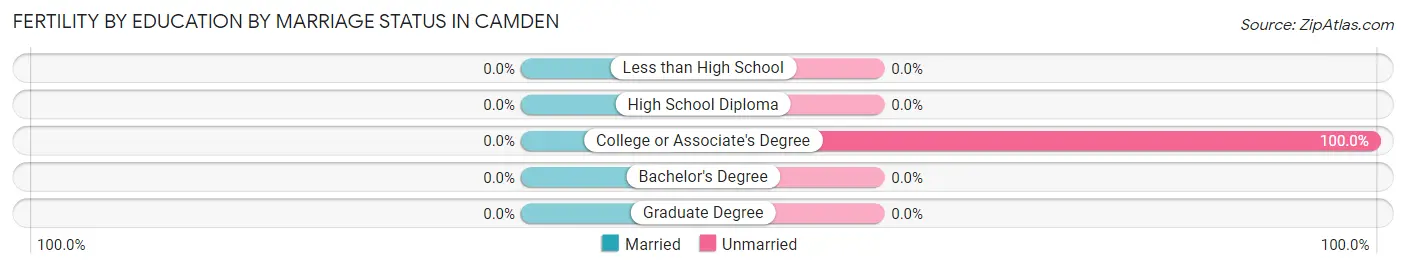
| Educational Attainment | Married | Unmarried |
| Less than High School | 0 (0.0%) | 0 (0.0%) |
| High School Diploma | 0 (0.0%) | 0 (0.0%) |
| College or Associate's Degree | 0 (0.0%) | 13 (100.0%) |
| Bachelor's Degree | 0 (0.0%) | 0 (0.0%) |
| Graduate Degree | 0 (0.0%) | 0 (0.0%) |
| Total | 0 (0.0%) | 13 (100.0%) |
Employment Characteristics in Camden
Employment by Class of Employer in Camden
Among the 676 employed individuals in Camden, private company employees (403 | 59.6%), not-for-profit organizations (106 | 15.7%), and local government employees (86 | 12.7%) make up the most common classes of employment.
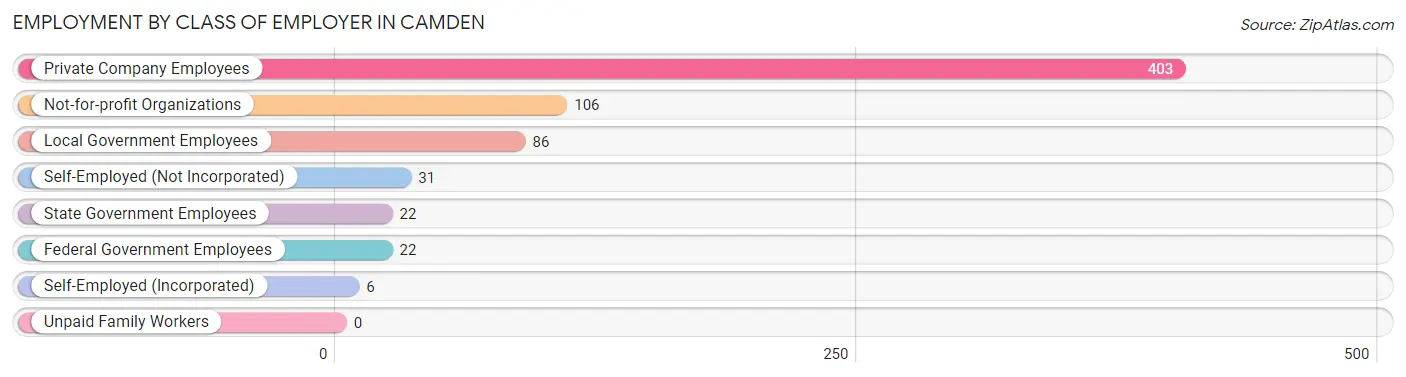
| Employer Class | # Employees | % Employees |
| Private Company Employees | 403 | 59.6% |
| Self-Employed (Incorporated) | 6 | 0.9% |
| Self-Employed (Not Incorporated) | 31 | 4.6% |
| Not-for-profit Organizations | 106 | 15.7% |
| Local Government Employees | 86 | 12.7% |
| State Government Employees | 22 | 3.3% |
| Federal Government Employees | 22 | 3.3% |
| Unpaid Family Workers | 0 | 0.0% |
| Total | 676 | 100.0% |
Employment Status by Age in Camden
According to the labor force statistics for Camden, out of the total population over 16 years of age (1,702), 46.2% or 786 individuals are in the labor force, with 11.7% or 92 of them unemployed. The age group with the highest labor force participation rate is 30 to 34 years, with 81.4% or 171 individuals in the labor force. Within the labor force, the 20 to 24 years age range has the highest percentage of unemployed individuals, with 41.1% or 30 of them being unemployed.
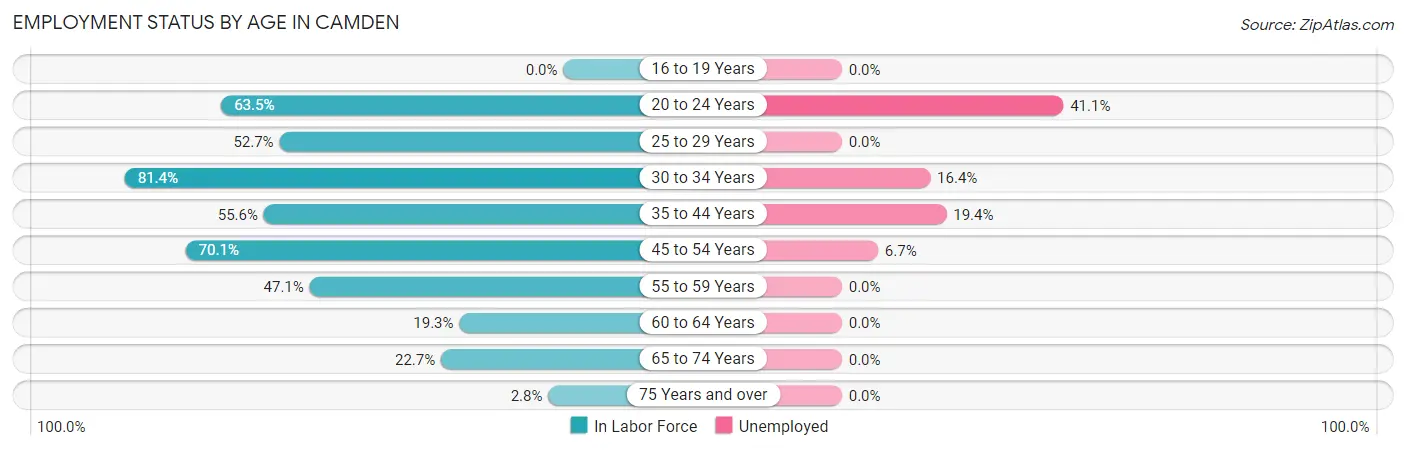
| Age Bracket | In Labor Force | Unemployed |
| 16 to 19 Years | 0 (0.0%) | 0 (0.0%) |
| 20 to 24 Years | 73 (63.5%) | 30 (41.1%) |
| 25 to 29 Years | 137 (52.7%) | 0 (0.0%) |
| 30 to 34 Years | 171 (81.4%) | 28 (16.4%) |
| 35 to 44 Years | 144 (55.6%) | 28 (19.4%) |
| 45 to 54 Years | 89 (70.1%) | 6 (6.7%) |
| 55 to 59 Years | 82 (47.1%) | 0 (0.0%) |
| 60 to 64 Years | 16 (19.3%) | 0 (0.0%) |
| 65 to 74 Years | 72 (22.7%) | 0 (0.0%) |
| 75 Years and over | 3 (2.8%) | 0 (0.0%) |
| Total | 786 (46.2%) | 92 (11.7%) |
Employment Status by Educational Attainment in Camden
According to labor force statistics for Camden, 57.4% of individuals (639) out of the total population between 25 and 64 years of age (1,113) are in the labor force, with 9.7% or 62 of them being unemployed. The group with the highest labor force participation rate are those with the educational attainment of bachelor's degree or higher, with 84.1% or 211 individuals in the labor force. Within the labor force, individuals with high school diploma education have the highest percentage of unemployment, with 25.0% or 28 of them being unemployed.
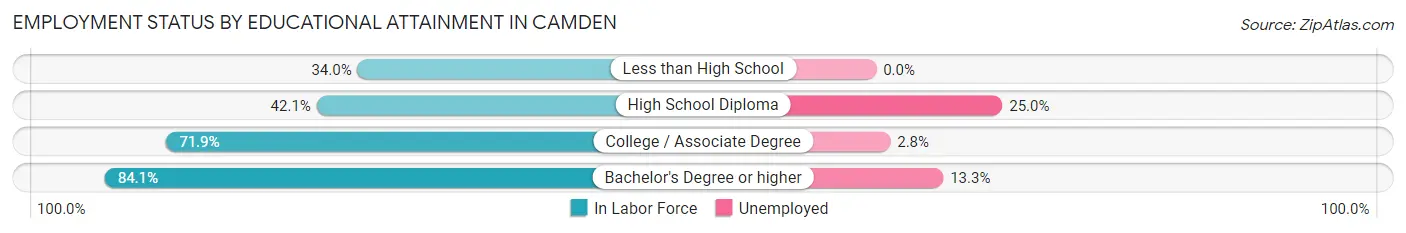
| Educational Attainment | In Labor Force | Unemployed |
| Less than High School | 101 (34.0%) | 0 (0.0%) |
| High School Diploma | 112 (42.1%) | 66 (25.0%) |
| College / Associate Degree | 215 (71.9%) | 8 (2.8%) |
| Bachelor's Degree or higher | 211 (84.1%) | 33 (13.3%) |
| Total | 639 (57.4%) | 108 (9.7%) |
Employment Occupations by Sex in Camden
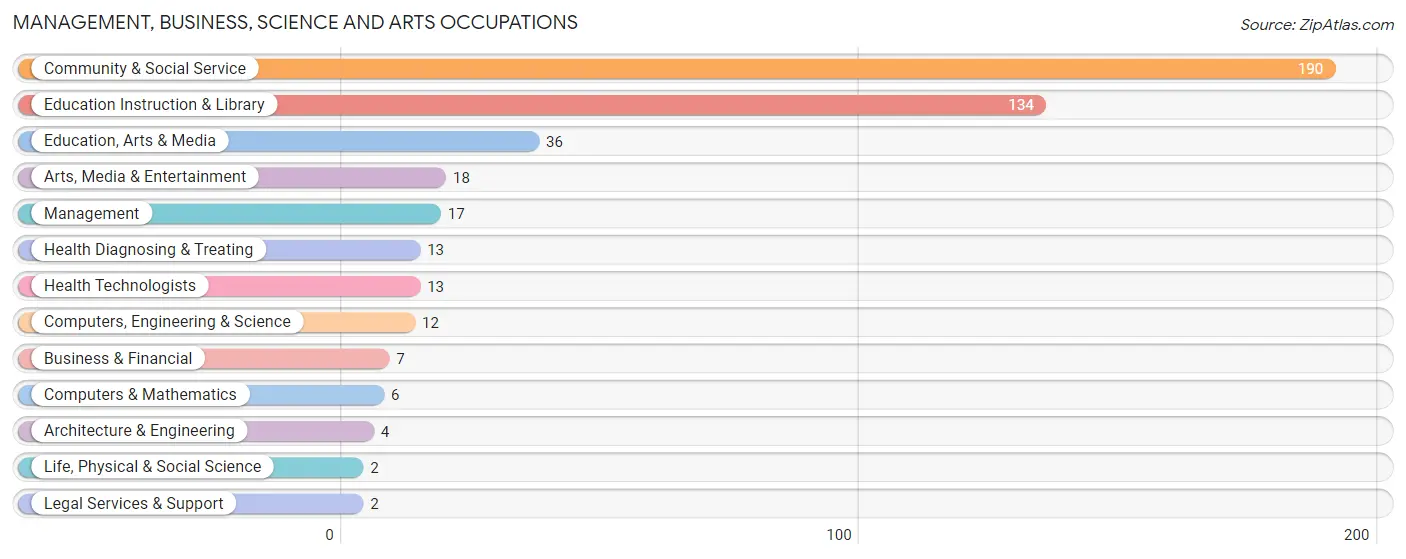
Management, Business, Science and Arts Occupations
The most common Management, Business, Science and Arts occupations in Camden are Community & Social Service (190 | 27.3%), Education Instruction & Library (134 | 19.3%), Education, Arts & Media (36 | 5.2%), Arts, Media & Entertainment (18 | 2.6%), and Management (17 | 2.5%).
Management, Business, Science and Arts Occupations by Sex
Within the Management, Business, Science and Arts occupations in Camden, the most male-oriented occupations are Computers & Mathematics (100.0%), Life, Physical & Social Science (100.0%), and Legal Services & Support (100.0%), while the most female-oriented occupations are Education Instruction & Library (100.0%), Arts, Media & Entertainment (100.0%), and Community & Social Service (86.3%).
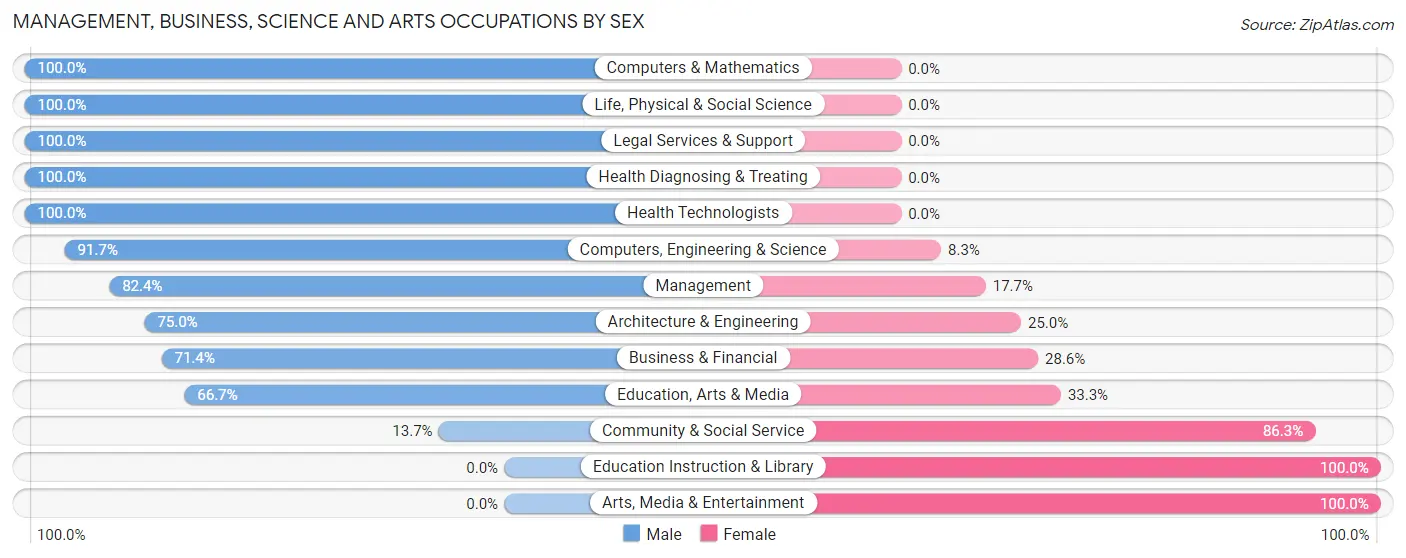
| Occupation | Male | Female |
| Management | 14 (82.4%) | 3 (17.6%) |
| Business & Financial | 5 (71.4%) | 2 (28.6%) |
| Computers, Engineering & Science | 11 (91.7%) | 1 (8.3%) |
| Computers & Mathematics | 6 (100.0%) | 0 (0.0%) |
| Architecture & Engineering | 3 (75.0%) | 1 (25.0%) |
| Life, Physical & Social Science | 2 (100.0%) | 0 (0.0%) |
| Community & Social Service | 26 (13.7%) | 164 (86.3%) |
| Education, Arts & Media | 24 (66.7%) | 12 (33.3%) |
| Legal Services & Support | 2 (100.0%) | 0 (0.0%) |
| Education Instruction & Library | 0 (0.0%) | 134 (100.0%) |
| Arts, Media & Entertainment | 0 (0.0%) | 18 (100.0%) |
| Health Diagnosing & Treating | 13 (100.0%) | 0 (0.0%) |
| Health Technologists | 13 (100.0%) | 0 (0.0%) |
| Total (Category) | 69 (28.9%) | 170 (71.1%) |
| Total (Overall) | 317 (45.6%) | 378 (54.4%) |
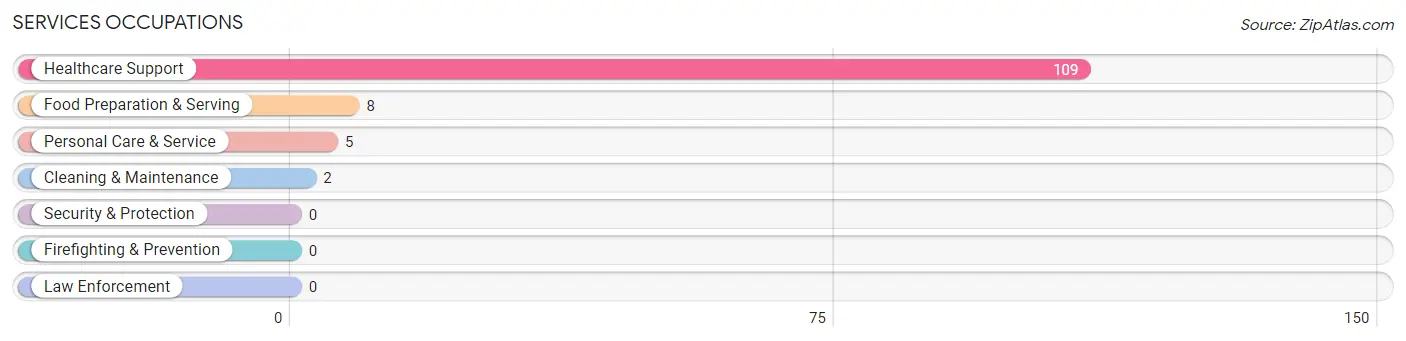
Services Occupations
The most common Services occupations in Camden are Healthcare Support (109 | 15.7%), Food Preparation & Serving (8 | 1.1%), Personal Care & Service (5 | 0.7%), and Cleaning & Maintenance (2 | 0.3%).
Services Occupations by Sex
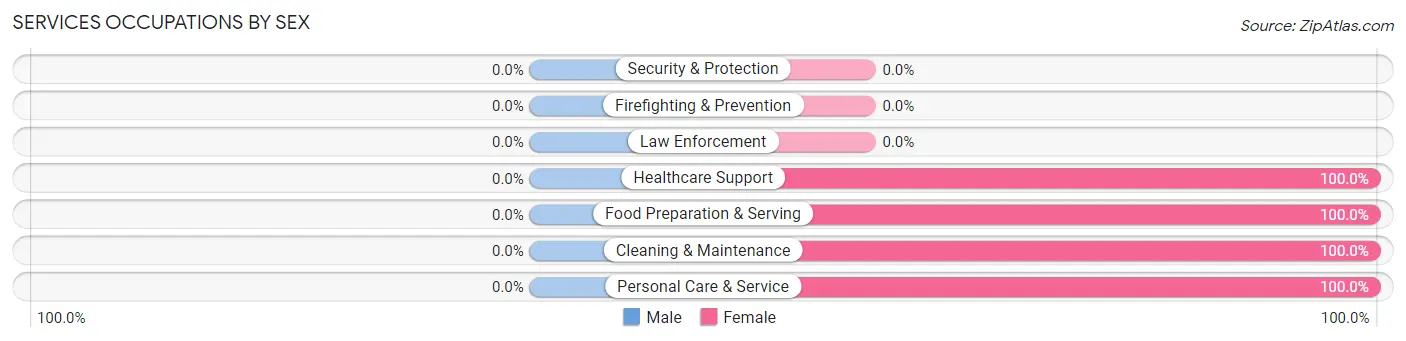
| Occupation | Male | Female |
| Healthcare Support | 0 (0.0%) | 109 (100.0%) |
| Security & Protection | 0 (0.0%) | 0 (0.0%) |
| Firefighting & Prevention | 0 (0.0%) | 0 (0.0%) |
| Law Enforcement | 0 (0.0%) | 0 (0.0%) |
| Food Preparation & Serving | 0 (0.0%) | 8 (100.0%) |
| Cleaning & Maintenance | 0 (0.0%) | 2 (100.0%) |
| Personal Care & Service | 0 (0.0%) | 5 (100.0%) |
| Total (Category) | 0 (0.0%) | 124 (100.0%) |
| Total (Overall) | 317 (45.6%) | 378 (54.4%) |
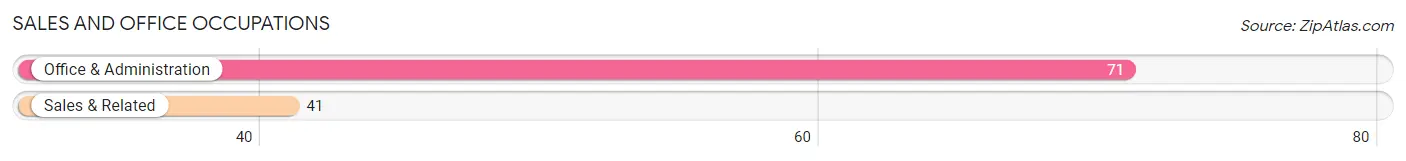
Sales and Office Occupations
The most common Sales and Office occupations in Camden are Office & Administration (71 | 10.2%), and Sales & Related (41 | 5.9%).
Sales and Office Occupations by Sex
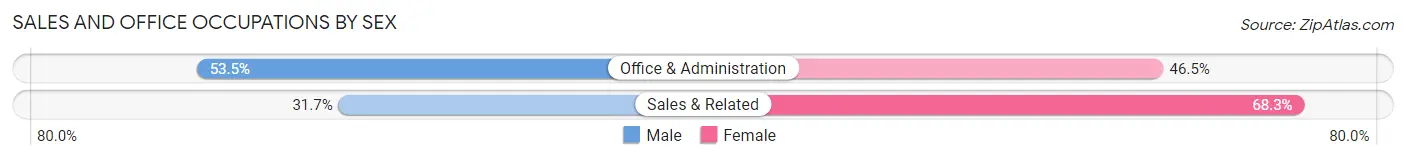
| Occupation | Male | Female |
| Sales & Related | 13 (31.7%) | 28 (68.3%) |
| Office & Administration | 38 (53.5%) | 33 (46.5%) |
| Total (Category) | 51 (45.5%) | 61 (54.5%) |
| Total (Overall) | 317 (45.6%) | 378 (54.4%) |
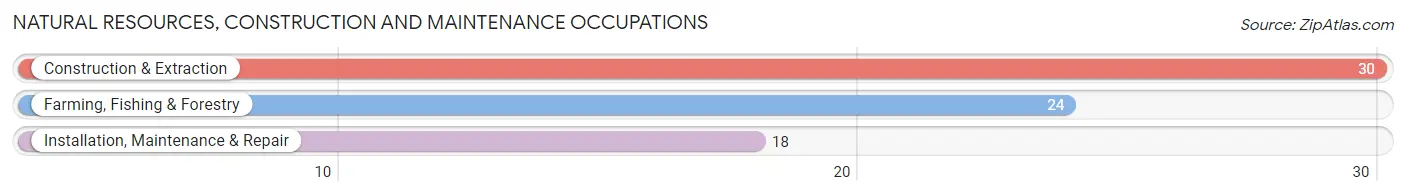
Natural Resources, Construction and Maintenance Occupations
The most common Natural Resources, Construction and Maintenance occupations in Camden are Construction & Extraction (30 | 4.3%), Farming, Fishing & Forestry (24 | 3.5%), and Installation, Maintenance & Repair (18 | 2.6%).
Natural Resources, Construction and Maintenance Occupations by Sex
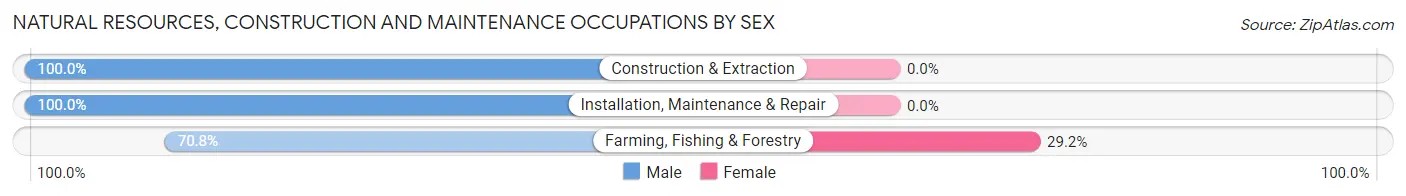
| Occupation | Male | Female |
| Farming, Fishing & Forestry | 17 (70.8%) | 7 (29.2%) |
| Construction & Extraction | 30 (100.0%) | 0 (0.0%) |
| Installation, Maintenance & Repair | 18 (100.0%) | 0 (0.0%) |
| Total (Category) | 65 (90.3%) | 7 (9.7%) |
| Total (Overall) | 317 (45.6%) | 378 (54.4%) |
Production, Transportation and Moving Occupations
The most common Production, Transportation and Moving occupations in Camden are Production (127 | 18.3%), Material Moving (16 | 2.3%), and Transportation (5 | 0.7%).
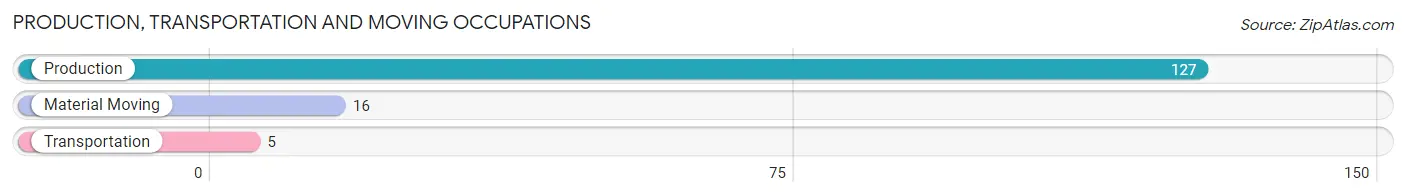
Production, Transportation and Moving Occupations by Sex
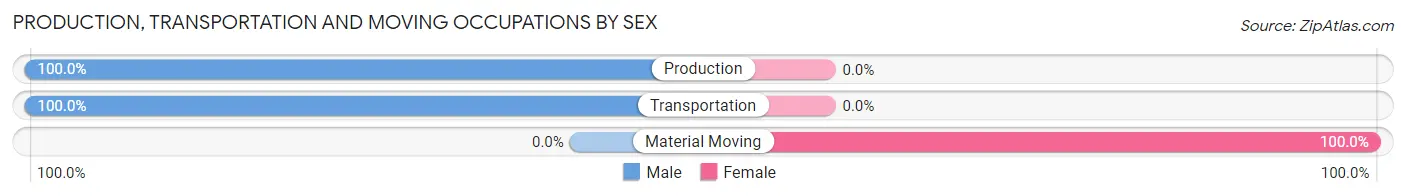
| Occupation | Male | Female |
| Production | 127 (100.0%) | 0 (0.0%) |
| Transportation | 5 (100.0%) | 0 (0.0%) |
| Material Moving | 0 (0.0%) | 16 (100.0%) |
| Total (Category) | 132 (89.2%) | 16 (10.8%) |
| Total (Overall) | 317 (45.6%) | 378 (54.4%) |
Employment Industries by Sex in Camden
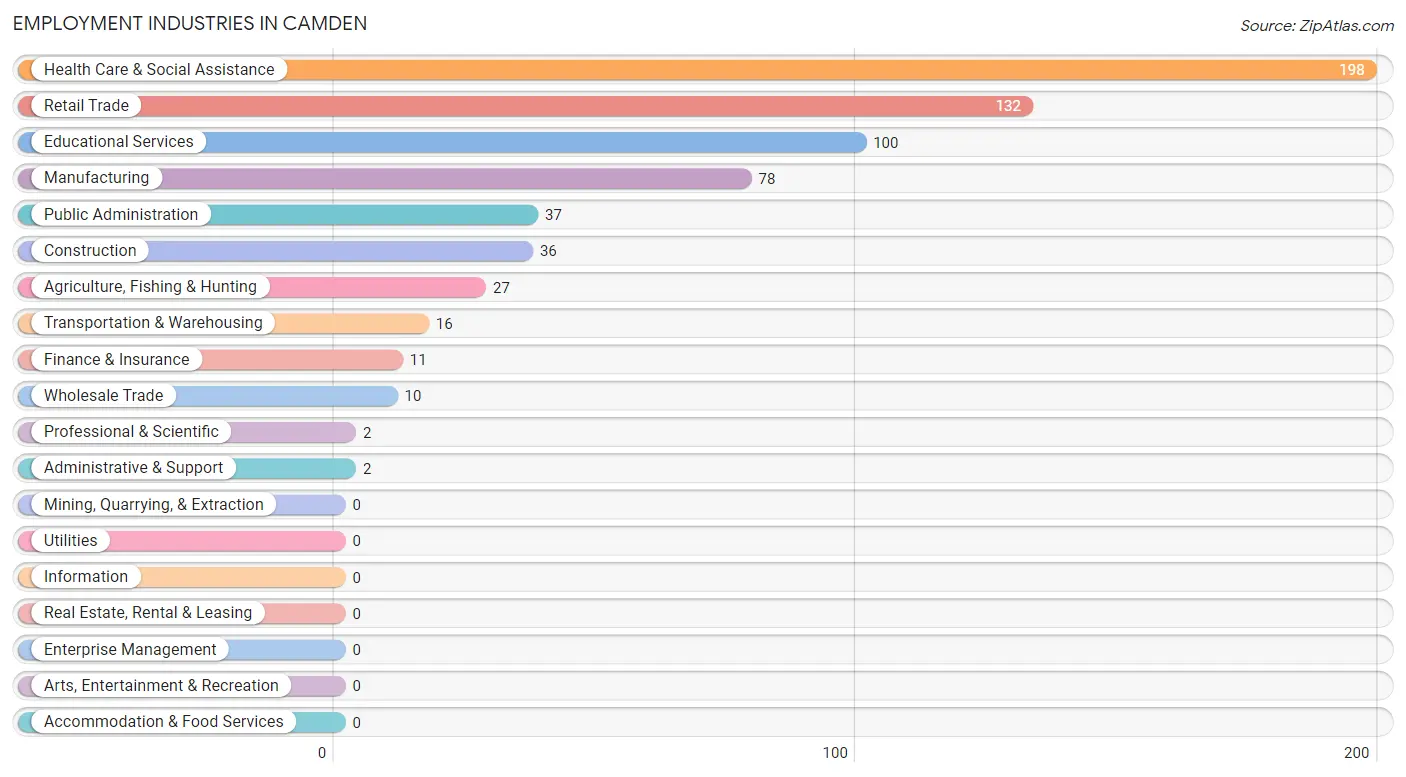
Employment Industries in Camden
The major employment industries in Camden include Health Care & Social Assistance (198 | 28.5%), Retail Trade (132 | 19.0%), Educational Services (100 | 14.4%), Manufacturing (78 | 11.2%), and Public Administration (37 | 5.3%).
Employment Industries by Sex in Camden
The Camden industries that see more men than women are Construction (100.0%), Professional & Scientific (100.0%), and Manufacturing (89.7%), whereas the industries that tend to have a higher number of women are Administrative & Support (100.0%), Educational Services (100.0%), and Health Care & Social Assistance (82.3%).
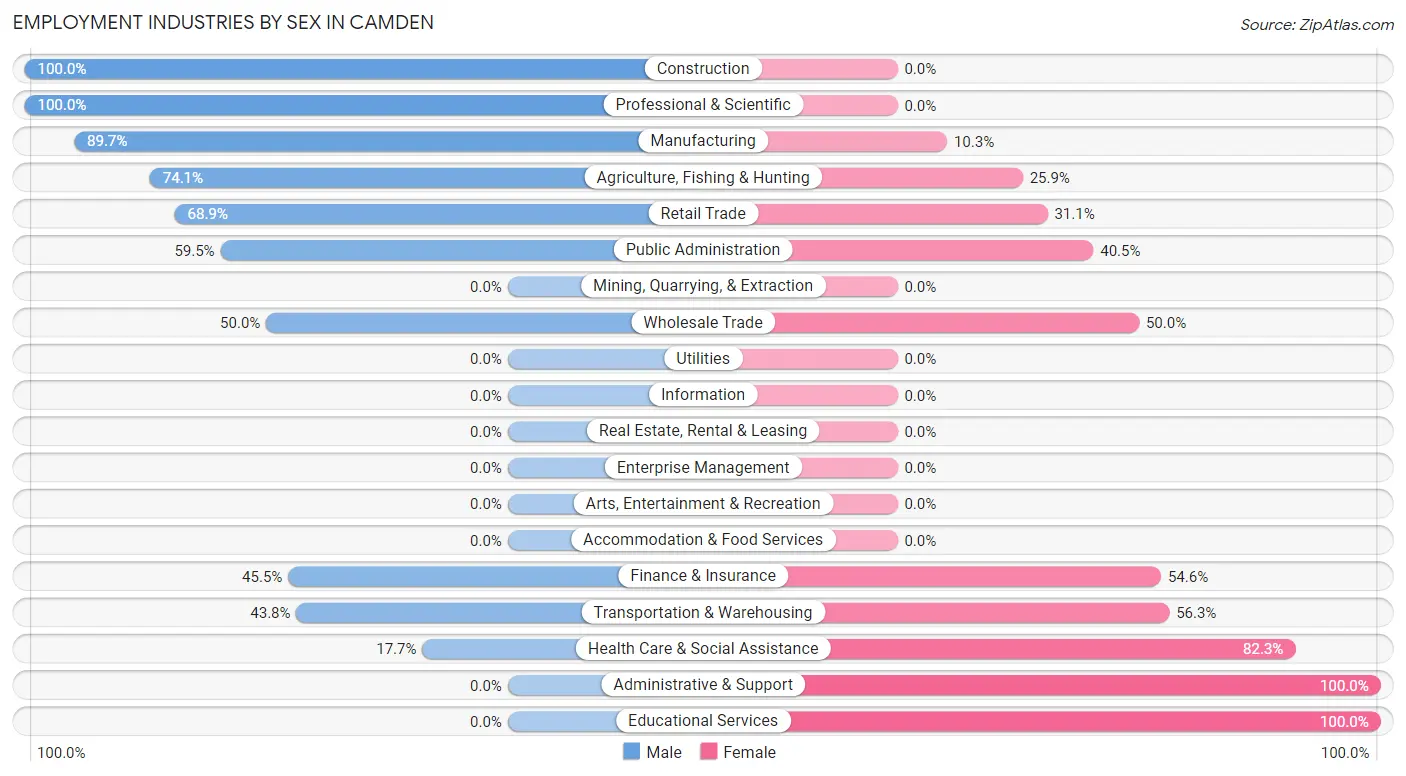
| Industry | Male | Female |
| Agriculture, Fishing & Hunting | 20 (74.1%) | 7 (25.9%) |
| Mining, Quarrying, & Extraction | 0 (0.0%) | 0 (0.0%) |
| Construction | 36 (100.0%) | 0 (0.0%) |
| Manufacturing | 70 (89.7%) | 8 (10.3%) |
| Wholesale Trade | 5 (50.0%) | 5 (50.0%) |
| Retail Trade | 91 (68.9%) | 41 (31.1%) |
| Transportation & Warehousing | 7 (43.8%) | 9 (56.2%) |
| Utilities | 0 (0.0%) | 0 (0.0%) |
| Information | 0 (0.0%) | 0 (0.0%) |
| Finance & Insurance | 5 (45.5%) | 6 (54.5%) |
| Real Estate, Rental & Leasing | 0 (0.0%) | 0 (0.0%) |
| Professional & Scientific | 2 (100.0%) | 0 (0.0%) |
| Enterprise Management | 0 (0.0%) | 0 (0.0%) |
| Administrative & Support | 0 (0.0%) | 2 (100.0%) |
| Educational Services | 0 (0.0%) | 100 (100.0%) |
| Health Care & Social Assistance | 35 (17.7%) | 163 (82.3%) |
| Arts, Entertainment & Recreation | 0 (0.0%) | 0 (0.0%) |
| Accommodation & Food Services | 0 (0.0%) | 0 (0.0%) |
| Public Administration | 22 (59.5%) | 15 (40.5%) |
| Total | 317 (45.6%) | 378 (54.4%) |
Education in Camden
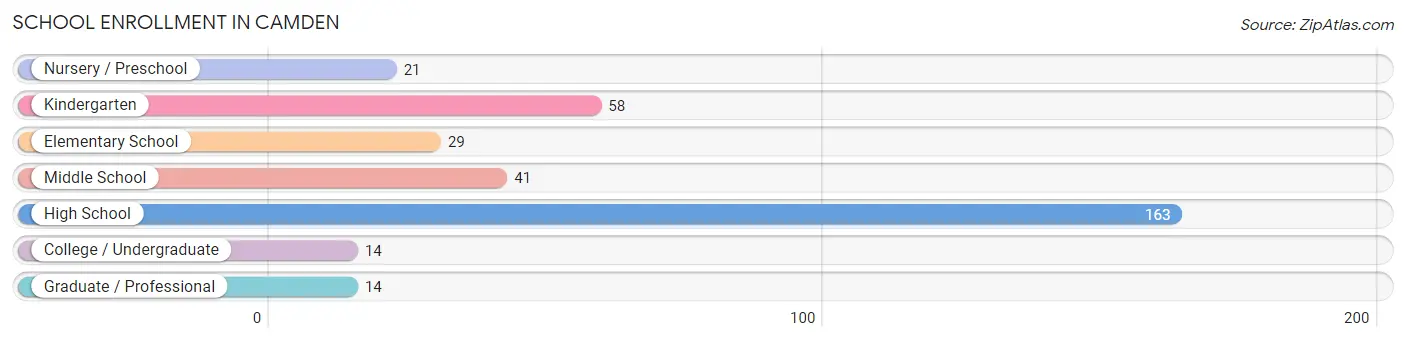
School Enrollment in Camden
The most common levels of schooling among the 340 students in Camden are high school (163 | 47.9%), kindergarten (58 | 17.1%), and middle school (41 | 12.1%).
| School Level | # Students | % Students |
| Nursery / Preschool | 21 | 6.2% |
| Kindergarten | 58 | 17.1% |
| Elementary School | 29 | 8.5% |
| Middle School | 41 | 12.1% |
| High School | 163 | 47.9% |
| College / Undergraduate | 14 | 4.1% |
| Graduate / Professional | 14 | 4.1% |
| Total | 340 | 100.0% |
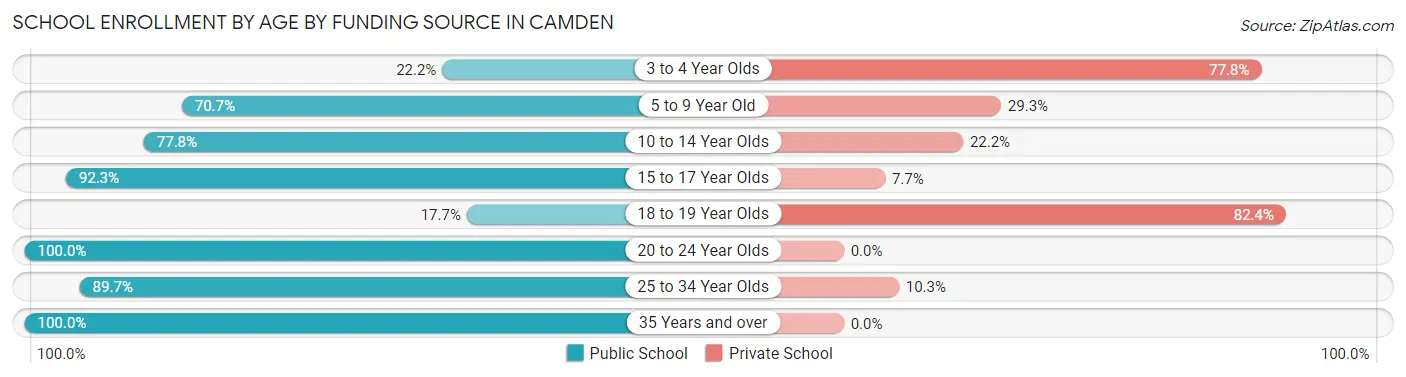
School Enrollment by Age by Funding Source in Camden
Out of a total of 340 students who are enrolled in schools in Camden, 79 (23.2%) attend a private institution, while the remaining 261 (76.8%) are enrolled in public schools. The age group of 18 to 19 year olds has the highest likelihood of being enrolled in private schools, with 14 (82.4% in the age bracket) enrolled. Conversely, the age group of 20 to 24 year olds has the lowest likelihood of being enrolled in a private school, with 1 (100.0% in the age bracket) attending a public institution.
| Age Bracket | Public School | Private School |
| 3 to 4 Year Olds | 2 (22.2%) | 7 (77.8%) |
| 5 to 9 Year Old | 70 (70.7%) | 29 (29.3%) |
| 10 to 14 Year Olds | 70 (77.8%) | 20 (22.2%) |
| 15 to 17 Year Olds | 60 (92.3%) | 5 (7.7%) |
| 18 to 19 Year Olds | 3 (17.6%) | 14 (82.4%) |
| 20 to 24 Year Olds | 1 (100.0%) | 0 (0.0%) |
| 25 to 34 Year Olds | 35 (89.7%) | 4 (10.3%) |
| 35 Years and over | 20 (100.0%) | 0 (0.0%) |
| Total | 261 (76.8%) | 79 (23.2%) |
Educational Attainment by Field of Study in Camden
Business (206 | 61.5%), education (47 | 14.0%), science & technology (24 | 7.2%), liberal arts & history (24 | 7.2%), and engineering (10 | 3.0%) are the most common fields of study among 335 individuals in Camden who have obtained a bachelor's degree or higher.
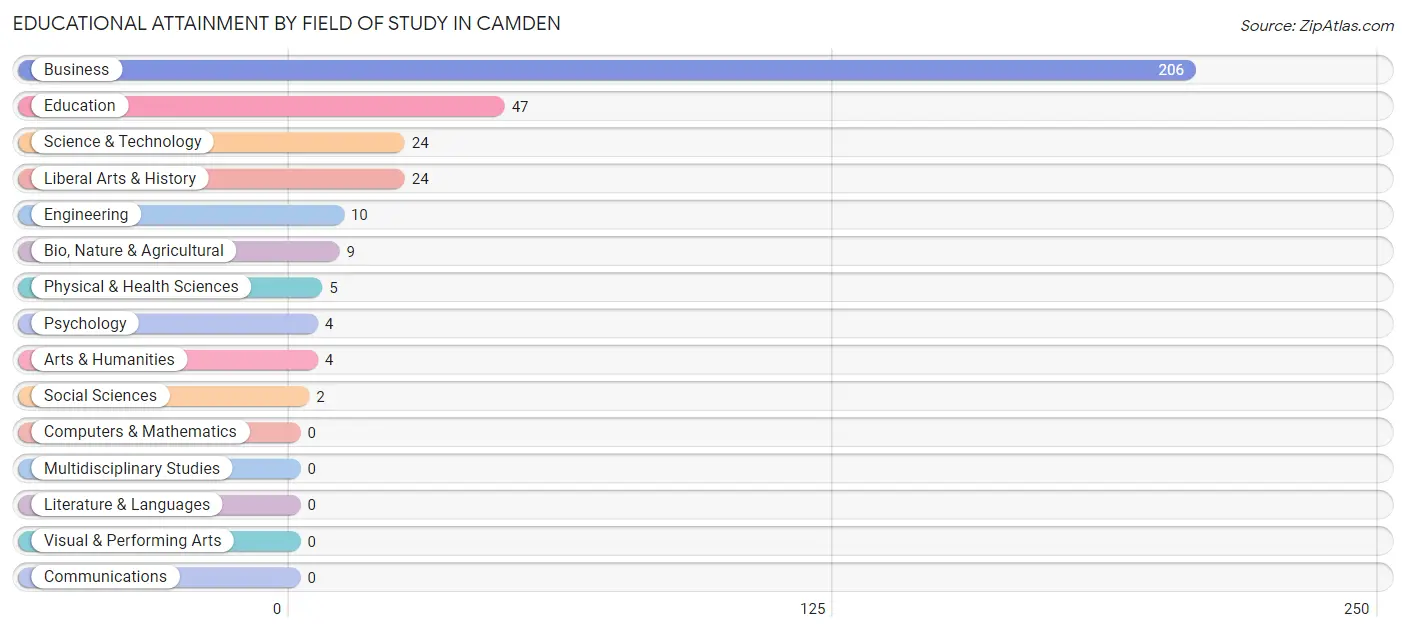
| Field of Study | # Graduates | % Graduates |
| Computers & Mathematics | 0 | 0.0% |
| Bio, Nature & Agricultural | 9 | 2.7% |
| Physical & Health Sciences | 5 | 1.5% |
| Psychology | 4 | 1.2% |
| Social Sciences | 2 | 0.6% |
| Engineering | 10 | 3.0% |
| Multidisciplinary Studies | 0 | 0.0% |
| Science & Technology | 24 | 7.2% |
| Business | 206 | 61.5% |
| Education | 47 | 14.0% |
| Literature & Languages | 0 | 0.0% |
| Liberal Arts & History | 24 | 7.2% |
| Visual & Performing Arts | 0 | 0.0% |
| Communications | 0 | 0.0% |
| Arts & Humanities | 4 | 1.2% |
| Total | 335 | 100.0% |
Transportation & Commute in Camden
Vehicle Availability by Sex in Camden
The most prevalent vehicle ownership categories in Camden are males with 2 vehicles (111, accounting for 35.7%) and females with 2 vehicles (157, making up 30.4%).
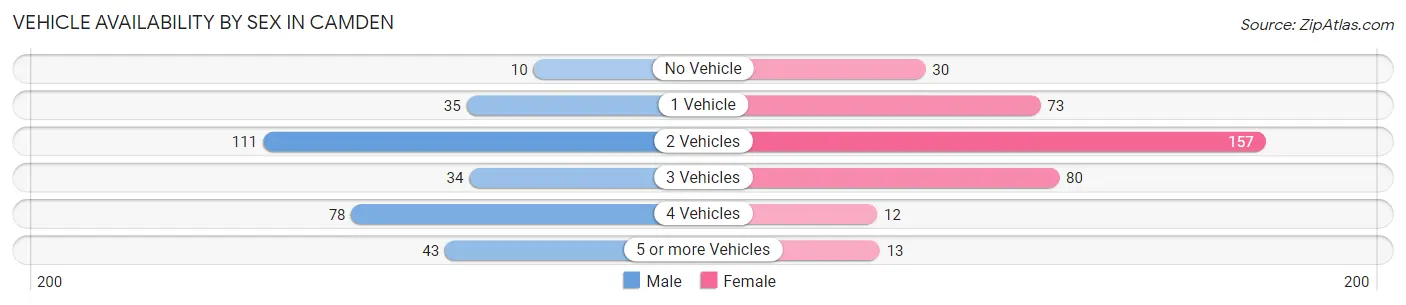
| Vehicles Available | Male | Female |
| No Vehicle | 10 (3.2%) | 30 (8.2%) |
| 1 Vehicle | 35 (11.3%) | 73 (20.0%) |
| 2 Vehicles | 111 (35.7%) | 157 (43.0%) |
| 3 Vehicles | 34 (10.9%) | 80 (21.9%) |
| 4 Vehicles | 78 (25.1%) | 12 (3.3%) |
| 5 or more Vehicles | 43 (13.8%) | 13 (3.6%) |
| Total | 311 (100.0%) | 365 (100.0%) |
Commute Time in Camden
The most frequently occuring commute durations in Camden are 5 to 9 minutes (169 commuters, 26.1%), 10 to 14 minutes (113 commuters, 17.4%), and 60 to 89 minutes (96 commuters, 14.8%).
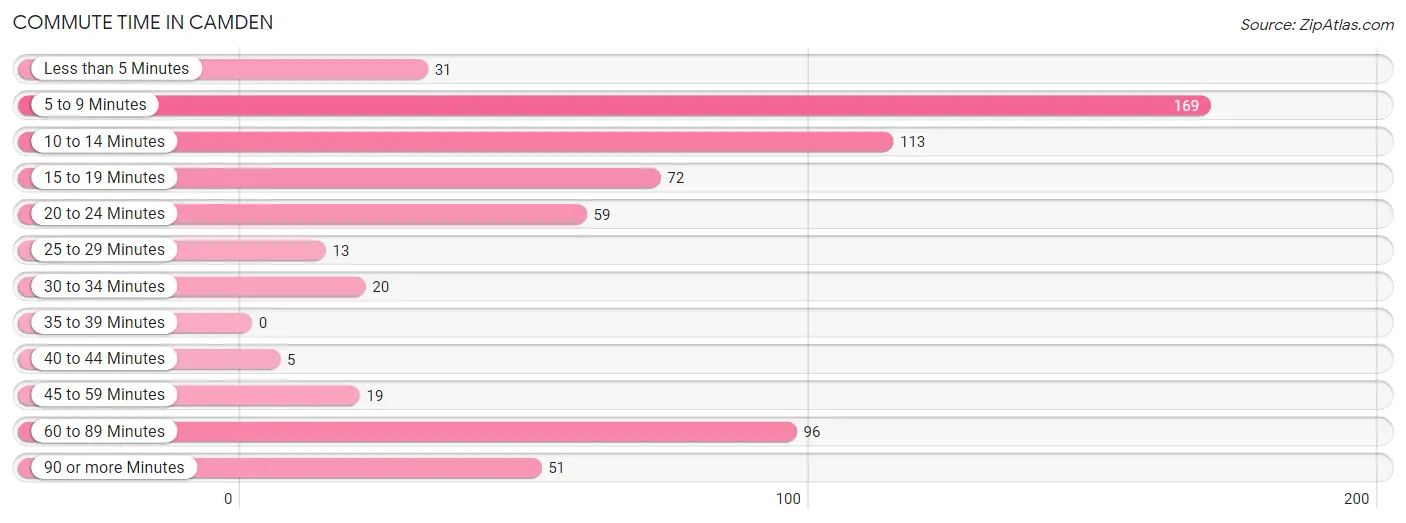
| Commute Time | # Commuters | % Commuters |
| Less than 5 Minutes | 31 | 4.8% |
| 5 to 9 Minutes | 169 | 26.1% |
| 10 to 14 Minutes | 113 | 17.4% |
| 15 to 19 Minutes | 72 | 11.1% |
| 20 to 24 Minutes | 59 | 9.1% |
| 25 to 29 Minutes | 13 | 2.0% |
| 30 to 34 Minutes | 20 | 3.1% |
| 35 to 39 Minutes | 0 | 0.0% |
| 40 to 44 Minutes | 5 | 0.8% |
| 45 to 59 Minutes | 19 | 2.9% |
| 60 to 89 Minutes | 96 | 14.8% |
| 90 or more Minutes | 51 | 7.9% |
Commute Time by Sex in Camden
The most common commute times in Camden are 60 to 89 minutes (85 commuters, 27.3%) for males and 5 to 9 minutes (118 commuters, 35.0%) for females.
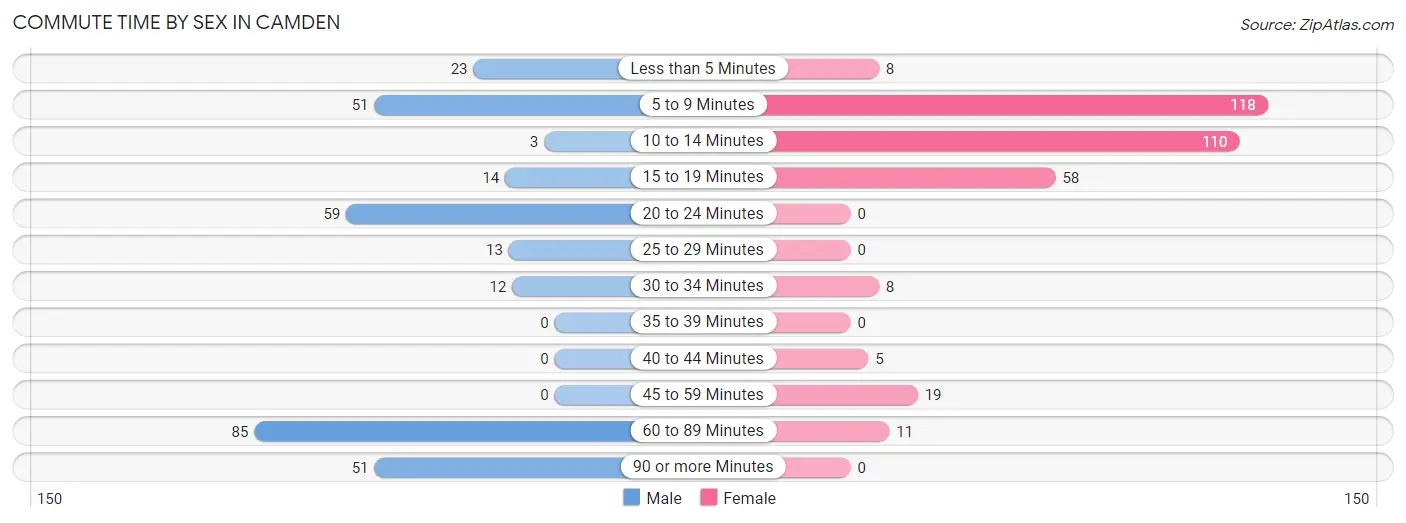
| Commute Time | Male | Female |
| Less than 5 Minutes | 23 (7.4%) | 8 (2.4%) |
| 5 to 9 Minutes | 51 (16.4%) | 118 (35.0%) |
| 10 to 14 Minutes | 3 (1.0%) | 110 (32.6%) |
| 15 to 19 Minutes | 14 (4.5%) | 58 (17.2%) |
| 20 to 24 Minutes | 59 (19.0%) | 0 (0.0%) |
| 25 to 29 Minutes | 13 (4.2%) | 0 (0.0%) |
| 30 to 34 Minutes | 12 (3.9%) | 8 (2.4%) |
| 35 to 39 Minutes | 0 (0.0%) | 0 (0.0%) |
| 40 to 44 Minutes | 0 (0.0%) | 5 (1.5%) |
| 45 to 59 Minutes | 0 (0.0%) | 19 (5.6%) |
| 60 to 89 Minutes | 85 (27.3%) | 11 (3.3%) |
| 90 or more Minutes | 51 (16.4%) | 0 (0.0%) |
Time of Departure to Work by Sex in Camden
The most frequent times of departure to work in Camden are 12:00 PM to 3:59 PM (65, 20.9%) for males and 7:00 AM to 7:29 AM (101, 30.0%) for females.
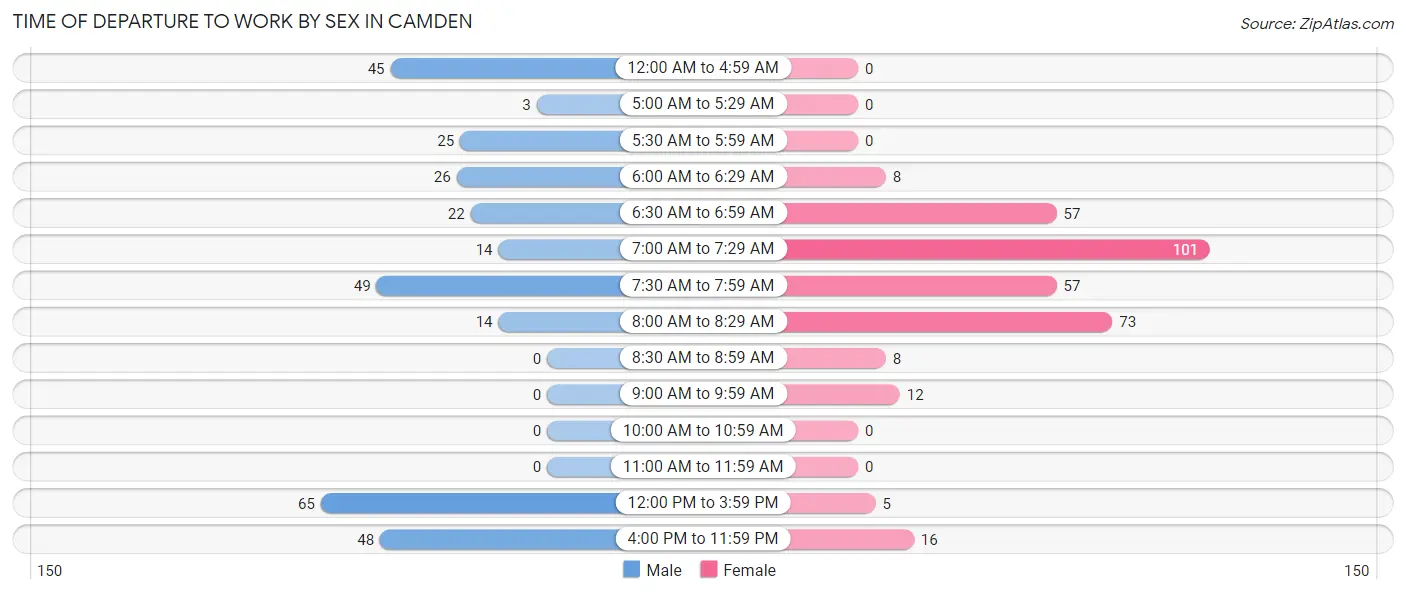
| Time of Departure | Male | Female |
| 12:00 AM to 4:59 AM | 45 (14.5%) | 0 (0.0%) |
| 5:00 AM to 5:29 AM | 3 (1.0%) | 0 (0.0%) |
| 5:30 AM to 5:59 AM | 25 (8.0%) | 0 (0.0%) |
| 6:00 AM to 6:29 AM | 26 (8.4%) | 8 (2.4%) |
| 6:30 AM to 6:59 AM | 22 (7.1%) | 57 (16.9%) |
| 7:00 AM to 7:29 AM | 14 (4.5%) | 101 (30.0%) |
| 7:30 AM to 7:59 AM | 49 (15.8%) | 57 (16.9%) |
| 8:00 AM to 8:29 AM | 14 (4.5%) | 73 (21.7%) |
| 8:30 AM to 8:59 AM | 0 (0.0%) | 8 (2.4%) |
| 9:00 AM to 9:59 AM | 0 (0.0%) | 12 (3.6%) |
| 10:00 AM to 10:59 AM | 0 (0.0%) | 0 (0.0%) |
| 11:00 AM to 11:59 AM | 0 (0.0%) | 0 (0.0%) |
| 12:00 PM to 3:59 PM | 65 (20.9%) | 5 (1.5%) |
| 4:00 PM to 11:59 PM | 48 (15.4%) | 16 (4.8%) |
| Total | 311 (100.0%) | 337 (100.0%) |
Housing Occupancy in Camden
Occupancy by Ownership in Camden
Of the total 541 dwellings in Camden, owner-occupied units account for 431 (79.7%), while renter-occupied units make up 110 (20.3%).
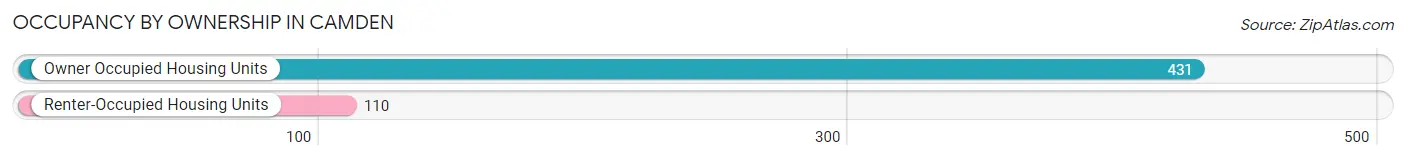
| Occupancy | # Housing Units | % Housing Units |
| Owner Occupied Housing Units | 431 | 79.7% |
| Renter-Occupied Housing Units | 110 | 20.3% |
| Total Occupied Housing Units | 541 | 100.0% |
Occupancy by Household Size in Camden
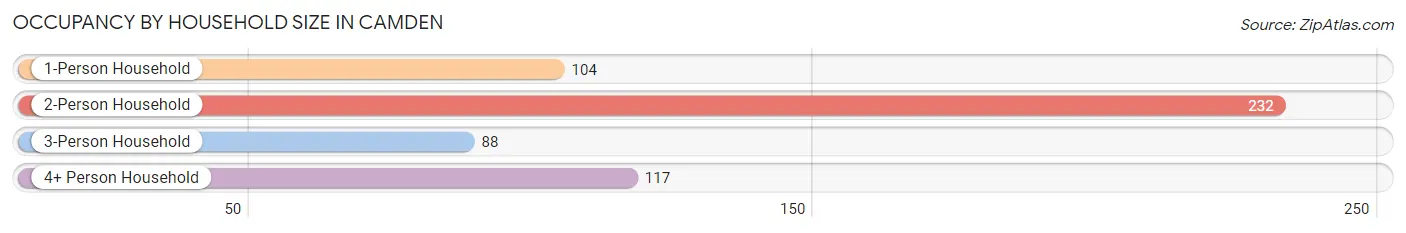
| Household Size | # Housing Units | % Housing Units |
| 1-Person Household | 104 | 19.2% |
| 2-Person Household | 232 | 42.9% |
| 3-Person Household | 88 | 16.3% |
| 4+ Person Household | 117 | 21.6% |
| Total Housing Units | 541 | 100.0% |
Occupancy by Ownership by Household Size in Camden
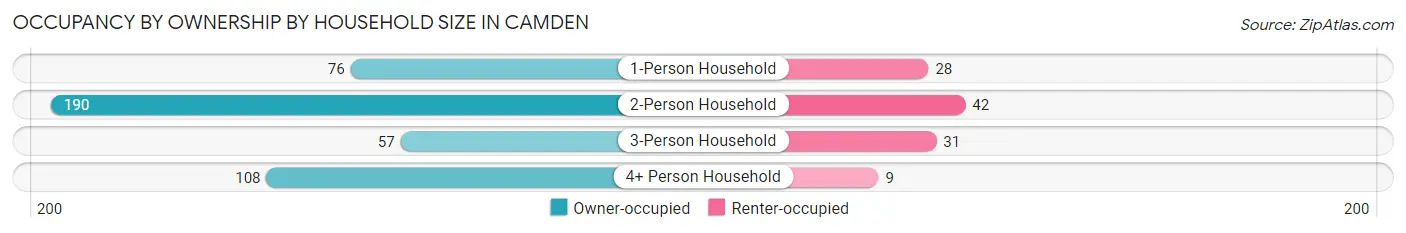
| Household Size | Owner-occupied | Renter-occupied |
| 1-Person Household | 76 (73.1%) | 28 (26.9%) |
| 2-Person Household | 190 (81.9%) | 42 (18.1%) |
| 3-Person Household | 57 (64.8%) | 31 (35.2%) |
| 4+ Person Household | 108 (92.3%) | 9 (7.7%) |
| Total Housing Units | 431 (79.7%) | 110 (20.3%) |
Occupancy by Educational Attainment in Camden
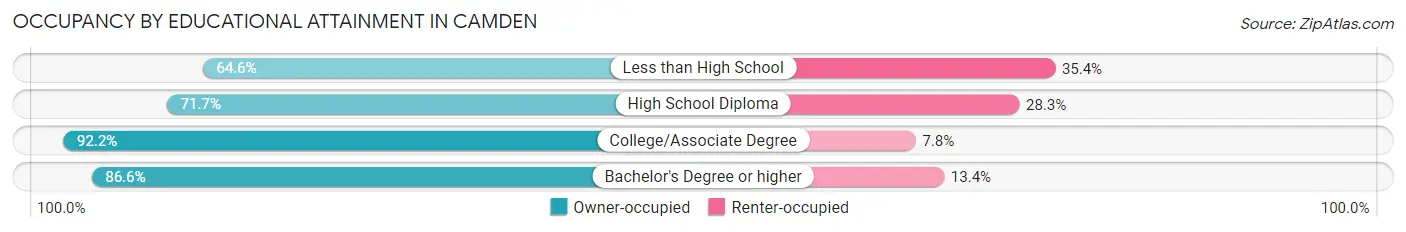
| Household Size | Owner-occupied | Renter-occupied |
| Less than High School | 51 (64.6%) | 28 (35.4%) |
| High School Diploma | 134 (71.7%) | 53 (28.3%) |
| College/Associate Degree | 130 (92.2%) | 11 (7.8%) |
| Bachelor's Degree or higher | 116 (86.6%) | 18 (13.4%) |
Occupancy by Age of Householder in Camden
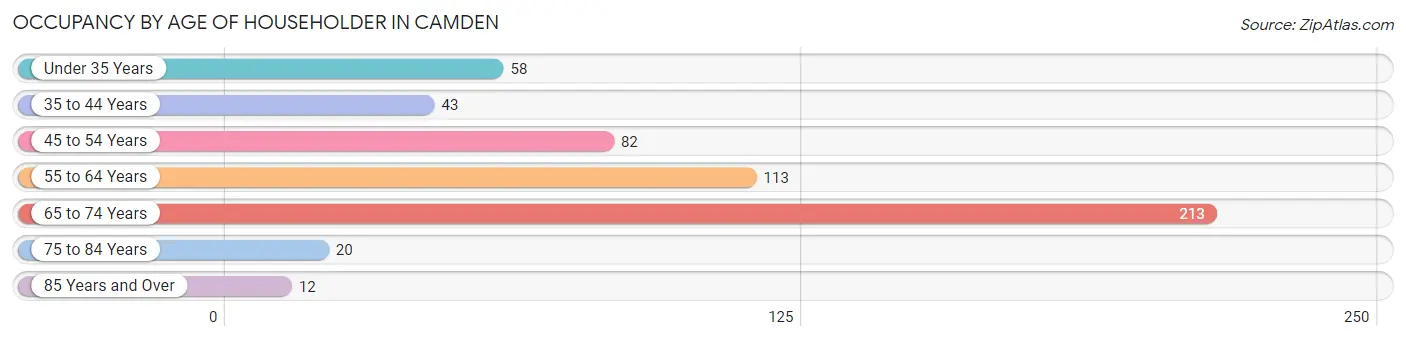
| Age Bracket | # Households | % Households |
| Under 35 Years | 58 | 10.7% |
| 35 to 44 Years | 43 | 8.0% |
| 45 to 54 Years | 82 | 15.2% |
| 55 to 64 Years | 113 | 20.9% |
| 65 to 74 Years | 213 | 39.4% |
| 75 to 84 Years | 20 | 3.7% |
| 85 Years and Over | 12 | 2.2% |
| Total | 541 | 100.0% |
Housing Finances in Camden
Median Income by Occupancy in Camden
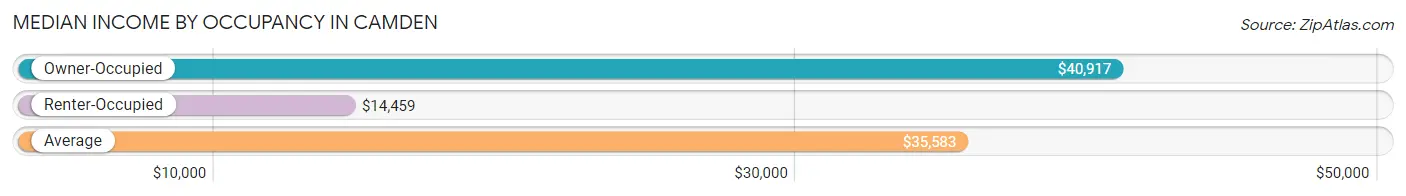
| Occupancy Type | # Households | Median Income |
| Owner-Occupied | 431 (79.7%) | $40,917 |
| Renter-Occupied | 110 (20.3%) | $14,459 |
| Average | 541 (100.0%) | $35,583 |
Occupancy by Householder Income Bracket in Camden
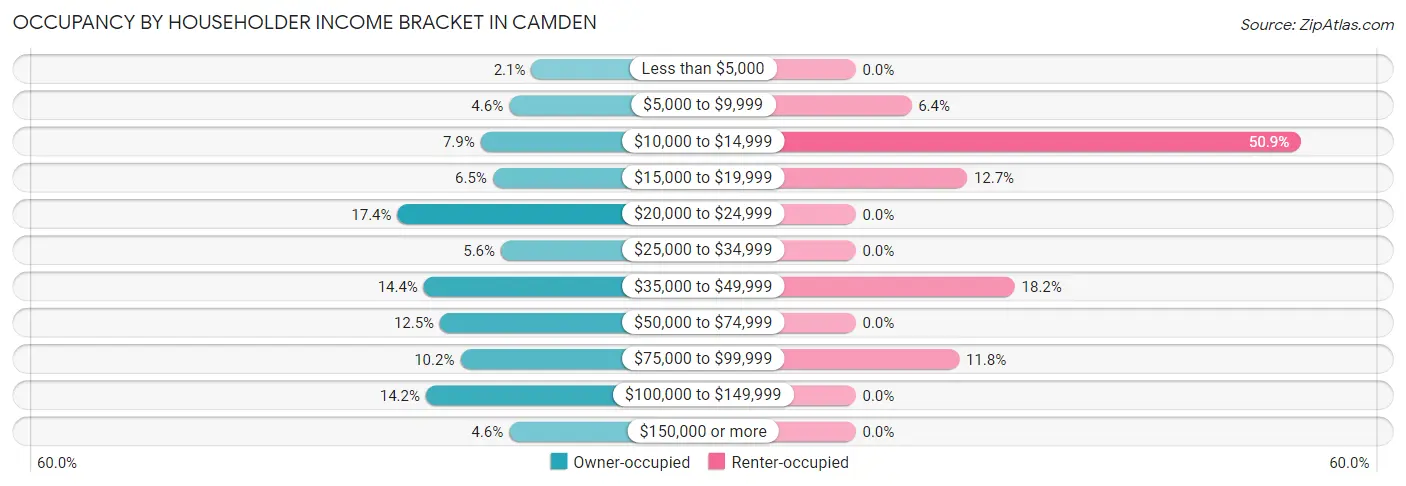
| Income Bracket | Owner-occupied | Renter-occupied |
| Less than $5,000 | 9 (2.1%) | 0 (0.0%) |
| $5,000 to $9,999 | 20 (4.6%) | 7 (6.4%) |
| $10,000 to $14,999 | 34 (7.9%) | 56 (50.9%) |
| $15,000 to $19,999 | 28 (6.5%) | 14 (12.7%) |
| $20,000 to $24,999 | 75 (17.4%) | 0 (0.0%) |
| $25,000 to $34,999 | 24 (5.6%) | 0 (0.0%) |
| $35,000 to $49,999 | 62 (14.4%) | 20 (18.2%) |
| $50,000 to $74,999 | 54 (12.5%) | 0 (0.0%) |
| $75,000 to $99,999 | 44 (10.2%) | 13 (11.8%) |
| $100,000 to $149,999 | 61 (14.1%) | 0 (0.0%) |
| $150,000 or more | 20 (4.6%) | 0 (0.0%) |
| Total | 431 (100.0%) | 110 (100.0%) |
Monthly Housing Cost Tiers in Camden
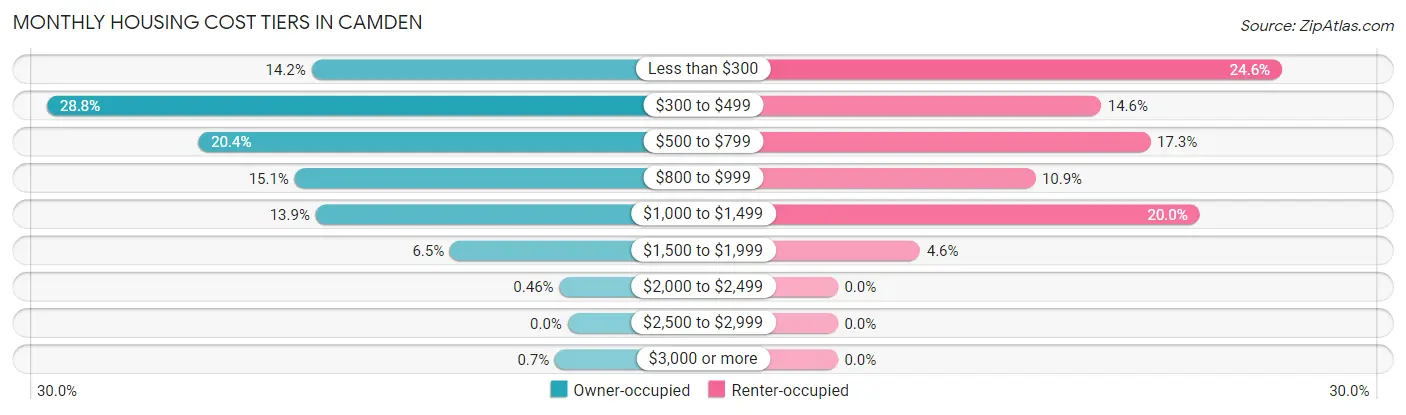
| Monthly Cost | Owner-occupied | Renter-occupied |
| Less than $300 | 61 (14.1%) | 27 (24.5%) |
| $300 to $499 | 124 (28.8%) | 16 (14.5%) |
| $500 to $799 | 88 (20.4%) | 19 (17.3%) |
| $800 to $999 | 65 (15.1%) | 12 (10.9%) |
| $1,000 to $1,499 | 60 (13.9%) | 22 (20.0%) |
| $1,500 to $1,999 | 28 (6.5%) | 5 (4.5%) |
| $2,000 to $2,499 | 2 (0.5%) | 0 (0.0%) |
| $2,500 to $2,999 | 0 (0.0%) | 0 (0.0%) |
| $3,000 or more | 3 (0.7%) | 0 (0.0%) |
| Total | 431 (100.0%) | 110 (100.0%) |
Physical Housing Characteristics in Camden
Housing Structures in Camden
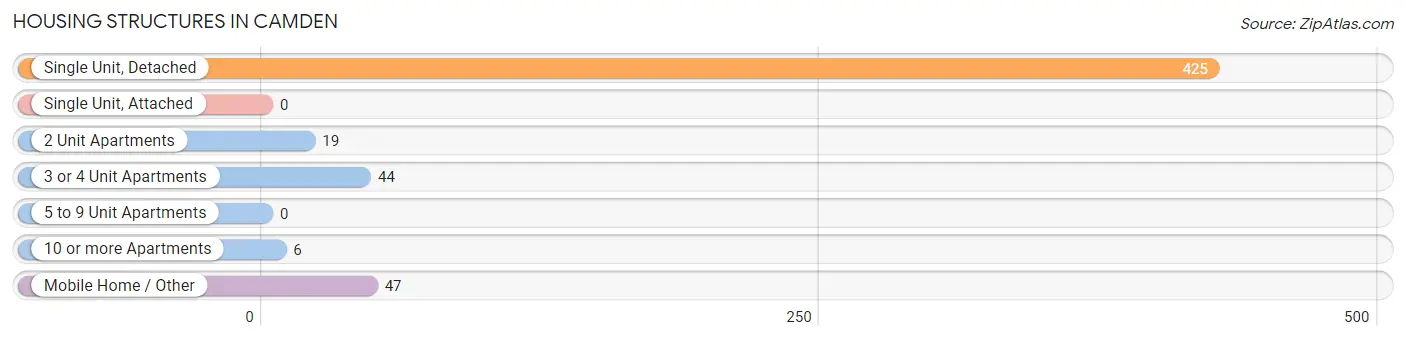
| Structure Type | # Housing Units | % Housing Units |
| Single Unit, Detached | 425 | 78.6% |
| Single Unit, Attached | 0 | 0.0% |
| 2 Unit Apartments | 19 | 3.5% |
| 3 or 4 Unit Apartments | 44 | 8.1% |
| 5 to 9 Unit Apartments | 0 | 0.0% |
| 10 or more Apartments | 6 | 1.1% |
| Mobile Home / Other | 47 | 8.7% |
| Total | 541 | 100.0% |
Housing Structures by Occupancy in Camden
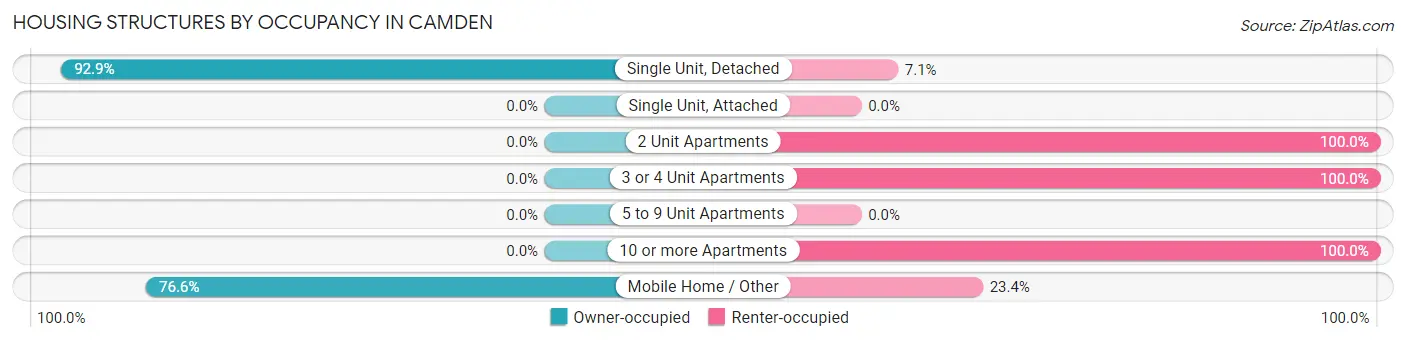
| Structure Type | Owner-occupied | Renter-occupied |
| Single Unit, Detached | 395 (92.9%) | 30 (7.1%) |
| Single Unit, Attached | 0 (0.0%) | 0 (0.0%) |
| 2 Unit Apartments | 0 (0.0%) | 19 (100.0%) |
| 3 or 4 Unit Apartments | 0 (0.0%) | 44 (100.0%) |
| 5 to 9 Unit Apartments | 0 (0.0%) | 0 (0.0%) |
| 10 or more Apartments | 0 (0.0%) | 6 (100.0%) |
| Mobile Home / Other | 36 (76.6%) | 11 (23.4%) |
| Total | 431 (79.7%) | 110 (20.3%) |
Housing Structures by Number of Rooms in Camden
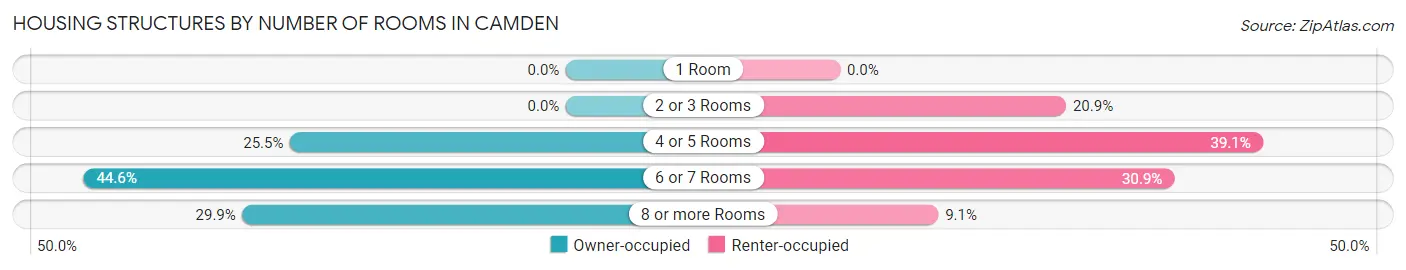
| Number of Rooms | Owner-occupied | Renter-occupied |
| 1 Room | 0 (0.0%) | 0 (0.0%) |
| 2 or 3 Rooms | 0 (0.0%) | 23 (20.9%) |
| 4 or 5 Rooms | 110 (25.5%) | 43 (39.1%) |
| 6 or 7 Rooms | 192 (44.6%) | 34 (30.9%) |
| 8 or more Rooms | 129 (29.9%) | 10 (9.1%) |
| Total | 431 (100.0%) | 110 (100.0%) |
Housing Structure by Heating Type in Camden
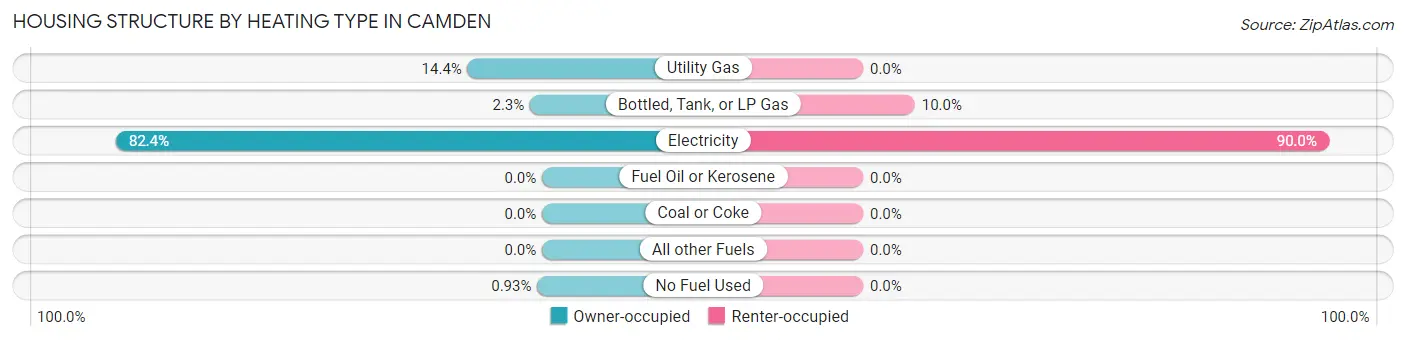
| Heating Type | Owner-occupied | Renter-occupied |
| Utility Gas | 62 (14.4%) | 0 (0.0%) |
| Bottled, Tank, or LP Gas | 10 (2.3%) | 11 (10.0%) |
| Electricity | 355 (82.4%) | 99 (90.0%) |
| Fuel Oil or Kerosene | 0 (0.0%) | 0 (0.0%) |
| Coal or Coke | 0 (0.0%) | 0 (0.0%) |
| All other Fuels | 0 (0.0%) | 0 (0.0%) |
| No Fuel Used | 4 (0.9%) | 0 (0.0%) |
| Total | 431 (100.0%) | 110 (100.0%) |
Household Vehicle Usage in Camden
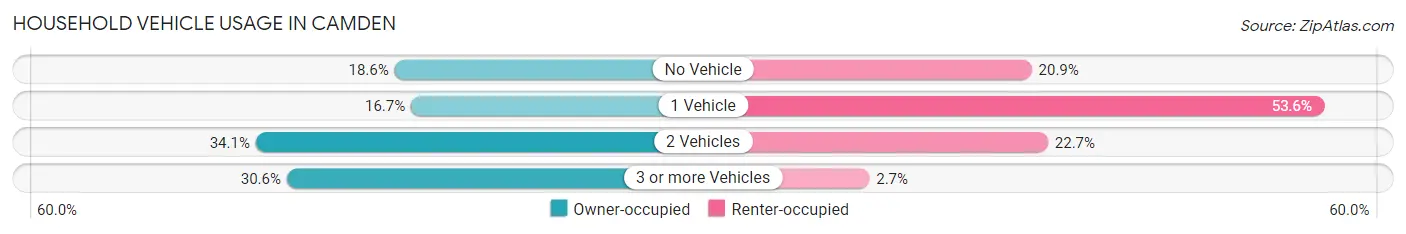
| Vehicles per Household | Owner-occupied | Renter-occupied |
| No Vehicle | 80 (18.6%) | 23 (20.9%) |
| 1 Vehicle | 72 (16.7%) | 59 (53.6%) |
| 2 Vehicles | 147 (34.1%) | 25 (22.7%) |
| 3 or more Vehicles | 132 (30.6%) | 3 (2.7%) |
| Total | 431 (100.0%) | 110 (100.0%) |
Real Estate & Mortgages in Camden
Real Estate and Mortgage Overview in Camden
| Characteristic | Without Mortgage | With Mortgage |
| Housing Units | 260 | 171 |
| Median Property Value | $68,300 | $111,700 |
| Median Household Income | $36,500 | $13 |
| Monthly Housing Costs | $442 | $3 |
| Real Estate Taxes | $254 | $0 |
Property Value by Mortgage Status in Camden
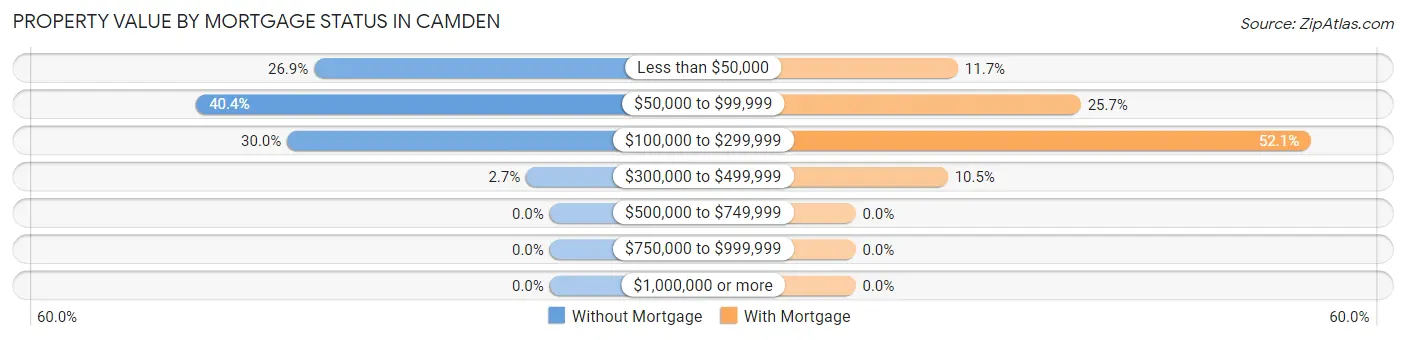
| Property Value | Without Mortgage | With Mortgage |
| Less than $50,000 | 70 (26.9%) | 20 (11.7%) |
| $50,000 to $99,999 | 105 (40.4%) | 44 (25.7%) |
| $100,000 to $299,999 | 78 (30.0%) | 89 (52.0%) |
| $300,000 to $499,999 | 7 (2.7%) | 18 (10.5%) |
| $500,000 to $749,999 | 0 (0.0%) | 0 (0.0%) |
| $750,000 to $999,999 | 0 (0.0%) | 0 (0.0%) |
| $1,000,000 or more | 0 (0.0%) | 0 (0.0%) |
| Total | 260 (100.0%) | 171 (100.0%) |
Household Income by Mortgage Status in Camden
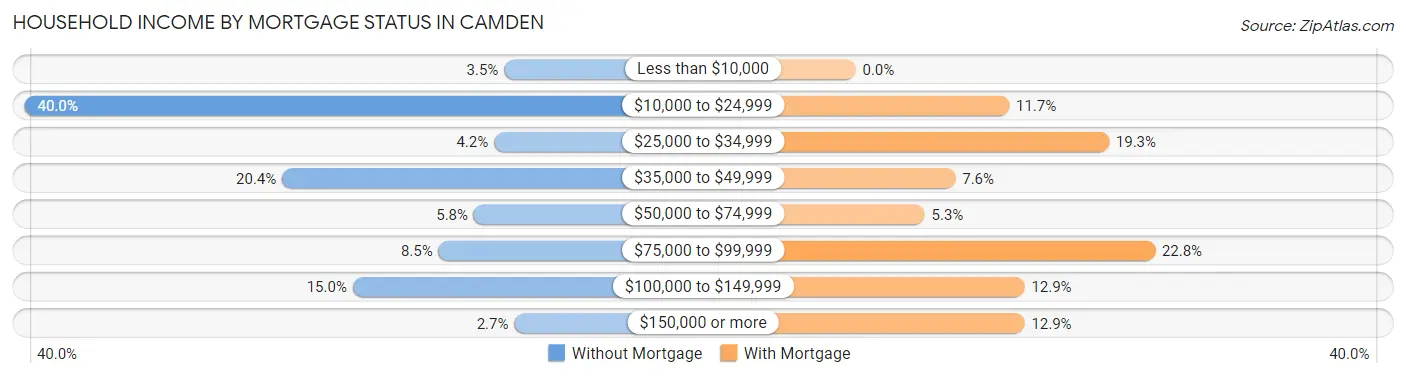
| Household Income | Without Mortgage | With Mortgage |
| Less than $10,000 | 9 (3.5%) | 0 (0.0%) |
| $10,000 to $24,999 | 104 (40.0%) | 20 (11.7%) |
| $25,000 to $34,999 | 11 (4.2%) | 33 (19.3%) |
| $35,000 to $49,999 | 53 (20.4%) | 13 (7.6%) |
| $50,000 to $74,999 | 15 (5.8%) | 9 (5.3%) |
| $75,000 to $99,999 | 22 (8.5%) | 39 (22.8%) |
| $100,000 to $149,999 | 39 (15.0%) | 22 (12.9%) |
| $150,000 or more | 7 (2.7%) | 22 (12.9%) |
| Total | 260 (100.0%) | 171 (100.0%) |
Property Value to Household Income Ratio in Camden
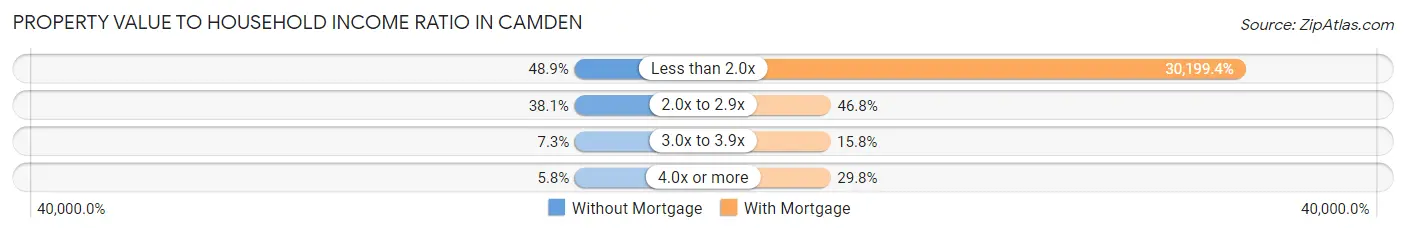
| Value-to-Income Ratio | Without Mortgage | With Mortgage |
| Less than 2.0x | 127 (48.8%) | 51,641 (30,199.4%) |
| 2.0x to 2.9x | 99 (38.1%) | 80 (46.8%) |
| 3.0x to 3.9x | 19 (7.3%) | 27 (15.8%) |
| 4.0x or more | 15 (5.8%) | 51 (29.8%) |
| Total | 260 (100.0%) | 171 (100.0%) |
Real Estate Taxes by Mortgage Status in Camden
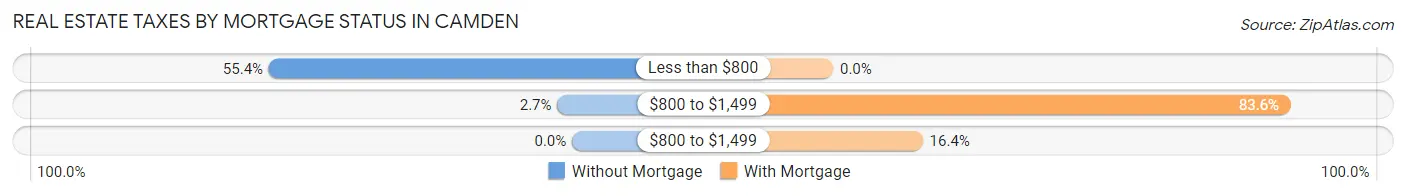
| Property Taxes | Without Mortgage | With Mortgage |
| Less than $800 | 144 (55.4%) | 0 (0.0%) |
| $800 to $1,499 | 7 (2.7%) | 143 (83.6%) |
| $800 to $1,499 | 0 (0.0%) | 28 (16.4%) |
| Total | 260 (100.0%) | 171 (100.0%) |
Health & Disability in Camden
Health Insurance Coverage by Age in Camden
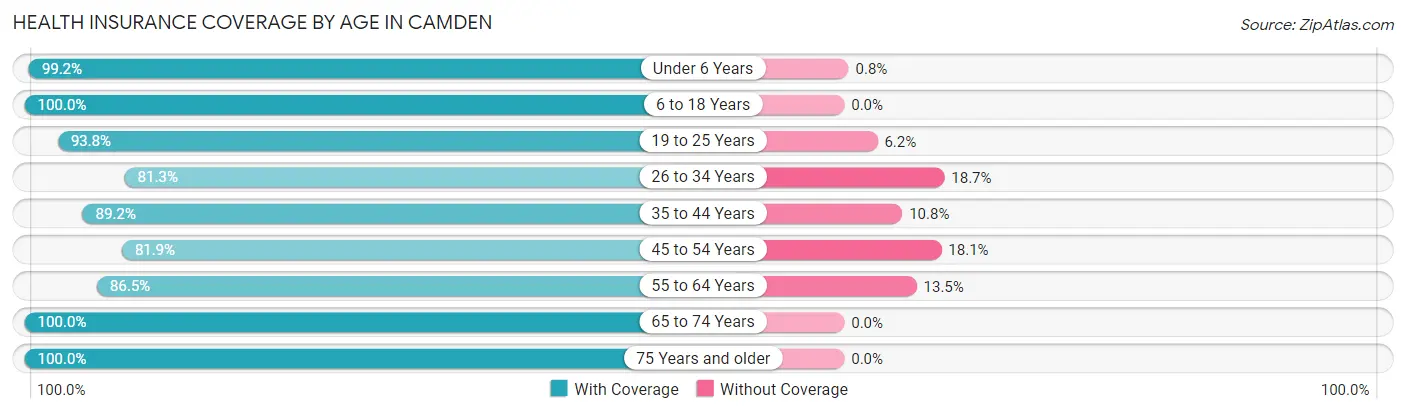
| Age Bracket | With Coverage | Without Coverage |
| Under 6 Years | 247 (99.2%) | 2 (0.8%) |
| 6 to 18 Years | 249 (100.0%) | 0 (0.0%) |
| 19 to 25 Years | 167 (93.8%) | 11 (6.2%) |
| 26 to 34 Years | 327 (81.3%) | 75 (18.7%) |
| 35 to 44 Years | 231 (89.2%) | 28 (10.8%) |
| 45 to 54 Years | 104 (81.9%) | 23 (18.1%) |
| 55 to 64 Years | 218 (86.5%) | 34 (13.5%) |
| 65 to 74 Years | 277 (100.0%) | 0 (0.0%) |
| 75 Years and older | 77 (100.0%) | 0 (0.0%) |
| Total | 1,897 (91.6%) | 173 (8.4%) |
Health Insurance Coverage by Citizenship Status in Camden
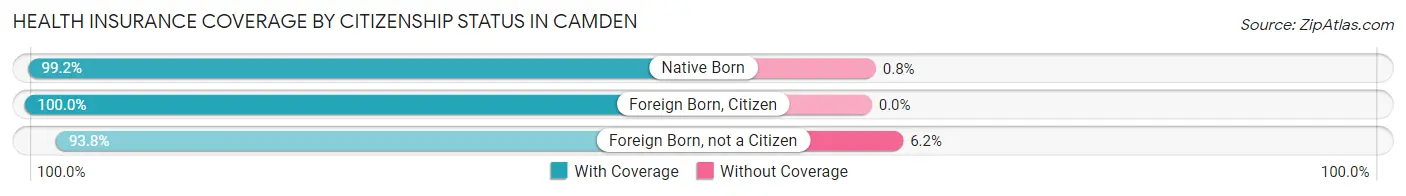
| Citizenship Status | With Coverage | Without Coverage |
| Native Born | 247 (99.2%) | 2 (0.8%) |
| Foreign Born, Citizen | 249 (100.0%) | 0 (0.0%) |
| Foreign Born, not a Citizen | 167 (93.8%) | 11 (6.2%) |
Health Insurance Coverage by Household Income in Camden
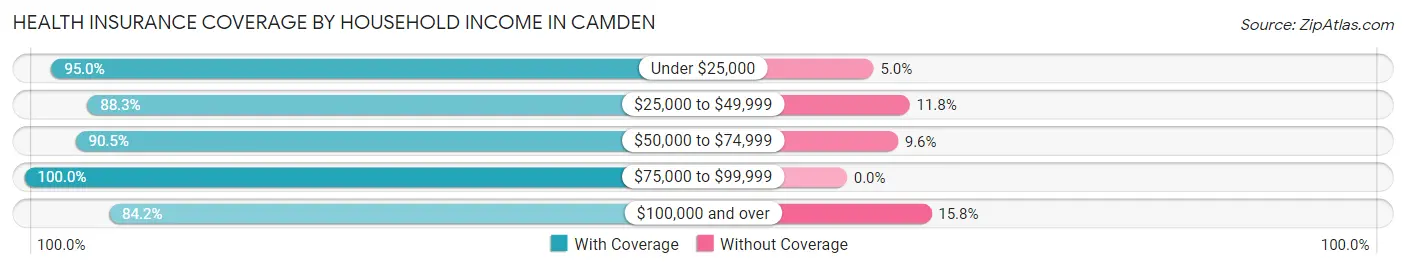
| Household Income | With Coverage | Without Coverage |
| Under $25,000 | 645 (95.0%) | 34 (5.0%) |
| $25,000 to $49,999 | 368 (88.2%) | 49 (11.7%) |
| $50,000 to $74,999 | 199 (90.4%) | 21 (9.6%) |
| $75,000 to $99,999 | 318 (100.0%) | 0 (0.0%) |
| $100,000 and over | 367 (84.2%) | 69 (15.8%) |
Public vs Private Health Insurance Coverage by Age in Camden
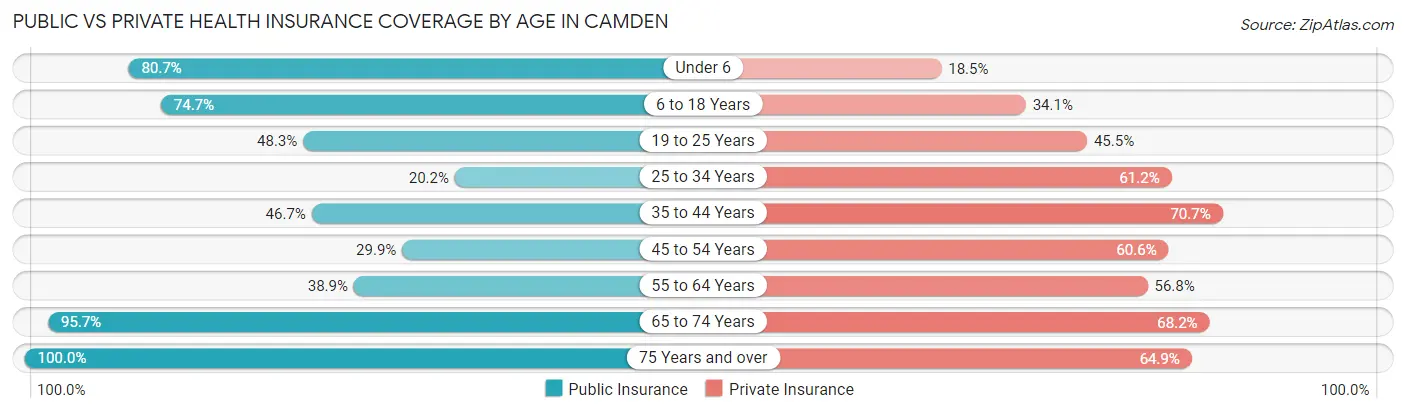
| Age Bracket | Public Insurance | Private Insurance |
| Under 6 | 201 (80.7%) | 46 (18.5%) |
| 6 to 18 Years | 186 (74.7%) | 85 (34.1%) |
| 19 to 25 Years | 86 (48.3%) | 81 (45.5%) |
| 25 to 34 Years | 81 (20.2%) | 246 (61.2%) |
| 35 to 44 Years | 121 (46.7%) | 183 (70.7%) |
| 45 to 54 Years | 38 (29.9%) | 77 (60.6%) |
| 55 to 64 Years | 98 (38.9%) | 143 (56.8%) |
| 65 to 74 Years | 265 (95.7%) | 189 (68.2%) |
| 75 Years and over | 77 (100.0%) | 50 (64.9%) |
| Total | 1,153 (55.7%) | 1,100 (53.1%) |
Disability Status by Sex by Age in Camden
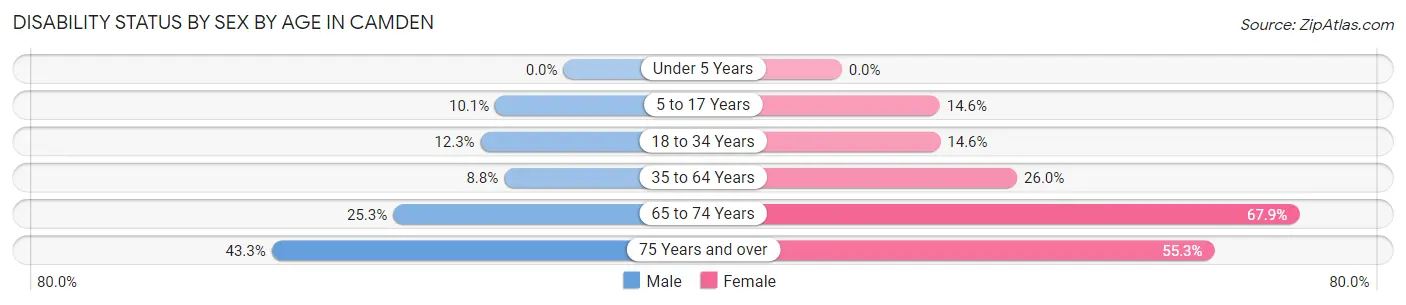
| Age Bracket | Male | Female |
| Under 5 Years | 0 (0.0%) | 0 (0.0%) |
| 5 to 17 Years | 15 (10.1%) | 16 (14.5%) |
| 18 to 34 Years | 34 (12.3%) | 47 (14.6%) |
| 35 to 64 Years | 20 (8.8%) | 107 (26.0%) |
| 65 to 74 Years | 22 (25.3%) | 129 (67.9%) |
| 75 Years and over | 13 (43.3%) | 26 (55.3%) |
Disability Class by Sex by Age in Camden
Disability Class: Hearing Difficulty
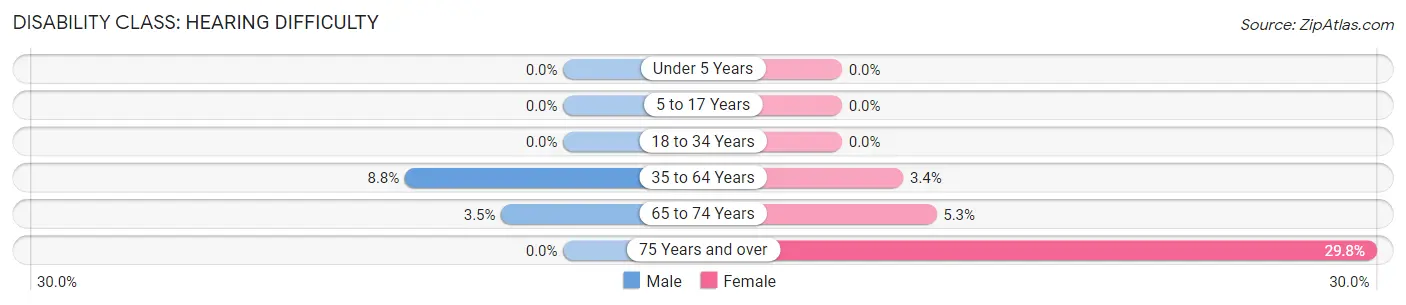
| Age Bracket | Male | Female |
| Under 5 Years | 0 (0.0%) | 0 (0.0%) |
| 5 to 17 Years | 0 (0.0%) | 0 (0.0%) |
| 18 to 34 Years | 0 (0.0%) | 0 (0.0%) |
| 35 to 64 Years | 20 (8.8%) | 14 (3.4%) |
| 65 to 74 Years | 3 (3.5%) | 10 (5.3%) |
| 75 Years and over | 0 (0.0%) | 14 (29.8%) |
Disability Class: Vision Difficulty
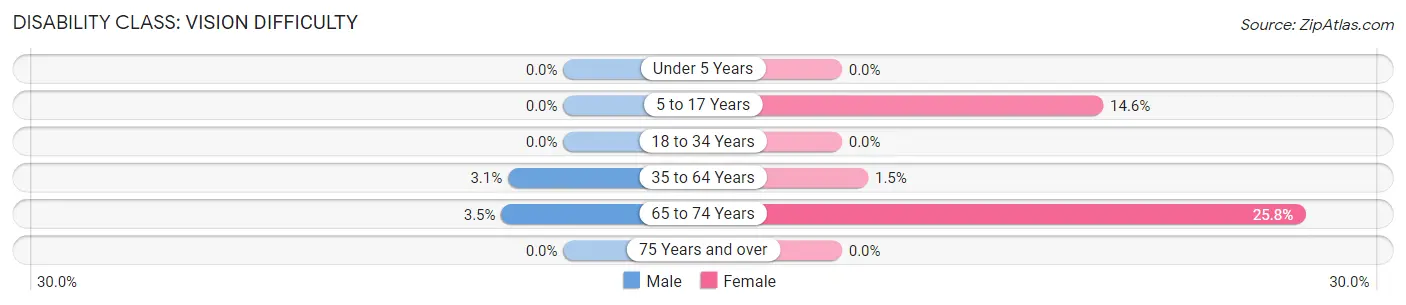
| Age Bracket | Male | Female |
| Under 5 Years | 0 (0.0%) | 0 (0.0%) |
| 5 to 17 Years | 0 (0.0%) | 16 (14.5%) |
| 18 to 34 Years | 0 (0.0%) | 0 (0.0%) |
| 35 to 64 Years | 7 (3.1%) | 6 (1.5%) |
| 65 to 74 Years | 3 (3.5%) | 49 (25.8%) |
| 75 Years and over | 0 (0.0%) | 0 (0.0%) |
Disability Class: Cognitive Difficulty
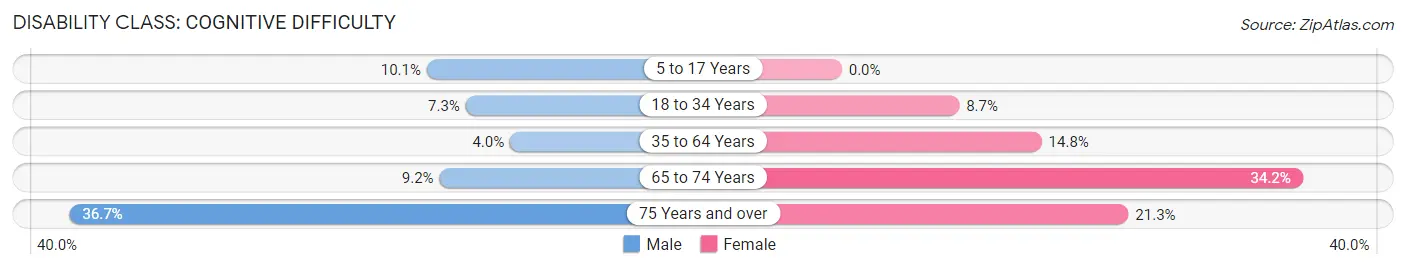
| Age Bracket | Male | Female |
| 5 to 17 Years | 15 (10.1%) | 0 (0.0%) |
| 18 to 34 Years | 20 (7.2%) | 28 (8.7%) |
| 35 to 64 Years | 9 (4.0%) | 61 (14.8%) |
| 65 to 74 Years | 8 (9.2%) | 65 (34.2%) |
| 75 Years and over | 11 (36.7%) | 10 (21.3%) |
Disability Class: Ambulatory Difficulty
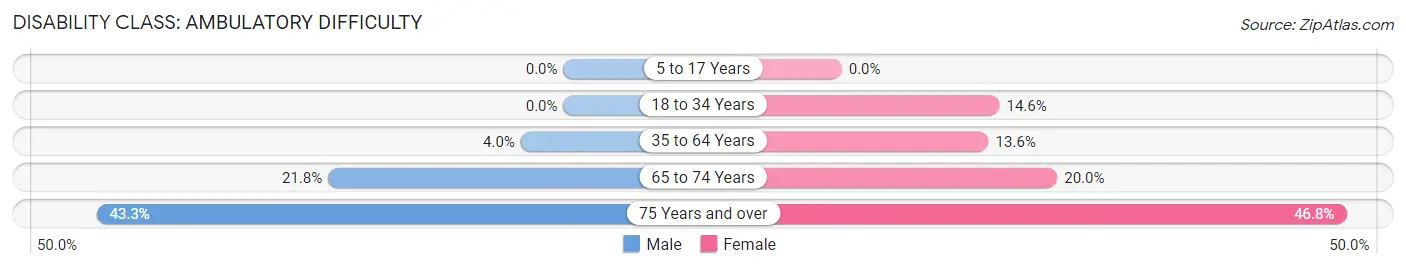
| Age Bracket | Male | Female |
| 5 to 17 Years | 0 (0.0%) | 0 (0.0%) |
| 18 to 34 Years | 0 (0.0%) | 47 (14.6%) |
| 35 to 64 Years | 9 (4.0%) | 56 (13.6%) |
| 65 to 74 Years | 19 (21.8%) | 38 (20.0%) |
| 75 Years and over | 13 (43.3%) | 22 (46.8%) |
Disability Class: Self-Care Difficulty
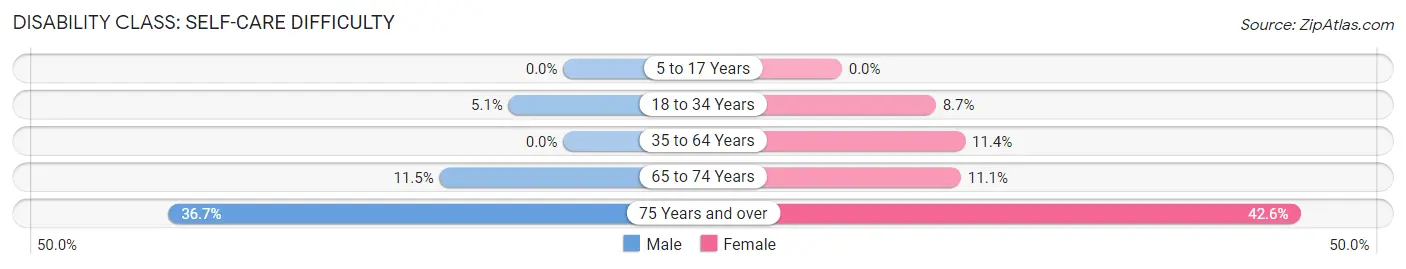
| Age Bracket | Male | Female |
| 5 to 17 Years | 0 (0.0%) | 0 (0.0%) |
| 18 to 34 Years | 14 (5.1%) | 28 (8.7%) |
| 35 to 64 Years | 0 (0.0%) | 47 (11.4%) |
| 65 to 74 Years | 10 (11.5%) | 21 (11.1%) |
| 75 Years and over | 11 (36.7%) | 20 (42.5%) |
Technology Access in Camden
Computing Device Access in Camden
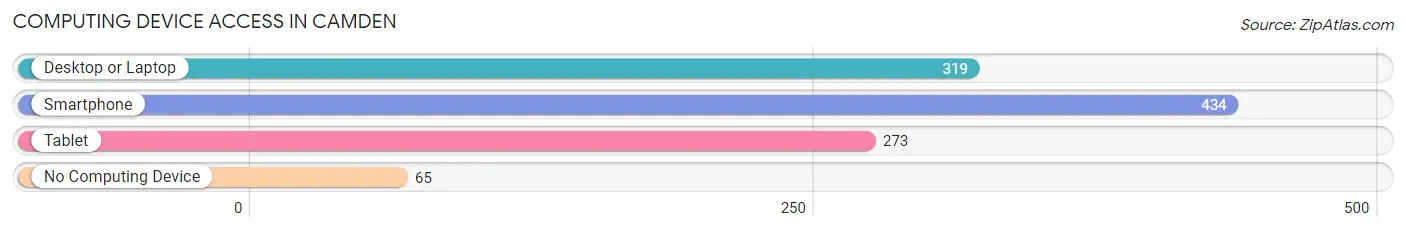
| Device Type | # Households | % Households |
| Desktop or Laptop | 319 | 59.0% |
| Smartphone | 434 | 80.2% |
| Tablet | 273 | 50.5% |
| No Computing Device | 65 | 12.0% |
| Total | 541 | 100.0% |
Internet Access in Camden
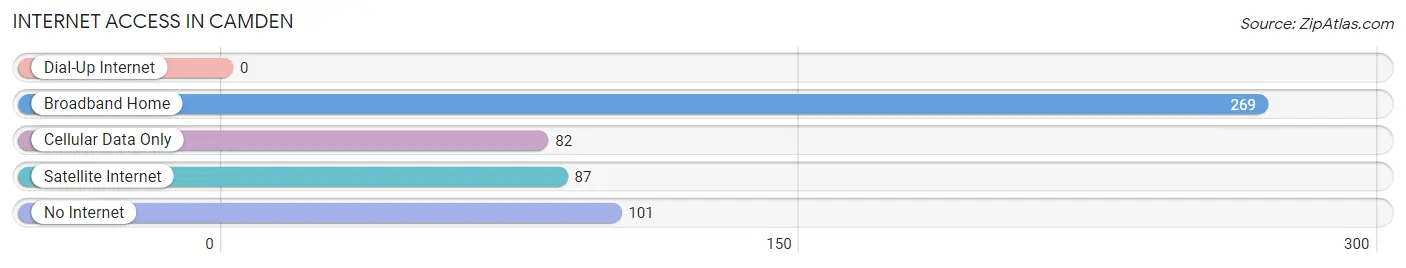
| Internet Type | # Households | % Households |
| Dial-Up Internet | 0 | 0.0% |
| Broadband Home | 269 | 49.7% |
| Cellular Data Only | 82 | 15.2% |
| Satellite Internet | 87 | 16.1% |
| No Internet | 101 | 18.7% |
| Total | 541 | 100.0% |
Camden Summary
Camden, Alabama is a small town located in Wilcox County, Alabama. It is situated on the banks of the Alabama River, approximately 40 miles south of Montgomery. The town has a population of approximately 2,000 people and is the county seat of Wilcox County.
History
The area that is now Camden was first settled in the early 1800s by settlers from the Carolinas and Georgia. The town was originally known as “Cotton Gin Port” due to the cotton gin that was located there. In 1820, the town was officially incorporated as Camden.
The town was named after Charles Pratt, the 1st Earl of Camden, who was a British politician and lawyer. He was a strong advocate of civil liberties and was a major influence on the American Constitution.
The town of Camden was an important port during the Civil War. It was the site of a major battle in 1864, when Union forces attempted to capture the town. The Union forces were unsuccessful and the town remained in Confederate hands.
Geography
Camden is located in Wilcox County, Alabama. It is situated on the banks of the Alabama River, approximately 40 miles south of Montgomery. The town is located in the Black Belt region of Alabama, which is known for its rich soil and agricultural production.
The town is surrounded by rolling hills and forests. The climate is humid subtropical, with hot summers and mild winters. The average annual temperature is around 70 degrees Fahrenheit.
Economy
The economy of Camden is largely based on agriculture. The town is home to several large farms, which produce cotton, soybeans, corn, and other crops. The town is also home to several small businesses, including restaurants, retail stores, and service providers.
The town is also home to a large paper mill, which produces paper products for the local and regional markets. The town is also home to a large lumber mill, which produces lumber for the local and regional markets.
Demographics
As of the 2010 census, the population of Camden was 2,000. The racial makeup of the town was 79.2% White, 18.2% African American, 0.2% Native American, 0.2% Asian, 0.2% from other races, and 1.9% from two or more races. Hispanic or Latino of any race were 0.9% of the population.
The median income for a household in the town was $30,000, and the median income for a family was $35,000. The per capita income for the town was $14,000. About 18.2% of families and 22.2% of the population were below the poverty line, including 28.2% of those under age 18 and 16.2% of those age 65 or over.
Conclusion
Camden, Alabama is a small town located in Wilcox County, Alabama. It is situated on the banks of the Alabama River, approximately 40 miles south of Montgomery. The town has a population of approximately 2,000 people and is the county seat of Wilcox County. The town has a rich history and is home to several large farms, businesses, and industries. The economy of Camden is largely based on agriculture, with the town also home to a large paper mill and lumber mill. The racial makeup of the town is 79.2% White, 18.2% African American, 0.2% Native American, 0.2% Asian, 0.2% from other races, and 1.9% from two or more races. The median income for a household in the town was $30,000, and the median income for a family was $35,000.
Common Questions
What is Per Capita Income in Camden?
Per Capita income in Camden is $17,535.
What is the Median Family Income in Camden?
Median Family Income in Camden is $41,333.
What is the Median Household income in Camden?
Median Household Income in Camden is $35,583.
What is Income or Wage Gap in Camden?
Income or Wage Gap in Camden is 51.9%.
Women in Camden earn 48.1 cents for every dollar earned by a man.
What is Inequality or Gini Index in Camden?
Inequality or Gini Index in Camden is 0.46.
What is the Total Population of Camden?
Total Population of Camden is 2,149.
What is the Total Male Population of Camden?
Total Male Population of Camden is 914.
What is the Total Female Population of Camden?
Total Female Population of Camden is 1,235.
What is the Ratio of Males per 100 Females in Camden?
There are 74.01 Males per 100 Females in Camden.
What is the Ratio of Females per 100 Males in Camden?
There are 135.12 Females per 100 Males in Camden.
What is the Median Population Age in Camden?
Median Population Age in Camden is 34.8 Years.
What is the Average Family Size in Camden
Average Family Size in Camden is 4.5 People.
What is the Average Household Size in Camden
Average Household Size in Camden is 3.8 People.
How Large is the Labor Force in Camden?
There are 786 People in the Labor Forcein in Camden.
What is the Percentage of People in the Labor Force in Camden?
46.2% of People are in the Labor Force in Camden.
What is the Unemployment Rate in Camden?
Unemployment Rate in Camden is 11.7%.