Brundidge, AL Map & Demographics
Brundidge Map
Brundidge Overview
$19,329
PER CAPITA INCOME
$43,140
AVG FAMILY INCOME
$37,627
AVG HOUSEHOLD INCOME
25.6%
WAGE / INCOME GAP [ % ]
74.4¢/ $1
WAGE / INCOME GAP [ $ ]
0.44
INEQUALITY / GINI INDEX
2,309
TOTAL POPULATION
1,117
MALE POPULATION
1,192
FEMALE POPULATION
93.71
MALES / 100 FEMALES
106.71
FEMALES / 100 MALES
49.9
MEDIAN AGE
3.0
AVG FAMILY SIZE
2.3
AVG HOUSEHOLD SIZE
779
LABOR FORCE [ PEOPLE ]
40.4%
PERCENT IN LABOR FORCE
10.1%
UNEMPLOYMENT RATE
Brundidge Zip Codes
Brundidge Area Codes
Income in Brundidge
Income Overview in Brundidge
Per Capita Income in Brundidge is $19,329, while median incomes of families and households are $43,140 and $37,627 respectively.
| Characteristic | Number | Measure |
| Per Capita Income | 2,309 | $19,329 |
| Median Family Income | 582 | $43,140 |
| Mean Family Income | 582 | $55,971 |
| Median Household Income | 992 | $37,627 |
| Mean Household Income | 992 | $43,872 |
| Income Deficit | 582 | $0 |
| Wage / Income Gap (%) | 2,309 | 25.57% |
| Wage / Income Gap ($) | 2,309 | 74.43¢ per $1 |
| Gini / Inequality Index | 2,309 | 0.44 |
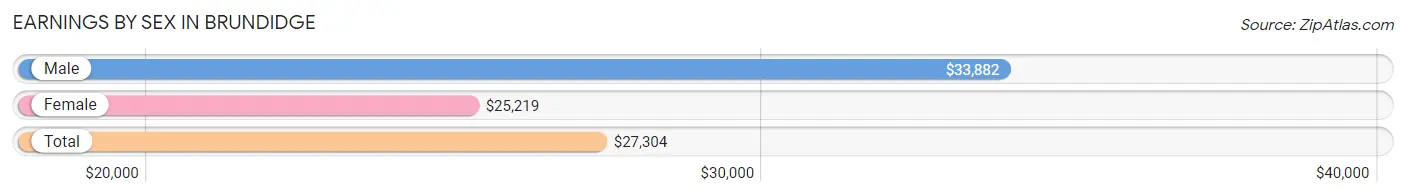
Earnings by Sex in Brundidge
Average Earnings in Brundidge are $27,304, $33,882 for men and $25,219 for women, a difference of 25.6%.
| Sex | Number | Average Earnings |
| Male | 469 (57.9%) | $33,882 |
| Female | 341 (42.1%) | $25,219 |
| Total | 810 (100.0%) | $27,304 |
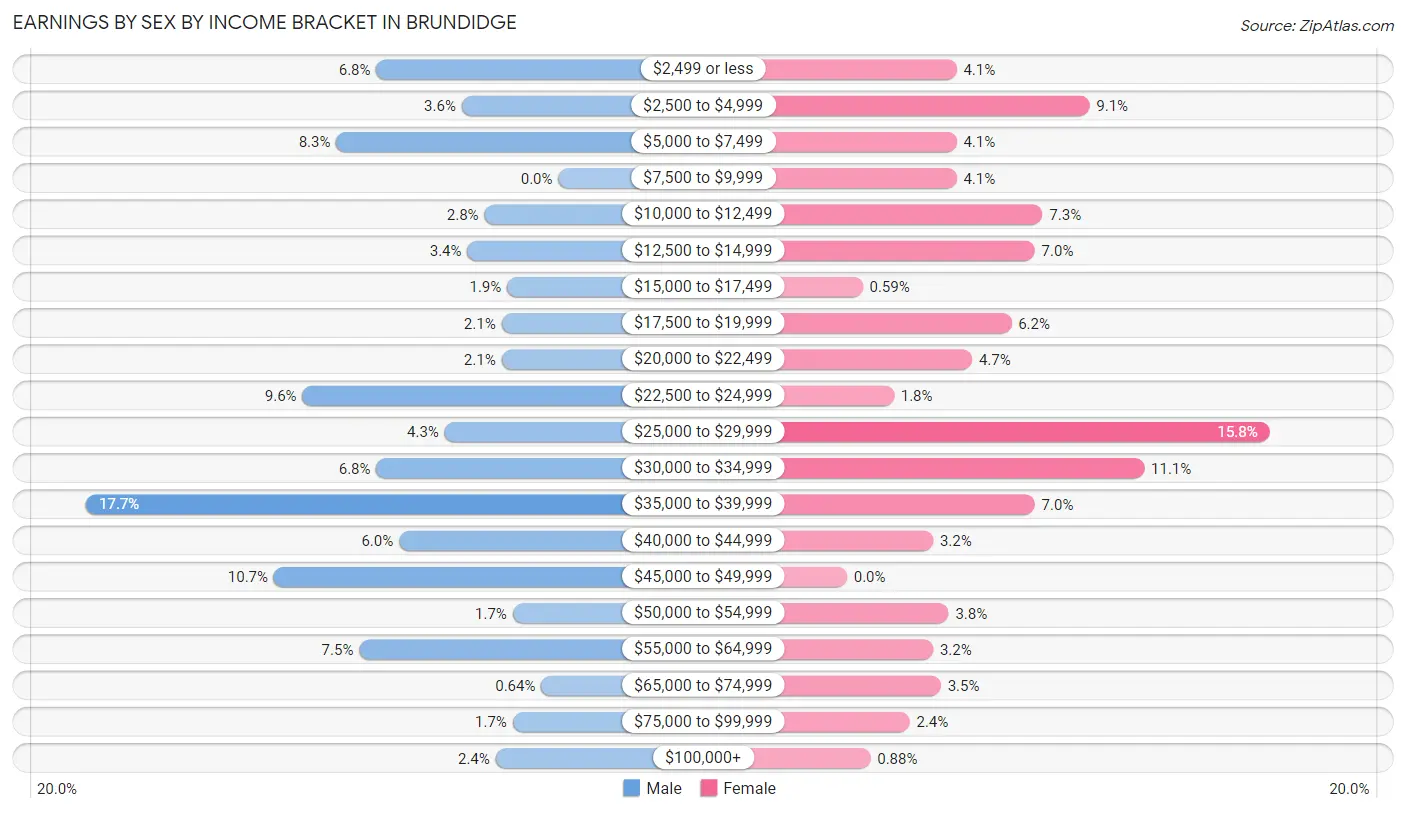
Earnings by Sex by Income Bracket in Brundidge
The most common earnings brackets in Brundidge are $35,000 to $39,999 for men (83 | 17.7%) and $25,000 to $29,999 for women (54 | 15.8%).
| Income | Male | Female |
| $2,499 or less | 32 (6.8%) | 14 (4.1%) |
| $2,500 to $4,999 | 17 (3.6%) | 31 (9.1%) |
| $5,000 to $7,499 | 39 (8.3%) | 14 (4.1%) |
| $7,500 to $9,999 | 0 (0.0%) | 14 (4.1%) |
| $10,000 to $12,499 | 13 (2.8%) | 25 (7.3%) |
| $12,500 to $14,999 | 16 (3.4%) | 24 (7.0%) |
| $15,000 to $17,499 | 9 (1.9%) | 2 (0.6%) |
| $17,500 to $19,999 | 10 (2.1%) | 21 (6.2%) |
| $20,000 to $22,499 | 10 (2.1%) | 16 (4.7%) |
| $22,500 to $24,999 | 45 (9.6%) | 6 (1.8%) |
| $25,000 to $29,999 | 20 (4.3%) | 54 (15.8%) |
| $30,000 to $34,999 | 32 (6.8%) | 38 (11.1%) |
| $35,000 to $39,999 | 83 (17.7%) | 24 (7.0%) |
| $40,000 to $44,999 | 28 (6.0%) | 11 (3.2%) |
| $45,000 to $49,999 | 50 (10.7%) | 0 (0.0%) |
| $50,000 to $54,999 | 8 (1.7%) | 13 (3.8%) |
| $55,000 to $64,999 | 35 (7.5%) | 11 (3.2%) |
| $65,000 to $74,999 | 3 (0.6%) | 12 (3.5%) |
| $75,000 to $99,999 | 8 (1.7%) | 8 (2.4%) |
| $100,000+ | 11 (2.4%) | 3 (0.9%) |
| Total | 469 (100.0%) | 341 (100.0%) |
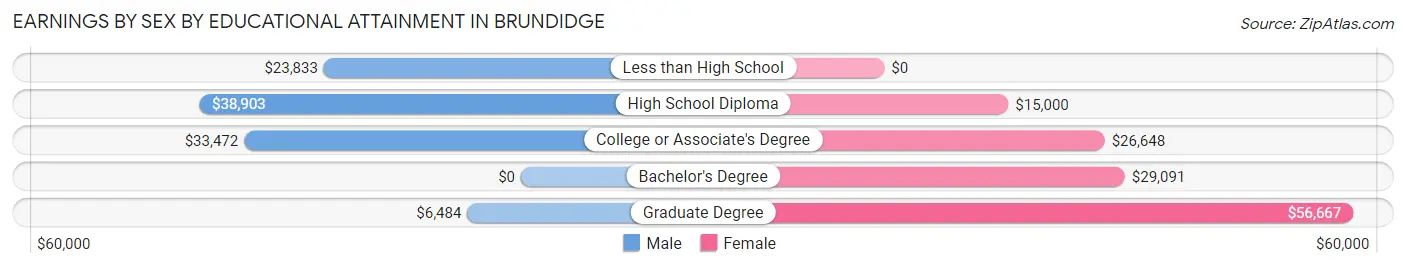
Earnings by Sex by Educational Attainment in Brundidge
Average earnings in Brundidge are $36,691 for men and $26,406 for women, a difference of 28.0%. Men with an educational attainment of high school diploma enjoy the highest average annual earnings of $38,903, while those with graduate degree education earn the least with $6,484. Women with an educational attainment of graduate degree earn the most with the average annual earnings of $56,667, while those with high school diploma education have the smallest earnings of $15,000.
| Educational Attainment | Male Income | Female Income |
| Less than High School | $23,833 | $0 |
| High School Diploma | $38,903 | $15,000 |
| College or Associate's Degree | $33,472 | $26,648 |
| Bachelor's Degree | - | - |
| Graduate Degree | $6,484 | $56,667 |
| Total | $36,691 | $26,406 |
Family Income in Brundidge
Family Income Brackets in Brundidge
According to the Brundidge family income data, there are 223 families falling into the $35,000 to $49,999 income range, which is the most common income bracket and makes up 38.3% of all families. Conversely, the $150,000 to $199,999 income bracket is the least frequent group with only 4 families (0.7%) belonging to this category.
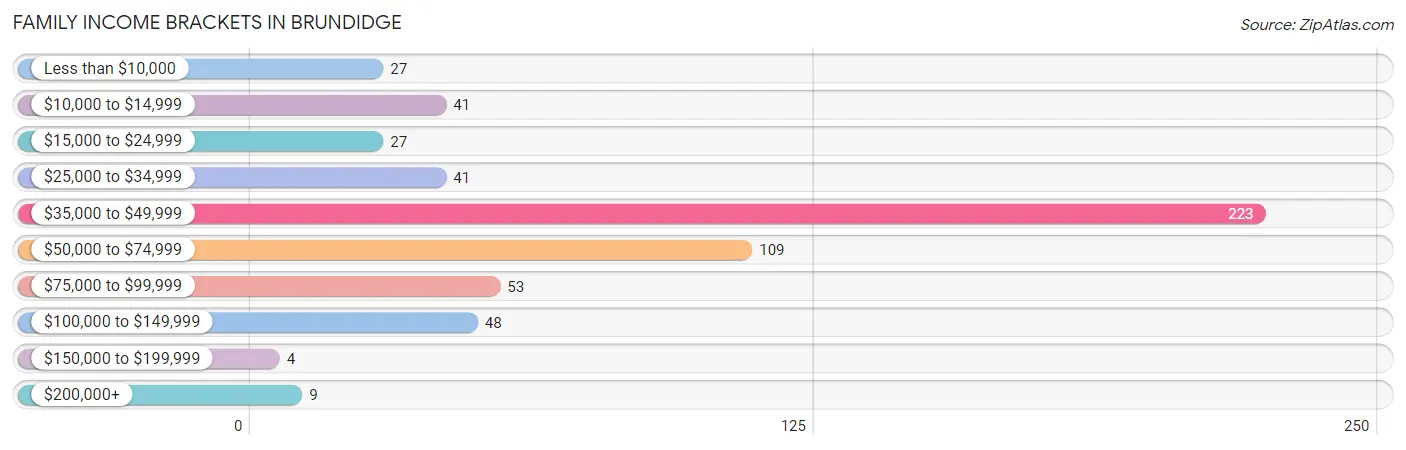
| Income Bracket | # Families | % Families |
| Less than $10,000 | 27 | 4.6% |
| $10,000 to $14,999 | 41 | 7.0% |
| $15,000 to $24,999 | 27 | 4.6% |
| $25,000 to $34,999 | 41 | 7.0% |
| $35,000 to $49,999 | 223 | 38.3% |
| $50,000 to $74,999 | 109 | 18.7% |
| $75,000 to $99,999 | 53 | 9.1% |
| $100,000 to $149,999 | 48 | 8.2% |
| $150,000 to $199,999 | 4 | 0.7% |
| $200,000+ | 9 | 1.5% |
Family Income by Famaliy Size in Brundidge
3-person families (95 | 16.3%) account for the highest median family income in Brundidge with $53,125 per family, while 2-person families (369 | 63.4%) have the highest median income of $19,938 per family member.
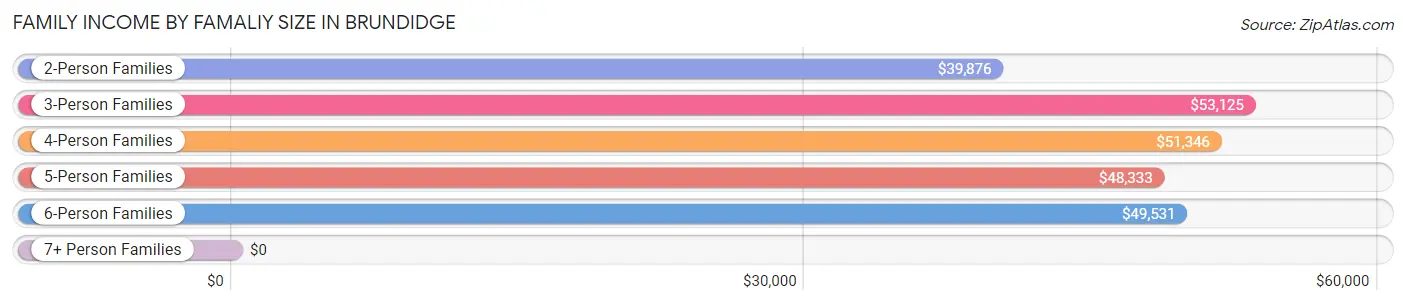
| Income Bracket | # Families | Median Income |
| 2-Person Families | 369 (63.4%) | $39,876 |
| 3-Person Families | 95 (16.3%) | $53,125 |
| 4-Person Families | 78 (13.4%) | $51,346 |
| 5-Person Families | 18 (3.1%) | $48,333 |
| 6-Person Families | 13 (2.2%) | $49,531 |
| 7+ Person Families | 9 (1.5%) | $0 |
| Total | 582 (100.0%) | $43,140 |
Family Income by Number of Earners in Brundidge
The median family income in Brundidge is $43,140, with families comprising 3+ earners (50) having the highest median family income of $110,500, while families with 1 earner (269) have the lowest median family income of $38,826, accounting for 8.6% and 46.2% of families, respectively.
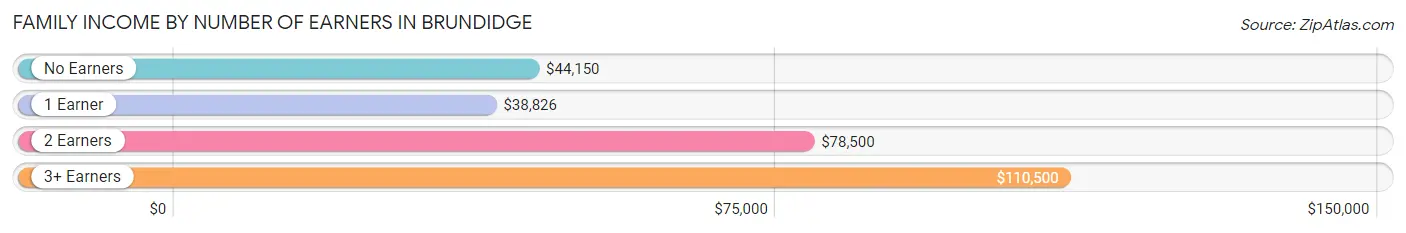
| Number of Earners | # Families | Median Income |
| No Earners | 161 (27.7%) | $44,150 |
| 1 Earner | 269 (46.2%) | $38,826 |
| 2 Earners | 102 (17.5%) | $78,500 |
| 3+ Earners | 50 (8.6%) | $110,500 |
| Total | 582 (100.0%) | $43,140 |
Household Income in Brundidge
Household Income Brackets in Brundidge
With 271 households falling in the category, the $35,000 to $49,999 income range is the most frequent in Brundidge, accounting for 27.3% of all households. In contrast, only 7 households (0.7%) fall into the $150,000 to $199,999 income bracket, making it the least populous group.
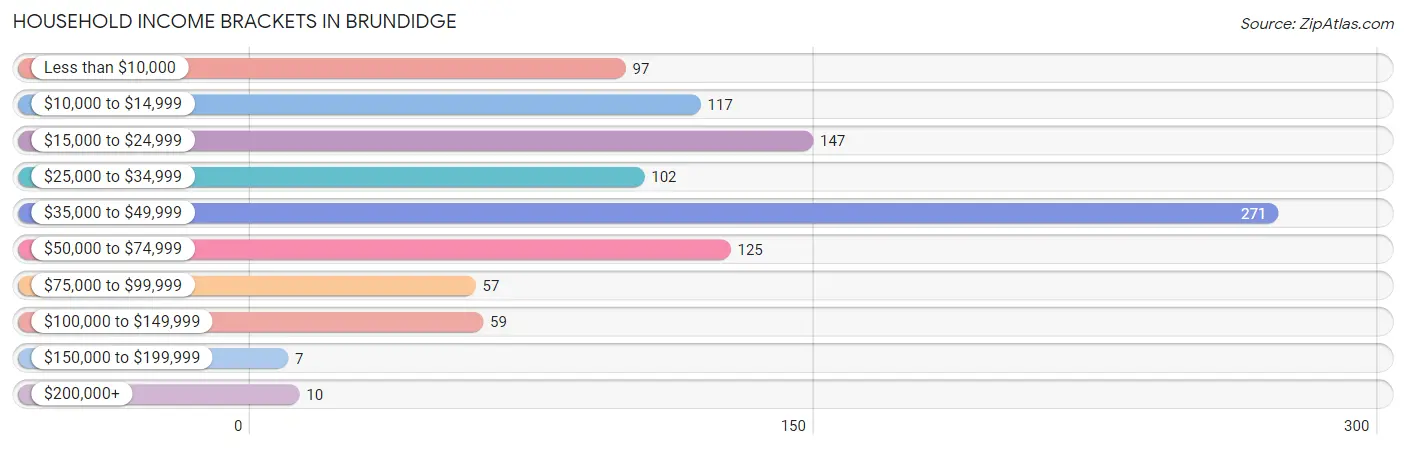
| Income Bracket | # Households | % Households |
| Less than $10,000 | 97 | 9.8% |
| $10,000 to $14,999 | 117 | 11.8% |
| $15,000 to $24,999 | 147 | 14.8% |
| $25,000 to $34,999 | 102 | 10.3% |
| $35,000 to $49,999 | 271 | 27.3% |
| $50,000 to $74,999 | 125 | 12.6% |
| $75,000 to $99,999 | 57 | 5.7% |
| $100,000 to $149,999 | 59 | 5.9% |
| $150,000 to $199,999 | 7 | 0.7% |
| $200,000+ | 10 | 1.0% |
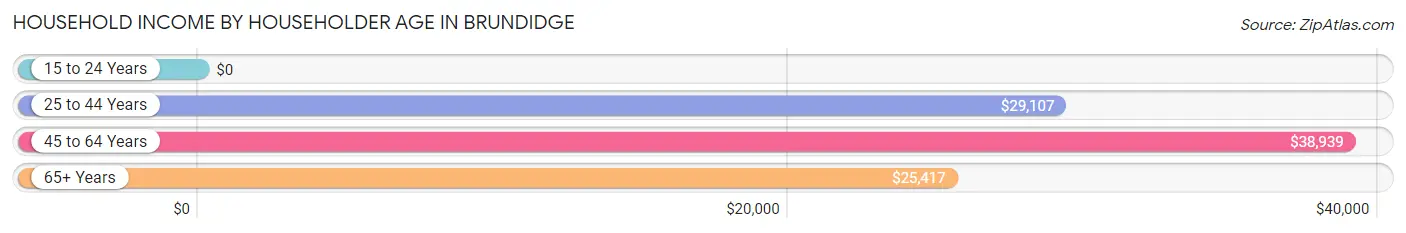
Household Income by Householder Age in Brundidge
The median household income in Brundidge is $37,627, with the highest median household income of $38,939 found in the 45 to 64 years age bracket for the primary householder. A total of 370 households (37.3%) fall into this category. Meanwhile, the 15 to 24 years age bracket for the primary householder has the lowest median household income of $0, with 6 households (0.6%) in this group.
| Income Bracket | # Households | Median Income |
| 15 to 24 Years | 6 (0.6%) | $0 |
| 25 to 44 Years | 167 (16.8%) | $29,107 |
| 45 to 64 Years | 370 (37.3%) | $38,939 |
| 65+ Years | 449 (45.3%) | $25,417 |
| Total | 992 (100.0%) | $37,627 |
Poverty in Brundidge
Income Below Poverty by Sex and Age in Brundidge
With 22.9% poverty level for males and 32.9% for females among the residents of Brundidge, 5 year old males and under 5 year old females are the most vulnerable to poverty, with 8 males (100.0%) and 49 females (86.0%) in their respective age groups living below the poverty level.
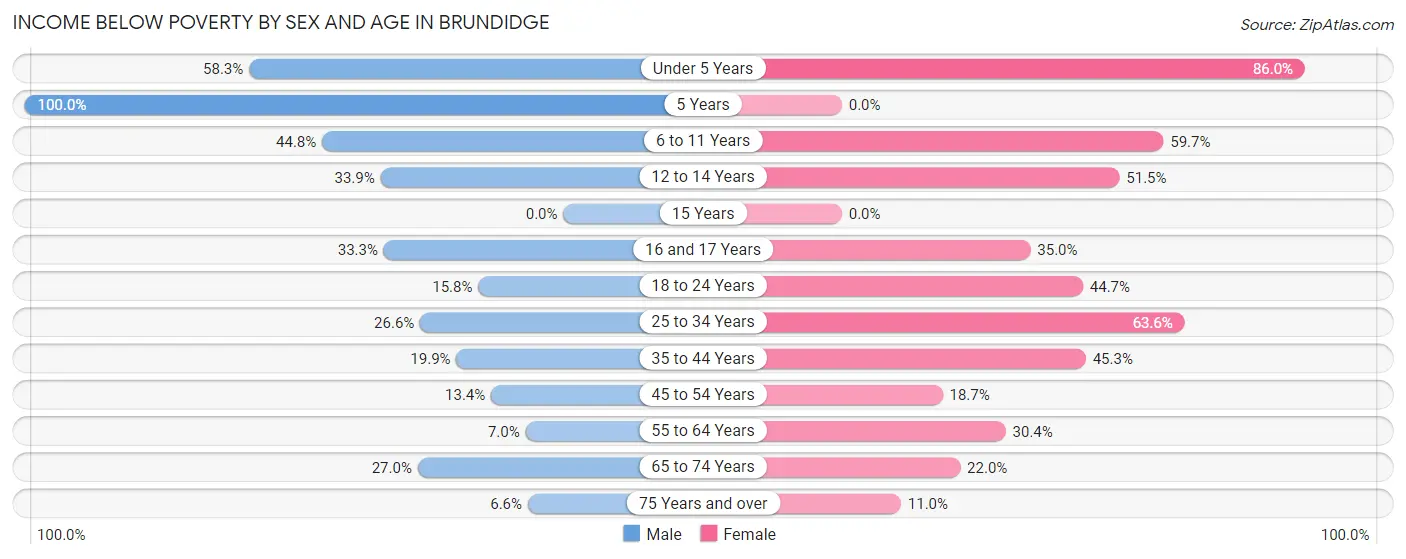
| Age Bracket | Male | Female |
| Under 5 Years | 35 (58.3%) | 49 (86.0%) |
| 5 Years | 8 (100.0%) | 0 (0.0%) |
| 6 to 11 Years | 30 (44.8%) | 37 (59.7%) |
| 12 to 14 Years | 19 (33.9%) | 17 (51.5%) |
| 15 Years | 0 (0.0%) | 0 (0.0%) |
| 16 and 17 Years | 20 (33.3%) | 7 (35.0%) |
| 18 to 24 Years | 15 (15.8%) | 17 (44.7%) |
| 25 to 34 Years | 21 (26.6%) | 56 (63.6%) |
| 35 to 44 Years | 26 (19.9%) | 48 (45.3%) |
| 45 to 54 Years | 24 (13.4%) | 49 (18.7%) |
| 55 to 64 Years | 8 (7.0%) | 45 (30.4%) |
| 65 to 74 Years | 40 (27.0%) | 49 (22.0%) |
| 75 Years and over | 6 (6.6%) | 16 (11.0%) |
| Total | 252 (22.9%) | 390 (32.9%) |
Income Above Poverty by Sex and Age in Brundidge
According to the poverty statistics in Brundidge, males aged 15 years and females aged 5 years are the age groups that are most secure financially, with 100.0% of males and 100.0% of females in these age groups living above the poverty line.
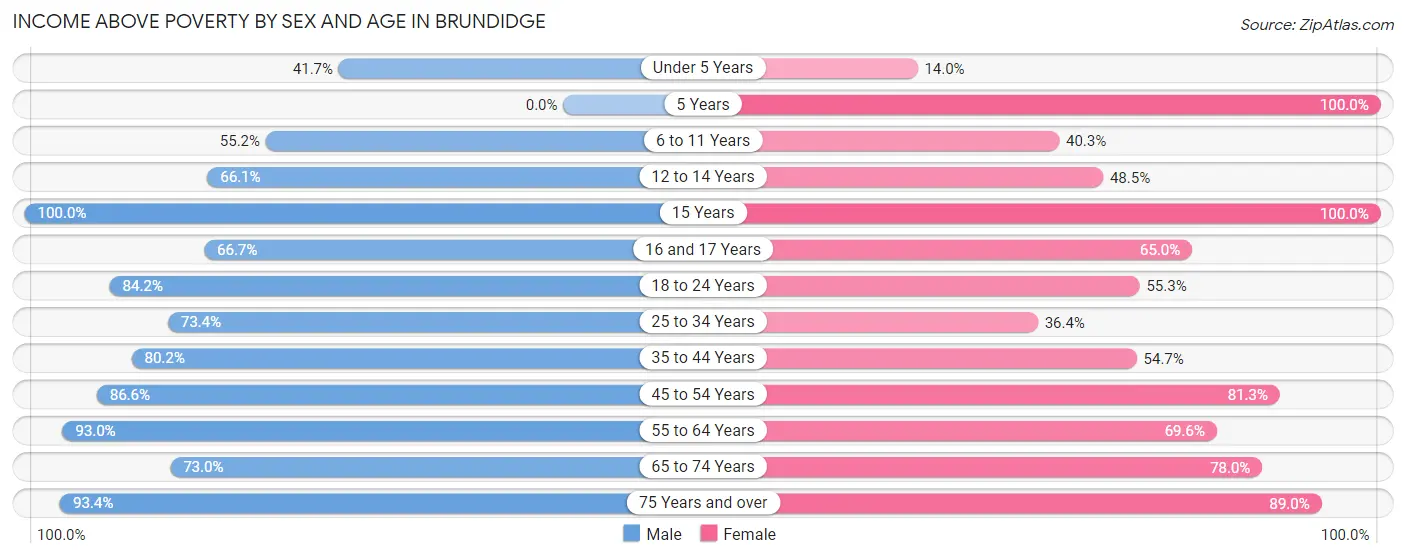
| Age Bracket | Male | Female |
| Under 5 Years | 25 (41.7%) | 8 (14.0%) |
| 5 Years | 0 (0.0%) | 2 (100.0%) |
| 6 to 11 Years | 37 (55.2%) | 25 (40.3%) |
| 12 to 14 Years | 37 (66.1%) | 16 (48.5%) |
| 15 Years | 15 (100.0%) | 2 (100.0%) |
| 16 and 17 Years | 40 (66.7%) | 13 (65.0%) |
| 18 to 24 Years | 80 (84.2%) | 21 (55.3%) |
| 25 to 34 Years | 58 (73.4%) | 32 (36.4%) |
| 35 to 44 Years | 105 (80.1%) | 58 (54.7%) |
| 45 to 54 Years | 155 (86.6%) | 213 (81.3%) |
| 55 to 64 Years | 106 (93.0%) | 103 (69.6%) |
| 65 to 74 Years | 108 (73.0%) | 174 (78.0%) |
| 75 Years and over | 85 (93.4%) | 130 (89.0%) |
| Total | 851 (77.1%) | 797 (67.1%) |
Income Below Poverty Among Married-Couple Families in Brundidge
The poverty statistics for married-couple families in Brundidge show that 5.8% or 23 of the total 399 families live below the poverty line. Families with 3 or 4 children have the highest poverty rate of 66.7%, comprising of 6 families. On the other hand, families with no children have the lowest poverty rate of 1.9%, which includes 6 families.
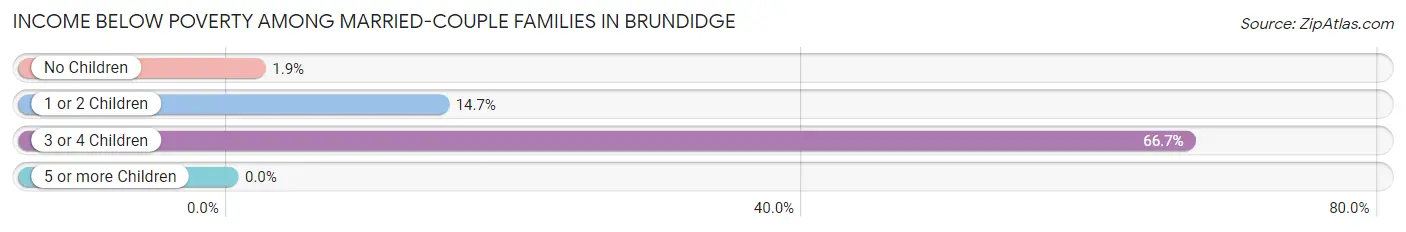
| Children | Above Poverty | Below Poverty |
| No Children | 309 (98.1%) | 6 (1.9%) |
| 1 or 2 Children | 64 (85.3%) | 11 (14.7%) |
| 3 or 4 Children | 3 (33.3%) | 6 (66.7%) |
| 5 or more Children | 0 (0.0%) | 0 (0.0%) |
| Total | 376 (94.2%) | 23 (5.8%) |
Income Below Poverty Among Single-Parent Households in Brundidge
According to the poverty data in Brundidge, 15.8% or 6 single-father households and 44.8% or 65 single-mother households are living below the poverty line. Among single-father households, those with 1 or 2 children have the highest poverty rate, with 6 households (42.9%) experiencing poverty. Likewise, among single-mother households, those with 5 or more children have the highest poverty rate, with 9 households (100.0%) falling below the poverty line.
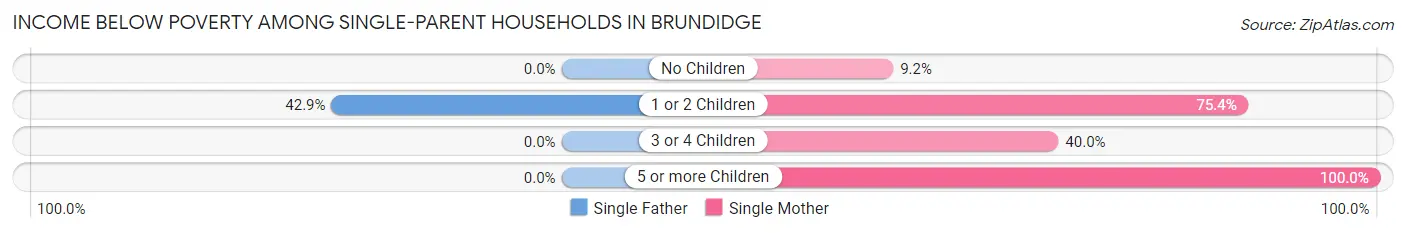
| Children | Single Father | Single Mother |
| No Children | 0 (0.0%) | 6 (9.2%) |
| 1 or 2 Children | 6 (42.9%) | 46 (75.4%) |
| 3 or 4 Children | 0 (0.0%) | 4 (40.0%) |
| 5 or more Children | 0 (0.0%) | 9 (100.0%) |
| Total | 6 (15.8%) | 65 (44.8%) |
Income Below Poverty Among Married-Couple vs Single-Parent Households in Brundidge
The poverty data for Brundidge shows that 23 of the married-couple family households (5.8%) and 71 of the single-parent households (38.8%) are living below the poverty level. Within the married-couple family households, those with 3 or 4 children have the highest poverty rate, with 6 households (66.7%) falling below the poverty line. Among the single-parent households, those with 1 or 2 children have the highest poverty rate, with 52 household (69.3%) living below poverty.
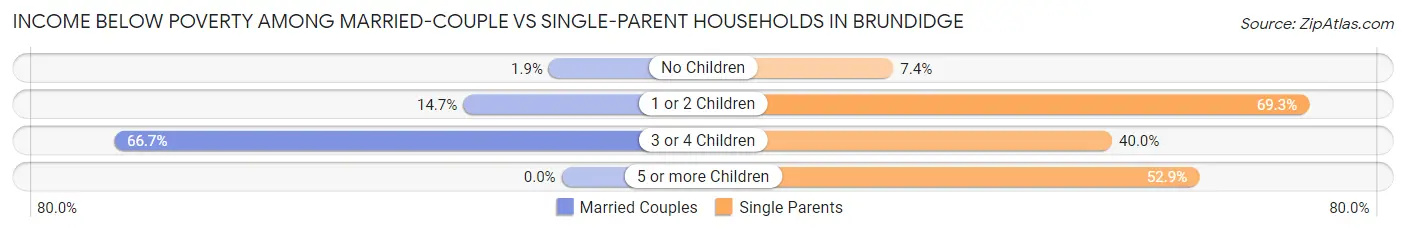
| Children | Married-Couple Families | Single-Parent Households |
| No Children | 6 (1.9%) | 6 (7.4%) |
| 1 or 2 Children | 11 (14.7%) | 52 (69.3%) |
| 3 or 4 Children | 6 (66.7%) | 4 (40.0%) |
| 5 or more Children | 0 (0.0%) | 9 (52.9%) |
| Total | 23 (5.8%) | 71 (38.8%) |
Race in Brundidge
The most populous races in Brundidge are Black / African American (1,367 | 59.2%), White / Caucasian (832 | 36.0%), and Hispanic or Latino (320 | 13.9%).
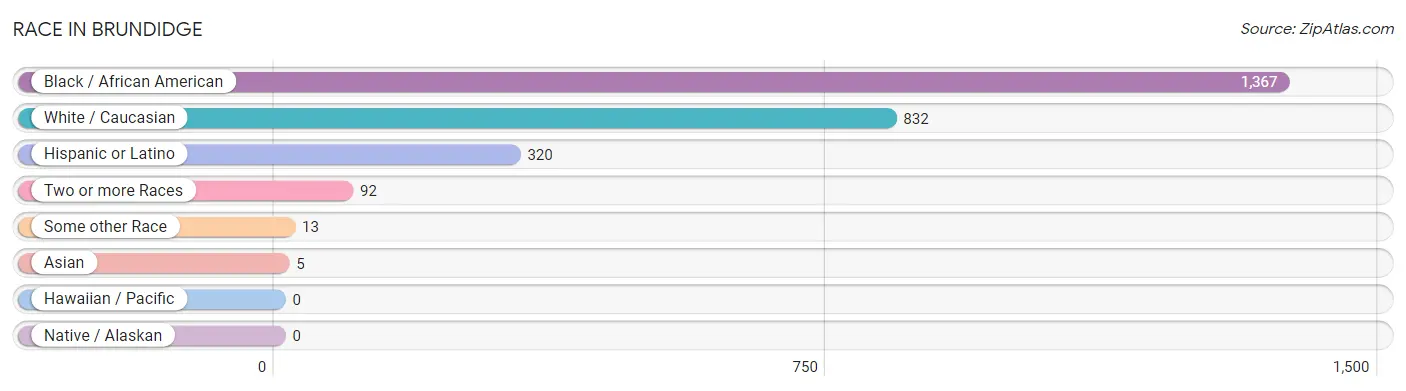
| Race | # Population | % Population |
| Asian | 5 | 0.2% |
| Black / African American | 1,367 | 59.2% |
| Hawaiian / Pacific | 0 | 0.0% |
| Hispanic or Latino | 320 | 13.9% |
| Native / Alaskan | 0 | 0.0% |
| White / Caucasian | 832 | 36.0% |
| Two or more Races | 92 | 4.0% |
| Some other Race | 13 | 0.6% |
| Total | 2,309 | 100.0% |
Ancestry in Brundidge
The most populous ancestries reported in Brundidge are Mexican (239 | 10.3%), American (205 | 8.9%), English (70 | 3.0%), European (60 | 2.6%), and Italian (55 | 2.4%), together accounting for 27.2% of all Brundidge residents.
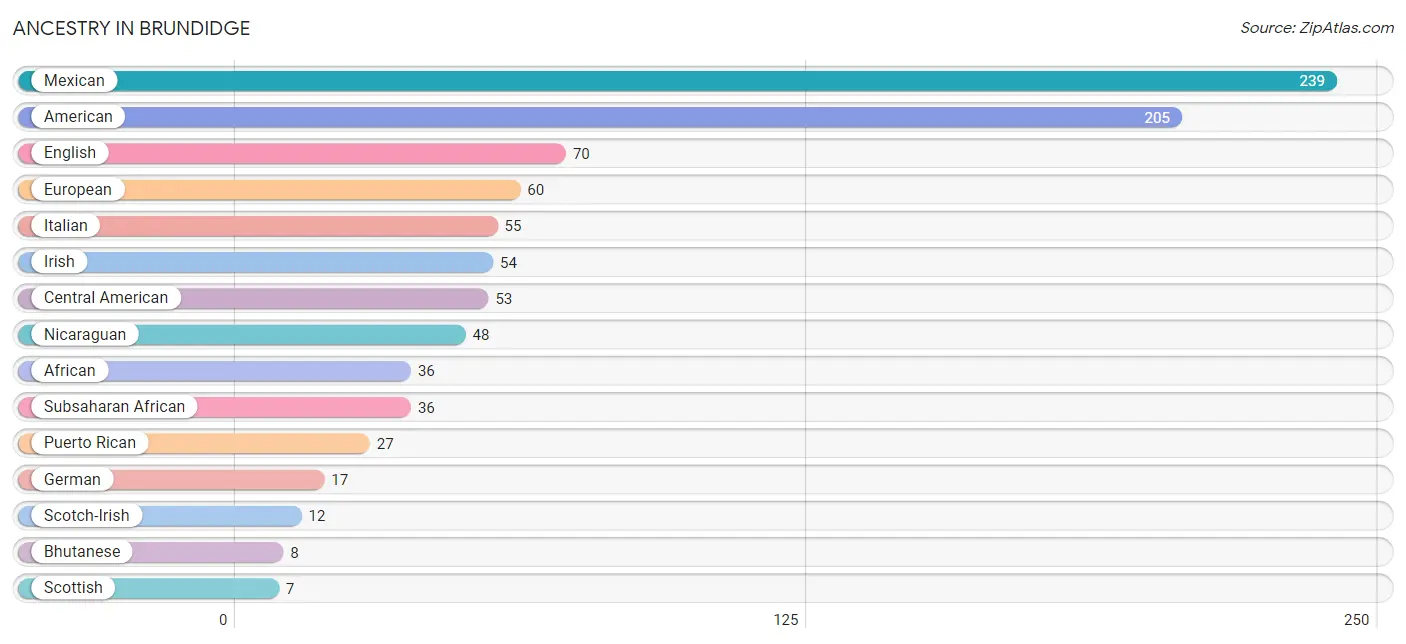
| Ancestry | # Population | % Population |
| African | 36 | 1.6% |
| American | 205 | 8.9% |
| Bhutanese | 8 | 0.4% |
| Central American | 53 | 2.3% |
| English | 70 | 3.0% |
| European | 60 | 2.6% |
| French | 5 | 0.2% |
| German | 17 | 0.7% |
| Honduran | 5 | 0.2% |
| Irish | 54 | 2.3% |
| Iroquois | 1 | 0.0% |
| Italian | 55 | 2.4% |
| Mexican | 239 | 10.3% |
| Nicaraguan | 48 | 2.1% |
| Polish | 5 | 0.2% |
| Puerto Rican | 27 | 1.2% |
| Scotch-Irish | 12 | 0.5% |
| Scottish | 7 | 0.3% |
| Spanish | 1 | 0.0% |
| Subsaharan African | 36 | 1.6% |
| Thai | 3 | 0.1% |
| Trinidadian and Tobagonian | 1 | 0.0% |
| Welsh | 2 | 0.1% |
| West Indian | 1 | 0.0% | View All 24 Rows |
Immigrants in Brundidge
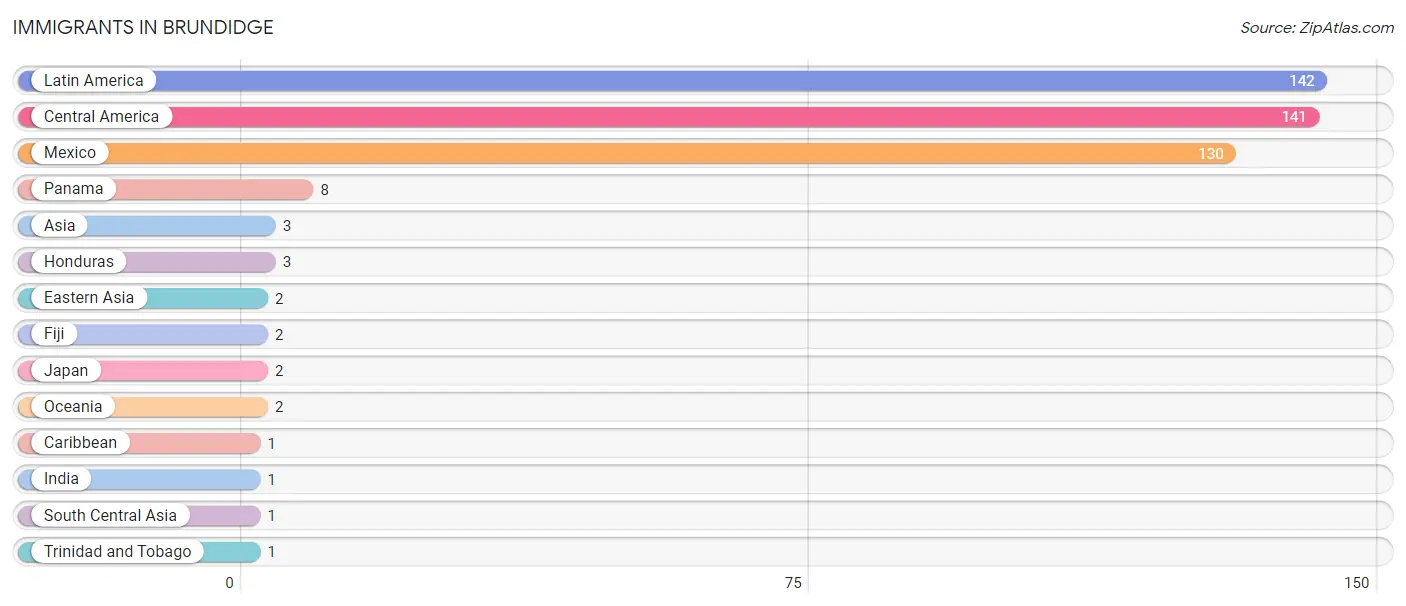
The most numerous immigrant groups reported in Brundidge came from Latin America (142 | 6.1%), Central America (141 | 6.1%), Mexico (130 | 5.6%), Panama (8 | 0.4%), and Asia (3 | 0.1%), together accounting for 18.4% of all Brundidge residents.
| Immigration Origin | # Population | % Population |
| Asia | 3 | 0.1% |
| Caribbean | 1 | 0.0% |
| Central America | 141 | 6.1% |
| Eastern Asia | 2 | 0.1% |
| Fiji | 2 | 0.1% |
| Honduras | 3 | 0.1% |
| India | 1 | 0.0% |
| Japan | 2 | 0.1% |
| Latin America | 142 | 6.1% |
| Mexico | 130 | 5.6% |
| Oceania | 2 | 0.1% |
| Panama | 8 | 0.4% |
| South Central Asia | 1 | 0.0% |
| Trinidad and Tobago | 1 | 0.0% | View All 14 Rows |
Sex and Age in Brundidge
Sex and Age in Brundidge
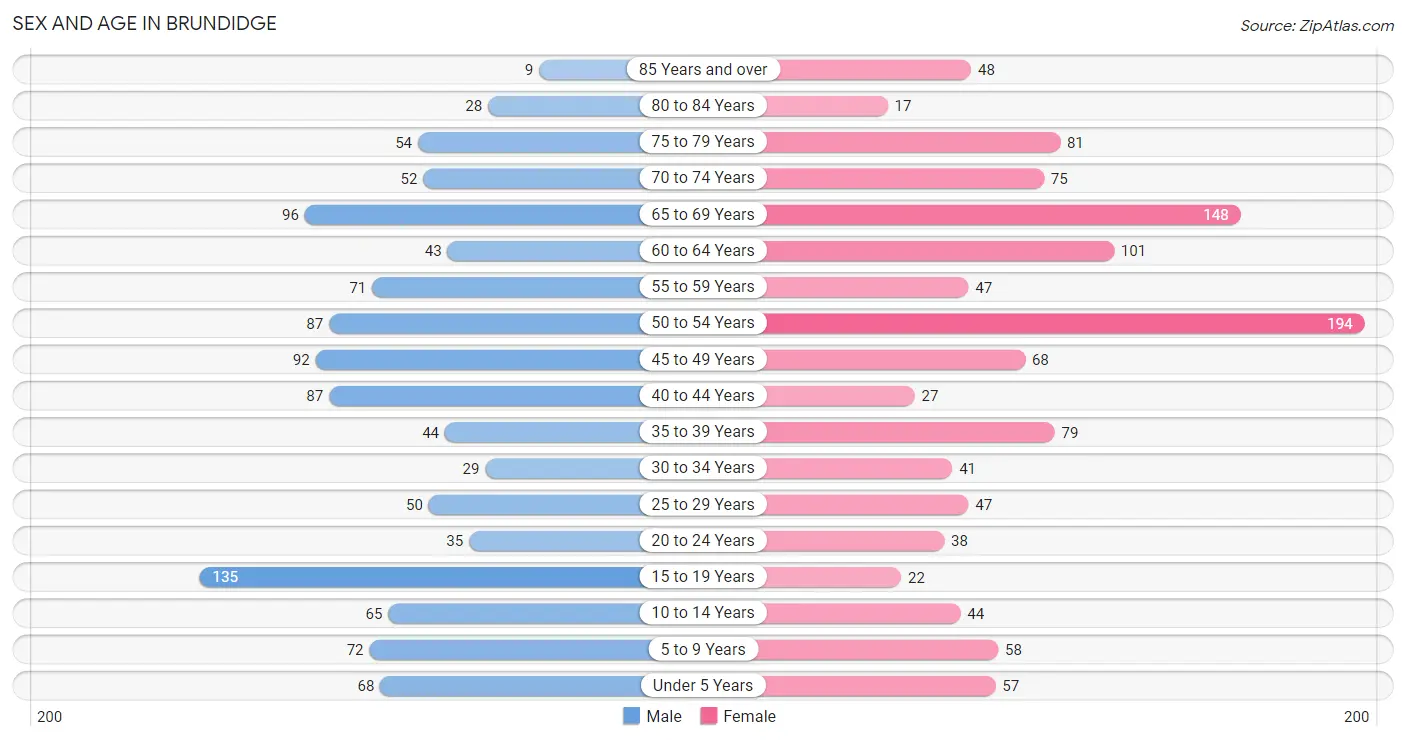
The most populous age groups in Brundidge are 15 to 19 Years (135 | 12.1%) for men and 50 to 54 Years (194 | 16.3%) for women.
| Age Bracket | Male | Female |
| Under 5 Years | 68 (6.1%) | 57 (4.8%) |
| 5 to 9 Years | 72 (6.5%) | 58 (4.9%) |
| 10 to 14 Years | 65 (5.8%) | 44 (3.7%) |
| 15 to 19 Years | 135 (12.1%) | 22 (1.8%) |
| 20 to 24 Years | 35 (3.1%) | 38 (3.2%) |
| 25 to 29 Years | 50 (4.5%) | 47 (3.9%) |
| 30 to 34 Years | 29 (2.6%) | 41 (3.4%) |
| 35 to 39 Years | 44 (3.9%) | 79 (6.6%) |
| 40 to 44 Years | 87 (7.8%) | 27 (2.3%) |
| 45 to 49 Years | 92 (8.2%) | 68 (5.7%) |
| 50 to 54 Years | 87 (7.8%) | 194 (16.3%) |
| 55 to 59 Years | 71 (6.4%) | 47 (3.9%) |
| 60 to 64 Years | 43 (3.8%) | 101 (8.5%) |
| 65 to 69 Years | 96 (8.6%) | 148 (12.4%) |
| 70 to 74 Years | 52 (4.7%) | 75 (6.3%) |
| 75 to 79 Years | 54 (4.8%) | 81 (6.8%) |
| 80 to 84 Years | 28 (2.5%) | 17 (1.4%) |
| 85 Years and over | 9 (0.8%) | 48 (4.0%) |
| Total | 1,117 (100.0%) | 1,192 (100.0%) |
Families and Households in Brundidge
Median Family Size in Brundidge
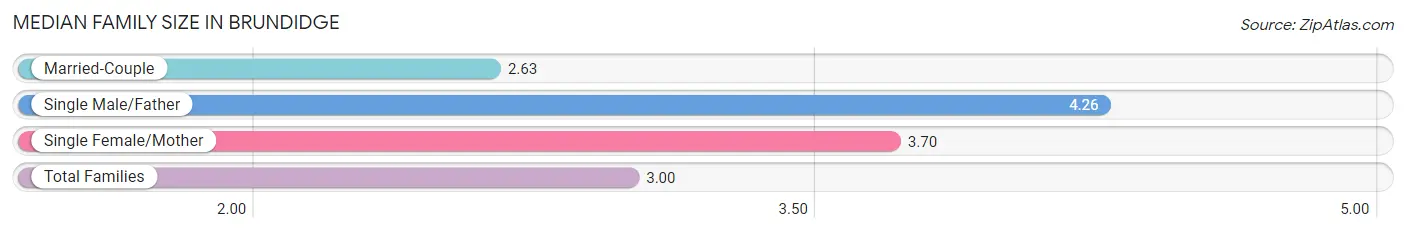
The median family size in Brundidge is 3.00 persons per family, with single male/father families (38 | 6.5%) accounting for the largest median family size of 4.26 persons per family. On the other hand, married-couple families (399 | 68.6%) represent the smallest median family size with 2.63 persons per family.
| Family Type | # Families | Family Size |
| Married-Couple | 399 (68.6%) | 2.63 |
| Single Male/Father | 38 (6.5%) | 4.26 |
| Single Female/Mother | 145 (24.9%) | 3.70 |
| Total Families | 582 (100.0%) | 3.00 |
Median Household Size in Brundidge
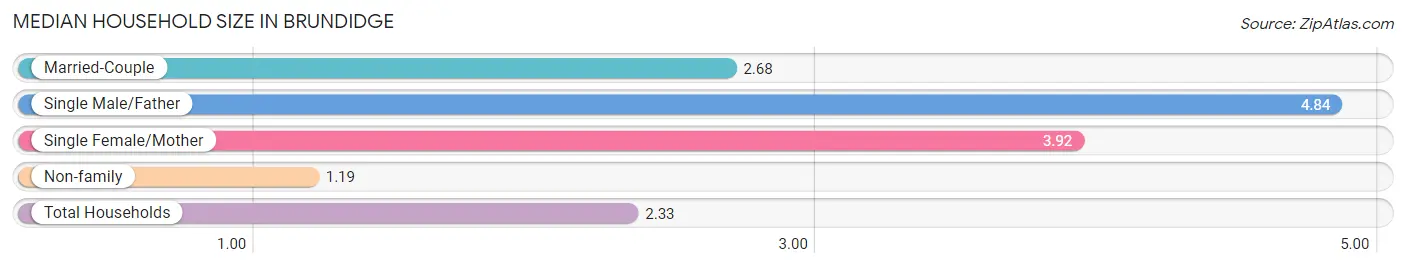
The median household size in Brundidge is 2.33 persons per household, with single male/father households (38 | 3.8%) accounting for the largest median household size of 4.84 persons per household. non-family households (410 | 41.3%) represent the smallest median household size with 1.19 persons per household.
| Household Type | # Households | Household Size |
| Married-Couple | 399 (40.2%) | 2.68 |
| Single Male/Father | 38 (3.8%) | 4.84 |
| Single Female/Mother | 145 (14.6%) | 3.92 |
| Non-family | 410 (41.3%) | 1.19 |
| Total Households | 992 (100.0%) | 2.33 |
Household Size by Marriage Status in Brundidge
Out of a total of 992 households in Brundidge, 582 (58.7%) are family households, while 410 (41.3%) are nonfamily households. The most numerous type of family households are 2-person households, comprising 359, and the most common type of nonfamily households are 1-person households, comprising 377.
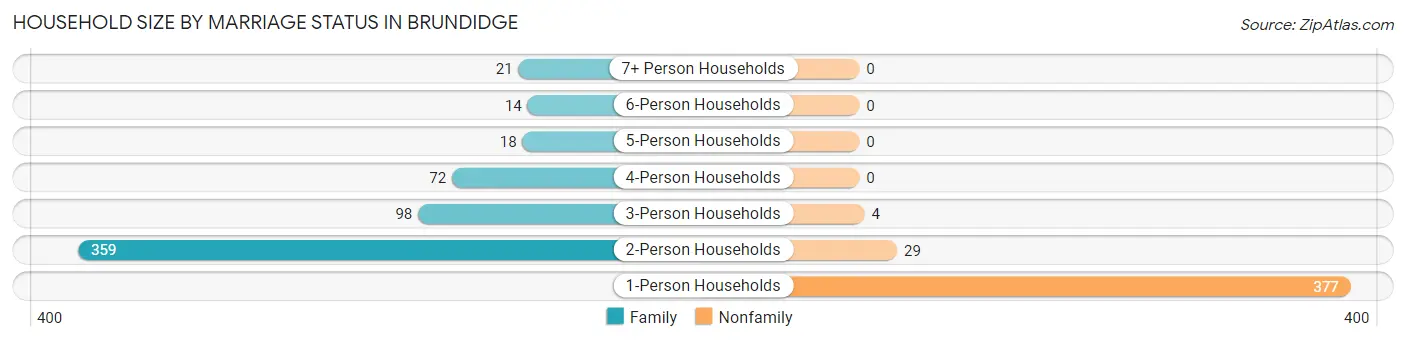
| Household Size | Family Households | Nonfamily Households |
| 1-Person Households | - | 377 (38.0%) |
| 2-Person Households | 359 (36.2%) | 29 (2.9%) |
| 3-Person Households | 98 (9.9%) | 4 (0.4%) |
| 4-Person Households | 72 (7.3%) | 0 (0.0%) |
| 5-Person Households | 18 (1.8%) | 0 (0.0%) |
| 6-Person Households | 14 (1.4%) | 0 (0.0%) |
| 7+ Person Households | 21 (2.1%) | 0 (0.0%) |
| Total | 582 (58.7%) | 410 (41.3%) |
Female Fertility in Brundidge
Fertility by Age in Brundidge
Average fertility rate in Brundidge is 128.0 births per 1,000 women. Women in the age bracket of 15 to 19 years have the highest fertility rate with 227.0 births per 1,000 women. Women in the age bracket of 20 to 34 years acount for 51.8% of all women with births.
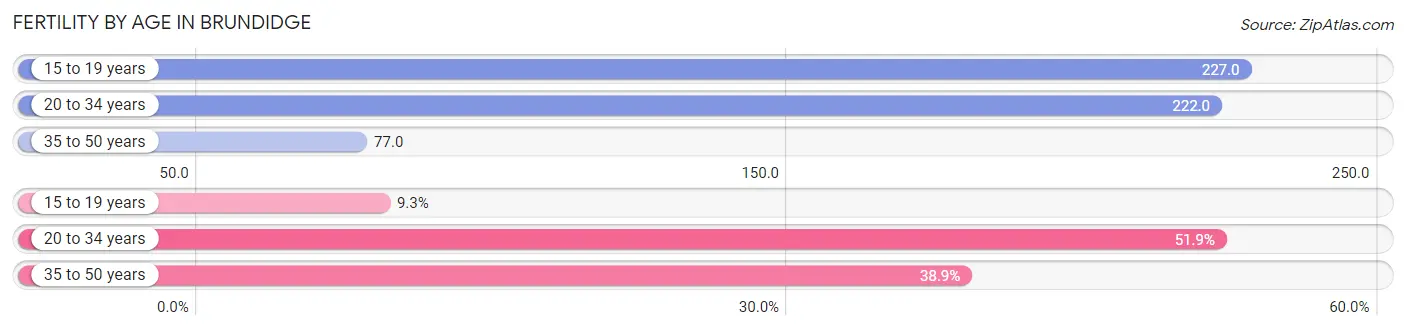
| Age Bracket | Women with Births | Births / 1,000 Women |
| 15 to 19 years | 5 (9.3%) | 227.0 |
| 20 to 34 years | 28 (51.8%) | 222.0 |
| 35 to 50 years | 21 (38.9%) | 77.0 |
| Total | 54 (100.0%) | 128.0 |
Fertility by Age by Marriage Status in Brundidge
22.2% of women with births (54) in Brundidge are married. The highest percentage of unmarried women with births falls into 15 to 19 years age bracket with 100.0% of them unmarried at the time of birth, while the lowest percentage of unmarried women with births belong to 35 to 50 years age bracket with 42.9% of them unmarried.
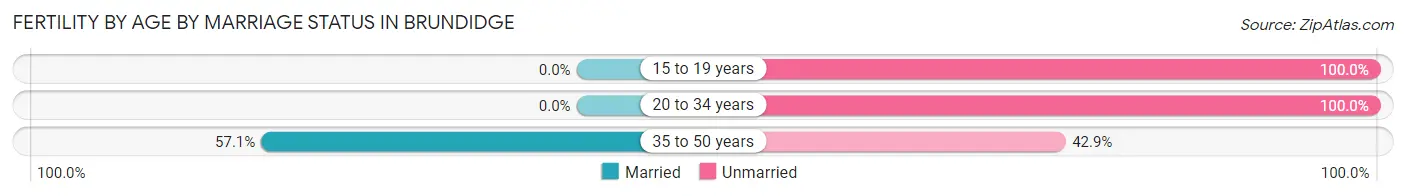
| Age Bracket | Married | Unmarried |
| 15 to 19 years | 0 (0.0%) | 5 (100.0%) |
| 20 to 34 years | 0 (0.0%) | 28 (100.0%) |
| 35 to 50 years | 12 (57.1%) | 9 (42.9%) |
| Total | 12 (22.2%) | 42 (77.8%) |
Fertility by Education in Brundidge
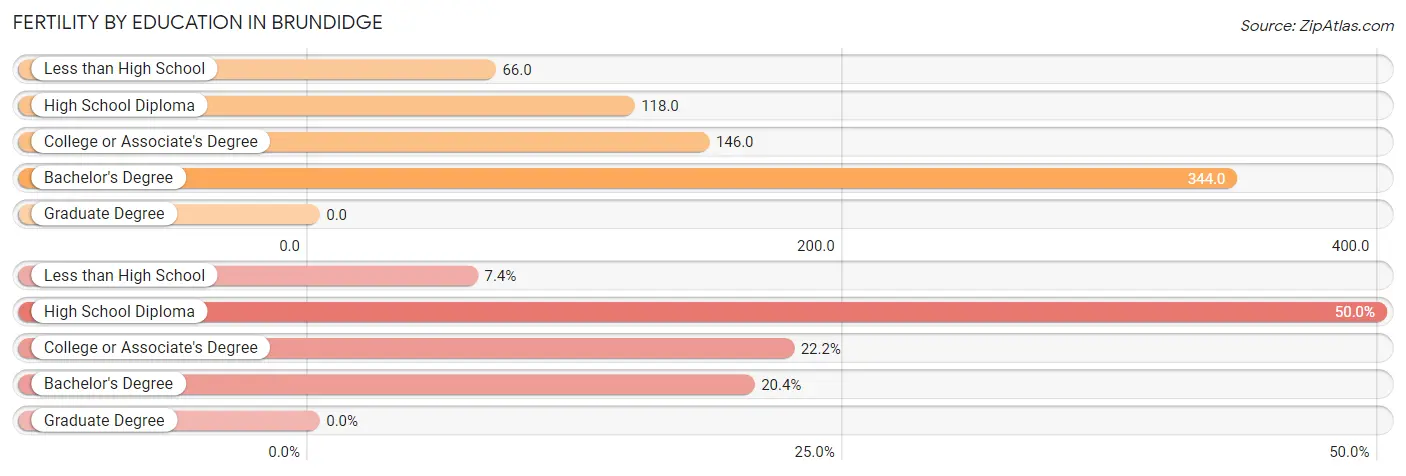
| Educational Attainment | Women with Births | Births / 1,000 Women |
| Less than High School | 4 (7.4%) | 66.0 |
| High School Diploma | 27 (50.0%) | 118.0 |
| College or Associate's Degree | 12 (22.2%) | 146.0 |
| Bachelor's Degree | 11 (20.4%) | 344.0 |
| Graduate Degree | 0 (0.0%) | 0.0 |
| Total | 54 (100.0%) | 128.0 |
Fertility by Education by Marriage Status in Brundidge
77.8% of women with births in Brundidge are unmarried. Women with the educational attainment of bachelor's degree are most likely to be married with 100.0% of them married at childbirth, while women with the educational attainment of less than high school are least likely to be married with 100.0% of them unmarried at childbirth.
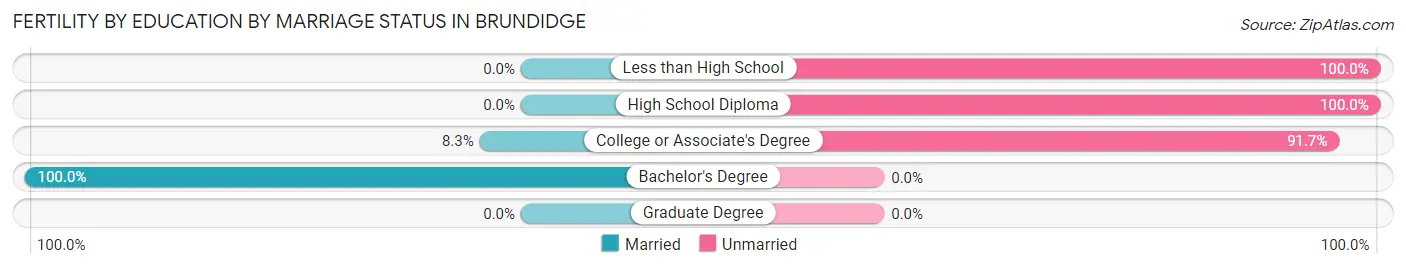
| Educational Attainment | Married | Unmarried |
| Less than High School | 0 (0.0%) | 4 (100.0%) |
| High School Diploma | 0 (0.0%) | 27 (100.0%) |
| College or Associate's Degree | 1 (8.3%) | 11 (91.7%) |
| Bachelor's Degree | 11 (100.0%) | 0 (0.0%) |
| Graduate Degree | 0 (0.0%) | 0 (0.0%) |
| Total | 12 (22.2%) | 42 (77.8%) |
Employment Characteristics in Brundidge
Employment by Class of Employer in Brundidge
Among the 671 employed individuals in Brundidge, private company employees (536 | 79.9%), not-for-profit organizations (38 | 5.7%), and state government employees (36 | 5.4%) make up the most common classes of employment.
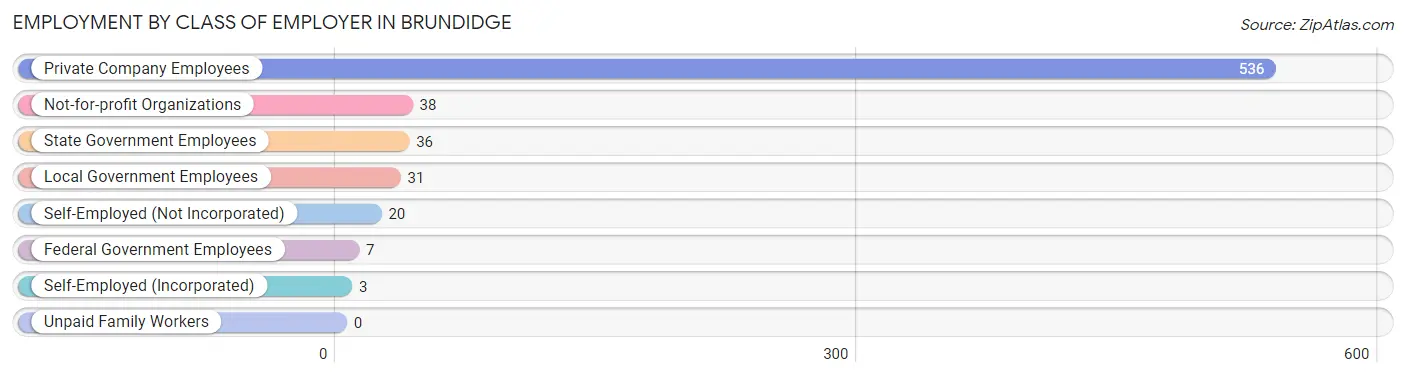
| Employer Class | # Employees | % Employees |
| Private Company Employees | 536 | 79.9% |
| Self-Employed (Incorporated) | 3 | 0.4% |
| Self-Employed (Not Incorporated) | 20 | 3.0% |
| Not-for-profit Organizations | 38 | 5.7% |
| Local Government Employees | 31 | 4.6% |
| State Government Employees | 36 | 5.4% |
| Federal Government Employees | 7 | 1.0% |
| Unpaid Family Workers | 0 | 0.0% |
| Total | 671 | 100.0% |
Employment Status by Age in Brundidge
According to the labor force statistics for Brundidge, out of the total population over 16 years of age (1,928), 40.4% or 779 individuals are in the labor force, with 10.1% or 79 of them unemployed. The age group with the highest labor force participation rate is 20 to 24 years, with 93.2% or 68 individuals in the labor force. Within the labor force, the 16 to 19 years age range has the highest percentage of unemployed individuals, with 57.1% or 12 of them being unemployed.
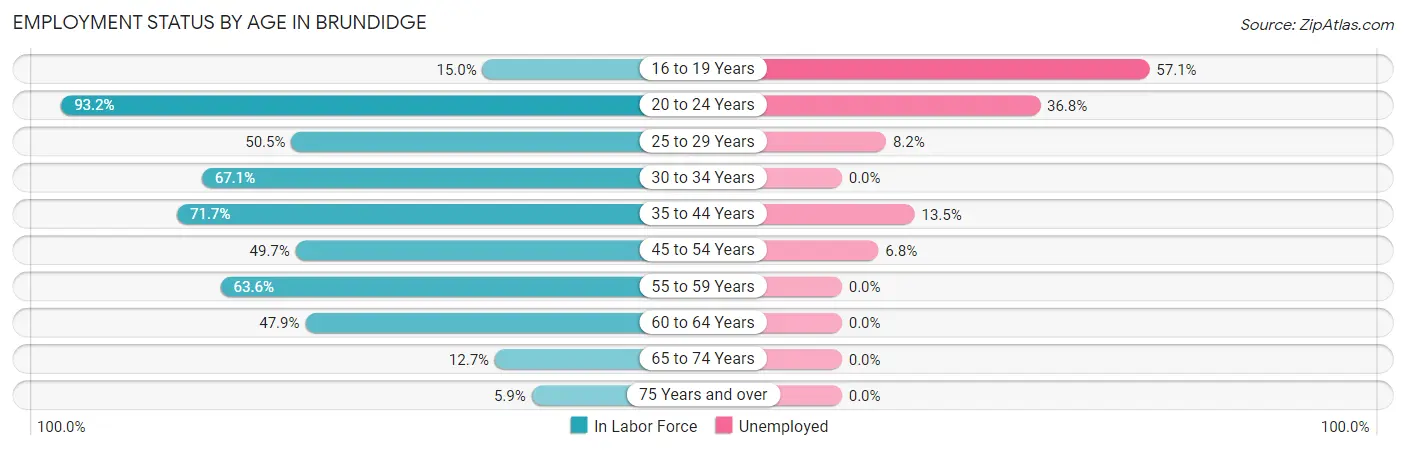
| Age Bracket | In Labor Force | Unemployed |
| 16 to 19 Years | 21 (15.0%) | 12 (57.1%) |
| 20 to 24 Years | 68 (93.2%) | 25 (36.8%) |
| 25 to 29 Years | 49 (50.5%) | 4 (8.2%) |
| 30 to 34 Years | 47 (67.1%) | 0 (0.0%) |
| 35 to 44 Years | 170 (71.7%) | 23 (13.5%) |
| 45 to 54 Years | 219 (49.7%) | 15 (6.8%) |
| 55 to 59 Years | 75 (63.6%) | 0 (0.0%) |
| 60 to 64 Years | 69 (47.9%) | 0 (0.0%) |
| 65 to 74 Years | 47 (12.7%) | 0 (0.0%) |
| 75 Years and over | 14 (5.9%) | 0 (0.0%) |
| Total | 779 (40.4%) | 79 (10.1%) |
Employment Status by Educational Attainment in Brundidge
According to labor force statistics for Brundidge, 56.8% of individuals (629) out of the total population between 25 and 64 years of age (1,107) are in the labor force, with 6.7% or 42 of them being unemployed. The group with the highest labor force participation rate are those with the educational attainment of bachelor's degree or higher, with 82.3% or 107 individuals in the labor force. Within the labor force, individuals with bachelor's degree or higher education have the highest percentage of unemployment, with 10.3% or 11 of them being unemployed.
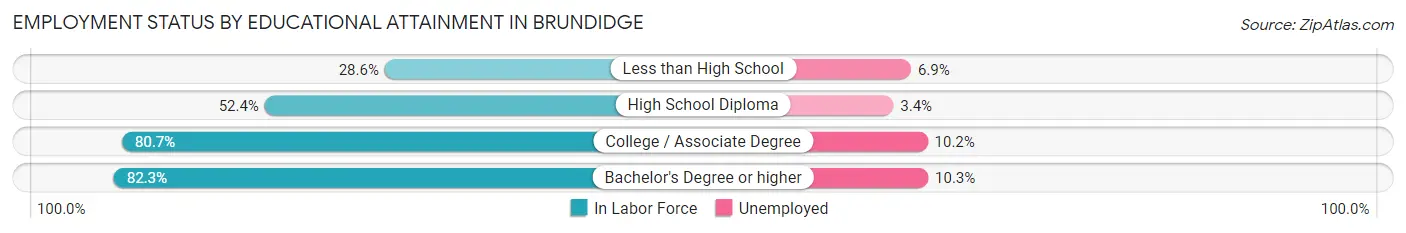
| Educational Attainment | In Labor Force | Unemployed |
| Less than High School | 58 (28.6%) | 14 (6.9%) |
| High School Diploma | 297 (52.4%) | 19 (3.4%) |
| College / Associate Degree | 167 (80.7%) | 21 (10.2%) |
| Bachelor's Degree or higher | 107 (82.3%) | 13 (10.3%) |
| Total | 629 (56.8%) | 74 (6.7%) |
Employment Occupations by Sex in Brundidge
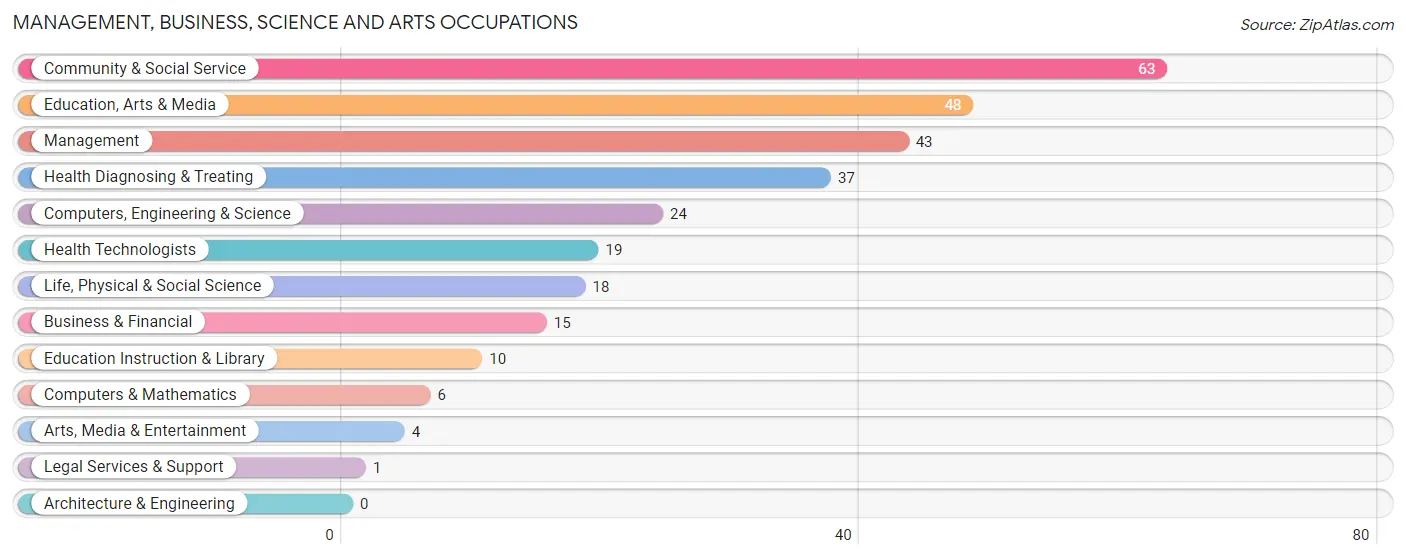
Management, Business, Science and Arts Occupations
The most common Management, Business, Science and Arts occupations in Brundidge are Community & Social Service (63 | 9.0%), Education, Arts & Media (48 | 6.9%), Management (43 | 6.1%), Health Diagnosing & Treating (37 | 5.3%), and Computers, Engineering & Science (24 | 3.4%).
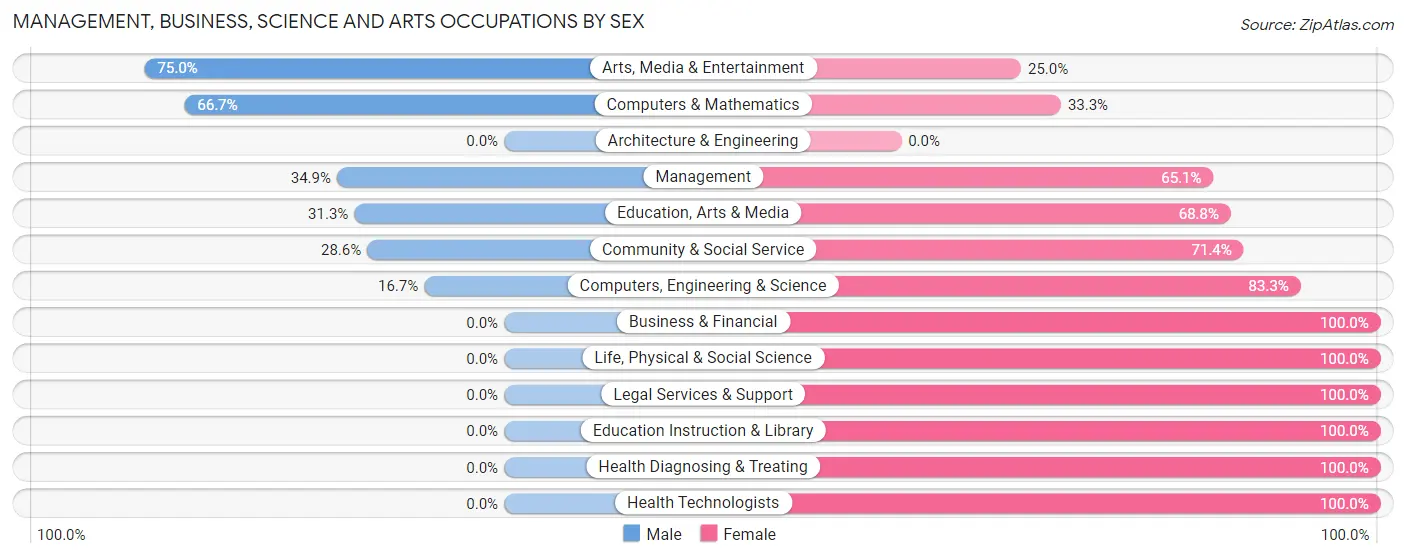
Management, Business, Science and Arts Occupations by Sex
Within the Management, Business, Science and Arts occupations in Brundidge, the most male-oriented occupations are Arts, Media & Entertainment (75.0%), Computers & Mathematics (66.7%), and Management (34.9%), while the most female-oriented occupations are Business & Financial (100.0%), Life, Physical & Social Science (100.0%), and Legal Services & Support (100.0%).
| Occupation | Male | Female |
| Management | 15 (34.9%) | 28 (65.1%) |
| Business & Financial | 0 (0.0%) | 15 (100.0%) |
| Computers, Engineering & Science | 4 (16.7%) | 20 (83.3%) |
| Computers & Mathematics | 4 (66.7%) | 2 (33.3%) |
| Architecture & Engineering | 0 (0.0%) | 0 (0.0%) |
| Life, Physical & Social Science | 0 (0.0%) | 18 (100.0%) |
| Community & Social Service | 18 (28.6%) | 45 (71.4%) |
| Education, Arts & Media | 15 (31.2%) | 33 (68.8%) |
| Legal Services & Support | 0 (0.0%) | 1 (100.0%) |
| Education Instruction & Library | 0 (0.0%) | 10 (100.0%) |
| Arts, Media & Entertainment | 3 (75.0%) | 1 (25.0%) |
| Health Diagnosing & Treating | 0 (0.0%) | 37 (100.0%) |
| Health Technologists | 0 (0.0%) | 19 (100.0%) |
| Total (Category) | 37 (20.3%) | 145 (79.7%) |
| Total (Overall) | 392 (56.0%) | 308 (44.0%) |
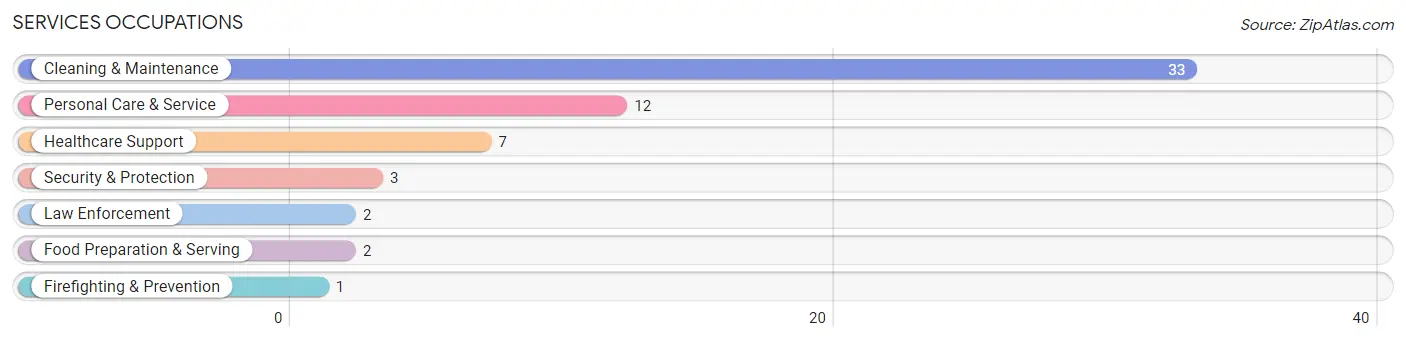
Services Occupations
The most common Services occupations in Brundidge are Cleaning & Maintenance (33 | 4.7%), Personal Care & Service (12 | 1.7%), Healthcare Support (7 | 1.0%), Security & Protection (3 | 0.4%), and Law Enforcement (2 | 0.3%).
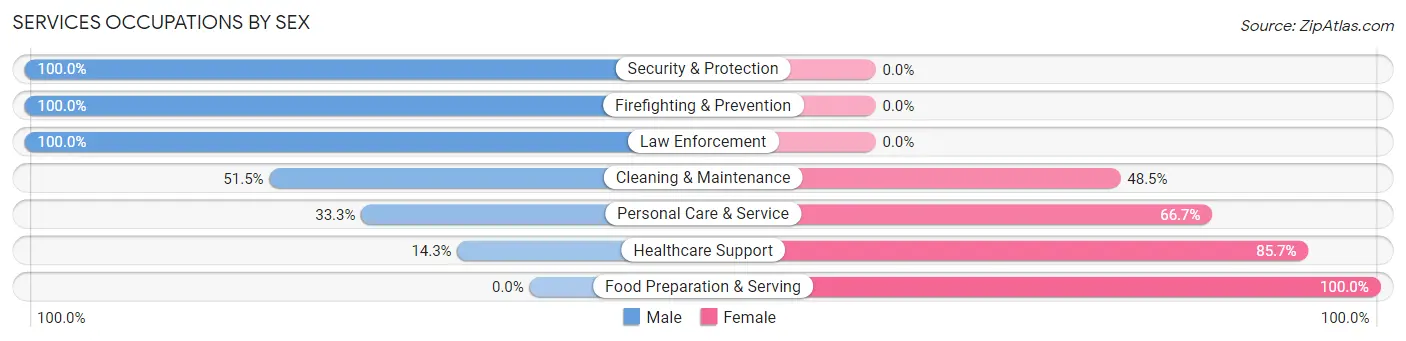
Services Occupations by Sex
Within the Services occupations in Brundidge, the most male-oriented occupations are Security & Protection (100.0%), Firefighting & Prevention (100.0%), and Law Enforcement (100.0%), while the most female-oriented occupations are Food Preparation & Serving (100.0%), Healthcare Support (85.7%), and Personal Care & Service (66.7%).
| Occupation | Male | Female |
| Healthcare Support | 1 (14.3%) | 6 (85.7%) |
| Security & Protection | 3 (100.0%) | 0 (0.0%) |
| Firefighting & Prevention | 1 (100.0%) | 0 (0.0%) |
| Law Enforcement | 2 (100.0%) | 0 (0.0%) |
| Food Preparation & Serving | 0 (0.0%) | 2 (100.0%) |
| Cleaning & Maintenance | 17 (51.5%) | 16 (48.5%) |
| Personal Care & Service | 4 (33.3%) | 8 (66.7%) |
| Total (Category) | 25 (43.9%) | 32 (56.1%) |
| Total (Overall) | 392 (56.0%) | 308 (44.0%) |
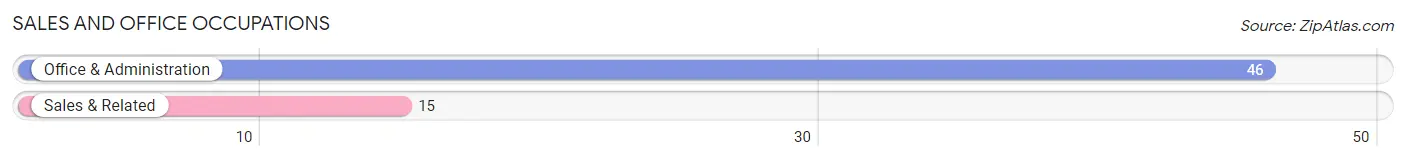
Sales and Office Occupations
The most common Sales and Office occupations in Brundidge are Office & Administration (46 | 6.6%), and Sales & Related (15 | 2.1%).
Sales and Office Occupations by Sex
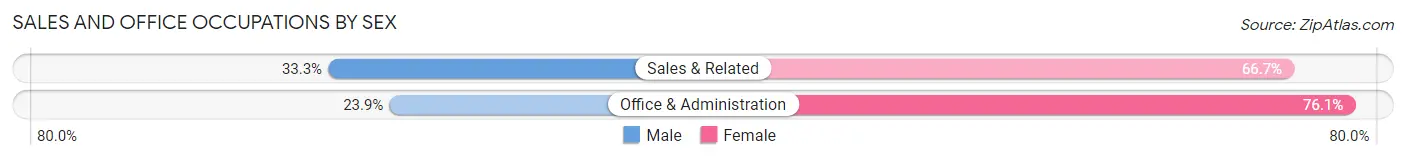
| Occupation | Male | Female |
| Sales & Related | 5 (33.3%) | 10 (66.7%) |
| Office & Administration | 11 (23.9%) | 35 (76.1%) |
| Total (Category) | 16 (26.2%) | 45 (73.8%) |
| Total (Overall) | 392 (56.0%) | 308 (44.0%) |
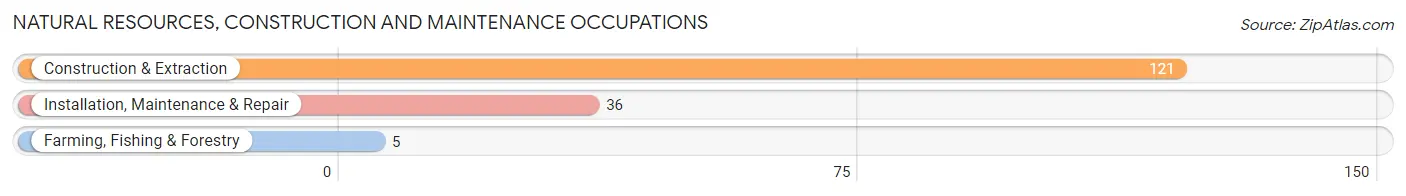
Natural Resources, Construction and Maintenance Occupations
The most common Natural Resources, Construction and Maintenance occupations in Brundidge are Construction & Extraction (121 | 17.3%), Installation, Maintenance & Repair (36 | 5.1%), and Farming, Fishing & Forestry (5 | 0.7%).
Natural Resources, Construction and Maintenance Occupations by Sex
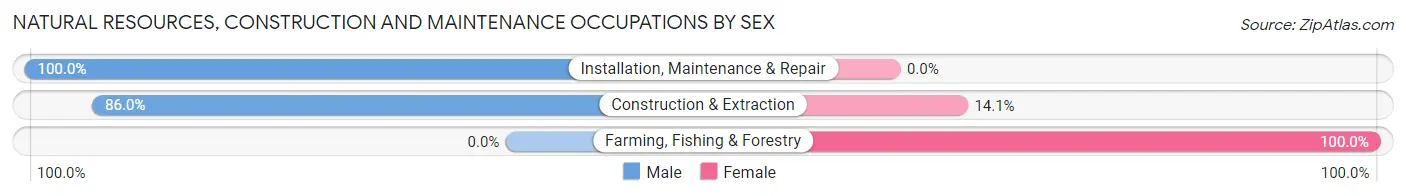
| Occupation | Male | Female |
| Farming, Fishing & Forestry | 0 (0.0%) | 5 (100.0%) |
| Construction & Extraction | 104 (86.0%) | 17 (14.1%) |
| Installation, Maintenance & Repair | 36 (100.0%) | 0 (0.0%) |
| Total (Category) | 140 (86.4%) | 22 (13.6%) |
| Total (Overall) | 392 (56.0%) | 308 (44.0%) |
Production, Transportation and Moving Occupations
The most common Production, Transportation and Moving occupations in Brundidge are Production (139 | 19.9%), Transportation (51 | 7.3%), and Material Moving (48 | 6.9%).
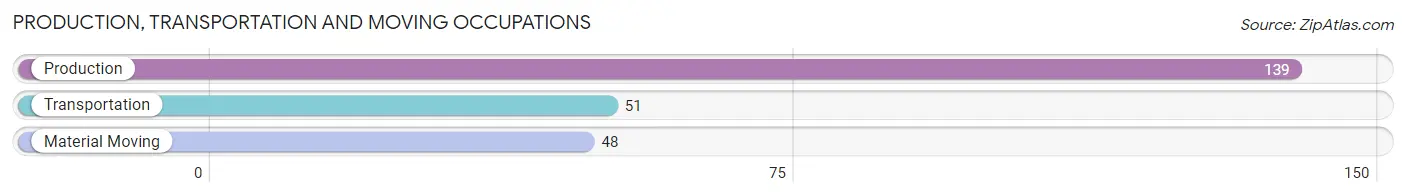
Production, Transportation and Moving Occupations by Sex
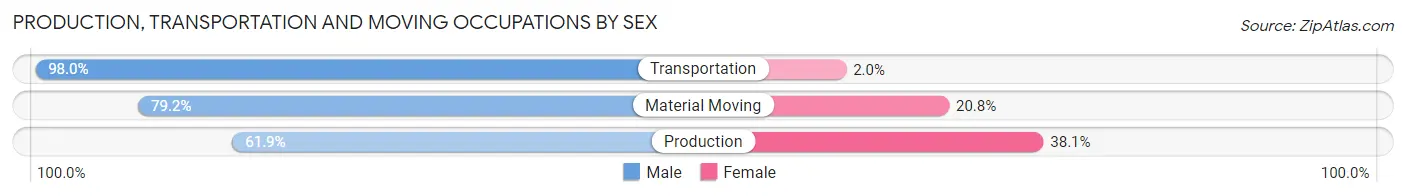
| Occupation | Male | Female |
| Production | 86 (61.9%) | 53 (38.1%) |
| Transportation | 50 (98.0%) | 1 (2.0%) |
| Material Moving | 38 (79.2%) | 10 (20.8%) |
| Total (Category) | 174 (73.1%) | 64 (26.9%) |
| Total (Overall) | 392 (56.0%) | 308 (44.0%) |
Employment Industries by Sex in Brundidge
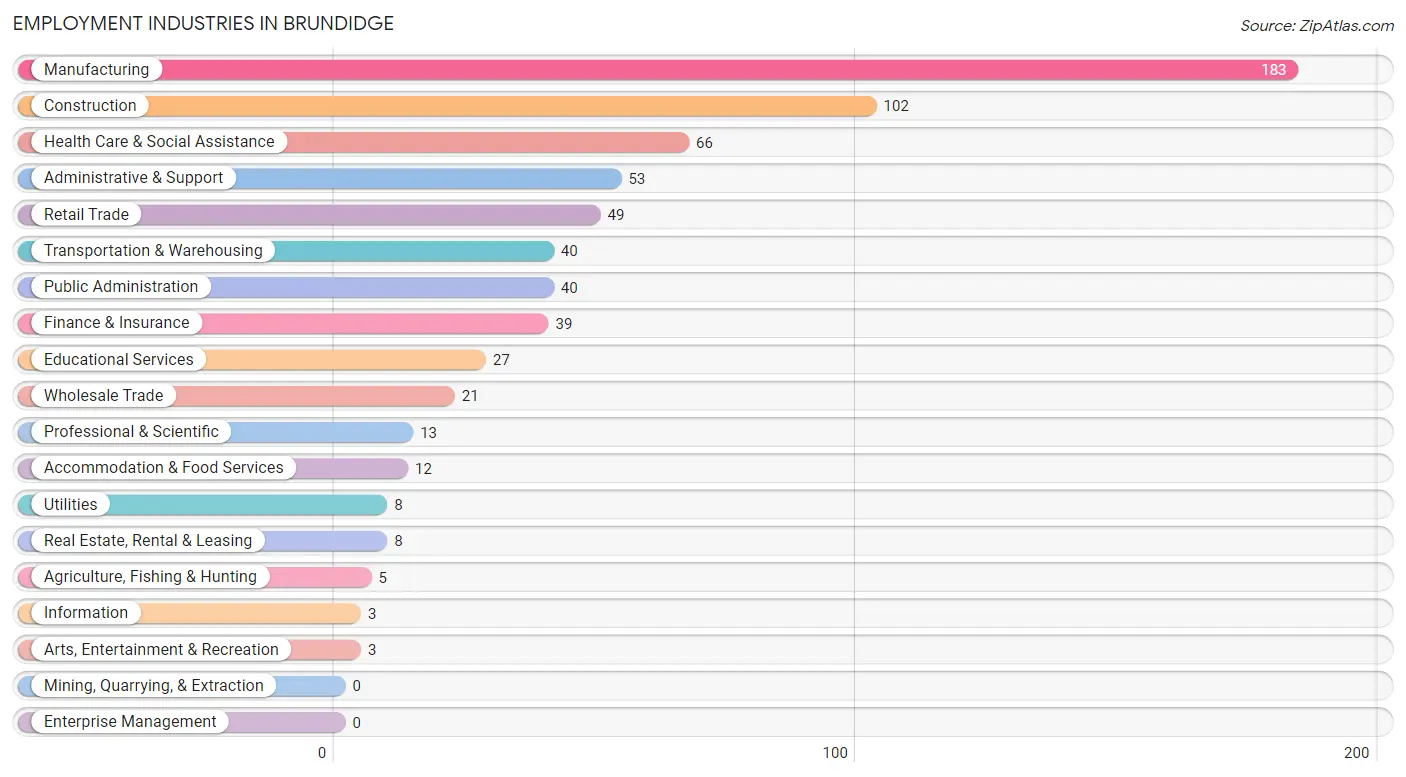
Employment Industries in Brundidge
The major employment industries in Brundidge include Manufacturing (183 | 26.1%), Construction (102 | 14.6%), Health Care & Social Assistance (66 | 9.4%), Administrative & Support (53 | 7.6%), and Retail Trade (49 | 7.0%).
Employment Industries by Sex in Brundidge
The Brundidge industries that see more men than women are Agriculture, Fishing & Hunting (100.0%), Construction (100.0%), and Professional & Scientific (100.0%), whereas the industries that tend to have a higher number of women are Health Care & Social Assistance (95.5%), Accommodation & Food Services (83.3%), and Finance & Insurance (82.1%).
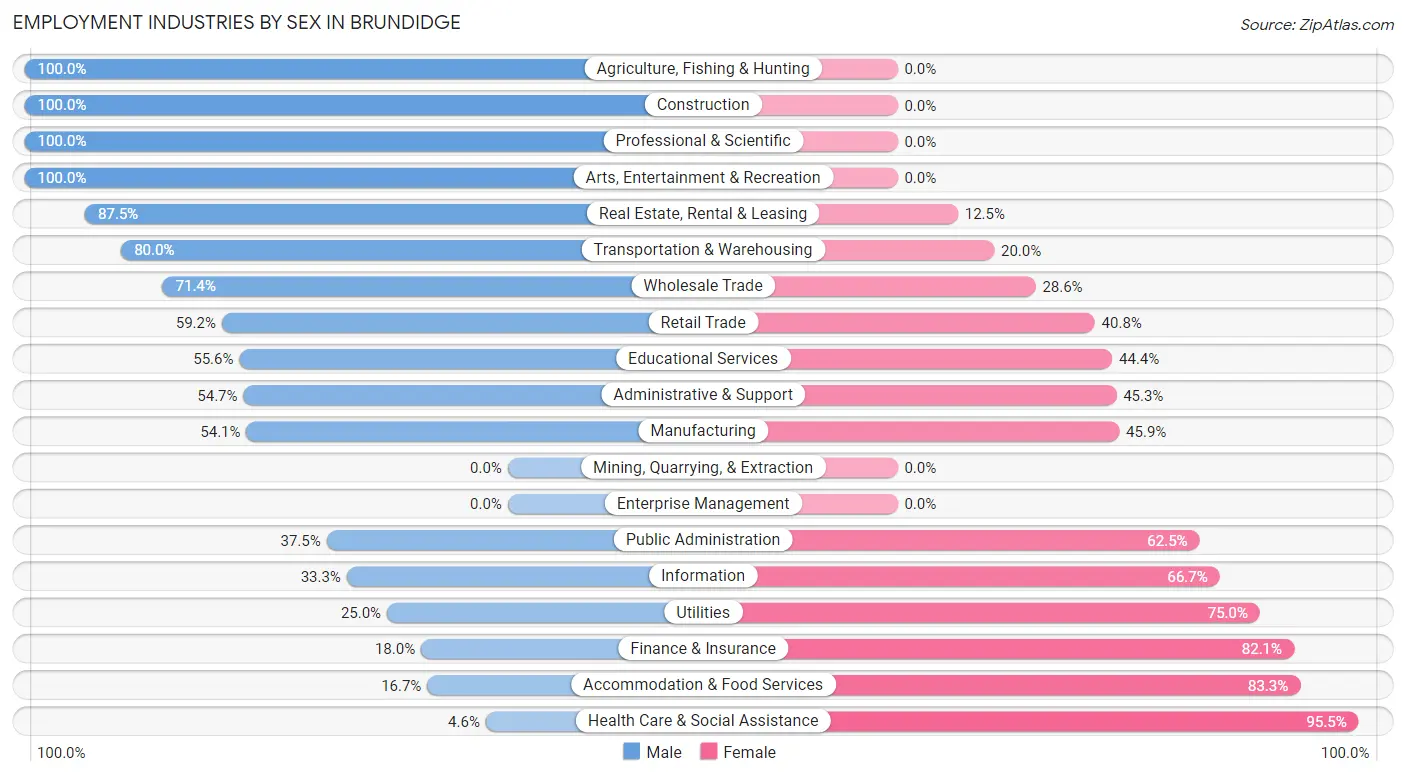
| Industry | Male | Female |
| Agriculture, Fishing & Hunting | 5 (100.0%) | 0 (0.0%) |
| Mining, Quarrying, & Extraction | 0 (0.0%) | 0 (0.0%) |
| Construction | 102 (100.0%) | 0 (0.0%) |
| Manufacturing | 99 (54.1%) | 84 (45.9%) |
| Wholesale Trade | 15 (71.4%) | 6 (28.6%) |
| Retail Trade | 29 (59.2%) | 20 (40.8%) |
| Transportation & Warehousing | 32 (80.0%) | 8 (20.0%) |
| Utilities | 2 (25.0%) | 6 (75.0%) |
| Information | 1 (33.3%) | 2 (66.7%) |
| Finance & Insurance | 7 (17.9%) | 32 (82.1%) |
| Real Estate, Rental & Leasing | 7 (87.5%) | 1 (12.5%) |
| Professional & Scientific | 13 (100.0%) | 0 (0.0%) |
| Enterprise Management | 0 (0.0%) | 0 (0.0%) |
| Administrative & Support | 29 (54.7%) | 24 (45.3%) |
| Educational Services | 15 (55.6%) | 12 (44.4%) |
| Health Care & Social Assistance | 3 (4.5%) | 63 (95.5%) |
| Arts, Entertainment & Recreation | 3 (100.0%) | 0 (0.0%) |
| Accommodation & Food Services | 2 (16.7%) | 10 (83.3%) |
| Public Administration | 15 (37.5%) | 25 (62.5%) |
| Total | 392 (56.0%) | 308 (44.0%) |
Education in Brundidge
School Enrollment in Brundidge
The most common levels of schooling among the 480 students in Brundidge are high school (118 | 24.6%), middle school (102 | 21.2%), and elementary school (99 | 20.6%).
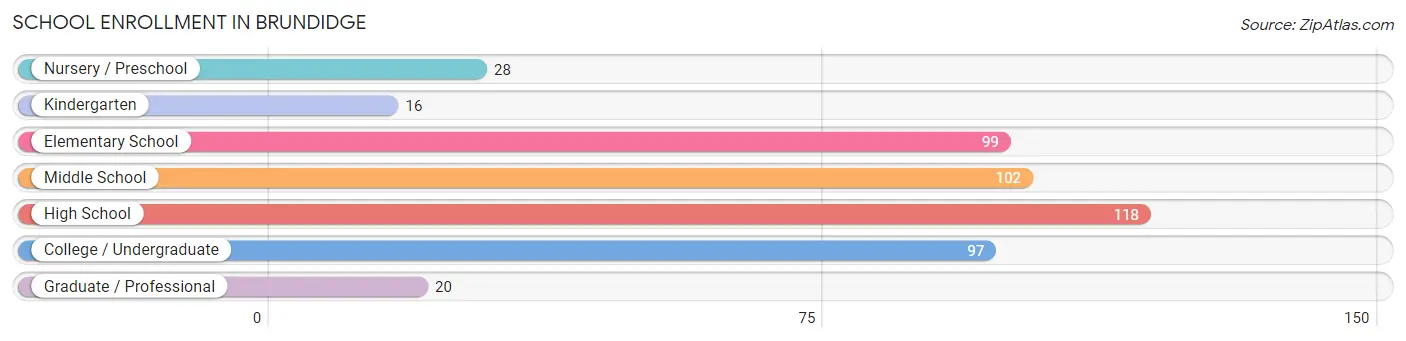
| School Level | # Students | % Students |
| Nursery / Preschool | 28 | 5.8% |
| Kindergarten | 16 | 3.3% |
| Elementary School | 99 | 20.6% |
| Middle School | 102 | 21.2% |
| High School | 118 | 24.6% |
| College / Undergraduate | 97 | 20.2% |
| Graduate / Professional | 20 | 4.2% |
| Total | 480 | 100.0% |
School Enrollment by Age by Funding Source in Brundidge
Out of a total of 480 students who are enrolled in schools in Brundidge, 51 (10.6%) attend a private institution, while the remaining 429 (89.4%) are enrolled in public schools. The age group of 18 to 19 year olds has the highest likelihood of being enrolled in private schools, with 8 (100.0% in the age bracket) enrolled. Conversely, the age group of 3 to 4 year olds has the lowest likelihood of being enrolled in a private school, with 28 (100.0% in the age bracket) attending a public institution.
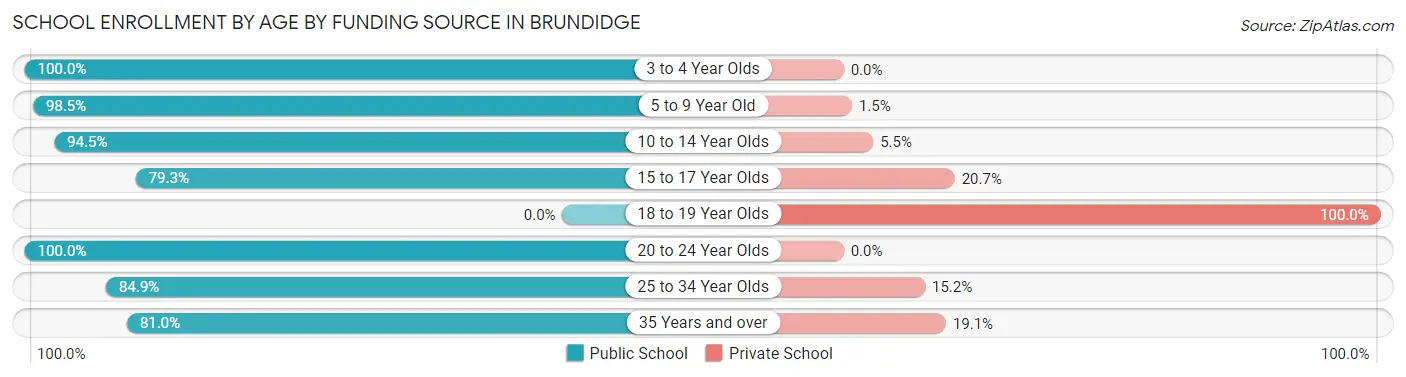
| Age Bracket | Public School | Private School |
| 3 to 4 Year Olds | 28 (100.0%) | 0 (0.0%) |
| 5 to 9 Year Old | 128 (98.5%) | 2 (1.5%) |
| 10 to 14 Year Olds | 103 (94.5%) | 6 (5.5%) |
| 15 to 17 Year Olds | 69 (79.3%) | 18 (20.7%) |
| 18 to 19 Year Olds | 0 (0.0%) | 8 (100.0%) |
| 20 to 24 Year Olds | 22 (100.0%) | 0 (0.0%) |
| 25 to 34 Year Olds | 28 (84.9%) | 5 (15.1%) |
| 35 Years and over | 51 (80.9%) | 12 (19.1%) |
| Total | 429 (89.4%) | 51 (10.6%) |
Educational Attainment by Field of Study in Brundidge
Business (63 | 24.4%), education (53 | 20.5%), bio, nature & agricultural (19 | 7.4%), science & technology (16 | 6.2%), and computers & mathematics (14 | 5.4%) are the most common fields of study among 258 individuals in Brundidge who have obtained a bachelor's degree or higher.
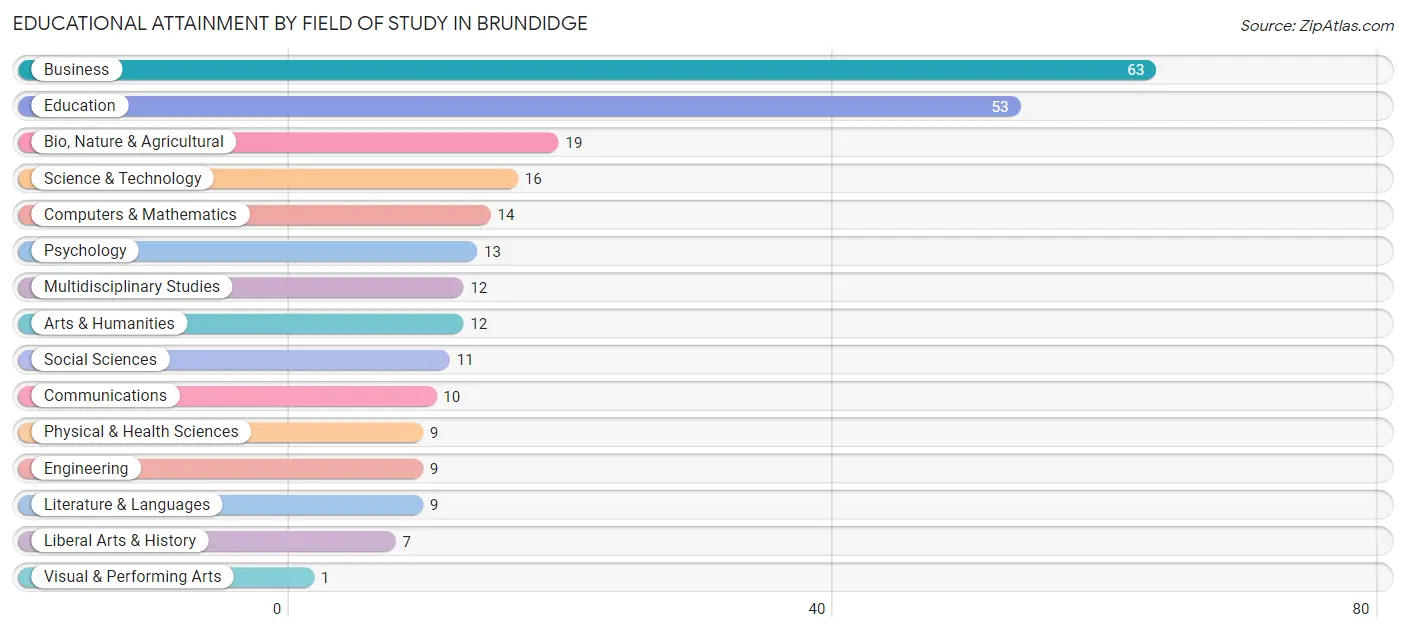
| Field of Study | # Graduates | % Graduates |
| Computers & Mathematics | 14 | 5.4% |
| Bio, Nature & Agricultural | 19 | 7.4% |
| Physical & Health Sciences | 9 | 3.5% |
| Psychology | 13 | 5.0% |
| Social Sciences | 11 | 4.3% |
| Engineering | 9 | 3.5% |
| Multidisciplinary Studies | 12 | 4.6% |
| Science & Technology | 16 | 6.2% |
| Business | 63 | 24.4% |
| Education | 53 | 20.5% |
| Literature & Languages | 9 | 3.5% |
| Liberal Arts & History | 7 | 2.7% |
| Visual & Performing Arts | 1 | 0.4% |
| Communications | 10 | 3.9% |
| Arts & Humanities | 12 | 4.6% |
| Total | 258 | 100.0% |
Transportation & Commute in Brundidge
Vehicle Availability by Sex in Brundidge
The most prevalent vehicle ownership categories in Brundidge are males with 2 vehicles (142, accounting for 36.7%) and females with 2 vehicles (74, making up 50.0%).
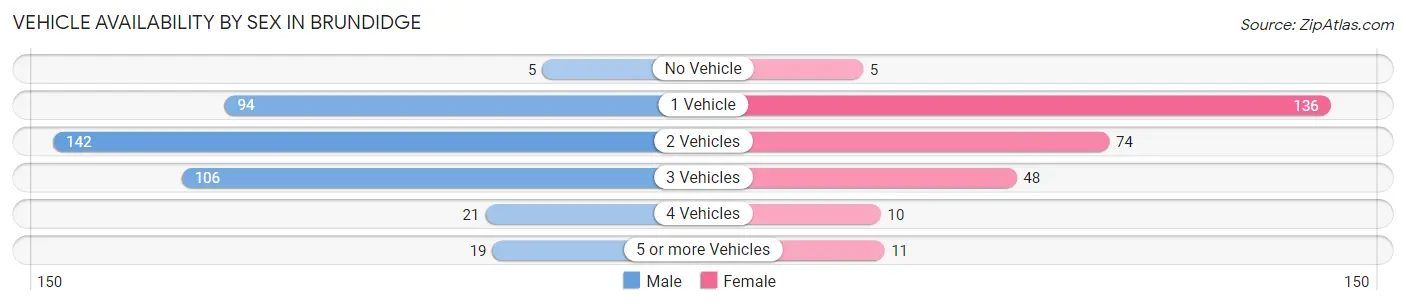
| Vehicles Available | Male | Female |
| No Vehicle | 5 (1.3%) | 5 (1.8%) |
| 1 Vehicle | 94 (24.3%) | 136 (47.9%) |
| 2 Vehicles | 142 (36.7%) | 74 (26.1%) |
| 3 Vehicles | 106 (27.4%) | 48 (16.9%) |
| 4 Vehicles | 21 (5.4%) | 10 (3.5%) |
| 5 or more Vehicles | 19 (4.9%) | 11 (3.9%) |
| Total | 387 (100.0%) | 284 (100.0%) |
Commute Time in Brundidge
The most frequently occuring commute durations in Brundidge are 20 to 24 minutes (140 commuters, 21.4%), 10 to 14 minutes (98 commuters, 15.0%), and 15 to 19 minutes (95 commuters, 14.5%).
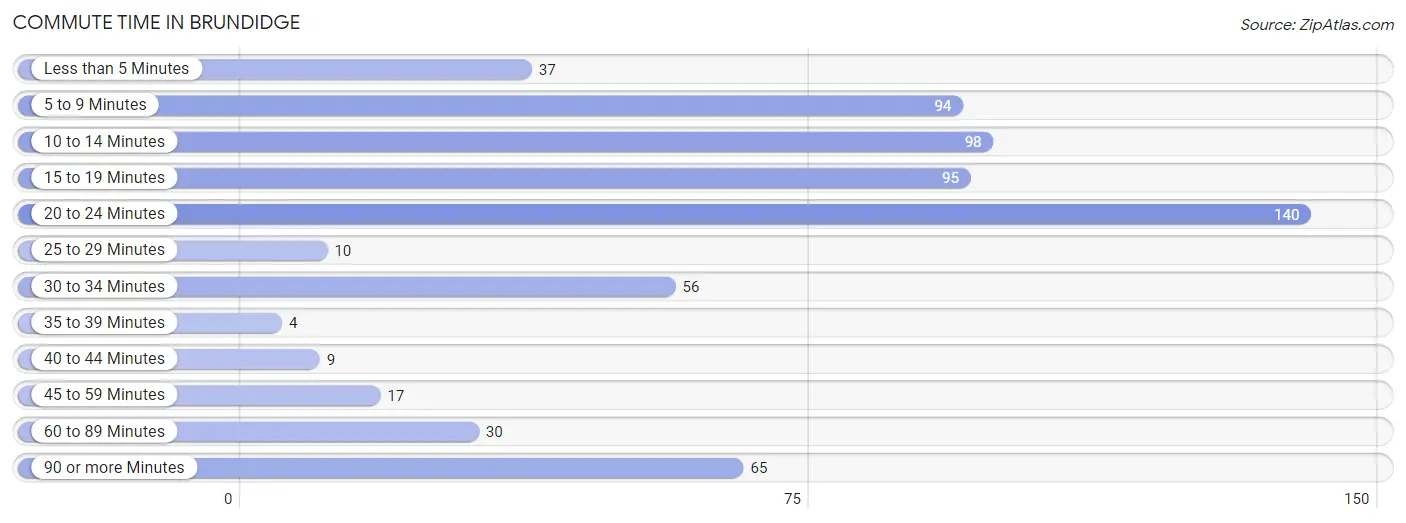
| Commute Time | # Commuters | % Commuters |
| Less than 5 Minutes | 37 | 5.7% |
| 5 to 9 Minutes | 94 | 14.3% |
| 10 to 14 Minutes | 98 | 15.0% |
| 15 to 19 Minutes | 95 | 14.5% |
| 20 to 24 Minutes | 140 | 21.4% |
| 25 to 29 Minutes | 10 | 1.5% |
| 30 to 34 Minutes | 56 | 8.6% |
| 35 to 39 Minutes | 4 | 0.6% |
| 40 to 44 Minutes | 9 | 1.4% |
| 45 to 59 Minutes | 17 | 2.6% |
| 60 to 89 Minutes | 30 | 4.6% |
| 90 or more Minutes | 65 | 9.9% |
Commute Time by Sex in Brundidge
The most common commute times in Brundidge are 20 to 24 minutes (80 commuters, 21.1%) for males and 20 to 24 minutes (60 commuters, 21.7%) for females.
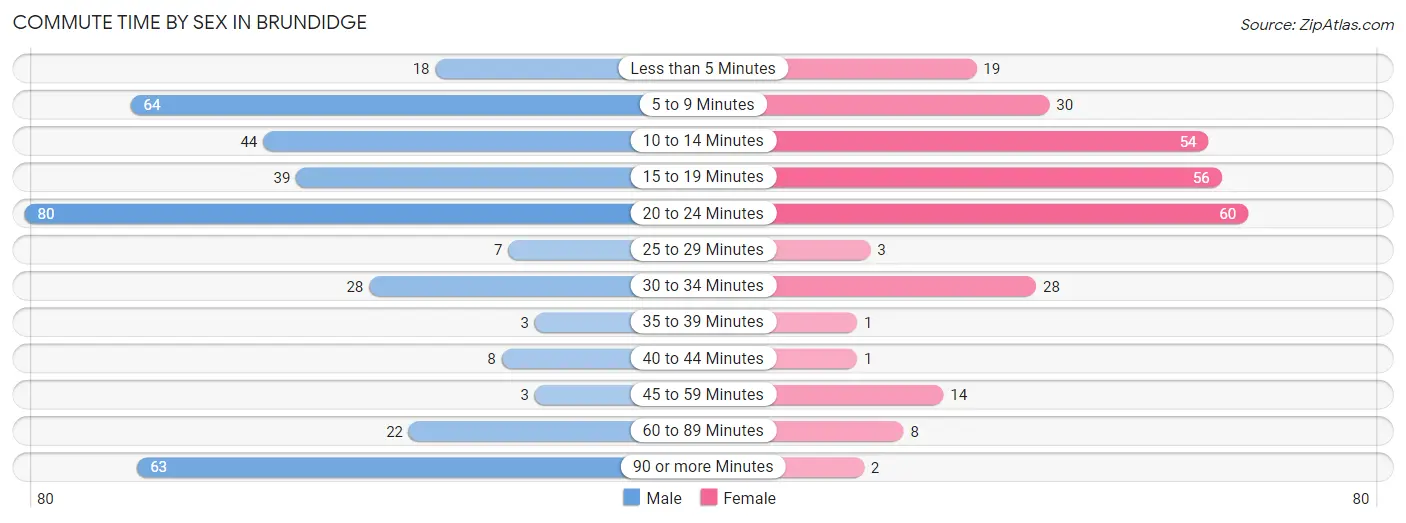
| Commute Time | Male | Female |
| Less than 5 Minutes | 18 (4.8%) | 19 (6.9%) |
| 5 to 9 Minutes | 64 (16.9%) | 30 (10.9%) |
| 10 to 14 Minutes | 44 (11.6%) | 54 (19.6%) |
| 15 to 19 Minutes | 39 (10.3%) | 56 (20.3%) |
| 20 to 24 Minutes | 80 (21.1%) | 60 (21.7%) |
| 25 to 29 Minutes | 7 (1.8%) | 3 (1.1%) |
| 30 to 34 Minutes | 28 (7.4%) | 28 (10.1%) |
| 35 to 39 Minutes | 3 (0.8%) | 1 (0.4%) |
| 40 to 44 Minutes | 8 (2.1%) | 1 (0.4%) |
| 45 to 59 Minutes | 3 (0.8%) | 14 (5.1%) |
| 60 to 89 Minutes | 22 (5.8%) | 8 (2.9%) |
| 90 or more Minutes | 63 (16.6%) | 2 (0.7%) |
Time of Departure to Work by Sex in Brundidge
The most frequent times of departure to work in Brundidge are 6:30 AM to 6:59 AM (86, 22.7%) for males and 7:30 AM to 7:59 AM (63, 22.8%) for females.
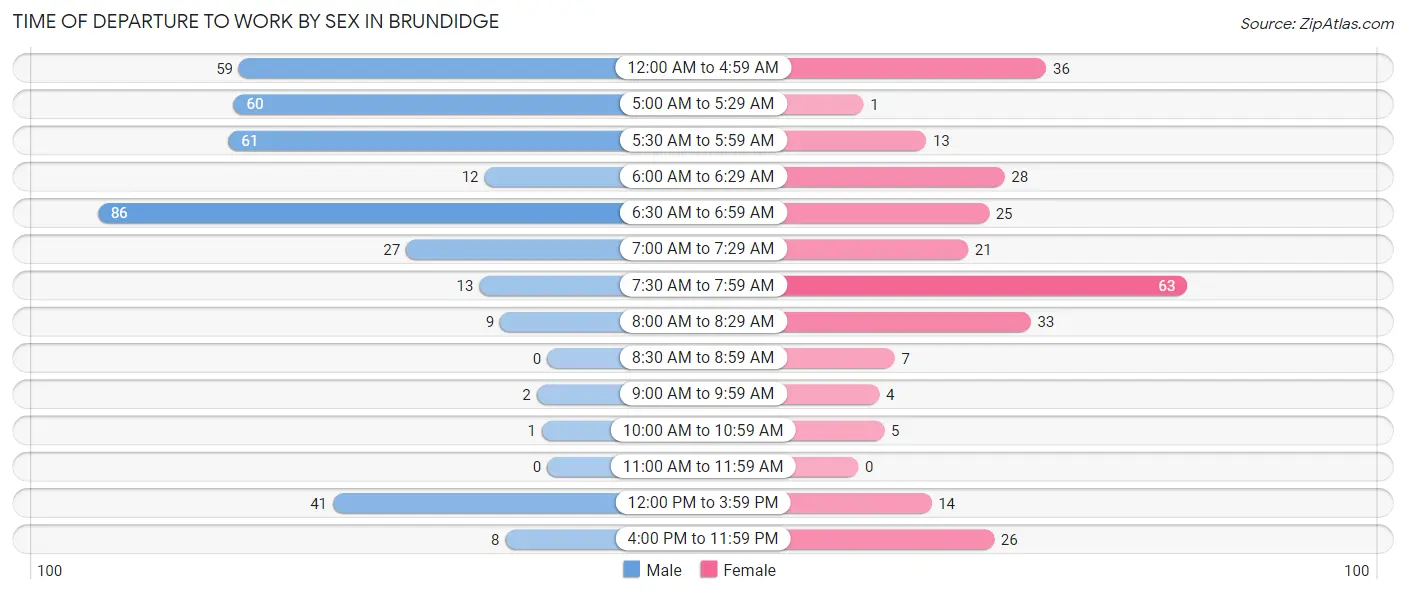
| Time of Departure | Male | Female |
| 12:00 AM to 4:59 AM | 59 (15.6%) | 36 (13.0%) |
| 5:00 AM to 5:29 AM | 60 (15.8%) | 1 (0.4%) |
| 5:30 AM to 5:59 AM | 61 (16.1%) | 13 (4.7%) |
| 6:00 AM to 6:29 AM | 12 (3.2%) | 28 (10.1%) |
| 6:30 AM to 6:59 AM | 86 (22.7%) | 25 (9.1%) |
| 7:00 AM to 7:29 AM | 27 (7.1%) | 21 (7.6%) |
| 7:30 AM to 7:59 AM | 13 (3.4%) | 63 (22.8%) |
| 8:00 AM to 8:29 AM | 9 (2.4%) | 33 (12.0%) |
| 8:30 AM to 8:59 AM | 0 (0.0%) | 7 (2.5%) |
| 9:00 AM to 9:59 AM | 2 (0.5%) | 4 (1.5%) |
| 10:00 AM to 10:59 AM | 1 (0.3%) | 5 (1.8%) |
| 11:00 AM to 11:59 AM | 0 (0.0%) | 0 (0.0%) |
| 12:00 PM to 3:59 PM | 41 (10.8%) | 14 (5.1%) |
| 4:00 PM to 11:59 PM | 8 (2.1%) | 26 (9.4%) |
| Total | 379 (100.0%) | 276 (100.0%) |
Housing Occupancy in Brundidge
Occupancy by Ownership in Brundidge
Of the total 992 dwellings in Brundidge, owner-occupied units account for 619 (62.4%), while renter-occupied units make up 373 (37.6%).
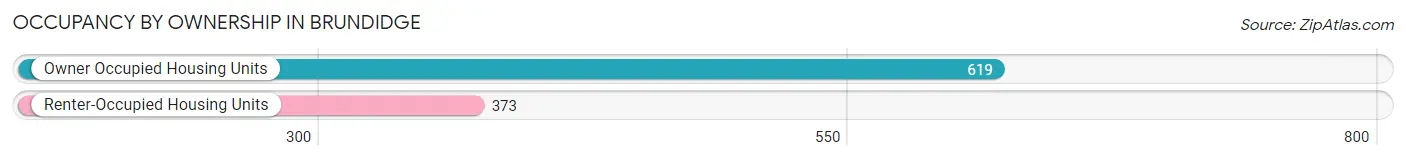
| Occupancy | # Housing Units | % Housing Units |
| Owner Occupied Housing Units | 619 | 62.4% |
| Renter-Occupied Housing Units | 373 | 37.6% |
| Total Occupied Housing Units | 992 | 100.0% |
Occupancy by Household Size in Brundidge
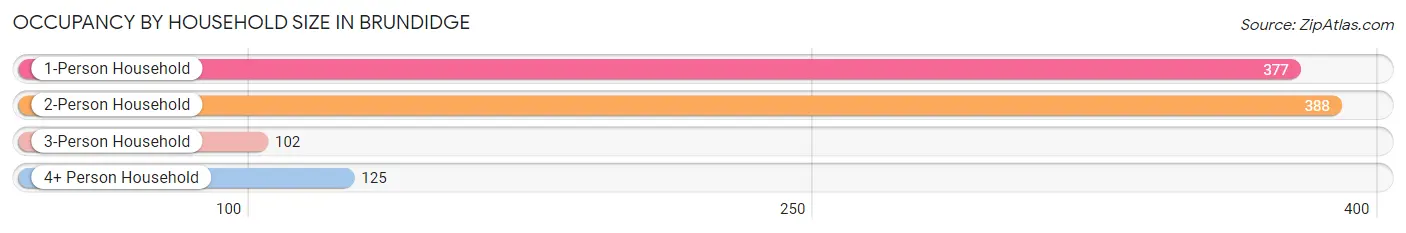
| Household Size | # Housing Units | % Housing Units |
| 1-Person Household | 377 | 38.0% |
| 2-Person Household | 388 | 39.1% |
| 3-Person Household | 102 | 10.3% |
| 4+ Person Household | 125 | 12.6% |
| Total Housing Units | 992 | 100.0% |
Occupancy by Ownership by Household Size in Brundidge
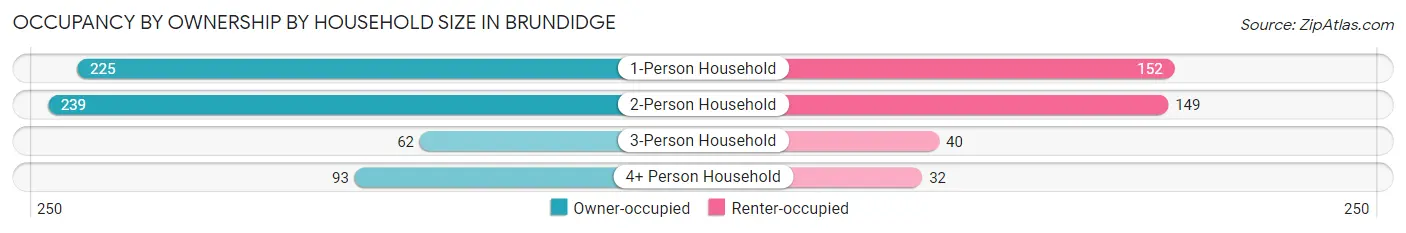
| Household Size | Owner-occupied | Renter-occupied |
| 1-Person Household | 225 (59.7%) | 152 (40.3%) |
| 2-Person Household | 239 (61.6%) | 149 (38.4%) |
| 3-Person Household | 62 (60.8%) | 40 (39.2%) |
| 4+ Person Household | 93 (74.4%) | 32 (25.6%) |
| Total Housing Units | 619 (62.4%) | 373 (37.6%) |
Occupancy by Educational Attainment in Brundidge
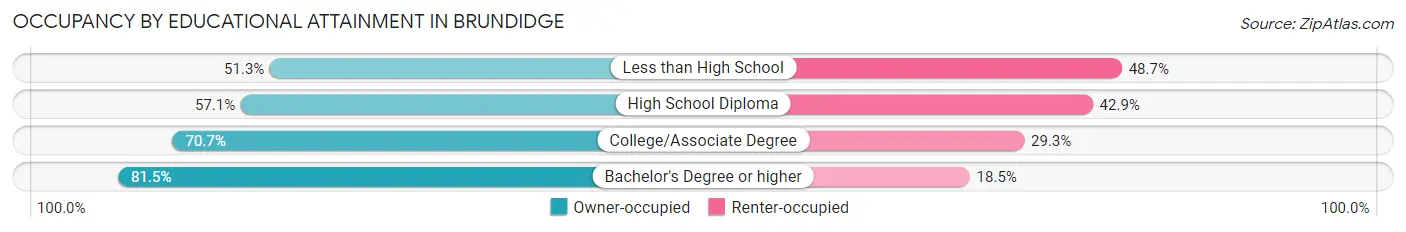
| Household Size | Owner-occupied | Renter-occupied |
| Less than High School | 98 (51.3%) | 93 (48.7%) |
| High School Diploma | 270 (57.1%) | 203 (42.9%) |
| College/Associate Degree | 106 (70.7%) | 44 (29.3%) |
| Bachelor's Degree or higher | 145 (81.5%) | 33 (18.5%) |
Occupancy by Age of Householder in Brundidge
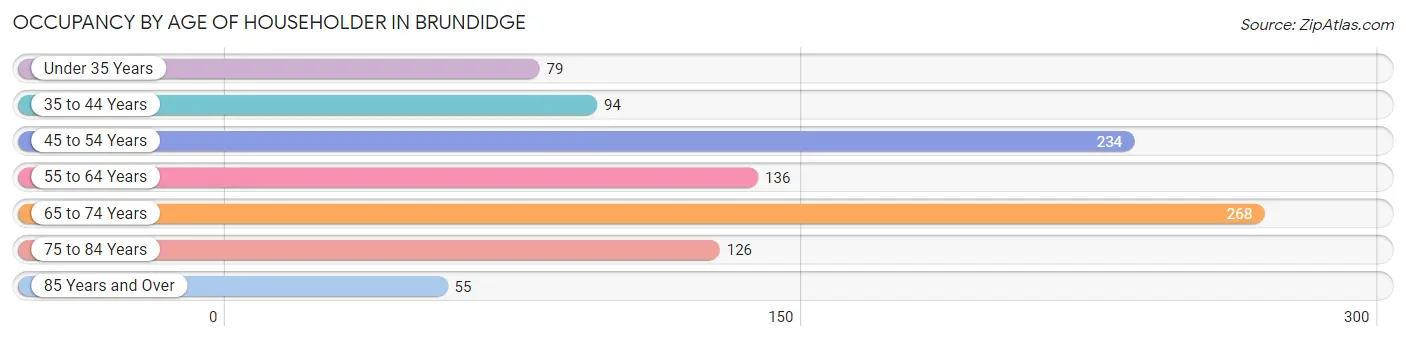
| Age Bracket | # Households | % Households |
| Under 35 Years | 79 | 8.0% |
| 35 to 44 Years | 94 | 9.5% |
| 45 to 54 Years | 234 | 23.6% |
| 55 to 64 Years | 136 | 13.7% |
| 65 to 74 Years | 268 | 27.0% |
| 75 to 84 Years | 126 | 12.7% |
| 85 Years and Over | 55 | 5.5% |
| Total | 992 | 100.0% |
Housing Finances in Brundidge
Median Income by Occupancy in Brundidge
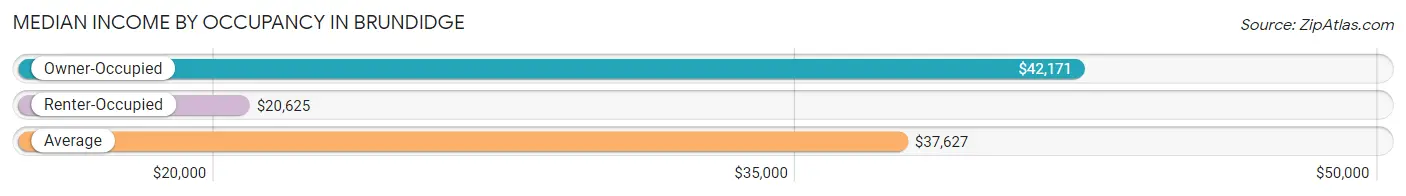
| Occupancy Type | # Households | Median Income |
| Owner-Occupied | 619 (62.4%) | $42,171 |
| Renter-Occupied | 373 (37.6%) | $20,625 |
| Average | 992 (100.0%) | $37,627 |
Occupancy by Householder Income Bracket in Brundidge
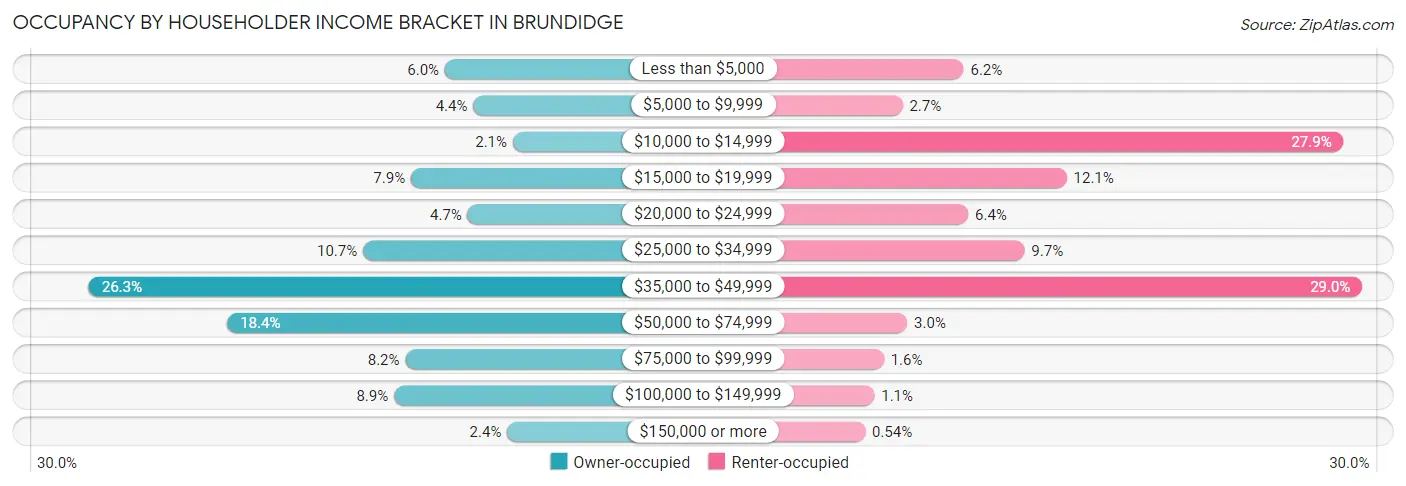
| Income Bracket | Owner-occupied | Renter-occupied |
| Less than $5,000 | 37 (6.0%) | 23 (6.2%) |
| $5,000 to $9,999 | 27 (4.4%) | 10 (2.7%) |
| $10,000 to $14,999 | 13 (2.1%) | 104 (27.9%) |
| $15,000 to $19,999 | 49 (7.9%) | 45 (12.1%) |
| $20,000 to $24,999 | 29 (4.7%) | 24 (6.4%) |
| $25,000 to $34,999 | 66 (10.7%) | 36 (9.7%) |
| $35,000 to $49,999 | 163 (26.3%) | 108 (28.9%) |
| $50,000 to $74,999 | 114 (18.4%) | 11 (2.9%) |
| $75,000 to $99,999 | 51 (8.2%) | 6 (1.6%) |
| $100,000 to $149,999 | 55 (8.9%) | 4 (1.1%) |
| $150,000 or more | 15 (2.4%) | 2 (0.5%) |
| Total | 619 (100.0%) | 373 (100.0%) |
Monthly Housing Cost Tiers in Brundidge
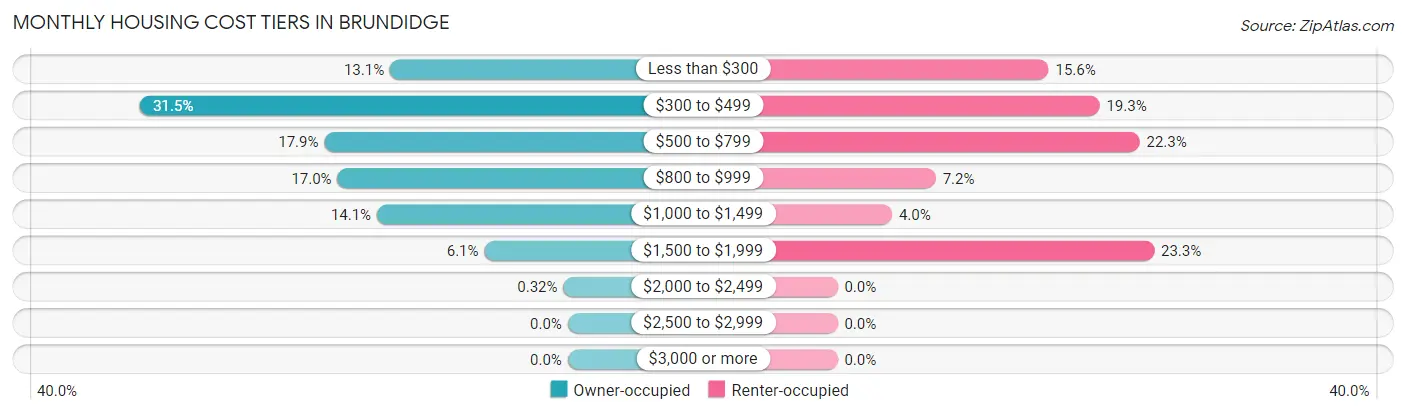
| Monthly Cost | Owner-occupied | Renter-occupied |
| Less than $300 | 81 (13.1%) | 58 (15.5%) |
| $300 to $499 | 195 (31.5%) | 72 (19.3%) |
| $500 to $799 | 111 (17.9%) | 83 (22.3%) |
| $800 to $999 | 105 (17.0%) | 27 (7.2%) |
| $1,000 to $1,499 | 87 (14.1%) | 15 (4.0%) |
| $1,500 to $1,999 | 38 (6.1%) | 87 (23.3%) |
| $2,000 to $2,499 | 2 (0.3%) | 0 (0.0%) |
| $2,500 to $2,999 | 0 (0.0%) | 0 (0.0%) |
| $3,000 or more | 0 (0.0%) | 0 (0.0%) |
| Total | 619 (100.0%) | 373 (100.0%) |
Physical Housing Characteristics in Brundidge
Housing Structures in Brundidge
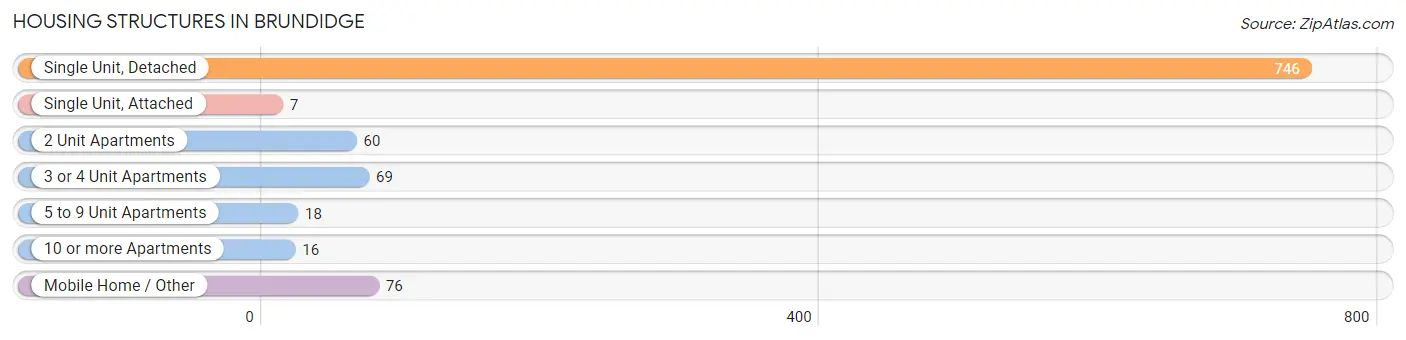
| Structure Type | # Housing Units | % Housing Units |
| Single Unit, Detached | 746 | 75.2% |
| Single Unit, Attached | 7 | 0.7% |
| 2 Unit Apartments | 60 | 6.0% |
| 3 or 4 Unit Apartments | 69 | 7.0% |
| 5 to 9 Unit Apartments | 18 | 1.8% |
| 10 or more Apartments | 16 | 1.6% |
| Mobile Home / Other | 76 | 7.7% |
| Total | 992 | 100.0% |
Housing Structures by Occupancy in Brundidge
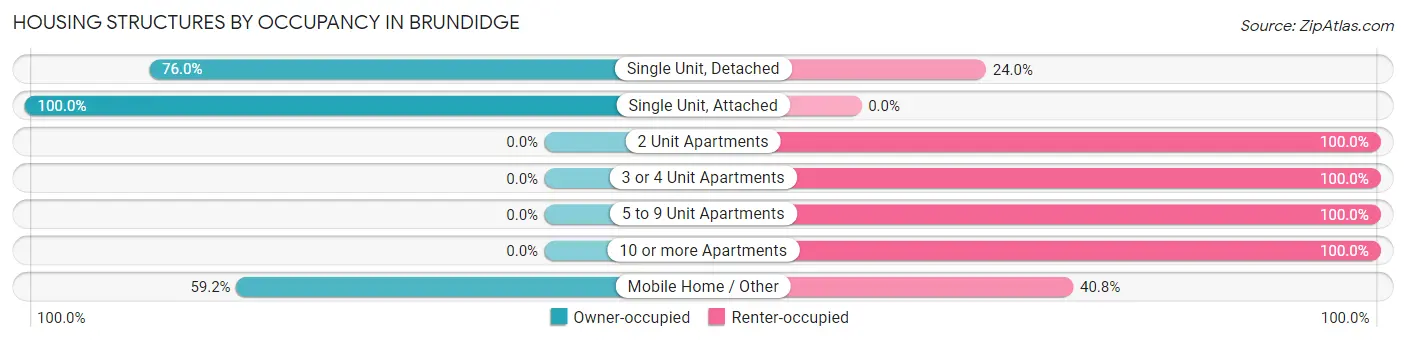
| Structure Type | Owner-occupied | Renter-occupied |
| Single Unit, Detached | 567 (76.0%) | 179 (24.0%) |
| Single Unit, Attached | 7 (100.0%) | 0 (0.0%) |
| 2 Unit Apartments | 0 (0.0%) | 60 (100.0%) |
| 3 or 4 Unit Apartments | 0 (0.0%) | 69 (100.0%) |
| 5 to 9 Unit Apartments | 0 (0.0%) | 18 (100.0%) |
| 10 or more Apartments | 0 (0.0%) | 16 (100.0%) |
| Mobile Home / Other | 45 (59.2%) | 31 (40.8%) |
| Total | 619 (62.4%) | 373 (37.6%) |
Housing Structures by Number of Rooms in Brundidge
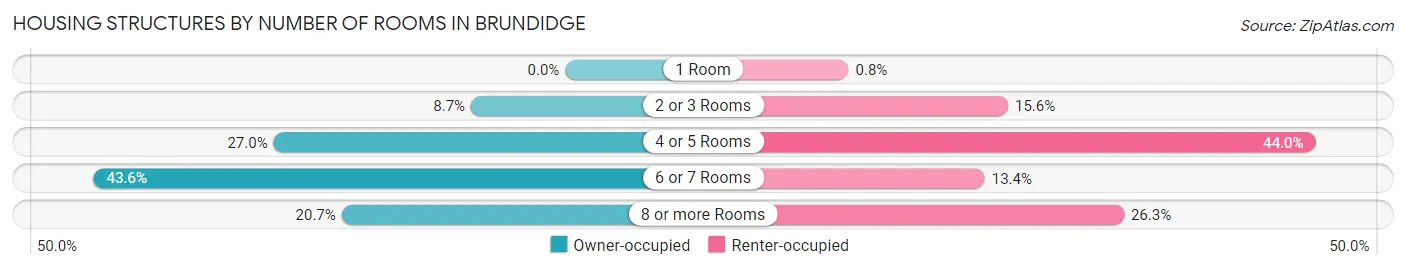
| Number of Rooms | Owner-occupied | Renter-occupied |
| 1 Room | 0 (0.0%) | 3 (0.8%) |
| 2 or 3 Rooms | 54 (8.7%) | 58 (15.5%) |
| 4 or 5 Rooms | 167 (27.0%) | 164 (44.0%) |
| 6 or 7 Rooms | 270 (43.6%) | 50 (13.4%) |
| 8 or more Rooms | 128 (20.7%) | 98 (26.3%) |
| Total | 619 (100.0%) | 373 (100.0%) |
Housing Structure by Heating Type in Brundidge
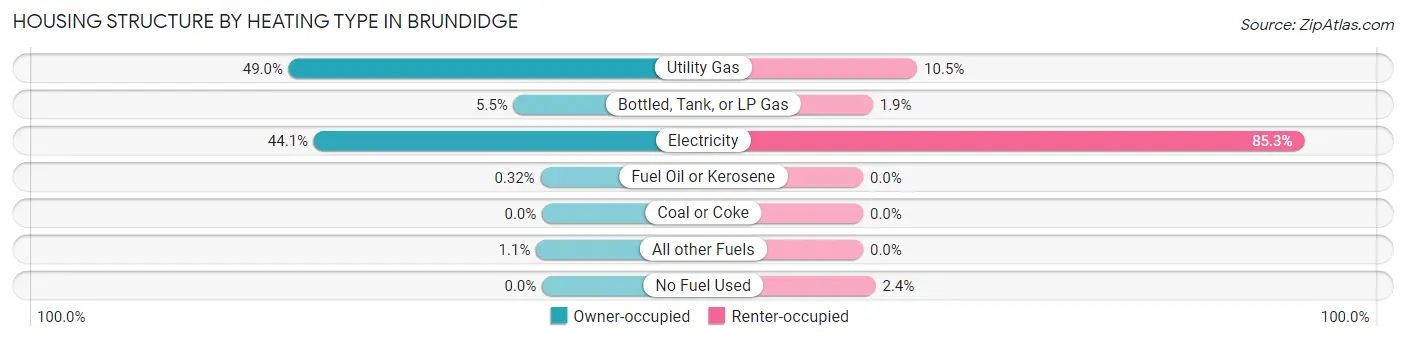
| Heating Type | Owner-occupied | Renter-occupied |
| Utility Gas | 303 (48.9%) | 39 (10.5%) |
| Bottled, Tank, or LP Gas | 34 (5.5%) | 7 (1.9%) |
| Electricity | 273 (44.1%) | 318 (85.3%) |
| Fuel Oil or Kerosene | 2 (0.3%) | 0 (0.0%) |
| Coal or Coke | 0 (0.0%) | 0 (0.0%) |
| All other Fuels | 7 (1.1%) | 0 (0.0%) |
| No Fuel Used | 0 (0.0%) | 9 (2.4%) |
| Total | 619 (100.0%) | 373 (100.0%) |
Household Vehicle Usage in Brundidge
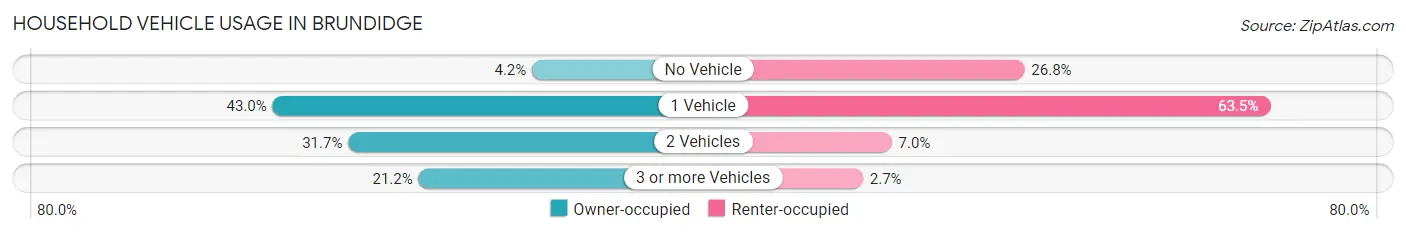
| Vehicles per Household | Owner-occupied | Renter-occupied |
| No Vehicle | 26 (4.2%) | 100 (26.8%) |
| 1 Vehicle | 266 (43.0%) | 237 (63.5%) |
| 2 Vehicles | 196 (31.7%) | 26 (7.0%) |
| 3 or more Vehicles | 131 (21.2%) | 10 (2.7%) |
| Total | 619 (100.0%) | 373 (100.0%) |
Real Estate & Mortgages in Brundidge
Real Estate and Mortgage Overview in Brundidge
| Characteristic | Without Mortgage | With Mortgage |
| Housing Units | 386 | 233 |
| Median Property Value | $66,100 | $94,000 |
| Median Household Income | $39,674 | $7 |
| Monthly Housing Costs | $346 | $0 |
| Real Estate Taxes | $247 | $61 |
Property Value by Mortgage Status in Brundidge
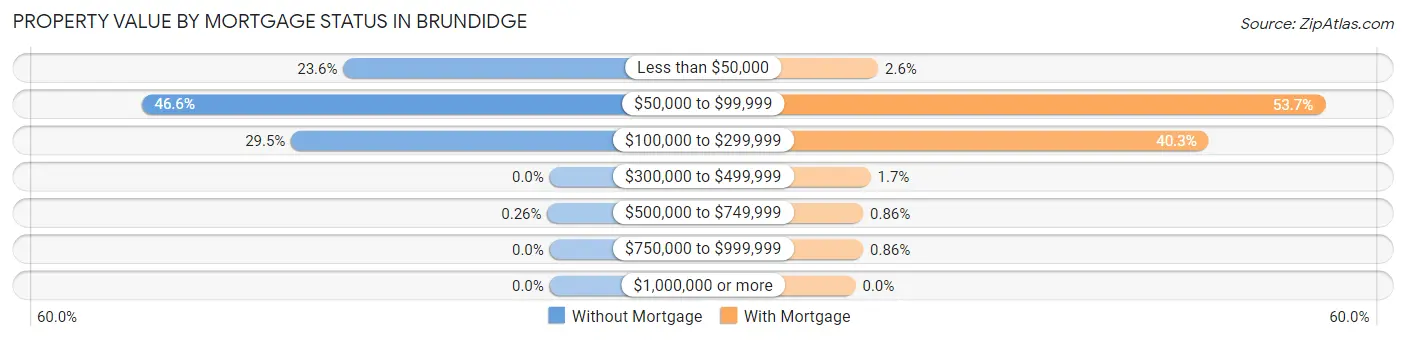
| Property Value | Without Mortgage | With Mortgage |
| Less than $50,000 | 91 (23.6%) | 6 (2.6%) |
| $50,000 to $99,999 | 180 (46.6%) | 125 (53.6%) |
| $100,000 to $299,999 | 114 (29.5%) | 94 (40.3%) |
| $300,000 to $499,999 | 0 (0.0%) | 4 (1.7%) |
| $500,000 to $749,999 | 1 (0.3%) | 2 (0.9%) |
| $750,000 to $999,999 | 0 (0.0%) | 2 (0.9%) |
| $1,000,000 or more | 0 (0.0%) | 0 (0.0%) |
| Total | 386 (100.0%) | 233 (100.0%) |
Household Income by Mortgage Status in Brundidge
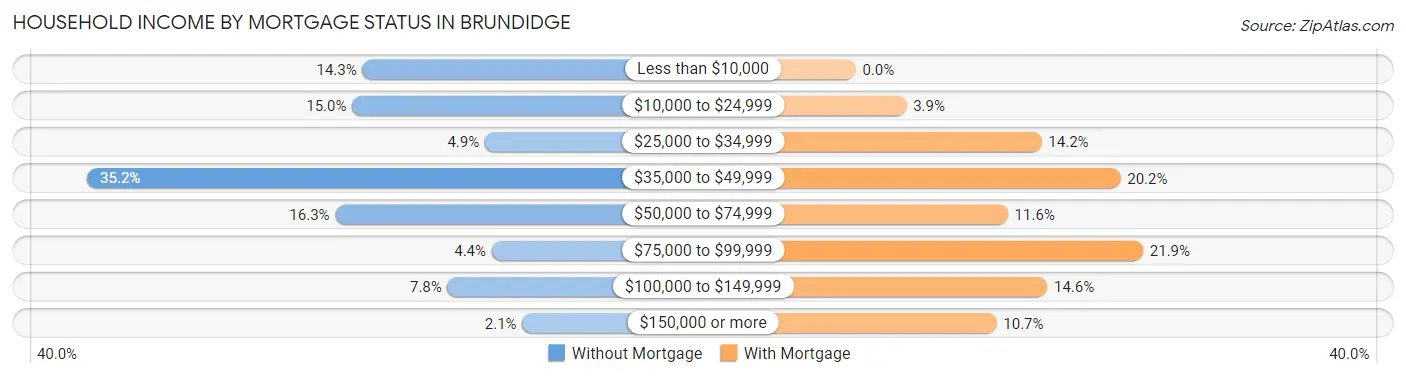
| Household Income | Without Mortgage | With Mortgage |
| Less than $10,000 | 55 (14.2%) | 0 (0.0%) |
| $10,000 to $24,999 | 58 (15.0%) | 9 (3.9%) |
| $25,000 to $34,999 | 19 (4.9%) | 33 (14.2%) |
| $35,000 to $49,999 | 136 (35.2%) | 47 (20.2%) |
| $50,000 to $74,999 | 63 (16.3%) | 27 (11.6%) |
| $75,000 to $99,999 | 17 (4.4%) | 51 (21.9%) |
| $100,000 to $149,999 | 30 (7.8%) | 34 (14.6%) |
| $150,000 or more | 8 (2.1%) | 25 (10.7%) |
| Total | 386 (100.0%) | 233 (100.0%) |
Property Value to Household Income Ratio in Brundidge
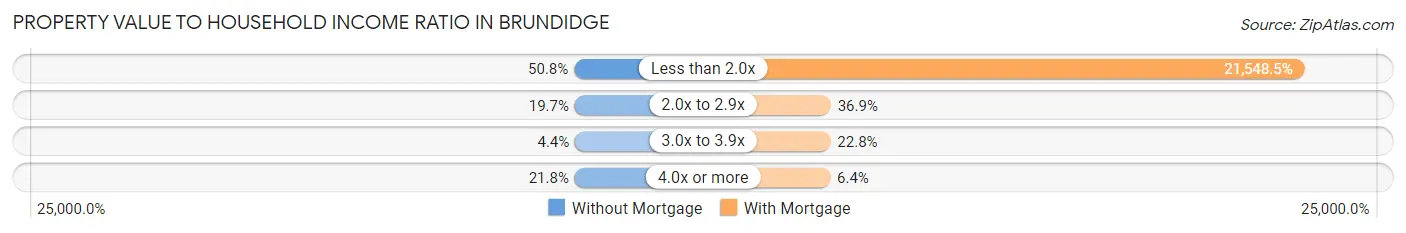
| Value-to-Income Ratio | Without Mortgage | With Mortgage |
| Less than 2.0x | 196 (50.8%) | 50,208 (21,548.5%) |
| 2.0x to 2.9x | 76 (19.7%) | 86 (36.9%) |
| 3.0x to 3.9x | 17 (4.4%) | 53 (22.8%) |
| 4.0x or more | 84 (21.8%) | 15 (6.4%) |
| Total | 386 (100.0%) | 233 (100.0%) |
Real Estate Taxes by Mortgage Status in Brundidge
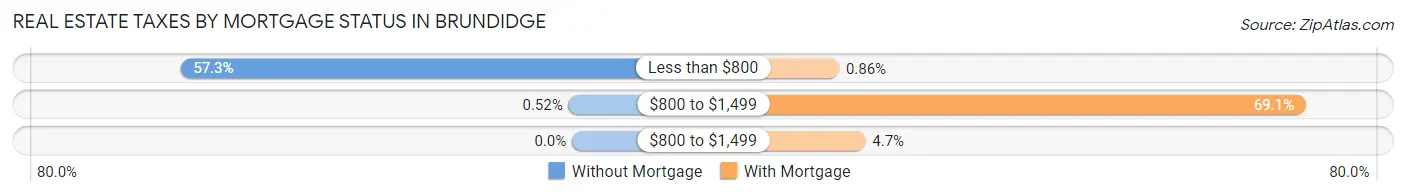
| Property Taxes | Without Mortgage | With Mortgage |
| Less than $800 | 221 (57.3%) | 2 (0.9%) |
| $800 to $1,499 | 2 (0.5%) | 161 (69.1%) |
| $800 to $1,499 | 0 (0.0%) | 11 (4.7%) |
| Total | 386 (100.0%) | 233 (100.0%) |
Health & Disability in Brundidge
Health Insurance Coverage by Age in Brundidge
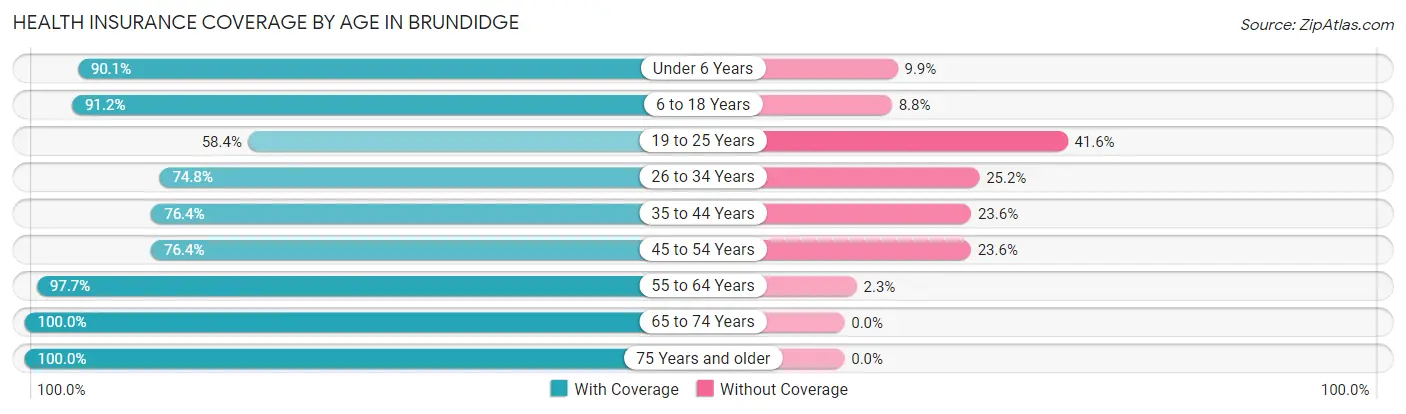
| Age Bracket | With Coverage | Without Coverage |
| Under 6 Years | 127 (90.1%) | 14 (9.9%) |
| 6 to 18 Years | 299 (91.2%) | 29 (8.8%) |
| 19 to 25 Years | 80 (58.4%) | 57 (41.6%) |
| 26 to 34 Years | 116 (74.8%) | 39 (25.2%) |
| 35 to 44 Years | 181 (76.4%) | 56 (23.6%) |
| 45 to 54 Years | 337 (76.4%) | 104 (23.6%) |
| 55 to 64 Years | 256 (97.7%) | 6 (2.3%) |
| 65 to 74 Years | 371 (100.0%) | 0 (0.0%) |
| 75 Years and older | 237 (100.0%) | 0 (0.0%) |
| Total | 2,004 (86.8%) | 305 (13.2%) |
Health Insurance Coverage by Citizenship Status in Brundidge
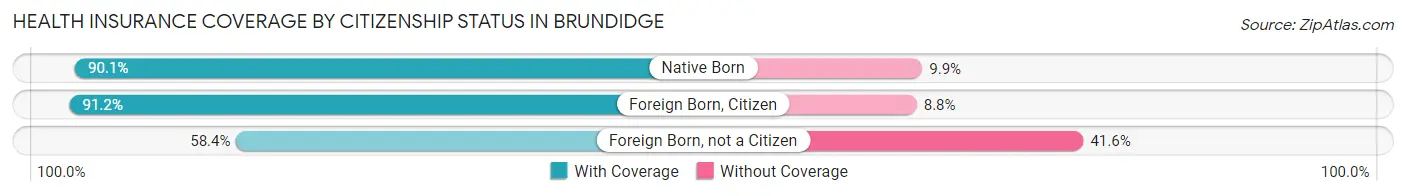
| Citizenship Status | With Coverage | Without Coverage |
| Native Born | 127 (90.1%) | 14 (9.9%) |
| Foreign Born, Citizen | 299 (91.2%) | 29 (8.8%) |
| Foreign Born, not a Citizen | 80 (58.4%) | 57 (41.6%) |
Health Insurance Coverage by Household Income in Brundidge
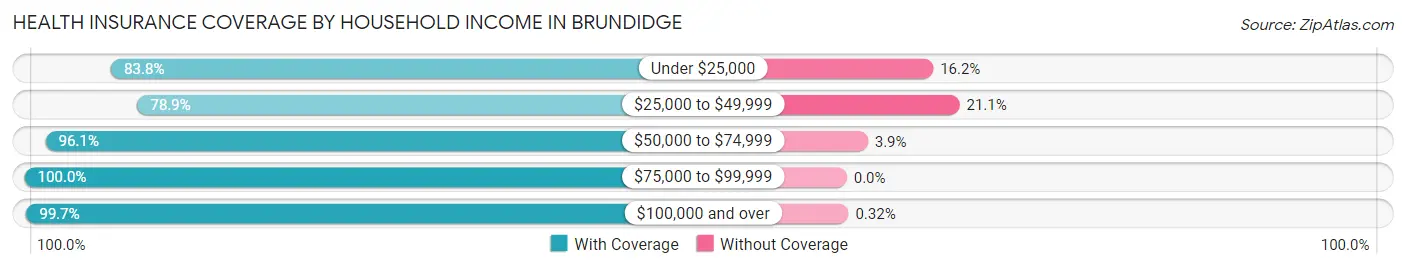
| Household Income | With Coverage | Without Coverage |
| Under $25,000 | 502 (83.8%) | 97 (16.2%) |
| $25,000 to $49,999 | 724 (78.9%) | 194 (21.1%) |
| $50,000 to $74,999 | 318 (96.1%) | 13 (3.9%) |
| $75,000 to $99,999 | 144 (100.0%) | 0 (0.0%) |
| $100,000 and over | 316 (99.7%) | 1 (0.3%) |
Public vs Private Health Insurance Coverage by Age in Brundidge
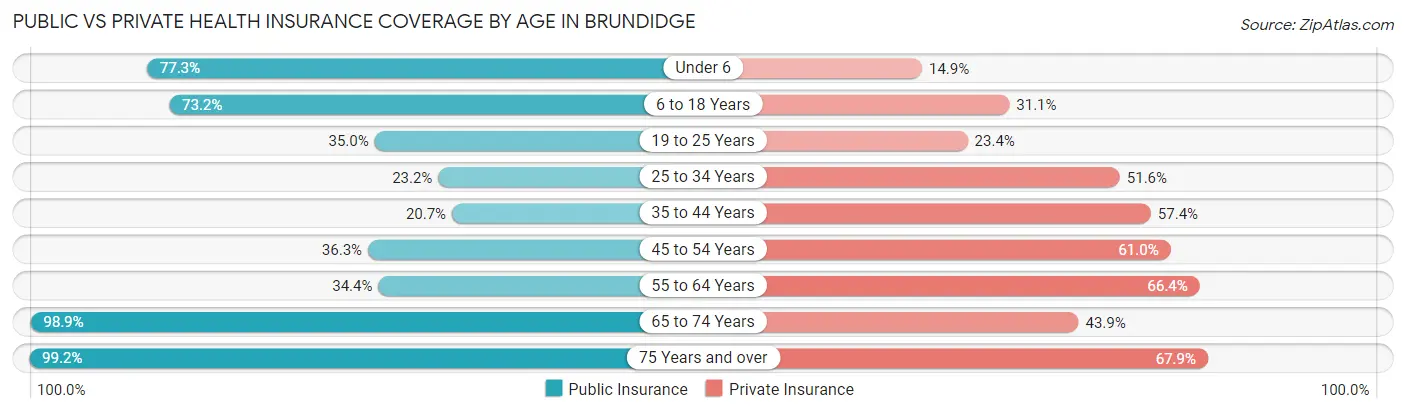
| Age Bracket | Public Insurance | Private Insurance |
| Under 6 | 109 (77.3%) | 21 (14.9%) |
| 6 to 18 Years | 240 (73.2%) | 102 (31.1%) |
| 19 to 25 Years | 48 (35.0%) | 32 (23.4%) |
| 25 to 34 Years | 36 (23.2%) | 80 (51.6%) |
| 35 to 44 Years | 49 (20.7%) | 136 (57.4%) |
| 45 to 54 Years | 160 (36.3%) | 269 (61.0%) |
| 55 to 64 Years | 90 (34.4%) | 174 (66.4%) |
| 65 to 74 Years | 367 (98.9%) | 163 (43.9%) |
| 75 Years and over | 235 (99.2%) | 161 (67.9%) |
| Total | 1,334 (57.8%) | 1,138 (49.3%) |
Disability Status by Sex by Age in Brundidge
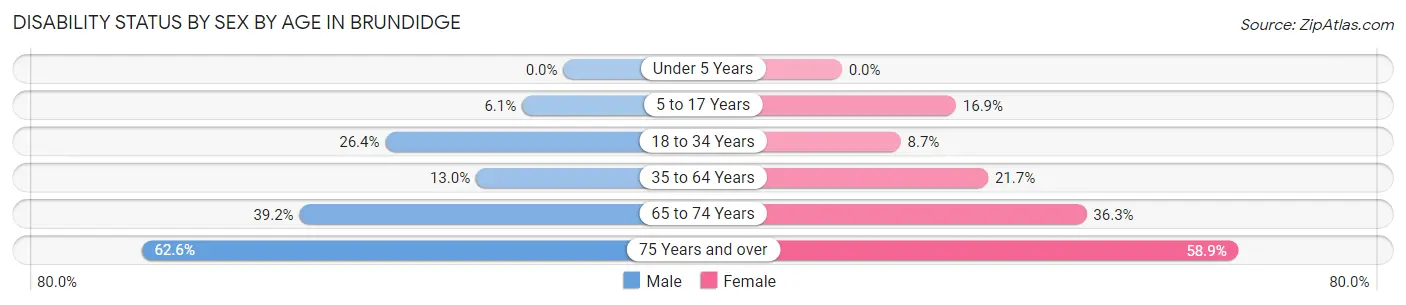
| Age Bracket | Male | Female |
| Under 5 Years | 0 (0.0%) | 0 (0.0%) |
| 5 to 17 Years | 13 (6.1%) | 21 (16.9%) |
| 18 to 34 Years | 46 (26.4%) | 11 (8.7%) |
| 35 to 64 Years | 55 (13.0%) | 112 (21.7%) |
| 65 to 74 Years | 58 (39.2%) | 81 (36.3%) |
| 75 Years and over | 57 (62.6%) | 86 (58.9%) |
Disability Class by Sex by Age in Brundidge
Disability Class: Hearing Difficulty
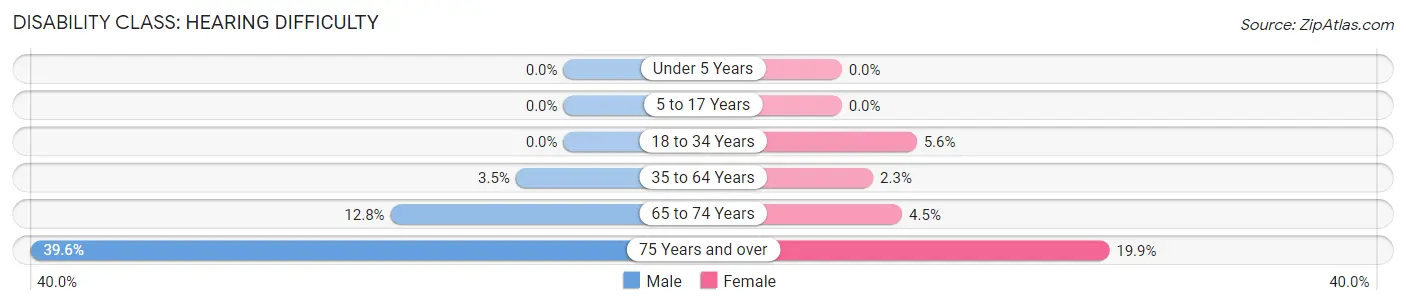
| Age Bracket | Male | Female |
| Under 5 Years | 0 (0.0%) | 0 (0.0%) |
| 5 to 17 Years | 0 (0.0%) | 0 (0.0%) |
| 18 to 34 Years | 0 (0.0%) | 7 (5.6%) |
| 35 to 64 Years | 15 (3.5%) | 12 (2.3%) |
| 65 to 74 Years | 19 (12.8%) | 10 (4.5%) |
| 75 Years and over | 36 (39.6%) | 29 (19.9%) |
Disability Class: Vision Difficulty
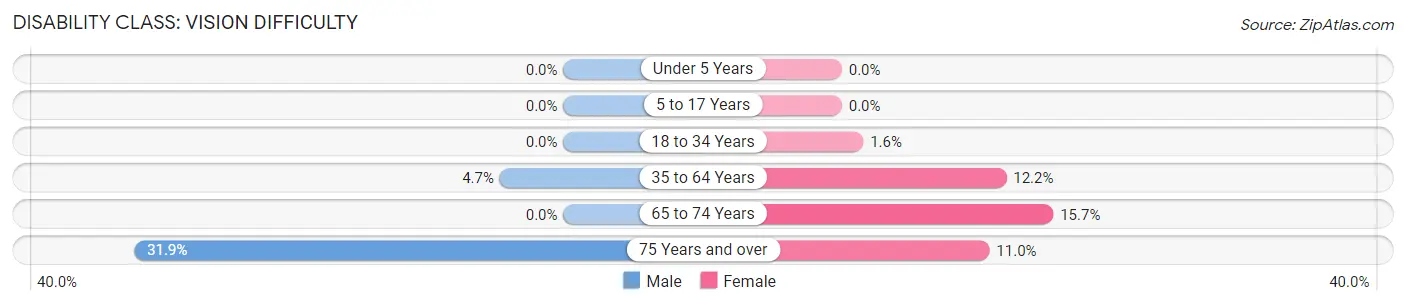
| Age Bracket | Male | Female |
| Under 5 Years | 0 (0.0%) | 0 (0.0%) |
| 5 to 17 Years | 0 (0.0%) | 0 (0.0%) |
| 18 to 34 Years | 0 (0.0%) | 2 (1.6%) |
| 35 to 64 Years | 20 (4.7%) | 63 (12.2%) |
| 65 to 74 Years | 0 (0.0%) | 35 (15.7%) |
| 75 Years and over | 29 (31.9%) | 16 (11.0%) |
Disability Class: Cognitive Difficulty
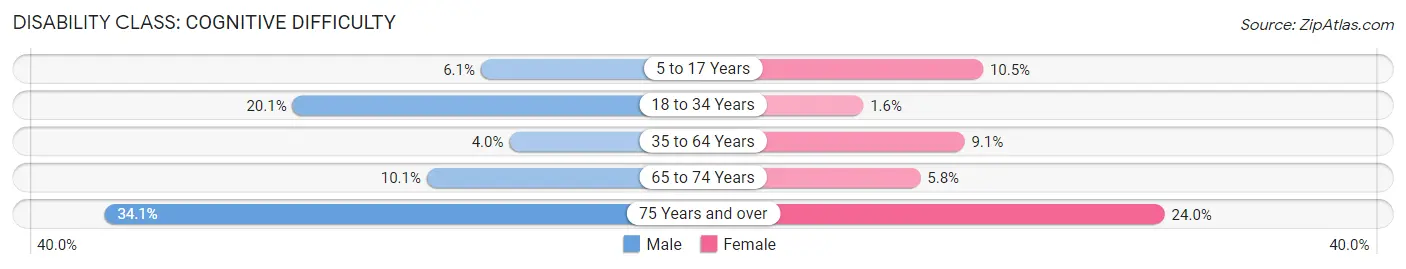
| Age Bracket | Male | Female |
| 5 to 17 Years | 13 (6.1%) | 13 (10.5%) |
| 18 to 34 Years | 35 (20.1%) | 2 (1.6%) |
| 35 to 64 Years | 17 (4.0%) | 47 (9.1%) |
| 65 to 74 Years | 15 (10.1%) | 13 (5.8%) |
| 75 Years and over | 31 (34.1%) | 35 (24.0%) |
Disability Class: Ambulatory Difficulty
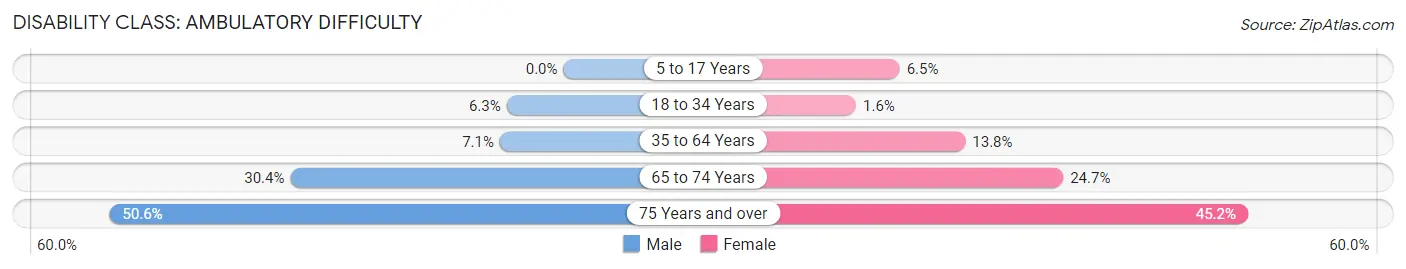
| Age Bracket | Male | Female |
| 5 to 17 Years | 0 (0.0%) | 8 (6.5%) |
| 18 to 34 Years | 11 (6.3%) | 2 (1.6%) |
| 35 to 64 Years | 30 (7.1%) | 71 (13.8%) |
| 65 to 74 Years | 45 (30.4%) | 55 (24.7%) |
| 75 Years and over | 46 (50.5%) | 66 (45.2%) |
Disability Class: Self-Care Difficulty
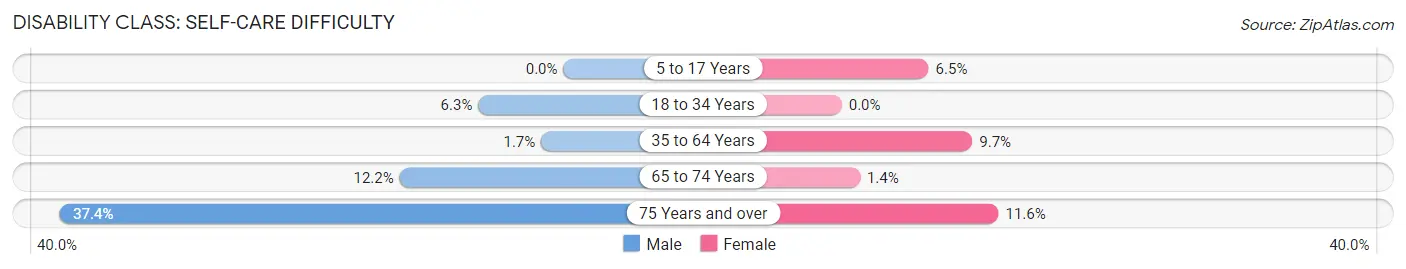
| Age Bracket | Male | Female |
| 5 to 17 Years | 0 (0.0%) | 8 (6.5%) |
| 18 to 34 Years | 11 (6.3%) | 0 (0.0%) |
| 35 to 64 Years | 7 (1.7%) | 50 (9.7%) |
| 65 to 74 Years | 18 (12.2%) | 3 (1.3%) |
| 75 Years and over | 34 (37.4%) | 17 (11.6%) |
Technology Access in Brundidge
Computing Device Access in Brundidge
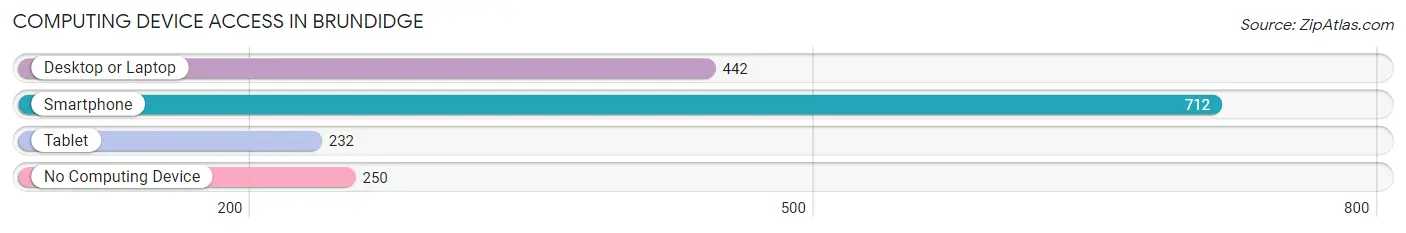
| Device Type | # Households | % Households |
| Desktop or Laptop | 442 | 44.6% |
| Smartphone | 712 | 71.8% |
| Tablet | 232 | 23.4% |
| No Computing Device | 250 | 25.2% |
| Total | 992 | 100.0% |
Internet Access in Brundidge
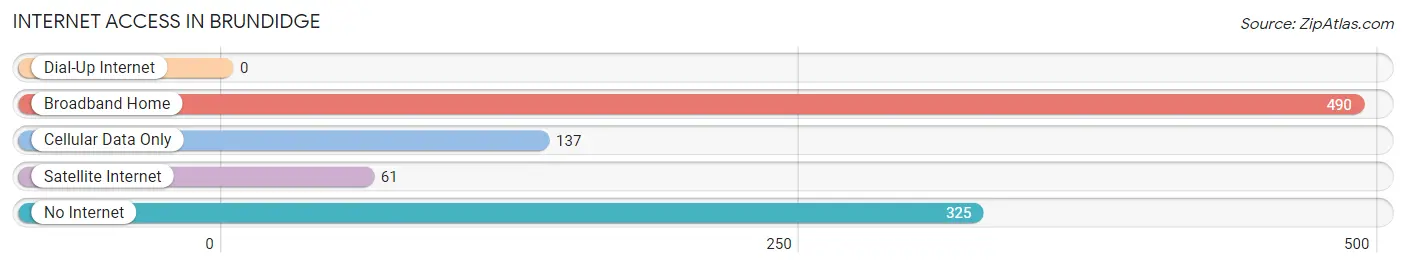
| Internet Type | # Households | % Households |
| Dial-Up Internet | 0 | 0.0% |
| Broadband Home | 490 | 49.4% |
| Cellular Data Only | 137 | 13.8% |
| Satellite Internet | 61 | 6.1% |
| No Internet | 325 | 32.8% |
| Total | 992 | 100.0% |
Brundidge Summary
Brundidge, Alabama is a small town located in Pike County, Alabama. It is situated in the southeastern part of the state, about halfway between Montgomery and Dothan. The town was founded in 1854 and has a population of 1,845 as of the 2010 census.
Brundidge is located in the heart of the Wiregrass Region of Alabama, which is known for its rich agricultural heritage. The town is situated on the banks of the Pea River, which is a tributary of the Choctawhatchee River. The area is known for its rolling hills, pine forests, and abundant wildlife.
The economy of Brundidge is largely based on agriculture. The town is home to several large farms, including the Brundidge Peanut Company, which is one of the largest peanut producers in the state. Other agricultural products grown in the area include cotton, corn, soybeans, and hay. The town is also home to several small businesses, including a few restaurants, a grocery store, and a few retail stores.
The demographics of Brundidge are largely reflective of the state of Alabama as a whole. The population is predominantly white, with African Americans making up about 25% of the population. The median household income is $31,000, which is slightly lower than the state average. The poverty rate is also slightly higher than the state average, at 22.3%.
Brundidge is served by the Pike County School District, which includes two elementary schools, one middle school, and one high school. The town is also home to Troy University's Brundidge Campus, which offers a variety of degree programs.
Brundidge is a small town with a rich history and a bright future. The town is home to a diverse population and a thriving economy. With its close proximity to larger cities and its abundance of natural resources, Brundidge is an ideal place to live and work.
Common Questions
What is Per Capita Income in Brundidge?
Per Capita income in Brundidge is $19,329.
What is the Median Family Income in Brundidge?
Median Family Income in Brundidge is $43,140.
What is the Median Household income in Brundidge?
Median Household Income in Brundidge is $37,627.
What is Income or Wage Gap in Brundidge?
Income or Wage Gap in Brundidge is 25.6%.
Women in Brundidge earn 74.4 cents for every dollar earned by a man.
What is Inequality or Gini Index in Brundidge?
Inequality or Gini Index in Brundidge is 0.44.
What is the Total Population of Brundidge?
Total Population of Brundidge is 2,309.
What is the Total Male Population of Brundidge?
Total Male Population of Brundidge is 1,117.
What is the Total Female Population of Brundidge?
Total Female Population of Brundidge is 1,192.
What is the Ratio of Males per 100 Females in Brundidge?
There are 93.71 Males per 100 Females in Brundidge.
What is the Ratio of Females per 100 Males in Brundidge?
There are 106.71 Females per 100 Males in Brundidge.
What is the Median Population Age in Brundidge?
Median Population Age in Brundidge is 49.9 Years.
What is the Average Family Size in Brundidge
Average Family Size in Brundidge is 3.0 People.
What is the Average Household Size in Brundidge
Average Household Size in Brundidge is 2.3 People.
How Large is the Labor Force in Brundidge?
There are 779 People in the Labor Forcein in Brundidge.
What is the Percentage of People in the Labor Force in Brundidge?
40.4% of People are in the Labor Force in Brundidge.
What is the Unemployment Rate in Brundidge?
Unemployment Rate in Brundidge is 10.1%.