Brighton, AL Map & Demographics
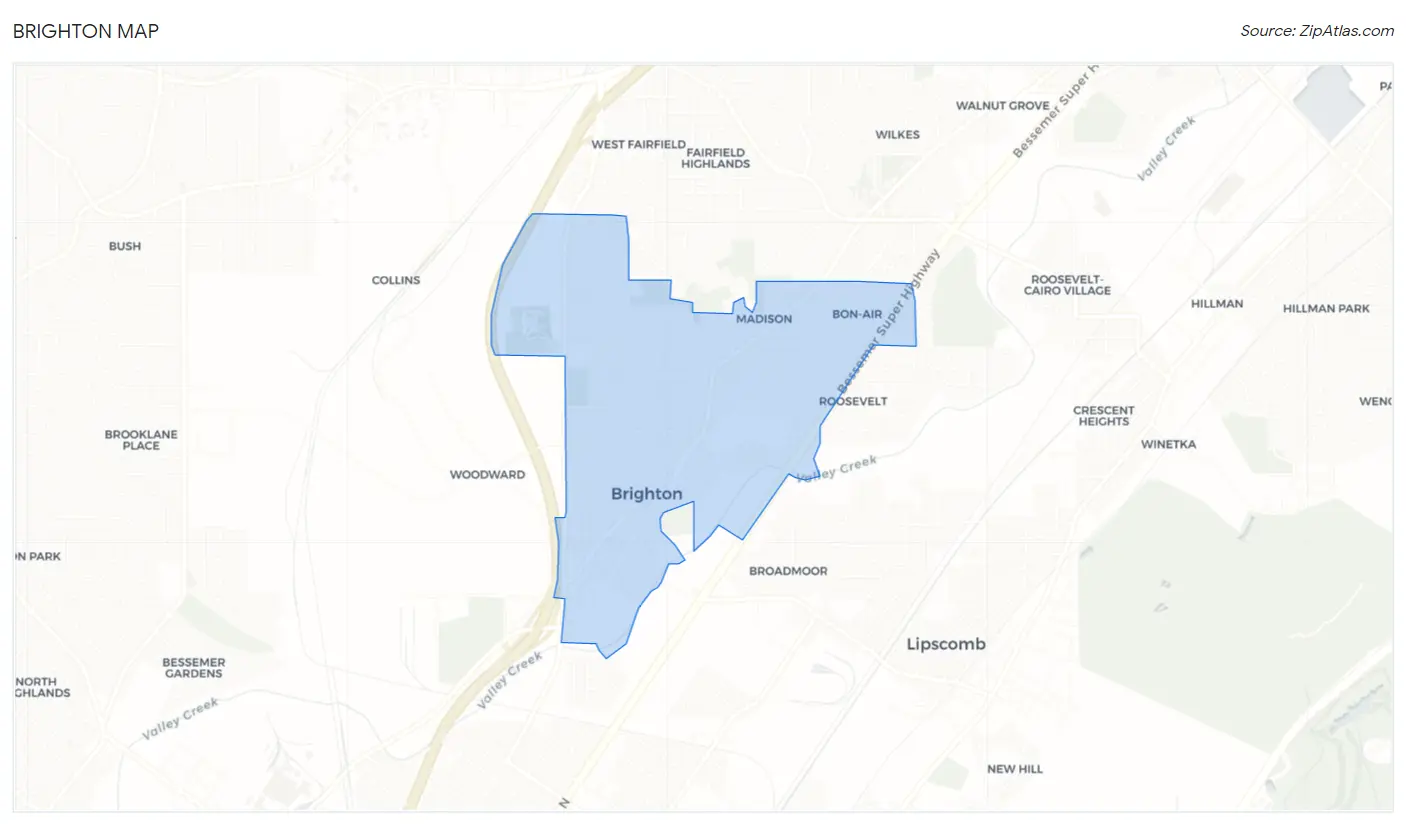
Brighton Map
Brighton Overview
$20,222
PER CAPITA INCOME
$58,264
AVG FAMILY INCOME
$34,471
AVG HOUSEHOLD INCOME
14.2%
WAGE / INCOME GAP [ % ]
85.8¢/ $1
WAGE / INCOME GAP [ $ ]
0.44
INEQUALITY / GINI INDEX
2,983
TOTAL POPULATION
1,390
MALE POPULATION
1,593
FEMALE POPULATION
87.26
MALES / 100 FEMALES
114.60
FEMALES / 100 MALES
43.9
MEDIAN AGE
3.4
AVG FAMILY SIZE
2.5
AVG HOUSEHOLD SIZE
1,259
LABOR FORCE [ PEOPLE ]
56.3%
PERCENT IN LABOR FORCE
12.4%
UNEMPLOYMENT RATE
Brighton Area Codes
Income in Brighton
Income Overview in Brighton
Per Capita Income in Brighton is $20,222, while median incomes of families and households are $58,264 and $34,471 respectively.
| Characteristic | Number | Measure |
| Per Capita Income | 2,983 | $20,222 |
| Median Family Income | 697 | $58,264 |
| Mean Family Income | 697 | $58,985 |
| Median Household Income | 1,197 | $34,471 |
| Mean Household Income | 1,197 | $47,325 |
| Income Deficit | 697 | $0 |
| Wage / Income Gap (%) | 2,983 | 14.24% |
| Wage / Income Gap ($) | 2,983 | 85.76¢ per $1 |
| Gini / Inequality Index | 2,983 | 0.44 |
Earnings by Sex in Brighton
Average Earnings in Brighton are $31,536, $28,250 for men and $32,940 for women, a difference of 14.2%.
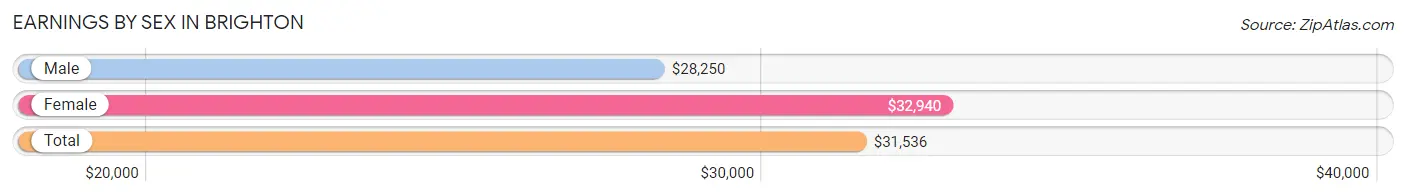
| Sex | Number | Average Earnings |
| Male | 451 (36.4%) | $28,250 |
| Female | 788 (63.6%) | $32,940 |
| Total | 1,239 (100.0%) | $31,536 |
Earnings by Sex by Income Bracket in Brighton
The most common earnings brackets in Brighton are $5,000 to $7,499 for men (91 | 20.2%) and $30,000 to $34,999 for women (206 | 26.1%).
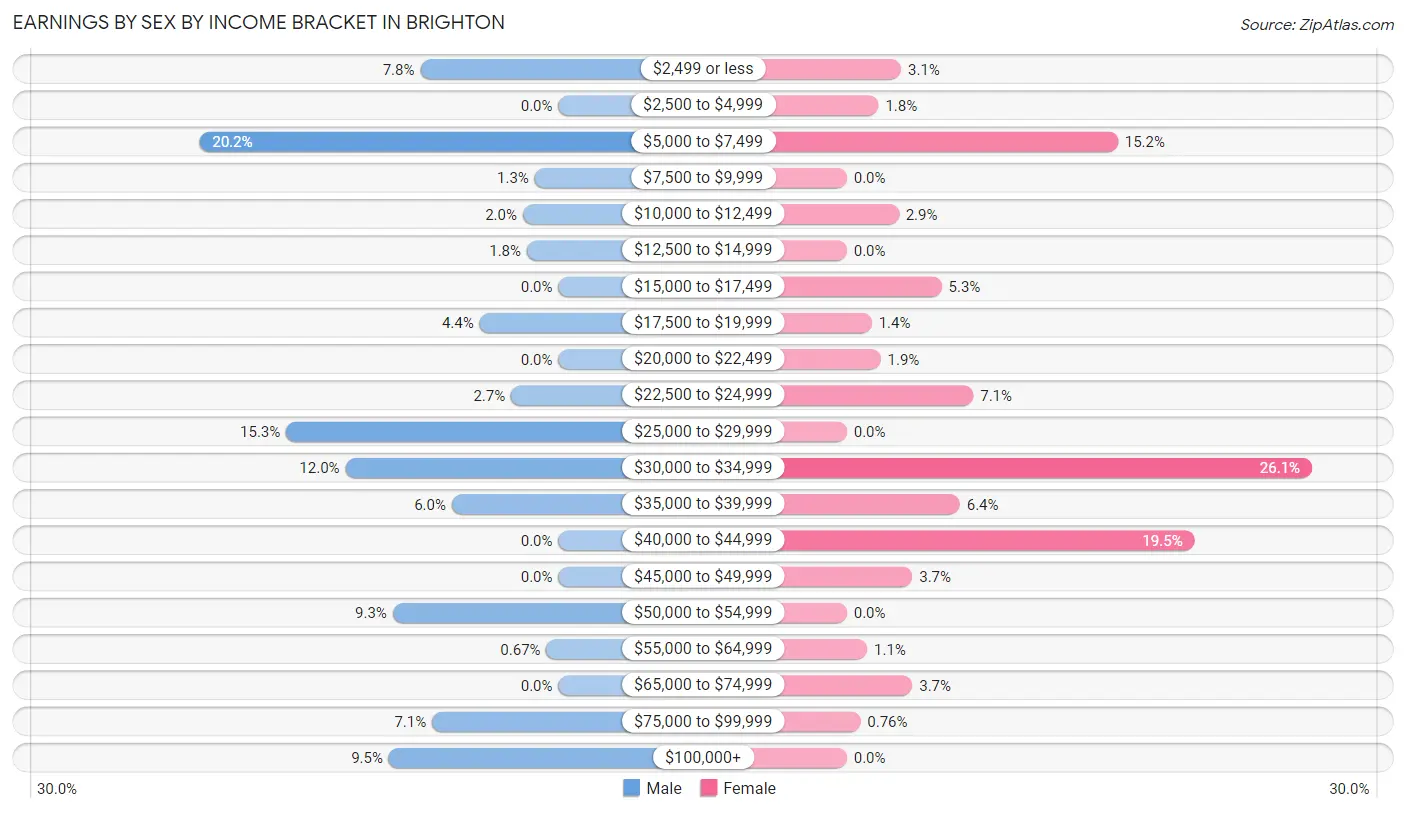
| Income | Male | Female |
| $2,499 or less | 35 (7.8%) | 24 (3.0%) |
| $2,500 to $4,999 | 0 (0.0%) | 14 (1.8%) |
| $5,000 to $7,499 | 91 (20.2%) | 120 (15.2%) |
| $7,500 to $9,999 | 6 (1.3%) | 0 (0.0%) |
| $10,000 to $12,499 | 9 (2.0%) | 23 (2.9%) |
| $12,500 to $14,999 | 8 (1.8%) | 0 (0.0%) |
| $15,000 to $17,499 | 0 (0.0%) | 42 (5.3%) |
| $17,500 to $19,999 | 20 (4.4%) | 11 (1.4%) |
| $20,000 to $22,499 | 0 (0.0%) | 15 (1.9%) |
| $22,500 to $24,999 | 12 (2.7%) | 56 (7.1%) |
| $25,000 to $29,999 | 69 (15.3%) | 0 (0.0%) |
| $30,000 to $34,999 | 54 (12.0%) | 206 (26.1%) |
| $35,000 to $39,999 | 27 (6.0%) | 50 (6.4%) |
| $40,000 to $44,999 | 0 (0.0%) | 154 (19.5%) |
| $45,000 to $49,999 | 0 (0.0%) | 29 (3.7%) |
| $50,000 to $54,999 | 42 (9.3%) | 0 (0.0%) |
| $55,000 to $64,999 | 3 (0.7%) | 9 (1.1%) |
| $65,000 to $74,999 | 0 (0.0%) | 29 (3.7%) |
| $75,000 to $99,999 | 32 (7.1%) | 6 (0.8%) |
| $100,000+ | 43 (9.5%) | 0 (0.0%) |
| Total | 451 (100.0%) | 788 (100.0%) |
Earnings by Sex by Educational Attainment in Brighton
Average earnings in Brighton are $30,000 for men and $33,301 for women, a difference of 9.9%. Men with an educational attainment of high school diploma enjoy the highest average annual earnings of $30,915, while those with college or associate's degree education earn the least with $27,760. Women with an educational attainment of college or associate's degree earn the most with the average annual earnings of $36,645, while those with less than high school education have the smallest earnings of $6,310.
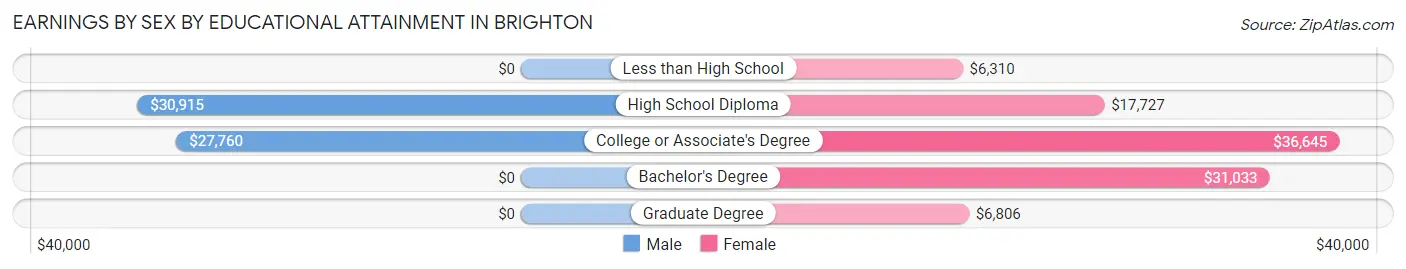
| Educational Attainment | Male Income | Female Income |
| Less than High School | - | - |
| High School Diploma | $30,915 | $17,727 |
| College or Associate's Degree | $27,760 | $36,645 |
| Bachelor's Degree | - | - |
| Graduate Degree | - | - |
| Total | $30,000 | $33,301 |
Family Income in Brighton
Family Income Brackets in Brighton
According to the Brighton family income data, there are 186 families falling into the $75,000 to $99,999 income range, which is the most common income bracket and makes up 26.7% of all families. Conversely, the $200,000+ income bracket is the least frequent group with only 5 families (0.7%) belonging to this category.
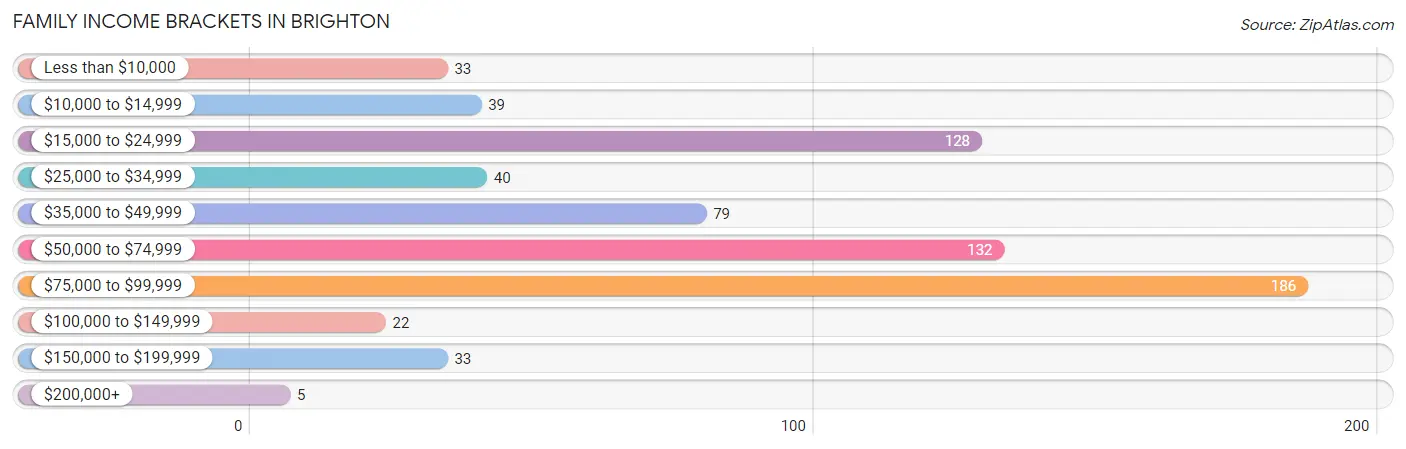
| Income Bracket | # Families | % Families |
| Less than $10,000 | 33 | 4.7% |
| $10,000 to $14,999 | 39 | 5.6% |
| $15,000 to $24,999 | 128 | 18.4% |
| $25,000 to $34,999 | 40 | 5.7% |
| $35,000 to $49,999 | 79 | 11.3% |
| $50,000 to $74,999 | 132 | 18.9% |
| $75,000 to $99,999 | 186 | 26.7% |
| $100,000 to $149,999 | 22 | 3.2% |
| $150,000 to $199,999 | 33 | 4.7% |
| $200,000+ | 5 | 0.7% |
Family Income by Famaliy Size in Brighton
2-person families (524 | 75.2%) account for the highest median family income in Brighton with $62,976 per family, while 2-person families (524 | 75.2%) have the highest median income of $31,488 per family member.
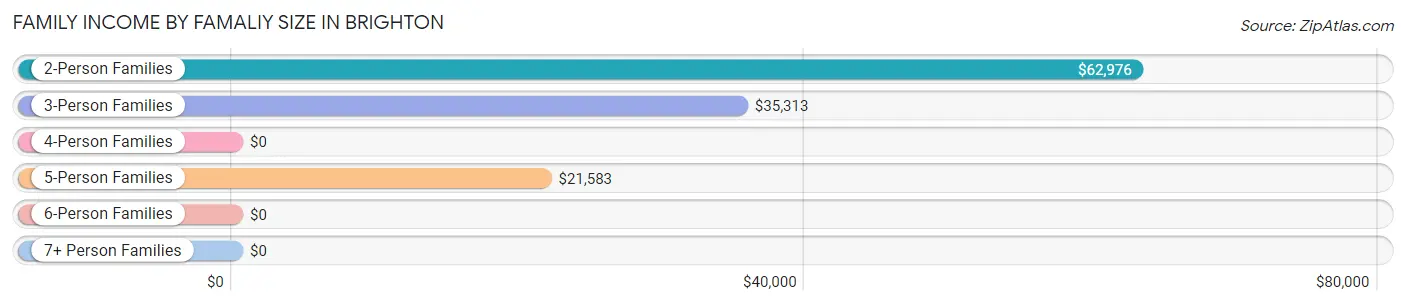
| Income Bracket | # Families | Median Income |
| 2-Person Families | 524 (75.2%) | $62,976 |
| 3-Person Families | 60 (8.6%) | $35,313 |
| 4-Person Families | 42 (6.0%) | $0 |
| 5-Person Families | 41 (5.9%) | $21,583 |
| 6-Person Families | 7 (1.0%) | $0 |
| 7+ Person Families | 23 (3.3%) | $0 |
| Total | 697 (100.0%) | $58,264 |
Family Income by Number of Earners in Brighton
The median family income in Brighton is $58,264, with families comprising 3+ earners (38) having the highest median family income of $197,941, while families with no earners (164) have the lowest median family income of $18,056, accounting for 5.4% and 23.5% of families, respectively.
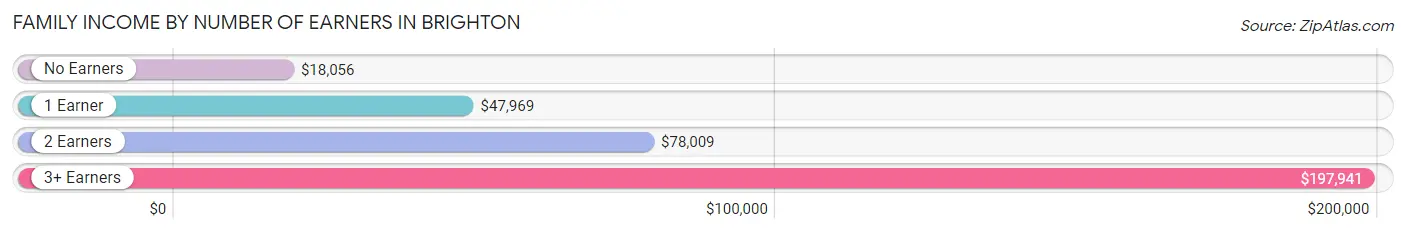
| Number of Earners | # Families | Median Income |
| No Earners | 164 (23.5%) | $18,056 |
| 1 Earner | 220 (31.6%) | $47,969 |
| 2 Earners | 275 (39.5%) | $78,009 |
| 3+ Earners | 38 (5.4%) | $197,941 |
| Total | 697 (100.0%) | $58,264 |
Household Income in Brighton
Household Income Brackets in Brighton
With 340 households falling in the category, the $15,000 to $24,999 income range is the most frequent in Brighton, accounting for 28.4% of all households. In contrast, only 5 households (0.4%) fall into the $200,000+ income bracket, making it the least populous group.
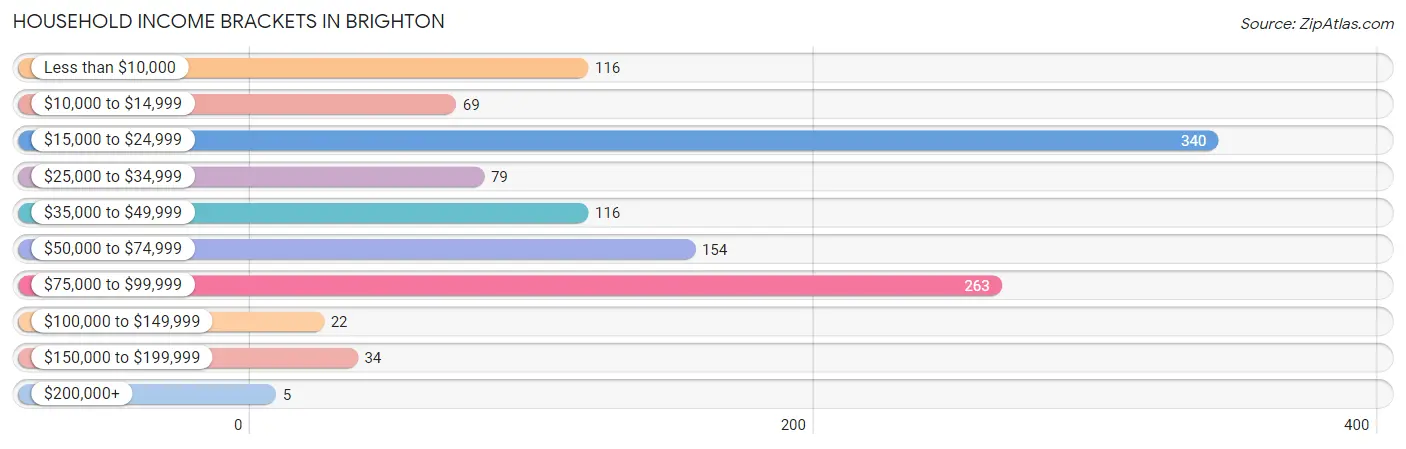
| Income Bracket | # Households | % Households |
| Less than $10,000 | 116 | 9.7% |
| $10,000 to $14,999 | 69 | 5.8% |
| $15,000 to $24,999 | 340 | 28.4% |
| $25,000 to $34,999 | 79 | 6.6% |
| $35,000 to $49,999 | 116 | 9.7% |
| $50,000 to $74,999 | 154 | 12.9% |
| $75,000 to $99,999 | 263 | 22.0% |
| $100,000 to $149,999 | 22 | 1.8% |
| $150,000 to $199,999 | 34 | 2.8% |
| $200,000+ | 5 | 0.4% |
Household Income by Householder Age in Brighton
The median household income in Brighton is $34,471, with the highest median household income of $77,843 found in the 25 to 44 years age bracket for the primary householder. A total of 297 households (24.8%) fall into this category. Meanwhile, the 15 to 24 years age bracket for the primary householder has the lowest median household income of $0, with 12 households (1.0%) in this group.
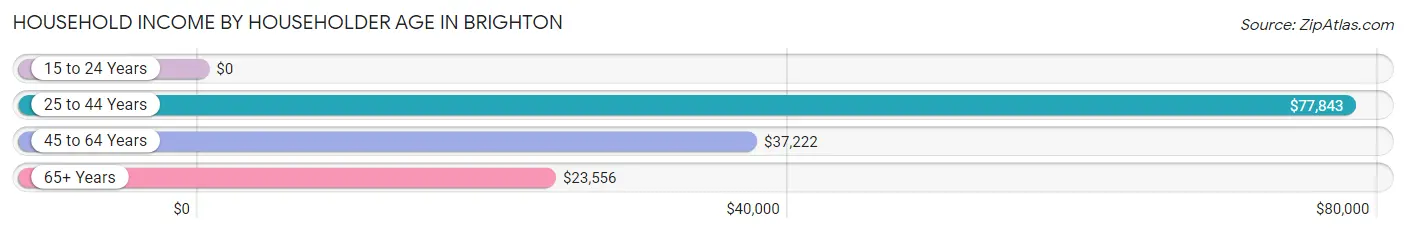
| Income Bracket | # Households | Median Income |
| 15 to 24 Years | 12 (1.0%) | $0 |
| 25 to 44 Years | 297 (24.8%) | $77,843 |
| 45 to 64 Years | 382 (31.9%) | $37,222 |
| 65+ Years | 506 (42.3%) | $23,556 |
| Total | 1,197 (100.0%) | $34,471 |
Poverty in Brighton
Income Below Poverty by Sex and Age in Brighton
With 42.9% poverty level for males and 33.3% for females among the residents of Brighton, 16 and 17 year old males and under 5 year old females are the most vulnerable to poverty, with 25 males (100.0%) and 46 females (100.0%) in their respective age groups living below the poverty level.
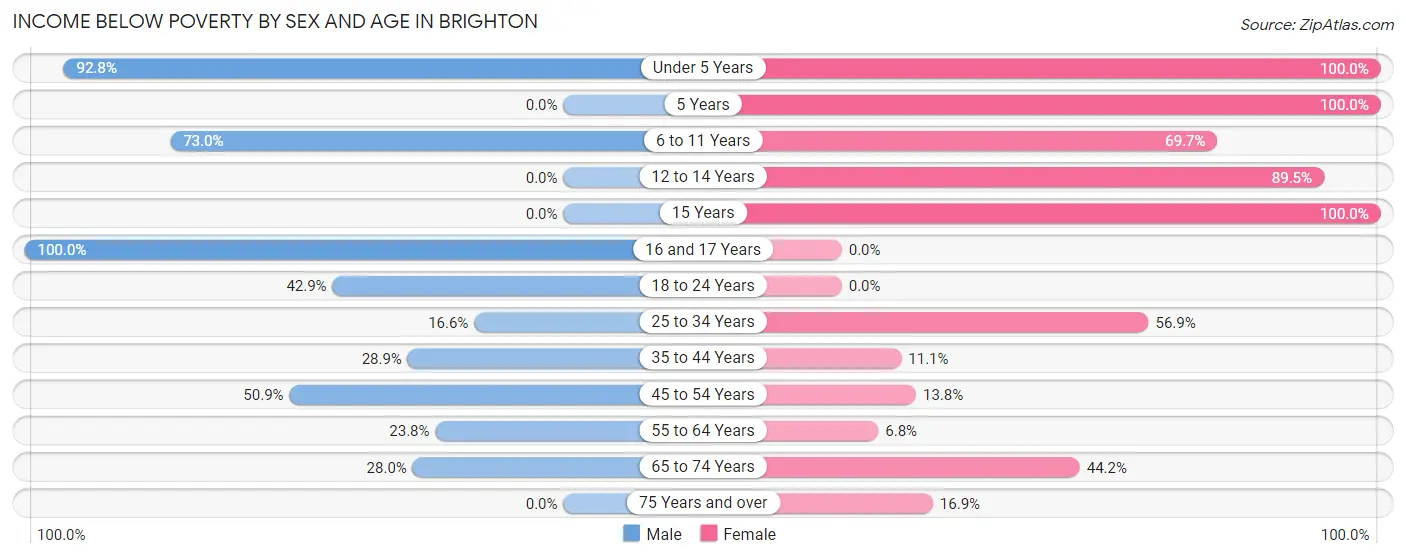
| Age Bracket | Male | Female |
| Under 5 Years | 231 (92.8%) | 46 (100.0%) |
| 5 Years | 0 (0.0%) | 43 (100.0%) |
| 6 to 11 Years | 108 (73.0%) | 92 (69.7%) |
| 12 to 14 Years | 0 (0.0%) | 51 (89.5%) |
| 15 Years | 0 (0.0%) | 9 (100.0%) |
| 16 and 17 Years | 25 (100.0%) | 0 (0.0%) |
| 18 to 24 Years | 27 (42.9%) | 0 (0.0%) |
| 25 to 34 Years | 24 (16.6%) | 82 (56.9%) |
| 35 to 44 Years | 39 (28.9%) | 22 (11.1%) |
| 45 to 54 Years | 60 (50.8%) | 20 (13.8%) |
| 55 to 64 Years | 43 (23.8%) | 24 (6.8%) |
| 65 to 74 Years | 40 (28.0%) | 110 (44.2%) |
| 75 Years and over | 0 (0.0%) | 23 (16.9%) |
| Total | 597 (42.9%) | 522 (33.3%) |
Income Above Poverty by Sex and Age in Brighton
According to the poverty statistics in Brighton, males aged 12 to 14 years and females aged 16 and 17 years are the age groups that are most secure financially, with 100.0% of males and 100.0% of females in these age groups living above the poverty line.
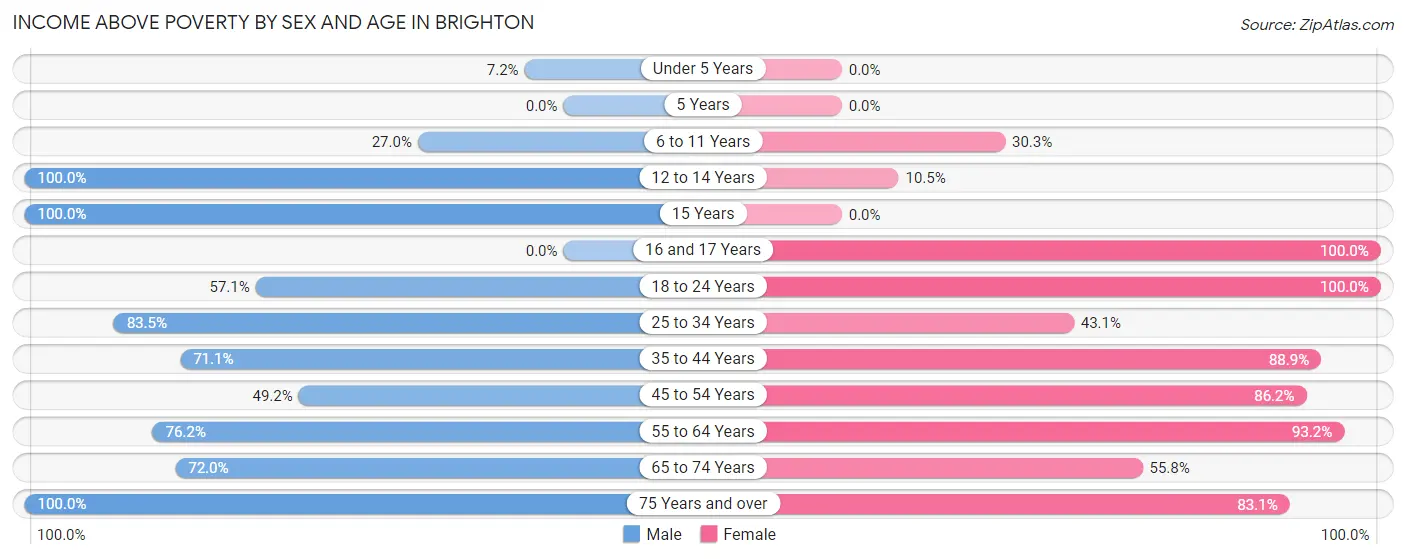
| Age Bracket | Male | Female |
| Under 5 Years | 18 (7.2%) | 0 (0.0%) |
| 5 Years | 0 (0.0%) | 0 (0.0%) |
| 6 to 11 Years | 40 (27.0%) | 40 (30.3%) |
| 12 to 14 Years | 29 (100.0%) | 6 (10.5%) |
| 15 Years | 7 (100.0%) | 0 (0.0%) |
| 16 and 17 Years | 0 (0.0%) | 9 (100.0%) |
| 18 to 24 Years | 36 (57.1%) | 44 (100.0%) |
| 25 to 34 Years | 121 (83.5%) | 62 (43.1%) |
| 35 to 44 Years | 96 (71.1%) | 177 (88.9%) |
| 45 to 54 Years | 58 (49.1%) | 125 (86.2%) |
| 55 to 64 Years | 138 (76.2%) | 330 (93.2%) |
| 65 to 74 Years | 103 (72.0%) | 139 (55.8%) |
| 75 Years and over | 147 (100.0%) | 113 (83.1%) |
| Total | 793 (57.1%) | 1,045 (66.7%) |
Income Below Poverty Among Married-Couple Families in Brighton
The poverty statistics for married-couple families in Brighton show that 19.4% or 48 of the total 247 families live below the poverty line. Families with 3 or 4 children have the highest poverty rate of 100.0%, comprising of 10 families. On the other hand, families with 1 or 2 children have the lowest poverty rate of 0.0%, which includes 0 families.
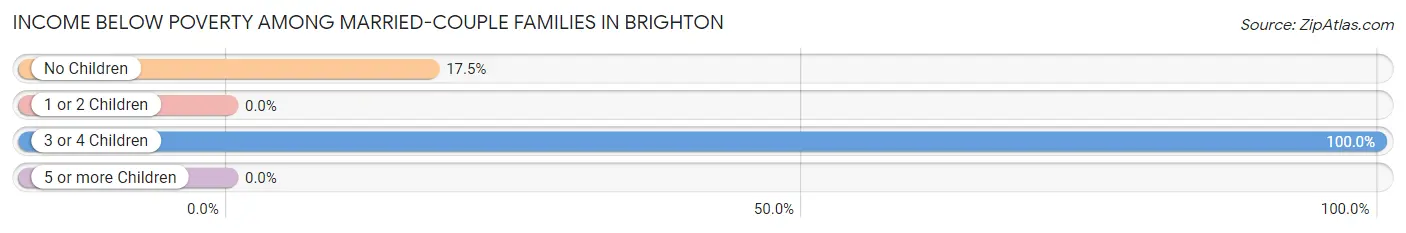
| Children | Above Poverty | Below Poverty |
| No Children | 179 (82.5%) | 38 (17.5%) |
| 1 or 2 Children | 20 (100.0%) | 0 (0.0%) |
| 3 or 4 Children | 0 (0.0%) | 10 (100.0%) |
| 5 or more Children | 0 (0.0%) | 0 (0.0%) |
| Total | 199 (80.6%) | 48 (19.4%) |
Income Below Poverty Among Single-Parent Households in Brighton
According to the poverty data in Brighton, 39.3% or 11 single-father households and 30.1% or 127 single-mother households are living below the poverty line. Among single-father households, those with 3 or 4 children have the highest poverty rate, with 11 households (100.0%) experiencing poverty. Likewise, among single-mother households, those with 3 or 4 children have the highest poverty rate, with 31 households (100.0%) falling below the poverty line.
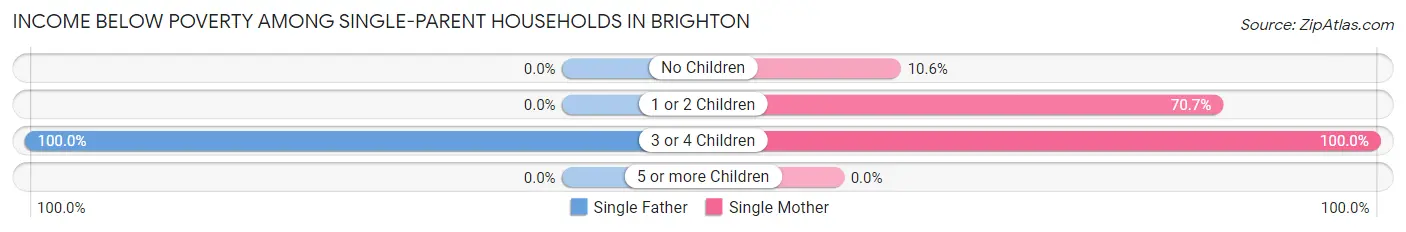
| Children | Single Father | Single Mother |
| No Children | 0 (0.0%) | 31 (10.6%) |
| 1 or 2 Children | 0 (0.0%) | 65 (70.7%) |
| 3 or 4 Children | 11 (100.0%) | 31 (100.0%) |
| 5 or more Children | 0 (0.0%) | 0 (0.0%) |
| Total | 11 (39.3%) | 127 (30.1%) |
Income Below Poverty Among Married-Couple vs Single-Parent Households in Brighton
The poverty data for Brighton shows that 48 of the married-couple family households (19.4%) and 138 of the single-parent households (30.7%) are living below the poverty level. Within the married-couple family households, those with 3 or 4 children have the highest poverty rate, with 10 households (100.0%) falling below the poverty line. Among the single-parent households, those with 3 or 4 children have the highest poverty rate, with 42 household (100.0%) living below poverty.
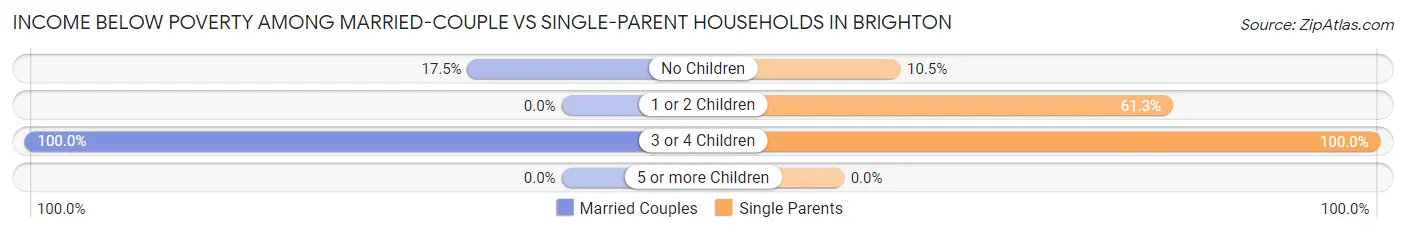
| Children | Married-Couple Families | Single-Parent Households |
| No Children | 38 (17.5%) | 31 (10.5%) |
| 1 or 2 Children | 0 (0.0%) | 65 (61.3%) |
| 3 or 4 Children | 10 (100.0%) | 42 (100.0%) |
| 5 or more Children | 0 (0.0%) | 0 (0.0%) |
| Total | 48 (19.4%) | 138 (30.7%) |
Race in Brighton
The most populous races in Brighton are Black / African American (2,264 | 75.9%), Hispanic or Latino (540 | 18.1%), and Some other Race (484 | 16.2%).
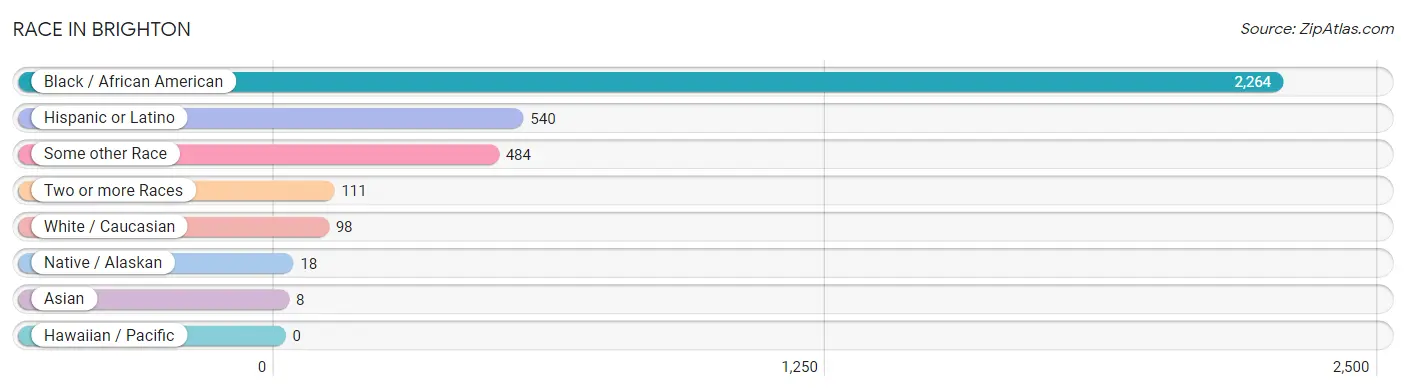
| Race | # Population | % Population |
| Asian | 8 | 0.3% |
| Black / African American | 2,264 | 75.9% |
| Hawaiian / Pacific | 0 | 0.0% |
| Hispanic or Latino | 540 | 18.1% |
| Native / Alaskan | 18 | 0.6% |
| White / Caucasian | 98 | 3.3% |
| Two or more Races | 111 | 3.7% |
| Some other Race | 484 | 16.2% |
| Total | 2,983 | 100.0% |
Ancestry in Brighton
The most populous ancestries reported in Brighton are Mexican (494 | 16.6%), American (69 | 2.3%), Central American (40 | 1.3%), Honduran (40 | 1.3%), and Irish (31 | 1.0%), together accounting for 22.6% of all Brighton residents.
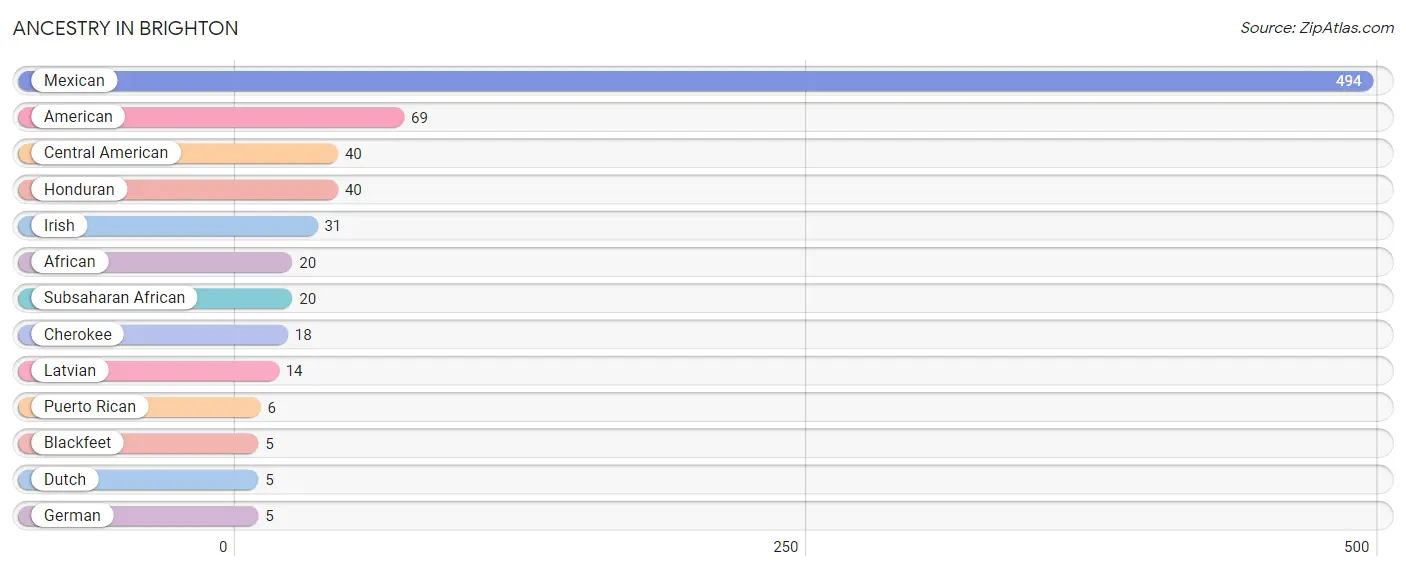
| Ancestry | # Population | % Population |
| African | 20 | 0.7% |
| American | 69 | 2.3% |
| Blackfeet | 5 | 0.2% |
| Central American | 40 | 1.3% |
| Cherokee | 18 | 0.6% |
| Dutch | 5 | 0.2% |
| German | 5 | 0.2% |
| Honduran | 40 | 1.3% |
| Irish | 31 | 1.0% |
| Latvian | 14 | 0.5% |
| Mexican | 494 | 16.6% |
| Puerto Rican | 6 | 0.2% |
| Subsaharan African | 20 | 0.7% | View All 13 Rows |
Immigrants in Brighton
The most numerous immigrant groups reported in Brighton came from Central America (166 | 5.6%), Latin America (166 | 5.6%), Mexico (144 | 4.8%), Honduras (22 | 0.7%), and Asia (8 | 0.3%), together accounting for 17.0% of all Brighton residents.
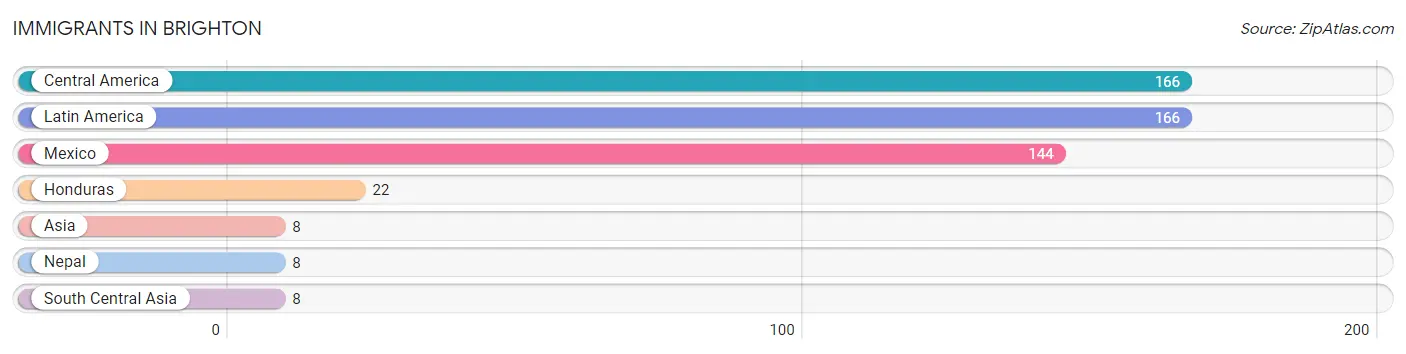
| Immigration Origin | # Population | % Population |
| Asia | 8 | 0.3% |
| Central America | 166 | 5.6% |
| Honduras | 22 | 0.7% |
| Latin America | 166 | 5.6% |
| Mexico | 144 | 4.8% |
| Nepal | 8 | 0.3% |
| South Central Asia | 8 | 0.3% | View All 7 Rows |
Sex and Age in Brighton
Sex and Age in Brighton
The most populous age groups in Brighton are Under 5 Years (249 | 17.9%) for men and 60 to 64 Years (278 | 17.4%) for women.
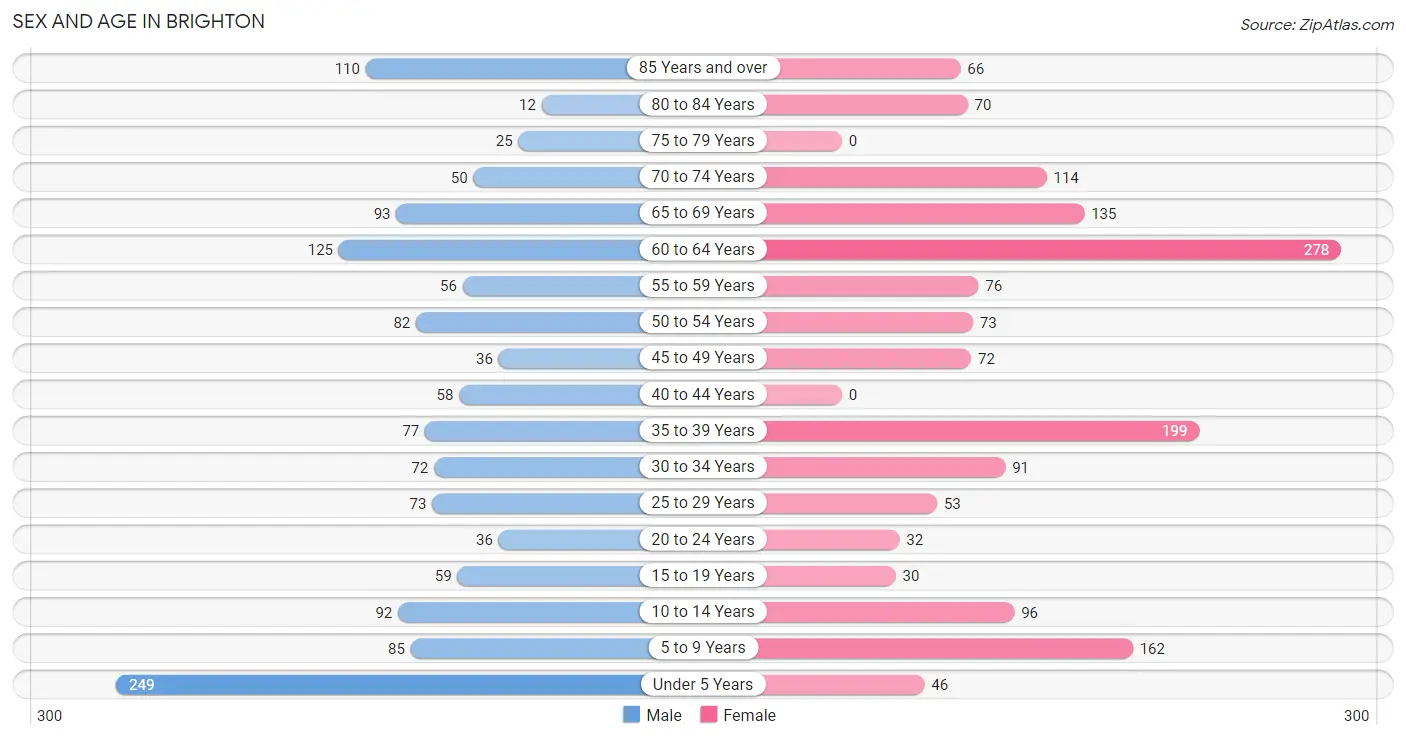
| Age Bracket | Male | Female |
| Under 5 Years | 249 (17.9%) | 46 (2.9%) |
| 5 to 9 Years | 85 (6.1%) | 162 (10.2%) |
| 10 to 14 Years | 92 (6.6%) | 96 (6.0%) |
| 15 to 19 Years | 59 (4.2%) | 30 (1.9%) |
| 20 to 24 Years | 36 (2.6%) | 32 (2.0%) |
| 25 to 29 Years | 73 (5.2%) | 53 (3.3%) |
| 30 to 34 Years | 72 (5.2%) | 91 (5.7%) |
| 35 to 39 Years | 77 (5.5%) | 199 (12.5%) |
| 40 to 44 Years | 58 (4.2%) | 0 (0.0%) |
| 45 to 49 Years | 36 (2.6%) | 72 (4.5%) |
| 50 to 54 Years | 82 (5.9%) | 73 (4.6%) |
| 55 to 59 Years | 56 (4.0%) | 76 (4.8%) |
| 60 to 64 Years | 125 (9.0%) | 278 (17.4%) |
| 65 to 69 Years | 93 (6.7%) | 135 (8.5%) |
| 70 to 74 Years | 50 (3.6%) | 114 (7.2%) |
| 75 to 79 Years | 25 (1.8%) | 0 (0.0%) |
| 80 to 84 Years | 12 (0.9%) | 70 (4.4%) |
| 85 Years and over | 110 (7.9%) | 66 (4.1%) |
| Total | 1,390 (100.0%) | 1,593 (100.0%) |
Families and Households in Brighton
Median Family Size in Brighton
The median family size in Brighton is 3.35 persons per family, with single male/father families (28 | 4.0%) accounting for the largest median family size of 14.82 persons per family. On the other hand, single female/mother families (422 | 60.6%) represent the smallest median family size with 2.85 persons per family.
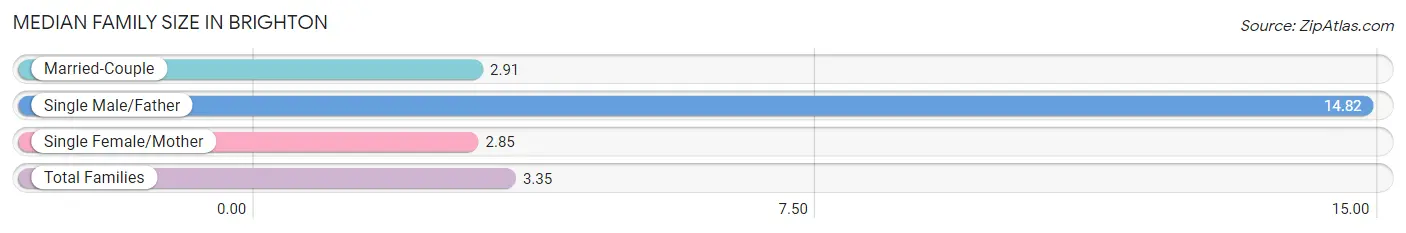
| Family Type | # Families | Family Size |
| Married-Couple | 247 (35.4%) | 2.91 |
| Single Male/Father | 28 (4.0%) | 14.82 |
| Single Female/Mother | 422 (60.6%) | 2.85 |
| Total Families | 697 (100.0%) | 3.35 |
Median Household Size in Brighton
The median household size in Brighton is 2.47 persons per household, with single male/father households (28 | 2.3%) accounting for the largest median household size of 15.68 persons per household. non-family households (500 | 41.8%) represent the smallest median household size with 1.01 persons per household.
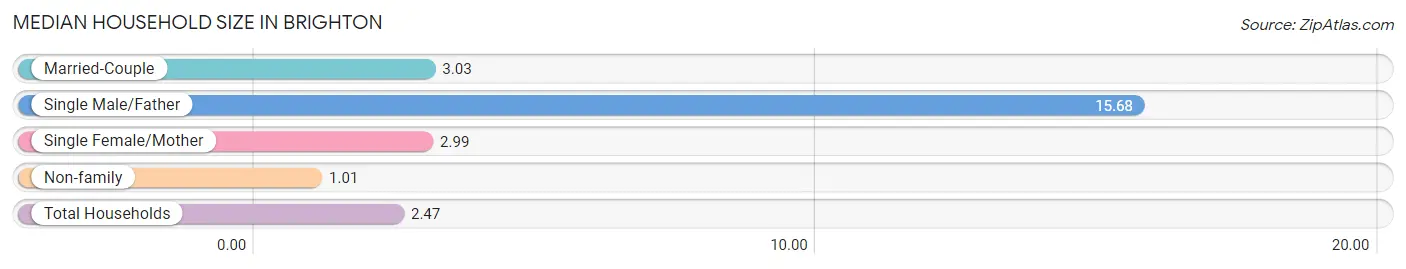
| Household Type | # Households | Household Size |
| Married-Couple | 247 (20.6%) | 3.03 |
| Single Male/Father | 28 (2.3%) | 15.68 |
| Single Female/Mother | 422 (35.2%) | 2.99 |
| Non-family | 500 (41.8%) | 1.01 |
| Total Households | 1,197 (100.0%) | 2.47 |
Household Size by Marriage Status in Brighton
Out of a total of 1,197 households in Brighton, 697 (58.2%) are family households, while 500 (41.8%) are nonfamily households. The most numerous type of family households are 2-person households, comprising 464, and the most common type of nonfamily households are 1-person households, comprising 495.
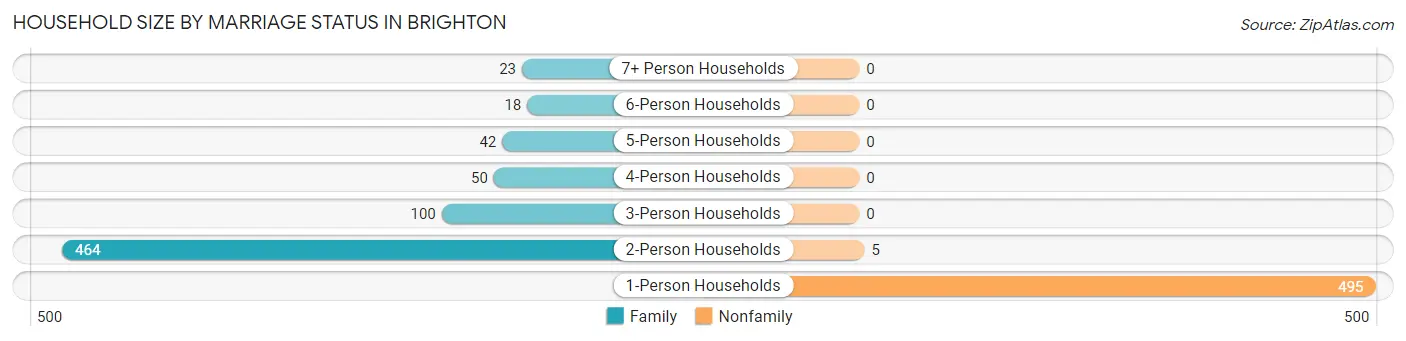
| Household Size | Family Households | Nonfamily Households |
| 1-Person Households | - | 495 (41.3%) |
| 2-Person Households | 464 (38.8%) | 5 (0.4%) |
| 3-Person Households | 100 (8.4%) | 0 (0.0%) |
| 4-Person Households | 50 (4.2%) | 0 (0.0%) |
| 5-Person Households | 42 (3.5%) | 0 (0.0%) |
| 6-Person Households | 18 (1.5%) | 0 (0.0%) |
| 7+ Person Households | 23 (1.9%) | 0 (0.0%) |
| Total | 697 (58.2%) | 500 (41.8%) |
Female Fertility in Brighton
Fertility by Age in Brighton
Average fertility rate in Brighton is 63.0 births per 1,000 women. Women in the age bracket of 20 to 34 years have the highest fertility rate with 170.0 births per 1,000 women. Women in the age bracket of 20 to 34 years acount for 100.0% of all women with births.
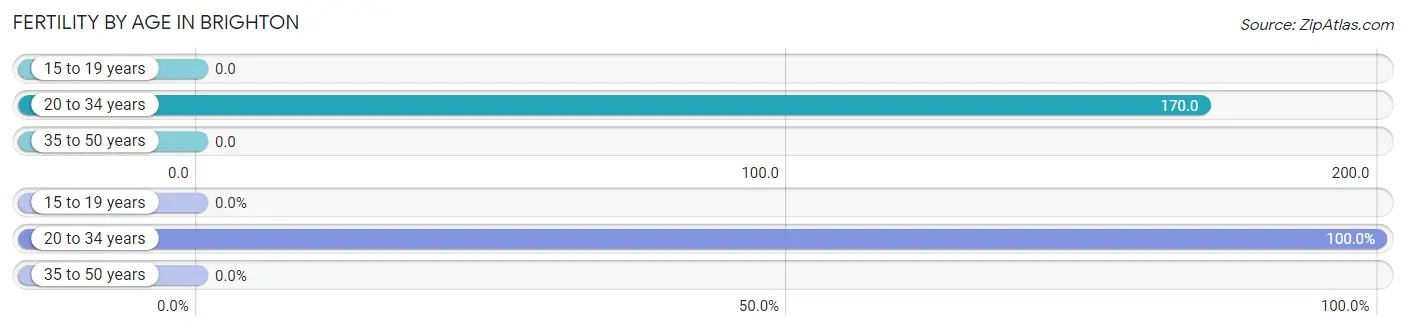
| Age Bracket | Women with Births | Births / 1,000 Women |
| 15 to 19 years | 0 (0.0%) | 0.0 |
| 20 to 34 years | 30 (100.0%) | 170.0 |
| 35 to 50 years | 0 (0.0%) | 0.0 |
| Total | 30 (100.0%) | 63.0 |
Fertility by Age by Marriage Status in Brighton
66.7% of women with births (30) in Brighton are married. The highest percentage of unmarried women with births falls into 20 to 34 years age bracket with 33.3% of them unmarried at the time of birth, while the lowest percentage of unmarried women with births belong to 20 to 34 years age bracket with 33.3% of them unmarried.
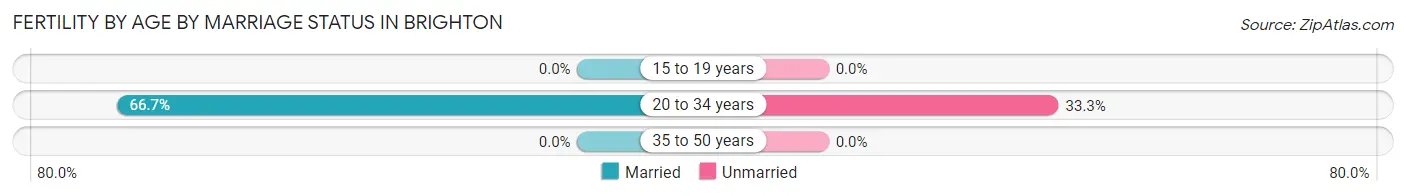
| Age Bracket | Married | Unmarried |
| 15 to 19 years | 0 (0.0%) | 0 (0.0%) |
| 20 to 34 years | 20 (66.7%) | 10 (33.3%) |
| 35 to 50 years | 0 (0.0%) | 0 (0.0%) |
| Total | 20 (66.7%) | 10 (33.3%) |
Fertility by Education in Brighton
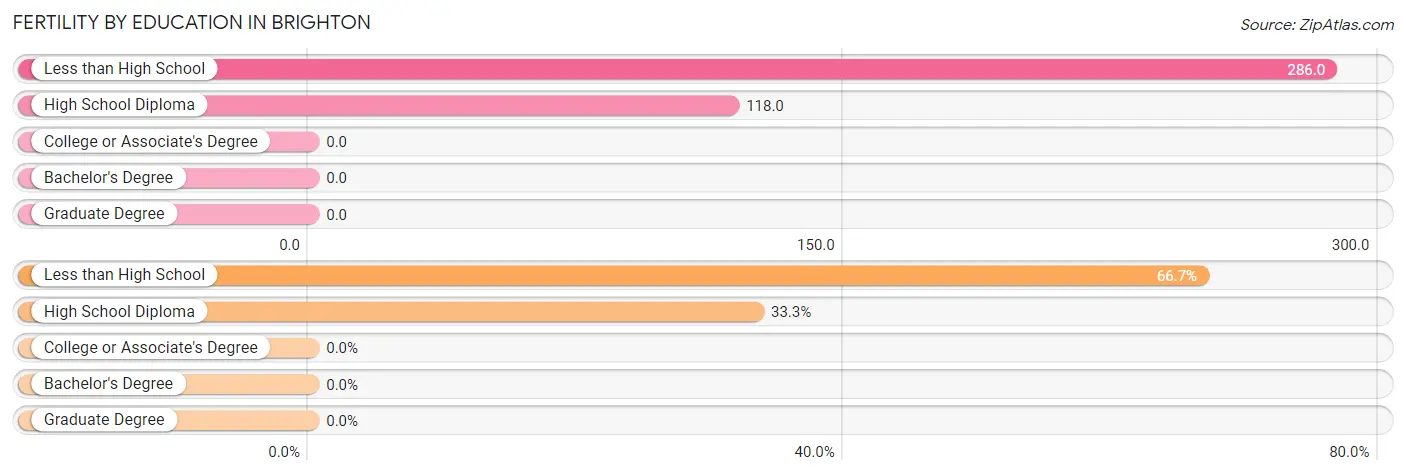
| Educational Attainment | Women with Births | Births / 1,000 Women |
| Less than High School | 20 (66.7%) | 286.0 |
| High School Diploma | 10 (33.3%) | 118.0 |
| College or Associate's Degree | 0 (0.0%) | 0.0 |
| Bachelor's Degree | 0 (0.0%) | 0.0 |
| Graduate Degree | 0 (0.0%) | 0.0 |
| Total | 30 (100.0%) | 63.0 |
Fertility by Education by Marriage Status in Brighton
33.3% of women with births in Brighton are unmarried. Women with the educational attainment of less than high school are most likely to be married with 100.0% of them married at childbirth, while women with the educational attainment of high school diploma are least likely to be married with 100.0% of them unmarried at childbirth.
| Educational Attainment | Married | Unmarried |
| Less than High School | 20 (100.0%) | 0 (0.0%) |
| High School Diploma | 0 (0.0%) | 10 (100.0%) |
| College or Associate's Degree | 0 (0.0%) | 0 (0.0%) |
| Bachelor's Degree | 0 (0.0%) | 0 (0.0%) |
| Graduate Degree | 0 (0.0%) | 0 (0.0%) |
| Total | 20 (66.7%) | 10 (33.3%) |
Employment Characteristics in Brighton
Employment by Class of Employer in Brighton
Among the 1,079 employed individuals in Brighton, private company employees (701 | 65.0%), federal government employees (153 | 14.2%), and local government employees (86 | 8.0%) make up the most common classes of employment.
| Employer Class | # Employees | % Employees |
| Private Company Employees | 701 | 65.0% |
| Self-Employed (Incorporated) | 0 | 0.0% |
| Self-Employed (Not Incorporated) | 76 | 7.0% |
| Not-for-profit Organizations | 37 | 3.4% |
| Local Government Employees | 86 | 8.0% |
| State Government Employees | 26 | 2.4% |
| Federal Government Employees | 153 | 14.2% |
| Unpaid Family Workers | 0 | 0.0% |
| Total | 1,079 | 100.0% |
Employment Status by Age in Brighton
According to the labor force statistics for Brighton, out of the total population over 16 years of age (2,237), 56.3% or 1,259 individuals are in the labor force, with 12.4% or 156 of them unemployed. The age group with the highest labor force participation rate is 20 to 24 years, with 100.0% or 68 individuals in the labor force. Within the labor force, the 16 to 19 years age range has the highest percentage of unemployed individuals, with 41.0% or 25 of them being unemployed.
| Age Bracket | In Labor Force | Unemployed |
| 16 to 19 Years | 61 (83.6%) | 25 (41.0%) |
| 20 to 24 Years | 68 (100.0%) | 0 (0.0%) |
| 25 to 29 Years | 106 (84.1%) | 0 (0.0%) |
| 30 to 34 Years | 153 (93.9%) | 30 (19.6%) |
| 35 to 44 Years | 307 (91.9%) | 54 (17.6%) |
| 45 to 54 Years | 173 (65.8%) | 23 (13.3%) |
| 55 to 59 Years | 96 (72.7%) | 15 (15.6%) |
| 60 to 64 Years | 235 (58.3%) | 0 (0.0%) |
| 65 to 74 Years | 60 (15.3%) | 9 (15.0%) |
| 75 Years and over | 0 (0.0%) | 0 (0.0%) |
| Total | 1,259 (56.3%) | 156 (12.4%) |
Employment Status by Educational Attainment in Brighton
According to labor force statistics for Brighton, 75.3% of individuals (1,070) out of the total population between 25 and 64 years of age (1,421) are in the labor force, with 11.4% or 122 of them being unemployed. The group with the highest labor force participation rate are those with the educational attainment of bachelor's degree or higher, with 84.6% or 121 individuals in the labor force. Within the labor force, individuals with less than high school education have the highest percentage of unemployment, with 30.7% or 23 of them being unemployed.
| Educational Attainment | In Labor Force | Unemployed |
| Less than High School | 75 (39.3%) | 59 (30.7%) |
| High School Diploma | 279 (74.6%) | 55 (14.7%) |
| College / Associate Degree | 595 (83.5%) | 26 (3.7%) |
| Bachelor's Degree or higher | 121 (84.6%) | 43 (29.8%) |
| Total | 1,070 (75.3%) | 162 (11.4%) |
Employment Occupations by Sex in Brighton
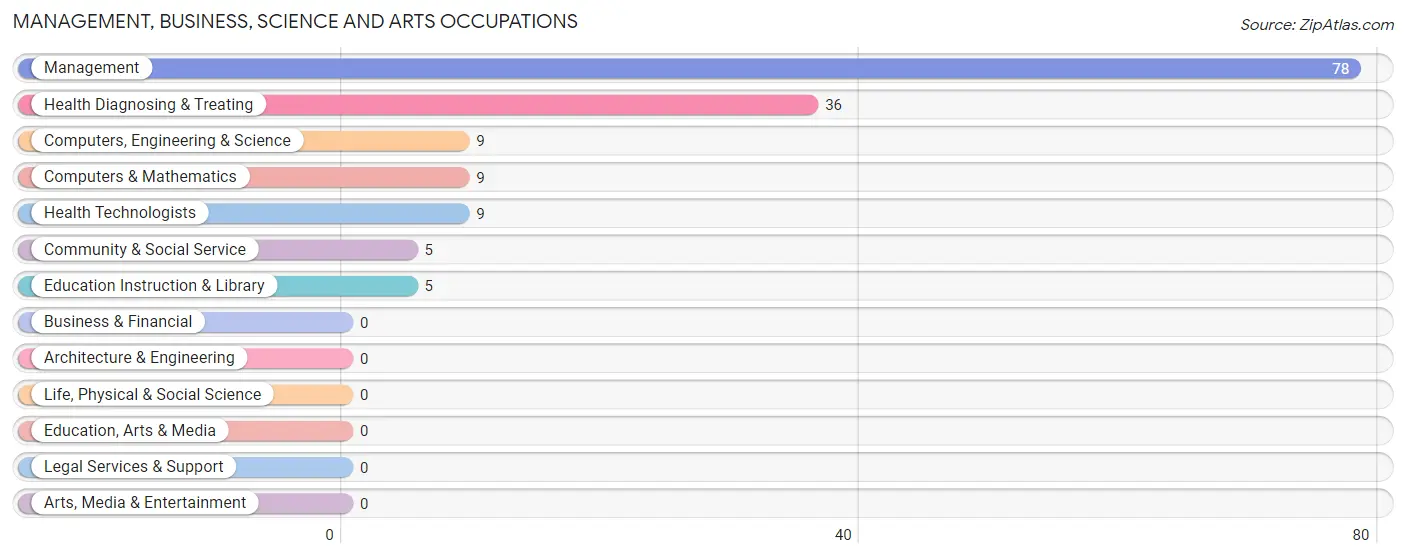
Management, Business, Science and Arts Occupations
The most common Management, Business, Science and Arts occupations in Brighton are Management (78 | 7.1%), Health Diagnosing & Treating (36 | 3.3%), Computers, Engineering & Science (9 | 0.8%), Computers & Mathematics (9 | 0.8%), and Health Technologists (9 | 0.8%).
Management, Business, Science and Arts Occupations by Sex
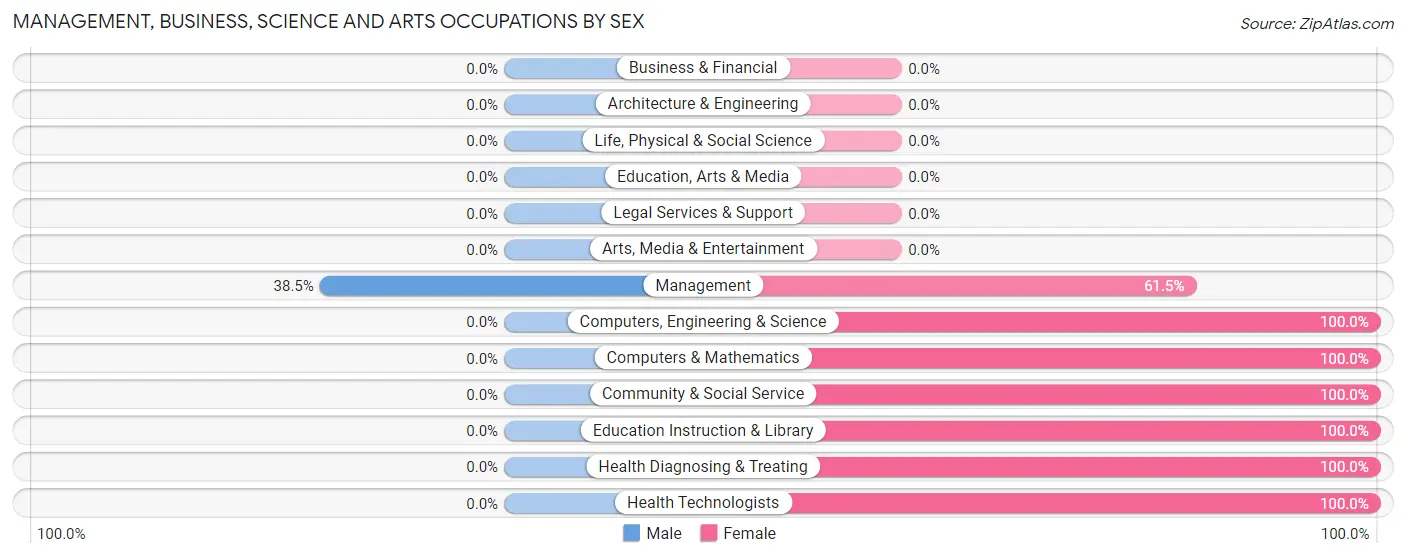
| Occupation | Male | Female |
| Management | 30 (38.5%) | 48 (61.5%) |
| Business & Financial | 0 (0.0%) | 0 (0.0%) |
| Computers, Engineering & Science | 0 (0.0%) | 9 (100.0%) |
| Computers & Mathematics | 0 (0.0%) | 9 (100.0%) |
| Architecture & Engineering | 0 (0.0%) | 0 (0.0%) |
| Life, Physical & Social Science | 0 (0.0%) | 0 (0.0%) |
| Community & Social Service | 0 (0.0%) | 5 (100.0%) |
| Education, Arts & Media | 0 (0.0%) | 0 (0.0%) |
| Legal Services & Support | 0 (0.0%) | 0 (0.0%) |
| Education Instruction & Library | 0 (0.0%) | 5 (100.0%) |
| Arts, Media & Entertainment | 0 (0.0%) | 0 (0.0%) |
| Health Diagnosing & Treating | 0 (0.0%) | 36 (100.0%) |
| Health Technologists | 0 (0.0%) | 9 (100.0%) |
| Total (Category) | 30 (23.4%) | 98 (76.6%) |
| Total (Overall) | 415 (37.6%) | 688 (62.4%) |
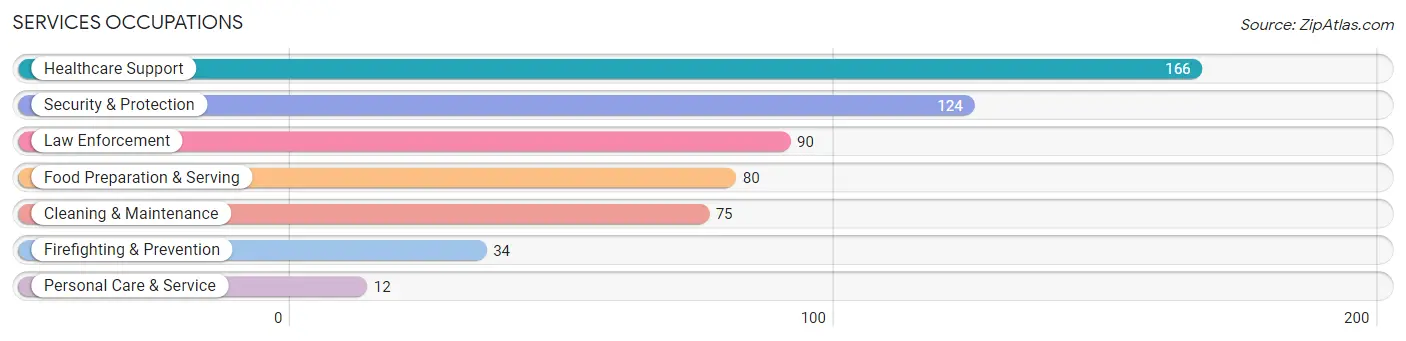
Services Occupations
The most common Services occupations in Brighton are Healthcare Support (166 | 15.0%), Security & Protection (124 | 11.2%), Law Enforcement (90 | 8.2%), Food Preparation & Serving (80 | 7.2%), and Cleaning & Maintenance (75 | 6.8%).
Services Occupations by Sex
Within the Services occupations in Brighton, the most male-oriented occupations are Firefighting & Prevention (100.0%), Security & Protection (79.0%), and Cleaning & Maintenance (73.3%), while the most female-oriented occupations are Healthcare Support (100.0%), Personal Care & Service (100.0%), and Food Preparation & Serving (36.2%).
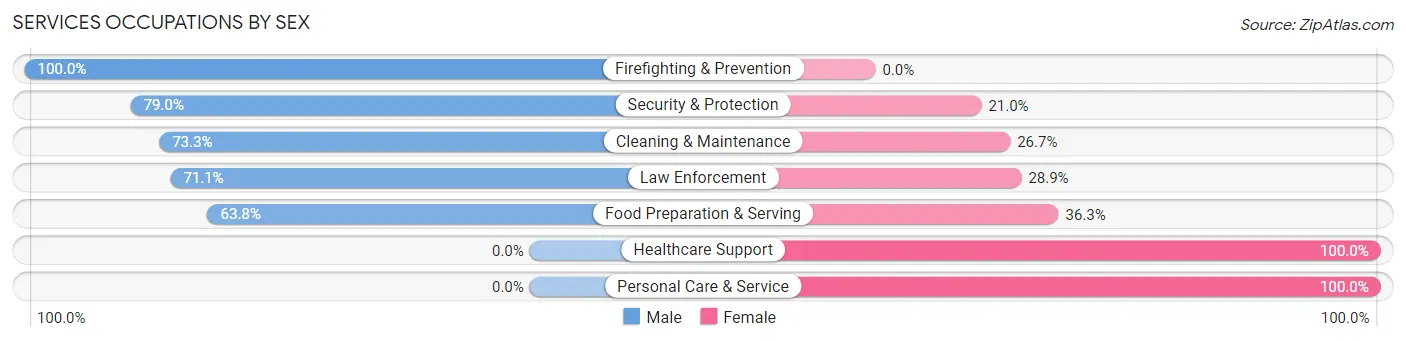
| Occupation | Male | Female |
| Healthcare Support | 0 (0.0%) | 166 (100.0%) |
| Security & Protection | 98 (79.0%) | 26 (21.0%) |
| Firefighting & Prevention | 34 (100.0%) | 0 (0.0%) |
| Law Enforcement | 64 (71.1%) | 26 (28.9%) |
| Food Preparation & Serving | 51 (63.7%) | 29 (36.2%) |
| Cleaning & Maintenance | 55 (73.3%) | 20 (26.7%) |
| Personal Care & Service | 0 (0.0%) | 12 (100.0%) |
| Total (Category) | 204 (44.6%) | 253 (55.4%) |
| Total (Overall) | 415 (37.6%) | 688 (62.4%) |
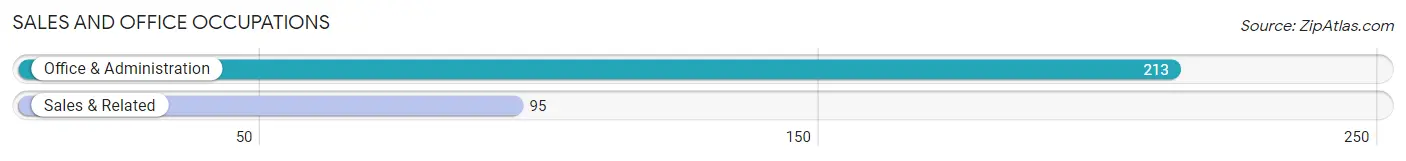
Sales and Office Occupations
The most common Sales and Office occupations in Brighton are Office & Administration (213 | 19.3%), and Sales & Related (95 | 8.6%).
Sales and Office Occupations by Sex
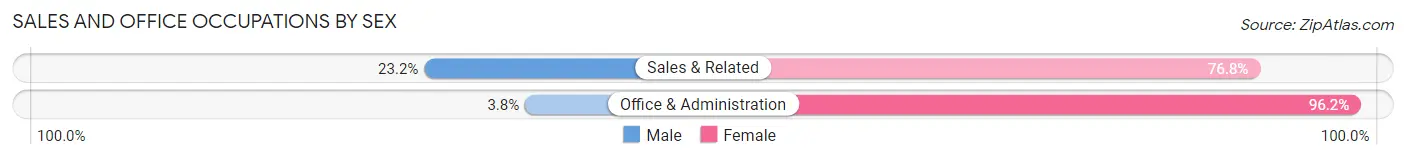
| Occupation | Male | Female |
| Sales & Related | 22 (23.2%) | 73 (76.8%) |
| Office & Administration | 8 (3.8%) | 205 (96.2%) |
| Total (Category) | 30 (9.7%) | 278 (90.3%) |
| Total (Overall) | 415 (37.6%) | 688 (62.4%) |
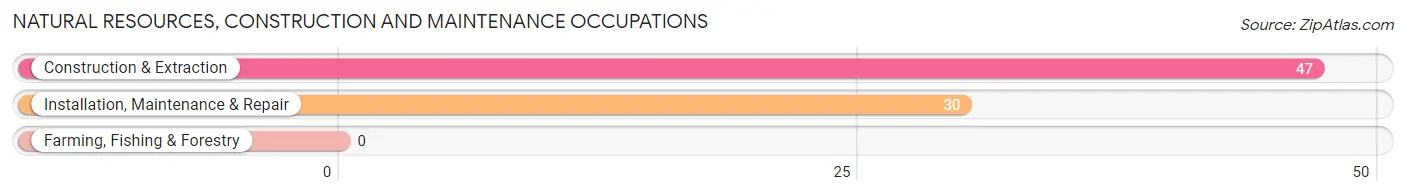
Natural Resources, Construction and Maintenance Occupations
The most common Natural Resources, Construction and Maintenance occupations in Brighton are Construction & Extraction (47 | 4.3%), and Installation, Maintenance & Repair (30 | 2.7%).
Natural Resources, Construction and Maintenance Occupations by Sex
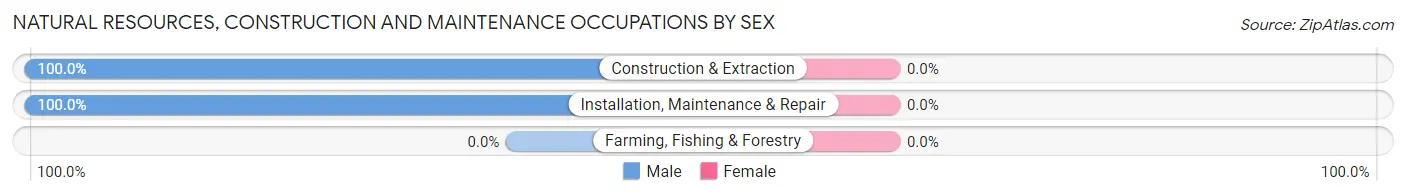
| Occupation | Male | Female |
| Farming, Fishing & Forestry | 0 (0.0%) | 0 (0.0%) |
| Construction & Extraction | 47 (100.0%) | 0 (0.0%) |
| Installation, Maintenance & Repair | 30 (100.0%) | 0 (0.0%) |
| Total (Category) | 77 (100.0%) | 0 (0.0%) |
| Total (Overall) | 415 (37.6%) | 688 (62.4%) |
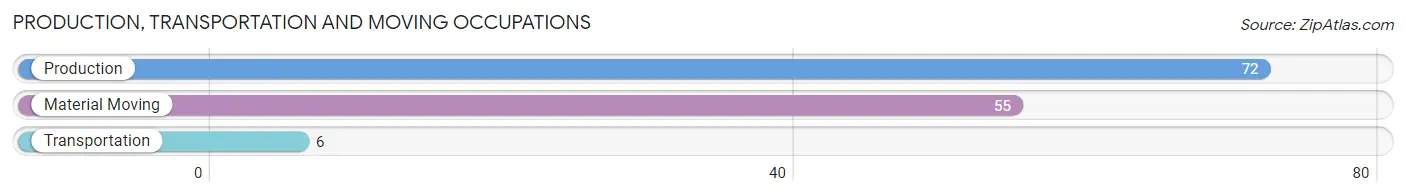
Production, Transportation and Moving Occupations
The most common Production, Transportation and Moving occupations in Brighton are Production (72 | 6.5%), Material Moving (55 | 5.0%), and Transportation (6 | 0.5%).
Production, Transportation and Moving Occupations by Sex
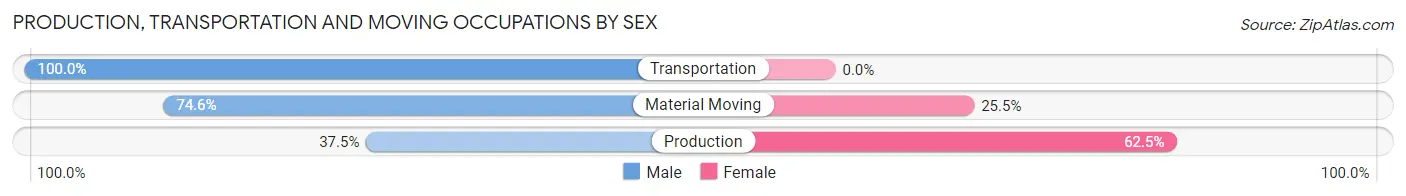
| Occupation | Male | Female |
| Production | 27 (37.5%) | 45 (62.5%) |
| Transportation | 6 (100.0%) | 0 (0.0%) |
| Material Moving | 41 (74.6%) | 14 (25.5%) |
| Total (Category) | 74 (55.6%) | 59 (44.4%) |
| Total (Overall) | 415 (37.6%) | 688 (62.4%) |
Employment Industries by Sex in Brighton
Employment Industries in Brighton
The major employment industries in Brighton include Health Care & Social Assistance (255 | 23.1%), Finance & Insurance (157 | 14.2%), Public Administration (123 | 11.2%), Accommodation & Food Services (122 | 11.1%), and Administrative & Support (115 | 10.4%).
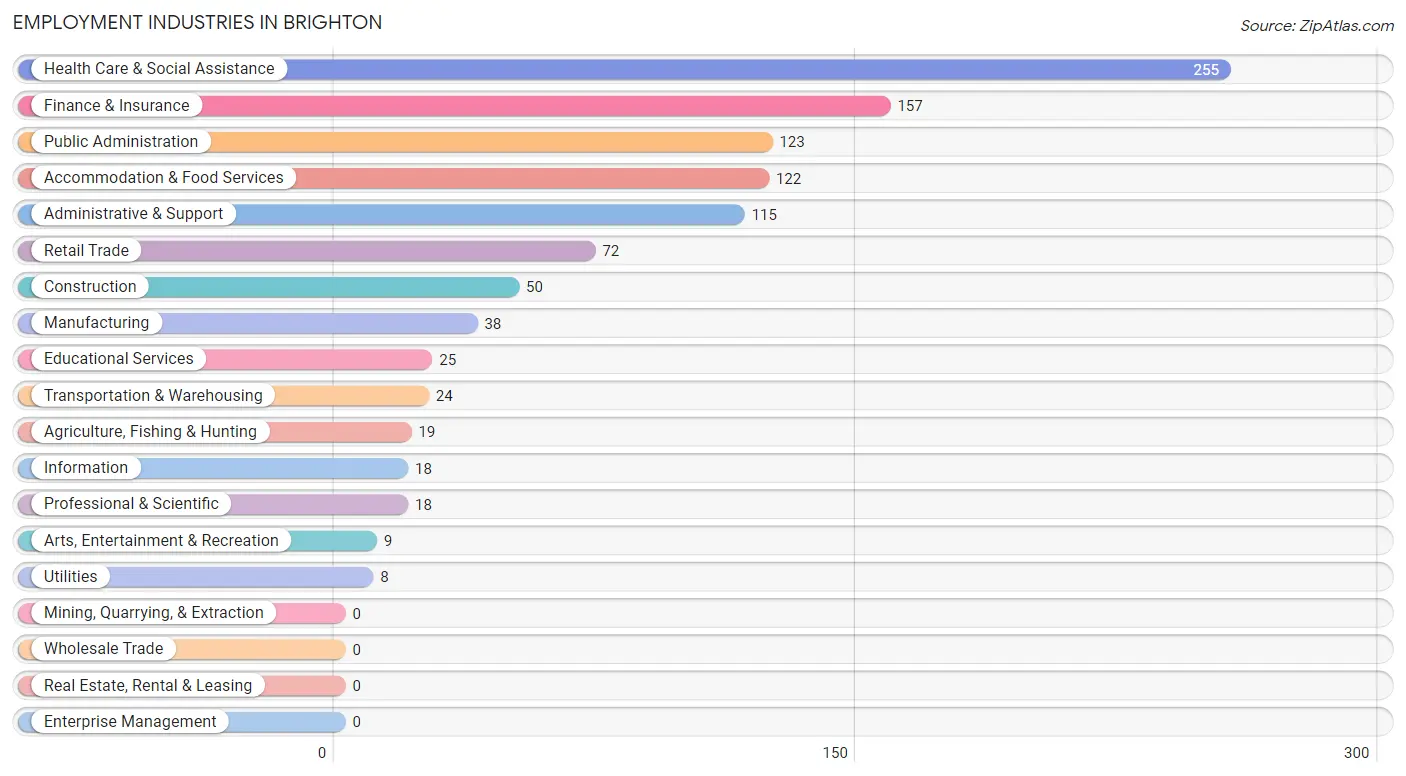
Employment Industries by Sex in Brighton
The Brighton industries that see more men than women are Agriculture, Fishing & Hunting (100.0%), Construction (100.0%), and Manufacturing (100.0%), whereas the industries that tend to have a higher number of women are Finance & Insurance (100.0%), Professional & Scientific (100.0%), and Educational Services (100.0%).
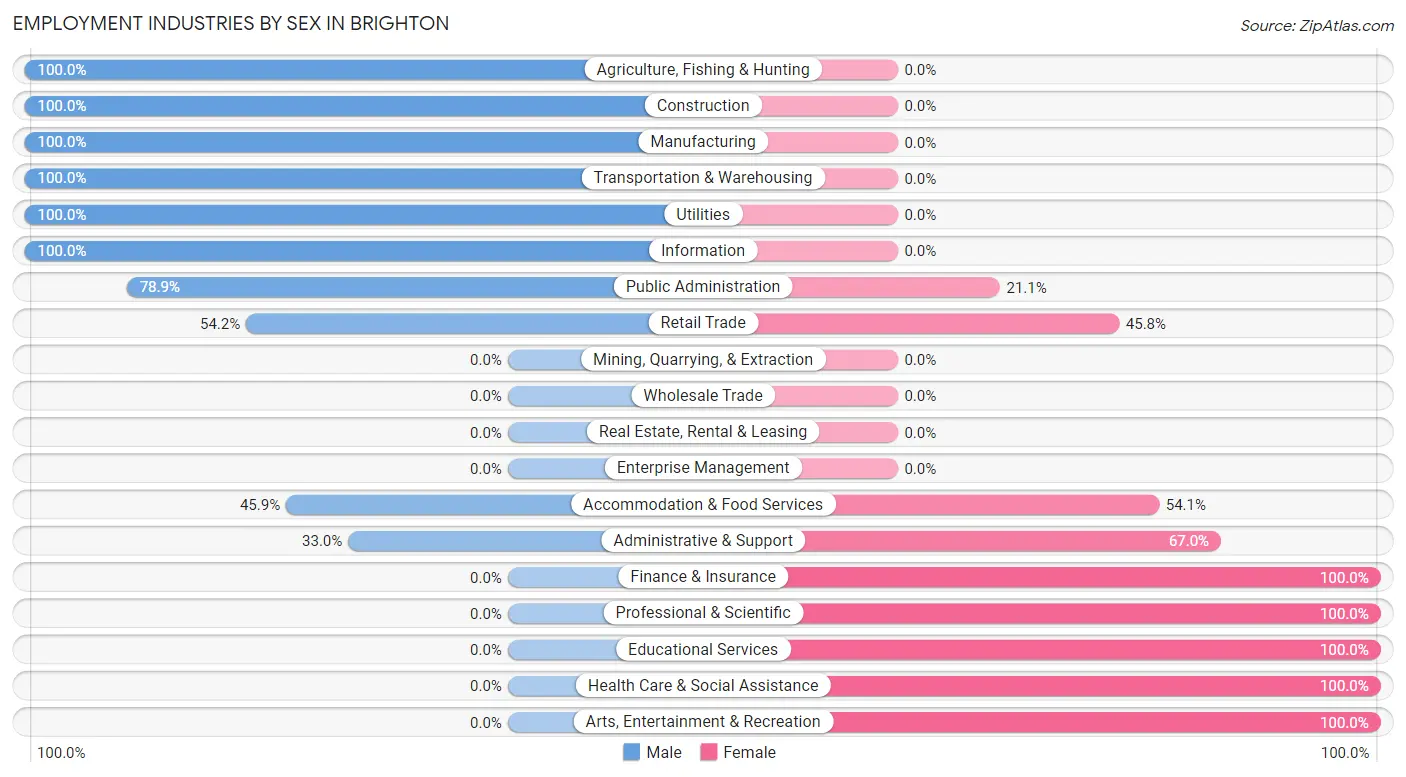
| Industry | Male | Female |
| Agriculture, Fishing & Hunting | 19 (100.0%) | 0 (0.0%) |
| Mining, Quarrying, & Extraction | 0 (0.0%) | 0 (0.0%) |
| Construction | 50 (100.0%) | 0 (0.0%) |
| Manufacturing | 38 (100.0%) | 0 (0.0%) |
| Wholesale Trade | 0 (0.0%) | 0 (0.0%) |
| Retail Trade | 39 (54.2%) | 33 (45.8%) |
| Transportation & Warehousing | 24 (100.0%) | 0 (0.0%) |
| Utilities | 8 (100.0%) | 0 (0.0%) |
| Information | 18 (100.0%) | 0 (0.0%) |
| Finance & Insurance | 0 (0.0%) | 157 (100.0%) |
| Real Estate, Rental & Leasing | 0 (0.0%) | 0 (0.0%) |
| Professional & Scientific | 0 (0.0%) | 18 (100.0%) |
| Enterprise Management | 0 (0.0%) | 0 (0.0%) |
| Administrative & Support | 38 (33.0%) | 77 (67.0%) |
| Educational Services | 0 (0.0%) | 25 (100.0%) |
| Health Care & Social Assistance | 0 (0.0%) | 255 (100.0%) |
| Arts, Entertainment & Recreation | 0 (0.0%) | 9 (100.0%) |
| Accommodation & Food Services | 56 (45.9%) | 66 (54.1%) |
| Public Administration | 97 (78.9%) | 26 (21.1%) |
| Total | 415 (37.6%) | 688 (62.4%) |
Education in Brighton
School Enrollment in Brighton
The most common levels of schooling among the 707 students in Brighton are elementary school (220 | 31.1%), college / undergraduate (191 | 27.0%), and middle school (153 | 21.6%).
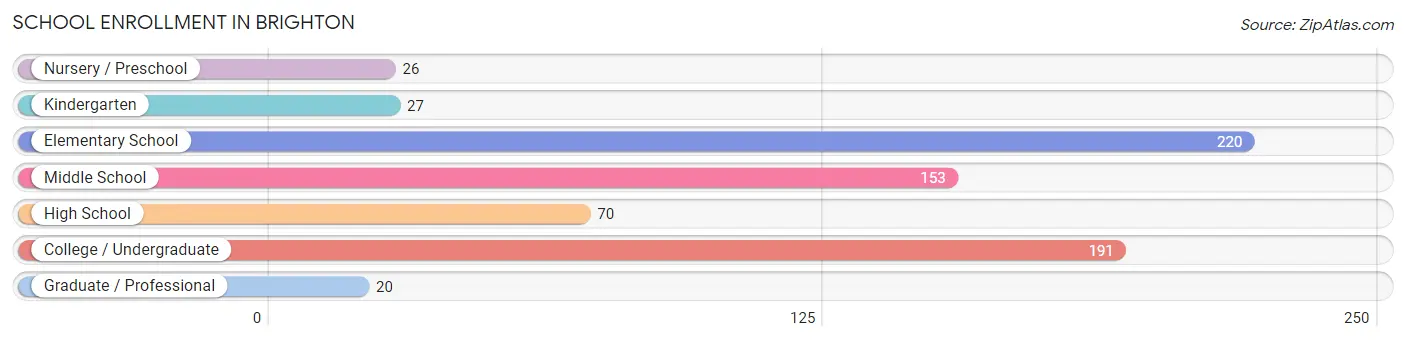
| School Level | # Students | % Students |
| Nursery / Preschool | 26 | 3.7% |
| Kindergarten | 27 | 3.8% |
| Elementary School | 220 | 31.1% |
| Middle School | 153 | 21.6% |
| High School | 70 | 9.9% |
| College / Undergraduate | 191 | 27.0% |
| Graduate / Professional | 20 | 2.8% |
| Total | 707 | 100.0% |
School Enrollment by Age by Funding Source in Brighton
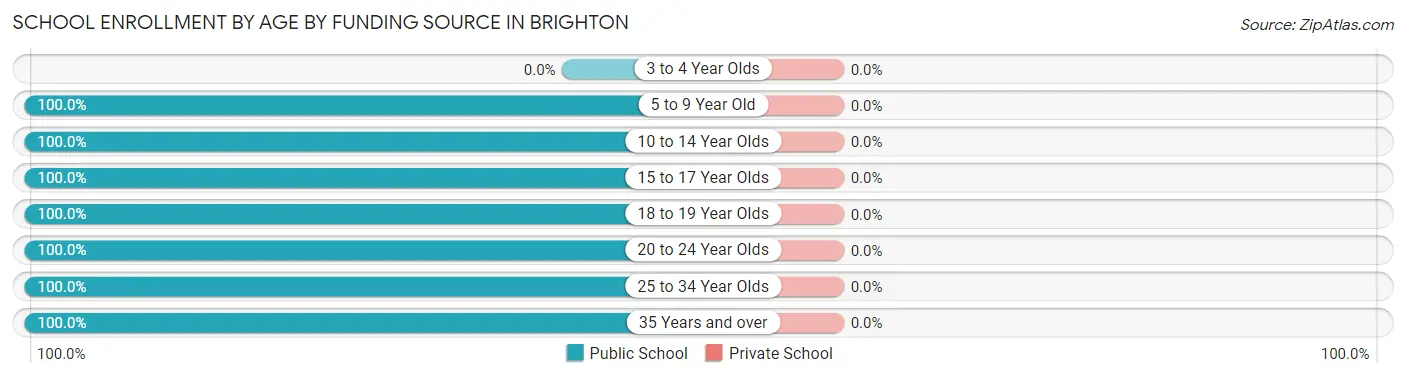
| Age Bracket | Public School | Private School |
| 3 to 4 Year Olds | 0 (0.0%) | 0 (0.0%) |
| 5 to 9 Year Old | 247 (100.0%) | 0 (0.0%) |
| 10 to 14 Year Olds | 179 (100.0%) | 0 (0.0%) |
| 15 to 17 Year Olds | 50 (100.0%) | 0 (0.0%) |
| 18 to 19 Year Olds | 27 (100.0%) | 0 (0.0%) |
| 20 to 24 Year Olds | 22 (100.0%) | 0 (0.0%) |
| 25 to 34 Year Olds | 20 (100.0%) | 0 (0.0%) |
| 35 Years and over | 162 (100.0%) | 0 (0.0%) |
| Total | 707 (100.0%) | 0 (0.0%) |
Educational Attainment by Field of Study in Brighton
Business (79 | 27.8%), computers & mathematics (51 | 18.0%), arts & humanities (43 | 15.1%), physical & health sciences (40 | 14.1%), and education (37 | 13.0%) are the most common fields of study among 284 individuals in Brighton who have obtained a bachelor's degree or higher.
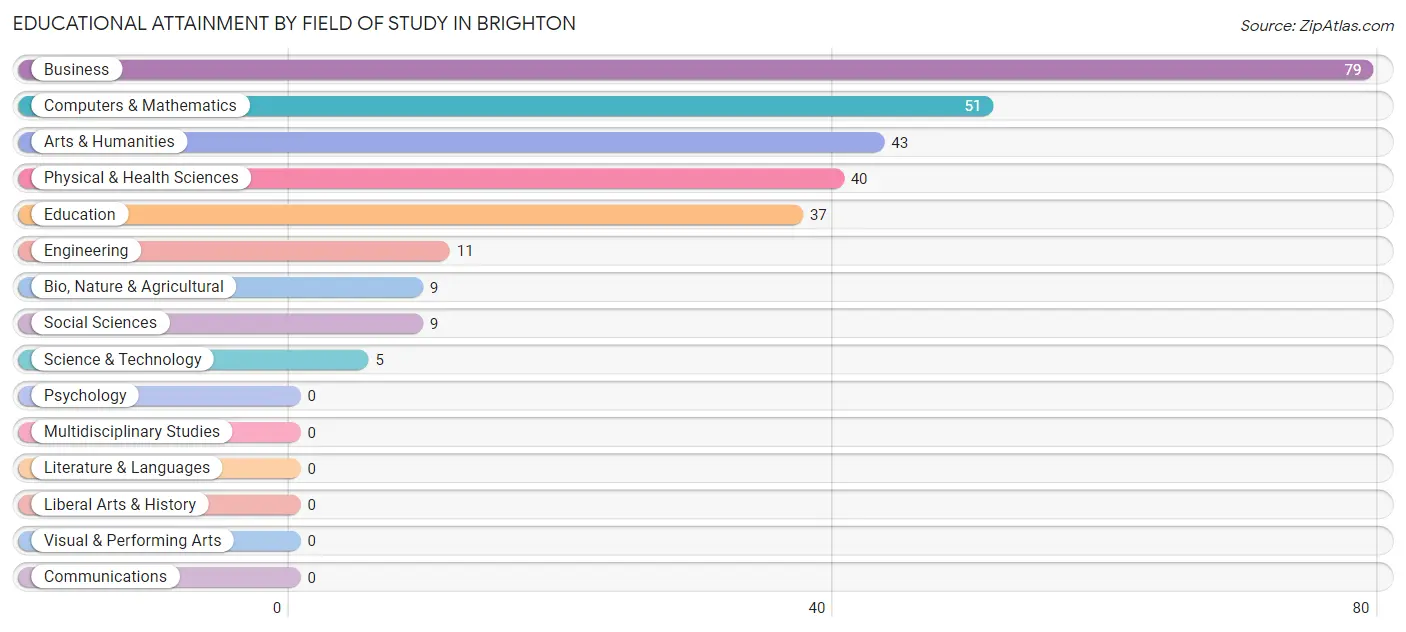
| Field of Study | # Graduates | % Graduates |
| Computers & Mathematics | 51 | 18.0% |
| Bio, Nature & Agricultural | 9 | 3.2% |
| Physical & Health Sciences | 40 | 14.1% |
| Psychology | 0 | 0.0% |
| Social Sciences | 9 | 3.2% |
| Engineering | 11 | 3.9% |
| Multidisciplinary Studies | 0 | 0.0% |
| Science & Technology | 5 | 1.8% |
| Business | 79 | 27.8% |
| Education | 37 | 13.0% |
| Literature & Languages | 0 | 0.0% |
| Liberal Arts & History | 0 | 0.0% |
| Visual & Performing Arts | 0 | 0.0% |
| Communications | 0 | 0.0% |
| Arts & Humanities | 43 | 15.1% |
| Total | 284 | 100.0% |
Transportation & Commute in Brighton
Vehicle Availability by Sex in Brighton
The most prevalent vehicle ownership categories in Brighton are males with 1 vehicle (135, accounting for 32.5%) and females with 1 vehicle (121, making up 20.3%).
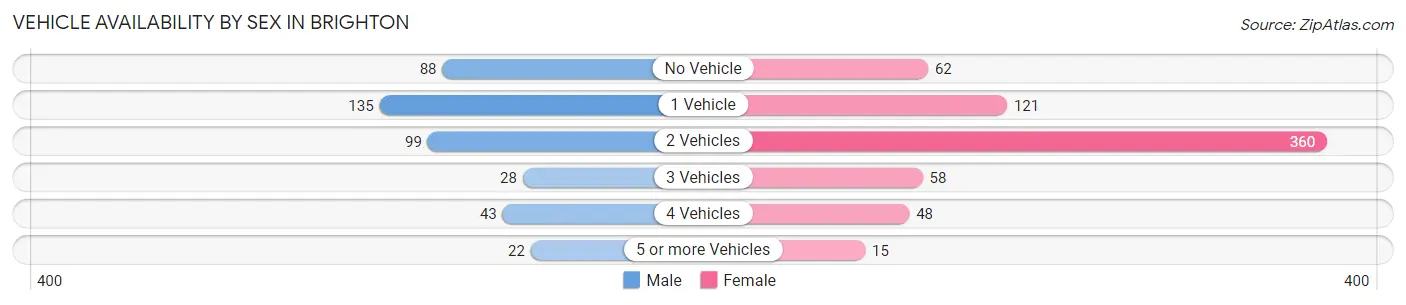
| Vehicles Available | Male | Female |
| No Vehicle | 88 (21.2%) | 62 (9.3%) |
| 1 Vehicle | 135 (32.5%) | 121 (18.2%) |
| 2 Vehicles | 99 (23.9%) | 360 (54.2%) |
| 3 Vehicles | 28 (6.8%) | 58 (8.7%) |
| 4 Vehicles | 43 (10.4%) | 48 (7.2%) |
| 5 or more Vehicles | 22 (5.3%) | 15 (2.3%) |
| Total | 415 (100.0%) | 664 (100.0%) |
Commute Time in Brighton
The most frequently occuring commute durations in Brighton are 30 to 34 minutes (314 commuters, 30.2%), 25 to 29 minutes (167 commuters, 16.1%), and 15 to 19 minutes (150 commuters, 14.4%).
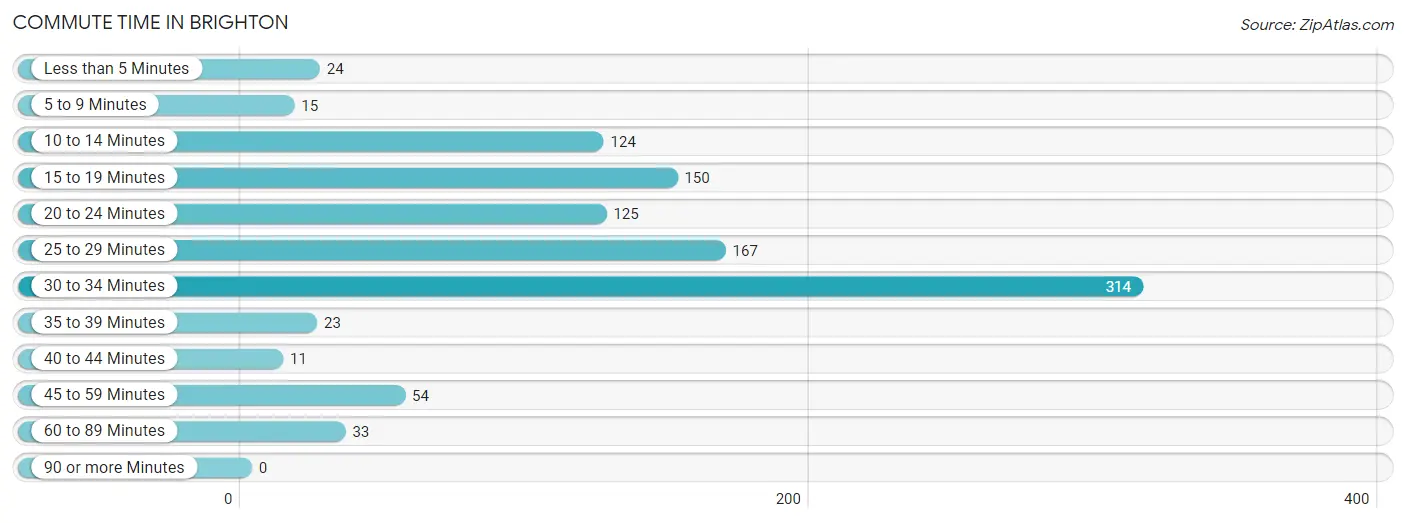
| Commute Time | # Commuters | % Commuters |
| Less than 5 Minutes | 24 | 2.3% |
| 5 to 9 Minutes | 15 | 1.4% |
| 10 to 14 Minutes | 124 | 11.9% |
| 15 to 19 Minutes | 150 | 14.4% |
| 20 to 24 Minutes | 125 | 12.0% |
| 25 to 29 Minutes | 167 | 16.1% |
| 30 to 34 Minutes | 314 | 30.2% |
| 35 to 39 Minutes | 23 | 2.2% |
| 40 to 44 Minutes | 11 | 1.1% |
| 45 to 59 Minutes | 54 | 5.2% |
| 60 to 89 Minutes | 33 | 3.2% |
| 90 or more Minutes | 0 | 0.0% |
Commute Time by Sex in Brighton
The most common commute times in Brighton are 20 to 24 minutes (94 commuters, 23.0%) for males and 30 to 34 minutes (284 commuters, 44.9%) for females.
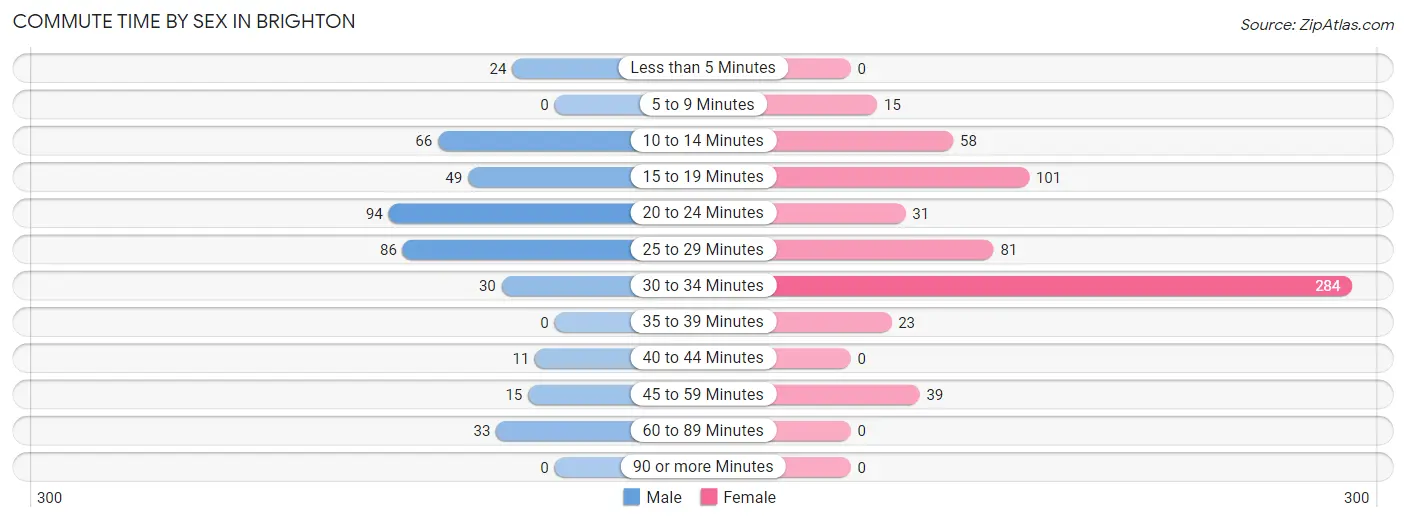
| Commute Time | Male | Female |
| Less than 5 Minutes | 24 (5.9%) | 0 (0.0%) |
| 5 to 9 Minutes | 0 (0.0%) | 15 (2.4%) |
| 10 to 14 Minutes | 66 (16.2%) | 58 (9.2%) |
| 15 to 19 Minutes | 49 (12.0%) | 101 (16.0%) |
| 20 to 24 Minutes | 94 (23.0%) | 31 (4.9%) |
| 25 to 29 Minutes | 86 (21.1%) | 81 (12.8%) |
| 30 to 34 Minutes | 30 (7.3%) | 284 (44.9%) |
| 35 to 39 Minutes | 0 (0.0%) | 23 (3.6%) |
| 40 to 44 Minutes | 11 (2.7%) | 0 (0.0%) |
| 45 to 59 Minutes | 15 (3.7%) | 39 (6.2%) |
| 60 to 89 Minutes | 33 (8.1%) | 0 (0.0%) |
| 90 or more Minutes | 0 (0.0%) | 0 (0.0%) |
Time of Departure to Work by Sex in Brighton
The most frequent times of departure to work in Brighton are 7:00 AM to 7:29 AM (74, 18.1%) for males and 12:00 PM to 3:59 PM (162, 25.6%) for females.
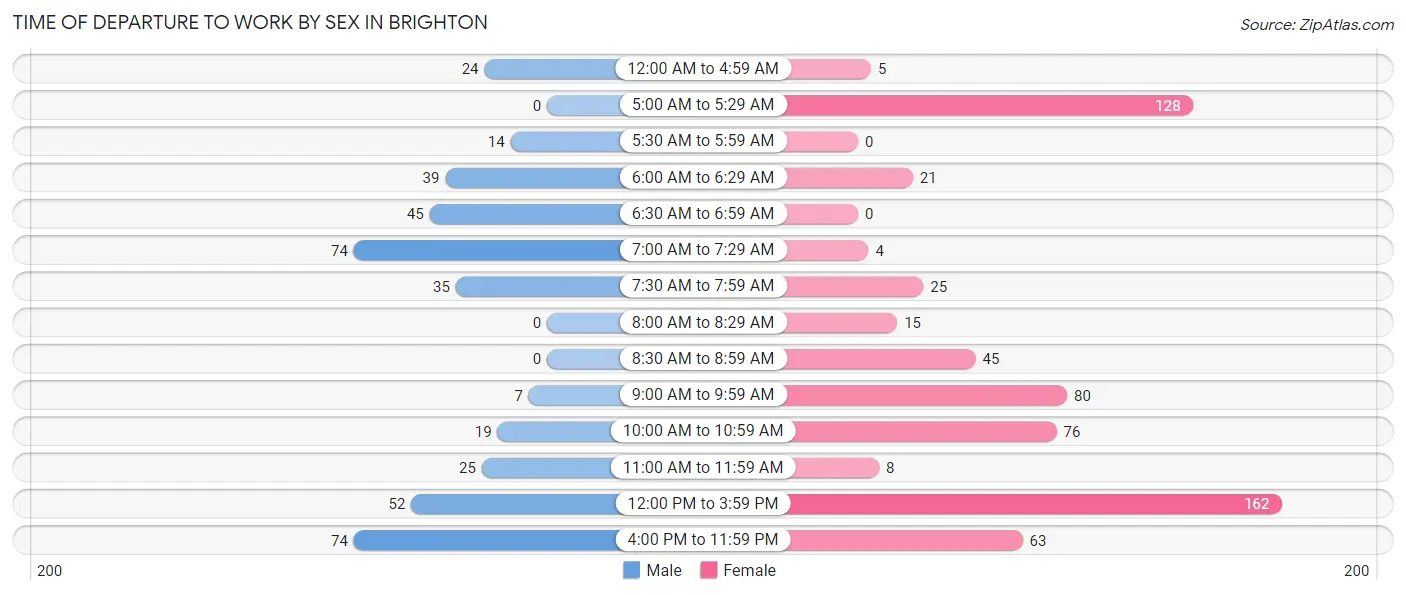
| Time of Departure | Male | Female |
| 12:00 AM to 4:59 AM | 24 (5.9%) | 5 (0.8%) |
| 5:00 AM to 5:29 AM | 0 (0.0%) | 128 (20.3%) |
| 5:30 AM to 5:59 AM | 14 (3.4%) | 0 (0.0%) |
| 6:00 AM to 6:29 AM | 39 (9.6%) | 21 (3.3%) |
| 6:30 AM to 6:59 AM | 45 (11.0%) | 0 (0.0%) |
| 7:00 AM to 7:29 AM | 74 (18.1%) | 4 (0.6%) |
| 7:30 AM to 7:59 AM | 35 (8.6%) | 25 (4.0%) |
| 8:00 AM to 8:29 AM | 0 (0.0%) | 15 (2.4%) |
| 8:30 AM to 8:59 AM | 0 (0.0%) | 45 (7.1%) |
| 9:00 AM to 9:59 AM | 7 (1.7%) | 80 (12.7%) |
| 10:00 AM to 10:59 AM | 19 (4.7%) | 76 (12.0%) |
| 11:00 AM to 11:59 AM | 25 (6.1%) | 8 (1.3%) |
| 12:00 PM to 3:59 PM | 52 (12.8%) | 162 (25.6%) |
| 4:00 PM to 11:59 PM | 74 (18.1%) | 63 (10.0%) |
| Total | 408 (100.0%) | 632 (100.0%) |
Housing Occupancy in Brighton
Occupancy by Ownership in Brighton
Of the total 1,197 dwellings in Brighton, owner-occupied units account for 846 (70.7%), while renter-occupied units make up 351 (29.3%).
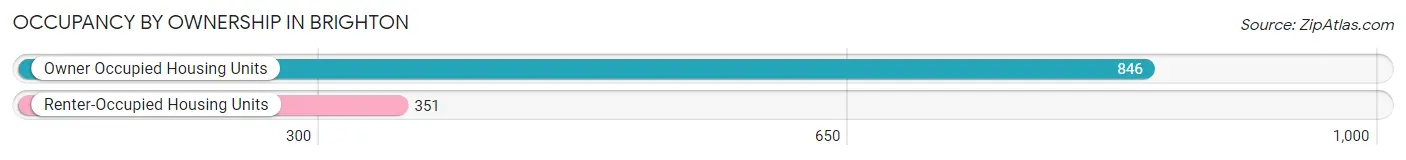
| Occupancy | # Housing Units | % Housing Units |
| Owner Occupied Housing Units | 846 | 70.7% |
| Renter-Occupied Housing Units | 351 | 29.3% |
| Total Occupied Housing Units | 1,197 | 100.0% |
Occupancy by Household Size in Brighton
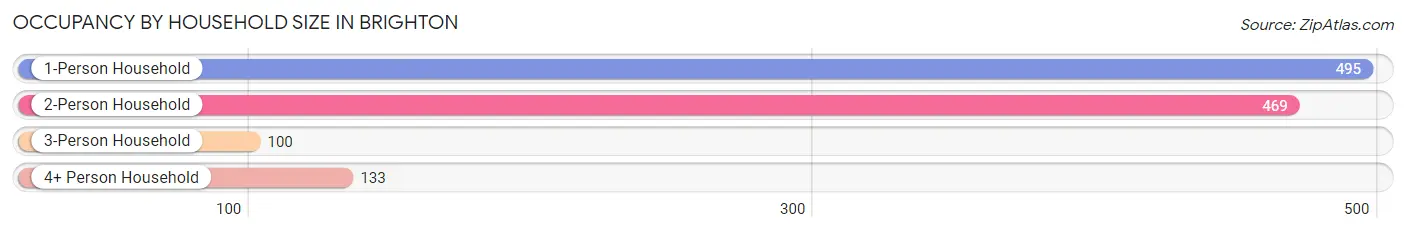
| Household Size | # Housing Units | % Housing Units |
| 1-Person Household | 495 | 41.3% |
| 2-Person Household | 469 | 39.2% |
| 3-Person Household | 100 | 8.4% |
| 4+ Person Household | 133 | 11.1% |
| Total Housing Units | 1,197 | 100.0% |
Occupancy by Ownership by Household Size in Brighton
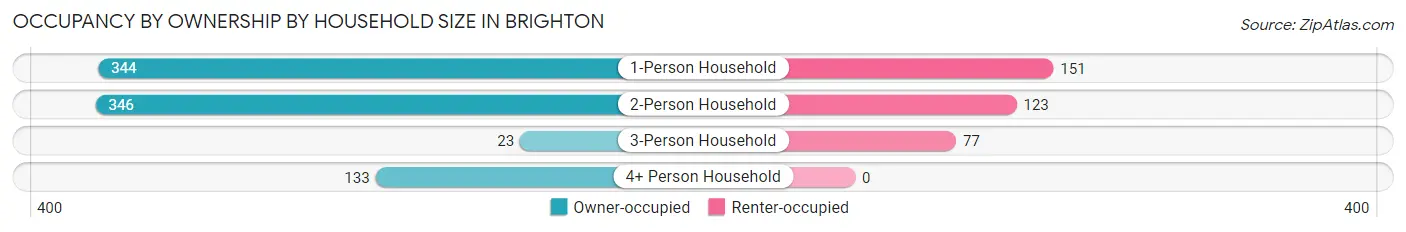
| Household Size | Owner-occupied | Renter-occupied |
| 1-Person Household | 344 (69.5%) | 151 (30.5%) |
| 2-Person Household | 346 (73.8%) | 123 (26.2%) |
| 3-Person Household | 23 (23.0%) | 77 (77.0%) |
| 4+ Person Household | 133 (100.0%) | 0 (0.0%) |
| Total Housing Units | 846 (70.7%) | 351 (29.3%) |
Occupancy by Educational Attainment in Brighton
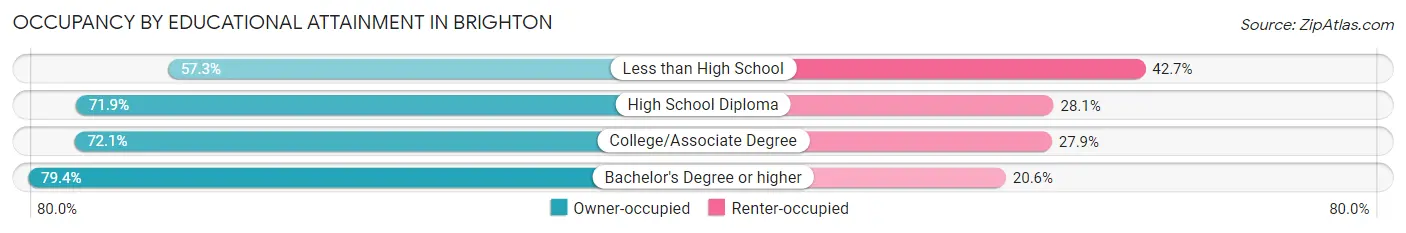
| Household Size | Owner-occupied | Renter-occupied |
| Less than High School | 102 (57.3%) | 76 (42.7%) |
| High School Diploma | 337 (71.9%) | 132 (28.1%) |
| College/Associate Degree | 295 (72.1%) | 114 (27.9%) |
| Bachelor's Degree or higher | 112 (79.4%) | 29 (20.6%) |
Occupancy by Age of Householder in Brighton
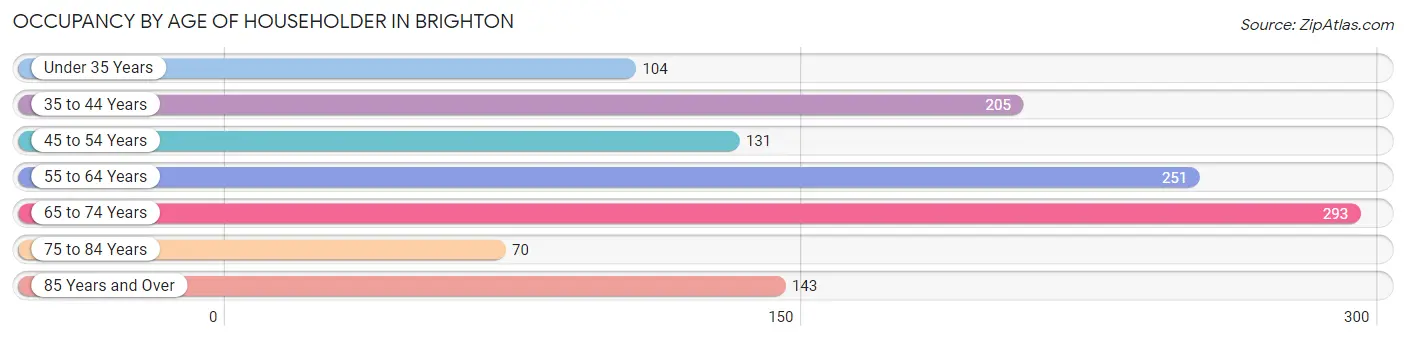
| Age Bracket | # Households | % Households |
| Under 35 Years | 104 | 8.7% |
| 35 to 44 Years | 205 | 17.1% |
| 45 to 54 Years | 131 | 10.9% |
| 55 to 64 Years | 251 | 21.0% |
| 65 to 74 Years | 293 | 24.5% |
| 75 to 84 Years | 70 | 5.9% |
| 85 Years and Over | 143 | 11.9% |
| Total | 1,197 | 100.0% |
Housing Finances in Brighton
Median Income by Occupancy in Brighton
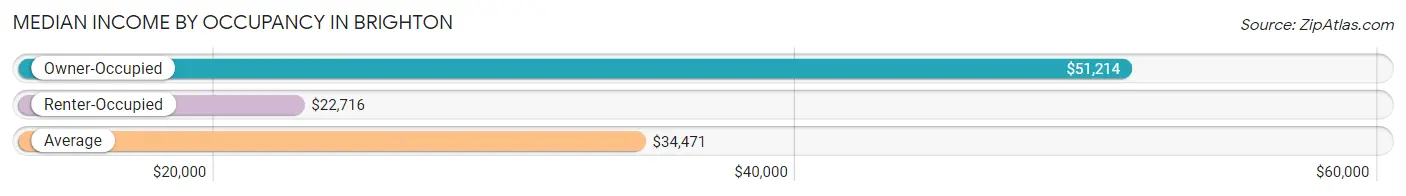
| Occupancy Type | # Households | Median Income |
| Owner-Occupied | 846 (70.7%) | $51,214 |
| Renter-Occupied | 351 (29.3%) | $22,716 |
| Average | 1,197 (100.0%) | $34,471 |
Occupancy by Householder Income Bracket in Brighton
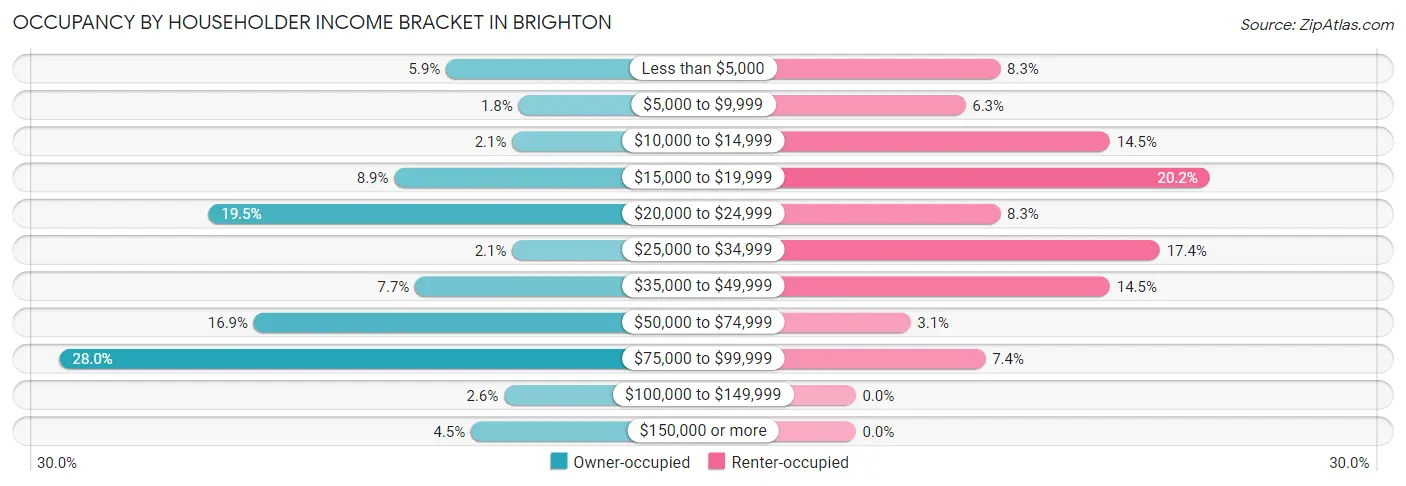
| Income Bracket | Owner-occupied | Renter-occupied |
| Less than $5,000 | 50 (5.9%) | 29 (8.3%) |
| $5,000 to $9,999 | 15 (1.8%) | 22 (6.3%) |
| $10,000 to $14,999 | 18 (2.1%) | 51 (14.5%) |
| $15,000 to $19,999 | 75 (8.9%) | 71 (20.2%) |
| $20,000 to $24,999 | 165 (19.5%) | 29 (8.3%) |
| $25,000 to $34,999 | 18 (2.1%) | 61 (17.4%) |
| $35,000 to $49,999 | 65 (7.7%) | 51 (14.5%) |
| $50,000 to $74,999 | 143 (16.9%) | 11 (3.1%) |
| $75,000 to $99,999 | 237 (28.0%) | 26 (7.4%) |
| $100,000 to $149,999 | 22 (2.6%) | 0 (0.0%) |
| $150,000 or more | 38 (4.5%) | 0 (0.0%) |
| Total | 846 (100.0%) | 351 (100.0%) |
Monthly Housing Cost Tiers in Brighton
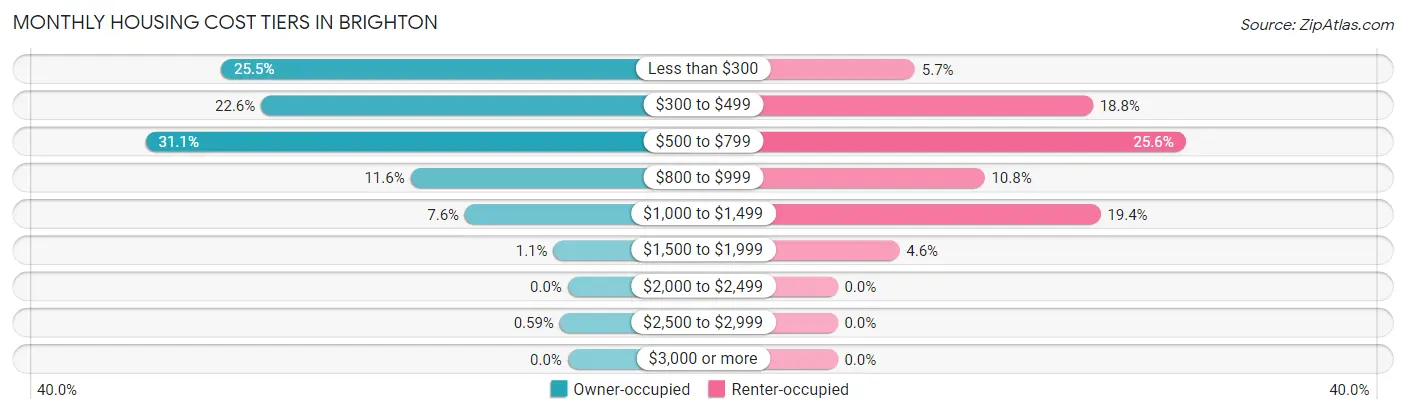
| Monthly Cost | Owner-occupied | Renter-occupied |
| Less than $300 | 216 (25.5%) | 20 (5.7%) |
| $300 to $499 | 191 (22.6%) | 66 (18.8%) |
| $500 to $799 | 263 (31.1%) | 90 (25.6%) |
| $800 to $999 | 98 (11.6%) | 38 (10.8%) |
| $1,000 to $1,499 | 64 (7.6%) | 68 (19.4%) |
| $1,500 to $1,999 | 9 (1.1%) | 16 (4.6%) |
| $2,000 to $2,499 | 0 (0.0%) | 0 (0.0%) |
| $2,500 to $2,999 | 5 (0.6%) | 0 (0.0%) |
| $3,000 or more | 0 (0.0%) | 0 (0.0%) |
| Total | 846 (100.0%) | 351 (100.0%) |
Physical Housing Characteristics in Brighton
Housing Structures in Brighton
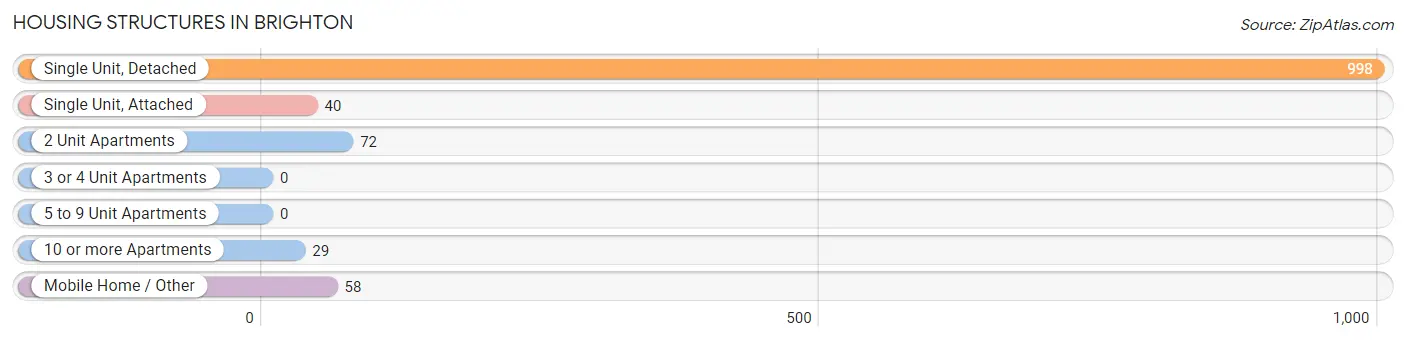
| Structure Type | # Housing Units | % Housing Units |
| Single Unit, Detached | 998 | 83.4% |
| Single Unit, Attached | 40 | 3.3% |
| 2 Unit Apartments | 72 | 6.0% |
| 3 or 4 Unit Apartments | 0 | 0.0% |
| 5 to 9 Unit Apartments | 0 | 0.0% |
| 10 or more Apartments | 29 | 2.4% |
| Mobile Home / Other | 58 | 4.9% |
| Total | 1,197 | 100.0% |
Housing Structures by Occupancy in Brighton
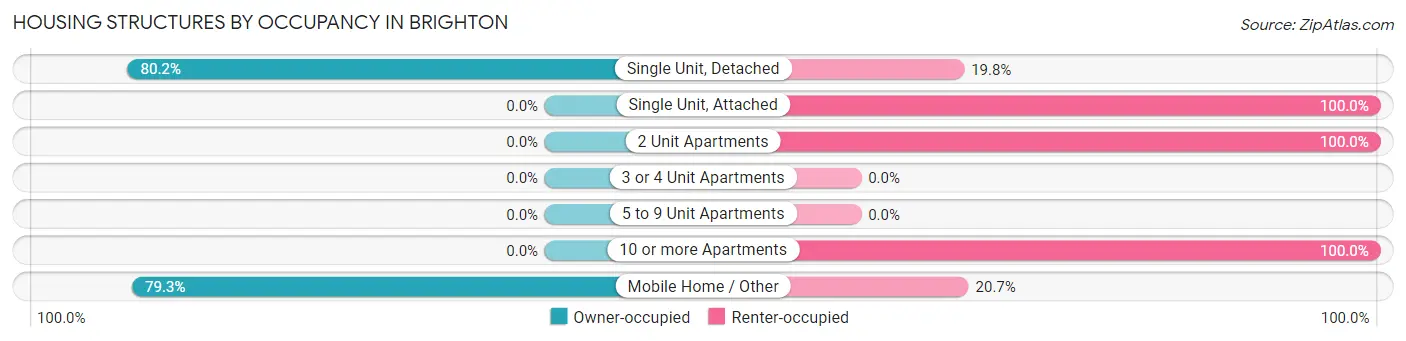
| Structure Type | Owner-occupied | Renter-occupied |
| Single Unit, Detached | 800 (80.2%) | 198 (19.8%) |
| Single Unit, Attached | 0 (0.0%) | 40 (100.0%) |
| 2 Unit Apartments | 0 (0.0%) | 72 (100.0%) |
| 3 or 4 Unit Apartments | 0 (0.0%) | 0 (0.0%) |
| 5 to 9 Unit Apartments | 0 (0.0%) | 0 (0.0%) |
| 10 or more Apartments | 0 (0.0%) | 29 (100.0%) |
| Mobile Home / Other | 46 (79.3%) | 12 (20.7%) |
| Total | 846 (70.7%) | 351 (29.3%) |
Housing Structures by Number of Rooms in Brighton
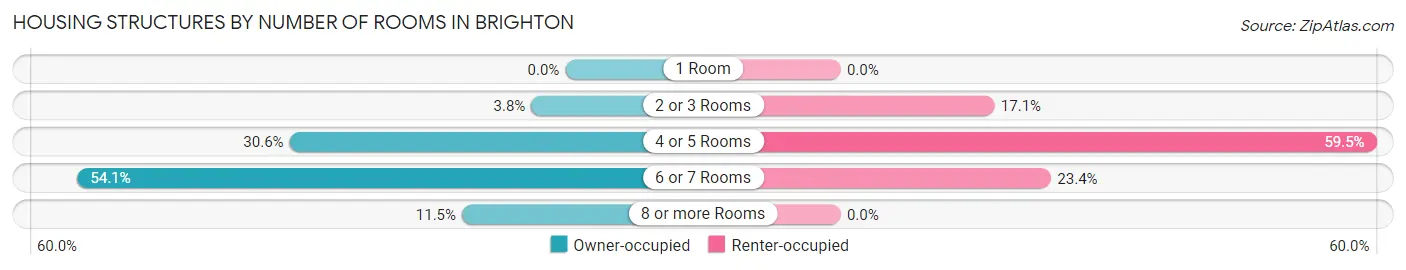
| Number of Rooms | Owner-occupied | Renter-occupied |
| 1 Room | 0 (0.0%) | 0 (0.0%) |
| 2 or 3 Rooms | 32 (3.8%) | 60 (17.1%) |
| 4 or 5 Rooms | 259 (30.6%) | 209 (59.5%) |
| 6 or 7 Rooms | 458 (54.1%) | 82 (23.4%) |
| 8 or more Rooms | 97 (11.5%) | 0 (0.0%) |
| Total | 846 (100.0%) | 351 (100.0%) |
Housing Structure by Heating Type in Brighton
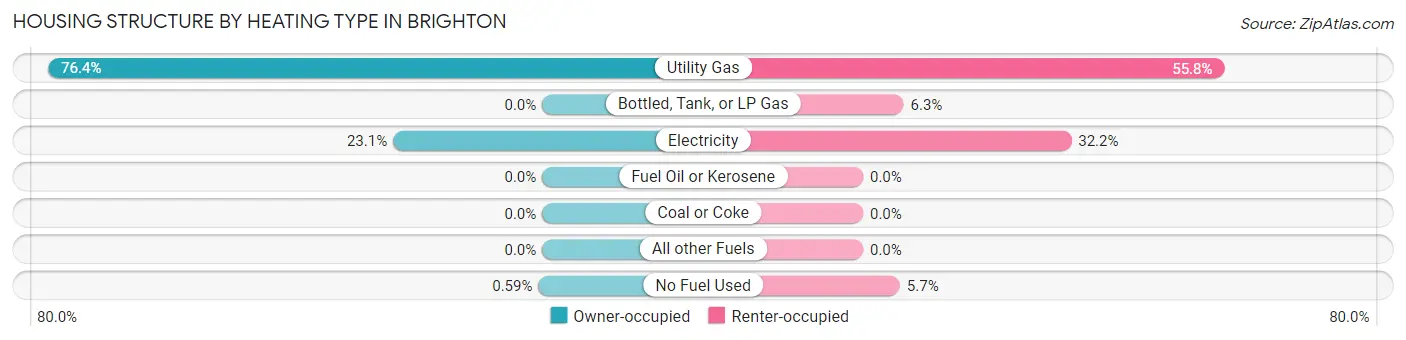
| Heating Type | Owner-occupied | Renter-occupied |
| Utility Gas | 646 (76.4%) | 196 (55.8%) |
| Bottled, Tank, or LP Gas | 0 (0.0%) | 22 (6.3%) |
| Electricity | 195 (23.1%) | 113 (32.2%) |
| Fuel Oil or Kerosene | 0 (0.0%) | 0 (0.0%) |
| Coal or Coke | 0 (0.0%) | 0 (0.0%) |
| All other Fuels | 0 (0.0%) | 0 (0.0%) |
| No Fuel Used | 5 (0.6%) | 20 (5.7%) |
| Total | 846 (100.0%) | 351 (100.0%) |
Household Vehicle Usage in Brighton
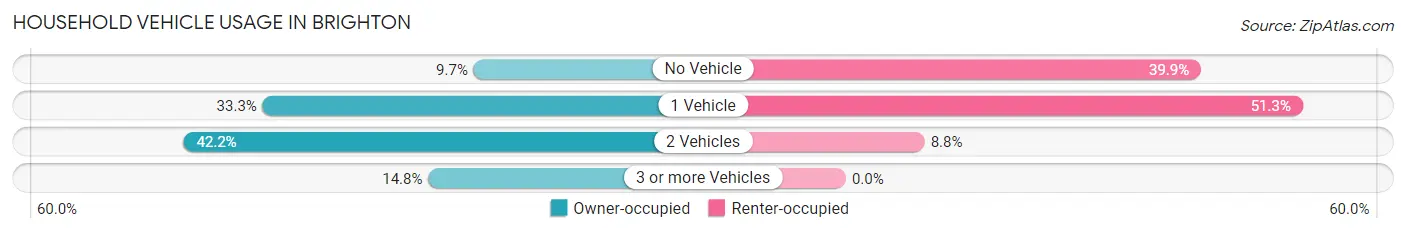
| Vehicles per Household | Owner-occupied | Renter-occupied |
| No Vehicle | 82 (9.7%) | 140 (39.9%) |
| 1 Vehicle | 282 (33.3%) | 180 (51.3%) |
| 2 Vehicles | 357 (42.2%) | 31 (8.8%) |
| 3 or more Vehicles | 125 (14.8%) | 0 (0.0%) |
| Total | 846 (100.0%) | 351 (100.0%) |
Real Estate & Mortgages in Brighton
Real Estate and Mortgage Overview in Brighton
| Characteristic | Without Mortgage | With Mortgage |
| Housing Units | 460 | 386 |
| Median Property Value | $55,800 | $91,800 |
| Median Household Income | - | - |
| Monthly Housing Costs | $316 | $0 |
| Real Estate Taxes | $359 | $58 |
Property Value by Mortgage Status in Brighton
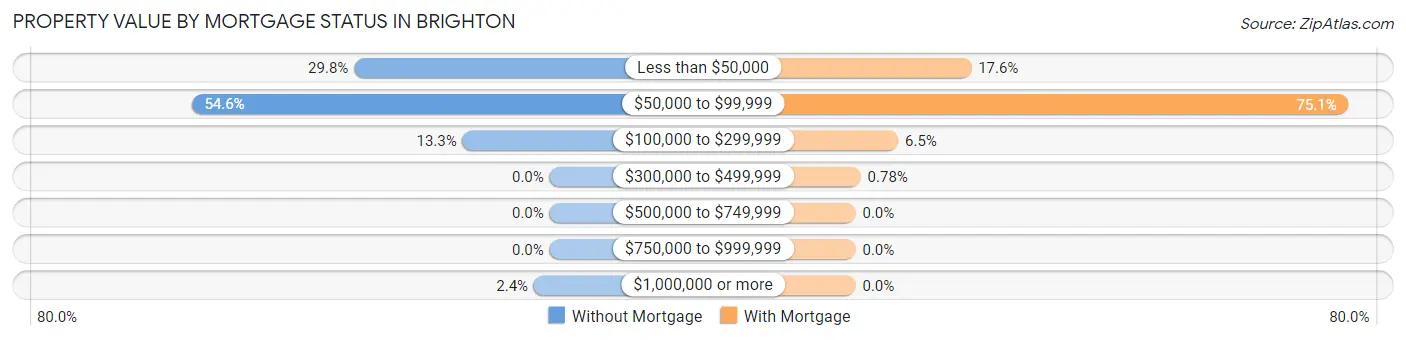
| Property Value | Without Mortgage | With Mortgage |
| Less than $50,000 | 137 (29.8%) | 68 (17.6%) |
| $50,000 to $99,999 | 251 (54.6%) | 290 (75.1%) |
| $100,000 to $299,999 | 61 (13.3%) | 25 (6.5%) |
| $300,000 to $499,999 | 0 (0.0%) | 3 (0.8%) |
| $500,000 to $749,999 | 0 (0.0%) | 0 (0.0%) |
| $750,000 to $999,999 | 0 (0.0%) | 0 (0.0%) |
| $1,000,000 or more | 11 (2.4%) | 0 (0.0%) |
| Total | 460 (100.0%) | 386 (100.0%) |
Household Income by Mortgage Status in Brighton
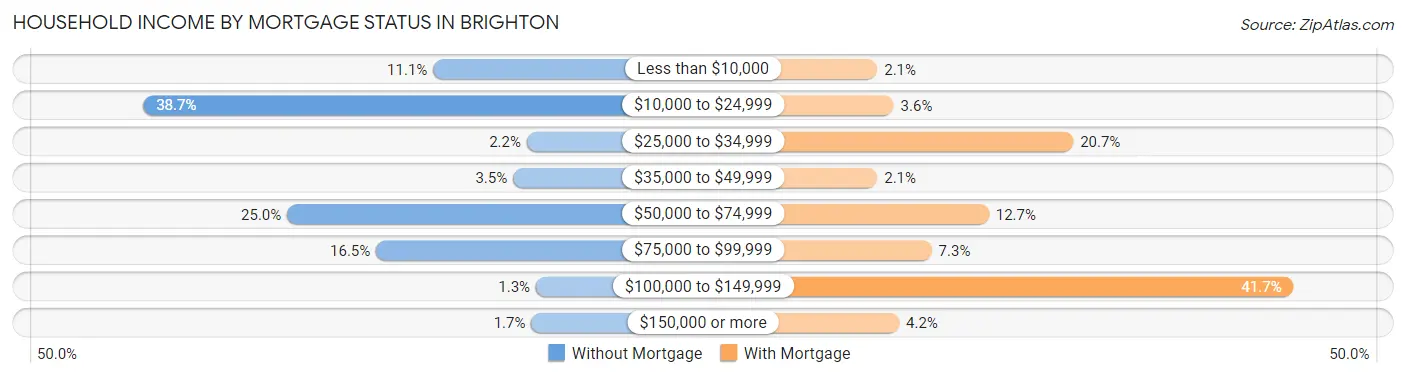
| Household Income | Without Mortgage | With Mortgage |
| Less than $10,000 | 51 (11.1%) | 8 (2.1%) |
| $10,000 to $24,999 | 178 (38.7%) | 14 (3.6%) |
| $25,000 to $34,999 | 10 (2.2%) | 80 (20.7%) |
| $35,000 to $49,999 | 16 (3.5%) | 8 (2.1%) |
| $50,000 to $74,999 | 115 (25.0%) | 49 (12.7%) |
| $75,000 to $99,999 | 76 (16.5%) | 28 (7.2%) |
| $100,000 to $149,999 | 6 (1.3%) | 161 (41.7%) |
| $150,000 or more | 8 (1.7%) | 16 (4.2%) |
| Total | 460 (100.0%) | 386 (100.0%) |
Property Value to Household Income Ratio in Brighton
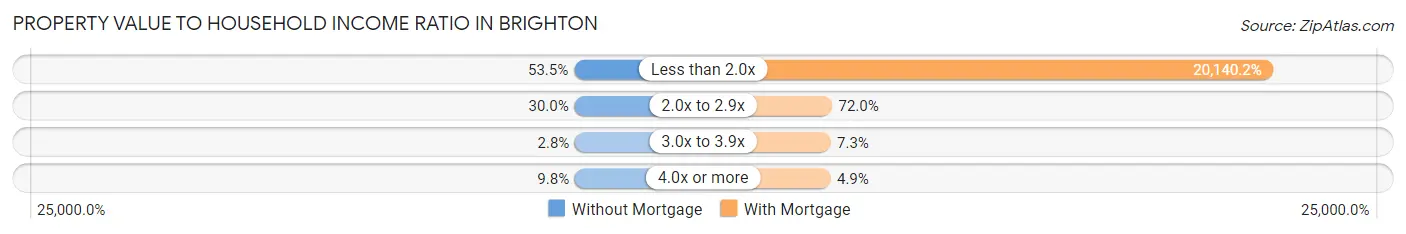
| Value-to-Income Ratio | Without Mortgage | With Mortgage |
| Less than 2.0x | 246 (53.5%) | 77,741 (20,140.2%) |
| 2.0x to 2.9x | 138 (30.0%) | 278 (72.0%) |
| 3.0x to 3.9x | 13 (2.8%) | 28 (7.2%) |
| 4.0x or more | 45 (9.8%) | 19 (4.9%) |
| Total | 460 (100.0%) | 386 (100.0%) |
Real Estate Taxes by Mortgage Status in Brighton
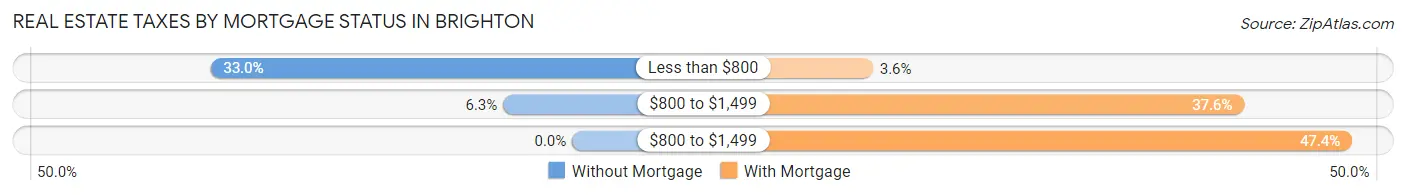
| Property Taxes | Without Mortgage | With Mortgage |
| Less than $800 | 152 (33.0%) | 14 (3.6%) |
| $800 to $1,499 | 29 (6.3%) | 145 (37.6%) |
| $800 to $1,499 | 0 (0.0%) | 183 (47.4%) |
| Total | 460 (100.0%) | 386 (100.0%) |
Health & Disability in Brighton
Health Insurance Coverage by Age in Brighton
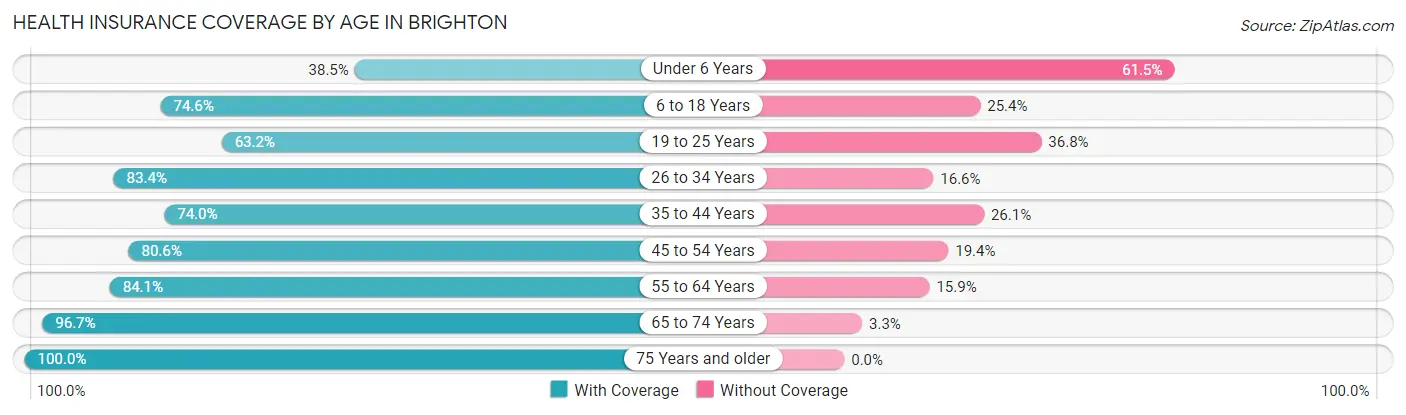
| Age Bracket | With Coverage | Without Coverage |
| Under 6 Years | 130 (38.5%) | 208 (61.5%) |
| 6 to 18 Years | 359 (74.6%) | 122 (25.4%) |
| 19 to 25 Years | 43 (63.2%) | 25 (36.8%) |
| 26 to 34 Years | 241 (83.4%) | 48 (16.6%) |
| 35 to 44 Years | 247 (74.0%) | 87 (26.1%) |
| 45 to 54 Years | 212 (80.6%) | 51 (19.4%) |
| 55 to 64 Years | 450 (84.1%) | 85 (15.9%) |
| 65 to 74 Years | 379 (96.7%) | 13 (3.3%) |
| 75 Years and older | 283 (100.0%) | 0 (0.0%) |
| Total | 2,344 (78.6%) | 639 (21.4%) |
Health Insurance Coverage by Citizenship Status in Brighton
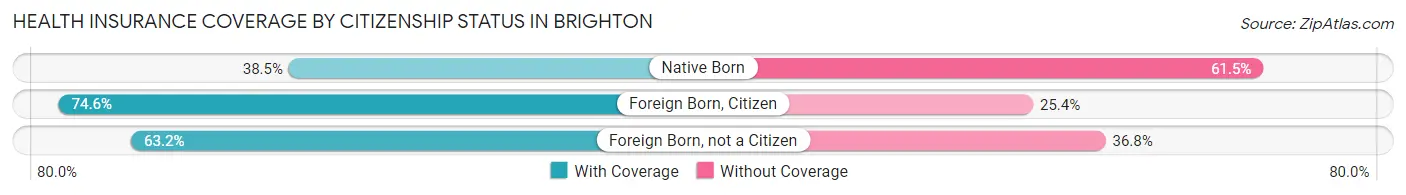
| Citizenship Status | With Coverage | Without Coverage |
| Native Born | 130 (38.5%) | 208 (61.5%) |
| Foreign Born, Citizen | 359 (74.6%) | 122 (25.4%) |
| Foreign Born, not a Citizen | 43 (63.2%) | 25 (36.8%) |
Health Insurance Coverage by Household Income in Brighton
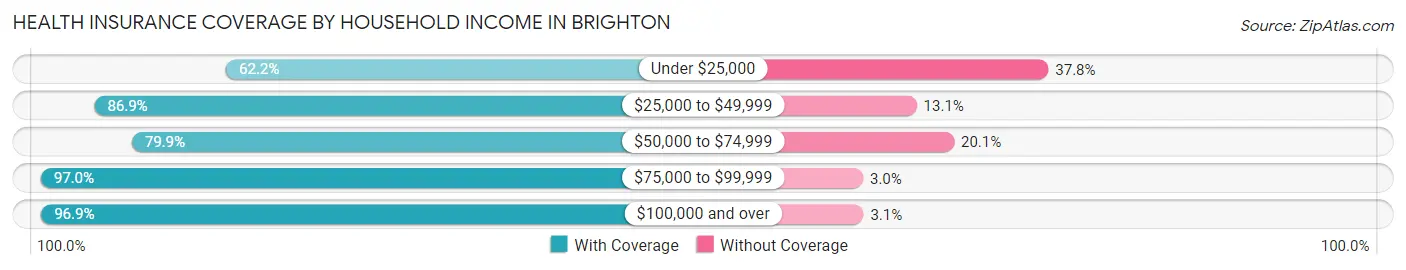
| Household Income | With Coverage | Without Coverage |
| Under $25,000 | 760 (62.2%) | 461 (37.8%) |
| $25,000 to $49,999 | 458 (86.9%) | 69 (13.1%) |
| $50,000 to $74,999 | 338 (79.9%) | 85 (20.1%) |
| $75,000 to $99,999 | 510 (97.0%) | 16 (3.0%) |
| $100,000 and over | 248 (96.9%) | 8 (3.1%) |
Public vs Private Health Insurance Coverage by Age in Brighton

| Age Bracket | Public Insurance | Private Insurance |
| Under 6 | 130 (38.5%) | 46 (13.6%) |
| 6 to 18 Years | 283 (58.8%) | 122 (25.4%) |
| 19 to 25 Years | 0 (0.0%) | 43 (63.2%) |
| 25 to 34 Years | 64 (22.2%) | 177 (61.3%) |
| 35 to 44 Years | 27 (8.1%) | 220 (65.9%) |
| 45 to 54 Years | 105 (39.9%) | 138 (52.5%) |
| 55 to 64 Years | 122 (22.8%) | 343 (64.1%) |
| 65 to 74 Years | 379 (96.7%) | 142 (36.2%) |
| 75 Years and over | 283 (100.0%) | 195 (68.9%) |
| Total | 1,393 (46.7%) | 1,426 (47.8%) |
Disability Status by Sex by Age in Brighton
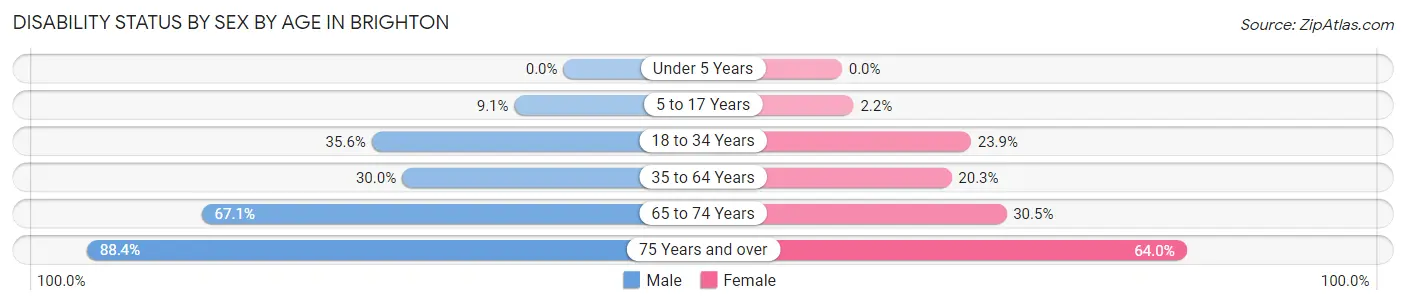
| Age Bracket | Male | Female |
| Under 5 Years | 0 (0.0%) | 0 (0.0%) |
| 5 to 17 Years | 19 (9.1%) | 6 (2.2%) |
| 18 to 34 Years | 74 (35.6%) | 45 (23.9%) |
| 35 to 64 Years | 130 (29.9%) | 142 (20.3%) |
| 65 to 74 Years | 96 (67.1%) | 76 (30.5%) |
| 75 Years and over | 130 (88.4%) | 87 (64.0%) |
Disability Class by Sex by Age in Brighton
Disability Class: Hearing Difficulty
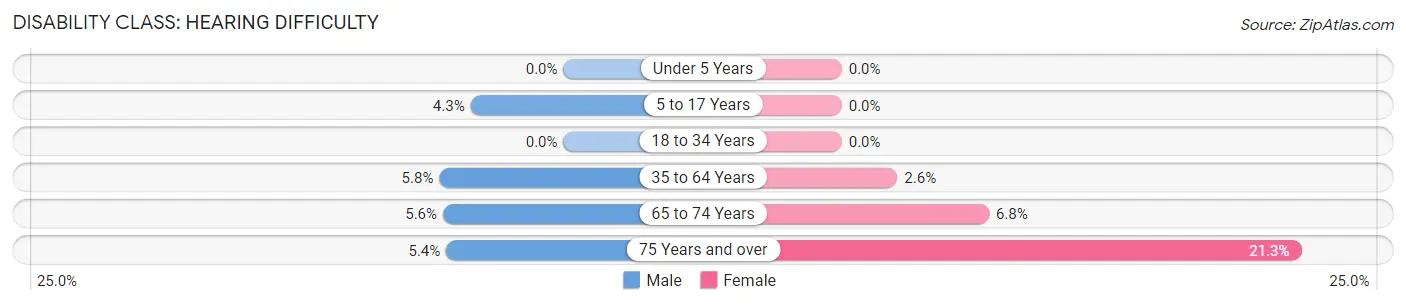
| Age Bracket | Male | Female |
| Under 5 Years | 0 (0.0%) | 0 (0.0%) |
| 5 to 17 Years | 9 (4.3%) | 0 (0.0%) |
| 18 to 34 Years | 0 (0.0%) | 0 (0.0%) |
| 35 to 64 Years | 25 (5.8%) | 18 (2.6%) |
| 65 to 74 Years | 8 (5.6%) | 17 (6.8%) |
| 75 Years and over | 8 (5.4%) | 29 (21.3%) |
Disability Class: Vision Difficulty
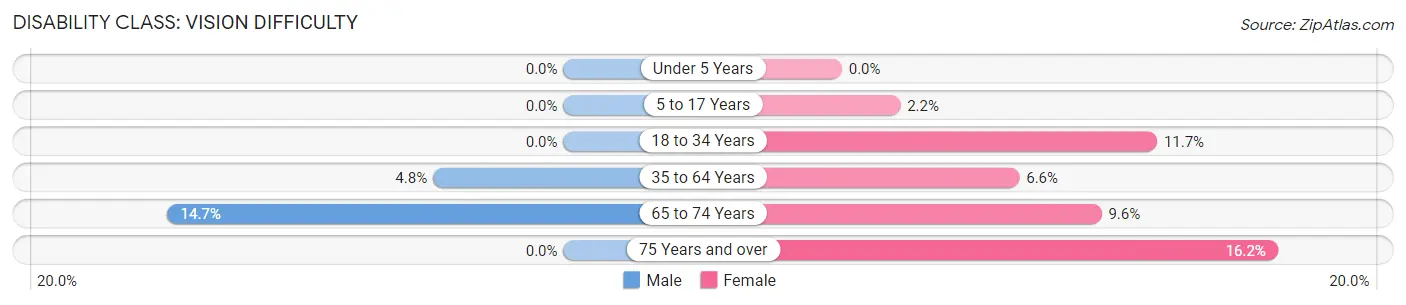
| Age Bracket | Male | Female |
| Under 5 Years | 0 (0.0%) | 0 (0.0%) |
| 5 to 17 Years | 0 (0.0%) | 6 (2.2%) |
| 18 to 34 Years | 0 (0.0%) | 22 (11.7%) |
| 35 to 64 Years | 21 (4.8%) | 46 (6.6%) |
| 65 to 74 Years | 21 (14.7%) | 24 (9.6%) |
| 75 Years and over | 0 (0.0%) | 22 (16.2%) |
Disability Class: Cognitive Difficulty
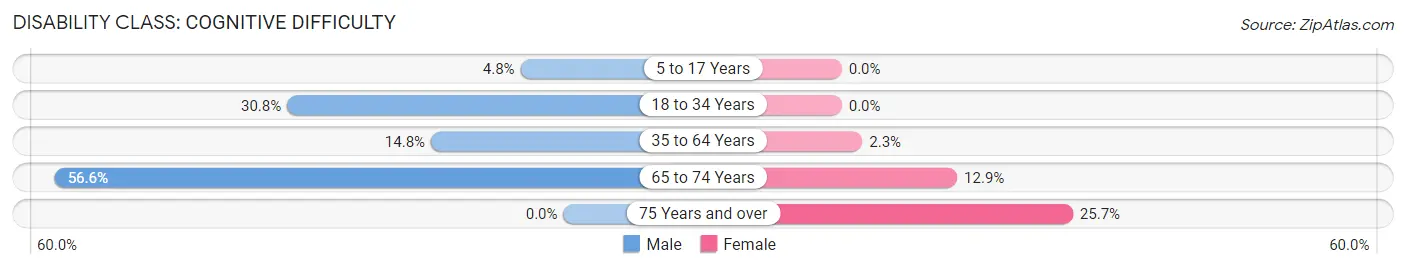
| Age Bracket | Male | Female |
| 5 to 17 Years | 10 (4.8%) | 0 (0.0%) |
| 18 to 34 Years | 64 (30.8%) | 0 (0.0%) |
| 35 to 64 Years | 64 (14.7%) | 16 (2.3%) |
| 65 to 74 Years | 81 (56.6%) | 32 (12.9%) |
| 75 Years and over | 0 (0.0%) | 35 (25.7%) |
Disability Class: Ambulatory Difficulty
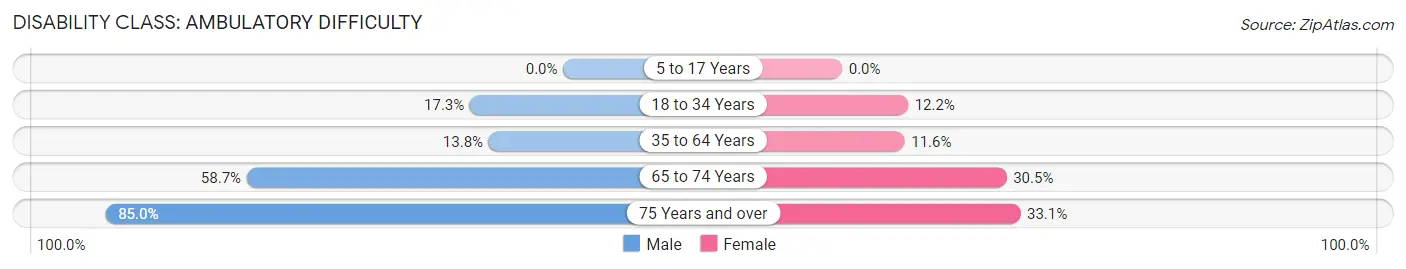
| Age Bracket | Male | Female |
| 5 to 17 Years | 0 (0.0%) | 0 (0.0%) |
| 18 to 34 Years | 36 (17.3%) | 23 (12.2%) |
| 35 to 64 Years | 60 (13.8%) | 81 (11.6%) |
| 65 to 74 Years | 84 (58.7%) | 76 (30.5%) |
| 75 Years and over | 125 (85.0%) | 45 (33.1%) |
Disability Class: Self-Care Difficulty
| Age Bracket | Male | Female |
| 5 to 17 Years | 0 (0.0%) | 0 (0.0%) |
| 18 to 34 Years | 0 (0.0%) | 0 (0.0%) |
| 35 to 64 Years | 5 (1.1%) | 22 (3.2%) |
| 65 to 74 Years | 68 (47.5%) | 17 (6.8%) |
| 75 Years and over | 12 (8.2%) | 47 (34.6%) |
Technology Access in Brighton
Computing Device Access in Brighton
| Device Type | # Households | % Households |
| Desktop or Laptop | 513 | 42.9% |
| Smartphone | 852 | 71.2% |
| Tablet | 510 | 42.6% |
| No Computing Device | 264 | 22.1% |
| Total | 1,197 | 100.0% |
Internet Access in Brighton
| Internet Type | # Households | % Households |
| Dial-Up Internet | 0 | 0.0% |
| Broadband Home | 636 | 53.1% |
| Cellular Data Only | 120 | 10.0% |
| Satellite Internet | 99 | 8.3% |
| No Internet | 391 | 32.7% |
| Total | 1,197 | 100.0% |
Brighton Summary
Brighton is a small city located in Jefferson County, Alabama. It is situated on the banks of the Black Warrior River, approximately 10 miles northwest of Birmingham. The city has a population of approximately 4,000 people and is part of the Birmingham-Hoover Metropolitan Statistical Area.
History
Brighton was founded in 1818 by settlers from the Creek Nation. The city was originally known as “Brighton Town” and was the first settlement in Jefferson County. The city was named after the English city of Brighton, which was the hometown of one of the settlers.
In 1820, the city was incorporated and the first mayor was elected. During the Civil War, Brighton was a major supply center for the Confederate Army. After the war, the city experienced a period of growth and development. In 1887, the city was connected to Birmingham by the Birmingham and Northwestern Railroad.
In the early 20th century, Brighton was a major center for coal mining. The city was also home to several manufacturing plants, including a cotton mill and a brick factory.
Geography
Brighton is located in the foothills of the Appalachian Mountains. The city is situated on the banks of the Black Warrior River, approximately 10 miles northwest of Birmingham. The city has a total area of 4.2 square miles, all of which is land.
The climate in Brighton is humid subtropical, with hot, humid summers and mild winters. The average annual temperature is 64°F, with an average high of 87°F in the summer and an average low of 41°F in the winter.
Economy
The economy of Brighton is largely based on manufacturing and retail. The city is home to several manufacturing plants, including a cotton mill and a brick factory. The city is also home to several retail stores, including a Walmart Supercenter and a Lowe’s Home Improvement store.
The city is also home to several small businesses, including restaurants, bars, and shops. The city is also home to several medical facilities, including a hospital and several clinics.
Demographics
As of the 2010 census, the population of Brighton was 4,000. The racial makeup of the city was 79.3% African American, 17.2% White, 0.7% Asian, 0.3% Native American, and 2.5% from other races.
The median household income in Brighton was $30,938, and the median family income was $35,625. The per capita income in the city was $14,945. Approximately 24.3% of the population was below the poverty line.
Brighton is served by the Jefferson County School System. The city is home to one elementary school, one middle school, and one high school. The city is also home to several private schools, including a Catholic school and a Montessori school.
Common Questions
What is Per Capita Income in Brighton?
Per Capita income in Brighton is $20,222.
What is the Median Family Income in Brighton?
Median Family Income in Brighton is $58,264.
What is the Median Household income in Brighton?
Median Household Income in Brighton is $34,471.
What is Income or Wage Gap in Brighton?
Income or Wage Gap in Brighton is 14.2%.
Women in Brighton earn 85.8 cents for every dollar earned by a man.
What is Inequality or Gini Index in Brighton?
Inequality or Gini Index in Brighton is 0.44.
What is the Total Population of Brighton?
Total Population of Brighton is 2,983.
What is the Total Male Population of Brighton?
Total Male Population of Brighton is 1,390.
What is the Total Female Population of Brighton?
Total Female Population of Brighton is 1,593.
What is the Ratio of Males per 100 Females in Brighton?
There are 87.26 Males per 100 Females in Brighton.
What is the Ratio of Females per 100 Males in Brighton?
There are 114.60 Females per 100 Males in Brighton.
What is the Median Population Age in Brighton?
Median Population Age in Brighton is 43.9 Years.
What is the Average Family Size in Brighton
Average Family Size in Brighton is 3.4 People.
What is the Average Household Size in Brighton
Average Household Size in Brighton is 2.5 People.
How Large is the Labor Force in Brighton?
There are 1,259 People in the Labor Forcein in Brighton.
What is the Percentage of People in the Labor Force in Brighton?
56.3% of People are in the Labor Force in Brighton.
What is the Unemployment Rate in Brighton?
Unemployment Rate in Brighton is 12.4%.