Boligee, AL Map & Demographics
Boligee Map
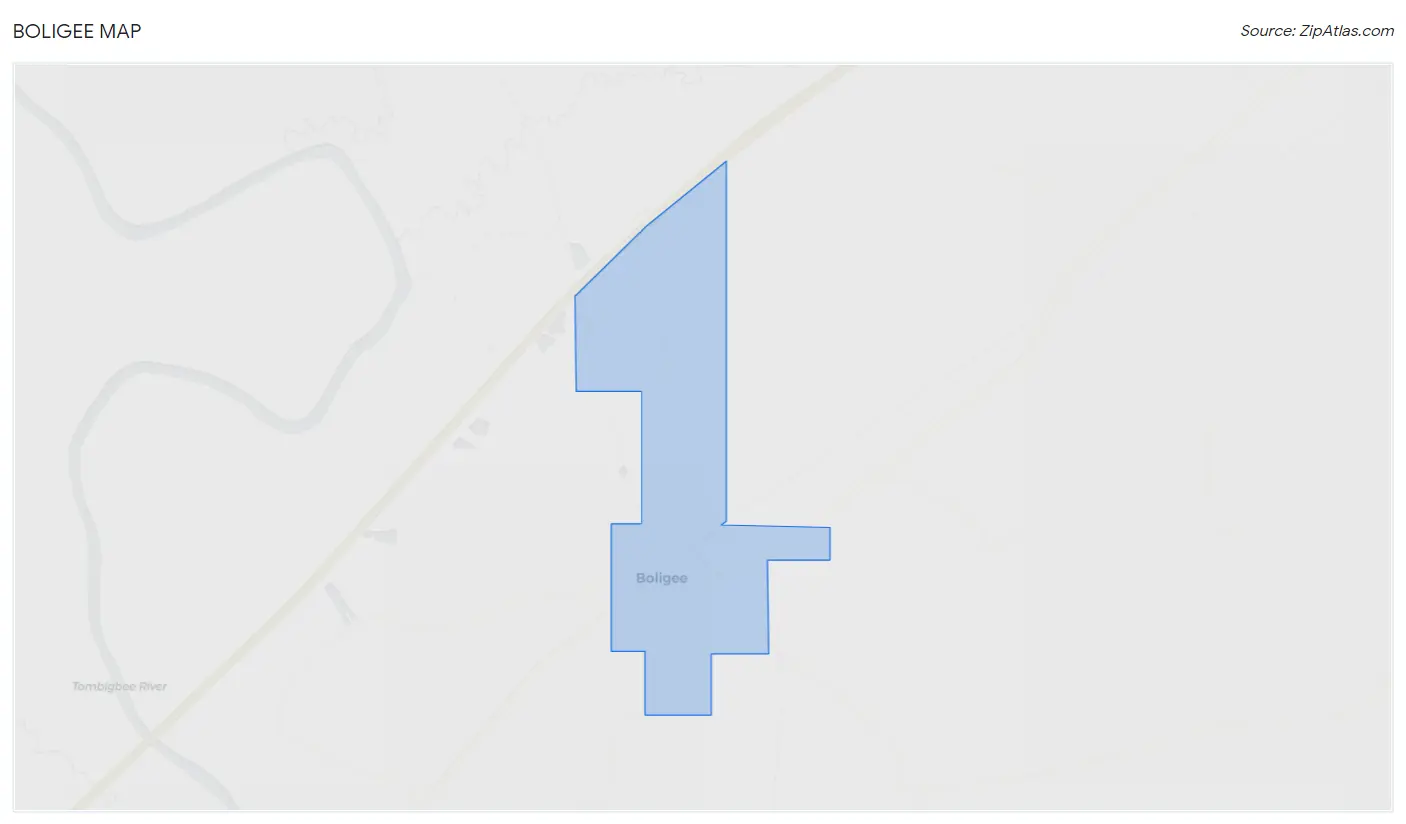
Boligee Overview
$7,215
PER CAPITA INCOME
$25,972
AVG FAMILY INCOME
$14,034
AVG HOUSEHOLD INCOME
0.40
INEQUALITY / GINI INDEX
271
TOTAL POPULATION
163
MALE POPULATION
108
FEMALE POPULATION
150.93
MALES / 100 FEMALES
66.26
FEMALES / 100 MALES
31.7
MEDIAN AGE
5.1
AVG FAMILY SIZE
2.7
AVG HOUSEHOLD SIZE
96
LABOR FORCE [ PEOPLE ]
53.6%
PERCENT IN LABOR FORCE
51.0%
UNEMPLOYMENT RATE
Boligee Zip Codes
Boligee Area Codes
Income in Boligee
Income Overview in Boligee
Per Capita Income in Boligee is $7,215, while median incomes of families and households are $25,972 and $14,034 respectively.
| Characteristic | Number | Measure |
| Per Capita Income | 271 | $7,215 |
| Median Family Income | 38 | $25,972 |
| Mean Family Income | 38 | $22,505 |
| Median Household Income | 99 | $14,034 |
| Mean Household Income | 99 | $17,531 |
| Income Deficit | 38 | $0 |
| Wage / Income Gap (%) | 271 | 0.00% |
| Wage / Income Gap ($) | 271 | 100.00¢ per $1 |
| Gini / Inequality Index | 271 | 0.40 |
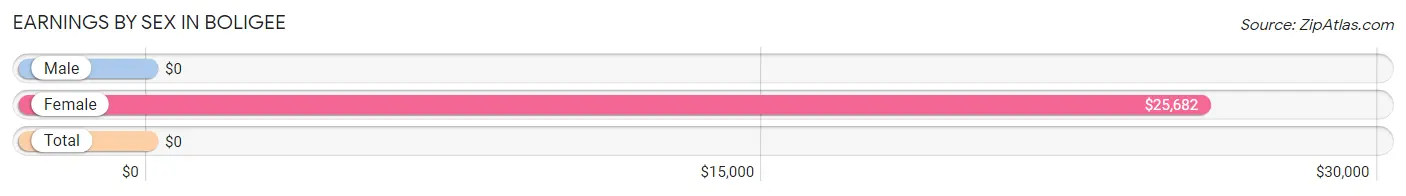
Earnings by Sex in Boligee
| Sex | Number | Average Earnings |
| Male | 66 (67.3%) | $0 |
| Female | 32 (32.7%) | $25,682 |
| Total | 98 (100.0%) | $0 |
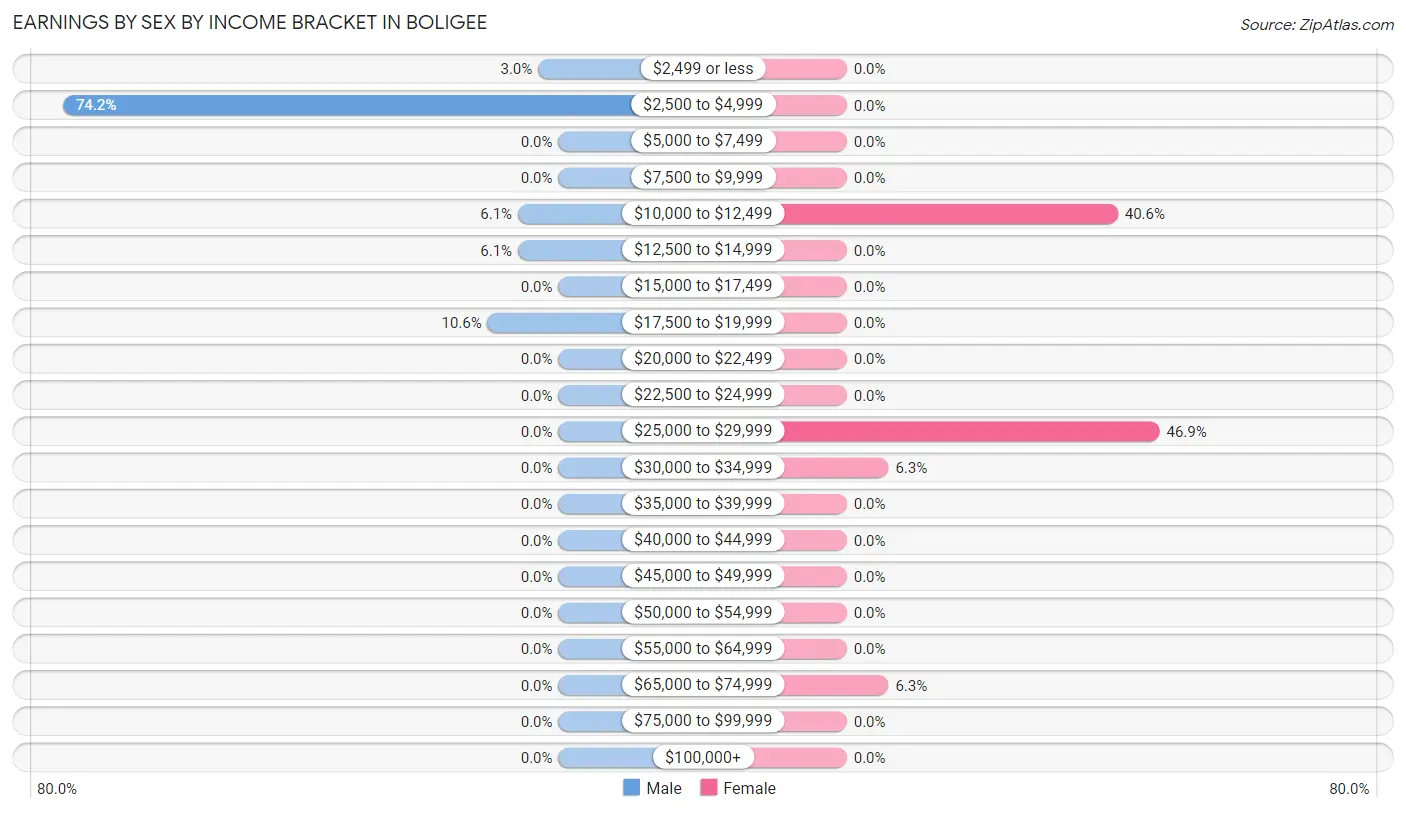
Earnings by Sex by Income Bracket in Boligee
The most common earnings brackets in Boligee are $2,500 to $4,999 for men (49 | 74.2%) and $25,000 to $29,999 for women (15 | 46.9%).
| Income | Male | Female |
| $2,499 or less | 2 (3.0%) | 0 (0.0%) |
| $2,500 to $4,999 | 49 (74.2%) | 0 (0.0%) |
| $5,000 to $7,499 | 0 (0.0%) | 0 (0.0%) |
| $7,500 to $9,999 | 0 (0.0%) | 0 (0.0%) |
| $10,000 to $12,499 | 4 (6.1%) | 13 (40.6%) |
| $12,500 to $14,999 | 4 (6.1%) | 0 (0.0%) |
| $15,000 to $17,499 | 0 (0.0%) | 0 (0.0%) |
| $17,500 to $19,999 | 7 (10.6%) | 0 (0.0%) |
| $20,000 to $22,499 | 0 (0.0%) | 0 (0.0%) |
| $22,500 to $24,999 | 0 (0.0%) | 0 (0.0%) |
| $25,000 to $29,999 | 0 (0.0%) | 15 (46.9%) |
| $30,000 to $34,999 | 0 (0.0%) | 2 (6.2%) |
| $35,000 to $39,999 | 0 (0.0%) | 0 (0.0%) |
| $40,000 to $44,999 | 0 (0.0%) | 0 (0.0%) |
| $45,000 to $49,999 | 0 (0.0%) | 0 (0.0%) |
| $50,000 to $54,999 | 0 (0.0%) | 0 (0.0%) |
| $55,000 to $64,999 | 0 (0.0%) | 0 (0.0%) |
| $65,000 to $74,999 | 0 (0.0%) | 2 (6.2%) |
| $75,000 to $99,999 | 0 (0.0%) | 0 (0.0%) |
| $100,000+ | 0 (0.0%) | 0 (0.0%) |
| Total | 66 (100.0%) | 32 (100.0%) |
Earnings by Sex by Educational Attainment in Boligee
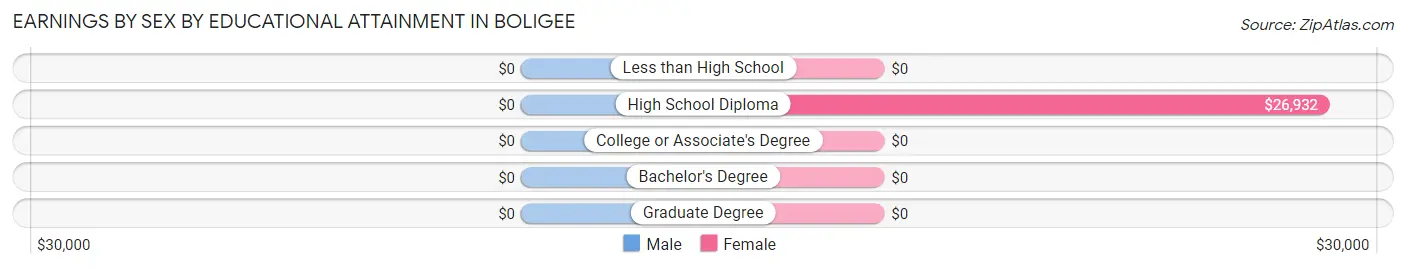
| Educational Attainment | Male Income | Female Income |
| Less than High School | - | - |
| High School Diploma | - | - |
| College or Associate's Degree | - | - |
| Bachelor's Degree | - | - |
| Graduate Degree | - | - |
| Total | - | - |
Family Income in Boligee
Family Income Brackets in Boligee
According to the Boligee family income data, there are 26 families falling into the $25,000 to $34,999 income range, which is the most common income bracket and makes up 68.4% of all families.
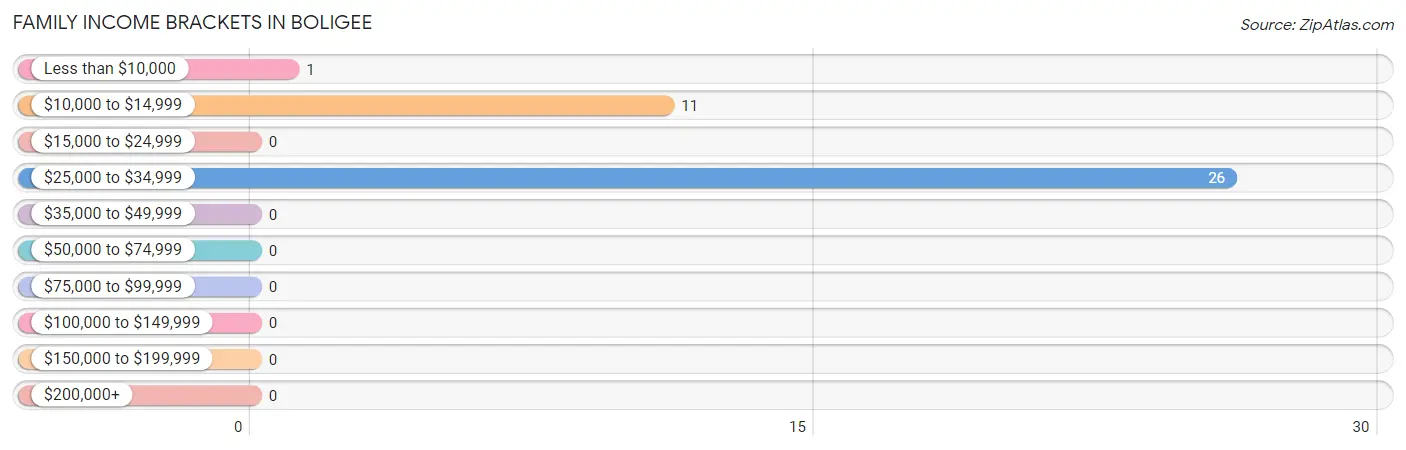
| Income Bracket | # Families | % Families |
| Less than $10,000 | 1 | 2.6% |
| $10,000 to $14,999 | 11 | 28.9% |
| $15,000 to $24,999 | 0 | 0.0% |
| $25,000 to $34,999 | 26 | 68.4% |
| $35,000 to $49,999 | 0 | 0.0% |
| $50,000 to $74,999 | 0 | 0.0% |
| $75,000 to $99,999 | 0 | 0.0% |
| $100,000 to $149,999 | 0 | 0.0% |
| $150,000 to $199,999 | 0 | 0.0% |
| $200,000+ | 0 | 0.0% |
Family Income by Famaliy Size in Boligee
3-person families (16 | 42.1%) account for the highest median family income in Boligee with $26,591 per family, while 3-person families (16 | 42.1%) have the highest median income of $8,864 per family member.
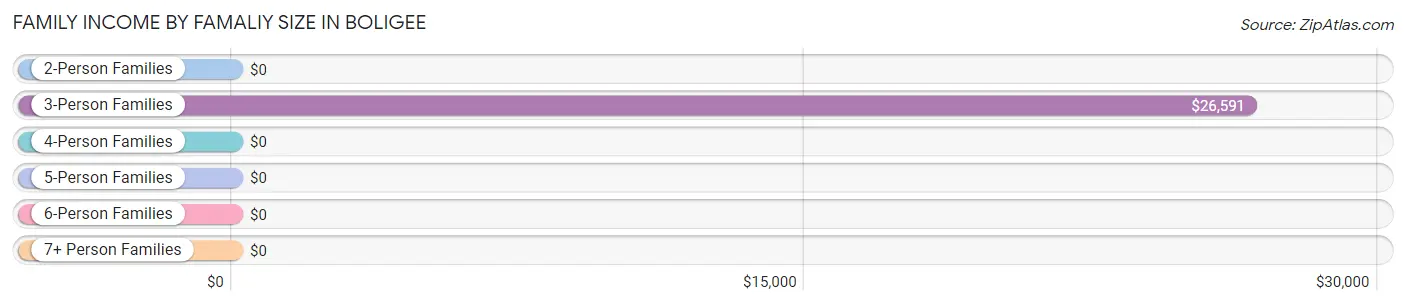
| Income Bracket | # Families | Median Income |
| 2-Person Families | 22 (57.9%) | $0 |
| 3-Person Families | 16 (42.1%) | $26,591 |
| 4-Person Families | 0 (0.0%) | $0 |
| 5-Person Families | 0 (0.0%) | $0 |
| 6-Person Families | 0 (0.0%) | $0 |
| 7+ Person Families | 0 (0.0%) | $0 |
| Total | 38 (100.0%) | $25,972 |
Family Income by Number of Earners in Boligee
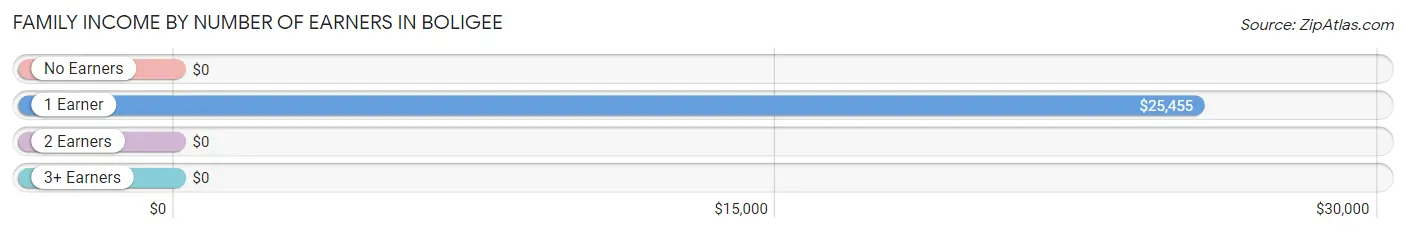
| Number of Earners | # Families | Median Income |
| No Earners | 8 (21.0%) | $0 |
| 1 Earner | 26 (68.4%) | $25,455 |
| 2 Earners | 4 (10.5%) | $0 |
| 3+ Earners | 0 (0.0%) | $0 |
| Total | 38 (100.0%) | $25,972 |
Household Income in Boligee
Household Income Brackets in Boligee
With 33 households falling in the category, the $10,000 to $14,999 income range is the most frequent in Boligee, accounting for 33.3% of all households.
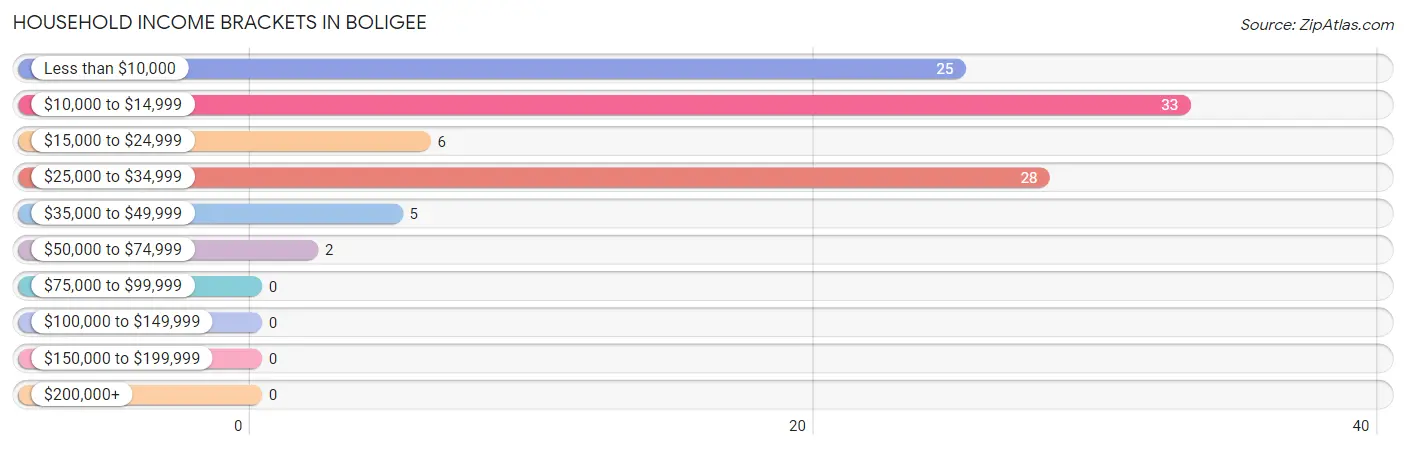
| Income Bracket | # Households | % Households |
| Less than $10,000 | 25 | 25.3% |
| $10,000 to $14,999 | 33 | 33.3% |
| $15,000 to $24,999 | 6 | 6.1% |
| $25,000 to $34,999 | 28 | 28.3% |
| $35,000 to $49,999 | 5 | 5.1% |
| $50,000 to $74,999 | 2 | 2.0% |
| $75,000 to $99,999 | 0 | 0.0% |
| $100,000 to $149,999 | 0 | 0.0% |
| $150,000 to $199,999 | 0 | 0.0% |
| $200,000+ | 0 | 0.0% |
Household Income by Householder Age in Boligee
The median household income in Boligee is $14,034, with the highest median household income of $24,688 found in the 65+ years age bracket for the primary householder. A total of 11 households (11.1%) fall into this category.
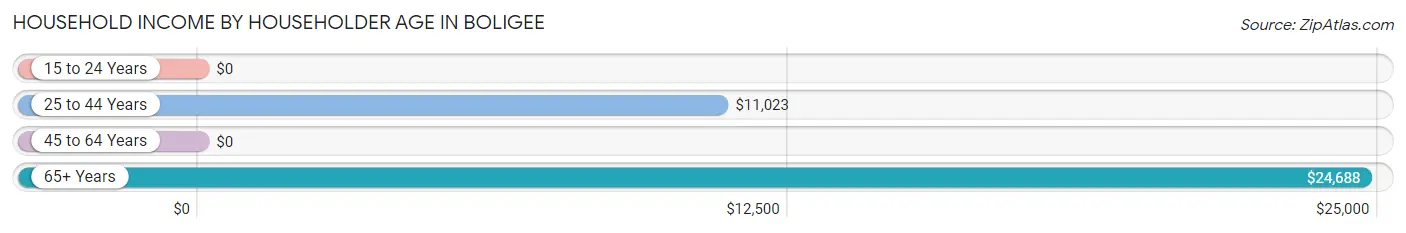
| Income Bracket | # Households | Median Income |
| 15 to 24 Years | 0 (0.0%) | $0 |
| 25 to 44 Years | 55 (55.6%) | $11,023 |
| 45 to 64 Years | 33 (33.3%) | $0 |
| 65+ Years | 11 (11.1%) | $24,688 |
| Total | 99 (100.0%) | $14,034 |
Poverty in Boligee
Income Below Poverty by Sex and Age in Boligee
With 14.7% poverty level for males and 68.5% for females among the residents of Boligee, 55 to 64 year old males and 5 year old females are the most vulnerable to poverty, with 2 males (100.0%) and 20 females (100.0%) in their respective age groups living below the poverty level.
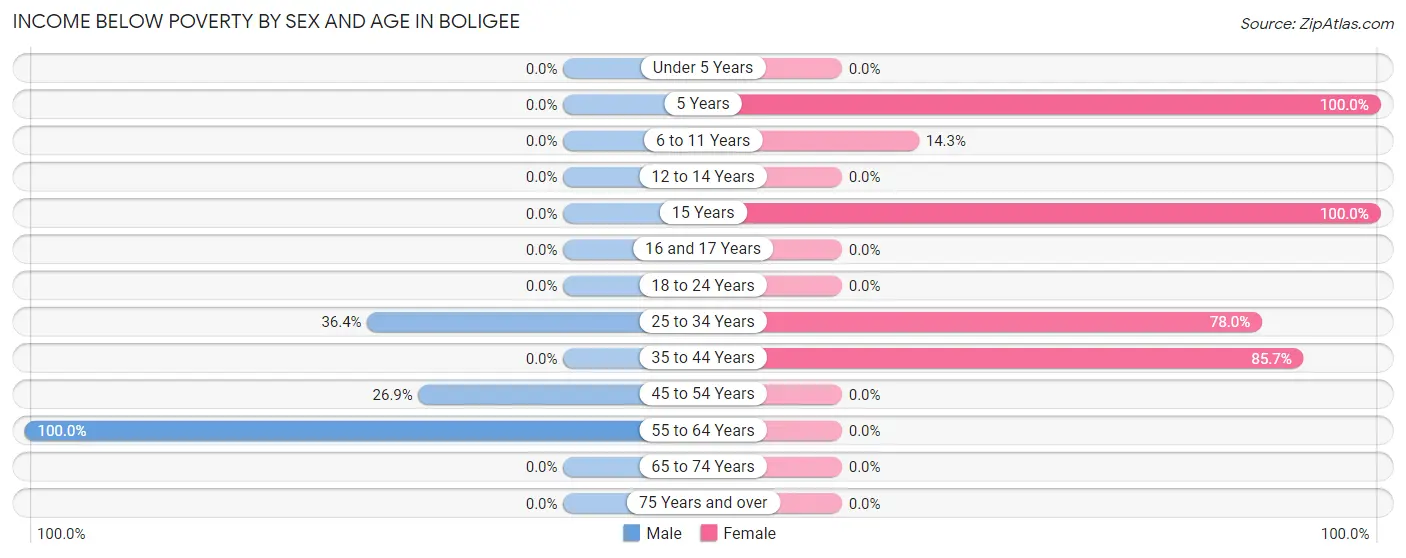
| Age Bracket | Male | Female |
| Under 5 Years | 0 (0.0%) | 0 (0.0%) |
| 5 Years | 0 (0.0%) | 20 (100.0%) |
| 6 to 11 Years | 0 (0.0%) | 1 (14.3%) |
| 12 to 14 Years | 0 (0.0%) | 0 (0.0%) |
| 15 Years | 0 (0.0%) | 2 (100.0%) |
| 16 and 17 Years | 0 (0.0%) | 0 (0.0%) |
| 18 to 24 Years | 0 (0.0%) | 0 (0.0%) |
| 25 to 34 Years | 4 (36.4%) | 39 (78.0%) |
| 35 to 44 Years | 0 (0.0%) | 12 (85.7%) |
| 45 to 54 Years | 18 (26.9%) | 0 (0.0%) |
| 55 to 64 Years | 2 (100.0%) | 0 (0.0%) |
| 65 to 74 Years | 0 (0.0%) | 0 (0.0%) |
| 75 Years and over | 0 (0.0%) | 0 (0.0%) |
| Total | 24 (14.7%) | 74 (68.5%) |
Income Above Poverty by Sex and Age in Boligee
According to the poverty statistics in Boligee, males aged under 5 years and females aged 45 to 54 years are the age groups that are most secure financially, with 100.0% of males and 100.0% of females in these age groups living above the poverty line.
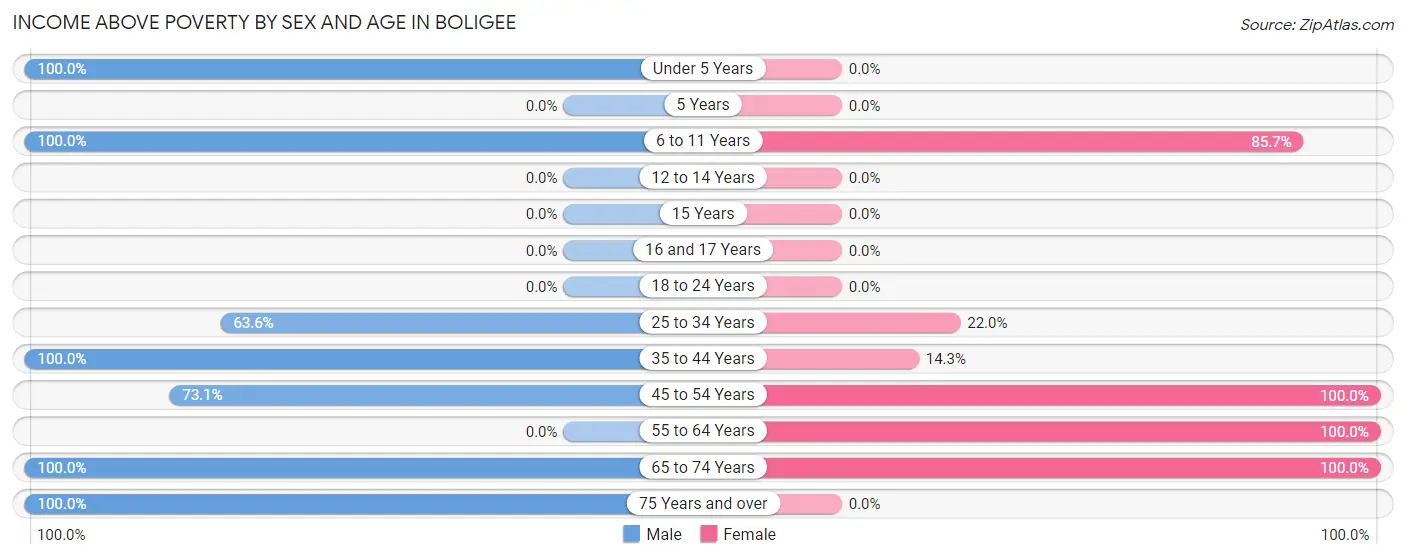
| Age Bracket | Male | Female |
| Under 5 Years | 45 (100.0%) | 0 (0.0%) |
| 5 Years | 0 (0.0%) | 0 (0.0%) |
| 6 to 11 Years | 18 (100.0%) | 6 (85.7%) |
| 12 to 14 Years | 0 (0.0%) | 0 (0.0%) |
| 15 Years | 0 (0.0%) | 0 (0.0%) |
| 16 and 17 Years | 0 (0.0%) | 0 (0.0%) |
| 18 to 24 Years | 0 (0.0%) | 0 (0.0%) |
| 25 to 34 Years | 7 (63.6%) | 11 (22.0%) |
| 35 to 44 Years | 4 (100.0%) | 2 (14.3%) |
| 45 to 54 Years | 49 (73.1%) | 4 (100.0%) |
| 55 to 64 Years | 0 (0.0%) | 9 (100.0%) |
| 65 to 74 Years | 12 (100.0%) | 2 (100.0%) |
| 75 Years and over | 4 (100.0%) | 0 (0.0%) |
| Total | 139 (85.3%) | 34 (31.5%) |
Income Below Poverty Among Married-Couple Families in Boligee
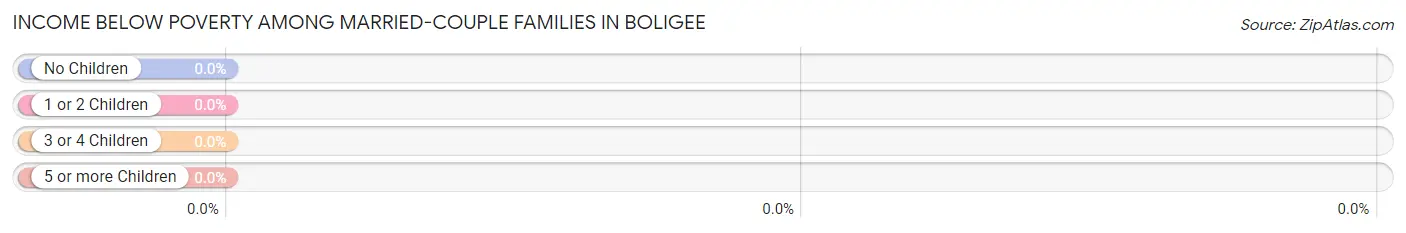
| Children | Above Poverty | Below Poverty |
| No Children | 7 (100.0%) | 0 (0.0%) |
| 1 or 2 Children | 0 (0.0%) | 0 (0.0%) |
| 3 or 4 Children | 0 (0.0%) | 0 (0.0%) |
| 5 or more Children | 0 (0.0%) | 0 (0.0%) |
| Total | 7 (100.0%) | 0 (0.0%) |
Income Below Poverty Among Single-Parent Households in Boligee
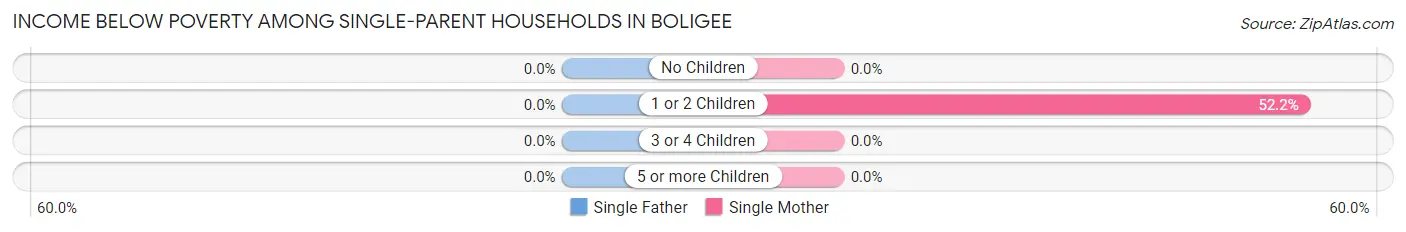
| Children | Single Father | Single Mother |
| No Children | 0 (0.0%) | 0 (0.0%) |
| 1 or 2 Children | 0 (0.0%) | 12 (52.2%) |
| 3 or 4 Children | 0 (0.0%) | 0 (0.0%) |
| 5 or more Children | 0 (0.0%) | 0 (0.0%) |
| Total | 0 (0.0%) | 12 (44.4%) |
Income Below Poverty Among Married-Couple vs Single-Parent Households in Boligee
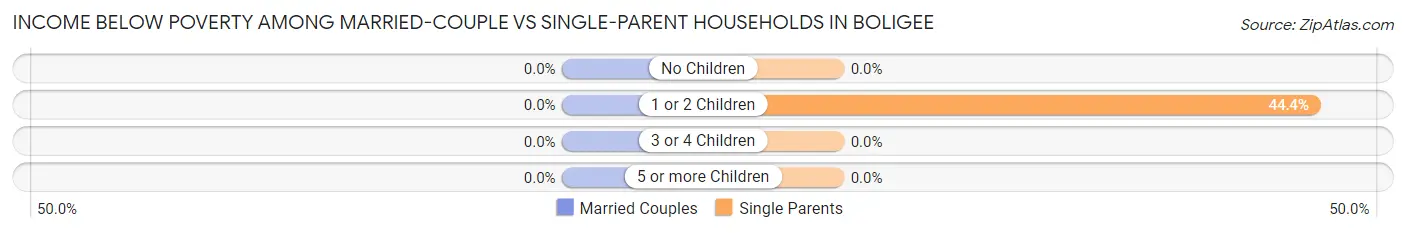
| Children | Married-Couple Families | Single-Parent Households |
| No Children | 0 (0.0%) | 0 (0.0%) |
| 1 or 2 Children | 0 (0.0%) | 12 (44.4%) |
| 3 or 4 Children | 0 (0.0%) | 0 (0.0%) |
| 5 or more Children | 0 (0.0%) | 0 (0.0%) |
| Total | 0 (0.0%) | 12 (38.7%) |
Race in Boligee
The most populous races in Boligee are Black / African American (253 | 93.4%), and White / Caucasian (18 | 6.6%).
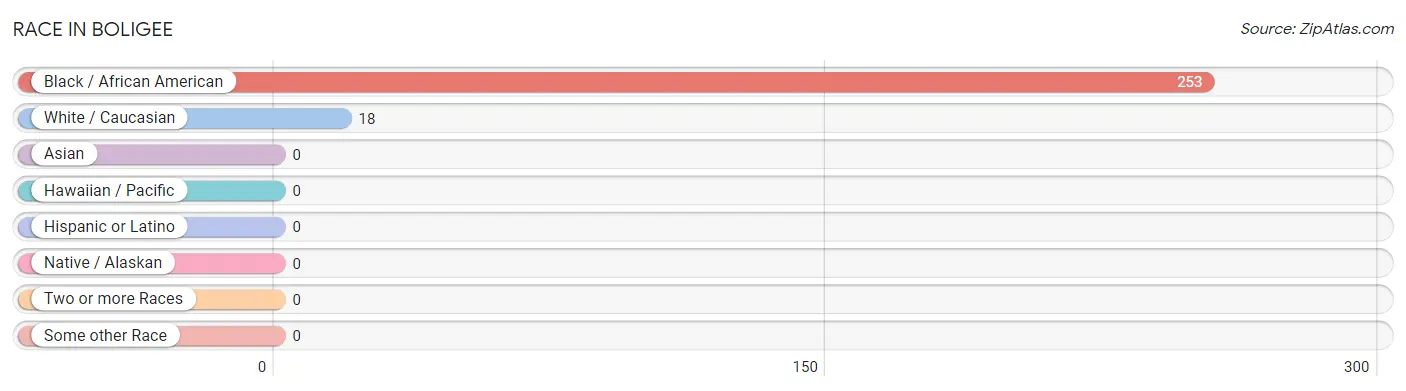
| Race | # Population | % Population |
| Asian | 0 | 0.0% |
| Black / African American | 253 | 93.4% |
| Hawaiian / Pacific | 0 | 0.0% |
| Hispanic or Latino | 0 | 0.0% |
| Native / Alaskan | 0 | 0.0% |
| White / Caucasian | 18 | 6.6% |
| Two or more Races | 0 | 0.0% |
| Some other Race | 0 | 0.0% |
| Total | 271 | 100.0% |
Ancestry in Boligee
The most populous ancestries reported in Boligee are American (53 | 19.6%), German (18 | 6.6%), Irish (18 | 6.6%), and Italian (8 | 2.9%), together accounting for 35.8% of all Boligee residents.
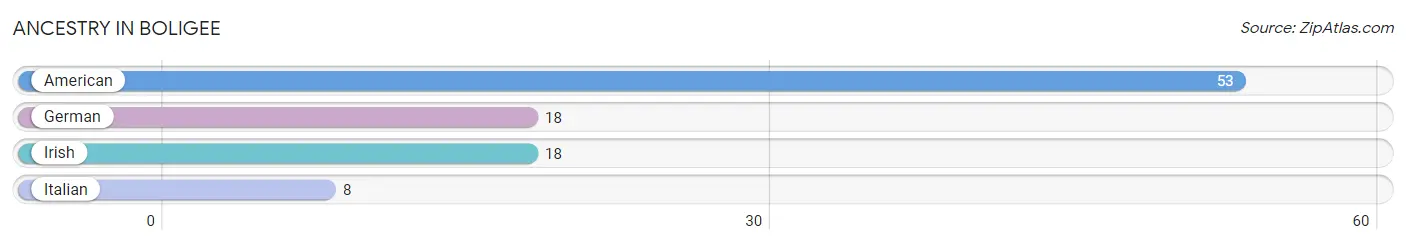
| Ancestry | # Population | % Population |
| American | 53 | 19.6% |
| German | 18 | 6.6% |
| Irish | 18 | 6.6% |
| Italian | 8 | 2.9% | View All 4 Rows |
Immigrants in Boligee
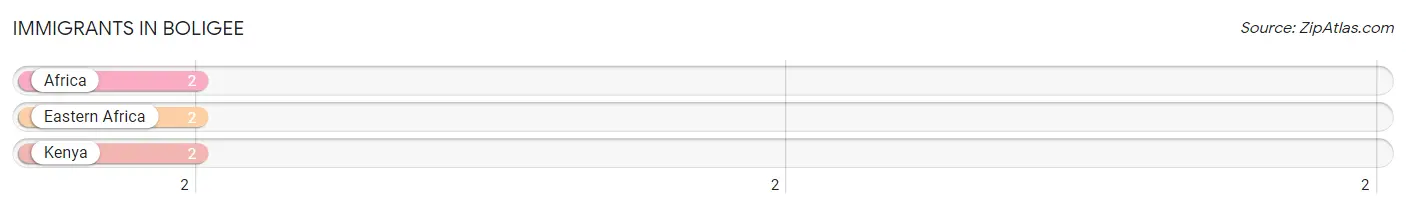
The most numerous immigrant groups reported in Boligee came from Africa (2 | 0.7%), Eastern Africa (2 | 0.7%), and Kenya (2 | 0.7%), together accounting for 2.2% of all Boligee residents.
| Immigration Origin | # Population | % Population |
| Africa | 2 | 0.7% |
| Eastern Africa | 2 | 0.7% |
| Kenya | 2 | 0.7% | View All 3 Rows |
Sex and Age in Boligee
Sex and Age in Boligee
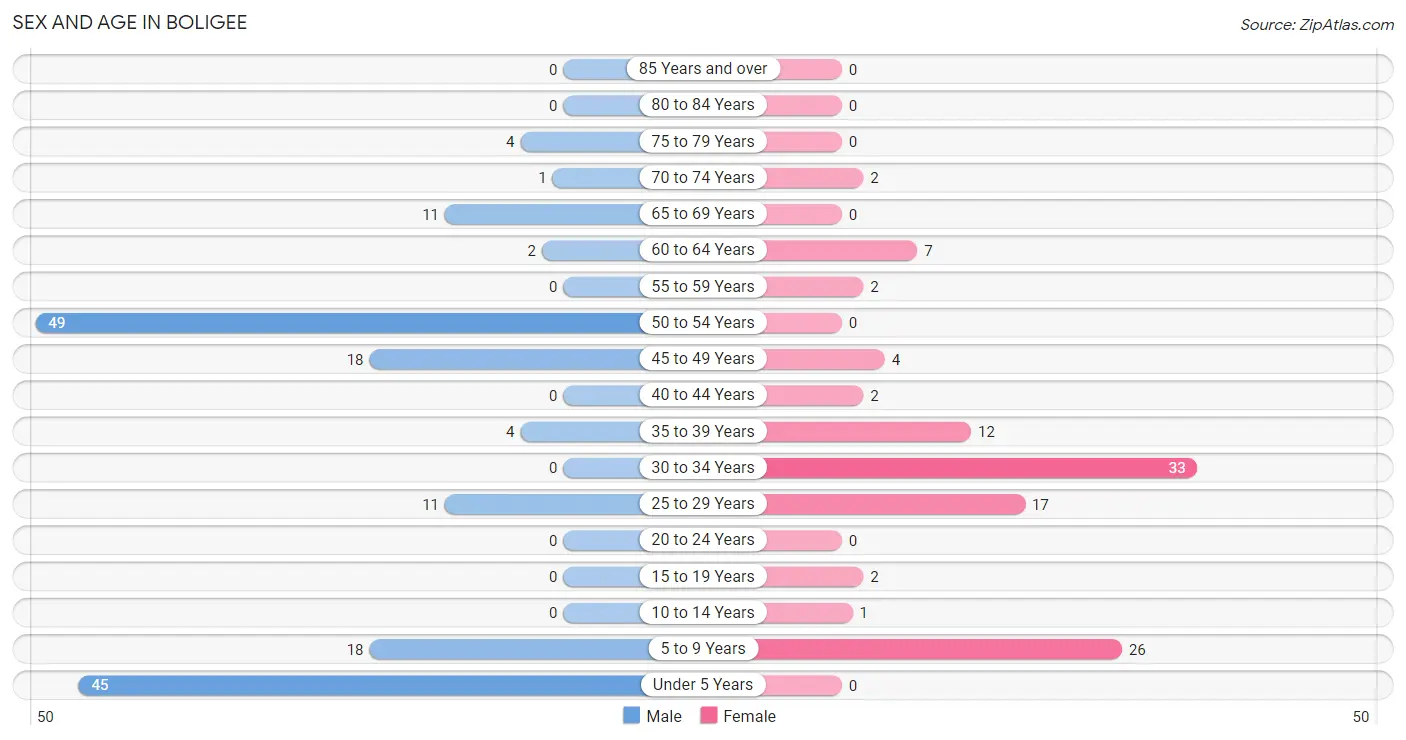
The most populous age groups in Boligee are 50 to 54 Years (49 | 30.1%) for men and 30 to 34 Years (33 | 30.6%) for women.
| Age Bracket | Male | Female |
| Under 5 Years | 45 (27.6%) | 0 (0.0%) |
| 5 to 9 Years | 18 (11.0%) | 26 (24.1%) |
| 10 to 14 Years | 0 (0.0%) | 1 (0.9%) |
| 15 to 19 Years | 0 (0.0%) | 2 (1.8%) |
| 20 to 24 Years | 0 (0.0%) | 0 (0.0%) |
| 25 to 29 Years | 11 (6.8%) | 17 (15.7%) |
| 30 to 34 Years | 0 (0.0%) | 33 (30.6%) |
| 35 to 39 Years | 4 (2.5%) | 12 (11.1%) |
| 40 to 44 Years | 0 (0.0%) | 2 (1.8%) |
| 45 to 49 Years | 18 (11.0%) | 4 (3.7%) |
| 50 to 54 Years | 49 (30.1%) | 0 (0.0%) |
| 55 to 59 Years | 0 (0.0%) | 2 (1.8%) |
| 60 to 64 Years | 2 (1.2%) | 7 (6.5%) |
| 65 to 69 Years | 11 (6.8%) | 0 (0.0%) |
| 70 to 74 Years | 1 (0.6%) | 2 (1.8%) |
| 75 to 79 Years | 4 (2.5%) | 0 (0.0%) |
| 80 to 84 Years | 0 (0.0%) | 0 (0.0%) |
| 85 Years and over | 0 (0.0%) | 0 (0.0%) |
| Total | 163 (100.0%) | 108 (100.0%) |
Families and Households in Boligee
Median Family Size in Boligee
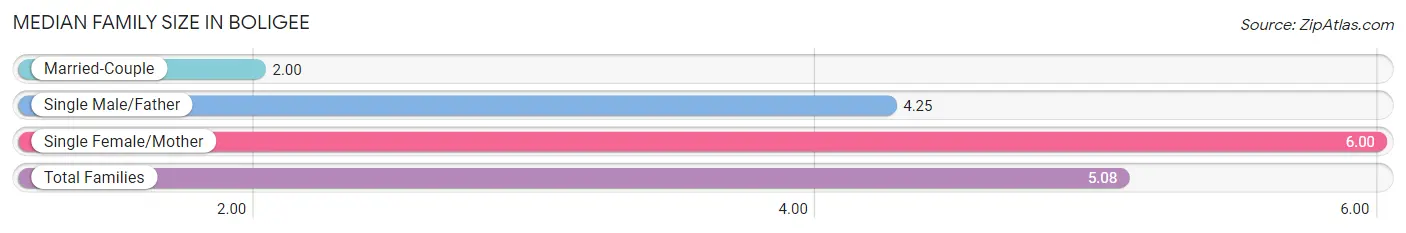
The median family size in Boligee is 5.08 persons per family, with single female/mother families (27 | 71.1%) accounting for the largest median family size of 6 persons per family. On the other hand, married-couple families (7 | 18.4%) represent the smallest median family size with 2.00 persons per family.
| Family Type | # Families | Family Size |
| Married-Couple | 7 (18.4%) | 2.00 |
| Single Male/Father | 4 (10.5%) | 4.25 |
| Single Female/Mother | 27 (71.1%) | 6.00 |
| Total Families | 38 (100.0%) | 5.08 |
Median Household Size in Boligee
| Household Type | # Households | Household Size |
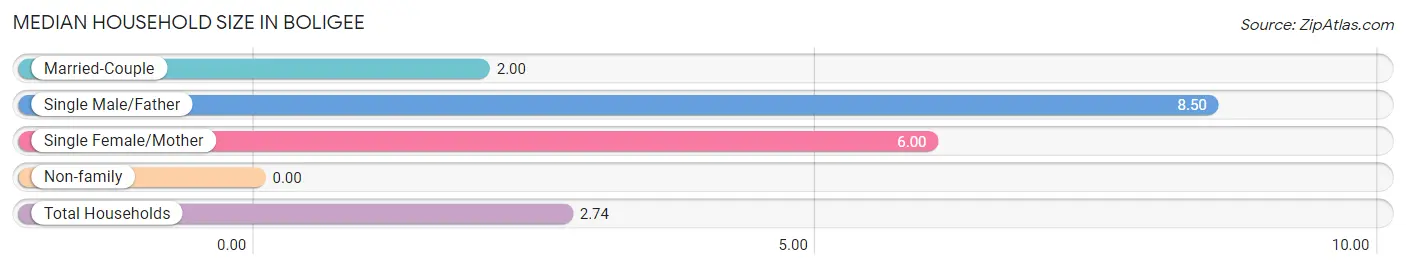
| Married-Couple | 7 (7.1%) | 2.00 |
| Single Male/Father | 4 (4.0%) | 8.50 |
| Single Female/Mother | 27 (27.3%) | 6.00 |
| Non-family | 61 (61.6%) | - |
| Total Households | 99 (100.0%) | 2.74 |
Household Size by Marriage Status in Boligee
Out of a total of 99 households in Boligee, 38 (38.4%) are family households, while 61 (61.6%) are nonfamily households. The most numerous type of family households are 2-person households, comprising 22, and the most common type of nonfamily households are 1-person households, comprising 61.
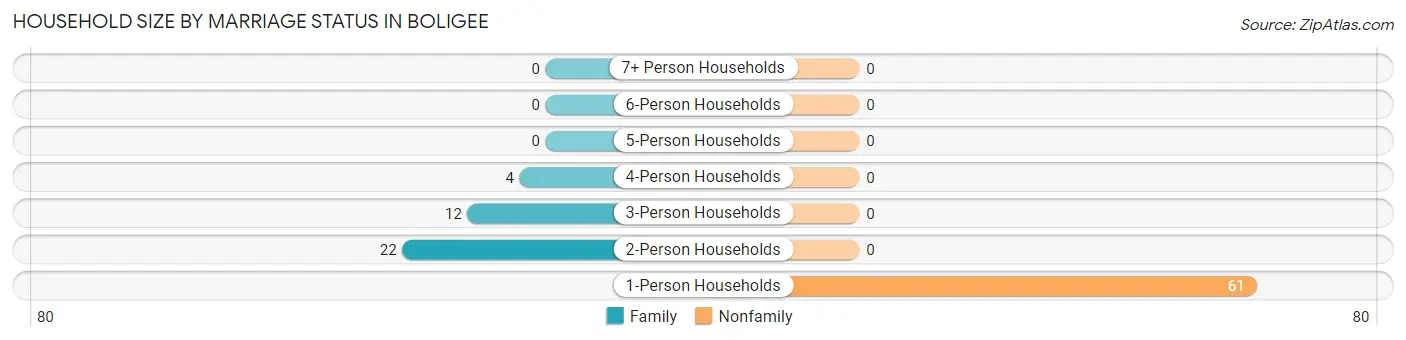
| Household Size | Family Households | Nonfamily Households |
| 1-Person Households | - | 61 (61.6%) |
| 2-Person Households | 22 (22.2%) | 0 (0.0%) |
| 3-Person Households | 12 (12.1%) | 0 (0.0%) |
| 4-Person Households | 4 (4.0%) | 0 (0.0%) |
| 5-Person Households | 0 (0.0%) | 0 (0.0%) |
| 6-Person Households | 0 (0.0%) | 0 (0.0%) |
| 7+ Person Households | 0 (0.0%) | 0 (0.0%) |
| Total | 38 (38.4%) | 61 (61.6%) |
Female Fertility in Boligee
Fertility by Age in Boligee
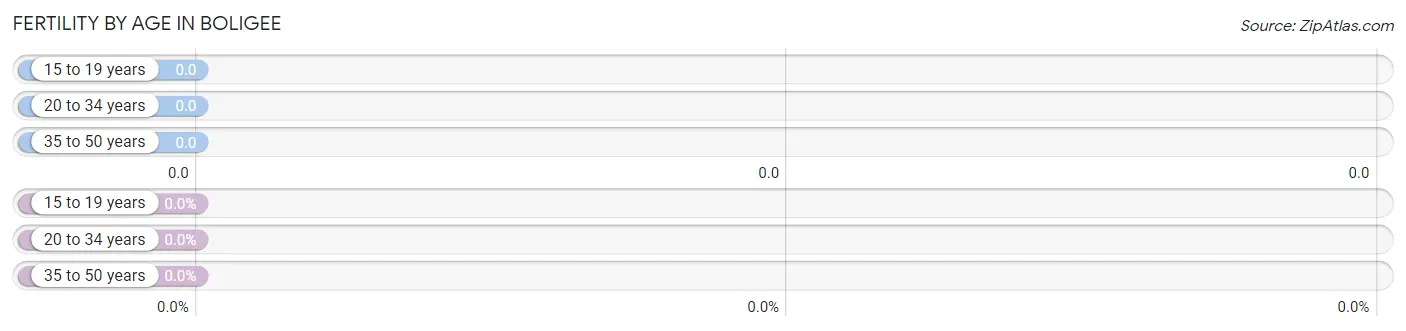
| Age Bracket | Women with Births | Births / 1,000 Women |
| 15 to 19 years | 0 (0.0%) | 0.0 |
| 20 to 34 years | 0 (0.0%) | 0.0 |
| 35 to 50 years | 0 (0.0%) | 0.0 |
| Total | 0 (0.0%) | 0.0 |
Fertility by Age by Marriage Status in Boligee
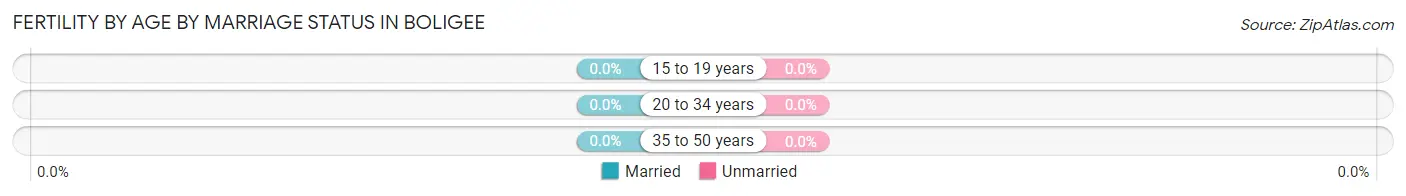
| Age Bracket | Married | Unmarried |
| 15 to 19 years | 0 (0.0%) | 0 (0.0%) |
| 20 to 34 years | 0 (0.0%) | 0 (0.0%) |
| 35 to 50 years | 0 (0.0%) | 0 (0.0%) |
| Total | 0 (0.0%) | 0 (0.0%) |
Fertility by Education in Boligee
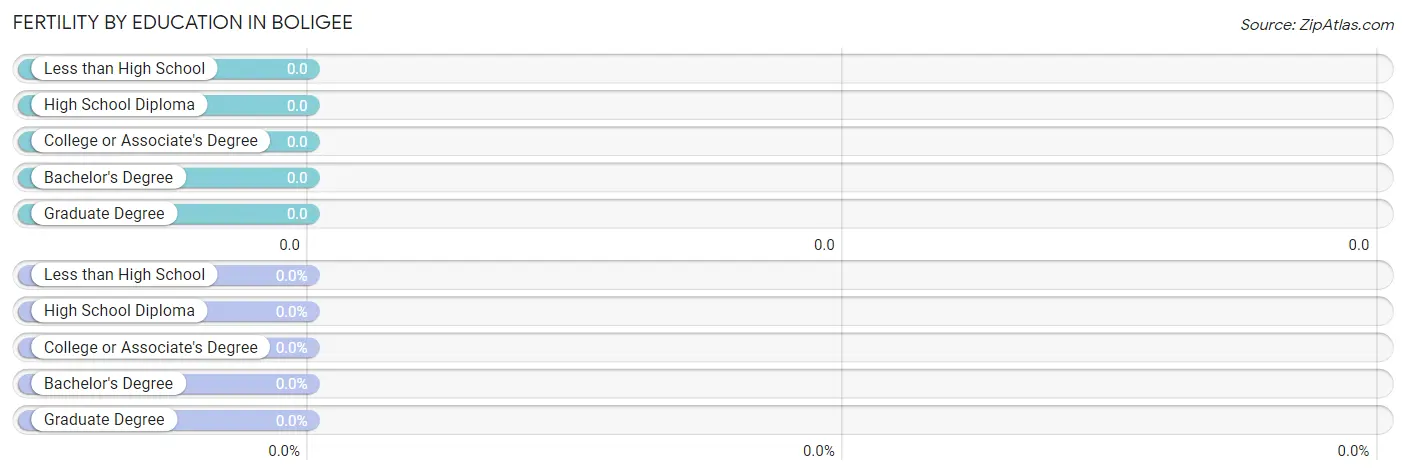
| Educational Attainment | Women with Births | Births / 1,000 Women |
| Less than High School | 0 (0.0%) | 0.0 |
| High School Diploma | 0 (0.0%) | 0.0 |
| College or Associate's Degree | 0 (0.0%) | 0.0 |
| Bachelor's Degree | 0 (0.0%) | 0.0 |
| Graduate Degree | 0 (0.0%) | 0.0 |
| Total | 0 (0.0%) | 0.0 |
Fertility by Education by Marriage Status in Boligee
| Educational Attainment | Married | Unmarried |
| Less than High School | 0 (0.0%) | 0 (0.0%) |
| High School Diploma | 0 (0.0%) | 0 (0.0%) |
| College or Associate's Degree | 0 (0.0%) | 0 (0.0%) |
| Bachelor's Degree | 0 (0.0%) | 0 (0.0%) |
| Graduate Degree | 0 (0.0%) | 0 (0.0%) |
| Total | 0 (0.0%) | 0 (0.0%) |
Employment Characteristics in Boligee
Employment by Class of Employer in Boligee
Among the 47 employed individuals in Boligee, private company employees (32 | 68.1%), state government employees (11 | 23.4%), and local government employees (4 | 8.5%) make up the most common classes of employment.
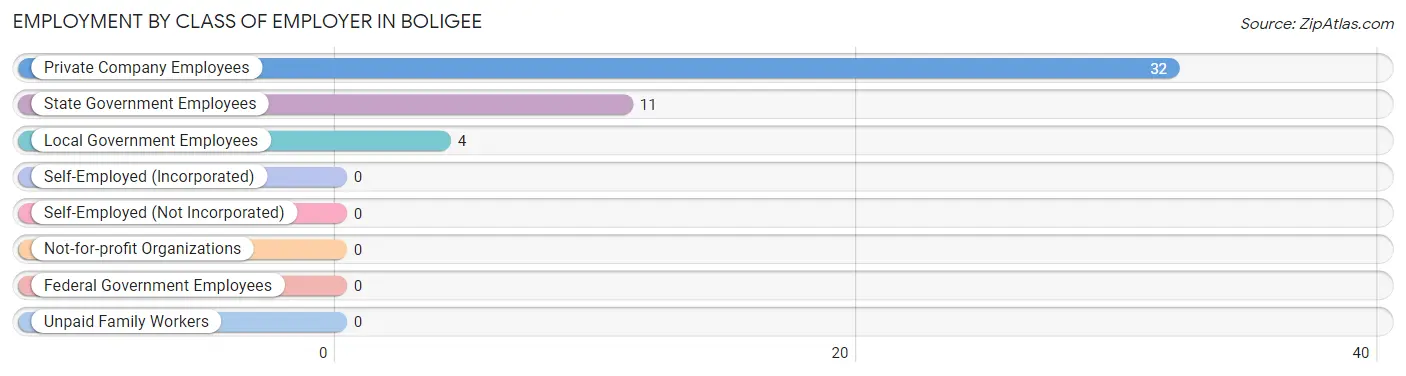
| Employer Class | # Employees | % Employees |
| Private Company Employees | 32 | 68.1% |
| Self-Employed (Incorporated) | 0 | 0.0% |
| Self-Employed (Not Incorporated) | 0 | 0.0% |
| Not-for-profit Organizations | 0 | 0.0% |
| Local Government Employees | 4 | 8.5% |
| State Government Employees | 11 | 23.4% |
| Federal Government Employees | 0 | 0.0% |
| Unpaid Family Workers | 0 | 0.0% |
| Total | 47 | 100.0% |
Employment Status by Age in Boligee
According to the labor force statistics for Boligee, out of the total population over 16 years of age (179), 53.6% or 96 individuals are in the labor force, with 51.0% or 49 of them unemployed. The age group with the highest labor force participation rate is 55 to 59 years, with 100.0% or 2 individuals in the labor force. Within the labor force, the 45 to 54 years age range has the highest percentage of unemployed individuals, with 92.5% or 49 of them being unemployed.
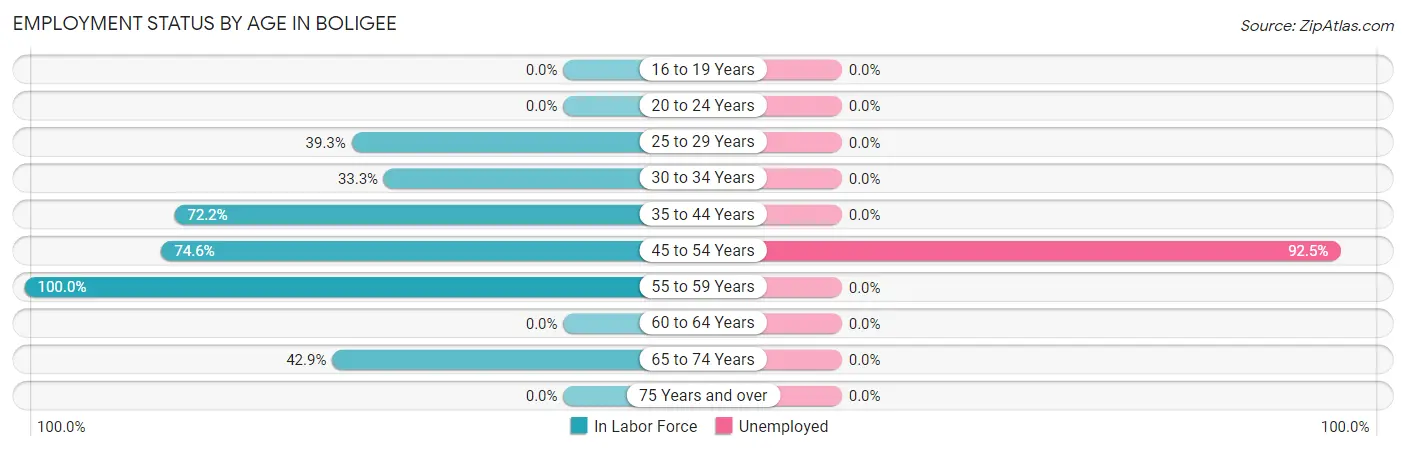
| Age Bracket | In Labor Force | Unemployed |
| 16 to 19 Years | 0 (0.0%) | 0 (0.0%) |
| 20 to 24 Years | 0 (0.0%) | 0 (0.0%) |
| 25 to 29 Years | 11 (39.3%) | 0 (0.0%) |
| 30 to 34 Years | 11 (33.3%) | 0 (0.0%) |
| 35 to 44 Years | 13 (72.2%) | 0 (0.0%) |
| 45 to 54 Years | 53 (74.6%) | 49 (92.5%) |
| 55 to 59 Years | 2 (100.0%) | 0 (0.0%) |
| 60 to 64 Years | 0 (0.0%) | 0 (0.0%) |
| 65 to 74 Years | 6 (42.9%) | 0 (0.0%) |
| 75 Years and over | 0 (0.0%) | 0 (0.0%) |
| Total | 96 (53.6%) | 49 (51.0%) |
Employment Status by Educational Attainment in Boligee
According to labor force statistics for Boligee, 55.9% of individuals (90) out of the total population between 25 and 64 years of age (161) are in the labor force, with 54.4% or 49 of them being unemployed. The group with the highest labor force participation rate are those with the educational attainment of high school diploma, with 57.9% or 73 individuals in the labor force. Within the labor force, individuals with high school diploma education have the highest percentage of unemployment, with 67.1% or 49 of them being unemployed.
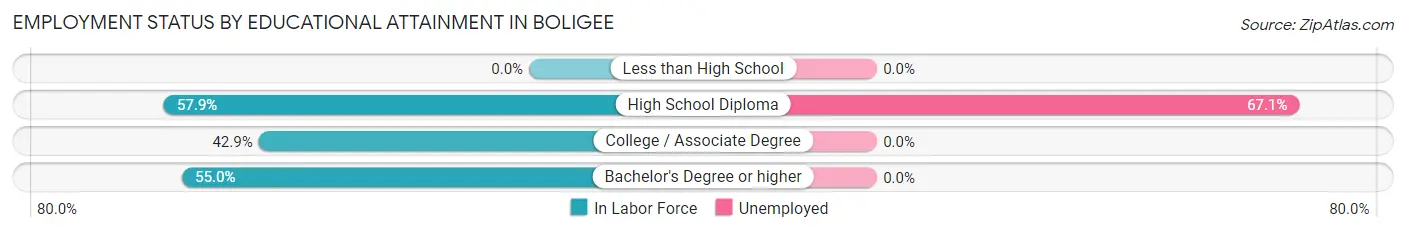
| Educational Attainment | In Labor Force | Unemployed |
| Less than High School | 0 (0.0%) | 0 (0.0%) |
| High School Diploma | 73 (57.9%) | 85 (67.1%) |
| College / Associate Degree | 6 (42.9%) | 0 (0.0%) |
| Bachelor's Degree or higher | 11 (55.0%) | 0 (0.0%) |
| Total | 90 (55.9%) | 88 (54.4%) |
Employment Occupations by Sex in Boligee
Management, Business, Science and Arts Occupations
Management, Business, Science and Arts Occupations by Sex
| Occupation | Male | Female |
| Management | 0 (0.0%) | 0 (0.0%) |
| Business & Financial | 0 (0.0%) | 0 (0.0%) |
| Computers, Engineering & Science | 0 (0.0%) | 0 (0.0%) |
| Computers & Mathematics | 0 (0.0%) | 0 (0.0%) |
| Architecture & Engineering | 0 (0.0%) | 0 (0.0%) |
| Life, Physical & Social Science | 0 (0.0%) | 0 (0.0%) |
| Community & Social Service | 0 (0.0%) | 0 (0.0%) |
| Education, Arts & Media | 0 (0.0%) | 0 (0.0%) |
| Legal Services & Support | 0 (0.0%) | 0 (0.0%) |
| Education Instruction & Library | 0 (0.0%) | 0 (0.0%) |
| Arts, Media & Entertainment | 0 (0.0%) | 0 (0.0%) |
| Health Diagnosing & Treating | 0 (0.0%) | 0 (0.0%) |
| Health Technologists | 0 (0.0%) | 0 (0.0%) |
| Total (Category) | 0 (0.0%) | 0 (0.0%) |
| Total (Overall) | 15 (31.9%) | 32 (68.1%) |
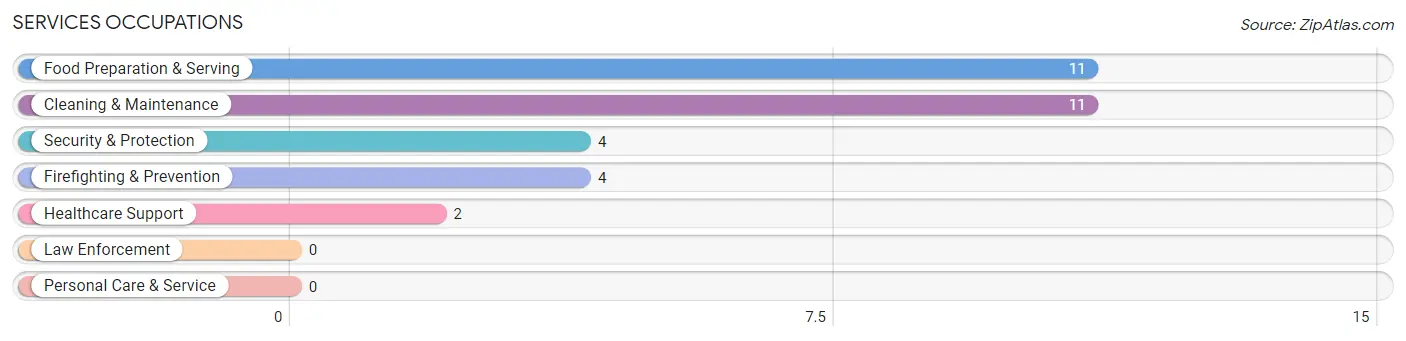
Services Occupations
The most common Services occupations in Boligee are Food Preparation & Serving (11 | 23.4%), Cleaning & Maintenance (11 | 23.4%), Security & Protection (4 | 8.5%), Firefighting & Prevention (4 | 8.5%), and Healthcare Support (2 | 4.3%).
Services Occupations by Sex
Within the Services occupations in Boligee, the most male-oriented occupations are Security & Protection (100.0%), and Firefighting & Prevention (100.0%), while the most female-oriented occupations are Healthcare Support (100.0%), Food Preparation & Serving (100.0%), and Cleaning & Maintenance (100.0%).
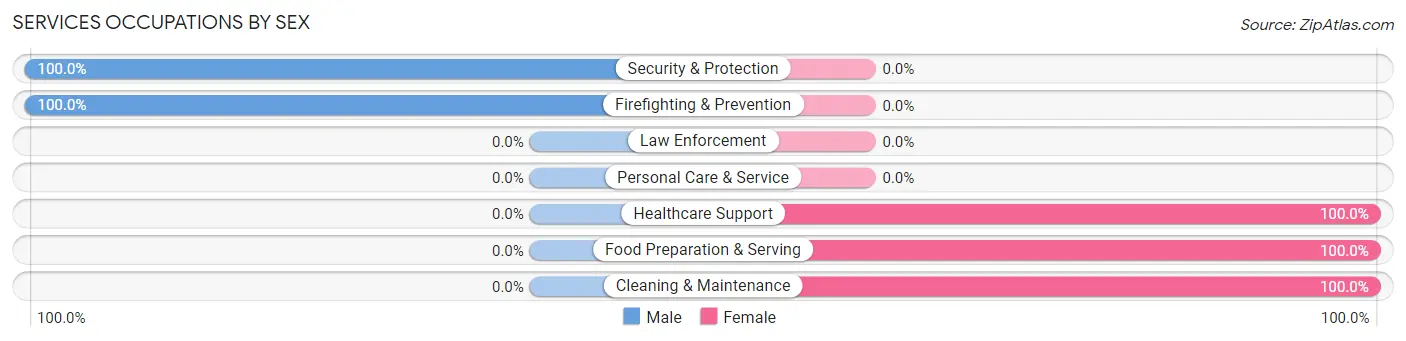
| Occupation | Male | Female |
| Healthcare Support | 0 (0.0%) | 2 (100.0%) |
| Security & Protection | 4 (100.0%) | 0 (0.0%) |
| Firefighting & Prevention | 4 (100.0%) | 0 (0.0%) |
| Law Enforcement | 0 (0.0%) | 0 (0.0%) |
| Food Preparation & Serving | 0 (0.0%) | 11 (100.0%) |
| Cleaning & Maintenance | 0 (0.0%) | 11 (100.0%) |
| Personal Care & Service | 0 (0.0%) | 0 (0.0%) |
| Total (Category) | 4 (14.3%) | 24 (85.7%) |
| Total (Overall) | 15 (31.9%) | 32 (68.1%) |
Sales and Office Occupations
The most common Sales and Office occupations in Boligee are Sales & Related (7 | 14.9%), and Office & Administration (6 | 12.8%).
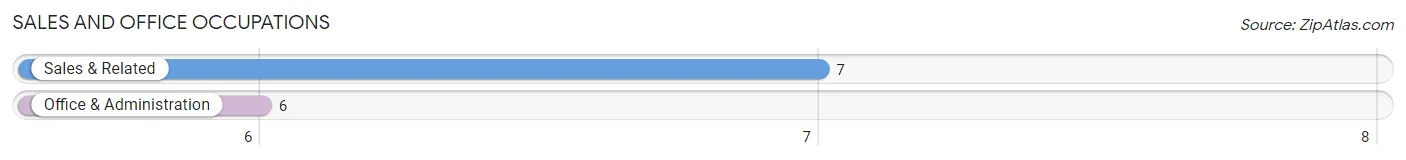
Sales and Office Occupations by Sex
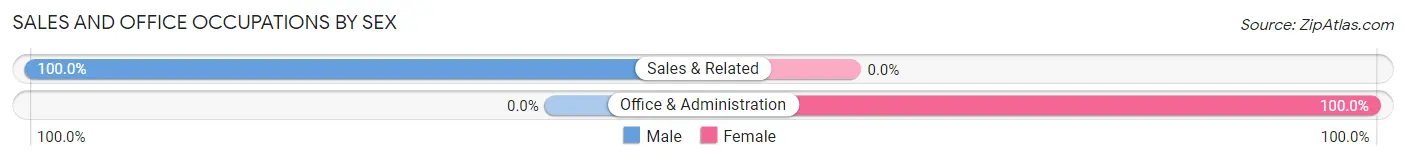
| Occupation | Male | Female |
| Sales & Related | 7 (100.0%) | 0 (0.0%) |
| Office & Administration | 0 (0.0%) | 6 (100.0%) |
| Total (Category) | 7 (53.8%) | 6 (46.2%) |
| Total (Overall) | 15 (31.9%) | 32 (68.1%) |
Natural Resources, Construction and Maintenance Occupations
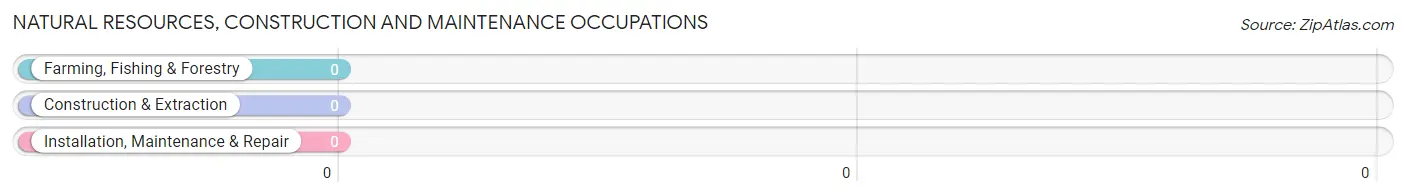
Natural Resources, Construction and Maintenance Occupations by Sex
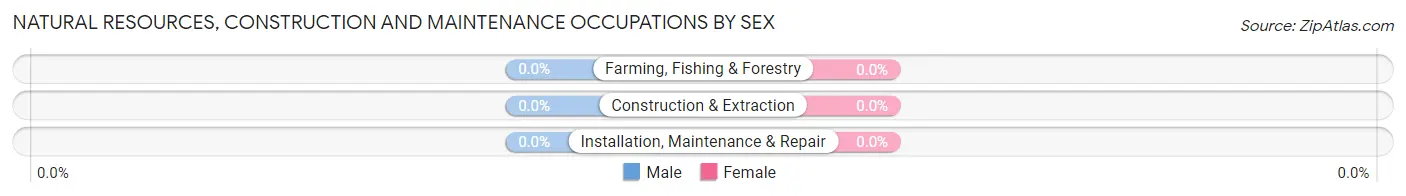
| Occupation | Male | Female |
| Farming, Fishing & Forestry | 0 (0.0%) | 0 (0.0%) |
| Construction & Extraction | 0 (0.0%) | 0 (0.0%) |
| Installation, Maintenance & Repair | 0 (0.0%) | 0 (0.0%) |
| Total (Category) | 0 (0.0%) | 0 (0.0%) |
| Total (Overall) | 15 (31.9%) | 32 (68.1%) |
Production, Transportation and Moving Occupations
The most common Production, Transportation and Moving occupations in Boligee are Transportation (4 | 8.5%), and Production (2 | 4.3%).
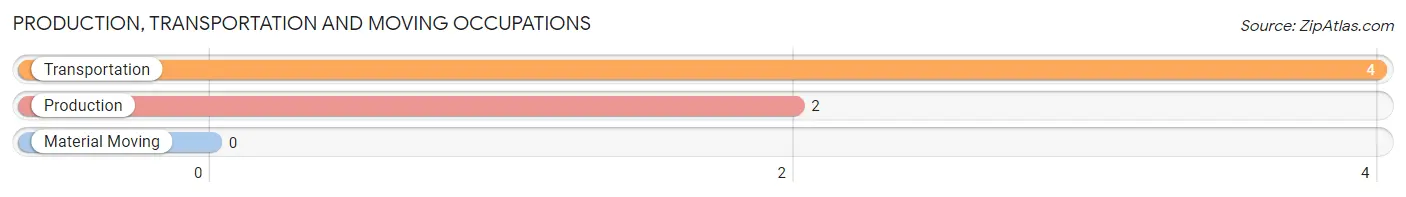
Production, Transportation and Moving Occupations by Sex
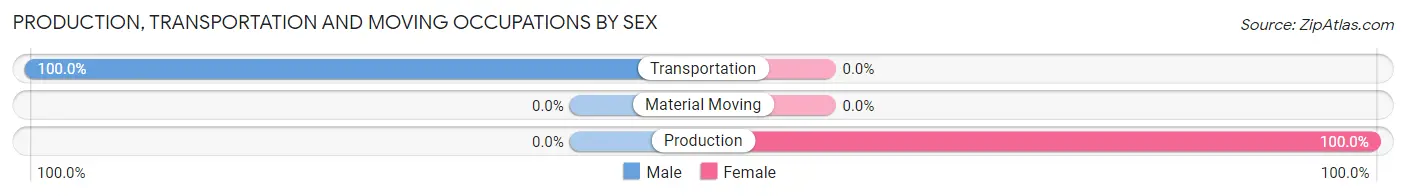
| Occupation | Male | Female |
| Production | 0 (0.0%) | 2 (100.0%) |
| Transportation | 4 (100.0%) | 0 (0.0%) |
| Material Moving | 0 (0.0%) | 0 (0.0%) |
| Total (Category) | 4 (66.7%) | 2 (33.3%) |
| Total (Overall) | 15 (31.9%) | 32 (68.1%) |
Employment Industries by Sex in Boligee
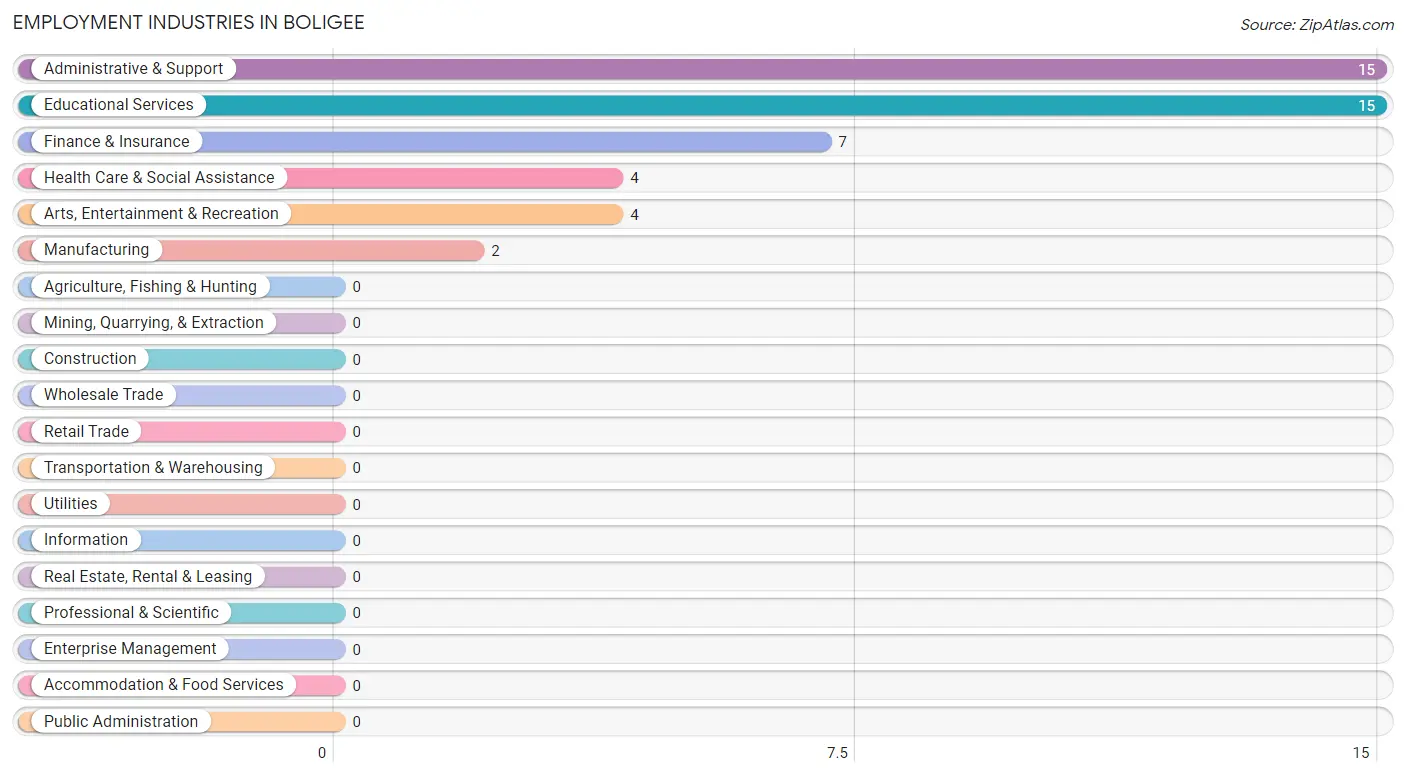
Employment Industries in Boligee
The major employment industries in Boligee include Administrative & Support (15 | 31.9%), Educational Services (15 | 31.9%), Finance & Insurance (7 | 14.9%), Health Care & Social Assistance (4 | 8.5%), and Arts, Entertainment & Recreation (4 | 8.5%).
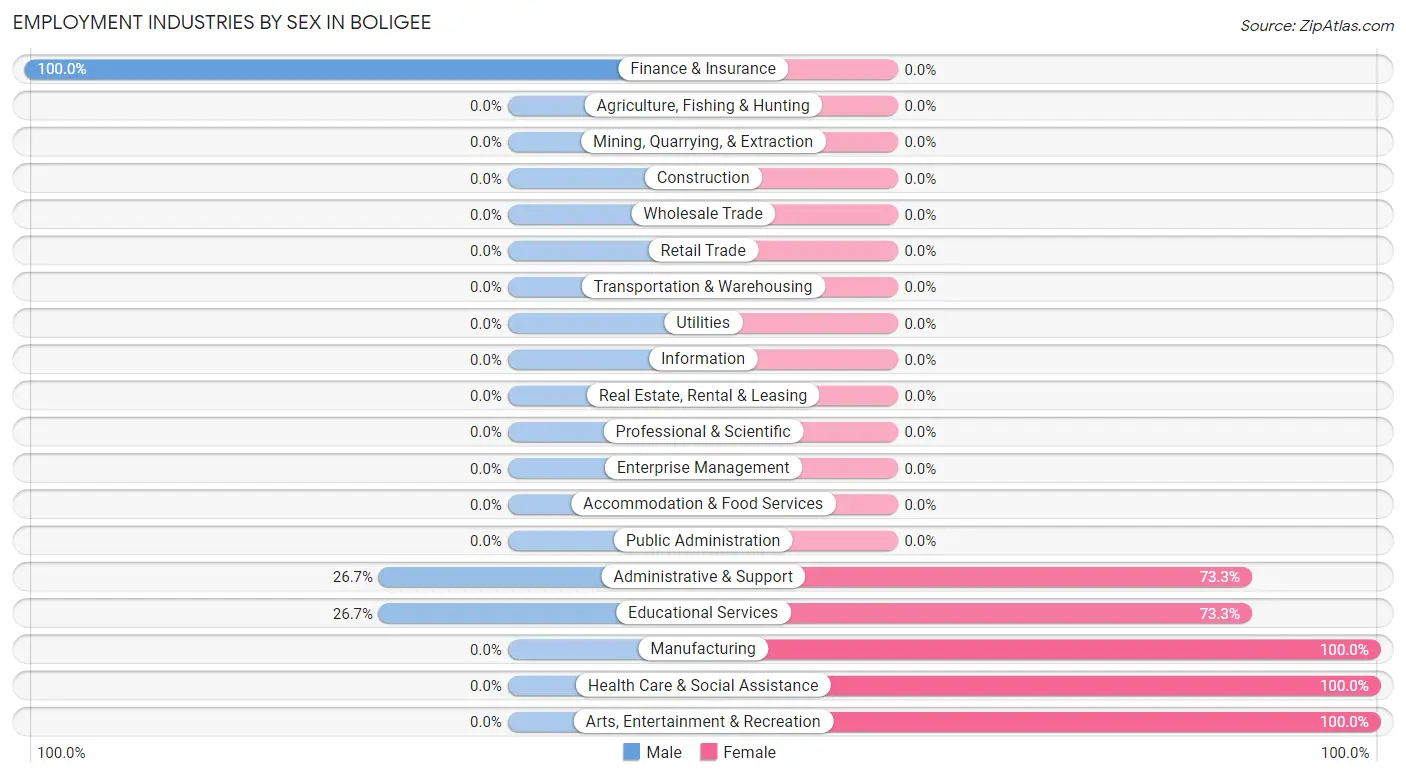
Employment Industries by Sex in Boligee
The Boligee industries that see more men than women are Finance & Insurance (100.0%), Administrative & Support (26.7%), and Educational Services (26.7%), whereas the industries that tend to have a higher number of women are Manufacturing (100.0%), Health Care & Social Assistance (100.0%), and Arts, Entertainment & Recreation (100.0%).
| Industry | Male | Female |
| Agriculture, Fishing & Hunting | 0 (0.0%) | 0 (0.0%) |
| Mining, Quarrying, & Extraction | 0 (0.0%) | 0 (0.0%) |
| Construction | 0 (0.0%) | 0 (0.0%) |
| Manufacturing | 0 (0.0%) | 2 (100.0%) |
| Wholesale Trade | 0 (0.0%) | 0 (0.0%) |
| Retail Trade | 0 (0.0%) | 0 (0.0%) |
| Transportation & Warehousing | 0 (0.0%) | 0 (0.0%) |
| Utilities | 0 (0.0%) | 0 (0.0%) |
| Information | 0 (0.0%) | 0 (0.0%) |
| Finance & Insurance | 7 (100.0%) | 0 (0.0%) |
| Real Estate, Rental & Leasing | 0 (0.0%) | 0 (0.0%) |
| Professional & Scientific | 0 (0.0%) | 0 (0.0%) |
| Enterprise Management | 0 (0.0%) | 0 (0.0%) |
| Administrative & Support | 4 (26.7%) | 11 (73.3%) |
| Educational Services | 4 (26.7%) | 11 (73.3%) |
| Health Care & Social Assistance | 0 (0.0%) | 4 (100.0%) |
| Arts, Entertainment & Recreation | 0 (0.0%) | 4 (100.0%) |
| Accommodation & Food Services | 0 (0.0%) | 0 (0.0%) |
| Public Administration | 0 (0.0%) | 0 (0.0%) |
| Total | 15 (31.9%) | 32 (68.1%) |
Education in Boligee
School Enrollment in Boligee
The most common levels of schooling among the 44 students in Boligee are kindergarten (20 | 45.5%), elementary school (18 | 40.9%), and college / undergraduate (4 | 9.1%).
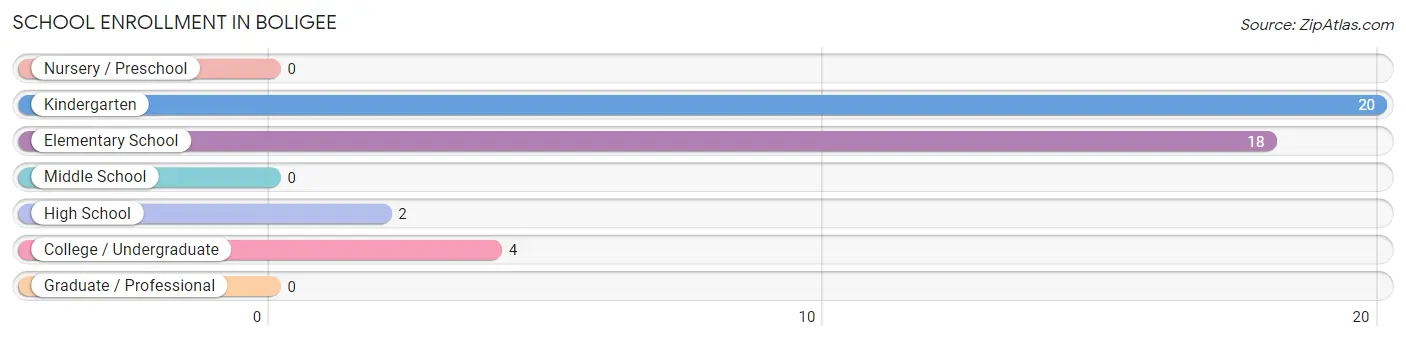
| School Level | # Students | % Students |
| Nursery / Preschool | 0 | 0.0% |
| Kindergarten | 20 | 45.5% |
| Elementary School | 18 | 40.9% |
| Middle School | 0 | 0.0% |
| High School | 2 | 4.5% |
| College / Undergraduate | 4 | 9.1% |
| Graduate / Professional | 0 | 0.0% |
| Total | 44 | 100.0% |
School Enrollment by Age by Funding Source in Boligee
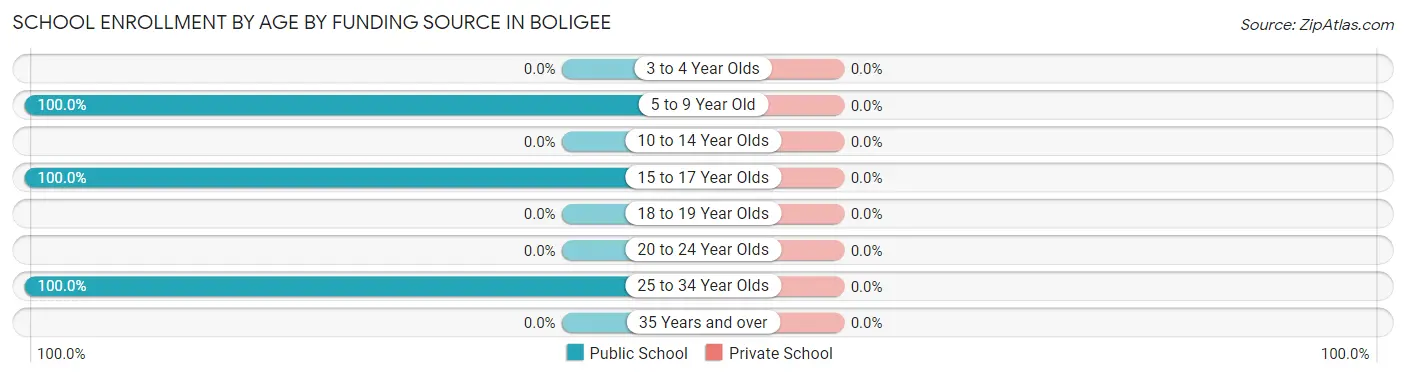
| Age Bracket | Public School | Private School |
| 3 to 4 Year Olds | 0 (0.0%) | 0 (0.0%) |
| 5 to 9 Year Old | 38 (100.0%) | 0 (0.0%) |
| 10 to 14 Year Olds | 0 (0.0%) | 0 (0.0%) |
| 15 to 17 Year Olds | 2 (100.0%) | 0 (0.0%) |
| 18 to 19 Year Olds | 0 (0.0%) | 0 (0.0%) |
| 20 to 24 Year Olds | 0 (0.0%) | 0 (0.0%) |
| 25 to 34 Year Olds | 4 (100.0%) | 0 (0.0%) |
| 35 Years and over | 0 (0.0%) | 0 (0.0%) |
| Total | 44 (100.0%) | 0 (0.0%) |
Educational Attainment by Field of Study in Boligee
Arts & humanities (11 | 55.0%), education (7 | 35.0%), and bio, nature & agricultural (2 | 10.0%) are the most common fields of study among 20 individuals in Boligee who have obtained a bachelor's degree or higher.
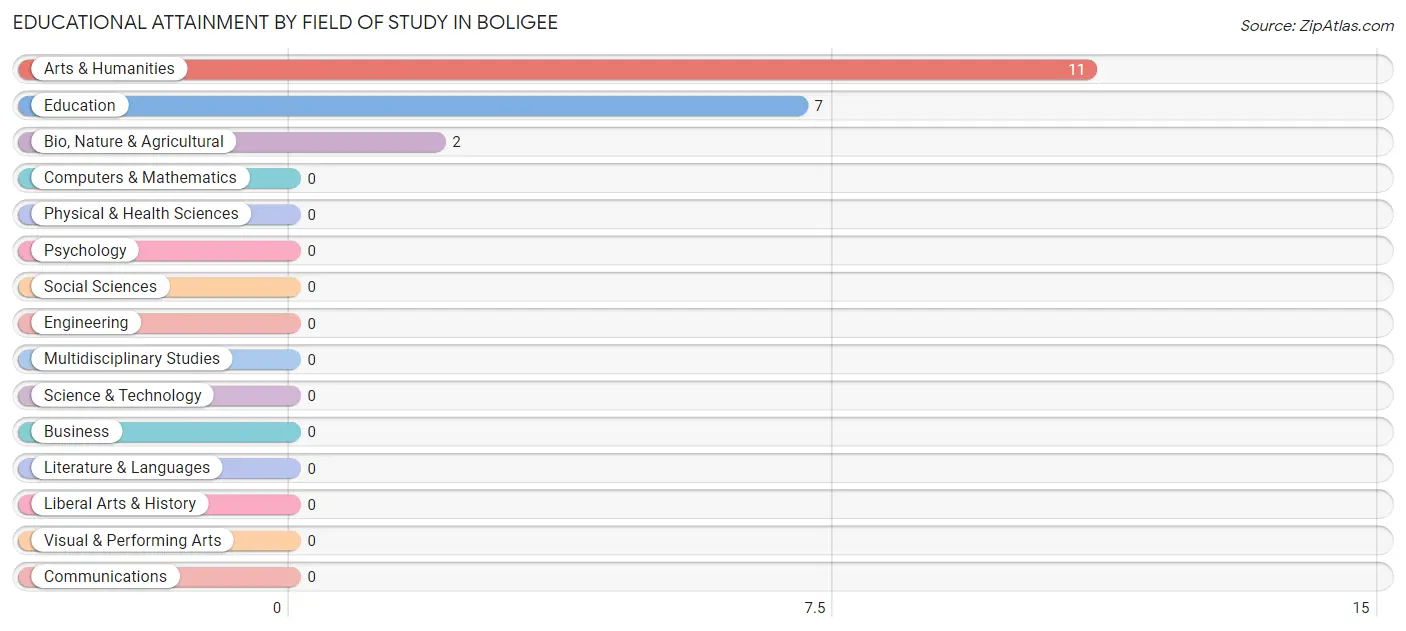
| Field of Study | # Graduates | % Graduates |
| Computers & Mathematics | 0 | 0.0% |
| Bio, Nature & Agricultural | 2 | 10.0% |
| Physical & Health Sciences | 0 | 0.0% |
| Psychology | 0 | 0.0% |
| Social Sciences | 0 | 0.0% |
| Engineering | 0 | 0.0% |
| Multidisciplinary Studies | 0 | 0.0% |
| Science & Technology | 0 | 0.0% |
| Business | 0 | 0.0% |
| Education | 7 | 35.0% |
| Literature & Languages | 0 | 0.0% |
| Liberal Arts & History | 0 | 0.0% |
| Visual & Performing Arts | 0 | 0.0% |
| Communications | 0 | 0.0% |
| Arts & Humanities | 11 | 55.0% |
| Total | 20 | 100.0% |
Transportation & Commute in Boligee
Vehicle Availability by Sex in Boligee
The most prevalent vehicle ownership categories in Boligee are males with 1 vehicle (8, accounting for 53.3%) and females with 1 vehicle (19, making up 25.0%).
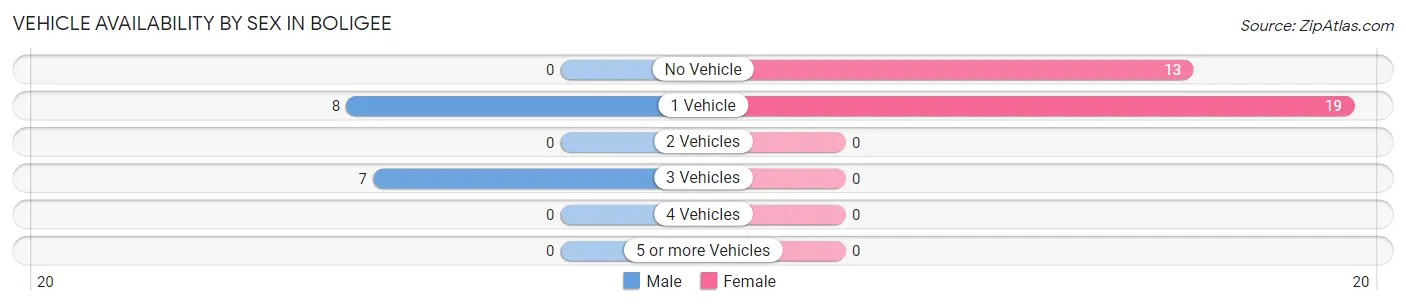
| Vehicles Available | Male | Female |
| No Vehicle | 0 (0.0%) | 13 (40.6%) |
| 1 Vehicle | 8 (53.3%) | 19 (59.4%) |
| 2 Vehicles | 0 (0.0%) | 0 (0.0%) |
| 3 Vehicles | 7 (46.7%) | 0 (0.0%) |
| 4 Vehicles | 0 (0.0%) | 0 (0.0%) |
| 5 or more Vehicles | 0 (0.0%) | 0 (0.0%) |
| Total | 15 (100.0%) | 32 (100.0%) |
Commute Time in Boligee
The most frequently occuring commute durations in Boligee are 15 to 19 minutes (15 commuters, 31.9%), less than 5 minutes (11 commuters, 23.4%), and 60 to 89 minutes (7 commuters, 14.9%).
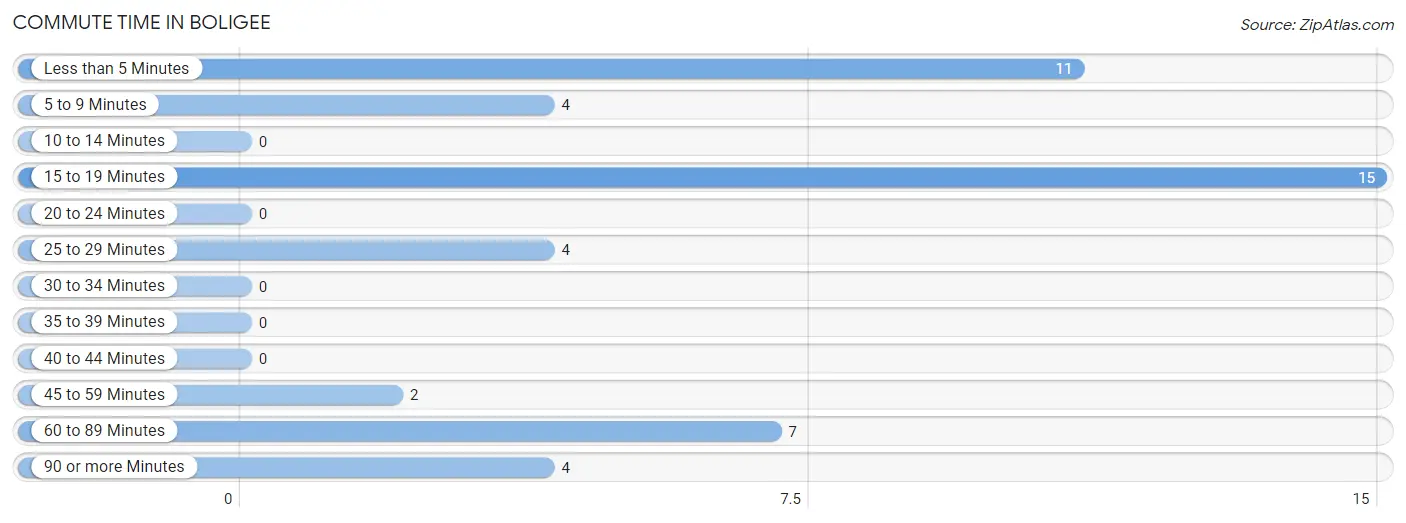
| Commute Time | # Commuters | % Commuters |
| Less than 5 Minutes | 11 | 23.4% |
| 5 to 9 Minutes | 4 | 8.5% |
| 10 to 14 Minutes | 0 | 0.0% |
| 15 to 19 Minutes | 15 | 31.9% |
| 20 to 24 Minutes | 0 | 0.0% |
| 25 to 29 Minutes | 4 | 8.5% |
| 30 to 34 Minutes | 0 | 0.0% |
| 35 to 39 Minutes | 0 | 0.0% |
| 40 to 44 Minutes | 0 | 0.0% |
| 45 to 59 Minutes | 2 | 4.3% |
| 60 to 89 Minutes | 7 | 14.9% |
| 90 or more Minutes | 4 | 8.5% |
Commute Time by Sex in Boligee
The most common commute times in Boligee are 60 to 89 minutes (7 commuters, 46.7%) for males and less than 5 minutes (11 commuters, 34.4%) for females.
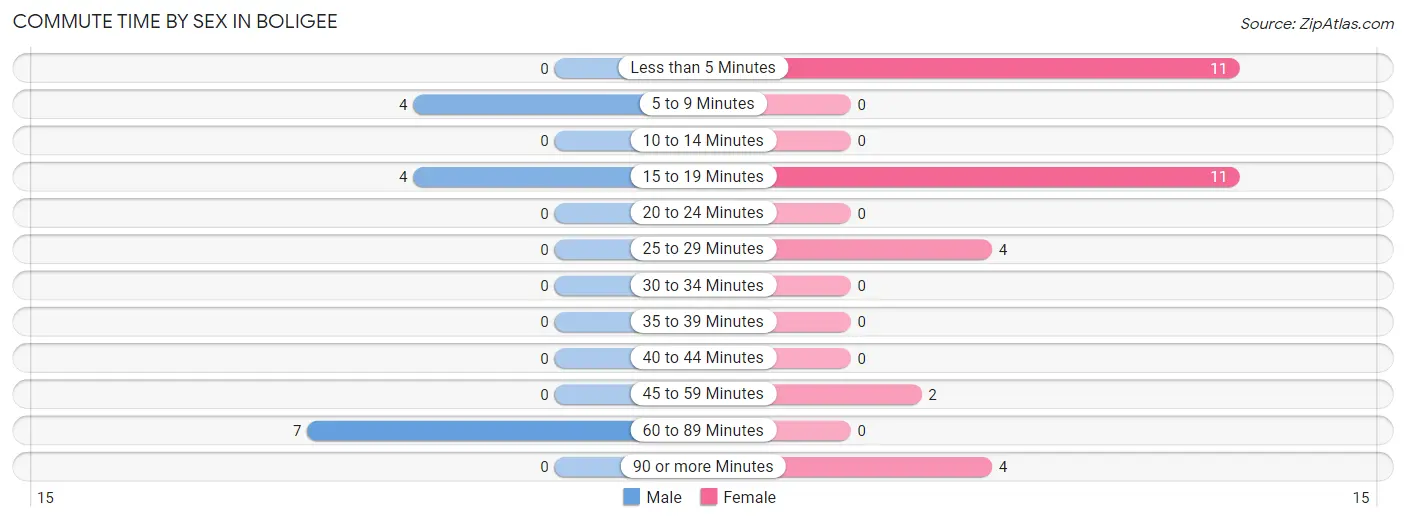
| Commute Time | Male | Female |
| Less than 5 Minutes | 0 (0.0%) | 11 (34.4%) |
| 5 to 9 Minutes | 4 (26.7%) | 0 (0.0%) |
| 10 to 14 Minutes | 0 (0.0%) | 0 (0.0%) |
| 15 to 19 Minutes | 4 (26.7%) | 11 (34.4%) |
| 20 to 24 Minutes | 0 (0.0%) | 0 (0.0%) |
| 25 to 29 Minutes | 0 (0.0%) | 4 (12.5%) |
| 30 to 34 Minutes | 0 (0.0%) | 0 (0.0%) |
| 35 to 39 Minutes | 0 (0.0%) | 0 (0.0%) |
| 40 to 44 Minutes | 0 (0.0%) | 0 (0.0%) |
| 45 to 59 Minutes | 0 (0.0%) | 2 (6.2%) |
| 60 to 89 Minutes | 7 (46.7%) | 0 (0.0%) |
| 90 or more Minutes | 0 (0.0%) | 4 (12.5%) |
Time of Departure to Work by Sex in Boligee
The most frequent times of departure to work in Boligee are 7:00 AM to 7:29 AM (7, 46.7%) for males and 6:30 AM to 6:59 AM (11, 34.4%) for females.
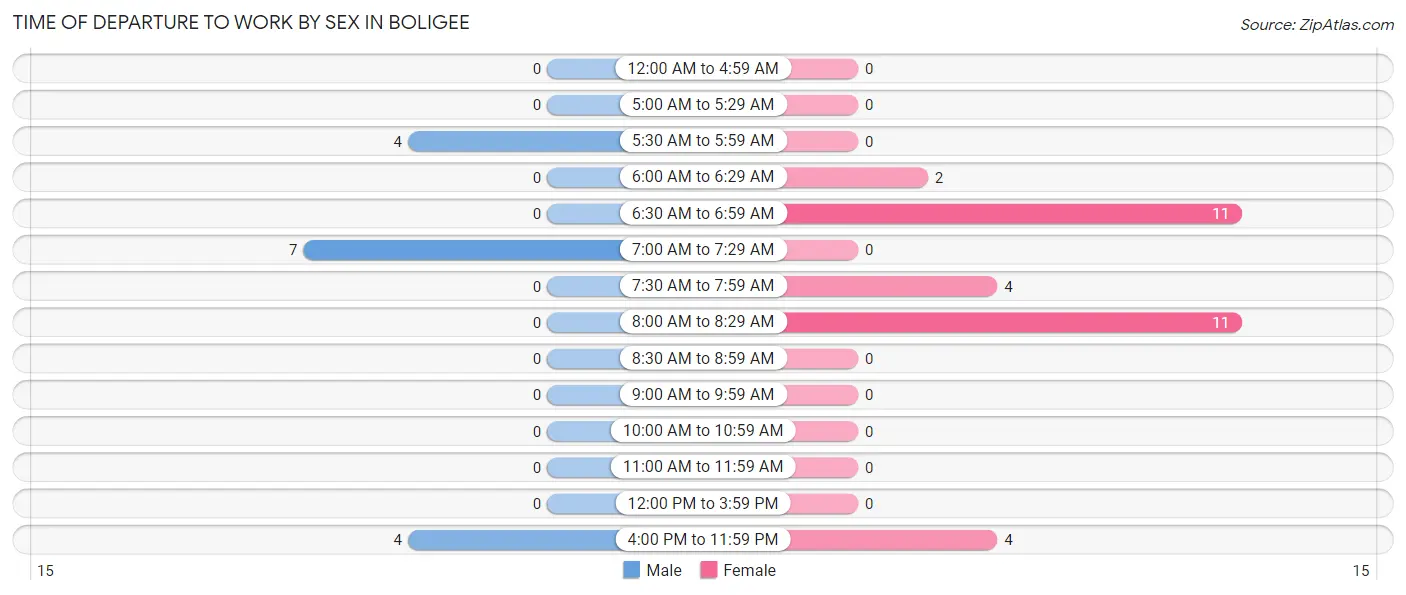
| Time of Departure | Male | Female |
| 12:00 AM to 4:59 AM | 0 (0.0%) | 0 (0.0%) |
| 5:00 AM to 5:29 AM | 0 (0.0%) | 0 (0.0%) |
| 5:30 AM to 5:59 AM | 4 (26.7%) | 0 (0.0%) |
| 6:00 AM to 6:29 AM | 0 (0.0%) | 2 (6.2%) |
| 6:30 AM to 6:59 AM | 0 (0.0%) | 11 (34.4%) |
| 7:00 AM to 7:29 AM | 7 (46.7%) | 0 (0.0%) |
| 7:30 AM to 7:59 AM | 0 (0.0%) | 4 (12.5%) |
| 8:00 AM to 8:29 AM | 0 (0.0%) | 11 (34.4%) |
| 8:30 AM to 8:59 AM | 0 (0.0%) | 0 (0.0%) |
| 9:00 AM to 9:59 AM | 0 (0.0%) | 0 (0.0%) |
| 10:00 AM to 10:59 AM | 0 (0.0%) | 0 (0.0%) |
| 11:00 AM to 11:59 AM | 0 (0.0%) | 0 (0.0%) |
| 12:00 PM to 3:59 PM | 0 (0.0%) | 0 (0.0%) |
| 4:00 PM to 11:59 PM | 4 (26.7%) | 4 (12.5%) |
| Total | 15 (100.0%) | 32 (100.0%) |
Housing Occupancy in Boligee
Occupancy by Ownership in Boligee
Of the total 99 dwellings in Boligee, owner-occupied units account for 40 (40.4%), while renter-occupied units make up 59 (59.6%).
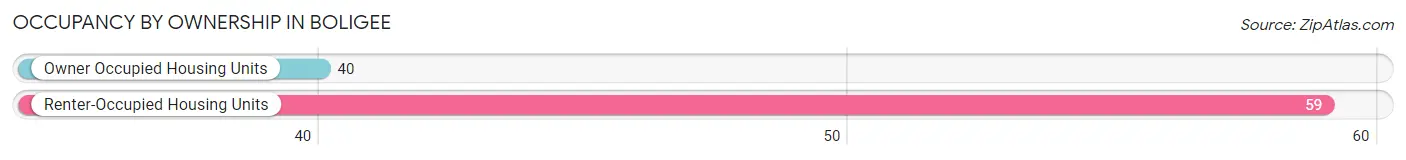
| Occupancy | # Housing Units | % Housing Units |
| Owner Occupied Housing Units | 40 | 40.4% |
| Renter-Occupied Housing Units | 59 | 59.6% |
| Total Occupied Housing Units | 99 | 100.0% |
Occupancy by Household Size in Boligee
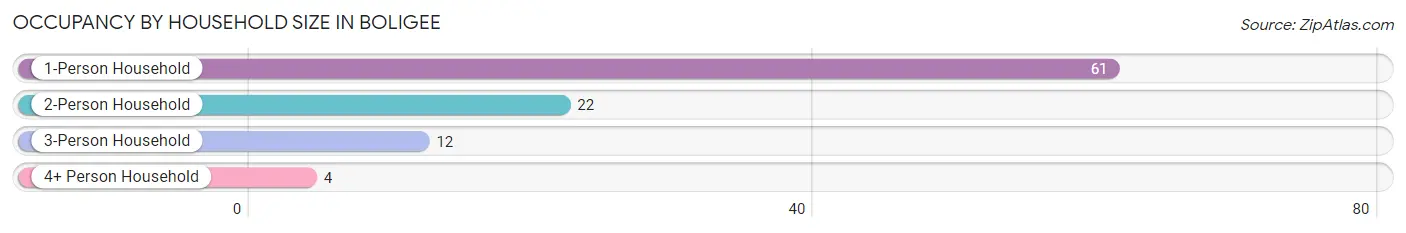
| Household Size | # Housing Units | % Housing Units |
| 1-Person Household | 61 | 61.6% |
| 2-Person Household | 22 | 22.2% |
| 3-Person Household | 12 | 12.1% |
| 4+ Person Household | 4 | 4.0% |
| Total Housing Units | 99 | 100.0% |
Occupancy by Ownership by Household Size in Boligee
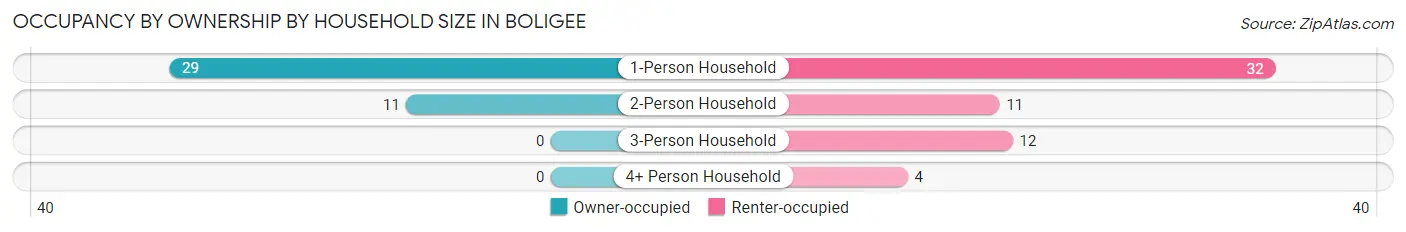
| Household Size | Owner-occupied | Renter-occupied |
| 1-Person Household | 29 (47.5%) | 32 (52.5%) |
| 2-Person Household | 11 (50.0%) | 11 (50.0%) |
| 3-Person Household | 0 (0.0%) | 12 (100.0%) |
| 4+ Person Household | 0 (0.0%) | 4 (100.0%) |
| Total Housing Units | 40 (40.4%) | 59 (59.6%) |
Occupancy by Educational Attainment in Boligee
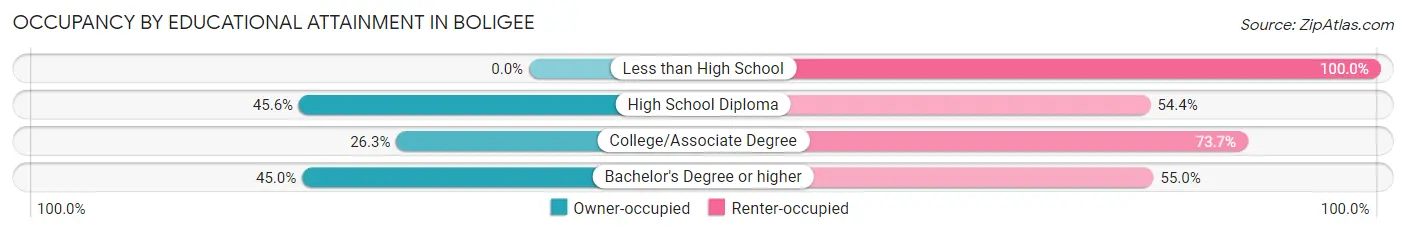
| Household Size | Owner-occupied | Renter-occupied |
| Less than High School | 0 (0.0%) | 3 (100.0%) |
| High School Diploma | 26 (45.6%) | 31 (54.4%) |
| College/Associate Degree | 5 (26.3%) | 14 (73.7%) |
| Bachelor's Degree or higher | 9 (45.0%) | 11 (55.0%) |
Occupancy by Age of Householder in Boligee
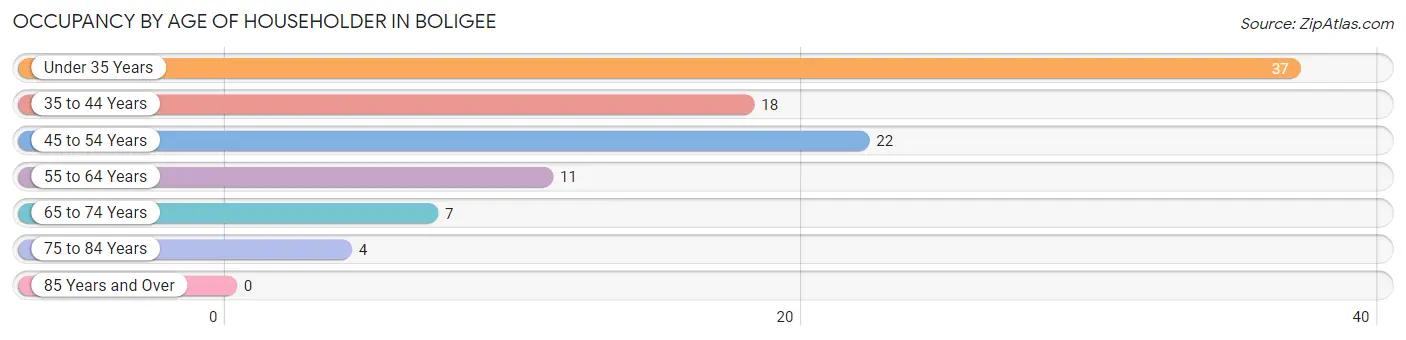
| Age Bracket | # Households | % Households |
| Under 35 Years | 37 | 37.4% |
| 35 to 44 Years | 18 | 18.2% |
| 45 to 54 Years | 22 | 22.2% |
| 55 to 64 Years | 11 | 11.1% |
| 65 to 74 Years | 7 | 7.1% |
| 75 to 84 Years | 4 | 4.0% |
| 85 Years and Over | 0 | 0.0% |
| Total | 99 | 100.0% |
Housing Finances in Boligee
Median Income by Occupancy in Boligee
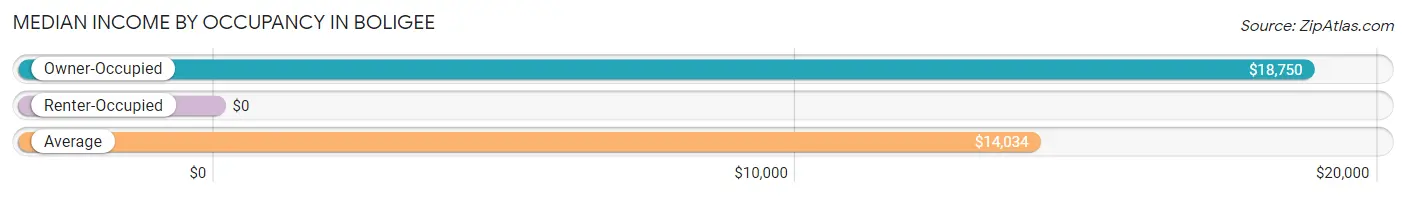
| Occupancy Type | # Households | Median Income |
| Owner-Occupied | 40 (40.4%) | $18,750 |
| Renter-Occupied | 59 (59.6%) | $0 |
| Average | 99 (100.0%) | $14,034 |
Occupancy by Householder Income Bracket in Boligee
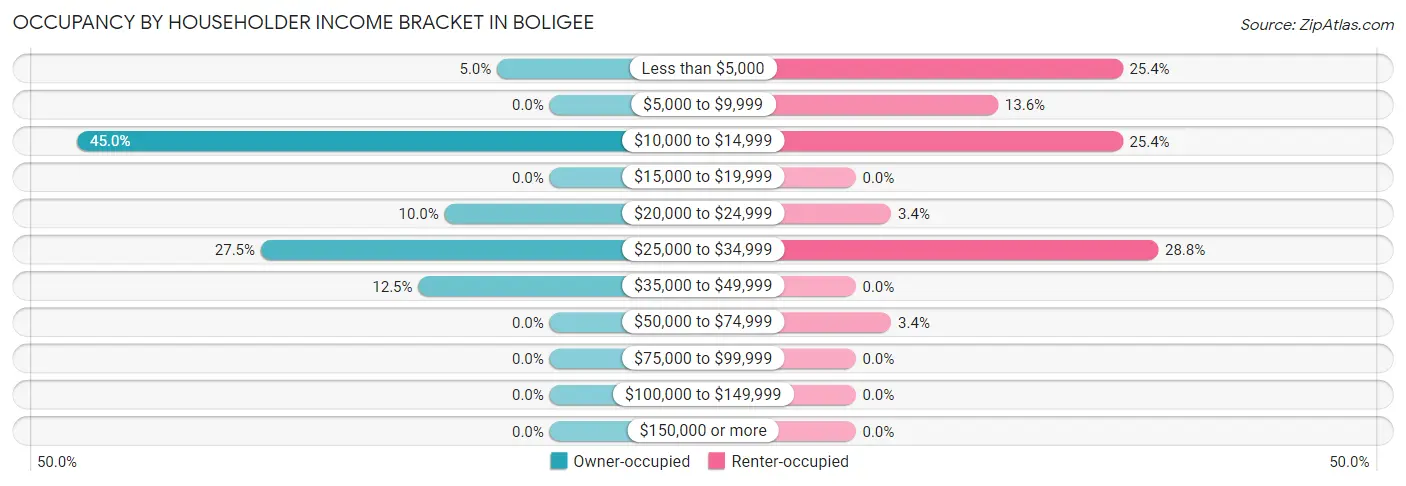
| Income Bracket | Owner-occupied | Renter-occupied |
| Less than $5,000 | 2 (5.0%) | 15 (25.4%) |
| $5,000 to $9,999 | 0 (0.0%) | 8 (13.6%) |
| $10,000 to $14,999 | 18 (45.0%) | 15 (25.4%) |
| $15,000 to $19,999 | 0 (0.0%) | 0 (0.0%) |
| $20,000 to $24,999 | 4 (10.0%) | 2 (3.4%) |
| $25,000 to $34,999 | 11 (27.5%) | 17 (28.8%) |
| $35,000 to $49,999 | 5 (12.5%) | 0 (0.0%) |
| $50,000 to $74,999 | 0 (0.0%) | 2 (3.4%) |
| $75,000 to $99,999 | 0 (0.0%) | 0 (0.0%) |
| $100,000 to $149,999 | 0 (0.0%) | 0 (0.0%) |
| $150,000 or more | 0 (0.0%) | 0 (0.0%) |
| Total | 40 (100.0%) | 59 (100.0%) |
Monthly Housing Cost Tiers in Boligee
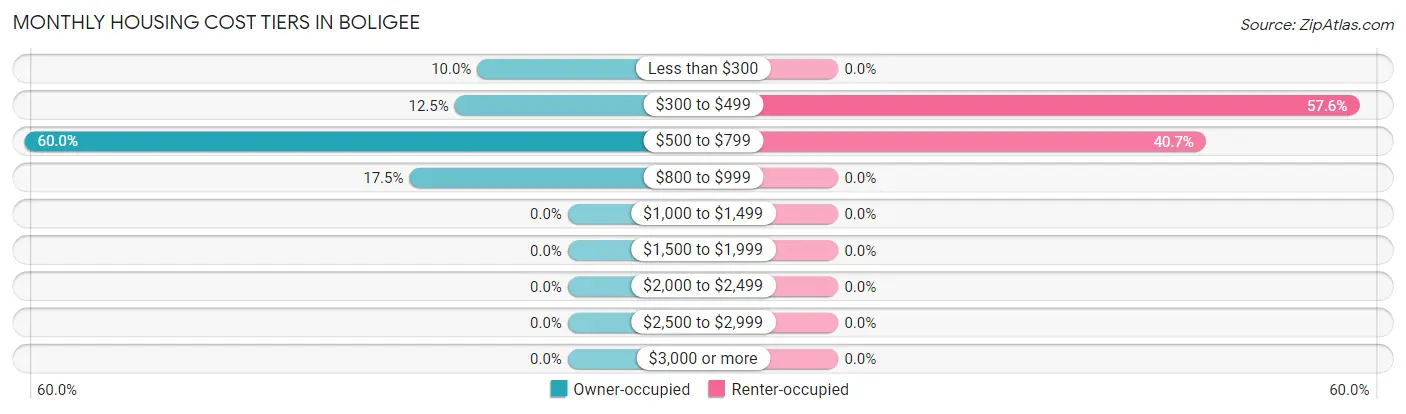
| Monthly Cost | Owner-occupied | Renter-occupied |
| Less than $300 | 4 (10.0%) | 0 (0.0%) |
| $300 to $499 | 5 (12.5%) | 34 (57.6%) |
| $500 to $799 | 24 (60.0%) | 24 (40.7%) |
| $800 to $999 | 7 (17.5%) | 0 (0.0%) |
| $1,000 to $1,499 | 0 (0.0%) | 0 (0.0%) |
| $1,500 to $1,999 | 0 (0.0%) | 0 (0.0%) |
| $2,000 to $2,499 | 0 (0.0%) | 0 (0.0%) |
| $2,500 to $2,999 | 0 (0.0%) | 0 (0.0%) |
| $3,000 or more | 0 (0.0%) | 0 (0.0%) |
| Total | 40 (100.0%) | 59 (100.0%) |
Physical Housing Characteristics in Boligee
Housing Structures in Boligee
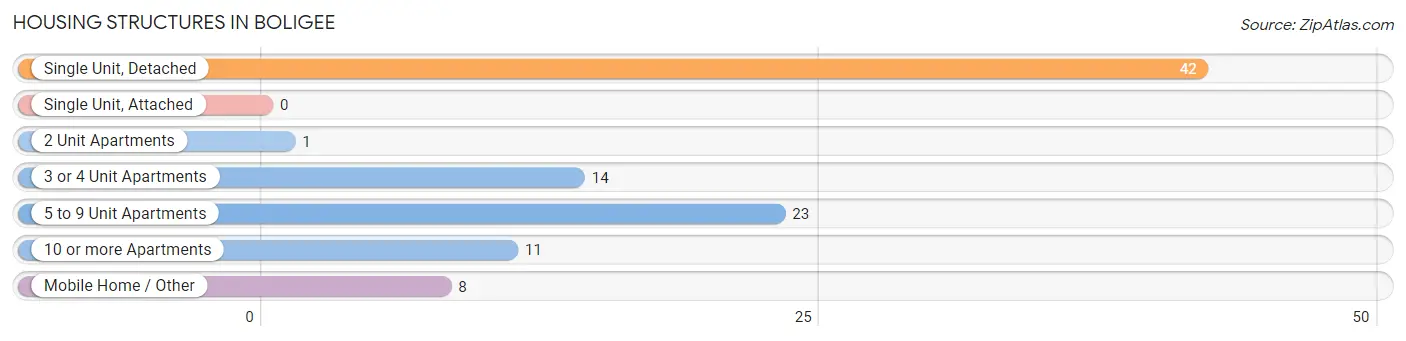
| Structure Type | # Housing Units | % Housing Units |
| Single Unit, Detached | 42 | 42.4% |
| Single Unit, Attached | 0 | 0.0% |
| 2 Unit Apartments | 1 | 1.0% |
| 3 or 4 Unit Apartments | 14 | 14.1% |
| 5 to 9 Unit Apartments | 23 | 23.2% |
| 10 or more Apartments | 11 | 11.1% |
| Mobile Home / Other | 8 | 8.1% |
| Total | 99 | 100.0% |
Housing Structures by Occupancy in Boligee
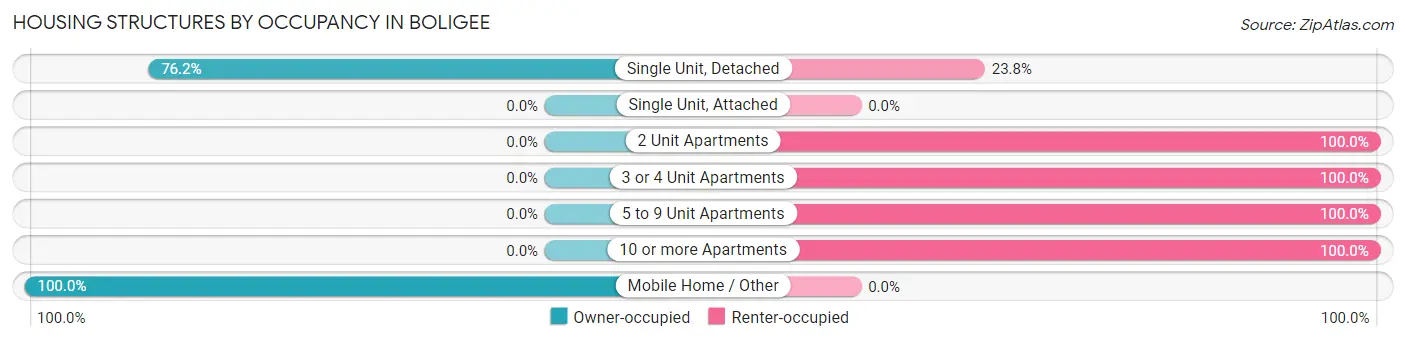
| Structure Type | Owner-occupied | Renter-occupied |
| Single Unit, Detached | 32 (76.2%) | 10 (23.8%) |
| Single Unit, Attached | 0 (0.0%) | 0 (0.0%) |
| 2 Unit Apartments | 0 (0.0%) | 1 (100.0%) |
| 3 or 4 Unit Apartments | 0 (0.0%) | 14 (100.0%) |
| 5 to 9 Unit Apartments | 0 (0.0%) | 23 (100.0%) |
| 10 or more Apartments | 0 (0.0%) | 11 (100.0%) |
| Mobile Home / Other | 8 (100.0%) | 0 (0.0%) |
| Total | 40 (40.4%) | 59 (59.6%) |
Housing Structures by Number of Rooms in Boligee
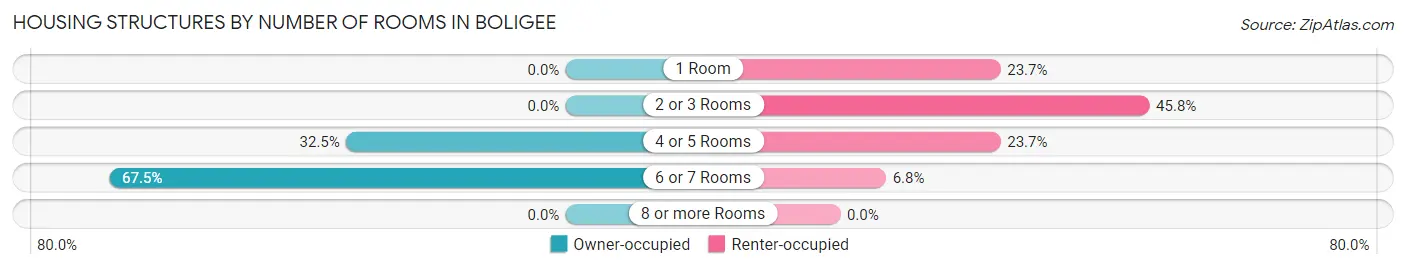
| Number of Rooms | Owner-occupied | Renter-occupied |
| 1 Room | 0 (0.0%) | 14 (23.7%) |
| 2 or 3 Rooms | 0 (0.0%) | 27 (45.8%) |
| 4 or 5 Rooms | 13 (32.5%) | 14 (23.7%) |
| 6 or 7 Rooms | 27 (67.5%) | 4 (6.8%) |
| 8 or more Rooms | 0 (0.0%) | 0 (0.0%) |
| Total | 40 (100.0%) | 59 (100.0%) |
Housing Structure by Heating Type in Boligee
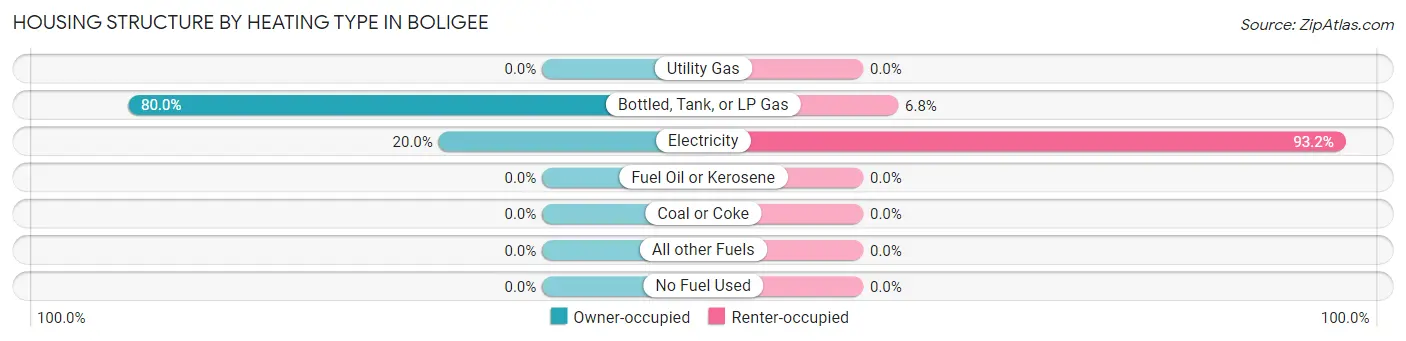
| Heating Type | Owner-occupied | Renter-occupied |
| Utility Gas | 0 (0.0%) | 0 (0.0%) |
| Bottled, Tank, or LP Gas | 32 (80.0%) | 4 (6.8%) |
| Electricity | 8 (20.0%) | 55 (93.2%) |
| Fuel Oil or Kerosene | 0 (0.0%) | 0 (0.0%) |
| Coal or Coke | 0 (0.0%) | 0 (0.0%) |
| All other Fuels | 0 (0.0%) | 0 (0.0%) |
| No Fuel Used | 0 (0.0%) | 0 (0.0%) |
| Total | 40 (100.0%) | 59 (100.0%) |
Household Vehicle Usage in Boligee
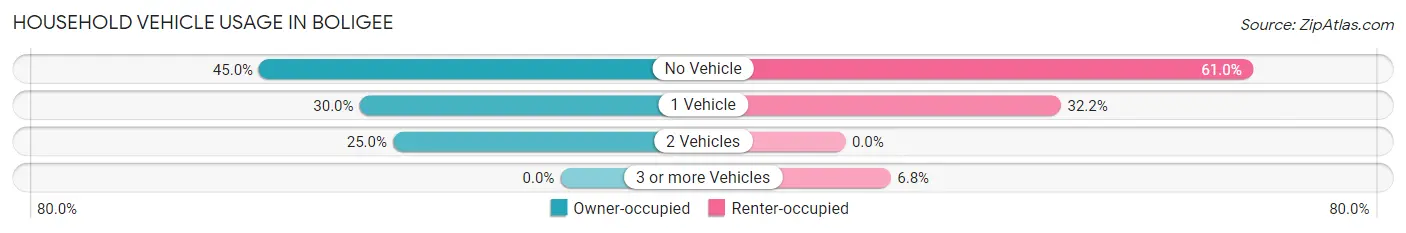
| Vehicles per Household | Owner-occupied | Renter-occupied |
| No Vehicle | 18 (45.0%) | 36 (61.0%) |
| 1 Vehicle | 12 (30.0%) | 19 (32.2%) |
| 2 Vehicles | 10 (25.0%) | 0 (0.0%) |
| 3 or more Vehicles | 0 (0.0%) | 4 (6.8%) |
| Total | 40 (100.0%) | 59 (100.0%) |
Real Estate & Mortgages in Boligee
Real Estate and Mortgage Overview in Boligee
| Characteristic | Without Mortgage | With Mortgage |
| Housing Units | 15 | 25 |
| Median Property Value | - | - |
| Median Household Income | $30,938 | $0 |
| Monthly Housing Costs | $335 | $0 |
| Real Estate Taxes | - | - |
Property Value by Mortgage Status in Boligee
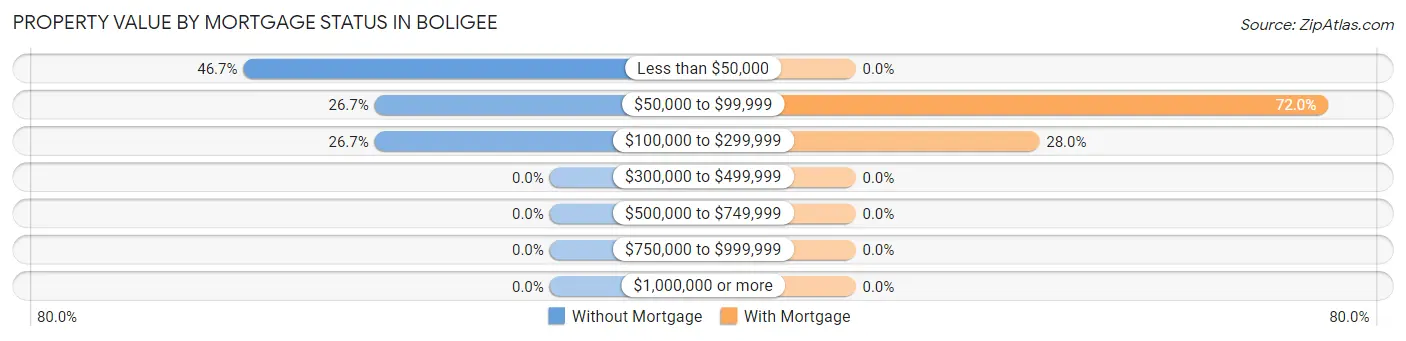
| Property Value | Without Mortgage | With Mortgage |
| Less than $50,000 | 7 (46.7%) | 0 (0.0%) |
| $50,000 to $99,999 | 4 (26.7%) | 18 (72.0%) |
| $100,000 to $299,999 | 4 (26.7%) | 7 (28.0%) |
| $300,000 to $499,999 | 0 (0.0%) | 0 (0.0%) |
| $500,000 to $749,999 | 0 (0.0%) | 0 (0.0%) |
| $750,000 to $999,999 | 0 (0.0%) | 0 (0.0%) |
| $1,000,000 or more | 0 (0.0%) | 0 (0.0%) |
| Total | 15 (100.0%) | 25 (100.0%) |
Household Income by Mortgage Status in Boligee
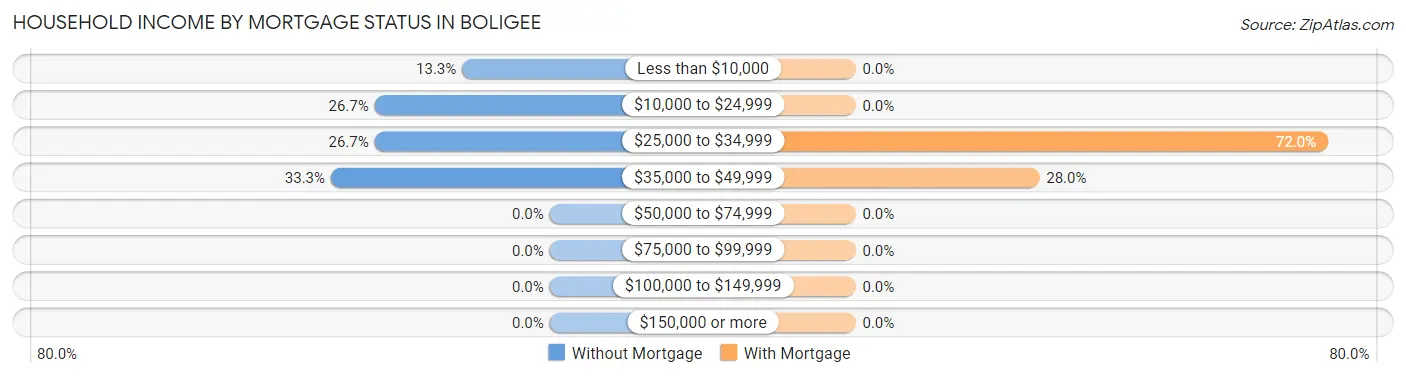
| Household Income | Without Mortgage | With Mortgage |
| Less than $10,000 | 2 (13.3%) | 0 (0.0%) |
| $10,000 to $24,999 | 4 (26.7%) | 0 (0.0%) |
| $25,000 to $34,999 | 4 (26.7%) | 18 (72.0%) |
| $35,000 to $49,999 | 5 (33.3%) | 7 (28.0%) |
| $50,000 to $74,999 | 0 (0.0%) | 0 (0.0%) |
| $75,000 to $99,999 | 0 (0.0%) | 0 (0.0%) |
| $100,000 to $149,999 | 0 (0.0%) | 0 (0.0%) |
| $150,000 or more | 0 (0.0%) | 0 (0.0%) |
| Total | 15 (100.0%) | 25 (100.0%) |
Property Value to Household Income Ratio in Boligee
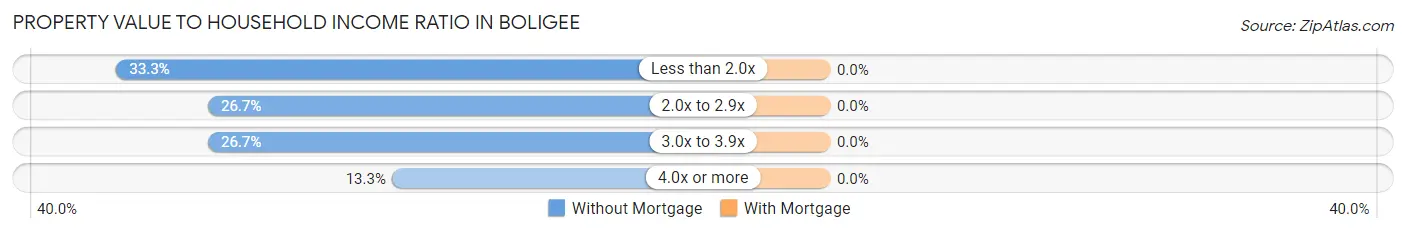
| Value-to-Income Ratio | Without Mortgage | With Mortgage |
| Less than 2.0x | 5 (33.3%) | 0 (0.0%) |
| 2.0x to 2.9x | 4 (26.7%) | 0 (0.0%) |
| 3.0x to 3.9x | 4 (26.7%) | 0 (0.0%) |
| 4.0x or more | 2 (13.3%) | 0 (0.0%) |
| Total | 15 (100.0%) | 25 (100.0%) |
Real Estate Taxes by Mortgage Status in Boligee
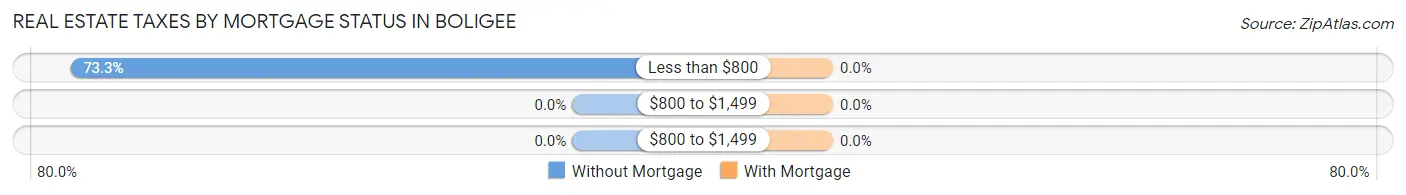
| Property Taxes | Without Mortgage | With Mortgage |
| Less than $800 | 11 (73.3%) | 0 (0.0%) |
| $800 to $1,499 | 0 (0.0%) | 0 (0.0%) |
| $800 to $1,499 | 0 (0.0%) | 0 (0.0%) |
| Total | 15 (100.0%) | 25 (100.0%) |
Health & Disability in Boligee
Health Insurance Coverage by Age in Boligee
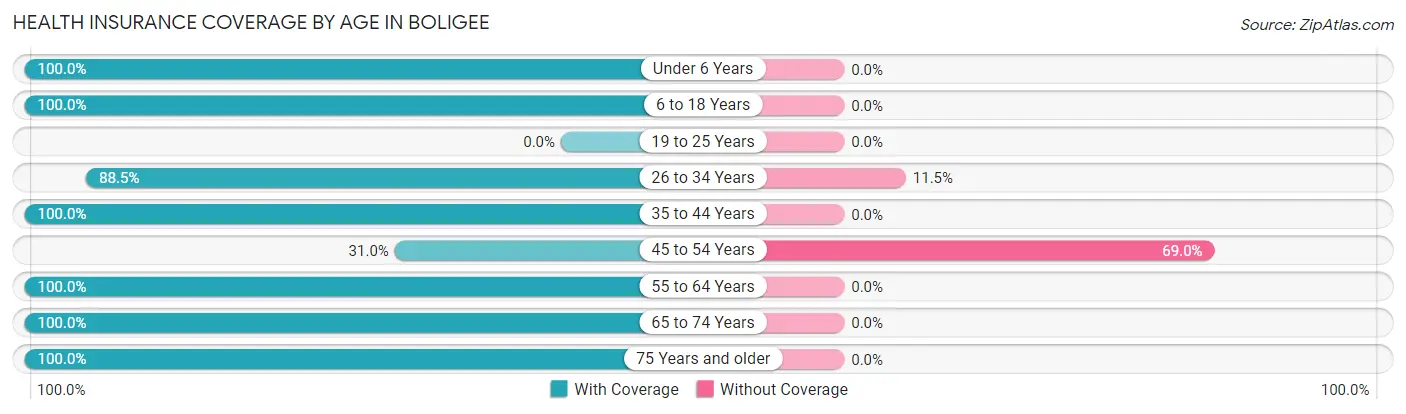
| Age Bracket | With Coverage | Without Coverage |
| Under 6 Years | 65 (100.0%) | 0 (0.0%) |
| 6 to 18 Years | 27 (100.0%) | 0 (0.0%) |
| 19 to 25 Years | 0 (0.0%) | 0 (0.0%) |
| 26 to 34 Years | 54 (88.5%) | 7 (11.5%) |
| 35 to 44 Years | 18 (100.0%) | 0 (0.0%) |
| 45 to 54 Years | 22 (31.0%) | 49 (69.0%) |
| 55 to 64 Years | 11 (100.0%) | 0 (0.0%) |
| 65 to 74 Years | 14 (100.0%) | 0 (0.0%) |
| 75 Years and older | 4 (100.0%) | 0 (0.0%) |
| Total | 215 (79.3%) | 56 (20.7%) |
Health Insurance Coverage by Citizenship Status in Boligee
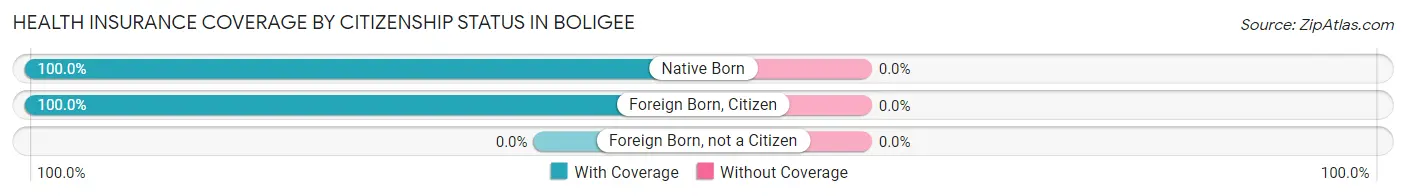
| Citizenship Status | With Coverage | Without Coverage |
| Native Born | 65 (100.0%) | 0 (0.0%) |
| Foreign Born, Citizen | 27 (100.0%) | 0 (0.0%) |
| Foreign Born, not a Citizen | 0 (0.0%) | 0 (0.0%) |
Health Insurance Coverage by Household Income in Boligee
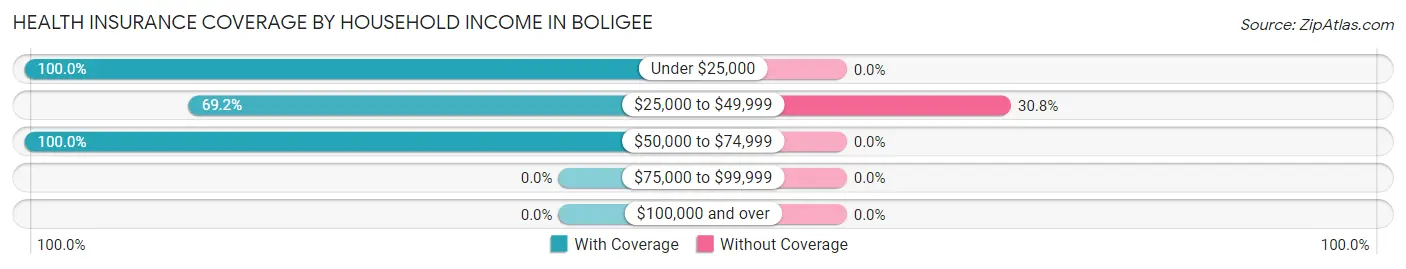
| Household Income | With Coverage | Without Coverage |
| Under $25,000 | 87 (100.0%) | 0 (0.0%) |
| $25,000 to $49,999 | 126 (69.2%) | 56 (30.8%) |
| $50,000 to $74,999 | 2 (100.0%) | 0 (0.0%) |
| $75,000 to $99,999 | 0 (0.0%) | 0 (0.0%) |
| $100,000 and over | 0 (0.0%) | 0 (0.0%) |
Public vs Private Health Insurance Coverage by Age in Boligee
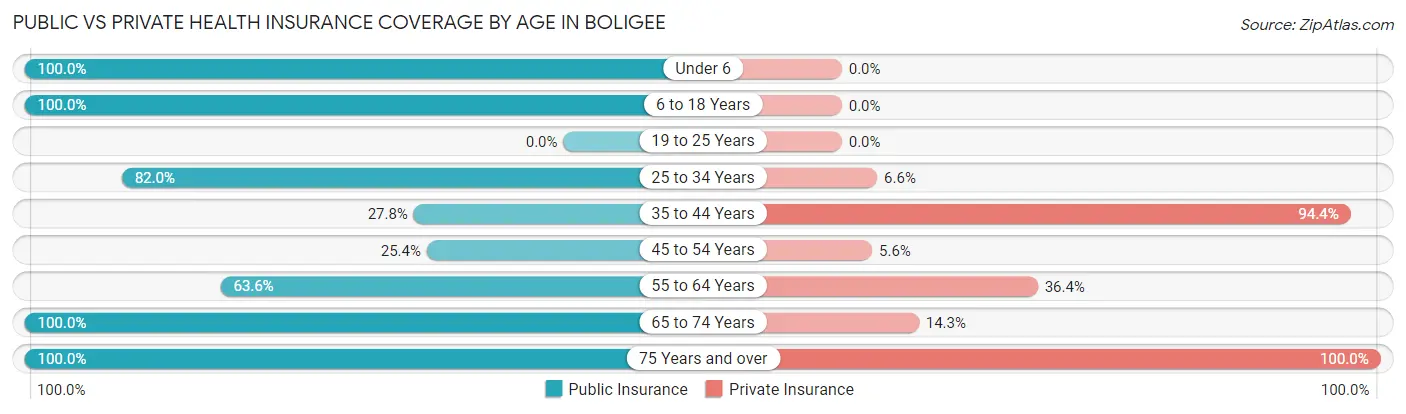
| Age Bracket | Public Insurance | Private Insurance |
| Under 6 | 65 (100.0%) | 0 (0.0%) |
| 6 to 18 Years | 27 (100.0%) | 0 (0.0%) |
| 19 to 25 Years | 0 (0.0%) | 0 (0.0%) |
| 25 to 34 Years | 50 (82.0%) | 4 (6.6%) |
| 35 to 44 Years | 5 (27.8%) | 17 (94.4%) |
| 45 to 54 Years | 18 (25.4%) | 4 (5.6%) |
| 55 to 64 Years | 7 (63.6%) | 4 (36.4%) |
| 65 to 74 Years | 14 (100.0%) | 2 (14.3%) |
| 75 Years and over | 4 (100.0%) | 4 (100.0%) |
| Total | 190 (70.1%) | 35 (12.9%) |
Disability Status by Sex by Age in Boligee
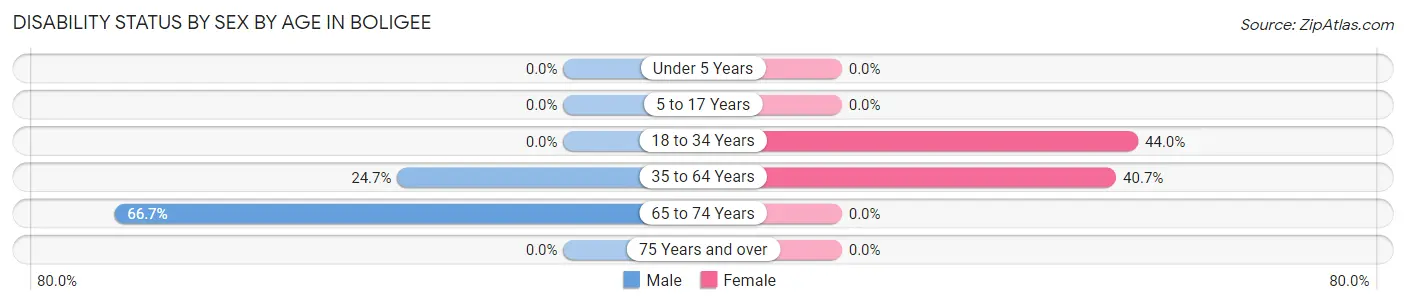
| Age Bracket | Male | Female |
| Under 5 Years | 0 (0.0%) | 0 (0.0%) |
| 5 to 17 Years | 0 (0.0%) | 0 (0.0%) |
| 18 to 34 Years | 0 (0.0%) | 22 (44.0%) |
| 35 to 64 Years | 18 (24.7%) | 11 (40.7%) |
| 65 to 74 Years | 8 (66.7%) | 0 (0.0%) |
| 75 Years and over | 0 (0.0%) | 0 (0.0%) |
Disability Class by Sex by Age in Boligee
Disability Class: Hearing Difficulty
| Age Bracket | Male | Female |
| Under 5 Years | 0 (0.0%) | 0 (0.0%) |
| 5 to 17 Years | 0 (0.0%) | 0 (0.0%) |
| 18 to 34 Years | 0 (0.0%) | 0 (0.0%) |
| 35 to 64 Years | 0 (0.0%) | 0 (0.0%) |
| 65 to 74 Years | 0 (0.0%) | 0 (0.0%) |
| 75 Years and over | 0 (0.0%) | 0 (0.0%) |
Disability Class: Vision Difficulty
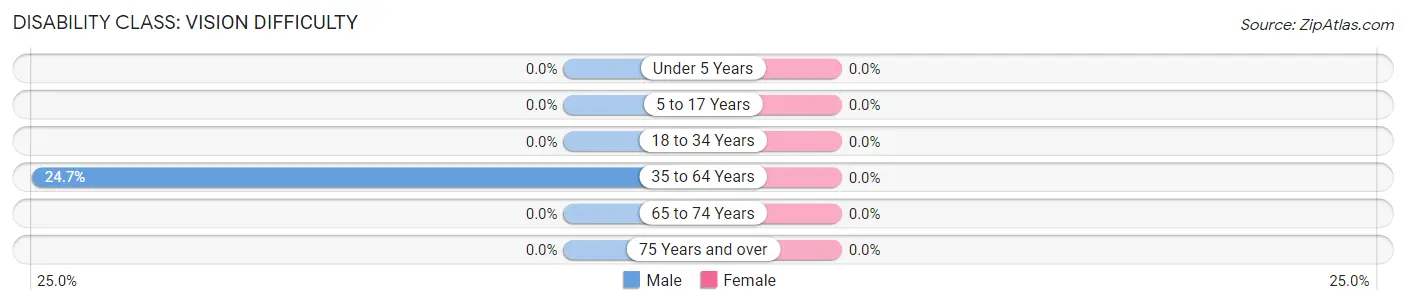
| Age Bracket | Male | Female |
| Under 5 Years | 0 (0.0%) | 0 (0.0%) |
| 5 to 17 Years | 0 (0.0%) | 0 (0.0%) |
| 18 to 34 Years | 0 (0.0%) | 0 (0.0%) |
| 35 to 64 Years | 18 (24.7%) | 0 (0.0%) |
| 65 to 74 Years | 0 (0.0%) | 0 (0.0%) |
| 75 Years and over | 0 (0.0%) | 0 (0.0%) |
Disability Class: Cognitive Difficulty
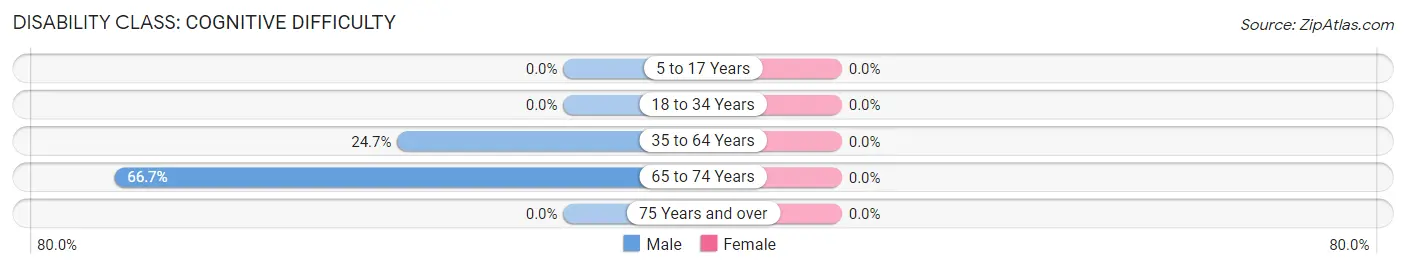
| Age Bracket | Male | Female |
| 5 to 17 Years | 0 (0.0%) | 0 (0.0%) |
| 18 to 34 Years | 0 (0.0%) | 0 (0.0%) |
| 35 to 64 Years | 18 (24.7%) | 0 (0.0%) |
| 65 to 74 Years | 8 (66.7%) | 0 (0.0%) |
| 75 Years and over | 0 (0.0%) | 0 (0.0%) |
Disability Class: Ambulatory Difficulty
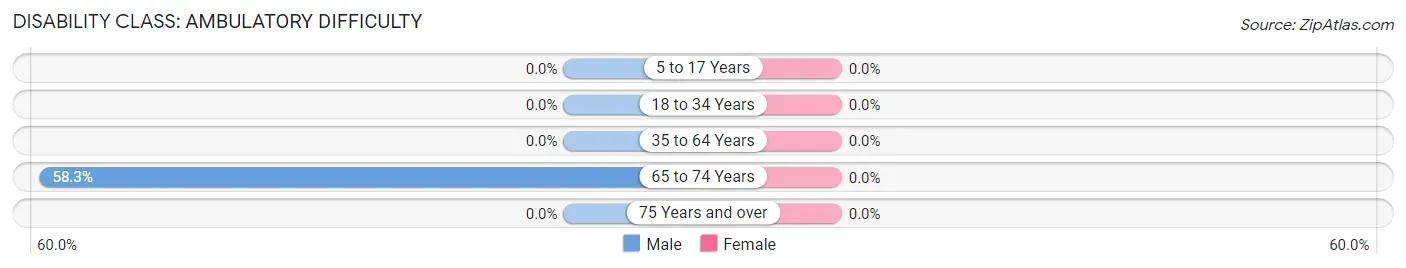
| Age Bracket | Male | Female |
| 5 to 17 Years | 0 (0.0%) | 0 (0.0%) |
| 18 to 34 Years | 0 (0.0%) | 0 (0.0%) |
| 35 to 64 Years | 0 (0.0%) | 0 (0.0%) |
| 65 to 74 Years | 7 (58.3%) | 0 (0.0%) |
| 75 Years and over | 0 (0.0%) | 0 (0.0%) |
Disability Class: Self-Care Difficulty
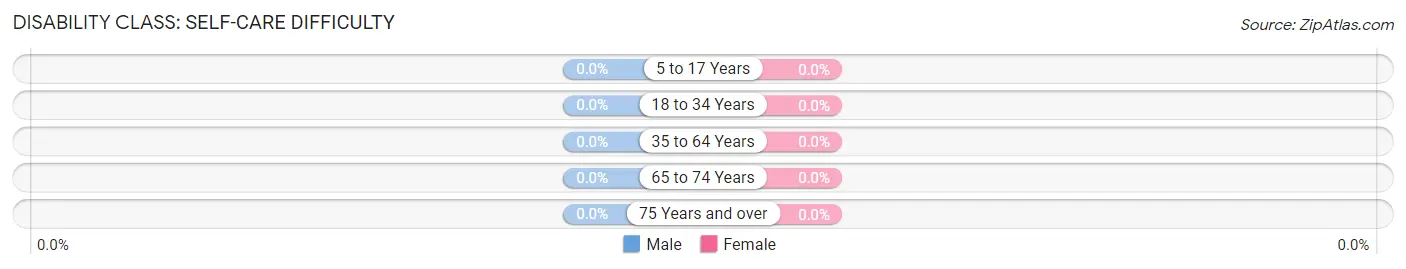
| Age Bracket | Male | Female |
| 5 to 17 Years | 0 (0.0%) | 0 (0.0%) |
| 18 to 34 Years | 0 (0.0%) | 0 (0.0%) |
| 35 to 64 Years | 0 (0.0%) | 0 (0.0%) |
| 65 to 74 Years | 0 (0.0%) | 0 (0.0%) |
| 75 Years and over | 0 (0.0%) | 0 (0.0%) |
Technology Access in Boligee
Computing Device Access in Boligee
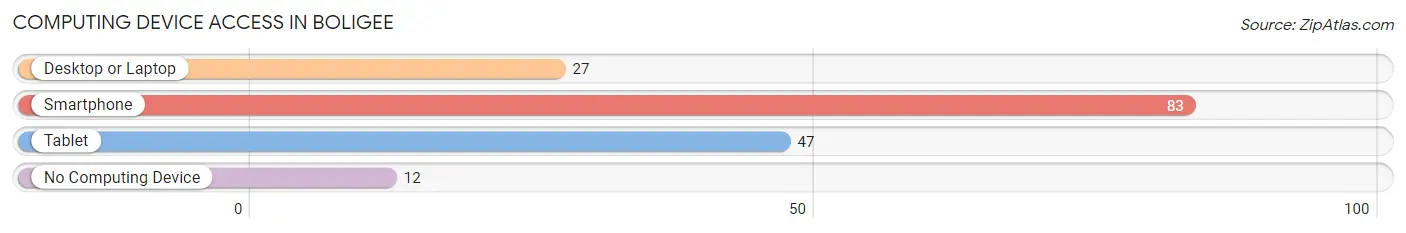
| Device Type | # Households | % Households |
| Desktop or Laptop | 27 | 27.3% |
| Smartphone | 83 | 83.8% |
| Tablet | 47 | 47.5% |
| No Computing Device | 12 | 12.1% |
| Total | 99 | 100.0% |
Internet Access in Boligee
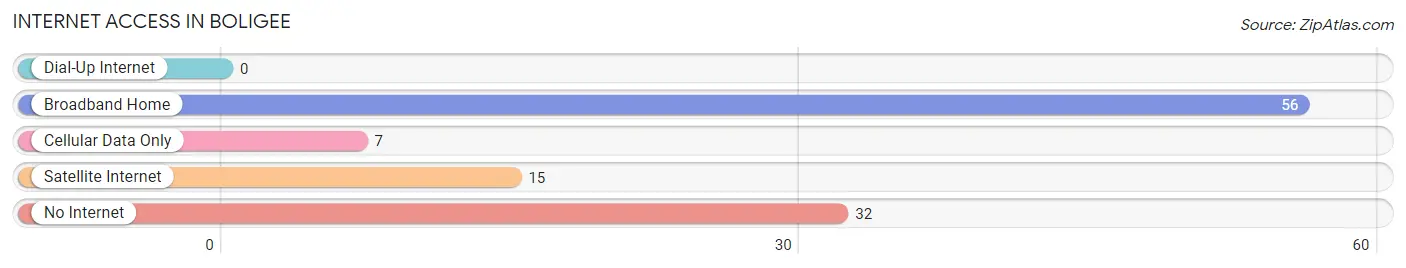
| Internet Type | # Households | % Households |
| Dial-Up Internet | 0 | 0.0% |
| Broadband Home | 56 | 56.6% |
| Cellular Data Only | 7 | 7.1% |
| Satellite Internet | 15 | 15.1% |
| No Internet | 32 | 32.3% |
| Total | 99 | 100.0% |
Boligee Summary
Boligee is a small town located in Greene County, Alabama. It is situated on the banks of the Tombigbee River, approximately 20 miles east of Tuscaloosa. The town was founded in 1819 and is named after the Choctaw chief, Boligee. The population of Boligee was 545 in the 2010 census.
Geography
Boligee is located at 32°59'25" North, 88°14'17" West (32.990278, -88.238056). It is situated on the banks of the Tombigbee River, approximately 20 miles east of Tuscaloosa. The town is located in the Black Belt region of Alabama, which is characterized by its rich, dark soil. The area is mostly flat, with some rolling hills. The climate is humid subtropical, with hot summers and mild winters.
Economy
Boligee’s economy is largely based on agriculture. The town is home to several farms, which produce cotton, soybeans, corn, and other crops. The town also has a few small businesses, including a grocery store, a gas station, and a few restaurants.
Demographics
As of the 2010 census, the population of Boligee was 545. The racial makeup of the town was 79.3% White, 19.3% African American, 0.2% Native American, 0.2% Asian, and 0.9% from other races. The median household income was $25,625, and the median family income was $31,250.
History
Boligee was founded in 1819 and is named after the Choctaw chief, Boligee. The town was originally a trading post for the Choctaw and Chickasaw tribes. In 1820, the town was incorporated and a post office was established. In the late 19th century, Boligee became a center for cotton production. The town was also home to several sawmills and gristmills.
In the early 20th century, Boligee was a thriving community. The town had several stores, a bank, a hotel, and a movie theater. The town also had a cotton gin and a lumber mill. In the 1950s, the town began to decline as the cotton industry declined. The town’s population decreased and many of the businesses closed.
Today, Boligee is a small, rural town. The town is home to several farms and a few small businesses. The town is also home to the Boligee Historic District, which is listed on the National Register of Historic Places. The district includes several historic buildings, including the Boligee Methodist Church, the Boligee Masonic Lodge, and the Boligee Post Office.
Common Questions
What is Per Capita Income in Boligee?
Per Capita income in Boligee is $7,215.
What is the Median Family Income in Boligee?
Median Family Income in Boligee is $25,972.
What is the Median Household income in Boligee?
Median Household Income in Boligee is $14,034.
What is Inequality or Gini Index in Boligee?
Inequality or Gini Index in Boligee is 0.40.
What is the Total Population of Boligee?
Total Population of Boligee is 271.
What is the Total Male Population of Boligee?
Total Male Population of Boligee is 163.
What is the Total Female Population of Boligee?
Total Female Population of Boligee is 108.
What is the Ratio of Males per 100 Females in Boligee?
There are 150.93 Males per 100 Females in Boligee.
What is the Ratio of Females per 100 Males in Boligee?
There are 66.26 Females per 100 Males in Boligee.
What is the Median Population Age in Boligee?
Median Population Age in Boligee is 31.7 Years.
What is the Average Family Size in Boligee
Average Family Size in Boligee is 5.1 People.
What is the Average Household Size in Boligee
Average Household Size in Boligee is 2.7 People.
How Large is the Labor Force in Boligee?
There are 96 People in the Labor Forcein in Boligee.
What is the Percentage of People in the Labor Force in Boligee?
53.6% of People are in the Labor Force in Boligee.
What is the Unemployment Rate in Boligee?
Unemployment Rate in Boligee is 51.0%.