Blountsville, AL Map & Demographics
Blountsville Map
Blountsville Overview
$22,934
PER CAPITA INCOME
$57,688
AVG FAMILY INCOME
$43,455
AVG HOUSEHOLD INCOME
6.4%
WAGE / INCOME GAP [ % ]
93.6¢/ $1
WAGE / INCOME GAP [ $ ]
0.45
INEQUALITY / GINI INDEX
1,837
TOTAL POPULATION
881
MALE POPULATION
956
FEMALE POPULATION
92.15
MALES / 100 FEMALES
108.51
FEMALES / 100 MALES
33.9
MEDIAN AGE
3.5
AVG FAMILY SIZE
2.7
AVG HOUSEHOLD SIZE
777
LABOR FORCE [ PEOPLE ]
54.2%
PERCENT IN LABOR FORCE
2.7%
UNEMPLOYMENT RATE
Blountsville Zip Codes
Blountsville Area Codes
Income in Blountsville
Income Overview in Blountsville
Per Capita Income in Blountsville is $22,934, while median incomes of families and households are $57,688 and $43,455 respectively.
| Characteristic | Number | Measure |
| Per Capita Income | 1,837 | $22,934 |
| Median Family Income | 443 | $57,688 |
| Mean Family Income | 443 | $71,726 |
| Median Household Income | 684 | $43,455 |
| Mean Household Income | 684 | $56,605 |
| Income Deficit | 443 | $0 |
| Wage / Income Gap (%) | 1,837 | 6.42% |
| Wage / Income Gap ($) | 1,837 | 93.58¢ per $1 |
| Gini / Inequality Index | 1,837 | 0.45 |
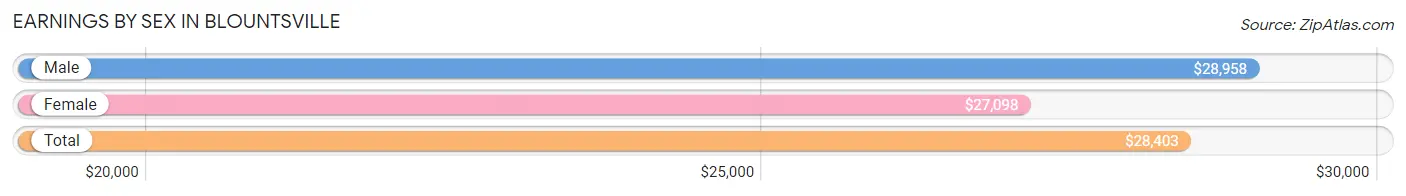
Earnings by Sex in Blountsville
Average Earnings in Blountsville are $28,403, $28,958 for men and $27,098 for women, a difference of 6.4%.
| Sex | Number | Average Earnings |
| Male | 415 (51.6%) | $28,958 |
| Female | 389 (48.4%) | $27,098 |
| Total | 804 (100.0%) | $28,403 |
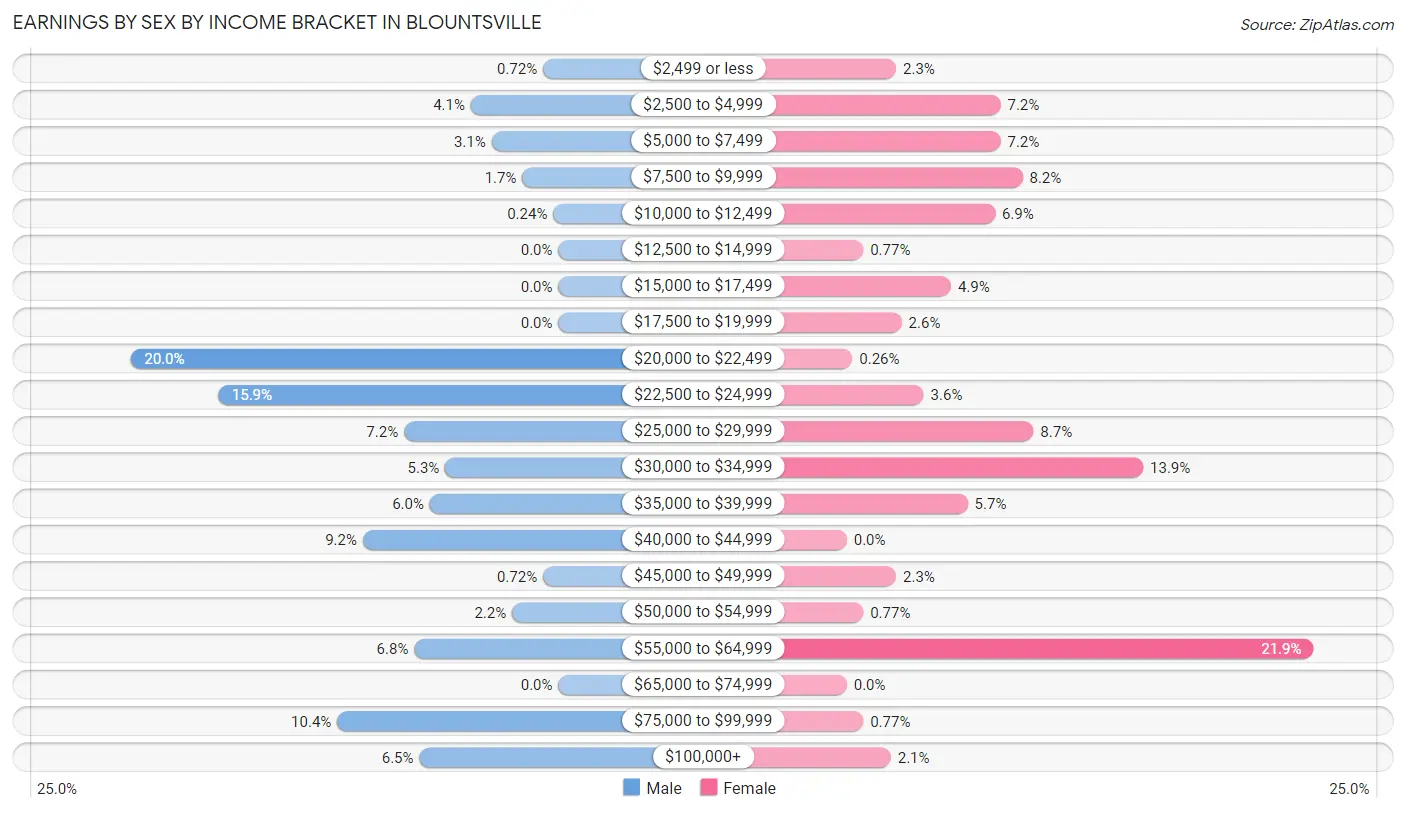
Earnings by Sex by Income Bracket in Blountsville
The most common earnings brackets in Blountsville are $20,000 to $22,499 for men (83 | 20.0%) and $55,000 to $64,999 for women (85 | 21.8%).
| Income | Male | Female |
| $2,499 or less | 3 (0.7%) | 9 (2.3%) |
| $2,500 to $4,999 | 17 (4.1%) | 28 (7.2%) |
| $5,000 to $7,499 | 13 (3.1%) | 28 (7.2%) |
| $7,500 to $9,999 | 7 (1.7%) | 32 (8.2%) |
| $10,000 to $12,499 | 1 (0.2%) | 27 (6.9%) |
| $12,500 to $14,999 | 0 (0.0%) | 3 (0.8%) |
| $15,000 to $17,499 | 0 (0.0%) | 19 (4.9%) |
| $17,500 to $19,999 | 0 (0.0%) | 10 (2.6%) |
| $20,000 to $22,499 | 83 (20.0%) | 1 (0.3%) |
| $22,500 to $24,999 | 66 (15.9%) | 14 (3.6%) |
| $25,000 to $29,999 | 30 (7.2%) | 34 (8.7%) |
| $30,000 to $34,999 | 22 (5.3%) | 54 (13.9%) |
| $35,000 to $39,999 | 25 (6.0%) | 22 (5.7%) |
| $40,000 to $44,999 | 38 (9.2%) | 0 (0.0%) |
| $45,000 to $49,999 | 3 (0.7%) | 9 (2.3%) |
| $50,000 to $54,999 | 9 (2.2%) | 3 (0.8%) |
| $55,000 to $64,999 | 28 (6.8%) | 85 (21.8%) |
| $65,000 to $74,999 | 0 (0.0%) | 0 (0.0%) |
| $75,000 to $99,999 | 43 (10.4%) | 3 (0.8%) |
| $100,000+ | 27 (6.5%) | 8 (2.1%) |
| Total | 415 (100.0%) | 389 (100.0%) |
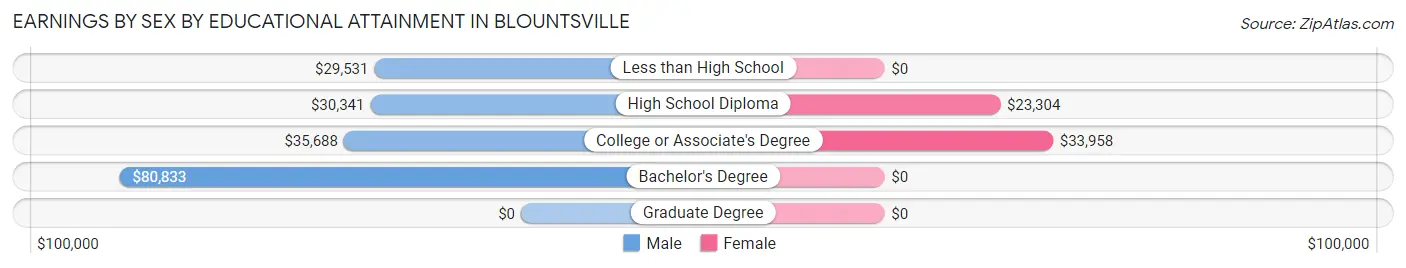
Earnings by Sex by Educational Attainment in Blountsville
Average earnings in Blountsville are $33,056 for men and $30,926 for women, a difference of 6.4%. Men with an educational attainment of bachelor's degree enjoy the highest average annual earnings of $80,833, while those with less than high school education earn the least with $29,531. Women with an educational attainment of college or associate's degree earn the most with the average annual earnings of $33,958, while those with high school diploma education have the smallest earnings of $23,304.
| Educational Attainment | Male Income | Female Income |
| Less than High School | $29,531 | $0 |
| High School Diploma | $30,341 | $23,304 |
| College or Associate's Degree | $35,688 | $33,958 |
| Bachelor's Degree | $80,833 | $0 |
| Graduate Degree | - | - |
| Total | $33,056 | $30,926 |
Family Income in Blountsville
Family Income Brackets in Blountsville
According to the Blountsville family income data, there are 90 families falling into the $35,000 to $49,999 income range, which is the most common income bracket and makes up 20.3% of all families. Conversely, the less than $10,000 income bracket is the least frequent group with only 8 families (1.8%) belonging to this category.
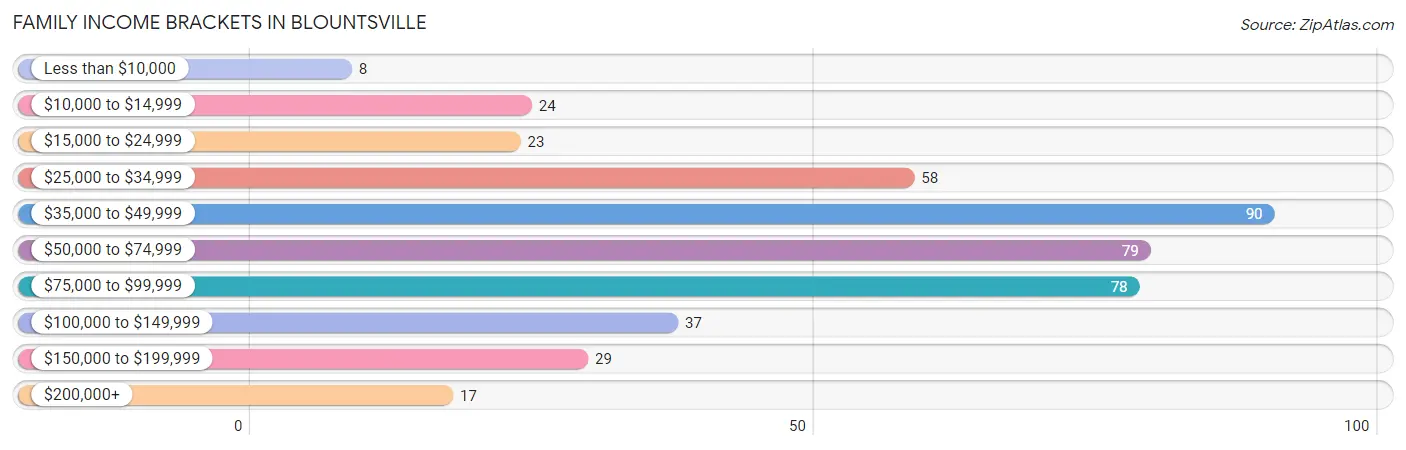
| Income Bracket | # Families | % Families |
| Less than $10,000 | 8 | 1.8% |
| $10,000 to $14,999 | 24 | 5.4% |
| $15,000 to $24,999 | 23 | 5.2% |
| $25,000 to $34,999 | 58 | 13.1% |
| $35,000 to $49,999 | 90 | 20.3% |
| $50,000 to $74,999 | 79 | 17.8% |
| $75,000 to $99,999 | 78 | 17.6% |
| $100,000 to $149,999 | 37 | 8.4% |
| $150,000 to $199,999 | 29 | 6.5% |
| $200,000+ | 17 | 3.8% |
Family Income by Famaliy Size in Blountsville
4-person families (60 | 13.5%) account for the highest median family income in Blountsville with $87,727 per family, while 3-person families (74 | 16.7%) have the highest median income of $27,083 per family member.
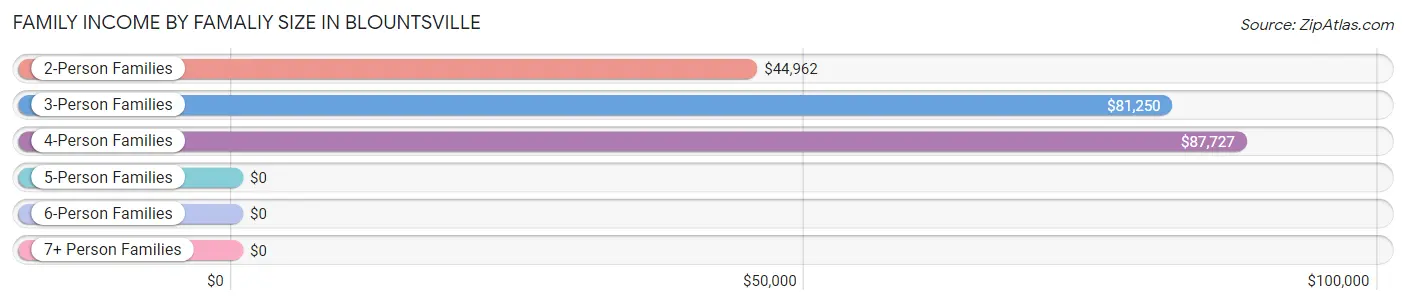
| Income Bracket | # Families | Median Income |
| 2-Person Families | 240 (54.2%) | $44,962 |
| 3-Person Families | 74 (16.7%) | $81,250 |
| 4-Person Families | 60 (13.5%) | $87,727 |
| 5-Person Families | 37 (8.4%) | $0 |
| 6-Person Families | 16 (3.6%) | $0 |
| 7+ Person Families | 16 (3.6%) | $0 |
| Total | 443 (100.0%) | $57,688 |
Family Income by Number of Earners in Blountsville
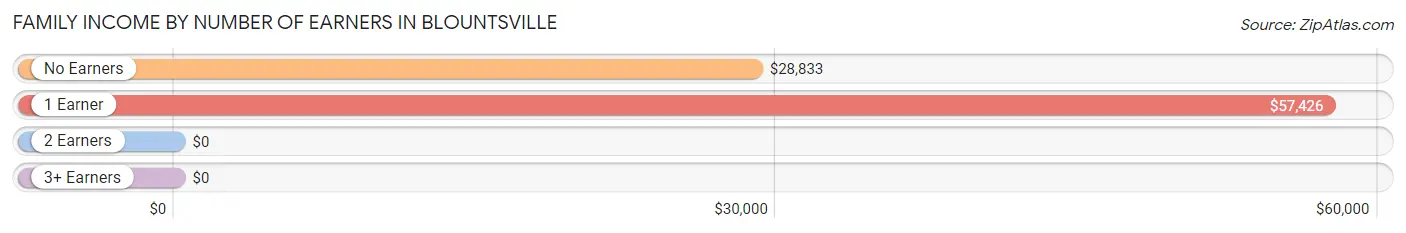
| Number of Earners | # Families | Median Income |
| No Earners | 72 (16.3%) | $28,833 |
| 1 Earner | 175 (39.5%) | $57,426 |
| 2 Earners | 146 (33.0%) | $0 |
| 3+ Earners | 50 (11.3%) | $0 |
| Total | 443 (100.0%) | $57,688 |
Household Income in Blountsville
Household Income Brackets in Blountsville
With 133 households falling in the category, the $35,000 to $49,999 income range is the most frequent in Blountsville, accounting for 19.4% of all households. In contrast, only 22 households (3.2%) fall into the $200,000+ income bracket, making it the least populous group.
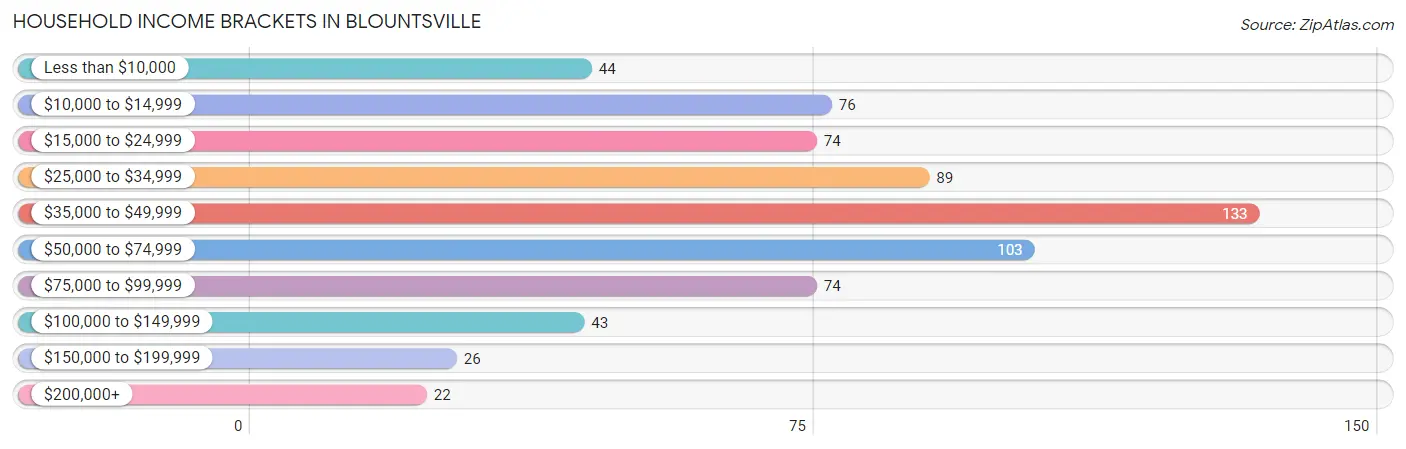
| Income Bracket | # Households | % Households |
| Less than $10,000 | 44 | 6.4% |
| $10,000 to $14,999 | 76 | 11.1% |
| $15,000 to $24,999 | 74 | 10.8% |
| $25,000 to $34,999 | 89 | 13.0% |
| $35,000 to $49,999 | 133 | 19.4% |
| $50,000 to $74,999 | 103 | 15.1% |
| $75,000 to $99,999 | 74 | 10.8% |
| $100,000 to $149,999 | 43 | 6.3% |
| $150,000 to $199,999 | 26 | 3.8% |
| $200,000+ | 22 | 3.2% |
Household Income by Householder Age in Blountsville
The median household income in Blountsville is $43,455, with the highest median household income of $51,389 found in the 45 to 64 years age bracket for the primary householder. A total of 258 households (37.7%) fall into this category. Meanwhile, the 15 to 24 years age bracket for the primary householder has the lowest median household income of $0, with 34 households (5.0%) in this group.
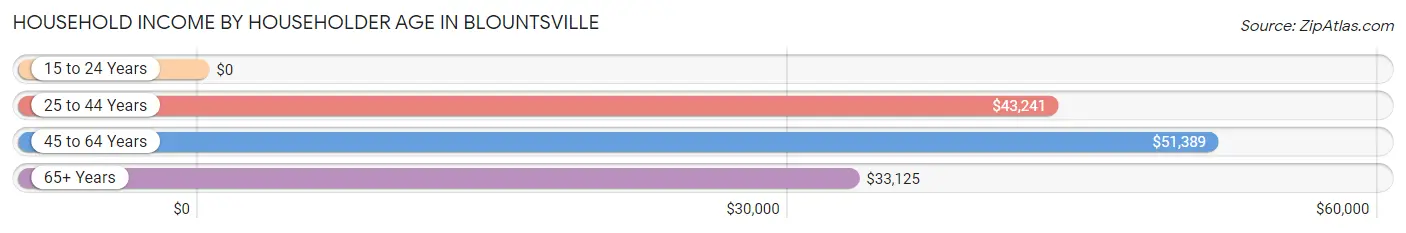
| Income Bracket | # Households | Median Income |
| 15 to 24 Years | 34 (5.0%) | $0 |
| 25 to 44 Years | 154 (22.5%) | $43,241 |
| 45 to 64 Years | 258 (37.7%) | $51,389 |
| 65+ Years | 238 (34.8%) | $33,125 |
| Total | 684 (100.0%) | $43,455 |
Poverty in Blountsville
Income Below Poverty by Sex and Age in Blountsville
With 16.0% poverty level for males and 21.2% for females among the residents of Blountsville, 5 year old males and 6 to 11 year old females are the most vulnerable to poverty, with 10 males (100.0%) and 15 females (75.0%) in their respective age groups living below the poverty level.
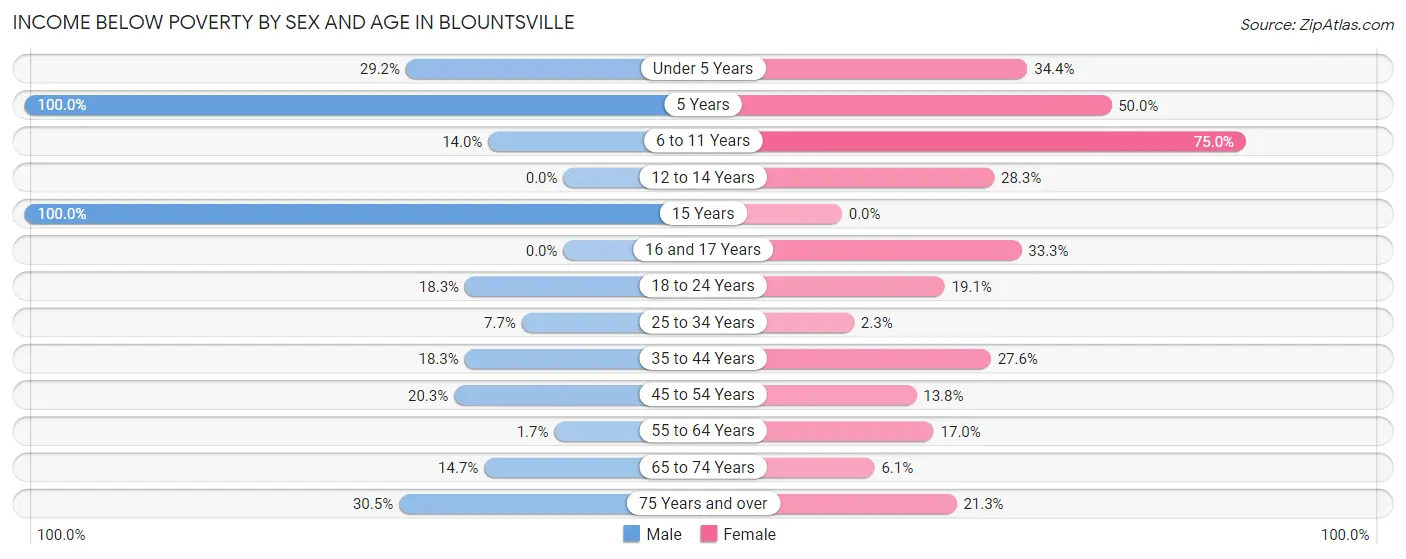
| Age Bracket | Male | Female |
| Under 5 Years | 19 (29.2%) | 42 (34.4%) |
| 5 Years | 10 (100.0%) | 9 (50.0%) |
| 6 to 11 Years | 12 (14.0%) | 15 (75.0%) |
| 12 to 14 Years | 0 (0.0%) | 13 (28.3%) |
| 15 Years | 11 (100.0%) | 0 (0.0%) |
| 16 and 17 Years | 0 (0.0%) | 7 (33.3%) |
| 18 to 24 Years | 19 (18.3%) | 17 (19.1%) |
| 25 to 34 Years | 15 (7.7%) | 2 (2.2%) |
| 35 to 44 Years | 11 (18.3%) | 34 (27.6%) |
| 45 to 54 Years | 14 (20.3%) | 17 (13.8%) |
| 55 to 64 Years | 2 (1.7%) | 23 (17.0%) |
| 65 to 74 Years | 10 (14.7%) | 4 (6.1%) |
| 75 Years and over | 18 (30.5%) | 20 (21.3%) |
| Total | 141 (16.0%) | 203 (21.2%) |
Income Above Poverty by Sex and Age in Blountsville
According to the poverty statistics in Blountsville, males aged 12 to 14 years and females aged 15 years are the age groups that are most secure financially, with 100.0% of males and 100.0% of females in these age groups living above the poverty line.
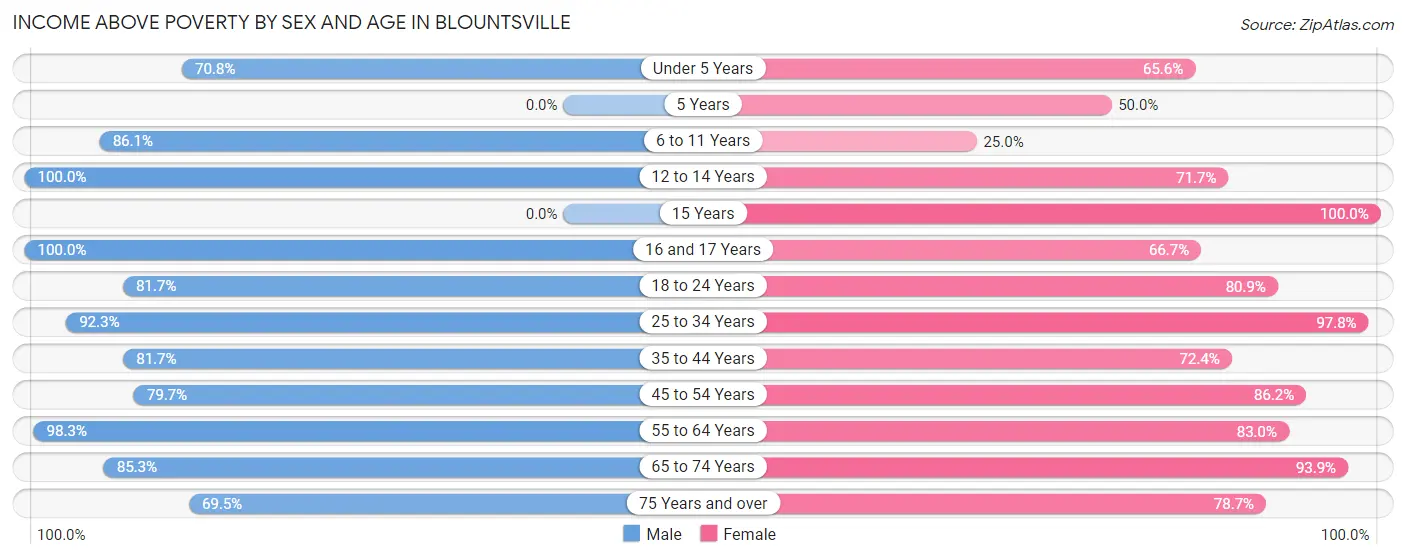
| Age Bracket | Male | Female |
| Under 5 Years | 46 (70.8%) | 80 (65.6%) |
| 5 Years | 0 (0.0%) | 9 (50.0%) |
| 6 to 11 Years | 74 (86.1%) | 5 (25.0%) |
| 12 to 14 Years | 16 (100.0%) | 33 (71.7%) |
| 15 Years | 0 (0.0%) | 10 (100.0%) |
| 16 and 17 Years | 20 (100.0%) | 14 (66.7%) |
| 18 to 24 Years | 85 (81.7%) | 72 (80.9%) |
| 25 to 34 Years | 179 (92.3%) | 87 (97.8%) |
| 35 to 44 Years | 49 (81.7%) | 89 (72.4%) |
| 45 to 54 Years | 55 (79.7%) | 106 (86.2%) |
| 55 to 64 Years | 117 (98.3%) | 112 (83.0%) |
| 65 to 74 Years | 58 (85.3%) | 62 (93.9%) |
| 75 Years and over | 41 (69.5%) | 74 (78.7%) |
| Total | 740 (84.0%) | 753 (78.8%) |
Income Below Poverty Among Married-Couple Families in Blountsville
The poverty statistics for married-couple families in Blountsville show that 12.0% or 27 of the total 224 families live below the poverty line. Families with 1 or 2 children have the highest poverty rate of 34.7%, comprising of 26 families. On the other hand, families with no children have the lowest poverty rate of 0.0%, which includes 0 families.
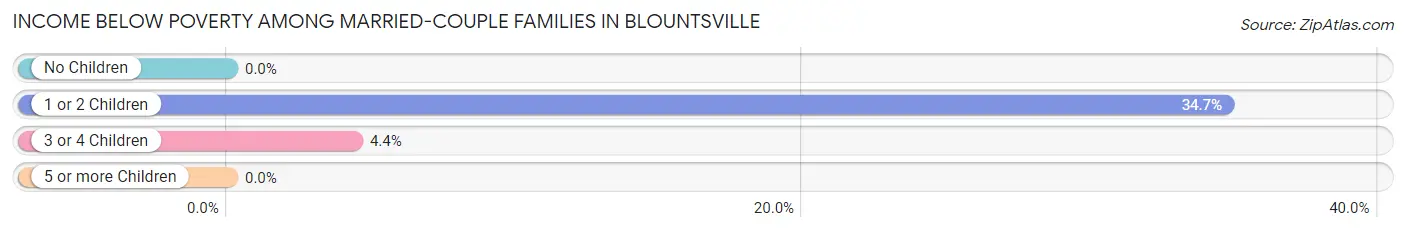
| Children | Above Poverty | Below Poverty |
| No Children | 126 (100.0%) | 0 (0.0%) |
| 1 or 2 Children | 49 (65.3%) | 26 (34.7%) |
| 3 or 4 Children | 22 (95.7%) | 1 (4.3%) |
| 5 or more Children | 0 (0.0%) | 0 (0.0%) |
| Total | 197 (87.9%) | 27 (12.0%) |
Income Below Poverty Among Single-Parent Households in Blountsville
According to the poverty data in Blountsville, 7.6% or 6 single-father households and 16.4% or 23 single-mother households are living below the poverty line. Among single-father households, those with 1 or 2 children have the highest poverty rate, with 6 households (75.0%) experiencing poverty. Likewise, among single-mother households, those with 3 or 4 children have the highest poverty rate, with 12 households (100.0%) falling below the poverty line.
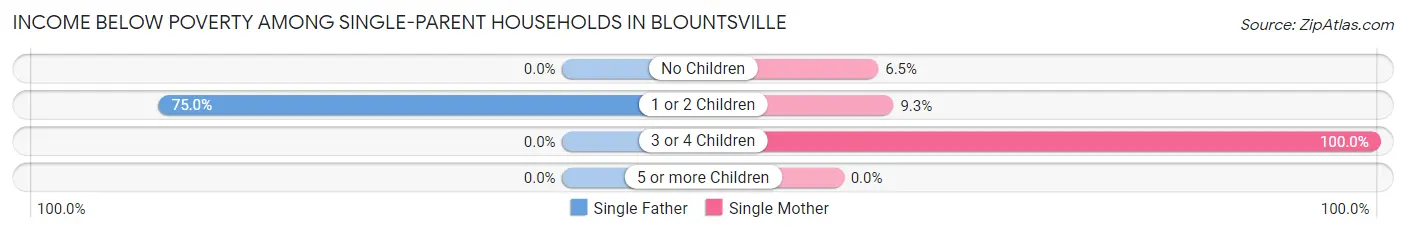
| Children | Single Father | Single Mother |
| No Children | 0 (0.0%) | 2 (6.5%) |
| 1 or 2 Children | 6 (75.0%) | 9 (9.3%) |
| 3 or 4 Children | 0 (0.0%) | 12 (100.0%) |
| 5 or more Children | 0 (0.0%) | 0 (0.0%) |
| Total | 6 (7.6%) | 23 (16.4%) |
Income Below Poverty Among Married-Couple vs Single-Parent Households in Blountsville
The poverty data for Blountsville shows that 27 of the married-couple family households (12.0%) and 29 of the single-parent households (13.2%) are living below the poverty level. Within the married-couple family households, those with 1 or 2 children have the highest poverty rate, with 26 households (34.7%) falling below the poverty line. Among the single-parent households, those with 3 or 4 children have the highest poverty rate, with 12 household (66.7%) living below poverty.
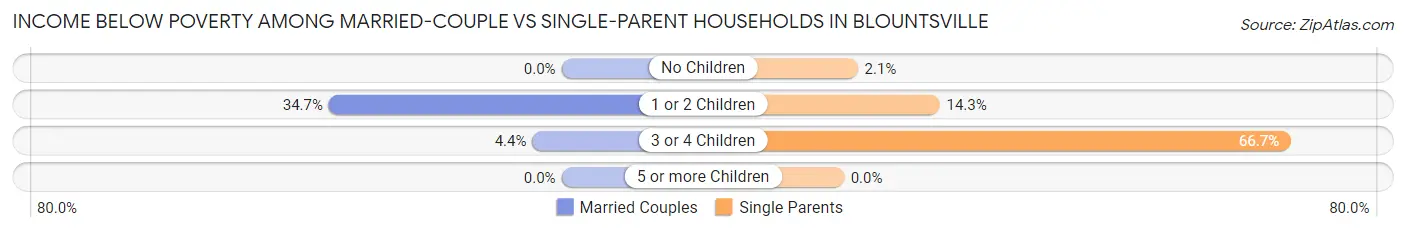
| Children | Married-Couple Families | Single-Parent Households |
| No Children | 0 (0.0%) | 2 (2.1%) |
| 1 or 2 Children | 26 (34.7%) | 15 (14.3%) |
| 3 or 4 Children | 1 (4.3%) | 12 (66.7%) |
| 5 or more Children | 0 (0.0%) | 0 (0.0%) |
| Total | 27 (12.0%) | 29 (13.2%) |
Race in Blountsville
The most populous races in Blountsville are White / Caucasian (1,537 | 83.7%), Hispanic or Latino (259 | 14.1%), and Two or more Races (128 | 7.0%).
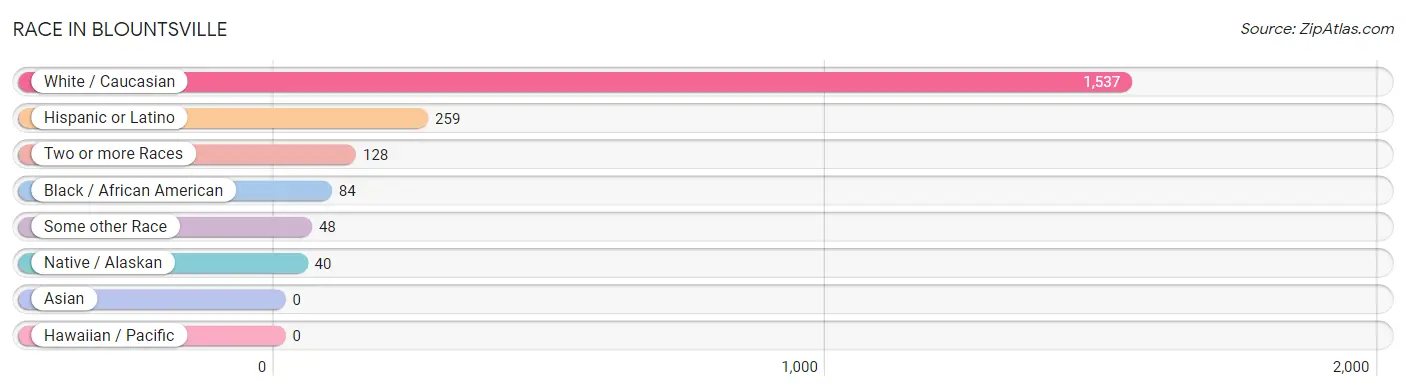
| Race | # Population | % Population |
| Asian | 0 | 0.0% |
| Black / African American | 84 | 4.6% |
| Hawaiian / Pacific | 0 | 0.0% |
| Hispanic or Latino | 259 | 14.1% |
| Native / Alaskan | 40 | 2.2% |
| White / Caucasian | 1,537 | 83.7% |
| Two or more Races | 128 | 7.0% |
| Some other Race | 48 | 2.6% |
| Total | 1,837 | 100.0% |
Ancestry in Blountsville
The most populous ancestries reported in Blountsville are Irish (327 | 17.8%), Mexican (206 | 11.2%), English (169 | 9.2%), American (138 | 7.5%), and Cherokee (101 | 5.5%), together accounting for 51.2% of all Blountsville residents.
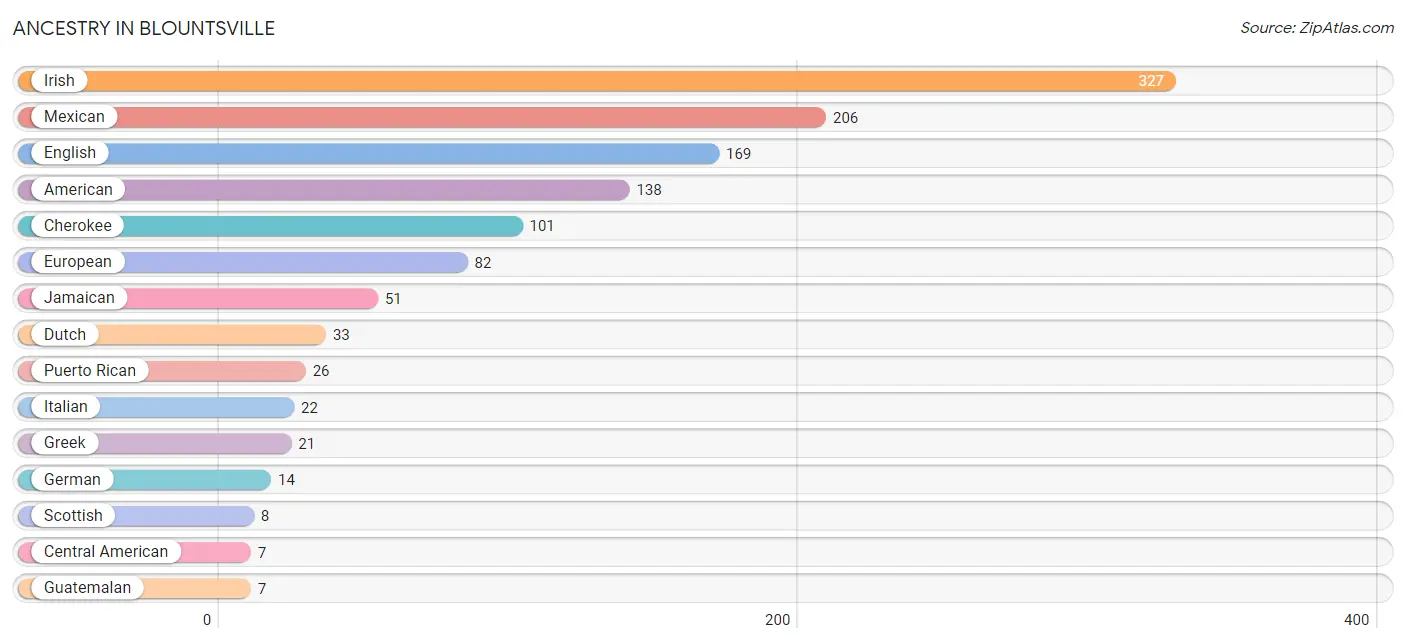
| Ancestry | # Population | % Population |
| African | 4 | 0.2% |
| American | 138 | 7.5% |
| Central American | 7 | 0.4% |
| Cherokee | 101 | 5.5% |
| Dutch | 33 | 1.8% |
| English | 169 | 9.2% |
| European | 82 | 4.5% |
| Finnish | 4 | 0.2% |
| French | 4 | 0.2% |
| German | 14 | 0.8% |
| Greek | 21 | 1.1% |
| Guatemalan | 7 | 0.4% |
| Irish | 327 | 17.8% |
| Italian | 22 | 1.2% |
| Jamaican | 51 | 2.8% |
| Lithuanian | 5 | 0.3% |
| Mexican | 206 | 11.2% |
| Norwegian | 6 | 0.3% |
| Puerto Rican | 26 | 1.4% |
| Russian | 5 | 0.3% |
| Scotch-Irish | 6 | 0.3% |
| Scottish | 8 | 0.4% |
| Subsaharan African | 4 | 0.2% |
| Swedish | 4 | 0.2% | View All 24 Rows |
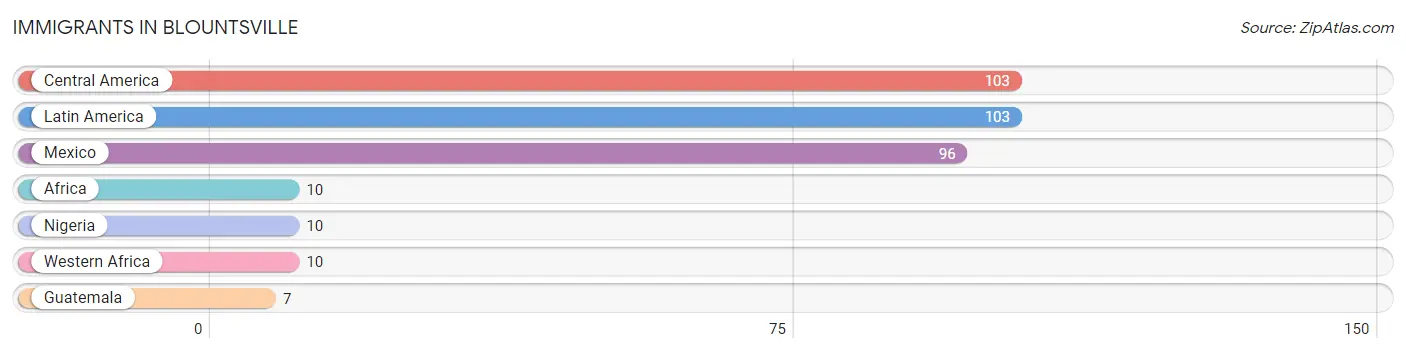
Immigrants in Blountsville
The most numerous immigrant groups reported in Blountsville came from Central America (103 | 5.6%), Latin America (103 | 5.6%), Mexico (96 | 5.2%), Africa (10 | 0.5%), and Nigeria (10 | 0.5%), together accounting for 17.5% of all Blountsville residents.
| Immigration Origin | # Population | % Population |
| Africa | 10 | 0.5% |
| Central America | 103 | 5.6% |
| Guatemala | 7 | 0.4% |
| Latin America | 103 | 5.6% |
| Mexico | 96 | 5.2% |
| Nigeria | 10 | 0.5% |
| Western Africa | 10 | 0.5% | View All 7 Rows |
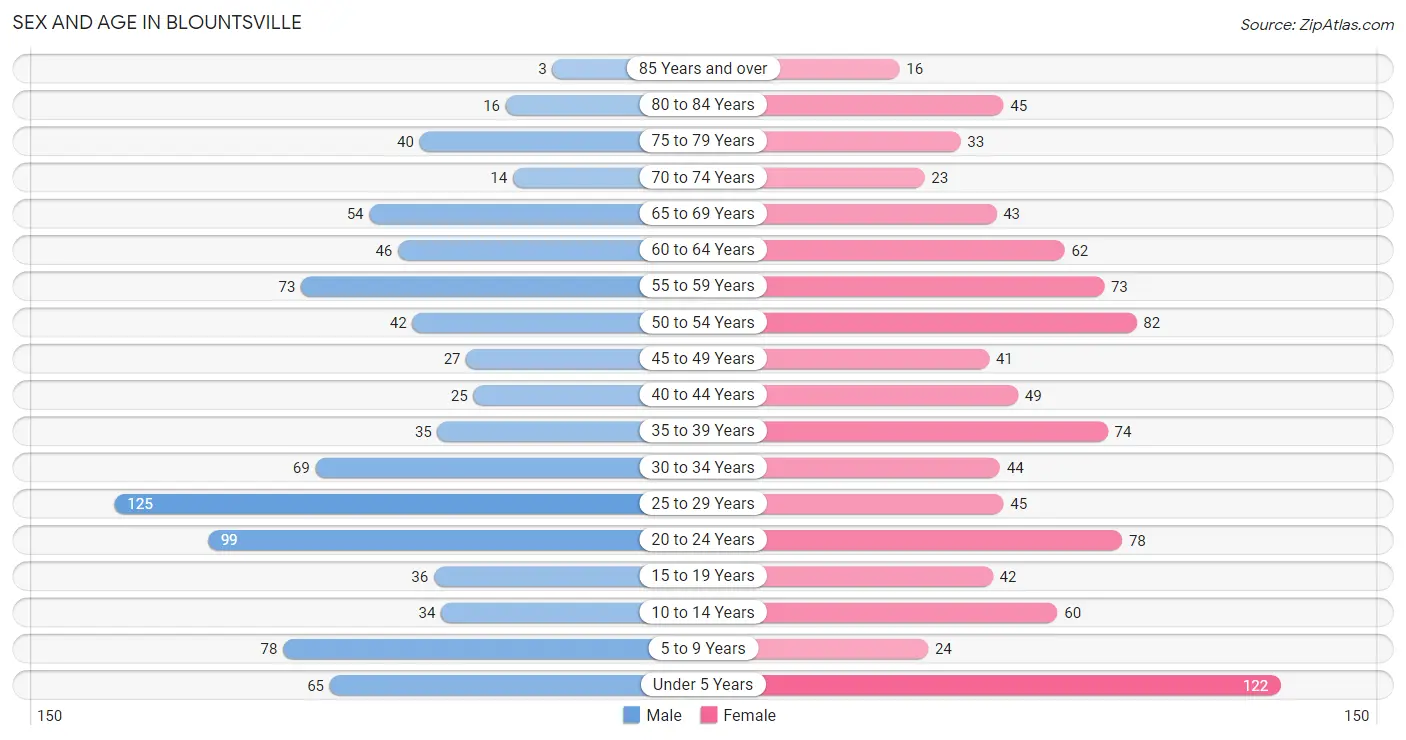
Sex and Age in Blountsville
Sex and Age in Blountsville
The most populous age groups in Blountsville are 25 to 29 Years (125 | 14.2%) for men and Under 5 Years (122 | 12.8%) for women.
| Age Bracket | Male | Female |
| Under 5 Years | 65 (7.4%) | 122 (12.8%) |
| 5 to 9 Years | 78 (8.8%) | 24 (2.5%) |
| 10 to 14 Years | 34 (3.9%) | 60 (6.3%) |
| 15 to 19 Years | 36 (4.1%) | 42 (4.4%) |
| 20 to 24 Years | 99 (11.2%) | 78 (8.2%) |
| 25 to 29 Years | 125 (14.2%) | 45 (4.7%) |
| 30 to 34 Years | 69 (7.8%) | 44 (4.6%) |
| 35 to 39 Years | 35 (4.0%) | 74 (7.7%) |
| 40 to 44 Years | 25 (2.8%) | 49 (5.1%) |
| 45 to 49 Years | 27 (3.1%) | 41 (4.3%) |
| 50 to 54 Years | 42 (4.8%) | 82 (8.6%) |
| 55 to 59 Years | 73 (8.3%) | 73 (7.6%) |
| 60 to 64 Years | 46 (5.2%) | 62 (6.5%) |
| 65 to 69 Years | 54 (6.1%) | 43 (4.5%) |
| 70 to 74 Years | 14 (1.6%) | 23 (2.4%) |
| 75 to 79 Years | 40 (4.5%) | 33 (3.5%) |
| 80 to 84 Years | 16 (1.8%) | 45 (4.7%) |
| 85 Years and over | 3 (0.3%) | 16 (1.7%) |
| Total | 881 (100.0%) | 956 (100.0%) |
Families and Households in Blountsville
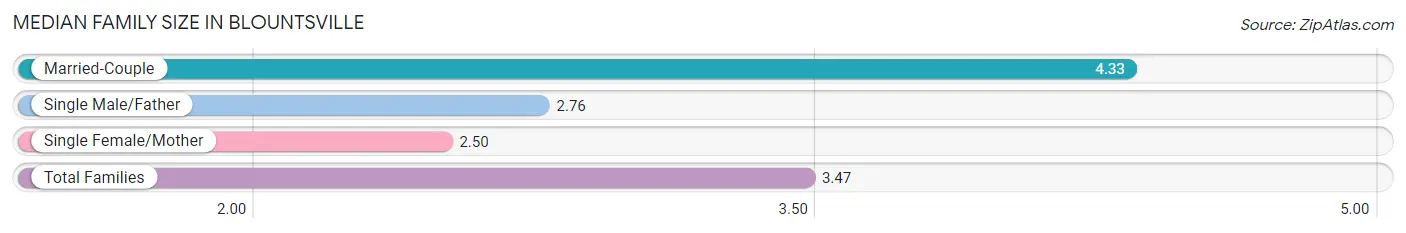
Median Family Size in Blountsville
The median family size in Blountsville is 3.47 persons per family, with married-couple families (224 | 50.6%) accounting for the largest median family size of 4.33 persons per family. On the other hand, single female/mother families (140 | 31.6%) represent the smallest median family size with 2.50 persons per family.
| Family Type | # Families | Family Size |
| Married-Couple | 224 (50.6%) | 4.33 |
| Single Male/Father | 79 (17.8%) | 2.76 |
| Single Female/Mother | 140 (31.6%) | 2.50 |
| Total Families | 443 (100.0%) | 3.47 |
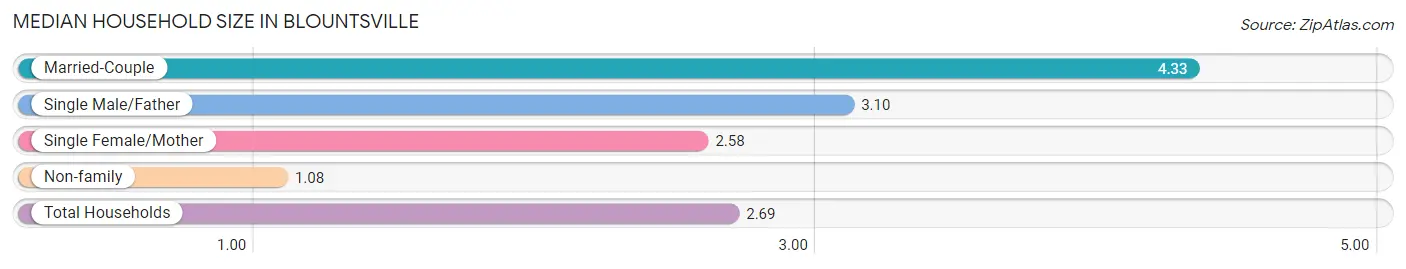
Median Household Size in Blountsville
The median household size in Blountsville is 2.69 persons per household, with married-couple households (224 | 32.8%) accounting for the largest median household size of 4.33 persons per household. non-family households (241 | 35.2%) represent the smallest median household size with 1.08 persons per household.
| Household Type | # Households | Household Size |
| Married-Couple | 224 (32.8%) | 4.33 |
| Single Male/Father | 79 (11.6%) | 3.10 |
| Single Female/Mother | 140 (20.5%) | 2.58 |
| Non-family | 241 (35.2%) | 1.08 |
| Total Households | 684 (100.0%) | 2.69 |
Household Size by Marriage Status in Blountsville
Out of a total of 684 households in Blountsville, 443 (64.8%) are family households, while 241 (35.2%) are nonfamily households. The most numerous type of family households are 2-person households, comprising 240, and the most common type of nonfamily households are 1-person households, comprising 230.
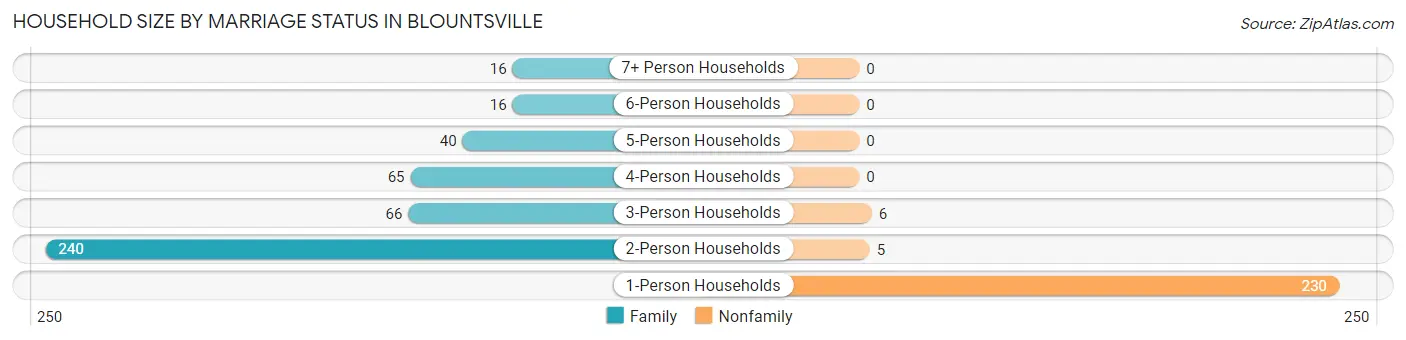
| Household Size | Family Households | Nonfamily Households |
| 1-Person Households | - | 230 (33.6%) |
| 2-Person Households | 240 (35.1%) | 5 (0.7%) |
| 3-Person Households | 66 (9.7%) | 6 (0.9%) |
| 4-Person Households | 65 (9.5%) | 0 (0.0%) |
| 5-Person Households | 40 (5.9%) | 0 (0.0%) |
| 6-Person Households | 16 (2.3%) | 0 (0.0%) |
| 7+ Person Households | 16 (2.3%) | 0 (0.0%) |
| Total | 443 (64.8%) | 241 (35.2%) |
Female Fertility in Blountsville
Fertility by Age in Blountsville
Average fertility rate in Blountsville is 72.0 births per 1,000 women. Women in the age bracket of 20 to 34 years have the highest fertility rate with 90.0 births per 1,000 women. Women in the age bracket of 20 to 34 years acount for 55.6% of all women with births.
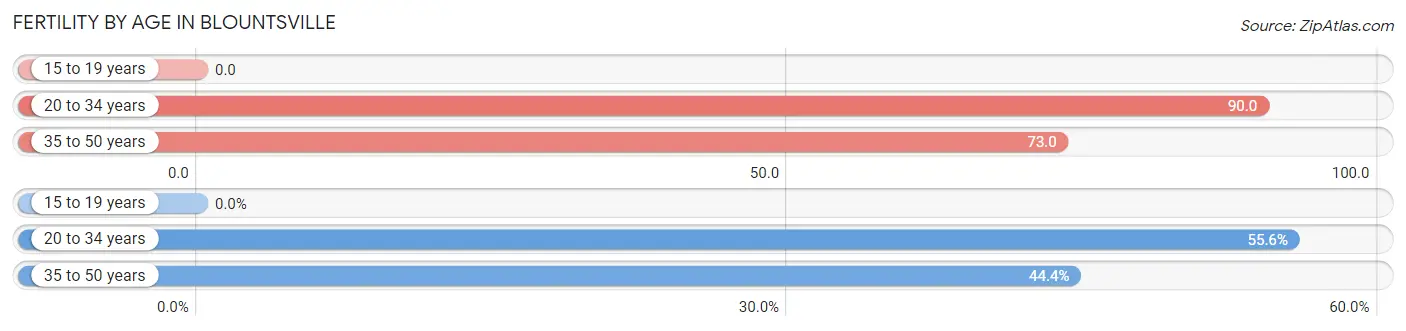
| Age Bracket | Women with Births | Births / 1,000 Women |
| 15 to 19 years | 0 (0.0%) | 0.0 |
| 20 to 34 years | 15 (55.6%) | 90.0 |
| 35 to 50 years | 12 (44.4%) | 73.0 |
| Total | 27 (100.0%) | 72.0 |
Fertility by Age by Marriage Status in Blountsville
55.6% of women with births (27) in Blountsville are married. The highest percentage of unmarried women with births falls into 35 to 50 years age bracket with 75.0% of them unmarried at the time of birth, while the lowest percentage of unmarried women with births belong to 20 to 34 years age bracket with 20.0% of them unmarried.
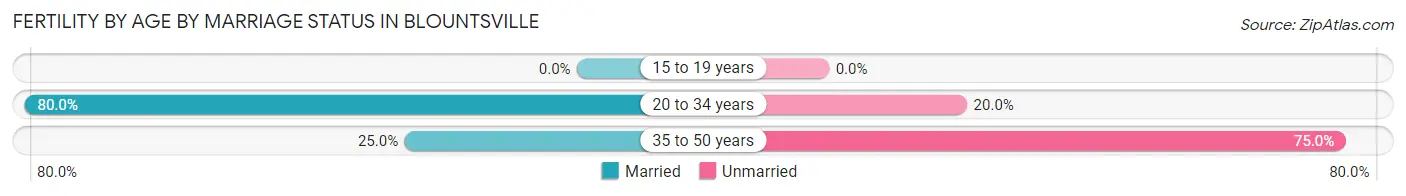
| Age Bracket | Married | Unmarried |
| 15 to 19 years | 0 (0.0%) | 0 (0.0%) |
| 20 to 34 years | 12 (80.0%) | 3 (20.0%) |
| 35 to 50 years | 3 (25.0%) | 9 (75.0%) |
| Total | 15 (55.6%) | 12 (44.4%) |
Fertility by Education in Blountsville
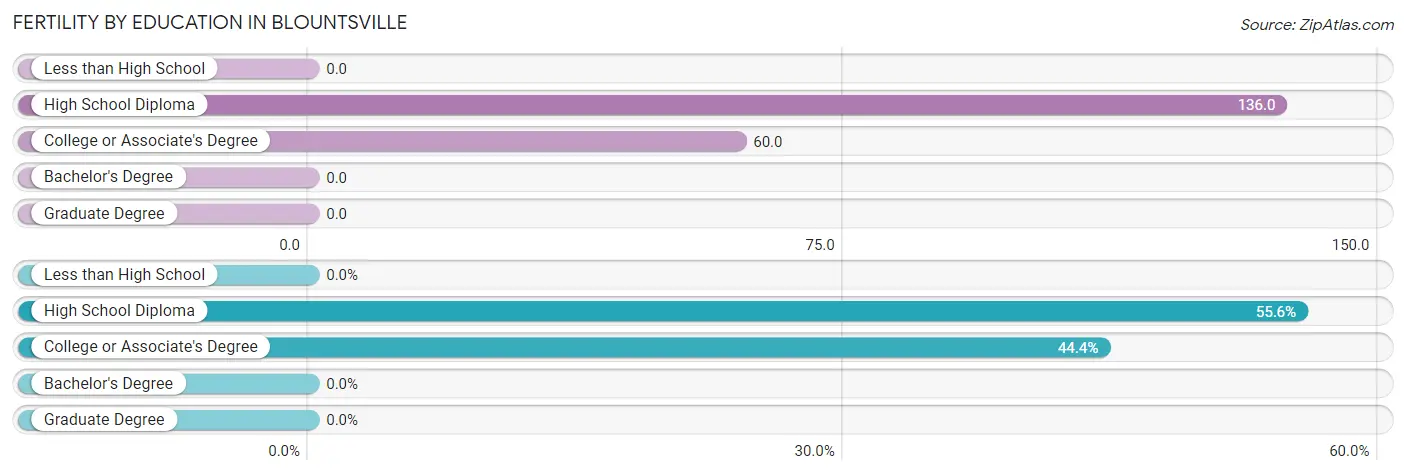
| Educational Attainment | Women with Births | Births / 1,000 Women |
| Less than High School | 0 (0.0%) | 0.0 |
| High School Diploma | 15 (55.6%) | 136.0 |
| College or Associate's Degree | 12 (44.4%) | 60.0 |
| Bachelor's Degree | 0 (0.0%) | 0.0 |
| Graduate Degree | 0 (0.0%) | 0.0 |
| Total | 27 (100.0%) | 72.0 |
Fertility by Education by Marriage Status in Blountsville
44.4% of women with births in Blountsville are unmarried. Women with the educational attainment of college or associate's degree are most likely to be married with 100.0% of them married at childbirth, while women with the educational attainment of high school diploma are least likely to be married with 80.0% of them unmarried at childbirth.
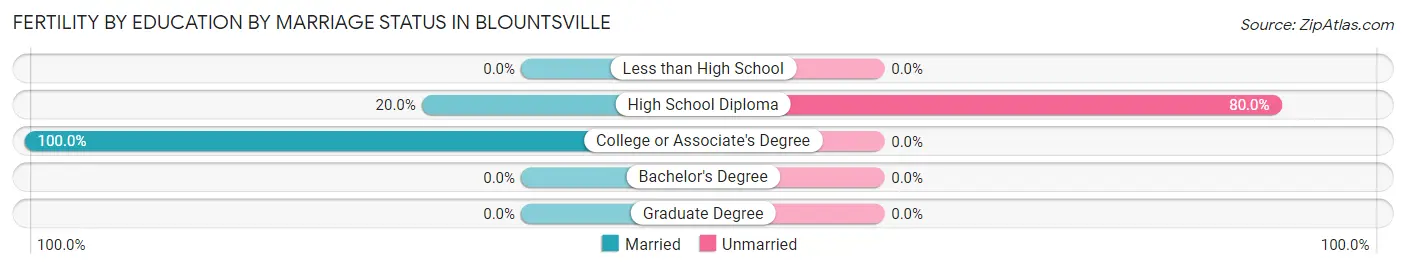
| Educational Attainment | Married | Unmarried |
| Less than High School | 0 (0.0%) | 0 (0.0%) |
| High School Diploma | 3 (20.0%) | 12 (80.0%) |
| College or Associate's Degree | 12 (100.0%) | 0 (0.0%) |
| Bachelor's Degree | 0 (0.0%) | 0 (0.0%) |
| Graduate Degree | 0 (0.0%) | 0 (0.0%) |
| Total | 15 (55.6%) | 12 (44.4%) |
Employment Characteristics in Blountsville
Employment by Class of Employer in Blountsville
Among the 715 employed individuals in Blountsville, private company employees (582 | 81.4%), not-for-profit organizations (63 | 8.8%), and self-employed (not incorporated) (34 | 4.8%) make up the most common classes of employment.
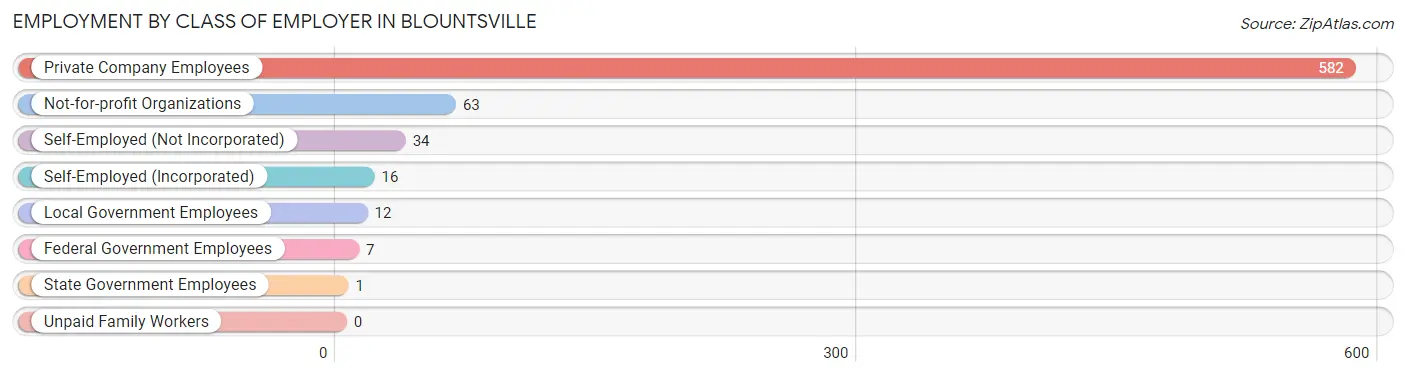
| Employer Class | # Employees | % Employees |
| Private Company Employees | 582 | 81.4% |
| Self-Employed (Incorporated) | 16 | 2.2% |
| Self-Employed (Not Incorporated) | 34 | 4.8% |
| Not-for-profit Organizations | 63 | 8.8% |
| Local Government Employees | 12 | 1.7% |
| State Government Employees | 1 | 0.1% |
| Federal Government Employees | 7 | 1.0% |
| Unpaid Family Workers | 0 | 0.0% |
| Total | 715 | 100.0% |
Employment Status by Age in Blountsville
According to the labor force statistics for Blountsville, out of the total population over 16 years of age (1,433), 54.2% or 777 individuals are in the labor force, with 2.7% or 21 of them unemployed. The age group with the highest labor force participation rate is 30 to 34 years, with 97.3% or 110 individuals in the labor force. Within the labor force, the 20 to 24 years age range has the highest percentage of unemployed individuals, with 6.8% or 9 of them being unemployed.
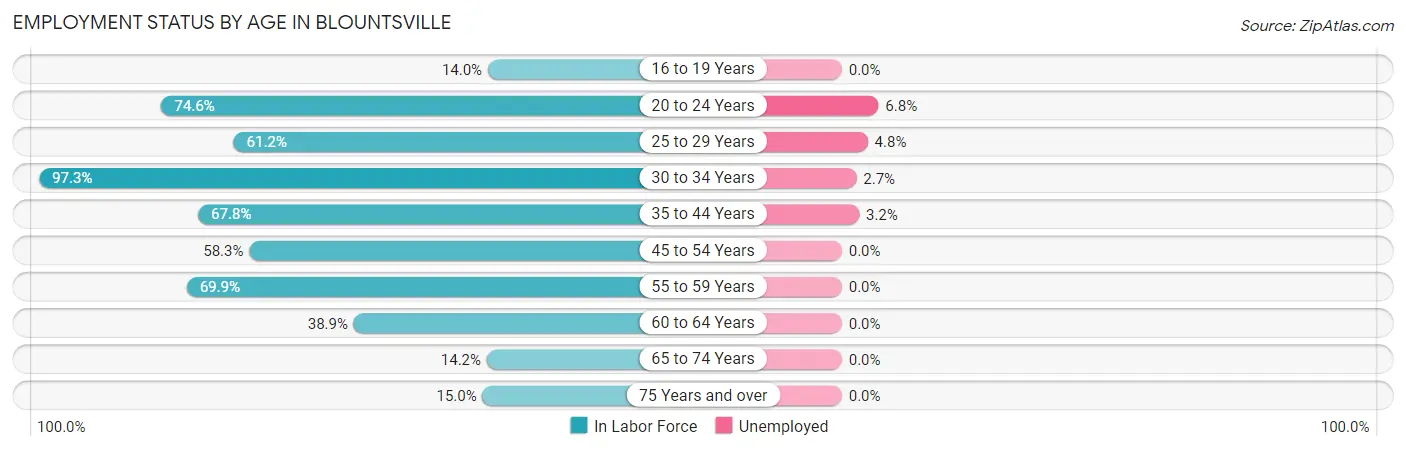
| Age Bracket | In Labor Force | Unemployed |
| 16 to 19 Years | 8 (14.0%) | 0 (0.0%) |
| 20 to 24 Years | 132 (74.6%) | 9 (6.8%) |
| 25 to 29 Years | 104 (61.2%) | 5 (4.8%) |
| 30 to 34 Years | 110 (97.3%) | 3 (2.7%) |
| 35 to 44 Years | 124 (67.8%) | 4 (3.2%) |
| 45 to 54 Years | 112 (58.3%) | 0 (0.0%) |
| 55 to 59 Years | 102 (69.9%) | 0 (0.0%) |
| 60 to 64 Years | 42 (38.9%) | 0 (0.0%) |
| 65 to 74 Years | 19 (14.2%) | 0 (0.0%) |
| 75 Years and over | 23 (15.0%) | 0 (0.0%) |
| Total | 777 (54.2%) | 21 (2.7%) |
Employment Status by Educational Attainment in Blountsville
According to labor force statistics for Blountsville, 65.1% of individuals (594) out of the total population between 25 and 64 years of age (912) are in the labor force, with 2.0% or 12 of them being unemployed. The group with the highest labor force participation rate are those with the educational attainment of high school diploma, with 72.0% or 249 individuals in the labor force. Within the labor force, individuals with college / associate degree education have the highest percentage of unemployment, with 2.7% or 7 of them being unemployed.
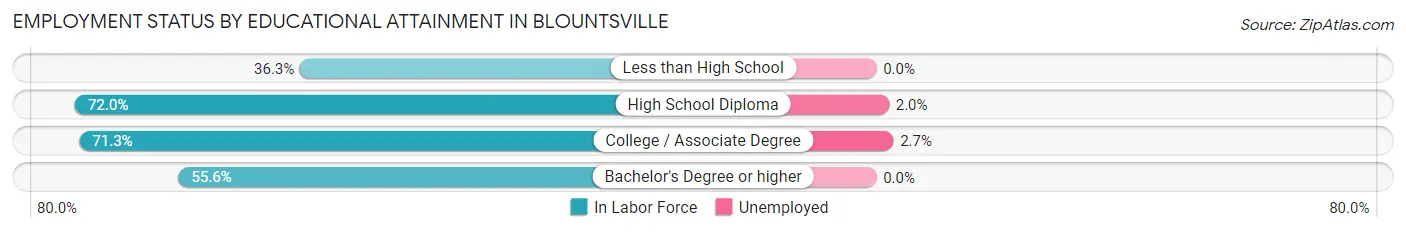
| Educational Attainment | In Labor Force | Unemployed |
| Less than High School | 49 (36.3%) | 0 (0.0%) |
| High School Diploma | 249 (72.0%) | 7 (2.0%) |
| College / Associate Degree | 256 (71.3%) | 10 (2.7%) |
| Bachelor's Degree or higher | 40 (55.6%) | 0 (0.0%) |
| Total | 594 (65.1%) | 18 (2.0%) |
Employment Occupations by Sex in Blountsville
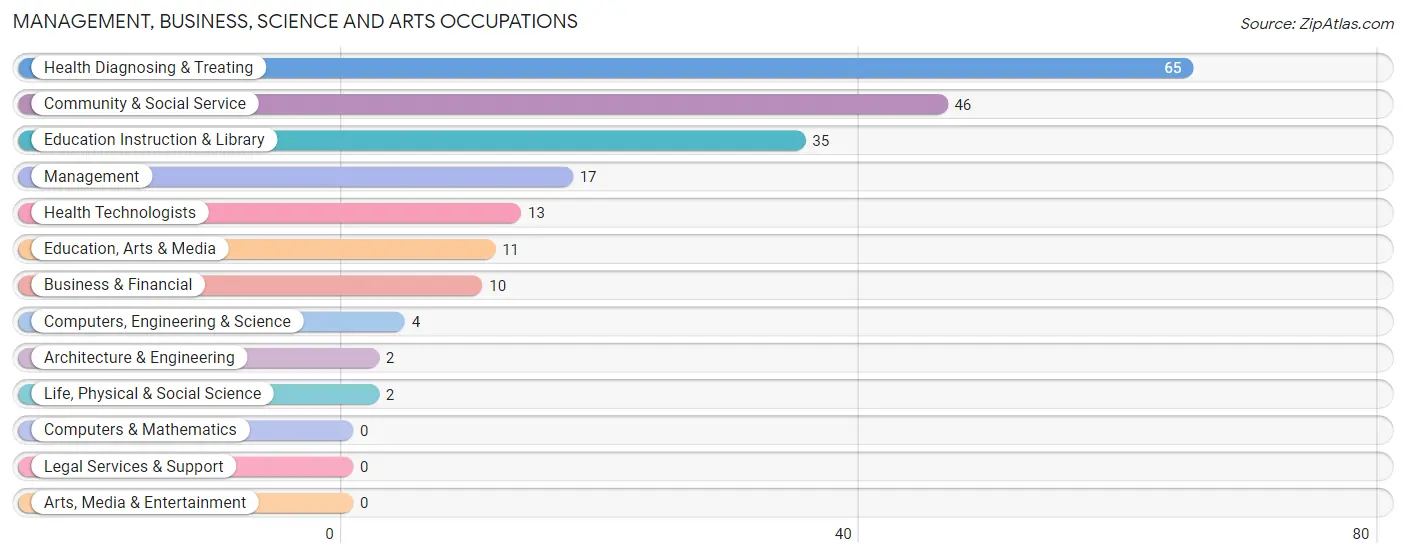
Management, Business, Science and Arts Occupations
The most common Management, Business, Science and Arts occupations in Blountsville are Health Diagnosing & Treating (65 | 8.6%), Community & Social Service (46 | 6.1%), Education Instruction & Library (35 | 4.6%), Management (17 | 2.2%), and Health Technologists (13 | 1.7%).
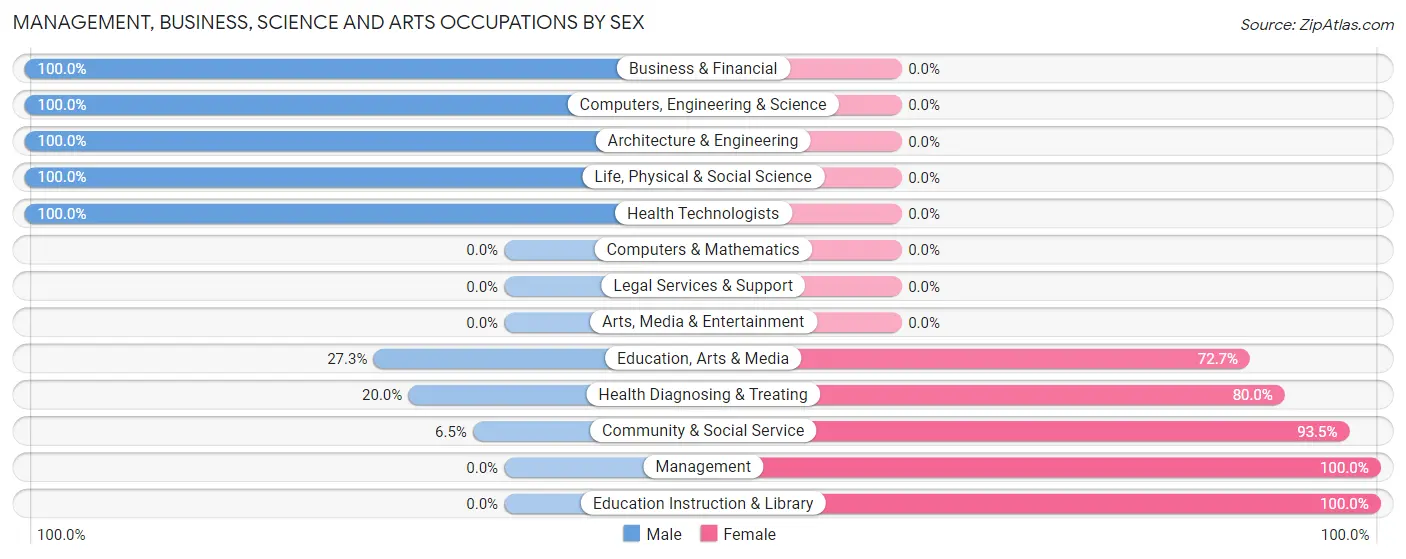
Management, Business, Science and Arts Occupations by Sex
Within the Management, Business, Science and Arts occupations in Blountsville, the most male-oriented occupations are Business & Financial (100.0%), Computers, Engineering & Science (100.0%), and Architecture & Engineering (100.0%), while the most female-oriented occupations are Management (100.0%), Education Instruction & Library (100.0%), and Community & Social Service (93.5%).
| Occupation | Male | Female |
| Management | 0 (0.0%) | 17 (100.0%) |
| Business & Financial | 10 (100.0%) | 0 (0.0%) |
| Computers, Engineering & Science | 4 (100.0%) | 0 (0.0%) |
| Computers & Mathematics | 0 (0.0%) | 0 (0.0%) |
| Architecture & Engineering | 2 (100.0%) | 0 (0.0%) |
| Life, Physical & Social Science | 2 (100.0%) | 0 (0.0%) |
| Community & Social Service | 3 (6.5%) | 43 (93.5%) |
| Education, Arts & Media | 3 (27.3%) | 8 (72.7%) |
| Legal Services & Support | 0 (0.0%) | 0 (0.0%) |
| Education Instruction & Library | 0 (0.0%) | 35 (100.0%) |
| Arts, Media & Entertainment | 0 (0.0%) | 0 (0.0%) |
| Health Diagnosing & Treating | 13 (20.0%) | 52 (80.0%) |
| Health Technologists | 13 (100.0%) | 0 (0.0%) |
| Total (Category) | 30 (21.1%) | 112 (78.9%) |
| Total (Overall) | 406 (53.8%) | 349 (46.2%) |
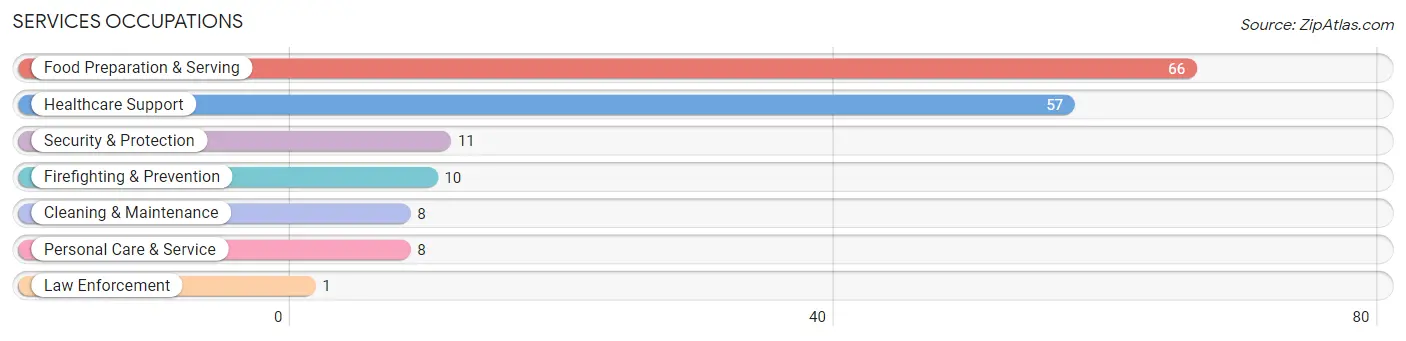
Services Occupations
The most common Services occupations in Blountsville are Food Preparation & Serving (66 | 8.7%), Healthcare Support (57 | 7.5%), Security & Protection (11 | 1.5%), Firefighting & Prevention (10 | 1.3%), and Cleaning & Maintenance (8 | 1.1%).
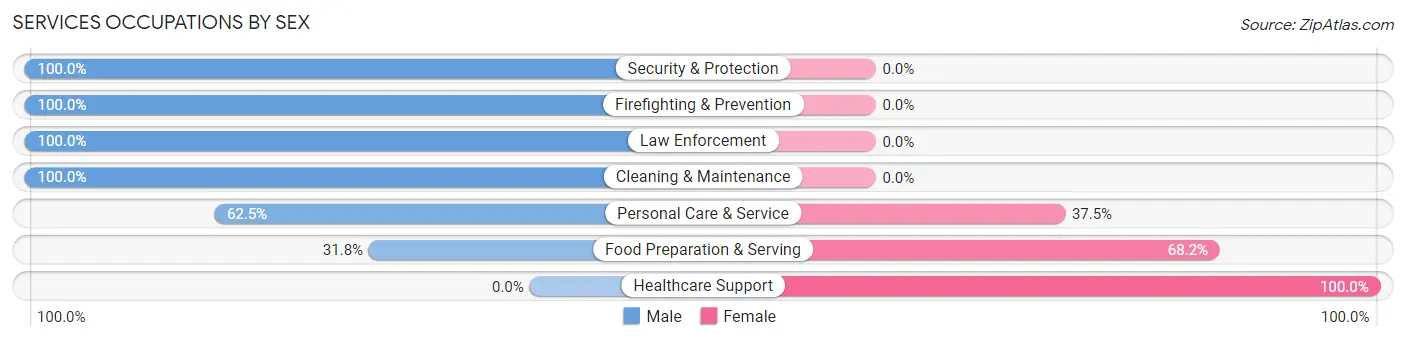
Services Occupations by Sex
Within the Services occupations in Blountsville, the most male-oriented occupations are Security & Protection (100.0%), Firefighting & Prevention (100.0%), and Law Enforcement (100.0%), while the most female-oriented occupations are Healthcare Support (100.0%), Food Preparation & Serving (68.2%), and Personal Care & Service (37.5%).
| Occupation | Male | Female |
| Healthcare Support | 0 (0.0%) | 57 (100.0%) |
| Security & Protection | 11 (100.0%) | 0 (0.0%) |
| Firefighting & Prevention | 10 (100.0%) | 0 (0.0%) |
| Law Enforcement | 1 (100.0%) | 0 (0.0%) |
| Food Preparation & Serving | 21 (31.8%) | 45 (68.2%) |
| Cleaning & Maintenance | 8 (100.0%) | 0 (0.0%) |
| Personal Care & Service | 5 (62.5%) | 3 (37.5%) |
| Total (Category) | 45 (30.0%) | 105 (70.0%) |
| Total (Overall) | 406 (53.8%) | 349 (46.2%) |
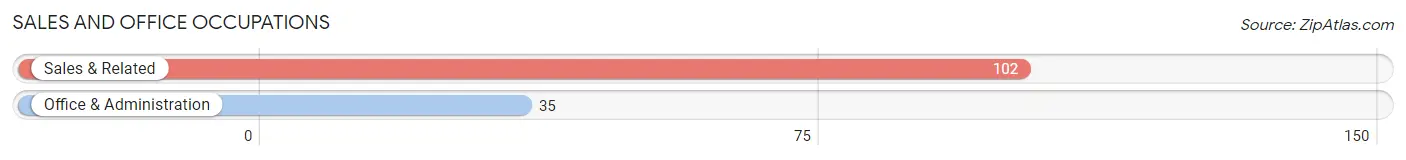
Sales and Office Occupations
The most common Sales and Office occupations in Blountsville are Sales & Related (102 | 13.5%), and Office & Administration (35 | 4.6%).
Sales and Office Occupations by Sex
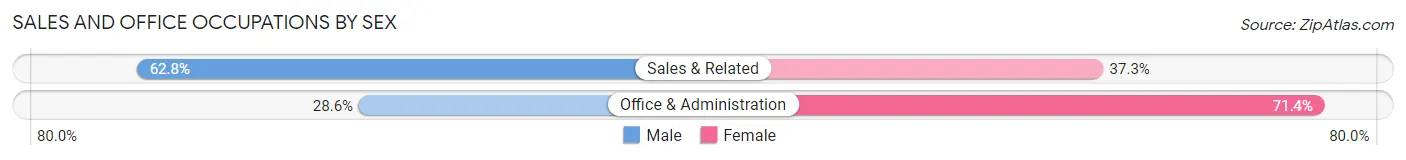
| Occupation | Male | Female |
| Sales & Related | 64 (62.7%) | 38 (37.2%) |
| Office & Administration | 10 (28.6%) | 25 (71.4%) |
| Total (Category) | 74 (54.0%) | 63 (46.0%) |
| Total (Overall) | 406 (53.8%) | 349 (46.2%) |
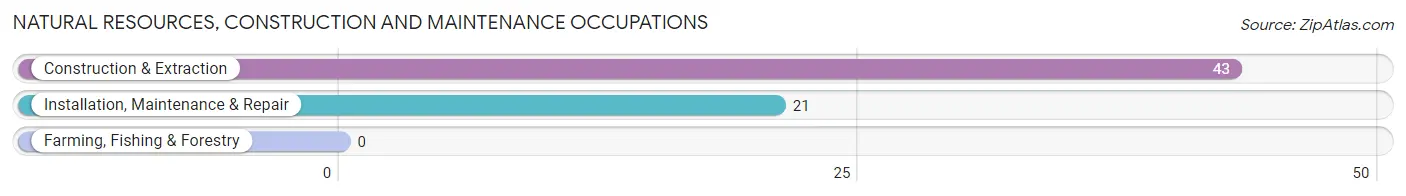
Natural Resources, Construction and Maintenance Occupations
The most common Natural Resources, Construction and Maintenance occupations in Blountsville are Construction & Extraction (43 | 5.7%), and Installation, Maintenance & Repair (21 | 2.8%).
Natural Resources, Construction and Maintenance Occupations by Sex
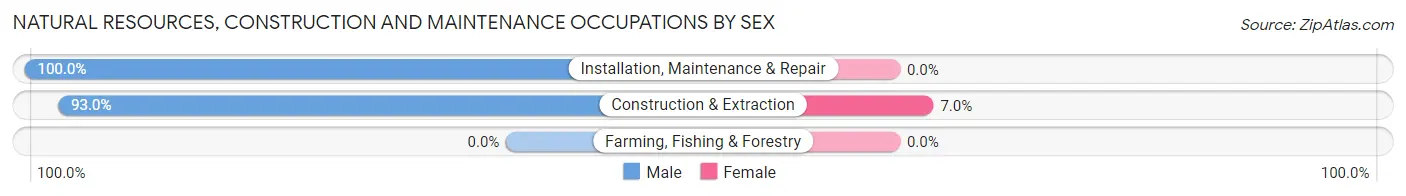
| Occupation | Male | Female |
| Farming, Fishing & Forestry | 0 (0.0%) | 0 (0.0%) |
| Construction & Extraction | 40 (93.0%) | 3 (7.0%) |
| Installation, Maintenance & Repair | 21 (100.0%) | 0 (0.0%) |
| Total (Category) | 61 (95.3%) | 3 (4.7%) |
| Total (Overall) | 406 (53.8%) | 349 (46.2%) |
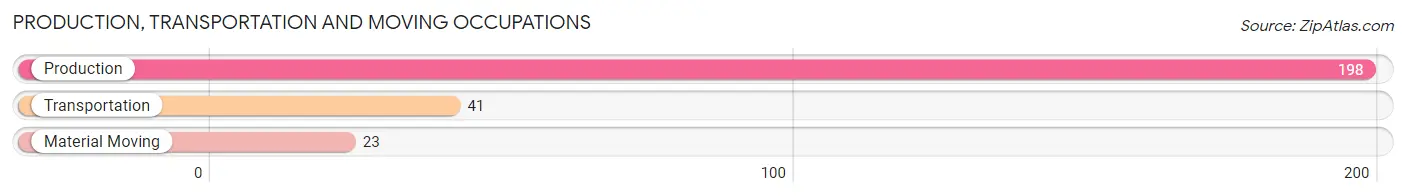
Production, Transportation and Moving Occupations
The most common Production, Transportation and Moving occupations in Blountsville are Production (198 | 26.2%), Transportation (41 | 5.4%), and Material Moving (23 | 3.0%).
Production, Transportation and Moving Occupations by Sex
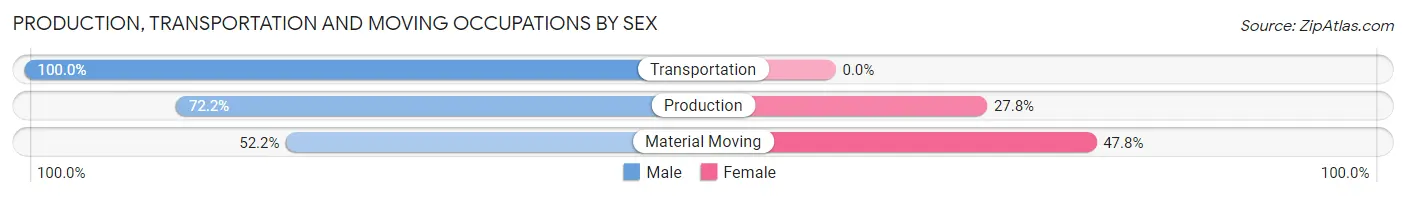
| Occupation | Male | Female |
| Production | 143 (72.2%) | 55 (27.8%) |
| Transportation | 41 (100.0%) | 0 (0.0%) |
| Material Moving | 12 (52.2%) | 11 (47.8%) |
| Total (Category) | 196 (74.8%) | 66 (25.2%) |
| Total (Overall) | 406 (53.8%) | 349 (46.2%) |
Employment Industries by Sex in Blountsville
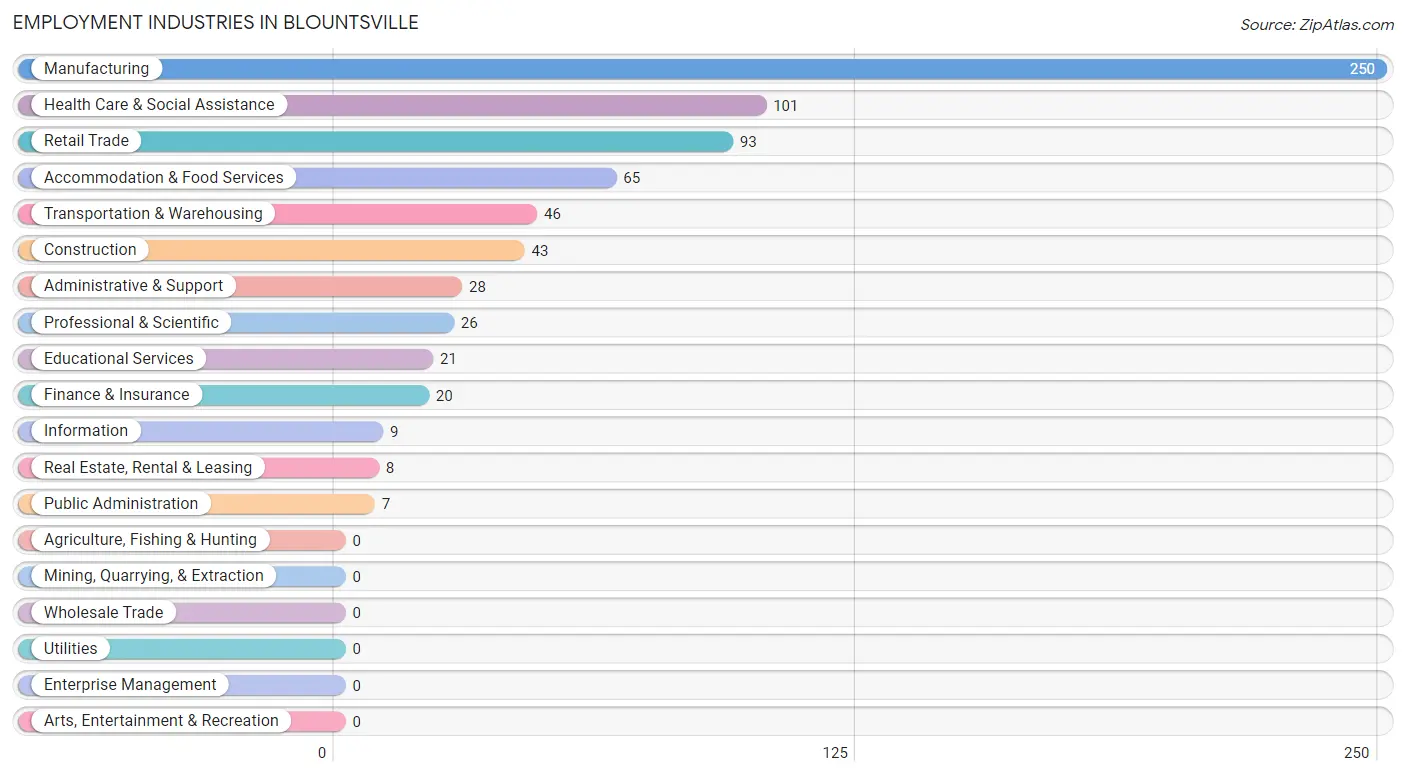
Employment Industries in Blountsville
The major employment industries in Blountsville include Manufacturing (250 | 33.1%), Health Care & Social Assistance (101 | 13.4%), Retail Trade (93 | 12.3%), Accommodation & Food Services (65 | 8.6%), and Transportation & Warehousing (46 | 6.1%).
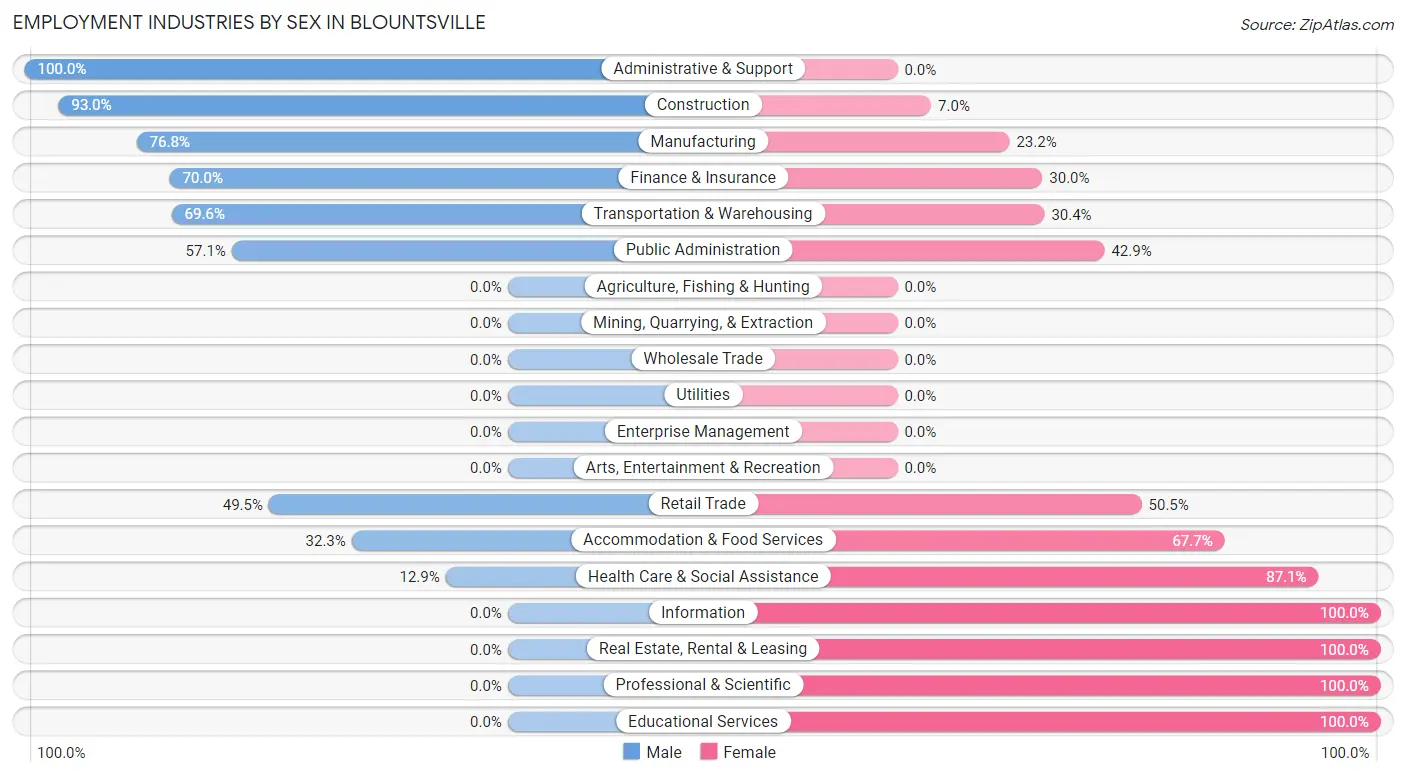
Employment Industries by Sex in Blountsville
The Blountsville industries that see more men than women are Administrative & Support (100.0%), Construction (93.0%), and Manufacturing (76.8%), whereas the industries that tend to have a higher number of women are Information (100.0%), Real Estate, Rental & Leasing (100.0%), and Professional & Scientific (100.0%).
| Industry | Male | Female |
| Agriculture, Fishing & Hunting | 0 (0.0%) | 0 (0.0%) |
| Mining, Quarrying, & Extraction | 0 (0.0%) | 0 (0.0%) |
| Construction | 40 (93.0%) | 3 (7.0%) |
| Manufacturing | 192 (76.8%) | 58 (23.2%) |
| Wholesale Trade | 0 (0.0%) | 0 (0.0%) |
| Retail Trade | 46 (49.5%) | 47 (50.5%) |
| Transportation & Warehousing | 32 (69.6%) | 14 (30.4%) |
| Utilities | 0 (0.0%) | 0 (0.0%) |
| Information | 0 (0.0%) | 9 (100.0%) |
| Finance & Insurance | 14 (70.0%) | 6 (30.0%) |
| Real Estate, Rental & Leasing | 0 (0.0%) | 8 (100.0%) |
| Professional & Scientific | 0 (0.0%) | 26 (100.0%) |
| Enterprise Management | 0 (0.0%) | 0 (0.0%) |
| Administrative & Support | 28 (100.0%) | 0 (0.0%) |
| Educational Services | 0 (0.0%) | 21 (100.0%) |
| Health Care & Social Assistance | 13 (12.9%) | 88 (87.1%) |
| Arts, Entertainment & Recreation | 0 (0.0%) | 0 (0.0%) |
| Accommodation & Food Services | 21 (32.3%) | 44 (67.7%) |
| Public Administration | 4 (57.1%) | 3 (42.9%) |
| Total | 406 (53.8%) | 349 (46.2%) |
Education in Blountsville
School Enrollment in Blountsville
The most common levels of schooling among the 318 students in Blountsville are middle school (93 | 29.2%), college / undergraduate (73 | 23.0%), and elementary school (71 | 22.3%).
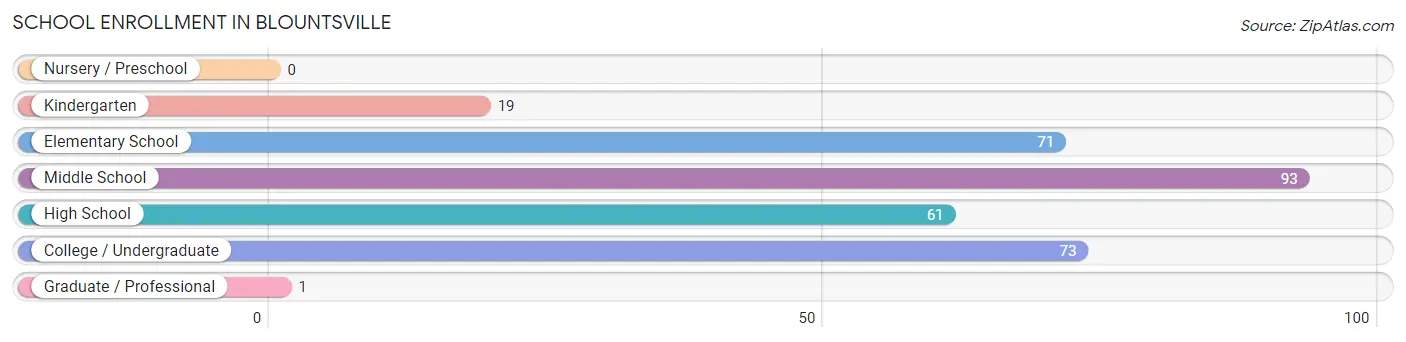
| School Level | # Students | % Students |
| Nursery / Preschool | 0 | 0.0% |
| Kindergarten | 19 | 6.0% |
| Elementary School | 71 | 22.3% |
| Middle School | 93 | 29.2% |
| High School | 61 | 19.2% |
| College / Undergraduate | 73 | 23.0% |
| Graduate / Professional | 1 | 0.3% |
| Total | 318 | 100.0% |
School Enrollment by Age by Funding Source in Blountsville
Out of a total of 318 students who are enrolled in schools in Blountsville, 36 (11.3%) attend a private institution, while the remaining 282 (88.7%) are enrolled in public schools. The age group of 5 to 9 year old has the highest likelihood of being enrolled in private schools, with 31 (34.4% in the age bracket) enrolled. Conversely, the age group of 10 to 14 year olds has the lowest likelihood of being enrolled in a private school, with 94 (100.0% in the age bracket) attending a public institution.
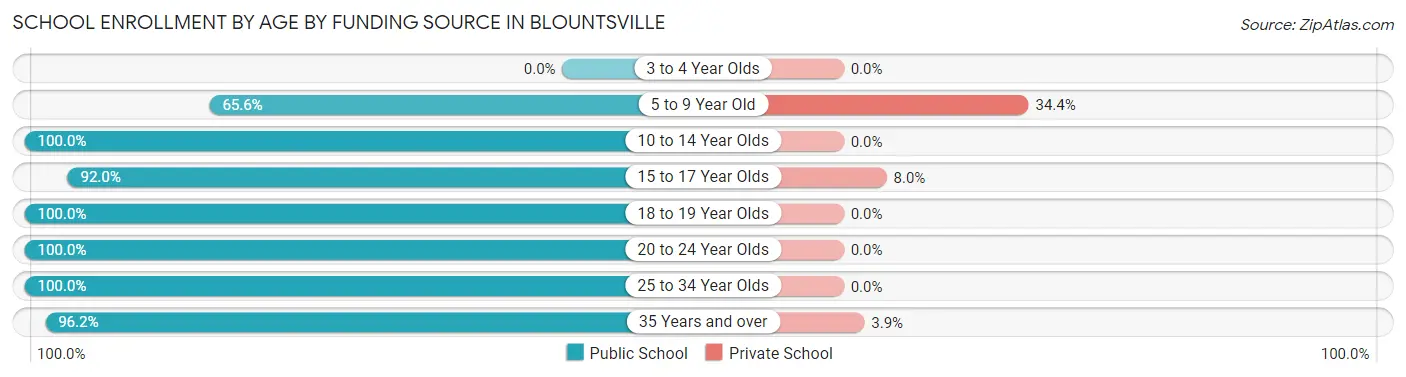
| Age Bracket | Public School | Private School |
| 3 to 4 Year Olds | 0 (0.0%) | 0 (0.0%) |
| 5 to 9 Year Old | 59 (65.6%) | 31 (34.4%) |
| 10 to 14 Year Olds | 94 (100.0%) | 0 (0.0%) |
| 15 to 17 Year Olds | 46 (92.0%) | 4 (8.0%) |
| 18 to 19 Year Olds | 11 (100.0%) | 0 (0.0%) |
| 20 to 24 Year Olds | 45 (100.0%) | 0 (0.0%) |
| 25 to 34 Year Olds | 2 (100.0%) | 0 (0.0%) |
| 35 Years and over | 25 (96.2%) | 1 (3.8%) |
| Total | 282 (88.7%) | 36 (11.3%) |
Educational Attainment by Field of Study in Blountsville
Business (27 | 27.3%), science & technology (24 | 24.2%), education (18 | 18.2%), engineering (11 | 11.1%), and social sciences (9 | 9.1%) are the most common fields of study among 99 individuals in Blountsville who have obtained a bachelor's degree or higher.
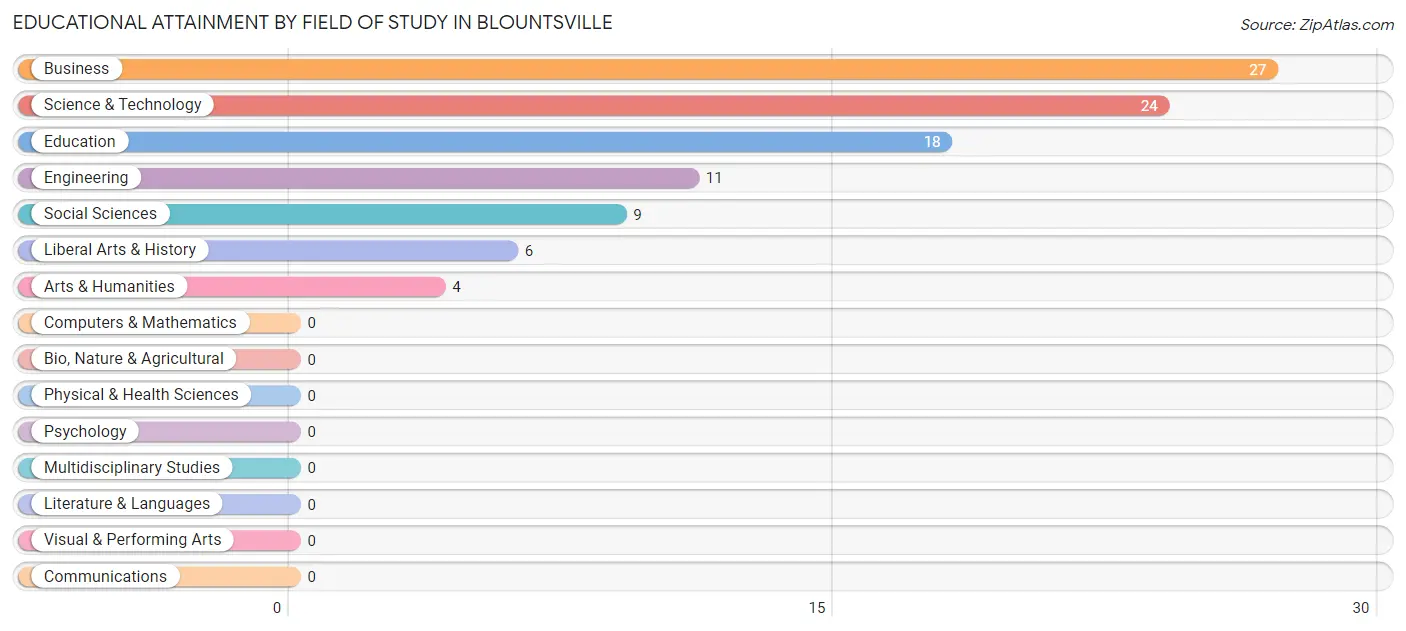
| Field of Study | # Graduates | % Graduates |
| Computers & Mathematics | 0 | 0.0% |
| Bio, Nature & Agricultural | 0 | 0.0% |
| Physical & Health Sciences | 0 | 0.0% |
| Psychology | 0 | 0.0% |
| Social Sciences | 9 | 9.1% |
| Engineering | 11 | 11.1% |
| Multidisciplinary Studies | 0 | 0.0% |
| Science & Technology | 24 | 24.2% |
| Business | 27 | 27.3% |
| Education | 18 | 18.2% |
| Literature & Languages | 0 | 0.0% |
| Liberal Arts & History | 6 | 6.1% |
| Visual & Performing Arts | 0 | 0.0% |
| Communications | 0 | 0.0% |
| Arts & Humanities | 4 | 4.0% |
| Total | 99 | 100.0% |
Transportation & Commute in Blountsville
Vehicle Availability by Sex in Blountsville
The most prevalent vehicle ownership categories in Blountsville are males with no vehicle (105, accounting for 27.8%) and females with no vehicle (19, making up 31.2%).
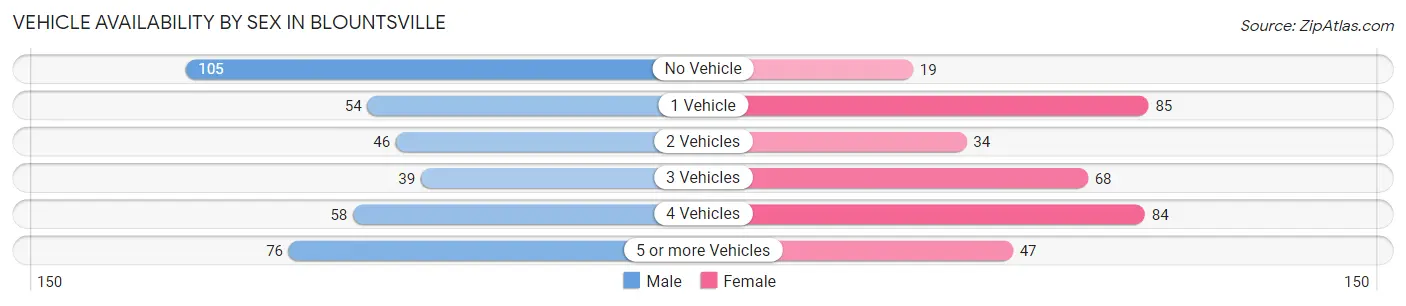
| Vehicles Available | Male | Female |
| No Vehicle | 105 (27.8%) | 19 (5.6%) |
| 1 Vehicle | 54 (14.3%) | 85 (25.2%) |
| 2 Vehicles | 46 (12.2%) | 34 (10.1%) |
| 3 Vehicles | 39 (10.3%) | 68 (20.2%) |
| 4 Vehicles | 58 (15.3%) | 84 (24.9%) |
| 5 or more Vehicles | 76 (20.1%) | 47 (14.0%) |
| Total | 378 (100.0%) | 337 (100.0%) |
Commute Time in Blountsville
The most frequently occuring commute durations in Blountsville are 45 to 59 minutes (124 commuters, 17.4%), 5 to 9 minutes (121 commuters, 17.0%), and 20 to 24 minutes (96 commuters, 13.5%).
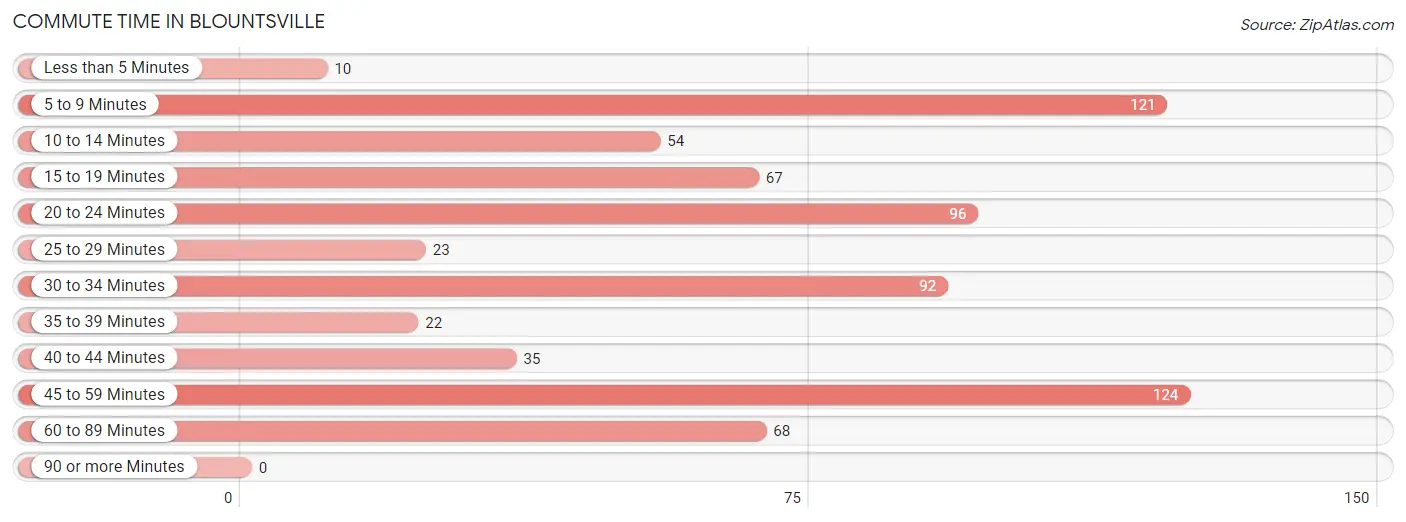
| Commute Time | # Commuters | % Commuters |
| Less than 5 Minutes | 10 | 1.4% |
| 5 to 9 Minutes | 121 | 17.0% |
| 10 to 14 Minutes | 54 | 7.6% |
| 15 to 19 Minutes | 67 | 9.4% |
| 20 to 24 Minutes | 96 | 13.5% |
| 25 to 29 Minutes | 23 | 3.2% |
| 30 to 34 Minutes | 92 | 12.9% |
| 35 to 39 Minutes | 22 | 3.1% |
| 40 to 44 Minutes | 35 | 4.9% |
| 45 to 59 Minutes | 124 | 17.4% |
| 60 to 89 Minutes | 68 | 9.6% |
| 90 or more Minutes | 0 | 0.0% |
Commute Time by Sex in Blountsville
The most common commute times in Blountsville are 20 to 24 minutes (76 commuters, 20.1%) for males and 5 to 9 minutes (75 commuters, 22.5%) for females.
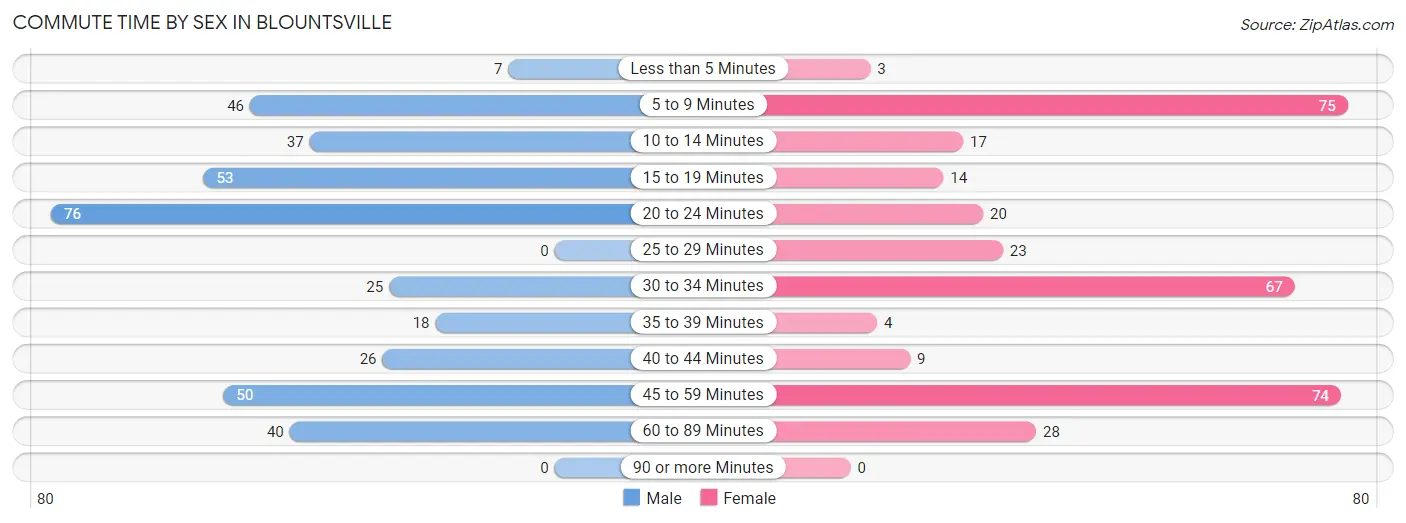
| Commute Time | Male | Female |
| Less than 5 Minutes | 7 (1.8%) | 3 (0.9%) |
| 5 to 9 Minutes | 46 (12.2%) | 75 (22.5%) |
| 10 to 14 Minutes | 37 (9.8%) | 17 (5.1%) |
| 15 to 19 Minutes | 53 (14.0%) | 14 (4.2%) |
| 20 to 24 Minutes | 76 (20.1%) | 20 (6.0%) |
| 25 to 29 Minutes | 0 (0.0%) | 23 (6.9%) |
| 30 to 34 Minutes | 25 (6.6%) | 67 (20.1%) |
| 35 to 39 Minutes | 18 (4.8%) | 4 (1.2%) |
| 40 to 44 Minutes | 26 (6.9%) | 9 (2.7%) |
| 45 to 59 Minutes | 50 (13.2%) | 74 (22.2%) |
| 60 to 89 Minutes | 40 (10.6%) | 28 (8.4%) |
| 90 or more Minutes | 0 (0.0%) | 0 (0.0%) |
Time of Departure to Work by Sex in Blountsville
The most frequent times of departure to work in Blountsville are 7:00 AM to 7:29 AM (111, 29.4%) for males and 7:00 AM to 7:29 AM (55, 16.5%) for females.
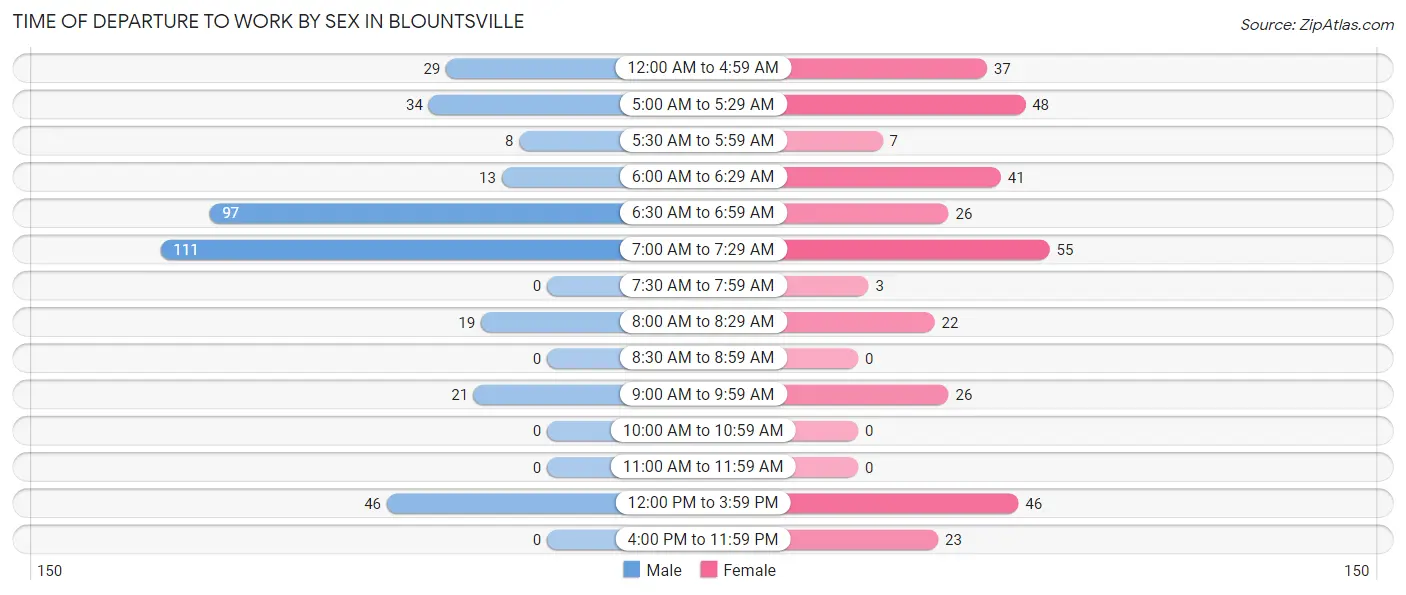
| Time of Departure | Male | Female |
| 12:00 AM to 4:59 AM | 29 (7.7%) | 37 (11.1%) |
| 5:00 AM to 5:29 AM | 34 (9.0%) | 48 (14.4%) |
| 5:30 AM to 5:59 AM | 8 (2.1%) | 7 (2.1%) |
| 6:00 AM to 6:29 AM | 13 (3.4%) | 41 (12.3%) |
| 6:30 AM to 6:59 AM | 97 (25.7%) | 26 (7.8%) |
| 7:00 AM to 7:29 AM | 111 (29.4%) | 55 (16.5%) |
| 7:30 AM to 7:59 AM | 0 (0.0%) | 3 (0.9%) |
| 8:00 AM to 8:29 AM | 19 (5.0%) | 22 (6.6%) |
| 8:30 AM to 8:59 AM | 0 (0.0%) | 0 (0.0%) |
| 9:00 AM to 9:59 AM | 21 (5.6%) | 26 (7.8%) |
| 10:00 AM to 10:59 AM | 0 (0.0%) | 0 (0.0%) |
| 11:00 AM to 11:59 AM | 0 (0.0%) | 0 (0.0%) |
| 12:00 PM to 3:59 PM | 46 (12.2%) | 46 (13.8%) |
| 4:00 PM to 11:59 PM | 0 (0.0%) | 23 (6.9%) |
| Total | 378 (100.0%) | 334 (100.0%) |
Housing Occupancy in Blountsville
Occupancy by Ownership in Blountsville
Of the total 684 dwellings in Blountsville, owner-occupied units account for 386 (56.4%), while renter-occupied units make up 298 (43.6%).
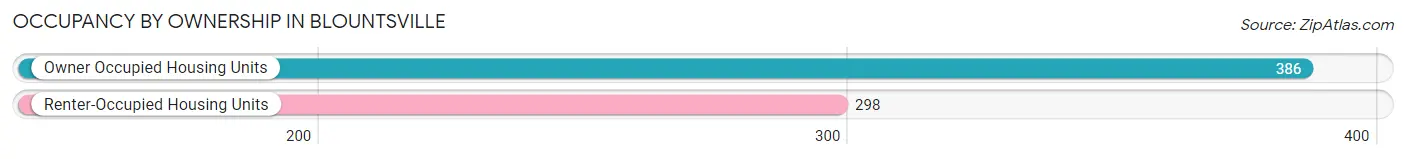
| Occupancy | # Housing Units | % Housing Units |
| Owner Occupied Housing Units | 386 | 56.4% |
| Renter-Occupied Housing Units | 298 | 43.6% |
| Total Occupied Housing Units | 684 | 100.0% |
Occupancy by Household Size in Blountsville
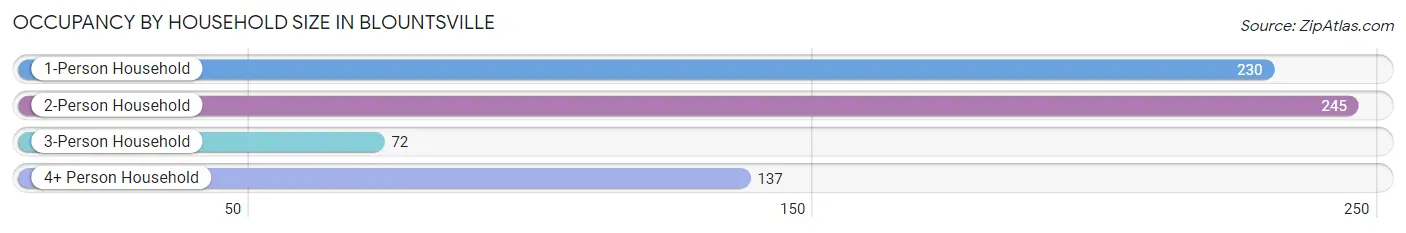
| Household Size | # Housing Units | % Housing Units |
| 1-Person Household | 230 | 33.6% |
| 2-Person Household | 245 | 35.8% |
| 3-Person Household | 72 | 10.5% |
| 4+ Person Household | 137 | 20.0% |
| Total Housing Units | 684 | 100.0% |
Occupancy by Ownership by Household Size in Blountsville
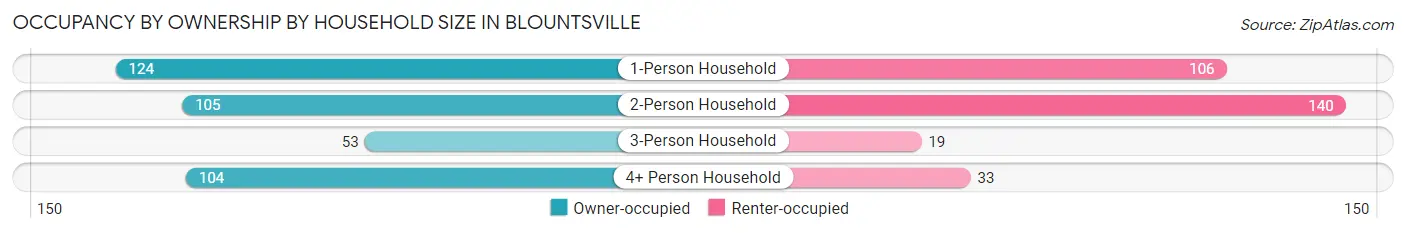
| Household Size | Owner-occupied | Renter-occupied |
| 1-Person Household | 124 (53.9%) | 106 (46.1%) |
| 2-Person Household | 105 (42.9%) | 140 (57.1%) |
| 3-Person Household | 53 (73.6%) | 19 (26.4%) |
| 4+ Person Household | 104 (75.9%) | 33 (24.1%) |
| Total Housing Units | 386 (56.4%) | 298 (43.6%) |
Occupancy by Educational Attainment in Blountsville
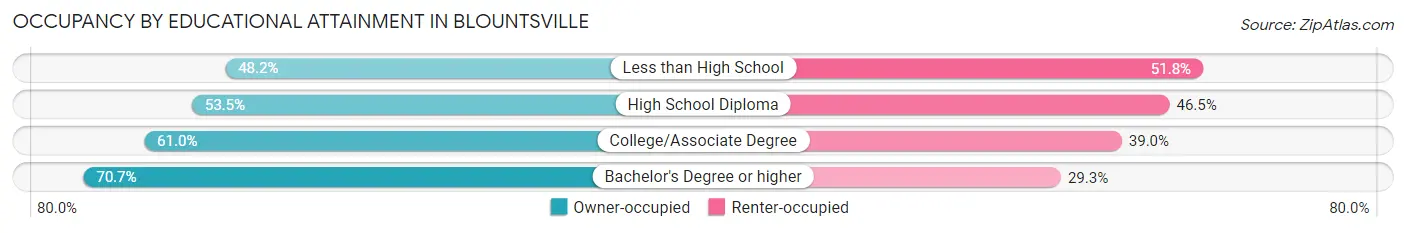
| Household Size | Owner-occupied | Renter-occupied |
| Less than High School | 53 (48.2%) | 57 (51.8%) |
| High School Diploma | 162 (53.5%) | 141 (46.5%) |
| College/Associate Degree | 130 (61.0%) | 83 (39.0%) |
| Bachelor's Degree or higher | 41 (70.7%) | 17 (29.3%) |
Occupancy by Age of Householder in Blountsville
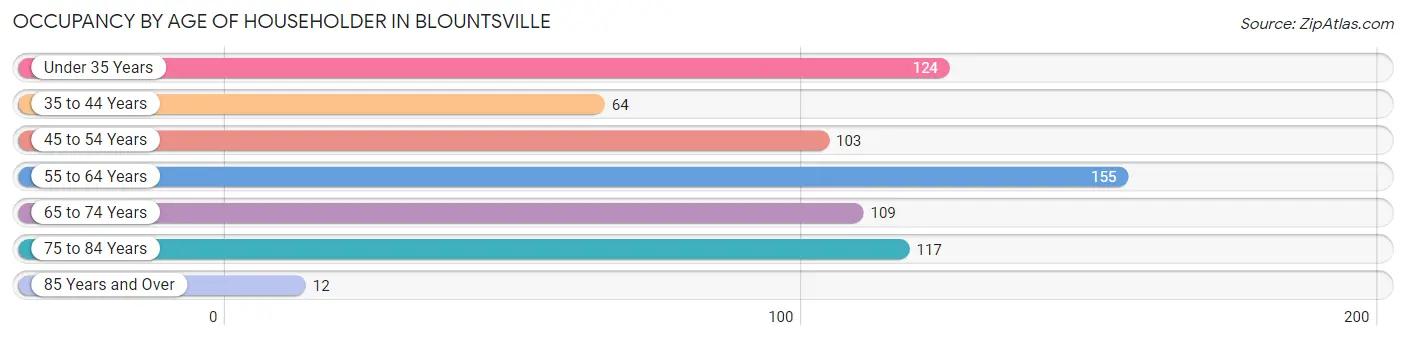
| Age Bracket | # Households | % Households |
| Under 35 Years | 124 | 18.1% |
| 35 to 44 Years | 64 | 9.4% |
| 45 to 54 Years | 103 | 15.1% |
| 55 to 64 Years | 155 | 22.7% |
| 65 to 74 Years | 109 | 15.9% |
| 75 to 84 Years | 117 | 17.1% |
| 85 Years and Over | 12 | 1.8% |
| Total | 684 | 100.0% |
Housing Finances in Blountsville
Median Income by Occupancy in Blountsville
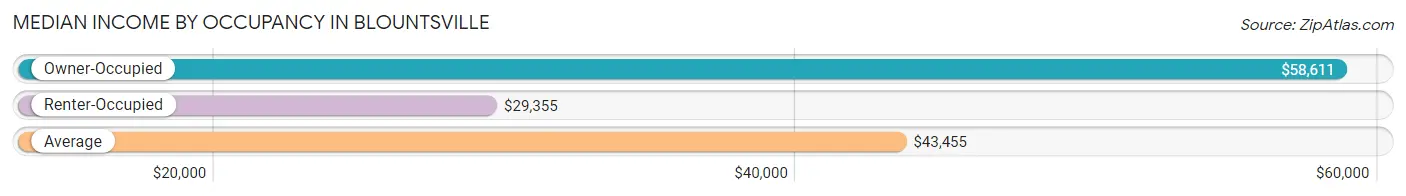
| Occupancy Type | # Households | Median Income |
| Owner-Occupied | 386 (56.4%) | $58,611 |
| Renter-Occupied | 298 (43.6%) | $29,355 |
| Average | 684 (100.0%) | $43,455 |
Occupancy by Householder Income Bracket in Blountsville
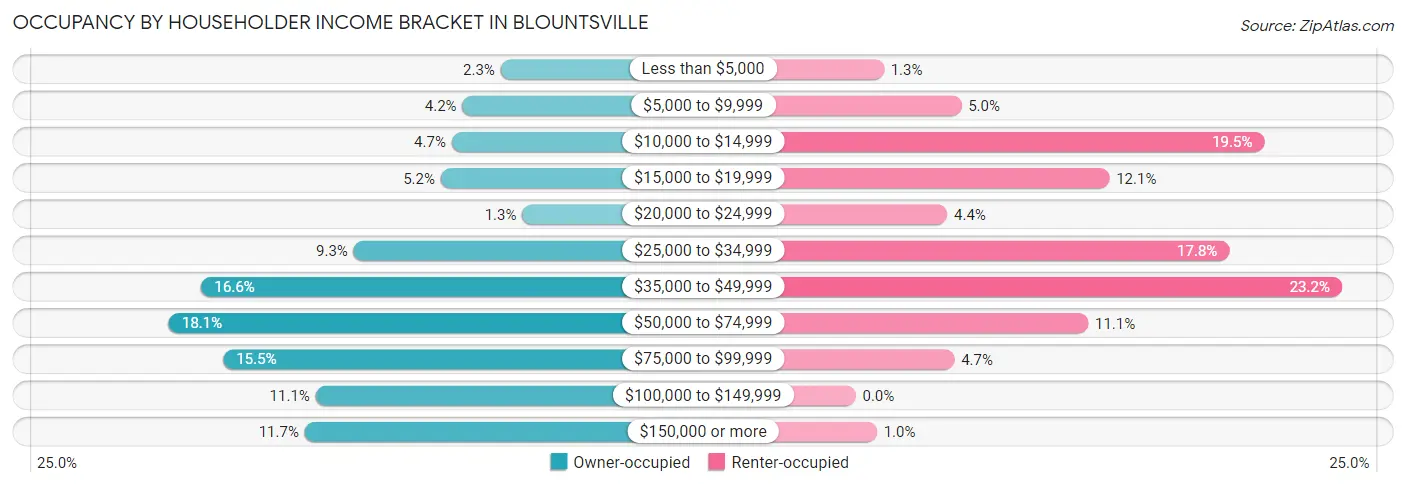
| Income Bracket | Owner-occupied | Renter-occupied |
| Less than $5,000 | 9 (2.3%) | 4 (1.3%) |
| $5,000 to $9,999 | 16 (4.2%) | 15 (5.0%) |
| $10,000 to $14,999 | 18 (4.7%) | 58 (19.5%) |
| $15,000 to $19,999 | 20 (5.2%) | 36 (12.1%) |
| $20,000 to $24,999 | 5 (1.3%) | 13 (4.4%) |
| $25,000 to $34,999 | 36 (9.3%) | 53 (17.8%) |
| $35,000 to $49,999 | 64 (16.6%) | 69 (23.2%) |
| $50,000 to $74,999 | 70 (18.1%) | 33 (11.1%) |
| $75,000 to $99,999 | 60 (15.5%) | 14 (4.7%) |
| $100,000 to $149,999 | 43 (11.1%) | 0 (0.0%) |
| $150,000 or more | 45 (11.7%) | 3 (1.0%) |
| Total | 386 (100.0%) | 298 (100.0%) |
Monthly Housing Cost Tiers in Blountsville
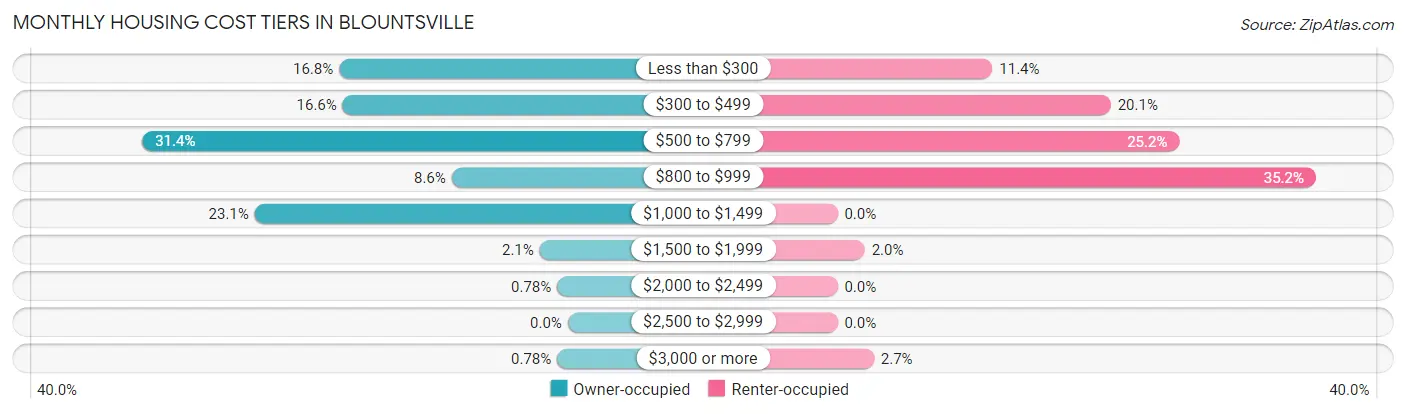
| Monthly Cost | Owner-occupied | Renter-occupied |
| Less than $300 | 65 (16.8%) | 34 (11.4%) |
| $300 to $499 | 64 (16.6%) | 60 (20.1%) |
| $500 to $799 | 121 (31.4%) | 75 (25.2%) |
| $800 to $999 | 33 (8.6%) | 105 (35.2%) |
| $1,000 to $1,499 | 89 (23.1%) | 0 (0.0%) |
| $1,500 to $1,999 | 8 (2.1%) | 6 (2.0%) |
| $2,000 to $2,499 | 3 (0.8%) | 0 (0.0%) |
| $2,500 to $2,999 | 0 (0.0%) | 0 (0.0%) |
| $3,000 or more | 3 (0.8%) | 8 (2.7%) |
| Total | 386 (100.0%) | 298 (100.0%) |
Physical Housing Characteristics in Blountsville
Housing Structures in Blountsville
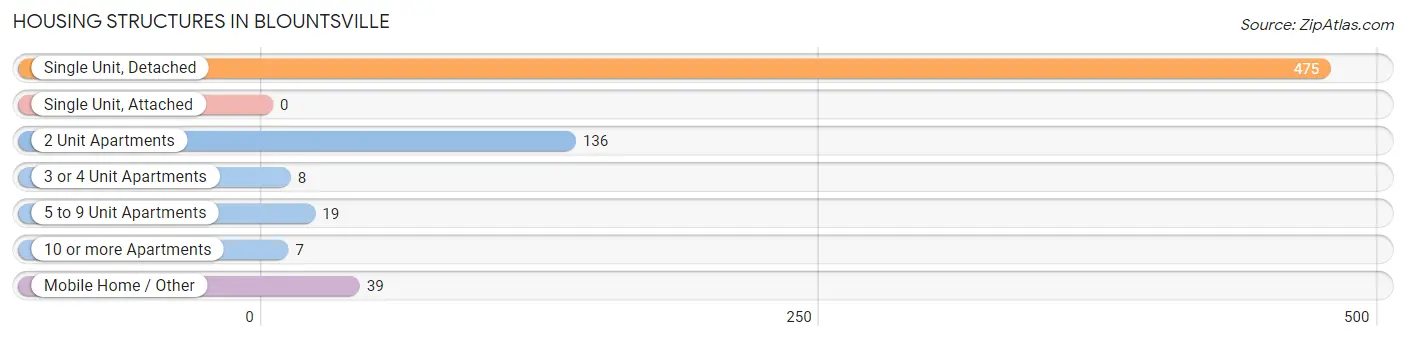
| Structure Type | # Housing Units | % Housing Units |
| Single Unit, Detached | 475 | 69.4% |
| Single Unit, Attached | 0 | 0.0% |
| 2 Unit Apartments | 136 | 19.9% |
| 3 or 4 Unit Apartments | 8 | 1.2% |
| 5 to 9 Unit Apartments | 19 | 2.8% |
| 10 or more Apartments | 7 | 1.0% |
| Mobile Home / Other | 39 | 5.7% |
| Total | 684 | 100.0% |
Housing Structures by Occupancy in Blountsville
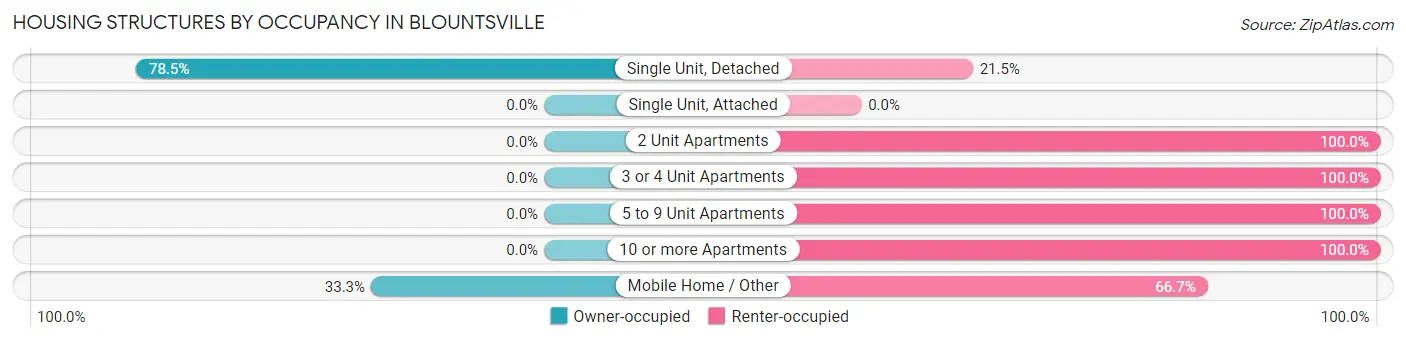
| Structure Type | Owner-occupied | Renter-occupied |
| Single Unit, Detached | 373 (78.5%) | 102 (21.5%) |
| Single Unit, Attached | 0 (0.0%) | 0 (0.0%) |
| 2 Unit Apartments | 0 (0.0%) | 136 (100.0%) |
| 3 or 4 Unit Apartments | 0 (0.0%) | 8 (100.0%) |
| 5 to 9 Unit Apartments | 0 (0.0%) | 19 (100.0%) |
| 10 or more Apartments | 0 (0.0%) | 7 (100.0%) |
| Mobile Home / Other | 13 (33.3%) | 26 (66.7%) |
| Total | 386 (56.4%) | 298 (43.6%) |
Housing Structures by Number of Rooms in Blountsville
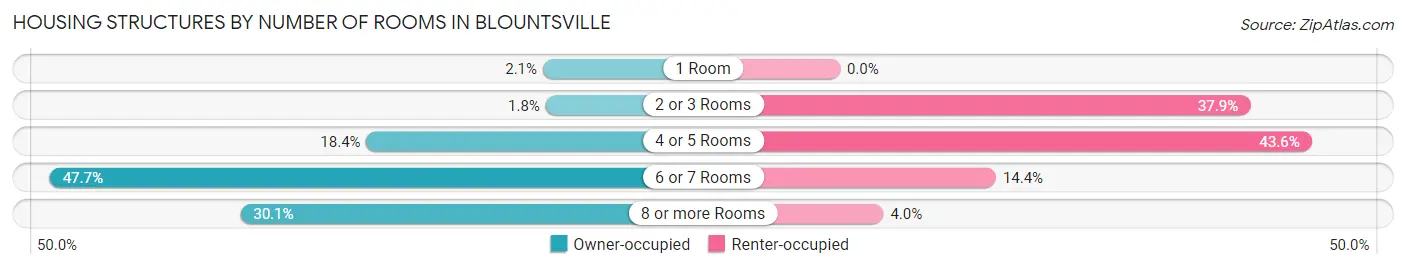
| Number of Rooms | Owner-occupied | Renter-occupied |
| 1 Room | 8 (2.1%) | 0 (0.0%) |
| 2 or 3 Rooms | 7 (1.8%) | 113 (37.9%) |
| 4 or 5 Rooms | 71 (18.4%) | 130 (43.6%) |
| 6 or 7 Rooms | 184 (47.7%) | 43 (14.4%) |
| 8 or more Rooms | 116 (30.0%) | 12 (4.0%) |
| Total | 386 (100.0%) | 298 (100.0%) |
Housing Structure by Heating Type in Blountsville
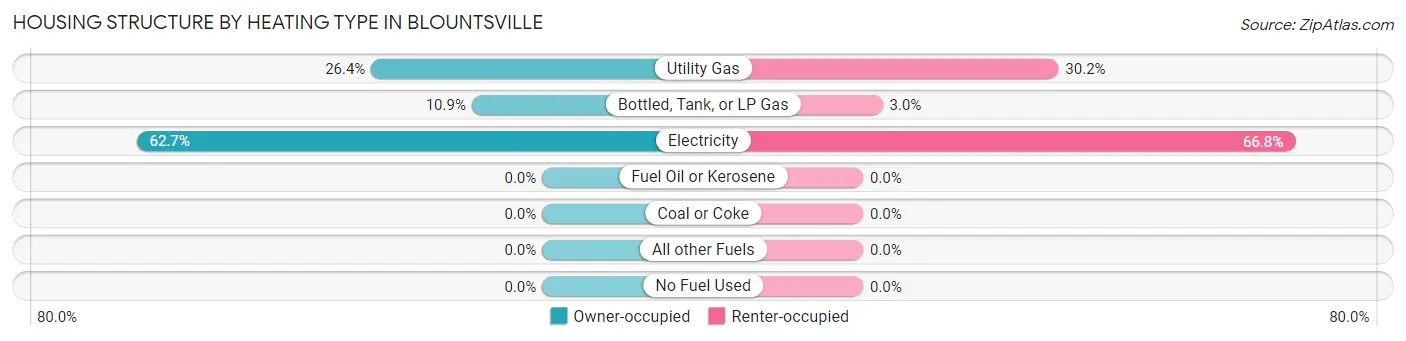
| Heating Type | Owner-occupied | Renter-occupied |
| Utility Gas | 102 (26.4%) | 90 (30.2%) |
| Bottled, Tank, or LP Gas | 42 (10.9%) | 9 (3.0%) |
| Electricity | 242 (62.7%) | 199 (66.8%) |
| Fuel Oil or Kerosene | 0 (0.0%) | 0 (0.0%) |
| Coal or Coke | 0 (0.0%) | 0 (0.0%) |
| All other Fuels | 0 (0.0%) | 0 (0.0%) |
| No Fuel Used | 0 (0.0%) | 0 (0.0%) |
| Total | 386 (100.0%) | 298 (100.0%) |
Household Vehicle Usage in Blountsville
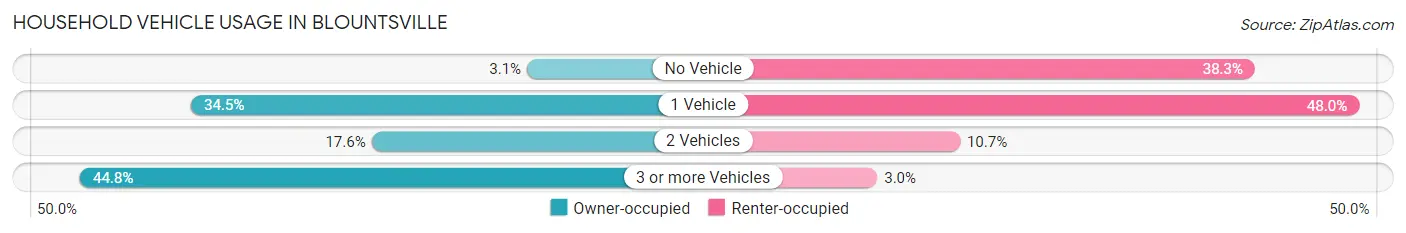
| Vehicles per Household | Owner-occupied | Renter-occupied |
| No Vehicle | 12 (3.1%) | 114 (38.3%) |
| 1 Vehicle | 133 (34.5%) | 143 (48.0%) |
| 2 Vehicles | 68 (17.6%) | 32 (10.7%) |
| 3 or more Vehicles | 173 (44.8%) | 9 (3.0%) |
| Total | 386 (100.0%) | 298 (100.0%) |
Real Estate & Mortgages in Blountsville
Real Estate and Mortgage Overview in Blountsville
| Characteristic | Without Mortgage | With Mortgage |
| Housing Units | 185 | 201 |
| Median Property Value | $111,100 | $132,500 |
| Median Household Income | $60,893 | $19 |
| Monthly Housing Costs | $339 | $3 |
| Real Estate Taxes | $380 | $36 |
Property Value by Mortgage Status in Blountsville
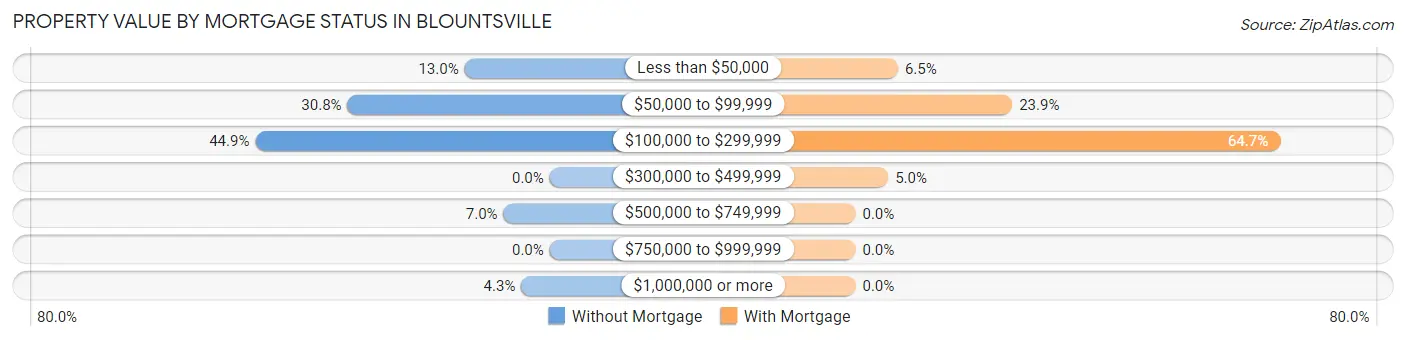
| Property Value | Without Mortgage | With Mortgage |
| Less than $50,000 | 24 (13.0%) | 13 (6.5%) |
| $50,000 to $99,999 | 57 (30.8%) | 48 (23.9%) |
| $100,000 to $299,999 | 83 (44.9%) | 130 (64.7%) |
| $300,000 to $499,999 | 0 (0.0%) | 10 (5.0%) |
| $500,000 to $749,999 | 13 (7.0%) | 0 (0.0%) |
| $750,000 to $999,999 | 0 (0.0%) | 0 (0.0%) |
| $1,000,000 or more | 8 (4.3%) | 0 (0.0%) |
| Total | 185 (100.0%) | 201 (100.0%) |
Household Income by Mortgage Status in Blountsville
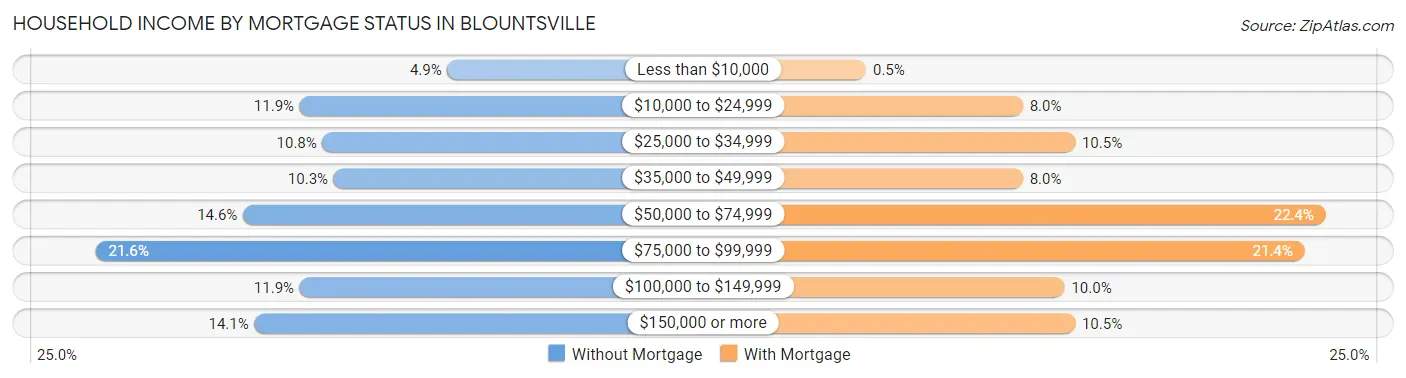
| Household Income | Without Mortgage | With Mortgage |
| Less than $10,000 | 9 (4.9%) | 1 (0.5%) |
| $10,000 to $24,999 | 22 (11.9%) | 16 (8.0%) |
| $25,000 to $34,999 | 20 (10.8%) | 21 (10.4%) |
| $35,000 to $49,999 | 19 (10.3%) | 16 (8.0%) |
| $50,000 to $74,999 | 27 (14.6%) | 45 (22.4%) |
| $75,000 to $99,999 | 40 (21.6%) | 43 (21.4%) |
| $100,000 to $149,999 | 22 (11.9%) | 20 (10.0%) |
| $150,000 or more | 26 (14.1%) | 21 (10.4%) |
| Total | 185 (100.0%) | 201 (100.0%) |
Property Value to Household Income Ratio in Blountsville
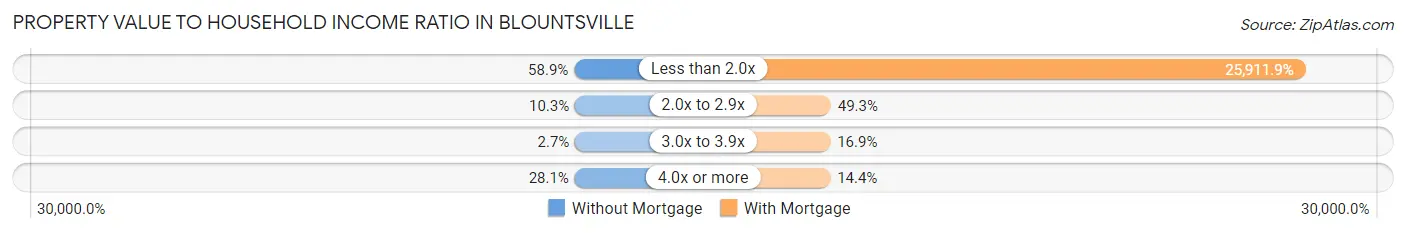
| Value-to-Income Ratio | Without Mortgage | With Mortgage |
| Less than 2.0x | 109 (58.9%) | 52,083 (25,911.9%) |
| 2.0x to 2.9x | 19 (10.3%) | 99 (49.2%) |
| 3.0x to 3.9x | 5 (2.7%) | 34 (16.9%) |
| 4.0x or more | 52 (28.1%) | 29 (14.4%) |
| Total | 185 (100.0%) | 201 (100.0%) |
Real Estate Taxes by Mortgage Status in Blountsville
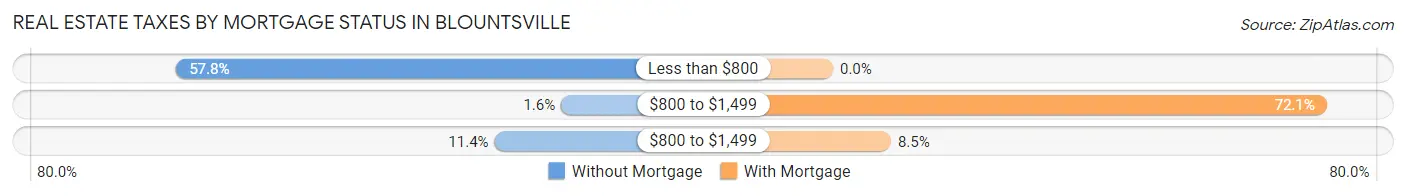
| Property Taxes | Without Mortgage | With Mortgage |
| Less than $800 | 107 (57.8%) | 0 (0.0%) |
| $800 to $1,499 | 3 (1.6%) | 145 (72.1%) |
| $800 to $1,499 | 21 (11.4%) | 17 (8.5%) |
| Total | 185 (100.0%) | 201 (100.0%) |
Health & Disability in Blountsville
Health Insurance Coverage by Age in Blountsville
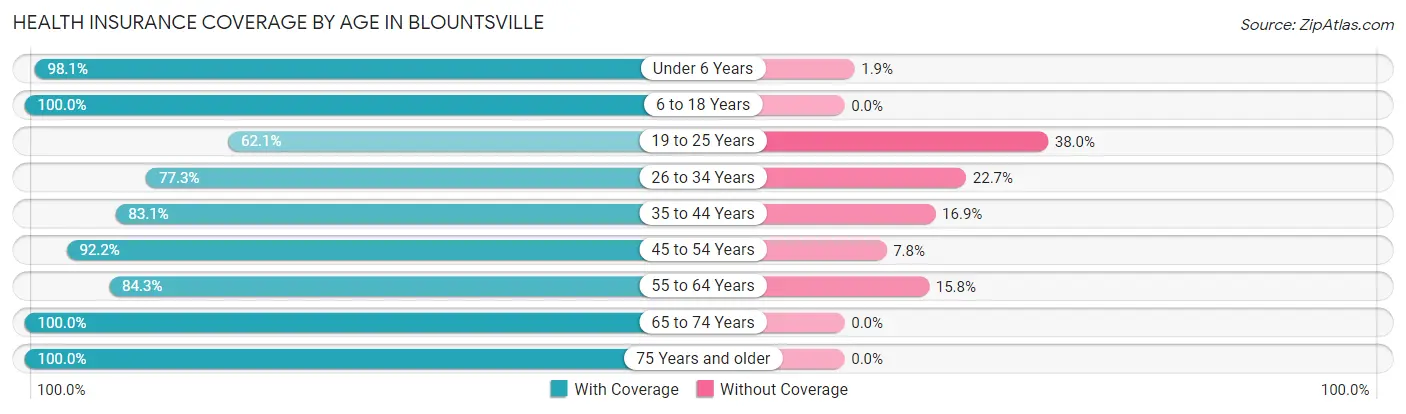
| Age Bracket | With Coverage | Without Coverage |
| Under 6 Years | 211 (98.1%) | 4 (1.9%) |
| 6 to 18 Years | 231 (100.0%) | 0 (0.0%) |
| 19 to 25 Years | 188 (62.1%) | 115 (38.0%) |
| 26 to 34 Years | 133 (77.3%) | 39 (22.7%) |
| 35 to 44 Years | 152 (83.1%) | 31 (16.9%) |
| 45 to 54 Years | 177 (92.2%) | 15 (7.8%) |
| 55 to 64 Years | 214 (84.3%) | 40 (15.8%) |
| 65 to 74 Years | 134 (100.0%) | 0 (0.0%) |
| 75 Years and older | 153 (100.0%) | 0 (0.0%) |
| Total | 1,593 (86.7%) | 244 (13.3%) |
Health Insurance Coverage by Citizenship Status in Blountsville
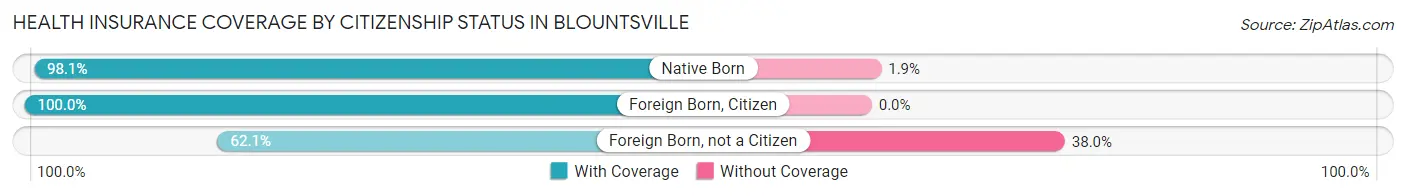
| Citizenship Status | With Coverage | Without Coverage |
| Native Born | 211 (98.1%) | 4 (1.9%) |
| Foreign Born, Citizen | 231 (100.0%) | 0 (0.0%) |
| Foreign Born, not a Citizen | 188 (62.1%) | 115 (38.0%) |
Health Insurance Coverage by Household Income in Blountsville
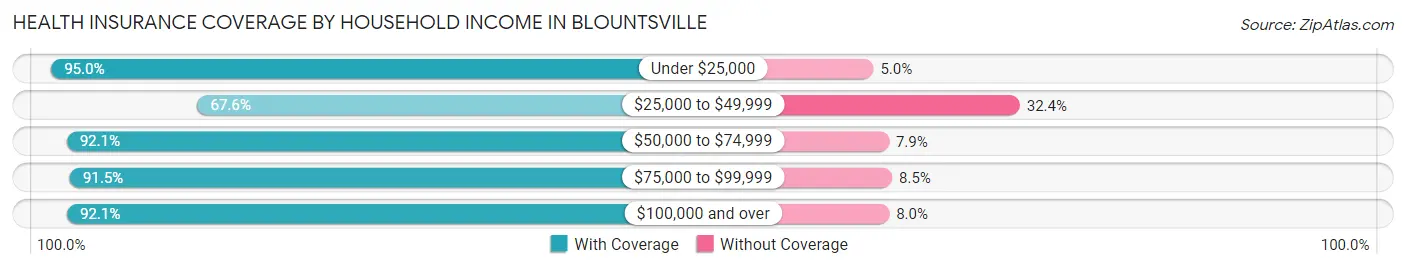
| Household Income | With Coverage | Without Coverage |
| Under $25,000 | 323 (95.0%) | 17 (5.0%) |
| $25,000 to $49,999 | 294 (67.6%) | 141 (32.4%) |
| $50,000 to $74,999 | 268 (92.1%) | 23 (7.9%) |
| $75,000 to $99,999 | 291 (91.5%) | 27 (8.5%) |
| $100,000 and over | 417 (92.0%) | 36 (8.0%) |
Public vs Private Health Insurance Coverage by Age in Blountsville
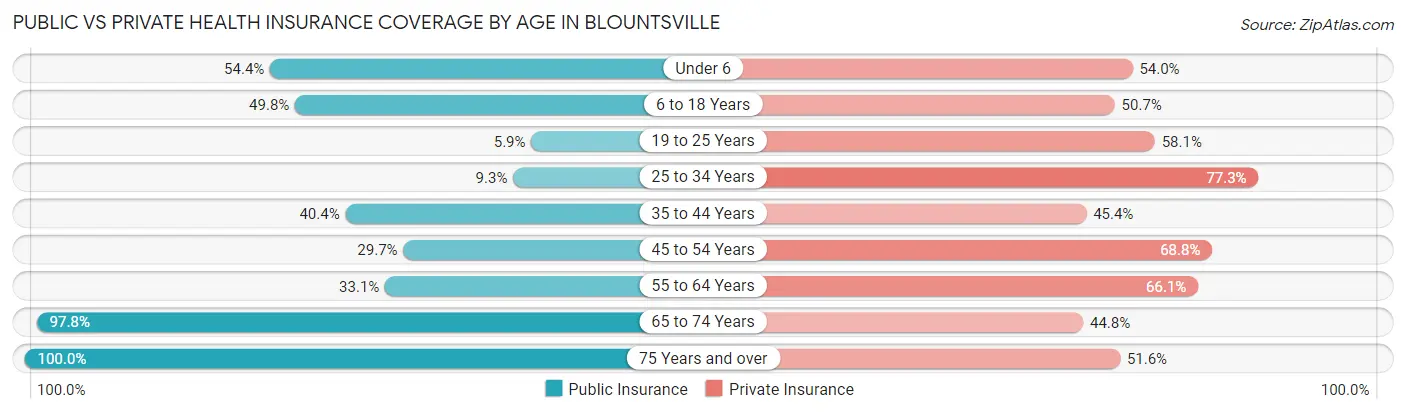
| Age Bracket | Public Insurance | Private Insurance |
| Under 6 | 117 (54.4%) | 116 (53.9%) |
| 6 to 18 Years | 115 (49.8%) | 117 (50.6%) |
| 19 to 25 Years | 18 (5.9%) | 176 (58.1%) |
| 25 to 34 Years | 16 (9.3%) | 133 (77.3%) |
| 35 to 44 Years | 74 (40.4%) | 83 (45.4%) |
| 45 to 54 Years | 57 (29.7%) | 132 (68.8%) |
| 55 to 64 Years | 84 (33.1%) | 168 (66.1%) |
| 65 to 74 Years | 131 (97.8%) | 60 (44.8%) |
| 75 Years and over | 153 (100.0%) | 79 (51.6%) |
| Total | 765 (41.6%) | 1,064 (57.9%) |
Disability Status by Sex by Age in Blountsville
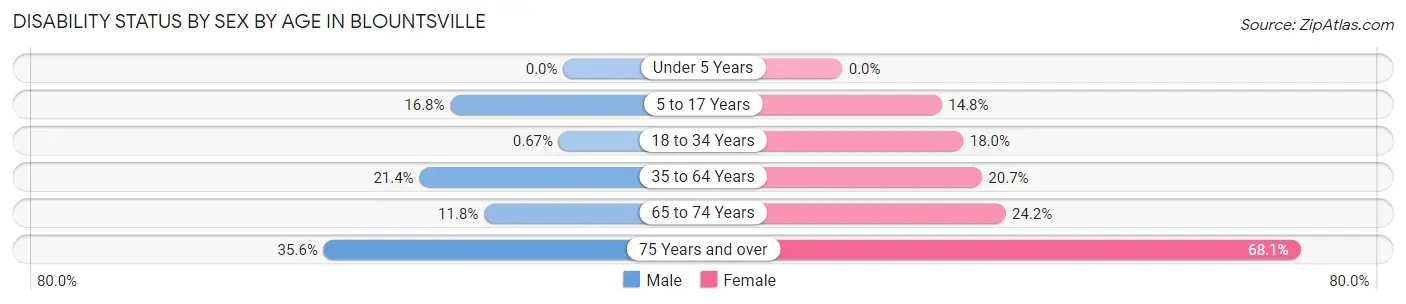
| Age Bracket | Male | Female |
| Under 5 Years | 0 (0.0%) | 0 (0.0%) |
| 5 to 17 Years | 24 (16.8%) | 17 (14.8%) |
| 18 to 34 Years | 2 (0.7%) | 32 (18.0%) |
| 35 to 64 Years | 53 (21.4%) | 79 (20.7%) |
| 65 to 74 Years | 8 (11.8%) | 16 (24.2%) |
| 75 Years and over | 21 (35.6%) | 64 (68.1%) |
Disability Class by Sex by Age in Blountsville
Disability Class: Hearing Difficulty
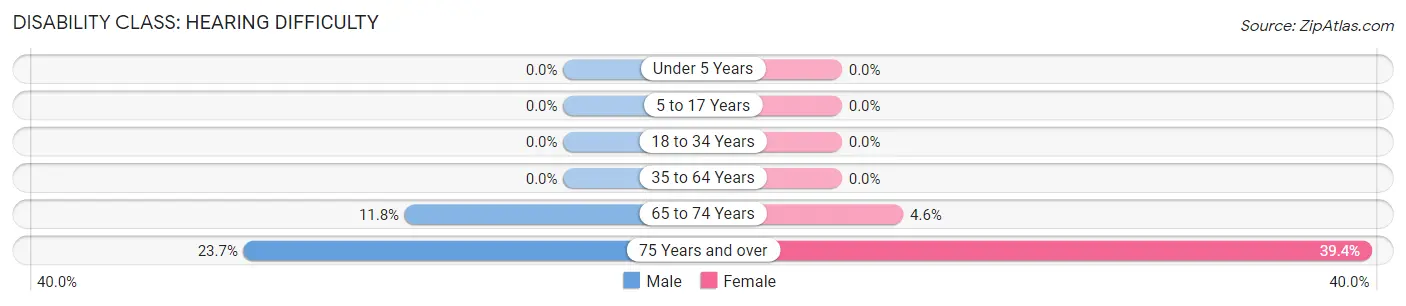
| Age Bracket | Male | Female |
| Under 5 Years | 0 (0.0%) | 0 (0.0%) |
| 5 to 17 Years | 0 (0.0%) | 0 (0.0%) |
| 18 to 34 Years | 0 (0.0%) | 0 (0.0%) |
| 35 to 64 Years | 0 (0.0%) | 0 (0.0%) |
| 65 to 74 Years | 8 (11.8%) | 3 (4.5%) |
| 75 Years and over | 14 (23.7%) | 37 (39.4%) |
Disability Class: Vision Difficulty
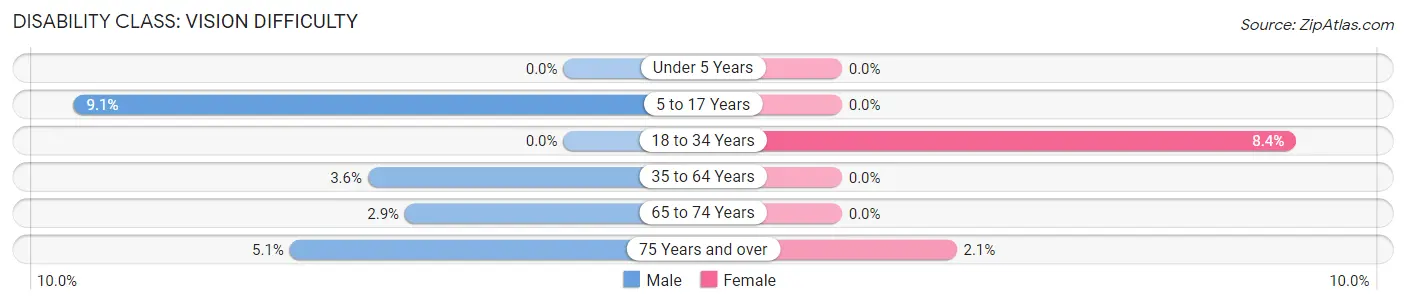
| Age Bracket | Male | Female |
| Under 5 Years | 0 (0.0%) | 0 (0.0%) |
| 5 to 17 Years | 13 (9.1%) | 0 (0.0%) |
| 18 to 34 Years | 0 (0.0%) | 15 (8.4%) |
| 35 to 64 Years | 9 (3.6%) | 0 (0.0%) |
| 65 to 74 Years | 2 (2.9%) | 0 (0.0%) |
| 75 Years and over | 3 (5.1%) | 2 (2.1%) |
Disability Class: Cognitive Difficulty
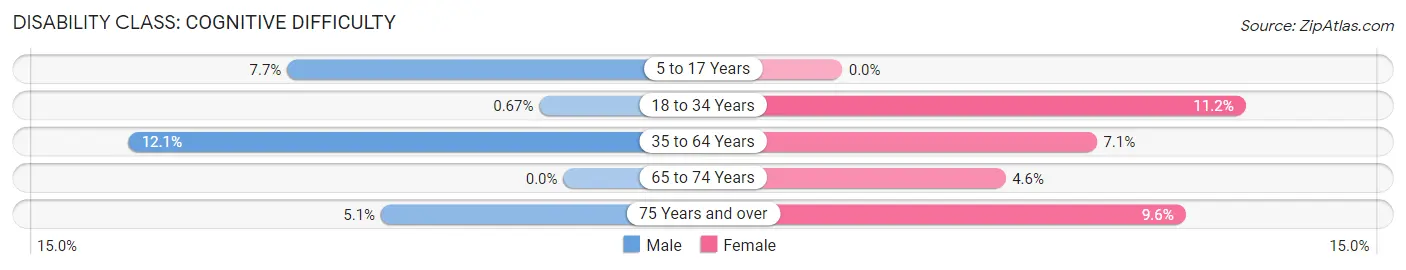
| Age Bracket | Male | Female |
| 5 to 17 Years | 11 (7.7%) | 0 (0.0%) |
| 18 to 34 Years | 2 (0.7%) | 20 (11.2%) |
| 35 to 64 Years | 30 (12.1%) | 27 (7.1%) |
| 65 to 74 Years | 0 (0.0%) | 3 (4.5%) |
| 75 Years and over | 3 (5.1%) | 9 (9.6%) |
Disability Class: Ambulatory Difficulty
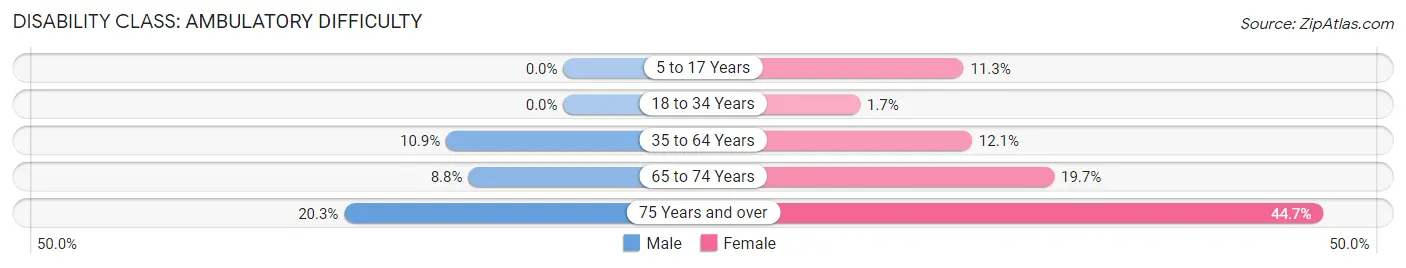
| Age Bracket | Male | Female |
| 5 to 17 Years | 0 (0.0%) | 13 (11.3%) |
| 18 to 34 Years | 0 (0.0%) | 3 (1.7%) |
| 35 to 64 Years | 27 (10.9%) | 46 (12.1%) |
| 65 to 74 Years | 6 (8.8%) | 13 (19.7%) |
| 75 Years and over | 12 (20.3%) | 42 (44.7%) |
Disability Class: Self-Care Difficulty
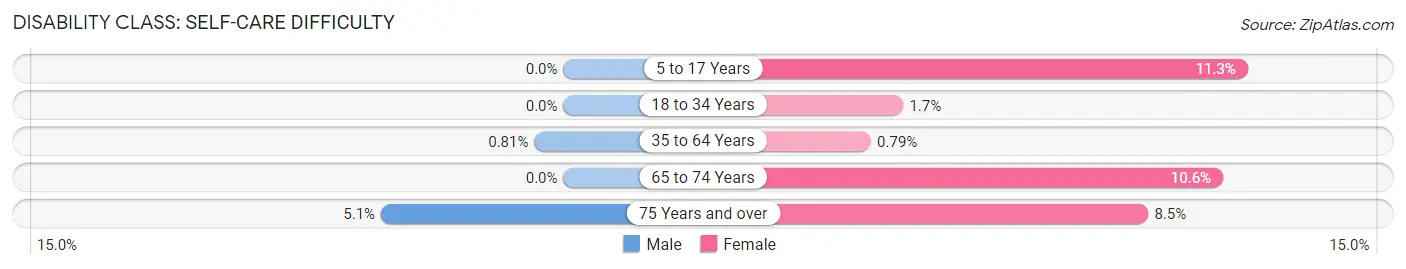
| Age Bracket | Male | Female |
| 5 to 17 Years | 0 (0.0%) | 13 (11.3%) |
| 18 to 34 Years | 0 (0.0%) | 3 (1.7%) |
| 35 to 64 Years | 2 (0.8%) | 3 (0.8%) |
| 65 to 74 Years | 0 (0.0%) | 7 (10.6%) |
| 75 Years and over | 3 (5.1%) | 8 (8.5%) |
Technology Access in Blountsville
Computing Device Access in Blountsville
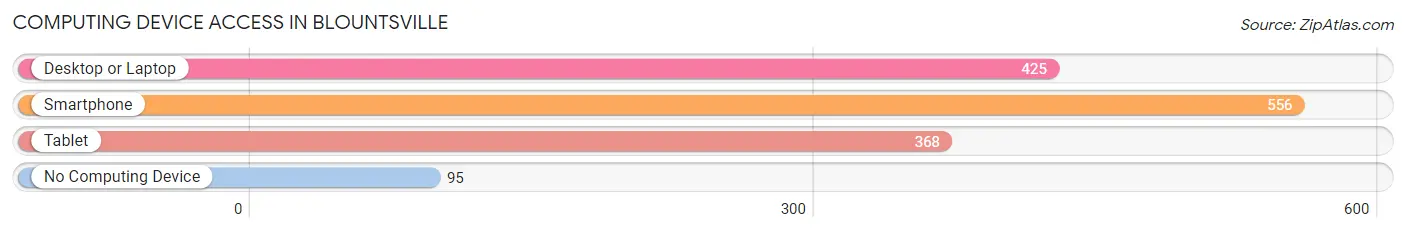
| Device Type | # Households | % Households |
| Desktop or Laptop | 425 | 62.1% |
| Smartphone | 556 | 81.3% |
| Tablet | 368 | 53.8% |
| No Computing Device | 95 | 13.9% |
| Total | 684 | 100.0% |
Internet Access in Blountsville
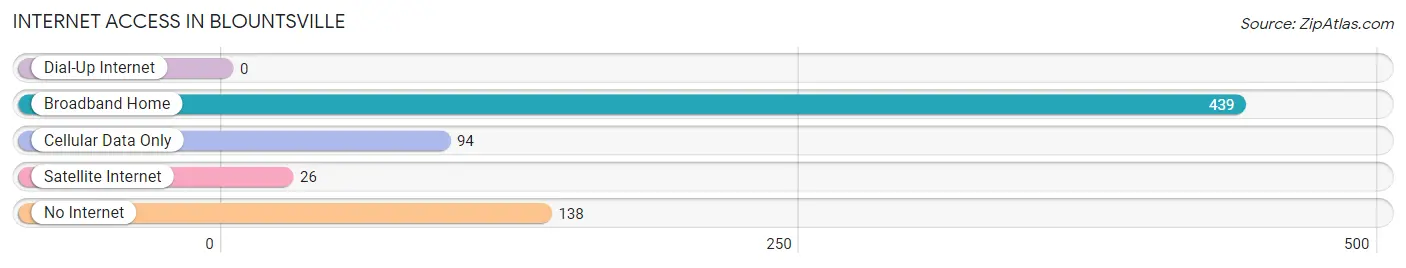
| Internet Type | # Households | % Households |
| Dial-Up Internet | 0 | 0.0% |
| Broadband Home | 439 | 64.2% |
| Cellular Data Only | 94 | 13.7% |
| Satellite Internet | 26 | 3.8% |
| No Internet | 138 | 20.2% |
| Total | 684 | 100.0% |
Blountsville Summary
Blountsville, Alabama is a small town located in Blount County, Alabama. It is situated in the foothills of the Appalachian Mountains and is part of the Birmingham-Hoover Metropolitan Statistical Area. The town has a population of 1,845 people, according to the 2010 census.
History
Blountsville was founded in 1818 by John Blount, a Revolutionary War veteran. The town was originally known as Blountsville Station, and was the first county seat of Blount County. The town was incorporated in 1868 and was named after its founder.
In the late 19th century, Blountsville was a thriving agricultural center, with cotton, corn, and tobacco being the main crops. The town also had a number of sawmills and gristmills.
In the early 20th century, the town began to decline as the railroad bypassed it and the population began to move away. The town was nearly abandoned by the 1950s, but has since seen a resurgence in population and economic activity.
Geography
Blountsville is located in the foothills of the Appalachian Mountains, about 25 miles northeast of Birmingham. The town is situated at the intersection of US Highway 231 and Alabama State Route 79.
The town is located in a hilly area, with elevations ranging from 600 to 900 feet above sea level. The terrain is mostly wooded, with some open fields. The town is located in the Black Warrior River watershed.
Economy
The economy of Blountsville is largely based on agriculture and tourism. The town is home to several farms, which produce a variety of crops, including cotton, corn, soybeans, and tobacco.
The town is also home to several small businesses, including restaurants, antique stores, and gift shops. The town is also home to a number of bed and breakfasts, which attract tourists from around the region.
Demographics
According to the 2010 census, Blountsville has a population of 1,845 people. The town has a median household income of $37,917 and a median family income of $45,917. The town has a poverty rate of 17.3%, which is higher than the national average.
The town is predominantly white, with 87.3% of the population identifying as such. The town also has a small African American population, at 8.3%, and a small Hispanic population, at 2.2%.
Conclusion
Blountsville, Alabama is a small town located in the foothills of the Appalachian Mountains. The town has a population of 1,845 people, and is largely based on agriculture and tourism. The town is predominantly white, with a small African American and Hispanic population. The town has a median household income of $37,917 and a poverty rate of 17.3%.
Common Questions
What is Per Capita Income in Blountsville?
Per Capita income in Blountsville is $22,934.
What is the Median Family Income in Blountsville?
Median Family Income in Blountsville is $57,688.
What is the Median Household income in Blountsville?
Median Household Income in Blountsville is $43,455.
What is Income or Wage Gap in Blountsville?
Income or Wage Gap in Blountsville is 6.4%.
Women in Blountsville earn 93.6 cents for every dollar earned by a man.
What is Inequality or Gini Index in Blountsville?
Inequality or Gini Index in Blountsville is 0.45.
What is the Total Population of Blountsville?
Total Population of Blountsville is 1,837.
What is the Total Male Population of Blountsville?
Total Male Population of Blountsville is 881.
What is the Total Female Population of Blountsville?
Total Female Population of Blountsville is 956.
What is the Ratio of Males per 100 Females in Blountsville?
There are 92.15 Males per 100 Females in Blountsville.
What is the Ratio of Females per 100 Males in Blountsville?
There are 108.51 Females per 100 Males in Blountsville.
What is the Median Population Age in Blountsville?
Median Population Age in Blountsville is 33.9 Years.
What is the Average Family Size in Blountsville
Average Family Size in Blountsville is 3.5 People.
What is the Average Household Size in Blountsville
Average Household Size in Blountsville is 2.7 People.
How Large is the Labor Force in Blountsville?
There are 777 People in the Labor Forcein in Blountsville.
What is the Percentage of People in the Labor Force in Blountsville?
54.2% of People are in the Labor Force in Blountsville.
What is the Unemployment Rate in Blountsville?
Unemployment Rate in Blountsville is 2.7%.