Bear Creek, AL Map & Demographics
Bear Creek Map
Bear Creek Overview
$18,547
PER CAPITA INCOME
$56,250
AVG FAMILY INCOME
$38,657
AVG HOUSEHOLD INCOME
0.41
INEQUALITY / GINI INDEX
1,549
TOTAL POPULATION
977
MALE POPULATION
572
FEMALE POPULATION
170.80
MALES / 100 FEMALES
58.55
FEMALES / 100 MALES
41.3
MEDIAN AGE
3.6
AVG FAMILY SIZE
3.0
AVG HOUSEHOLD SIZE
614
LABOR FORCE [ PEOPLE ]
49.6%
PERCENT IN LABOR FORCE
13.0%
UNEMPLOYMENT RATE
Bear Creek Zip Codes
Bear Creek Area Codes
Income in Bear Creek
Income Overview in Bear Creek
Per Capita Income in Bear Creek is $18,547, while median incomes of families and households are $56,250 and $38,657 respectively.
| Characteristic | Number | Measure |
| Per Capita Income | 1,549 | $18,547 |
| Median Family Income | 357 | $56,250 |
| Mean Family Income | 357 | $61,571 |
| Median Household Income | 523 | $38,657 |
| Mean Household Income | 523 | $52,601 |
| Income Deficit | 357 | $0 |
| Wage / Income Gap (%) | 1,549 | 0.00% |
| Wage / Income Gap ($) | 1,549 | 100.00¢ per $1 |
| Gini / Inequality Index | 1,549 | 0.41 |
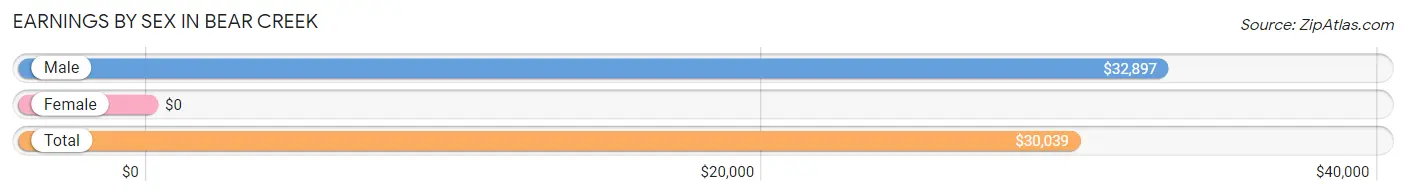
Earnings by Sex in Bear Creek
| Sex | Number | Average Earnings |
| Male | 392 (60.3%) | $32,897 |
| Female | 258 (39.7%) | $0 |
| Total | 650 (100.0%) | $30,039 |
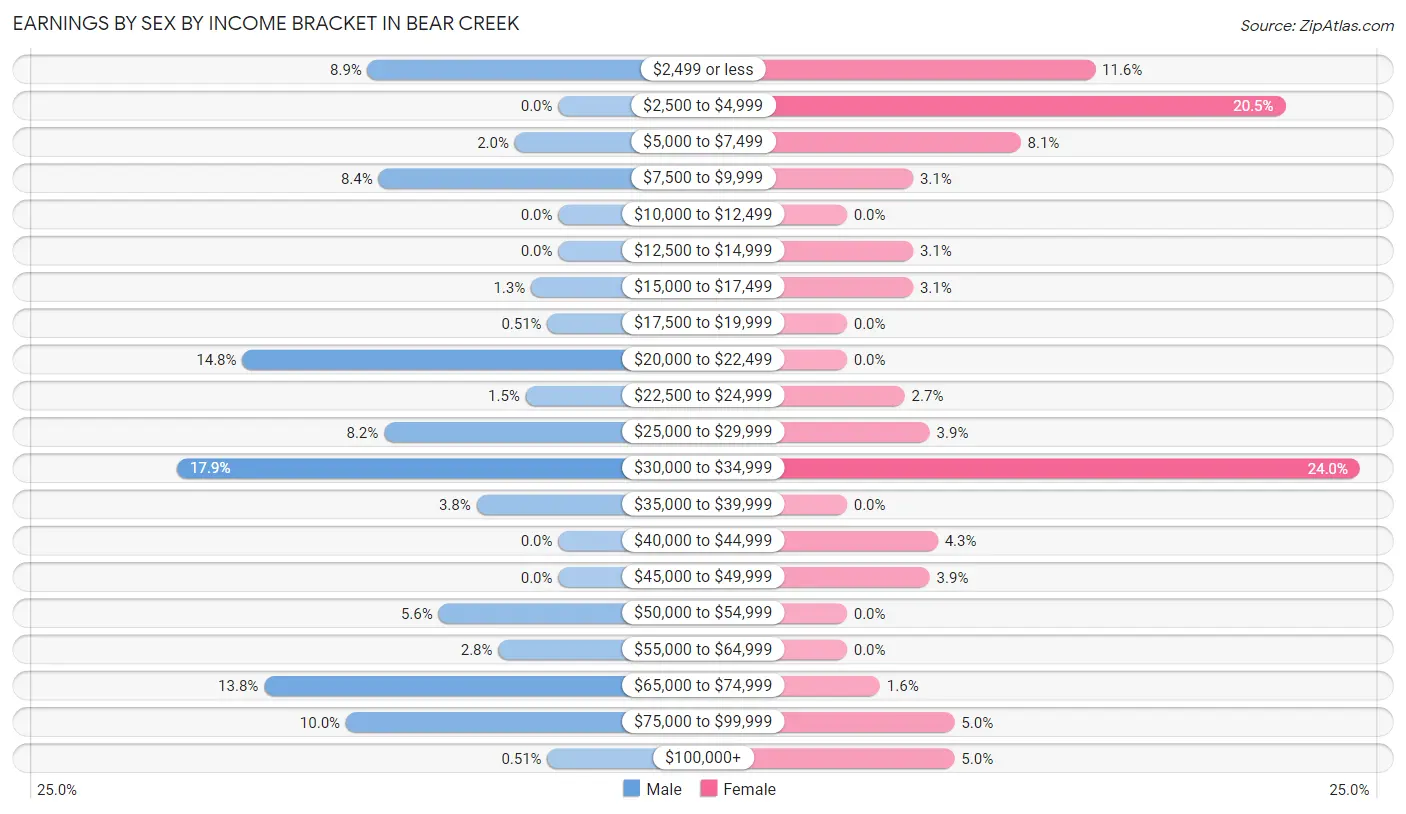
Earnings by Sex by Income Bracket in Bear Creek
The most common earnings brackets in Bear Creek are $30,000 to $34,999 for men (70 | 17.9%) and $30,000 to $34,999 for women (62 | 24.0%).
| Income | Male | Female |
| $2,499 or less | 35 (8.9%) | 30 (11.6%) |
| $2,500 to $4,999 | 0 (0.0%) | 53 (20.5%) |
| $5,000 to $7,499 | 8 (2.0%) | 21 (8.1%) |
| $7,500 to $9,999 | 33 (8.4%) | 8 (3.1%) |
| $10,000 to $12,499 | 0 (0.0%) | 0 (0.0%) |
| $12,500 to $14,999 | 0 (0.0%) | 8 (3.1%) |
| $15,000 to $17,499 | 5 (1.3%) | 8 (3.1%) |
| $17,500 to $19,999 | 2 (0.5%) | 0 (0.0%) |
| $20,000 to $22,499 | 58 (14.8%) | 0 (0.0%) |
| $22,500 to $24,999 | 6 (1.5%) | 7 (2.7%) |
| $25,000 to $29,999 | 32 (8.2%) | 10 (3.9%) |
| $30,000 to $34,999 | 70 (17.9%) | 62 (24.0%) |
| $35,000 to $39,999 | 15 (3.8%) | 0 (0.0%) |
| $40,000 to $44,999 | 0 (0.0%) | 11 (4.3%) |
| $45,000 to $49,999 | 0 (0.0%) | 10 (3.9%) |
| $50,000 to $54,999 | 22 (5.6%) | 0 (0.0%) |
| $55,000 to $64,999 | 11 (2.8%) | 0 (0.0%) |
| $65,000 to $74,999 | 54 (13.8%) | 4 (1.5%) |
| $75,000 to $99,999 | 39 (10.0%) | 13 (5.0%) |
| $100,000+ | 2 (0.5%) | 13 (5.0%) |
| Total | 392 (100.0%) | 258 (100.0%) |
Earnings by Sex by Educational Attainment in Bear Creek
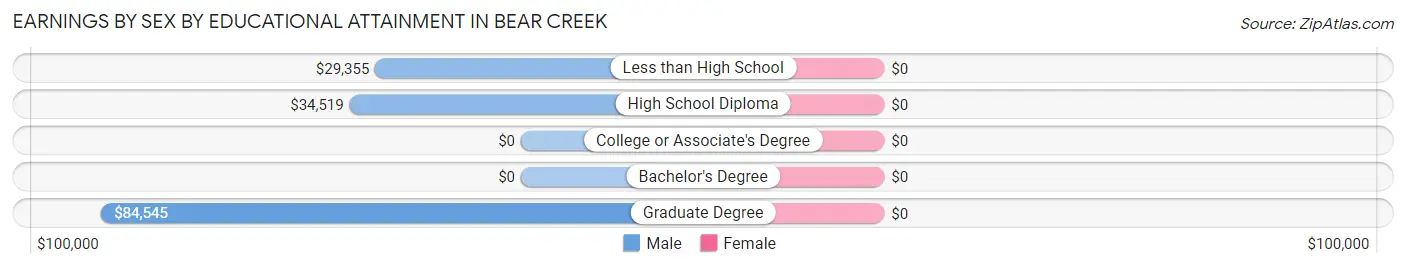
| Educational Attainment | Male Income | Female Income |
| Less than High School | $29,355 | $0 |
| High School Diploma | $34,519 | $0 |
| College or Associate's Degree | - | - |
| Bachelor's Degree | - | - |
| Graduate Degree | $84,545 | $0 |
| Total | $36,250 | $0 |
Family Income in Bear Creek
Family Income Brackets in Bear Creek
According to the Bear Creek family income data, there are 88 families falling into the $75,000 to $99,999 income range, which is the most common income bracket and makes up 24.6% of all families.
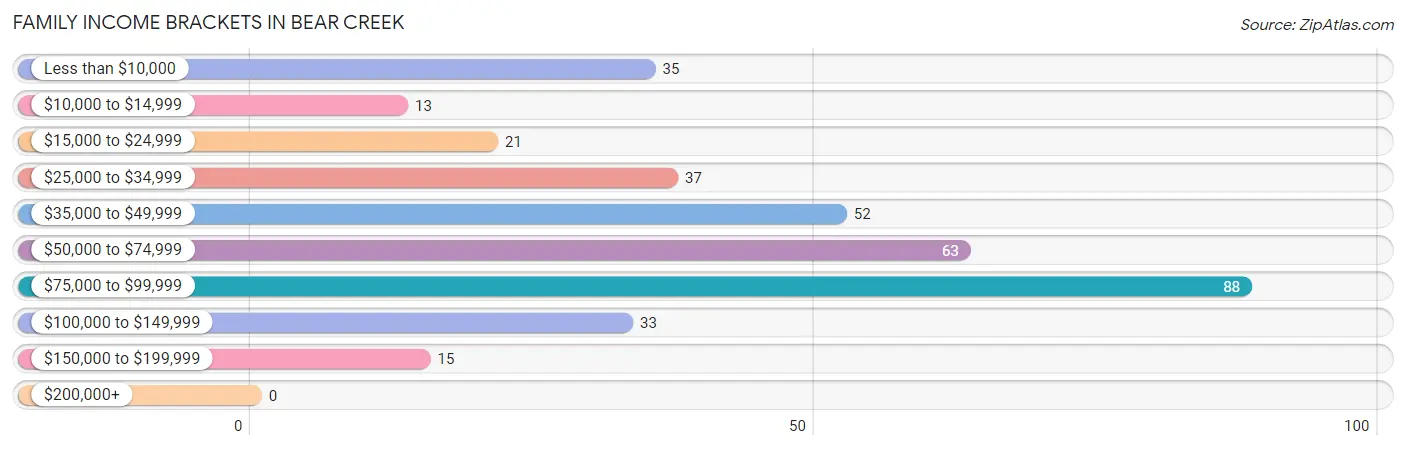
| Income Bracket | # Families | % Families |
| Less than $10,000 | 35 | 9.8% |
| $10,000 to $14,999 | 13 | 3.6% |
| $15,000 to $24,999 | 21 | 5.9% |
| $25,000 to $34,999 | 37 | 10.4% |
| $35,000 to $49,999 | 52 | 14.6% |
| $50,000 to $74,999 | 63 | 17.6% |
| $75,000 to $99,999 | 88 | 24.6% |
| $100,000 to $149,999 | 33 | 9.2% |
| $150,000 to $199,999 | 15 | 4.2% |
| $200,000+ | 0 | 0.0% |
Family Income by Famaliy Size in Bear Creek
3-person families (97 | 27.2%) account for the highest median family income in Bear Creek with $83,650 per family, while 3-person families (97 | 27.2%) have the highest median income of $27,883 per family member.
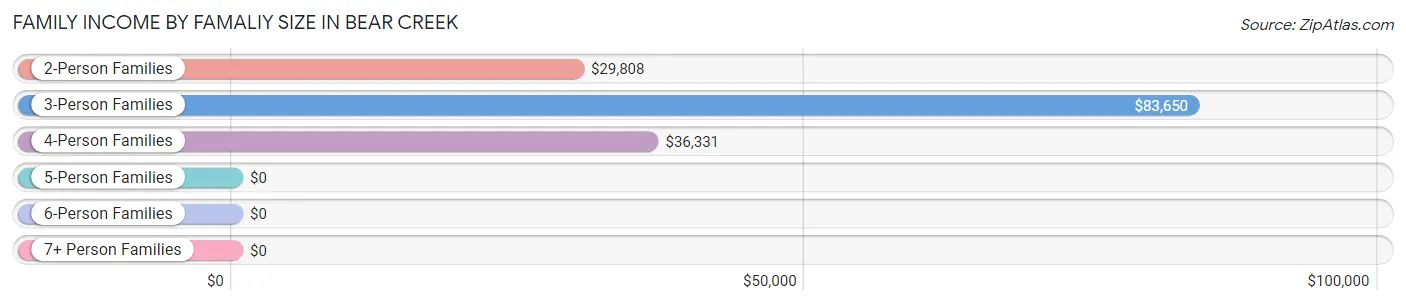
| Income Bracket | # Families | Median Income |
| 2-Person Families | 174 (48.7%) | $29,808 |
| 3-Person Families | 97 (27.2%) | $83,650 |
| 4-Person Families | 51 (14.3%) | $36,331 |
| 5-Person Families | 10 (2.8%) | $0 |
| 6-Person Families | 25 (7.0%) | $0 |
| 7+ Person Families | 0 (0.0%) | $0 |
| Total | 357 (100.0%) | $56,250 |
Family Income by Number of Earners in Bear Creek
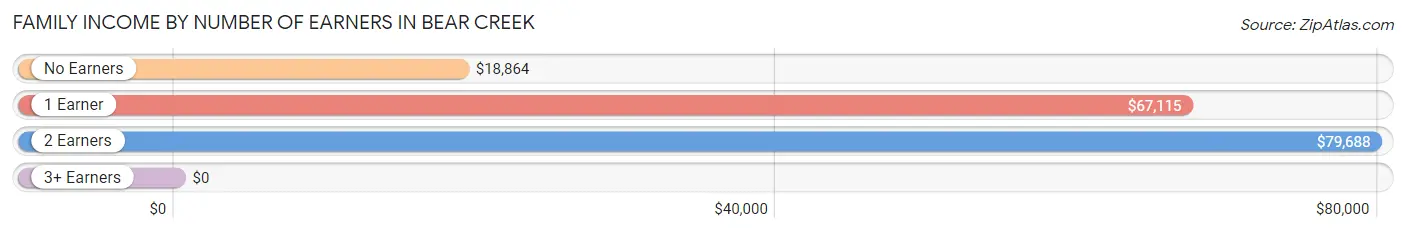
| Number of Earners | # Families | Median Income |
| No Earners | 90 (25.2%) | $18,864 |
| 1 Earner | 112 (31.4%) | $67,115 |
| 2 Earners | 98 (27.5%) | $79,688 |
| 3+ Earners | 57 (16.0%) | $0 |
| Total | 357 (100.0%) | $56,250 |
Household Income in Bear Creek
Household Income Brackets in Bear Creek
With 103 households falling in the category, the $75,000 to $99,999 income range is the most frequent in Bear Creek, accounting for 19.7% of all households.
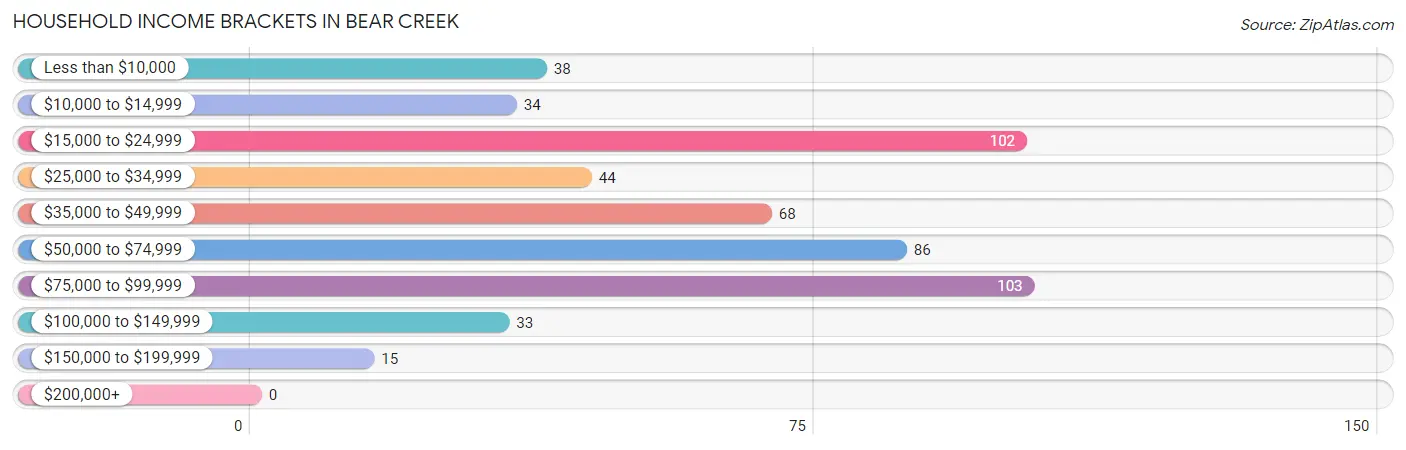
| Income Bracket | # Households | % Households |
| Less than $10,000 | 38 | 7.3% |
| $10,000 to $14,999 | 34 | 6.5% |
| $15,000 to $24,999 | 102 | 19.5% |
| $25,000 to $34,999 | 44 | 8.4% |
| $35,000 to $49,999 | 68 | 13.0% |
| $50,000 to $74,999 | 86 | 16.4% |
| $75,000 to $99,999 | 103 | 19.7% |
| $100,000 to $149,999 | 33 | 6.3% |
| $150,000 to $199,999 | 15 | 2.9% |
| $200,000+ | 0 | 0.0% |
Household Income by Householder Age in Bear Creek
The median household income in Bear Creek is $38,657, with the highest median household income of $49,107 found in the 45 to 64 years age bracket for the primary householder. A total of 227 households (43.4%) fall into this category. Meanwhile, the 15 to 24 years age bracket for the primary householder has the lowest median household income of $0, with 28 households (5.3%) in this group.
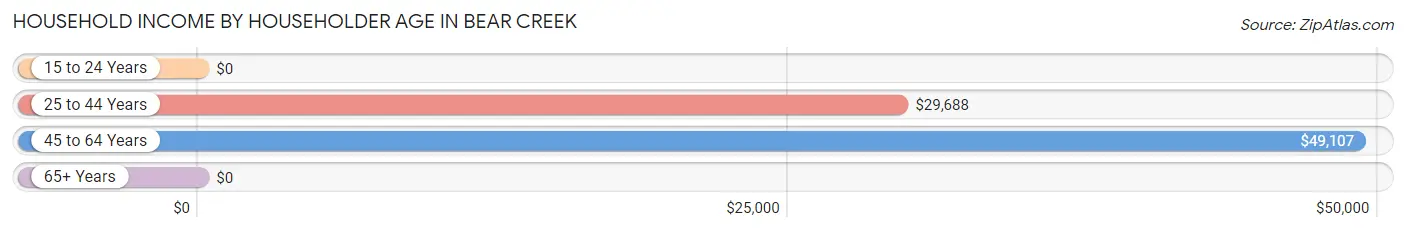
| Income Bracket | # Households | Median Income |
| 15 to 24 Years | 28 (5.3%) | $0 |
| 25 to 44 Years | 100 (19.1%) | $29,688 |
| 45 to 64 Years | 227 (43.4%) | $49,107 |
| 65+ Years | 168 (32.1%) | $0 |
| Total | 523 (100.0%) | $38,657 |
Poverty in Bear Creek
Income Below Poverty by Sex and Age in Bear Creek
With 10.5% poverty level for males and 18.5% for females among the residents of Bear Creek, 16 and 17 year old males and 25 to 34 year old females are the most vulnerable to poverty, with 10 males (55.6%) and 42 females (67.7%) in their respective age groups living below the poverty level.
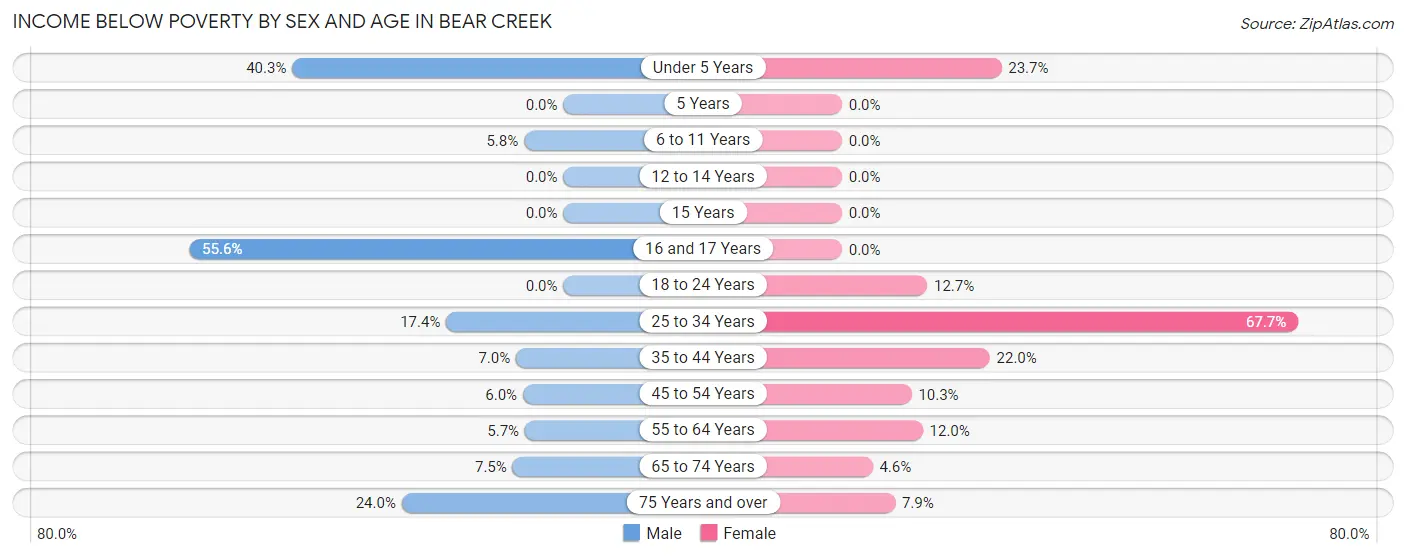
| Age Bracket | Male | Female |
| Under 5 Years | 31 (40.3%) | 9 (23.7%) |
| 5 Years | 0 (0.0%) | 0 (0.0%) |
| 6 to 11 Years | 7 (5.8%) | 0 (0.0%) |
| 12 to 14 Years | 0 (0.0%) | 0 (0.0%) |
| 15 Years | 0 (0.0%) | 0 (0.0%) |
| 16 and 17 Years | 10 (55.6%) | 0 (0.0%) |
| 18 to 24 Years | 0 (0.0%) | 10 (12.7%) |
| 25 to 34 Years | 16 (17.4%) | 42 (67.7%) |
| 35 to 44 Years | 13 (7.0%) | 18 (22.0%) |
| 45 to 54 Years | 6 (6.0%) | 9 (10.3%) |
| 55 to 64 Years | 6 (5.7%) | 12 (12.0%) |
| 65 to 74 Years | 7 (7.5%) | 3 (4.5%) |
| 75 Years and over | 6 (24.0%) | 3 (7.9%) |
| Total | 102 (10.5%) | 106 (18.5%) |
Income Above Poverty by Sex and Age in Bear Creek
According to the poverty statistics in Bear Creek, males aged 5 years and females aged 6 to 11 years are the age groups that are most secure financially, with 100.0% of males and 100.0% of females in these age groups living above the poverty line.
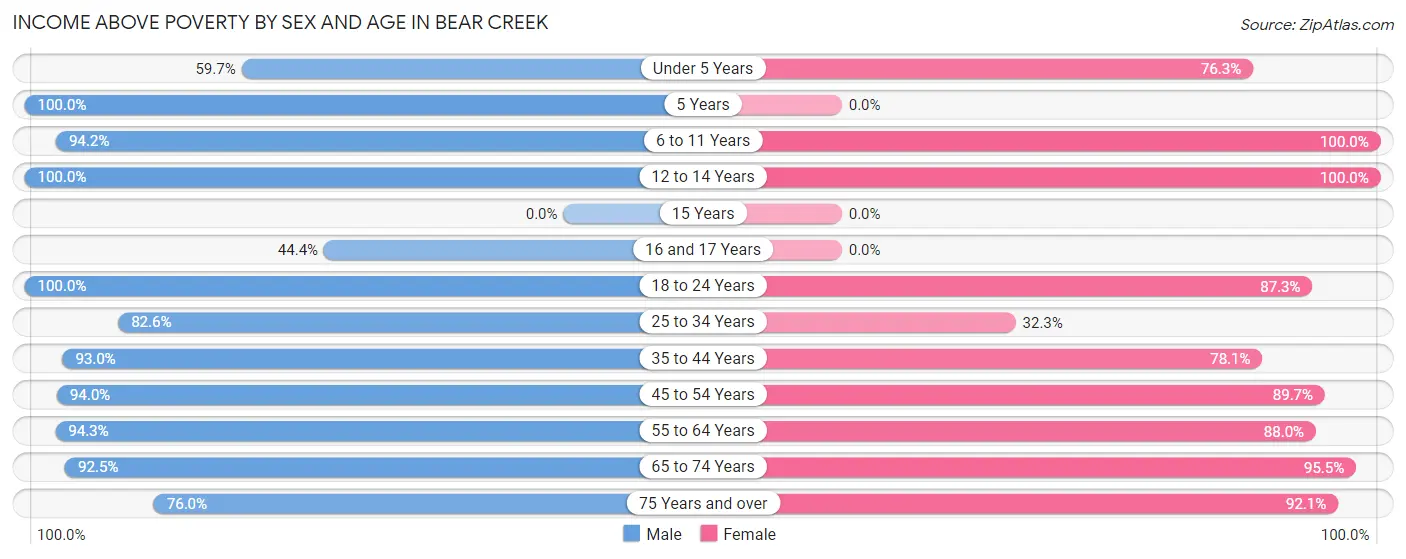
| Age Bracket | Male | Female |
| Under 5 Years | 46 (59.7%) | 29 (76.3%) |
| 5 Years | 9 (100.0%) | 0 (0.0%) |
| 6 to 11 Years | 113 (94.2%) | 8 (100.0%) |
| 12 to 14 Years | 44 (100.0%) | 12 (100.0%) |
| 15 Years | 0 (0.0%) | 0 (0.0%) |
| 16 and 17 Years | 8 (44.4%) | 0 (0.0%) |
| 18 to 24 Years | 106 (100.0%) | 69 (87.3%) |
| 25 to 34 Years | 76 (82.6%) | 20 (32.3%) |
| 35 to 44 Years | 172 (93.0%) | 64 (78.0%) |
| 45 to 54 Years | 94 (94.0%) | 78 (89.7%) |
| 55 to 64 Years | 99 (94.3%) | 88 (88.0%) |
| 65 to 74 Years | 86 (92.5%) | 63 (95.5%) |
| 75 Years and over | 19 (76.0%) | 35 (92.1%) |
| Total | 872 (89.5%) | 466 (81.5%) |
Income Below Poverty Among Married-Couple Families in Bear Creek
The poverty statistics for married-couple families in Bear Creek show that 5.5% or 14 of the total 253 families live below the poverty line. Families with no children have the highest poverty rate of 8.3%, comprising of 14 families. On the other hand, families with 1 or 2 children have the lowest poverty rate of 0.0%, which includes 0 families.
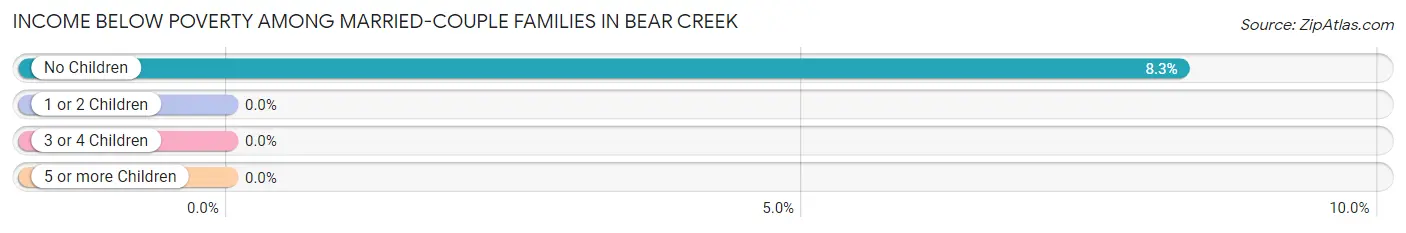
| Children | Above Poverty | Below Poverty |
| No Children | 155 (91.7%) | 14 (8.3%) |
| 1 or 2 Children | 62 (100.0%) | 0 (0.0%) |
| 3 or 4 Children | 22 (100.0%) | 0 (0.0%) |
| 5 or more Children | 0 (0.0%) | 0 (0.0%) |
| Total | 239 (94.5%) | 14 (5.5%) |
Income Below Poverty Among Single-Parent Households in Bear Creek
According to the poverty data in Bear Creek, 68.4% or 13 single-father households and 40.0% or 34 single-mother households are living below the poverty line. Among single-father households, those with 1 or 2 children have the highest poverty rate, with 13 households (100.0%) experiencing poverty. Likewise, among single-mother households, those with 1 or 2 children have the highest poverty rate, with 34 households (73.9%) falling below the poverty line.
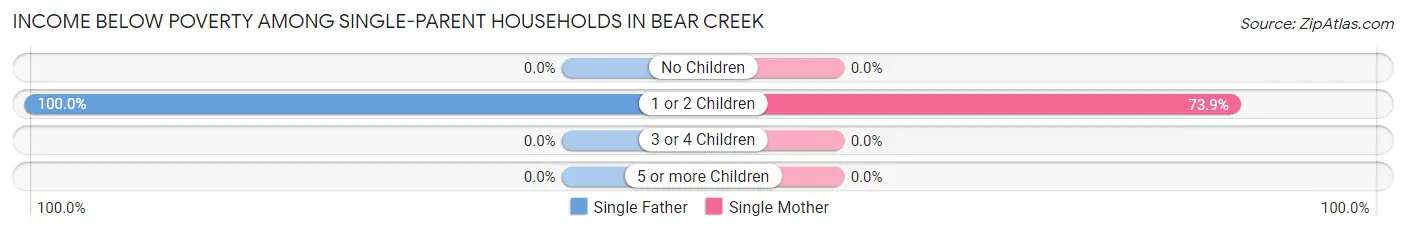
| Children | Single Father | Single Mother |
| No Children | 0 (0.0%) | 0 (0.0%) |
| 1 or 2 Children | 13 (100.0%) | 34 (73.9%) |
| 3 or 4 Children | 0 (0.0%) | 0 (0.0%) |
| 5 or more Children | 0 (0.0%) | 0 (0.0%) |
| Total | 13 (68.4%) | 34 (40.0%) |
Income Below Poverty Among Married-Couple vs Single-Parent Households in Bear Creek
The poverty data for Bear Creek shows that 14 of the married-couple family households (5.5%) and 47 of the single-parent households (45.2%) are living below the poverty level. Within the married-couple family households, those with no children have the highest poverty rate, with 14 households (8.3%) falling below the poverty line. Among the single-parent households, those with 1 or 2 children have the highest poverty rate, with 47 household (79.7%) living below poverty.
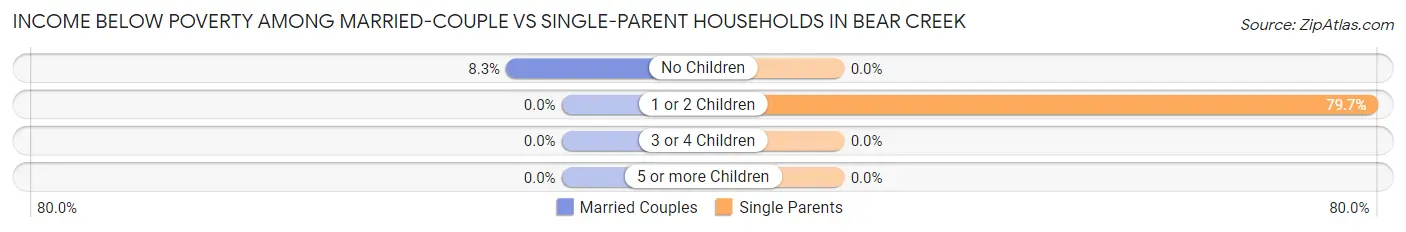
| Children | Married-Couple Families | Single-Parent Households |
| No Children | 14 (8.3%) | 0 (0.0%) |
| 1 or 2 Children | 0 (0.0%) | 47 (79.7%) |
| 3 or 4 Children | 0 (0.0%) | 0 (0.0%) |
| 5 or more Children | 0 (0.0%) | 0 (0.0%) |
| Total | 14 (5.5%) | 47 (45.2%) |
Race in Bear Creek
The most populous races in Bear Creek are White / Caucasian (1,405 | 90.7%), Hispanic or Latino (120 | 7.7%), and Some other Race (119 | 7.7%).
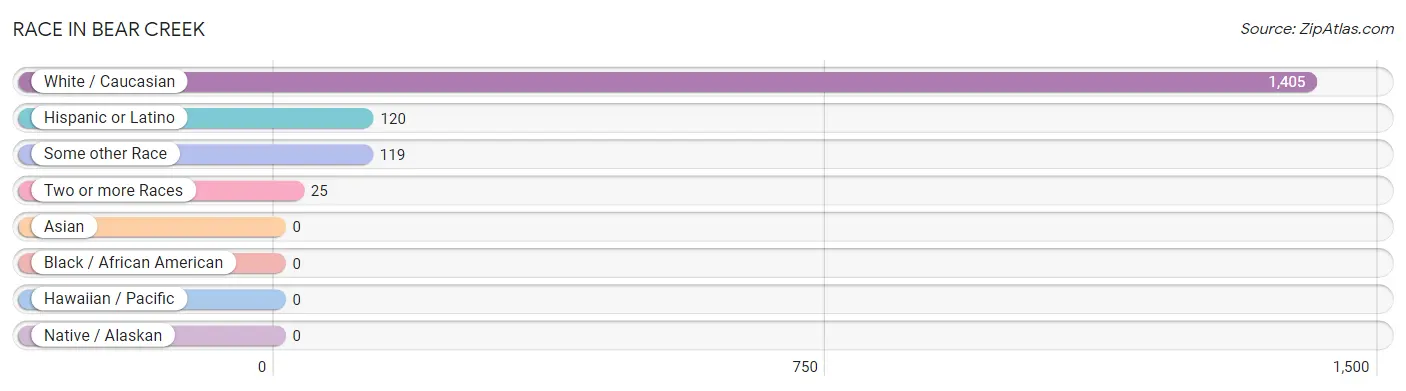
| Race | # Population | % Population |
| Asian | 0 | 0.0% |
| Black / African American | 0 | 0.0% |
| Hawaiian / Pacific | 0 | 0.0% |
| Hispanic or Latino | 120 | 7.7% |
| Native / Alaskan | 0 | 0.0% |
| White / Caucasian | 1,405 | 90.7% |
| Two or more Races | 25 | 1.6% |
| Some other Race | 119 | 7.7% |
| Total | 1,549 | 100.0% |
Ancestry in Bear Creek
The most populous ancestries reported in Bear Creek are English (309 | 20.0%), American (190 | 12.3%), French (138 | 8.9%), Mexican (119 | 7.7%), and German (98 | 6.3%), together accounting for 55.1% of all Bear Creek residents.
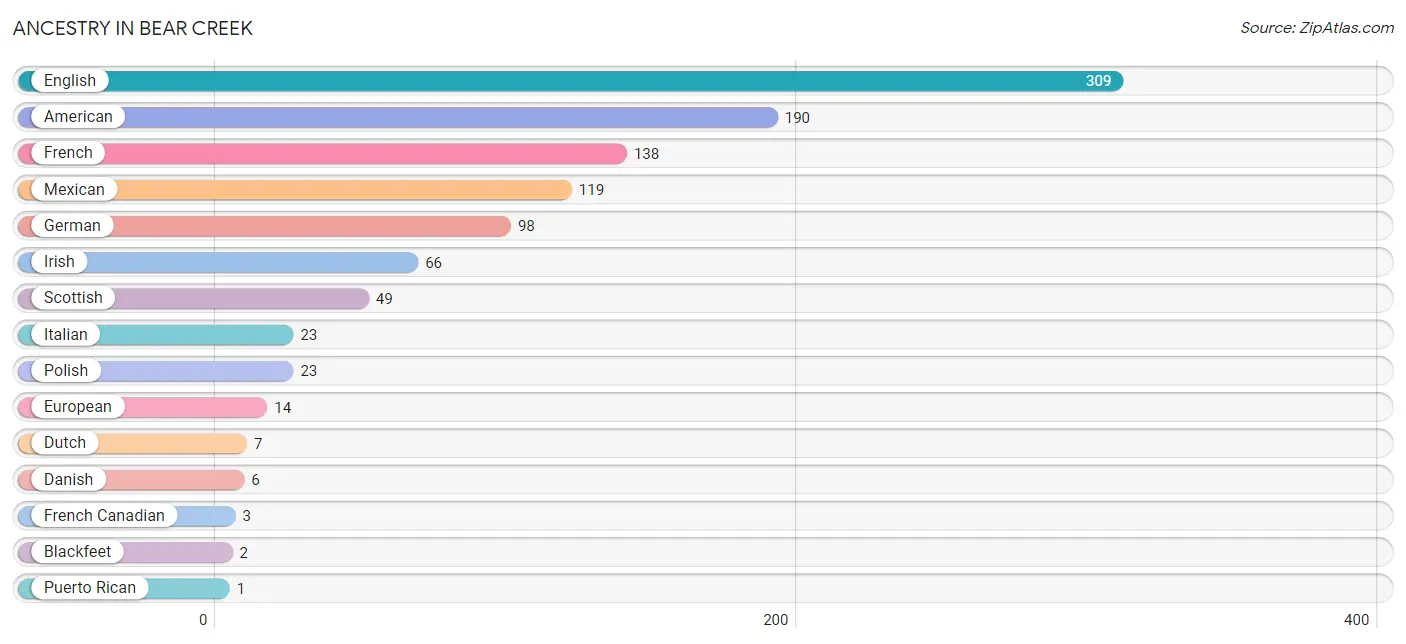
| Ancestry | # Population | % Population |
| American | 190 | 12.3% |
| Blackfeet | 2 | 0.1% |
| Danish | 6 | 0.4% |
| Dutch | 7 | 0.4% |
| English | 309 | 20.0% |
| European | 14 | 0.9% |
| French | 138 | 8.9% |
| French Canadian | 3 | 0.2% |
| German | 98 | 6.3% |
| Irish | 66 | 4.3% |
| Italian | 23 | 1.5% |
| Mexican | 119 | 7.7% |
| Polish | 23 | 1.5% |
| Puerto Rican | 1 | 0.1% |
| Scottish | 49 | 3.2% | View All 15 Rows |
Immigrants in Bear Creek
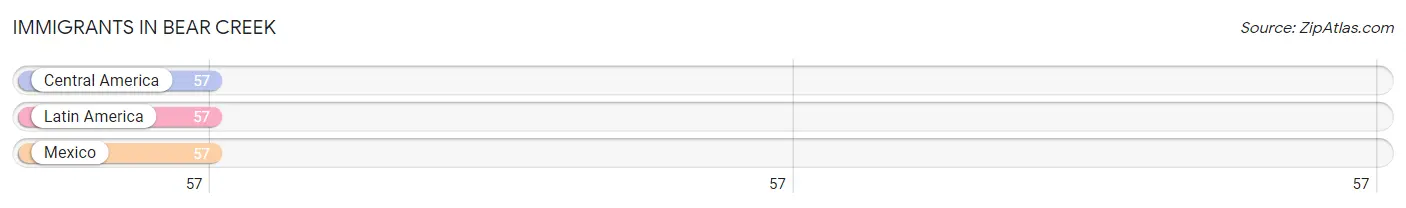
The most numerous immigrant groups reported in Bear Creek came from Central America (57 | 3.7%), Latin America (57 | 3.7%), and Mexico (57 | 3.7%), together accounting for 11.0% of all Bear Creek residents.
| Immigration Origin | # Population | % Population |
| Central America | 57 | 3.7% |
| Latin America | 57 | 3.7% |
| Mexico | 57 | 3.7% | View All 3 Rows |
Sex and Age in Bear Creek
Sex and Age in Bear Creek
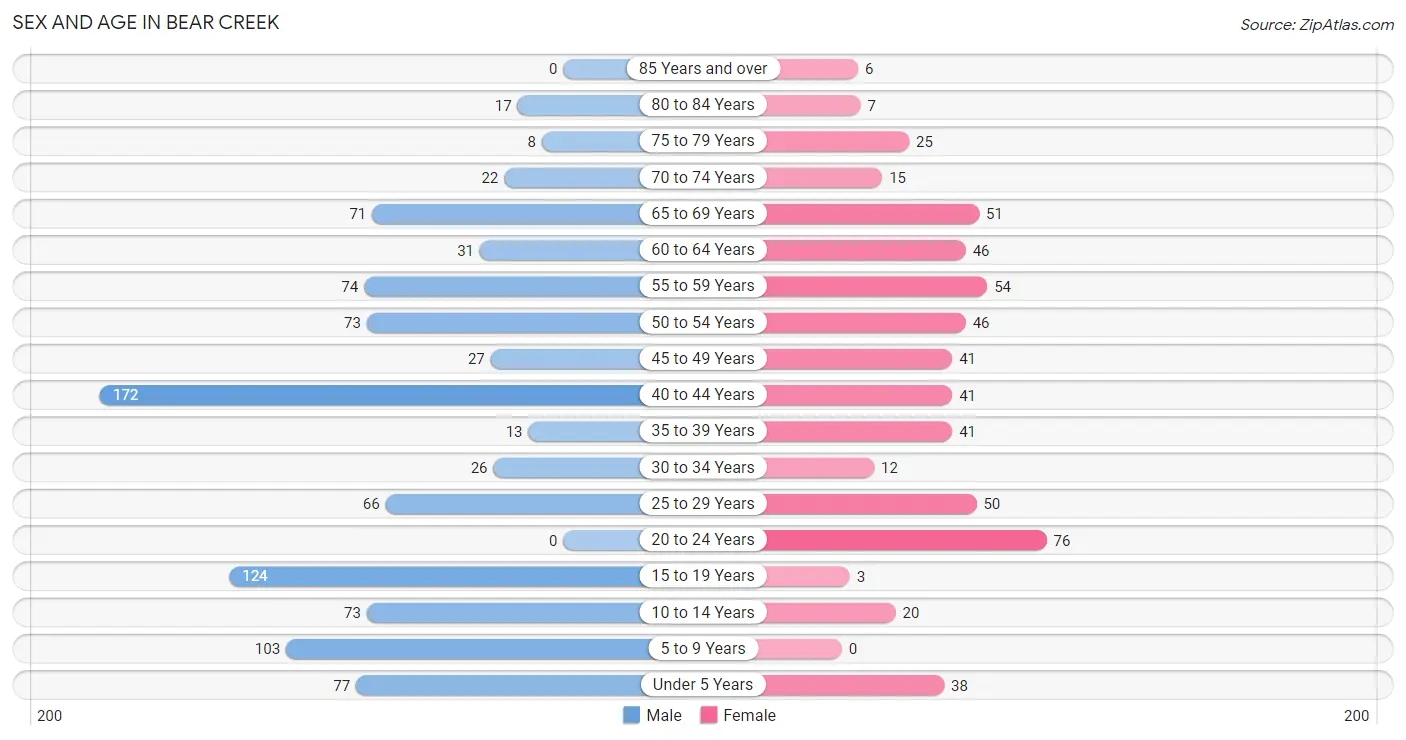
The most populous age groups in Bear Creek are 40 to 44 Years (172 | 17.6%) for men and 20 to 24 Years (76 | 13.3%) for women.
| Age Bracket | Male | Female |
| Under 5 Years | 77 (7.9%) | 38 (6.6%) |
| 5 to 9 Years | 103 (10.5%) | 0 (0.0%) |
| 10 to 14 Years | 73 (7.5%) | 20 (3.5%) |
| 15 to 19 Years | 124 (12.7%) | 3 (0.5%) |
| 20 to 24 Years | 0 (0.0%) | 76 (13.3%) |
| 25 to 29 Years | 66 (6.8%) | 50 (8.7%) |
| 30 to 34 Years | 26 (2.7%) | 12 (2.1%) |
| 35 to 39 Years | 13 (1.3%) | 41 (7.2%) |
| 40 to 44 Years | 172 (17.6%) | 41 (7.2%) |
| 45 to 49 Years | 27 (2.8%) | 41 (7.2%) |
| 50 to 54 Years | 73 (7.5%) | 46 (8.0%) |
| 55 to 59 Years | 74 (7.6%) | 54 (9.4%) |
| 60 to 64 Years | 31 (3.2%) | 46 (8.0%) |
| 65 to 69 Years | 71 (7.3%) | 51 (8.9%) |
| 70 to 74 Years | 22 (2.2%) | 15 (2.6%) |
| 75 to 79 Years | 8 (0.8%) | 25 (4.4%) |
| 80 to 84 Years | 17 (1.7%) | 7 (1.2%) |
| 85 Years and over | 0 (0.0%) | 6 (1.1%) |
| Total | 977 (100.0%) | 572 (100.0%) |
Families and Households in Bear Creek
Median Family Size in Bear Creek
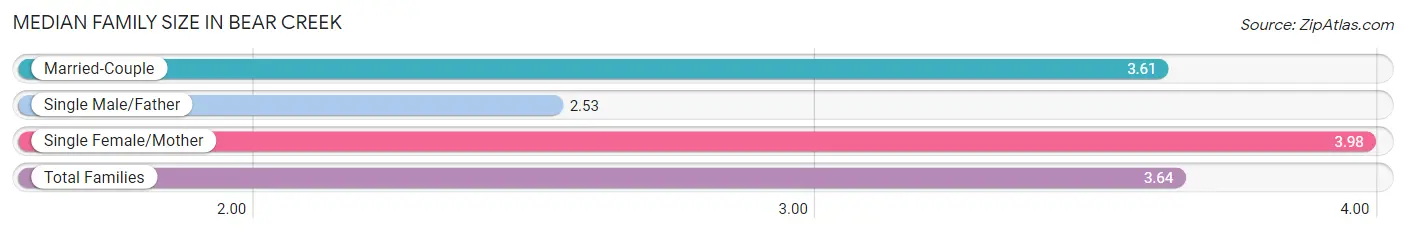
The median family size in Bear Creek is 3.64 persons per family, with single female/mother families (85 | 23.8%) accounting for the largest median family size of 3.98 persons per family. On the other hand, single male/father families (19 | 5.3%) represent the smallest median family size with 2.53 persons per family.
| Family Type | # Families | Family Size |
| Married-Couple | 253 (70.9%) | 3.61 |
| Single Male/Father | 19 (5.3%) | 2.53 |
| Single Female/Mother | 85 (23.8%) | 3.98 |
| Total Families | 357 (100.0%) | 3.64 |
Median Household Size in Bear Creek
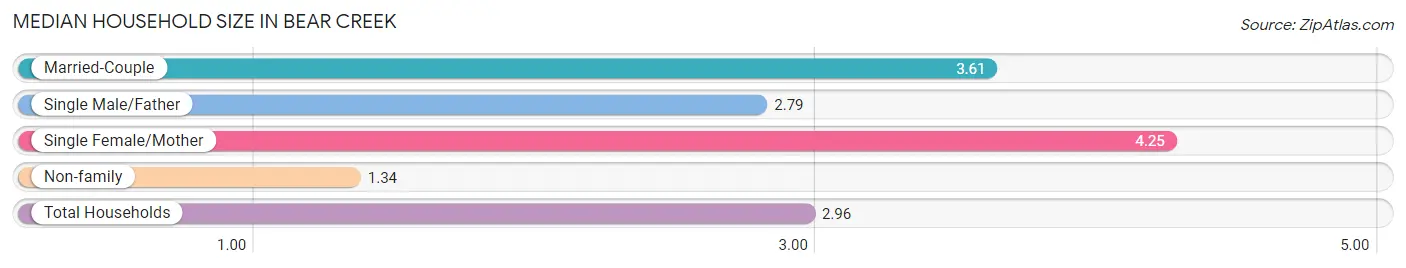
The median household size in Bear Creek is 2.96 persons per household, with single female/mother households (85 | 16.3%) accounting for the largest median household size of 4.25 persons per household. non-family households (166 | 31.7%) represent the smallest median household size with 1.34 persons per household.
| Household Type | # Households | Household Size |
| Married-Couple | 253 (48.4%) | 3.61 |
| Single Male/Father | 19 (3.6%) | 2.79 |
| Single Female/Mother | 85 (16.3%) | 4.25 |
| Non-family | 166 (31.7%) | 1.34 |
| Total Households | 523 (100.0%) | 2.96 |
Household Size by Marriage Status in Bear Creek
Out of a total of 523 households in Bear Creek, 357 (68.3%) are family households, while 166 (31.7%) are nonfamily households. The most numerous type of family households are 2-person households, comprising 156, and the most common type of nonfamily households are 1-person households, comprising 122.
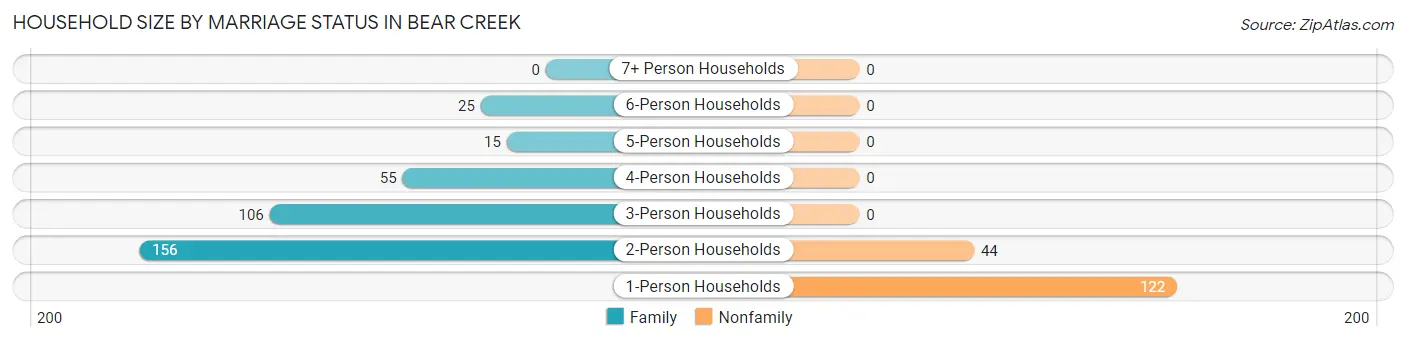
| Household Size | Family Households | Nonfamily Households |
| 1-Person Households | - | 122 (23.3%) |
| 2-Person Households | 156 (29.8%) | 44 (8.4%) |
| 3-Person Households | 106 (20.3%) | 0 (0.0%) |
| 4-Person Households | 55 (10.5%) | 0 (0.0%) |
| 5-Person Households | 15 (2.9%) | 0 (0.0%) |
| 6-Person Households | 25 (4.8%) | 0 (0.0%) |
| 7+ Person Households | 0 (0.0%) | 0 (0.0%) |
| Total | 357 (68.3%) | 166 (31.7%) |
Female Fertility in Bear Creek
Fertility by Age in Bear Creek
Average fertility rate in Bear Creek is 7.0 births per 1,000 women. Women in the age bracket of 35 to 50 years have the highest fertility rate with 15.0 births per 1,000 women. Women in the age bracket of 35 to 50 years acount for 100.0% of all women with births.
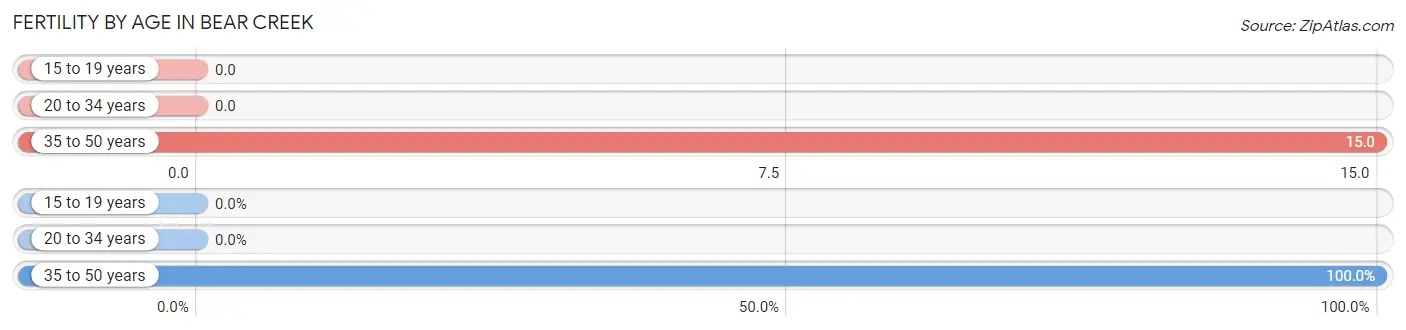
| Age Bracket | Women with Births | Births / 1,000 Women |
| 15 to 19 years | 0 (0.0%) | 0.0 |
| 20 to 34 years | 0 (0.0%) | 0.0 |
| 35 to 50 years | 2 (100.0%) | 15.0 |
| Total | 2 (100.0%) | 7.0 |
Fertility by Age by Marriage Status in Bear Creek
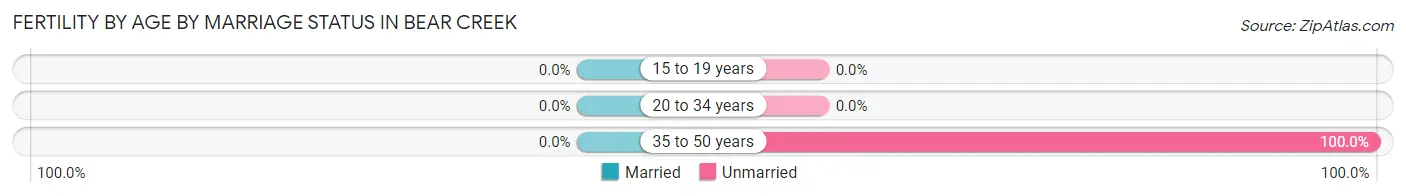
| Age Bracket | Married | Unmarried |
| 15 to 19 years | 0 (0.0%) | 0 (0.0%) |
| 20 to 34 years | 0 (0.0%) | 0 (0.0%) |
| 35 to 50 years | 0 (0.0%) | 2 (100.0%) |
| Total | 0 (0.0%) | 2 (100.0%) |
Fertility by Education in Bear Creek
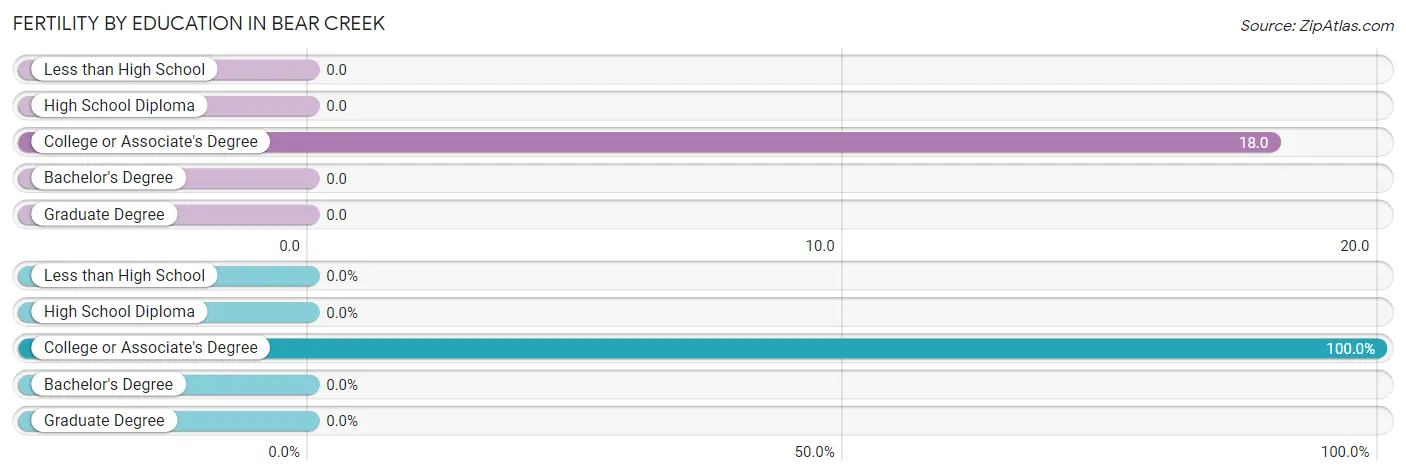
| Educational Attainment | Women with Births | Births / 1,000 Women |
| Less than High School | 0 (0.0%) | 0.0 |
| High School Diploma | 0 (0.0%) | 0.0 |
| College or Associate's Degree | 2 (100.0%) | 18.0 |
| Bachelor's Degree | 0 (0.0%) | 0.0 |
| Graduate Degree | 0 (0.0%) | 0.0 |
| Total | 2 (100.0%) | 7.0 |
Fertility by Education by Marriage Status in Bear Creek
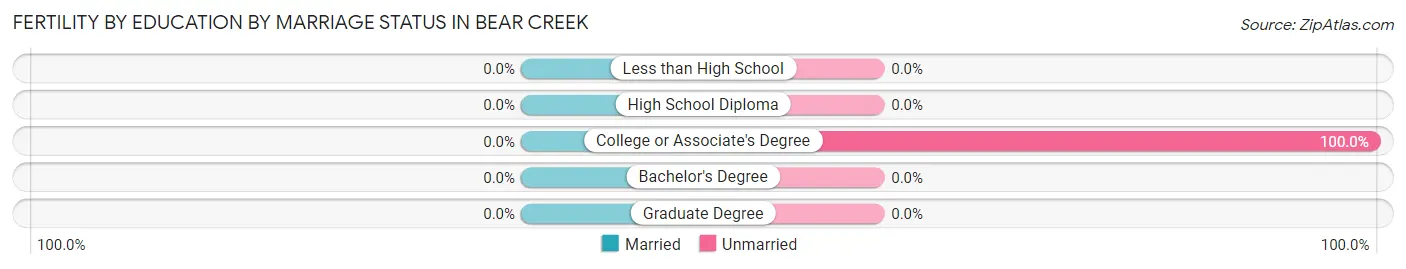
| Educational Attainment | Married | Unmarried |
| Less than High School | 0 (0.0%) | 0 (0.0%) |
| High School Diploma | 0 (0.0%) | 0 (0.0%) |
| College or Associate's Degree | 0 (0.0%) | 2 (100.0%) |
| Bachelor's Degree | 0 (0.0%) | 0 (0.0%) |
| Graduate Degree | 0 (0.0%) | 0 (0.0%) |
| Total | 0 (0.0%) | 2 (100.0%) |
Employment Characteristics in Bear Creek
Employment by Class of Employer in Bear Creek
Among the 517 employed individuals in Bear Creek, private company employees (340 | 65.8%), state government employees (54 | 10.4%), and self-employed (not incorporated) (39 | 7.5%) make up the most common classes of employment.
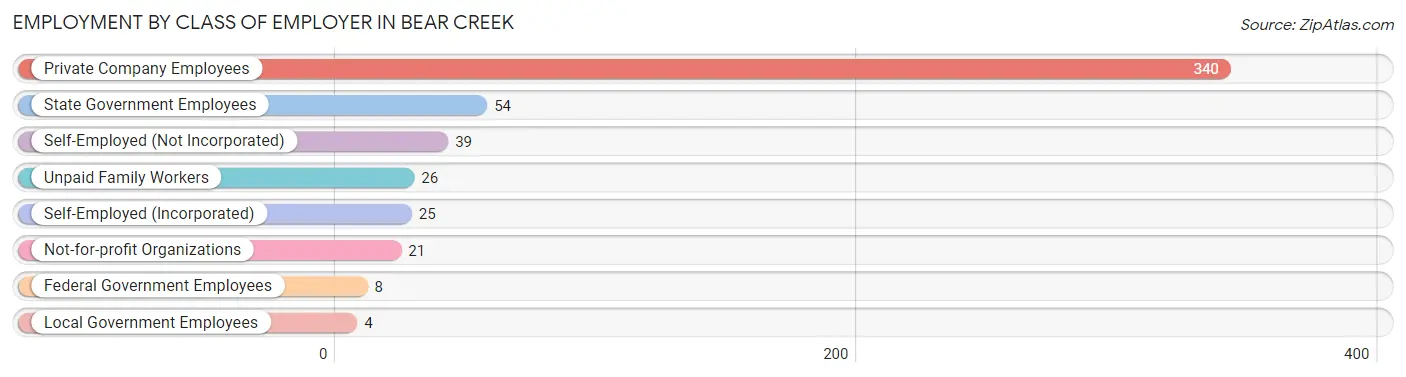
| Employer Class | # Employees | % Employees |
| Private Company Employees | 340 | 65.8% |
| Self-Employed (Incorporated) | 25 | 4.8% |
| Self-Employed (Not Incorporated) | 39 | 7.5% |
| Not-for-profit Organizations | 21 | 4.1% |
| Local Government Employees | 4 | 0.8% |
| State Government Employees | 54 | 10.4% |
| Federal Government Employees | 8 | 1.5% |
| Unpaid Family Workers | 26 | 5.0% |
| Total | 517 | 100.0% |
Employment Status by Age in Bear Creek
According to the labor force statistics for Bear Creek, out of the total population over 16 years of age (1,238), 49.6% or 614 individuals are in the labor force, with 13.0% or 80 of them unemployed. The age group with the highest labor force participation rate is 30 to 34 years, with 100.0% or 38 individuals in the labor force. Within the labor force, the 16 to 19 years age range has the highest percentage of unemployed individuals, with 35.5% or 27 of them being unemployed.
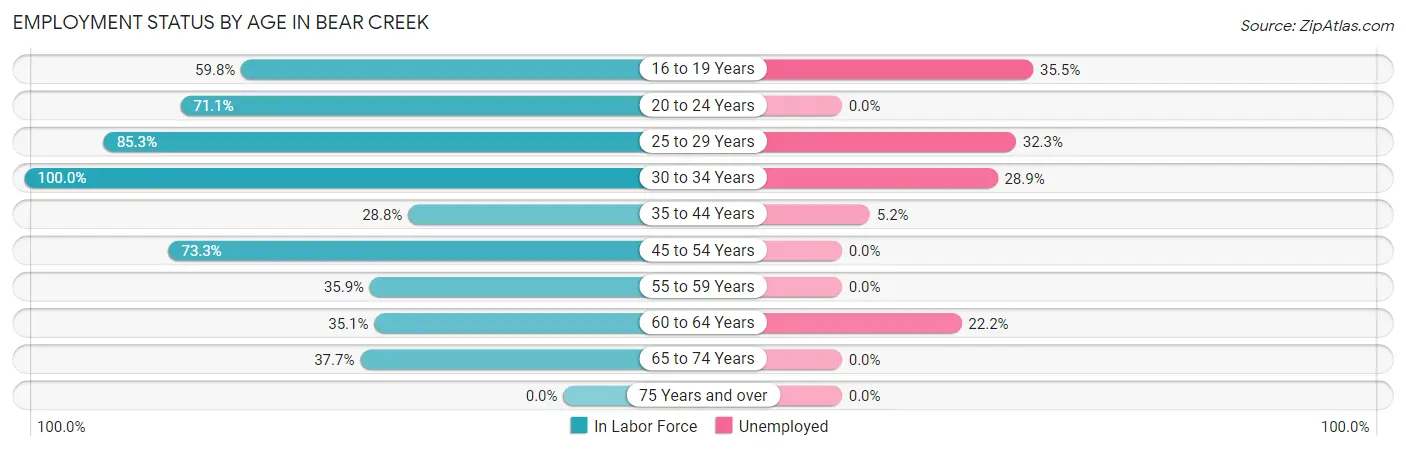
| Age Bracket | In Labor Force | Unemployed |
| 16 to 19 Years | 76 (59.8%) | 27 (35.5%) |
| 20 to 24 Years | 54 (71.1%) | 0 (0.0%) |
| 25 to 29 Years | 99 (85.3%) | 32 (32.3%) |
| 30 to 34 Years | 38 (100.0%) | 11 (28.9%) |
| 35 to 44 Years | 77 (28.8%) | 4 (5.2%) |
| 45 to 54 Years | 137 (73.3%) | 0 (0.0%) |
| 55 to 59 Years | 46 (35.9%) | 0 (0.0%) |
| 60 to 64 Years | 27 (35.1%) | 6 (22.2%) |
| 65 to 74 Years | 60 (37.7%) | 0 (0.0%) |
| 75 Years and over | 0 (0.0%) | 0 (0.0%) |
| Total | 614 (49.6%) | 80 (13.0%) |
Employment Status by Educational Attainment in Bear Creek
According to labor force statistics for Bear Creek, 52.2% of individuals (424) out of the total population between 25 and 64 years of age (813) are in the labor force, with 12.5% or 53 of them being unemployed. The group with the highest labor force participation rate are those with the educational attainment of college / associate degree, with 79.0% or 139 individuals in the labor force. Within the labor force, individuals with college / associate degree education have the highest percentage of unemployment, with 17.3% or 24 of them being unemployed.
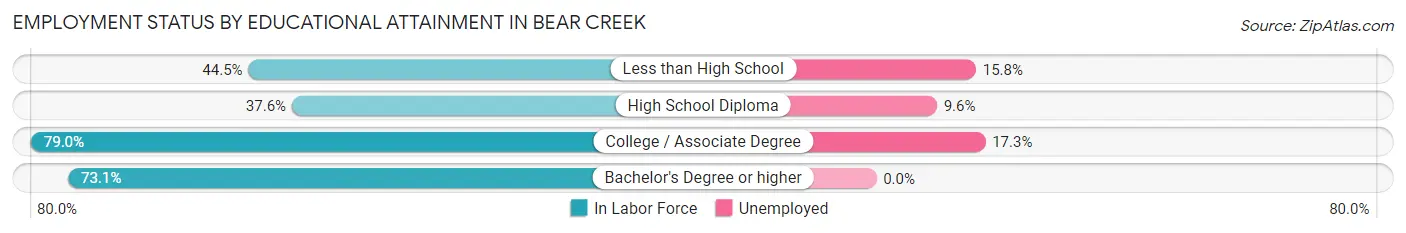
| Educational Attainment | In Labor Force | Unemployed |
| Less than High School | 114 (44.5%) | 40 (15.8%) |
| High School Diploma | 114 (37.6%) | 29 (9.6%) |
| College / Associate Degree | 139 (79.0%) | 30 (17.3%) |
| Bachelor's Degree or higher | 57 (73.1%) | 0 (0.0%) |
| Total | 424 (52.2%) | 102 (12.5%) |
Employment Occupations by Sex in Bear Creek
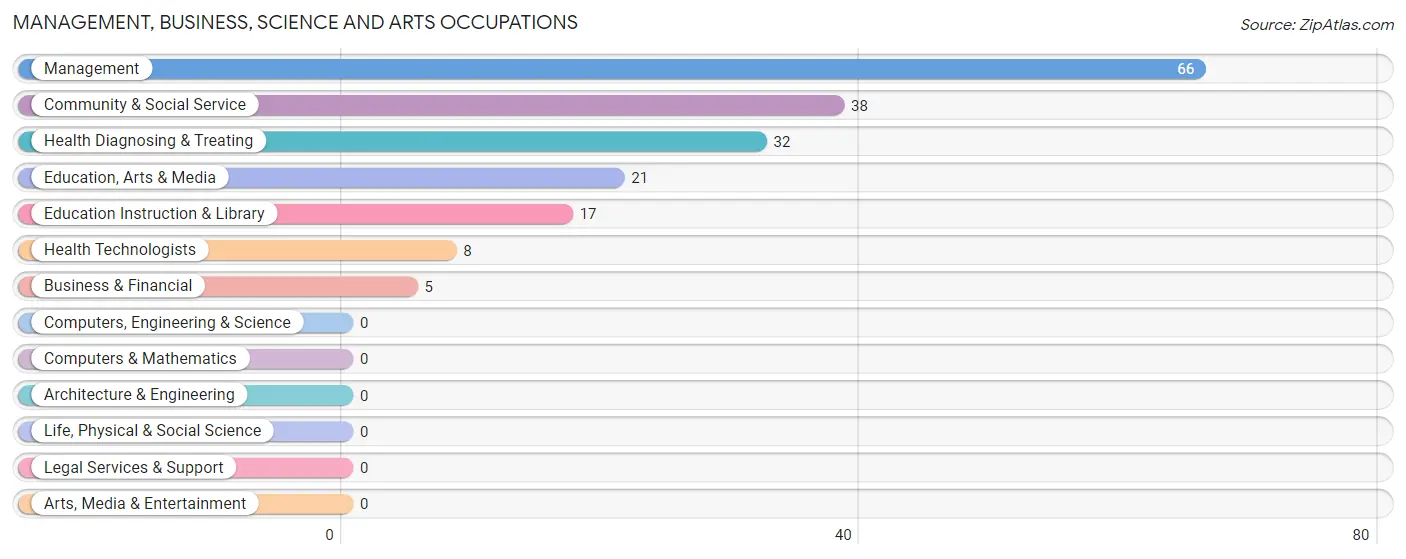
Management, Business, Science and Arts Occupations
The most common Management, Business, Science and Arts occupations in Bear Creek are Management (66 | 12.4%), Community & Social Service (38 | 7.1%), Health Diagnosing & Treating (32 | 6.0%), Education, Arts & Media (21 | 3.9%), and Education Instruction & Library (17 | 3.2%).
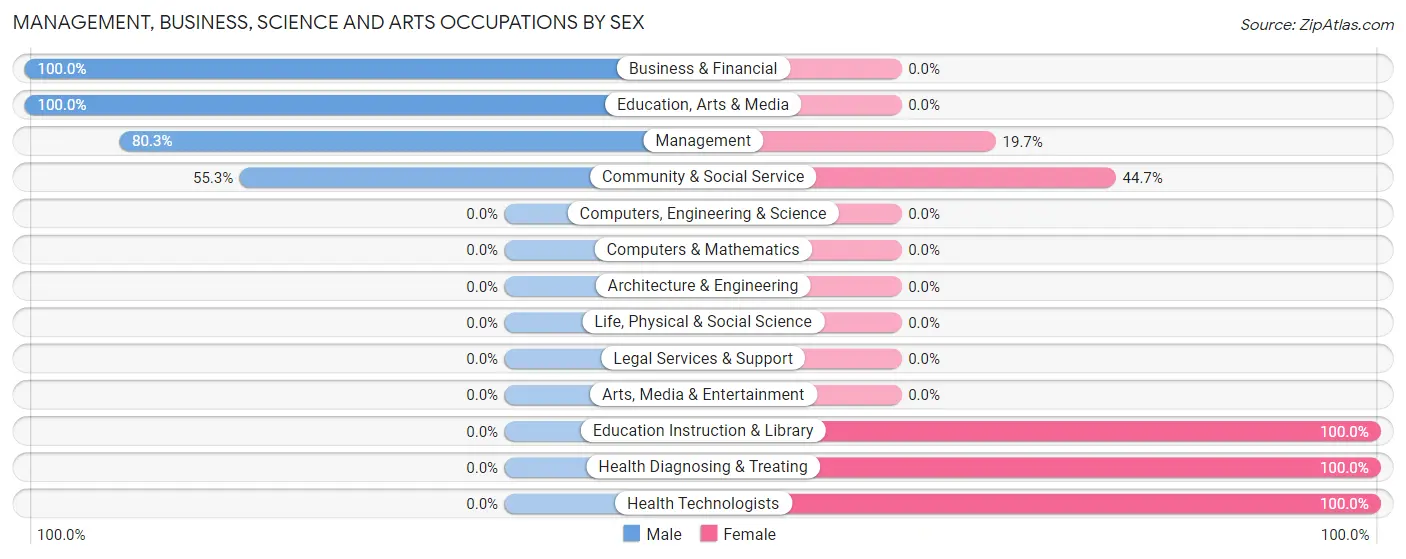
Management, Business, Science and Arts Occupations by Sex
Within the Management, Business, Science and Arts occupations in Bear Creek, the most male-oriented occupations are Business & Financial (100.0%), Education, Arts & Media (100.0%), and Management (80.3%), while the most female-oriented occupations are Education Instruction & Library (100.0%), Health Diagnosing & Treating (100.0%), and Health Technologists (100.0%).
| Occupation | Male | Female |
| Management | 53 (80.3%) | 13 (19.7%) |
| Business & Financial | 5 (100.0%) | 0 (0.0%) |
| Computers, Engineering & Science | 0 (0.0%) | 0 (0.0%) |
| Computers & Mathematics | 0 (0.0%) | 0 (0.0%) |
| Architecture & Engineering | 0 (0.0%) | 0 (0.0%) |
| Life, Physical & Social Science | 0 (0.0%) | 0 (0.0%) |
| Community & Social Service | 21 (55.3%) | 17 (44.7%) |
| Education, Arts & Media | 21 (100.0%) | 0 (0.0%) |
| Legal Services & Support | 0 (0.0%) | 0 (0.0%) |
| Education Instruction & Library | 0 (0.0%) | 17 (100.0%) |
| Arts, Media & Entertainment | 0 (0.0%) | 0 (0.0%) |
| Health Diagnosing & Treating | 0 (0.0%) | 32 (100.0%) |
| Health Technologists | 0 (0.0%) | 8 (100.0%) |
| Total (Category) | 79 (56.0%) | 62 (44.0%) |
| Total (Overall) | 316 (59.2%) | 218 (40.8%) |
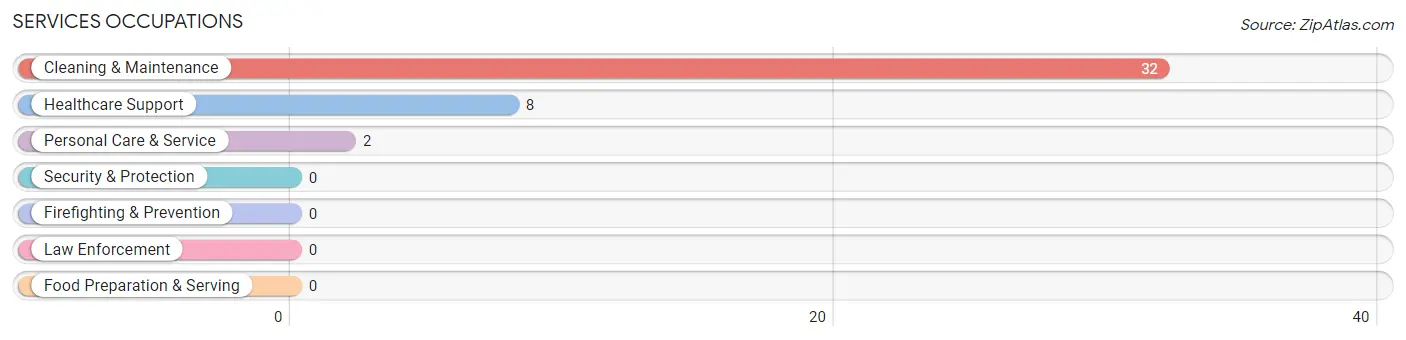
Services Occupations
The most common Services occupations in Bear Creek are Cleaning & Maintenance (32 | 6.0%), Healthcare Support (8 | 1.5%), and Personal Care & Service (2 | 0.4%).
Services Occupations by Sex
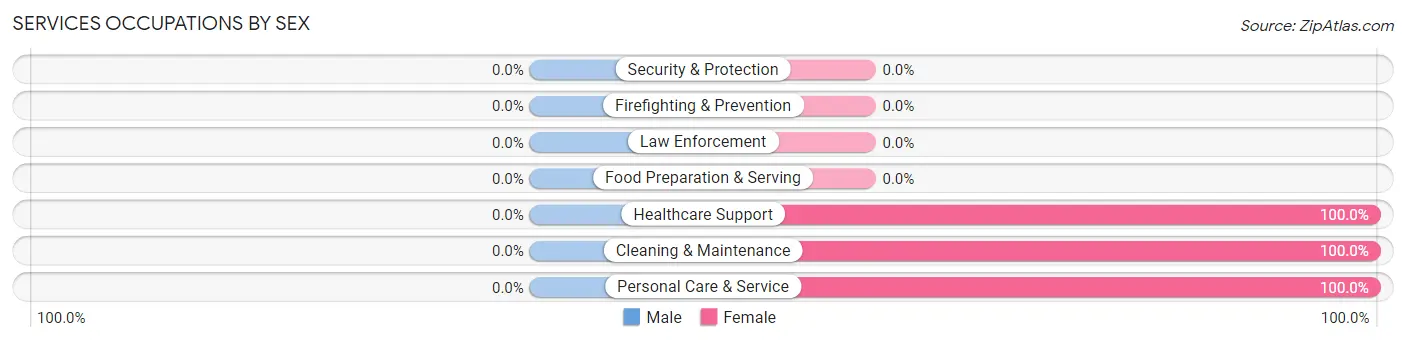
| Occupation | Male | Female |
| Healthcare Support | 0 (0.0%) | 8 (100.0%) |
| Security & Protection | 0 (0.0%) | 0 (0.0%) |
| Firefighting & Prevention | 0 (0.0%) | 0 (0.0%) |
| Law Enforcement | 0 (0.0%) | 0 (0.0%) |
| Food Preparation & Serving | 0 (0.0%) | 0 (0.0%) |
| Cleaning & Maintenance | 0 (0.0%) | 32 (100.0%) |
| Personal Care & Service | 0 (0.0%) | 2 (100.0%) |
| Total (Category) | 0 (0.0%) | 42 (100.0%) |
| Total (Overall) | 316 (59.2%) | 218 (40.8%) |
Sales and Office Occupations
The most common Sales and Office occupations in Bear Creek are Sales & Related (21 | 3.9%), and Office & Administration (18 | 3.4%).
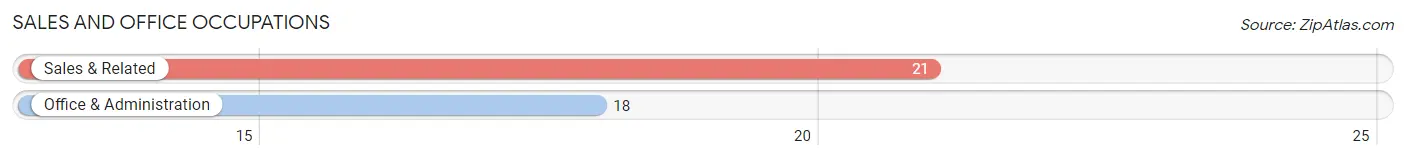
Sales and Office Occupations by Sex
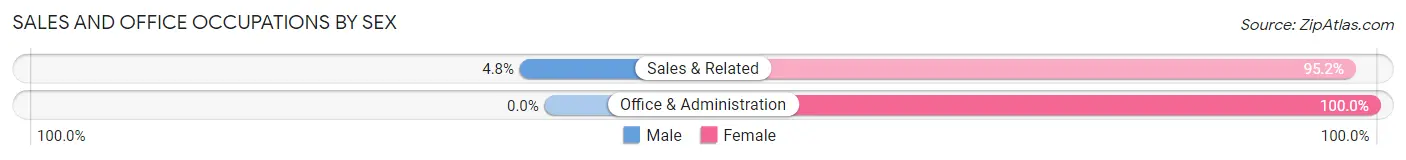
| Occupation | Male | Female |
| Sales & Related | 1 (4.8%) | 20 (95.2%) |
| Office & Administration | 0 (0.0%) | 18 (100.0%) |
| Total (Category) | 1 (2.6%) | 38 (97.4%) |
| Total (Overall) | 316 (59.2%) | 218 (40.8%) |
Natural Resources, Construction and Maintenance Occupations
The most common Natural Resources, Construction and Maintenance occupations in Bear Creek are Construction & Extraction (53 | 9.9%), and Installation, Maintenance & Repair (24 | 4.5%).
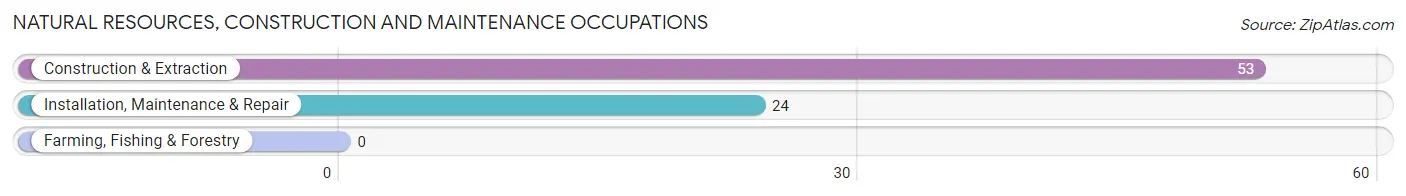
Natural Resources, Construction and Maintenance Occupations by Sex
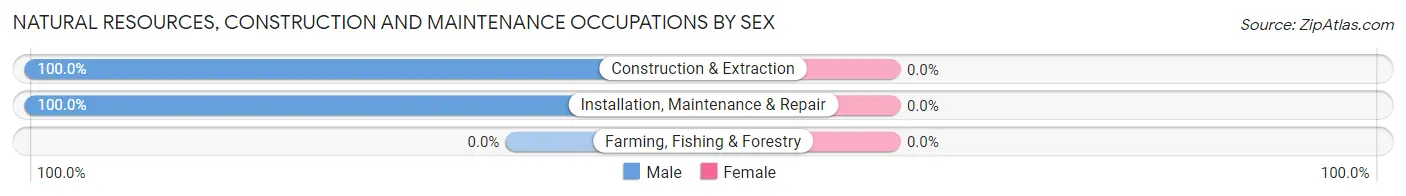
| Occupation | Male | Female |
| Farming, Fishing & Forestry | 0 (0.0%) | 0 (0.0%) |
| Construction & Extraction | 53 (100.0%) | 0 (0.0%) |
| Installation, Maintenance & Repair | 24 (100.0%) | 0 (0.0%) |
| Total (Category) | 77 (100.0%) | 0 (0.0%) |
| Total (Overall) | 316 (59.2%) | 218 (40.8%) |
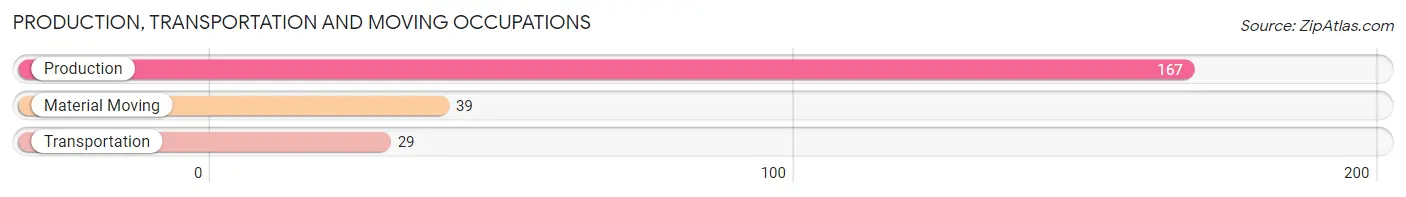
Production, Transportation and Moving Occupations
The most common Production, Transportation and Moving occupations in Bear Creek are Production (167 | 31.3%), Material Moving (39 | 7.3%), and Transportation (29 | 5.4%).
Production, Transportation and Moving Occupations by Sex
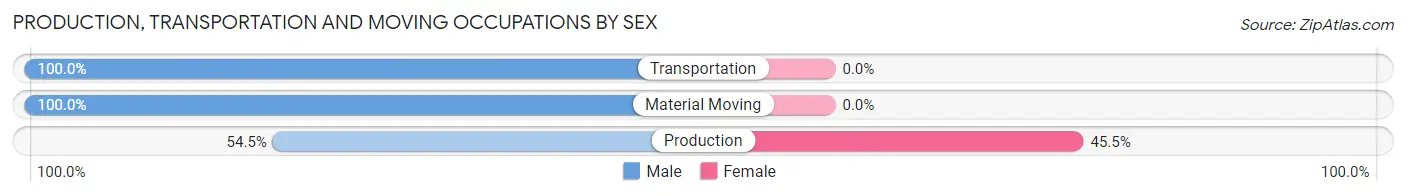
| Occupation | Male | Female |
| Production | 91 (54.5%) | 76 (45.5%) |
| Transportation | 29 (100.0%) | 0 (0.0%) |
| Material Moving | 39 (100.0%) | 0 (0.0%) |
| Total (Category) | 159 (67.7%) | 76 (32.3%) |
| Total (Overall) | 316 (59.2%) | 218 (40.8%) |
Employment Industries by Sex in Bear Creek
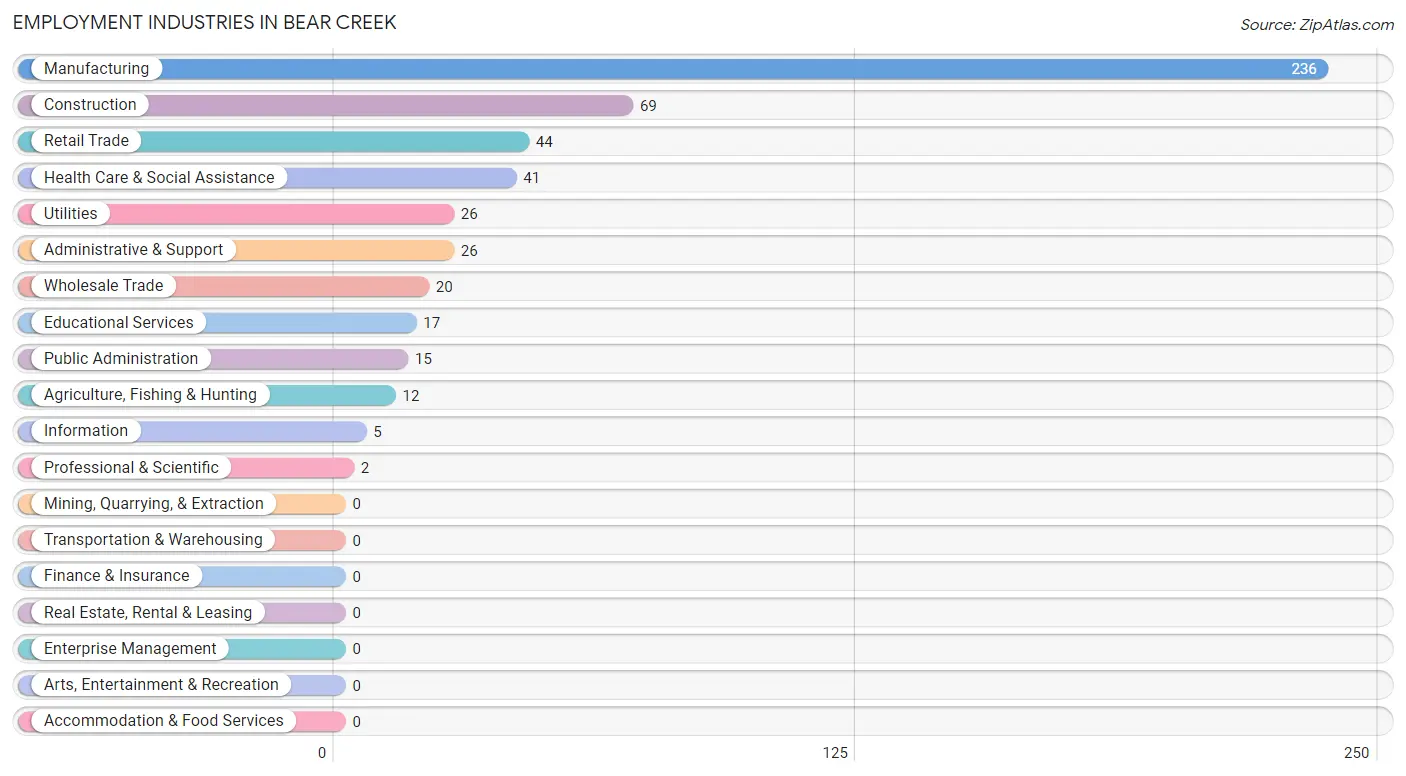
Employment Industries in Bear Creek
The major employment industries in Bear Creek include Manufacturing (236 | 44.2%), Construction (69 | 12.9%), Retail Trade (44 | 8.2%), Health Care & Social Assistance (41 | 7.7%), and Utilities (26 | 4.9%).
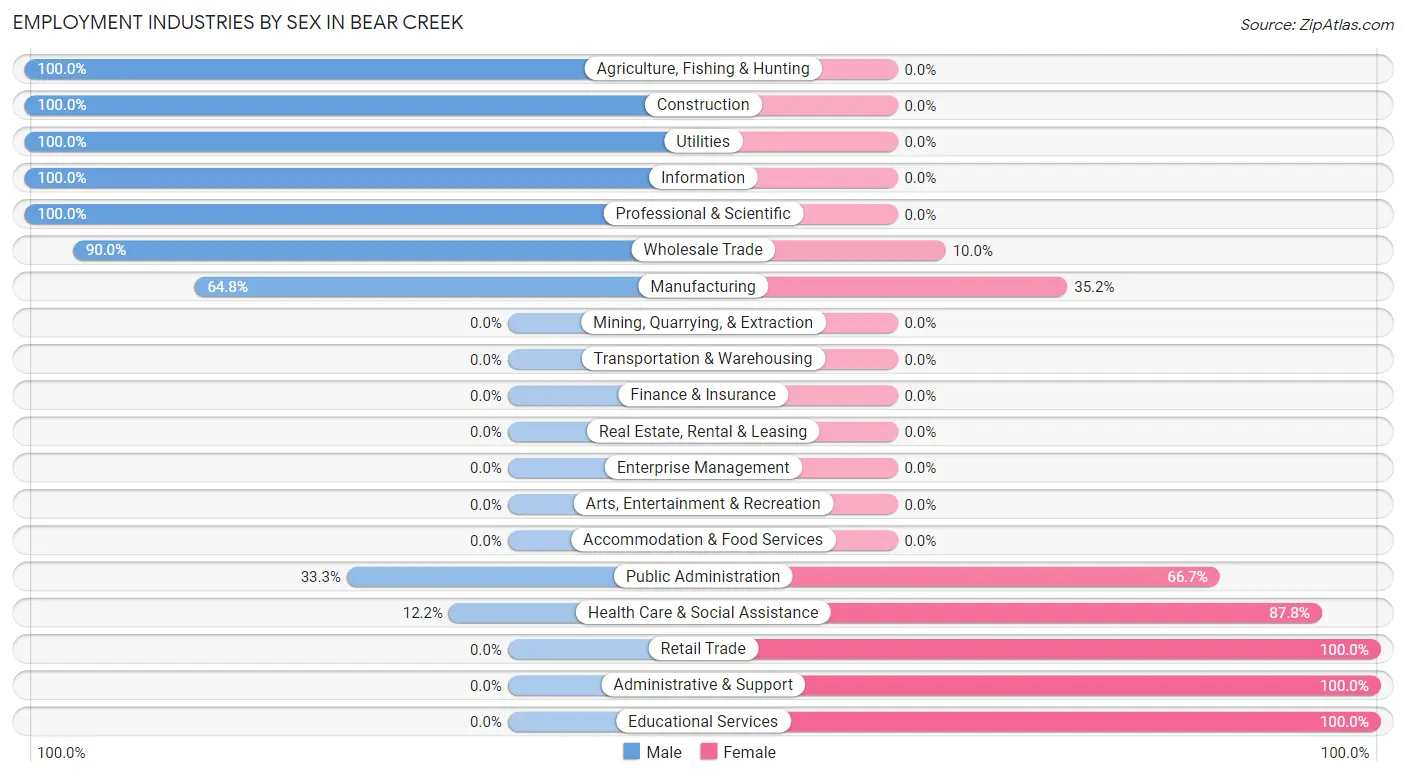
Employment Industries by Sex in Bear Creek
The Bear Creek industries that see more men than women are Agriculture, Fishing & Hunting (100.0%), Construction (100.0%), and Utilities (100.0%), whereas the industries that tend to have a higher number of women are Retail Trade (100.0%), Administrative & Support (100.0%), and Educational Services (100.0%).
| Industry | Male | Female |
| Agriculture, Fishing & Hunting | 12 (100.0%) | 0 (0.0%) |
| Mining, Quarrying, & Extraction | 0 (0.0%) | 0 (0.0%) |
| Construction | 69 (100.0%) | 0 (0.0%) |
| Manufacturing | 153 (64.8%) | 83 (35.2%) |
| Wholesale Trade | 18 (90.0%) | 2 (10.0%) |
| Retail Trade | 0 (0.0%) | 44 (100.0%) |
| Transportation & Warehousing | 0 (0.0%) | 0 (0.0%) |
| Utilities | 26 (100.0%) | 0 (0.0%) |
| Information | 5 (100.0%) | 0 (0.0%) |
| Finance & Insurance | 0 (0.0%) | 0 (0.0%) |
| Real Estate, Rental & Leasing | 0 (0.0%) | 0 (0.0%) |
| Professional & Scientific | 2 (100.0%) | 0 (0.0%) |
| Enterprise Management | 0 (0.0%) | 0 (0.0%) |
| Administrative & Support | 0 (0.0%) | 26 (100.0%) |
| Educational Services | 0 (0.0%) | 17 (100.0%) |
| Health Care & Social Assistance | 5 (12.2%) | 36 (87.8%) |
| Arts, Entertainment & Recreation | 0 (0.0%) | 0 (0.0%) |
| Accommodation & Food Services | 0 (0.0%) | 0 (0.0%) |
| Public Administration | 5 (33.3%) | 10 (66.7%) |
| Total | 316 (59.2%) | 218 (40.8%) |
Education in Bear Creek
School Enrollment in Bear Creek
The most common levels of schooling among the 242 students in Bear Creek are elementary school (107 | 44.2%), middle school (52 | 21.5%), and nursery / preschool (49 | 20.3%).
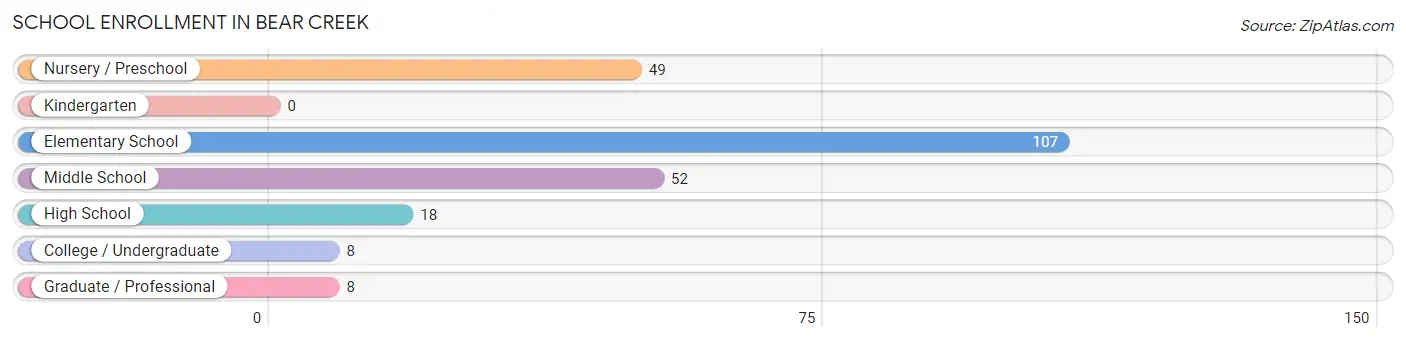
| School Level | # Students | % Students |
| Nursery / Preschool | 49 | 20.3% |
| Kindergarten | 0 | 0.0% |
| Elementary School | 107 | 44.2% |
| Middle School | 52 | 21.5% |
| High School | 18 | 7.4% |
| College / Undergraduate | 8 | 3.3% |
| Graduate / Professional | 8 | 3.3% |
| Total | 242 | 100.0% |
School Enrollment by Age by Funding Source in Bear Creek
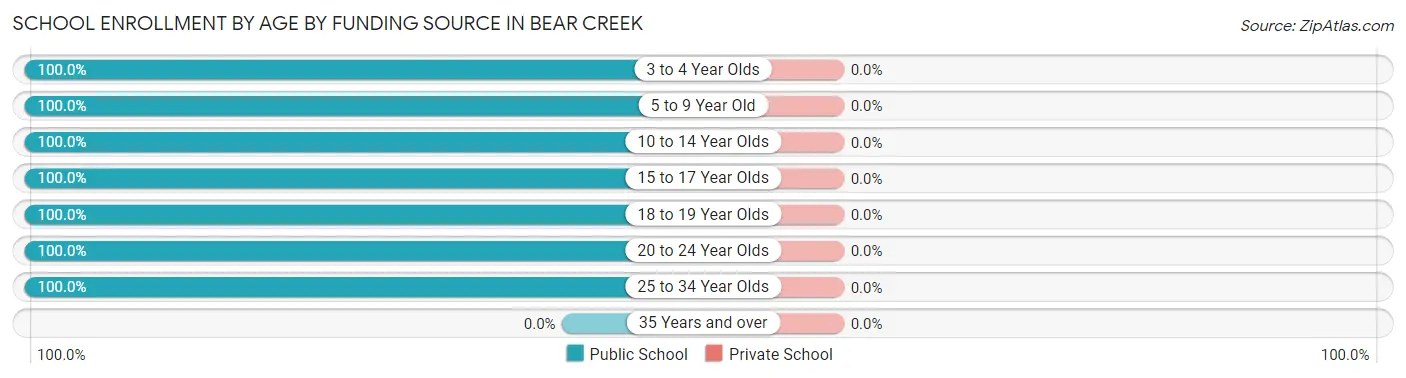
| Age Bracket | Public School | Private School |
| 3 to 4 Year Olds | 49 (100.0%) | 0 (0.0%) |
| 5 to 9 Year Old | 94 (100.0%) | 0 (0.0%) |
| 10 to 14 Year Olds | 65 (100.0%) | 0 (0.0%) |
| 15 to 17 Year Olds | 18 (100.0%) | 0 (0.0%) |
| 18 to 19 Year Olds | 3 (100.0%) | 0 (0.0%) |
| 20 to 24 Year Olds | 5 (100.0%) | 0 (0.0%) |
| 25 to 34 Year Olds | 8 (100.0%) | 0 (0.0%) |
| 35 Years and over | 0 (0.0%) | 0 (0.0%) |
| Total | 242 (100.0%) | 0 (0.0%) |
Educational Attainment by Field of Study in Bear Creek
Business (35 | 34.3%), education (35 | 34.3%), liberal arts & history (13 | 12.8%), engineering (11 | 10.8%), and literature & languages (4 | 3.9%) are the most common fields of study among 102 individuals in Bear Creek who have obtained a bachelor's degree or higher.
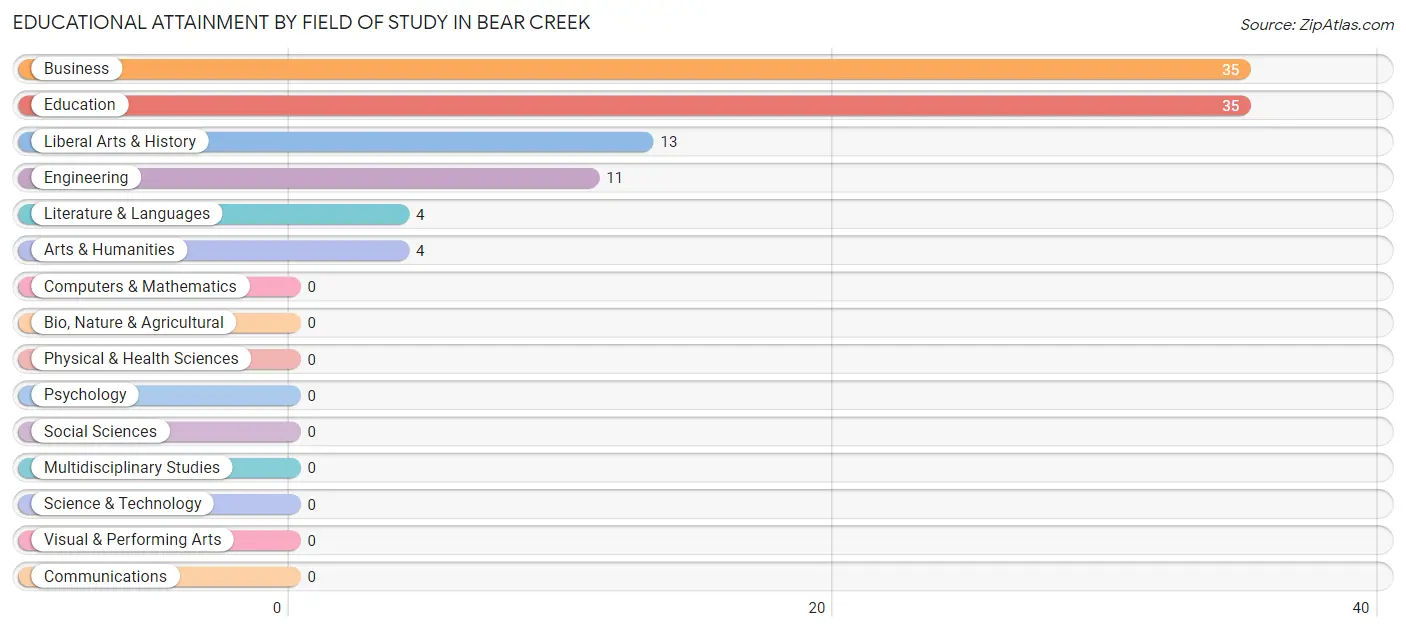
| Field of Study | # Graduates | % Graduates |
| Computers & Mathematics | 0 | 0.0% |
| Bio, Nature & Agricultural | 0 | 0.0% |
| Physical & Health Sciences | 0 | 0.0% |
| Psychology | 0 | 0.0% |
| Social Sciences | 0 | 0.0% |
| Engineering | 11 | 10.8% |
| Multidisciplinary Studies | 0 | 0.0% |
| Science & Technology | 0 | 0.0% |
| Business | 35 | 34.3% |
| Education | 35 | 34.3% |
| Literature & Languages | 4 | 3.9% |
| Liberal Arts & History | 13 | 12.8% |
| Visual & Performing Arts | 0 | 0.0% |
| Communications | 0 | 0.0% |
| Arts & Humanities | 4 | 3.9% |
| Total | 102 | 100.0% |
Transportation & Commute in Bear Creek
Vehicle Availability by Sex in Bear Creek
The most prevalent vehicle ownership categories in Bear Creek are males with 3 vehicles (143, accounting for 47.8%) and females with 3 vehicles (90, making up 65.6%).
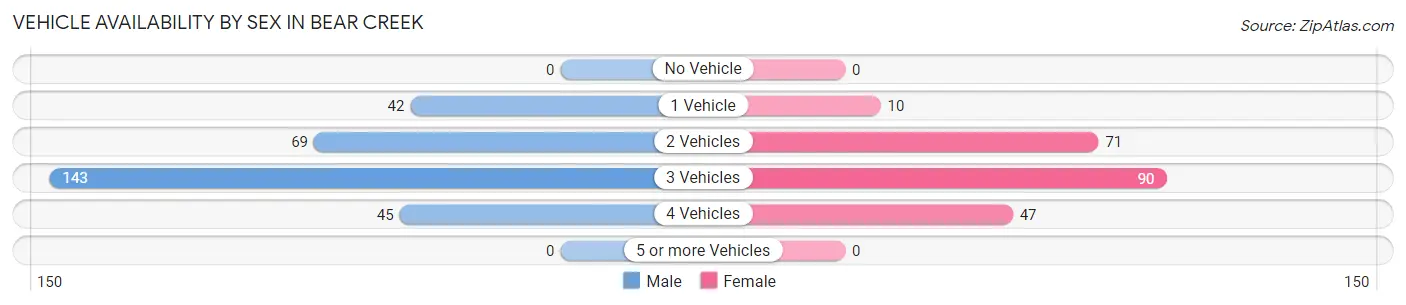
| Vehicles Available | Male | Female |
| No Vehicle | 0 (0.0%) | 0 (0.0%) |
| 1 Vehicle | 42 (14.1%) | 10 (4.6%) |
| 2 Vehicles | 69 (23.1%) | 71 (32.6%) |
| 3 Vehicles | 143 (47.8%) | 90 (41.3%) |
| 4 Vehicles | 45 (15.0%) | 47 (21.6%) |
| 5 or more Vehicles | 0 (0.0%) | 0 (0.0%) |
| Total | 299 (100.0%) | 218 (100.0%) |
Commute Time in Bear Creek
The most frequently occuring commute durations in Bear Creek are 15 to 19 minutes (114 commuters, 22.8%), 5 to 9 minutes (105 commuters, 21.0%), and 10 to 14 minutes (98 commuters, 19.6%).
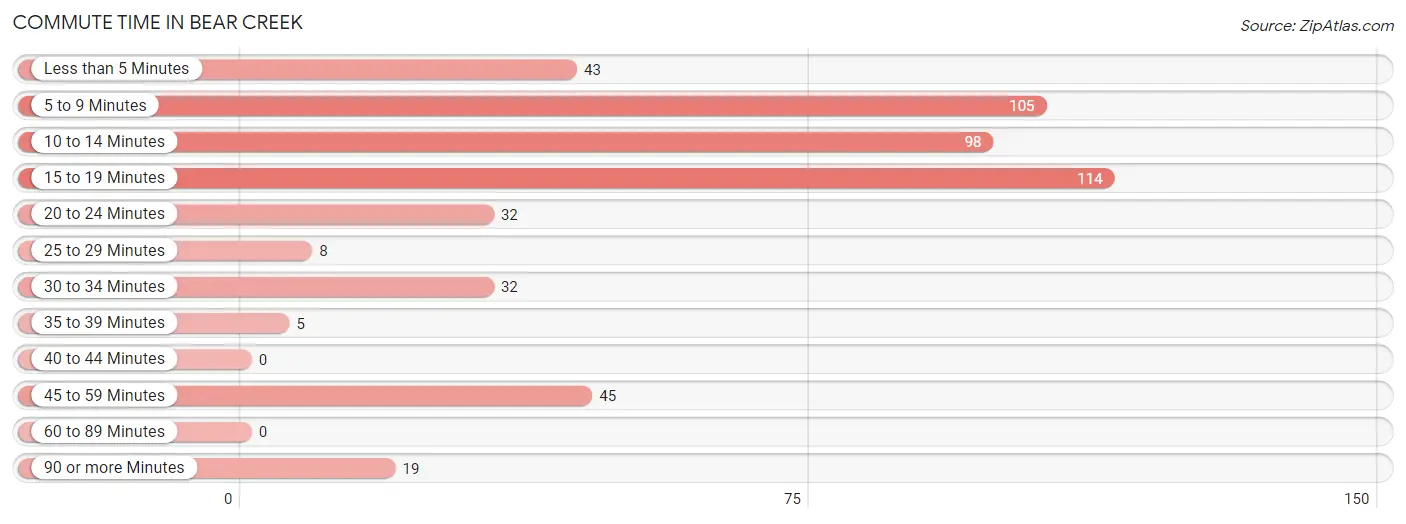
| Commute Time | # Commuters | % Commuters |
| Less than 5 Minutes | 43 | 8.6% |
| 5 to 9 Minutes | 105 | 21.0% |
| 10 to 14 Minutes | 98 | 19.6% |
| 15 to 19 Minutes | 114 | 22.8% |
| 20 to 24 Minutes | 32 | 6.4% |
| 25 to 29 Minutes | 8 | 1.6% |
| 30 to 34 Minutes | 32 | 6.4% |
| 35 to 39 Minutes | 5 | 1.0% |
| 40 to 44 Minutes | 0 | 0.0% |
| 45 to 59 Minutes | 45 | 9.0% |
| 60 to 89 Minutes | 0 | 0.0% |
| 90 or more Minutes | 19 | 3.8% |
Commute Time by Sex in Bear Creek
The most common commute times in Bear Creek are 5 to 9 minutes (65 commuters, 21.7%) for males and 15 to 19 minutes (63 commuters, 31.2%) for females.
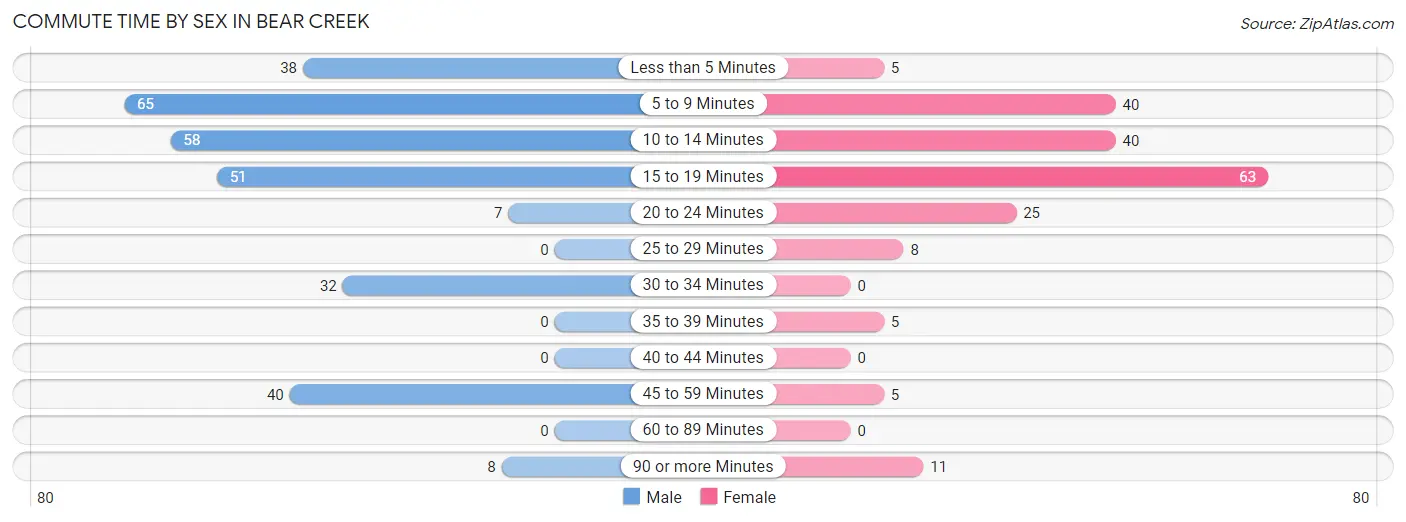
| Commute Time | Male | Female |
| Less than 5 Minutes | 38 (12.7%) | 5 (2.5%) |
| 5 to 9 Minutes | 65 (21.7%) | 40 (19.8%) |
| 10 to 14 Minutes | 58 (19.4%) | 40 (19.8%) |
| 15 to 19 Minutes | 51 (17.1%) | 63 (31.2%) |
| 20 to 24 Minutes | 7 (2.3%) | 25 (12.4%) |
| 25 to 29 Minutes | 0 (0.0%) | 8 (4.0%) |
| 30 to 34 Minutes | 32 (10.7%) | 0 (0.0%) |
| 35 to 39 Minutes | 0 (0.0%) | 5 (2.5%) |
| 40 to 44 Minutes | 0 (0.0%) | 0 (0.0%) |
| 45 to 59 Minutes | 40 (13.4%) | 5 (2.5%) |
| 60 to 89 Minutes | 0 (0.0%) | 0 (0.0%) |
| 90 or more Minutes | 8 (2.7%) | 11 (5.4%) |
Time of Departure to Work by Sex in Bear Creek
The most frequent times of departure to work in Bear Creek are 5:30 AM to 5:59 AM (105, 35.1%) for males and 6:30 AM to 6:59 AM (65, 32.2%) for females.
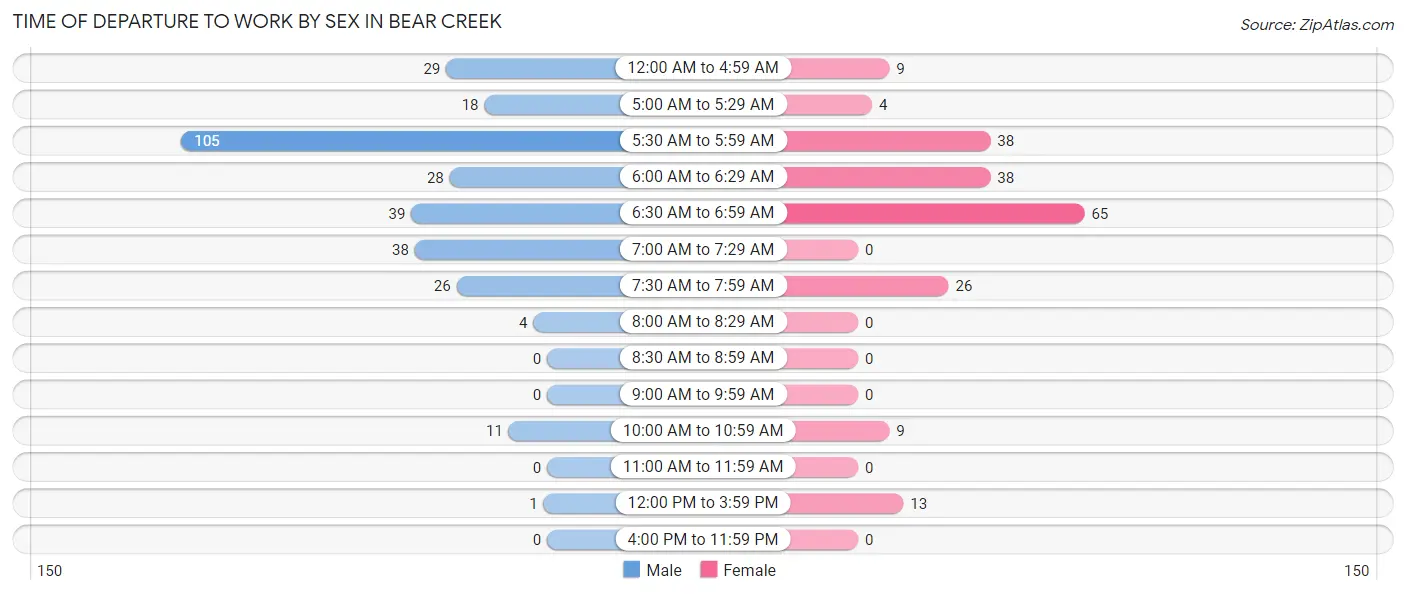
| Time of Departure | Male | Female |
| 12:00 AM to 4:59 AM | 29 (9.7%) | 9 (4.5%) |
| 5:00 AM to 5:29 AM | 18 (6.0%) | 4 (2.0%) |
| 5:30 AM to 5:59 AM | 105 (35.1%) | 38 (18.8%) |
| 6:00 AM to 6:29 AM | 28 (9.4%) | 38 (18.8%) |
| 6:30 AM to 6:59 AM | 39 (13.0%) | 65 (32.2%) |
| 7:00 AM to 7:29 AM | 38 (12.7%) | 0 (0.0%) |
| 7:30 AM to 7:59 AM | 26 (8.7%) | 26 (12.9%) |
| 8:00 AM to 8:29 AM | 4 (1.3%) | 0 (0.0%) |
| 8:30 AM to 8:59 AM | 0 (0.0%) | 0 (0.0%) |
| 9:00 AM to 9:59 AM | 0 (0.0%) | 0 (0.0%) |
| 10:00 AM to 10:59 AM | 11 (3.7%) | 9 (4.5%) |
| 11:00 AM to 11:59 AM | 0 (0.0%) | 0 (0.0%) |
| 12:00 PM to 3:59 PM | 1 (0.3%) | 13 (6.4%) |
| 4:00 PM to 11:59 PM | 0 (0.0%) | 0 (0.0%) |
| Total | 299 (100.0%) | 202 (100.0%) |
Housing Occupancy in Bear Creek
Occupancy by Ownership in Bear Creek
Of the total 523 dwellings in Bear Creek, owner-occupied units account for 439 (83.9%), while renter-occupied units make up 84 (16.1%).
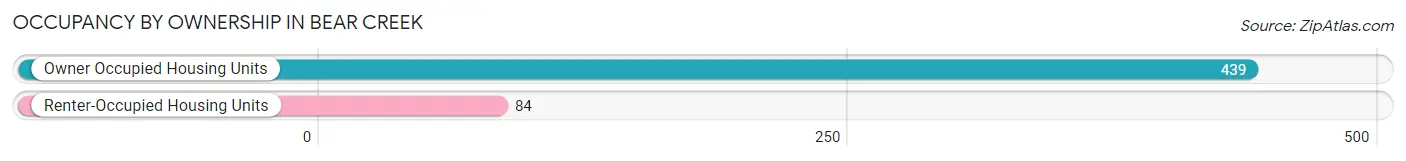
| Occupancy | # Housing Units | % Housing Units |
| Owner Occupied Housing Units | 439 | 83.9% |
| Renter-Occupied Housing Units | 84 | 16.1% |
| Total Occupied Housing Units | 523 | 100.0% |
Occupancy by Household Size in Bear Creek
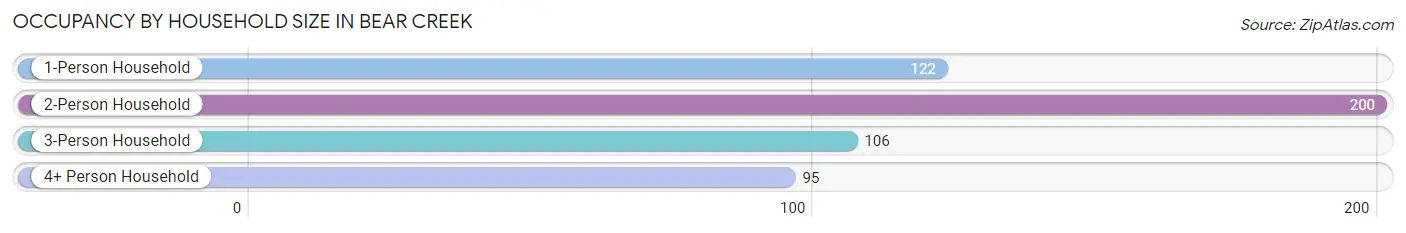
| Household Size | # Housing Units | % Housing Units |
| 1-Person Household | 122 | 23.3% |
| 2-Person Household | 200 | 38.2% |
| 3-Person Household | 106 | 20.3% |
| 4+ Person Household | 95 | 18.2% |
| Total Housing Units | 523 | 100.0% |
Occupancy by Ownership by Household Size in Bear Creek
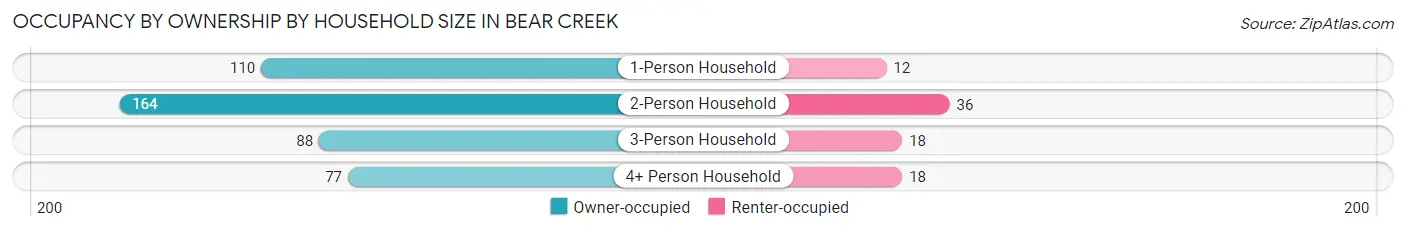
| Household Size | Owner-occupied | Renter-occupied |
| 1-Person Household | 110 (90.2%) | 12 (9.8%) |
| 2-Person Household | 164 (82.0%) | 36 (18.0%) |
| 3-Person Household | 88 (83.0%) | 18 (17.0%) |
| 4+ Person Household | 77 (81.0%) | 18 (19.0%) |
| Total Housing Units | 439 (83.9%) | 84 (16.1%) |
Occupancy by Educational Attainment in Bear Creek
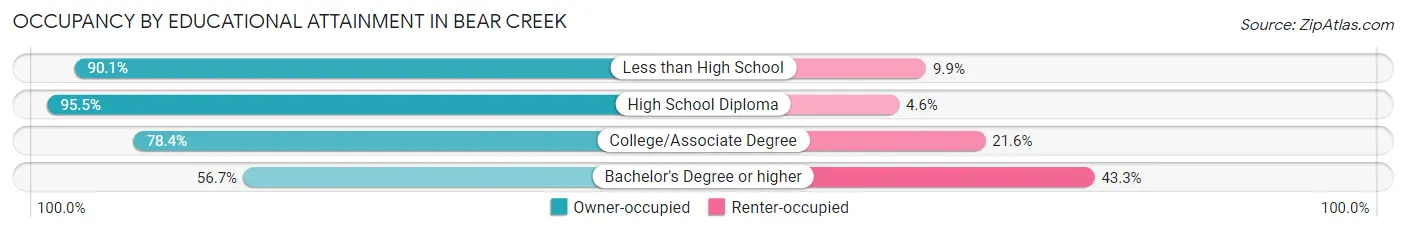
| Household Size | Owner-occupied | Renter-occupied |
| Less than High School | 191 (90.1%) | 21 (9.9%) |
| High School Diploma | 105 (95.5%) | 5 (4.5%) |
| College/Associate Degree | 105 (78.4%) | 29 (21.6%) |
| Bachelor's Degree or higher | 38 (56.7%) | 29 (43.3%) |
Occupancy by Age of Householder in Bear Creek
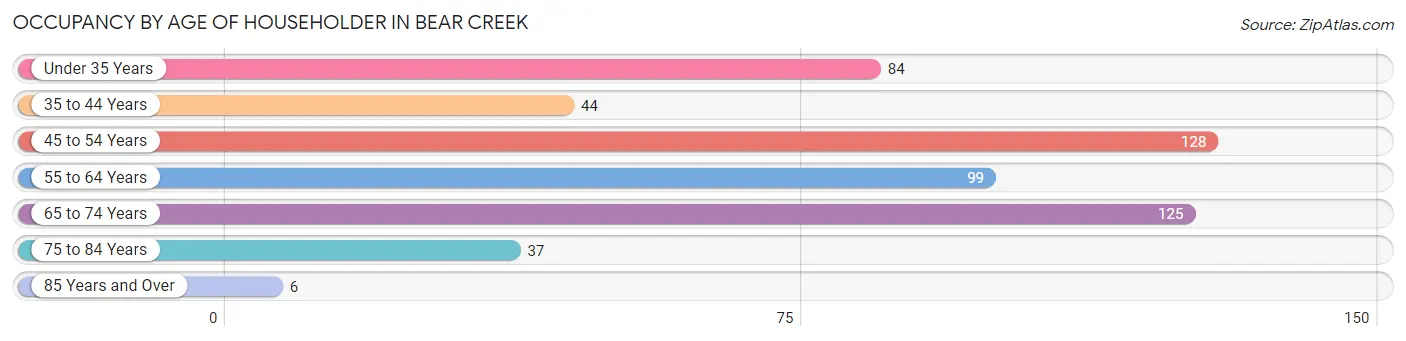
| Age Bracket | # Households | % Households |
| Under 35 Years | 84 | 16.1% |
| 35 to 44 Years | 44 | 8.4% |
| 45 to 54 Years | 128 | 24.5% |
| 55 to 64 Years | 99 | 18.9% |
| 65 to 74 Years | 125 | 23.9% |
| 75 to 84 Years | 37 | 7.1% |
| 85 Years and Over | 6 | 1.1% |
| Total | 523 | 100.0% |
Housing Finances in Bear Creek
Median Income by Occupancy in Bear Creek
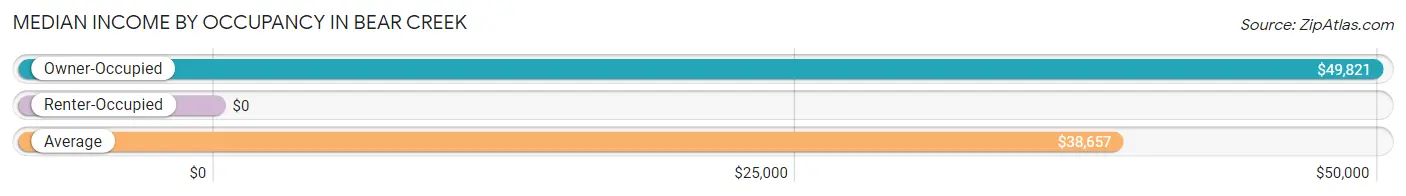
| Occupancy Type | # Households | Median Income |
| Owner-Occupied | 439 (83.9%) | $49,821 |
| Renter-Occupied | 84 (16.1%) | $0 |
| Average | 523 (100.0%) | $38,657 |
Occupancy by Householder Income Bracket in Bear Creek
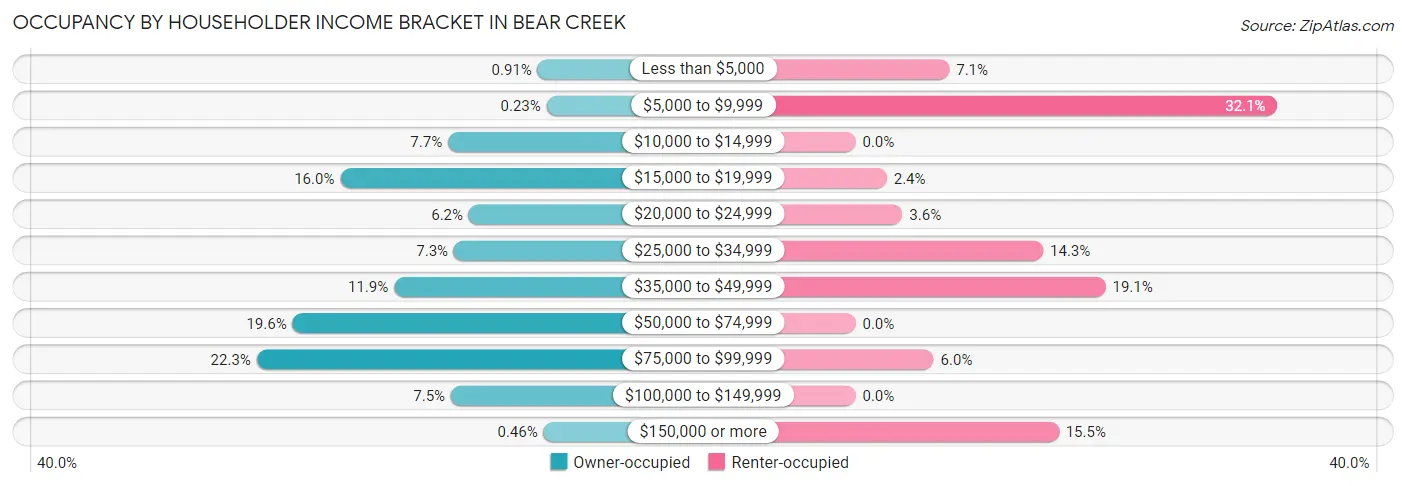
| Income Bracket | Owner-occupied | Renter-occupied |
| Less than $5,000 | 4 (0.9%) | 6 (7.1%) |
| $5,000 to $9,999 | 1 (0.2%) | 27 (32.1%) |
| $10,000 to $14,999 | 34 (7.7%) | 0 (0.0%) |
| $15,000 to $19,999 | 70 (16.0%) | 2 (2.4%) |
| $20,000 to $24,999 | 27 (6.1%) | 3 (3.6%) |
| $25,000 to $34,999 | 32 (7.3%) | 12 (14.3%) |
| $35,000 to $49,999 | 52 (11.8%) | 16 (19.1%) |
| $50,000 to $74,999 | 86 (19.6%) | 0 (0.0%) |
| $75,000 to $99,999 | 98 (22.3%) | 5 (5.9%) |
| $100,000 to $149,999 | 33 (7.5%) | 0 (0.0%) |
| $150,000 or more | 2 (0.5%) | 13 (15.5%) |
| Total | 439 (100.0%) | 84 (100.0%) |
Monthly Housing Cost Tiers in Bear Creek
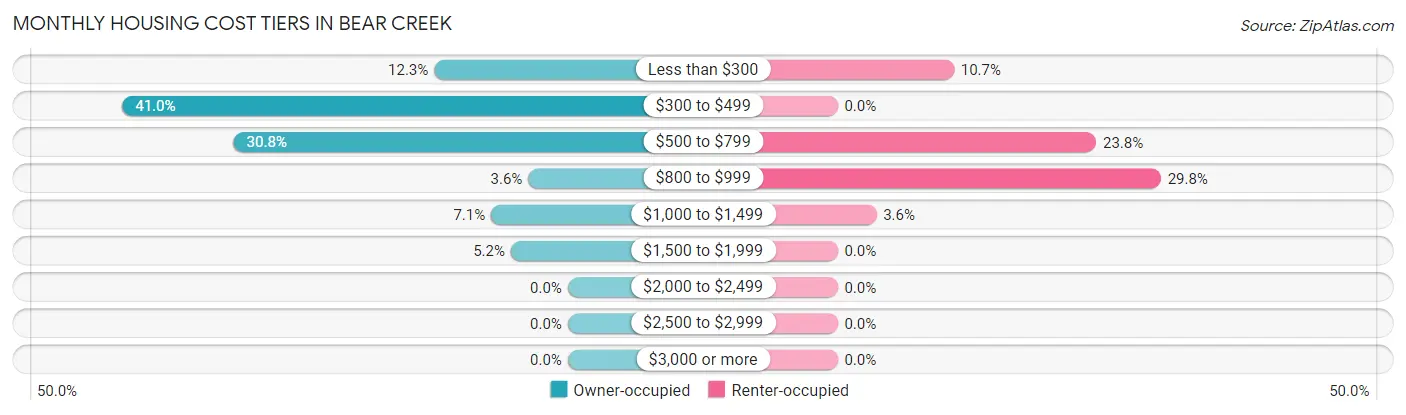
| Monthly Cost | Owner-occupied | Renter-occupied |
| Less than $300 | 54 (12.3%) | 9 (10.7%) |
| $300 to $499 | 180 (41.0%) | 0 (0.0%) |
| $500 to $799 | 135 (30.7%) | 20 (23.8%) |
| $800 to $999 | 16 (3.6%) | 25 (29.8%) |
| $1,000 to $1,499 | 31 (7.1%) | 3 (3.6%) |
| $1,500 to $1,999 | 23 (5.2%) | 0 (0.0%) |
| $2,000 to $2,499 | 0 (0.0%) | 0 (0.0%) |
| $2,500 to $2,999 | 0 (0.0%) | 0 (0.0%) |
| $3,000 or more | 0 (0.0%) | 0 (0.0%) |
| Total | 439 (100.0%) | 84 (100.0%) |
Physical Housing Characteristics in Bear Creek
Housing Structures in Bear Creek
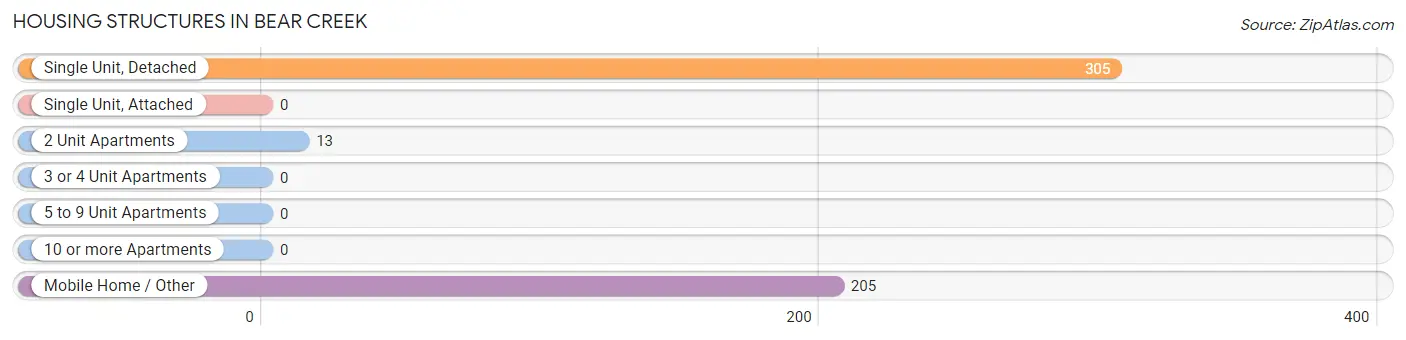
| Structure Type | # Housing Units | % Housing Units |
| Single Unit, Detached | 305 | 58.3% |
| Single Unit, Attached | 0 | 0.0% |
| 2 Unit Apartments | 13 | 2.5% |
| 3 or 4 Unit Apartments | 0 | 0.0% |
| 5 to 9 Unit Apartments | 0 | 0.0% |
| 10 or more Apartments | 0 | 0.0% |
| Mobile Home / Other | 205 | 39.2% |
| Total | 523 | 100.0% |
Housing Structures by Occupancy in Bear Creek
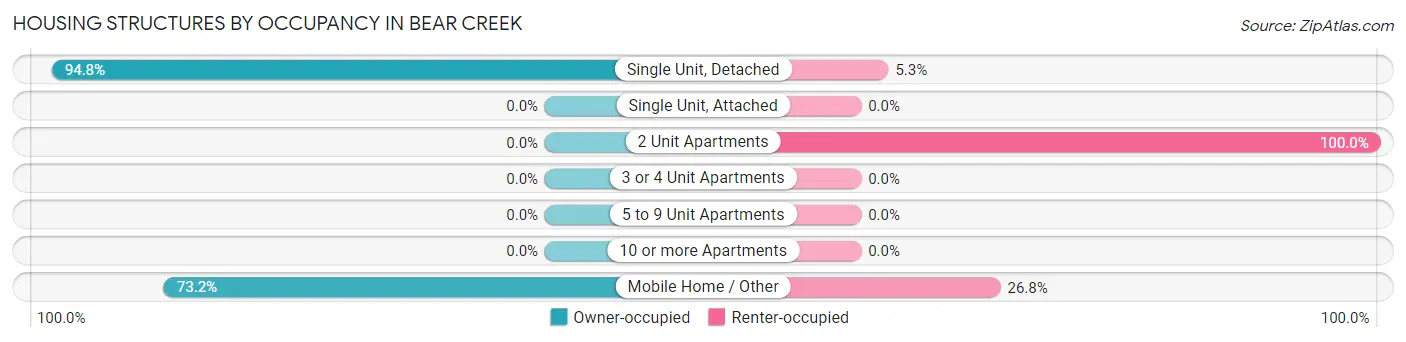
| Structure Type | Owner-occupied | Renter-occupied |
| Single Unit, Detached | 289 (94.8%) | 16 (5.2%) |
| Single Unit, Attached | 0 (0.0%) | 0 (0.0%) |
| 2 Unit Apartments | 0 (0.0%) | 13 (100.0%) |
| 3 or 4 Unit Apartments | 0 (0.0%) | 0 (0.0%) |
| 5 to 9 Unit Apartments | 0 (0.0%) | 0 (0.0%) |
| 10 or more Apartments | 0 (0.0%) | 0 (0.0%) |
| Mobile Home / Other | 150 (73.2%) | 55 (26.8%) |
| Total | 439 (83.9%) | 84 (16.1%) |
Housing Structures by Number of Rooms in Bear Creek
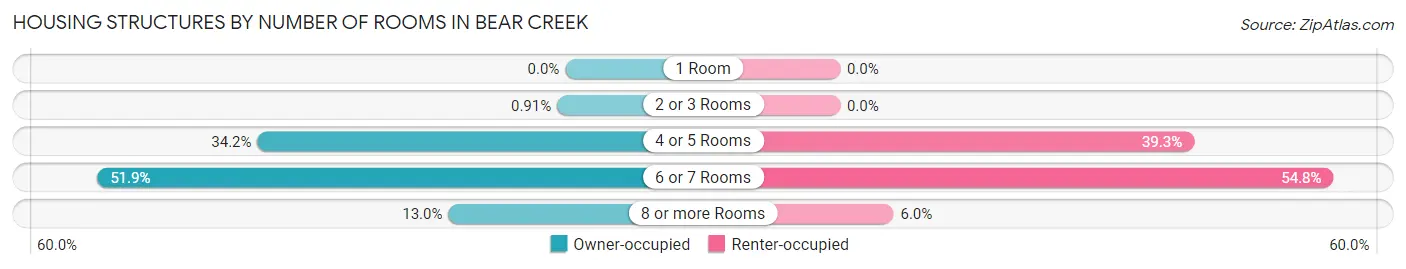
| Number of Rooms | Owner-occupied | Renter-occupied |
| 1 Room | 0 (0.0%) | 0 (0.0%) |
| 2 or 3 Rooms | 4 (0.9%) | 0 (0.0%) |
| 4 or 5 Rooms | 150 (34.2%) | 33 (39.3%) |
| 6 or 7 Rooms | 228 (51.9%) | 46 (54.8%) |
| 8 or more Rooms | 57 (13.0%) | 5 (5.9%) |
| Total | 439 (100.0%) | 84 (100.0%) |
Housing Structure by Heating Type in Bear Creek
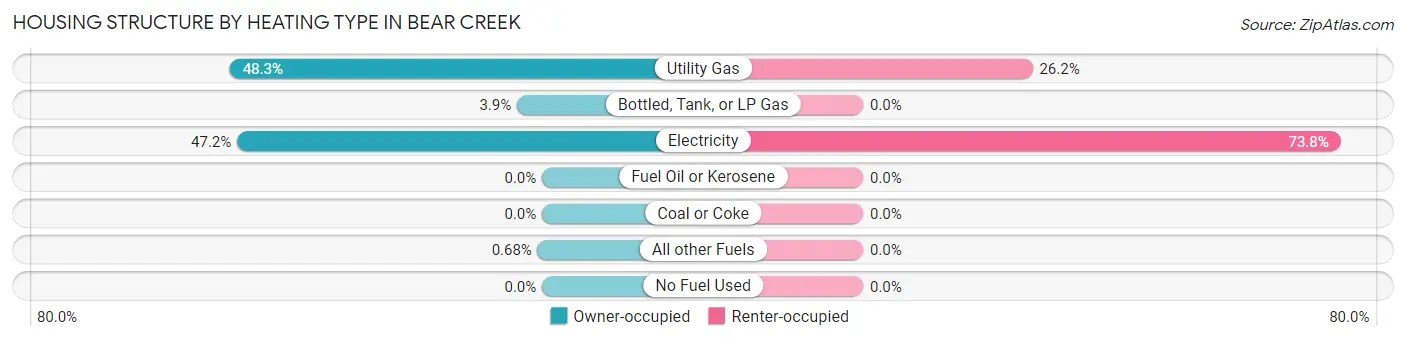
| Heating Type | Owner-occupied | Renter-occupied |
| Utility Gas | 212 (48.3%) | 22 (26.2%) |
| Bottled, Tank, or LP Gas | 17 (3.9%) | 0 (0.0%) |
| Electricity | 207 (47.1%) | 62 (73.8%) |
| Fuel Oil or Kerosene | 0 (0.0%) | 0 (0.0%) |
| Coal or Coke | 0 (0.0%) | 0 (0.0%) |
| All other Fuels | 3 (0.7%) | 0 (0.0%) |
| No Fuel Used | 0 (0.0%) | 0 (0.0%) |
| Total | 439 (100.0%) | 84 (100.0%) |
Household Vehicle Usage in Bear Creek
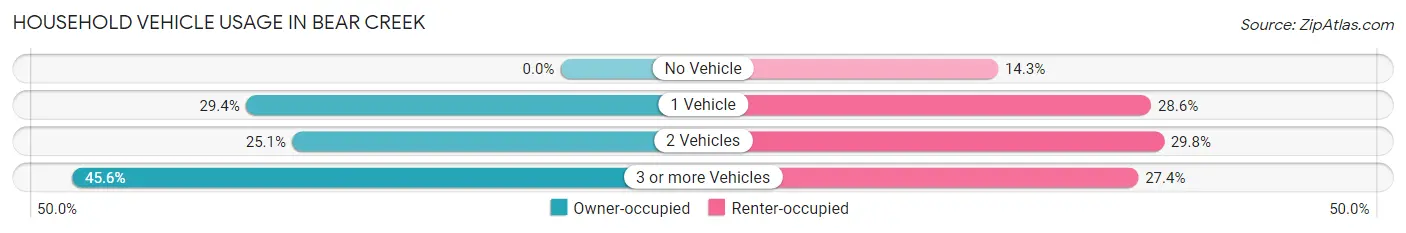
| Vehicles per Household | Owner-occupied | Renter-occupied |
| No Vehicle | 0 (0.0%) | 12 (14.3%) |
| 1 Vehicle | 129 (29.4%) | 24 (28.6%) |
| 2 Vehicles | 110 (25.1%) | 25 (29.8%) |
| 3 or more Vehicles | 200 (45.6%) | 23 (27.4%) |
| Total | 439 (100.0%) | 84 (100.0%) |
Real Estate & Mortgages in Bear Creek
Real Estate and Mortgage Overview in Bear Creek
| Characteristic | Without Mortgage | With Mortgage |
| Housing Units | 309 | 130 |
| Median Property Value | $97,700 | $73,300 |
| Median Household Income | $36,169 | $2 |
| Monthly Housing Costs | $404 | $0 |
| Real Estate Taxes | $253 | $16 |
Property Value by Mortgage Status in Bear Creek
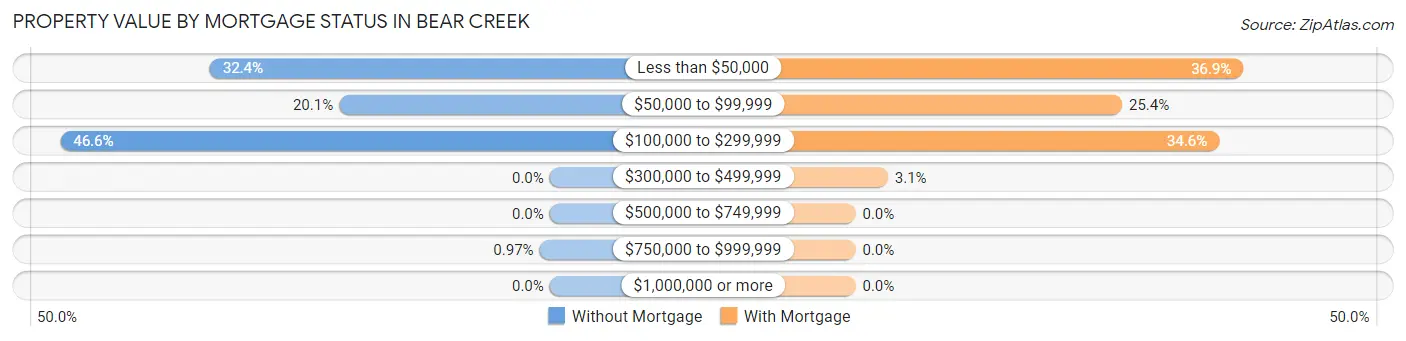
| Property Value | Without Mortgage | With Mortgage |
| Less than $50,000 | 100 (32.4%) | 48 (36.9%) |
| $50,000 to $99,999 | 62 (20.1%) | 33 (25.4%) |
| $100,000 to $299,999 | 144 (46.6%) | 45 (34.6%) |
| $300,000 to $499,999 | 0 (0.0%) | 4 (3.1%) |
| $500,000 to $749,999 | 0 (0.0%) | 0 (0.0%) |
| $750,000 to $999,999 | 3 (1.0%) | 0 (0.0%) |
| $1,000,000 or more | 0 (0.0%) | 0 (0.0%) |
| Total | 309 (100.0%) | 130 (100.0%) |
Household Income by Mortgage Status in Bear Creek
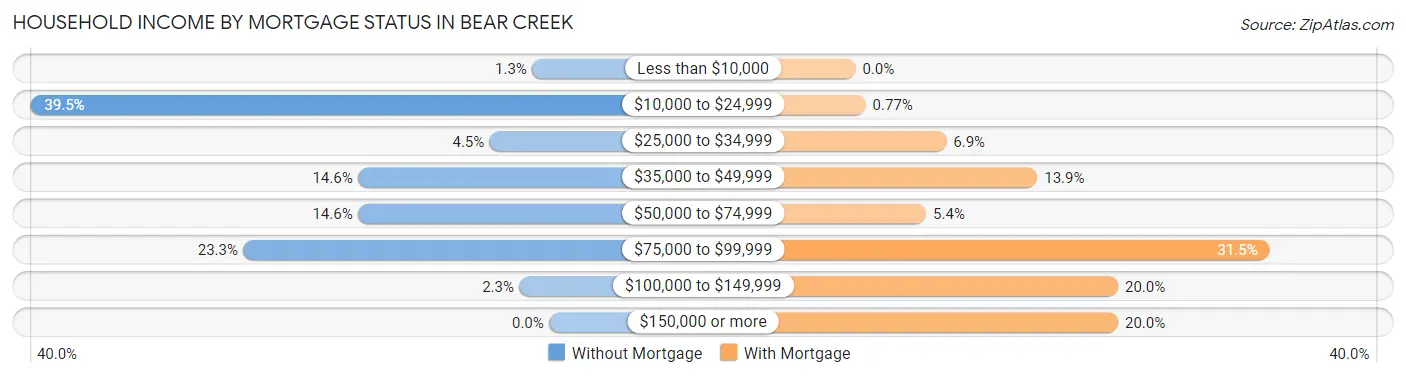
| Household Income | Without Mortgage | With Mortgage |
| Less than $10,000 | 4 (1.3%) | 0 (0.0%) |
| $10,000 to $24,999 | 122 (39.5%) | 1 (0.8%) |
| $25,000 to $34,999 | 14 (4.5%) | 9 (6.9%) |
| $35,000 to $49,999 | 45 (14.6%) | 18 (13.9%) |
| $50,000 to $74,999 | 45 (14.6%) | 7 (5.4%) |
| $75,000 to $99,999 | 72 (23.3%) | 41 (31.5%) |
| $100,000 to $149,999 | 7 (2.3%) | 26 (20.0%) |
| $150,000 or more | 0 (0.0%) | 26 (20.0%) |
| Total | 309 (100.0%) | 130 (100.0%) |
Property Value to Household Income Ratio in Bear Creek
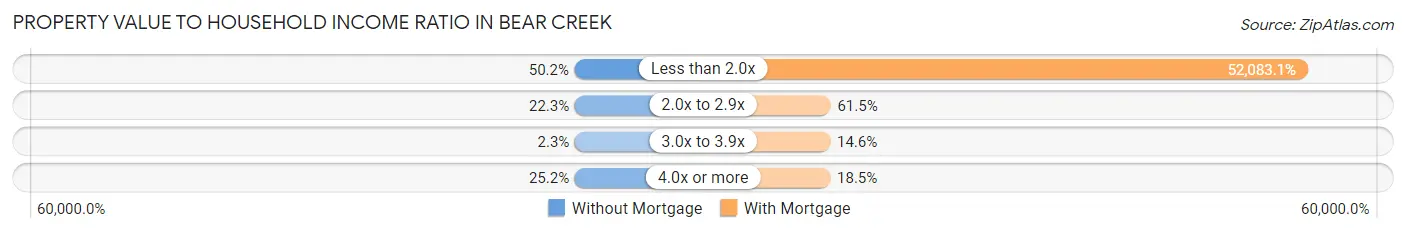
| Value-to-Income Ratio | Without Mortgage | With Mortgage |
| Less than 2.0x | 155 (50.2%) | 67,708 (52,083.1%) |
| 2.0x to 2.9x | 69 (22.3%) | 80 (61.5%) |
| 3.0x to 3.9x | 7 (2.3%) | 19 (14.6%) |
| 4.0x or more | 78 (25.2%) | 24 (18.5%) |
| Total | 309 (100.0%) | 130 (100.0%) |
Real Estate Taxes by Mortgage Status in Bear Creek
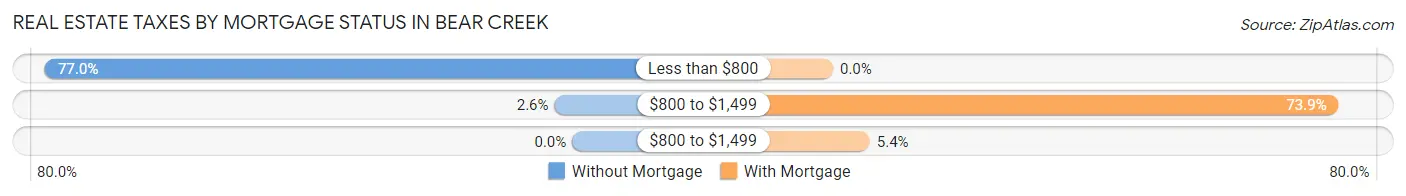
| Property Taxes | Without Mortgage | With Mortgage |
| Less than $800 | 238 (77.0%) | 0 (0.0%) |
| $800 to $1,499 | 8 (2.6%) | 96 (73.9%) |
| $800 to $1,499 | 0 (0.0%) | 7 (5.4%) |
| Total | 309 (100.0%) | 130 (100.0%) |
Health & Disability in Bear Creek
Health Insurance Coverage by Age in Bear Creek
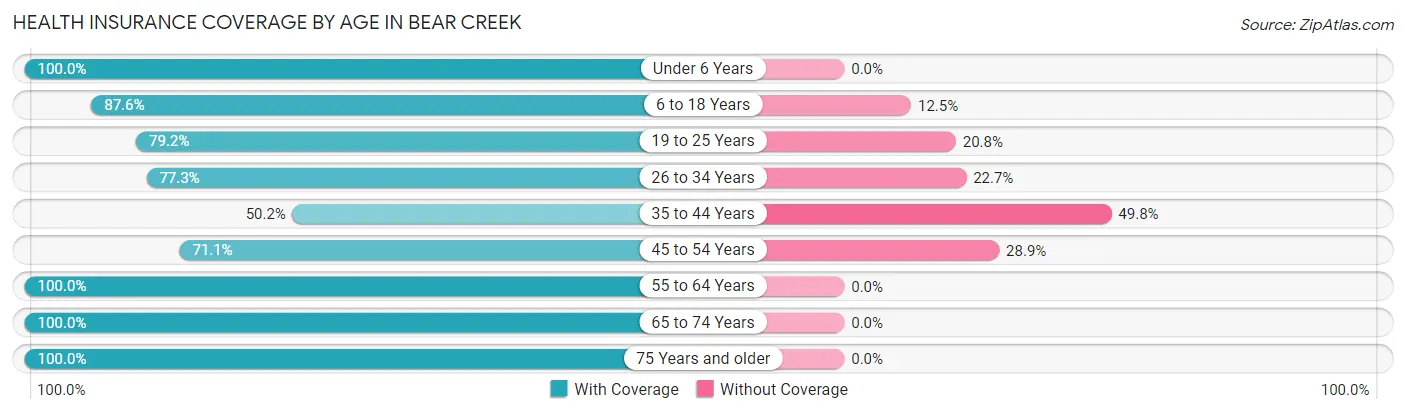
| Age Bracket | With Coverage | Without Coverage |
| Under 6 Years | 124 (100.0%) | 0 (0.0%) |
| 6 to 18 Years | 232 (87.5%) | 33 (12.4%) |
| 19 to 25 Years | 99 (79.2%) | 26 (20.8%) |
| 26 to 34 Years | 119 (77.3%) | 35 (22.7%) |
| 35 to 44 Years | 134 (50.2%) | 133 (49.8%) |
| 45 to 54 Years | 133 (71.1%) | 54 (28.9%) |
| 55 to 64 Years | 205 (100.0%) | 0 (0.0%) |
| 65 to 74 Years | 159 (100.0%) | 0 (0.0%) |
| 75 Years and older | 63 (100.0%) | 0 (0.0%) |
| Total | 1,268 (81.9%) | 281 (18.1%) |
Health Insurance Coverage by Citizenship Status in Bear Creek
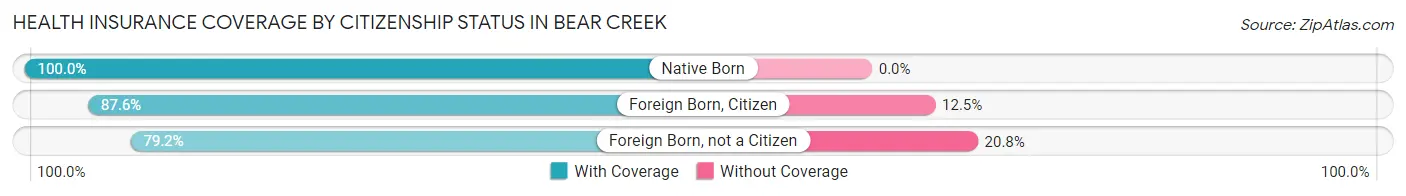
| Citizenship Status | With Coverage | Without Coverage |
| Native Born | 124 (100.0%) | 0 (0.0%) |
| Foreign Born, Citizen | 232 (87.5%) | 33 (12.4%) |
| Foreign Born, not a Citizen | 99 (79.2%) | 26 (20.8%) |
Health Insurance Coverage by Household Income in Bear Creek
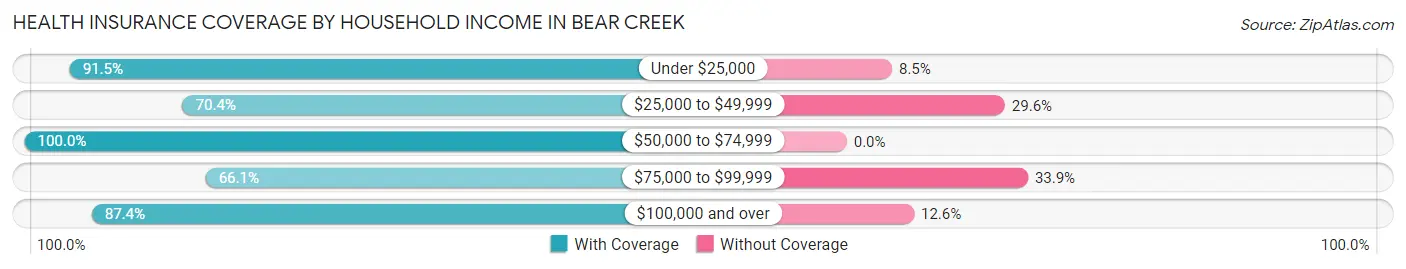
| Household Income | With Coverage | Without Coverage |
| Under $25,000 | 259 (91.5%) | 24 (8.5%) |
| $25,000 to $49,999 | 221 (70.4%) | 93 (29.6%) |
| $50,000 to $74,999 | 304 (100.0%) | 0 (0.0%) |
| $75,000 to $99,999 | 255 (66.1%) | 131 (33.9%) |
| $100,000 and over | 229 (87.4%) | 33 (12.6%) |
Public vs Private Health Insurance Coverage by Age in Bear Creek
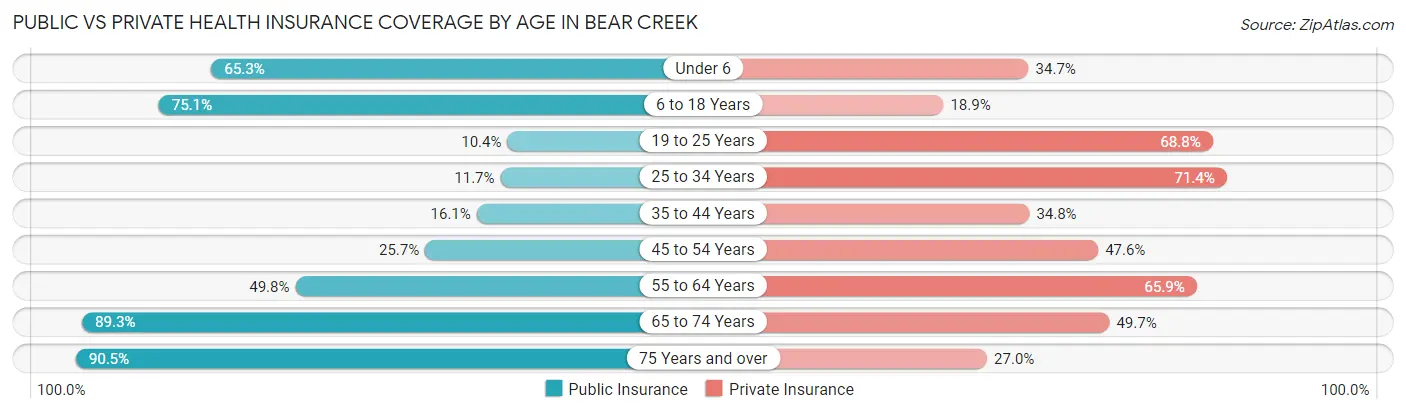
| Age Bracket | Public Insurance | Private Insurance |
| Under 6 | 81 (65.3%) | 43 (34.7%) |
| 6 to 18 Years | 199 (75.1%) | 50 (18.9%) |
| 19 to 25 Years | 13 (10.4%) | 86 (68.8%) |
| 25 to 34 Years | 18 (11.7%) | 110 (71.4%) |
| 35 to 44 Years | 43 (16.1%) | 93 (34.8%) |
| 45 to 54 Years | 48 (25.7%) | 89 (47.6%) |
| 55 to 64 Years | 102 (49.8%) | 135 (65.8%) |
| 65 to 74 Years | 142 (89.3%) | 79 (49.7%) |
| 75 Years and over | 57 (90.5%) | 17 (27.0%) |
| Total | 703 (45.4%) | 702 (45.3%) |
Disability Status by Sex by Age in Bear Creek
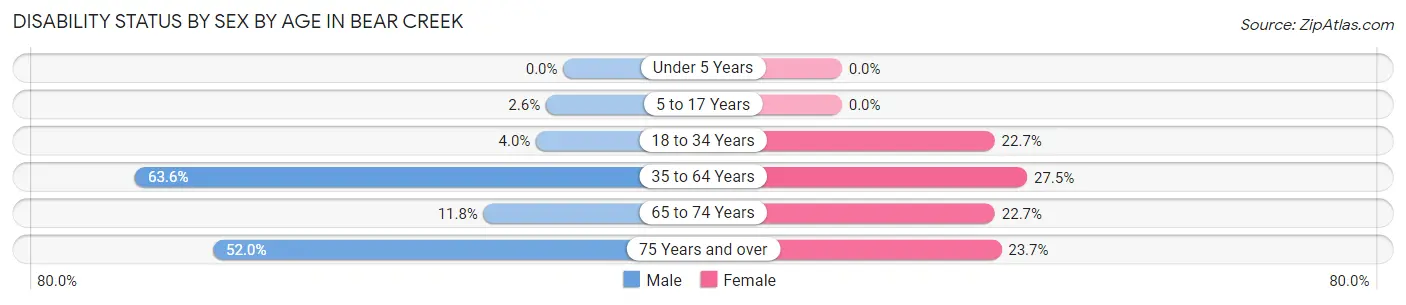
| Age Bracket | Male | Female |
| Under 5 Years | 0 (0.0%) | 0 (0.0%) |
| 5 to 17 Years | 5 (2.6%) | 0 (0.0%) |
| 18 to 34 Years | 8 (4.0%) | 32 (22.7%) |
| 35 to 64 Years | 248 (63.6%) | 74 (27.5%) |
| 65 to 74 Years | 11 (11.8%) | 15 (22.7%) |
| 75 Years and over | 13 (52.0%) | 9 (23.7%) |
Disability Class by Sex by Age in Bear Creek
Disability Class: Hearing Difficulty
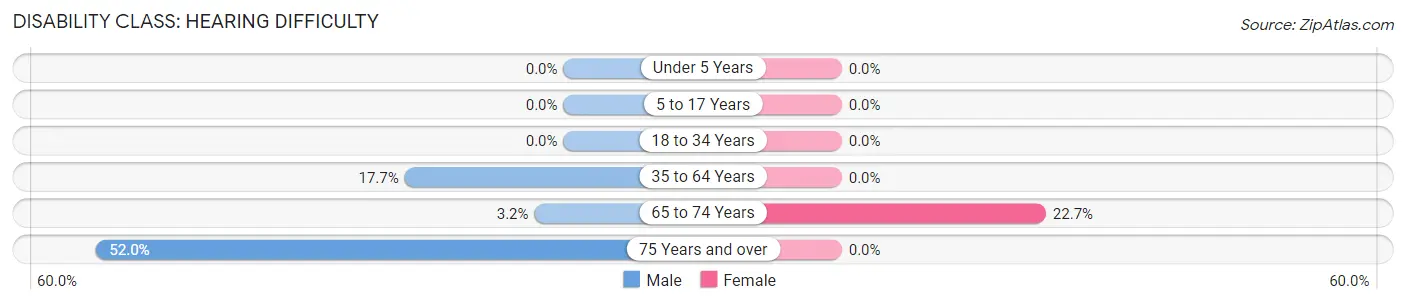
| Age Bracket | Male | Female |
| Under 5 Years | 0 (0.0%) | 0 (0.0%) |
| 5 to 17 Years | 0 (0.0%) | 0 (0.0%) |
| 18 to 34 Years | 0 (0.0%) | 0 (0.0%) |
| 35 to 64 Years | 69 (17.7%) | 0 (0.0%) |
| 65 to 74 Years | 3 (3.2%) | 15 (22.7%) |
| 75 Years and over | 13 (52.0%) | 0 (0.0%) |
Disability Class: Vision Difficulty
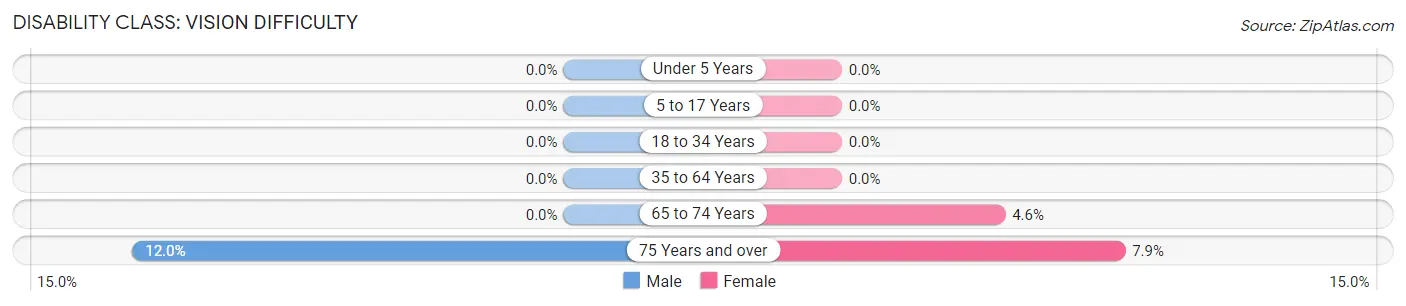
| Age Bracket | Male | Female |
| Under 5 Years | 0 (0.0%) | 0 (0.0%) |
| 5 to 17 Years | 0 (0.0%) | 0 (0.0%) |
| 18 to 34 Years | 0 (0.0%) | 0 (0.0%) |
| 35 to 64 Years | 0 (0.0%) | 0 (0.0%) |
| 65 to 74 Years | 0 (0.0%) | 3 (4.5%) |
| 75 Years and over | 3 (12.0%) | 3 (7.9%) |
Disability Class: Cognitive Difficulty
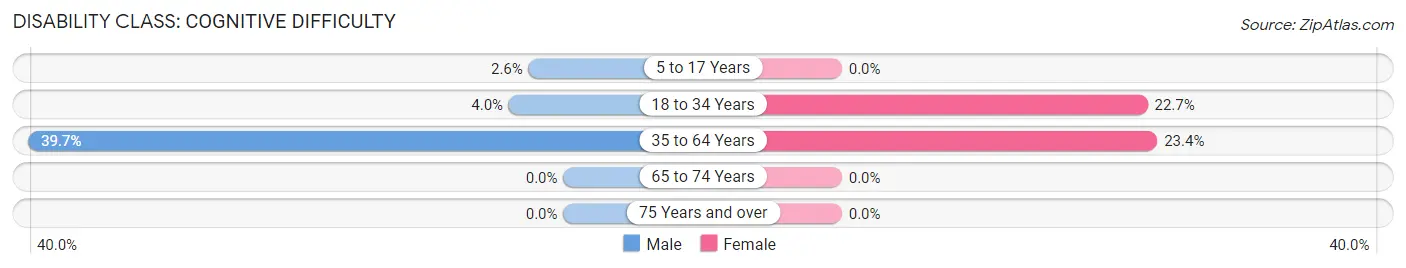
| Age Bracket | Male | Female |
| 5 to 17 Years | 5 (2.6%) | 0 (0.0%) |
| 18 to 34 Years | 8 (4.0%) | 32 (22.7%) |
| 35 to 64 Years | 155 (39.7%) | 63 (23.4%) |
| 65 to 74 Years | 0 (0.0%) | 0 (0.0%) |
| 75 Years and over | 0 (0.0%) | 0 (0.0%) |
Disability Class: Ambulatory Difficulty
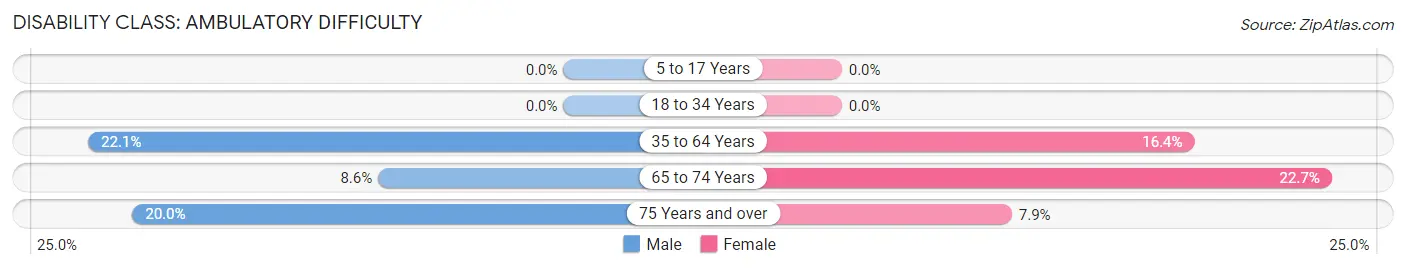
| Age Bracket | Male | Female |
| 5 to 17 Years | 0 (0.0%) | 0 (0.0%) |
| 18 to 34 Years | 0 (0.0%) | 0 (0.0%) |
| 35 to 64 Years | 86 (22.1%) | 44 (16.4%) |
| 65 to 74 Years | 8 (8.6%) | 15 (22.7%) |
| 75 Years and over | 5 (20.0%) | 3 (7.9%) |
Disability Class: Self-Care Difficulty
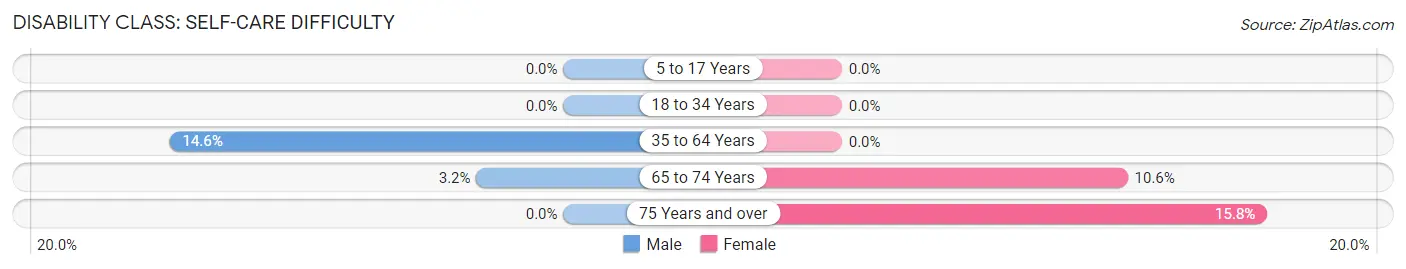
| Age Bracket | Male | Female |
| 5 to 17 Years | 0 (0.0%) | 0 (0.0%) |
| 18 to 34 Years | 0 (0.0%) | 0 (0.0%) |
| 35 to 64 Years | 57 (14.6%) | 0 (0.0%) |
| 65 to 74 Years | 3 (3.2%) | 7 (10.6%) |
| 75 Years and over | 0 (0.0%) | 6 (15.8%) |
Technology Access in Bear Creek
Computing Device Access in Bear Creek
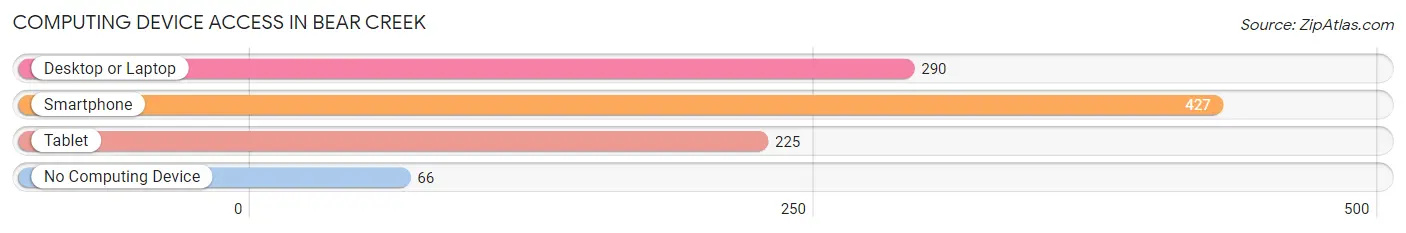
| Device Type | # Households | % Households |
| Desktop or Laptop | 290 | 55.4% |
| Smartphone | 427 | 81.6% |
| Tablet | 225 | 43.0% |
| No Computing Device | 66 | 12.6% |
| Total | 523 | 100.0% |
Internet Access in Bear Creek
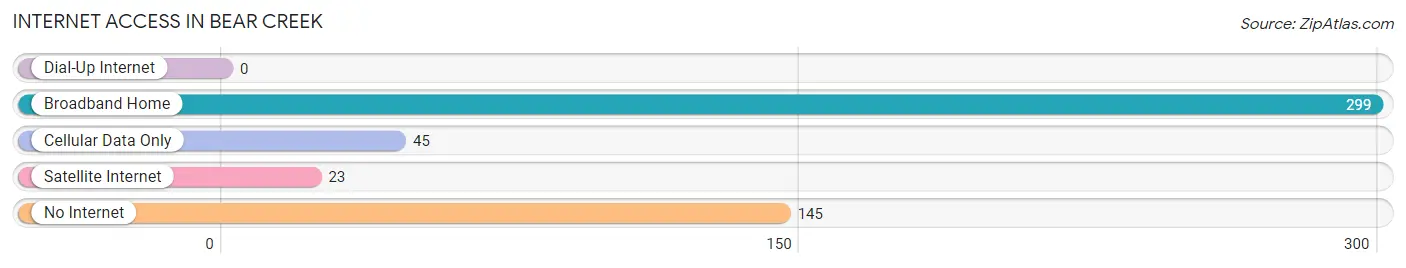
| Internet Type | # Households | % Households |
| Dial-Up Internet | 0 | 0.0% |
| Broadband Home | 299 | 57.2% |
| Cellular Data Only | 45 | 8.6% |
| Satellite Internet | 23 | 4.4% |
| No Internet | 145 | 27.7% |
| Total | 523 | 100.0% |
Bear Creek Summary
Introduction
Bear Creek is a small town located in the northwest corner of Alabama, in Marion County. It is situated on the banks of the Bear Creek, a tributary of the Tombigbee River. The town was founded in 1820 and has a population of approximately 1,000 people. The town is known for its rural charm and its close-knit community.
History
The town of Bear Creek was founded in 1820 by a group of settlers from Georgia. The settlers were attracted to the area by the abundance of timber and the fertile soil. The town was named after the nearby creek, which was named for the large number of black bears that inhabited the area.
The town grew slowly but steadily over the years, and by the late 19th century, it had become a thriving agricultural community. The town was home to several cotton gins, sawmills, and other businesses.
In the early 20th century, the town began to decline as the timber industry declined and the population began to move away. The town was revitalized in the 1950s when the Tennessee Valley Authority (TVA) built a dam on the nearby Bear Creek. The dam provided electricity to the town and helped to create jobs.
Geography
Bear Creek is located in the northwest corner of Alabama, in Marion County. It is situated on the banks of the Bear Creek, a tributary of the Tombigbee River. The town is surrounded by rolling hills and forests, and is located approximately 30 miles from the Mississippi border.
The town has a total area of 1.2 square miles, all of which is land. The elevation of the town is approximately 500 feet above sea level.
Economy
The economy of Bear Creek is largely based on agriculture. The town is home to several farms, which produce a variety of crops, including cotton, corn, soybeans, and wheat. The town also has several small businesses, including a grocery store, a hardware store, and a few restaurants.
The town is also home to a small manufacturing plant, which produces plastic products. The plant employs approximately 50 people.
Demographics
As of the 2010 census, the population of Bear Creek was 1,000 people. The racial makeup of the town was 97.2% White, 0.7% African American, 0.3% Native American, 0.2% Asian, and 1.6% from other races.
The median household income in Bear Creek was $30,000, and the median family income was $35,000. The per capita income was $14,000. Approximately 15.5% of the population was below the poverty line.
Conclusion
Bear Creek is a small town located in the northwest corner of Alabama, in Marion County. The town was founded in 1820 and has a population of approximately 1,000 people. The town is known for its rural charm and its close-knit community. The economy of Bear Creek is largely based on agriculture, and the town is home to several small businesses. The racial makeup of the town is predominantly White, with a small percentage of African American, Native American, and Asian residents. The median household income in Bear Creek is $30,000, and the per capita income is $14,000.
Common Questions
What is Per Capita Income in Bear Creek?
Per Capita income in Bear Creek is $18,547.
What is the Median Family Income in Bear Creek?
Median Family Income in Bear Creek is $56,250.
What is the Median Household income in Bear Creek?
Median Household Income in Bear Creek is $38,657.
What is Inequality or Gini Index in Bear Creek?
Inequality or Gini Index in Bear Creek is 0.41.
What is the Total Population of Bear Creek?
Total Population of Bear Creek is 1,549.
What is the Total Male Population of Bear Creek?
Total Male Population of Bear Creek is 977.
What is the Total Female Population of Bear Creek?
Total Female Population of Bear Creek is 572.
What is the Ratio of Males per 100 Females in Bear Creek?
There are 170.80 Males per 100 Females in Bear Creek.
What is the Ratio of Females per 100 Males in Bear Creek?
There are 58.55 Females per 100 Males in Bear Creek.
What is the Median Population Age in Bear Creek?
Median Population Age in Bear Creek is 41.3 Years.
What is the Average Family Size in Bear Creek
Average Family Size in Bear Creek is 3.6 People.
What is the Average Household Size in Bear Creek
Average Household Size in Bear Creek is 3.0 People.
How Large is the Labor Force in Bear Creek?
There are 614 People in the Labor Forcein in Bear Creek.
What is the Percentage of People in the Labor Force in Bear Creek?
49.6% of People are in the Labor Force in Bear Creek.
What is the Unemployment Rate in Bear Creek?
Unemployment Rate in Bear Creek is 13.0%.