Ashville, AL Map & Demographics
Ashville Map
Ashville Overview
$25,152
PER CAPITA INCOME
$54,771
AVG FAMILY INCOME
$54,785
AVG HOUSEHOLD INCOME
16.1%
WAGE / INCOME GAP [ % ]
83.9¢/ $1
WAGE / INCOME GAP [ $ ]
0.40
INEQUALITY / GINI INDEX
2,438
TOTAL POPULATION
1,389
MALE POPULATION
1,049
FEMALE POPULATION
132.41
MALES / 100 FEMALES
75.52
FEMALES / 100 MALES
40.3
MEDIAN AGE
3.4
AVG FAMILY SIZE
3.0
AVG HOUSEHOLD SIZE
1,115
LABOR FORCE [ PEOPLE ]
56.5%
PERCENT IN LABOR FORCE
0.7%
UNEMPLOYMENT RATE
Ashville Zip Codes
Ashville Area Codes
Income in Ashville
Income Overview in Ashville
Per Capita Income in Ashville is $25,152, while median incomes of families and households are $54,771 and $54,785 respectively.
| Characteristic | Number | Measure |
| Per Capita Income | 2,438 | $25,152 |
| Median Family Income | 541 | $54,771 |
| Mean Family Income | 541 | $72,666 |
| Median Household Income | 777 | $54,785 |
| Mean Household Income | 777 | $66,563 |
| Income Deficit | 541 | $0 |
| Wage / Income Gap (%) | 2,438 | 16.10% |
| Wage / Income Gap ($) | 2,438 | 83.90¢ per $1 |
| Gini / Inequality Index | 2,438 | 0.40 |
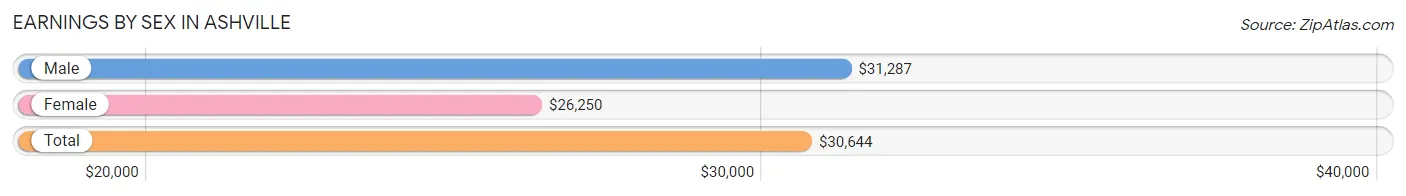
Earnings by Sex in Ashville
Average Earnings in Ashville are $30,644, $31,287 for men and $26,250 for women, a difference of 16.1%.
| Sex | Number | Average Earnings |
| Male | 724 (61.8%) | $31,287 |
| Female | 448 (38.2%) | $26,250 |
| Total | 1,172 (100.0%) | $30,644 |
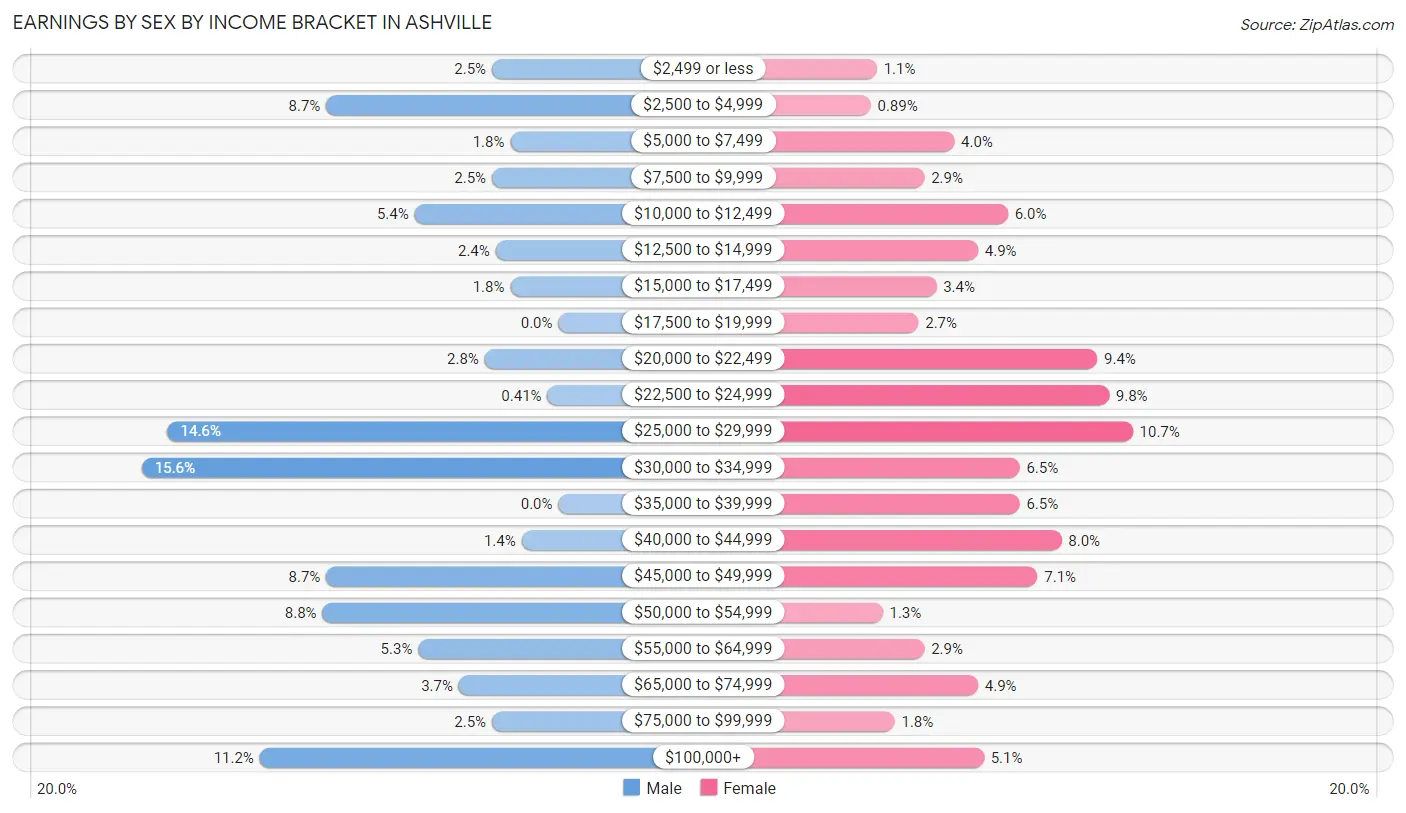
Earnings by Sex by Income Bracket in Ashville
The most common earnings brackets in Ashville are $30,000 to $34,999 for men (113 | 15.6%) and $25,000 to $29,999 for women (48 | 10.7%).
| Income | Male | Female |
| $2,499 or less | 18 (2.5%) | 5 (1.1%) |
| $2,500 to $4,999 | 63 (8.7%) | 4 (0.9%) |
| $5,000 to $7,499 | 13 (1.8%) | 18 (4.0%) |
| $7,500 to $9,999 | 18 (2.5%) | 13 (2.9%) |
| $10,000 to $12,499 | 39 (5.4%) | 27 (6.0%) |
| $12,500 to $14,999 | 17 (2.4%) | 22 (4.9%) |
| $15,000 to $17,499 | 13 (1.8%) | 15 (3.4%) |
| $17,500 to $19,999 | 0 (0.0%) | 12 (2.7%) |
| $20,000 to $22,499 | 20 (2.8%) | 42 (9.4%) |
| $22,500 to $24,999 | 3 (0.4%) | 44 (9.8%) |
| $25,000 to $29,999 | 106 (14.6%) | 48 (10.7%) |
| $30,000 to $34,999 | 113 (15.6%) | 29 (6.5%) |
| $35,000 to $39,999 | 0 (0.0%) | 29 (6.5%) |
| $40,000 to $44,999 | 10 (1.4%) | 36 (8.0%) |
| $45,000 to $49,999 | 63 (8.7%) | 32 (7.1%) |
| $50,000 to $54,999 | 64 (8.8%) | 6 (1.3%) |
| $55,000 to $64,999 | 38 (5.2%) | 13 (2.9%) |
| $65,000 to $74,999 | 27 (3.7%) | 22 (4.9%) |
| $75,000 to $99,999 | 18 (2.5%) | 8 (1.8%) |
| $100,000+ | 81 (11.2%) | 23 (5.1%) |
| Total | 724 (100.0%) | 448 (100.0%) |
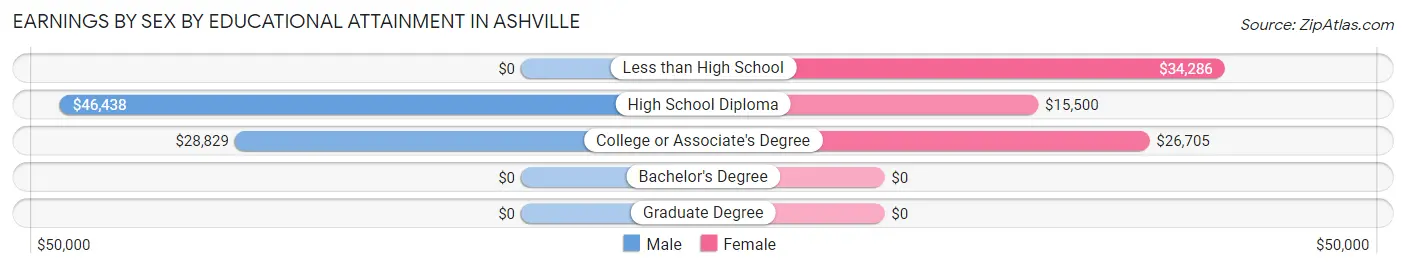
Earnings by Sex by Educational Attainment in Ashville
Average earnings in Ashville are $32,228 for men and $26,875 for women, a difference of 16.6%. Men with an educational attainment of high school diploma enjoy the highest average annual earnings of $46,438, while those with college or associate's degree education earn the least with $28,829. Women with an educational attainment of less than high school earn the most with the average annual earnings of $34,286, while those with high school diploma education have the smallest earnings of $15,500.
| Educational Attainment | Male Income | Female Income |
| Less than High School | - | - |
| High School Diploma | $46,438 | $15,500 |
| College or Associate's Degree | $28,829 | $26,705 |
| Bachelor's Degree | - | - |
| Graduate Degree | - | - |
| Total | $32,228 | $26,875 |
Family Income in Ashville
Family Income Brackets in Ashville
According to the Ashville family income data, there are 152 families falling into the $50,000 to $74,999 income range, which is the most common income bracket and makes up 28.1% of all families.
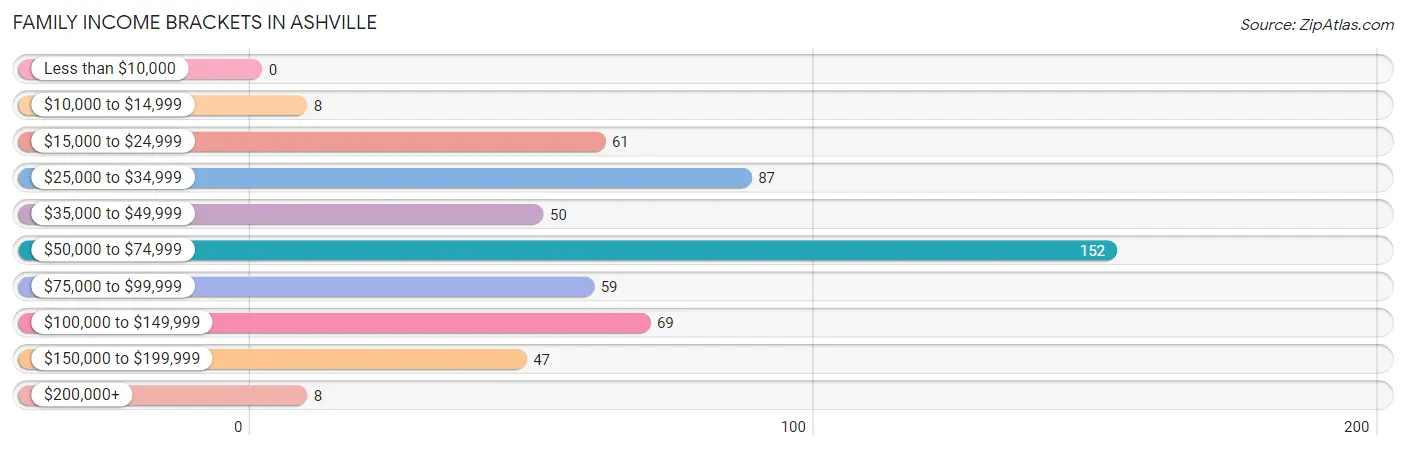
| Income Bracket | # Families | % Families |
| Less than $10,000 | 0 | 0.0% |
| $10,000 to $14,999 | 8 | 1.5% |
| $15,000 to $24,999 | 61 | 11.3% |
| $25,000 to $34,999 | 87 | 16.1% |
| $35,000 to $49,999 | 50 | 9.2% |
| $50,000 to $74,999 | 152 | 28.1% |
| $75,000 to $99,999 | 59 | 10.9% |
| $100,000 to $149,999 | 69 | 12.8% |
| $150,000 to $199,999 | 47 | 8.7% |
| $200,000+ | 8 | 1.5% |
Family Income by Famaliy Size in Ashville
4-person families (42 | 7.8%) account for the highest median family income in Ashville with $58,971 per family, while 2-person families (259 | 47.9%) have the highest median income of $25,812 per family member.
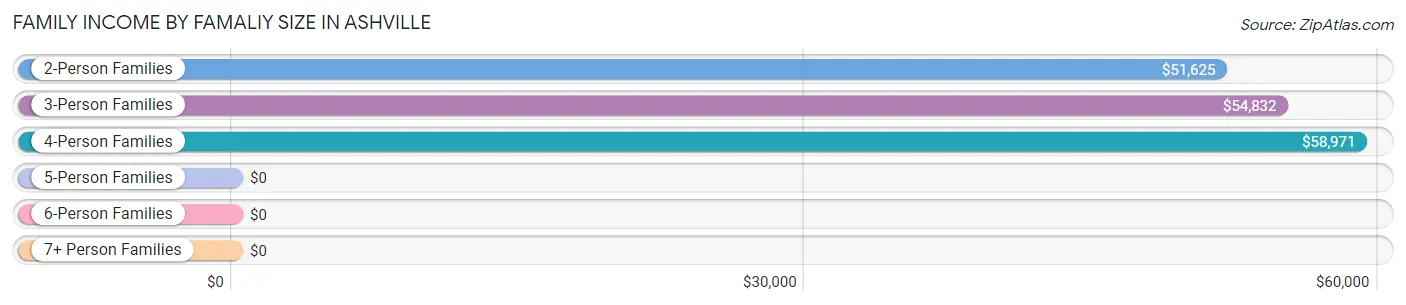
| Income Bracket | # Families | Median Income |
| 2-Person Families | 259 (47.9%) | $51,625 |
| 3-Person Families | 187 (34.6%) | $54,832 |
| 4-Person Families | 42 (7.8%) | $58,971 |
| 5-Person Families | 17 (3.1%) | $0 |
| 6-Person Families | 7 (1.3%) | $0 |
| 7+ Person Families | 29 (5.4%) | $0 |
| Total | 541 (100.0%) | $54,771 |
Family Income by Number of Earners in Ashville
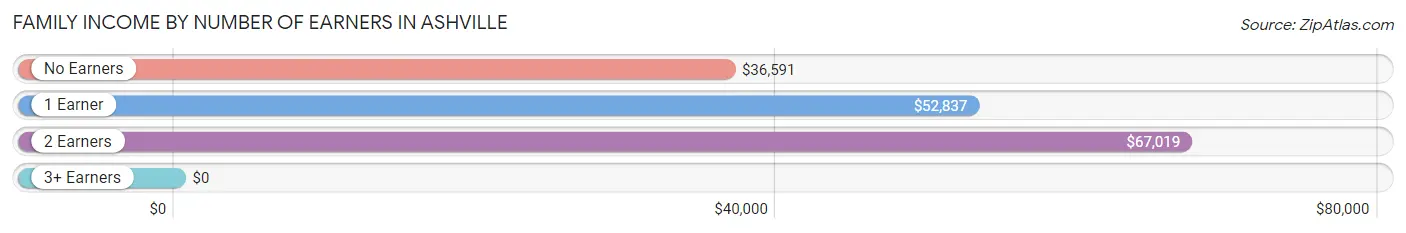
| Number of Earners | # Families | Median Income |
| No Earners | 88 (16.3%) | $36,591 |
| 1 Earner | 228 (42.1%) | $52,837 |
| 2 Earners | 193 (35.7%) | $67,019 |
| 3+ Earners | 32 (5.9%) | $0 |
| Total | 541 (100.0%) | $54,771 |
Household Income in Ashville
Household Income Brackets in Ashville
With 220 households falling in the category, the $50,000 to $74,999 income range is the most frequent in Ashville, accounting for 28.3% of all households. In contrast, only 9 households (1.2%) fall into the $200,000+ income bracket, making it the least populous group.
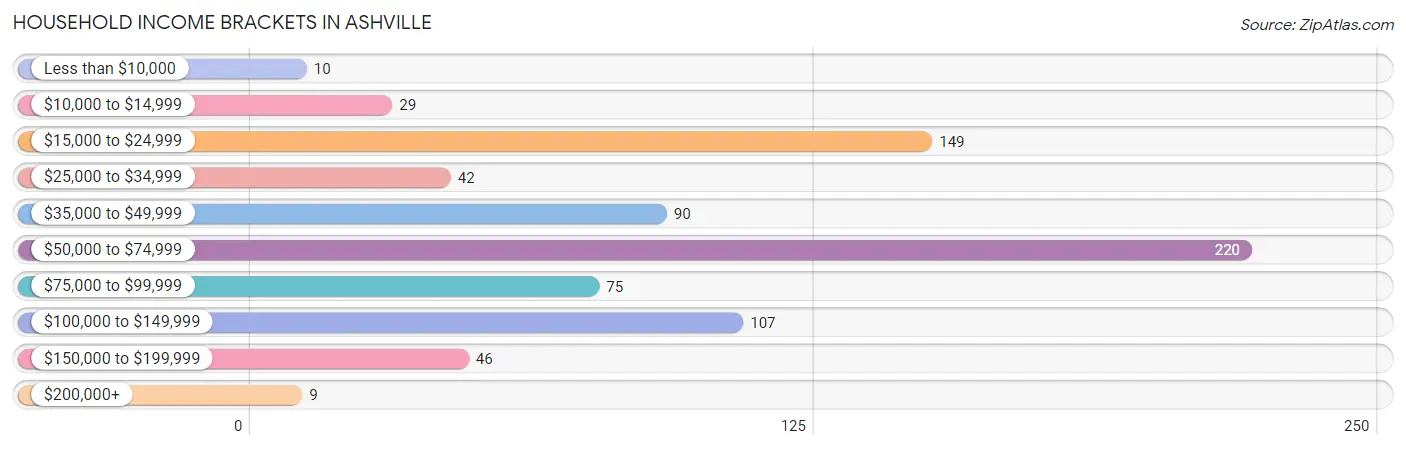
| Income Bracket | # Households | % Households |
| Less than $10,000 | 10 | 1.3% |
| $10,000 to $14,999 | 29 | 3.7% |
| $15,000 to $24,999 | 149 | 19.2% |
| $25,000 to $34,999 | 42 | 5.4% |
| $35,000 to $49,999 | 90 | 11.6% |
| $50,000 to $74,999 | 220 | 28.3% |
| $75,000 to $99,999 | 75 | 9.7% |
| $100,000 to $149,999 | 107 | 13.8% |
| $150,000 to $199,999 | 46 | 5.9% |
| $200,000+ | 9 | 1.2% |
Household Income by Householder Age in Ashville
The median household income in Ashville is $54,785, with the highest median household income of $59,489 found in the 45 to 64 years age bracket for the primary householder. A total of 271 households (34.9%) fall into this category.
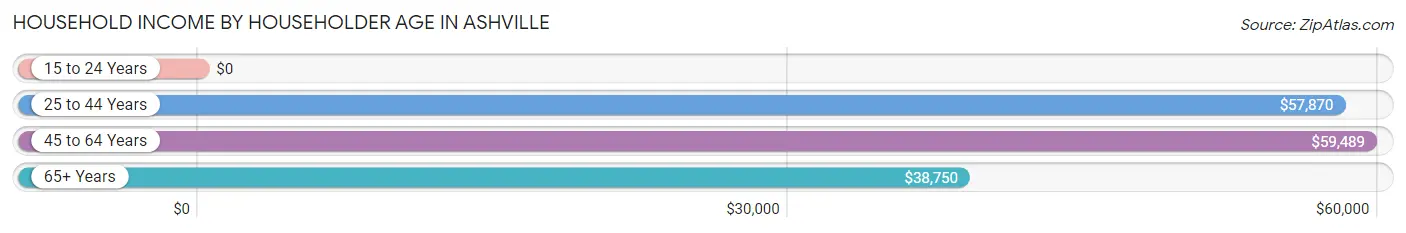
| Income Bracket | # Households | Median Income |
| 15 to 24 Years | 0 (0.0%) | $0 |
| 25 to 44 Years | 218 (28.1%) | $57,870 |
| 45 to 64 Years | 271 (34.9%) | $59,489 |
| 65+ Years | 288 (37.1%) | $38,750 |
| Total | 777 (100.0%) | $54,785 |
Poverty in Ashville
Income Below Poverty by Sex and Age in Ashville
With 18.8% poverty level for males and 25.8% for females among the residents of Ashville, 16 and 17 year old males and 45 to 54 year old females are the most vulnerable to poverty, with 33 males (71.7%) and 127 females (61.4%) in their respective age groups living below the poverty level.
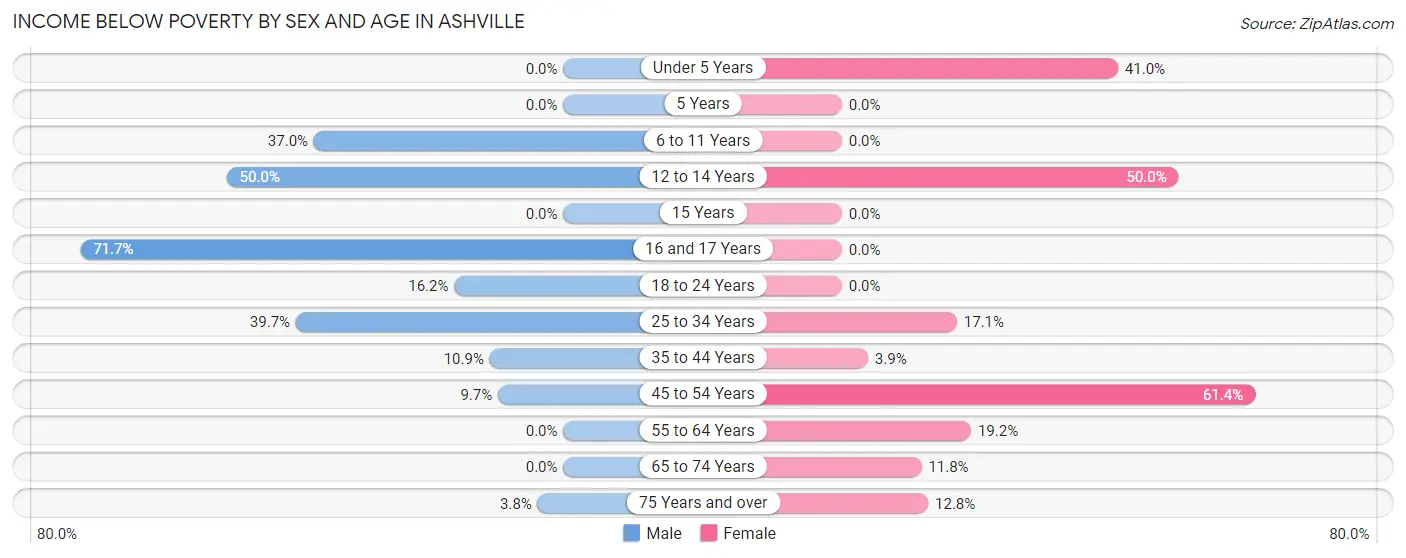
| Age Bracket | Male | Female |
| Under 5 Years | 0 (0.0%) | 41 (41.0%) |
| 5 Years | 0 (0.0%) | 0 (0.0%) |
| 6 to 11 Years | 60 (37.0%) | 0 (0.0%) |
| 12 to 14 Years | 30 (50.0%) | 26 (50.0%) |
| 15 Years | 0 (0.0%) | 0 (0.0%) |
| 16 and 17 Years | 33 (71.7%) | 0 (0.0%) |
| 18 to 24 Years | 23 (16.2%) | 0 (0.0%) |
| 25 to 34 Years | 54 (39.7%) | 27 (17.1%) |
| 35 to 44 Years | 27 (10.9%) | 5 (3.9%) |
| 45 to 54 Years | 16 (9.7%) | 127 (61.4%) |
| 55 to 64 Years | 0 (0.0%) | 14 (19.2%) |
| 65 to 74 Years | 0 (0.0%) | 20 (11.8%) |
| 75 Years and over | 4 (3.8%) | 5 (12.8%) |
| Total | 247 (18.8%) | 265 (25.8%) |
Income Above Poverty by Sex and Age in Ashville
According to the poverty statistics in Ashville, males aged 15 years and females aged 5 years are the age groups that are most secure financially, with 100.0% of males and 100.0% of females in these age groups living above the poverty line.
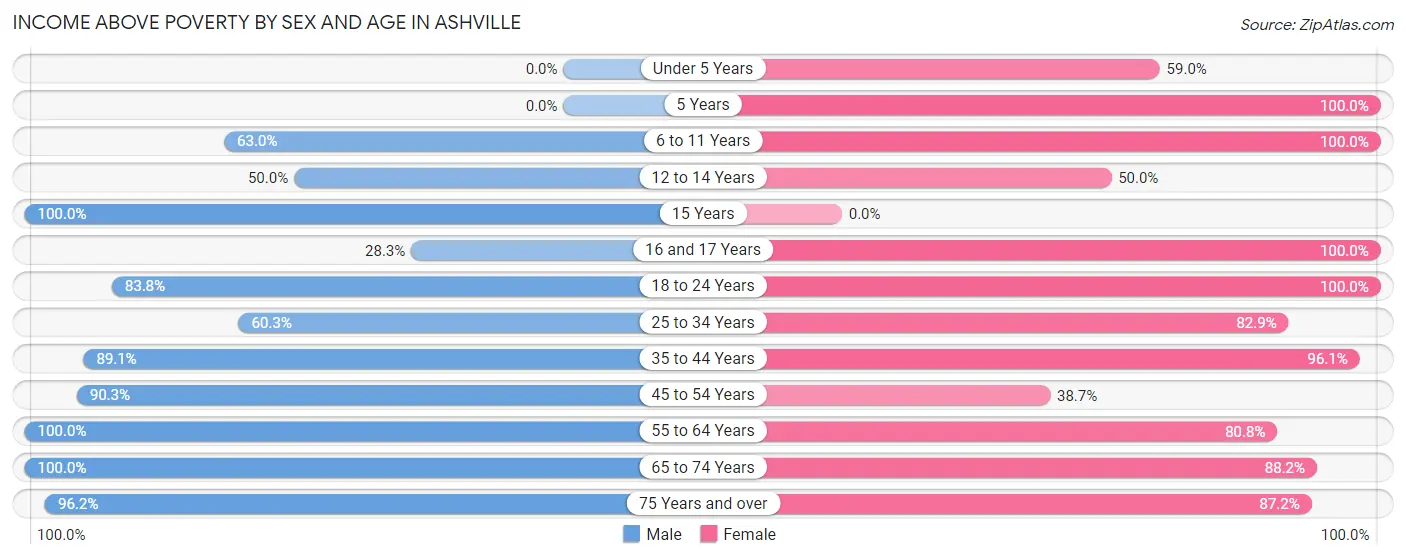
| Age Bracket | Male | Female |
| Under 5 Years | 0 (0.0%) | 59 (59.0%) |
| 5 Years | 0 (0.0%) | 12 (100.0%) |
| 6 to 11 Years | 102 (63.0%) | 20 (100.0%) |
| 12 to 14 Years | 30 (50.0%) | 26 (50.0%) |
| 15 Years | 59 (100.0%) | 0 (0.0%) |
| 16 and 17 Years | 13 (28.3%) | 16 (100.0%) |
| 18 to 24 Years | 119 (83.8%) | 53 (100.0%) |
| 25 to 34 Years | 82 (60.3%) | 131 (82.9%) |
| 35 to 44 Years | 220 (89.1%) | 124 (96.1%) |
| 45 to 54 Years | 149 (90.3%) | 80 (38.7%) |
| 55 to 64 Years | 130 (100.0%) | 59 (80.8%) |
| 65 to 74 Years | 61 (100.0%) | 149 (88.2%) |
| 75 Years and over | 101 (96.2%) | 34 (87.2%) |
| Total | 1,066 (81.2%) | 763 (74.2%) |
Income Below Poverty Among Married-Couple Families in Ashville
The poverty statistics for married-couple families in Ashville show that 7.4% or 17 of the total 231 families live below the poverty line. Families with no children have the highest poverty rate of 10.2%, comprising of 17 families. On the other hand, families with 1 or 2 children have the lowest poverty rate of 0.0%, which includes 0 families.
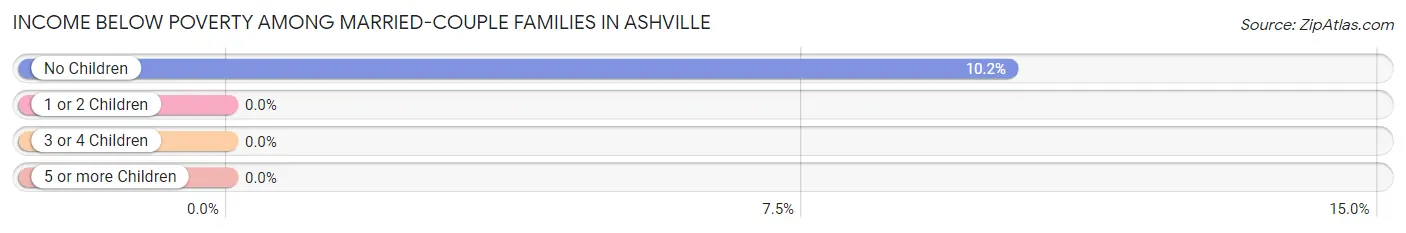
| Children | Above Poverty | Below Poverty |
| No Children | 150 (89.8%) | 17 (10.2%) |
| 1 or 2 Children | 58 (100.0%) | 0 (0.0%) |
| 3 or 4 Children | 6 (100.0%) | 0 (0.0%) |
| 5 or more Children | 0 (0.0%) | 0 (0.0%) |
| Total | 214 (92.6%) | 17 (7.4%) |
Income Below Poverty Among Single-Parent Households in Ashville
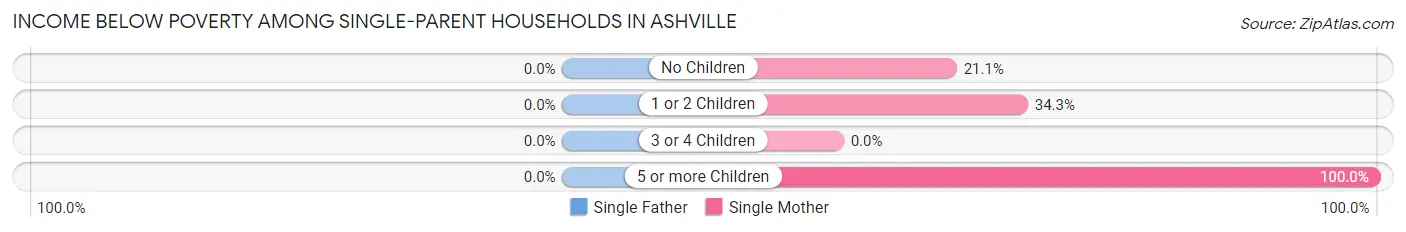
| Children | Single Father | Single Mother |
| No Children | 0 (0.0%) | 20 (21.0%) |
| 1 or 2 Children | 0 (0.0%) | 24 (34.3%) |
| 3 or 4 Children | 0 (0.0%) | 0 (0.0%) |
| 5 or more Children | 0 (0.0%) | 27 (100.0%) |
| Total | 0 (0.0%) | 71 (36.8%) |
Income Below Poverty Among Married-Couple vs Single-Parent Households in Ashville
The poverty data for Ashville shows that 17 of the married-couple family households (7.4%) and 71 of the single-parent households (22.9%) are living below the poverty level. Within the married-couple family households, those with no children have the highest poverty rate, with 17 households (10.2%) falling below the poverty line. Among the single-parent households, those with 5 or more children have the highest poverty rate, with 27 household (100.0%) living below poverty.
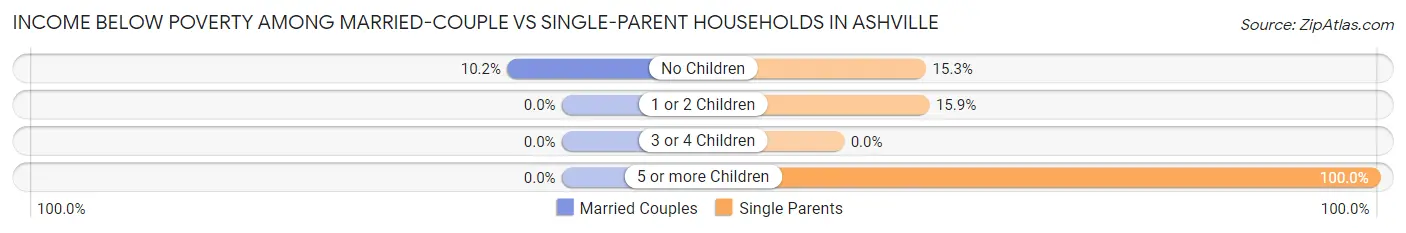
| Children | Married-Couple Families | Single-Parent Households |
| No Children | 17 (10.2%) | 20 (15.3%) |
| 1 or 2 Children | 0 (0.0%) | 24 (15.9%) |
| 3 or 4 Children | 0 (0.0%) | 0 (0.0%) |
| 5 or more Children | 0 (0.0%) | 27 (100.0%) |
| Total | 17 (7.4%) | 71 (22.9%) |
Race in Ashville
The most populous races in Ashville are White / Caucasian (1,899 | 77.9%), Black / African American (488 | 20.0%), and Hispanic or Latino (49 | 2.0%).
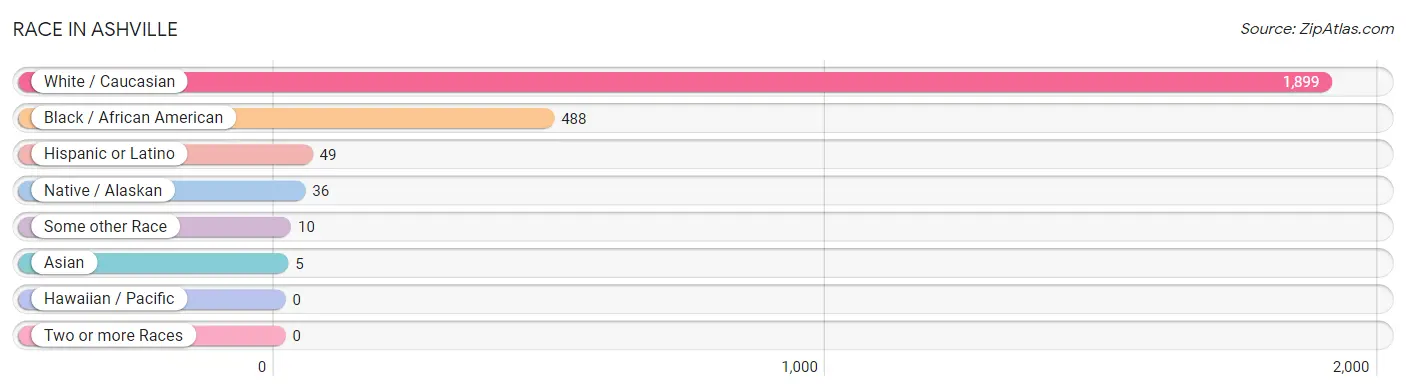
| Race | # Population | % Population |
| Asian | 5 | 0.2% |
| Black / African American | 488 | 20.0% |
| Hawaiian / Pacific | 0 | 0.0% |
| Hispanic or Latino | 49 | 2.0% |
| Native / Alaskan | 36 | 1.5% |
| White / Caucasian | 1,899 | 77.9% |
| Two or more Races | 0 | 0.0% |
| Some other Race | 10 | 0.4% |
| Total | 2,438 | 100.0% |
Ancestry in Ashville
The most populous ancestries reported in Ashville are English (244 | 10.0%), American (211 | 8.6%), Irish (171 | 7.0%), German (86 | 3.5%), and Cherokee (36 | 1.5%), together accounting for 30.7% of all Ashville residents.
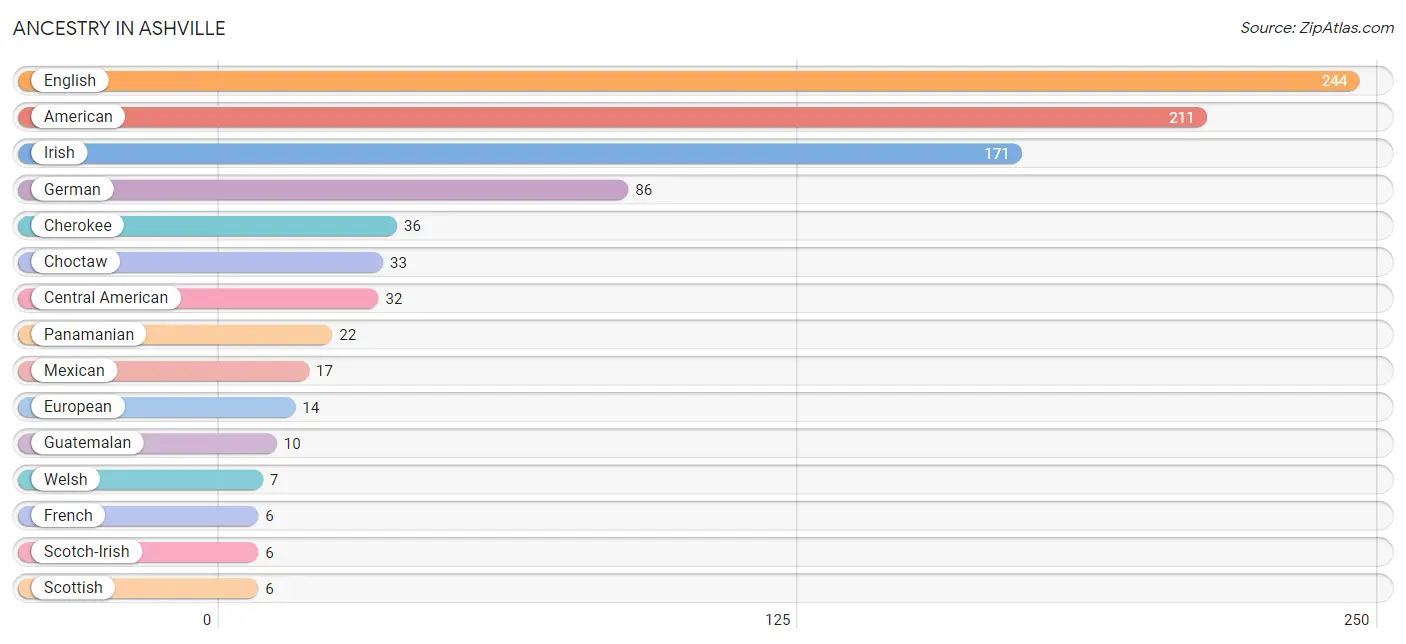
| Ancestry | # Population | % Population |
| American | 211 | 8.6% |
| Bhutanese | 5 | 0.2% |
| Celtic | 3 | 0.1% |
| Central American | 32 | 1.3% |
| Cherokee | 36 | 1.5% |
| Choctaw | 33 | 1.3% |
| Danish | 3 | 0.1% |
| English | 244 | 10.0% |
| European | 14 | 0.6% |
| French | 6 | 0.3% |
| German | 86 | 3.5% |
| Guatemalan | 10 | 0.4% |
| Irish | 171 | 7.0% |
| Mexican | 17 | 0.7% |
| Panamanian | 22 | 0.9% |
| Scotch-Irish | 6 | 0.3% |
| Scottish | 6 | 0.3% |
| Welsh | 7 | 0.3% | View All 18 Rows |
Immigrants in Ashville
The most numerous immigrant groups reported in Ashville came from Central America (42 | 1.7%), Latin America (42 | 1.7%), Panama (22 | 0.9%), Guatemala (10 | 0.4%), and Mexico (10 | 0.4%), together accounting for 5.2% of all Ashville residents.
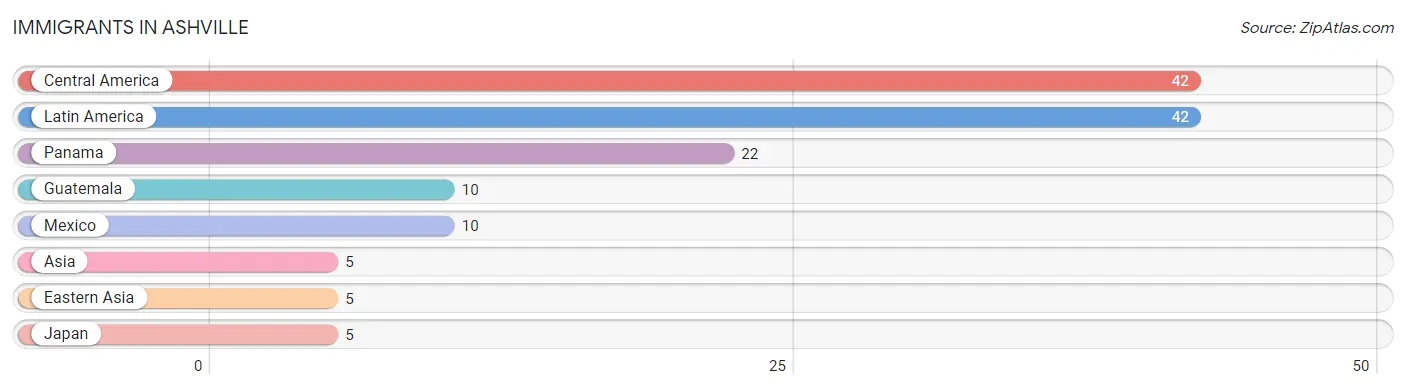
| Immigration Origin | # Population | % Population |
| Asia | 5 | 0.2% |
| Central America | 42 | 1.7% |
| Eastern Asia | 5 | 0.2% |
| Guatemala | 10 | 0.4% |
| Japan | 5 | 0.2% |
| Latin America | 42 | 1.7% |
| Mexico | 10 | 0.4% |
| Panama | 22 | 0.9% | View All 8 Rows |
Sex and Age in Ashville
Sex and Age in Ashville
The most populous age groups in Ashville are 15 to 19 Years (192 | 13.8%) for men and 50 to 54 Years (161 | 15.3%) for women.
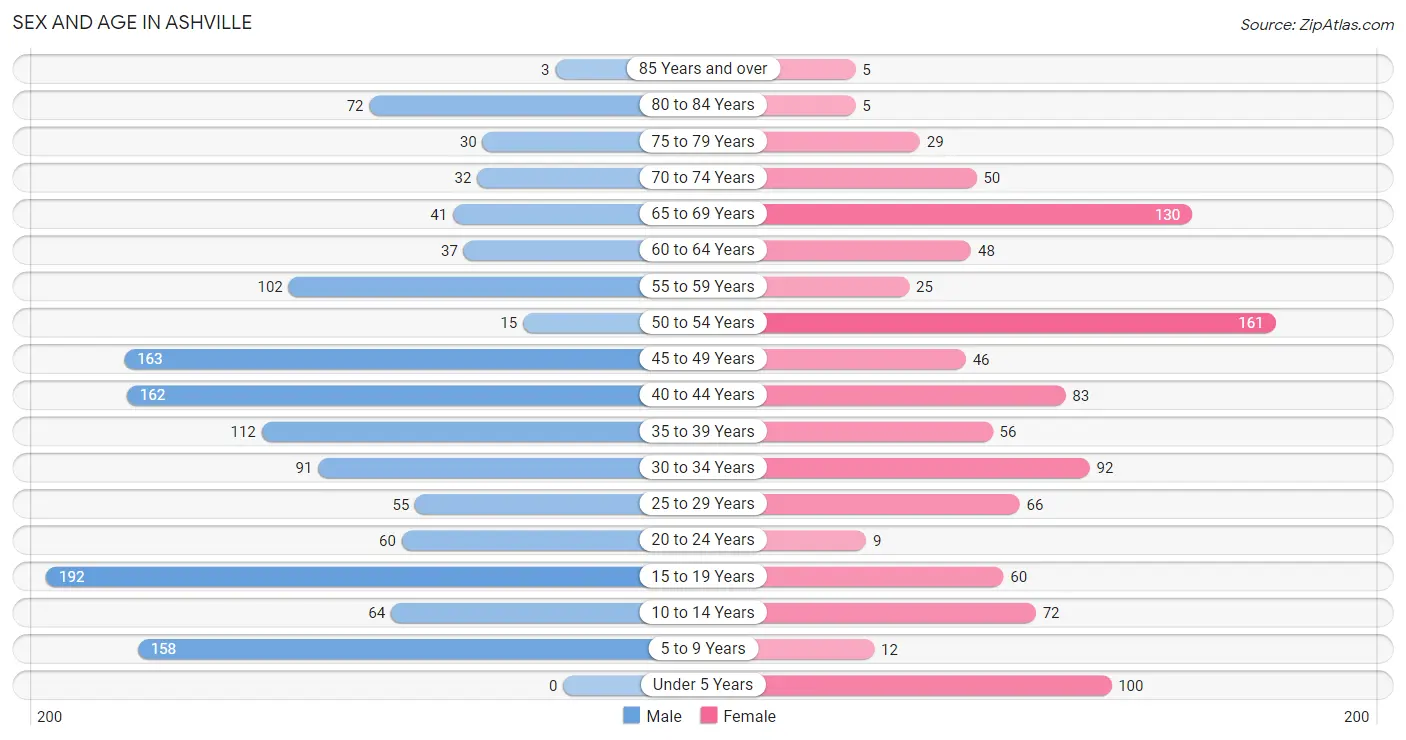
| Age Bracket | Male | Female |
| Under 5 Years | 0 (0.0%) | 100 (9.5%) |
| 5 to 9 Years | 158 (11.4%) | 12 (1.1%) |
| 10 to 14 Years | 64 (4.6%) | 72 (6.9%) |
| 15 to 19 Years | 192 (13.8%) | 60 (5.7%) |
| 20 to 24 Years | 60 (4.3%) | 9 (0.9%) |
| 25 to 29 Years | 55 (4.0%) | 66 (6.3%) |
| 30 to 34 Years | 91 (6.6%) | 92 (8.8%) |
| 35 to 39 Years | 112 (8.1%) | 56 (5.3%) |
| 40 to 44 Years | 162 (11.7%) | 83 (7.9%) |
| 45 to 49 Years | 163 (11.7%) | 46 (4.4%) |
| 50 to 54 Years | 15 (1.1%) | 161 (15.3%) |
| 55 to 59 Years | 102 (7.3%) | 25 (2.4%) |
| 60 to 64 Years | 37 (2.7%) | 48 (4.6%) |
| 65 to 69 Years | 41 (2.9%) | 130 (12.4%) |
| 70 to 74 Years | 32 (2.3%) | 50 (4.8%) |
| 75 to 79 Years | 30 (2.2%) | 29 (2.8%) |
| 80 to 84 Years | 72 (5.2%) | 5 (0.5%) |
| 85 Years and over | 3 (0.2%) | 5 (0.5%) |
| Total | 1,389 (100.0%) | 1,049 (100.0%) |
Families and Households in Ashville
Median Family Size in Ashville
The median family size in Ashville is 3.36 persons per family, with single female/mother families (193 | 35.7%) accounting for the largest median family size of 3.96 persons per family. On the other hand, married-couple families (231 | 42.7%) represent the smallest median family size with 2.90 persons per family.
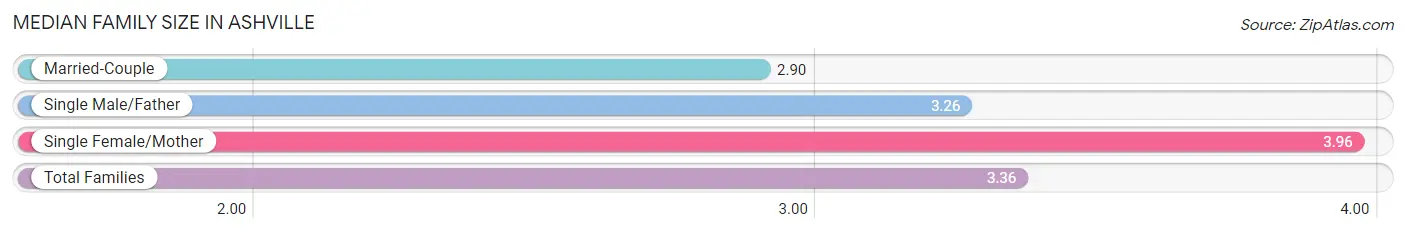
| Family Type | # Families | Family Size |
| Married-Couple | 231 (42.7%) | 2.90 |
| Single Male/Father | 117 (21.6%) | 3.26 |
| Single Female/Mother | 193 (35.7%) | 3.96 |
| Total Families | 541 (100.0%) | 3.36 |
Median Household Size in Ashville
The median household size in Ashville is 3.01 persons per household, with single female/mother households (193 | 24.8%) accounting for the largest median household size of 5.2 persons per household. non-family households (236 | 30.4%) represent the smallest median household size with 1.21 persons per household.
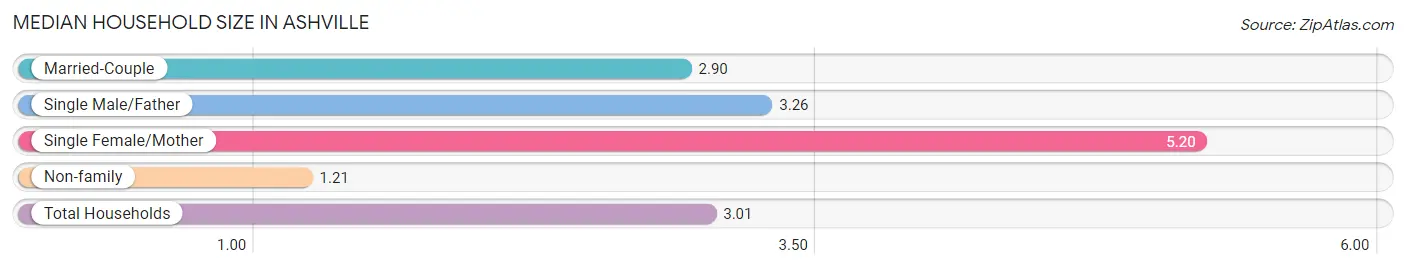
| Household Type | # Households | Household Size |
| Married-Couple | 231 (29.7%) | 2.90 |
| Single Male/Father | 117 (15.1%) | 3.26 |
| Single Female/Mother | 193 (24.8%) | 5.20 |
| Non-family | 236 (30.4%) | 1.21 |
| Total Households | 777 (100.0%) | 3.01 |
Household Size by Marriage Status in Ashville
Out of a total of 777 households in Ashville, 541 (69.6%) are family households, while 236 (30.4%) are nonfamily households. The most numerous type of family households are 2-person households, comprising 240, and the most common type of nonfamily households are 1-person households, comprising 196.

| Household Size | Family Households | Nonfamily Households |
| 1-Person Households | - | 196 (25.2%) |
| 2-Person Households | 240 (30.9%) | 40 (5.1%) |
| 3-Person Households | 192 (24.7%) | 0 (0.0%) |
| 4-Person Households | 56 (7.2%) | 0 (0.0%) |
| 5-Person Households | 17 (2.2%) | 0 (0.0%) |
| 6-Person Households | 6 (0.8%) | 0 (0.0%) |
| 7+ Person Households | 30 (3.9%) | 0 (0.0%) |
| Total | 541 (69.6%) | 236 (30.4%) |
Female Fertility in Ashville
Fertility by Age in Ashville
Average fertility rate in Ashville is 50.0 births per 1,000 women. Women in the age bracket of 20 to 34 years have the highest fertility rate with 138.0 births per 1,000 women. Women in the age bracket of 20 to 34 years acount for 100.0% of all women with births.
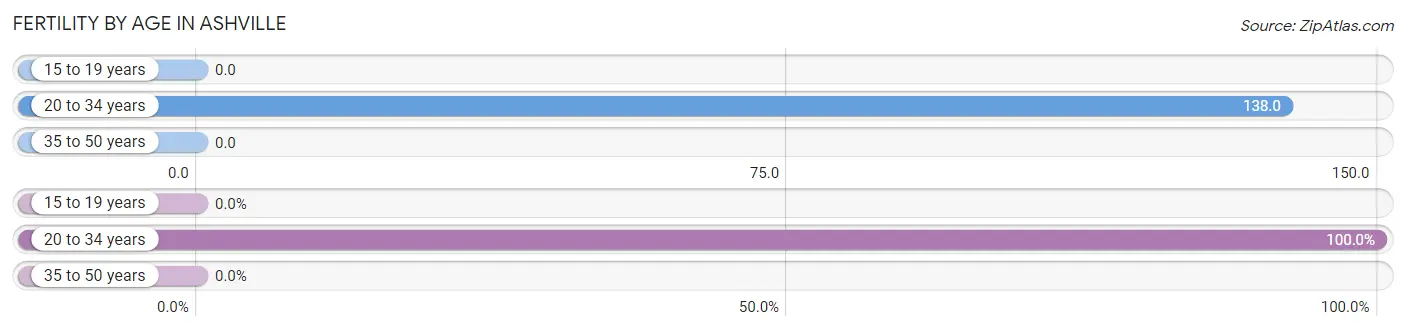
| Age Bracket | Women with Births | Births / 1,000 Women |
| 15 to 19 years | 0 (0.0%) | 0.0 |
| 20 to 34 years | 23 (100.0%) | 138.0 |
| 35 to 50 years | 0 (0.0%) | 0.0 |
| Total | 23 (100.0%) | 50.0 |
Fertility by Age by Marriage Status in Ashville
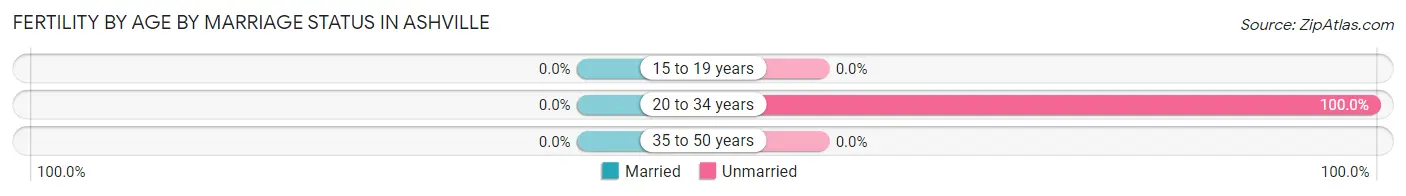
| Age Bracket | Married | Unmarried |
| 15 to 19 years | 0 (0.0%) | 0 (0.0%) |
| 20 to 34 years | 0 (0.0%) | 23 (100.0%) |
| 35 to 50 years | 0 (0.0%) | 0 (0.0%) |
| Total | 0 (0.0%) | 23 (100.0%) |
Fertility by Education in Ashville
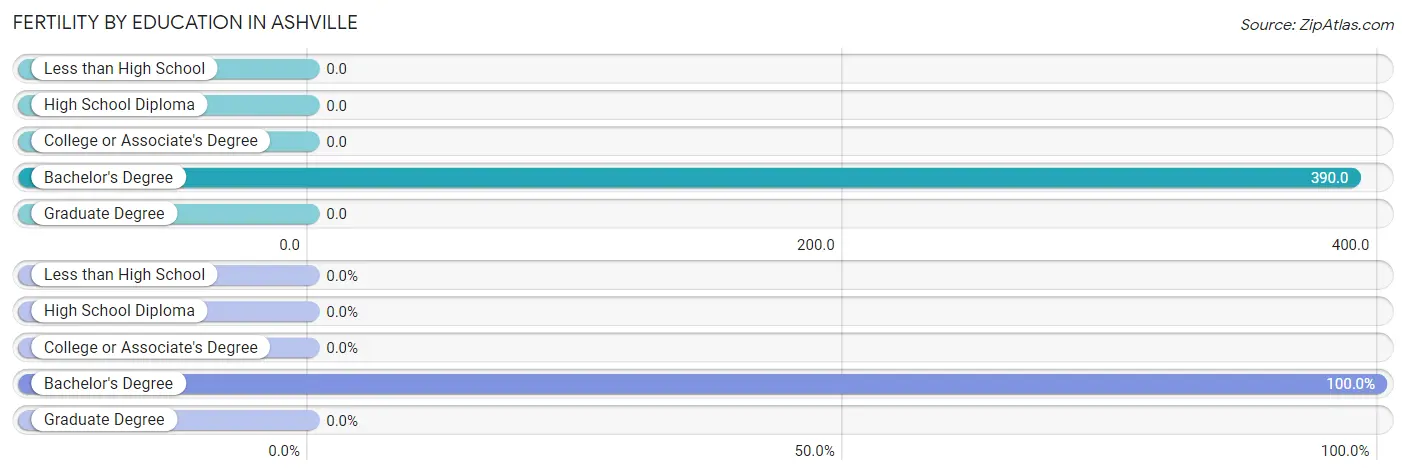
| Educational Attainment | Women with Births | Births / 1,000 Women |
| Less than High School | 0 (0.0%) | 0.0 |
| High School Diploma | 0 (0.0%) | 0.0 |
| College or Associate's Degree | 0 (0.0%) | 0.0 |
| Bachelor's Degree | 23 (100.0%) | 390.0 |
| Graduate Degree | 0 (0.0%) | 0.0 |
| Total | 23 (100.0%) | 50.0 |
Fertility by Education by Marriage Status in Ashville
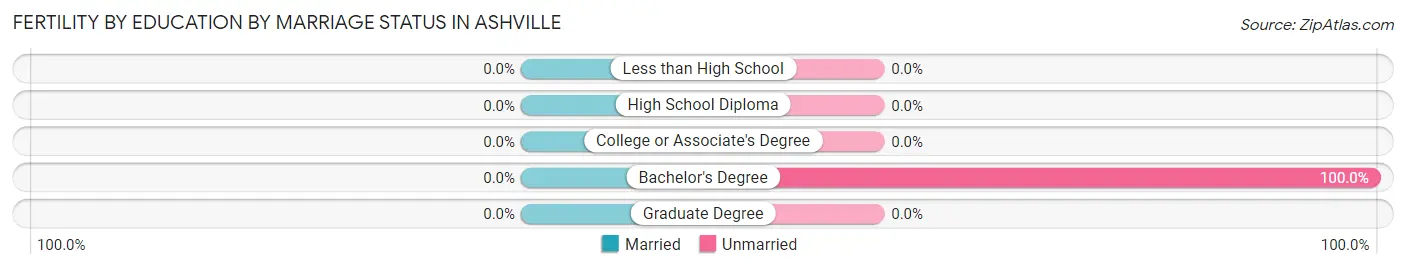
| Educational Attainment | Married | Unmarried |
| Less than High School | 0 (0.0%) | 0 (0.0%) |
| High School Diploma | 0 (0.0%) | 0 (0.0%) |
| College or Associate's Degree | 0 (0.0%) | 0 (0.0%) |
| Bachelor's Degree | 0 (0.0%) | 23 (100.0%) |
| Graduate Degree | 0 (0.0%) | 0 (0.0%) |
| Total | 0 (0.0%) | 23 (100.0%) |
Employment Characteristics in Ashville
Employment by Class of Employer in Ashville
Among the 1,049 employed individuals in Ashville, private company employees (828 | 78.9%), local government employees (156 | 14.9%), and not-for-profit organizations (24 | 2.3%) make up the most common classes of employment.
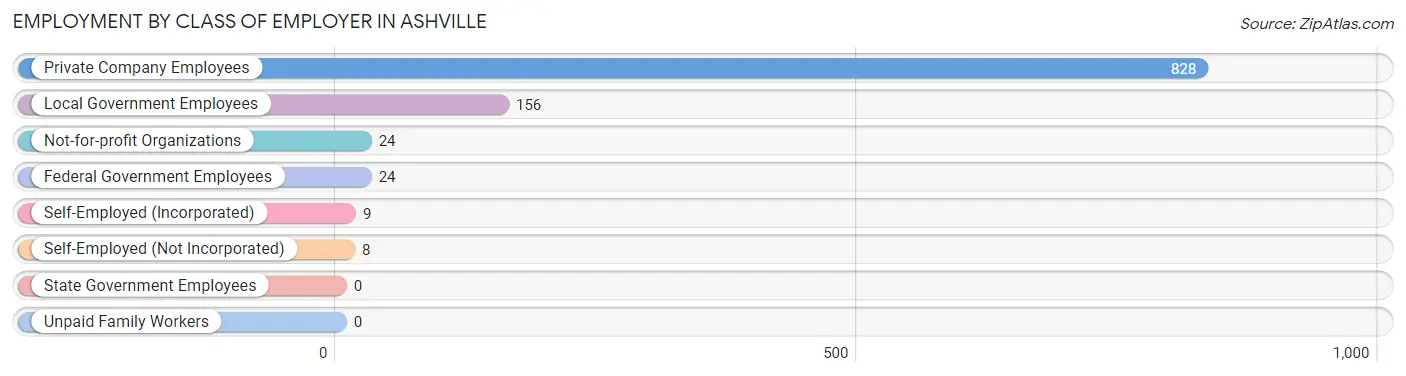
| Employer Class | # Employees | % Employees |
| Private Company Employees | 828 | 78.9% |
| Self-Employed (Incorporated) | 9 | 0.9% |
| Self-Employed (Not Incorporated) | 8 | 0.8% |
| Not-for-profit Organizations | 24 | 2.3% |
| Local Government Employees | 156 | 14.9% |
| State Government Employees | 0 | 0.0% |
| Federal Government Employees | 24 | 2.3% |
| Unpaid Family Workers | 0 | 0.0% |
| Total | 1,049 | 100.0% |
Employment Status by Age in Ashville
According to the labor force statistics for Ashville, out of the total population over 16 years of age (1,973), 56.5% or 1,115 individuals are in the labor force, with 0.7% or 8 of them unemployed. The age group with the highest labor force participation rate is 30 to 34 years, with 88.0% or 161 individuals in the labor force. Within the labor force, the 16 to 19 years age range has the highest percentage of unemployed individuals, with 11.4% or 8 of them being unemployed.
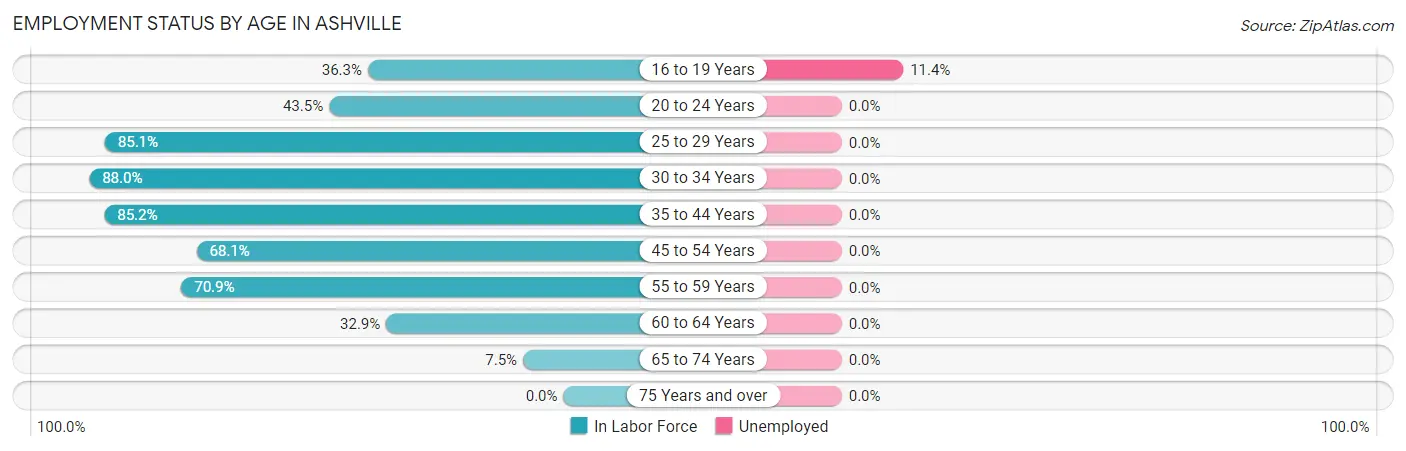
| Age Bracket | In Labor Force | Unemployed |
| 16 to 19 Years | 70 (36.3%) | 8 (11.4%) |
| 20 to 24 Years | 30 (43.5%) | 0 (0.0%) |
| 25 to 29 Years | 103 (85.1%) | 0 (0.0%) |
| 30 to 34 Years | 161 (88.0%) | 0 (0.0%) |
| 35 to 44 Years | 352 (85.2%) | 0 (0.0%) |
| 45 to 54 Years | 262 (68.1%) | 0 (0.0%) |
| 55 to 59 Years | 90 (70.9%) | 0 (0.0%) |
| 60 to 64 Years | 28 (32.9%) | 0 (0.0%) |
| 65 to 74 Years | 19 (7.5%) | 0 (0.0%) |
| 75 Years and over | 0 (0.0%) | 0 (0.0%) |
| Total | 1,115 (56.5%) | 8 (0.7%) |
Employment Status by Educational Attainment in Ashville
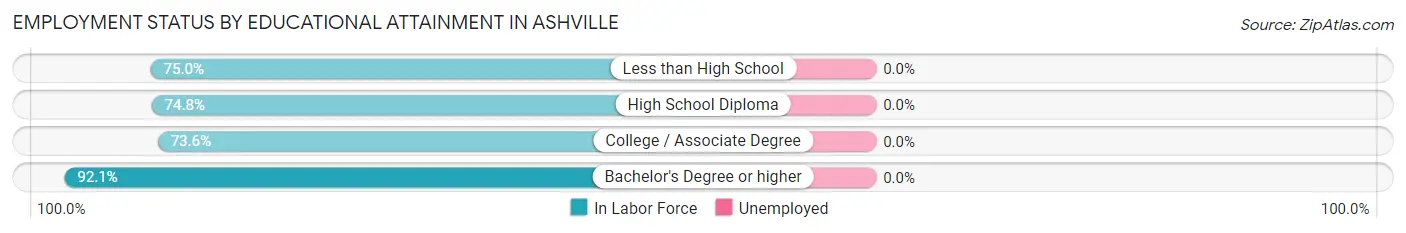
| Educational Attainment | In Labor Force | Unemployed |
| Less than High School | 186 (75.0%) | 0 (0.0%) |
| High School Diploma | 279 (74.8%) | 0 (0.0%) |
| College / Associate Degree | 426 (73.6%) | 0 (0.0%) |
| Bachelor's Degree or higher | 105 (92.1%) | 0 (0.0%) |
| Total | 996 (75.8%) | 0 (0.0%) |
Employment Occupations by Sex in Ashville
Management, Business, Science and Arts Occupations
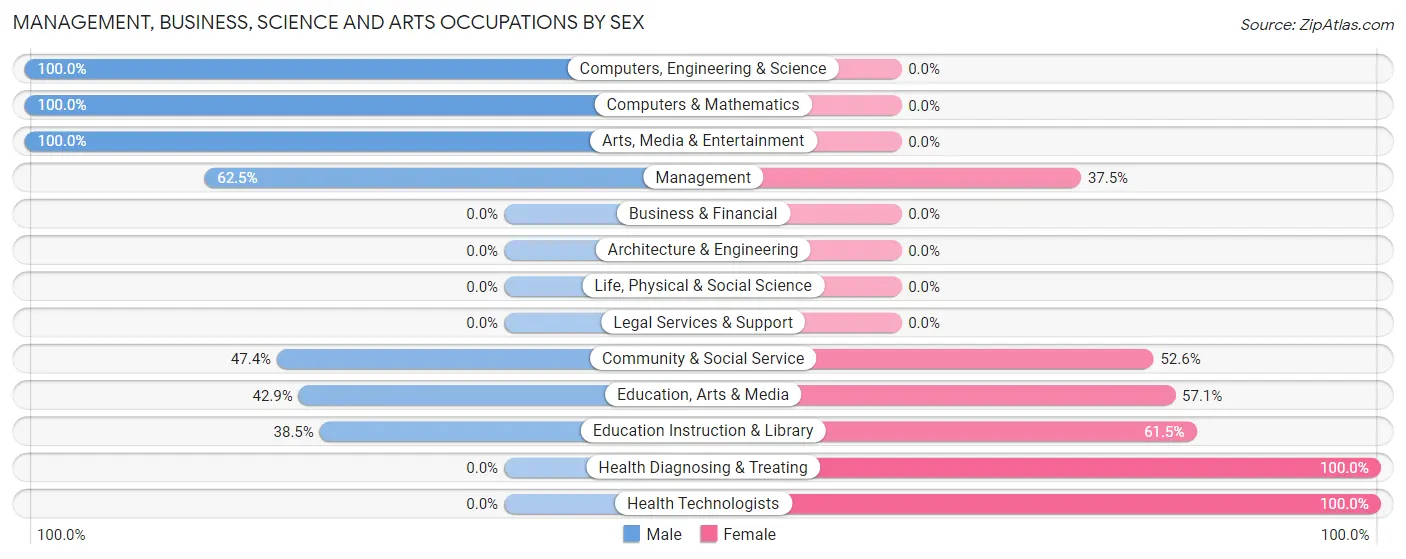
The most common Management, Business, Science and Arts occupations in Ashville are Community & Social Service (76 | 6.9%), Management (64 | 5.8%), Education Instruction & Library (52 | 4.7%), Health Diagnosing & Treating (45 | 4.1%), and Health Technologists (32 | 2.9%).
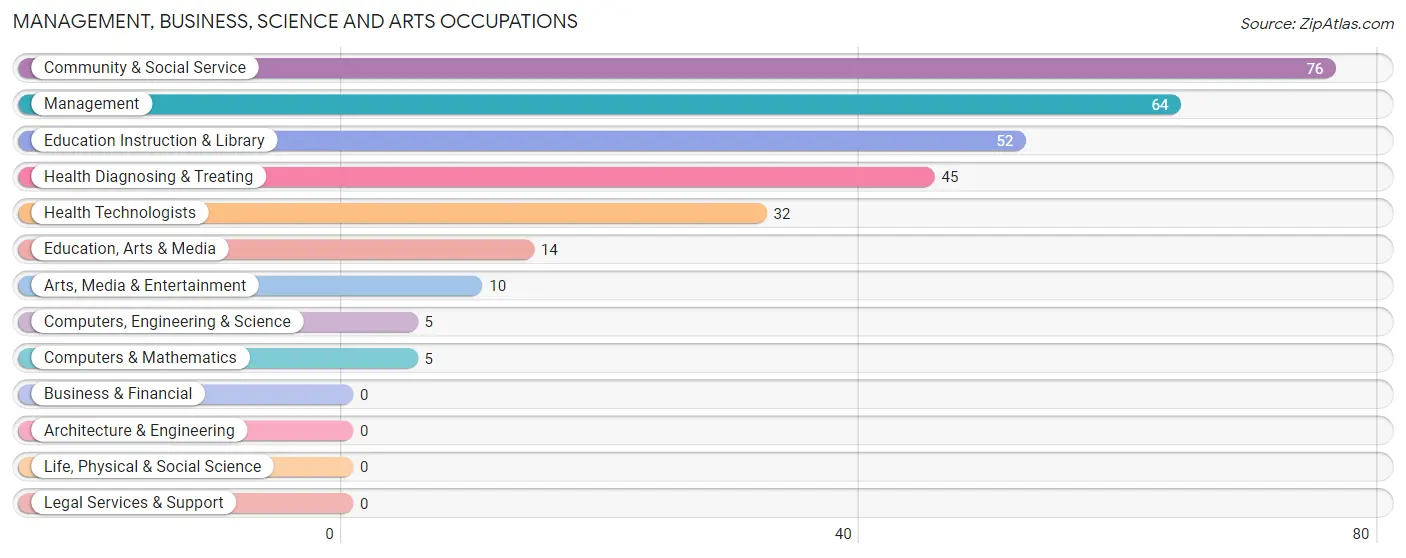
Management, Business, Science and Arts Occupations by Sex
Within the Management, Business, Science and Arts occupations in Ashville, the most male-oriented occupations are Computers, Engineering & Science (100.0%), Computers & Mathematics (100.0%), and Arts, Media & Entertainment (100.0%), while the most female-oriented occupations are Health Diagnosing & Treating (100.0%), Health Technologists (100.0%), and Education Instruction & Library (61.5%).
| Occupation | Male | Female |
| Management | 40 (62.5%) | 24 (37.5%) |
| Business & Financial | 0 (0.0%) | 0 (0.0%) |
| Computers, Engineering & Science | 5 (100.0%) | 0 (0.0%) |
| Computers & Mathematics | 5 (100.0%) | 0 (0.0%) |
| Architecture & Engineering | 0 (0.0%) | 0 (0.0%) |
| Life, Physical & Social Science | 0 (0.0%) | 0 (0.0%) |
| Community & Social Service | 36 (47.4%) | 40 (52.6%) |
| Education, Arts & Media | 6 (42.9%) | 8 (57.1%) |
| Legal Services & Support | 0 (0.0%) | 0 (0.0%) |
| Education Instruction & Library | 20 (38.5%) | 32 (61.5%) |
| Arts, Media & Entertainment | 10 (100.0%) | 0 (0.0%) |
| Health Diagnosing & Treating | 0 (0.0%) | 45 (100.0%) |
| Health Technologists | 0 (0.0%) | 32 (100.0%) |
| Total (Category) | 81 (42.6%) | 109 (57.4%) |
| Total (Overall) | 717 (64.8%) | 390 (35.2%) |
Services Occupations
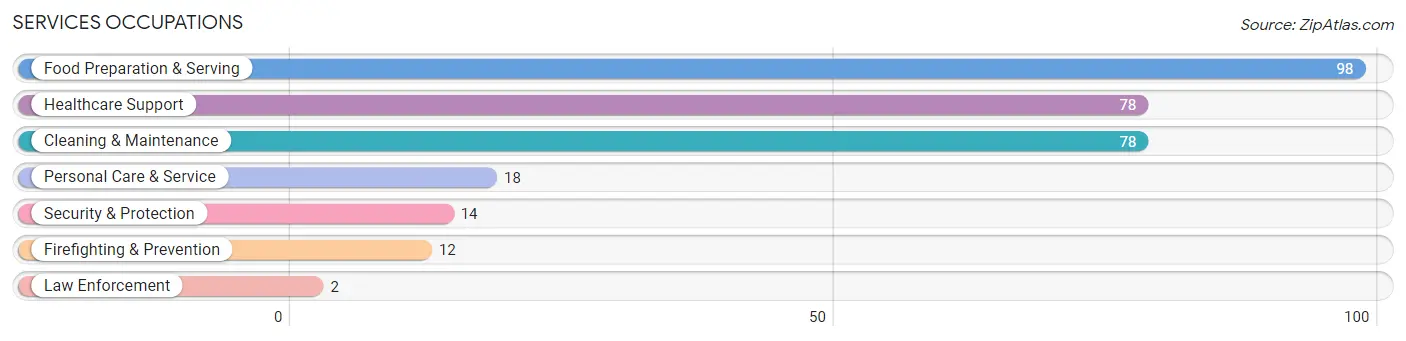
The most common Services occupations in Ashville are Food Preparation & Serving (98 | 8.8%), Healthcare Support (78 | 7.0%), Cleaning & Maintenance (78 | 7.0%), Personal Care & Service (18 | 1.6%), and Security & Protection (14 | 1.3%).
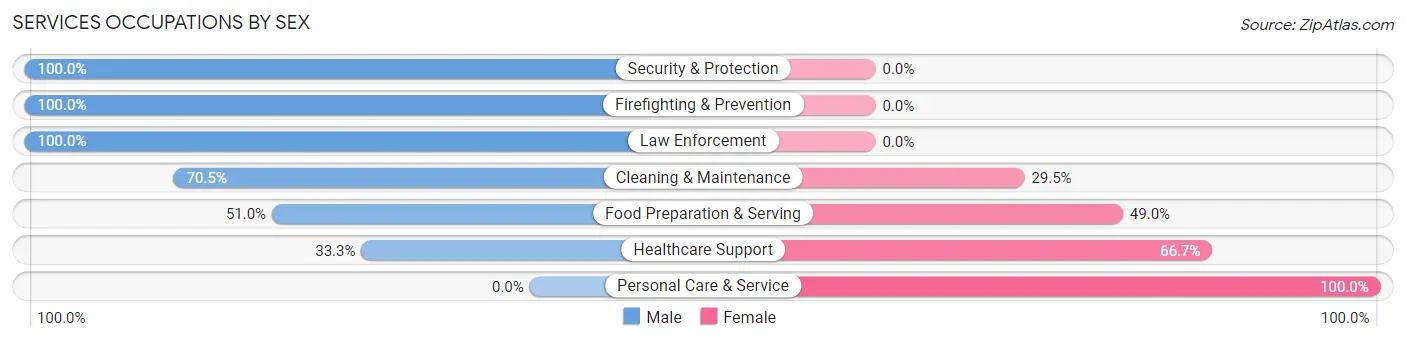
Services Occupations by Sex
Within the Services occupations in Ashville, the most male-oriented occupations are Security & Protection (100.0%), Firefighting & Prevention (100.0%), and Law Enforcement (100.0%), while the most female-oriented occupations are Personal Care & Service (100.0%), Healthcare Support (66.7%), and Food Preparation & Serving (49.0%).
| Occupation | Male | Female |
| Healthcare Support | 26 (33.3%) | 52 (66.7%) |
| Security & Protection | 14 (100.0%) | 0 (0.0%) |
| Firefighting & Prevention | 12 (100.0%) | 0 (0.0%) |
| Law Enforcement | 2 (100.0%) | 0 (0.0%) |
| Food Preparation & Serving | 50 (51.0%) | 48 (49.0%) |
| Cleaning & Maintenance | 55 (70.5%) | 23 (29.5%) |
| Personal Care & Service | 0 (0.0%) | 18 (100.0%) |
| Total (Category) | 145 (50.7%) | 141 (49.3%) |
| Total (Overall) | 717 (64.8%) | 390 (35.2%) |
Sales and Office Occupations
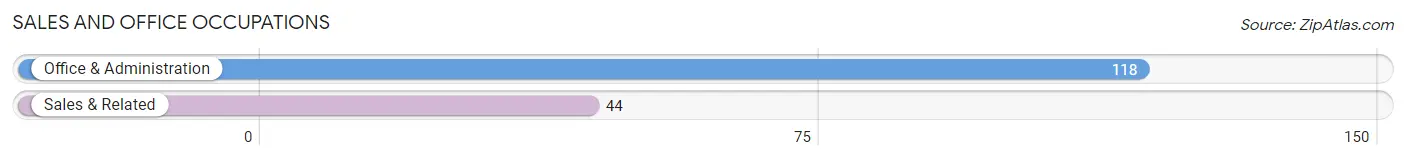
The most common Sales and Office occupations in Ashville are Office & Administration (118 | 10.7%), and Sales & Related (44 | 4.0%).
Sales and Office Occupations by Sex
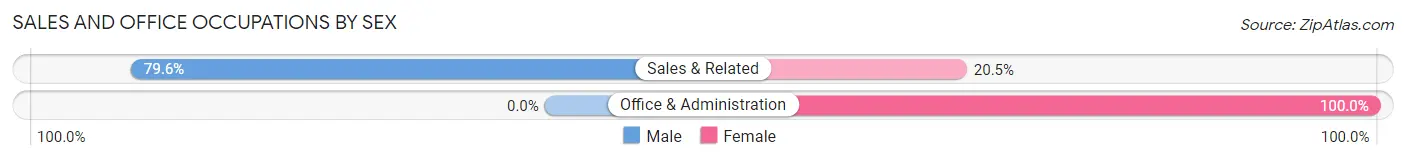
| Occupation | Male | Female |
| Sales & Related | 35 (79.5%) | 9 (20.4%) |
| Office & Administration | 0 (0.0%) | 118 (100.0%) |
| Total (Category) | 35 (21.6%) | 127 (78.4%) |
| Total (Overall) | 717 (64.8%) | 390 (35.2%) |
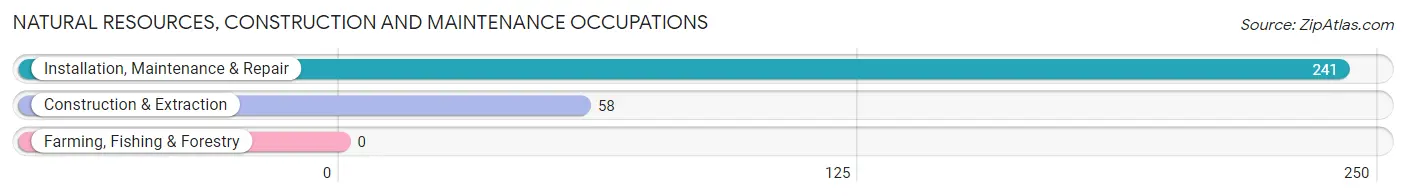
Natural Resources, Construction and Maintenance Occupations
The most common Natural Resources, Construction and Maintenance occupations in Ashville are Installation, Maintenance & Repair (241 | 21.8%), and Construction & Extraction (58 | 5.2%).
Natural Resources, Construction and Maintenance Occupations by Sex
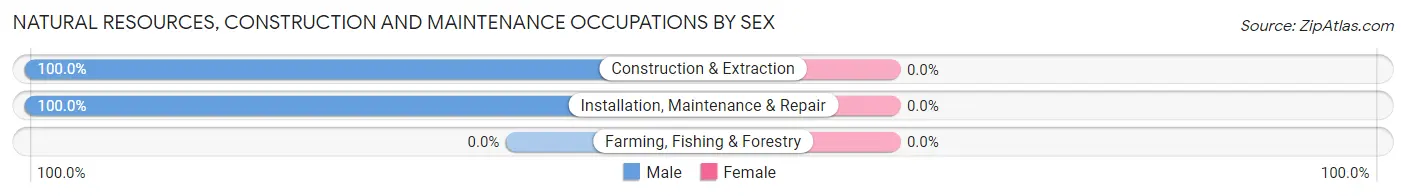
| Occupation | Male | Female |
| Farming, Fishing & Forestry | 0 (0.0%) | 0 (0.0%) |
| Construction & Extraction | 58 (100.0%) | 0 (0.0%) |
| Installation, Maintenance & Repair | 241 (100.0%) | 0 (0.0%) |
| Total (Category) | 299 (100.0%) | 0 (0.0%) |
| Total (Overall) | 717 (64.8%) | 390 (35.2%) |
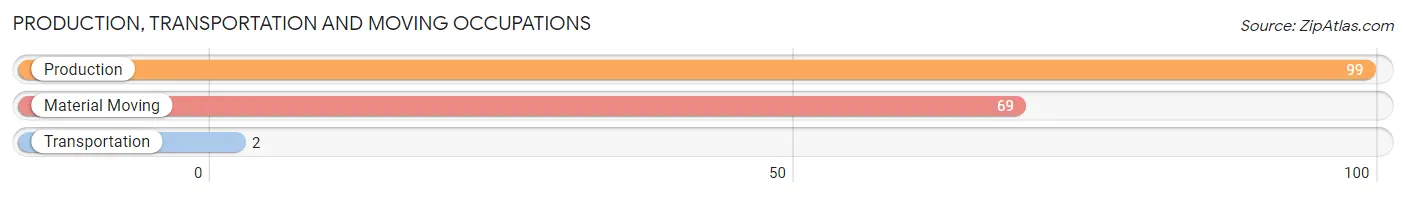
Production, Transportation and Moving Occupations
The most common Production, Transportation and Moving occupations in Ashville are Production (99 | 8.9%), Material Moving (69 | 6.2%), and Transportation (2 | 0.2%).
Production, Transportation and Moving Occupations by Sex
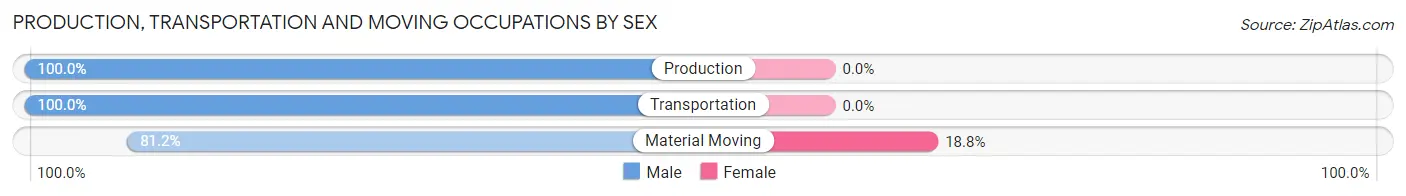
| Occupation | Male | Female |
| Production | 99 (100.0%) | 0 (0.0%) |
| Transportation | 2 (100.0%) | 0 (0.0%) |
| Material Moving | 56 (81.2%) | 13 (18.8%) |
| Total (Category) | 157 (92.3%) | 13 (7.6%) |
| Total (Overall) | 717 (64.8%) | 390 (35.2%) |
Employment Industries by Sex in Ashville
Employment Industries in Ashville
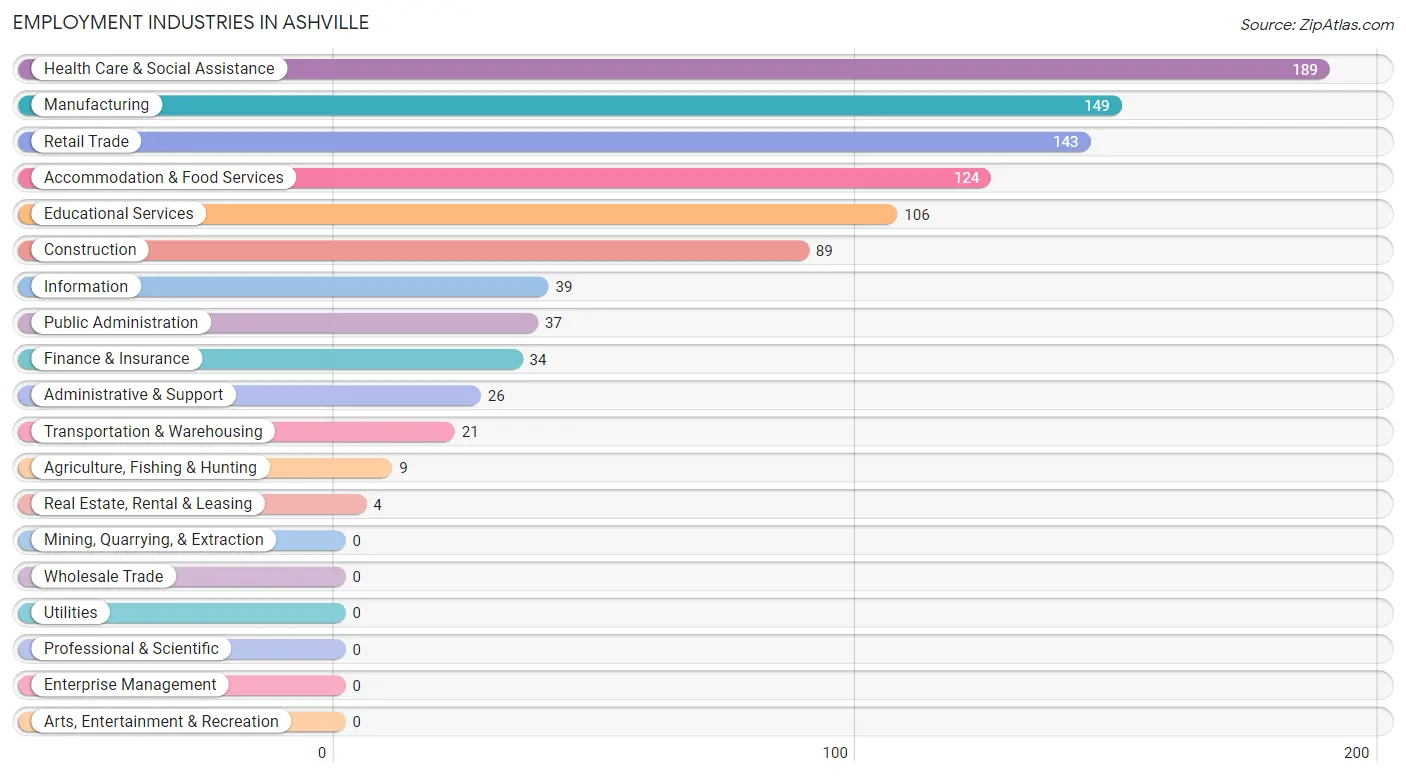
The major employment industries in Ashville include Health Care & Social Assistance (189 | 17.1%), Manufacturing (149 | 13.5%), Retail Trade (143 | 12.9%), Accommodation & Food Services (124 | 11.2%), and Educational Services (106 | 9.6%).
Employment Industries by Sex in Ashville
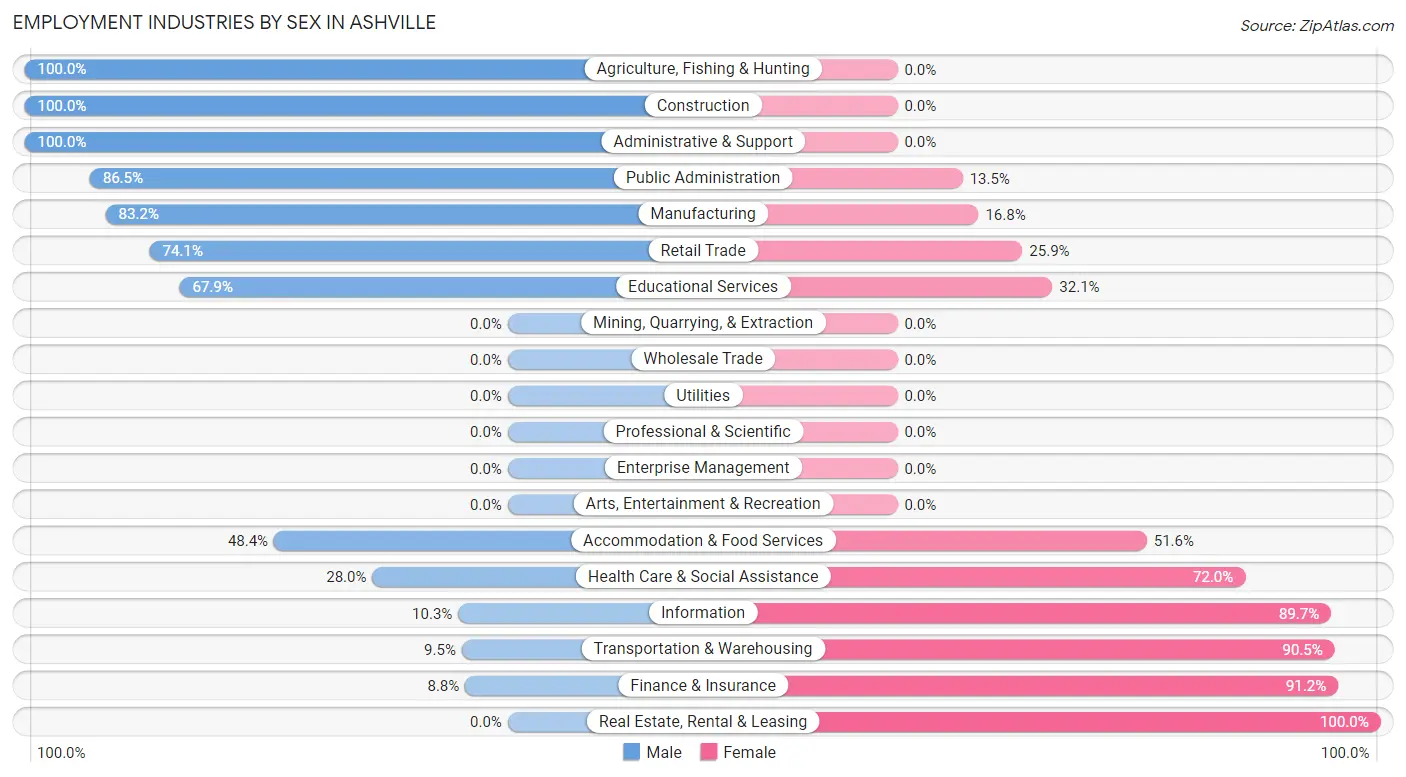
The Ashville industries that see more men than women are Agriculture, Fishing & Hunting (100.0%), Construction (100.0%), and Administrative & Support (100.0%), whereas the industries that tend to have a higher number of women are Real Estate, Rental & Leasing (100.0%), Finance & Insurance (91.2%), and Transportation & Warehousing (90.5%).
| Industry | Male | Female |
| Agriculture, Fishing & Hunting | 9 (100.0%) | 0 (0.0%) |
| Mining, Quarrying, & Extraction | 0 (0.0%) | 0 (0.0%) |
| Construction | 89 (100.0%) | 0 (0.0%) |
| Manufacturing | 124 (83.2%) | 25 (16.8%) |
| Wholesale Trade | 0 (0.0%) | 0 (0.0%) |
| Retail Trade | 106 (74.1%) | 37 (25.9%) |
| Transportation & Warehousing | 2 (9.5%) | 19 (90.5%) |
| Utilities | 0 (0.0%) | 0 (0.0%) |
| Information | 4 (10.3%) | 35 (89.7%) |
| Finance & Insurance | 3 (8.8%) | 31 (91.2%) |
| Real Estate, Rental & Leasing | 0 (0.0%) | 4 (100.0%) |
| Professional & Scientific | 0 (0.0%) | 0 (0.0%) |
| Enterprise Management | 0 (0.0%) | 0 (0.0%) |
| Administrative & Support | 26 (100.0%) | 0 (0.0%) |
| Educational Services | 72 (67.9%) | 34 (32.1%) |
| Health Care & Social Assistance | 53 (28.0%) | 136 (72.0%) |
| Arts, Entertainment & Recreation | 0 (0.0%) | 0 (0.0%) |
| Accommodation & Food Services | 60 (48.4%) | 64 (51.6%) |
| Public Administration | 32 (86.5%) | 5 (13.5%) |
| Total | 717 (64.8%) | 390 (35.2%) |
Education in Ashville
School Enrollment in Ashville
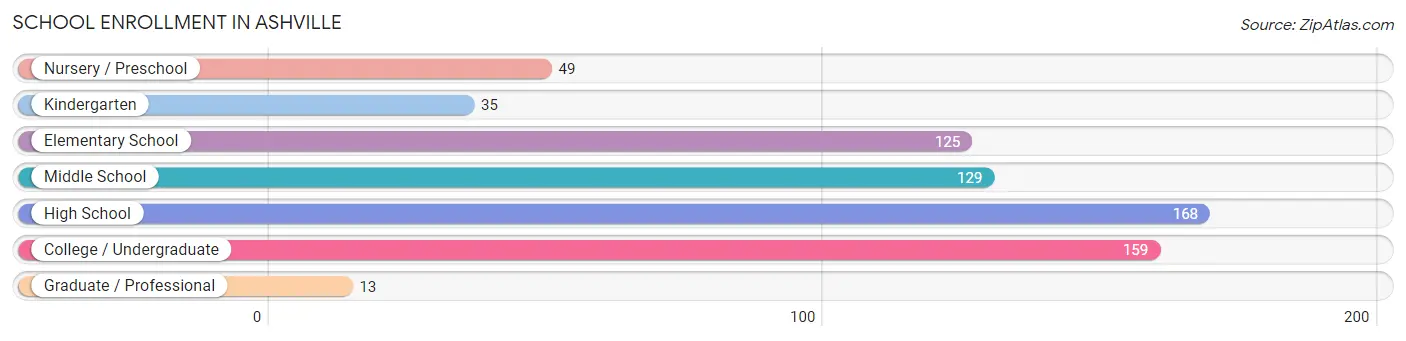
The most common levels of schooling among the 678 students in Ashville are high school (168 | 24.8%), college / undergraduate (159 | 23.4%), and middle school (129 | 19.0%).
| School Level | # Students | % Students |
| Nursery / Preschool | 49 | 7.2% |
| Kindergarten | 35 | 5.2% |
| Elementary School | 125 | 18.4% |
| Middle School | 129 | 19.0% |
| High School | 168 | 24.8% |
| College / Undergraduate | 159 | 23.4% |
| Graduate / Professional | 13 | 1.9% |
| Total | 678 | 100.0% |
School Enrollment by Age by Funding Source in Ashville
Out of a total of 678 students who are enrolled in schools in Ashville, 65 (9.6%) attend a private institution, while the remaining 613 (90.4%) are enrolled in public schools. The age group of 20 to 24 year olds has the highest likelihood of being enrolled in private schools, with 35 (100.0% in the age bracket) enrolled. Conversely, the age group of 18 to 19 year olds has the lowest likelihood of being enrolled in a private school, with 107 (100.0% in the age bracket) attending a public institution.
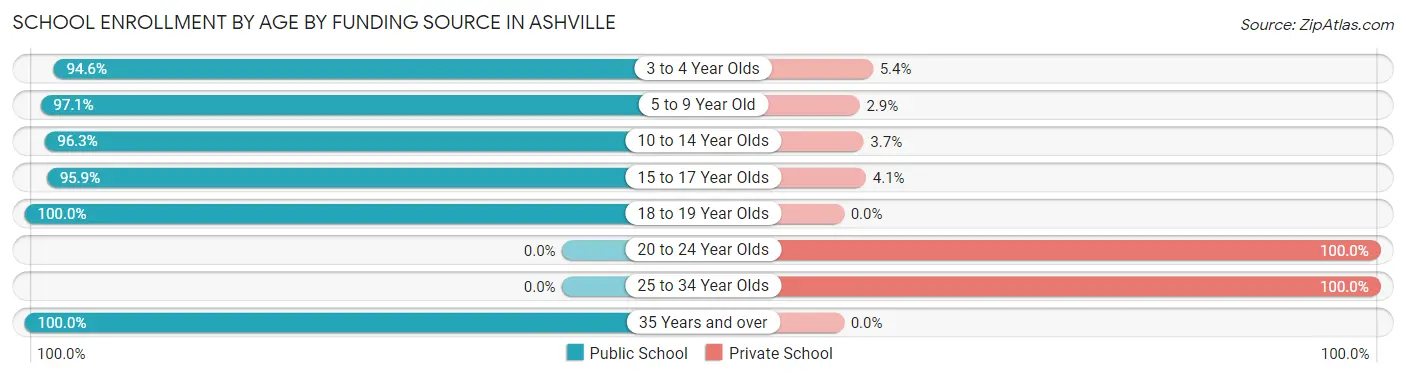
| Age Bracket | Public School | Private School |
| 3 to 4 Year Olds | 35 (94.6%) | 2 (5.4%) |
| 5 to 9 Year Old | 165 (97.1%) | 5 (2.9%) |
| 10 to 14 Year Olds | 131 (96.3%) | 5 (3.7%) |
| 15 to 17 Year Olds | 116 (95.9%) | 5 (4.1%) |
| 18 to 19 Year Olds | 107 (100.0%) | 0 (0.0%) |
| 20 to 24 Year Olds | 0 (0.0%) | 35 (100.0%) |
| 25 to 34 Year Olds | 0 (0.0%) | 13 (100.0%) |
| 35 Years and over | 59 (100.0%) | 0 (0.0%) |
| Total | 613 (90.4%) | 65 (9.6%) |
Educational Attainment by Field of Study in Ashville
Science & technology (45 | 27.3%), education (44 | 26.7%), visual & performing arts (22 | 13.3%), business (18 | 10.9%), and liberal arts & history (11 | 6.7%) are the most common fields of study among 165 individuals in Ashville who have obtained a bachelor's degree or higher.
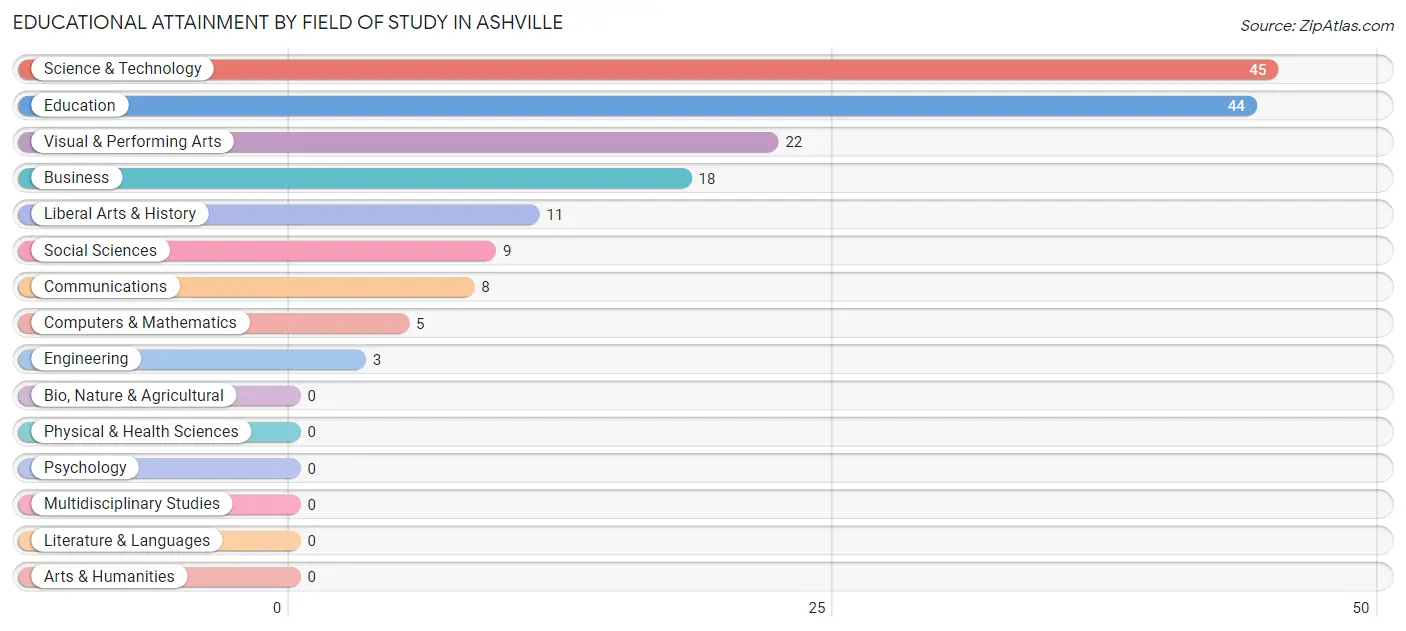
| Field of Study | # Graduates | % Graduates |
| Computers & Mathematics | 5 | 3.0% |
| Bio, Nature & Agricultural | 0 | 0.0% |
| Physical & Health Sciences | 0 | 0.0% |
| Psychology | 0 | 0.0% |
| Social Sciences | 9 | 5.4% |
| Engineering | 3 | 1.8% |
| Multidisciplinary Studies | 0 | 0.0% |
| Science & Technology | 45 | 27.3% |
| Business | 18 | 10.9% |
| Education | 44 | 26.7% |
| Literature & Languages | 0 | 0.0% |
| Liberal Arts & History | 11 | 6.7% |
| Visual & Performing Arts | 22 | 13.3% |
| Communications | 8 | 4.9% |
| Arts & Humanities | 0 | 0.0% |
| Total | 165 | 100.0% |
Transportation & Commute in Ashville
Vehicle Availability by Sex in Ashville
The most prevalent vehicle ownership categories in Ashville are males with 5 or more vehicles (178, accounting for 26.1%) and females with 5 or more vehicles (28, making up 48.5%).
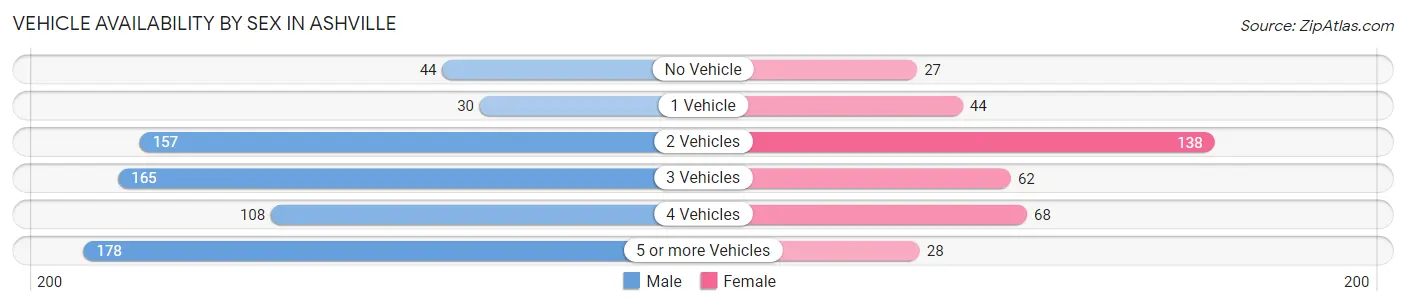
| Vehicles Available | Male | Female |
| No Vehicle | 44 (6.5%) | 27 (7.4%) |
| 1 Vehicle | 30 (4.4%) | 44 (12.0%) |
| 2 Vehicles | 157 (23.0%) | 138 (37.6%) |
| 3 Vehicles | 165 (24.2%) | 62 (16.9%) |
| 4 Vehicles | 108 (15.8%) | 68 (18.5%) |
| 5 or more Vehicles | 178 (26.1%) | 28 (7.6%) |
| Total | 682 (100.0%) | 367 (100.0%) |
Commute Time in Ashville
The most frequently occuring commute durations in Ashville are 30 to 34 minutes (337 commuters, 32.4%), 15 to 19 minutes (156 commuters, 15.0%), and 45 to 59 minutes (143 commuters, 13.7%).
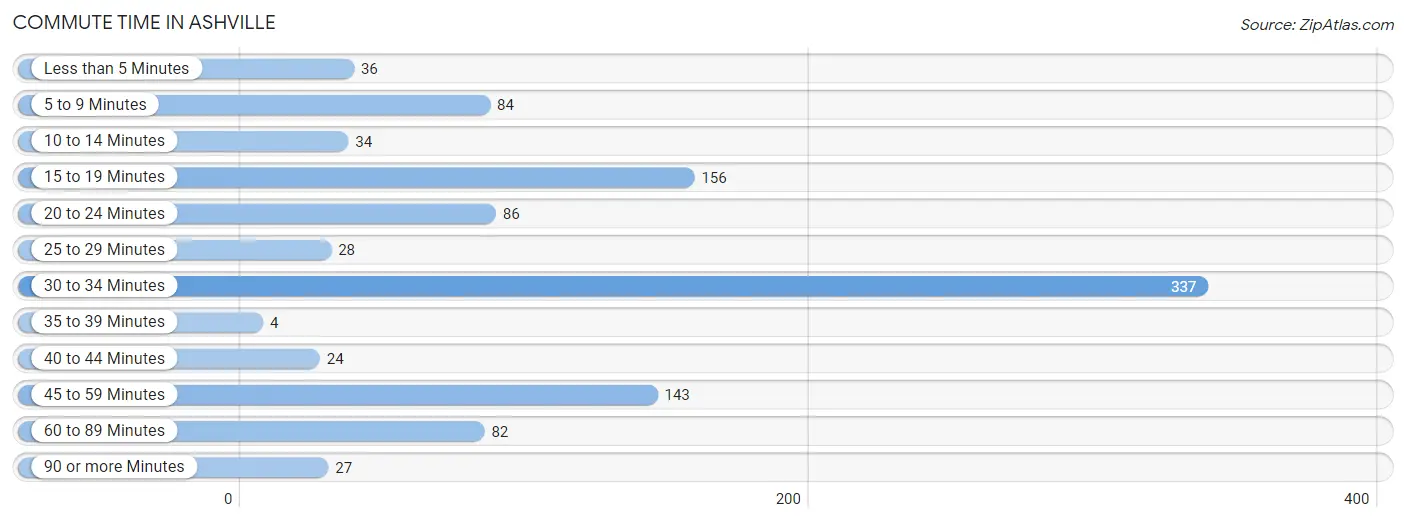
| Commute Time | # Commuters | % Commuters |
| Less than 5 Minutes | 36 | 3.5% |
| 5 to 9 Minutes | 84 | 8.1% |
| 10 to 14 Minutes | 34 | 3.3% |
| 15 to 19 Minutes | 156 | 15.0% |
| 20 to 24 Minutes | 86 | 8.3% |
| 25 to 29 Minutes | 28 | 2.7% |
| 30 to 34 Minutes | 337 | 32.4% |
| 35 to 39 Minutes | 4 | 0.4% |
| 40 to 44 Minutes | 24 | 2.3% |
| 45 to 59 Minutes | 143 | 13.7% |
| 60 to 89 Minutes | 82 | 7.9% |
| 90 or more Minutes | 27 | 2.6% |
Commute Time by Sex in Ashville
The most common commute times in Ashville are 30 to 34 minutes (283 commuters, 41.5%) for males and 60 to 89 minutes (62 commuters, 17.3%) for females.
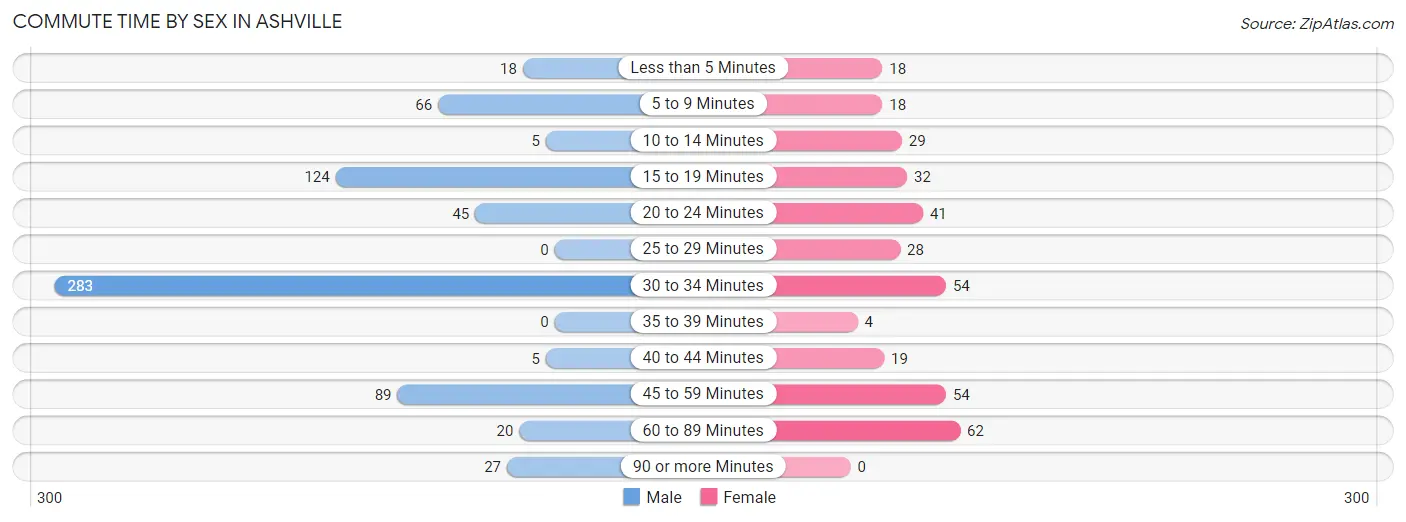
| Commute Time | Male | Female |
| Less than 5 Minutes | 18 (2.6%) | 18 (5.0%) |
| 5 to 9 Minutes | 66 (9.7%) | 18 (5.0%) |
| 10 to 14 Minutes | 5 (0.7%) | 29 (8.1%) |
| 15 to 19 Minutes | 124 (18.2%) | 32 (8.9%) |
| 20 to 24 Minutes | 45 (6.6%) | 41 (11.4%) |
| 25 to 29 Minutes | 0 (0.0%) | 28 (7.8%) |
| 30 to 34 Minutes | 283 (41.5%) | 54 (15.0%) |
| 35 to 39 Minutes | 0 (0.0%) | 4 (1.1%) |
| 40 to 44 Minutes | 5 (0.7%) | 19 (5.3%) |
| 45 to 59 Minutes | 89 (13.1%) | 54 (15.0%) |
| 60 to 89 Minutes | 20 (2.9%) | 62 (17.3%) |
| 90 or more Minutes | 27 (4.0%) | 0 (0.0%) |
Time of Departure to Work by Sex in Ashville
The most frequent times of departure to work in Ashville are 6:30 AM to 6:59 AM (144, 21.1%) for males and 7:30 AM to 7:59 AM (93, 25.9%) for females.
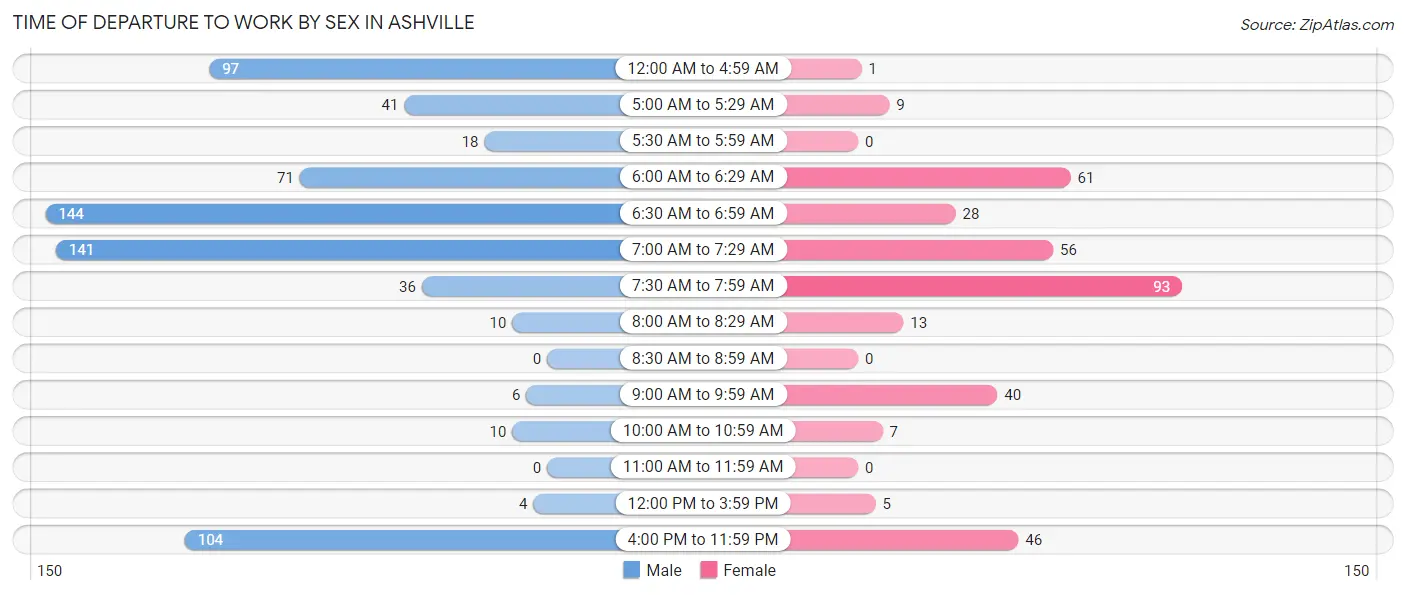
| Time of Departure | Male | Female |
| 12:00 AM to 4:59 AM | 97 (14.2%) | 1 (0.3%) |
| 5:00 AM to 5:29 AM | 41 (6.0%) | 9 (2.5%) |
| 5:30 AM to 5:59 AM | 18 (2.6%) | 0 (0.0%) |
| 6:00 AM to 6:29 AM | 71 (10.4%) | 61 (17.0%) |
| 6:30 AM to 6:59 AM | 144 (21.1%) | 28 (7.8%) |
| 7:00 AM to 7:29 AM | 141 (20.7%) | 56 (15.6%) |
| 7:30 AM to 7:59 AM | 36 (5.3%) | 93 (25.9%) |
| 8:00 AM to 8:29 AM | 10 (1.5%) | 13 (3.6%) |
| 8:30 AM to 8:59 AM | 0 (0.0%) | 0 (0.0%) |
| 9:00 AM to 9:59 AM | 6 (0.9%) | 40 (11.1%) |
| 10:00 AM to 10:59 AM | 10 (1.5%) | 7 (1.9%) |
| 11:00 AM to 11:59 AM | 0 (0.0%) | 0 (0.0%) |
| 12:00 PM to 3:59 PM | 4 (0.6%) | 5 (1.4%) |
| 4:00 PM to 11:59 PM | 104 (15.2%) | 46 (12.8%) |
| Total | 682 (100.0%) | 359 (100.0%) |
Housing Occupancy in Ashville
Occupancy by Ownership in Ashville
Of the total 777 dwellings in Ashville, owner-occupied units account for 567 (73.0%), while renter-occupied units make up 210 (27.0%).
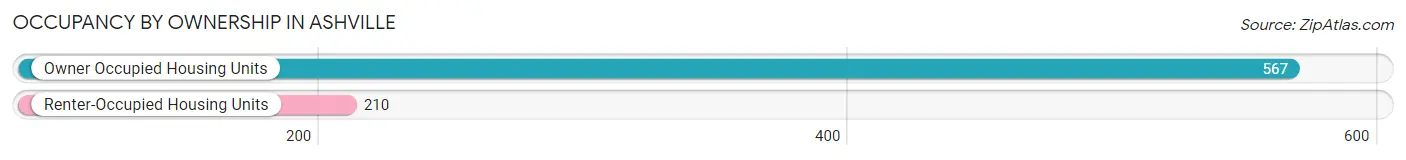
| Occupancy | # Housing Units | % Housing Units |
| Owner Occupied Housing Units | 567 | 73.0% |
| Renter-Occupied Housing Units | 210 | 27.0% |
| Total Occupied Housing Units | 777 | 100.0% |
Occupancy by Household Size in Ashville
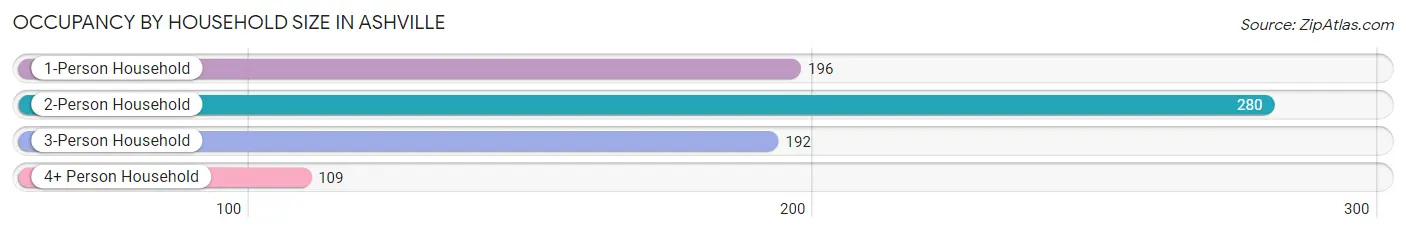
| Household Size | # Housing Units | % Housing Units |
| 1-Person Household | 196 | 25.2% |
| 2-Person Household | 280 | 36.0% |
| 3-Person Household | 192 | 24.7% |
| 4+ Person Household | 109 | 14.0% |
| Total Housing Units | 777 | 100.0% |
Occupancy by Ownership by Household Size in Ashville
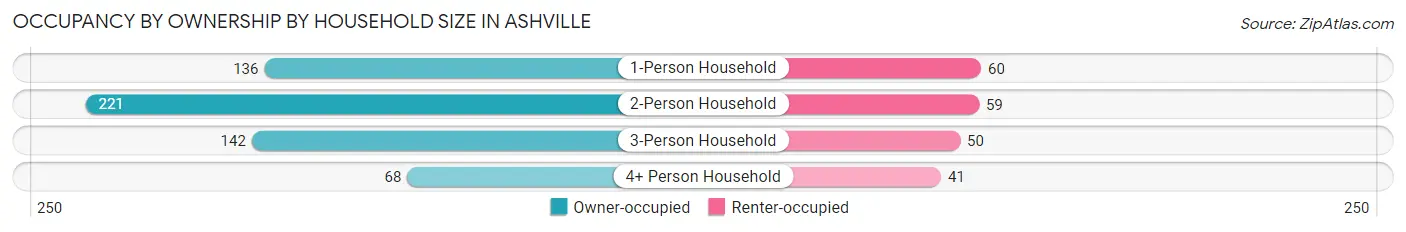
| Household Size | Owner-occupied | Renter-occupied |
| 1-Person Household | 136 (69.4%) | 60 (30.6%) |
| 2-Person Household | 221 (78.9%) | 59 (21.1%) |
| 3-Person Household | 142 (74.0%) | 50 (26.0%) |
| 4+ Person Household | 68 (62.4%) | 41 (37.6%) |
| Total Housing Units | 567 (73.0%) | 210 (27.0%) |
Occupancy by Educational Attainment in Ashville
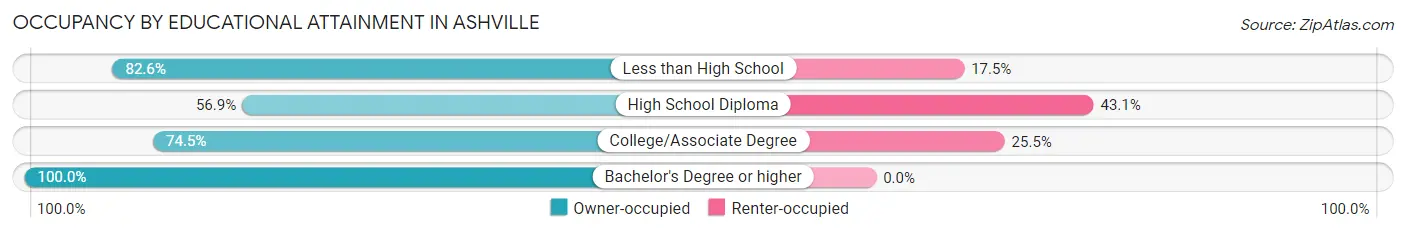
| Household Size | Owner-occupied | Renter-occupied |
| Less than High School | 123 (82.6%) | 26 (17.4%) |
| High School Diploma | 136 (56.9%) | 103 (43.1%) |
| College/Associate Degree | 237 (74.5%) | 81 (25.5%) |
| Bachelor's Degree or higher | 71 (100.0%) | 0 (0.0%) |
Occupancy by Age of Householder in Ashville
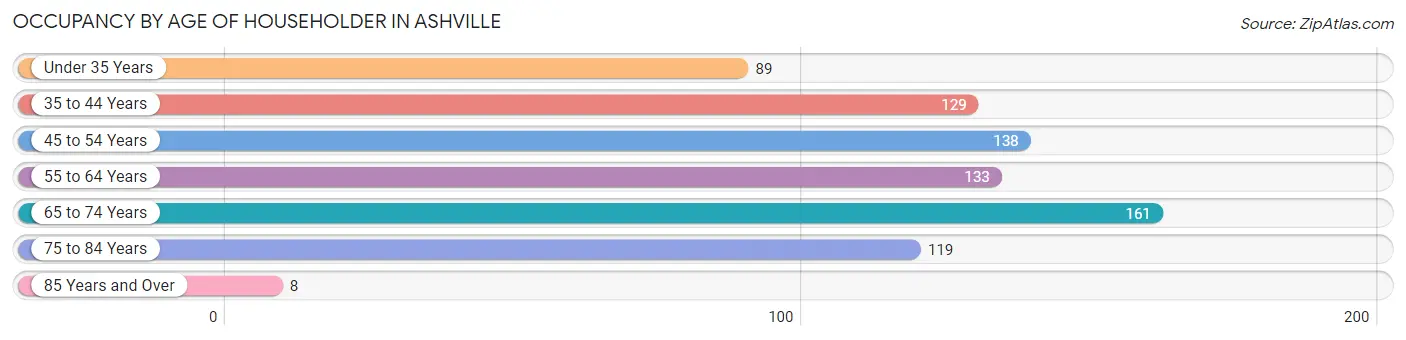
| Age Bracket | # Households | % Households |
| Under 35 Years | 89 | 11.5% |
| 35 to 44 Years | 129 | 16.6% |
| 45 to 54 Years | 138 | 17.8% |
| 55 to 64 Years | 133 | 17.1% |
| 65 to 74 Years | 161 | 20.7% |
| 75 to 84 Years | 119 | 15.3% |
| 85 Years and Over | 8 | 1.0% |
| Total | 777 | 100.0% |
Housing Finances in Ashville
Median Income by Occupancy in Ashville
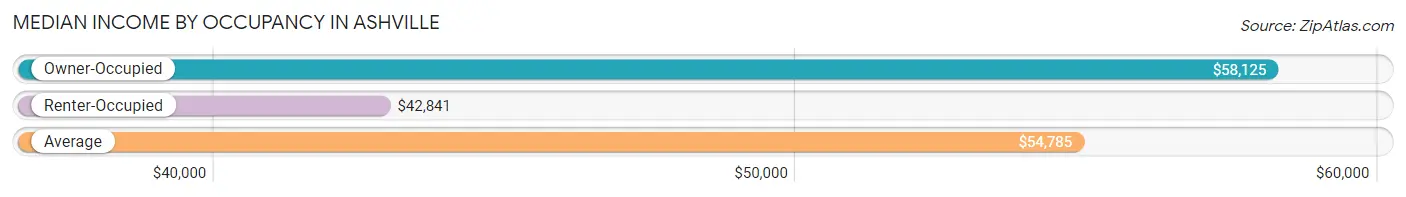
| Occupancy Type | # Households | Median Income |
| Owner-Occupied | 567 (73.0%) | $58,125 |
| Renter-Occupied | 210 (27.0%) | $42,841 |
| Average | 777 (100.0%) | $54,785 |
Occupancy by Householder Income Bracket in Ashville
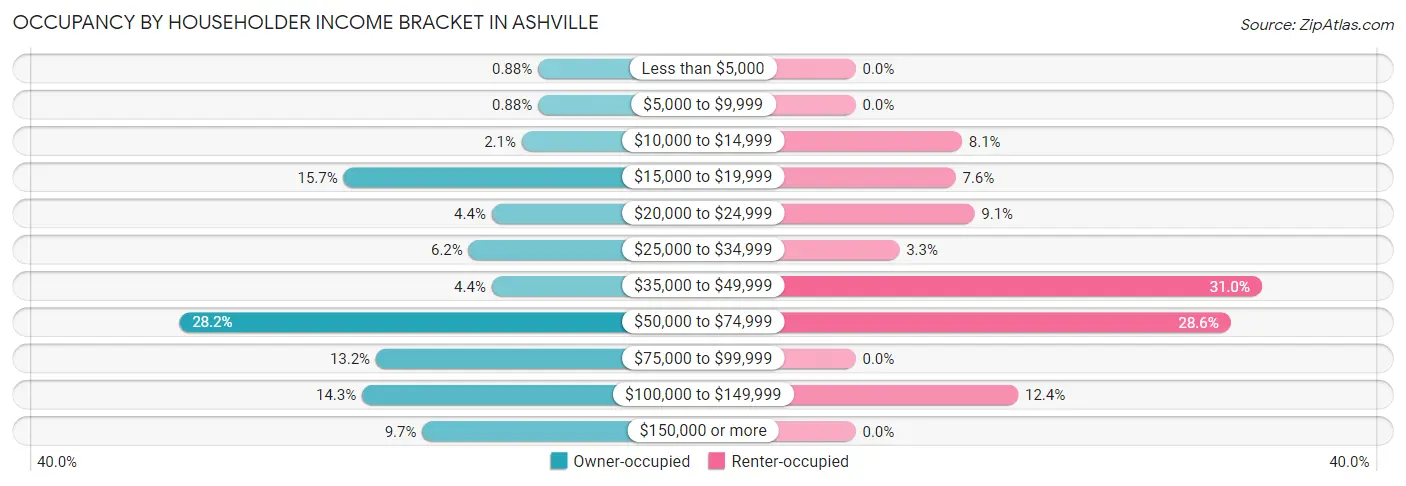
| Income Bracket | Owner-occupied | Renter-occupied |
| Less than $5,000 | 5 (0.9%) | 0 (0.0%) |
| $5,000 to $9,999 | 5 (0.9%) | 0 (0.0%) |
| $10,000 to $14,999 | 12 (2.1%) | 17 (8.1%) |
| $15,000 to $19,999 | 89 (15.7%) | 16 (7.6%) |
| $20,000 to $24,999 | 25 (4.4%) | 19 (9.0%) |
| $25,000 to $34,999 | 35 (6.2%) | 7 (3.3%) |
| $35,000 to $49,999 | 25 (4.4%) | 65 (30.9%) |
| $50,000 to $74,999 | 160 (28.2%) | 60 (28.6%) |
| $75,000 to $99,999 | 75 (13.2%) | 0 (0.0%) |
| $100,000 to $149,999 | 81 (14.3%) | 26 (12.4%) |
| $150,000 or more | 55 (9.7%) | 0 (0.0%) |
| Total | 567 (100.0%) | 210 (100.0%) |
Monthly Housing Cost Tiers in Ashville
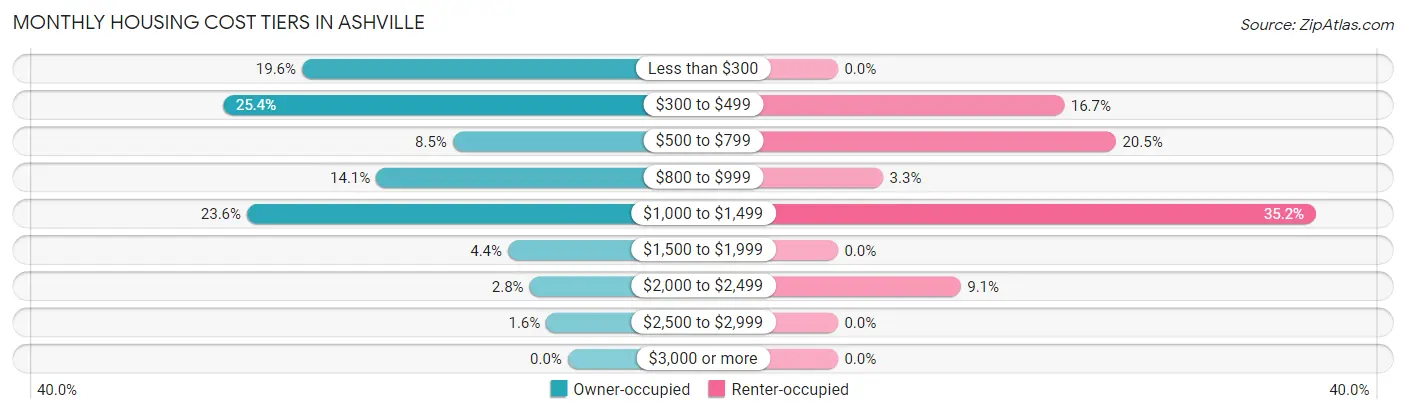
| Monthly Cost | Owner-occupied | Renter-occupied |
| Less than $300 | 111 (19.6%) | 0 (0.0%) |
| $300 to $499 | 144 (25.4%) | 35 (16.7%) |
| $500 to $799 | 48 (8.5%) | 43 (20.5%) |
| $800 to $999 | 80 (14.1%) | 7 (3.3%) |
| $1,000 to $1,499 | 134 (23.6%) | 74 (35.2%) |
| $1,500 to $1,999 | 25 (4.4%) | 0 (0.0%) |
| $2,000 to $2,499 | 16 (2.8%) | 19 (9.0%) |
| $2,500 to $2,999 | 9 (1.6%) | 0 (0.0%) |
| $3,000 or more | 0 (0.0%) | 0 (0.0%) |
| Total | 567 (100.0%) | 210 (100.0%) |
Physical Housing Characteristics in Ashville
Housing Structures in Ashville
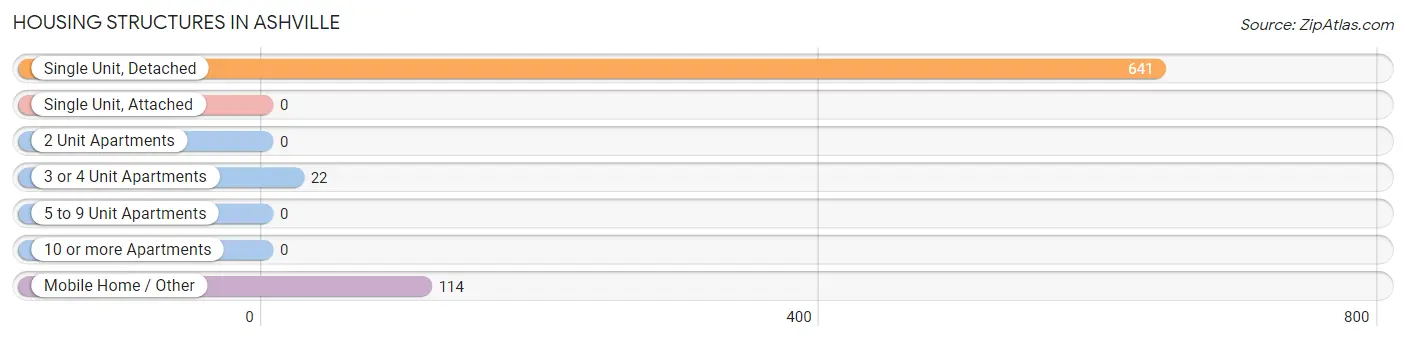
| Structure Type | # Housing Units | % Housing Units |
| Single Unit, Detached | 641 | 82.5% |
| Single Unit, Attached | 0 | 0.0% |
| 2 Unit Apartments | 0 | 0.0% |
| 3 or 4 Unit Apartments | 22 | 2.8% |
| 5 to 9 Unit Apartments | 0 | 0.0% |
| 10 or more Apartments | 0 | 0.0% |
| Mobile Home / Other | 114 | 14.7% |
| Total | 777 | 100.0% |
Housing Structures by Occupancy in Ashville
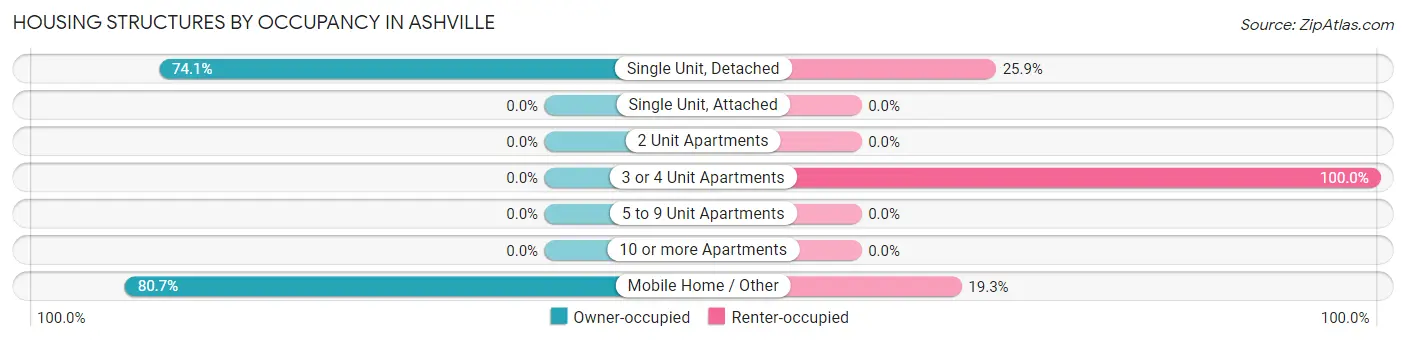
| Structure Type | Owner-occupied | Renter-occupied |
| Single Unit, Detached | 475 (74.1%) | 166 (25.9%) |
| Single Unit, Attached | 0 (0.0%) | 0 (0.0%) |
| 2 Unit Apartments | 0 (0.0%) | 0 (0.0%) |
| 3 or 4 Unit Apartments | 0 (0.0%) | 22 (100.0%) |
| 5 to 9 Unit Apartments | 0 (0.0%) | 0 (0.0%) |
| 10 or more Apartments | 0 (0.0%) | 0 (0.0%) |
| Mobile Home / Other | 92 (80.7%) | 22 (19.3%) |
| Total | 567 (73.0%) | 210 (27.0%) |
Housing Structures by Number of Rooms in Ashville
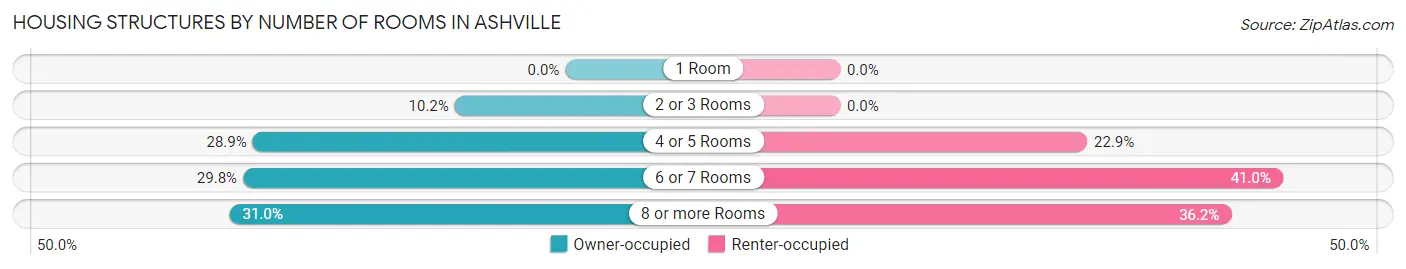
| Number of Rooms | Owner-occupied | Renter-occupied |
| 1 Room | 0 (0.0%) | 0 (0.0%) |
| 2 or 3 Rooms | 58 (10.2%) | 0 (0.0%) |
| 4 or 5 Rooms | 164 (28.9%) | 48 (22.9%) |
| 6 or 7 Rooms | 169 (29.8%) | 86 (40.9%) |
| 8 or more Rooms | 176 (31.0%) | 76 (36.2%) |
| Total | 567 (100.0%) | 210 (100.0%) |
Housing Structure by Heating Type in Ashville
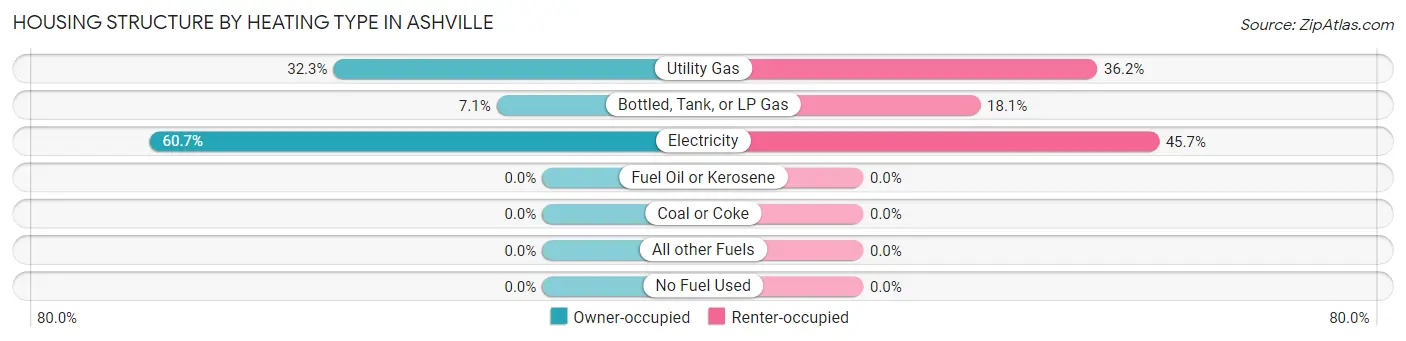
| Heating Type | Owner-occupied | Renter-occupied |
| Utility Gas | 183 (32.3%) | 76 (36.2%) |
| Bottled, Tank, or LP Gas | 40 (7.0%) | 38 (18.1%) |
| Electricity | 344 (60.7%) | 96 (45.7%) |
| Fuel Oil or Kerosene | 0 (0.0%) | 0 (0.0%) |
| Coal or Coke | 0 (0.0%) | 0 (0.0%) |
| All other Fuels | 0 (0.0%) | 0 (0.0%) |
| No Fuel Used | 0 (0.0%) | 0 (0.0%) |
| Total | 567 (100.0%) | 210 (100.0%) |
Household Vehicle Usage in Ashville
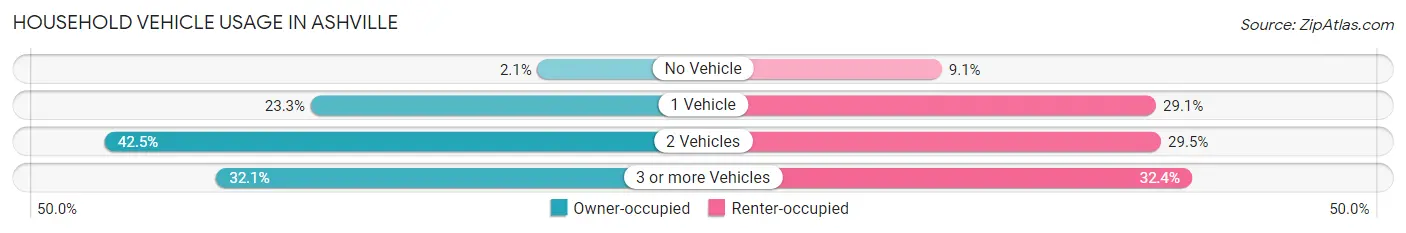
| Vehicles per Household | Owner-occupied | Renter-occupied |
| No Vehicle | 12 (2.1%) | 19 (9.0%) |
| 1 Vehicle | 132 (23.3%) | 61 (29.0%) |
| 2 Vehicles | 241 (42.5%) | 62 (29.5%) |
| 3 or more Vehicles | 182 (32.1%) | 68 (32.4%) |
| Total | 567 (100.0%) | 210 (100.0%) |
Real Estate & Mortgages in Ashville
Real Estate and Mortgage Overview in Ashville
| Characteristic | Without Mortgage | With Mortgage |
| Housing Units | 339 | 228 |
| Median Property Value | $177,900 | $203,100 |
| Median Household Income | $51,625 | $38 |
| Monthly Housing Costs | $380 | $0 |
| Real Estate Taxes | $335 | $51 |
Property Value by Mortgage Status in Ashville
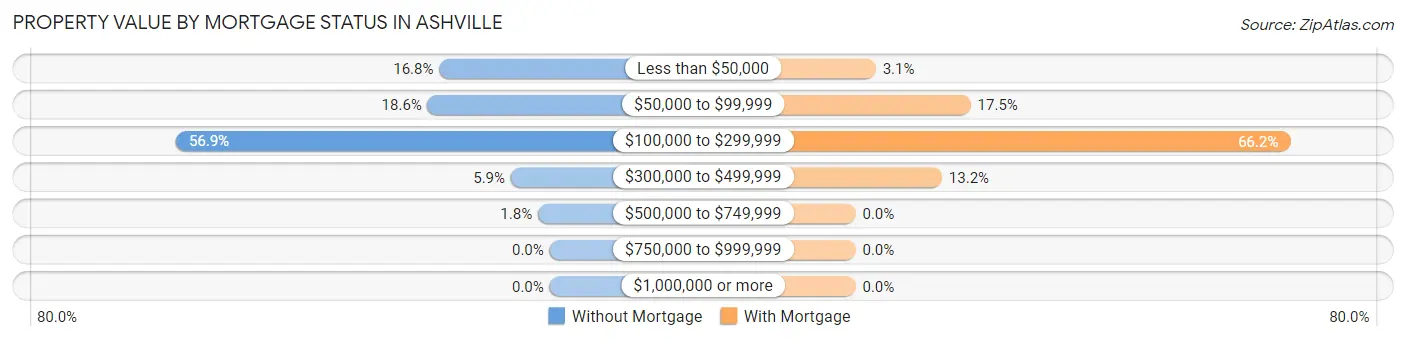
| Property Value | Without Mortgage | With Mortgage |
| Less than $50,000 | 57 (16.8%) | 7 (3.1%) |
| $50,000 to $99,999 | 63 (18.6%) | 40 (17.5%) |
| $100,000 to $299,999 | 193 (56.9%) | 151 (66.2%) |
| $300,000 to $499,999 | 20 (5.9%) | 30 (13.2%) |
| $500,000 to $749,999 | 6 (1.8%) | 0 (0.0%) |
| $750,000 to $999,999 | 0 (0.0%) | 0 (0.0%) |
| $1,000,000 or more | 0 (0.0%) | 0 (0.0%) |
| Total | 339 (100.0%) | 228 (100.0%) |
Household Income by Mortgage Status in Ashville
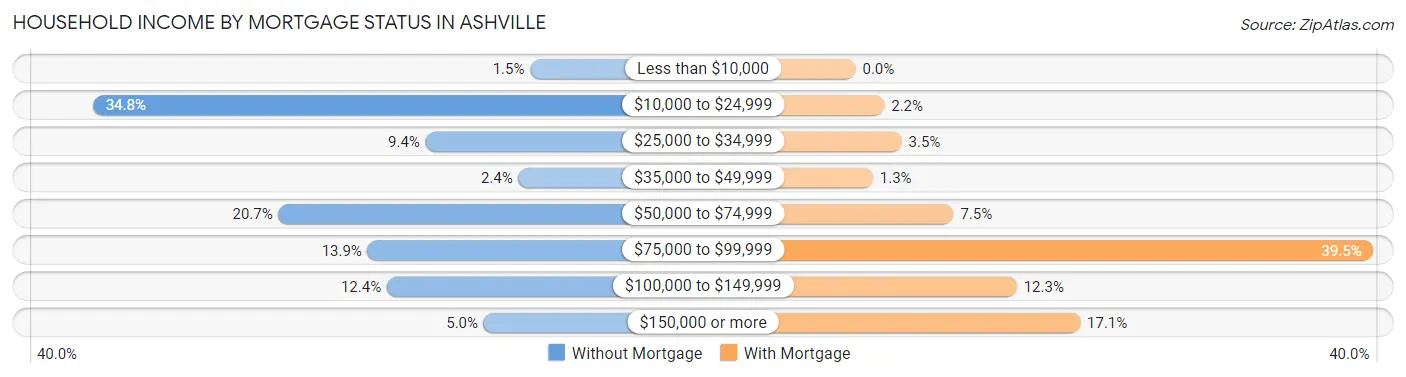
| Household Income | Without Mortgage | With Mortgage |
| Less than $10,000 | 5 (1.5%) | 0 (0.0%) |
| $10,000 to $24,999 | 118 (34.8%) | 5 (2.2%) |
| $25,000 to $34,999 | 32 (9.4%) | 8 (3.5%) |
| $35,000 to $49,999 | 8 (2.4%) | 3 (1.3%) |
| $50,000 to $74,999 | 70 (20.6%) | 17 (7.5%) |
| $75,000 to $99,999 | 47 (13.9%) | 90 (39.5%) |
| $100,000 to $149,999 | 42 (12.4%) | 28 (12.3%) |
| $150,000 or more | 17 (5.0%) | 39 (17.1%) |
| Total | 339 (100.0%) | 228 (100.0%) |
Property Value to Household Income Ratio in Ashville
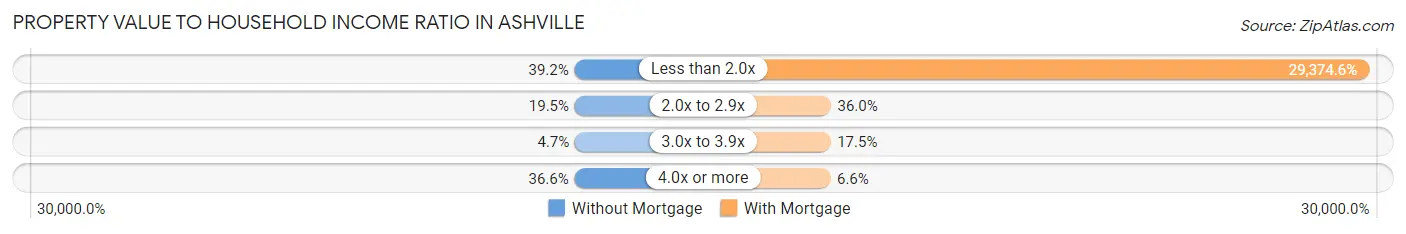
| Value-to-Income Ratio | Without Mortgage | With Mortgage |
| Less than 2.0x | 133 (39.2%) | 66,974 (29,374.6%) |
| 2.0x to 2.9x | 66 (19.5%) | 82 (36.0%) |
| 3.0x to 3.9x | 16 (4.7%) | 40 (17.5%) |
| 4.0x or more | 124 (36.6%) | 15 (6.6%) |
| Total | 339 (100.0%) | 228 (100.0%) |
Real Estate Taxes by Mortgage Status in Ashville
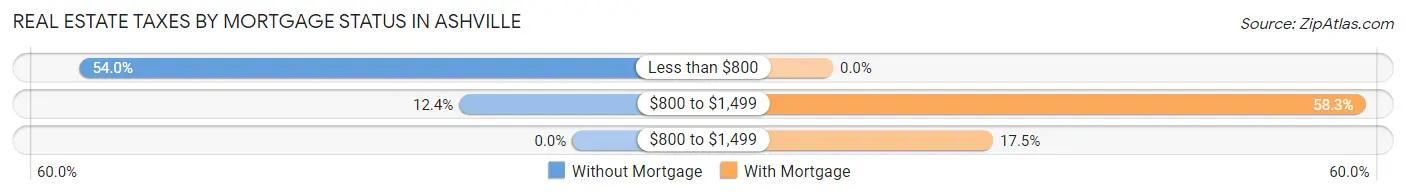
| Property Taxes | Without Mortgage | With Mortgage |
| Less than $800 | 183 (54.0%) | 0 (0.0%) |
| $800 to $1,499 | 42 (12.4%) | 133 (58.3%) |
| $800 to $1,499 | 0 (0.0%) | 40 (17.5%) |
| Total | 339 (100.0%) | 228 (100.0%) |
Health & Disability in Ashville
Health Insurance Coverage by Age in Ashville
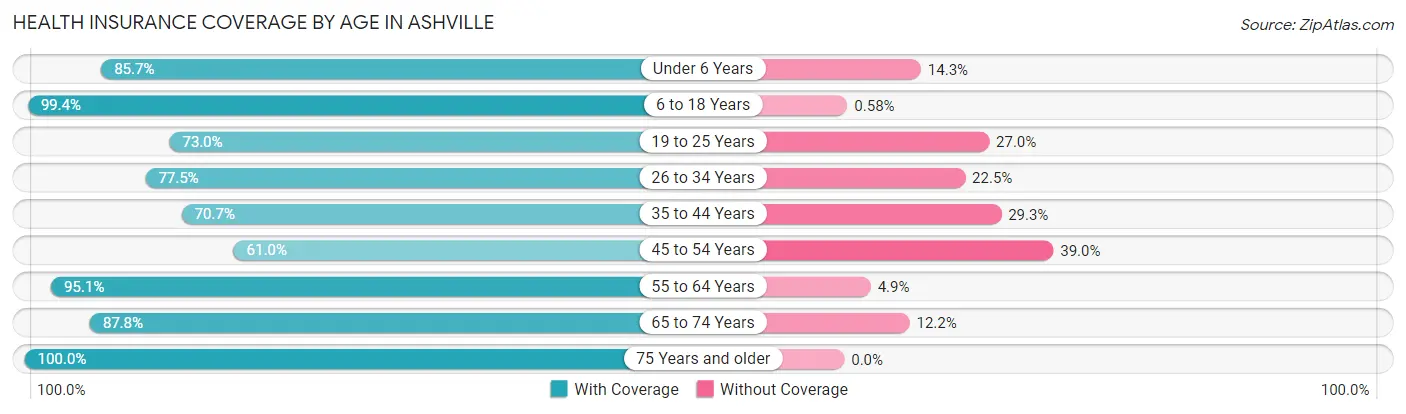
| Age Bracket | With Coverage | Without Coverage |
| Under 6 Years | 96 (85.7%) | 16 (14.3%) |
| 6 to 18 Years | 517 (99.4%) | 3 (0.6%) |
| 19 to 25 Years | 73 (73.0%) | 27 (27.0%) |
| 26 to 34 Years | 220 (77.5%) | 64 (22.5%) |
| 35 to 44 Years | 266 (70.7%) | 110 (29.3%) |
| 45 to 54 Years | 227 (61.0%) | 145 (39.0%) |
| 55 to 64 Years | 193 (95.1%) | 10 (4.9%) |
| 65 to 74 Years | 202 (87.8%) | 28 (12.2%) |
| 75 Years and older | 144 (100.0%) | 0 (0.0%) |
| Total | 1,938 (82.8%) | 403 (17.2%) |
Health Insurance Coverage by Citizenship Status in Ashville
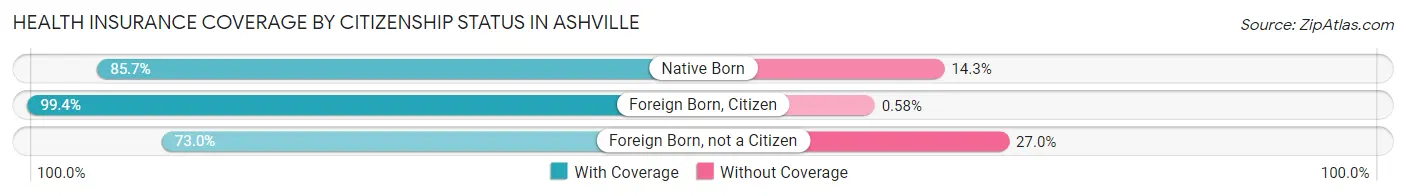
| Citizenship Status | With Coverage | Without Coverage |
| Native Born | 96 (85.7%) | 16 (14.3%) |
| Foreign Born, Citizen | 517 (99.4%) | 3 (0.6%) |
| Foreign Born, not a Citizen | 73 (73.0%) | 27 (27.0%) |
Health Insurance Coverage by Household Income in Ashville
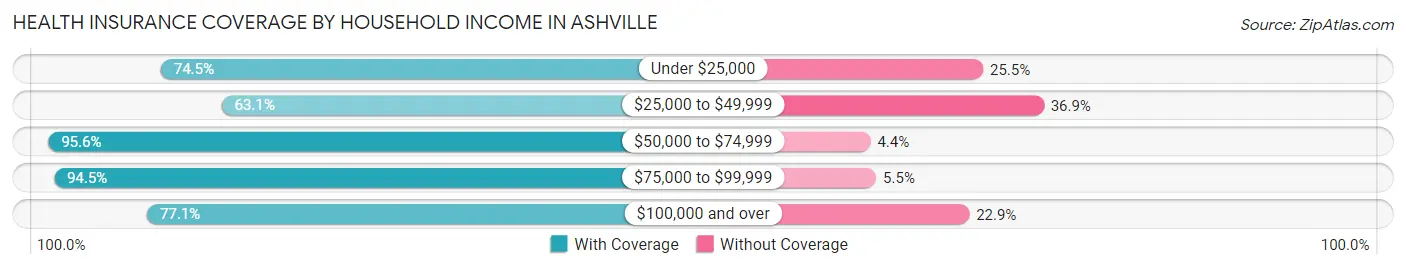
| Household Income | With Coverage | Without Coverage |
| Under $25,000 | 210 (74.5%) | 72 (25.5%) |
| $25,000 to $49,999 | 219 (63.1%) | 128 (36.9%) |
| $50,000 to $74,999 | 799 (95.6%) | 37 (4.4%) |
| $75,000 to $99,999 | 189 (94.5%) | 11 (5.5%) |
| $100,000 and over | 521 (77.1%) | 155 (22.9%) |
Public vs Private Health Insurance Coverage by Age in Ashville
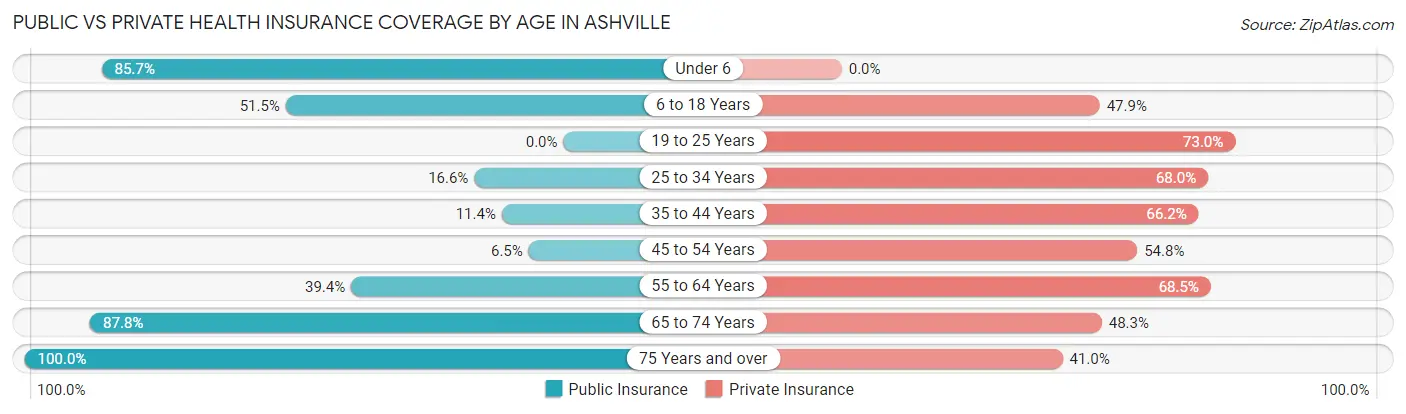
| Age Bracket | Public Insurance | Private Insurance |
| Under 6 | 96 (85.7%) | 0 (0.0%) |
| 6 to 18 Years | 268 (51.5%) | 249 (47.9%) |
| 19 to 25 Years | 0 (0.0%) | 73 (73.0%) |
| 25 to 34 Years | 47 (16.6%) | 193 (68.0%) |
| 35 to 44 Years | 43 (11.4%) | 249 (66.2%) |
| 45 to 54 Years | 24 (6.5%) | 204 (54.8%) |
| 55 to 64 Years | 80 (39.4%) | 139 (68.5%) |
| 65 to 74 Years | 202 (87.8%) | 111 (48.3%) |
| 75 Years and over | 144 (100.0%) | 59 (41.0%) |
| Total | 904 (38.6%) | 1,277 (54.5%) |
Disability Status by Sex by Age in Ashville
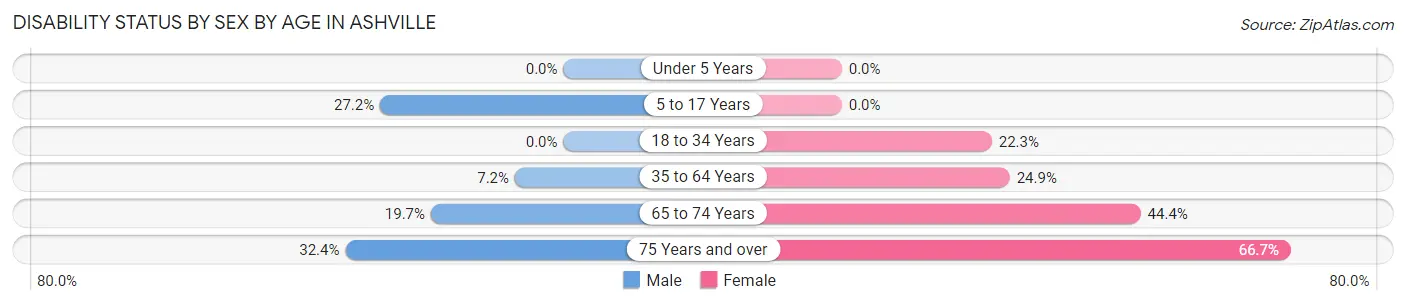
| Age Bracket | Male | Female |
| Under 5 Years | 0 (0.0%) | 0 (0.0%) |
| 5 to 17 Years | 89 (27.2%) | 0 (0.0%) |
| 18 to 34 Years | 0 (0.0%) | 47 (22.3%) |
| 35 to 64 Years | 39 (7.2%) | 102 (24.9%) |
| 65 to 74 Years | 12 (19.7%) | 75 (44.4%) |
| 75 Years and over | 34 (32.4%) | 26 (66.7%) |
Disability Class by Sex by Age in Ashville
Disability Class: Hearing Difficulty
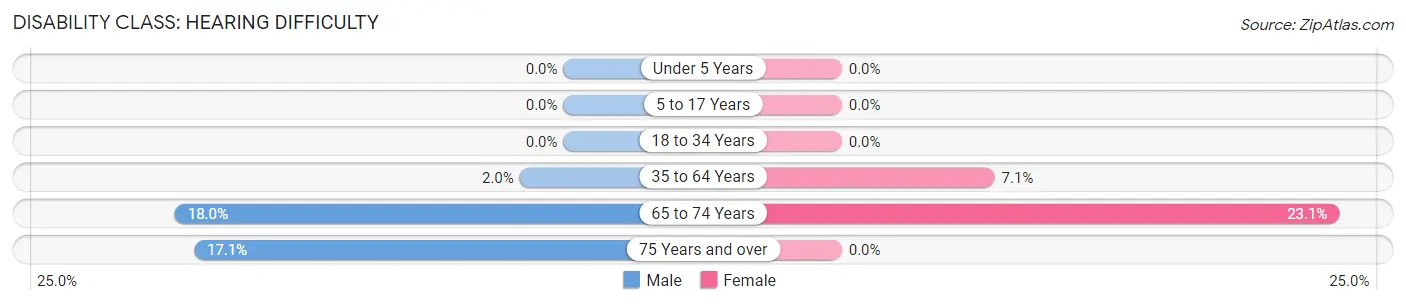
| Age Bracket | Male | Female |
| Under 5 Years | 0 (0.0%) | 0 (0.0%) |
| 5 to 17 Years | 0 (0.0%) | 0 (0.0%) |
| 18 to 34 Years | 0 (0.0%) | 0 (0.0%) |
| 35 to 64 Years | 11 (2.0%) | 29 (7.1%) |
| 65 to 74 Years | 11 (18.0%) | 39 (23.1%) |
| 75 Years and over | 18 (17.1%) | 0 (0.0%) |
Disability Class: Vision Difficulty
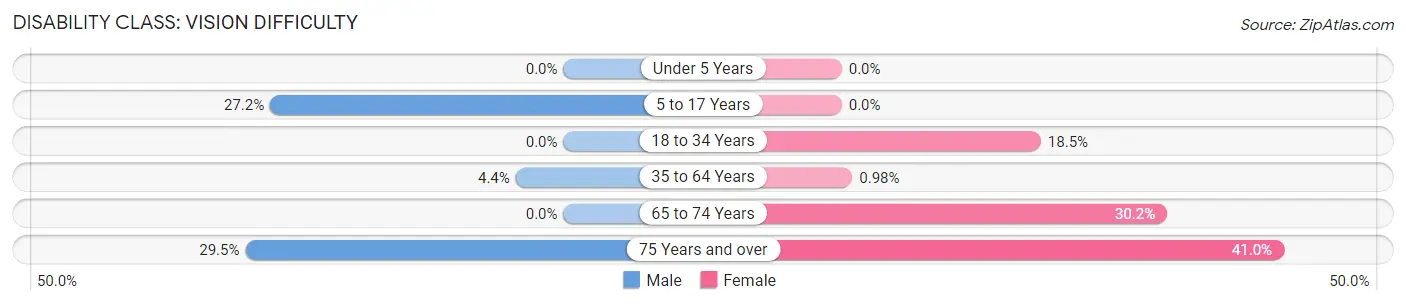
| Age Bracket | Male | Female |
| Under 5 Years | 0 (0.0%) | 0 (0.0%) |
| 5 to 17 Years | 89 (27.2%) | 0 (0.0%) |
| 18 to 34 Years | 0 (0.0%) | 39 (18.5%) |
| 35 to 64 Years | 24 (4.4%) | 4 (1.0%) |
| 65 to 74 Years | 0 (0.0%) | 51 (30.2%) |
| 75 Years and over | 31 (29.5%) | 16 (41.0%) |
Disability Class: Cognitive Difficulty
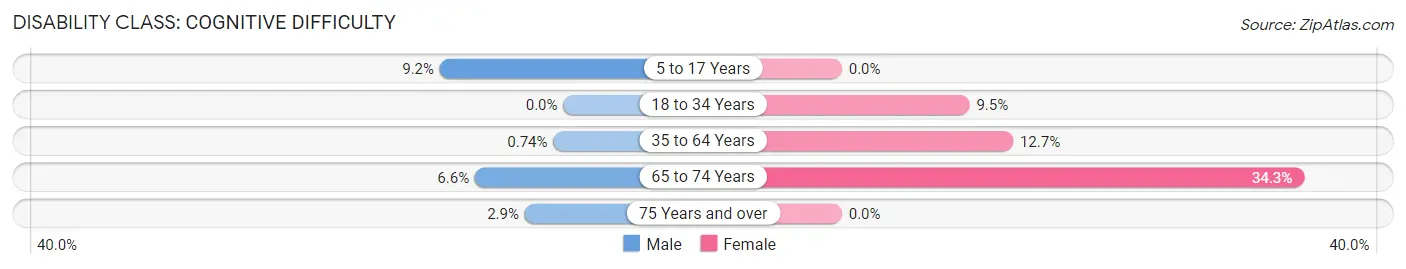
| Age Bracket | Male | Female |
| 5 to 17 Years | 30 (9.2%) | 0 (0.0%) |
| 18 to 34 Years | 0 (0.0%) | 20 (9.5%) |
| 35 to 64 Years | 4 (0.7%) | 52 (12.7%) |
| 65 to 74 Years | 4 (6.6%) | 58 (34.3%) |
| 75 Years and over | 3 (2.9%) | 0 (0.0%) |
Disability Class: Ambulatory Difficulty
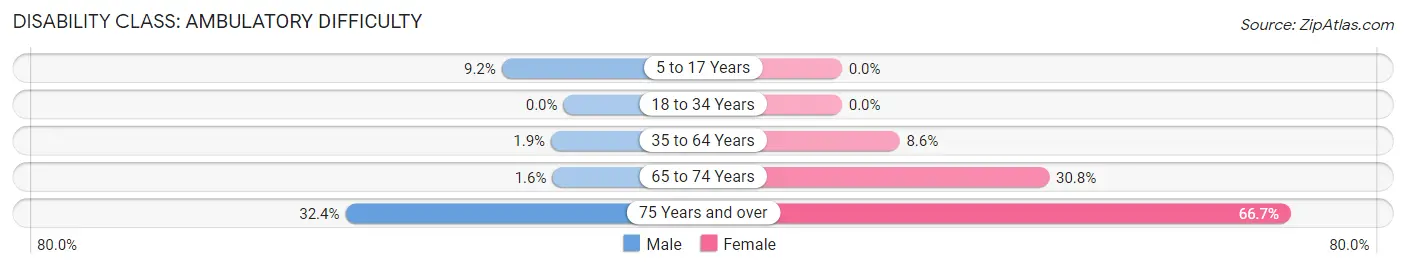
| Age Bracket | Male | Female |
| 5 to 17 Years | 30 (9.2%) | 0 (0.0%) |
| 18 to 34 Years | 0 (0.0%) | 0 (0.0%) |
| 35 to 64 Years | 10 (1.8%) | 35 (8.6%) |
| 65 to 74 Years | 1 (1.6%) | 52 (30.8%) |
| 75 Years and over | 34 (32.4%) | 26 (66.7%) |
Disability Class: Self-Care Difficulty
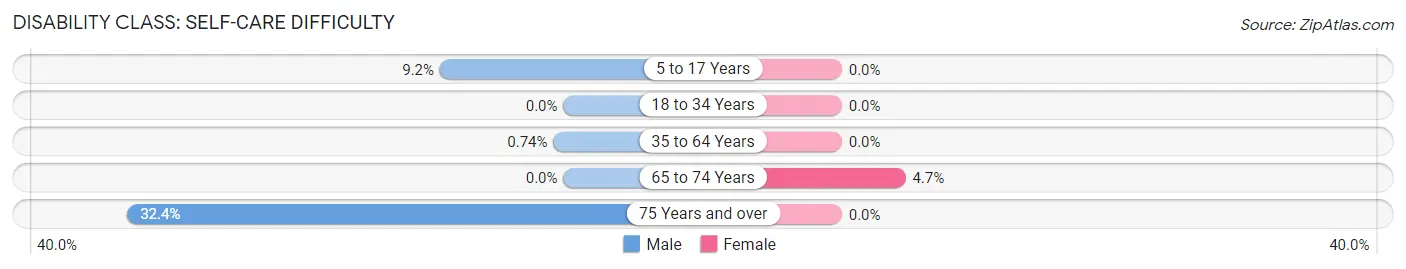
| Age Bracket | Male | Female |
| 5 to 17 Years | 30 (9.2%) | 0 (0.0%) |
| 18 to 34 Years | 0 (0.0%) | 0 (0.0%) |
| 35 to 64 Years | 4 (0.7%) | 0 (0.0%) |
| 65 to 74 Years | 0 (0.0%) | 8 (4.7%) |
| 75 Years and over | 34 (32.4%) | 0 (0.0%) |
Technology Access in Ashville
Computing Device Access in Ashville
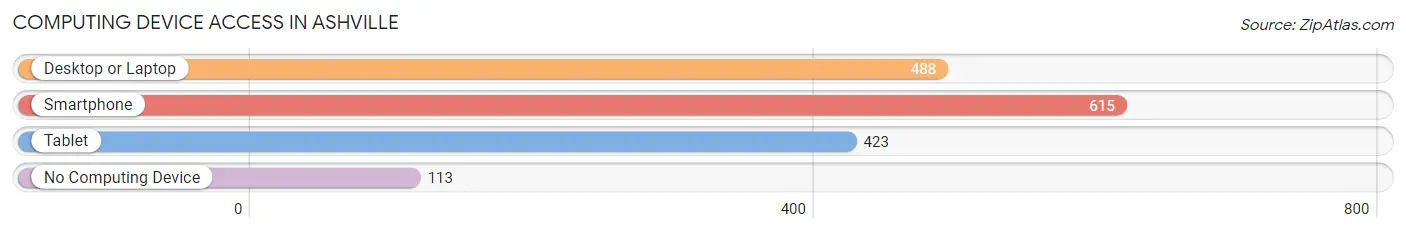
| Device Type | # Households | % Households |
| Desktop or Laptop | 488 | 62.8% |
| Smartphone | 615 | 79.1% |
| Tablet | 423 | 54.4% |
| No Computing Device | 113 | 14.5% |
| Total | 777 | 100.0% |
Internet Access in Ashville
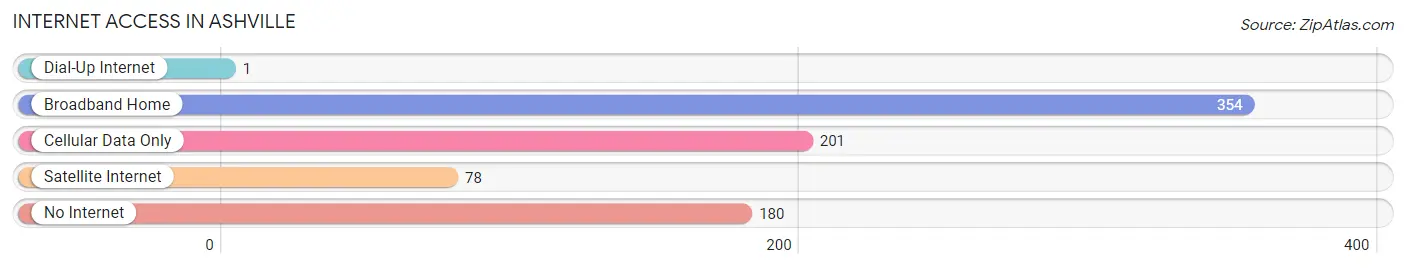
| Internet Type | # Households | % Households |
| Dial-Up Internet | 1 | 0.1% |
| Broadband Home | 354 | 45.6% |
| Cellular Data Only | 201 | 25.9% |
| Satellite Internet | 78 | 10.0% |
| No Internet | 180 | 23.2% |
| Total | 777 | 100.0% |
Ashville Summary
Asheville, Alabama is a small town located in the northwest corner of the state, in Winston County. It is situated on the banks of the Black Warrior River, and is surrounded by the Appalachian Mountains. The town has a population of just over 1,000 people, and is known for its rural charm and friendly atmosphere.
History
Asheville was founded in 1818 by a group of settlers from North Carolina. The town was named after the nearby mountain range, and was originally a trading post for the local Native American tribes. The town grew quickly, and by the mid-1800s it had become a major hub for the cotton industry. The town was also home to several large plantations, and was a major stop on the Underground Railroad.
In the late 1800s, the town began to decline as the cotton industry moved away. The town was hit hard by the Great Depression, and many of the plantations were abandoned. In the 1940s, the town began to experience a resurgence as the timber industry moved in. The town was also home to several coal mines, and the economy began to improve.
Geography
Asheville is located in the northwest corner of Alabama, in Winston County. The town is situated on the banks of the Black Warrior River, and is surrounded by the Appalachian Mountains. The town is located in a valley, and is surrounded by rolling hills and forests. The climate is mild, with hot summers and cool winters.
Economy
Asheville’s economy is largely based on agriculture and timber. The town is home to several large farms, and the surrounding area is known for its production of cotton, corn, soybeans, and other crops. The timber industry is also a major part of the local economy, and the town is home to several sawmills and lumber companies.
The town is also home to several small businesses, including restaurants, shops, and other services. The town is also home to a small airport, and is a popular destination for tourists.
Demographics
As of the 2010 census, the population of Asheville was 1,072. The town is predominantly white, with a small African American population. The median household income is $31,250, and the median home value is $90,000. The town is home to several churches, and is served by the Winston County School District.
Conclusion
Asheville, Alabama is a small town with a rich history and a friendly atmosphere. The town is situated on the banks of the Black Warrior River, and is surrounded by the Appalachian Mountains. The town’s economy is largely based on agriculture and timber, and the town is home to several small businesses. The population of Asheville is predominantly white, with a small African American population. The town is served by the Winston County School District, and is a popular destination for tourists.
Common Questions
What is Per Capita Income in Ashville?
Per Capita income in Ashville is $25,152.
What is the Median Family Income in Ashville?
Median Family Income in Ashville is $54,771.
What is the Median Household income in Ashville?
Median Household Income in Ashville is $54,785.
What is Income or Wage Gap in Ashville?
Income or Wage Gap in Ashville is 16.1%.
Women in Ashville earn 83.9 cents for every dollar earned by a man.
What is Inequality or Gini Index in Ashville?
Inequality or Gini Index in Ashville is 0.40.
What is the Total Population of Ashville?
Total Population of Ashville is 2,438.
What is the Total Male Population of Ashville?
Total Male Population of Ashville is 1,389.
What is the Total Female Population of Ashville?
Total Female Population of Ashville is 1,049.
What is the Ratio of Males per 100 Females in Ashville?
There are 132.41 Males per 100 Females in Ashville.
What is the Ratio of Females per 100 Males in Ashville?
There are 75.52 Females per 100 Males in Ashville.
What is the Median Population Age in Ashville?
Median Population Age in Ashville is 40.3 Years.
What is the Average Family Size in Ashville
Average Family Size in Ashville is 3.4 People.
What is the Average Household Size in Ashville
Average Household Size in Ashville is 3.0 People.
How Large is the Labor Force in Ashville?
There are 1,115 People in the Labor Forcein in Ashville.
What is the Percentage of People in the Labor Force in Ashville?
56.5% of People are in the Labor Force in Ashville.
What is the Unemployment Rate in Ashville?
Unemployment Rate in Ashville is 0.7%.