Altoona, AL Map & Demographics
Altoona Map
Altoona Overview
$23,200
PER CAPITA INCOME
$48,889
AVG FAMILY INCOME
$38,750
AVG HOUSEHOLD INCOME
$7,498
FAMILY INCOME DEFICIT
0.49
INEQUALITY / GINI INDEX
1,358
TOTAL POPULATION
719
MALE POPULATION
639
FEMALE POPULATION
112.52
MALES / 100 FEMALES
88.87
FEMALES / 100 MALES
40.5
MEDIAN AGE
3.5
AVG FAMILY SIZE
2.9
AVG HOUSEHOLD SIZE
682
LABOR FORCE [ PEOPLE ]
57.4%
PERCENT IN LABOR FORCE
3.4%
UNEMPLOYMENT RATE
Altoona Zip Codes
Altoona Area Codes
Income in Altoona
Income Overview in Altoona
Per Capita Income in Altoona is $23,200, while median incomes of families and households are $48,889 and $38,750 respectively.
| Characteristic | Number | Measure |
| Per Capita Income | 1,358 | $23,200 |
| Median Family Income | 328 | $48,889 |
| Mean Family Income | 328 | $66,929 |
| Median Household Income | 458 | $38,750 |
| Mean Household Income | 458 | $57,830 |
| Income Deficit | 328 | $7,498 |
| Wage / Income Gap (%) | 1,358 | 0.00% |
| Wage / Income Gap ($) | 1,358 | 100.00¢ per $1 |
| Gini / Inequality Index | 1,358 | 0.49 |
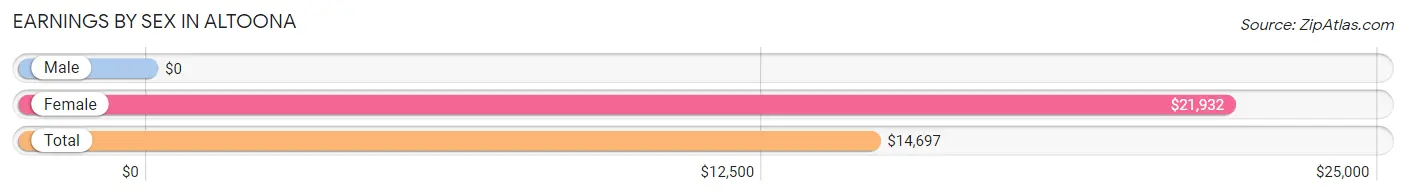
Earnings by Sex in Altoona
| Sex | Number | Average Earnings |
| Male | 493 (69.8%) | $0 |
| Female | 213 (30.2%) | $21,932 |
| Total | 706 (100.0%) | $14,697 |
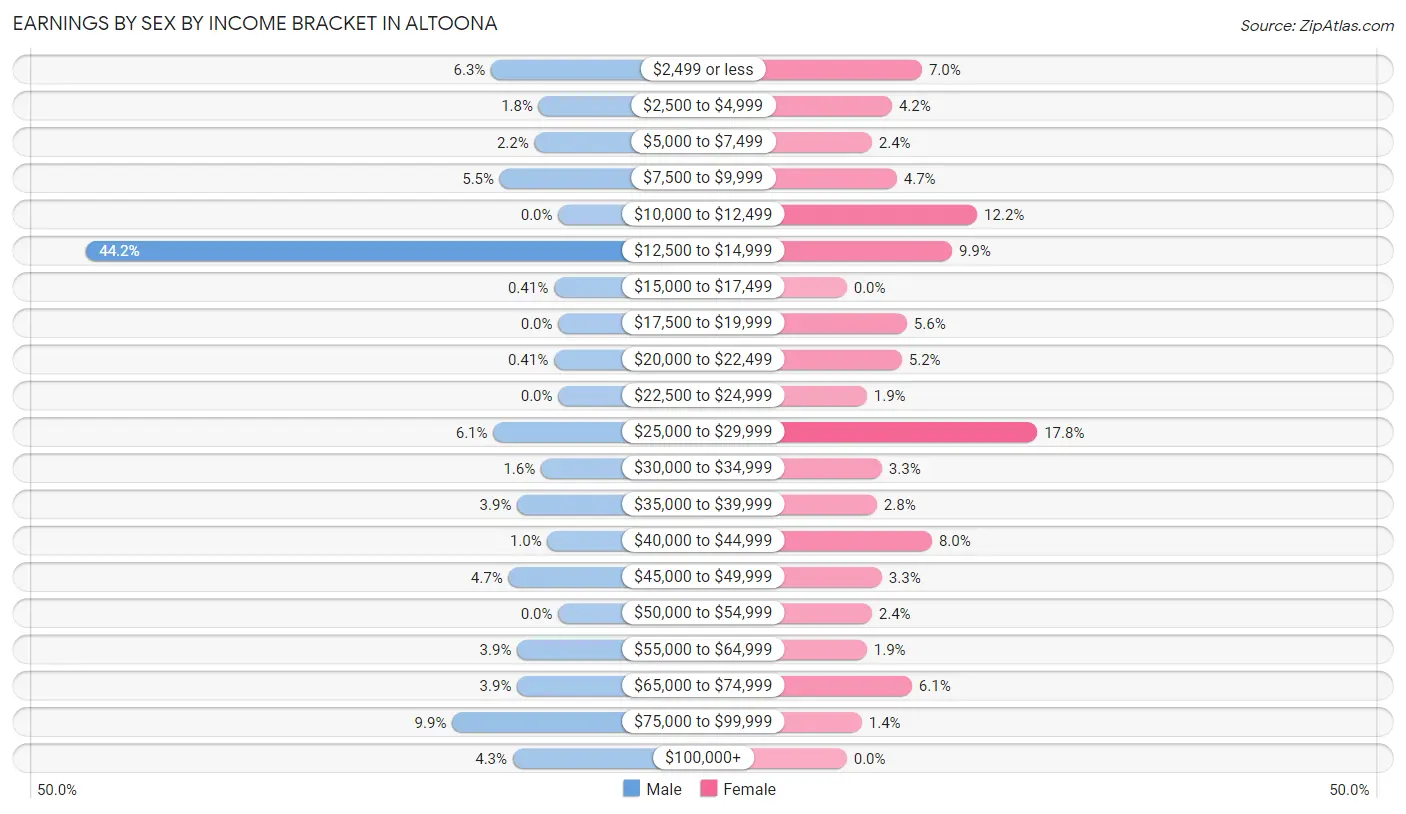
Earnings by Sex by Income Bracket in Altoona
The most common earnings brackets in Altoona are $12,500 to $14,999 for men (218 | 44.2%) and $25,000 to $29,999 for women (38 | 17.8%).
| Income | Male | Female |
| $2,499 or less | 31 (6.3%) | 15 (7.0%) |
| $2,500 to $4,999 | 9 (1.8%) | 9 (4.2%) |
| $5,000 to $7,499 | 11 (2.2%) | 5 (2.4%) |
| $7,500 to $9,999 | 27 (5.5%) | 10 (4.7%) |
| $10,000 to $12,499 | 0 (0.0%) | 26 (12.2%) |
| $12,500 to $14,999 | 218 (44.2%) | 21 (9.9%) |
| $15,000 to $17,499 | 2 (0.4%) | 0 (0.0%) |
| $17,500 to $19,999 | 0 (0.0%) | 12 (5.6%) |
| $20,000 to $22,499 | 2 (0.4%) | 11 (5.2%) |
| $22,500 to $24,999 | 0 (0.0%) | 4 (1.9%) |
| $25,000 to $29,999 | 30 (6.1%) | 38 (17.8%) |
| $30,000 to $34,999 | 8 (1.6%) | 7 (3.3%) |
| $35,000 to $39,999 | 19 (3.8%) | 6 (2.8%) |
| $40,000 to $44,999 | 5 (1.0%) | 17 (8.0%) |
| $45,000 to $49,999 | 23 (4.7%) | 7 (3.3%) |
| $50,000 to $54,999 | 0 (0.0%) | 5 (2.4%) |
| $55,000 to $64,999 | 19 (3.8%) | 4 (1.9%) |
| $65,000 to $74,999 | 19 (3.8%) | 13 (6.1%) |
| $75,000 to $99,999 | 49 (9.9%) | 3 (1.4%) |
| $100,000+ | 21 (4.3%) | 0 (0.0%) |
| Total | 493 (100.0%) | 213 (100.0%) |
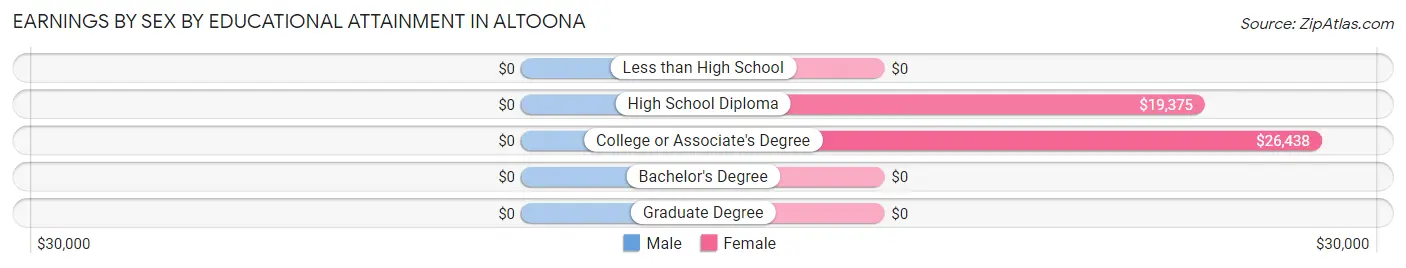
Earnings by Sex by Educational Attainment in Altoona
| Educational Attainment | Male Income | Female Income |
| Less than High School | - | - |
| High School Diploma | - | - |
| College or Associate's Degree | - | - |
| Bachelor's Degree | - | - |
| Graduate Degree | - | - |
| Total | - | - |
Family Income in Altoona
Family Income Brackets in Altoona
According to the Altoona family income data, there are 51 families falling into the $25,000 to $34,999 income range, which is the most common income bracket and makes up 15.5% of all families. Conversely, the $150,000 to $199,999 income bracket is the least frequent group with only 16 families (4.9%) belonging to this category.
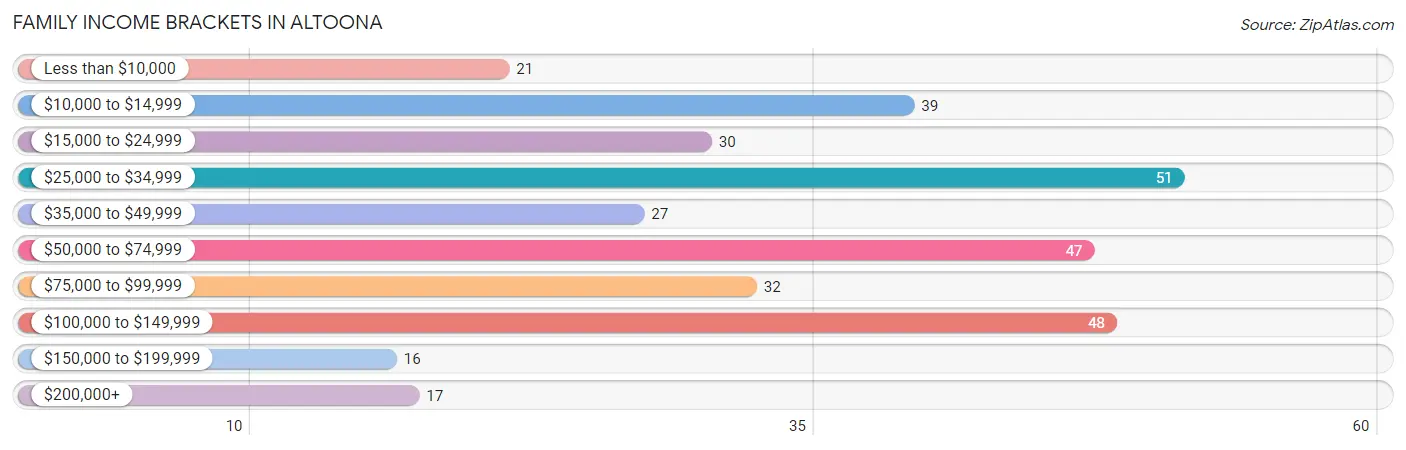
| Income Bracket | # Families | % Families |
| Less than $10,000 | 21 | 6.4% |
| $10,000 to $14,999 | 39 | 11.9% |
| $15,000 to $24,999 | 30 | 9.1% |
| $25,000 to $34,999 | 51 | 15.5% |
| $35,000 to $49,999 | 27 | 8.2% |
| $50,000 to $74,999 | 47 | 14.3% |
| $75,000 to $99,999 | 32 | 9.8% |
| $100,000 to $149,999 | 48 | 14.6% |
| $150,000 to $199,999 | 16 | 4.9% |
| $200,000+ | 17 | 5.2% |
Family Income by Famaliy Size in Altoona
5-person families (19 | 5.8%) account for the highest median family income in Altoona with $155,972 per family, while 5-person families (19 | 5.8%) have the highest median income of $31,194 per family member.
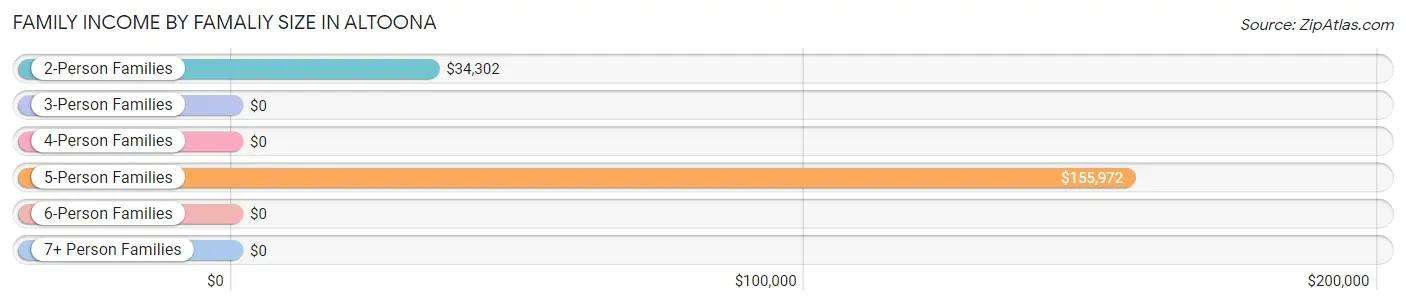
| Income Bracket | # Families | Median Income |
| 2-Person Families | 196 (59.8%) | $34,302 |
| 3-Person Families | 72 (22.0%) | $0 |
| 4-Person Families | 26 (7.9%) | $0 |
| 5-Person Families | 19 (5.8%) | $155,972 |
| 6-Person Families | 15 (4.6%) | $0 |
| 7+ Person Families | 0 (0.0%) | $0 |
| Total | 328 (100.0%) | $48,889 |
Family Income by Number of Earners in Altoona
The median family income in Altoona is $48,889, with families comprising 3+ earners (33) having the highest median family income of $176,250, while families with no earners (59) have the lowest median family income of $11,250, accounting for 10.1% and 18.0% of families, respectively.
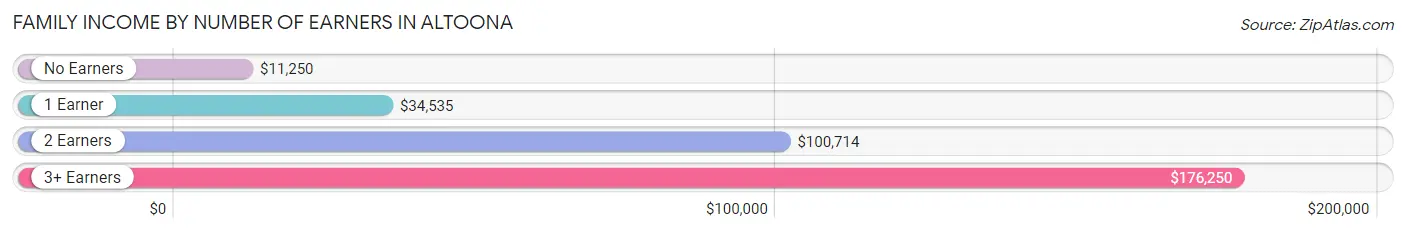
| Number of Earners | # Families | Median Income |
| No Earners | 59 (18.0%) | $11,250 |
| 1 Earner | 154 (46.9%) | $34,535 |
| 2 Earners | 82 (25.0%) | $100,714 |
| 3+ Earners | 33 (10.1%) | $176,250 |
| Total | 328 (100.0%) | $48,889 |
Household Income in Altoona
Household Income Brackets in Altoona
With 81 households falling in the category, the $10,000 to $14,999 income range is the most frequent in Altoona, accounting for 17.7% of all households. In contrast, only 17 households (3.7%) fall into the $200,000+ income bracket, making it the least populous group.
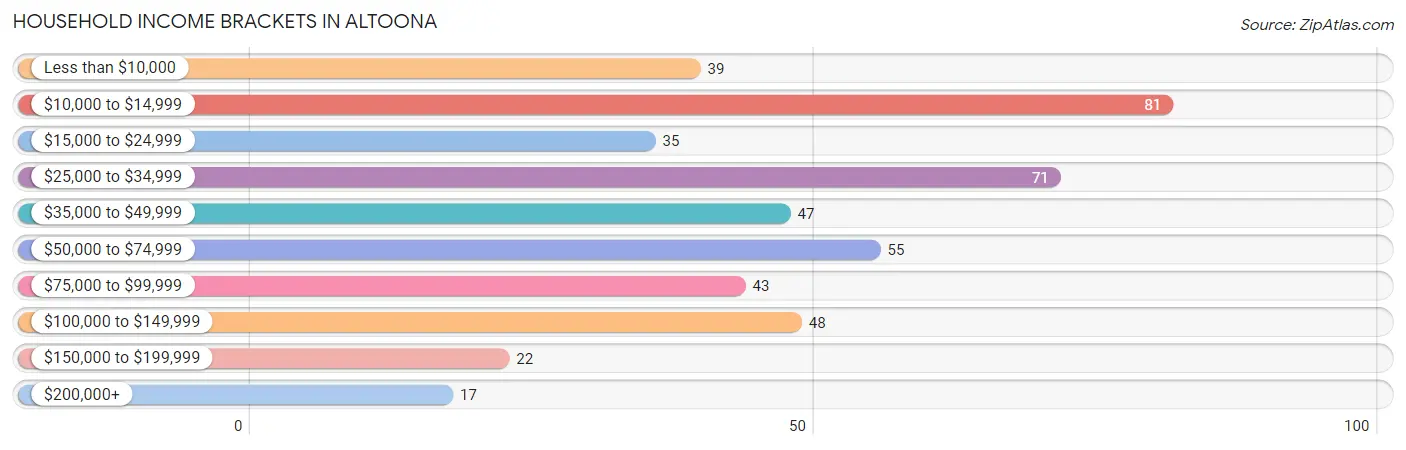
| Income Bracket | # Households | % Households |
| Less than $10,000 | 39 | 8.5% |
| $10,000 to $14,999 | 81 | 17.7% |
| $15,000 to $24,999 | 35 | 7.6% |
| $25,000 to $34,999 | 71 | 15.5% |
| $35,000 to $49,999 | 47 | 10.3% |
| $50,000 to $74,999 | 55 | 12.0% |
| $75,000 to $99,999 | 43 | 9.4% |
| $100,000 to $149,999 | 48 | 10.5% |
| $150,000 to $199,999 | 22 | 4.8% |
| $200,000+ | 17 | 3.7% |
Household Income by Householder Age in Altoona
The median household income in Altoona is $38,750, with the highest median household income of $57,344 found in the 45 to 64 years age bracket for the primary householder. A total of 197 households (43.0%) fall into this category. Meanwhile, the 15 to 24 years age bracket for the primary householder has the lowest median household income of $0, with 10 households (2.2%) in this group.
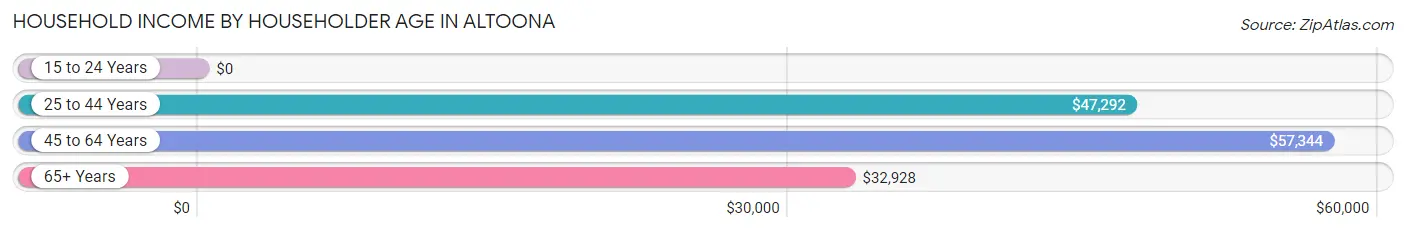
| Income Bracket | # Households | Median Income |
| 15 to 24 Years | 10 (2.2%) | $0 |
| 25 to 44 Years | 94 (20.5%) | $47,292 |
| 45 to 64 Years | 197 (43.0%) | $57,344 |
| 65+ Years | 157 (34.3%) | $32,928 |
| Total | 458 (100.0%) | $38,750 |
Poverty in Altoona
Income Below Poverty by Sex and Age in Altoona
With 10.0% poverty level for males and 31.9% for females among the residents of Altoona, 65 to 74 year old males and 5 year old females are the most vulnerable to poverty, with 38 males (53.5%) and 4 females (100.0%) in their respective age groups living below the poverty level.
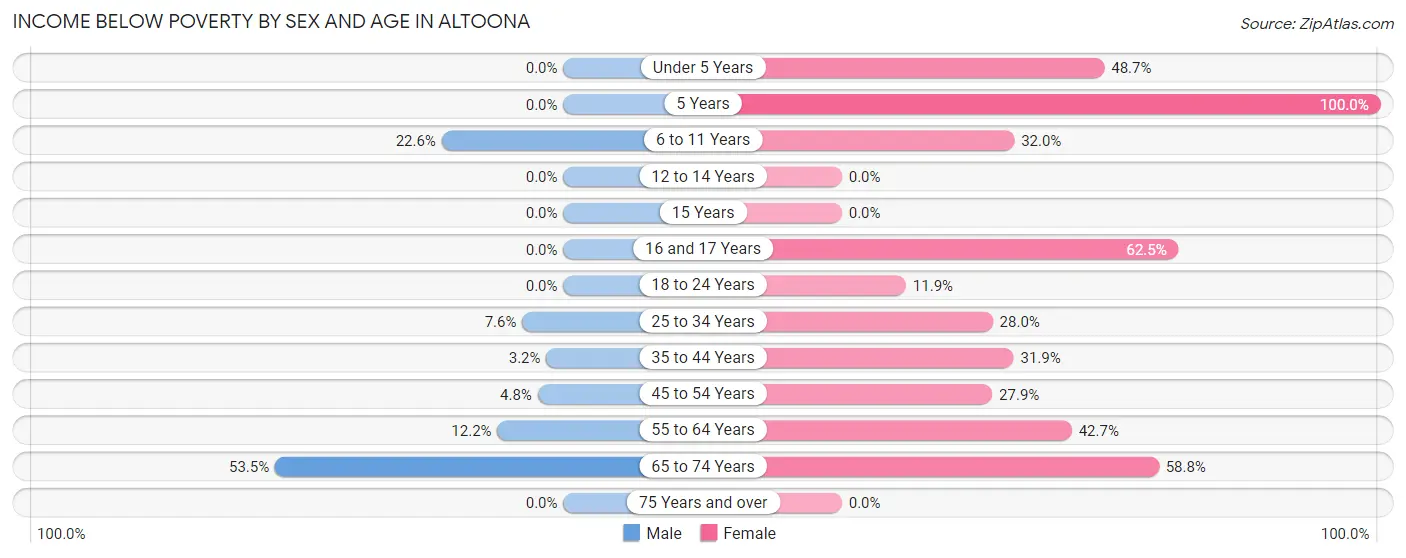
| Age Bracket | Male | Female |
| Under 5 Years | 0 (0.0%) | 19 (48.7%) |
| 5 Years | 0 (0.0%) | 4 (100.0%) |
| 6 to 11 Years | 7 (22.6%) | 8 (32.0%) |
| 12 to 14 Years | 0 (0.0%) | 0 (0.0%) |
| 15 Years | 0 (0.0%) | 0 (0.0%) |
| 16 and 17 Years | 0 (0.0%) | 15 (62.5%) |
| 18 to 24 Years | 0 (0.0%) | 5 (11.9%) |
| 25 to 34 Years | 8 (7.6%) | 21 (28.0%) |
| 35 to 44 Years | 8 (3.2%) | 22 (31.9%) |
| 45 to 54 Years | 4 (4.8%) | 24 (27.9%) |
| 55 to 64 Years | 6 (12.2%) | 35 (42.7%) |
| 65 to 74 Years | 38 (53.5%) | 40 (58.8%) |
| 75 Years and over | 0 (0.0%) | 0 (0.0%) |
| Total | 71 (10.0%) | 193 (31.9%) |
Income Above Poverty by Sex and Age in Altoona
According to the poverty statistics in Altoona, males aged under 5 years and females aged 12 to 14 years are the age groups that are most secure financially, with 100.0% of males and 100.0% of females in these age groups living above the poverty line.
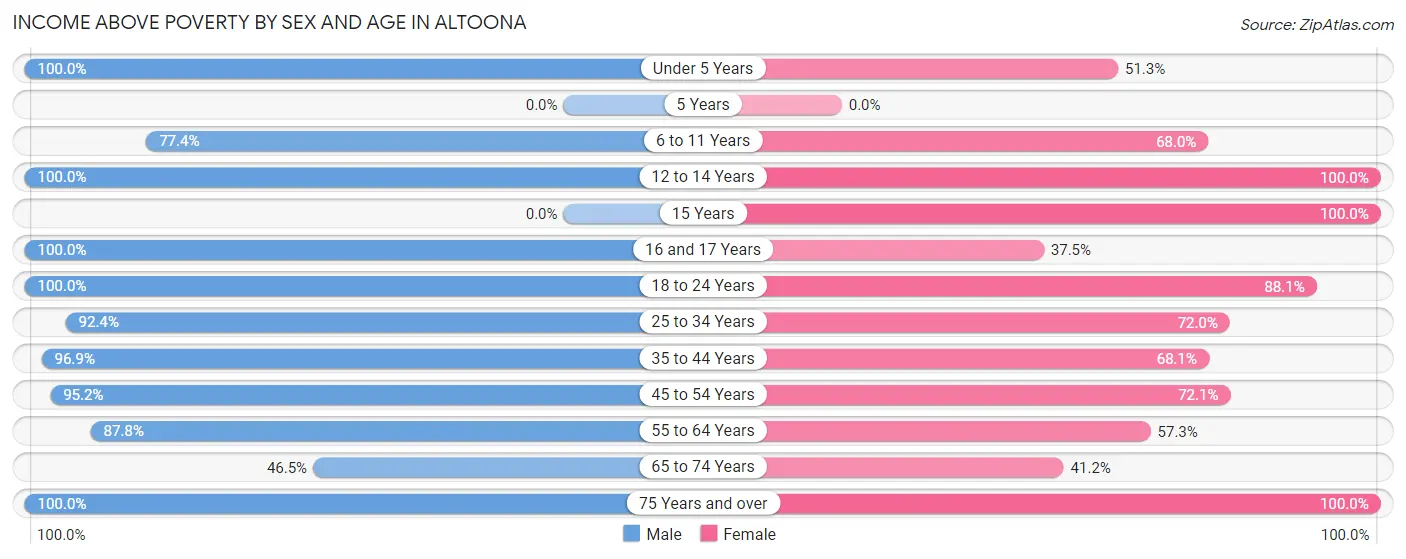
| Age Bracket | Male | Female |
| Under 5 Years | 16 (100.0%) | 20 (51.3%) |
| 5 Years | 0 (0.0%) | 0 (0.0%) |
| 6 to 11 Years | 24 (77.4%) | 17 (68.0%) |
| 12 to 14 Years | 13 (100.0%) | 35 (100.0%) |
| 15 Years | 0 (0.0%) | 6 (100.0%) |
| 16 and 17 Years | 26 (100.0%) | 9 (37.5%) |
| 18 to 24 Years | 48 (100.0%) | 37 (88.1%) |
| 25 to 34 Years | 97 (92.4%) | 54 (72.0%) |
| 35 to 44 Years | 246 (96.9%) | 47 (68.1%) |
| 45 to 54 Years | 80 (95.2%) | 62 (72.1%) |
| 55 to 64 Years | 43 (87.8%) | 47 (57.3%) |
| 65 to 74 Years | 33 (46.5%) | 28 (41.2%) |
| 75 Years and over | 10 (100.0%) | 51 (100.0%) |
| Total | 636 (90.0%) | 413 (68.1%) |
Income Below Poverty Among Married-Couple Families in Altoona
The poverty statistics for married-couple families in Altoona show that 21.1% or 43 of the total 204 families live below the poverty line. Families with no children have the highest poverty rate of 27.9%, comprising of 43 families. On the other hand, families with 1 or 2 children have the lowest poverty rate of 0.0%, which includes 0 families.
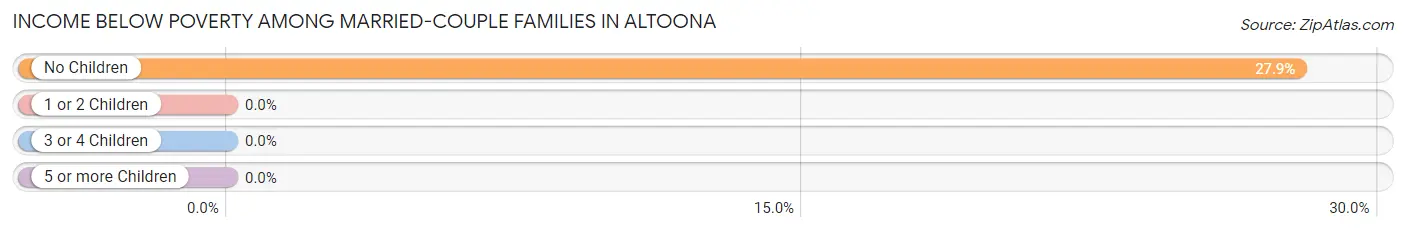
| Children | Above Poverty | Below Poverty |
| No Children | 111 (72.1%) | 43 (27.9%) |
| 1 or 2 Children | 30 (100.0%) | 0 (0.0%) |
| 3 or 4 Children | 20 (100.0%) | 0 (0.0%) |
| 5 or more Children | 0 (0.0%) | 0 (0.0%) |
| Total | 161 (78.9%) | 43 (21.1%) |
Income Below Poverty Among Single-Parent Households in Altoona
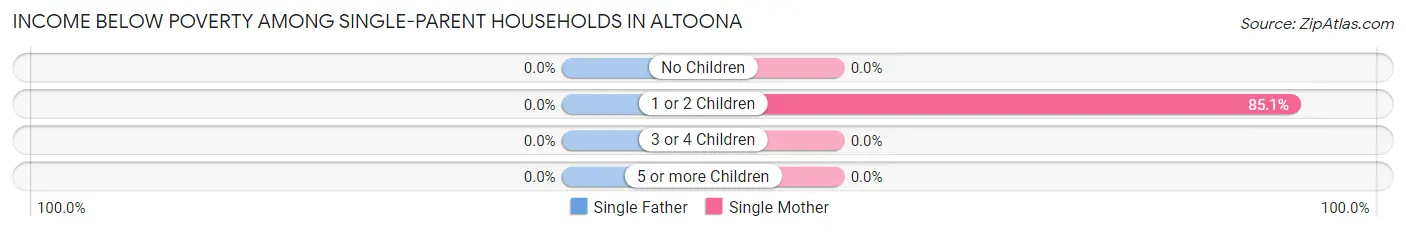
| Children | Single Father | Single Mother |
| No Children | 0 (0.0%) | 0 (0.0%) |
| 1 or 2 Children | 0 (0.0%) | 40 (85.1%) |
| 3 or 4 Children | 0 (0.0%) | 0 (0.0%) |
| 5 or more Children | 0 (0.0%) | 0 (0.0%) |
| Total | 0 (0.0%) | 40 (44.4%) |
Income Below Poverty Among Married-Couple vs Single-Parent Households in Altoona
The poverty data for Altoona shows that 43 of the married-couple family households (21.1%) and 40 of the single-parent households (32.3%) are living below the poverty level. Within the married-couple family households, those with no children have the highest poverty rate, with 43 households (27.9%) falling below the poverty line. Among the single-parent households, those with 1 or 2 children have the highest poverty rate, with 40 household (62.5%) living below poverty.
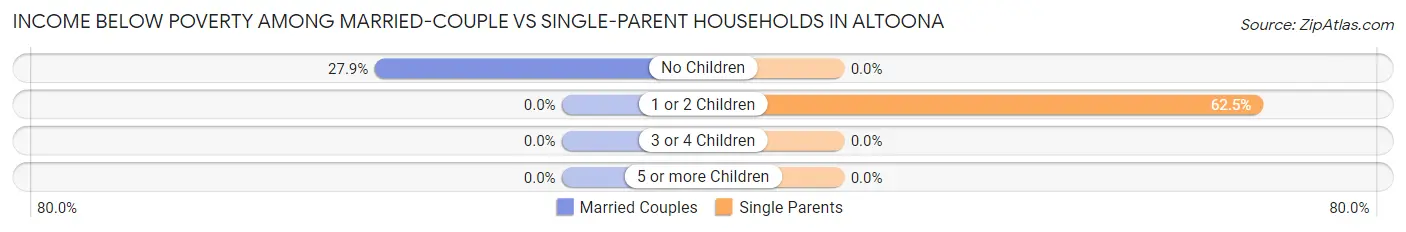
| Children | Married-Couple Families | Single-Parent Households |
| No Children | 43 (27.9%) | 0 (0.0%) |
| 1 or 2 Children | 0 (0.0%) | 40 (62.5%) |
| 3 or 4 Children | 0 (0.0%) | 0 (0.0%) |
| 5 or more Children | 0 (0.0%) | 0 (0.0%) |
| Total | 43 (21.1%) | 40 (32.3%) |
Race in Altoona
The most populous races in Altoona are White / Caucasian (1,292 | 95.1%), Hispanic or Latino (34 | 2.5%), and Two or more Races (27 | 2.0%).
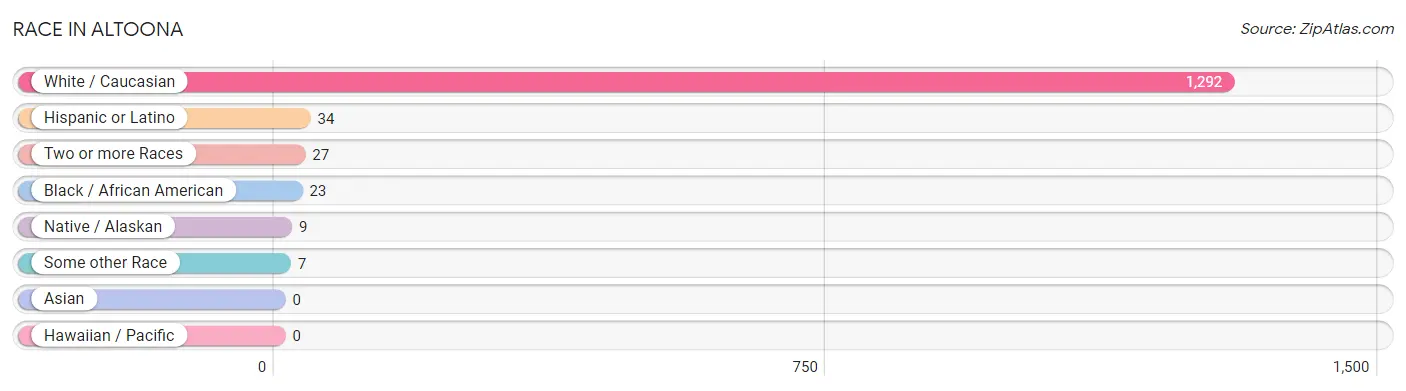
| Race | # Population | % Population |
| Asian | 0 | 0.0% |
| Black / African American | 23 | 1.7% |
| Hawaiian / Pacific | 0 | 0.0% |
| Hispanic or Latino | 34 | 2.5% |
| Native / Alaskan | 9 | 0.7% |
| White / Caucasian | 1,292 | 95.1% |
| Two or more Races | 27 | 2.0% |
| Some other Race | 7 | 0.5% |
| Total | 1,358 | 100.0% |
Ancestry in Altoona
The most populous ancestries reported in Altoona are American (394 | 29.0%), English (106 | 7.8%), Irish (79 | 5.8%), German (43 | 3.2%), and Mexican (31 | 2.3%), together accounting for 48.1% of all Altoona residents.
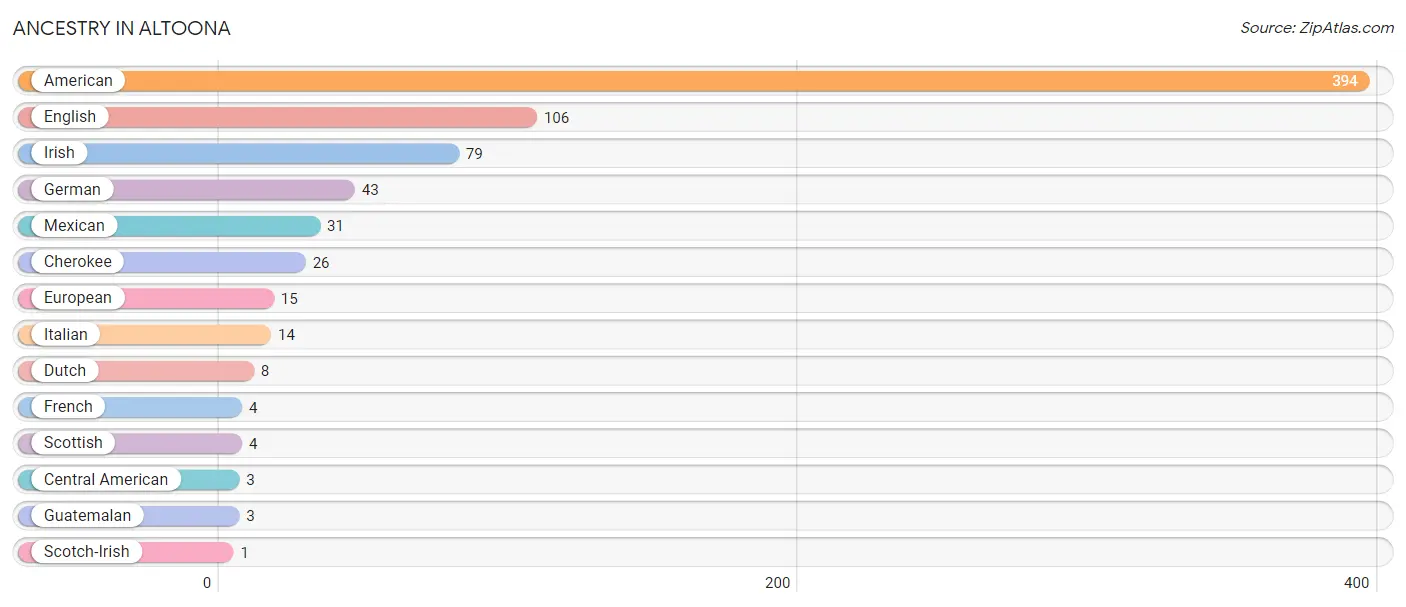
| Ancestry | # Population | % Population |
| American | 394 | 29.0% |
| Central American | 3 | 0.2% |
| Cherokee | 26 | 1.9% |
| Dutch | 8 | 0.6% |
| English | 106 | 7.8% |
| European | 15 | 1.1% |
| French | 4 | 0.3% |
| German | 43 | 3.2% |
| Guatemalan | 3 | 0.2% |
| Irish | 79 | 5.8% |
| Italian | 14 | 1.0% |
| Mexican | 31 | 2.3% |
| Scotch-Irish | 1 | 0.1% |
| Scottish | 4 | 0.3% | View All 14 Rows |
Immigrants in Altoona
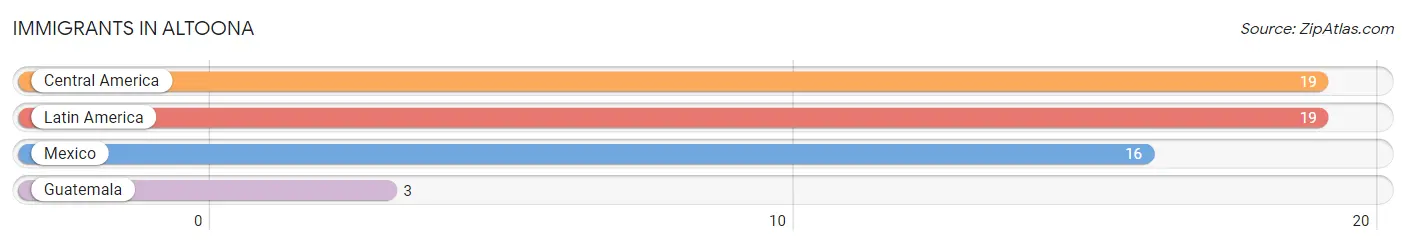
The most numerous immigrant groups reported in Altoona came from Central America (19 | 1.4%), Latin America (19 | 1.4%), Mexico (16 | 1.2%), and Guatemala (3 | 0.2%), together accounting for 4.2% of all Altoona residents.
| Immigration Origin | # Population | % Population |
| Central America | 19 | 1.4% |
| Guatemala | 3 | 0.2% |
| Latin America | 19 | 1.4% |
| Mexico | 16 | 1.2% | View All 4 Rows |
Sex and Age in Altoona
Sex and Age in Altoona
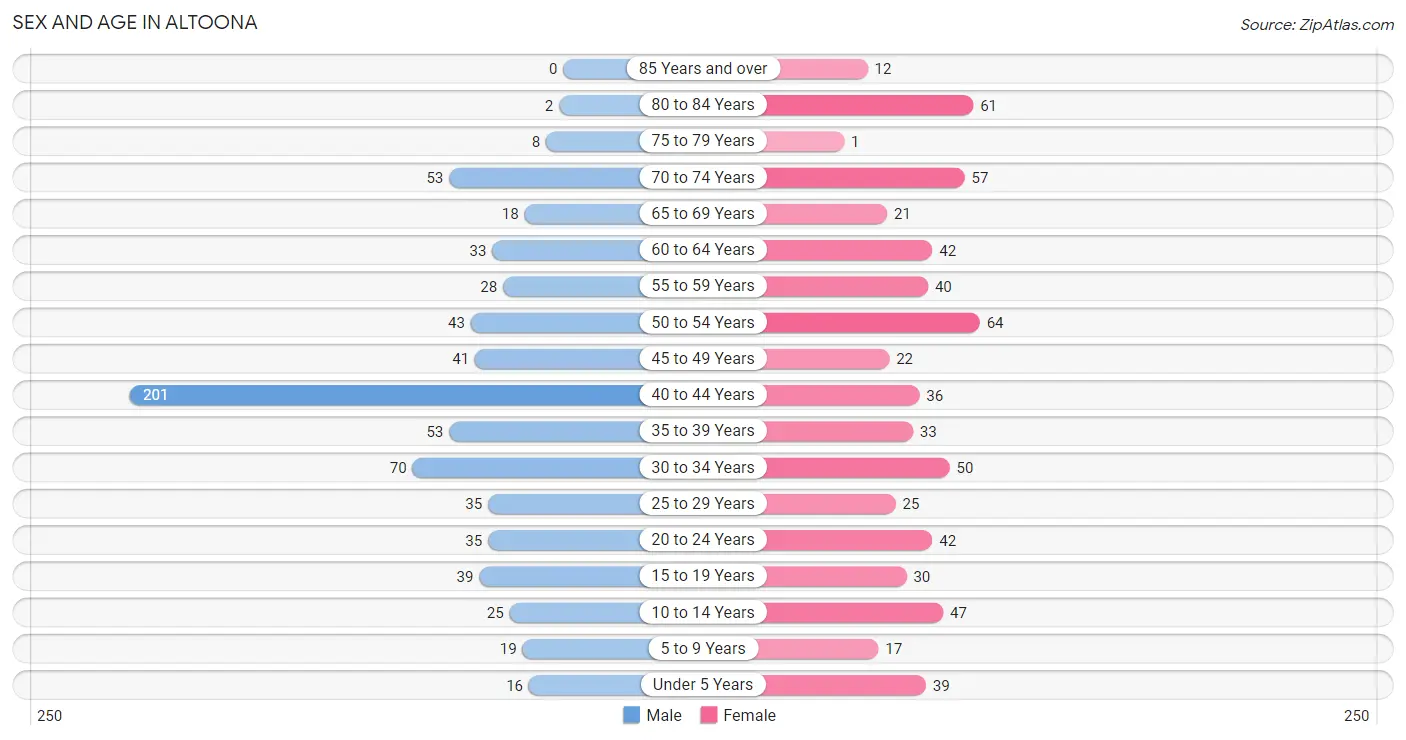
The most populous age groups in Altoona are 40 to 44 Years (201 | 28.0%) for men and 50 to 54 Years (64 | 10.0%) for women.
| Age Bracket | Male | Female |
| Under 5 Years | 16 (2.2%) | 39 (6.1%) |
| 5 to 9 Years | 19 (2.6%) | 17 (2.7%) |
| 10 to 14 Years | 25 (3.5%) | 47 (7.4%) |
| 15 to 19 Years | 39 (5.4%) | 30 (4.7%) |
| 20 to 24 Years | 35 (4.9%) | 42 (6.6%) |
| 25 to 29 Years | 35 (4.9%) | 25 (3.9%) |
| 30 to 34 Years | 70 (9.7%) | 50 (7.8%) |
| 35 to 39 Years | 53 (7.4%) | 33 (5.2%) |
| 40 to 44 Years | 201 (28.0%) | 36 (5.6%) |
| 45 to 49 Years | 41 (5.7%) | 22 (3.4%) |
| 50 to 54 Years | 43 (6.0%) | 64 (10.0%) |
| 55 to 59 Years | 28 (3.9%) | 40 (6.3%) |
| 60 to 64 Years | 33 (4.6%) | 42 (6.6%) |
| 65 to 69 Years | 18 (2.5%) | 21 (3.3%) |
| 70 to 74 Years | 53 (7.4%) | 57 (8.9%) |
| 75 to 79 Years | 8 (1.1%) | 1 (0.2%) |
| 80 to 84 Years | 2 (0.3%) | 61 (9.6%) |
| 85 Years and over | 0 (0.0%) | 12 (1.9%) |
| Total | 719 (100.0%) | 639 (100.0%) |
Families and Households in Altoona
Median Family Size in Altoona
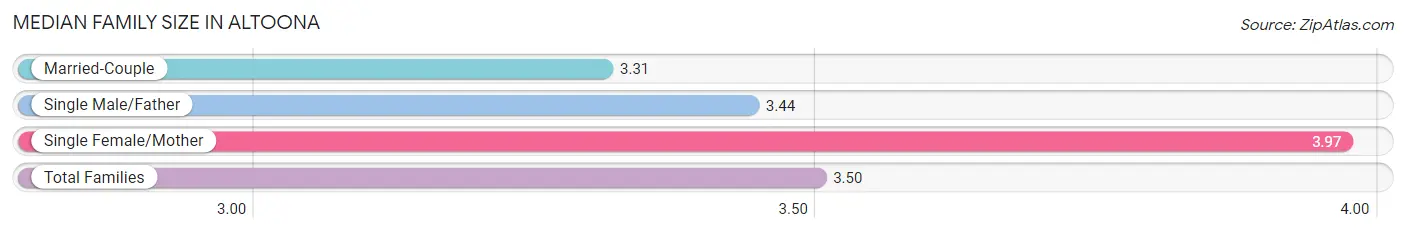
The median family size in Altoona is 3.50 persons per family, with single female/mother families (90 | 27.4%) accounting for the largest median family size of 3.97 persons per family. On the other hand, married-couple families (204 | 62.2%) represent the smallest median family size with 3.31 persons per family.
| Family Type | # Families | Family Size |
| Married-Couple | 204 (62.2%) | 3.31 |
| Single Male/Father | 34 (10.4%) | 3.44 |
| Single Female/Mother | 90 (27.4%) | 3.97 |
| Total Families | 328 (100.0%) | 3.50 |
Median Household Size in Altoona
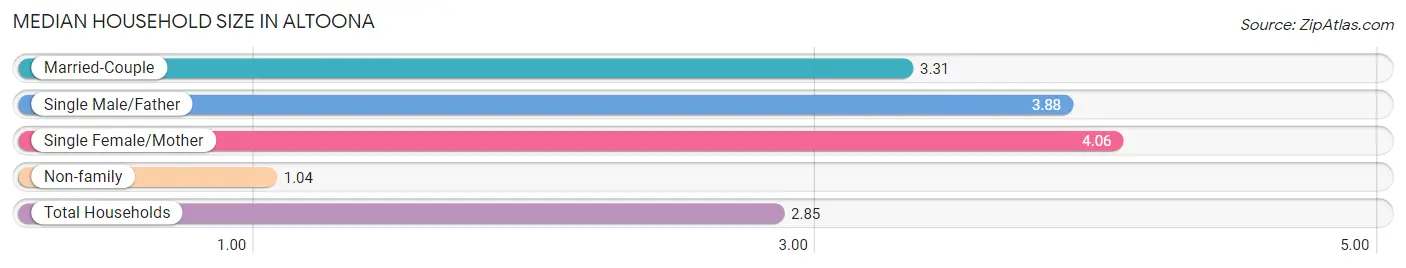
The median household size in Altoona is 2.85 persons per household, with single female/mother households (90 | 19.7%) accounting for the largest median household size of 4.06 persons per household. non-family households (130 | 28.4%) represent the smallest median household size with 1.04 persons per household.
| Household Type | # Households | Household Size |
| Married-Couple | 204 (44.5%) | 3.31 |
| Single Male/Father | 34 (7.4%) | 3.88 |
| Single Female/Mother | 90 (19.7%) | 4.06 |
| Non-family | 130 (28.4%) | 1.04 |
| Total Households | 458 (100.0%) | 2.85 |
Household Size by Marriage Status in Altoona
Out of a total of 458 households in Altoona, 328 (71.6%) are family households, while 130 (28.4%) are nonfamily households. The most numerous type of family households are 2-person households, comprising 189, and the most common type of nonfamily households are 1-person households, comprising 126.
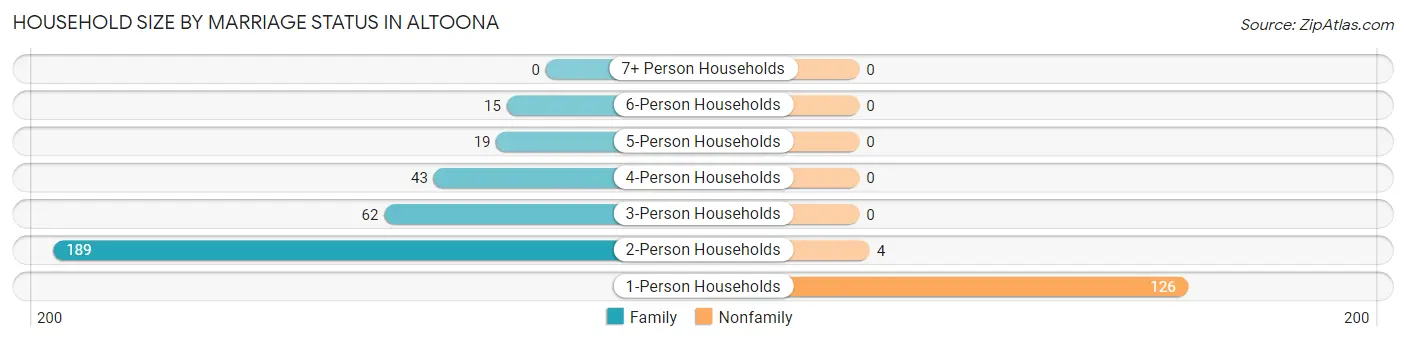
| Household Size | Family Households | Nonfamily Households |
| 1-Person Households | - | 126 (27.5%) |
| 2-Person Households | 189 (41.3%) | 4 (0.9%) |
| 3-Person Households | 62 (13.5%) | 0 (0.0%) |
| 4-Person Households | 43 (9.4%) | 0 (0.0%) |
| 5-Person Households | 19 (4.2%) | 0 (0.0%) |
| 6-Person Households | 15 (3.3%) | 0 (0.0%) |
| 7+ Person Households | 0 (0.0%) | 0 (0.0%) |
| Total | 328 (71.6%) | 130 (28.4%) |
Female Fertility in Altoona
Fertility by Age in Altoona
Average fertility rate in Altoona is 99.0 births per 1,000 women. Women in the age bracket of 15 to 19 years have the highest fertility rate with 267.0 births per 1,000 women. Women in the age bracket of 20 to 34 years acount for 66.7% of all women with births.
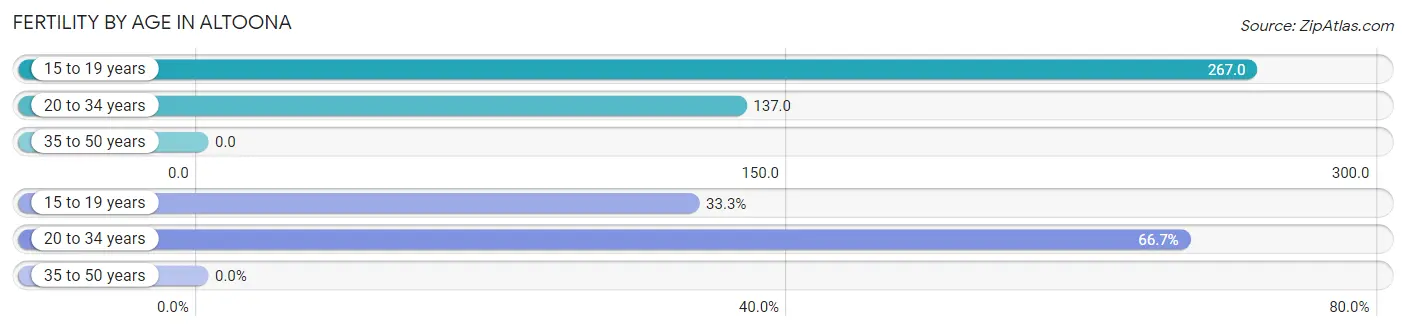
| Age Bracket | Women with Births | Births / 1,000 Women |
| 15 to 19 years | 8 (33.3%) | 267.0 |
| 20 to 34 years | 16 (66.7%) | 137.0 |
| 35 to 50 years | 0 (0.0%) | 0.0 |
| Total | 24 (100.0%) | 99.0 |
Fertility by Age by Marriage Status in Altoona
45.8% of women with births (24) in Altoona are married. The highest percentage of unmarried women with births falls into 15 to 19 years age bracket with 100.0% of them unmarried at the time of birth, while the lowest percentage of unmarried women with births belong to 20 to 34 years age bracket with 31.2% of them unmarried.
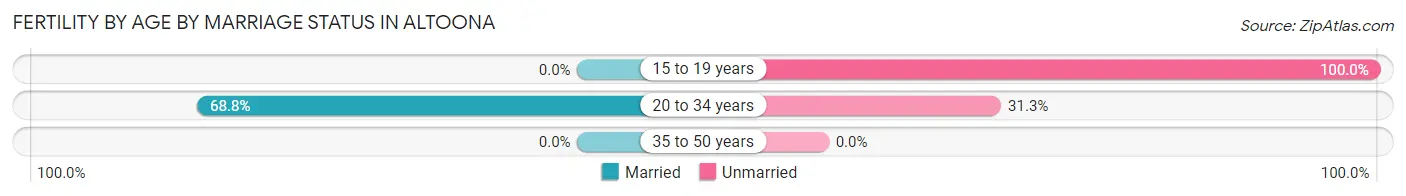
| Age Bracket | Married | Unmarried |
| 15 to 19 years | 0 (0.0%) | 8 (100.0%) |
| 20 to 34 years | 11 (68.8%) | 5 (31.2%) |
| 35 to 50 years | 0 (0.0%) | 0 (0.0%) |
| Total | 11 (45.8%) | 13 (54.2%) |
Fertility by Education in Altoona
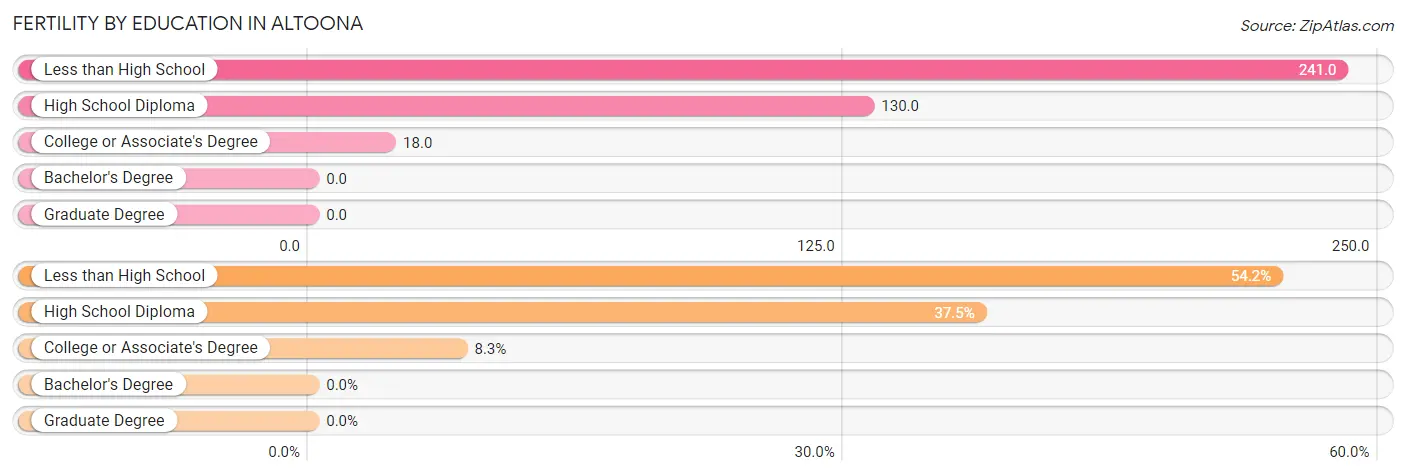
| Educational Attainment | Women with Births | Births / 1,000 Women |
| Less than High School | 13 (54.2%) | 241.0 |
| High School Diploma | 9 (37.5%) | 130.0 |
| College or Associate's Degree | 2 (8.3%) | 18.0 |
| Bachelor's Degree | 0 (0.0%) | 0.0 |
| Graduate Degree | 0 (0.0%) | 0.0 |
| Total | 24 (100.0%) | 99.0 |
Fertility by Education by Marriage Status in Altoona
54.2% of women with births in Altoona are unmarried. Women with the educational attainment of high school diploma are most likely to be married with 100.0% of them married at childbirth, while women with the educational attainment of less than high school are least likely to be married with 100.0% of them unmarried at childbirth.
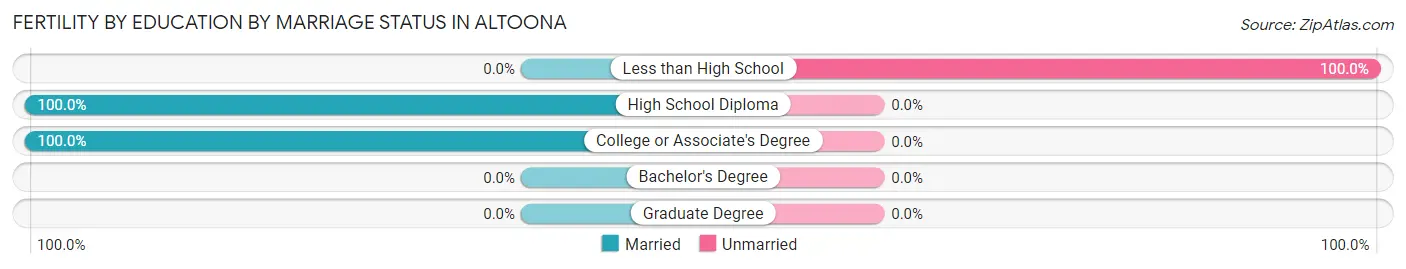
| Educational Attainment | Married | Unmarried |
| Less than High School | 0 (0.0%) | 13 (100.0%) |
| High School Diploma | 9 (100.0%) | 0 (0.0%) |
| College or Associate's Degree | 2 (100.0%) | 0 (0.0%) |
| Bachelor's Degree | 0 (0.0%) | 0 (0.0%) |
| Graduate Degree | 0 (0.0%) | 0 (0.0%) |
| Total | 11 (45.8%) | 13 (54.2%) |
Employment Characteristics in Altoona
Employment by Class of Employer in Altoona
Among the 644 employed individuals in Altoona, private company employees (300 | 46.6%), self-employed (not incorporated) (222 | 34.5%), and not-for-profit organizations (60 | 9.3%) make up the most common classes of employment.
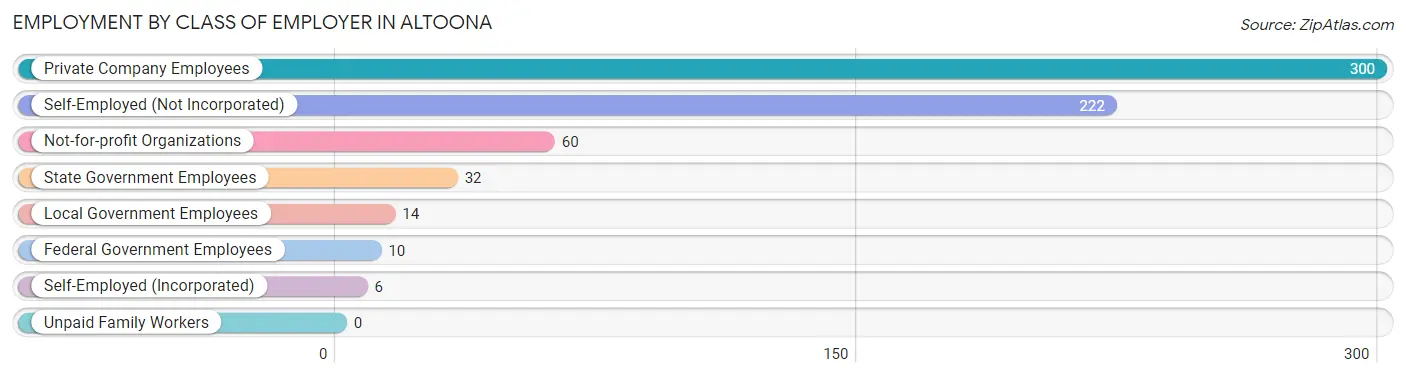
| Employer Class | # Employees | % Employees |
| Private Company Employees | 300 | 46.6% |
| Self-Employed (Incorporated) | 6 | 0.9% |
| Self-Employed (Not Incorporated) | 222 | 34.5% |
| Not-for-profit Organizations | 60 | 9.3% |
| Local Government Employees | 14 | 2.2% |
| State Government Employees | 32 | 5.0% |
| Federal Government Employees | 10 | 1.5% |
| Unpaid Family Workers | 0 | 0.0% |
| Total | 644 | 100.0% |
Employment Status by Age in Altoona
According to the labor force statistics for Altoona, out of the total population over 16 years of age (1,189), 57.4% or 682 individuals are in the labor force, with 3.4% or 23 of them unemployed. The age group with the highest labor force participation rate is 30 to 34 years, with 91.7% or 110 individuals in the labor force. Within the labor force, the 16 to 19 years age range has the highest percentage of unemployed individuals, with 24.2% or 8 of them being unemployed.
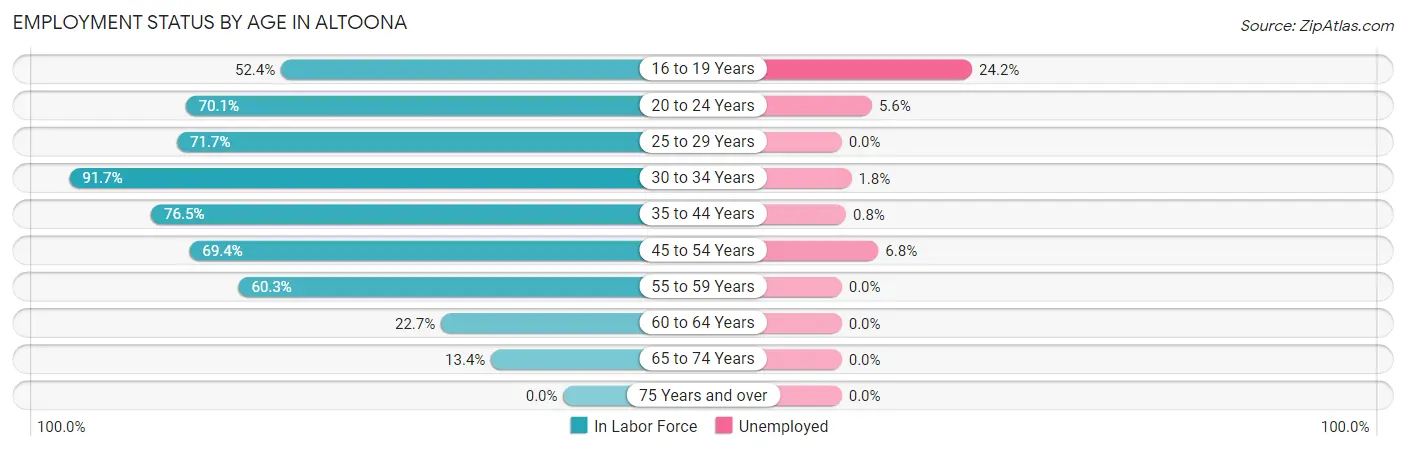
| Age Bracket | In Labor Force | Unemployed |
| 16 to 19 Years | 33 (52.4%) | 8 (24.2%) |
| 20 to 24 Years | 54 (70.1%) | 3 (5.6%) |
| 25 to 29 Years | 43 (71.7%) | 0 (0.0%) |
| 30 to 34 Years | 110 (91.7%) | 2 (1.8%) |
| 35 to 44 Years | 247 (76.5%) | 2 (0.8%) |
| 45 to 54 Years | 118 (69.4%) | 8 (6.8%) |
| 55 to 59 Years | 41 (60.3%) | 0 (0.0%) |
| 60 to 64 Years | 17 (22.7%) | 0 (0.0%) |
| 65 to 74 Years | 20 (13.4%) | 0 (0.0%) |
| 75 Years and over | 0 (0.0%) | 0 (0.0%) |
| Total | 682 (57.4%) | 23 (3.4%) |
Employment Status by Educational Attainment in Altoona
According to labor force statistics for Altoona, 70.6% of individuals (576) out of the total population between 25 and 64 years of age (816) are in the labor force, with 2.1% or 12 of them being unemployed. The group with the highest labor force participation rate are those with the educational attainment of bachelor's degree or higher, with 80.5% or 33 individuals in the labor force. Within the labor force, individuals with high school diploma education have the highest percentage of unemployment, with 3.0% or 10 of them being unemployed.
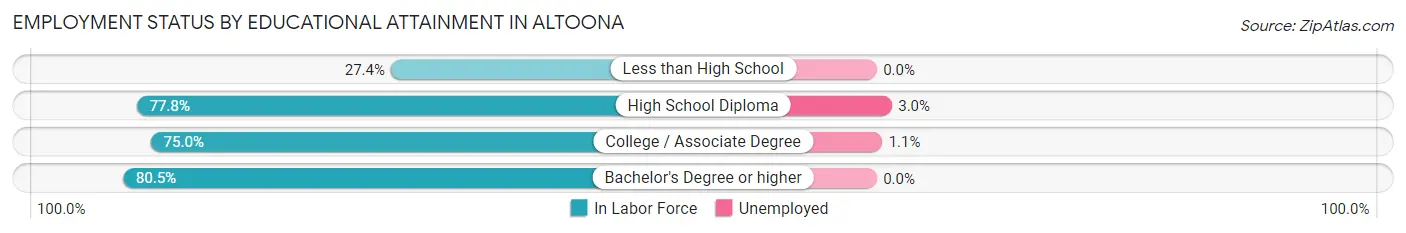
| Educational Attainment | In Labor Force | Unemployed |
| Less than High School | 29 (27.4%) | 0 (0.0%) |
| High School Diploma | 337 (77.8%) | 13 (3.0%) |
| College / Associate Degree | 177 (75.0%) | 3 (1.1%) |
| Bachelor's Degree or higher | 33 (80.5%) | 0 (0.0%) |
| Total | 576 (70.6%) | 17 (2.1%) |
Employment Occupations by Sex in Altoona
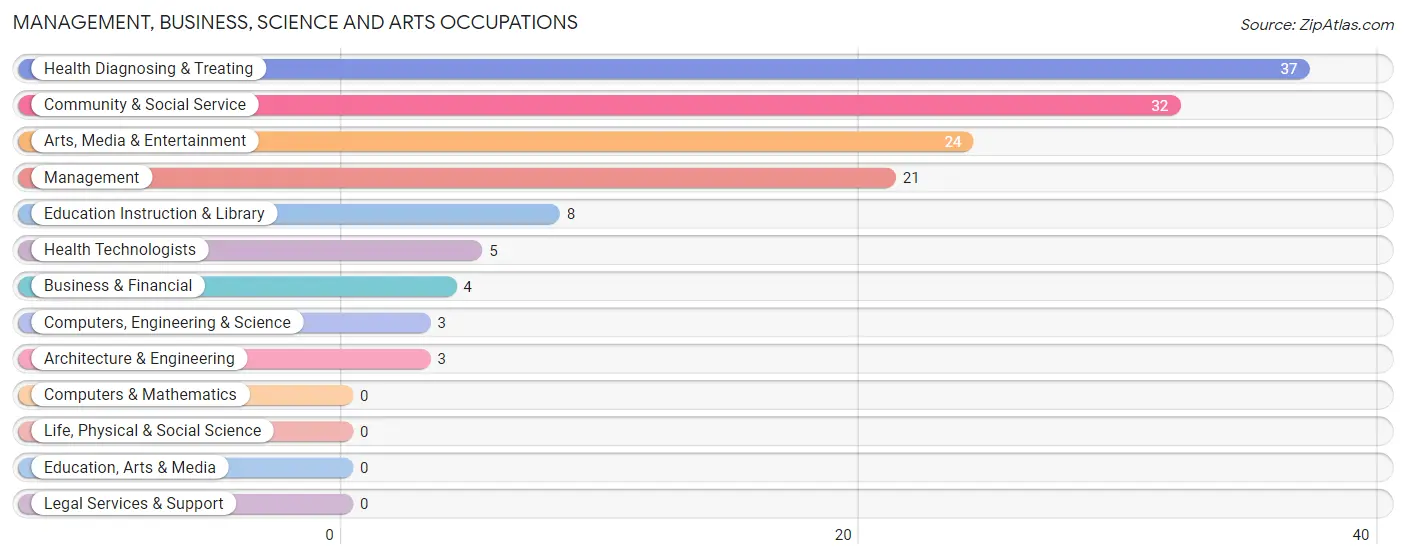
Management, Business, Science and Arts Occupations
The most common Management, Business, Science and Arts occupations in Altoona are Health Diagnosing & Treating (37 | 5.6%), Community & Social Service (32 | 4.9%), Arts, Media & Entertainment (24 | 3.6%), Management (21 | 3.2%), and Education Instruction & Library (8 | 1.2%).
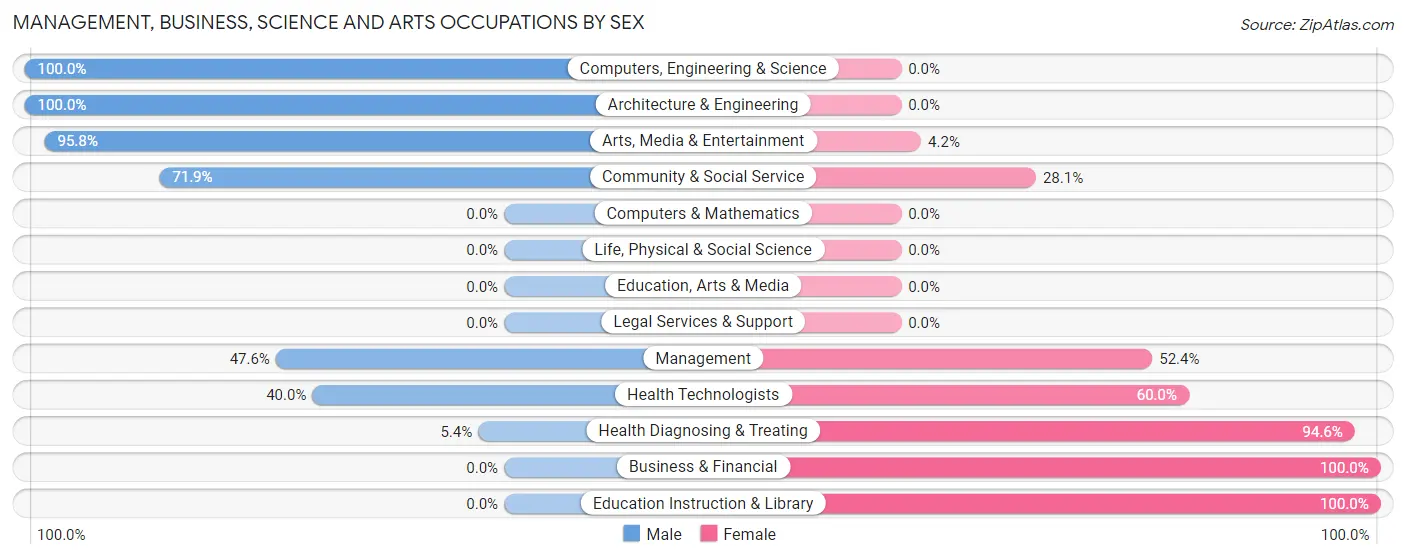
Management, Business, Science and Arts Occupations by Sex
Within the Management, Business, Science and Arts occupations in Altoona, the most male-oriented occupations are Computers, Engineering & Science (100.0%), Architecture & Engineering (100.0%), and Arts, Media & Entertainment (95.8%), while the most female-oriented occupations are Business & Financial (100.0%), Education Instruction & Library (100.0%), and Health Diagnosing & Treating (94.6%).
| Occupation | Male | Female |
| Management | 10 (47.6%) | 11 (52.4%) |
| Business & Financial | 0 (0.0%) | 4 (100.0%) |
| Computers, Engineering & Science | 3 (100.0%) | 0 (0.0%) |
| Computers & Mathematics | 0 (0.0%) | 0 (0.0%) |
| Architecture & Engineering | 3 (100.0%) | 0 (0.0%) |
| Life, Physical & Social Science | 0 (0.0%) | 0 (0.0%) |
| Community & Social Service | 23 (71.9%) | 9 (28.1%) |
| Education, Arts & Media | 0 (0.0%) | 0 (0.0%) |
| Legal Services & Support | 0 (0.0%) | 0 (0.0%) |
| Education Instruction & Library | 0 (0.0%) | 8 (100.0%) |
| Arts, Media & Entertainment | 23 (95.8%) | 1 (4.2%) |
| Health Diagnosing & Treating | 2 (5.4%) | 35 (94.6%) |
| Health Technologists | 2 (40.0%) | 3 (60.0%) |
| Total (Category) | 38 (39.2%) | 59 (60.8%) |
| Total (Overall) | 471 (71.4%) | 189 (28.6%) |
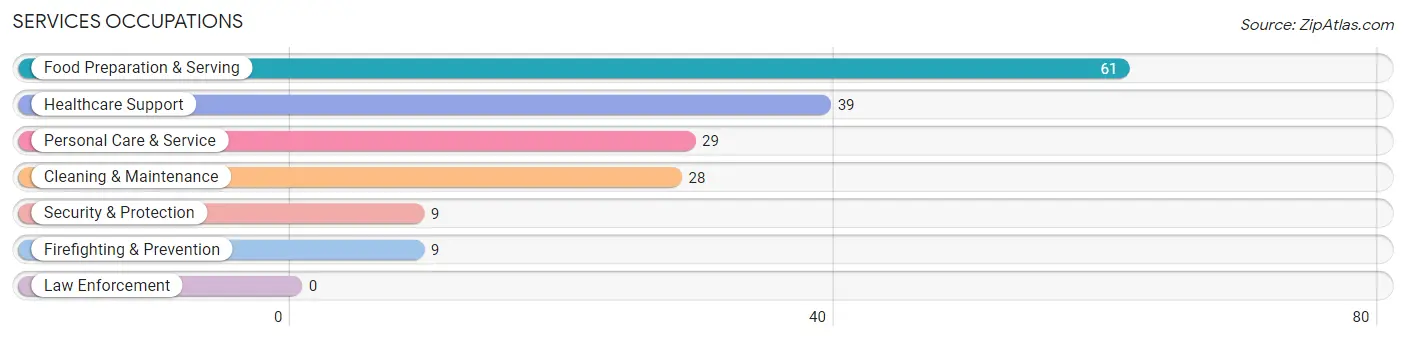
Services Occupations
The most common Services occupations in Altoona are Food Preparation & Serving (61 | 9.2%), Healthcare Support (39 | 5.9%), Personal Care & Service (29 | 4.4%), Cleaning & Maintenance (28 | 4.2%), and Security & Protection (9 | 1.4%).
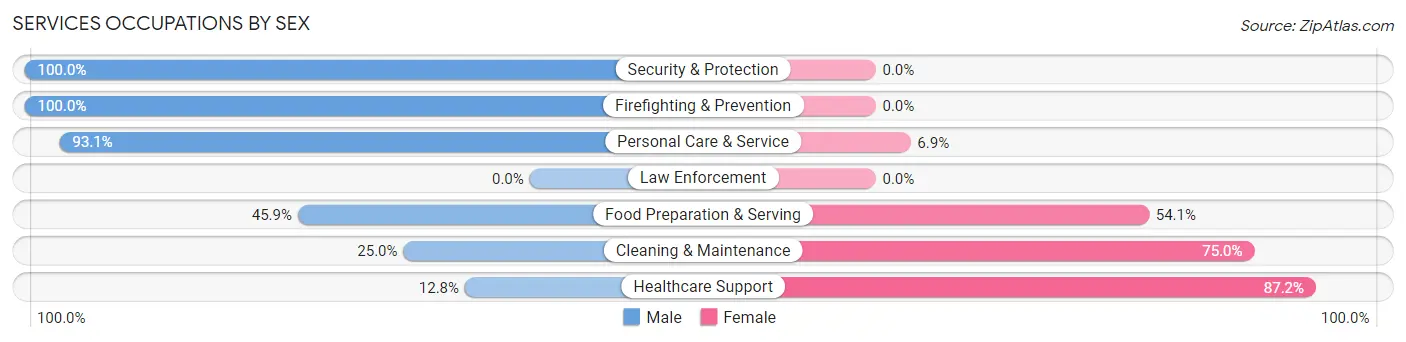
Services Occupations by Sex
Within the Services occupations in Altoona, the most male-oriented occupations are Security & Protection (100.0%), Firefighting & Prevention (100.0%), and Personal Care & Service (93.1%), while the most female-oriented occupations are Healthcare Support (87.2%), Cleaning & Maintenance (75.0%), and Food Preparation & Serving (54.1%).
| Occupation | Male | Female |
| Healthcare Support | 5 (12.8%) | 34 (87.2%) |
| Security & Protection | 9 (100.0%) | 0 (0.0%) |
| Firefighting & Prevention | 9 (100.0%) | 0 (0.0%) |
| Law Enforcement | 0 (0.0%) | 0 (0.0%) |
| Food Preparation & Serving | 28 (45.9%) | 33 (54.1%) |
| Cleaning & Maintenance | 7 (25.0%) | 21 (75.0%) |
| Personal Care & Service | 27 (93.1%) | 2 (6.9%) |
| Total (Category) | 76 (45.8%) | 90 (54.2%) |
| Total (Overall) | 471 (71.4%) | 189 (28.6%) |
Sales and Office Occupations
The most common Sales and Office occupations in Altoona are Sales & Related (41 | 6.2%), and Office & Administration (21 | 3.2%).
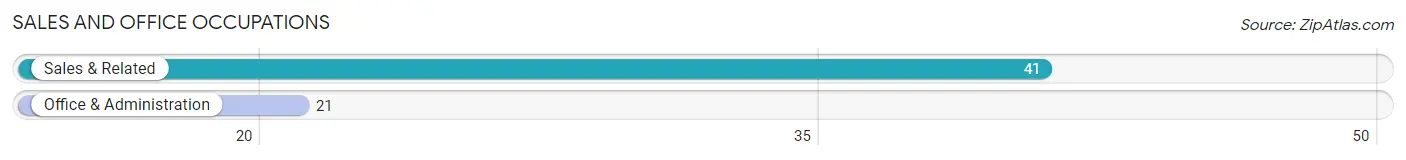
Sales and Office Occupations by Sex
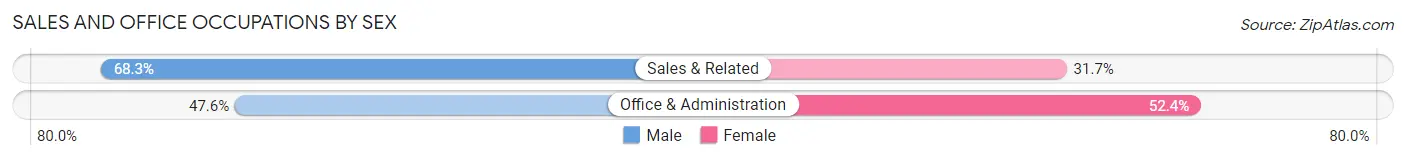
| Occupation | Male | Female |
| Sales & Related | 28 (68.3%) | 13 (31.7%) |
| Office & Administration | 10 (47.6%) | 11 (52.4%) |
| Total (Category) | 38 (61.3%) | 24 (38.7%) |
| Total (Overall) | 471 (71.4%) | 189 (28.6%) |
Natural Resources, Construction and Maintenance Occupations
The most common Natural Resources, Construction and Maintenance occupations in Altoona are Construction & Extraction (213 | 32.3%), Installation, Maintenance & Repair (25 | 3.8%), and Farming, Fishing & Forestry (2 | 0.3%).
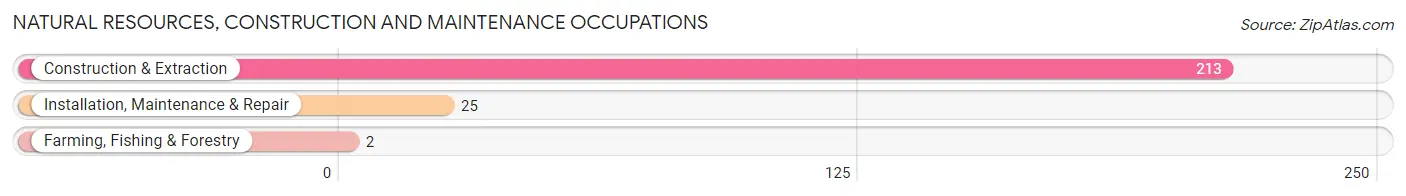
Natural Resources, Construction and Maintenance Occupations by Sex
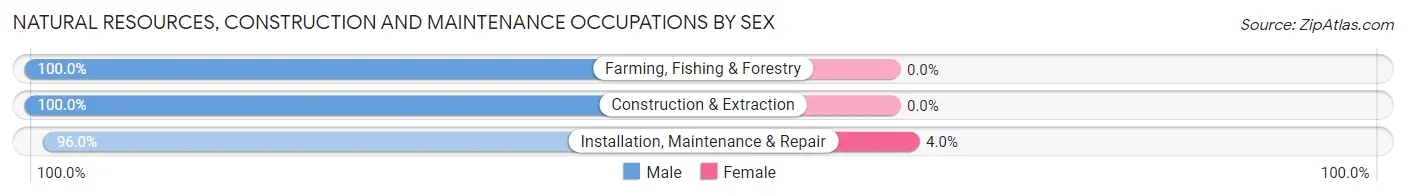
| Occupation | Male | Female |
| Farming, Fishing & Forestry | 2 (100.0%) | 0 (0.0%) |
| Construction & Extraction | 213 (100.0%) | 0 (0.0%) |
| Installation, Maintenance & Repair | 24 (96.0%) | 1 (4.0%) |
| Total (Category) | 239 (99.6%) | 1 (0.4%) |
| Total (Overall) | 471 (71.4%) | 189 (28.6%) |
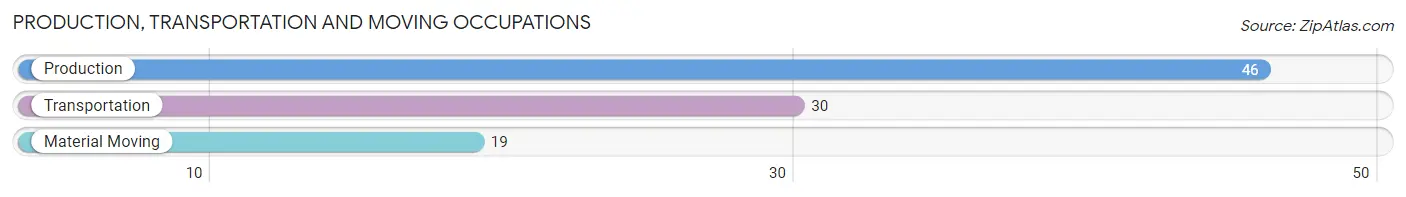
Production, Transportation and Moving Occupations
The most common Production, Transportation and Moving occupations in Altoona are Production (46 | 7.0%), Transportation (30 | 4.5%), and Material Moving (19 | 2.9%).
Production, Transportation and Moving Occupations by Sex
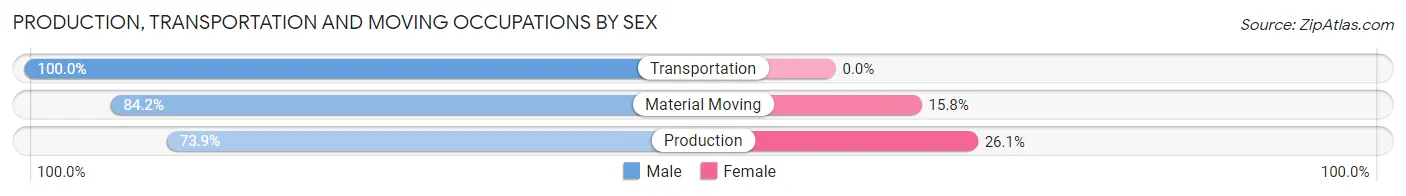
| Occupation | Male | Female |
| Production | 34 (73.9%) | 12 (26.1%) |
| Transportation | 30 (100.0%) | 0 (0.0%) |
| Material Moving | 16 (84.2%) | 3 (15.8%) |
| Total (Category) | 80 (84.2%) | 15 (15.8%) |
| Total (Overall) | 471 (71.4%) | 189 (28.6%) |
Employment Industries by Sex in Altoona
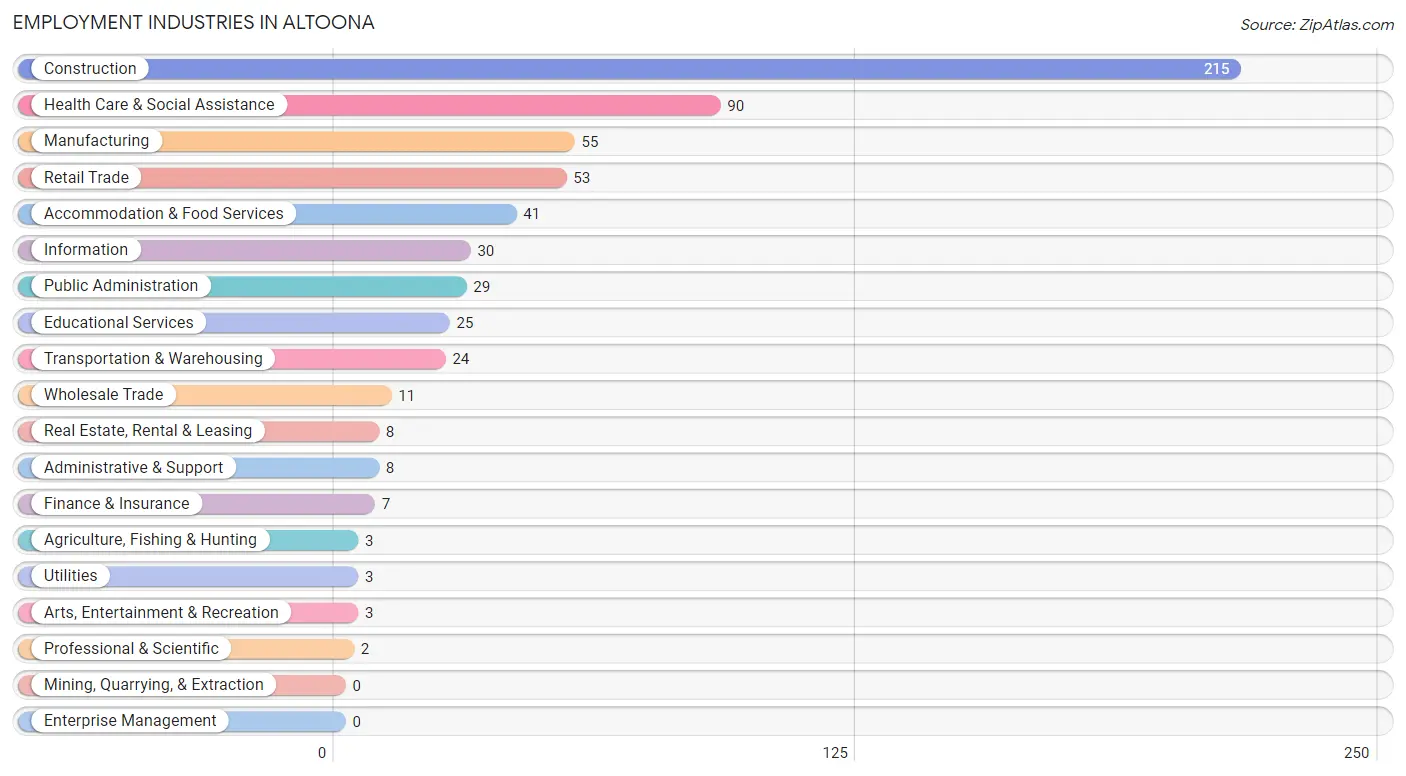
Employment Industries in Altoona
The major employment industries in Altoona include Construction (215 | 32.6%), Health Care & Social Assistance (90 | 13.6%), Manufacturing (55 | 8.3%), Retail Trade (53 | 8.0%), and Accommodation & Food Services (41 | 6.2%).
Employment Industries by Sex in Altoona
The Altoona industries that see more men than women are Agriculture, Fishing & Hunting (100.0%), Construction (100.0%), and Wholesale Trade (100.0%), whereas the industries that tend to have a higher number of women are Finance & Insurance (100.0%), Real Estate, Rental & Leasing (100.0%), and Educational Services (100.0%).
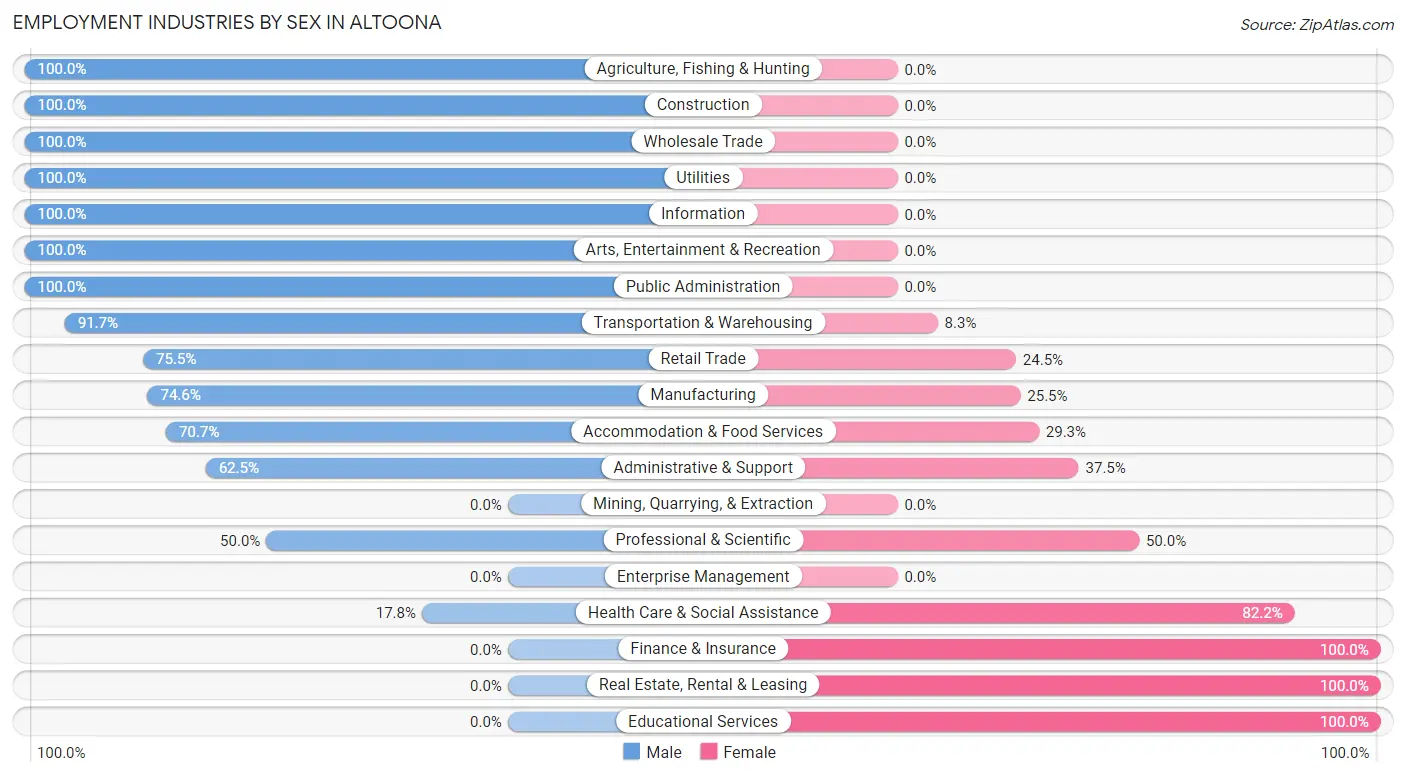
| Industry | Male | Female |
| Agriculture, Fishing & Hunting | 3 (100.0%) | 0 (0.0%) |
| Mining, Quarrying, & Extraction | 0 (0.0%) | 0 (0.0%) |
| Construction | 215 (100.0%) | 0 (0.0%) |
| Manufacturing | 41 (74.6%) | 14 (25.5%) |
| Wholesale Trade | 11 (100.0%) | 0 (0.0%) |
| Retail Trade | 40 (75.5%) | 13 (24.5%) |
| Transportation & Warehousing | 22 (91.7%) | 2 (8.3%) |
| Utilities | 3 (100.0%) | 0 (0.0%) |
| Information | 30 (100.0%) | 0 (0.0%) |
| Finance & Insurance | 0 (0.0%) | 7 (100.0%) |
| Real Estate, Rental & Leasing | 0 (0.0%) | 8 (100.0%) |
| Professional & Scientific | 1 (50.0%) | 1 (50.0%) |
| Enterprise Management | 0 (0.0%) | 0 (0.0%) |
| Administrative & Support | 5 (62.5%) | 3 (37.5%) |
| Educational Services | 0 (0.0%) | 25 (100.0%) |
| Health Care & Social Assistance | 16 (17.8%) | 74 (82.2%) |
| Arts, Entertainment & Recreation | 3 (100.0%) | 0 (0.0%) |
| Accommodation & Food Services | 29 (70.7%) | 12 (29.3%) |
| Public Administration | 29 (100.0%) | 0 (0.0%) |
| Total | 471 (71.4%) | 189 (28.6%) |
Education in Altoona
School Enrollment in Altoona
The most common levels of schooling among the 240 students in Altoona are college / undergraduate (80 | 33.3%), high school (66 | 27.5%), and elementary school (52 | 21.7%).
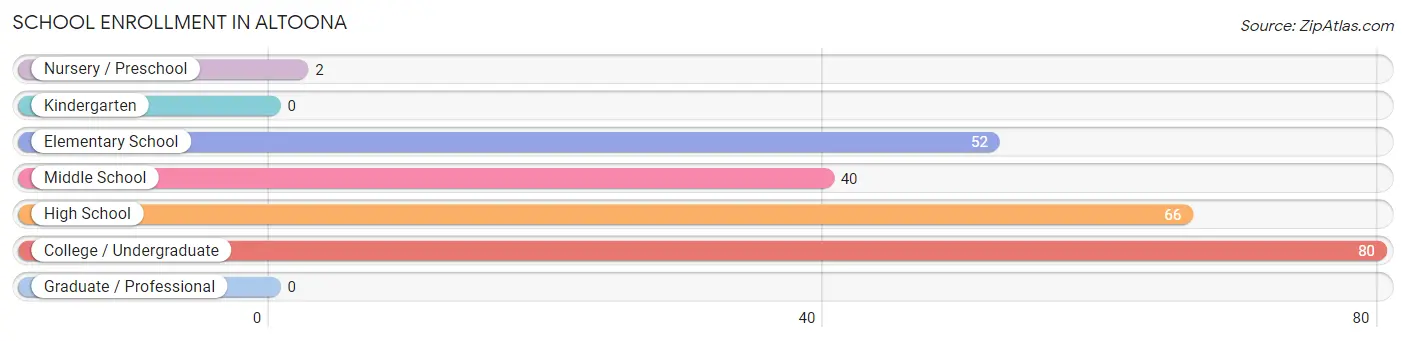
| School Level | # Students | % Students |
| Nursery / Preschool | 2 | 0.8% |
| Kindergarten | 0 | 0.0% |
| Elementary School | 52 | 21.7% |
| Middle School | 40 | 16.7% |
| High School | 66 | 27.5% |
| College / Undergraduate | 80 | 33.3% |
| Graduate / Professional | 0 | 0.0% |
| Total | 240 | 100.0% |
School Enrollment by Age by Funding Source in Altoona
Out of a total of 240 students who are enrolled in schools in Altoona, 16 (6.7%) attend a private institution, while the remaining 224 (93.3%) are enrolled in public schools. The age group of 3 to 4 year olds has the highest likelihood of being enrolled in private schools, with 2 (100.0% in the age bracket) enrolled. Conversely, the age group of 5 to 9 year old has the lowest likelihood of being enrolled in a private school, with 30 (100.0% in the age bracket) attending a public institution.
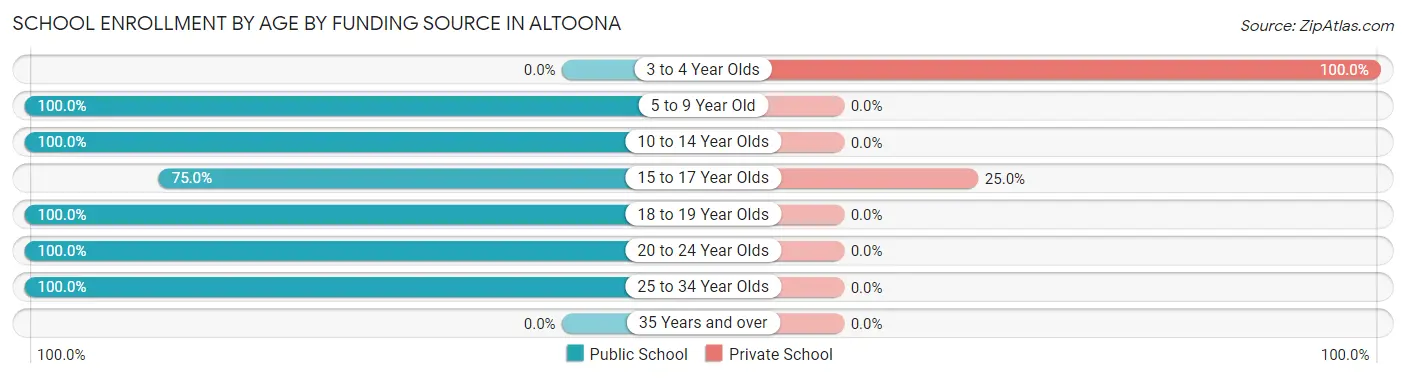
| Age Bracket | Public School | Private School |
| 3 to 4 Year Olds | 0 (0.0%) | 2 (100.0%) |
| 5 to 9 Year Old | 30 (100.0%) | 0 (0.0%) |
| 10 to 14 Year Olds | 72 (100.0%) | 0 (0.0%) |
| 15 to 17 Year Olds | 42 (75.0%) | 14 (25.0%) |
| 18 to 19 Year Olds | 13 (100.0%) | 0 (0.0%) |
| 20 to 24 Year Olds | 35 (100.0%) | 0 (0.0%) |
| 25 to 34 Year Olds | 32 (100.0%) | 0 (0.0%) |
| 35 Years and over | 0 (0.0%) | 0 (0.0%) |
| Total | 224 (93.3%) | 16 (6.7%) |
Educational Attainment by Field of Study in Altoona
Business (40 | 42.1%), liberal arts & history (27 | 28.4%), education (18 | 19.0%), arts & humanities (6 | 6.3%), and computers & mathematics (2 | 2.1%) are the most common fields of study among 95 individuals in Altoona who have obtained a bachelor's degree or higher.
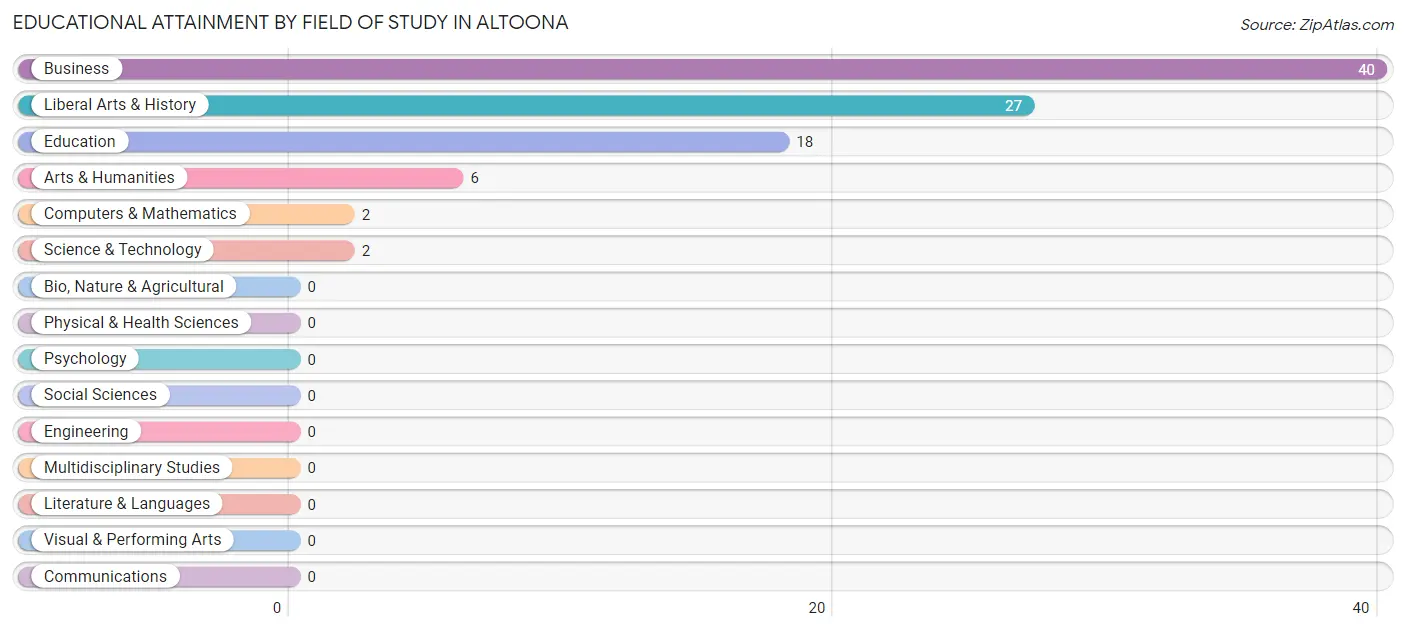
| Field of Study | # Graduates | % Graduates |
| Computers & Mathematics | 2 | 2.1% |
| Bio, Nature & Agricultural | 0 | 0.0% |
| Physical & Health Sciences | 0 | 0.0% |
| Psychology | 0 | 0.0% |
| Social Sciences | 0 | 0.0% |
| Engineering | 0 | 0.0% |
| Multidisciplinary Studies | 0 | 0.0% |
| Science & Technology | 2 | 2.1% |
| Business | 40 | 42.1% |
| Education | 18 | 19.0% |
| Literature & Languages | 0 | 0.0% |
| Liberal Arts & History | 27 | 28.4% |
| Visual & Performing Arts | 0 | 0.0% |
| Communications | 0 | 0.0% |
| Arts & Humanities | 6 | 6.3% |
| Total | 95 | 100.0% |
Transportation & Commute in Altoona
Vehicle Availability by Sex in Altoona
The most prevalent vehicle ownership categories in Altoona are males with 4 vehicles (280, accounting for 61.5%) and females with 4 vehicles (36, making up 148.2%).
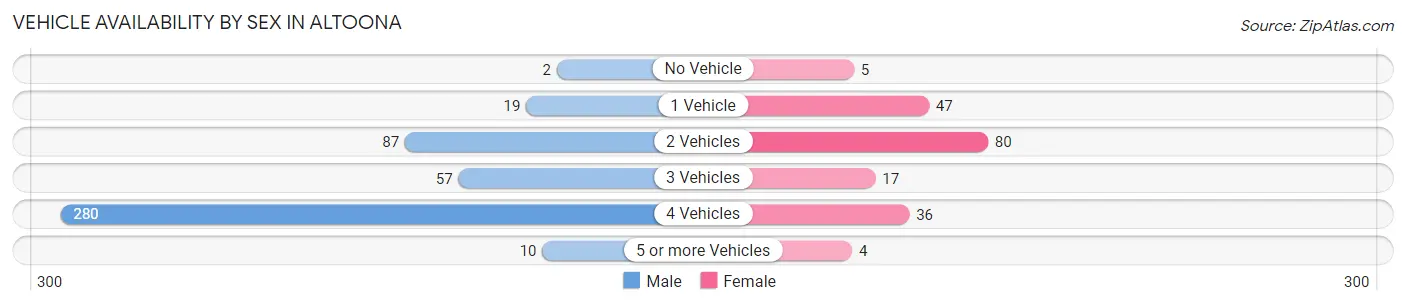
| Vehicles Available | Male | Female |
| No Vehicle | 2 (0.4%) | 5 (2.6%) |
| 1 Vehicle | 19 (4.2%) | 47 (24.9%) |
| 2 Vehicles | 87 (19.1%) | 80 (42.3%) |
| 3 Vehicles | 57 (12.5%) | 17 (9.0%) |
| 4 Vehicles | 280 (61.5%) | 36 (19.1%) |
| 5 or more Vehicles | 10 (2.2%) | 4 (2.1%) |
| Total | 455 (100.0%) | 189 (100.0%) |
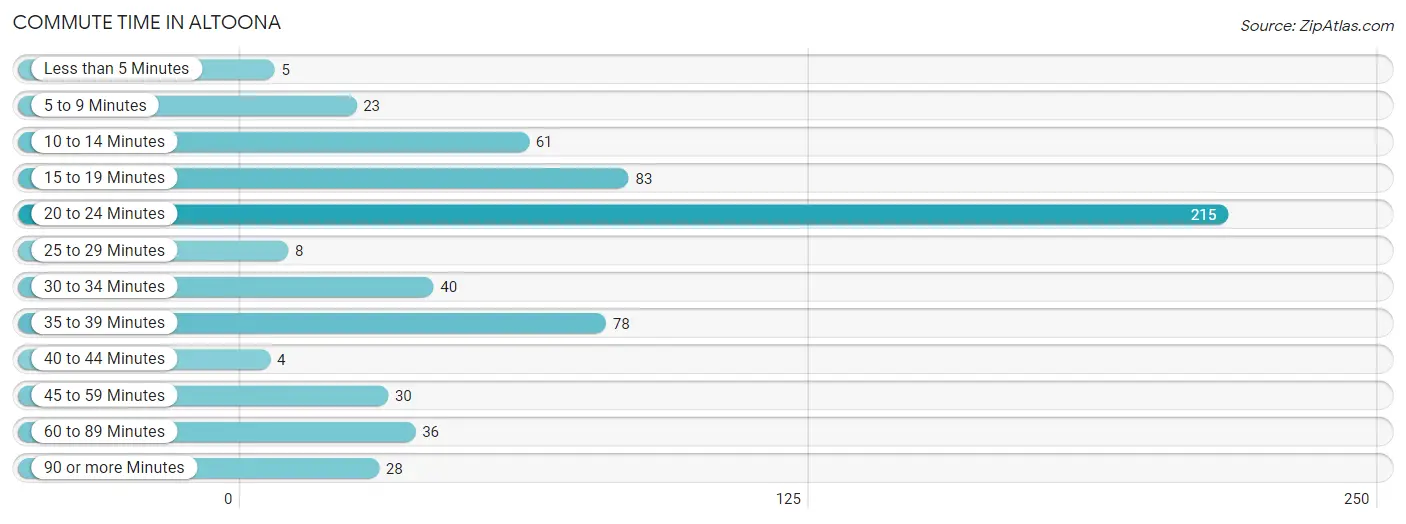
Commute Time in Altoona
The most frequently occuring commute durations in Altoona are 20 to 24 minutes (215 commuters, 35.2%), 15 to 19 minutes (83 commuters, 13.6%), and 35 to 39 minutes (78 commuters, 12.8%).
| Commute Time | # Commuters | % Commuters |
| Less than 5 Minutes | 5 | 0.8% |
| 5 to 9 Minutes | 23 | 3.8% |
| 10 to 14 Minutes | 61 | 10.0% |
| 15 to 19 Minutes | 83 | 13.6% |
| 20 to 24 Minutes | 215 | 35.2% |
| 25 to 29 Minutes | 8 | 1.3% |
| 30 to 34 Minutes | 40 | 6.6% |
| 35 to 39 Minutes | 78 | 12.8% |
| 40 to 44 Minutes | 4 | 0.6% |
| 45 to 59 Minutes | 30 | 4.9% |
| 60 to 89 Minutes | 36 | 5.9% |
| 90 or more Minutes | 28 | 4.6% |
Commute Time by Sex in Altoona
The most common commute times in Altoona are 20 to 24 minutes (202 commuters, 45.8%) for males and 15 to 19 minutes (46 commuters, 27.1%) for females.
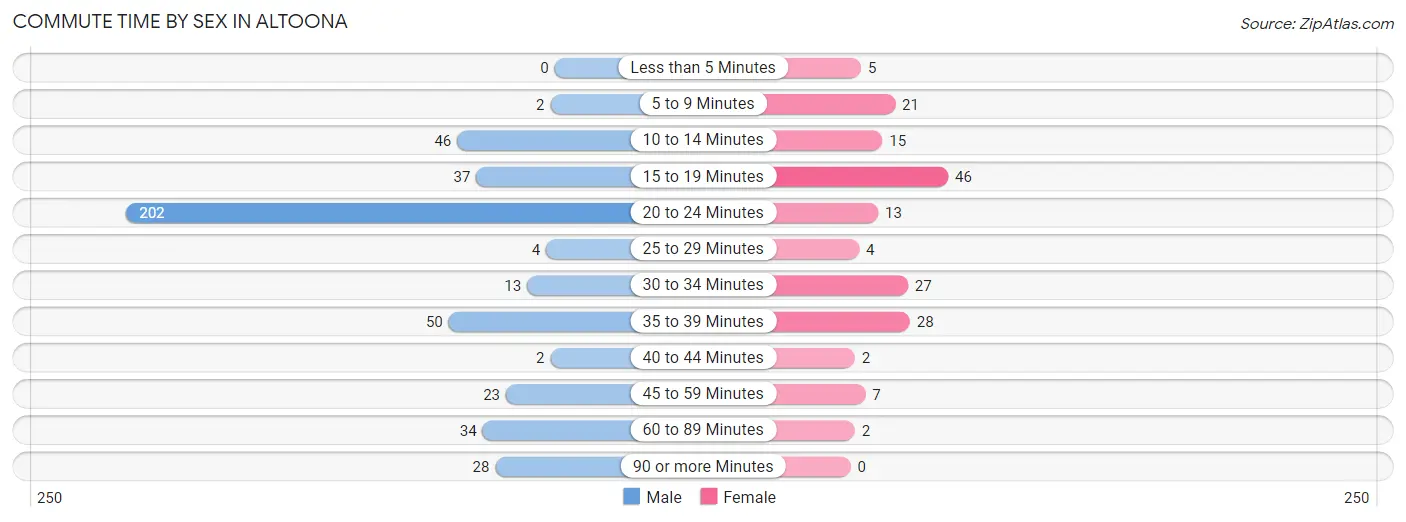
| Commute Time | Male | Female |
| Less than 5 Minutes | 0 (0.0%) | 5 (2.9%) |
| 5 to 9 Minutes | 2 (0.4%) | 21 (12.3%) |
| 10 to 14 Minutes | 46 (10.4%) | 15 (8.8%) |
| 15 to 19 Minutes | 37 (8.4%) | 46 (27.1%) |
| 20 to 24 Minutes | 202 (45.8%) | 13 (7.6%) |
| 25 to 29 Minutes | 4 (0.9%) | 4 (2.4%) |
| 30 to 34 Minutes | 13 (2.9%) | 27 (15.9%) |
| 35 to 39 Minutes | 50 (11.3%) | 28 (16.5%) |
| 40 to 44 Minutes | 2 (0.4%) | 2 (1.2%) |
| 45 to 59 Minutes | 23 (5.2%) | 7 (4.1%) |
| 60 to 89 Minutes | 34 (7.7%) | 2 (1.2%) |
| 90 or more Minutes | 28 (6.4%) | 0 (0.0%) |
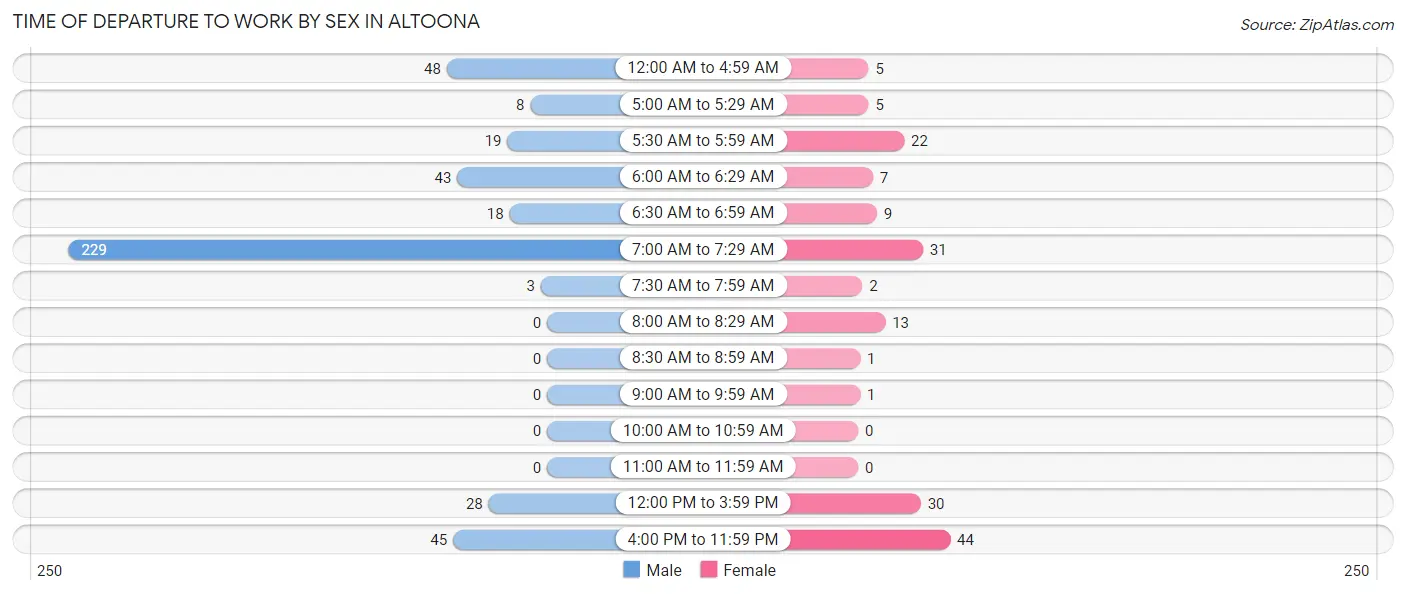
Time of Departure to Work by Sex in Altoona
The most frequent times of departure to work in Altoona are 7:00 AM to 7:29 AM (229, 51.9%) for males and 4:00 PM to 11:59 PM (44, 25.9%) for females.
| Time of Departure | Male | Female |
| 12:00 AM to 4:59 AM | 48 (10.9%) | 5 (2.9%) |
| 5:00 AM to 5:29 AM | 8 (1.8%) | 5 (2.9%) |
| 5:30 AM to 5:59 AM | 19 (4.3%) | 22 (12.9%) |
| 6:00 AM to 6:29 AM | 43 (9.8%) | 7 (4.1%) |
| 6:30 AM to 6:59 AM | 18 (4.1%) | 9 (5.3%) |
| 7:00 AM to 7:29 AM | 229 (51.9%) | 31 (18.2%) |
| 7:30 AM to 7:59 AM | 3 (0.7%) | 2 (1.2%) |
| 8:00 AM to 8:29 AM | 0 (0.0%) | 13 (7.6%) |
| 8:30 AM to 8:59 AM | 0 (0.0%) | 1 (0.6%) |
| 9:00 AM to 9:59 AM | 0 (0.0%) | 1 (0.6%) |
| 10:00 AM to 10:59 AM | 0 (0.0%) | 0 (0.0%) |
| 11:00 AM to 11:59 AM | 0 (0.0%) | 0 (0.0%) |
| 12:00 PM to 3:59 PM | 28 (6.4%) | 30 (17.6%) |
| 4:00 PM to 11:59 PM | 45 (10.2%) | 44 (25.9%) |
| Total | 441 (100.0%) | 170 (100.0%) |
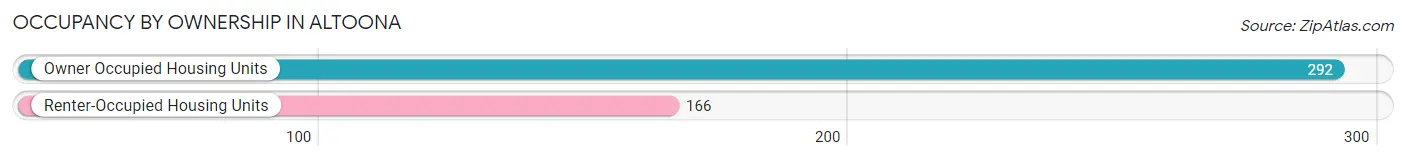
Housing Occupancy in Altoona
Occupancy by Ownership in Altoona
Of the total 458 dwellings in Altoona, owner-occupied units account for 292 (63.8%), while renter-occupied units make up 166 (36.2%).
| Occupancy | # Housing Units | % Housing Units |
| Owner Occupied Housing Units | 292 | 63.8% |
| Renter-Occupied Housing Units | 166 | 36.2% |
| Total Occupied Housing Units | 458 | 100.0% |
Occupancy by Household Size in Altoona
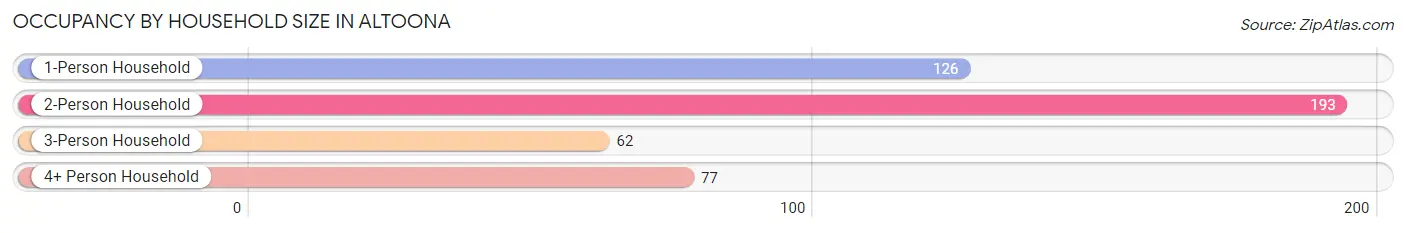
| Household Size | # Housing Units | % Housing Units |
| 1-Person Household | 126 | 27.5% |
| 2-Person Household | 193 | 42.1% |
| 3-Person Household | 62 | 13.5% |
| 4+ Person Household | 77 | 16.8% |
| Total Housing Units | 458 | 100.0% |
Occupancy by Ownership by Household Size in Altoona
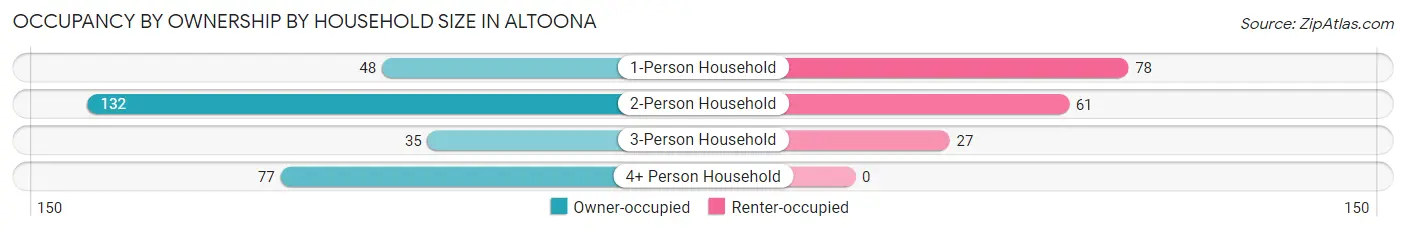
| Household Size | Owner-occupied | Renter-occupied |
| 1-Person Household | 48 (38.1%) | 78 (61.9%) |
| 2-Person Household | 132 (68.4%) | 61 (31.6%) |
| 3-Person Household | 35 (56.5%) | 27 (43.5%) |
| 4+ Person Household | 77 (100.0%) | 0 (0.0%) |
| Total Housing Units | 292 (63.8%) | 166 (36.2%) |
Occupancy by Educational Attainment in Altoona
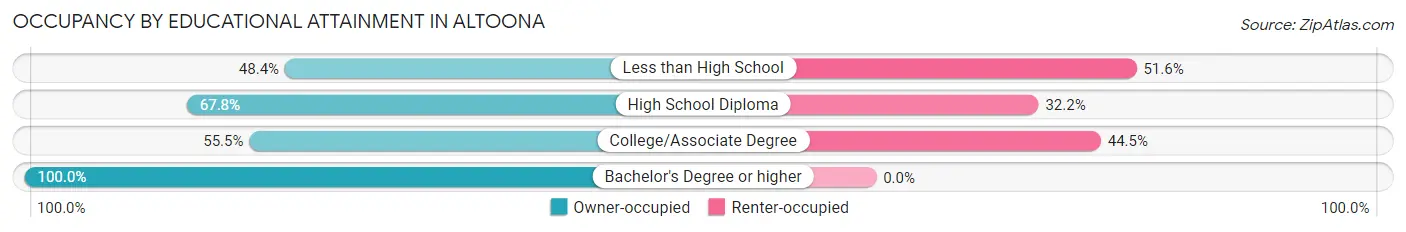
| Household Size | Owner-occupied | Renter-occupied |
| Less than High School | 45 (48.4%) | 48 (51.6%) |
| High School Diploma | 137 (67.8%) | 65 (32.2%) |
| College/Associate Degree | 66 (55.5%) | 53 (44.5%) |
| Bachelor's Degree or higher | 44 (100.0%) | 0 (0.0%) |
Occupancy by Age of Householder in Altoona
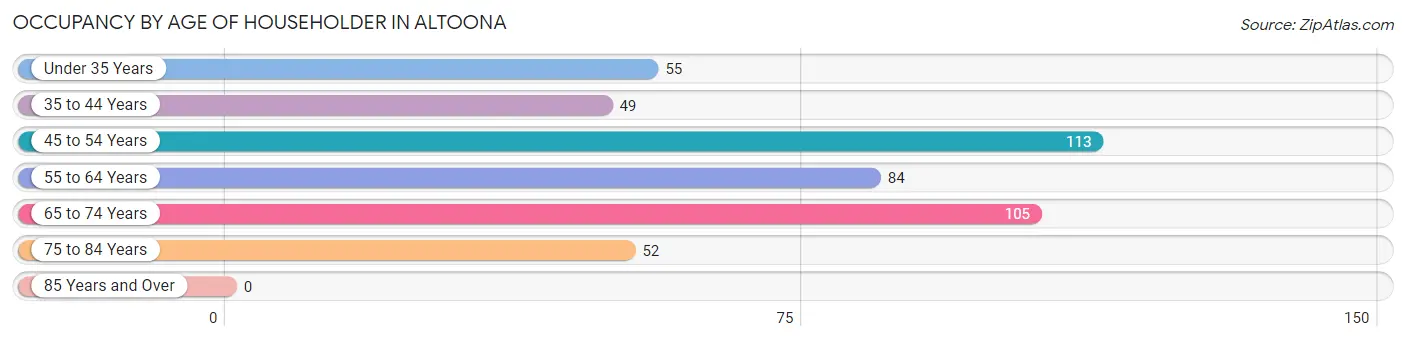
| Age Bracket | # Households | % Households |
| Under 35 Years | 55 | 12.0% |
| 35 to 44 Years | 49 | 10.7% |
| 45 to 54 Years | 113 | 24.7% |
| 55 to 64 Years | 84 | 18.3% |
| 65 to 74 Years | 105 | 22.9% |
| 75 to 84 Years | 52 | 11.4% |
| 85 Years and Over | 0 | 0.0% |
| Total | 458 | 100.0% |
Housing Finances in Altoona
Median Income by Occupancy in Altoona
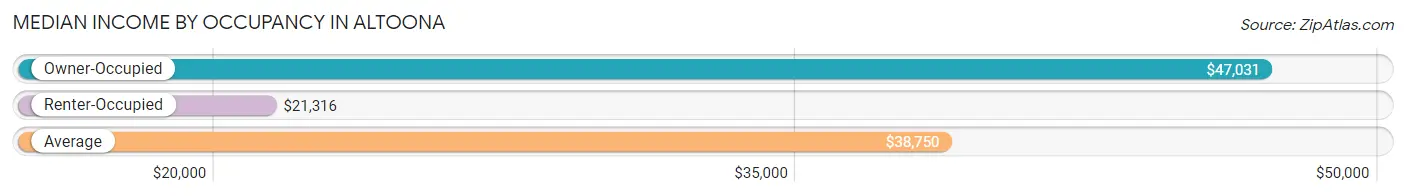
| Occupancy Type | # Households | Median Income |
| Owner-Occupied | 292 (63.8%) | $47,031 |
| Renter-Occupied | 166 (36.2%) | $21,316 |
| Average | 458 (100.0%) | $38,750 |
Occupancy by Householder Income Bracket in Altoona
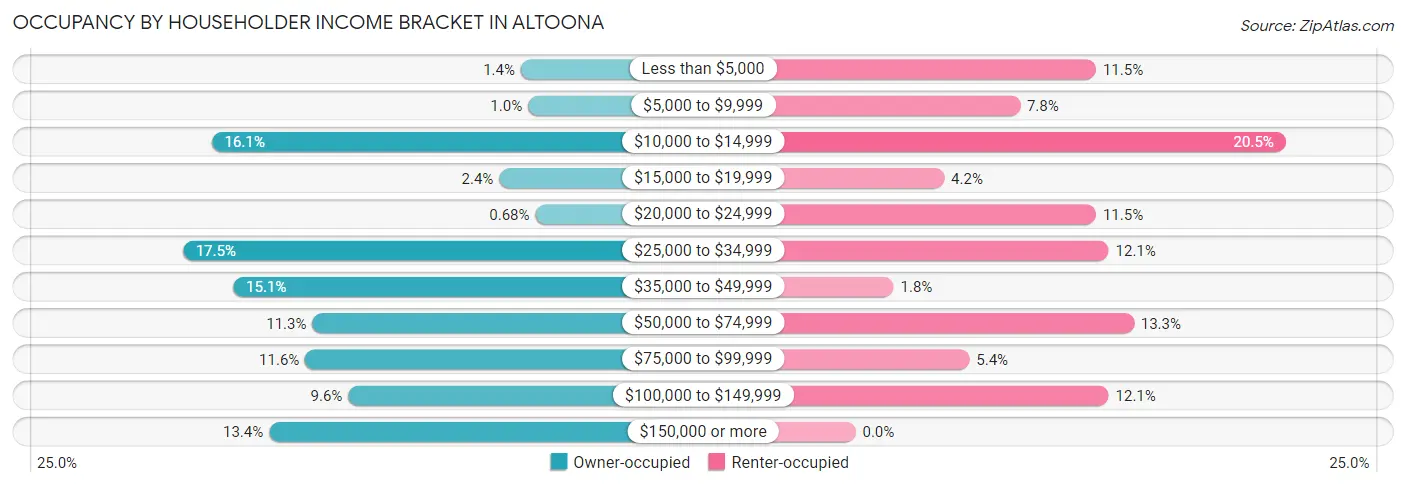
| Income Bracket | Owner-occupied | Renter-occupied |
| Less than $5,000 | 4 (1.4%) | 19 (11.5%) |
| $5,000 to $9,999 | 3 (1.0%) | 13 (7.8%) |
| $10,000 to $14,999 | 47 (16.1%) | 34 (20.5%) |
| $15,000 to $19,999 | 7 (2.4%) | 7 (4.2%) |
| $20,000 to $24,999 | 2 (0.7%) | 19 (11.5%) |
| $25,000 to $34,999 | 51 (17.5%) | 20 (12.0%) |
| $35,000 to $49,999 | 44 (15.1%) | 3 (1.8%) |
| $50,000 to $74,999 | 33 (11.3%) | 22 (13.3%) |
| $75,000 to $99,999 | 34 (11.6%) | 9 (5.4%) |
| $100,000 to $149,999 | 28 (9.6%) | 20 (12.0%) |
| $150,000 or more | 39 (13.4%) | 0 (0.0%) |
| Total | 292 (100.0%) | 166 (100.0%) |
Monthly Housing Cost Tiers in Altoona
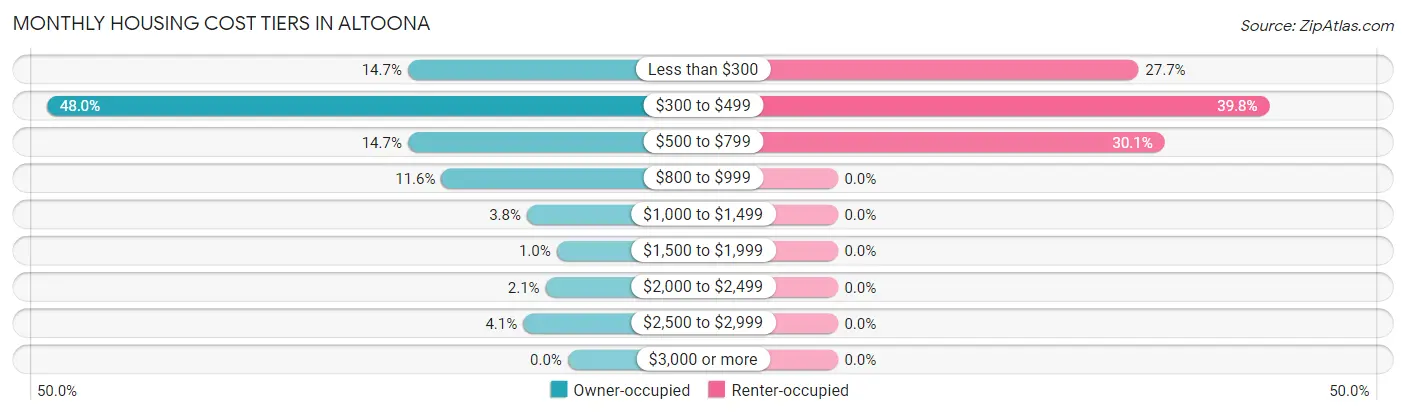
| Monthly Cost | Owner-occupied | Renter-occupied |
| Less than $300 | 43 (14.7%) | 46 (27.7%) |
| $300 to $499 | 140 (47.9%) | 66 (39.8%) |
| $500 to $799 | 43 (14.7%) | 50 (30.1%) |
| $800 to $999 | 34 (11.6%) | 0 (0.0%) |
| $1,000 to $1,499 | 11 (3.8%) | 0 (0.0%) |
| $1,500 to $1,999 | 3 (1.0%) | 0 (0.0%) |
| $2,000 to $2,499 | 6 (2.1%) | 0 (0.0%) |
| $2,500 to $2,999 | 12 (4.1%) | 0 (0.0%) |
| $3,000 or more | 0 (0.0%) | 0 (0.0%) |
| Total | 292 (100.0%) | 166 (100.0%) |
Physical Housing Characteristics in Altoona
Housing Structures in Altoona
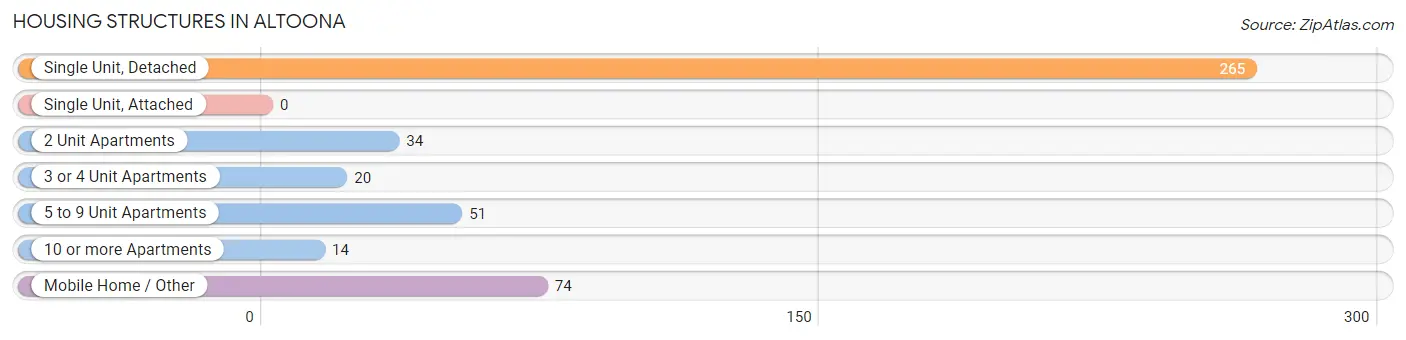
| Structure Type | # Housing Units | % Housing Units |
| Single Unit, Detached | 265 | 57.9% |
| Single Unit, Attached | 0 | 0.0% |
| 2 Unit Apartments | 34 | 7.4% |
| 3 or 4 Unit Apartments | 20 | 4.4% |
| 5 to 9 Unit Apartments | 51 | 11.1% |
| 10 or more Apartments | 14 | 3.1% |
| Mobile Home / Other | 74 | 16.2% |
| Total | 458 | 100.0% |
Housing Structures by Occupancy in Altoona
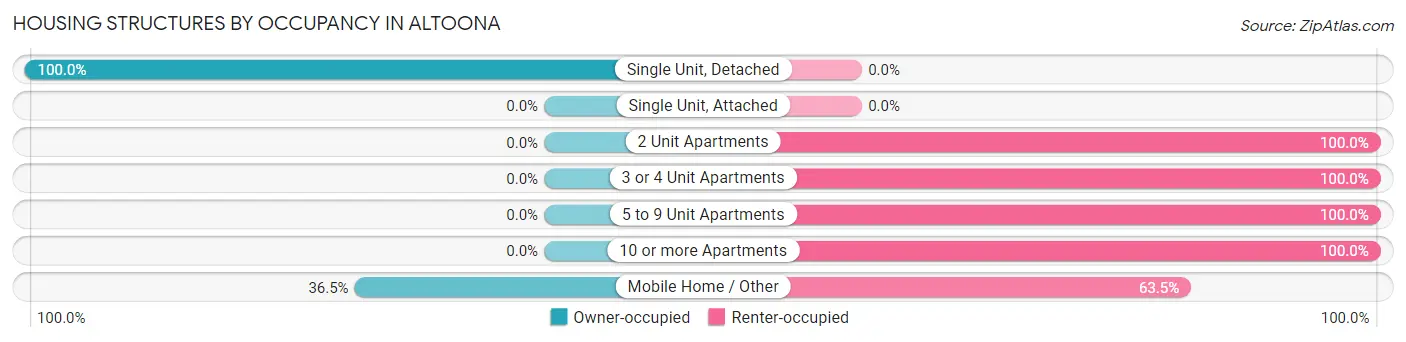
| Structure Type | Owner-occupied | Renter-occupied |
| Single Unit, Detached | 265 (100.0%) | 0 (0.0%) |
| Single Unit, Attached | 0 (0.0%) | 0 (0.0%) |
| 2 Unit Apartments | 0 (0.0%) | 34 (100.0%) |
| 3 or 4 Unit Apartments | 0 (0.0%) | 20 (100.0%) |
| 5 to 9 Unit Apartments | 0 (0.0%) | 51 (100.0%) |
| 10 or more Apartments | 0 (0.0%) | 14 (100.0%) |
| Mobile Home / Other | 27 (36.5%) | 47 (63.5%) |
| Total | 292 (63.8%) | 166 (36.2%) |
Housing Structures by Number of Rooms in Altoona
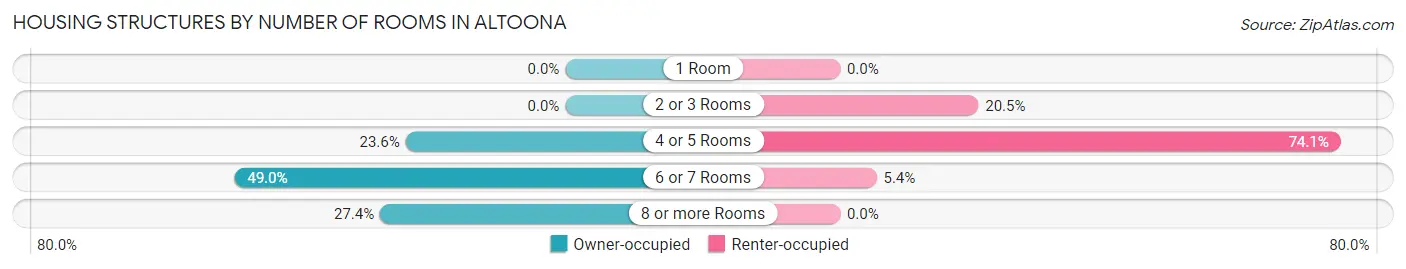
| Number of Rooms | Owner-occupied | Renter-occupied |
| 1 Room | 0 (0.0%) | 0 (0.0%) |
| 2 or 3 Rooms | 0 (0.0%) | 34 (20.5%) |
| 4 or 5 Rooms | 69 (23.6%) | 123 (74.1%) |
| 6 or 7 Rooms | 143 (49.0%) | 9 (5.4%) |
| 8 or more Rooms | 80 (27.4%) | 0 (0.0%) |
| Total | 292 (100.0%) | 166 (100.0%) |
Housing Structure by Heating Type in Altoona
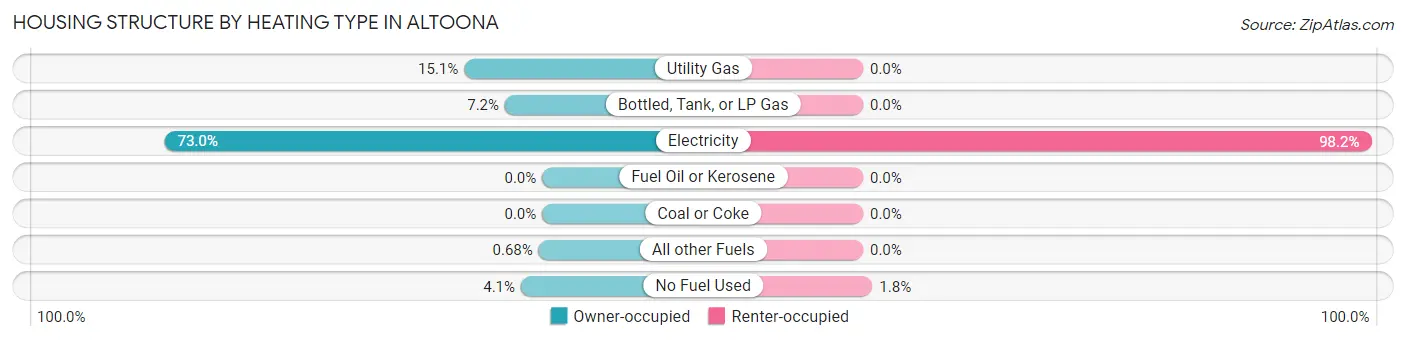
| Heating Type | Owner-occupied | Renter-occupied |
| Utility Gas | 44 (15.1%) | 0 (0.0%) |
| Bottled, Tank, or LP Gas | 21 (7.2%) | 0 (0.0%) |
| Electricity | 213 (73.0%) | 163 (98.2%) |
| Fuel Oil or Kerosene | 0 (0.0%) | 0 (0.0%) |
| Coal or Coke | 0 (0.0%) | 0 (0.0%) |
| All other Fuels | 2 (0.7%) | 0 (0.0%) |
| No Fuel Used | 12 (4.1%) | 3 (1.8%) |
| Total | 292 (100.0%) | 166 (100.0%) |
Household Vehicle Usage in Altoona
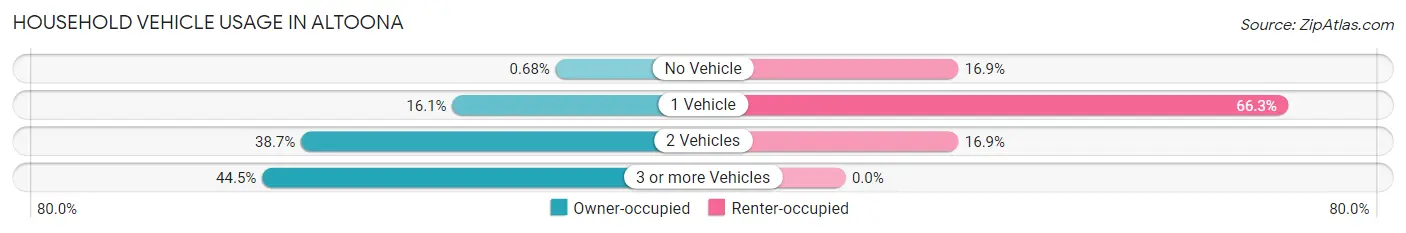
| Vehicles per Household | Owner-occupied | Renter-occupied |
| No Vehicle | 2 (0.7%) | 28 (16.9%) |
| 1 Vehicle | 47 (16.1%) | 110 (66.3%) |
| 2 Vehicles | 113 (38.7%) | 28 (16.9%) |
| 3 or more Vehicles | 130 (44.5%) | 0 (0.0%) |
| Total | 292 (100.0%) | 166 (100.0%) |
Real Estate & Mortgages in Altoona
Real Estate and Mortgage Overview in Altoona
| Characteristic | Without Mortgage | With Mortgage |
| Housing Units | 207 | 85 |
| Median Property Value | $119,300 | $103,800 |
| Median Household Income | - | - |
| Monthly Housing Costs | $384 | $0 |
| Real Estate Taxes | $358 | $13 |
Property Value by Mortgage Status in Altoona
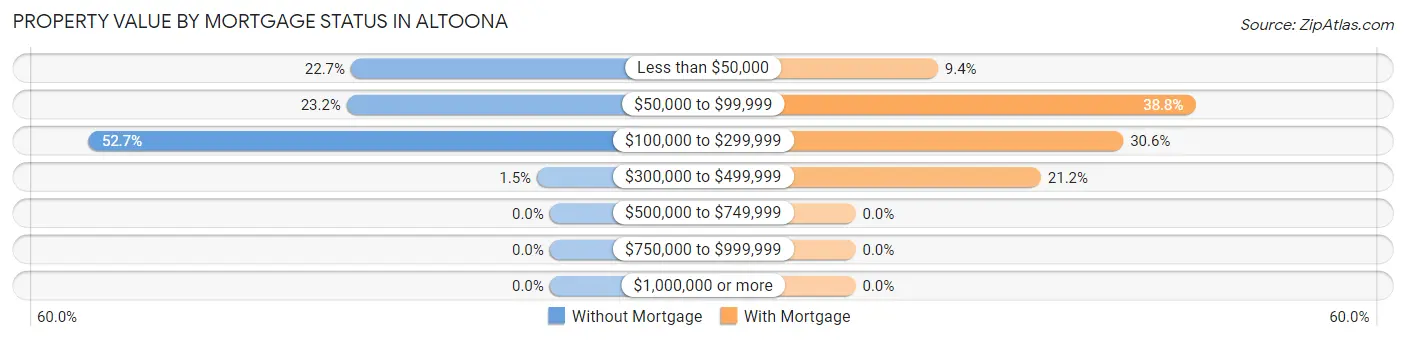
| Property Value | Without Mortgage | With Mortgage |
| Less than $50,000 | 47 (22.7%) | 8 (9.4%) |
| $50,000 to $99,999 | 48 (23.2%) | 33 (38.8%) |
| $100,000 to $299,999 | 109 (52.7%) | 26 (30.6%) |
| $300,000 to $499,999 | 3 (1.5%) | 18 (21.2%) |
| $500,000 to $749,999 | 0 (0.0%) | 0 (0.0%) |
| $750,000 to $999,999 | 0 (0.0%) | 0 (0.0%) |
| $1,000,000 or more | 0 (0.0%) | 0 (0.0%) |
| Total | 207 (100.0%) | 85 (100.0%) |
Household Income by Mortgage Status in Altoona
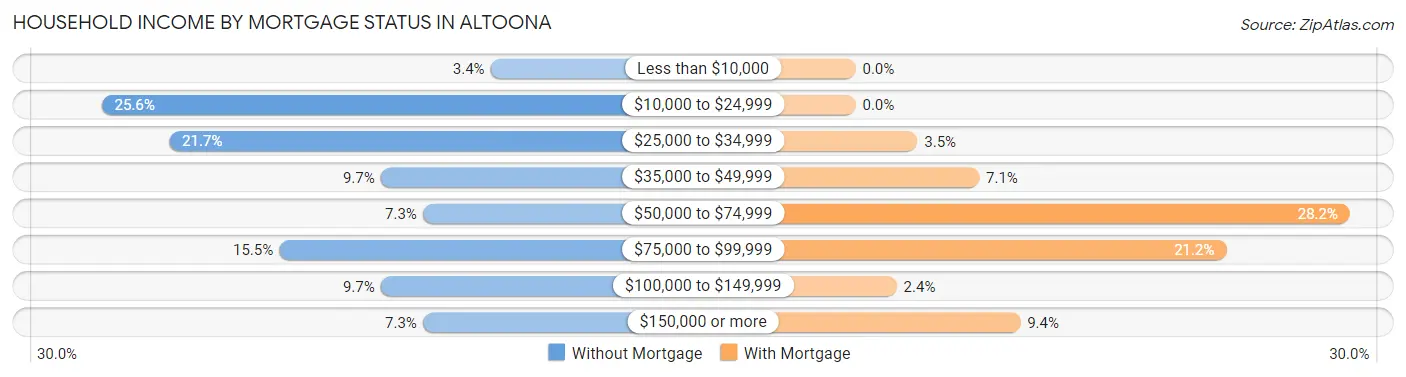
| Household Income | Without Mortgage | With Mortgage |
| Less than $10,000 | 7 (3.4%) | 0 (0.0%) |
| $10,000 to $24,999 | 53 (25.6%) | 0 (0.0%) |
| $25,000 to $34,999 | 45 (21.7%) | 3 (3.5%) |
| $35,000 to $49,999 | 20 (9.7%) | 6 (7.1%) |
| $50,000 to $74,999 | 15 (7.2%) | 24 (28.2%) |
| $75,000 to $99,999 | 32 (15.5%) | 18 (21.2%) |
| $100,000 to $149,999 | 20 (9.7%) | 2 (2.4%) |
| $150,000 or more | 15 (7.2%) | 8 (9.4%) |
| Total | 207 (100.0%) | 85 (100.0%) |
Property Value to Household Income Ratio in Altoona
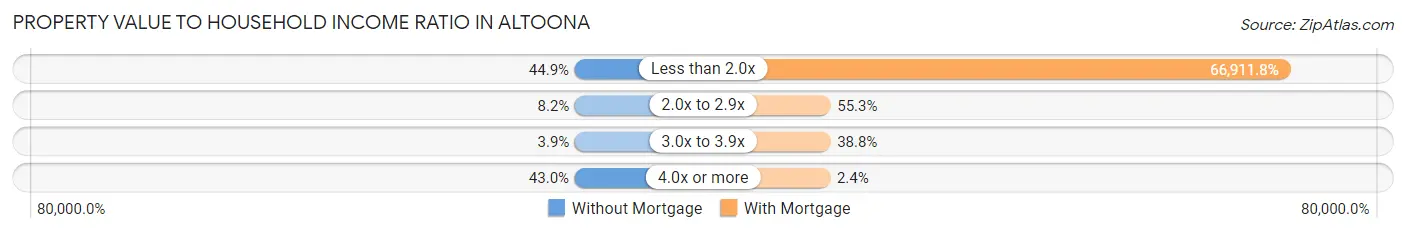
| Value-to-Income Ratio | Without Mortgage | With Mortgage |
| Less than 2.0x | 93 (44.9%) | 56,875 (66,911.8%) |
| 2.0x to 2.9x | 17 (8.2%) | 47 (55.3%) |
| 3.0x to 3.9x | 8 (3.9%) | 33 (38.8%) |
| 4.0x or more | 89 (43.0%) | 2 (2.4%) |
| Total | 207 (100.0%) | 85 (100.0%) |
Real Estate Taxes by Mortgage Status in Altoona
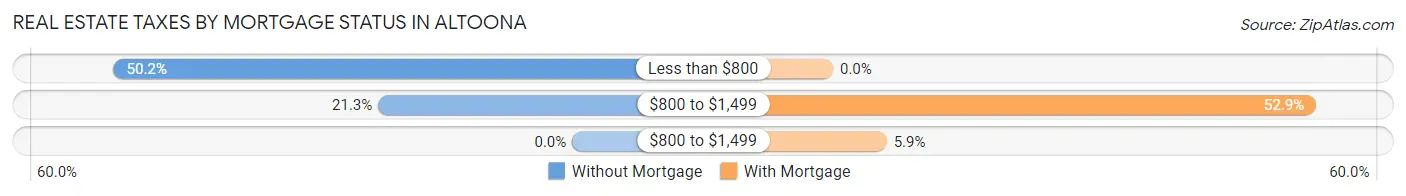
| Property Taxes | Without Mortgage | With Mortgage |
| Less than $800 | 104 (50.2%) | 0 (0.0%) |
| $800 to $1,499 | 44 (21.3%) | 45 (52.9%) |
| $800 to $1,499 | 0 (0.0%) | 5 (5.9%) |
| Total | 207 (100.0%) | 85 (100.0%) |
Health & Disability in Altoona
Health Insurance Coverage by Age in Altoona
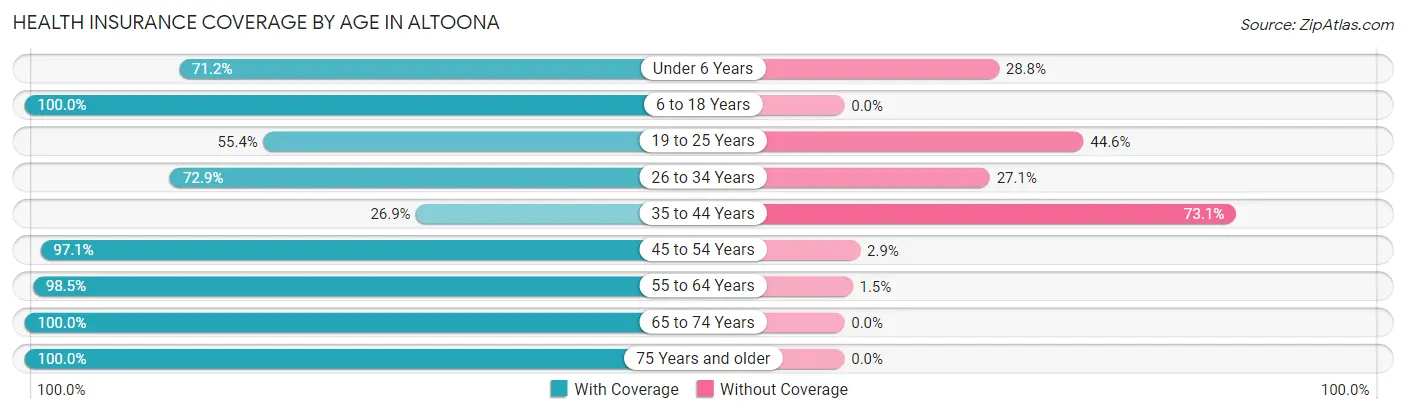
| Age Bracket | With Coverage | Without Coverage |
| Under 6 Years | 42 (71.2%) | 17 (28.8%) |
| 6 to 18 Years | 170 (100.0%) | 0 (0.0%) |
| 19 to 25 Years | 46 (55.4%) | 37 (44.6%) |
| 26 to 34 Years | 129 (72.9%) | 48 (27.1%) |
| 35 to 44 Years | 87 (26.9%) | 236 (73.1%) |
| 45 to 54 Years | 165 (97.1%) | 5 (2.9%) |
| 55 to 64 Years | 129 (98.5%) | 2 (1.5%) |
| 65 to 74 Years | 139 (100.0%) | 0 (0.0%) |
| 75 Years and older | 61 (100.0%) | 0 (0.0%) |
| Total | 968 (73.7%) | 345 (26.3%) |
Health Insurance Coverage by Citizenship Status in Altoona
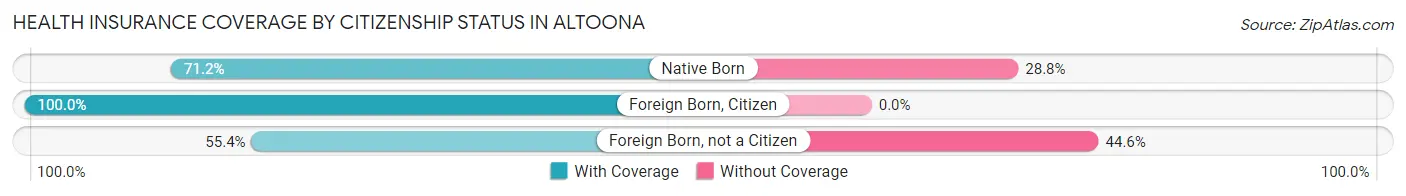
| Citizenship Status | With Coverage | Without Coverage |
| Native Born | 42 (71.2%) | 17 (28.8%) |
| Foreign Born, Citizen | 170 (100.0%) | 0 (0.0%) |
| Foreign Born, not a Citizen | 46 (55.4%) | 37 (44.6%) |
Health Insurance Coverage by Household Income in Altoona
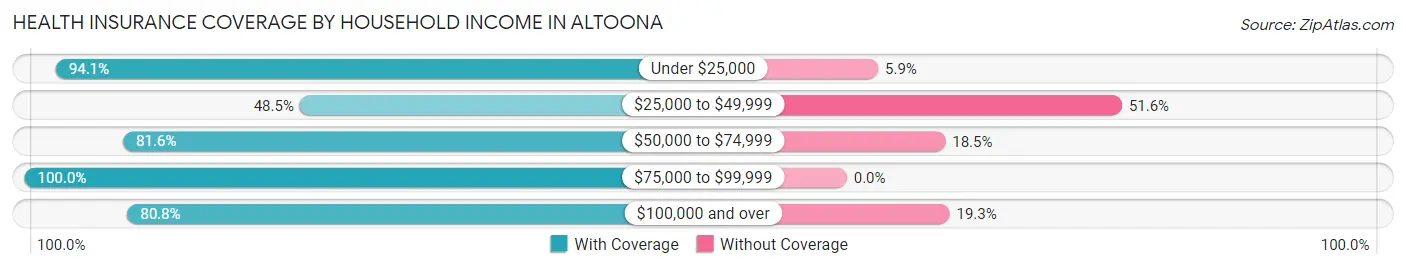
| Household Income | With Coverage | Without Coverage |
| Under $25,000 | 225 (94.1%) | 14 (5.9%) |
| $25,000 to $49,999 | 219 (48.4%) | 233 (51.5%) |
| $50,000 to $74,999 | 137 (81.6%) | 31 (18.4%) |
| $75,000 to $99,999 | 100 (100.0%) | 0 (0.0%) |
| $100,000 and over | 281 (80.7%) | 67 (19.3%) |
Public vs Private Health Insurance Coverage by Age in Altoona
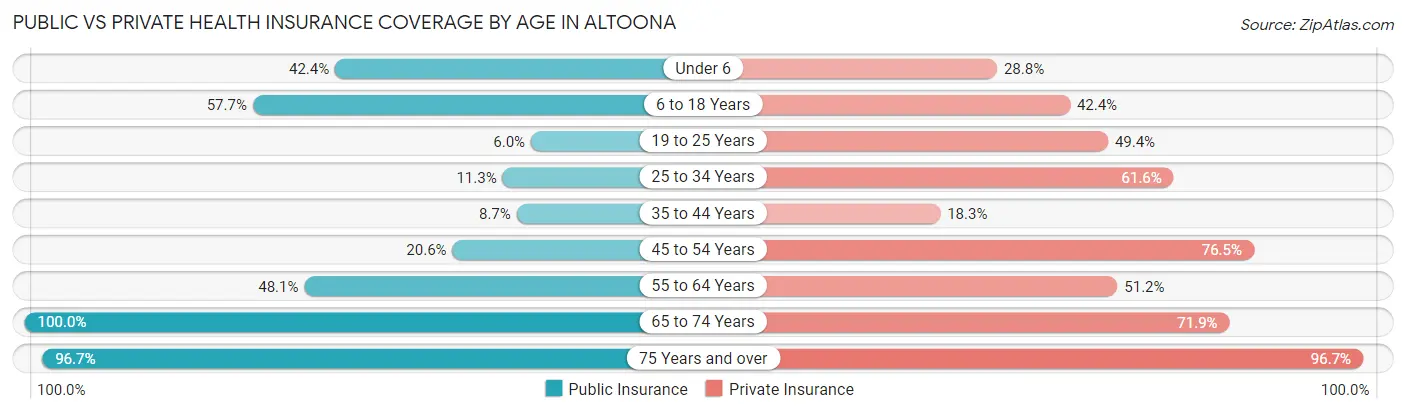
| Age Bracket | Public Insurance | Private Insurance |
| Under 6 | 25 (42.4%) | 17 (28.8%) |
| 6 to 18 Years | 98 (57.7%) | 72 (42.3%) |
| 19 to 25 Years | 5 (6.0%) | 41 (49.4%) |
| 25 to 34 Years | 20 (11.3%) | 109 (61.6%) |
| 35 to 44 Years | 28 (8.7%) | 59 (18.3%) |
| 45 to 54 Years | 35 (20.6%) | 130 (76.5%) |
| 55 to 64 Years | 63 (48.1%) | 67 (51.1%) |
| 65 to 74 Years | 139 (100.0%) | 100 (71.9%) |
| 75 Years and over | 59 (96.7%) | 59 (96.7%) |
| Total | 472 (35.9%) | 654 (49.8%) |
Disability Status by Sex by Age in Altoona
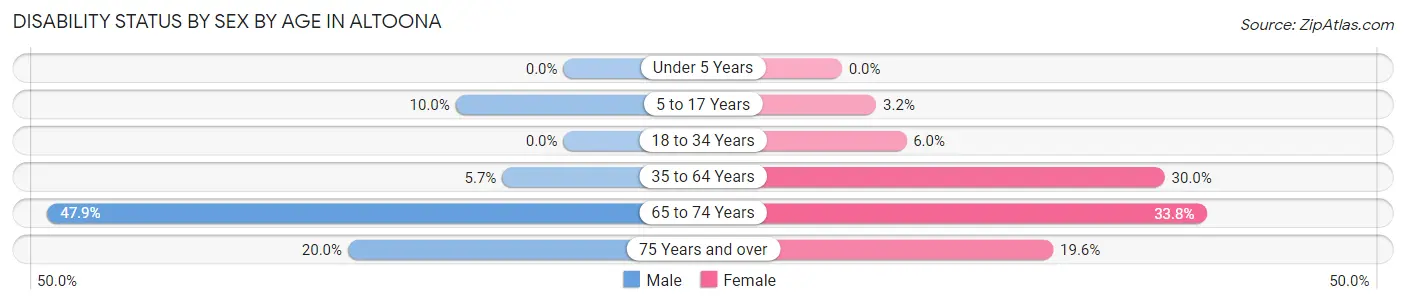
| Age Bracket | Male | Female |
| Under 5 Years | 0 (0.0%) | 0 (0.0%) |
| 5 to 17 Years | 7 (10.0%) | 3 (3.2%) |
| 18 to 34 Years | 0 (0.0%) | 7 (6.0%) |
| 35 to 64 Years | 22 (5.7%) | 71 (30.0%) |
| 65 to 74 Years | 34 (47.9%) | 23 (33.8%) |
| 75 Years and over | 2 (20.0%) | 10 (19.6%) |
Disability Class by Sex by Age in Altoona
Disability Class: Hearing Difficulty
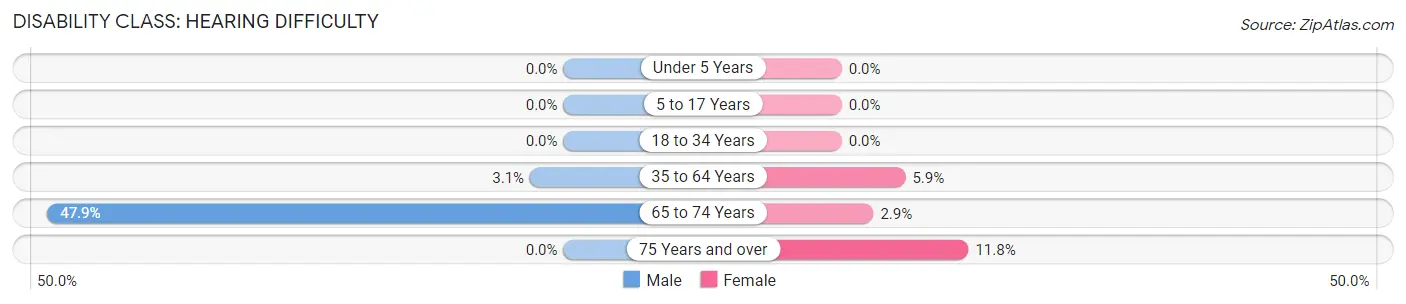
| Age Bracket | Male | Female |
| Under 5 Years | 0 (0.0%) | 0 (0.0%) |
| 5 to 17 Years | 0 (0.0%) | 0 (0.0%) |
| 18 to 34 Years | 0 (0.0%) | 0 (0.0%) |
| 35 to 64 Years | 12 (3.1%) | 14 (5.9%) |
| 65 to 74 Years | 34 (47.9%) | 2 (2.9%) |
| 75 Years and over | 0 (0.0%) | 6 (11.8%) |
Disability Class: Vision Difficulty
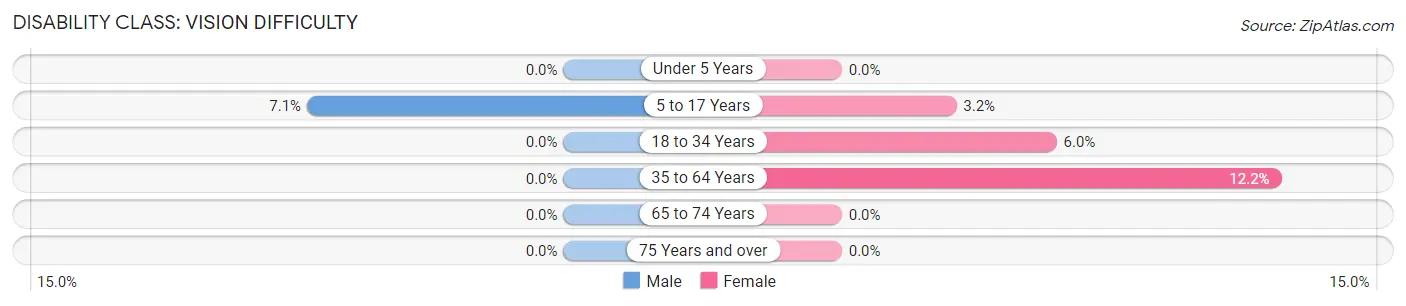
| Age Bracket | Male | Female |
| Under 5 Years | 0 (0.0%) | 0 (0.0%) |
| 5 to 17 Years | 5 (7.1%) | 3 (3.2%) |
| 18 to 34 Years | 0 (0.0%) | 7 (6.0%) |
| 35 to 64 Years | 0 (0.0%) | 29 (12.2%) |
| 65 to 74 Years | 0 (0.0%) | 0 (0.0%) |
| 75 Years and over | 0 (0.0%) | 0 (0.0%) |
Disability Class: Cognitive Difficulty
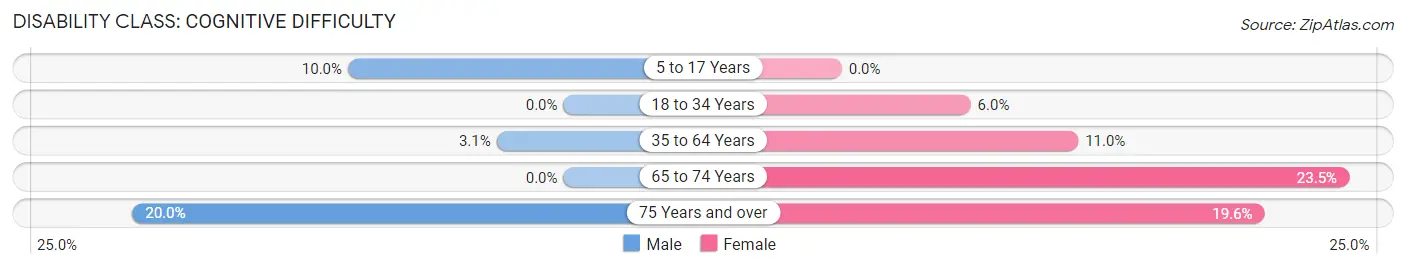
| Age Bracket | Male | Female |
| 5 to 17 Years | 7 (10.0%) | 0 (0.0%) |
| 18 to 34 Years | 0 (0.0%) | 7 (6.0%) |
| 35 to 64 Years | 12 (3.1%) | 26 (11.0%) |
| 65 to 74 Years | 0 (0.0%) | 16 (23.5%) |
| 75 Years and over | 2 (20.0%) | 10 (19.6%) |
Disability Class: Ambulatory Difficulty
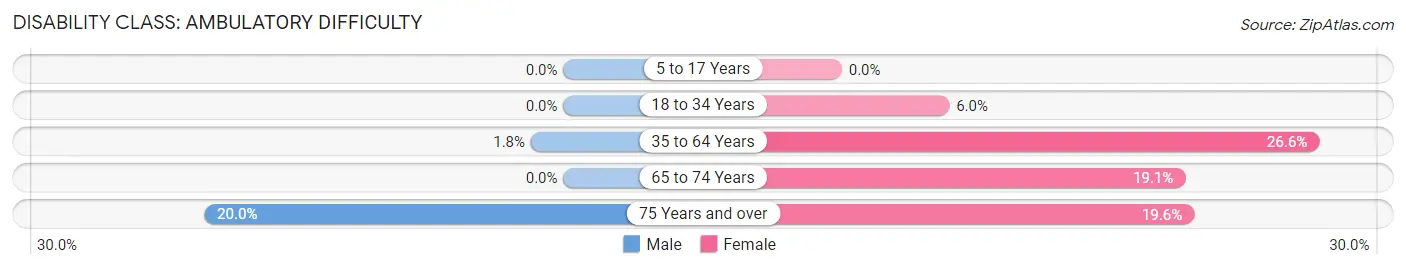
| Age Bracket | Male | Female |
| 5 to 17 Years | 0 (0.0%) | 0 (0.0%) |
| 18 to 34 Years | 0 (0.0%) | 7 (6.0%) |
| 35 to 64 Years | 7 (1.8%) | 63 (26.6%) |
| 65 to 74 Years | 0 (0.0%) | 13 (19.1%) |
| 75 Years and over | 2 (20.0%) | 10 (19.6%) |
Disability Class: Self-Care Difficulty
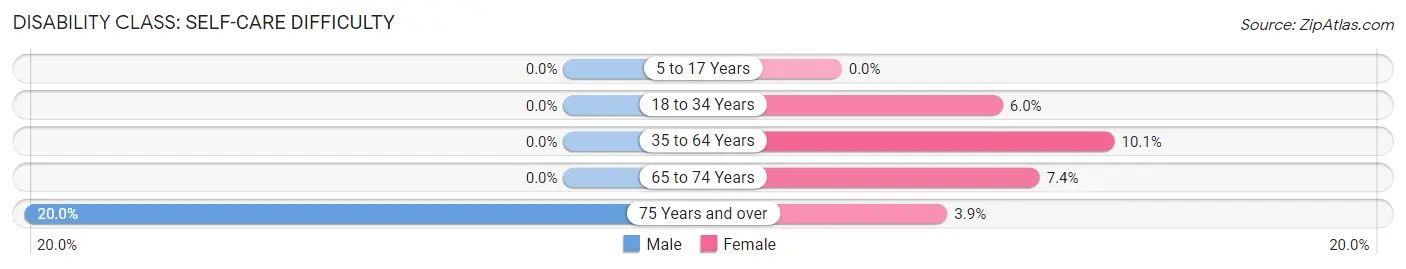
| Age Bracket | Male | Female |
| 5 to 17 Years | 0 (0.0%) | 0 (0.0%) |
| 18 to 34 Years | 0 (0.0%) | 7 (6.0%) |
| 35 to 64 Years | 0 (0.0%) | 24 (10.1%) |
| 65 to 74 Years | 0 (0.0%) | 5 (7.3%) |
| 75 Years and over | 2 (20.0%) | 2 (3.9%) |
Technology Access in Altoona
Computing Device Access in Altoona
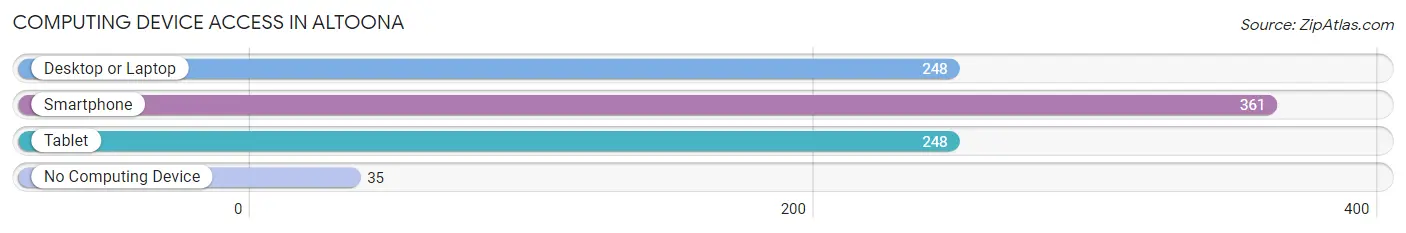
| Device Type | # Households | % Households |
| Desktop or Laptop | 248 | 54.1% |
| Smartphone | 361 | 78.8% |
| Tablet | 248 | 54.1% |
| No Computing Device | 35 | 7.6% |
| Total | 458 | 100.0% |
Internet Access in Altoona
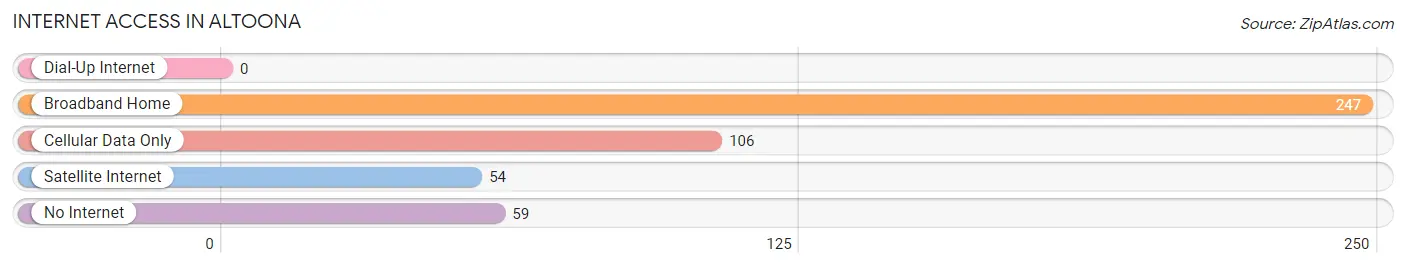
| Internet Type | # Households | % Households |
| Dial-Up Internet | 0 | 0.0% |
| Broadband Home | 247 | 53.9% |
| Cellular Data Only | 106 | 23.1% |
| Satellite Internet | 54 | 11.8% |
| No Internet | 59 | 12.9% |
| Total | 458 | 100.0% |
Altoona Summary
Altoona, Alabama is a small town located in the foothills of the Appalachian Mountains in the northeastern corner of the state. It is situated in the Etowah County, and is part of the Gadsden Metropolitan Statistical Area. The town has a population of approximately 2,000 people, and is known for its rural charm and friendly atmosphere.
History
Altoona was founded in 1872 by a group of settlers from Georgia. The town was named after the nearby Altoona Creek, which was named after the Italian city of Altoona. The town was originally a farming community, and the main crops grown were cotton, corn, and tobacco. The town was also home to a number of small businesses, including a sawmill, a gristmill, and a general store.
In the early 1900s, the town began to experience a period of growth and development. The railroad was extended to the town, and a number of new businesses opened up, including a hotel, a bank, and a movie theater. The town also became home to a number of churches, including the First Baptist Church of Altoona, which was founded in 1906.
Geography
Altoona is located in the foothills of the Appalachian Mountains in the northeastern corner of the state. The town is situated in the Etowah County, and is part of the Gadsden Metropolitan Statistical Area. The town is located at an elevation of 845 feet above sea level, and is surrounded by rolling hills and forests. The town is located approximately 30 miles from Birmingham, Alabama, and is accessible via Interstate 59.
Economy
Altoona’s economy is largely based on agriculture and tourism. The town is home to a number of small businesses, including a sawmill, a gristmill, and a general store. The town is also home to a number of churches, and is a popular destination for tourists who are interested in exploring the area’s rural charm and friendly atmosphere.
Demographics
As of the 2010 census, the population of Altoona was 2,000 people. The town is predominantly white, with approximately 95% of the population being white. The median household income is $35,000, and the median age is 38 years old. The town is home to a number of churches, and is a popular destination for tourists who are interested in exploring the area’s rural charm and friendly atmosphere.
Common Questions
What is Per Capita Income in Altoona?
Per Capita income in Altoona is $23,200.
What is the Median Family Income in Altoona?
Median Family Income in Altoona is $48,889.
What is the Median Household income in Altoona?
Median Household Income in Altoona is $38,750.
What is Family Income Deficit in Altoona?
Family Income Deficit in Altoona is $7,498.
Families that are below poverty line in Altoona earn $7,498 less on average than the poverty threshold level.
What is Inequality or Gini Index in Altoona?
Inequality or Gini Index in Altoona is 0.49.
What is the Total Population of Altoona?
Total Population of Altoona is 1,358.
What is the Total Male Population of Altoona?
Total Male Population of Altoona is 719.
What is the Total Female Population of Altoona?
Total Female Population of Altoona is 639.
What is the Ratio of Males per 100 Females in Altoona?
There are 112.52 Males per 100 Females in Altoona.
What is the Ratio of Females per 100 Males in Altoona?
There are 88.87 Females per 100 Males in Altoona.
What is the Median Population Age in Altoona?
Median Population Age in Altoona is 40.5 Years.
What is the Average Family Size in Altoona
Average Family Size in Altoona is 3.5 People.
What is the Average Household Size in Altoona
Average Household Size in Altoona is 2.9 People.
How Large is the Labor Force in Altoona?
There are 682 People in the Labor Forcein in Altoona.
What is the Percentage of People in the Labor Force in Altoona?
57.4% of People are in the Labor Force in Altoona.
What is the Unemployment Rate in Altoona?
Unemployment Rate in Altoona is 3.4%.