Aliceville, AL Map & Demographics
Aliceville Map
Aliceville Overview
$18,406
PER CAPITA INCOME
$30,750
AVG FAMILY INCOME
$30,152
AVG HOUSEHOLD INCOME
36.9%
WAGE / INCOME GAP [ % ]
63.1¢/ $1
WAGE / INCOME GAP [ $ ]
$11,611
FAMILY INCOME DEFICIT
0.49
INEQUALITY / GINI INDEX
2,325
TOTAL POPULATION
1,060
MALE POPULATION
1,265
FEMALE POPULATION
83.79
MALES / 100 FEMALES
119.34
FEMALES / 100 MALES
34.7
MEDIAN AGE
3.2
AVG FAMILY SIZE
2.5
AVG HOUSEHOLD SIZE
942
LABOR FORCE [ PEOPLE ]
54.3%
PERCENT IN LABOR FORCE
15.7%
UNEMPLOYMENT RATE
Aliceville Zip Codes
Aliceville Area Codes
Income in Aliceville
Income Overview in Aliceville
Per Capita Income in Aliceville is $18,406, while median incomes of families and households are $30,750 and $30,152 respectively.
| Characteristic | Number | Measure |
| Per Capita Income | 2,325 | $18,406 |
| Median Family Income | 538 | $30,750 |
| Mean Family Income | 538 | $45,207 |
| Median Household Income | 894 | $30,152 |
| Mean Household Income | 894 | $42,934 |
| Income Deficit | 538 | $11,611 |
| Wage / Income Gap (%) | 2,325 | 36.89% |
| Wage / Income Gap ($) | 2,325 | 63.11¢ per $1 |
| Gini / Inequality Index | 2,325 | 0.49 |
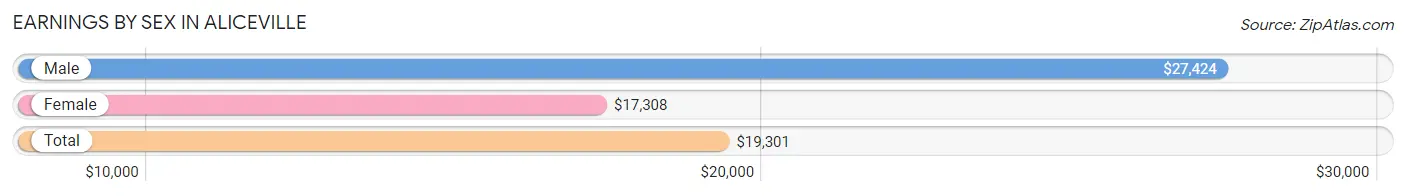
Earnings by Sex in Aliceville
Average Earnings in Aliceville are $19,301, $27,424 for men and $17,308 for women, a difference of 36.9%.
| Sex | Number | Average Earnings |
| Male | 414 (42.5%) | $27,424 |
| Female | 560 (57.5%) | $17,308 |
| Total | 974 (100.0%) | $19,301 |
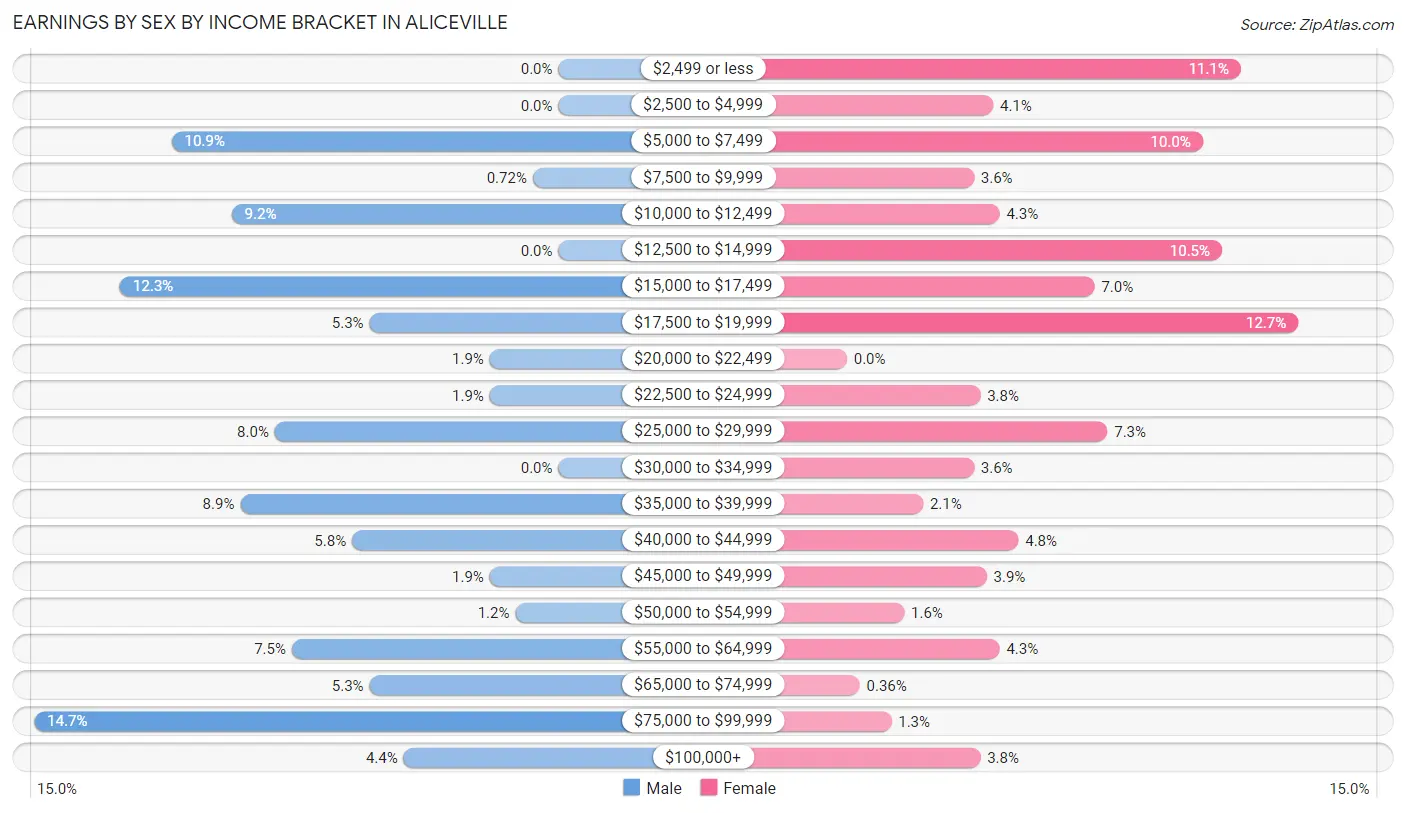
Earnings by Sex by Income Bracket in Aliceville
The most common earnings brackets in Aliceville are $75,000 to $99,999 for men (61 | 14.7%) and $17,500 to $19,999 for women (71 | 12.7%).
| Income | Male | Female |
| $2,499 or less | 0 (0.0%) | 62 (11.1%) |
| $2,500 to $4,999 | 0 (0.0%) | 23 (4.1%) |
| $5,000 to $7,499 | 45 (10.9%) | 56 (10.0%) |
| $7,500 to $9,999 | 3 (0.7%) | 20 (3.6%) |
| $10,000 to $12,499 | 38 (9.2%) | 24 (4.3%) |
| $12,500 to $14,999 | 0 (0.0%) | 59 (10.5%) |
| $15,000 to $17,499 | 51 (12.3%) | 39 (7.0%) |
| $17,500 to $19,999 | 22 (5.3%) | 71 (12.7%) |
| $20,000 to $22,499 | 8 (1.9%) | 0 (0.0%) |
| $22,500 to $24,999 | 8 (1.9%) | 21 (3.7%) |
| $25,000 to $29,999 | 33 (8.0%) | 41 (7.3%) |
| $30,000 to $34,999 | 0 (0.0%) | 20 (3.6%) |
| $35,000 to $39,999 | 37 (8.9%) | 12 (2.1%) |
| $40,000 to $44,999 | 24 (5.8%) | 27 (4.8%) |
| $45,000 to $49,999 | 8 (1.9%) | 22 (3.9%) |
| $50,000 to $54,999 | 5 (1.2%) | 9 (1.6%) |
| $55,000 to $64,999 | 31 (7.5%) | 24 (4.3%) |
| $65,000 to $74,999 | 22 (5.3%) | 2 (0.4%) |
| $75,000 to $99,999 | 61 (14.7%) | 7 (1.3%) |
| $100,000+ | 18 (4.3%) | 21 (3.7%) |
| Total | 414 (100.0%) | 560 (100.0%) |
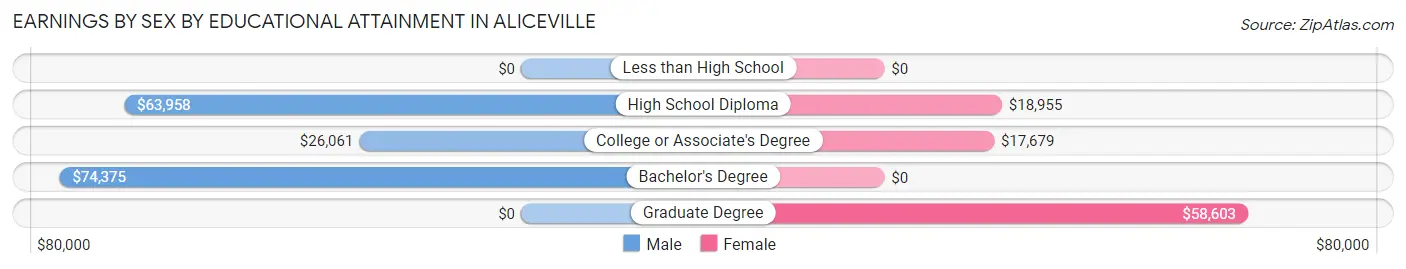
Earnings by Sex by Educational Attainment in Aliceville
Average earnings in Aliceville are $38,182 for men and $19,419 for women, a difference of 49.1%. Men with an educational attainment of bachelor's degree enjoy the highest average annual earnings of $74,375, while those with college or associate's degree education earn the least with $26,061. Women with an educational attainment of graduate degree earn the most with the average annual earnings of $58,603, while those with college or associate's degree education have the smallest earnings of $17,679.
| Educational Attainment | Male Income | Female Income |
| Less than High School | - | - |
| High School Diploma | $63,958 | $18,955 |
| College or Associate's Degree | $26,061 | $17,679 |
| Bachelor's Degree | $74,375 | $0 |
| Graduate Degree | - | - |
| Total | $38,182 | $19,419 |
Family Income in Aliceville
Family Income Brackets in Aliceville
According to the Aliceville family income data, there are 110 families falling into the $25,000 to $34,999 income range, which is the most common income bracket and makes up 20.4% of all families.
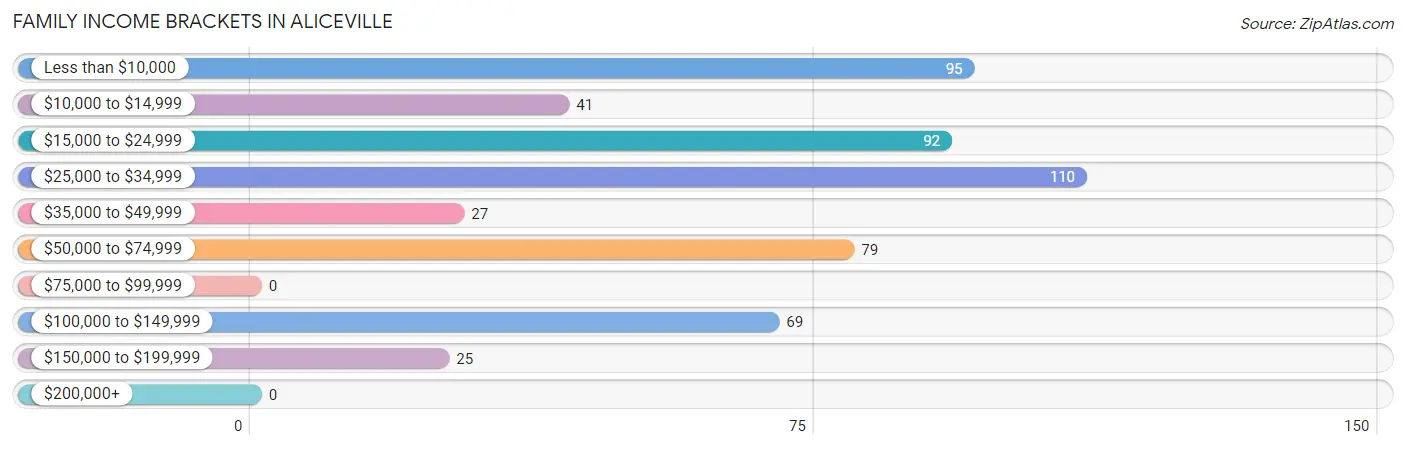
| Income Bracket | # Families | % Families |
| Less than $10,000 | 95 | 17.7% |
| $10,000 to $14,999 | 41 | 7.6% |
| $15,000 to $24,999 | 92 | 17.1% |
| $25,000 to $34,999 | 110 | 20.4% |
| $35,000 to $49,999 | 27 | 5.0% |
| $50,000 to $74,999 | 79 | 14.7% |
| $75,000 to $99,999 | 0 | 0.0% |
| $100,000 to $149,999 | 69 | 12.8% |
| $150,000 to $199,999 | 25 | 4.6% |
| $200,000+ | 0 | 0.0% |
Family Income by Famaliy Size in Aliceville
2-person families (303 | 56.3%) account for the highest median family income in Aliceville with $31,188 per family, while 2-person families (303 | 56.3%) have the highest median income of $15,594 per family member.
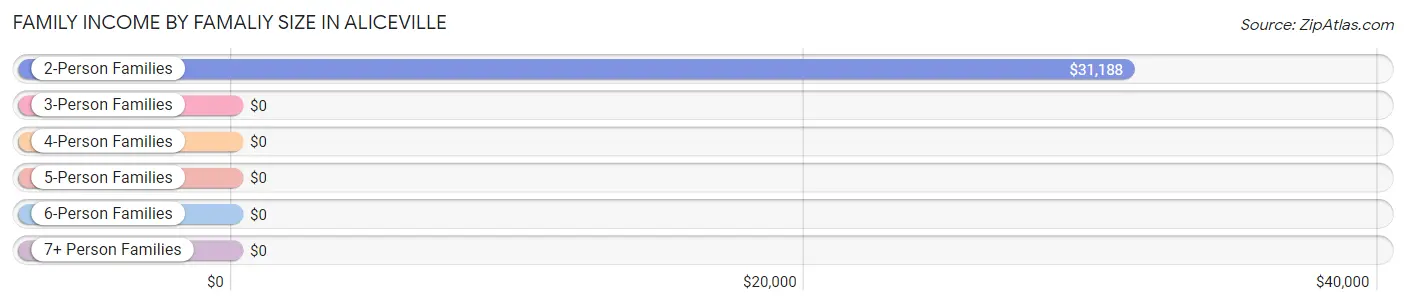
| Income Bracket | # Families | Median Income |
| 2-Person Families | 303 (56.3%) | $31,188 |
| 3-Person Families | 146 (27.1%) | $0 |
| 4-Person Families | 34 (6.3%) | $0 |
| 5-Person Families | 41 (7.6%) | $0 |
| 6-Person Families | 14 (2.6%) | $0 |
| 7+ Person Families | 0 (0.0%) | $0 |
| Total | 538 (100.0%) | $30,750 |
Family Income by Number of Earners in Aliceville
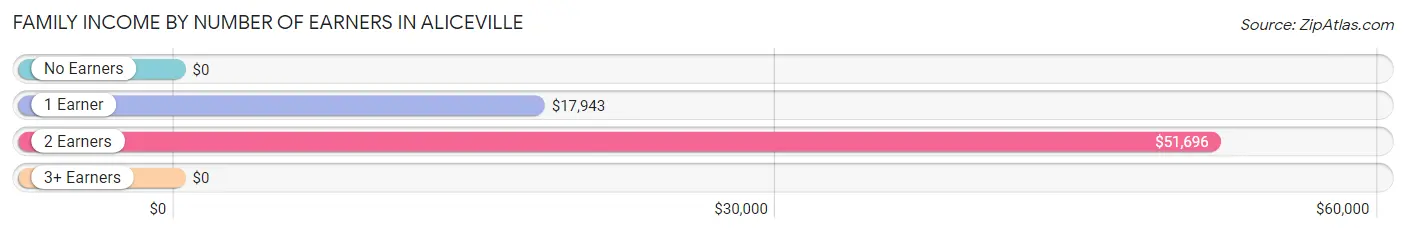
| Number of Earners | # Families | Median Income |
| No Earners | 88 (16.4%) | $0 |
| 1 Earner | 257 (47.8%) | $17,943 |
| 2 Earners | 176 (32.7%) | $51,696 |
| 3+ Earners | 17 (3.2%) | $0 |
| Total | 538 (100.0%) | $30,750 |
Household Income in Aliceville
Household Income Brackets in Aliceville
With 151 households falling in the category, the $15,000 to $24,999 income range is the most frequent in Aliceville, accounting for 16.9% of all households.
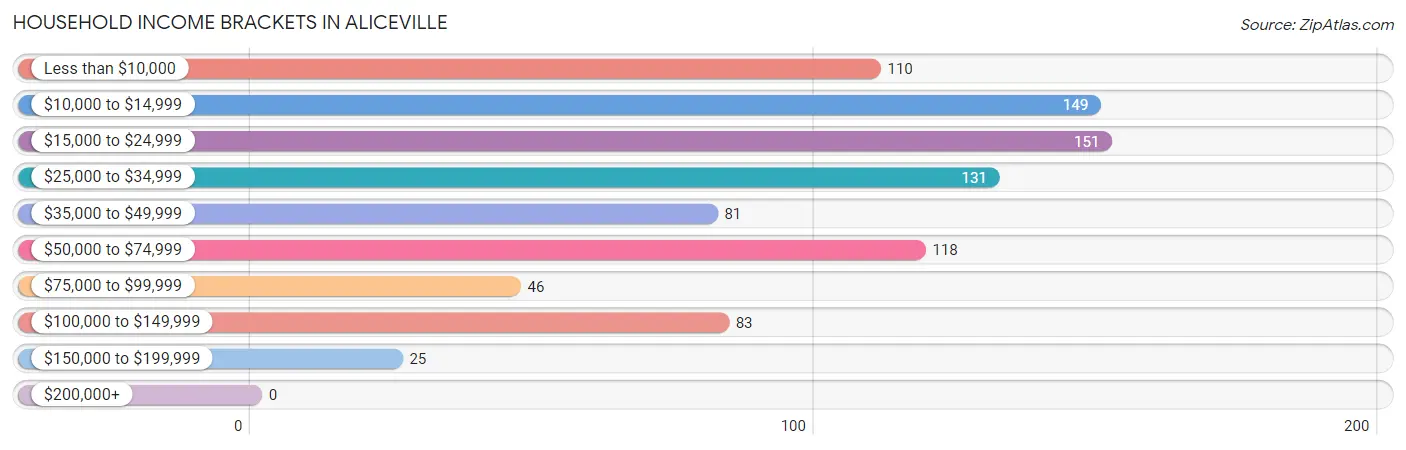
| Income Bracket | # Households | % Households |
| Less than $10,000 | 110 | 12.3% |
| $10,000 to $14,999 | 149 | 16.7% |
| $15,000 to $24,999 | 151 | 16.9% |
| $25,000 to $34,999 | 131 | 14.7% |
| $35,000 to $49,999 | 81 | 9.1% |
| $50,000 to $74,999 | 118 | 13.2% |
| $75,000 to $99,999 | 46 | 5.1% |
| $100,000 to $149,999 | 83 | 9.3% |
| $150,000 to $199,999 | 25 | 2.8% |
| $200,000+ | 0 | 0.0% |
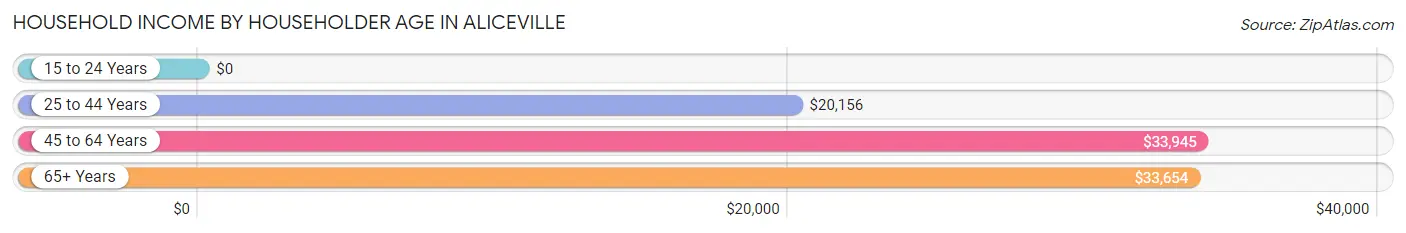
Household Income by Householder Age in Aliceville
The median household income in Aliceville is $30,152, with the highest median household income of $33,945 found in the 45 to 64 years age bracket for the primary householder. A total of 401 households (44.9%) fall into this category. Meanwhile, the 15 to 24 years age bracket for the primary householder has the lowest median household income of $0, with 39 households (4.4%) in this group.
| Income Bracket | # Households | Median Income |
| 15 to 24 Years | 39 (4.4%) | $0 |
| 25 to 44 Years | 276 (30.9%) | $20,156 |
| 45 to 64 Years | 401 (44.9%) | $33,945 |
| 65+ Years | 178 (19.9%) | $33,654 |
| Total | 894 (100.0%) | $30,152 |
Poverty in Aliceville
Income Below Poverty by Sex and Age in Aliceville
With 44.0% poverty level for males and 50.1% for females among the residents of Aliceville, 5 year old males and 5 year old females are the most vulnerable to poverty, with 19 males (100.0%) and 8 females (100.0%) in their respective age groups living below the poverty level.
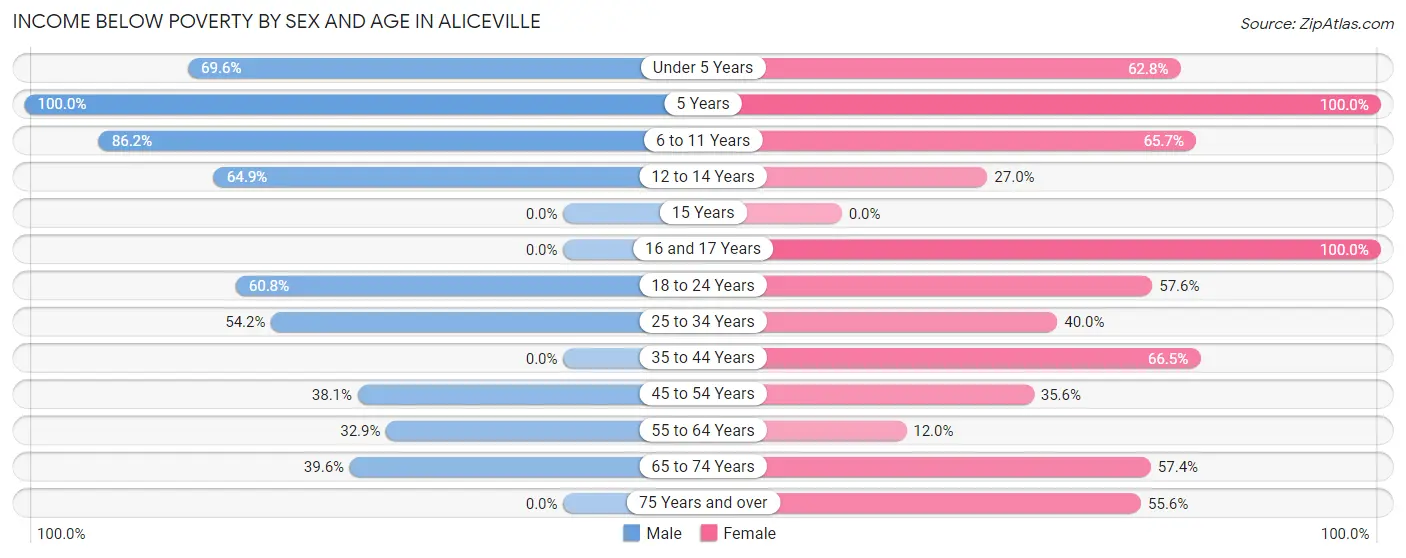
| Age Bracket | Male | Female |
| Under 5 Years | 39 (69.6%) | 76 (62.8%) |
| 5 Years | 19 (100.0%) | 8 (100.0%) |
| 6 to 11 Years | 100 (86.2%) | 90 (65.7%) |
| 12 to 14 Years | 48 (64.9%) | 10 (27.0%) |
| 15 Years | 0 (0.0%) | 0 (0.0%) |
| 16 and 17 Years | 0 (0.0%) | 29 (100.0%) |
| 18 to 24 Years | 31 (60.8%) | 68 (57.6%) |
| 25 to 34 Years | 116 (54.2%) | 56 (40.0%) |
| 35 to 44 Years | 0 (0.0%) | 123 (66.5%) |
| 45 to 54 Years | 45 (38.1%) | 67 (35.6%) |
| 55 to 64 Years | 47 (32.9%) | 17 (12.0%) |
| 65 to 74 Years | 21 (39.6%) | 35 (57.4%) |
| 75 Years and over | 0 (0.0%) | 55 (55.6%) |
| Total | 466 (44.0%) | 634 (50.1%) |
Income Above Poverty by Sex and Age in Aliceville
According to the poverty statistics in Aliceville, males aged 15 years and females aged 55 to 64 years are the age groups that are most secure financially, with 100.0% of males and 88.0% of females in these age groups living above the poverty line.
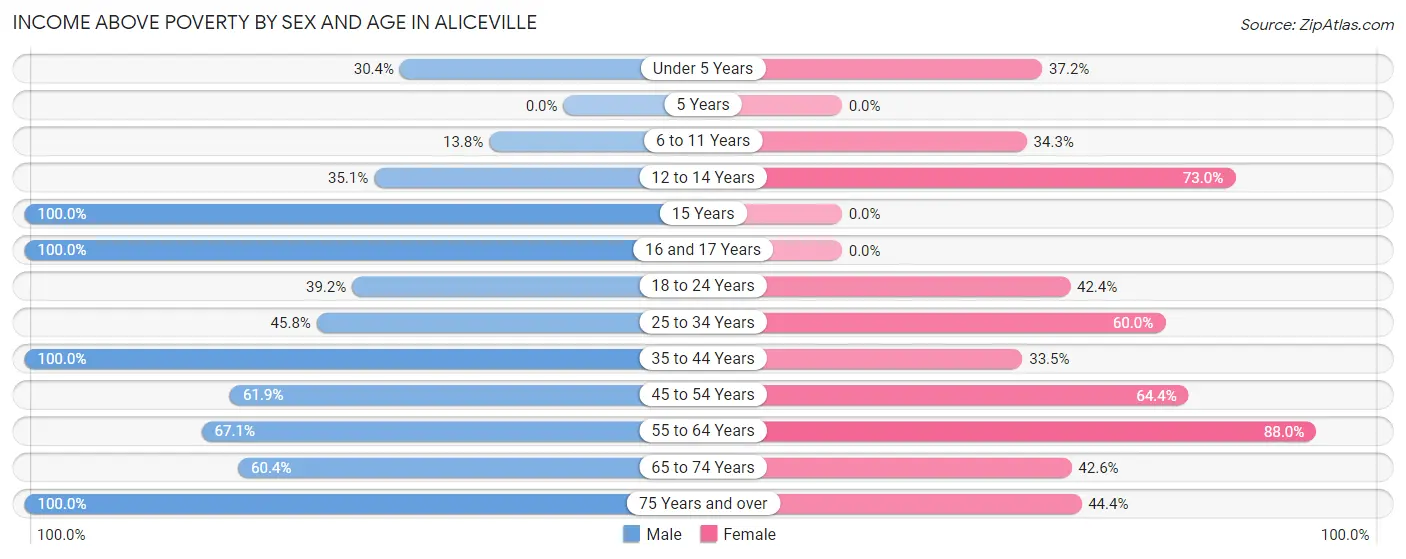
| Age Bracket | Male | Female |
| Under 5 Years | 17 (30.4%) | 45 (37.2%) |
| 5 Years | 0 (0.0%) | 0 (0.0%) |
| 6 to 11 Years | 16 (13.8%) | 47 (34.3%) |
| 12 to 14 Years | 26 (35.1%) | 27 (73.0%) |
| 15 Years | 22 (100.0%) | 0 (0.0%) |
| 16 and 17 Years | 40 (100.0%) | 0 (0.0%) |
| 18 to 24 Years | 20 (39.2%) | 50 (42.4%) |
| 25 to 34 Years | 98 (45.8%) | 84 (60.0%) |
| 35 to 44 Years | 91 (100.0%) | 62 (33.5%) |
| 45 to 54 Years | 73 (61.9%) | 121 (64.4%) |
| 55 to 64 Years | 96 (67.1%) | 125 (88.0%) |
| 65 to 74 Years | 32 (60.4%) | 26 (42.6%) |
| 75 Years and over | 63 (100.0%) | 44 (44.4%) |
| Total | 594 (56.0%) | 631 (49.9%) |
Income Below Poverty Among Married-Couple Families in Aliceville
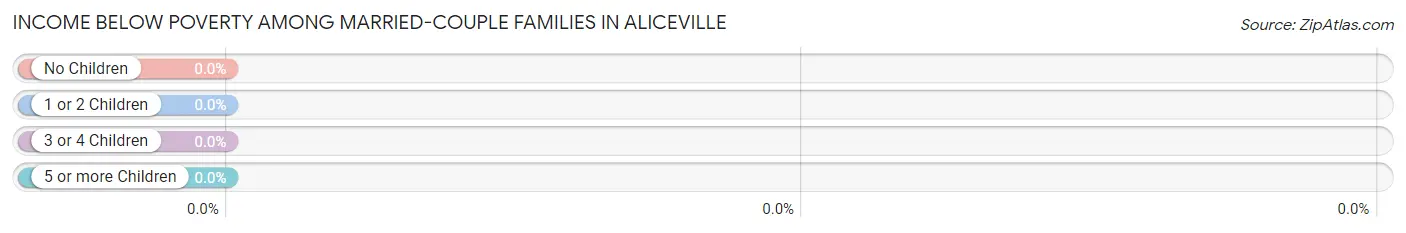
| Children | Above Poverty | Below Poverty |
| No Children | 129 (100.0%) | 0 (0.0%) |
| 1 or 2 Children | 63 (100.0%) | 0 (0.0%) |
| 3 or 4 Children | 0 (0.0%) | 0 (0.0%) |
| 5 or more Children | 0 (0.0%) | 0 (0.0%) |
| Total | 192 (100.0%) | 0 (0.0%) |
Income Below Poverty Among Single-Parent Households in Aliceville
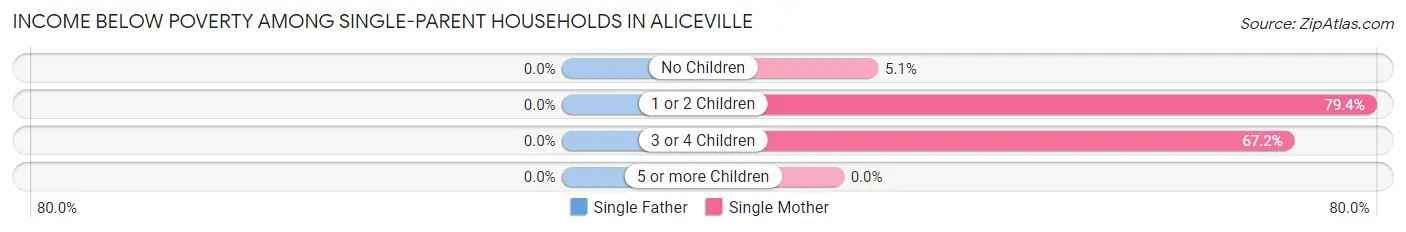
| Children | Single Father | Single Mother |
| No Children | 0 (0.0%) | 4 (5.1%) |
| 1 or 2 Children | 0 (0.0%) | 162 (79.4%) |
| 3 or 4 Children | 0 (0.0%) | 43 (67.2%) |
| 5 or more Children | 0 (0.0%) | 0 (0.0%) |
| Total | 0 (0.0%) | 209 (60.4%) |
Income Below Poverty Among Married-Couple vs Single-Parent Households in Aliceville
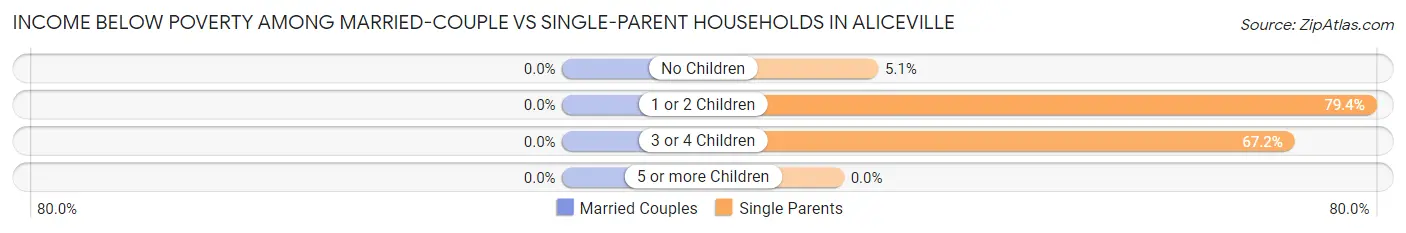
| Children | Married-Couple Families | Single-Parent Households |
| No Children | 0 (0.0%) | 4 (5.1%) |
| 1 or 2 Children | 0 (0.0%) | 162 (79.4%) |
| 3 or 4 Children | 0 (0.0%) | 43 (67.2%) |
| 5 or more Children | 0 (0.0%) | 0 (0.0%) |
| Total | 0 (0.0%) | 209 (60.4%) |
Race in Aliceville
The most populous races in Aliceville are Black / African American (1,911 | 82.2%), White / Caucasian (397 | 17.1%), and Two or more Races (17 | 0.7%).
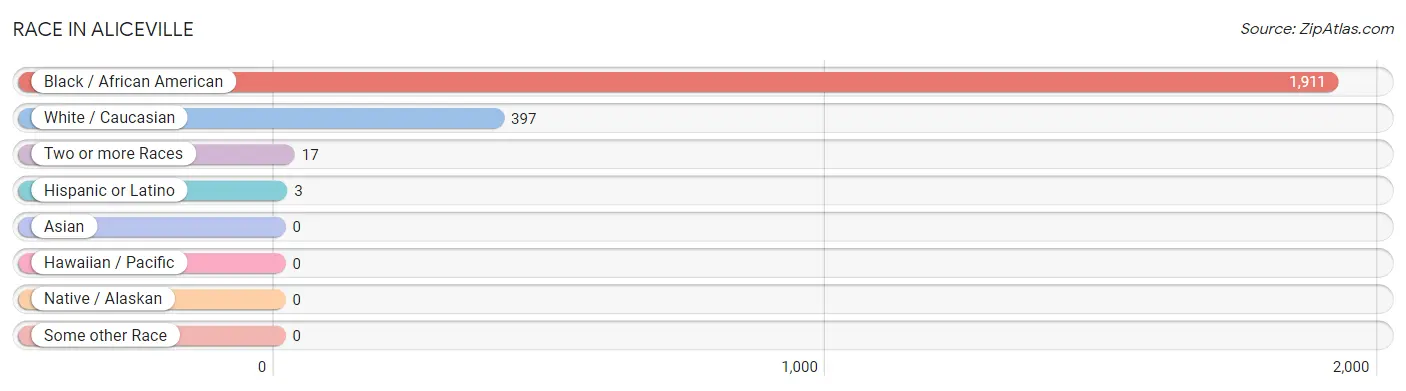
| Race | # Population | % Population |
| Asian | 0 | 0.0% |
| Black / African American | 1,911 | 82.2% |
| Hawaiian / Pacific | 0 | 0.0% |
| Hispanic or Latino | 3 | 0.1% |
| Native / Alaskan | 0 | 0.0% |
| White / Caucasian | 397 | 17.1% |
| Two or more Races | 17 | 0.7% |
| Some other Race | 0 | 0.0% |
| Total | 2,325 | 100.0% |
Ancestry in Aliceville
The most populous ancestries reported in Aliceville are American (88 | 3.8%), Irish (44 | 1.9%), African (34 | 1.5%), Subsaharan African (34 | 1.5%), and German (30 | 1.3%), together accounting for 9.9% of all Aliceville residents.
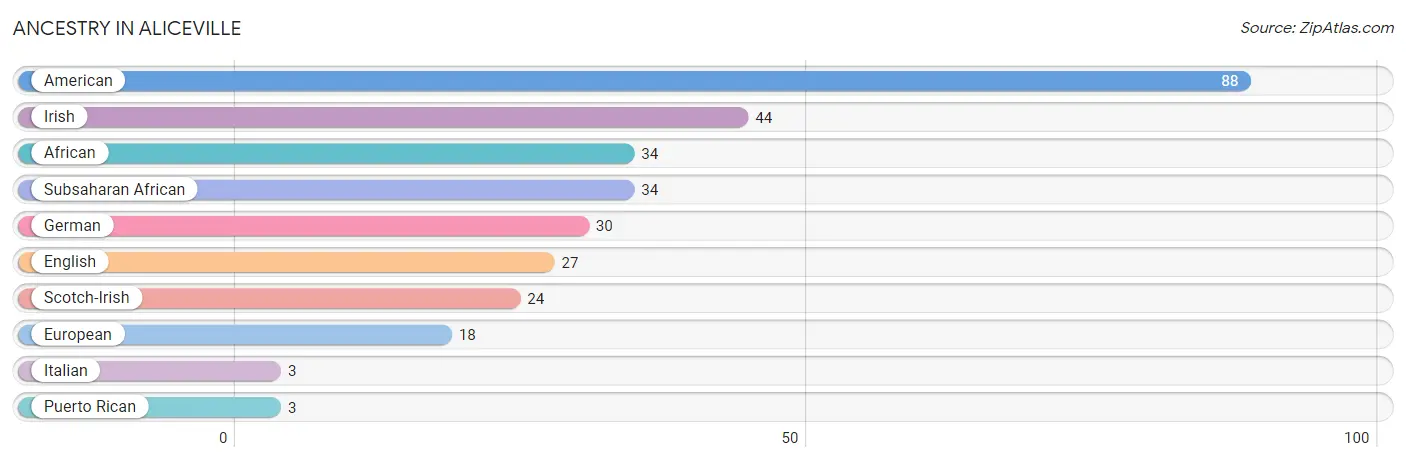
| Ancestry | # Population | % Population |
| African | 34 | 1.5% |
| American | 88 | 3.8% |
| English | 27 | 1.2% |
| European | 18 | 0.8% |
| German | 30 | 1.3% |
| Irish | 44 | 1.9% |
| Italian | 3 | 0.1% |
| Puerto Rican | 3 | 0.1% |
| Scotch-Irish | 24 | 1.0% |
| Subsaharan African | 34 | 1.5% | View All 10 Rows |
Immigrants in Aliceville

| Immigration Origin | # Population | % Population | View All 0 Rows |
Sex and Age in Aliceville
Sex and Age in Aliceville
The most populous age groups in Aliceville are 25 to 29 Years (163 | 15.4%) for men and Under 5 Years (121 | 9.6%) for women.
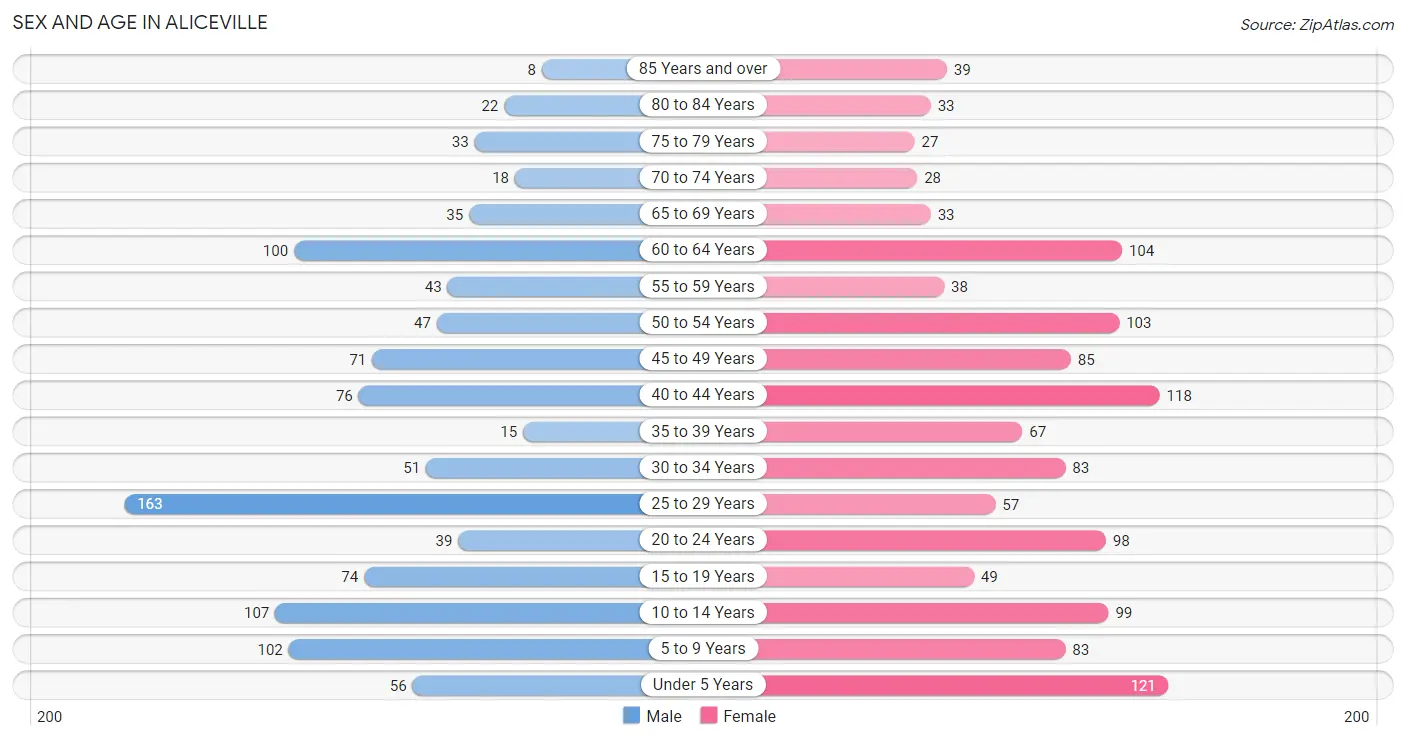
| Age Bracket | Male | Female |
| Under 5 Years | 56 (5.3%) | 121 (9.6%) |
| 5 to 9 Years | 102 (9.6%) | 83 (6.6%) |
| 10 to 14 Years | 107 (10.1%) | 99 (7.8%) |
| 15 to 19 Years | 74 (7.0%) | 49 (3.9%) |
| 20 to 24 Years | 39 (3.7%) | 98 (7.7%) |
| 25 to 29 Years | 163 (15.4%) | 57 (4.5%) |
| 30 to 34 Years | 51 (4.8%) | 83 (6.6%) |
| 35 to 39 Years | 15 (1.4%) | 67 (5.3%) |
| 40 to 44 Years | 76 (7.2%) | 118 (9.3%) |
| 45 to 49 Years | 71 (6.7%) | 85 (6.7%) |
| 50 to 54 Years | 47 (4.4%) | 103 (8.1%) |
| 55 to 59 Years | 43 (4.1%) | 38 (3.0%) |
| 60 to 64 Years | 100 (9.4%) | 104 (8.2%) |
| 65 to 69 Years | 35 (3.3%) | 33 (2.6%) |
| 70 to 74 Years | 18 (1.7%) | 28 (2.2%) |
| 75 to 79 Years | 33 (3.1%) | 27 (2.1%) |
| 80 to 84 Years | 22 (2.1%) | 33 (2.6%) |
| 85 Years and over | 8 (0.7%) | 39 (3.1%) |
| Total | 1,060 (100.0%) | 1,265 (100.0%) |
Families and Households in Aliceville
Median Family Size in Aliceville
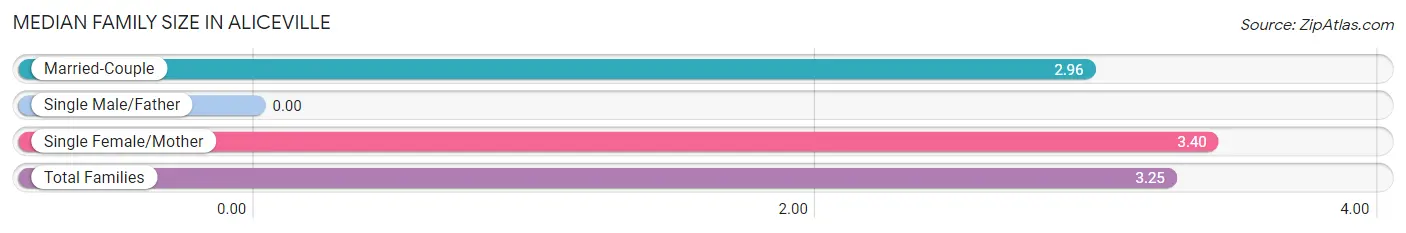
| Family Type | # Families | Family Size |
| Married-Couple | 192 (35.7%) | 2.96 |
| Single Male/Father | 0 (0.0%) | - |
| Single Female/Mother | 346 (64.3%) | 3.40 |
| Total Families | 538 (100.0%) | 3.25 |
Median Household Size in Aliceville
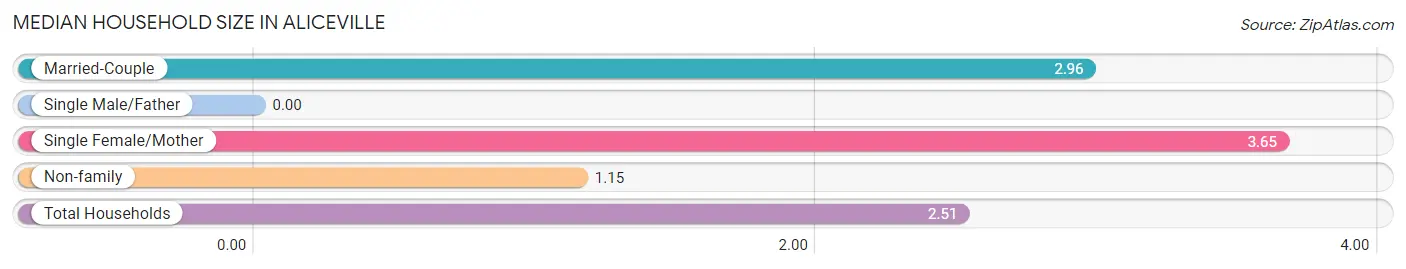
| Household Type | # Households | Household Size |
| Married-Couple | 192 (21.5%) | 2.96 |
| Single Male/Father | 0 (0.0%) | - |
| Single Female/Mother | 346 (38.7%) | 3.65 |
| Non-family | 356 (39.8%) | 1.15 |
| Total Households | 894 (100.0%) | 2.51 |
Household Size by Marriage Status in Aliceville
Out of a total of 894 households in Aliceville, 538 (60.2%) are family households, while 356 (39.8%) are nonfamily households. The most numerous type of family households are 2-person households, comprising 255, and the most common type of nonfamily households are 1-person households, comprising 297.
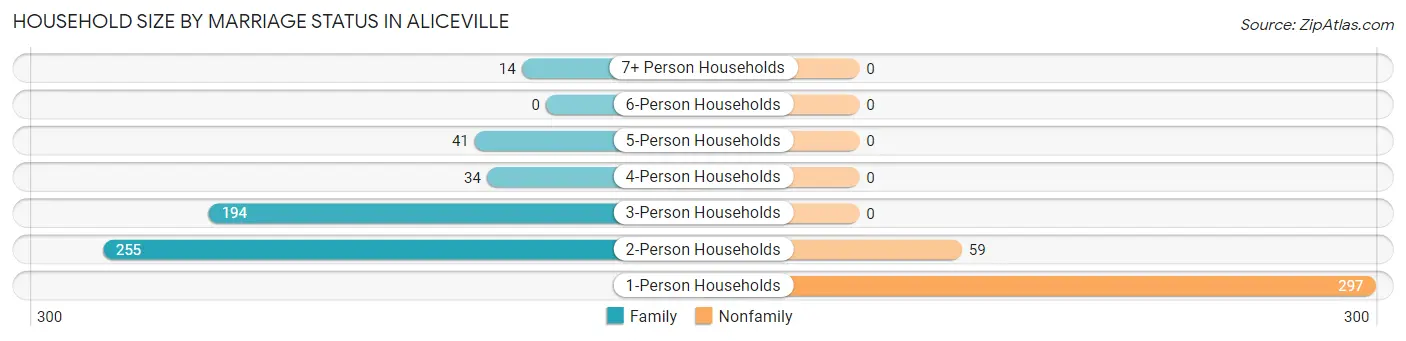
| Household Size | Family Households | Nonfamily Households |
| 1-Person Households | - | 297 (33.2%) |
| 2-Person Households | 255 (28.5%) | 59 (6.6%) |
| 3-Person Households | 194 (21.7%) | 0 (0.0%) |
| 4-Person Households | 34 (3.8%) | 0 (0.0%) |
| 5-Person Households | 41 (4.6%) | 0 (0.0%) |
| 6-Person Households | 0 (0.0%) | 0 (0.0%) |
| 7+ Person Households | 14 (1.6%) | 0 (0.0%) |
| Total | 538 (60.2%) | 356 (39.8%) |
Female Fertility in Aliceville
Fertility by Age in Aliceville
Average fertility rate in Aliceville is 109.0 births per 1,000 women. Women in the age bracket of 20 to 34 years have the highest fertility rate with 261.0 births per 1,000 women. Women in the age bracket of 20 to 34 years acount for 100.0% of all women with births.
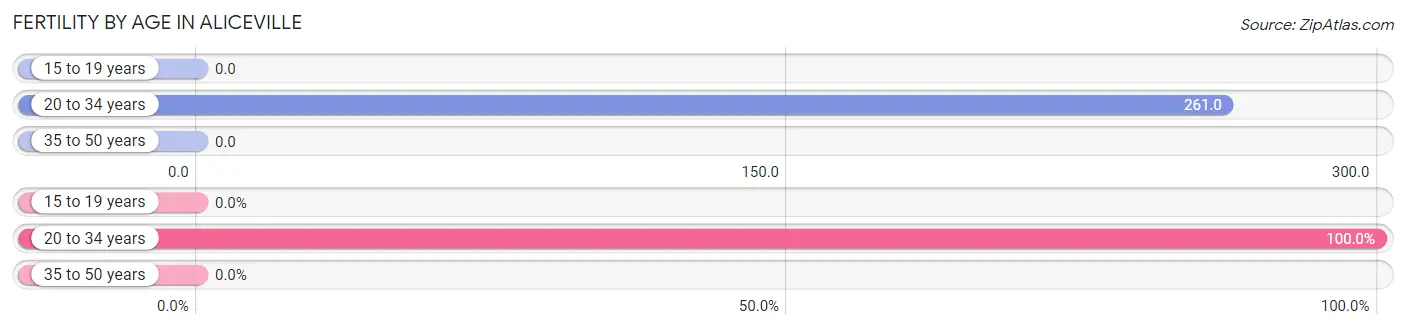
| Age Bracket | Women with Births | Births / 1,000 Women |
| 15 to 19 years | 0 (0.0%) | 0.0 |
| 20 to 34 years | 62 (100.0%) | 261.0 |
| 35 to 50 years | 0 (0.0%) | 0.0 |
| Total | 62 (100.0%) | 109.0 |
Fertility by Age by Marriage Status in Aliceville
12.9% of women with births (62) in Aliceville are married. The highest percentage of unmarried women with births falls into 20 to 34 years age bracket with 87.1% of them unmarried at the time of birth, while the lowest percentage of unmarried women with births belong to 20 to 34 years age bracket with 87.1% of them unmarried.
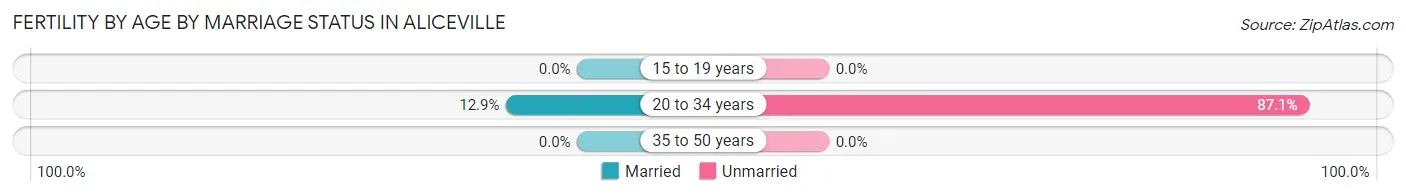
| Age Bracket | Married | Unmarried |
| 15 to 19 years | 0 (0.0%) | 0 (0.0%) |
| 20 to 34 years | 8 (12.9%) | 54 (87.1%) |
| 35 to 50 years | 0 (0.0%) | 0 (0.0%) |
| Total | 8 (12.9%) | 54 (87.1%) |
Fertility by Education in Aliceville
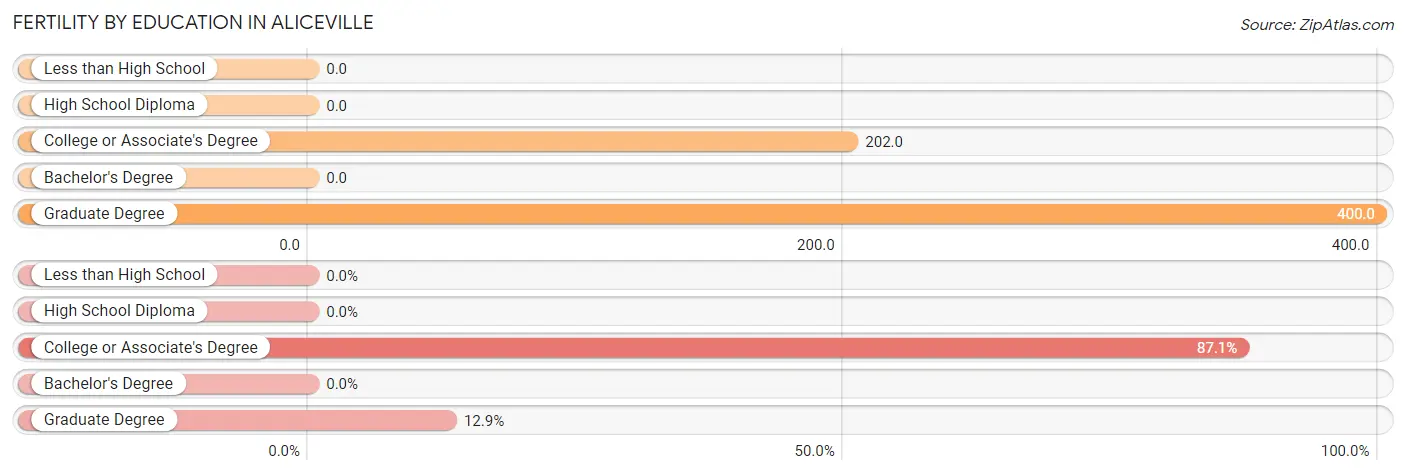
| Educational Attainment | Women with Births | Births / 1,000 Women |
| Less than High School | 0 (0.0%) | 0.0 |
| High School Diploma | 0 (0.0%) | 0.0 |
| College or Associate's Degree | 54 (87.1%) | 202.0 |
| Bachelor's Degree | 0 (0.0%) | 0.0 |
| Graduate Degree | 8 (12.9%) | 400.0 |
| Total | 62 (100.0%) | 109.0 |
Fertility by Education by Marriage Status in Aliceville
87.1% of women with births in Aliceville are unmarried. Women with the educational attainment of graduate degree are most likely to be married with 100.0% of them married at childbirth, while women with the educational attainment of college or associate's degree are least likely to be married with 100.0% of them unmarried at childbirth.
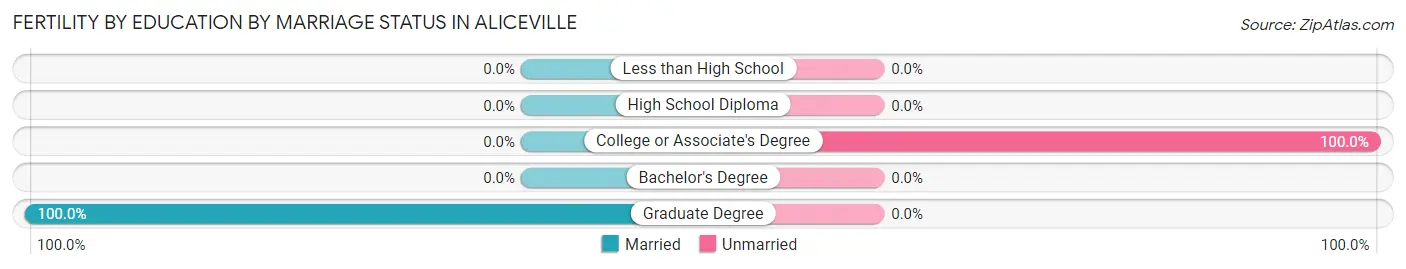
| Educational Attainment | Married | Unmarried |
| Less than High School | 0 (0.0%) | 0 (0.0%) |
| High School Diploma | 0 (0.0%) | 0 (0.0%) |
| College or Associate's Degree | 0 (0.0%) | 54 (100.0%) |
| Bachelor's Degree | 0 (0.0%) | 0 (0.0%) |
| Graduate Degree | 8 (100.0%) | 0 (0.0%) |
| Total | 8 (12.9%) | 54 (87.1%) |
Employment Characteristics in Aliceville
Employment by Class of Employer in Aliceville
Among the 698 employed individuals in Aliceville, private company employees (486 | 69.6%), local government employees (58 | 8.3%), and self-employed (incorporated) (51 | 7.3%) make up the most common classes of employment.
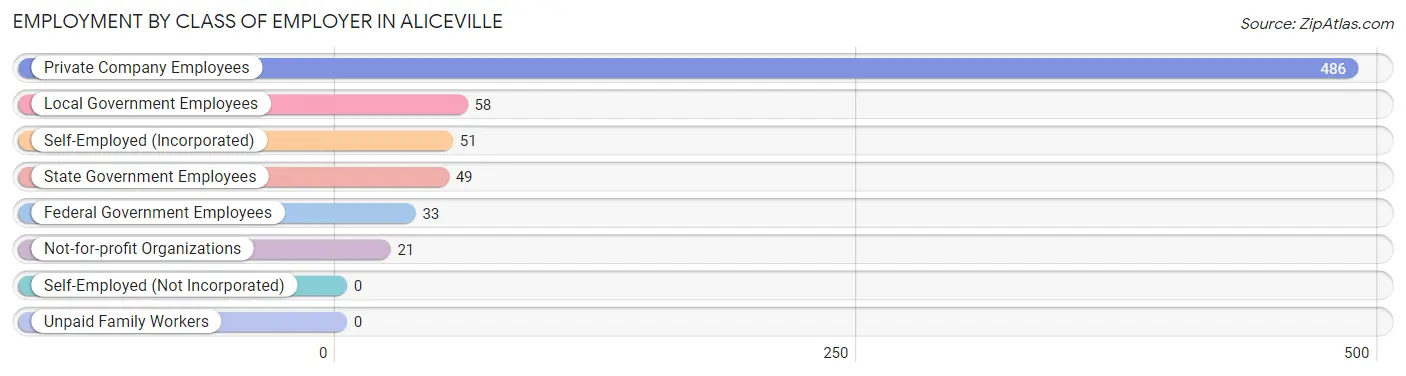
| Employer Class | # Employees | % Employees |
| Private Company Employees | 486 | 69.6% |
| Self-Employed (Incorporated) | 51 | 7.3% |
| Self-Employed (Not Incorporated) | 0 | 0.0% |
| Not-for-profit Organizations | 21 | 3.0% |
| Local Government Employees | 58 | 8.3% |
| State Government Employees | 49 | 7.0% |
| Federal Government Employees | 33 | 4.7% |
| Unpaid Family Workers | 0 | 0.0% |
| Total | 698 | 100.0% |
Employment Status by Age in Aliceville
According to the labor force statistics for Aliceville, out of the total population over 16 years of age (1,735), 54.3% or 942 individuals are in the labor force, with 15.7% or 148 of them unemployed. The age group with the highest labor force participation rate is 55 to 59 years, with 91.4% or 74 individuals in the labor force. Within the labor force, the 16 to 19 years age range has the highest percentage of unemployed individuals, with 67.4% or 29 of them being unemployed.
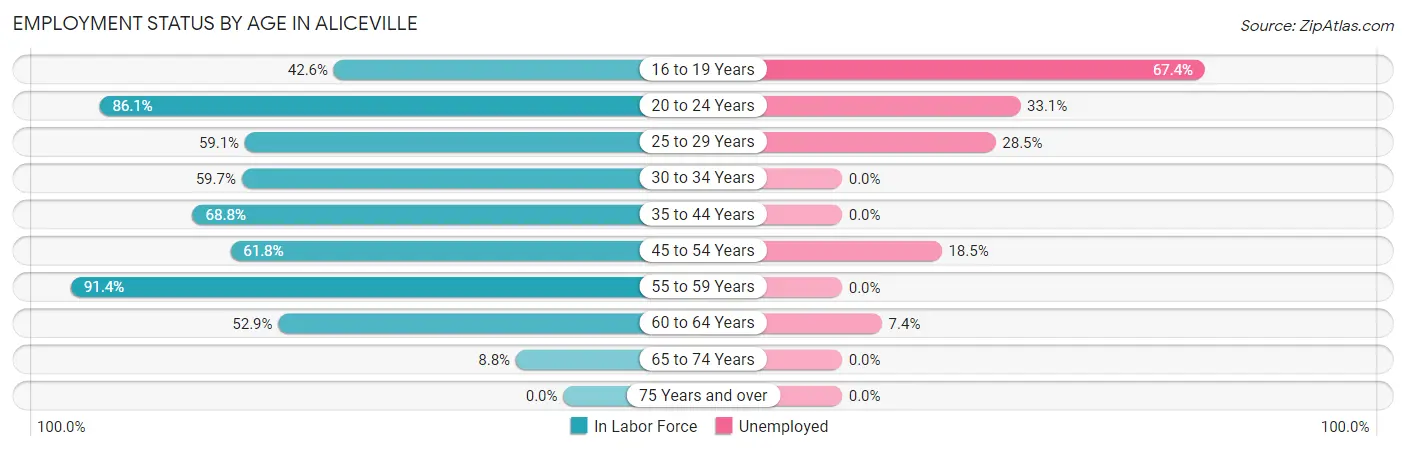
| Age Bracket | In Labor Force | Unemployed |
| 16 to 19 Years | 43 (42.6%) | 29 (67.4%) |
| 20 to 24 Years | 118 (86.1%) | 39 (33.1%) |
| 25 to 29 Years | 130 (59.1%) | 37 (28.5%) |
| 30 to 34 Years | 80 (59.7%) | 0 (0.0%) |
| 35 to 44 Years | 190 (68.8%) | 0 (0.0%) |
| 45 to 54 Years | 189 (61.8%) | 35 (18.5%) |
| 55 to 59 Years | 74 (91.4%) | 0 (0.0%) |
| 60 to 64 Years | 108 (52.9%) | 8 (7.4%) |
| 65 to 74 Years | 10 (8.8%) | 0 (0.0%) |
| 75 Years and over | 0 (0.0%) | 0 (0.0%) |
| Total | 942 (54.3%) | 148 (15.7%) |
Employment Status by Educational Attainment in Aliceville
According to labor force statistics for Aliceville, 63.1% of individuals (770) out of the total population between 25 and 64 years of age (1,221) are in the labor force, with 10.4% or 80 of them being unemployed. The group with the highest labor force participation rate are those with the educational attainment of college / associate degree, with 80.9% or 394 individuals in the labor force. Within the labor force, individuals with high school diploma education have the highest percentage of unemployment, with 15.5% or 35 of them being unemployed.
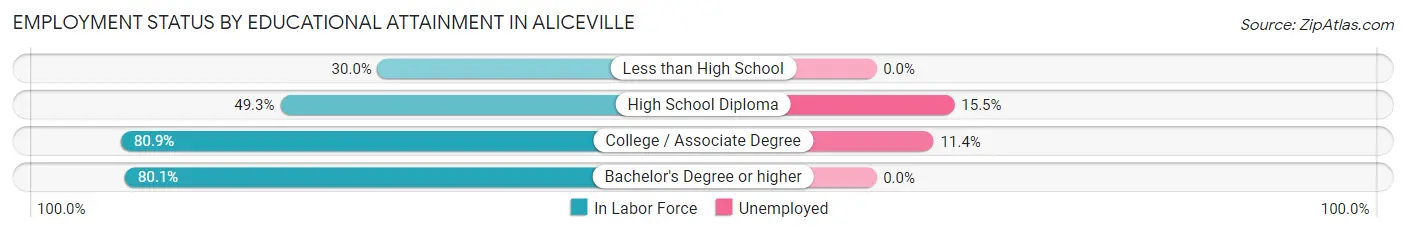
| Educational Attainment | In Labor Force | Unemployed |
| Less than High School | 42 (30.0%) | 0 (0.0%) |
| High School Diploma | 226 (49.3%) | 71 (15.5%) |
| College / Associate Degree | 394 (80.9%) | 56 (11.4%) |
| Bachelor's Degree or higher | 109 (80.1%) | 0 (0.0%) |
| Total | 770 (63.1%) | 127 (10.4%) |
Employment Occupations by Sex in Aliceville
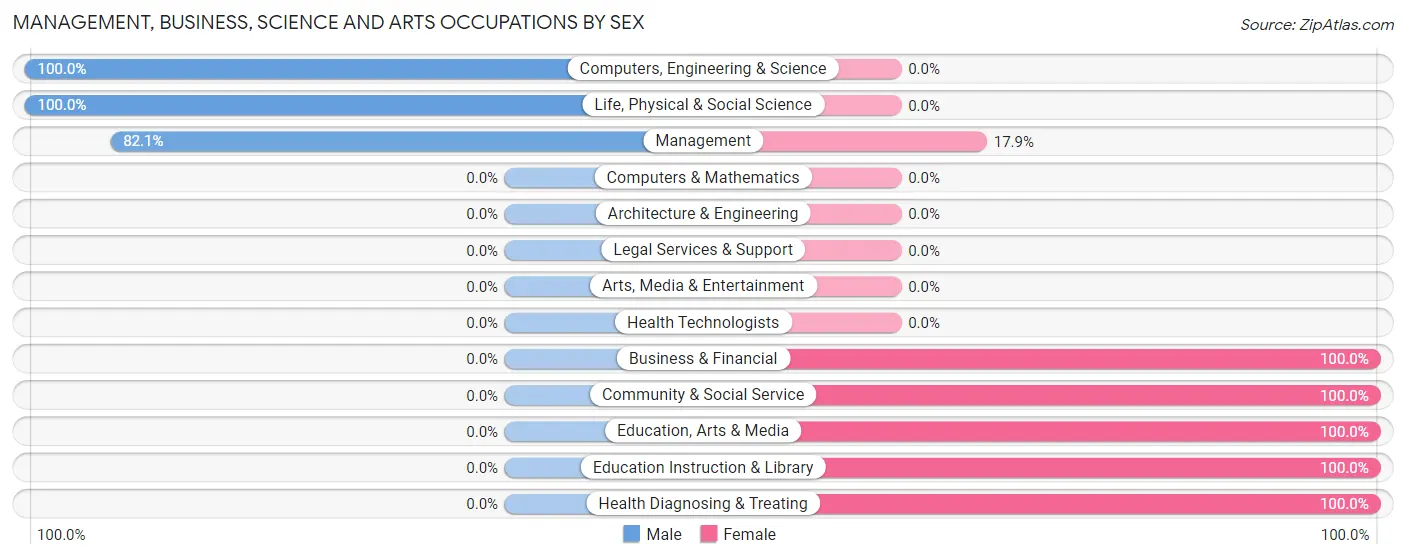
Management, Business, Science and Arts Occupations
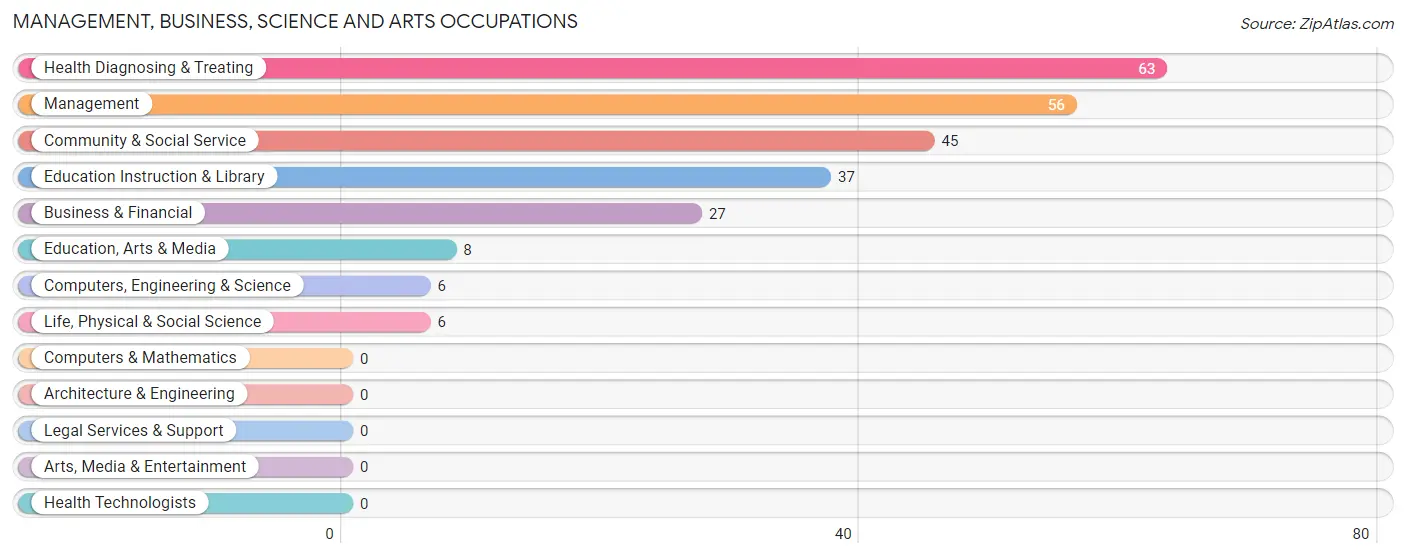
The most common Management, Business, Science and Arts occupations in Aliceville are Health Diagnosing & Treating (63 | 7.9%), Management (56 | 7.0%), Community & Social Service (45 | 5.7%), Education Instruction & Library (37 | 4.7%), and Business & Financial (27 | 3.4%).
Management, Business, Science and Arts Occupations by Sex
Within the Management, Business, Science and Arts occupations in Aliceville, the most male-oriented occupations are Computers, Engineering & Science (100.0%), Life, Physical & Social Science (100.0%), and Management (82.1%), while the most female-oriented occupations are Business & Financial (100.0%), Community & Social Service (100.0%), and Education, Arts & Media (100.0%).
| Occupation | Male | Female |
| Management | 46 (82.1%) | 10 (17.9%) |
| Business & Financial | 0 (0.0%) | 27 (100.0%) |
| Computers, Engineering & Science | 6 (100.0%) | 0 (0.0%) |
| Computers & Mathematics | 0 (0.0%) | 0 (0.0%) |
| Architecture & Engineering | 0 (0.0%) | 0 (0.0%) |
| Life, Physical & Social Science | 6 (100.0%) | 0 (0.0%) |
| Community & Social Service | 0 (0.0%) | 45 (100.0%) |
| Education, Arts & Media | 0 (0.0%) | 8 (100.0%) |
| Legal Services & Support | 0 (0.0%) | 0 (0.0%) |
| Education Instruction & Library | 0 (0.0%) | 37 (100.0%) |
| Arts, Media & Entertainment | 0 (0.0%) | 0 (0.0%) |
| Health Diagnosing & Treating | 0 (0.0%) | 63 (100.0%) |
| Health Technologists | 0 (0.0%) | 0 (0.0%) |
| Total (Category) | 52 (26.4%) | 145 (73.6%) |
| Total (Overall) | 349 (44.0%) | 445 (56.0%) |
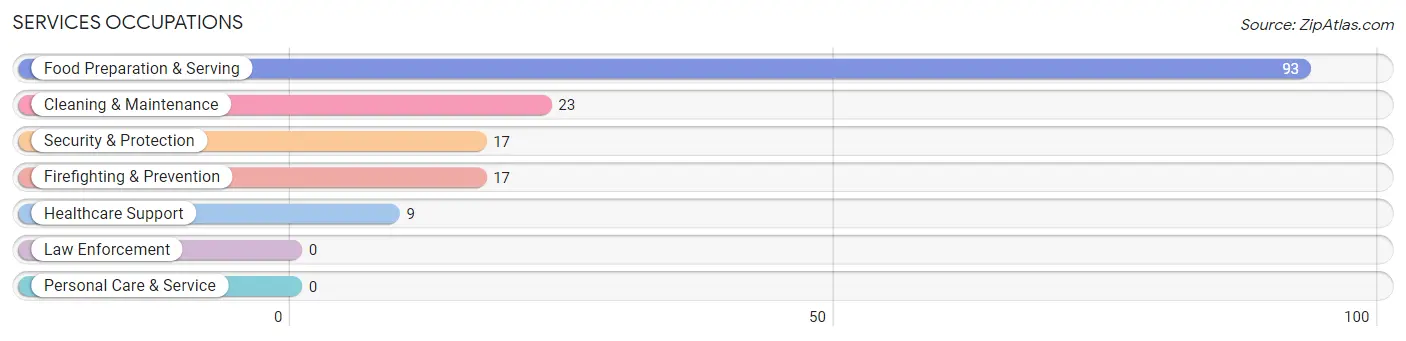
Services Occupations
The most common Services occupations in Aliceville are Food Preparation & Serving (93 | 11.7%), Cleaning & Maintenance (23 | 2.9%), Security & Protection (17 | 2.1%), Firefighting & Prevention (17 | 2.1%), and Healthcare Support (9 | 1.1%).
Services Occupations by Sex
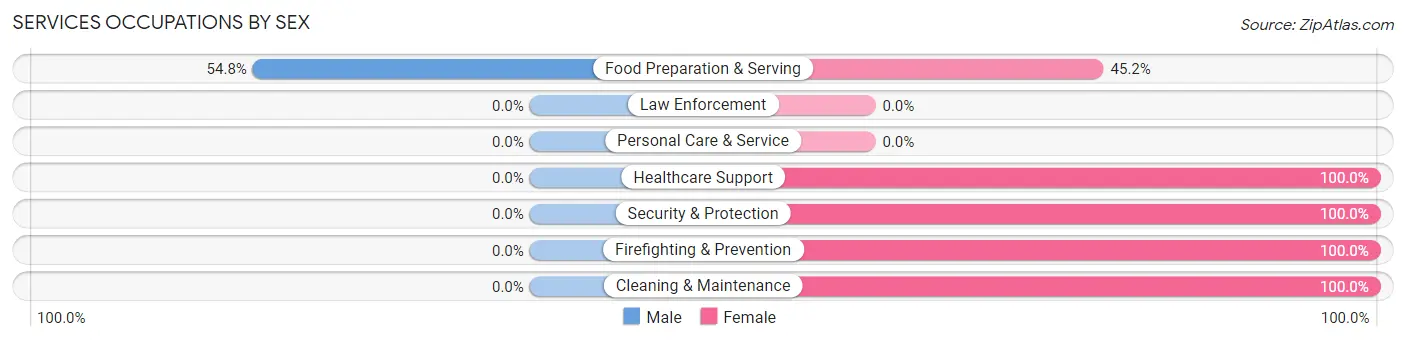
| Occupation | Male | Female |
| Healthcare Support | 0 (0.0%) | 9 (100.0%) |
| Security & Protection | 0 (0.0%) | 17 (100.0%) |
| Firefighting & Prevention | 0 (0.0%) | 17 (100.0%) |
| Law Enforcement | 0 (0.0%) | 0 (0.0%) |
| Food Preparation & Serving | 51 (54.8%) | 42 (45.2%) |
| Cleaning & Maintenance | 0 (0.0%) | 23 (100.0%) |
| Personal Care & Service | 0 (0.0%) | 0 (0.0%) |
| Total (Category) | 51 (35.9%) | 91 (64.1%) |
| Total (Overall) | 349 (44.0%) | 445 (56.0%) |
Sales and Office Occupations
The most common Sales and Office occupations in Aliceville are Sales & Related (115 | 14.5%), and Office & Administration (77 | 9.7%).

Sales and Office Occupations by Sex
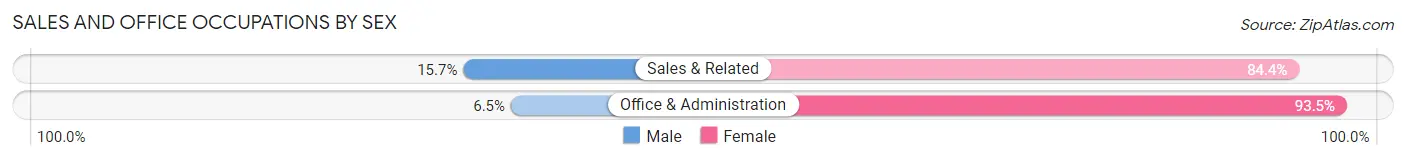
| Occupation | Male | Female |
| Sales & Related | 18 (15.7%) | 97 (84.4%) |
| Office & Administration | 5 (6.5%) | 72 (93.5%) |
| Total (Category) | 23 (12.0%) | 169 (88.0%) |
| Total (Overall) | 349 (44.0%) | 445 (56.0%) |
Natural Resources, Construction and Maintenance Occupations
The most common Natural Resources, Construction and Maintenance occupations in Aliceville are Installation, Maintenance & Repair (45 | 5.7%), and Construction & Extraction (23 | 2.9%).
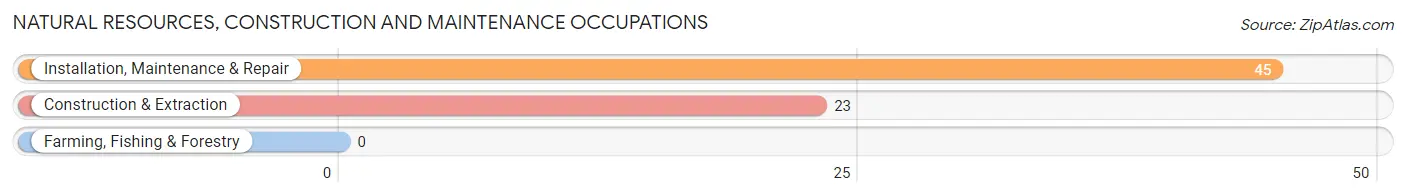
Natural Resources, Construction and Maintenance Occupations by Sex

| Occupation | Male | Female |
| Farming, Fishing & Forestry | 0 (0.0%) | 0 (0.0%) |
| Construction & Extraction | 23 (100.0%) | 0 (0.0%) |
| Installation, Maintenance & Repair | 45 (100.0%) | 0 (0.0%) |
| Total (Category) | 68 (100.0%) | 0 (0.0%) |
| Total (Overall) | 349 (44.0%) | 445 (56.0%) |
Production, Transportation and Moving Occupations
The most common Production, Transportation and Moving occupations in Aliceville are Production (118 | 14.9%), Material Moving (65 | 8.2%), and Transportation (12 | 1.5%).
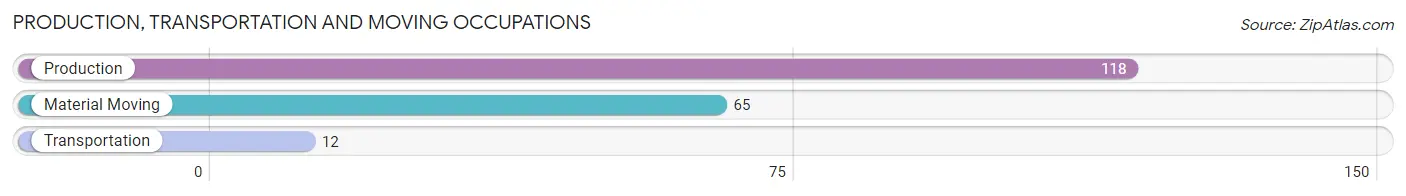
Production, Transportation and Moving Occupations by Sex
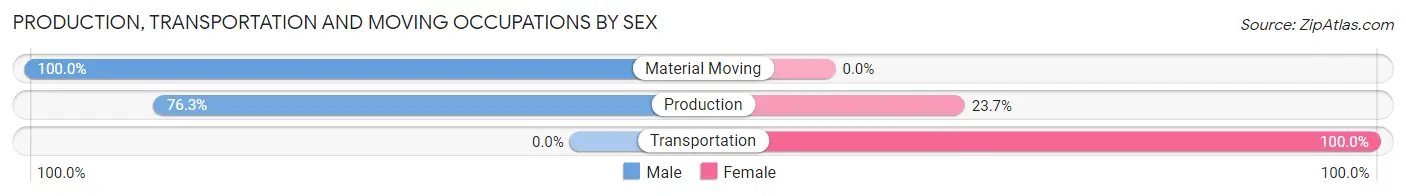
| Occupation | Male | Female |
| Production | 90 (76.3%) | 28 (23.7%) |
| Transportation | 0 (0.0%) | 12 (100.0%) |
| Material Moving | 65 (100.0%) | 0 (0.0%) |
| Total (Category) | 155 (79.5%) | 40 (20.5%) |
| Total (Overall) | 349 (44.0%) | 445 (56.0%) |
Employment Industries by Sex in Aliceville
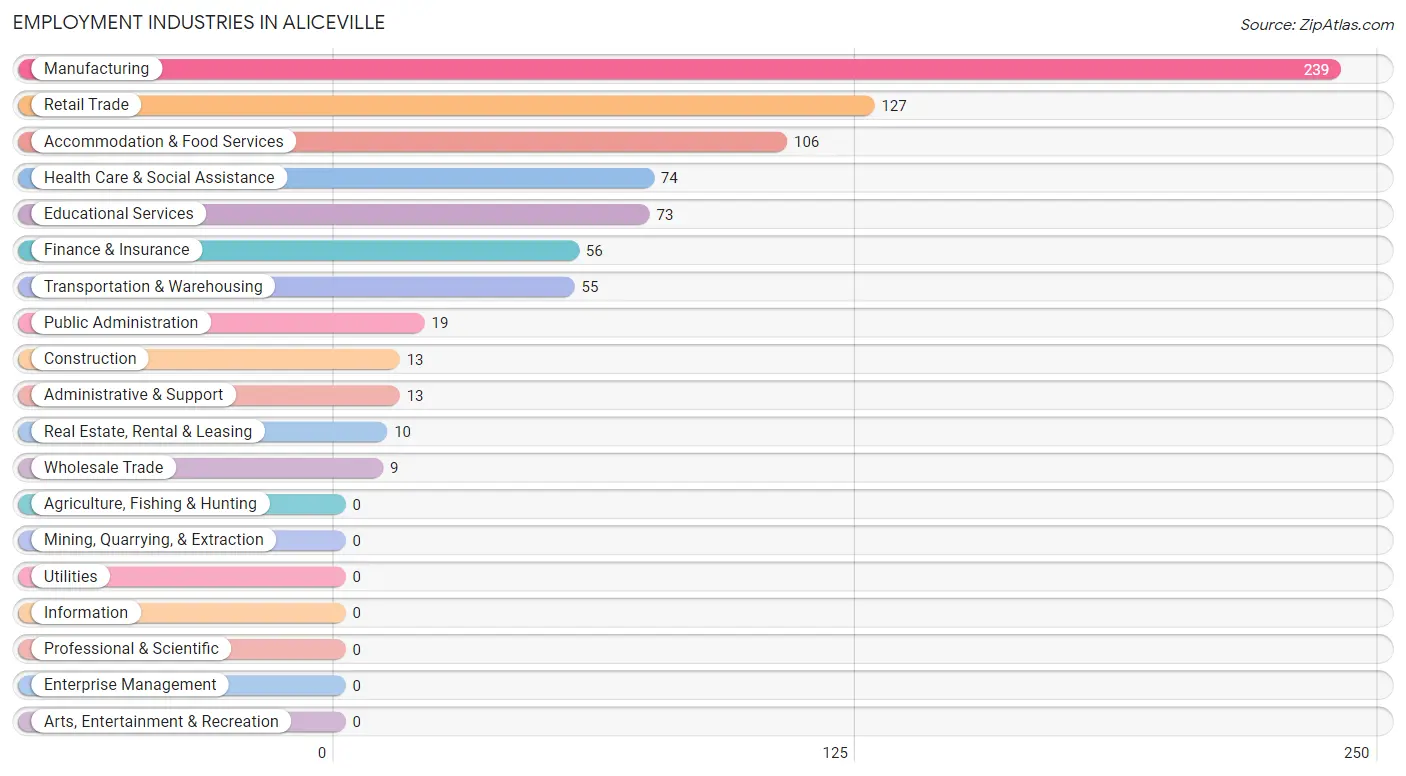
Employment Industries in Aliceville
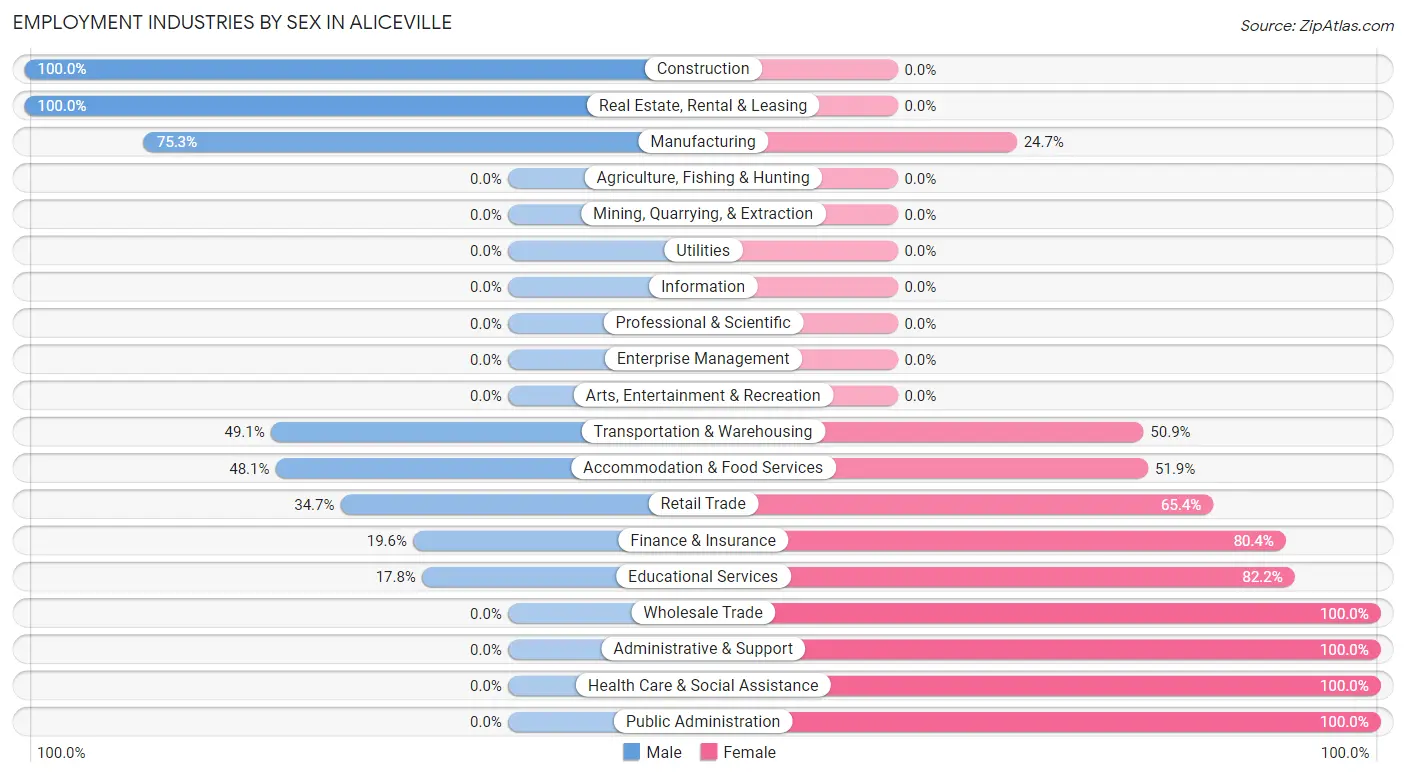
The major employment industries in Aliceville include Manufacturing (239 | 30.1%), Retail Trade (127 | 16.0%), Accommodation & Food Services (106 | 13.4%), Health Care & Social Assistance (74 | 9.3%), and Educational Services (73 | 9.2%).
Employment Industries by Sex in Aliceville
The Aliceville industries that see more men than women are Construction (100.0%), Real Estate, Rental & Leasing (100.0%), and Manufacturing (75.3%), whereas the industries that tend to have a higher number of women are Wholesale Trade (100.0%), Administrative & Support (100.0%), and Health Care & Social Assistance (100.0%).
| Industry | Male | Female |
| Agriculture, Fishing & Hunting | 0 (0.0%) | 0 (0.0%) |
| Mining, Quarrying, & Extraction | 0 (0.0%) | 0 (0.0%) |
| Construction | 13 (100.0%) | 0 (0.0%) |
| Manufacturing | 180 (75.3%) | 59 (24.7%) |
| Wholesale Trade | 0 (0.0%) | 9 (100.0%) |
| Retail Trade | 44 (34.6%) | 83 (65.3%) |
| Transportation & Warehousing | 27 (49.1%) | 28 (50.9%) |
| Utilities | 0 (0.0%) | 0 (0.0%) |
| Information | 0 (0.0%) | 0 (0.0%) |
| Finance & Insurance | 11 (19.6%) | 45 (80.4%) |
| Real Estate, Rental & Leasing | 10 (100.0%) | 0 (0.0%) |
| Professional & Scientific | 0 (0.0%) | 0 (0.0%) |
| Enterprise Management | 0 (0.0%) | 0 (0.0%) |
| Administrative & Support | 0 (0.0%) | 13 (100.0%) |
| Educational Services | 13 (17.8%) | 60 (82.2%) |
| Health Care & Social Assistance | 0 (0.0%) | 74 (100.0%) |
| Arts, Entertainment & Recreation | 0 (0.0%) | 0 (0.0%) |
| Accommodation & Food Services | 51 (48.1%) | 55 (51.9%) |
| Public Administration | 0 (0.0%) | 19 (100.0%) |
| Total | 349 (44.0%) | 445 (56.0%) |
Education in Aliceville
School Enrollment in Aliceville
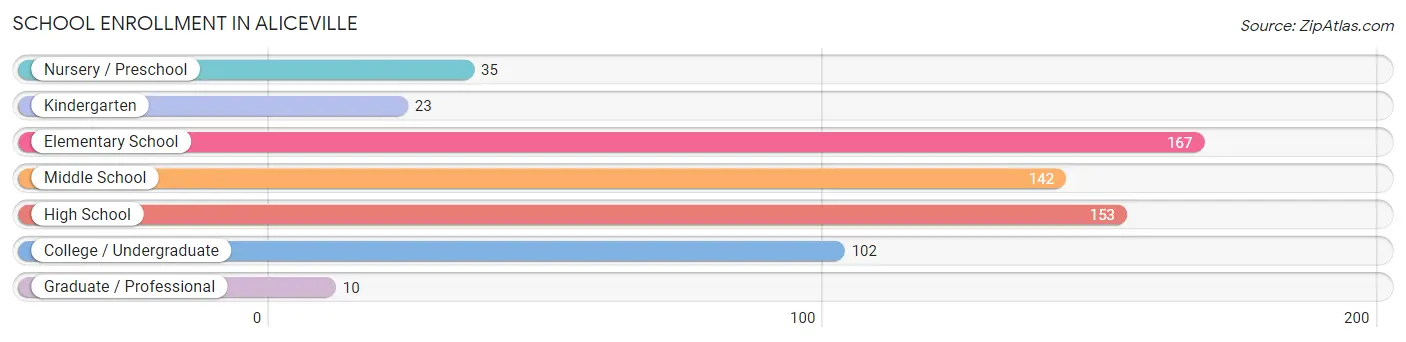
The most common levels of schooling among the 632 students in Aliceville are elementary school (167 | 26.4%), high school (153 | 24.2%), and middle school (142 | 22.5%).
| School Level | # Students | % Students |
| Nursery / Preschool | 35 | 5.5% |
| Kindergarten | 23 | 3.6% |
| Elementary School | 167 | 26.4% |
| Middle School | 142 | 22.5% |
| High School | 153 | 24.2% |
| College / Undergraduate | 102 | 16.1% |
| Graduate / Professional | 10 | 1.6% |
| Total | 632 | 100.0% |
School Enrollment by Age by Funding Source in Aliceville
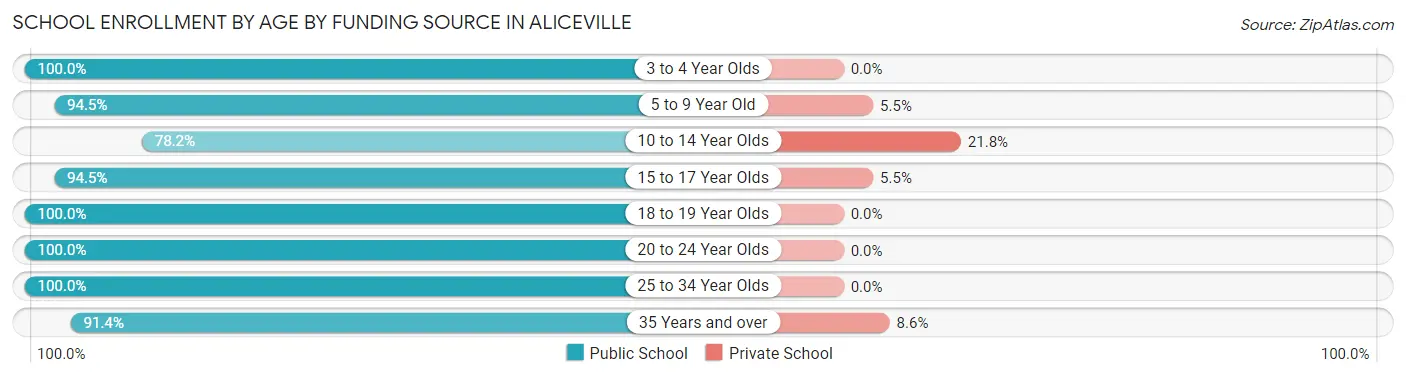
Out of a total of 632 students who are enrolled in schools in Aliceville, 62 (9.8%) attend a private institution, while the remaining 570 (90.2%) are enrolled in public schools. The age group of 10 to 14 year olds has the highest likelihood of being enrolled in private schools, with 45 (21.8% in the age bracket) enrolled. Conversely, the age group of 3 to 4 year olds has the lowest likelihood of being enrolled in a private school, with 16 (100.0% in the age bracket) attending a public institution.
| Age Bracket | Public School | Private School |
| 3 to 4 Year Olds | 16 (100.0%) | 0 (0.0%) |
| 5 to 9 Year Old | 155 (94.5%) | 9 (5.5%) |
| 10 to 14 Year Olds | 161 (78.2%) | 45 (21.8%) |
| 15 to 17 Year Olds | 86 (94.5%) | 5 (5.5%) |
| 18 to 19 Year Olds | 29 (100.0%) | 0 (0.0%) |
| 20 to 24 Year Olds | 20 (100.0%) | 0 (0.0%) |
| 25 to 34 Year Olds | 71 (100.0%) | 0 (0.0%) |
| 35 Years and over | 32 (91.4%) | 3 (8.6%) |
| Total | 570 (90.2%) | 62 (9.8%) |
Educational Attainment by Field of Study in Aliceville
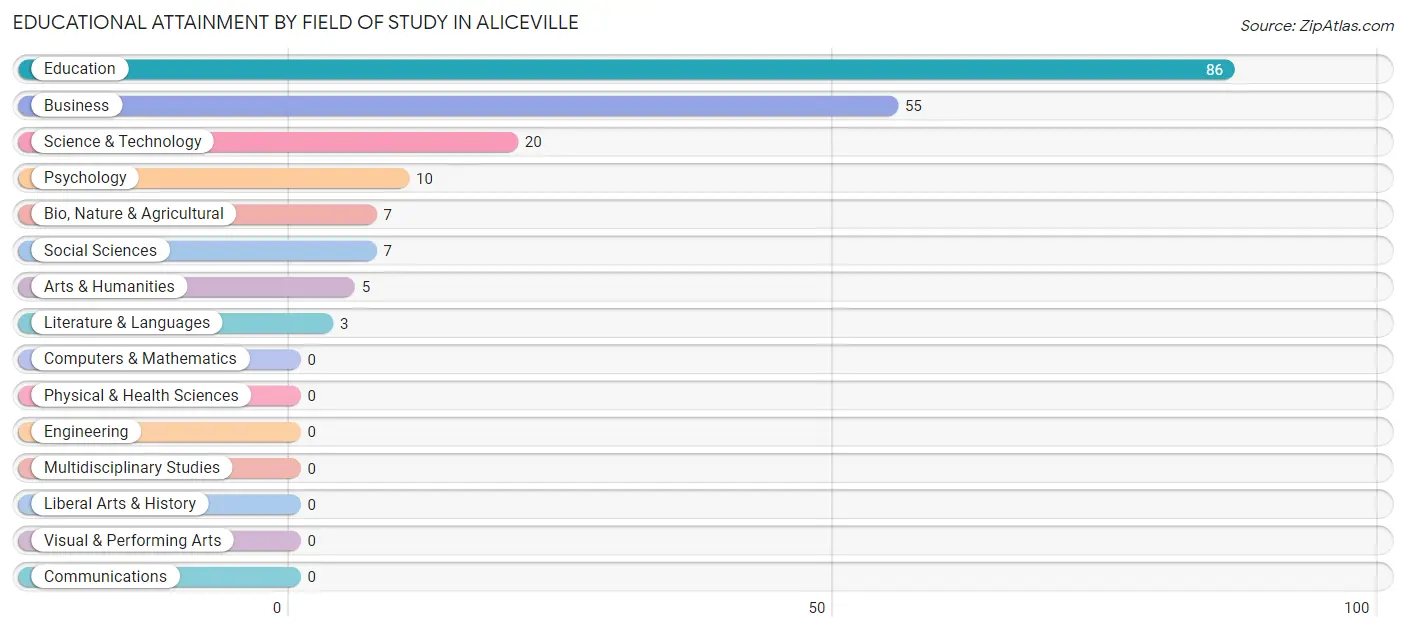
Education (86 | 44.6%), business (55 | 28.5%), science & technology (20 | 10.4%), psychology (10 | 5.2%), and bio, nature & agricultural (7 | 3.6%) are the most common fields of study among 193 individuals in Aliceville who have obtained a bachelor's degree or higher.
| Field of Study | # Graduates | % Graduates |
| Computers & Mathematics | 0 | 0.0% |
| Bio, Nature & Agricultural | 7 | 3.6% |
| Physical & Health Sciences | 0 | 0.0% |
| Psychology | 10 | 5.2% |
| Social Sciences | 7 | 3.6% |
| Engineering | 0 | 0.0% |
| Multidisciplinary Studies | 0 | 0.0% |
| Science & Technology | 20 | 10.4% |
| Business | 55 | 28.5% |
| Education | 86 | 44.6% |
| Literature & Languages | 3 | 1.5% |
| Liberal Arts & History | 0 | 0.0% |
| Visual & Performing Arts | 0 | 0.0% |
| Communications | 0 | 0.0% |
| Arts & Humanities | 5 | 2.6% |
| Total | 193 | 100.0% |
Transportation & Commute in Aliceville
Vehicle Availability by Sex in Aliceville
The most prevalent vehicle ownership categories in Aliceville are males with 2 vehicles (88, accounting for 31.7%) and females with 2 vehicles (187, making up 20.9%).
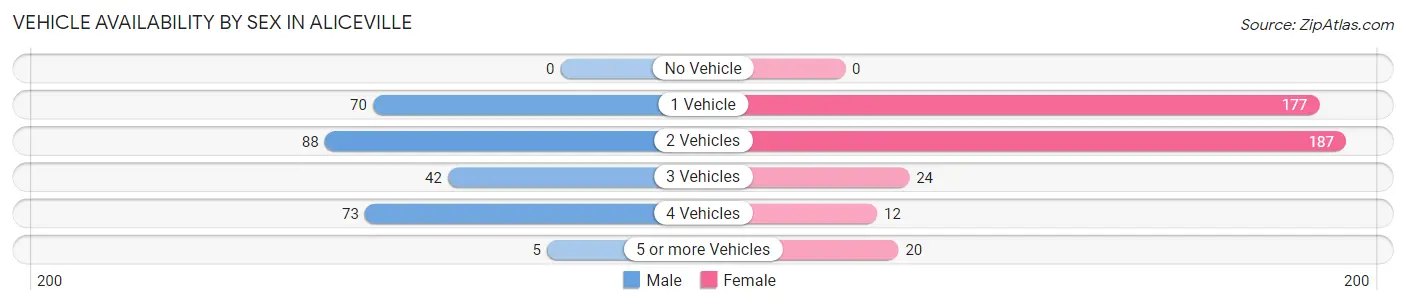
| Vehicles Available | Male | Female |
| No Vehicle | 0 (0.0%) | 0 (0.0%) |
| 1 Vehicle | 70 (25.2%) | 177 (42.1%) |
| 2 Vehicles | 88 (31.7%) | 187 (44.5%) |
| 3 Vehicles | 42 (15.1%) | 24 (5.7%) |
| 4 Vehicles | 73 (26.3%) | 12 (2.9%) |
| 5 or more Vehicles | 5 (1.8%) | 20 (4.8%) |
| Total | 278 (100.0%) | 420 (100.0%) |
Commute Time in Aliceville
The most frequently occuring commute durations in Aliceville are 45 to 59 minutes (170 commuters, 25.3%), 5 to 9 minutes (125 commuters, 18.6%), and 30 to 34 minutes (111 commuters, 16.5%).
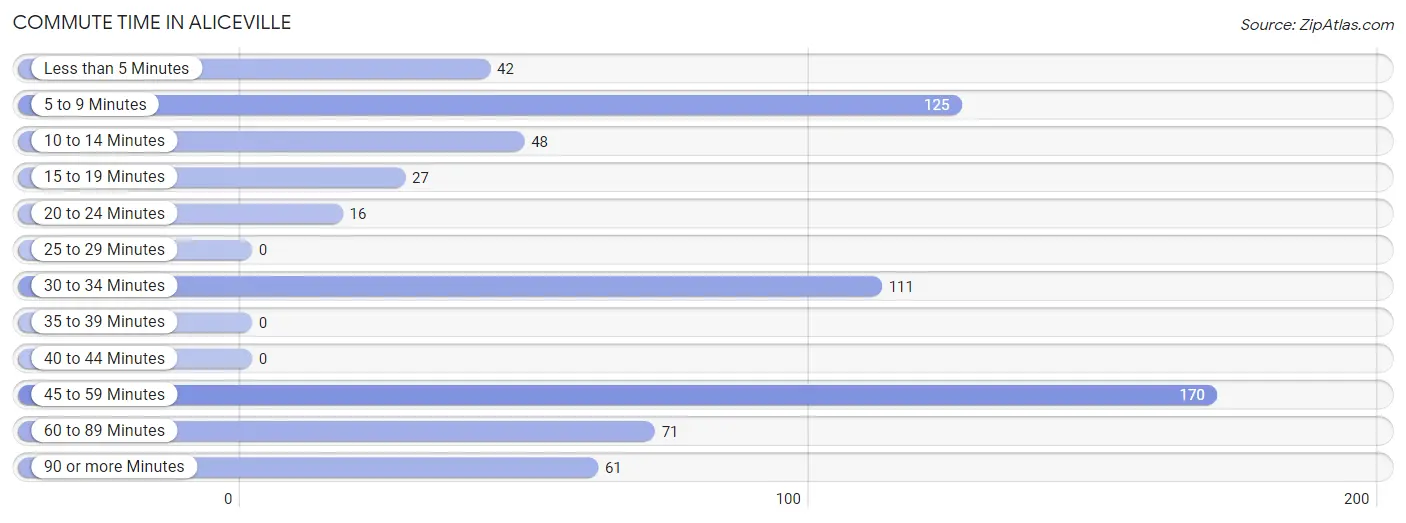
| Commute Time | # Commuters | % Commuters |
| Less than 5 Minutes | 42 | 6.3% |
| 5 to 9 Minutes | 125 | 18.6% |
| 10 to 14 Minutes | 48 | 7.1% |
| 15 to 19 Minutes | 27 | 4.0% |
| 20 to 24 Minutes | 16 | 2.4% |
| 25 to 29 Minutes | 0 | 0.0% |
| 30 to 34 Minutes | 111 | 16.5% |
| 35 to 39 Minutes | 0 | 0.0% |
| 40 to 44 Minutes | 0 | 0.0% |
| 45 to 59 Minutes | 170 | 25.3% |
| 60 to 89 Minutes | 71 | 10.6% |
| 90 or more Minutes | 61 | 9.1% |
Commute Time by Sex in Aliceville
The most common commute times in Aliceville are 45 to 59 minutes (75 commuters, 29.3%) for males and 5 to 9 minutes (104 commuters, 25.1%) for females.
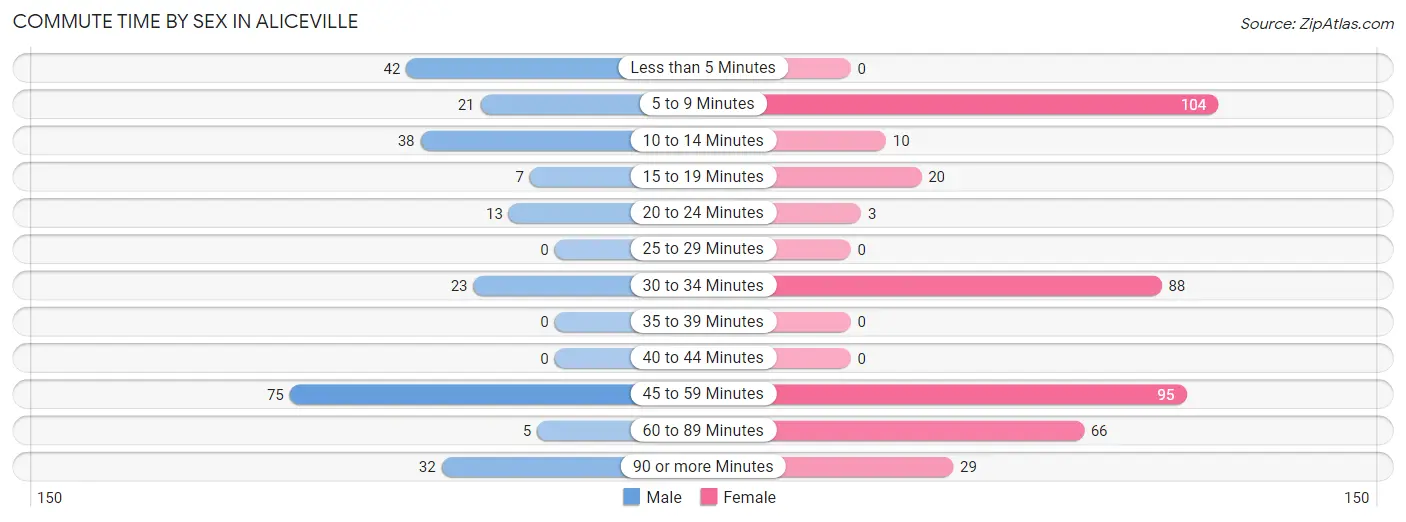
| Commute Time | Male | Female |
| Less than 5 Minutes | 42 (16.4%) | 0 (0.0%) |
| 5 to 9 Minutes | 21 (8.2%) | 104 (25.1%) |
| 10 to 14 Minutes | 38 (14.8%) | 10 (2.4%) |
| 15 to 19 Minutes | 7 (2.7%) | 20 (4.8%) |
| 20 to 24 Minutes | 13 (5.1%) | 3 (0.7%) |
| 25 to 29 Minutes | 0 (0.0%) | 0 (0.0%) |
| 30 to 34 Minutes | 23 (9.0%) | 88 (21.2%) |
| 35 to 39 Minutes | 0 (0.0%) | 0 (0.0%) |
| 40 to 44 Minutes | 0 (0.0%) | 0 (0.0%) |
| 45 to 59 Minutes | 75 (29.3%) | 95 (22.9%) |
| 60 to 89 Minutes | 5 (1.9%) | 66 (15.9%) |
| 90 or more Minutes | 32 (12.5%) | 29 (7.0%) |
Time of Departure to Work by Sex in Aliceville
The most frequent times of departure to work in Aliceville are 5:30 AM to 5:59 AM (53, 20.7%) for males and 6:00 AM to 6:29 AM (92, 22.2%) for females.
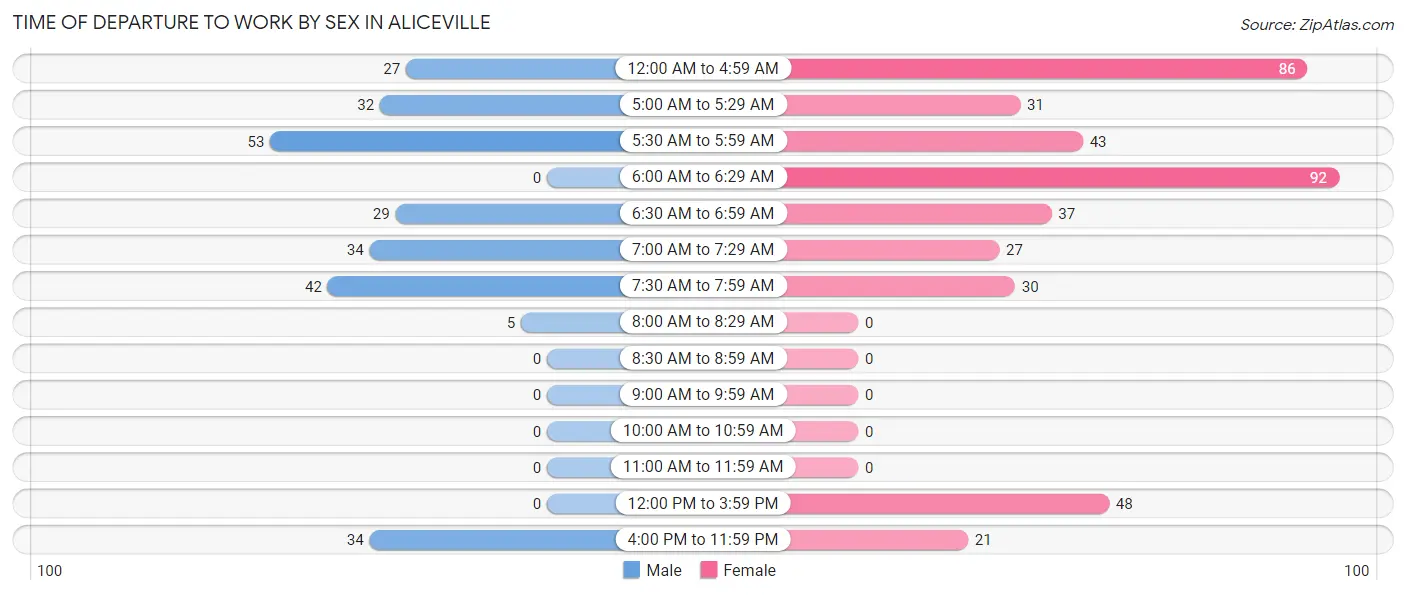
| Time of Departure | Male | Female |
| 12:00 AM to 4:59 AM | 27 (10.5%) | 86 (20.7%) |
| 5:00 AM to 5:29 AM | 32 (12.5%) | 31 (7.5%) |
| 5:30 AM to 5:59 AM | 53 (20.7%) | 43 (10.4%) |
| 6:00 AM to 6:29 AM | 0 (0.0%) | 92 (22.2%) |
| 6:30 AM to 6:59 AM | 29 (11.3%) | 37 (8.9%) |
| 7:00 AM to 7:29 AM | 34 (13.3%) | 27 (6.5%) |
| 7:30 AM to 7:59 AM | 42 (16.4%) | 30 (7.2%) |
| 8:00 AM to 8:29 AM | 5 (1.9%) | 0 (0.0%) |
| 8:30 AM to 8:59 AM | 0 (0.0%) | 0 (0.0%) |
| 9:00 AM to 9:59 AM | 0 (0.0%) | 0 (0.0%) |
| 10:00 AM to 10:59 AM | 0 (0.0%) | 0 (0.0%) |
| 11:00 AM to 11:59 AM | 0 (0.0%) | 0 (0.0%) |
| 12:00 PM to 3:59 PM | 0 (0.0%) | 48 (11.6%) |
| 4:00 PM to 11:59 PM | 34 (13.3%) | 21 (5.1%) |
| Total | 256 (100.0%) | 415 (100.0%) |
Housing Occupancy in Aliceville
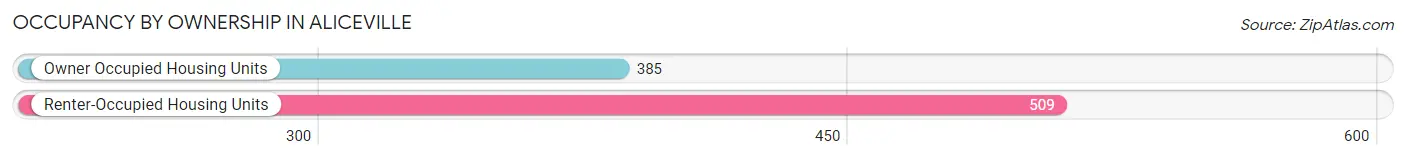
Occupancy by Ownership in Aliceville
Of the total 894 dwellings in Aliceville, owner-occupied units account for 385 (43.1%), while renter-occupied units make up 509 (56.9%).
| Occupancy | # Housing Units | % Housing Units |
| Owner Occupied Housing Units | 385 | 43.1% |
| Renter-Occupied Housing Units | 509 | 56.9% |
| Total Occupied Housing Units | 894 | 100.0% |
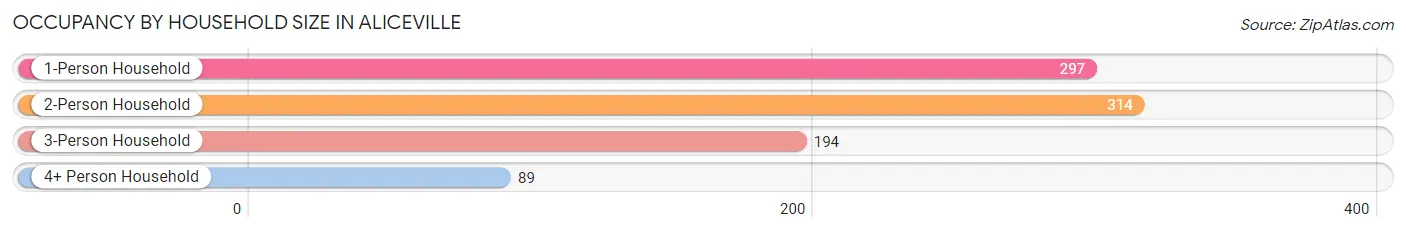
Occupancy by Household Size in Aliceville
| Household Size | # Housing Units | % Housing Units |
| 1-Person Household | 297 | 33.2% |
| 2-Person Household | 314 | 35.1% |
| 3-Person Household | 194 | 21.7% |
| 4+ Person Household | 89 | 10.0% |
| Total Housing Units | 894 | 100.0% |
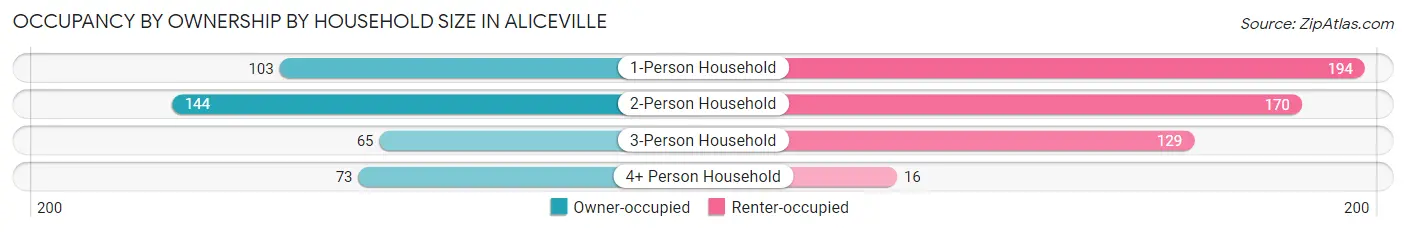
Occupancy by Ownership by Household Size in Aliceville
| Household Size | Owner-occupied | Renter-occupied |
| 1-Person Household | 103 (34.7%) | 194 (65.3%) |
| 2-Person Household | 144 (45.9%) | 170 (54.1%) |
| 3-Person Household | 65 (33.5%) | 129 (66.5%) |
| 4+ Person Household | 73 (82.0%) | 16 (18.0%) |
| Total Housing Units | 385 (43.1%) | 509 (56.9%) |
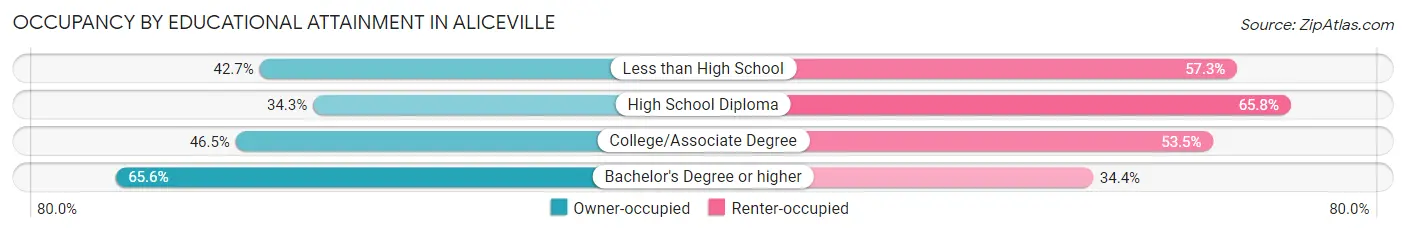
Occupancy by Educational Attainment in Aliceville
| Household Size | Owner-occupied | Renter-occupied |
| Less than High School | 50 (42.7%) | 67 (57.3%) |
| High School Diploma | 125 (34.3%) | 240 (65.7%) |
| College/Associate Degree | 147 (46.5%) | 169 (53.5%) |
| Bachelor's Degree or higher | 63 (65.6%) | 33 (34.4%) |
Occupancy by Age of Householder in Aliceville
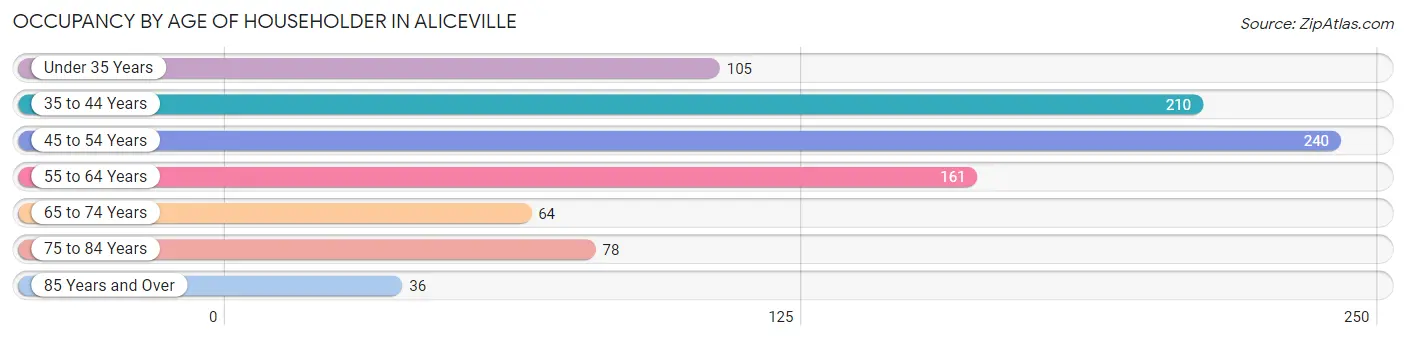
| Age Bracket | # Households | % Households |
| Under 35 Years | 105 | 11.7% |
| 35 to 44 Years | 210 | 23.5% |
| 45 to 54 Years | 240 | 26.9% |
| 55 to 64 Years | 161 | 18.0% |
| 65 to 74 Years | 64 | 7.2% |
| 75 to 84 Years | 78 | 8.7% |
| 85 Years and Over | 36 | 4.0% |
| Total | 894 | 100.0% |
Housing Finances in Aliceville
Median Income by Occupancy in Aliceville
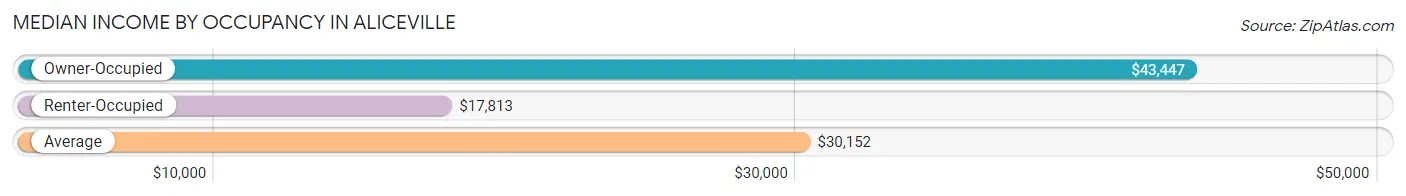
| Occupancy Type | # Households | Median Income |
| Owner-Occupied | 385 (43.1%) | $43,447 |
| Renter-Occupied | 509 (56.9%) | $17,813 |
| Average | 894 (100.0%) | $30,152 |
Occupancy by Householder Income Bracket in Aliceville
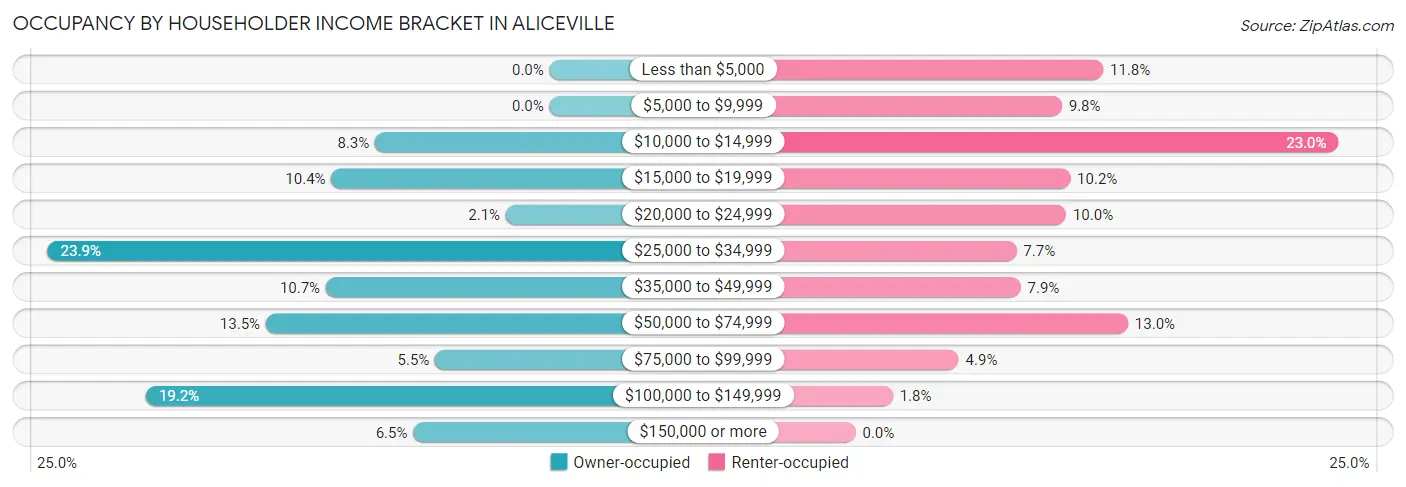
| Income Bracket | Owner-occupied | Renter-occupied |
| Less than $5,000 | 0 (0.0%) | 60 (11.8%) |
| $5,000 to $9,999 | 0 (0.0%) | 50 (9.8%) |
| $10,000 to $14,999 | 32 (8.3%) | 117 (23.0%) |
| $15,000 to $19,999 | 40 (10.4%) | 52 (10.2%) |
| $20,000 to $24,999 | 8 (2.1%) | 51 (10.0%) |
| $25,000 to $34,999 | 92 (23.9%) | 39 (7.7%) |
| $35,000 to $49,999 | 41 (10.6%) | 40 (7.9%) |
| $50,000 to $74,999 | 52 (13.5%) | 66 (13.0%) |
| $75,000 to $99,999 | 21 (5.4%) | 25 (4.9%) |
| $100,000 to $149,999 | 74 (19.2%) | 9 (1.8%) |
| $150,000 or more | 25 (6.5%) | 0 (0.0%) |
| Total | 385 (100.0%) | 509 (100.0%) |
Monthly Housing Cost Tiers in Aliceville
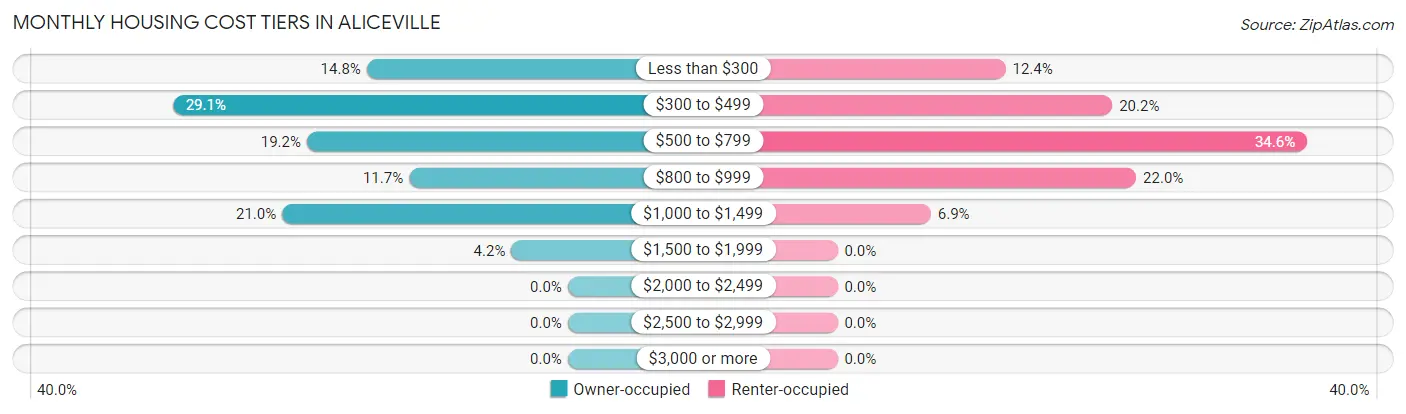
| Monthly Cost | Owner-occupied | Renter-occupied |
| Less than $300 | 57 (14.8%) | 63 (12.4%) |
| $300 to $499 | 112 (29.1%) | 103 (20.2%) |
| $500 to $799 | 74 (19.2%) | 176 (34.6%) |
| $800 to $999 | 45 (11.7%) | 112 (22.0%) |
| $1,000 to $1,499 | 81 (21.0%) | 35 (6.9%) |
| $1,500 to $1,999 | 16 (4.2%) | 0 (0.0%) |
| $2,000 to $2,499 | 0 (0.0%) | 0 (0.0%) |
| $2,500 to $2,999 | 0 (0.0%) | 0 (0.0%) |
| $3,000 or more | 0 (0.0%) | 0 (0.0%) |
| Total | 385 (100.0%) | 509 (100.0%) |
Physical Housing Characteristics in Aliceville
Housing Structures in Aliceville
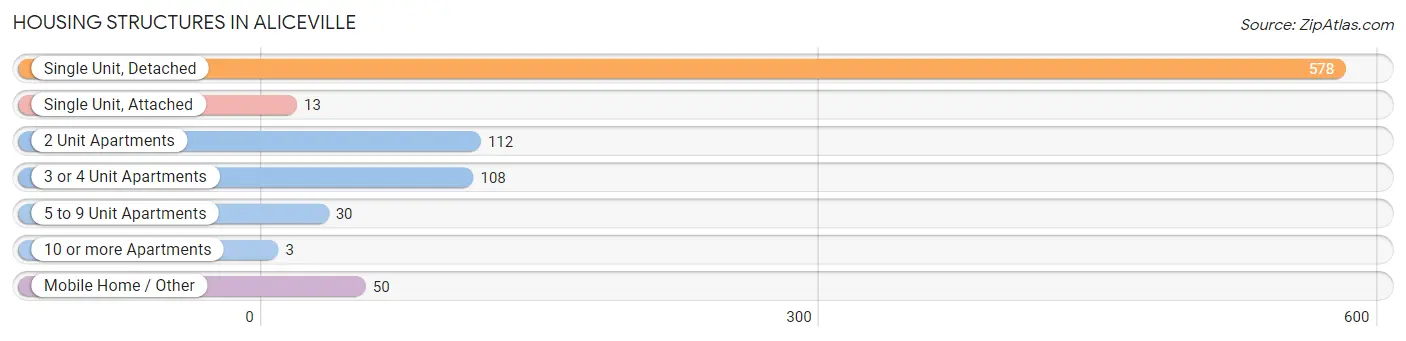
| Structure Type | # Housing Units | % Housing Units |
| Single Unit, Detached | 578 | 64.6% |
| Single Unit, Attached | 13 | 1.5% |
| 2 Unit Apartments | 112 | 12.5% |
| 3 or 4 Unit Apartments | 108 | 12.1% |
| 5 to 9 Unit Apartments | 30 | 3.4% |
| 10 or more Apartments | 3 | 0.3% |
| Mobile Home / Other | 50 | 5.6% |
| Total | 894 | 100.0% |
Housing Structures by Occupancy in Aliceville
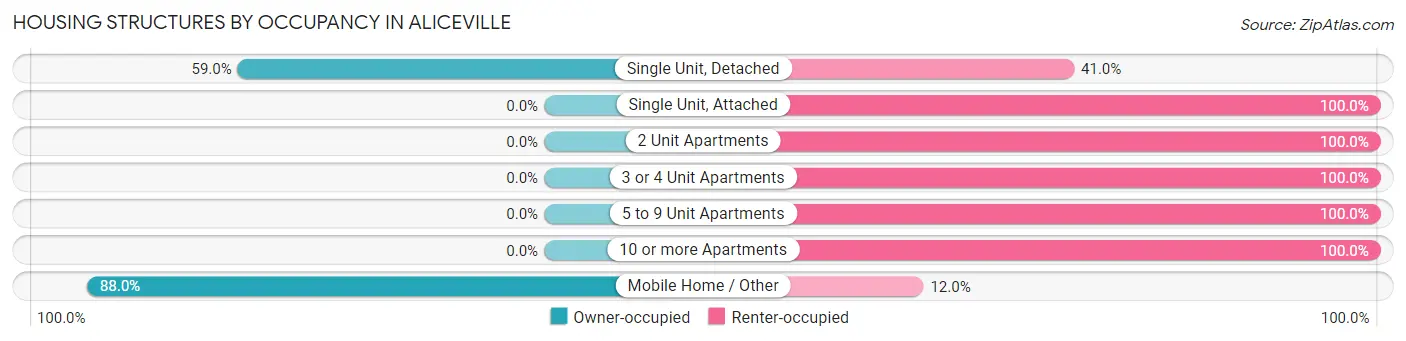
| Structure Type | Owner-occupied | Renter-occupied |
| Single Unit, Detached | 341 (59.0%) | 237 (41.0%) |
| Single Unit, Attached | 0 (0.0%) | 13 (100.0%) |
| 2 Unit Apartments | 0 (0.0%) | 112 (100.0%) |
| 3 or 4 Unit Apartments | 0 (0.0%) | 108 (100.0%) |
| 5 to 9 Unit Apartments | 0 (0.0%) | 30 (100.0%) |
| 10 or more Apartments | 0 (0.0%) | 3 (100.0%) |
| Mobile Home / Other | 44 (88.0%) | 6 (12.0%) |
| Total | 385 (43.1%) | 509 (56.9%) |
Housing Structures by Number of Rooms in Aliceville
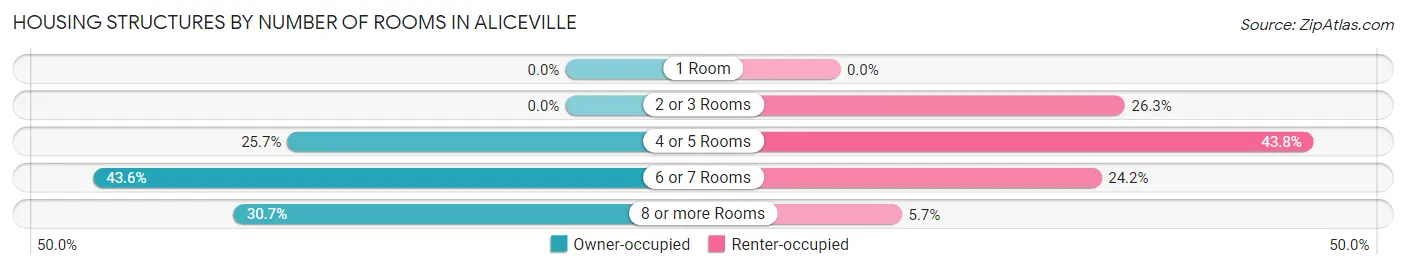
| Number of Rooms | Owner-occupied | Renter-occupied |
| 1 Room | 0 (0.0%) | 0 (0.0%) |
| 2 or 3 Rooms | 0 (0.0%) | 134 (26.3%) |
| 4 or 5 Rooms | 99 (25.7%) | 223 (43.8%) |
| 6 or 7 Rooms | 168 (43.6%) | 123 (24.2%) |
| 8 or more Rooms | 118 (30.6%) | 29 (5.7%) |
| Total | 385 (100.0%) | 509 (100.0%) |
Housing Structure by Heating Type in Aliceville
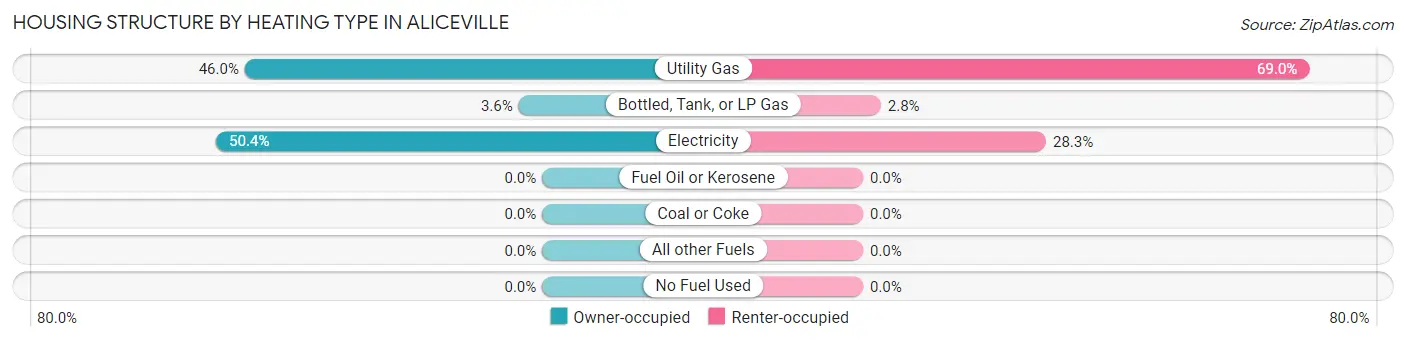
| Heating Type | Owner-occupied | Renter-occupied |
| Utility Gas | 177 (46.0%) | 351 (69.0%) |
| Bottled, Tank, or LP Gas | 14 (3.6%) | 14 (2.8%) |
| Electricity | 194 (50.4%) | 144 (28.3%) |
| Fuel Oil or Kerosene | 0 (0.0%) | 0 (0.0%) |
| Coal or Coke | 0 (0.0%) | 0 (0.0%) |
| All other Fuels | 0 (0.0%) | 0 (0.0%) |
| No Fuel Used | 0 (0.0%) | 0 (0.0%) |
| Total | 385 (100.0%) | 509 (100.0%) |
Household Vehicle Usage in Aliceville
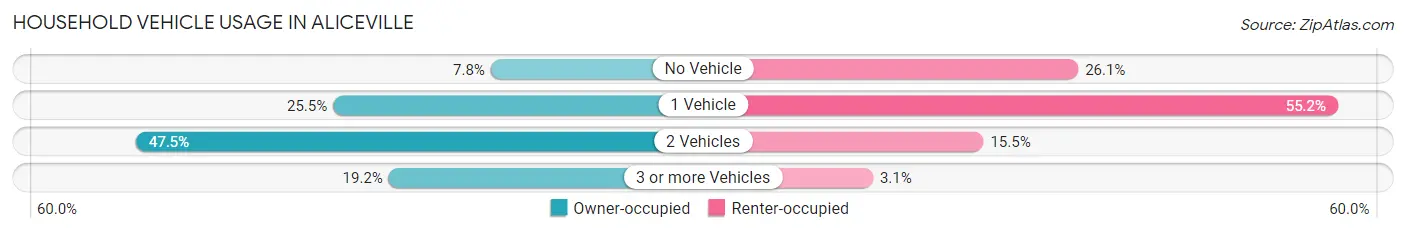
| Vehicles per Household | Owner-occupied | Renter-occupied |
| No Vehicle | 30 (7.8%) | 133 (26.1%) |
| 1 Vehicle | 98 (25.5%) | 281 (55.2%) |
| 2 Vehicles | 183 (47.5%) | 79 (15.5%) |
| 3 or more Vehicles | 74 (19.2%) | 16 (3.1%) |
| Total | 385 (100.0%) | 509 (100.0%) |
Real Estate & Mortgages in Aliceville
Real Estate and Mortgage Overview in Aliceville
| Characteristic | Without Mortgage | With Mortgage |
| Housing Units | 218 | 167 |
| Median Property Value | $90,400 | $126,700 |
| Median Household Income | $34,865 | $3 |
| Monthly Housing Costs | $347 | $0 |
| Real Estate Taxes | $274 | $36 |
Property Value by Mortgage Status in Aliceville
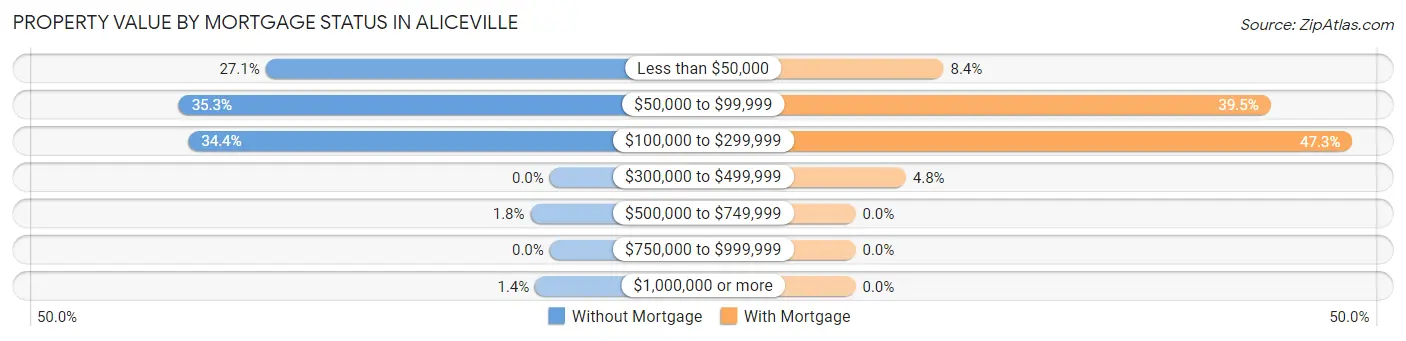
| Property Value | Without Mortgage | With Mortgage |
| Less than $50,000 | 59 (27.1%) | 14 (8.4%) |
| $50,000 to $99,999 | 77 (35.3%) | 66 (39.5%) |
| $100,000 to $299,999 | 75 (34.4%) | 79 (47.3%) |
| $300,000 to $499,999 | 0 (0.0%) | 8 (4.8%) |
| $500,000 to $749,999 | 4 (1.8%) | 0 (0.0%) |
| $750,000 to $999,999 | 0 (0.0%) | 0 (0.0%) |
| $1,000,000 or more | 3 (1.4%) | 0 (0.0%) |
| Total | 218 (100.0%) | 167 (100.0%) |
Household Income by Mortgage Status in Aliceville
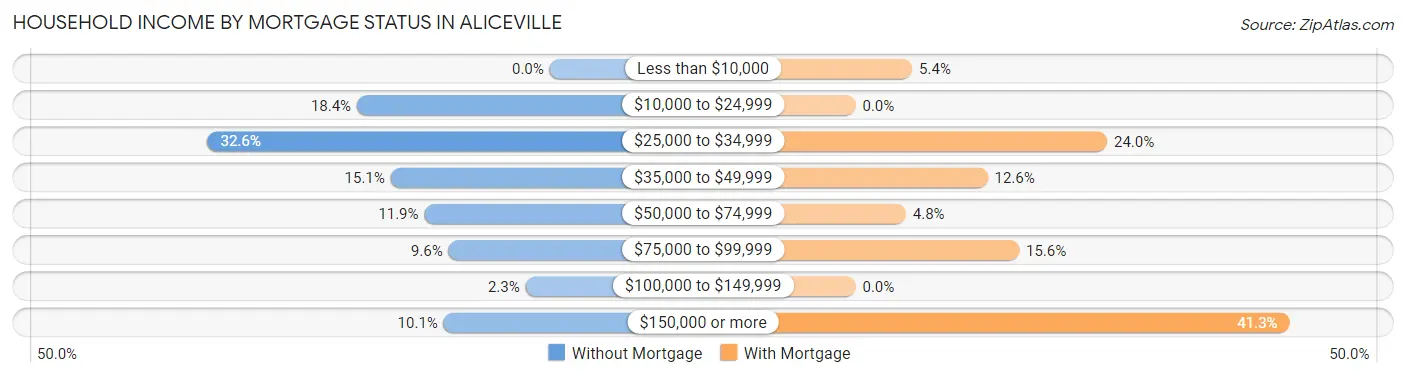
| Household Income | Without Mortgage | With Mortgage |
| Less than $10,000 | 0 (0.0%) | 9 (5.4%) |
| $10,000 to $24,999 | 40 (18.3%) | 0 (0.0%) |
| $25,000 to $34,999 | 71 (32.6%) | 40 (23.9%) |
| $35,000 to $49,999 | 33 (15.1%) | 21 (12.6%) |
| $50,000 to $74,999 | 26 (11.9%) | 8 (4.8%) |
| $75,000 to $99,999 | 21 (9.6%) | 26 (15.6%) |
| $100,000 to $149,999 | 5 (2.3%) | 0 (0.0%) |
| $150,000 or more | 22 (10.1%) | 69 (41.3%) |
| Total | 218 (100.0%) | 167 (100.0%) |
Property Value to Household Income Ratio in Aliceville
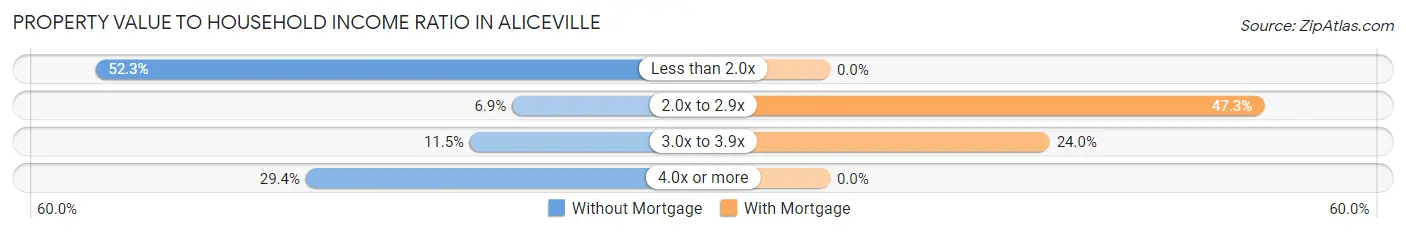
| Value-to-Income Ratio | Without Mortgage | With Mortgage |
| Less than 2.0x | 114 (52.3%) | 0 (0.0%) |
| 2.0x to 2.9x | 15 (6.9%) | 79 (47.3%) |
| 3.0x to 3.9x | 25 (11.5%) | 40 (23.9%) |
| 4.0x or more | 64 (29.4%) | 0 (0.0%) |
| Total | 218 (100.0%) | 167 (100.0%) |
Real Estate Taxes by Mortgage Status in Aliceville
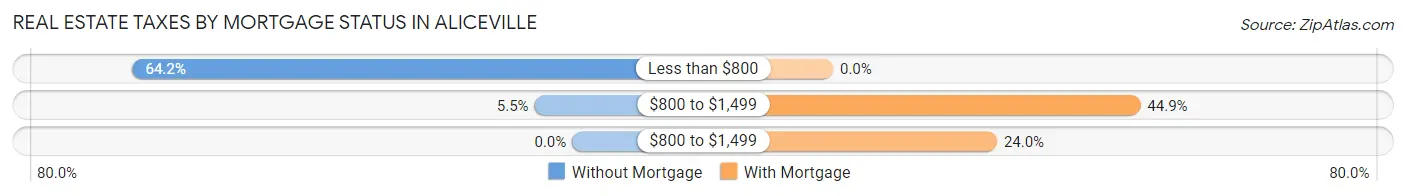
| Property Taxes | Without Mortgage | With Mortgage |
| Less than $800 | 140 (64.2%) | 0 (0.0%) |
| $800 to $1,499 | 12 (5.5%) | 75 (44.9%) |
| $800 to $1,499 | 0 (0.0%) | 40 (23.9%) |
| Total | 218 (100.0%) | 167 (100.0%) |
Health & Disability in Aliceville
Health Insurance Coverage by Age in Aliceville
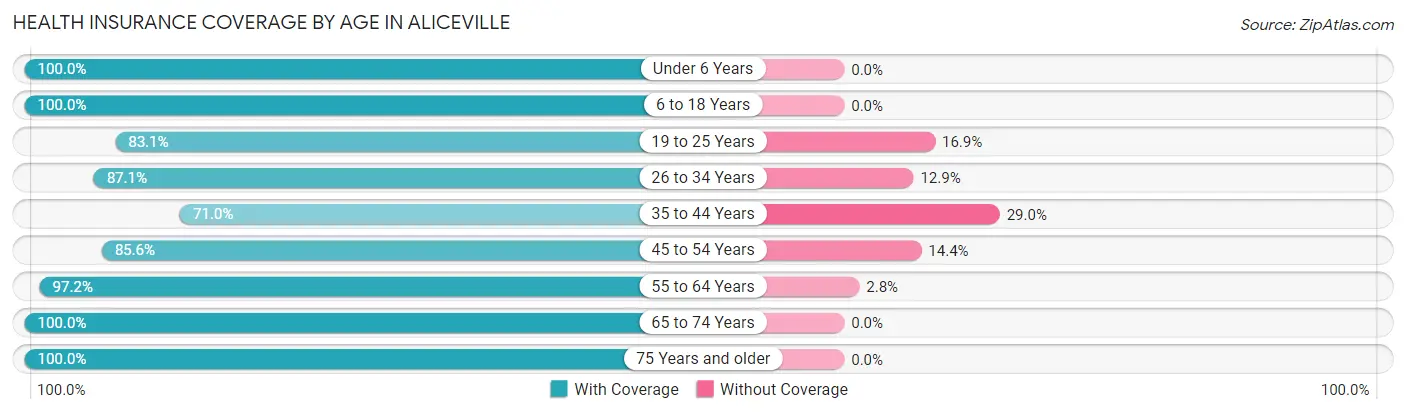
| Age Bracket | With Coverage | Without Coverage |
| Under 6 Years | 204 (100.0%) | 0 (0.0%) |
| 6 to 18 Years | 470 (100.0%) | 0 (0.0%) |
| 19 to 25 Years | 216 (83.1%) | 44 (16.9%) |
| 26 to 34 Years | 216 (87.1%) | 32 (12.9%) |
| 35 to 44 Years | 196 (71.0%) | 80 (29.0%) |
| 45 to 54 Years | 262 (85.6%) | 44 (14.4%) |
| 55 to 64 Years | 277 (97.2%) | 8 (2.8%) |
| 65 to 74 Years | 114 (100.0%) | 0 (0.0%) |
| 75 Years and older | 162 (100.0%) | 0 (0.0%) |
| Total | 2,117 (91.0%) | 208 (8.9%) |
Health Insurance Coverage by Citizenship Status in Aliceville
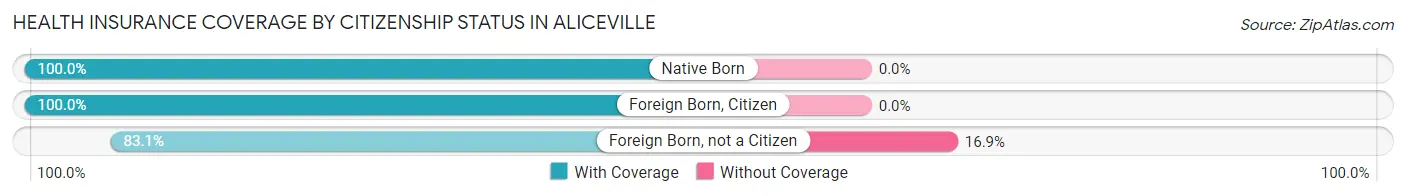
| Citizenship Status | With Coverage | Without Coverage |
| Native Born | 204 (100.0%) | 0 (0.0%) |
| Foreign Born, Citizen | 470 (100.0%) | 0 (0.0%) |
| Foreign Born, not a Citizen | 216 (83.1%) | 44 (16.9%) |
Health Insurance Coverage by Household Income in Aliceville
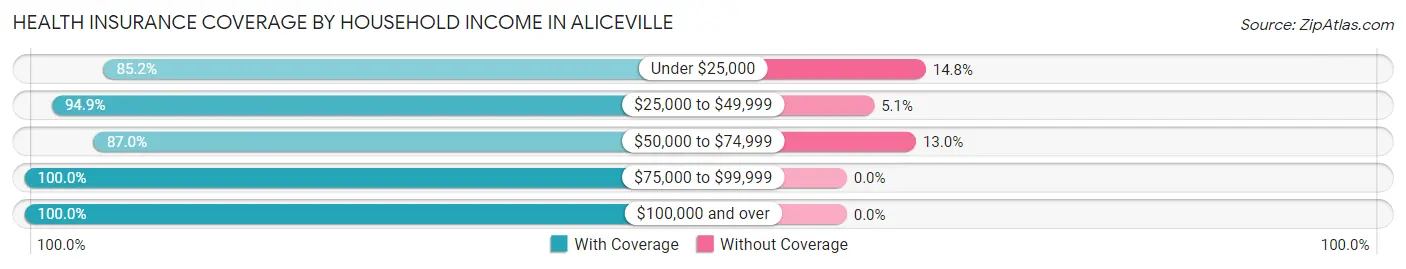
| Household Income | With Coverage | Without Coverage |
| Under $25,000 | 800 (85.2%) | 139 (14.8%) |
| $25,000 to $49,999 | 480 (94.9%) | 26 (5.1%) |
| $50,000 to $74,999 | 235 (87.0%) | 35 (13.0%) |
| $75,000 to $99,999 | 46 (100.0%) | 0 (0.0%) |
| $100,000 and over | 482 (100.0%) | 0 (0.0%) |
Public vs Private Health Insurance Coverage by Age in Aliceville
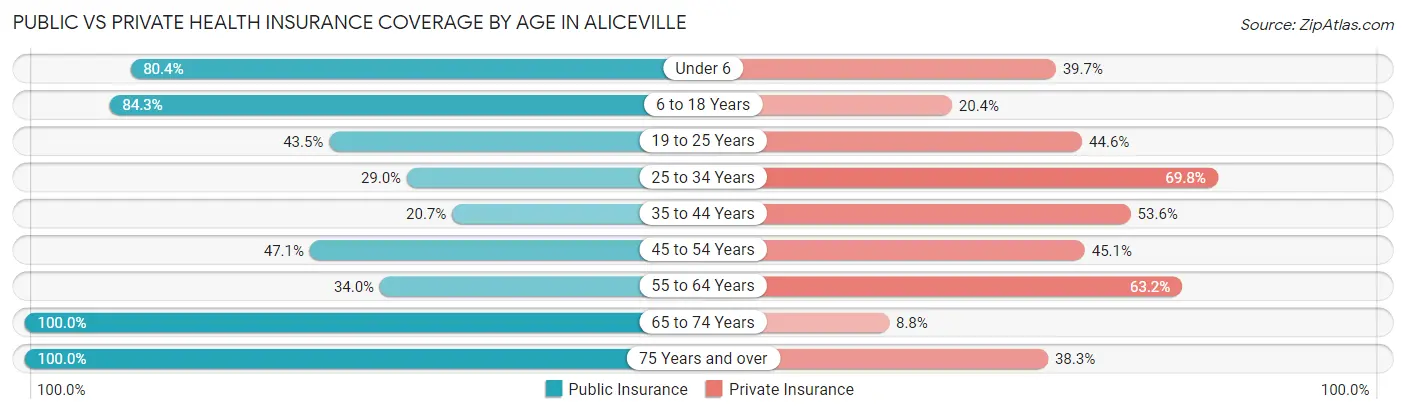
| Age Bracket | Public Insurance | Private Insurance |
| Under 6 | 164 (80.4%) | 81 (39.7%) |
| 6 to 18 Years | 396 (84.3%) | 96 (20.4%) |
| 19 to 25 Years | 113 (43.5%) | 116 (44.6%) |
| 25 to 34 Years | 72 (29.0%) | 173 (69.8%) |
| 35 to 44 Years | 57 (20.6%) | 148 (53.6%) |
| 45 to 54 Years | 144 (47.1%) | 138 (45.1%) |
| 55 to 64 Years | 97 (34.0%) | 180 (63.2%) |
| 65 to 74 Years | 114 (100.0%) | 10 (8.8%) |
| 75 Years and over | 162 (100.0%) | 62 (38.3%) |
| Total | 1,319 (56.7%) | 1,004 (43.2%) |
Disability Status by Sex by Age in Aliceville
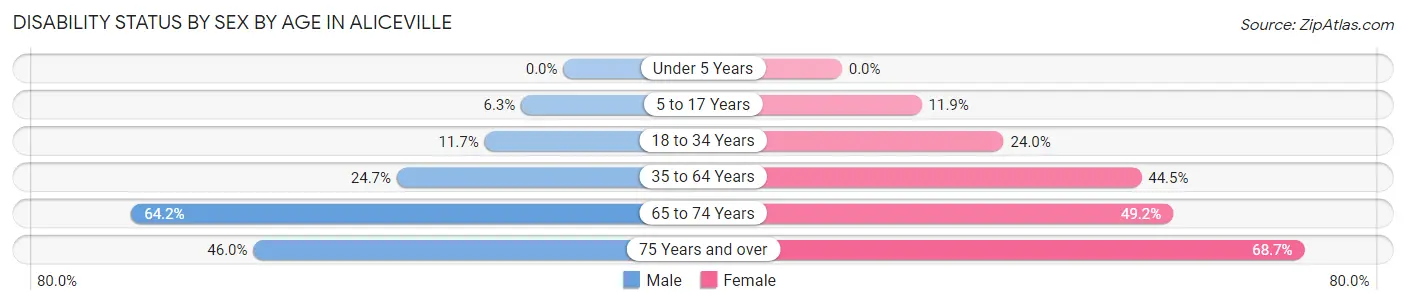
| Age Bracket | Male | Female |
| Under 5 Years | 0 (0.0%) | 0 (0.0%) |
| 5 to 17 Years | 17 (6.3%) | 25 (11.8%) |
| 18 to 34 Years | 31 (11.7%) | 62 (24.0%) |
| 35 to 64 Years | 87 (24.7%) | 229 (44.5%) |
| 65 to 74 Years | 34 (64.1%) | 30 (49.2%) |
| 75 Years and over | 29 (46.0%) | 68 (68.7%) |
Disability Class by Sex by Age in Aliceville
Disability Class: Hearing Difficulty
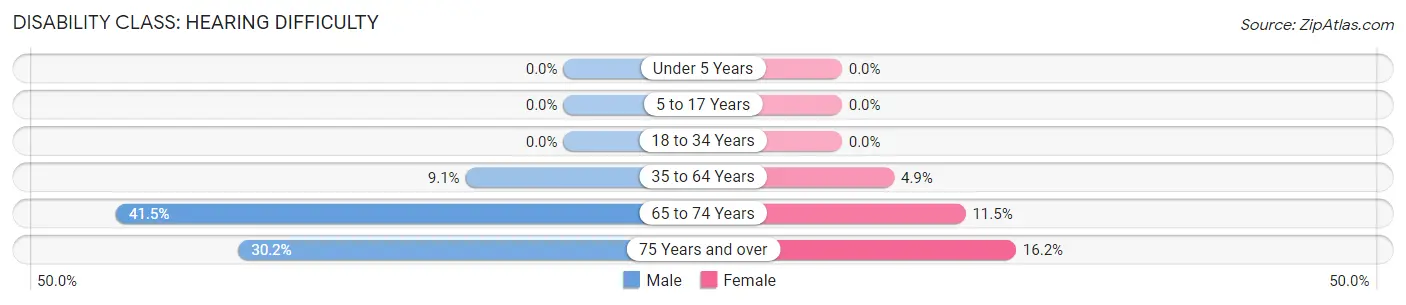
| Age Bracket | Male | Female |
| Under 5 Years | 0 (0.0%) | 0 (0.0%) |
| 5 to 17 Years | 0 (0.0%) | 0 (0.0%) |
| 18 to 34 Years | 0 (0.0%) | 0 (0.0%) |
| 35 to 64 Years | 32 (9.1%) | 25 (4.9%) |
| 65 to 74 Years | 22 (41.5%) | 7 (11.5%) |
| 75 Years and over | 19 (30.2%) | 16 (16.2%) |
Disability Class: Vision Difficulty
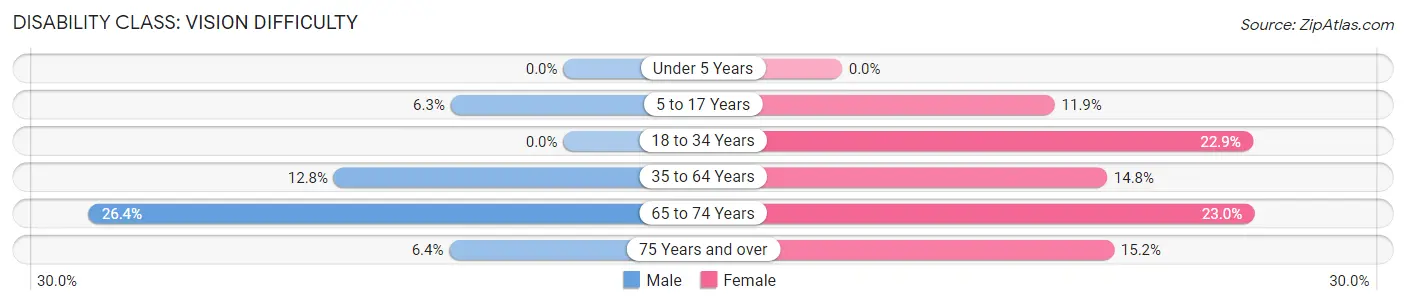
| Age Bracket | Male | Female |
| Under 5 Years | 0 (0.0%) | 0 (0.0%) |
| 5 to 17 Years | 17 (6.3%) | 25 (11.8%) |
| 18 to 34 Years | 0 (0.0%) | 59 (22.9%) |
| 35 to 64 Years | 45 (12.8%) | 76 (14.8%) |
| 65 to 74 Years | 14 (26.4%) | 14 (23.0%) |
| 75 Years and over | 4 (6.4%) | 15 (15.1%) |
Disability Class: Cognitive Difficulty
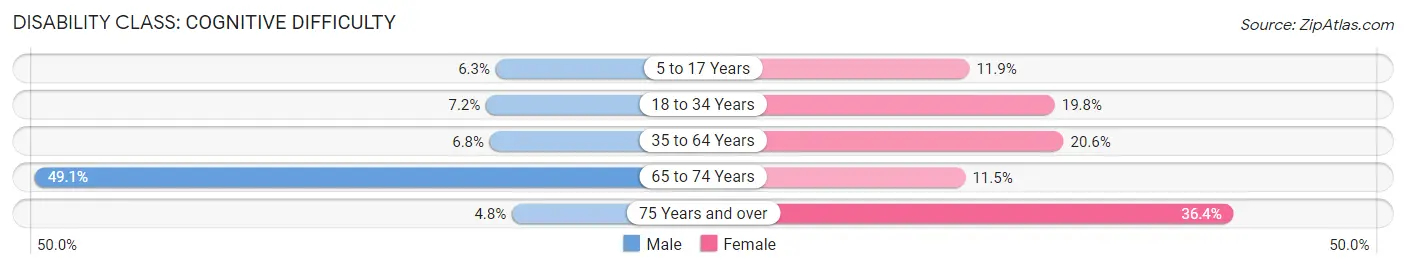
| Age Bracket | Male | Female |
| 5 to 17 Years | 17 (6.3%) | 25 (11.8%) |
| 18 to 34 Years | 19 (7.2%) | 51 (19.8%) |
| 35 to 64 Years | 24 (6.8%) | 106 (20.6%) |
| 65 to 74 Years | 26 (49.1%) | 7 (11.5%) |
| 75 Years and over | 3 (4.8%) | 36 (36.4%) |
Disability Class: Ambulatory Difficulty
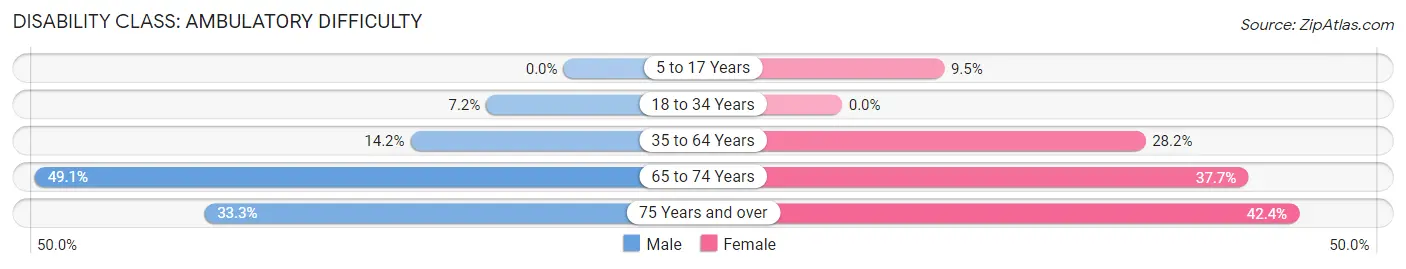
| Age Bracket | Male | Female |
| 5 to 17 Years | 0 (0.0%) | 20 (9.5%) |
| 18 to 34 Years | 19 (7.2%) | 0 (0.0%) |
| 35 to 64 Years | 50 (14.2%) | 145 (28.2%) |
| 65 to 74 Years | 26 (49.1%) | 23 (37.7%) |
| 75 Years and over | 21 (33.3%) | 42 (42.4%) |
Disability Class: Self-Care Difficulty
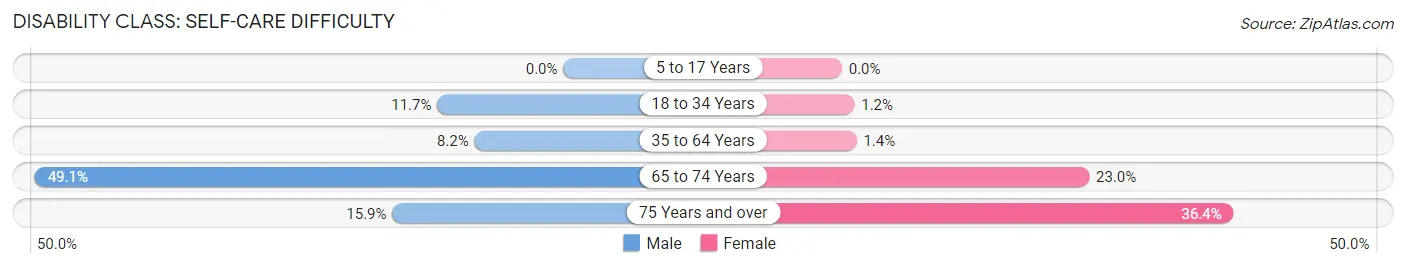
| Age Bracket | Male | Female |
| 5 to 17 Years | 0 (0.0%) | 0 (0.0%) |
| 18 to 34 Years | 31 (11.7%) | 3 (1.2%) |
| 35 to 64 Years | 29 (8.2%) | 7 (1.4%) |
| 65 to 74 Years | 26 (49.1%) | 14 (23.0%) |
| 75 Years and over | 10 (15.9%) | 36 (36.4%) |
Technology Access in Aliceville
Computing Device Access in Aliceville
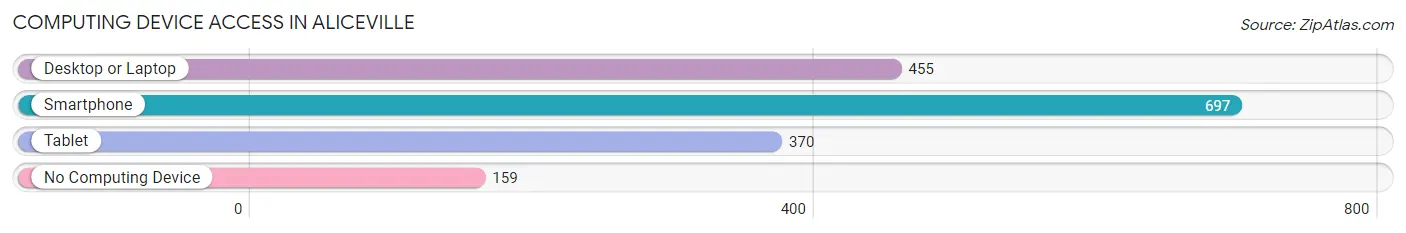
| Device Type | # Households | % Households |
| Desktop or Laptop | 455 | 50.9% |
| Smartphone | 697 | 78.0% |
| Tablet | 370 | 41.4% |
| No Computing Device | 159 | 17.8% |
| Total | 894 | 100.0% |
Internet Access in Aliceville
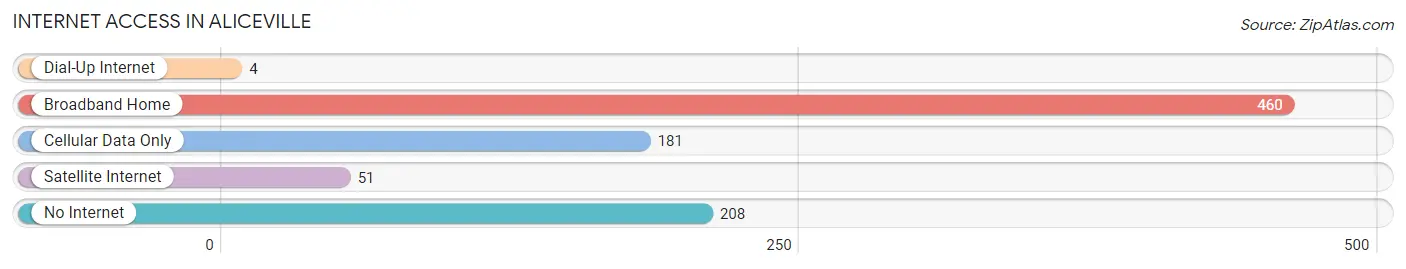
| Internet Type | # Households | % Households |
| Dial-Up Internet | 4 | 0.4% |
| Broadband Home | 460 | 51.4% |
| Cellular Data Only | 181 | 20.3% |
| Satellite Internet | 51 | 5.7% |
| No Internet | 208 | 23.3% |
| Total | 894 | 100.0% |
Aliceville Summary
Aliceville is a small town located in Pickens County, Alabama. It is situated on the banks of the Tombigbee River, about 25 miles northwest of Tuscaloosa. The town was founded in 1887 and named after the daughter of the first postmaster, Alice. The population of Aliceville was 2,486 at the 2010 census.
Geography
Aliceville is located at 33°14'25" North, 88°14'25" West (33.240278, -88.240278). According to the United States Census Bureau, the town has a total area of 4.2 square miles, all land.
Aliceville is located in the Black Belt region of Alabama, an area known for its rich soil and agricultural production. The town is situated on the banks of the Tombigbee River, which provides a source of recreation for the town's residents.
Economy
Aliceville's economy is largely based on agriculture. The town is home to several farms, including the Aliceville Cotton Gin, which has been in operation since the late 1800s. The town is also home to several small businesses, including a grocery store, a hardware store, and a restaurant.
Aliceville is also home to a number of manufacturing companies, including a paper mill, a furniture factory, and a plastics plant. The town is also home to a number of government offices, including the Pickens County Courthouse and the Aliceville Post Office.
Demographics
As of the 2010 census, Aliceville had a population of 2,486. The racial makeup of the town was 57.3% White, 40.2% African American, 0.2% Native American, 0.3% Asian, 0.1% Pacific Islander, 0.7% from other races, and 1.4% from two or more races. Hispanic or Latino of any race were 1.7% of the population.
The median income for a household in Aliceville was $30,938, and the median income for a family was $37,917. The per capita income for the town was $15,945. About 22.2% of families and 25.2% of the population were below the poverty line, including 36.2% of those under age 18 and 16.2% of those age 65 or over.
Aliceville is served by the Pickens County School District, which includes Aliceville Elementary School, Aliceville Middle School, and Aliceville High School. The town is also home to a branch of the University of West Alabama.
Aliceville is served by the Aliceville Public Library, which is part of the Pickens County Library System. The library offers a variety of services, including books, magazines, newspapers, and internet access. The library also hosts a number of events, including story time for children and book clubs for adults.
Aliceville is home to a number of churches, including the First Baptist Church, the First United Methodist Church, and the Church of God. The town is also home to a number of civic organizations, including the Aliceville Lions Club and the Aliceville Rotary Club.
Aliceville is served by the Aliceville Municipal Airport, which is located just outside of town. The airport offers a variety of services, including charter flights, air taxi services, and aircraft maintenance. The airport is also home to a number of aviation-related businesses, including a flight school and a helicopter tour company.
Common Questions
What is Per Capita Income in Aliceville?
Per Capita income in Aliceville is $18,406.
What is the Median Family Income in Aliceville?
Median Family Income in Aliceville is $30,750.
What is the Median Household income in Aliceville?
Median Household Income in Aliceville is $30,152.
What is Income or Wage Gap in Aliceville?
Income or Wage Gap in Aliceville is 36.9%.
Women in Aliceville earn 63.1 cents for every dollar earned by a man.
What is Family Income Deficit in Aliceville?
Family Income Deficit in Aliceville is $11,611.
Families that are below poverty line in Aliceville earn $11,611 less on average than the poverty threshold level.
What is Inequality or Gini Index in Aliceville?
Inequality or Gini Index in Aliceville is 0.49.
What is the Total Population of Aliceville?
Total Population of Aliceville is 2,325.
What is the Total Male Population of Aliceville?
Total Male Population of Aliceville is 1,060.
What is the Total Female Population of Aliceville?
Total Female Population of Aliceville is 1,265.
What is the Ratio of Males per 100 Females in Aliceville?
There are 83.79 Males per 100 Females in Aliceville.
What is the Ratio of Females per 100 Males in Aliceville?
There are 119.34 Females per 100 Males in Aliceville.
What is the Median Population Age in Aliceville?
Median Population Age in Aliceville is 34.7 Years.
What is the Average Family Size in Aliceville
Average Family Size in Aliceville is 3.2 People.
What is the Average Household Size in Aliceville
Average Household Size in Aliceville is 2.5 People.
How Large is the Labor Force in Aliceville?
There are 942 People in the Labor Forcein in Aliceville.
What is the Percentage of People in the Labor Force in Aliceville?
54.3% of People are in the Labor Force in Aliceville.
What is the Unemployment Rate in Aliceville?
Unemployment Rate in Aliceville is 15.7%.