Weston, WV Map & Demographics
Weston Map
Weston Overview
$28,388
PER CAPITA INCOME
$57,670
AVG FAMILY INCOME
$44,955
AVG HOUSEHOLD INCOME
14.3%
WAGE / INCOME GAP [ % ]
85.7¢/ $1
WAGE / INCOME GAP [ $ ]
0.47
INEQUALITY / GINI INDEX
3,922
TOTAL POPULATION
2,031
MALE POPULATION
1,891
FEMALE POPULATION
107.40
MALES / 100 FEMALES
93.11
FEMALES / 100 MALES
40.7
MEDIAN AGE
3.0
AVG FAMILY SIZE
2.4
AVG HOUSEHOLD SIZE
1,806
LABOR FORCE [ PEOPLE ]
55.7%
PERCENT IN LABOR FORCE
12.9%
UNEMPLOYMENT RATE
Weston Zip Codes
Income in Weston
Income Overview in Weston
Per Capita Income in Weston is $28,388, while median incomes of families and households are $57,670 and $44,955 respectively.
| Characteristic | Number | Measure |
| Per Capita Income | 3,922 | $28,388 |
| Median Family Income | 921 | $57,670 |
| Mean Family Income | 921 | $70,484 |
| Median Household Income | 1,669 | $44,955 |
| Mean Household Income | 1,669 | $65,880 |
| Income Deficit | 921 | $0 |
| Wage / Income Gap (%) | 3,922 | 14.26% |
| Wage / Income Gap ($) | 3,922 | 85.74¢ per $1 |
| Gini / Inequality Index | 3,922 | 0.47 |
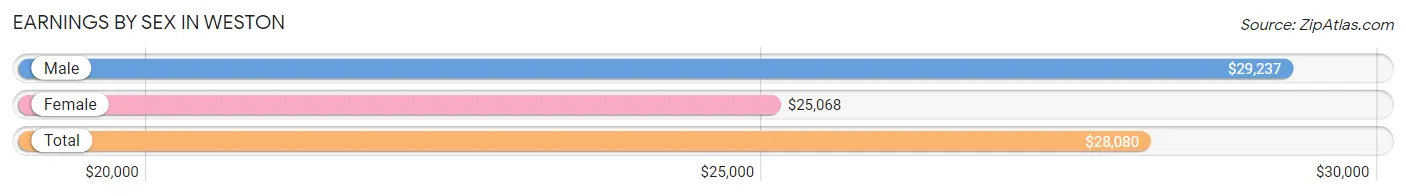
Earnings by Sex in Weston
Average Earnings in Weston are $28,080, $29,237 for men and $25,068 for women, a difference of 14.3%.
| Sex | Number | Average Earnings |
| Male | 1,080 (58.8%) | $29,237 |
| Female | 758 (41.2%) | $25,068 |
| Total | 1,838 (100.0%) | $28,080 |
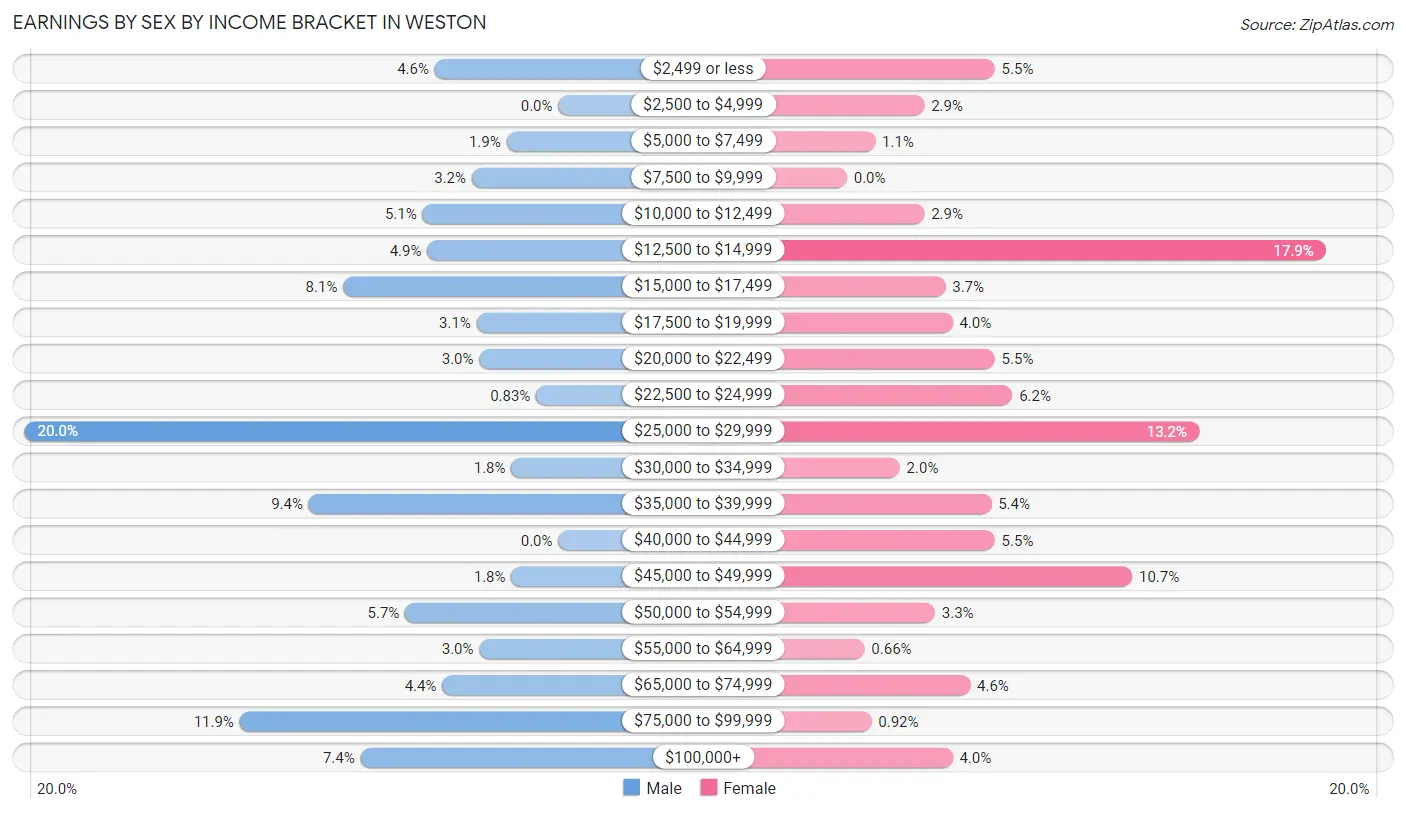
Earnings by Sex by Income Bracket in Weston
The most common earnings brackets in Weston are $25,000 to $29,999 for men (216 | 20.0%) and $12,500 to $14,999 for women (136 | 17.9%).
| Income | Male | Female |
| $2,499 or less | 50 (4.6%) | 42 (5.5%) |
| $2,500 to $4,999 | 0 (0.0%) | 22 (2.9%) |
| $5,000 to $7,499 | 21 (1.9%) | 8 (1.1%) |
| $7,500 to $9,999 | 35 (3.2%) | 0 (0.0%) |
| $10,000 to $12,499 | 55 (5.1%) | 22 (2.9%) |
| $12,500 to $14,999 | 53 (4.9%) | 136 (17.9%) |
| $15,000 to $17,499 | 87 (8.1%) | 28 (3.7%) |
| $17,500 to $19,999 | 33 (3.1%) | 30 (4.0%) |
| $20,000 to $22,499 | 32 (3.0%) | 42 (5.5%) |
| $22,500 to $24,999 | 9 (0.8%) | 47 (6.2%) |
| $25,000 to $29,999 | 216 (20.0%) | 100 (13.2%) |
| $30,000 to $34,999 | 19 (1.8%) | 15 (2.0%) |
| $35,000 to $39,999 | 101 (9.3%) | 41 (5.4%) |
| $40,000 to $44,999 | 0 (0.0%) | 42 (5.5%) |
| $45,000 to $49,999 | 19 (1.8%) | 81 (10.7%) |
| $50,000 to $54,999 | 62 (5.7%) | 25 (3.3%) |
| $55,000 to $64,999 | 32 (3.0%) | 5 (0.7%) |
| $65,000 to $74,999 | 47 (4.3%) | 35 (4.6%) |
| $75,000 to $99,999 | 129 (11.9%) | 7 (0.9%) |
| $100,000+ | 80 (7.4%) | 30 (4.0%) |
| Total | 1,080 (100.0%) | 758 (100.0%) |
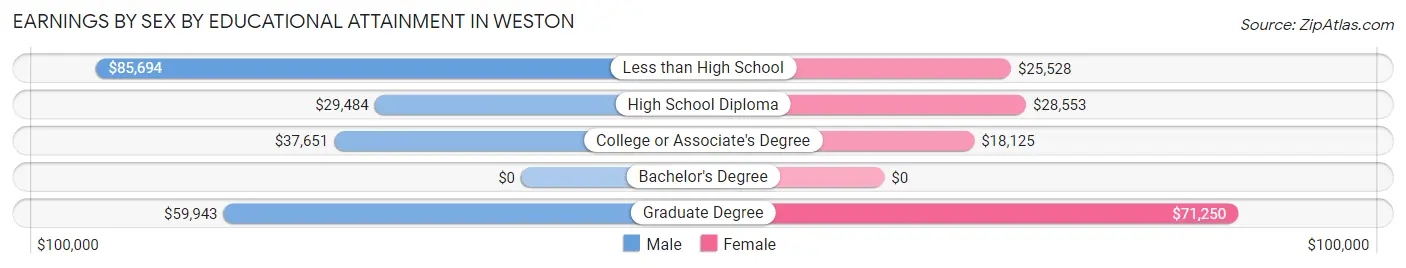
Earnings by Sex by Educational Attainment in Weston
Average earnings in Weston are $36,483 for men and $25,682 for women, a difference of 29.6%. Men with an educational attainment of less than high school enjoy the highest average annual earnings of $85,694, while those with high school diploma education earn the least with $29,484. Women with an educational attainment of graduate degree earn the most with the average annual earnings of $71,250, while those with college or associate's degree education have the smallest earnings of $18,125.
| Educational Attainment | Male Income | Female Income |
| Less than High School | $85,694 | $25,528 |
| High School Diploma | $29,484 | $28,553 |
| College or Associate's Degree | $37,651 | $18,125 |
| Bachelor's Degree | - | - |
| Graduate Degree | $59,943 | $71,250 |
| Total | $36,483 | $25,682 |
Family Income in Weston
Family Income Brackets in Weston
According to the Weston family income data, there are 166 families falling into the $50,000 to $74,999 income range, which is the most common income bracket and makes up 18.0% of all families.
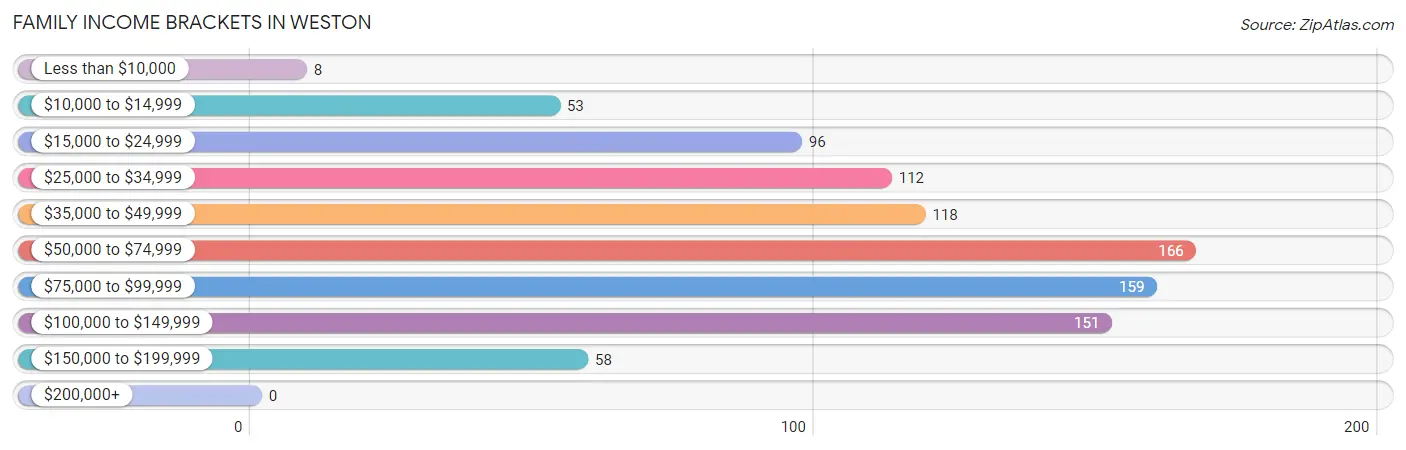
| Income Bracket | # Families | % Families |
| Less than $10,000 | 8 | 0.9% |
| $10,000 to $14,999 | 53 | 5.8% |
| $15,000 to $24,999 | 96 | 10.4% |
| $25,000 to $34,999 | 112 | 12.2% |
| $35,000 to $49,999 | 118 | 12.8% |
| $50,000 to $74,999 | 166 | 18.0% |
| $75,000 to $99,999 | 159 | 17.3% |
| $100,000 to $149,999 | 151 | 16.4% |
| $150,000 to $199,999 | 58 | 6.3% |
| $200,000+ | 0 | 0.0% |
Family Income by Famaliy Size in Weston
2-person families (541 | 58.7%) account for the highest median family income in Weston with $68,843 per family, while 2-person families (541 | 58.7%) have the highest median income of $34,422 per family member.
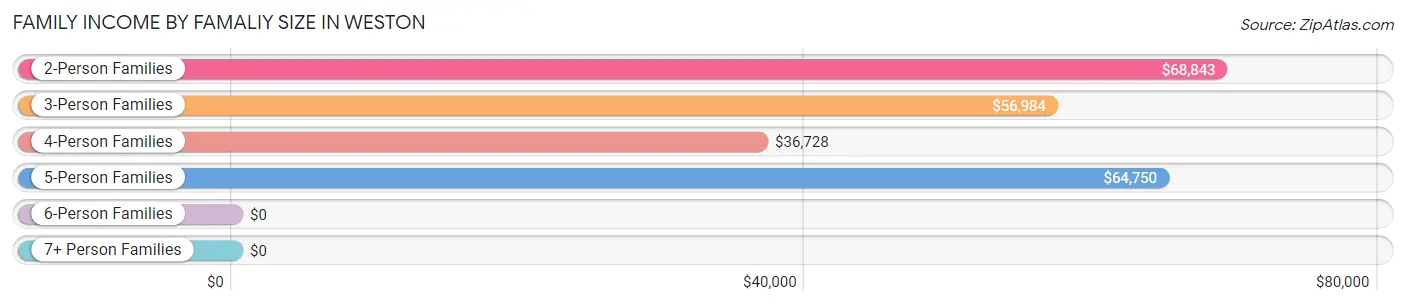
| Income Bracket | # Families | Median Income |
| 2-Person Families | 541 (58.7%) | $68,843 |
| 3-Person Families | 213 (23.1%) | $56,984 |
| 4-Person Families | 87 (9.5%) | $36,728 |
| 5-Person Families | 56 (6.1%) | $64,750 |
| 6-Person Families | 10 (1.1%) | $0 |
| 7+ Person Families | 14 (1.5%) | $0 |
| Total | 921 (100.0%) | $57,670 |
Family Income by Number of Earners in Weston
The median family income in Weston is $57,670, with families comprising 2 earners (315) having the highest median family income of $90,792, while families with no earners (181) have the lowest median family income of $31,488, accounting for 34.2% and 19.7% of families, respectively.
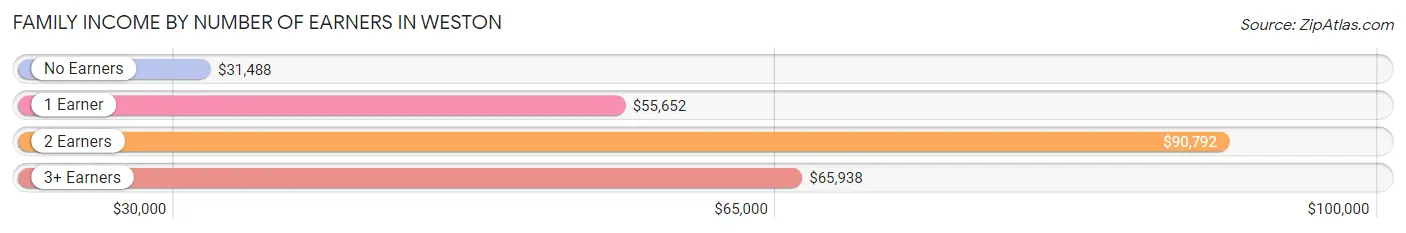
| Number of Earners | # Families | Median Income |
| No Earners | 181 (19.7%) | $31,488 |
| 1 Earner | 366 (39.7%) | $55,652 |
| 2 Earners | 315 (34.2%) | $90,792 |
| 3+ Earners | 59 (6.4%) | $65,938 |
| Total | 921 (100.0%) | $57,670 |
Household Income in Weston
Household Income Brackets in Weston
With 309 households falling in the category, the $15,000 to $24,999 income range is the most frequent in Weston, accounting for 18.5% of all households. In contrast, only 28 households (1.7%) fall into the $200,000+ income bracket, making it the least populous group.
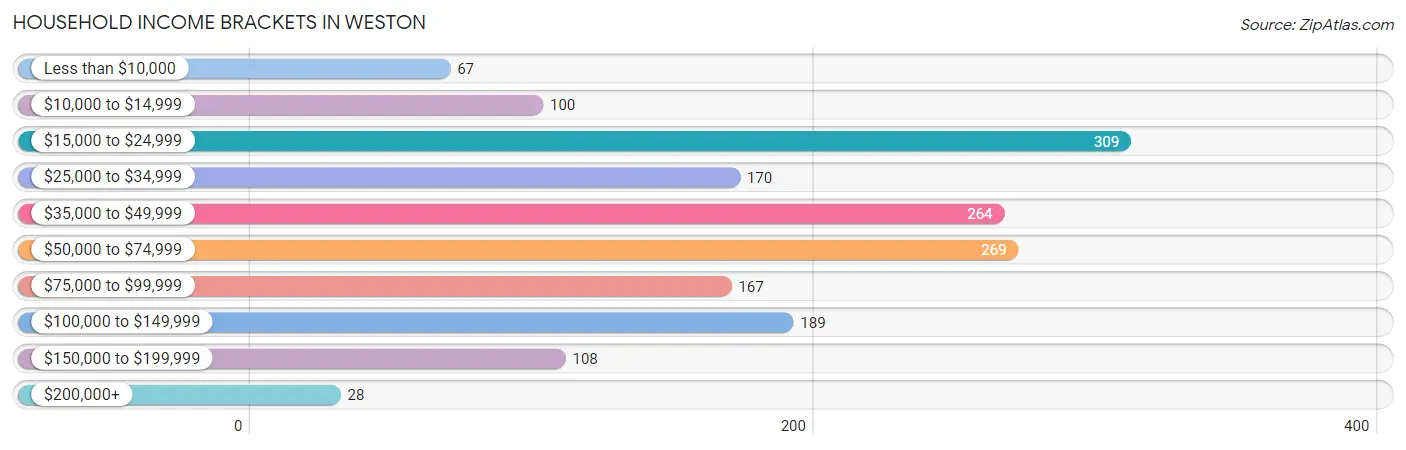
| Income Bracket | # Households | % Households |
| Less than $10,000 | 67 | 4.0% |
| $10,000 to $14,999 | 100 | 6.0% |
| $15,000 to $24,999 | 309 | 18.5% |
| $25,000 to $34,999 | 170 | 10.2% |
| $35,000 to $49,999 | 264 | 15.8% |
| $50,000 to $74,999 | 269 | 16.1% |
| $75,000 to $99,999 | 167 | 10.0% |
| $100,000 to $149,999 | 189 | 11.3% |
| $150,000 to $199,999 | 108 | 6.5% |
| $200,000+ | 28 | 1.7% |
Household Income by Householder Age in Weston
The median household income in Weston is $44,955, with the highest median household income of $48,587 found in the 25 to 44 years age bracket for the primary householder. A total of 542 households (32.5%) fall into this category. Meanwhile, the 15 to 24 years age bracket for the primary householder has the lowest median household income of $0, with 10 households (0.6%) in this group.
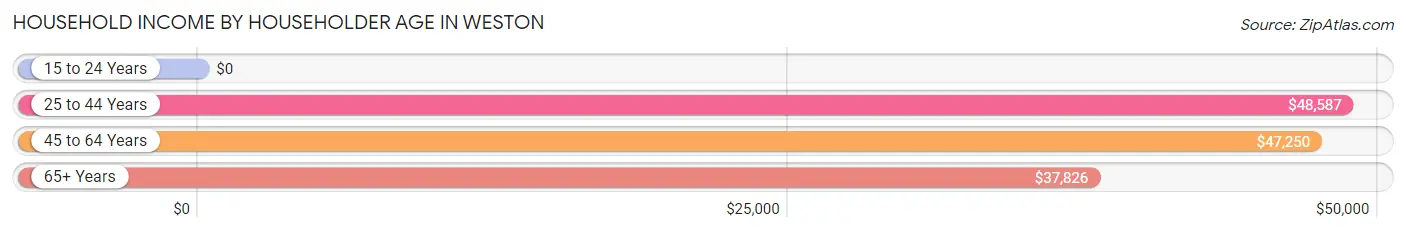
| Income Bracket | # Households | Median Income |
| 15 to 24 Years | 10 (0.6%) | $0 |
| 25 to 44 Years | 542 (32.5%) | $48,587 |
| 45 to 64 Years | 653 (39.1%) | $47,250 |
| 65+ Years | 464 (27.8%) | $37,826 |
| Total | 1,669 (100.0%) | $44,955 |
Poverty in Weston
Income Below Poverty by Sex and Age in Weston
With 9.5% poverty level for males and 20.6% for females among the residents of Weston, under 5 year old males and under 5 year old females are the most vulnerable to poverty, with 34 males (79.1%) and 39 females (60.0%) in their respective age groups living below the poverty level.
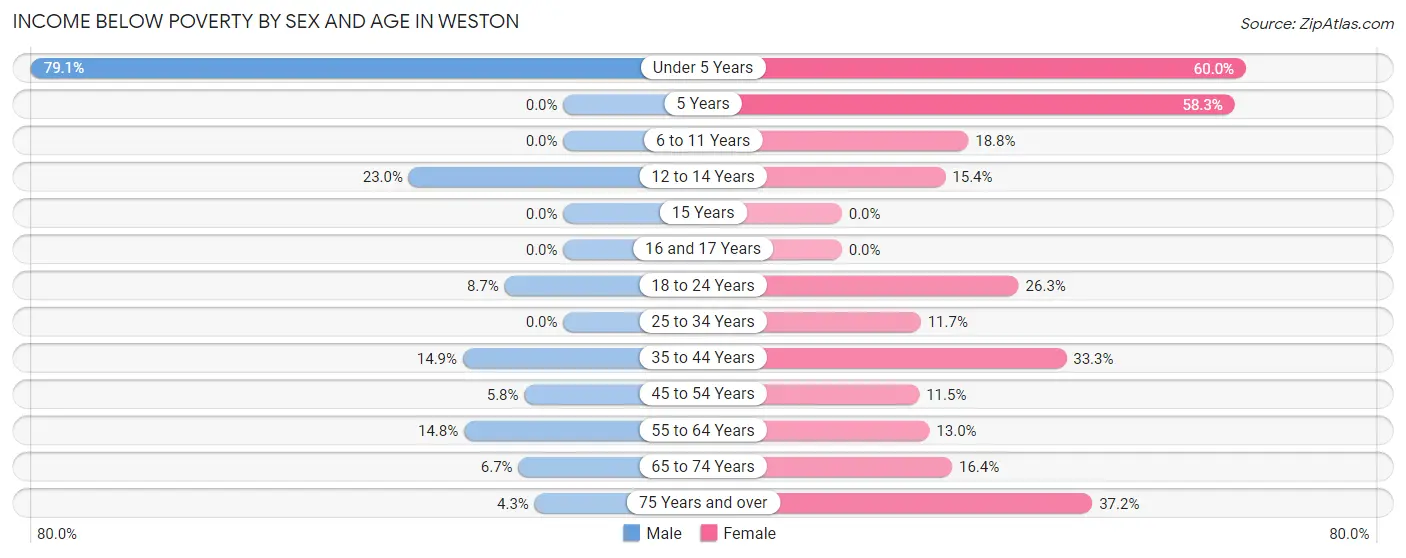
| Age Bracket | Male | Female |
| Under 5 Years | 34 (79.1%) | 39 (60.0%) |
| 5 Years | 0 (0.0%) | 7 (58.3%) |
| 6 to 11 Years | 0 (0.0%) | 28 (18.8%) |
| 12 to 14 Years | 28 (23.0%) | 14 (15.4%) |
| 15 Years | 0 (0.0%) | 0 (0.0%) |
| 16 and 17 Years | 0 (0.0%) | 0 (0.0%) |
| 18 to 24 Years | 20 (8.7%) | 26 (26.3%) |
| 25 to 34 Years | 0 (0.0%) | 30 (11.7%) |
| 35 to 44 Years | 44 (14.9%) | 70 (33.3%) |
| 45 to 54 Years | 14 (5.8%) | 33 (11.5%) |
| 55 to 64 Years | 36 (14.7%) | 38 (13.0%) |
| 65 to 74 Years | 10 (6.7%) | 28 (16.4%) |
| 75 Years and over | 6 (4.3%) | 74 (37.2%) |
| Total | 192 (9.5%) | 387 (20.6%) |
Income Above Poverty by Sex and Age in Weston
According to the poverty statistics in Weston, males aged 5 years and females aged 15 years are the age groups that are most secure financially, with 100.0% of males and 100.0% of females in these age groups living above the poverty line.
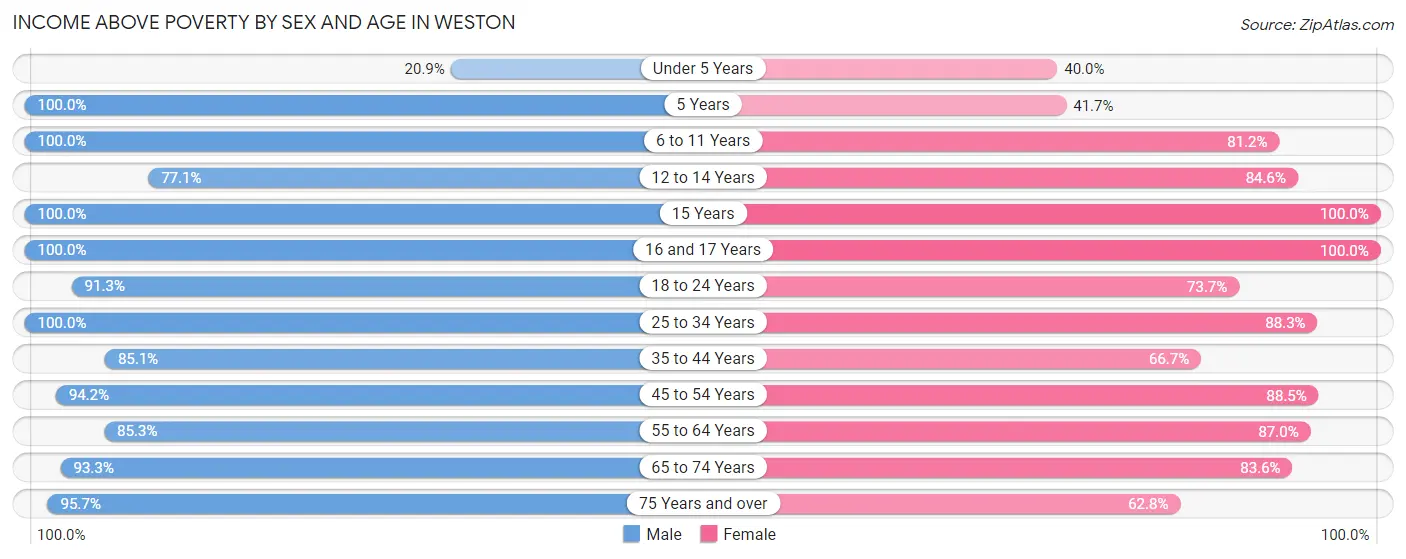
| Age Bracket | Male | Female |
| Under 5 Years | 9 (20.9%) | 26 (40.0%) |
| 5 Years | 29 (100.0%) | 5 (41.7%) |
| 6 to 11 Years | 118 (100.0%) | 121 (81.2%) |
| 12 to 14 Years | 94 (77.0%) | 77 (84.6%) |
| 15 Years | 17 (100.0%) | 6 (100.0%) |
| 16 and 17 Years | 44 (100.0%) | 38 (100.0%) |
| 18 to 24 Years | 209 (91.3%) | 73 (73.7%) |
| 25 to 34 Years | 344 (100.0%) | 226 (88.3%) |
| 35 to 44 Years | 251 (85.1%) | 140 (66.7%) |
| 45 to 54 Years | 228 (94.2%) | 254 (88.5%) |
| 55 to 64 Years | 208 (85.3%) | 254 (87.0%) |
| 65 to 74 Years | 140 (93.3%) | 143 (83.6%) |
| 75 Years and over | 135 (95.7%) | 125 (62.8%) |
| Total | 1,826 (90.5%) | 1,488 (79.4%) |
Income Below Poverty Among Married-Couple Families in Weston
The poverty statistics for married-couple families in Weston show that 3.0% or 18 of the total 595 families live below the poverty line. Families with no children have the highest poverty rate of 3.9%, comprising of 18 families. On the other hand, families with 1 or 2 children have the lowest poverty rate of 0.0%, which includes 0 families.
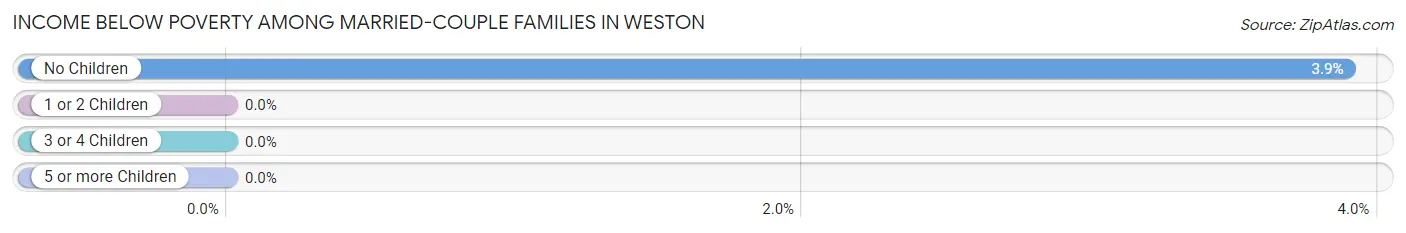
| Children | Above Poverty | Below Poverty |
| No Children | 445 (96.1%) | 18 (3.9%) |
| 1 or 2 Children | 90 (100.0%) | 0 (0.0%) |
| 3 or 4 Children | 42 (100.0%) | 0 (0.0%) |
| 5 or more Children | 0 (0.0%) | 0 (0.0%) |
| Total | 577 (97.0%) | 18 (3.0%) |
Income Below Poverty Among Single-Parent Households in Weston
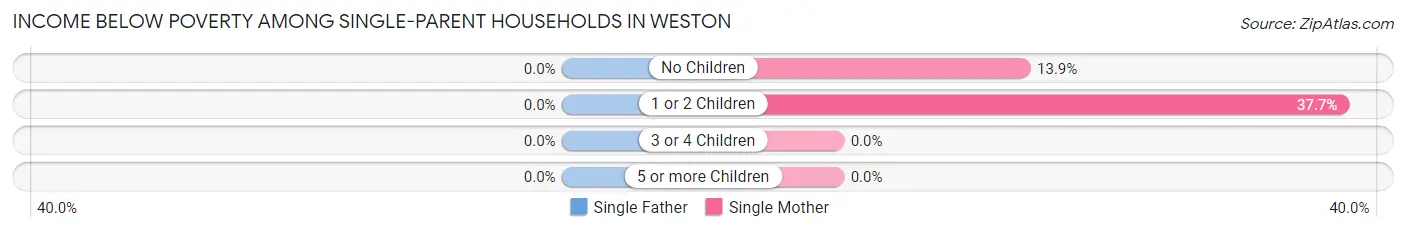
| Children | Single Father | Single Mother |
| No Children | 0 (0.0%) | 5 (13.9%) |
| 1 or 2 Children | 0 (0.0%) | 58 (37.7%) |
| 3 or 4 Children | 0 (0.0%) | 0 (0.0%) |
| 5 or more Children | 0 (0.0%) | 0 (0.0%) |
| Total | 0 (0.0%) | 63 (33.2%) |
Income Below Poverty Among Married-Couple vs Single-Parent Households in Weston
The poverty data for Weston shows that 18 of the married-couple family households (3.0%) and 63 of the single-parent households (19.3%) are living below the poverty level. Within the married-couple family households, those with no children have the highest poverty rate, with 18 households (3.9%) falling below the poverty line. Among the single-parent households, those with 1 or 2 children have the highest poverty rate, with 58 household (25.4%) living below poverty.
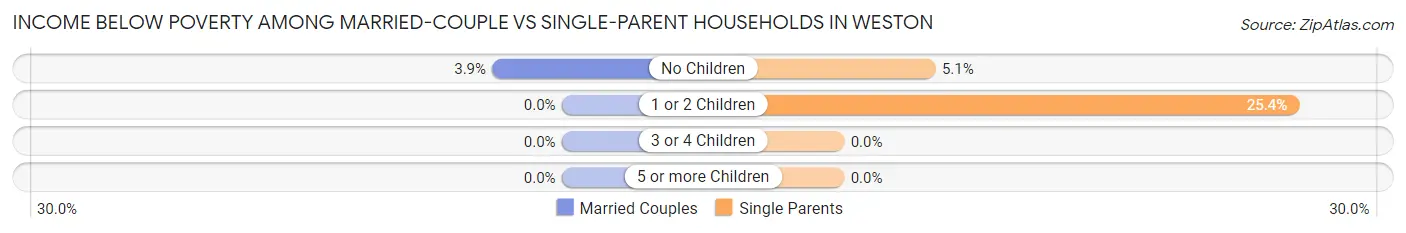
| Children | Married-Couple Families | Single-Parent Households |
| No Children | 18 (3.9%) | 5 (5.1%) |
| 1 or 2 Children | 0 (0.0%) | 58 (25.4%) |
| 3 or 4 Children | 0 (0.0%) | 0 (0.0%) |
| 5 or more Children | 0 (0.0%) | 0 (0.0%) |
| Total | 18 (3.0%) | 63 (19.3%) |
Race in Weston
The most populous races in Weston are White / Caucasian (3,793 | 96.7%), Two or more Races (102 | 2.6%), and Some other Race (17 | 0.4%).
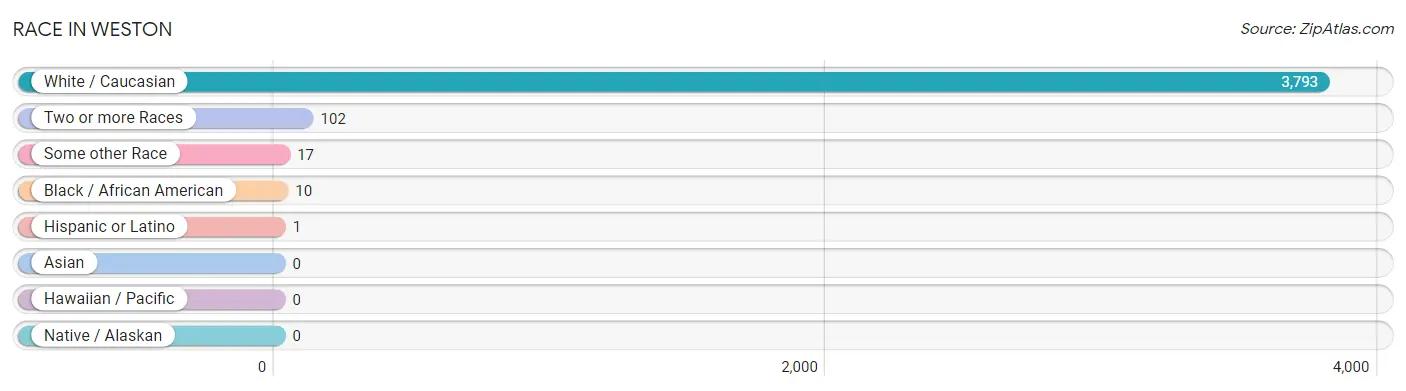
| Race | # Population | % Population |
| Asian | 0 | 0.0% |
| Black / African American | 10 | 0.3% |
| Hawaiian / Pacific | 0 | 0.0% |
| Hispanic or Latino | 1 | 0.0% |
| Native / Alaskan | 0 | 0.0% |
| White / Caucasian | 3,793 | 96.7% |
| Two or more Races | 102 | 2.6% |
| Some other Race | 17 | 0.4% |
| Total | 3,922 | 100.0% |
Ancestry in Weston
The most populous ancestries reported in Weston are Irish (606 | 15.4%), German (587 | 15.0%), American (454 | 11.6%), English (289 | 7.4%), and Italian (240 | 6.1%), together accounting for 55.5% of all Weston residents.
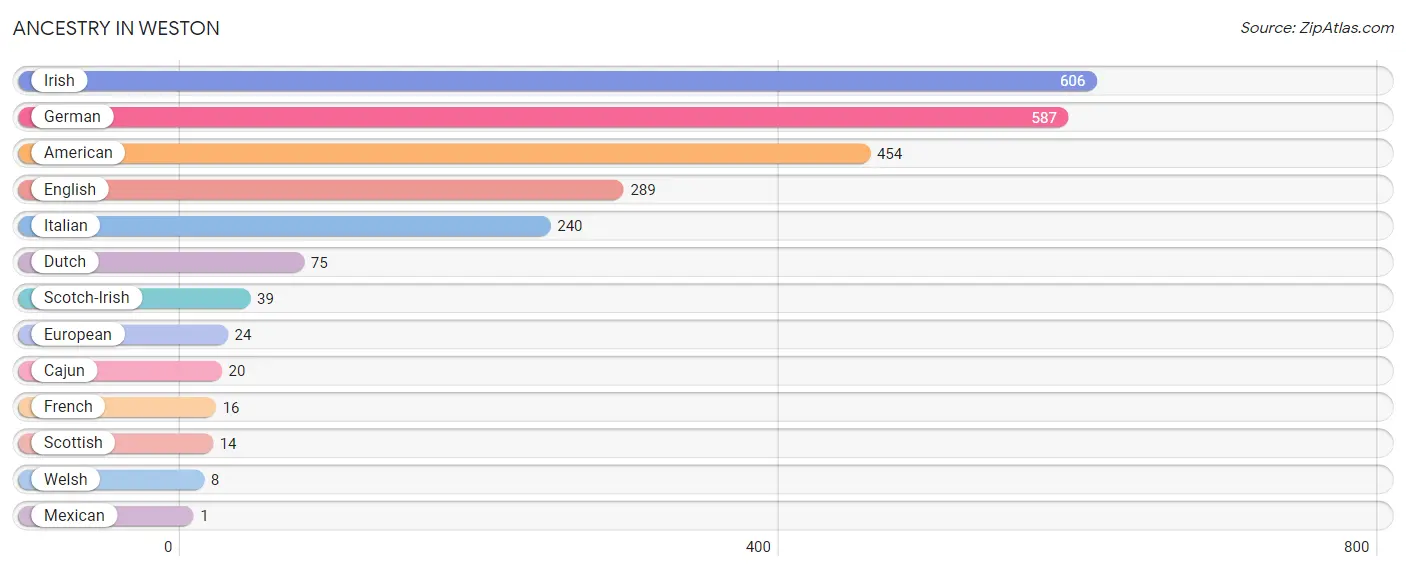
| Ancestry | # Population | % Population |
| American | 454 | 11.6% |
| Cajun | 20 | 0.5% |
| Dutch | 75 | 1.9% |
| English | 289 | 7.4% |
| European | 24 | 0.6% |
| French | 16 | 0.4% |
| German | 587 | 15.0% |
| Irish | 606 | 15.4% |
| Italian | 240 | 6.1% |
| Mexican | 1 | 0.0% |
| Scotch-Irish | 39 | 1.0% |
| Scottish | 14 | 0.4% |
| Welsh | 8 | 0.2% | View All 13 Rows |
Immigrants in Weston
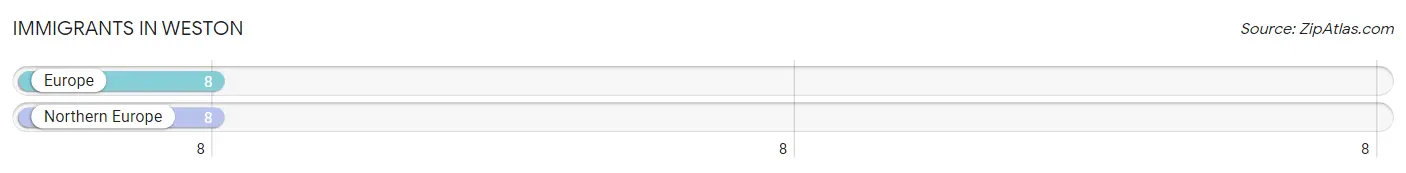
The most numerous immigrant groups reported in Weston came from Europe (8 | 0.2%), and Northern Europe (8 | 0.2%), together accounting for 0.4% of all Weston residents.
| Immigration Origin | # Population | % Population |
| Europe | 8 | 0.2% |
| Northern Europe | 8 | 0.2% | View All 2 Rows |
Sex and Age in Weston
Sex and Age in Weston
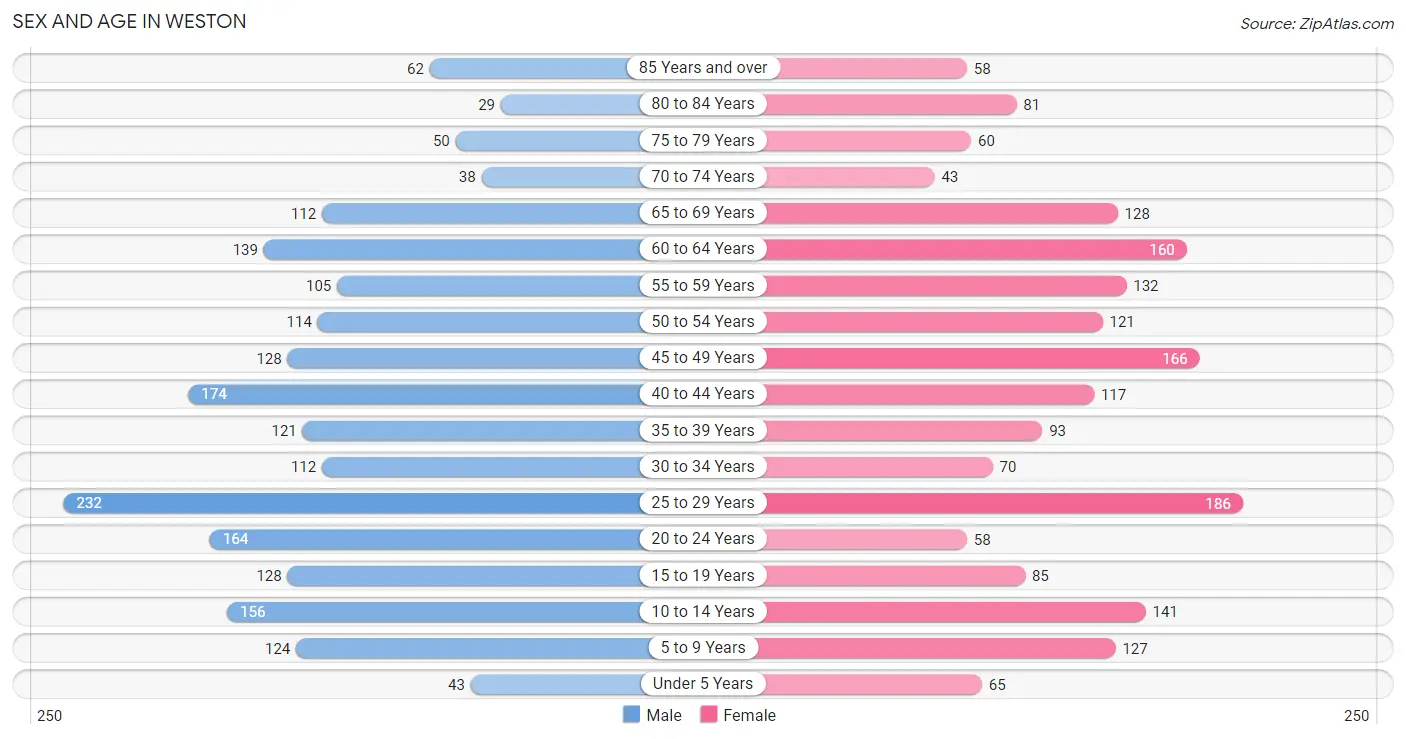
The most populous age groups in Weston are 25 to 29 Years (232 | 11.4%) for men and 25 to 29 Years (186 | 9.8%) for women.
| Age Bracket | Male | Female |
| Under 5 Years | 43 (2.1%) | 65 (3.4%) |
| 5 to 9 Years | 124 (6.1%) | 127 (6.7%) |
| 10 to 14 Years | 156 (7.7%) | 141 (7.5%) |
| 15 to 19 Years | 128 (6.3%) | 85 (4.5%) |
| 20 to 24 Years | 164 (8.1%) | 58 (3.1%) |
| 25 to 29 Years | 232 (11.4%) | 186 (9.8%) |
| 30 to 34 Years | 112 (5.5%) | 70 (3.7%) |
| 35 to 39 Years | 121 (6.0%) | 93 (4.9%) |
| 40 to 44 Years | 174 (8.6%) | 117 (6.2%) |
| 45 to 49 Years | 128 (6.3%) | 166 (8.8%) |
| 50 to 54 Years | 114 (5.6%) | 121 (6.4%) |
| 55 to 59 Years | 105 (5.2%) | 132 (7.0%) |
| 60 to 64 Years | 139 (6.8%) | 160 (8.5%) |
| 65 to 69 Years | 112 (5.5%) | 128 (6.8%) |
| 70 to 74 Years | 38 (1.9%) | 43 (2.3%) |
| 75 to 79 Years | 50 (2.5%) | 60 (3.2%) |
| 80 to 84 Years | 29 (1.4%) | 81 (4.3%) |
| 85 Years and over | 62 (3.0%) | 58 (3.1%) |
| Total | 2,031 (100.0%) | 1,891 (100.0%) |
Families and Households in Weston
Median Family Size in Weston
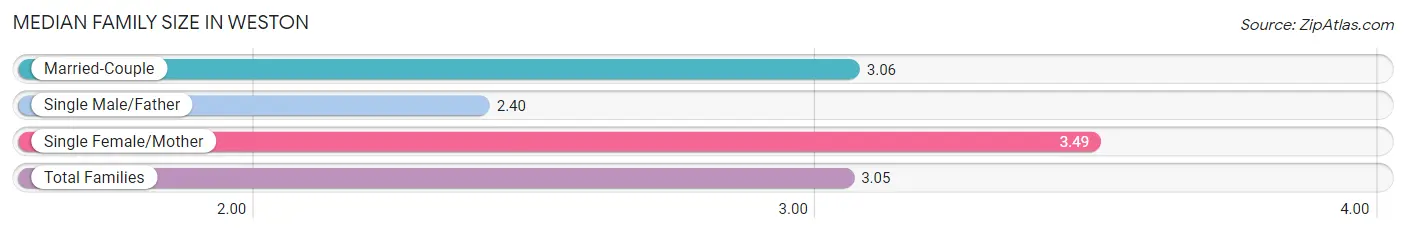
The median family size in Weston is 3.05 persons per family, with single female/mother families (190 | 20.6%) accounting for the largest median family size of 3.49 persons per family. On the other hand, single male/father families (136 | 14.8%) represent the smallest median family size with 2.40 persons per family.
| Family Type | # Families | Family Size |
| Married-Couple | 595 (64.6%) | 3.06 |
| Single Male/Father | 136 (14.8%) | 2.40 |
| Single Female/Mother | 190 (20.6%) | 3.49 |
| Total Families | 921 (100.0%) | 3.05 |
Median Household Size in Weston
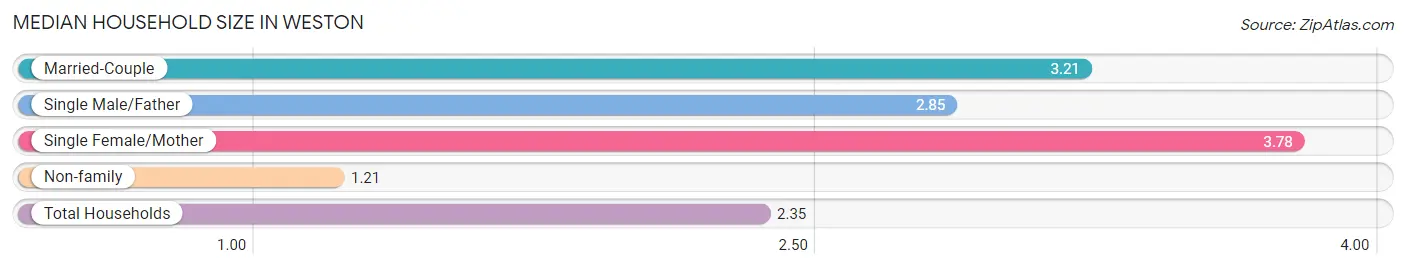
The median household size in Weston is 2.35 persons per household, with single female/mother households (190 | 11.4%) accounting for the largest median household size of 3.78 persons per household. non-family households (748 | 44.8%) represent the smallest median household size with 1.21 persons per household.
| Household Type | # Households | Household Size |
| Married-Couple | 595 (35.6%) | 3.21 |
| Single Male/Father | 136 (8.2%) | 2.85 |
| Single Female/Mother | 190 (11.4%) | 3.78 |
| Non-family | 748 (44.8%) | 1.21 |
| Total Households | 1,669 (100.0%) | 2.35 |
Household Size by Marriage Status in Weston
Out of a total of 1,669 households in Weston, 921 (55.2%) are family households, while 748 (44.8%) are nonfamily households. The most numerous type of family households are 2-person households, comprising 481, and the most common type of nonfamily households are 1-person households, comprising 557.
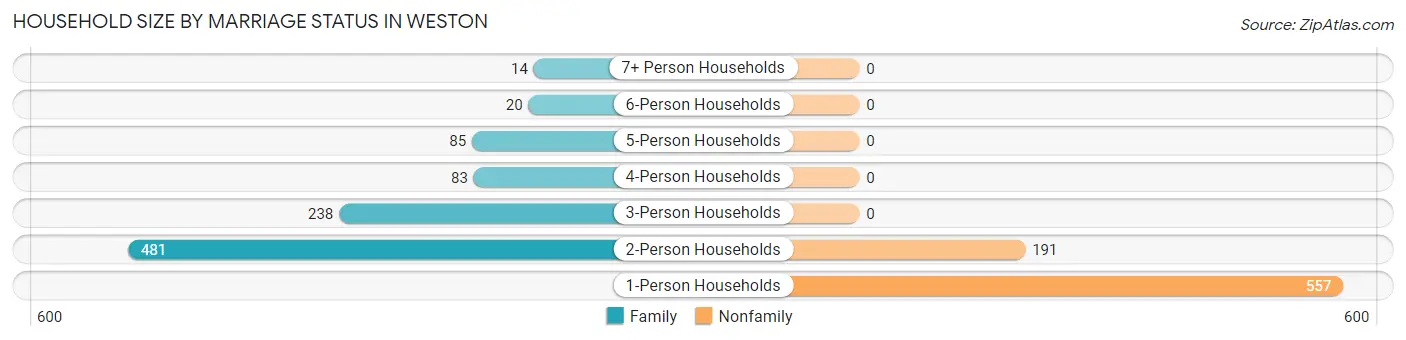
| Household Size | Family Households | Nonfamily Households |
| 1-Person Households | - | 557 (33.4%) |
| 2-Person Households | 481 (28.8%) | 191 (11.4%) |
| 3-Person Households | 238 (14.3%) | 0 (0.0%) |
| 4-Person Households | 83 (5.0%) | 0 (0.0%) |
| 5-Person Households | 85 (5.1%) | 0 (0.0%) |
| 6-Person Households | 20 (1.2%) | 0 (0.0%) |
| 7+ Person Households | 14 (0.8%) | 0 (0.0%) |
| Total | 921 (55.2%) | 748 (44.8%) |
Female Fertility in Weston
Fertility by Age in Weston
Average fertility rate in Weston is 10.0 births per 1,000 women. Women in the age bracket of 20 to 34 years have the highest fertility rate with 25.0 births per 1,000 women. Women in the age bracket of 20 to 34 years acount for 100.0% of all women with births.
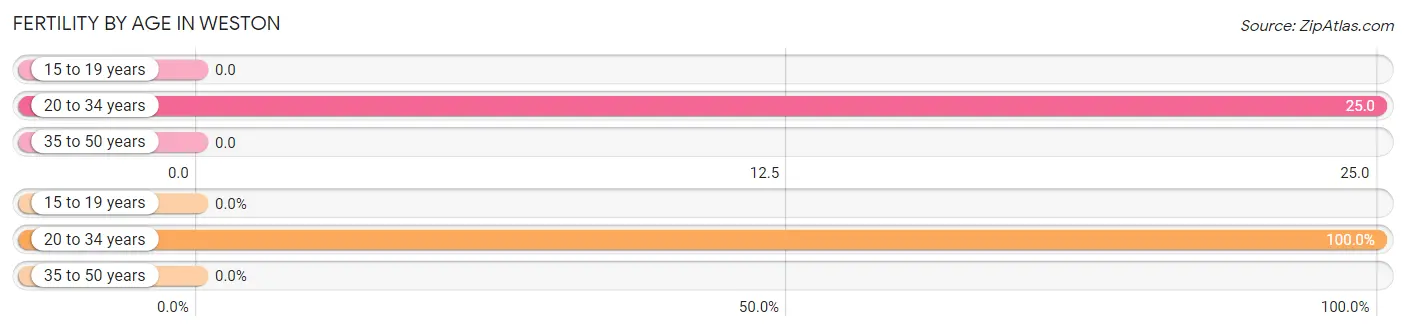
| Age Bracket | Women with Births | Births / 1,000 Women |
| 15 to 19 years | 0 (0.0%) | 0.0 |
| 20 to 34 years | 8 (100.0%) | 25.0 |
| 35 to 50 years | 0 (0.0%) | 0.0 |
| Total | 8 (100.0%) | 10.0 |
Fertility by Age by Marriage Status in Weston
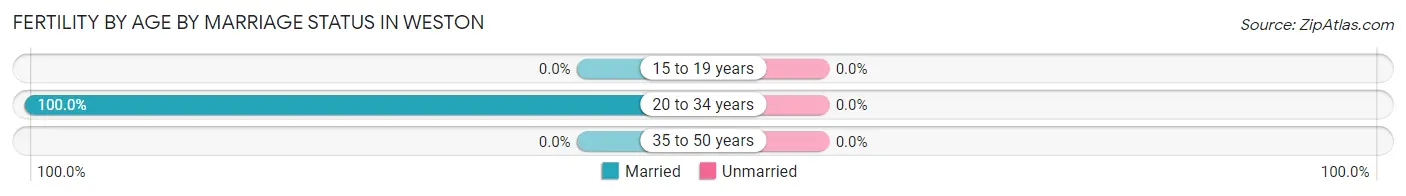
| Age Bracket | Married | Unmarried |
| 15 to 19 years | 0 (0.0%) | 0 (0.0%) |
| 20 to 34 years | 8 (100.0%) | 0 (0.0%) |
| 35 to 50 years | 0 (0.0%) | 0 (0.0%) |
| Total | 8 (100.0%) | 0 (0.0%) |
Fertility by Education in Weston
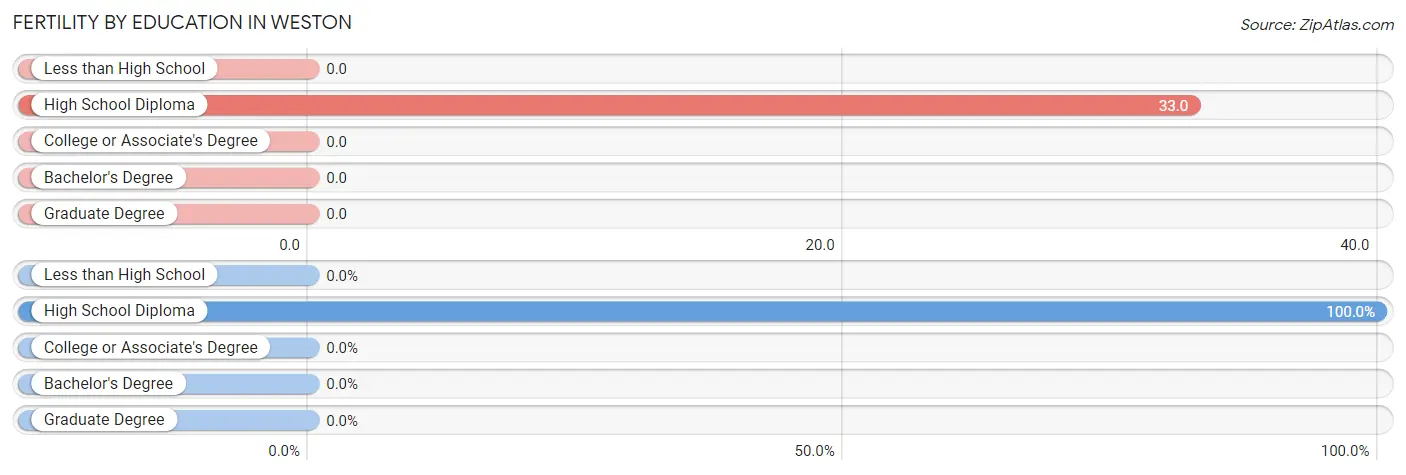
| Educational Attainment | Women with Births | Births / 1,000 Women |
| Less than High School | 0 (0.0%) | 0.0 |
| High School Diploma | 8 (100.0%) | 33.0 |
| College or Associate's Degree | 0 (0.0%) | 0.0 |
| Bachelor's Degree | 0 (0.0%) | 0.0 |
| Graduate Degree | 0 (0.0%) | 0.0 |
| Total | 8 (100.0%) | 10.0 |
Fertility by Education by Marriage Status in Weston
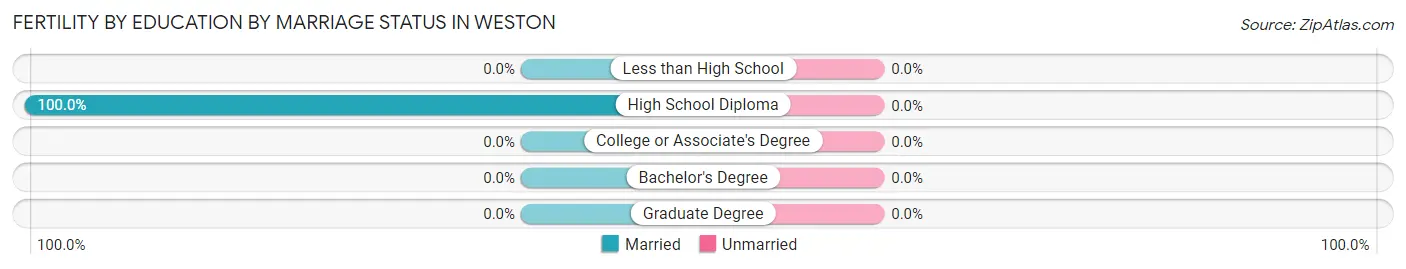
| Educational Attainment | Married | Unmarried |
| Less than High School | 0 (0.0%) | 0 (0.0%) |
| High School Diploma | 8 (100.0%) | 0 (0.0%) |
| College or Associate's Degree | 0 (0.0%) | 0 (0.0%) |
| Bachelor's Degree | 0 (0.0%) | 0 (0.0%) |
| Graduate Degree | 0 (0.0%) | 0 (0.0%) |
| Total | 8 (100.0%) | 0 (0.0%) |
Employment Characteristics in Weston
Employment by Class of Employer in Weston
Among the 1,568 employed individuals in Weston, private company employees (1,056 | 67.3%), state government employees (126 | 8.0%), and self-employed (not incorporated) (109 | 7.0%) make up the most common classes of employment.
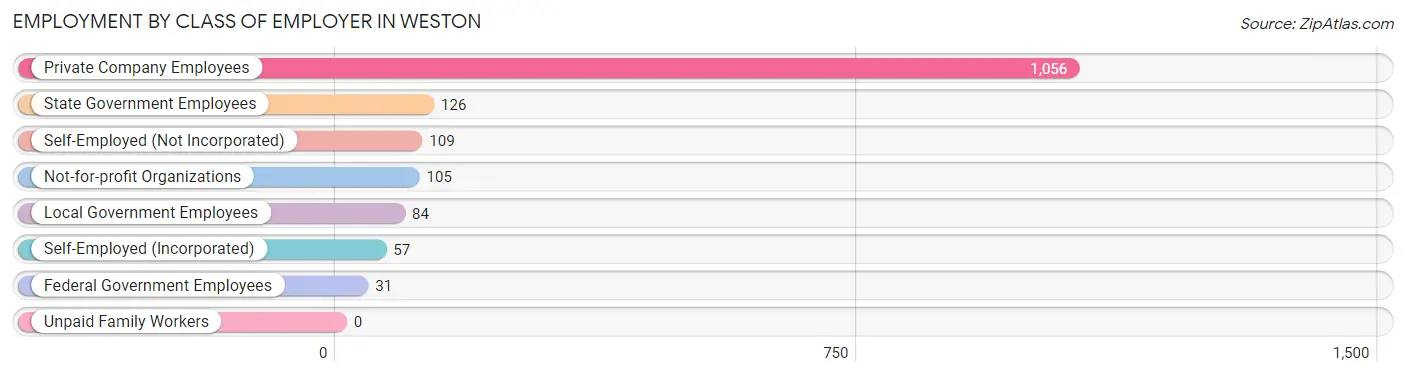
| Employer Class | # Employees | % Employees |
| Private Company Employees | 1,056 | 67.3% |
| Self-Employed (Incorporated) | 57 | 3.6% |
| Self-Employed (Not Incorporated) | 109 | 7.0% |
| Not-for-profit Organizations | 105 | 6.7% |
| Local Government Employees | 84 | 5.4% |
| State Government Employees | 126 | 8.0% |
| Federal Government Employees | 31 | 2.0% |
| Unpaid Family Workers | 0 | 0.0% |
| Total | 1,568 | 100.0% |
Employment Status by Age in Weston
According to the labor force statistics for Weston, out of the total population over 16 years of age (3,243), 55.7% or 1,806 individuals are in the labor force, with 12.9% or 233 of them unemployed. The age group with the highest labor force participation rate is 30 to 34 years, with 92.9% or 169 individuals in the labor force. Within the labor force, the 25 to 29 years age range has the highest percentage of unemployed individuals, with 35.2% or 122 of them being unemployed.
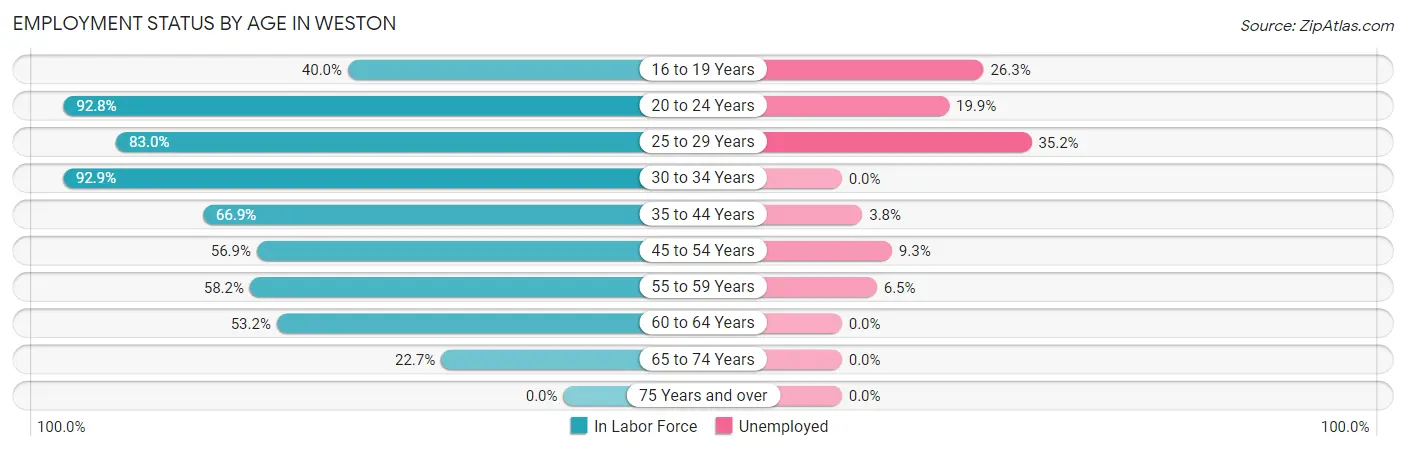
| Age Bracket | In Labor Force | Unemployed |
| 16 to 19 Years | 76 (40.0%) | 20 (26.3%) |
| 20 to 24 Years | 206 (92.8%) | 41 (19.9%) |
| 25 to 29 Years | 347 (83.0%) | 122 (35.2%) |
| 30 to 34 Years | 169 (92.9%) | 0 (0.0%) |
| 35 to 44 Years | 338 (66.9%) | 13 (3.8%) |
| 45 to 54 Years | 301 (56.9%) | 28 (9.3%) |
| 55 to 59 Years | 138 (58.2%) | 9 (6.5%) |
| 60 to 64 Years | 159 (53.2%) | 0 (0.0%) |
| 65 to 74 Years | 73 (22.7%) | 0 (0.0%) |
| 75 Years and over | 0 (0.0%) | 0 (0.0%) |
| Total | 1,806 (55.7%) | 233 (12.9%) |
Employment Status by Educational Attainment in Weston
According to labor force statistics for Weston, 66.9% of individuals (1,452) out of the total population between 25 and 64 years of age (2,170) are in the labor force, with 11.8% or 171 of them being unemployed. The group with the highest labor force participation rate are those with the educational attainment of bachelor's degree or higher, with 84.7% or 298 individuals in the labor force. Within the labor force, individuals with high school diploma education have the highest percentage of unemployment, with 25.4% or 128 of them being unemployed.
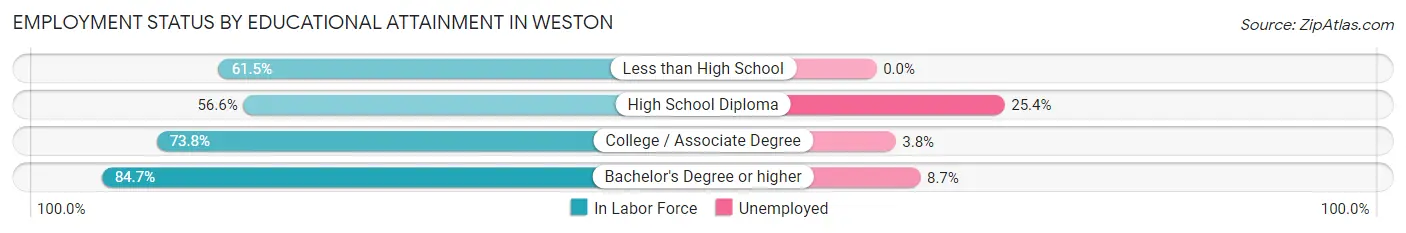
| Educational Attainment | In Labor Force | Unemployed |
| Less than High School | 171 (61.5%) | 0 (0.0%) |
| High School Diploma | 504 (56.6%) | 226 (25.4%) |
| College / Associate Degree | 479 (73.8%) | 25 (3.8%) |
| Bachelor's Degree or higher | 298 (84.7%) | 31 (8.7%) |
| Total | 1,452 (66.9%) | 256 (11.8%) |
Employment Occupations by Sex in Weston
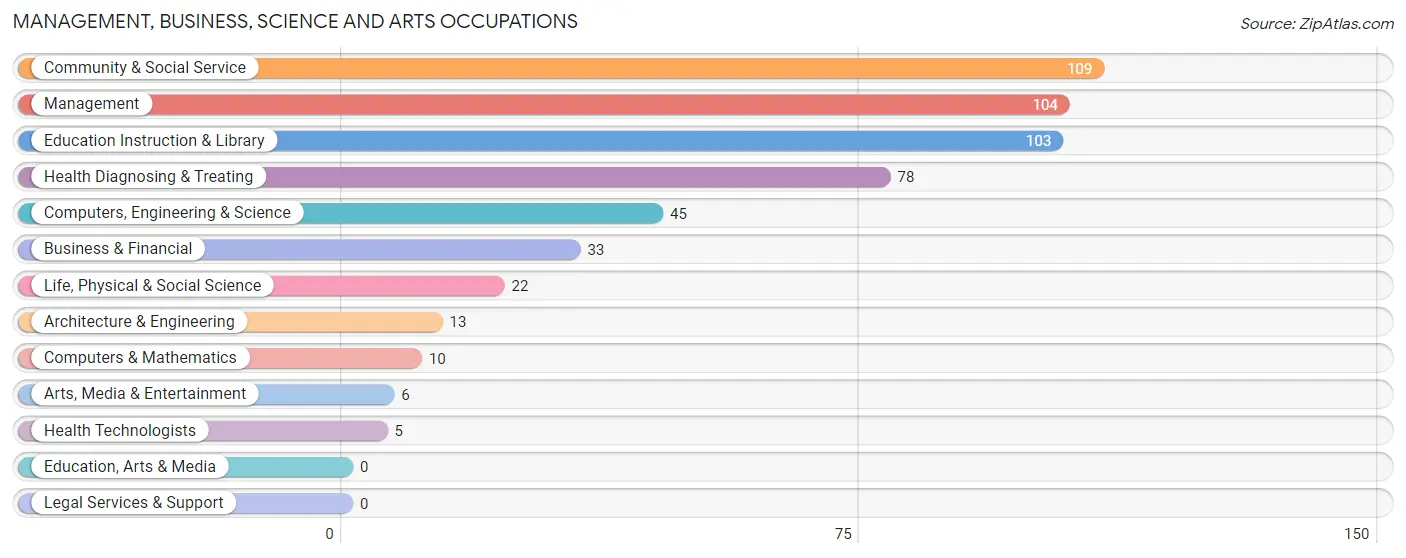
Management, Business, Science and Arts Occupations
The most common Management, Business, Science and Arts occupations in Weston are Community & Social Service (109 | 6.9%), Management (104 | 6.6%), Education Instruction & Library (103 | 6.5%), Health Diagnosing & Treating (78 | 5.0%), and Computers, Engineering & Science (45 | 2.9%).
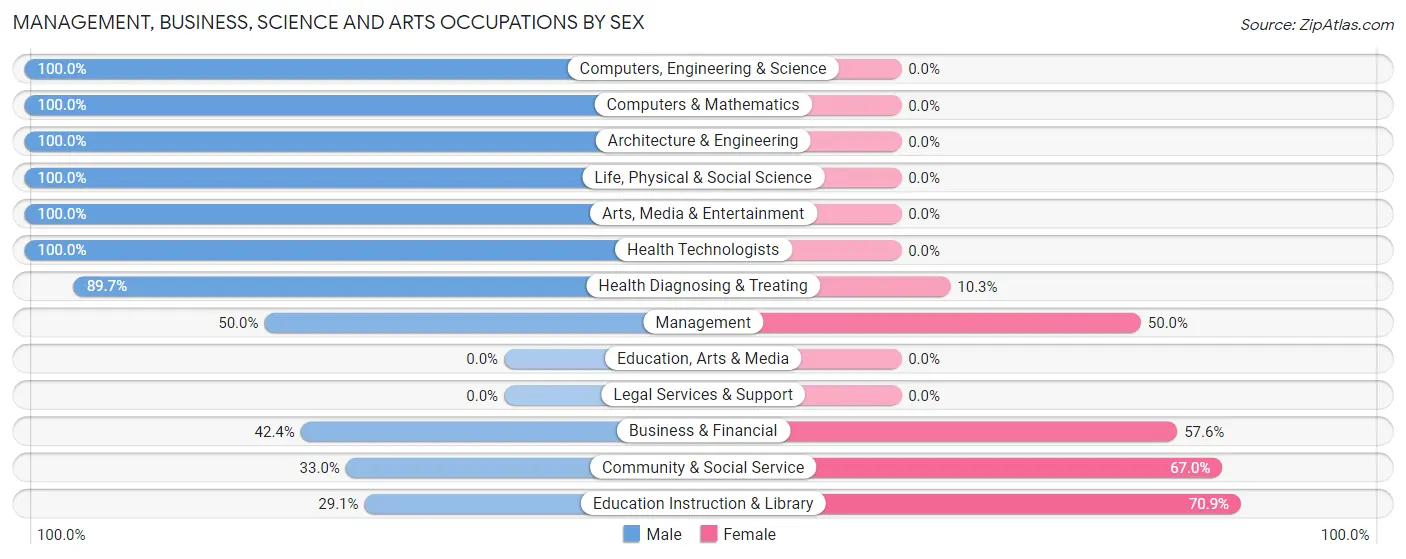
Management, Business, Science and Arts Occupations by Sex
Within the Management, Business, Science and Arts occupations in Weston, the most male-oriented occupations are Computers, Engineering & Science (100.0%), Computers & Mathematics (100.0%), and Architecture & Engineering (100.0%), while the most female-oriented occupations are Education Instruction & Library (70.9%), Community & Social Service (67.0%), and Business & Financial (57.6%).
| Occupation | Male | Female |
| Management | 52 (50.0%) | 52 (50.0%) |
| Business & Financial | 14 (42.4%) | 19 (57.6%) |
| Computers, Engineering & Science | 45 (100.0%) | 0 (0.0%) |
| Computers & Mathematics | 10 (100.0%) | 0 (0.0%) |
| Architecture & Engineering | 13 (100.0%) | 0 (0.0%) |
| Life, Physical & Social Science | 22 (100.0%) | 0 (0.0%) |
| Community & Social Service | 36 (33.0%) | 73 (67.0%) |
| Education, Arts & Media | 0 (0.0%) | 0 (0.0%) |
| Legal Services & Support | 0 (0.0%) | 0 (0.0%) |
| Education Instruction & Library | 30 (29.1%) | 73 (70.9%) |
| Arts, Media & Entertainment | 6 (100.0%) | 0 (0.0%) |
| Health Diagnosing & Treating | 70 (89.7%) | 8 (10.3%) |
| Health Technologists | 5 (100.0%) | 0 (0.0%) |
| Total (Category) | 217 (58.8%) | 152 (41.2%) |
| Total (Overall) | 903 (57.4%) | 671 (42.6%) |
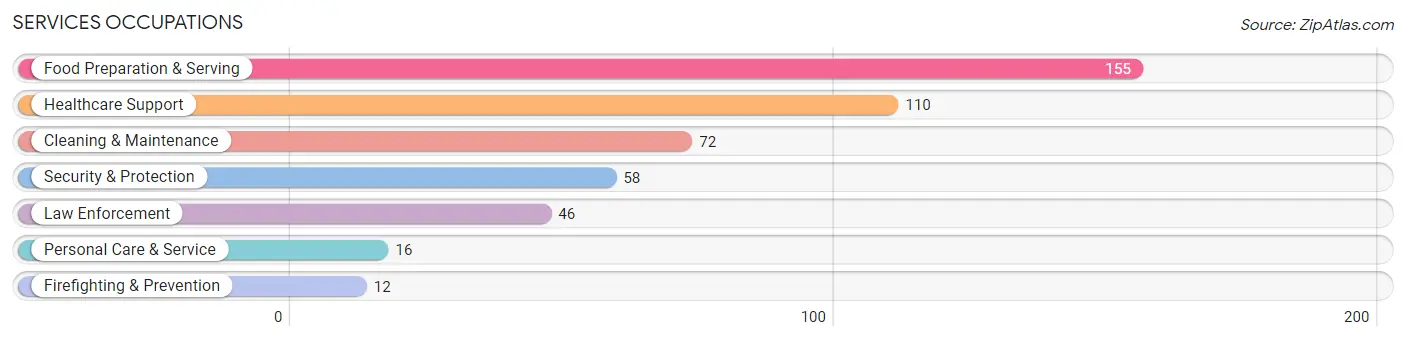
Services Occupations
The most common Services occupations in Weston are Food Preparation & Serving (155 | 9.9%), Healthcare Support (110 | 7.0%), Cleaning & Maintenance (72 | 4.6%), Security & Protection (58 | 3.7%), and Law Enforcement (46 | 2.9%).
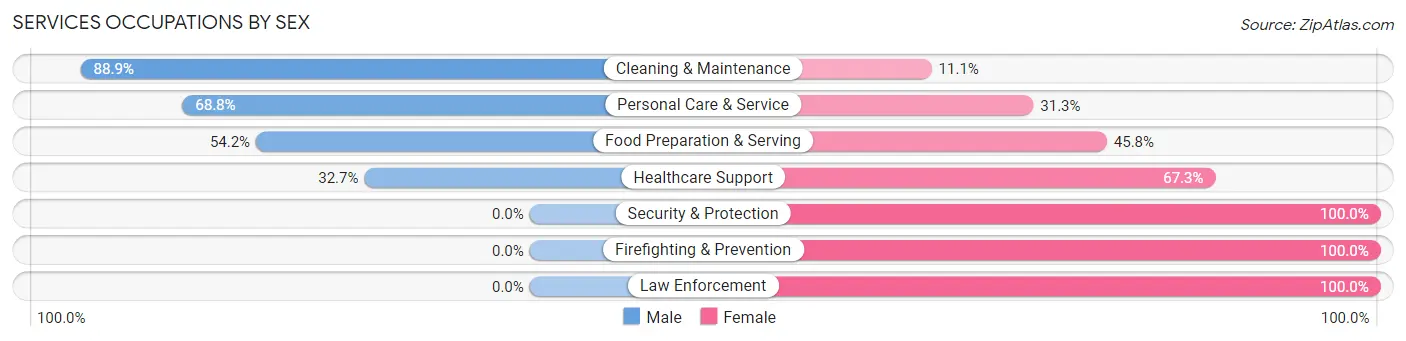
Services Occupations by Sex
Within the Services occupations in Weston, the most male-oriented occupations are Cleaning & Maintenance (88.9%), Personal Care & Service (68.8%), and Food Preparation & Serving (54.2%), while the most female-oriented occupations are Security & Protection (100.0%), Firefighting & Prevention (100.0%), and Law Enforcement (100.0%).
| Occupation | Male | Female |
| Healthcare Support | 36 (32.7%) | 74 (67.3%) |
| Security & Protection | 0 (0.0%) | 58 (100.0%) |
| Firefighting & Prevention | 0 (0.0%) | 12 (100.0%) |
| Law Enforcement | 0 (0.0%) | 46 (100.0%) |
| Food Preparation & Serving | 84 (54.2%) | 71 (45.8%) |
| Cleaning & Maintenance | 64 (88.9%) | 8 (11.1%) |
| Personal Care & Service | 11 (68.8%) | 5 (31.2%) |
| Total (Category) | 195 (47.4%) | 216 (52.5%) |
| Total (Overall) | 903 (57.4%) | 671 (42.6%) |
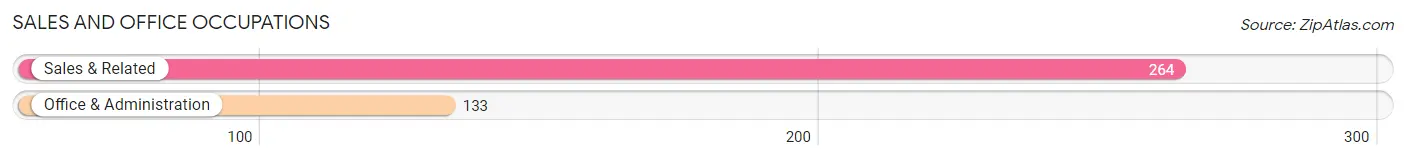
Sales and Office Occupations
The most common Sales and Office occupations in Weston are Sales & Related (264 | 16.8%), and Office & Administration (133 | 8.5%).
Sales and Office Occupations by Sex
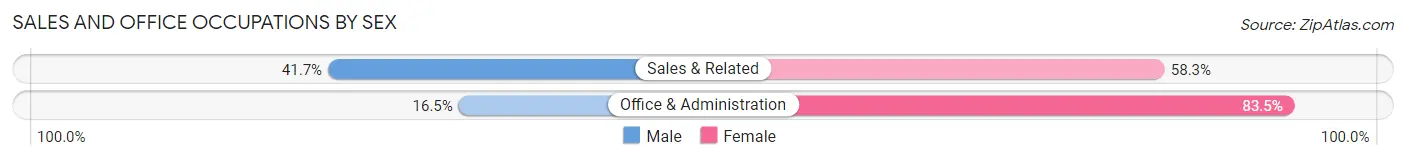
| Occupation | Male | Female |
| Sales & Related | 110 (41.7%) | 154 (58.3%) |
| Office & Administration | 22 (16.5%) | 111 (83.5%) |
| Total (Category) | 132 (33.3%) | 265 (66.7%) |
| Total (Overall) | 903 (57.4%) | 671 (42.6%) |
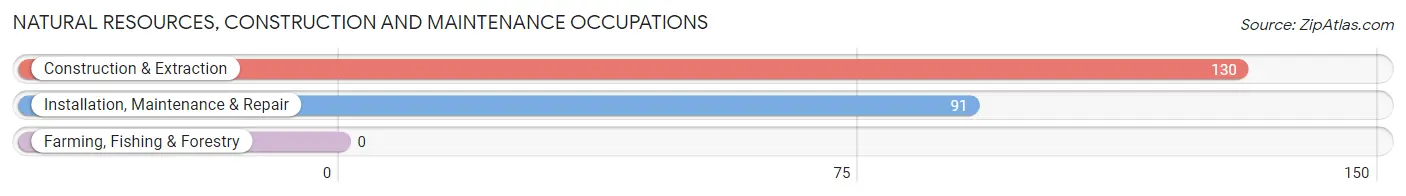
Natural Resources, Construction and Maintenance Occupations
The most common Natural Resources, Construction and Maintenance occupations in Weston are Construction & Extraction (130 | 8.3%), and Installation, Maintenance & Repair (91 | 5.8%).
Natural Resources, Construction and Maintenance Occupations by Sex
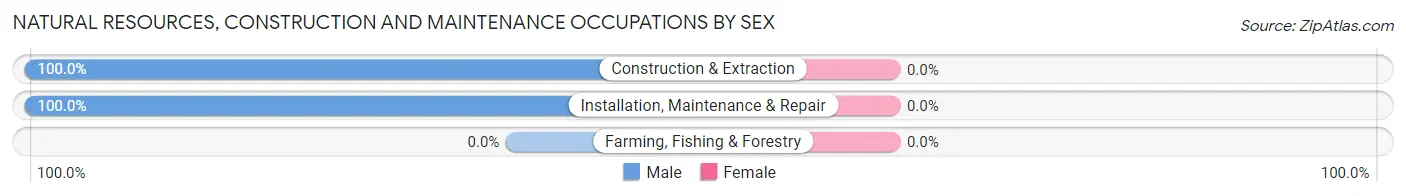
| Occupation | Male | Female |
| Farming, Fishing & Forestry | 0 (0.0%) | 0 (0.0%) |
| Construction & Extraction | 130 (100.0%) | 0 (0.0%) |
| Installation, Maintenance & Repair | 91 (100.0%) | 0 (0.0%) |
| Total (Category) | 221 (100.0%) | 0 (0.0%) |
| Total (Overall) | 903 (57.4%) | 671 (42.6%) |
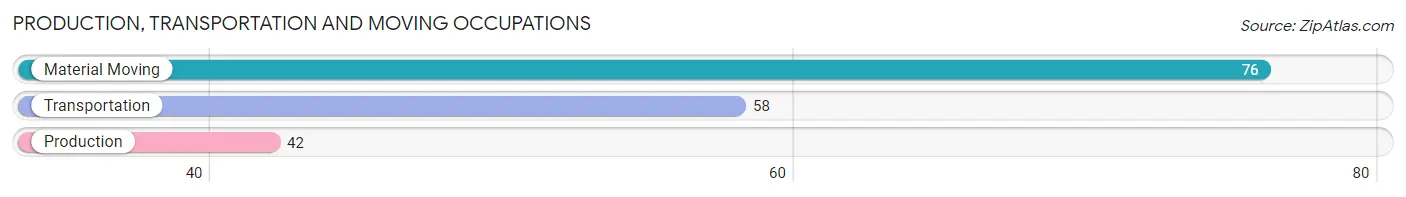
Production, Transportation and Moving Occupations
The most common Production, Transportation and Moving occupations in Weston are Material Moving (76 | 4.8%), Transportation (58 | 3.7%), and Production (42 | 2.7%).
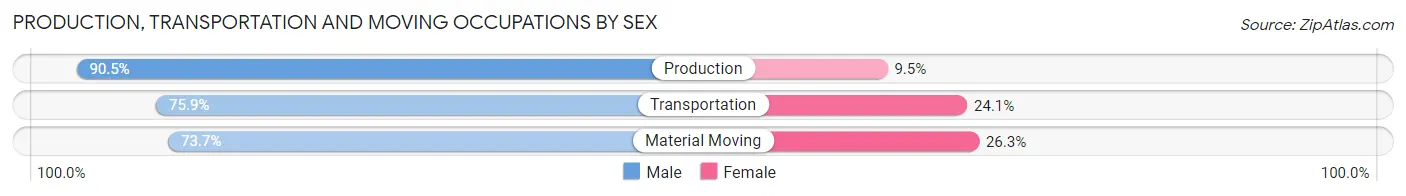
Production, Transportation and Moving Occupations by Sex
| Occupation | Male | Female |
| Production | 38 (90.5%) | 4 (9.5%) |
| Transportation | 44 (75.9%) | 14 (24.1%) |
| Material Moving | 56 (73.7%) | 20 (26.3%) |
| Total (Category) | 138 (78.4%) | 38 (21.6%) |
| Total (Overall) | 903 (57.4%) | 671 (42.6%) |
Employment Industries by Sex in Weston
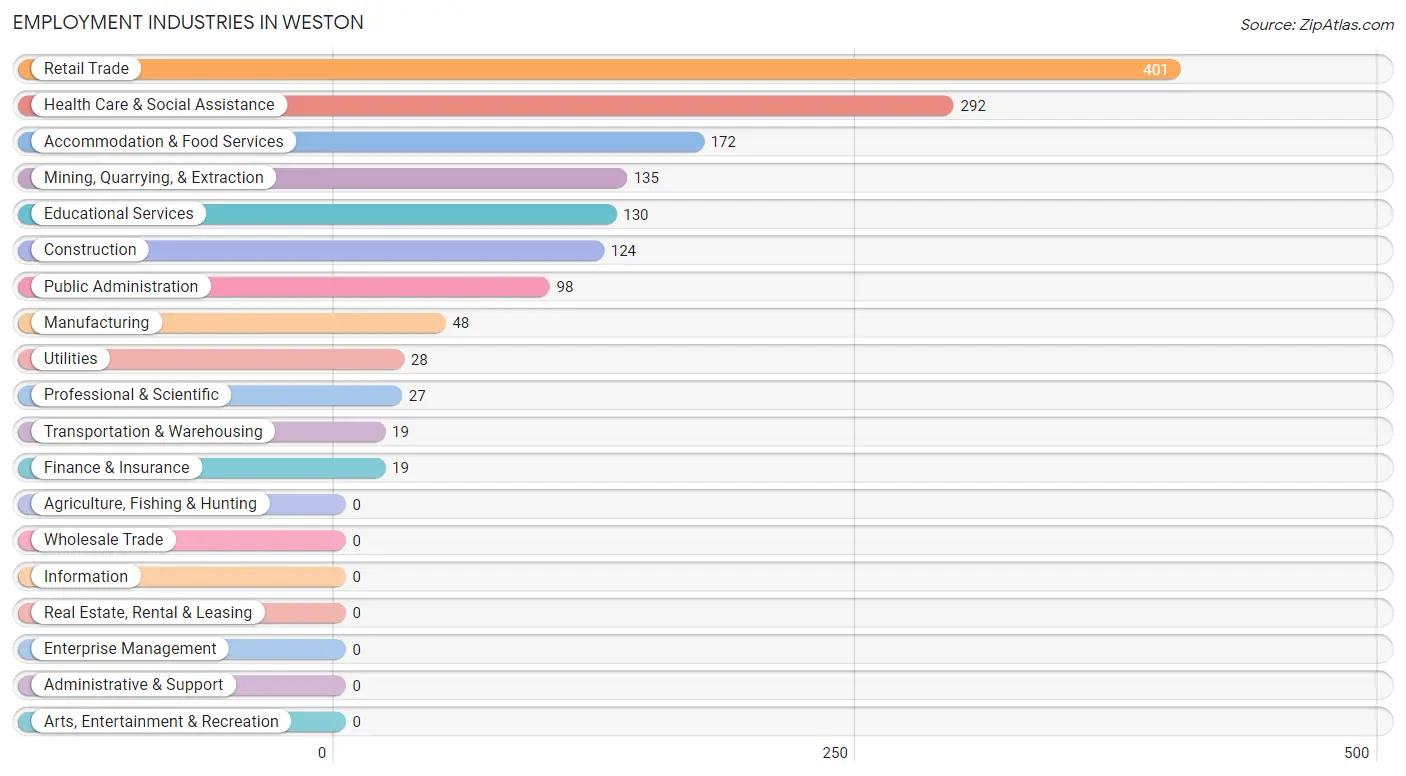
Employment Industries in Weston
The major employment industries in Weston include Retail Trade (401 | 25.5%), Health Care & Social Assistance (292 | 18.5%), Accommodation & Food Services (172 | 10.9%), Mining, Quarrying, & Extraction (135 | 8.6%), and Educational Services (130 | 8.3%).
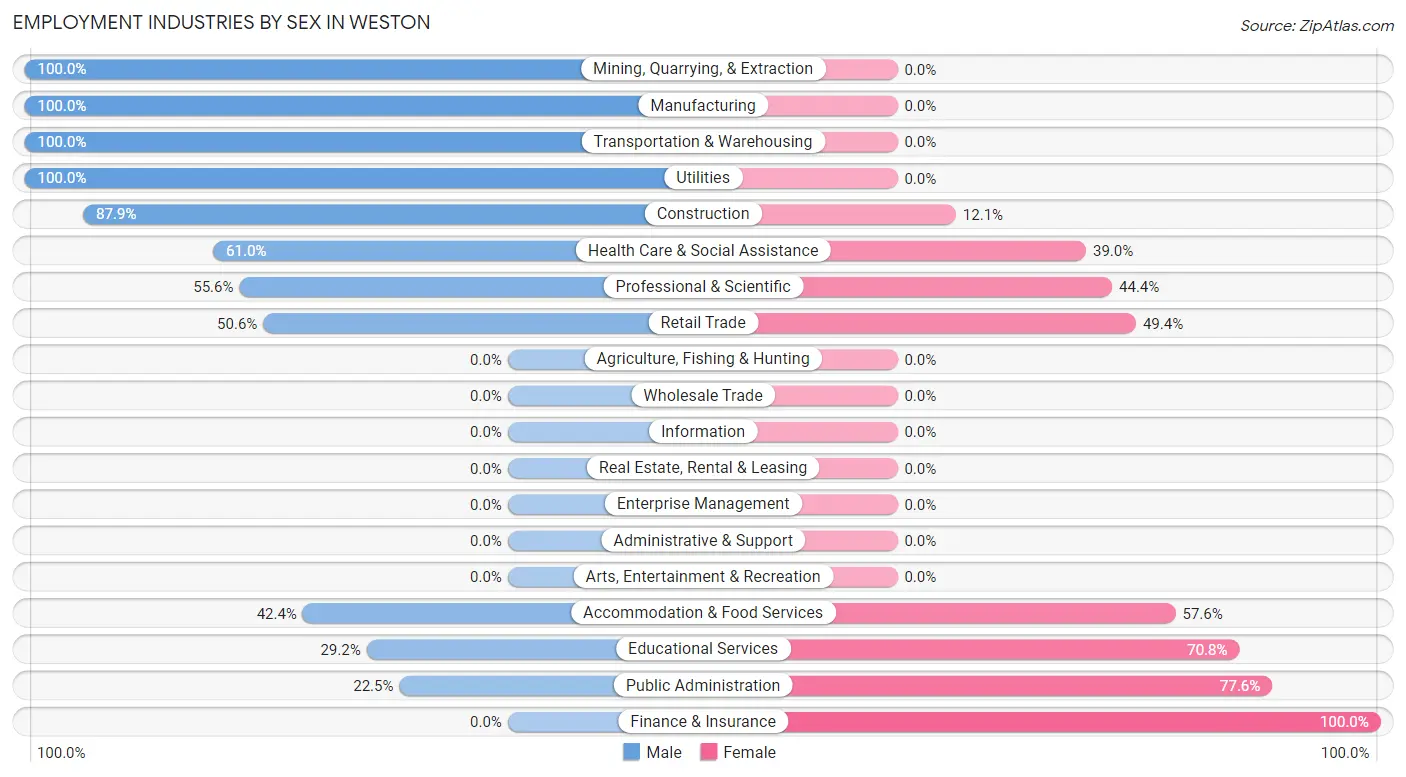
Employment Industries by Sex in Weston
The Weston industries that see more men than women are Mining, Quarrying, & Extraction (100.0%), Manufacturing (100.0%), and Transportation & Warehousing (100.0%), whereas the industries that tend to have a higher number of women are Finance & Insurance (100.0%), Public Administration (77.5%), and Educational Services (70.8%).
| Industry | Male | Female |
| Agriculture, Fishing & Hunting | 0 (0.0%) | 0 (0.0%) |
| Mining, Quarrying, & Extraction | 135 (100.0%) | 0 (0.0%) |
| Construction | 109 (87.9%) | 15 (12.1%) |
| Manufacturing | 48 (100.0%) | 0 (0.0%) |
| Wholesale Trade | 0 (0.0%) | 0 (0.0%) |
| Retail Trade | 203 (50.6%) | 198 (49.4%) |
| Transportation & Warehousing | 19 (100.0%) | 0 (0.0%) |
| Utilities | 28 (100.0%) | 0 (0.0%) |
| Information | 0 (0.0%) | 0 (0.0%) |
| Finance & Insurance | 0 (0.0%) | 19 (100.0%) |
| Real Estate, Rental & Leasing | 0 (0.0%) | 0 (0.0%) |
| Professional & Scientific | 15 (55.6%) | 12 (44.4%) |
| Enterprise Management | 0 (0.0%) | 0 (0.0%) |
| Administrative & Support | 0 (0.0%) | 0 (0.0%) |
| Educational Services | 38 (29.2%) | 92 (70.8%) |
| Health Care & Social Assistance | 178 (61.0%) | 114 (39.0%) |
| Arts, Entertainment & Recreation | 0 (0.0%) | 0 (0.0%) |
| Accommodation & Food Services | 73 (42.4%) | 99 (57.6%) |
| Public Administration | 22 (22.5%) | 76 (77.5%) |
| Total | 903 (57.4%) | 671 (42.6%) |
Education in Weston
School Enrollment in Weston
The most common levels of schooling among the 852 students in Weston are middle school (260 | 30.5%), high school (222 | 26.1%), and elementary school (192 | 22.5%).
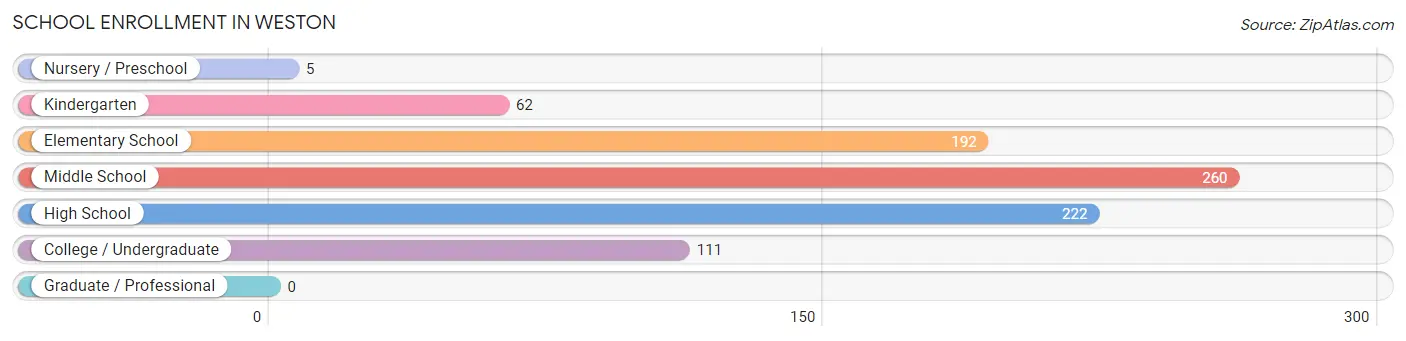
| School Level | # Students | % Students |
| Nursery / Preschool | 5 | 0.6% |
| Kindergarten | 62 | 7.3% |
| Elementary School | 192 | 22.5% |
| Middle School | 260 | 30.5% |
| High School | 222 | 26.1% |
| College / Undergraduate | 111 | 13.0% |
| Graduate / Professional | 0 | 0.0% |
| Total | 852 | 100.0% |
School Enrollment by Age by Funding Source in Weston
Out of a total of 852 students who are enrolled in schools in Weston, 59 (6.9%) attend a private institution, while the remaining 793 (93.1%) are enrolled in public schools. The age group of 20 to 24 year olds has the highest likelihood of being enrolled in private schools, with 23 (62.2% in the age bracket) enrolled. Conversely, the age group of 18 to 19 year olds has the lowest likelihood of being enrolled in a private school, with 86 (100.0% in the age bracket) attending a public institution.
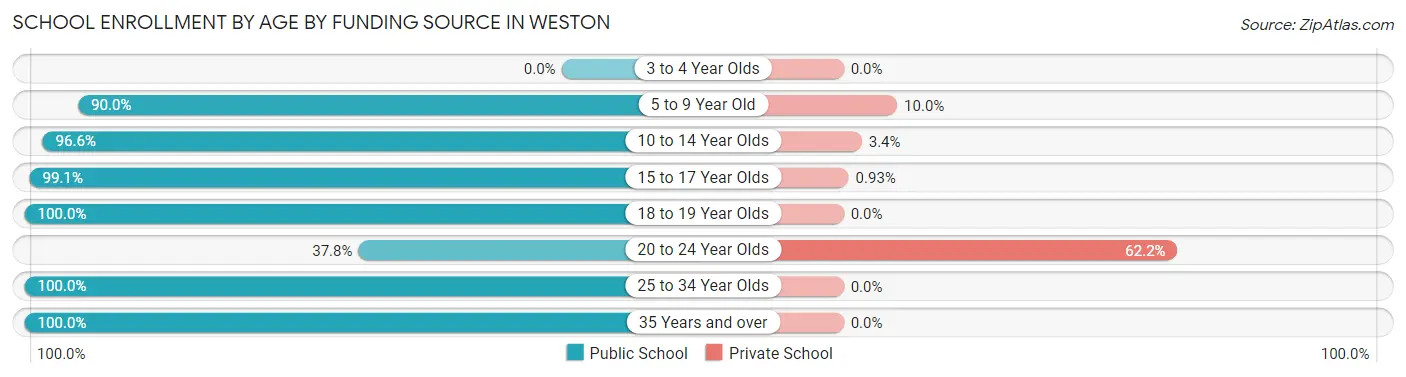
| Age Bracket | Public School | Private School |
| 3 to 4 Year Olds | 0 (0.0%) | 0 (0.0%) |
| 5 to 9 Year Old | 226 (90.0%) | 25 (10.0%) |
| 10 to 14 Year Olds | 287 (96.6%) | 10 (3.4%) |
| 15 to 17 Year Olds | 106 (99.1%) | 1 (0.9%) |
| 18 to 19 Year Olds | 86 (100.0%) | 0 (0.0%) |
| 20 to 24 Year Olds | 14 (37.8%) | 23 (62.2%) |
| 25 to 34 Year Olds | 64 (100.0%) | 0 (0.0%) |
| 35 Years and over | 10 (100.0%) | 0 (0.0%) |
| Total | 793 (93.1%) | 59 (6.9%) |
Educational Attainment by Field of Study in Weston
Business (115 | 24.8%), education (83 | 17.9%), science & technology (56 | 12.1%), visual & performing arts (54 | 11.7%), and liberal arts & history (51 | 11.0%) are the most common fields of study among 463 individuals in Weston who have obtained a bachelor's degree or higher.
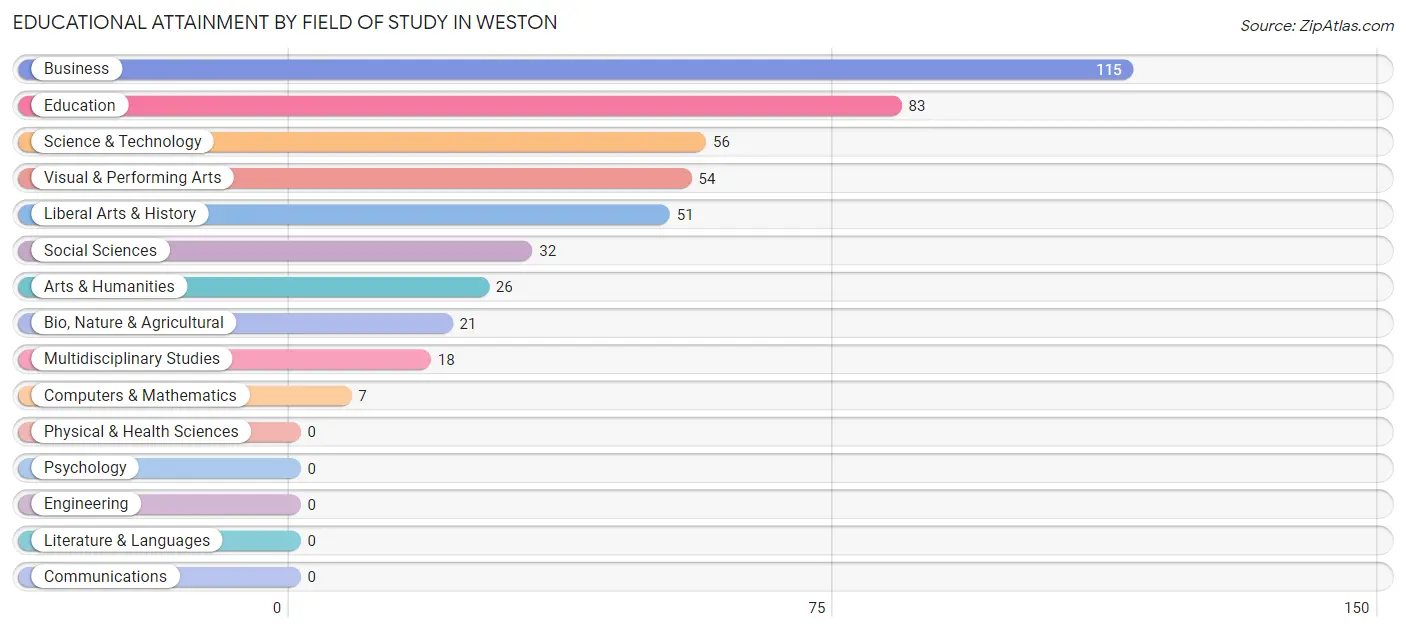
| Field of Study | # Graduates | % Graduates |
| Computers & Mathematics | 7 | 1.5% |
| Bio, Nature & Agricultural | 21 | 4.5% |
| Physical & Health Sciences | 0 | 0.0% |
| Psychology | 0 | 0.0% |
| Social Sciences | 32 | 6.9% |
| Engineering | 0 | 0.0% |
| Multidisciplinary Studies | 18 | 3.9% |
| Science & Technology | 56 | 12.1% |
| Business | 115 | 24.8% |
| Education | 83 | 17.9% |
| Literature & Languages | 0 | 0.0% |
| Liberal Arts & History | 51 | 11.0% |
| Visual & Performing Arts | 54 | 11.7% |
| Communications | 0 | 0.0% |
| Arts & Humanities | 26 | 5.6% |
| Total | 463 | 100.0% |
Transportation & Commute in Weston
Vehicle Availability by Sex in Weston
The most prevalent vehicle ownership categories in Weston are males with 2 vehicles (392, accounting for 43.4%) and females with 2 vehicles (280, making up 59.0%).
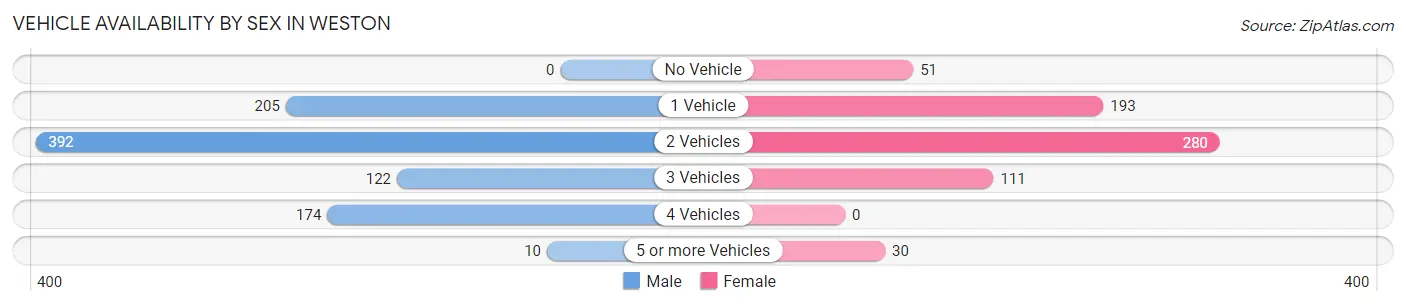
| Vehicles Available | Male | Female |
| No Vehicle | 0 (0.0%) | 51 (7.7%) |
| 1 Vehicle | 205 (22.7%) | 193 (29.0%) |
| 2 Vehicles | 392 (43.4%) | 280 (42.1%) |
| 3 Vehicles | 122 (13.5%) | 111 (16.7%) |
| 4 Vehicles | 174 (19.3%) | 0 (0.0%) |
| 5 or more Vehicles | 10 (1.1%) | 30 (4.5%) |
| Total | 903 (100.0%) | 665 (100.0%) |
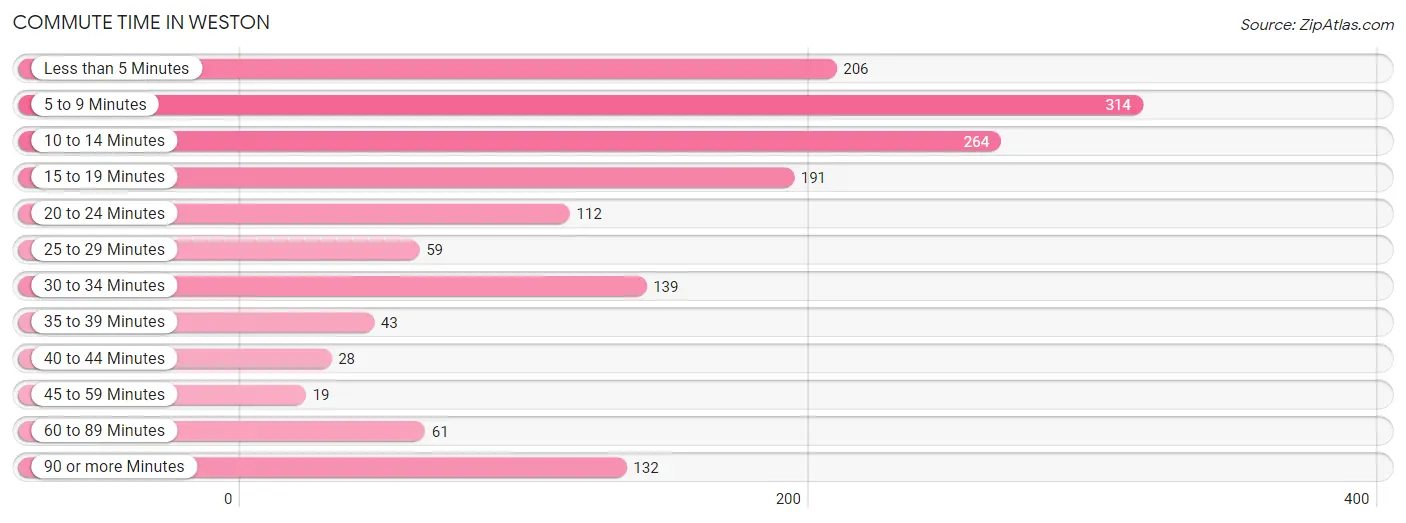
Commute Time in Weston
The most frequently occuring commute durations in Weston are 5 to 9 minutes (314 commuters, 20.0%), 10 to 14 minutes (264 commuters, 16.8%), and less than 5 minutes (206 commuters, 13.1%).
| Commute Time | # Commuters | % Commuters |
| Less than 5 Minutes | 206 | 13.1% |
| 5 to 9 Minutes | 314 | 20.0% |
| 10 to 14 Minutes | 264 | 16.8% |
| 15 to 19 Minutes | 191 | 12.2% |
| 20 to 24 Minutes | 112 | 7.1% |
| 25 to 29 Minutes | 59 | 3.8% |
| 30 to 34 Minutes | 139 | 8.9% |
| 35 to 39 Minutes | 43 | 2.7% |
| 40 to 44 Minutes | 28 | 1.8% |
| 45 to 59 Minutes | 19 | 1.2% |
| 60 to 89 Minutes | 61 | 3.9% |
| 90 or more Minutes | 132 | 8.4% |
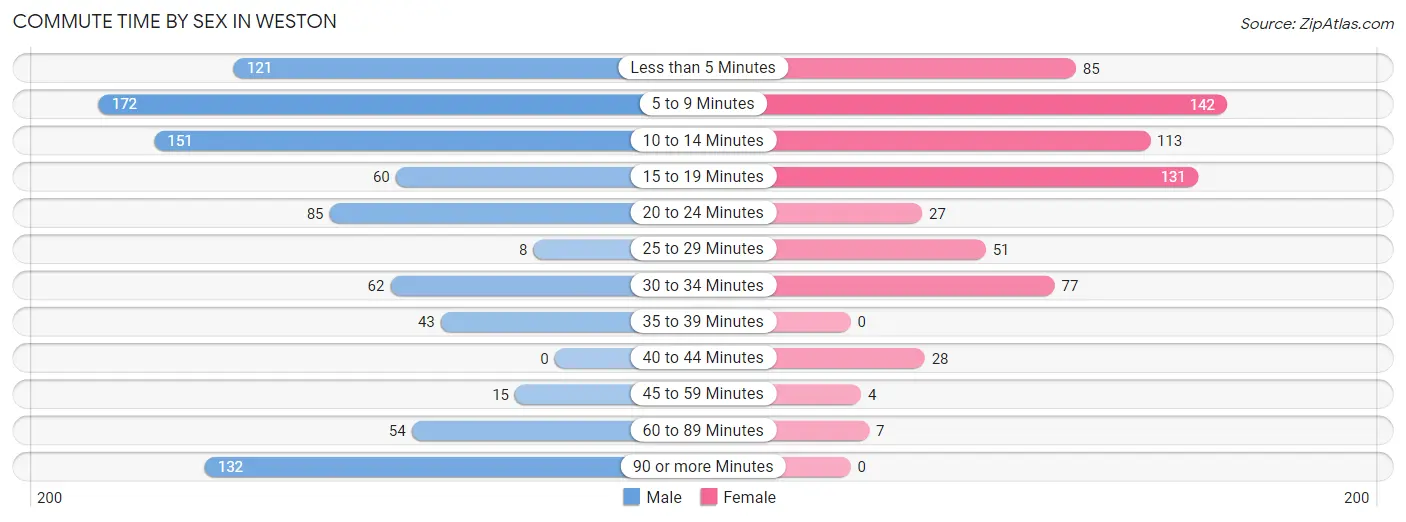
Commute Time by Sex in Weston
The most common commute times in Weston are 5 to 9 minutes (172 commuters, 19.1%) for males and 5 to 9 minutes (142 commuters, 21.3%) for females.
| Commute Time | Male | Female |
| Less than 5 Minutes | 121 (13.4%) | 85 (12.8%) |
| 5 to 9 Minutes | 172 (19.1%) | 142 (21.3%) |
| 10 to 14 Minutes | 151 (16.7%) | 113 (17.0%) |
| 15 to 19 Minutes | 60 (6.6%) | 131 (19.7%) |
| 20 to 24 Minutes | 85 (9.4%) | 27 (4.1%) |
| 25 to 29 Minutes | 8 (0.9%) | 51 (7.7%) |
| 30 to 34 Minutes | 62 (6.9%) | 77 (11.6%) |
| 35 to 39 Minutes | 43 (4.8%) | 0 (0.0%) |
| 40 to 44 Minutes | 0 (0.0%) | 28 (4.2%) |
| 45 to 59 Minutes | 15 (1.7%) | 4 (0.6%) |
| 60 to 89 Minutes | 54 (6.0%) | 7 (1.1%) |
| 90 or more Minutes | 132 (14.6%) | 0 (0.0%) |
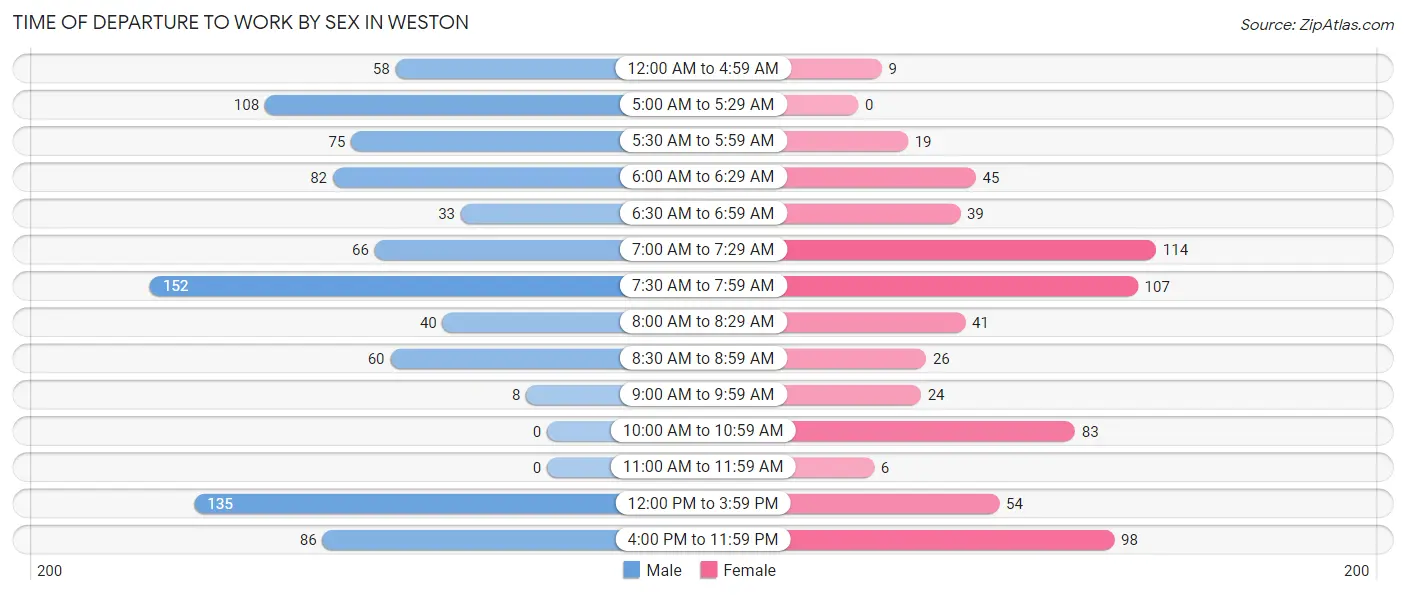
Time of Departure to Work by Sex in Weston
The most frequent times of departure to work in Weston are 7:30 AM to 7:59 AM (152, 16.8%) for males and 7:00 AM to 7:29 AM (114, 17.1%) for females.
| Time of Departure | Male | Female |
| 12:00 AM to 4:59 AM | 58 (6.4%) | 9 (1.3%) |
| 5:00 AM to 5:29 AM | 108 (12.0%) | 0 (0.0%) |
| 5:30 AM to 5:59 AM | 75 (8.3%) | 19 (2.9%) |
| 6:00 AM to 6:29 AM | 82 (9.1%) | 45 (6.8%) |
| 6:30 AM to 6:59 AM | 33 (3.6%) | 39 (5.9%) |
| 7:00 AM to 7:29 AM | 66 (7.3%) | 114 (17.1%) |
| 7:30 AM to 7:59 AM | 152 (16.8%) | 107 (16.1%) |
| 8:00 AM to 8:29 AM | 40 (4.4%) | 41 (6.2%) |
| 8:30 AM to 8:59 AM | 60 (6.6%) | 26 (3.9%) |
| 9:00 AM to 9:59 AM | 8 (0.9%) | 24 (3.6%) |
| 10:00 AM to 10:59 AM | 0 (0.0%) | 83 (12.5%) |
| 11:00 AM to 11:59 AM | 0 (0.0%) | 6 (0.9%) |
| 12:00 PM to 3:59 PM | 135 (14.9%) | 54 (8.1%) |
| 4:00 PM to 11:59 PM | 86 (9.5%) | 98 (14.7%) |
| Total | 903 (100.0%) | 665 (100.0%) |
Housing Occupancy in Weston
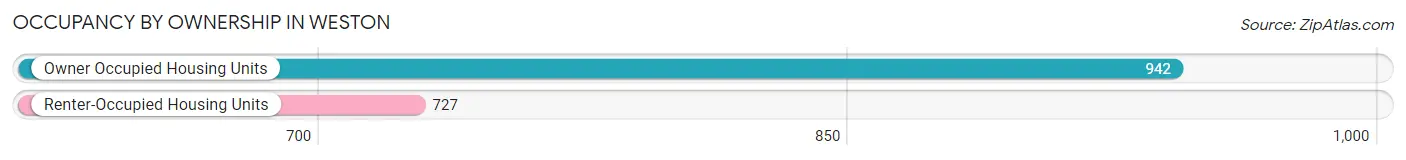
Occupancy by Ownership in Weston
Of the total 1,669 dwellings in Weston, owner-occupied units account for 942 (56.4%), while renter-occupied units make up 727 (43.6%).
| Occupancy | # Housing Units | % Housing Units |
| Owner Occupied Housing Units | 942 | 56.4% |
| Renter-Occupied Housing Units | 727 | 43.6% |
| Total Occupied Housing Units | 1,669 | 100.0% |
Occupancy by Household Size in Weston
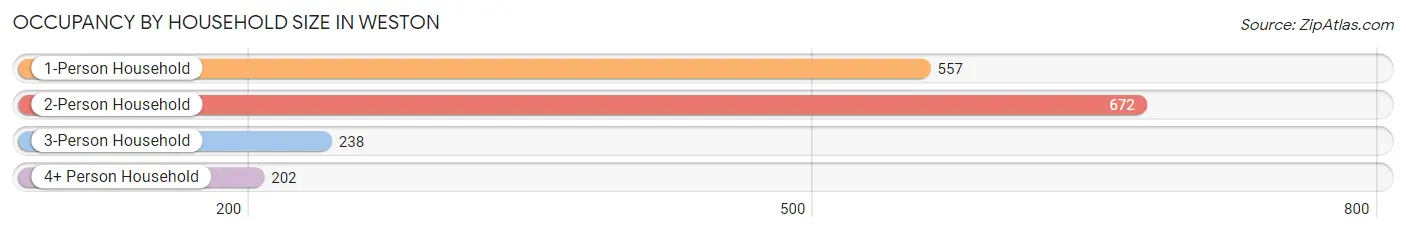
| Household Size | # Housing Units | % Housing Units |
| 1-Person Household | 557 | 33.4% |
| 2-Person Household | 672 | 40.3% |
| 3-Person Household | 238 | 14.3% |
| 4+ Person Household | 202 | 12.1% |
| Total Housing Units | 1,669 | 100.0% |
Occupancy by Ownership by Household Size in Weston
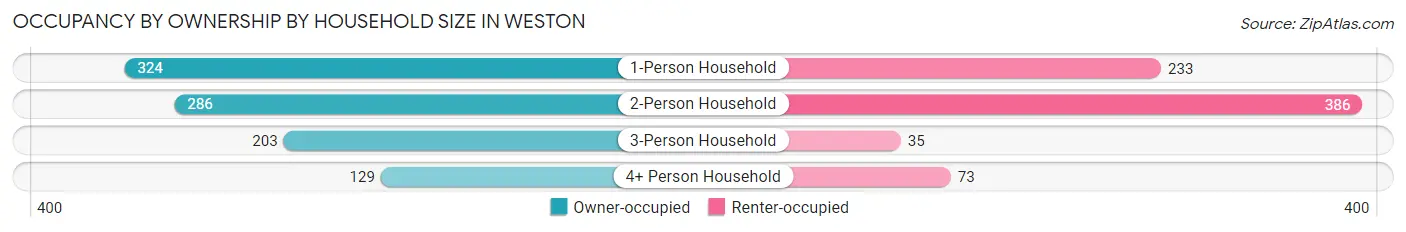
| Household Size | Owner-occupied | Renter-occupied |
| 1-Person Household | 324 (58.2%) | 233 (41.8%) |
| 2-Person Household | 286 (42.6%) | 386 (57.4%) |
| 3-Person Household | 203 (85.3%) | 35 (14.7%) |
| 4+ Person Household | 129 (63.9%) | 73 (36.1%) |
| Total Housing Units | 942 (56.4%) | 727 (43.6%) |
Occupancy by Educational Attainment in Weston
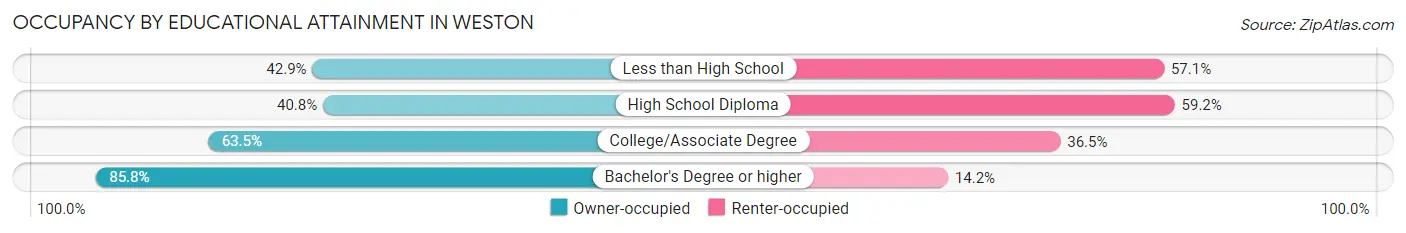
| Household Size | Owner-occupied | Renter-occupied |
| Less than High School | 70 (42.9%) | 93 (57.1%) |
| High School Diploma | 256 (40.8%) | 371 (59.2%) |
| College/Associate Degree | 393 (63.5%) | 226 (36.5%) |
| Bachelor's Degree or higher | 223 (85.8%) | 37 (14.2%) |
Occupancy by Age of Householder in Weston
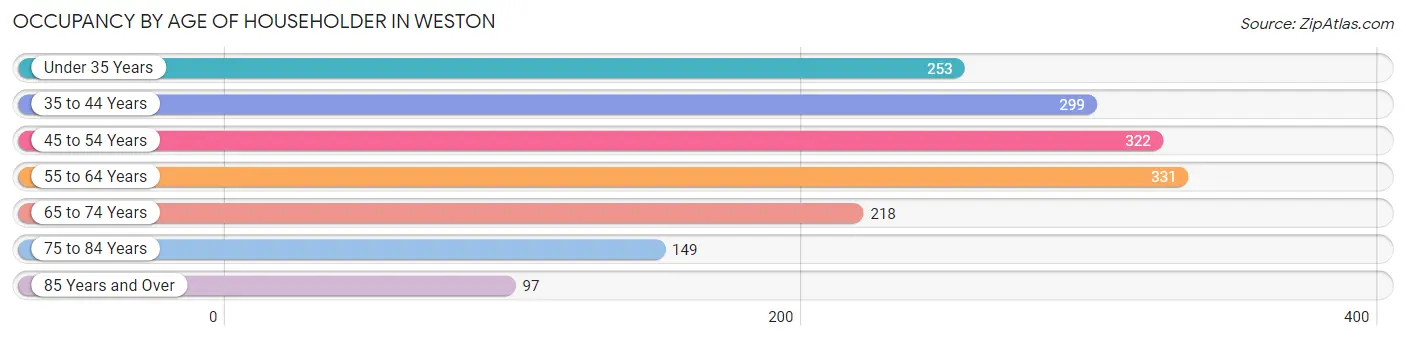
| Age Bracket | # Households | % Households |
| Under 35 Years | 253 | 15.2% |
| 35 to 44 Years | 299 | 17.9% |
| 45 to 54 Years | 322 | 19.3% |
| 55 to 64 Years | 331 | 19.8% |
| 65 to 74 Years | 218 | 13.1% |
| 75 to 84 Years | 149 | 8.9% |
| 85 Years and Over | 97 | 5.8% |
| Total | 1,669 | 100.0% |
Housing Finances in Weston
Median Income by Occupancy in Weston
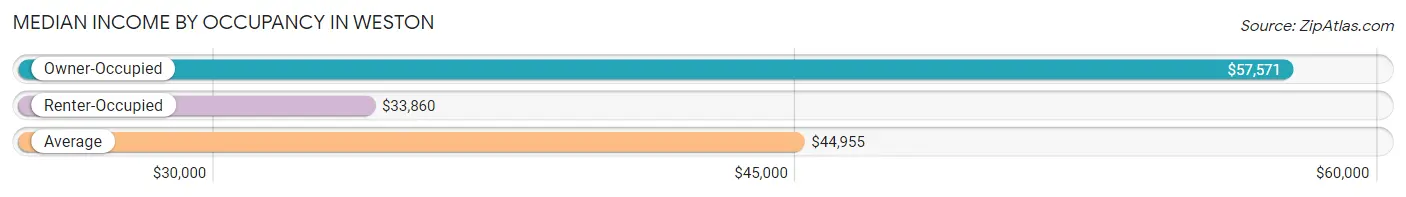
| Occupancy Type | # Households | Median Income |
| Owner-Occupied | 942 (56.4%) | $57,571 |
| Renter-Occupied | 727 (43.6%) | $33,860 |
| Average | 1,669 (100.0%) | $44,955 |
Occupancy by Householder Income Bracket in Weston
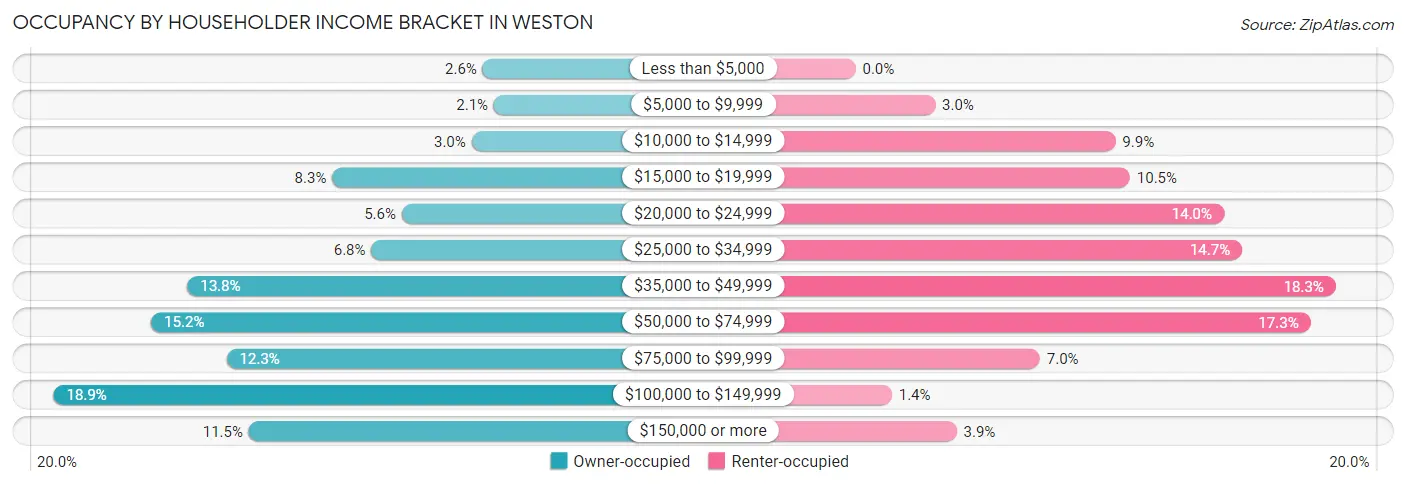
| Income Bracket | Owner-occupied | Renter-occupied |
| Less than $5,000 | 24 (2.5%) | 0 (0.0%) |
| $5,000 to $9,999 | 20 (2.1%) | 22 (3.0%) |
| $10,000 to $14,999 | 28 (3.0%) | 72 (9.9%) |
| $15,000 to $19,999 | 78 (8.3%) | 76 (10.4%) |
| $20,000 to $24,999 | 53 (5.6%) | 102 (14.0%) |
| $25,000 to $34,999 | 64 (6.8%) | 107 (14.7%) |
| $35,000 to $49,999 | 130 (13.8%) | 133 (18.3%) |
| $50,000 to $74,999 | 143 (15.2%) | 126 (17.3%) |
| $75,000 to $99,999 | 116 (12.3%) | 51 (7.0%) |
| $100,000 to $149,999 | 178 (18.9%) | 10 (1.4%) |
| $150,000 or more | 108 (11.5%) | 28 (3.8%) |
| Total | 942 (100.0%) | 727 (100.0%) |
Monthly Housing Cost Tiers in Weston
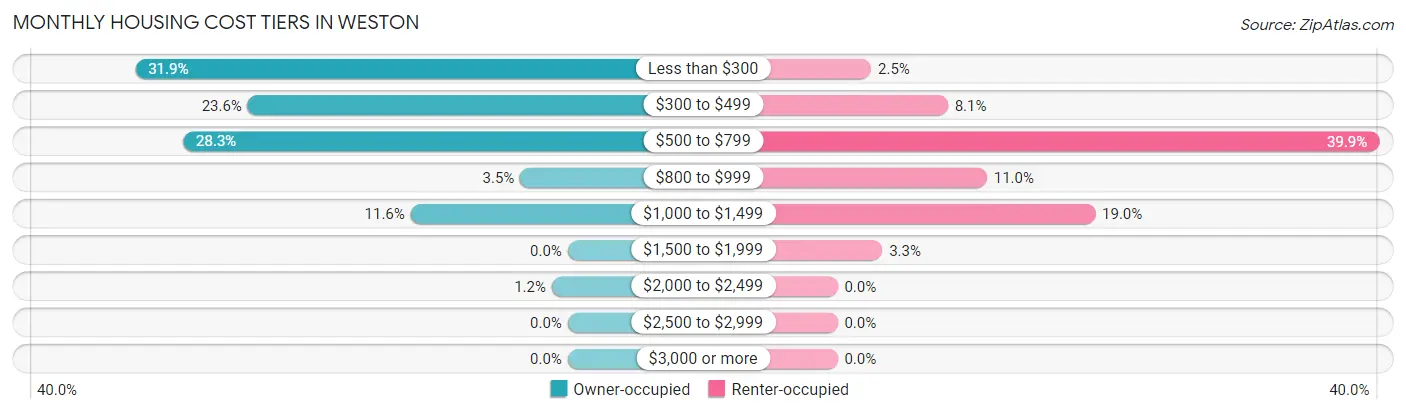
| Monthly Cost | Owner-occupied | Renter-occupied |
| Less than $300 | 300 (31.9%) | 18 (2.5%) |
| $300 to $499 | 222 (23.6%) | 59 (8.1%) |
| $500 to $799 | 267 (28.3%) | 290 (39.9%) |
| $800 to $999 | 33 (3.5%) | 80 (11.0%) |
| $1,000 to $1,499 | 109 (11.6%) | 138 (19.0%) |
| $1,500 to $1,999 | 0 (0.0%) | 24 (3.3%) |
| $2,000 to $2,499 | 11 (1.2%) | 0 (0.0%) |
| $2,500 to $2,999 | 0 (0.0%) | 0 (0.0%) |
| $3,000 or more | 0 (0.0%) | 0 (0.0%) |
| Total | 942 (100.0%) | 727 (100.0%) |
Physical Housing Characteristics in Weston
Housing Structures in Weston
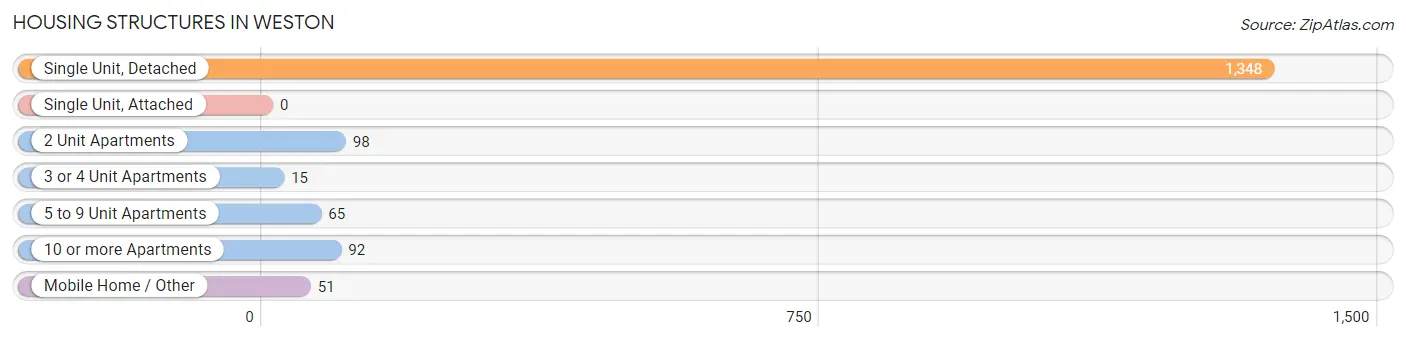
| Structure Type | # Housing Units | % Housing Units |
| Single Unit, Detached | 1,348 | 80.8% |
| Single Unit, Attached | 0 | 0.0% |
| 2 Unit Apartments | 98 | 5.9% |
| 3 or 4 Unit Apartments | 15 | 0.9% |
| 5 to 9 Unit Apartments | 65 | 3.9% |
| 10 or more Apartments | 92 | 5.5% |
| Mobile Home / Other | 51 | 3.1% |
| Total | 1,669 | 100.0% |
Housing Structures by Occupancy in Weston
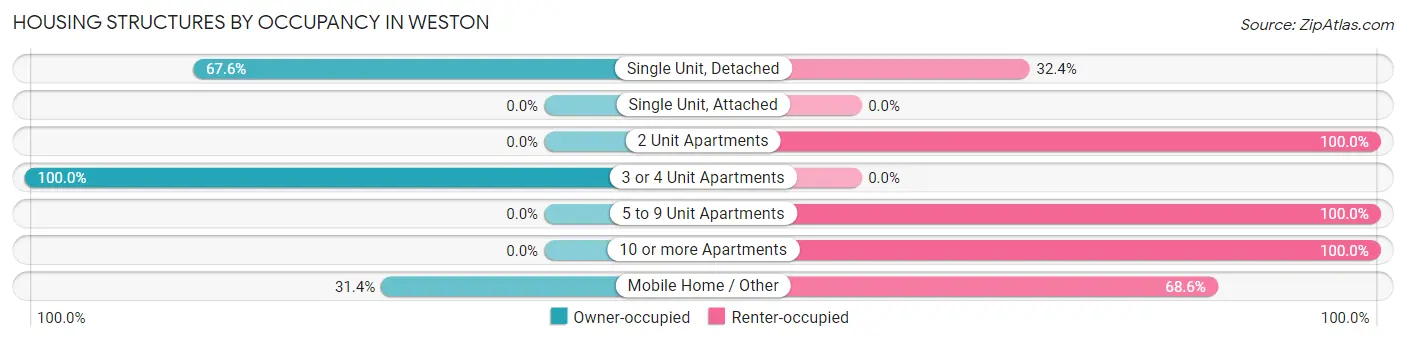
| Structure Type | Owner-occupied | Renter-occupied |
| Single Unit, Detached | 911 (67.6%) | 437 (32.4%) |
| Single Unit, Attached | 0 (0.0%) | 0 (0.0%) |
| 2 Unit Apartments | 0 (0.0%) | 98 (100.0%) |
| 3 or 4 Unit Apartments | 15 (100.0%) | 0 (0.0%) |
| 5 to 9 Unit Apartments | 0 (0.0%) | 65 (100.0%) |
| 10 or more Apartments | 0 (0.0%) | 92 (100.0%) |
| Mobile Home / Other | 16 (31.4%) | 35 (68.6%) |
| Total | 942 (56.4%) | 727 (43.6%) |
Housing Structures by Number of Rooms in Weston
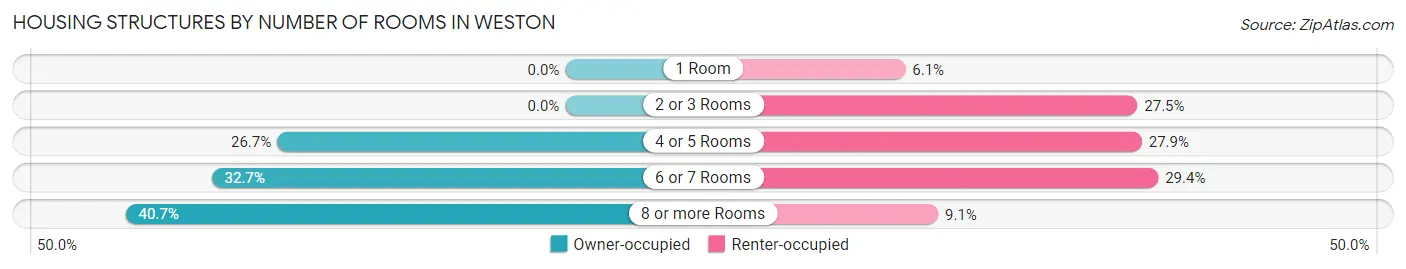
| Number of Rooms | Owner-occupied | Renter-occupied |
| 1 Room | 0 (0.0%) | 44 (6.0%) |
| 2 or 3 Rooms | 0 (0.0%) | 200 (27.5%) |
| 4 or 5 Rooms | 251 (26.7%) | 203 (27.9%) |
| 6 or 7 Rooms | 308 (32.7%) | 214 (29.4%) |
| 8 or more Rooms | 383 (40.7%) | 66 (9.1%) |
| Total | 942 (100.0%) | 727 (100.0%) |
Housing Structure by Heating Type in Weston
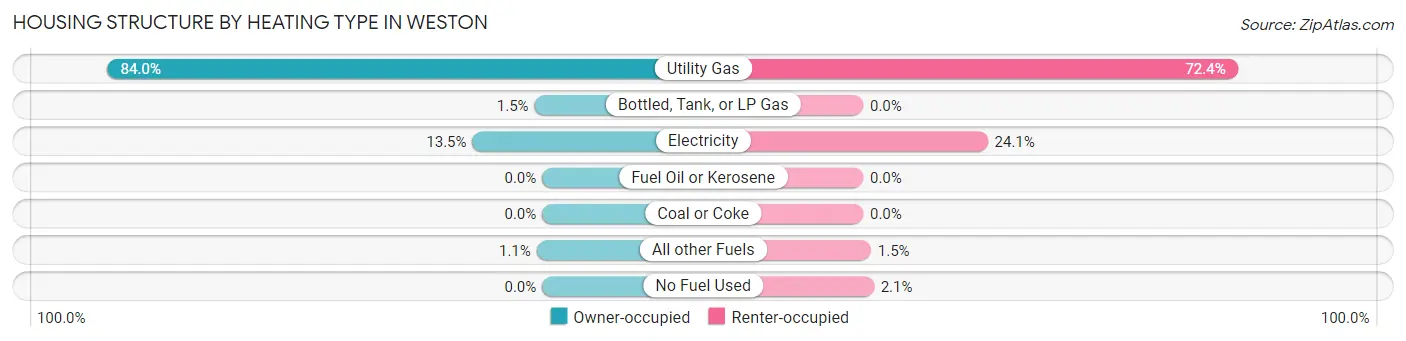
| Heating Type | Owner-occupied | Renter-occupied |
| Utility Gas | 791 (84.0%) | 526 (72.4%) |
| Bottled, Tank, or LP Gas | 14 (1.5%) | 0 (0.0%) |
| Electricity | 127 (13.5%) | 175 (24.1%) |
| Fuel Oil or Kerosene | 0 (0.0%) | 0 (0.0%) |
| Coal or Coke | 0 (0.0%) | 0 (0.0%) |
| All other Fuels | 10 (1.1%) | 11 (1.5%) |
| No Fuel Used | 0 (0.0%) | 15 (2.1%) |
| Total | 942 (100.0%) | 727 (100.0%) |
Household Vehicle Usage in Weston
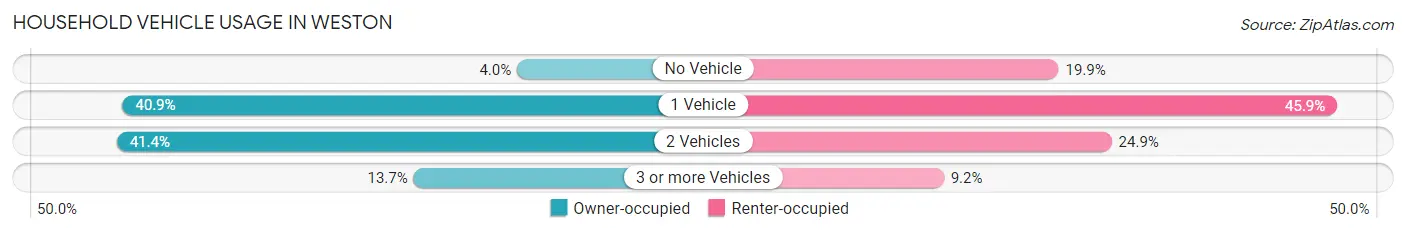
| Vehicles per Household | Owner-occupied | Renter-occupied |
| No Vehicle | 38 (4.0%) | 145 (19.9%) |
| 1 Vehicle | 385 (40.9%) | 334 (45.9%) |
| 2 Vehicles | 390 (41.4%) | 181 (24.9%) |
| 3 or more Vehicles | 129 (13.7%) | 67 (9.2%) |
| Total | 942 (100.0%) | 727 (100.0%) |
Real Estate & Mortgages in Weston
Real Estate and Mortgage Overview in Weston
| Characteristic | Without Mortgage | With Mortgage |
| Housing Units | 690 | 252 |
| Median Property Value | $90,500 | $95,000 |
| Median Household Income | $58,750 | $20 |
| Monthly Housing Costs | $317 | $0 |
| Real Estate Taxes | $601 | $0 |
Property Value by Mortgage Status in Weston
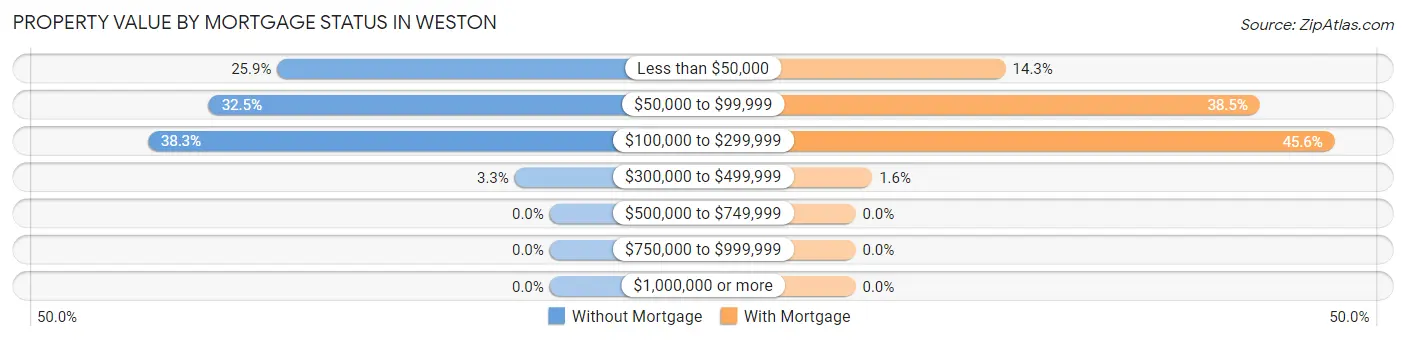
| Property Value | Without Mortgage | With Mortgage |
| Less than $50,000 | 179 (25.9%) | 36 (14.3%) |
| $50,000 to $99,999 | 224 (32.5%) | 97 (38.5%) |
| $100,000 to $299,999 | 264 (38.3%) | 115 (45.6%) |
| $300,000 to $499,999 | 23 (3.3%) | 4 (1.6%) |
| $500,000 to $749,999 | 0 (0.0%) | 0 (0.0%) |
| $750,000 to $999,999 | 0 (0.0%) | 0 (0.0%) |
| $1,000,000 or more | 0 (0.0%) | 0 (0.0%) |
| Total | 690 (100.0%) | 252 (100.0%) |
Household Income by Mortgage Status in Weston
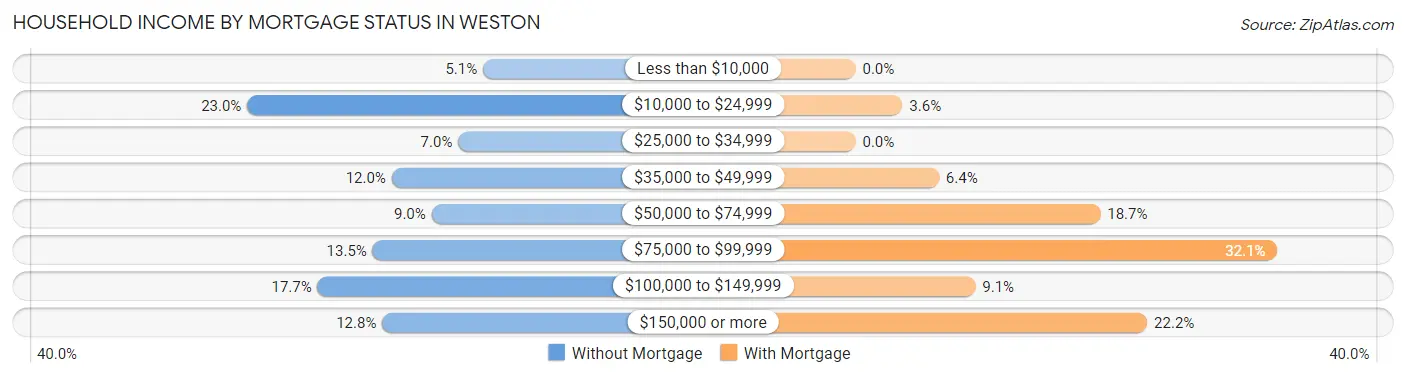
| Household Income | Without Mortgage | With Mortgage |
| Less than $10,000 | 35 (5.1%) | 0 (0.0%) |
| $10,000 to $24,999 | 159 (23.0%) | 9 (3.6%) |
| $25,000 to $34,999 | 48 (7.0%) | 0 (0.0%) |
| $35,000 to $49,999 | 83 (12.0%) | 16 (6.4%) |
| $50,000 to $74,999 | 62 (9.0%) | 47 (18.6%) |
| $75,000 to $99,999 | 93 (13.5%) | 81 (32.1%) |
| $100,000 to $149,999 | 122 (17.7%) | 23 (9.1%) |
| $150,000 or more | 88 (12.8%) | 56 (22.2%) |
| Total | 690 (100.0%) | 252 (100.0%) |
Property Value to Household Income Ratio in Weston
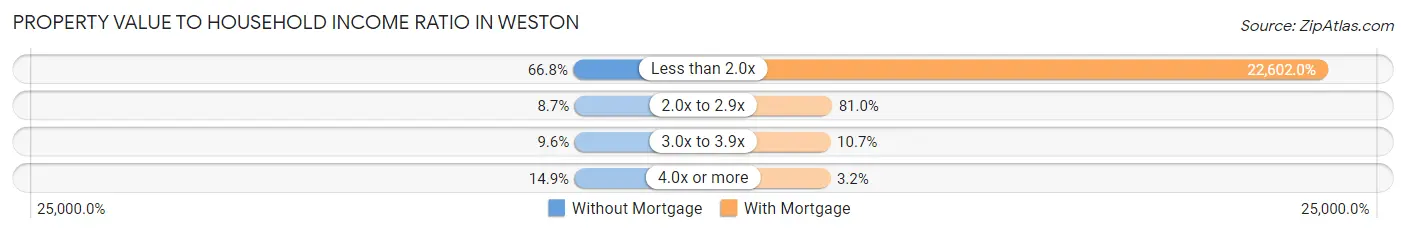
| Value-to-Income Ratio | Without Mortgage | With Mortgage |
| Less than 2.0x | 461 (66.8%) | 56,957 (22,602.0%) |
| 2.0x to 2.9x | 60 (8.7%) | 204 (80.9%) |
| 3.0x to 3.9x | 66 (9.6%) | 27 (10.7%) |
| 4.0x or more | 103 (14.9%) | 8 (3.2%) |
| Total | 690 (100.0%) | 252 (100.0%) |
Real Estate Taxes by Mortgage Status in Weston
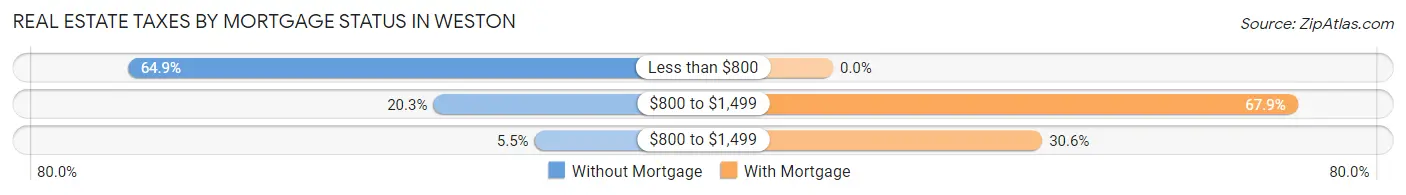
| Property Taxes | Without Mortgage | With Mortgage |
| Less than $800 | 448 (64.9%) | 0 (0.0%) |
| $800 to $1,499 | 140 (20.3%) | 171 (67.9%) |
| $800 to $1,499 | 38 (5.5%) | 77 (30.6%) |
| Total | 690 (100.0%) | 252 (100.0%) |
Health & Disability in Weston
Health Insurance Coverage by Age in Weston
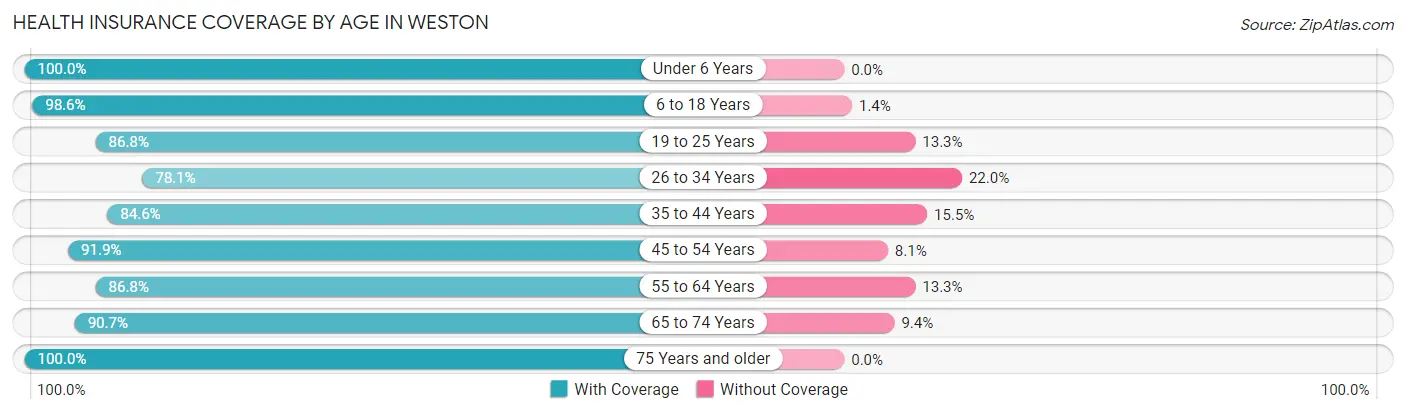
| Age Bracket | With Coverage | Without Coverage |
| Under 6 Years | 149 (100.0%) | 0 (0.0%) |
| 6 to 18 Years | 685 (98.6%) | 10 (1.4%) |
| 19 to 25 Years | 347 (86.8%) | 53 (13.3%) |
| 26 to 34 Years | 345 (78.0%) | 97 (22.0%) |
| 35 to 44 Years | 427 (84.6%) | 78 (15.4%) |
| 45 to 54 Years | 486 (91.9%) | 43 (8.1%) |
| 55 to 64 Years | 465 (86.8%) | 71 (13.3%) |
| 65 to 74 Years | 291 (90.6%) | 30 (9.3%) |
| 75 Years and older | 340 (100.0%) | 0 (0.0%) |
| Total | 3,535 (90.2%) | 382 (9.8%) |
Health Insurance Coverage by Citizenship Status in Weston
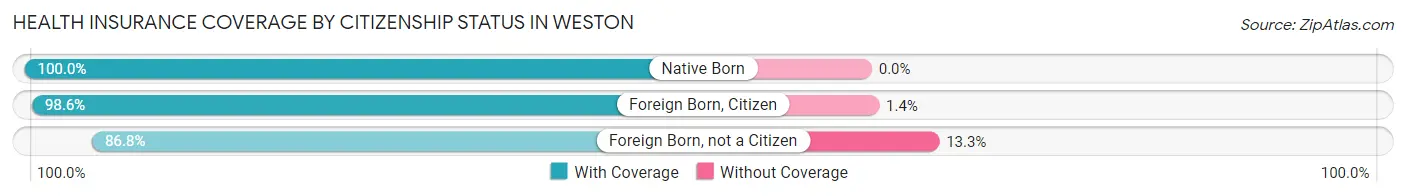
| Citizenship Status | With Coverage | Without Coverage |
| Native Born | 149 (100.0%) | 0 (0.0%) |
| Foreign Born, Citizen | 685 (98.6%) | 10 (1.4%) |
| Foreign Born, not a Citizen | 347 (86.8%) | 53 (13.3%) |
Health Insurance Coverage by Household Income in Weston
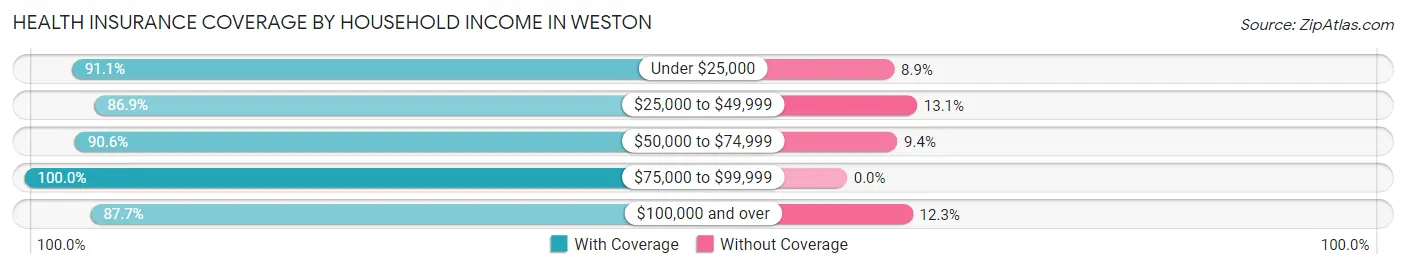
| Household Income | With Coverage | Without Coverage |
| Under $25,000 | 720 (91.1%) | 70 (8.9%) |
| $25,000 to $49,999 | 860 (86.9%) | 130 (13.1%) |
| $50,000 to $74,999 | 605 (90.6%) | 63 (9.4%) |
| $75,000 to $99,999 | 505 (100.0%) | 0 (0.0%) |
| $100,000 and over | 845 (87.7%) | 119 (12.3%) |
Public vs Private Health Insurance Coverage by Age in Weston
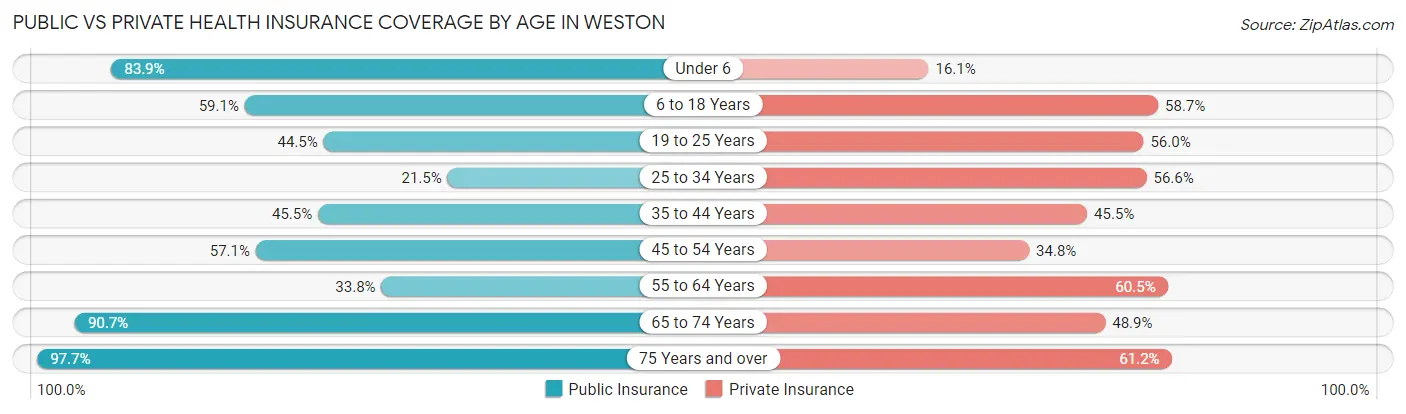
| Age Bracket | Public Insurance | Private Insurance |
| Under 6 | 125 (83.9%) | 24 (16.1%) |
| 6 to 18 Years | 411 (59.1%) | 408 (58.7%) |
| 19 to 25 Years | 178 (44.5%) | 224 (56.0%) |
| 25 to 34 Years | 95 (21.5%) | 250 (56.6%) |
| 35 to 44 Years | 230 (45.5%) | 230 (45.5%) |
| 45 to 54 Years | 302 (57.1%) | 184 (34.8%) |
| 55 to 64 Years | 181 (33.8%) | 324 (60.5%) |
| 65 to 74 Years | 291 (90.6%) | 157 (48.9%) |
| 75 Years and over | 332 (97.7%) | 208 (61.2%) |
| Total | 2,145 (54.8%) | 2,009 (51.3%) |
Disability Status by Sex by Age in Weston
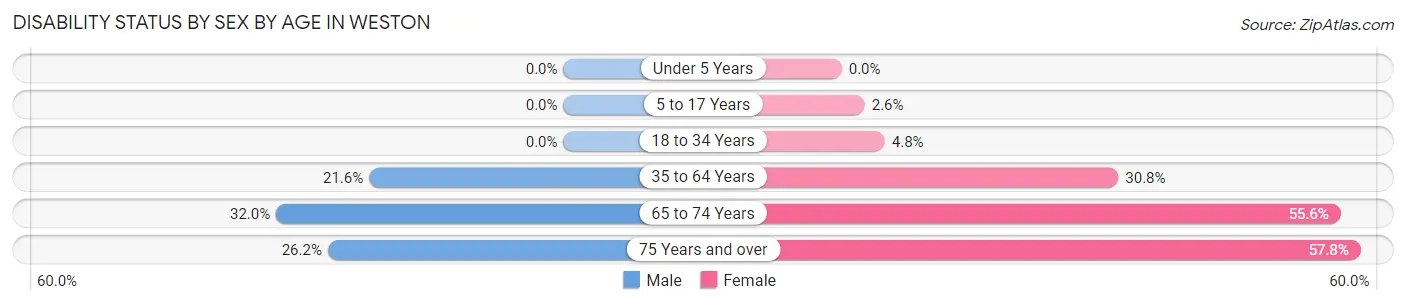
| Age Bracket | Male | Female |
| Under 5 Years | 0 (0.0%) | 0 (0.0%) |
| 5 to 17 Years | 0 (0.0%) | 8 (2.6%) |
| 18 to 34 Years | 0 (0.0%) | 17 (4.8%) |
| 35 to 64 Years | 169 (21.6%) | 243 (30.8%) |
| 65 to 74 Years | 48 (32.0%) | 95 (55.6%) |
| 75 Years and over | 37 (26.2%) | 115 (57.8%) |
Disability Class by Sex by Age in Weston
Disability Class: Hearing Difficulty
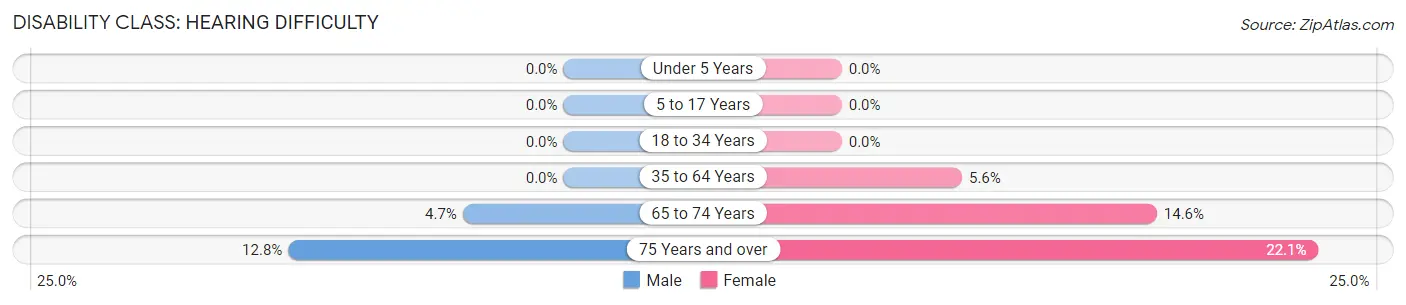
| Age Bracket | Male | Female |
| Under 5 Years | 0 (0.0%) | 0 (0.0%) |
| 5 to 17 Years | 0 (0.0%) | 0 (0.0%) |
| 18 to 34 Years | 0 (0.0%) | 0 (0.0%) |
| 35 to 64 Years | 0 (0.0%) | 44 (5.6%) |
| 65 to 74 Years | 7 (4.7%) | 25 (14.6%) |
| 75 Years and over | 18 (12.8%) | 44 (22.1%) |
Disability Class: Vision Difficulty
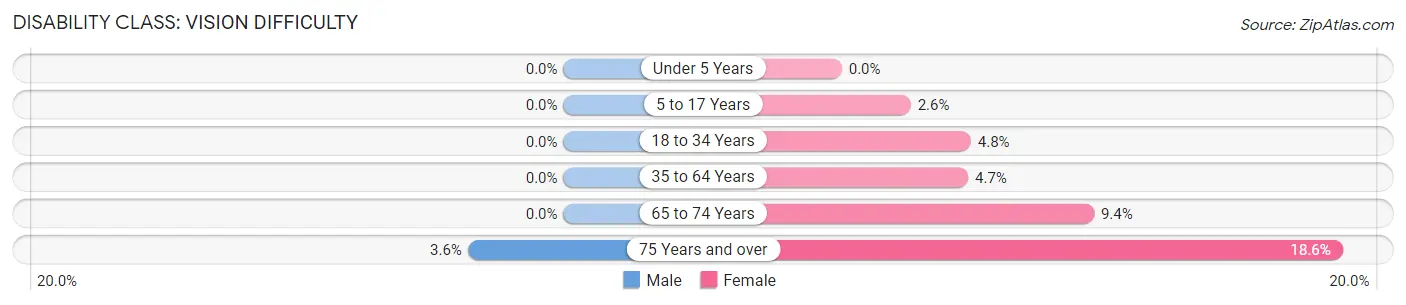
| Age Bracket | Male | Female |
| Under 5 Years | 0 (0.0%) | 0 (0.0%) |
| 5 to 17 Years | 0 (0.0%) | 8 (2.6%) |
| 18 to 34 Years | 0 (0.0%) | 17 (4.8%) |
| 35 to 64 Years | 0 (0.0%) | 37 (4.7%) |
| 65 to 74 Years | 0 (0.0%) | 16 (9.4%) |
| 75 Years and over | 5 (3.5%) | 37 (18.6%) |
Disability Class: Cognitive Difficulty
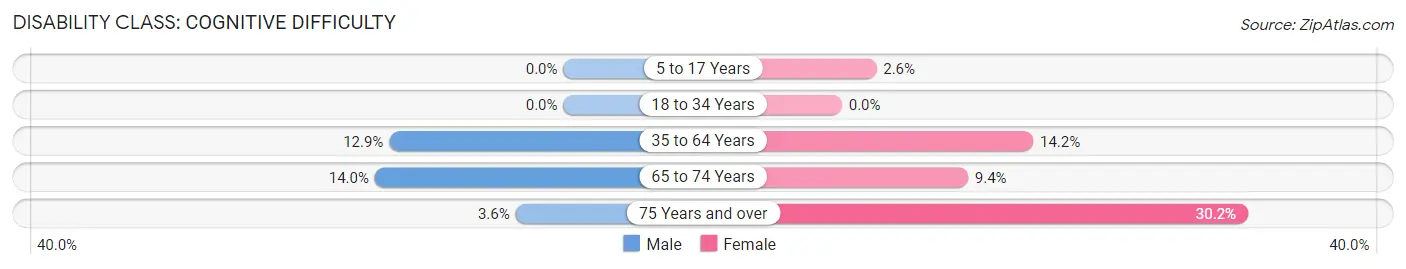
| Age Bracket | Male | Female |
| 5 to 17 Years | 0 (0.0%) | 8 (2.6%) |
| 18 to 34 Years | 0 (0.0%) | 0 (0.0%) |
| 35 to 64 Years | 101 (12.9%) | 112 (14.2%) |
| 65 to 74 Years | 21 (14.0%) | 16 (9.4%) |
| 75 Years and over | 5 (3.5%) | 60 (30.1%) |
Disability Class: Ambulatory Difficulty
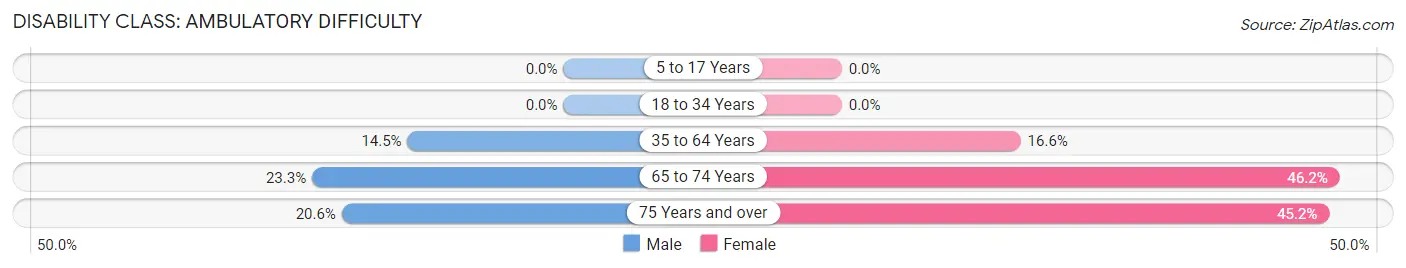
| Age Bracket | Male | Female |
| 5 to 17 Years | 0 (0.0%) | 0 (0.0%) |
| 18 to 34 Years | 0 (0.0%) | 0 (0.0%) |
| 35 to 64 Years | 113 (14.5%) | 131 (16.6%) |
| 65 to 74 Years | 35 (23.3%) | 79 (46.2%) |
| 75 Years and over | 29 (20.6%) | 90 (45.2%) |
Disability Class: Self-Care Difficulty
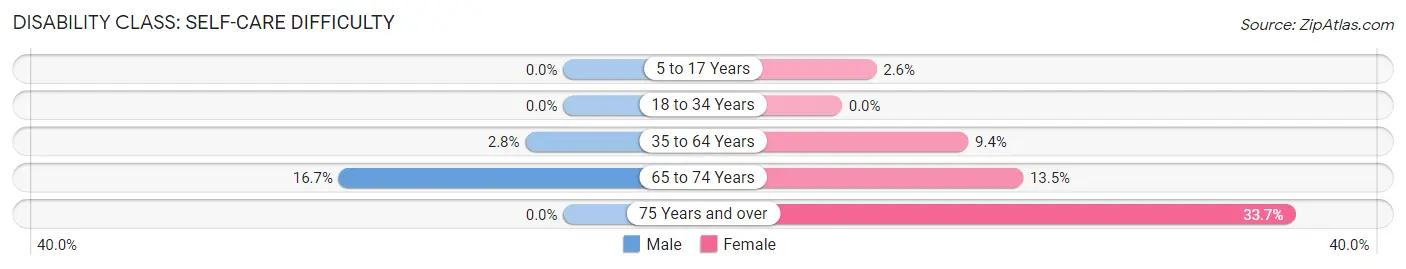
| Age Bracket | Male | Female |
| 5 to 17 Years | 0 (0.0%) | 8 (2.6%) |
| 18 to 34 Years | 0 (0.0%) | 0 (0.0%) |
| 35 to 64 Years | 22 (2.8%) | 74 (9.4%) |
| 65 to 74 Years | 25 (16.7%) | 23 (13.5%) |
| 75 Years and over | 0 (0.0%) | 67 (33.7%) |
Technology Access in Weston
Computing Device Access in Weston
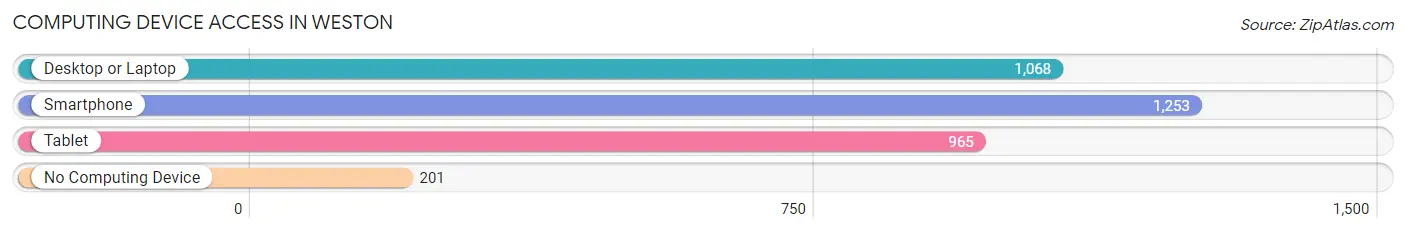
| Device Type | # Households | % Households |
| Desktop or Laptop | 1,068 | 64.0% |
| Smartphone | 1,253 | 75.1% |
| Tablet | 965 | 57.8% |
| No Computing Device | 201 | 12.0% |
| Total | 1,669 | 100.0% |
Internet Access in Weston
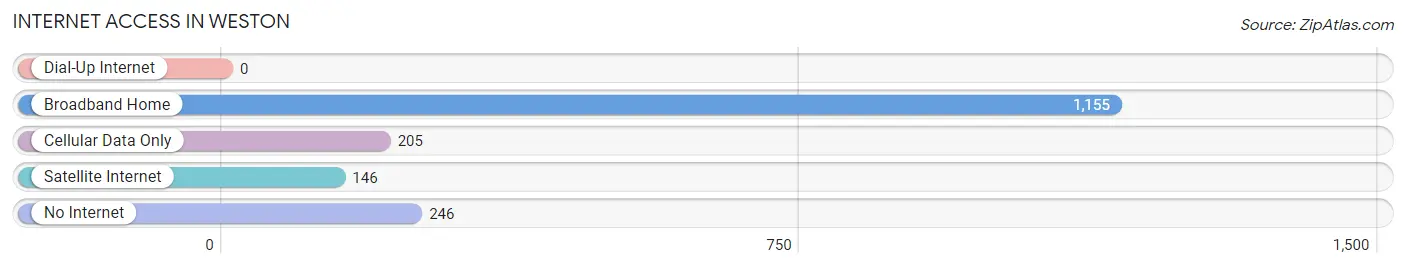
| Internet Type | # Households | % Households |
| Dial-Up Internet | 0 | 0.0% |
| Broadband Home | 1,155 | 69.2% |
| Cellular Data Only | 205 | 12.3% |
| Satellite Internet | 146 | 8.7% |
| No Internet | 246 | 14.7% |
| Total | 1,669 | 100.0% |
Weston Summary
Weston, West Virginia is a small city located in Lewis County, in the north-central part of the state. It is the county seat of Lewis County and is situated along the West Fork River. The city has a population of 4,110 as of the 2010 census, making it the largest city in Lewis County.
History
Weston was founded in 1818 by Colonel John Weston, a Revolutionary War veteran. He purchased the land from the local Native American tribes and named the settlement after himself. The town was incorporated in 1819 and quickly became a center of commerce and industry. The Weston and Gauley Bridge Turnpike was built in 1848, connecting Weston to the Ohio River and providing a major transportation route for the area.
The city was a major center of the Civil War, with several battles taking place in the area. The Battle of Carnifex Ferry was fought nearby in 1861, and the Battle of Droop Mountain was fought in 1863. After the war, Weston became a major center of the timber industry, with several sawmills and lumber companies operating in the area.
Geography
Weston is located in the Appalachian Mountains of West Virginia, in the north-central part of the state. It is situated along the West Fork River, at an elevation of 1,845 feet. The city covers an area of 2.3 square miles, all of which is land.
The climate in Weston is humid continental, with hot, humid summers and cold, snowy winters. The average annual temperature is 50.2 degrees Fahrenheit, and the average annual precipitation is 41.3 inches.
Economy
Weston’s economy is largely based on the timber industry, with several sawmills and lumber companies operating in the area. The city is also home to several manufacturing companies, including a paper mill, a furniture factory, and a plastics plant.
Weston is also home to several tourist attractions, including the Trans-Allegheny Lunatic Asylum, the West Fork River Trail, and the West Virginia Motor Speedway. The city is also home to several festivals, including the Lewis County Fair and the Weston Apple Festival.
Demographics
As of the 2010 census, Weston had a population of 4,110. The racial makeup of the city was 95.2% White, 1.7% African American, 0.3% Native American, 0.4% Asian, 0.1% Pacific Islander, 0.7% from other races, and 1.6% from two or more races. Hispanic or Latino of any race were 1.7% of the population.
The median household income in Weston was $30,938, and the median family income was $37,917. The per capita income was $17,845. About 17.2% of the population was below the poverty line.
Common Questions
What is Per Capita Income in Weston?
Per Capita income in Weston is $28,388.
What is the Median Family Income in Weston?
Median Family Income in Weston is $57,670.
What is the Median Household income in Weston?
Median Household Income in Weston is $44,955.
What is Income or Wage Gap in Weston?
Income or Wage Gap in Weston is 14.3%.
Women in Weston earn 85.7 cents for every dollar earned by a man.
What is Inequality or Gini Index in Weston?
Inequality or Gini Index in Weston is 0.47.
What is the Total Population of Weston?
Total Population of Weston is 3,922.
What is the Total Male Population of Weston?
Total Male Population of Weston is 2,031.
What is the Total Female Population of Weston?
Total Female Population of Weston is 1,891.
What is the Ratio of Males per 100 Females in Weston?
There are 107.40 Males per 100 Females in Weston.
What is the Ratio of Females per 100 Males in Weston?
There are 93.11 Females per 100 Males in Weston.
What is the Median Population Age in Weston?
Median Population Age in Weston is 40.7 Years.
What is the Average Family Size in Weston
Average Family Size in Weston is 3.0 People.
What is the Average Household Size in Weston
Average Household Size in Weston is 2.4 People.
How Large is the Labor Force in Weston?
There are 1,806 People in the Labor Forcein in Weston.
What is the Percentage of People in the Labor Force in Weston?
55.7% of People are in the Labor Force in Weston.
What is the Unemployment Rate in Weston?
Unemployment Rate in Weston is 12.9%.