Welch, WV Map & Demographics
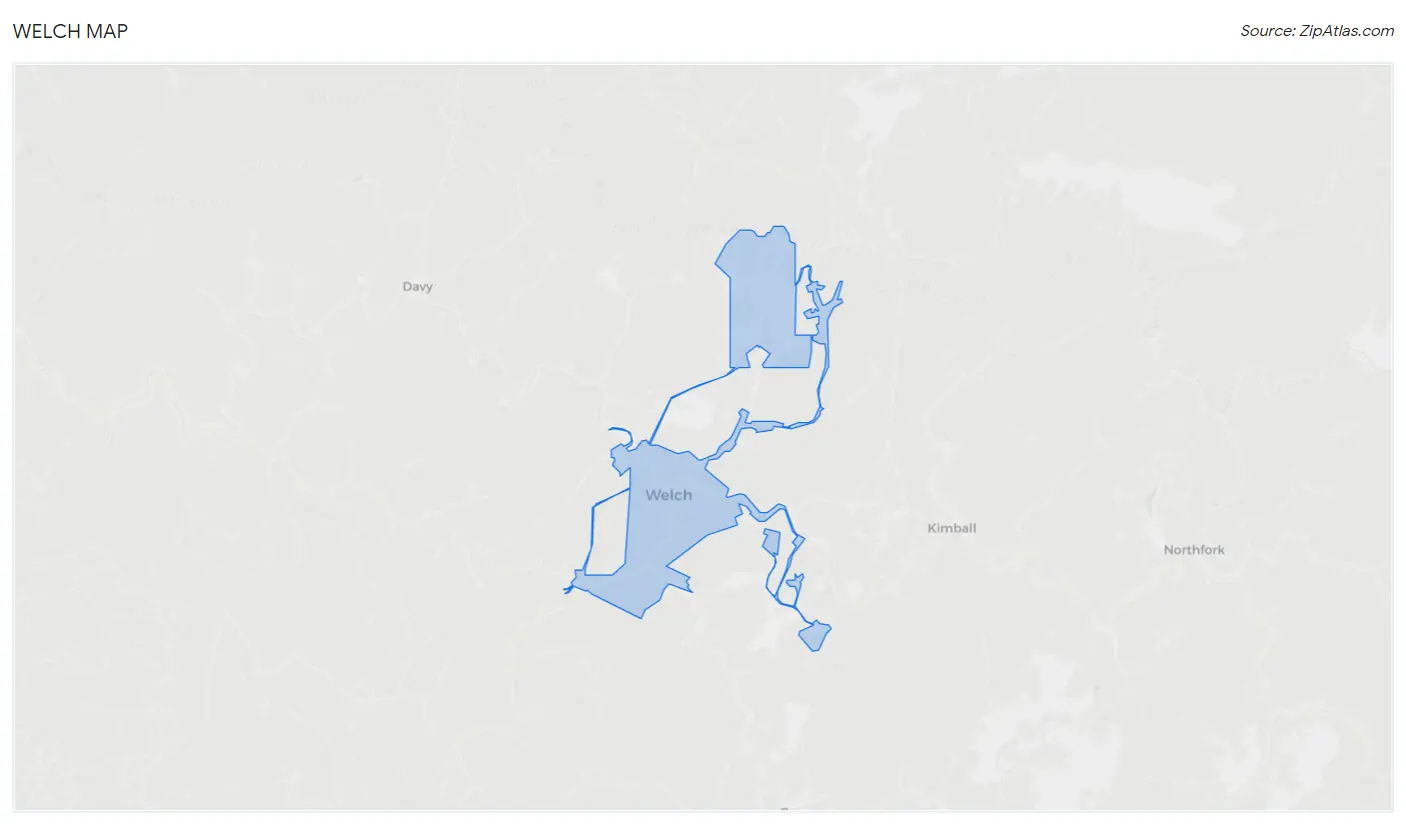
Welch Map
Welch Overview
$11,974
PER CAPITA INCOME
$51,213
AVG FAMILY INCOME
$32,109
AVG HOUSEHOLD INCOME
43.9%
WAGE / INCOME GAP [ % ]
56.1¢/ $1
WAGE / INCOME GAP [ $ ]
0.41
INEQUALITY / GINI INDEX
3,475
TOTAL POPULATION
2,587
MALE POPULATION
888
FEMALE POPULATION
291.33
MALES / 100 FEMALES
34.33
FEMALES / 100 MALES
41.2
MEDIAN AGE
3.2
AVG FAMILY SIZE
2.1
AVG HOUSEHOLD SIZE
508
LABOR FORCE [ PEOPLE ]
16.2%
PERCENT IN LABOR FORCE
8.7%
UNEMPLOYMENT RATE
Welch Zip Codes
Income in Welch
Income Overview in Welch
Per Capita Income in Welch is $11,974, while median incomes of families and households are $51,213 and $32,109 respectively.
| Characteristic | Number | Measure |
| Per Capita Income | 3,475 | $11,974 |
| Median Family Income | 355 | $51,213 |
| Mean Family Income | 355 | $50,913 |
| Median Household Income | 808 | $32,109 |
| Mean Household Income | 808 | $38,495 |
| Income Deficit | 355 | $0 |
| Wage / Income Gap (%) | 3,475 | 43.94% |
| Wage / Income Gap ($) | 3,475 | 56.06¢ per $1 |
| Gini / Inequality Index | 3,475 | 0.41 |
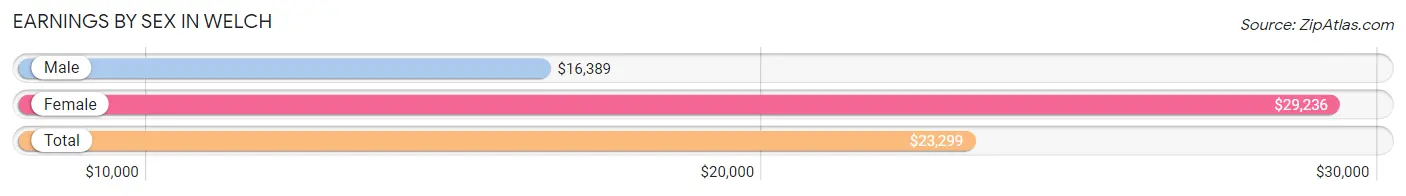
Earnings by Sex in Welch
Average Earnings in Welch are $23,299, $16,389 for men and $29,236 for women, a difference of 43.9%.
| Sex | Number | Average Earnings |
| Male | 496 (61.0%) | $16,389 |
| Female | 317 (39.0%) | $29,236 |
| Total | 813 (100.0%) | $23,299 |
Earnings by Sex by Income Bracket in Welch
The most common earnings brackets in Welch are $2,499 or less for men (117 | 23.6%) and $35,000 to $39,999 for women (54 | 17.0%).
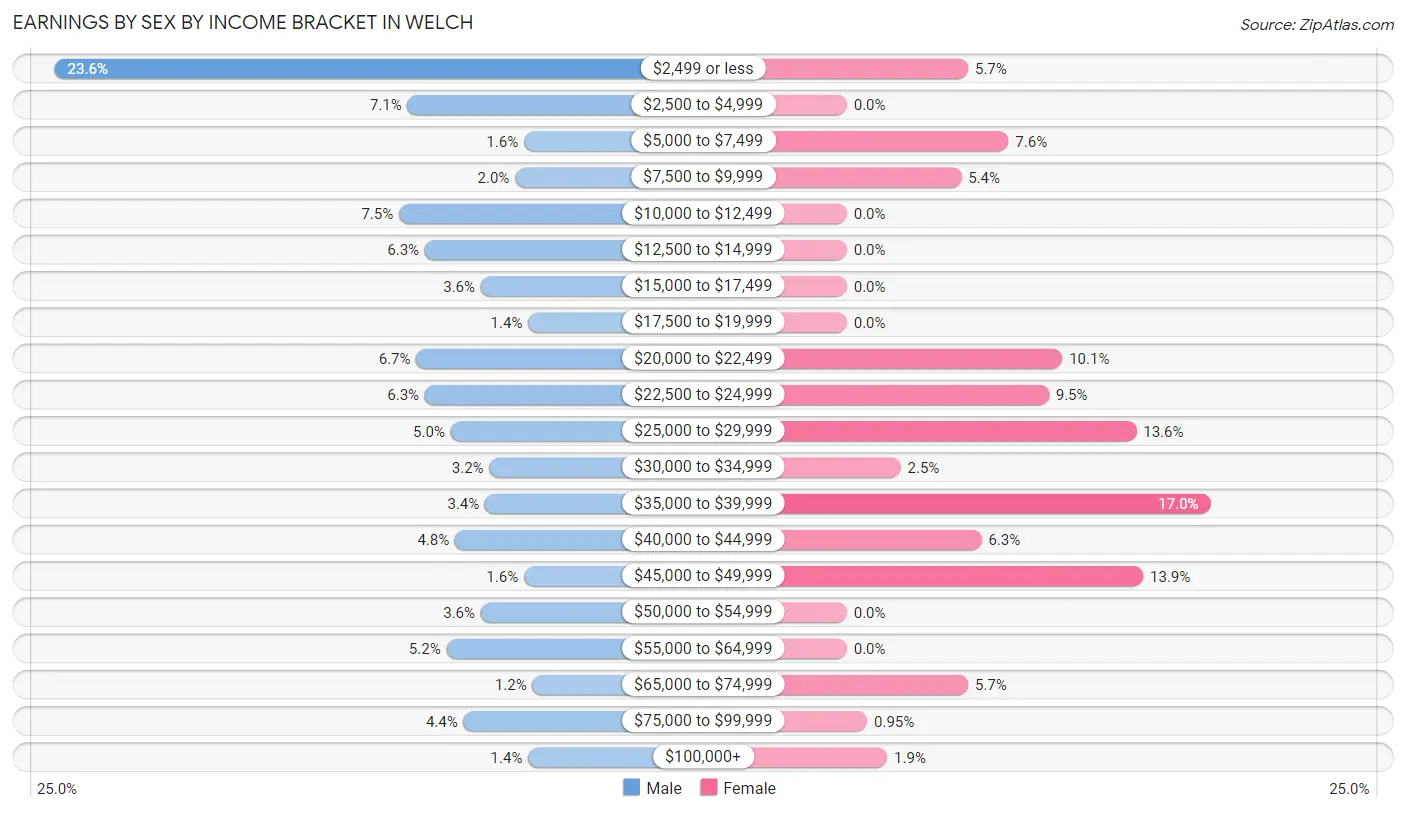
| Income | Male | Female |
| $2,499 or less | 117 (23.6%) | 18 (5.7%) |
| $2,500 to $4,999 | 35 (7.1%) | 0 (0.0%) |
| $5,000 to $7,499 | 8 (1.6%) | 24 (7.6%) |
| $7,500 to $9,999 | 10 (2.0%) | 17 (5.4%) |
| $10,000 to $12,499 | 37 (7.5%) | 0 (0.0%) |
| $12,500 to $14,999 | 31 (6.2%) | 0 (0.0%) |
| $15,000 to $17,499 | 18 (3.6%) | 0 (0.0%) |
| $17,500 to $19,999 | 7 (1.4%) | 0 (0.0%) |
| $20,000 to $22,499 | 33 (6.7%) | 32 (10.1%) |
| $22,500 to $24,999 | 31 (6.2%) | 30 (9.5%) |
| $25,000 to $29,999 | 25 (5.0%) | 43 (13.6%) |
| $30,000 to $34,999 | 16 (3.2%) | 8 (2.5%) |
| $35,000 to $39,999 | 17 (3.4%) | 54 (17.0%) |
| $40,000 to $44,999 | 24 (4.8%) | 20 (6.3%) |
| $45,000 to $49,999 | 8 (1.6%) | 44 (13.9%) |
| $50,000 to $54,999 | 18 (3.6%) | 0 (0.0%) |
| $55,000 to $64,999 | 26 (5.2%) | 0 (0.0%) |
| $65,000 to $74,999 | 6 (1.2%) | 18 (5.7%) |
| $75,000 to $99,999 | 22 (4.4%) | 3 (0.9%) |
| $100,000+ | 7 (1.4%) | 6 (1.9%) |
| Total | 496 (100.0%) | 317 (100.0%) |
Earnings by Sex by Educational Attainment in Welch
Average earnings in Welch are $20,985 for men and $29,236 for women, a difference of 28.2%. Men with an educational attainment of bachelor's degree enjoy the highest average annual earnings of $75,250, while those with high school diploma education earn the least with $15,391. Women with an educational attainment of high school diploma earn the most with the average annual earnings of $37,875, while those with bachelor's degree education have the smallest earnings of $24,042.
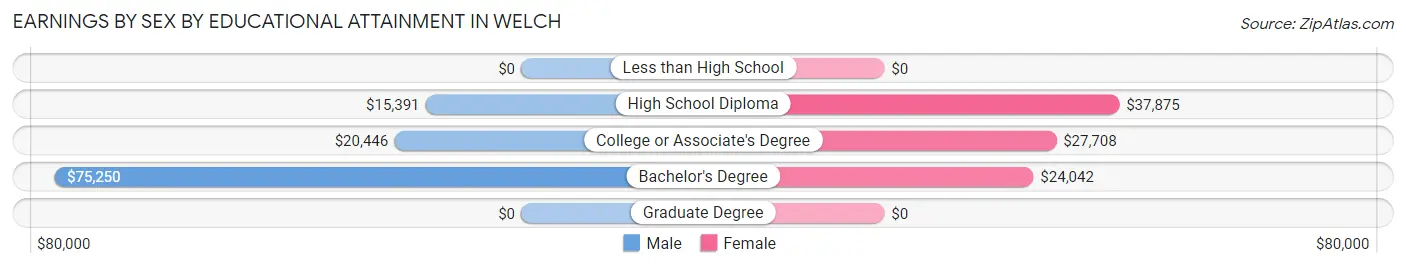
| Educational Attainment | Male Income | Female Income |
| Less than High School | - | - |
| High School Diploma | $15,391 | $37,875 |
| College or Associate's Degree | $20,446 | $27,708 |
| Bachelor's Degree | $75,250 | $24,042 |
| Graduate Degree | - | - |
| Total | $20,985 | $29,236 |
Family Income in Welch
Family Income Brackets in Welch
According to the Welch family income data, there are 142 families falling into the $50,000 to $74,999 income range, which is the most common income bracket and makes up 40.0% of all families.
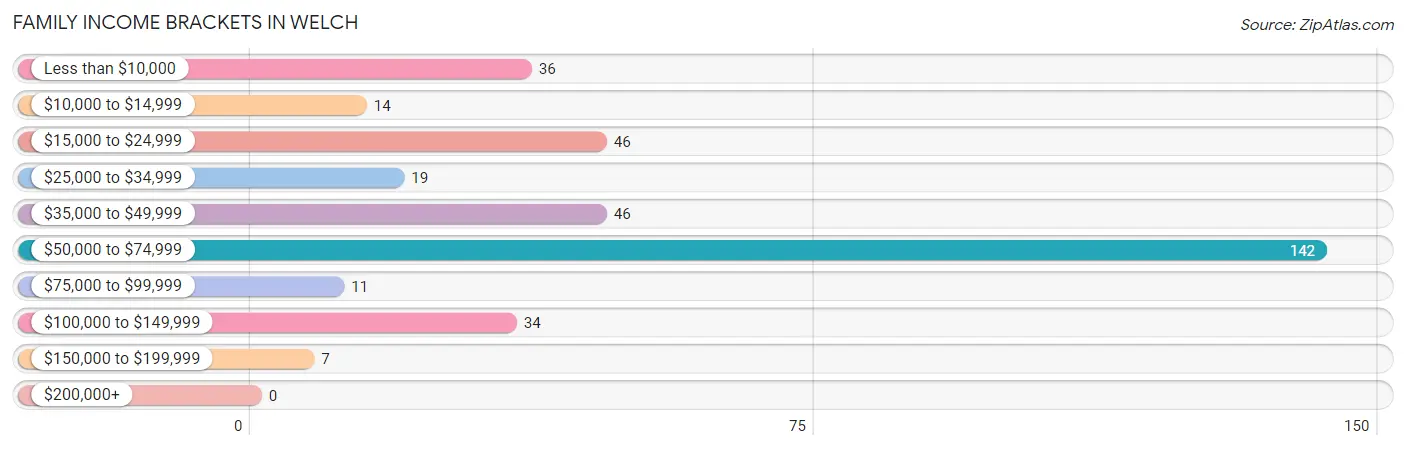
| Income Bracket | # Families | % Families |
| Less than $10,000 | 36 | 10.1% |
| $10,000 to $14,999 | 14 | 3.9% |
| $15,000 to $24,999 | 46 | 13.0% |
| $25,000 to $34,999 | 19 | 5.4% |
| $35,000 to $49,999 | 46 | 13.0% |
| $50,000 to $74,999 | 142 | 40.0% |
| $75,000 to $99,999 | 11 | 3.1% |
| $100,000 to $149,999 | 34 | 9.6% |
| $150,000 to $199,999 | 7 | 2.0% |
| $200,000+ | 0 | 0.0% |
Family Income by Famaliy Size in Welch
4-person families (69 | 19.4%) account for the highest median family income in Welch with $53,939 per family, while 2-person families (238 | 67.0%) have the highest median income of $19,896 per family member.
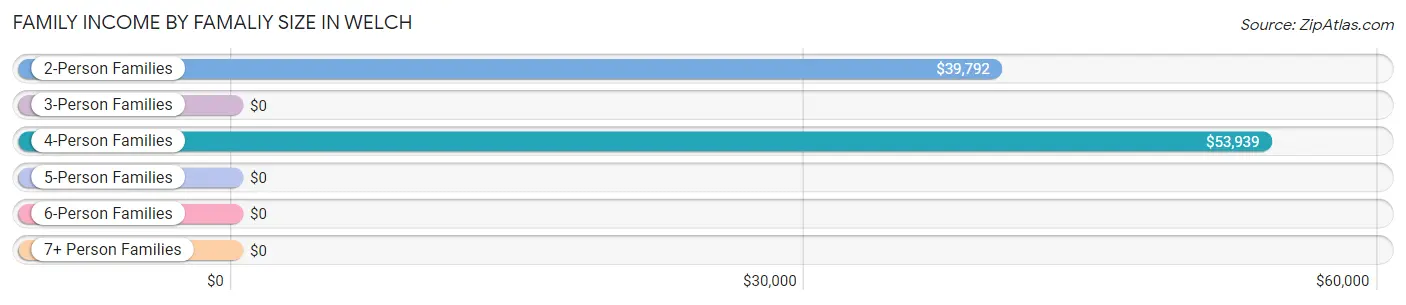
| Income Bracket | # Families | Median Income |
| 2-Person Families | 238 (67.0%) | $39,792 |
| 3-Person Families | 48 (13.5%) | $0 |
| 4-Person Families | 69 (19.4%) | $53,939 |
| 5-Person Families | 0 (0.0%) | $0 |
| 6-Person Families | 0 (0.0%) | $0 |
| 7+ Person Families | 0 (0.0%) | $0 |
| Total | 355 (100.0%) | $51,213 |
Family Income by Number of Earners in Welch
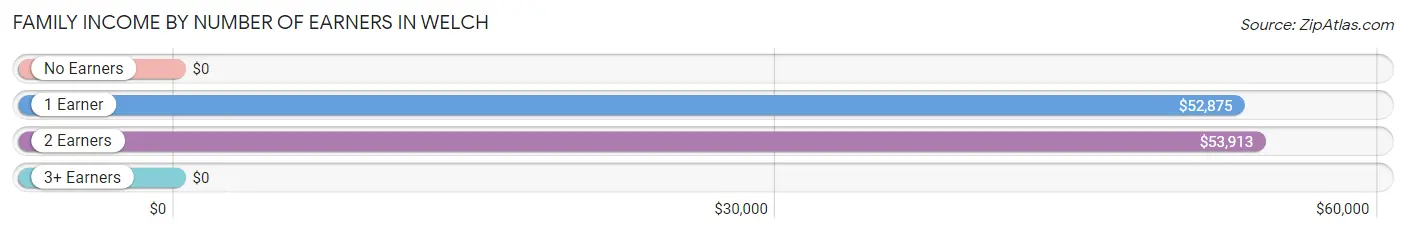
| Number of Earners | # Families | Median Income |
| No Earners | 150 (42.2%) | $0 |
| 1 Earner | 119 (33.5%) | $52,875 |
| 2 Earners | 86 (24.2%) | $53,913 |
| 3+ Earners | 0 (0.0%) | $0 |
| Total | 355 (100.0%) | $51,213 |
Household Income in Welch
Household Income Brackets in Welch
With 209 households falling in the category, the $10,000 to $14,999 income range is the most frequent in Welch, accounting for 25.9% of all households.
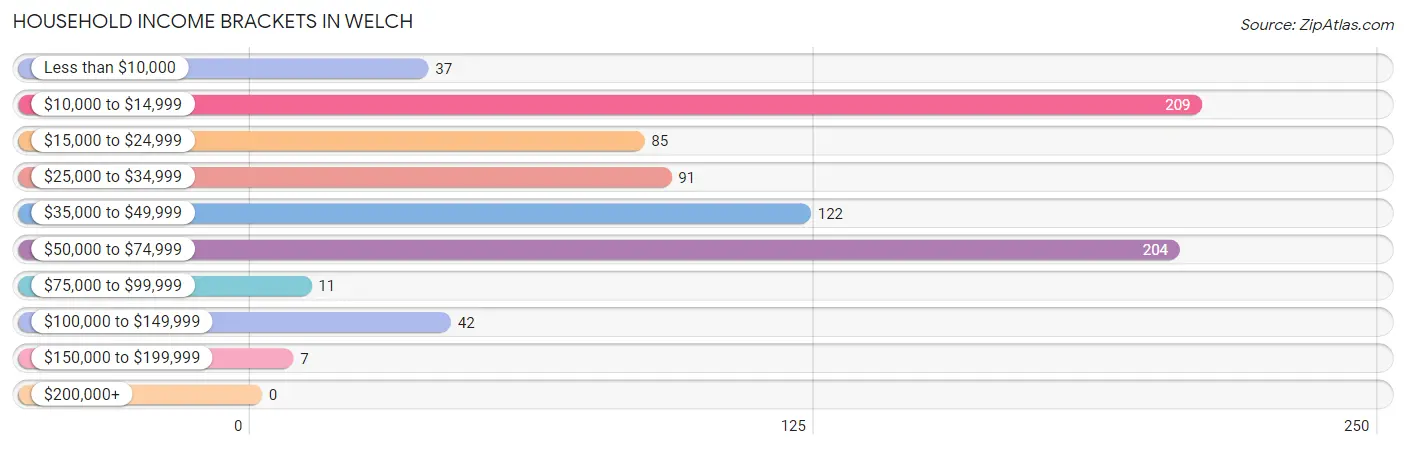
| Income Bracket | # Households | % Households |
| Less than $10,000 | 37 | 4.6% |
| $10,000 to $14,999 | 209 | 25.9% |
| $15,000 to $24,999 | 85 | 10.5% |
| $25,000 to $34,999 | 91 | 11.3% |
| $35,000 to $49,999 | 122 | 15.1% |
| $50,000 to $74,999 | 204 | 25.2% |
| $75,000 to $99,999 | 11 | 1.4% |
| $100,000 to $149,999 | 42 | 5.2% |
| $150,000 to $199,999 | 7 | 0.9% |
| $200,000+ | 0 | 0.0% |
Household Income by Householder Age in Welch
The median household income in Welch is $32,109, with the highest median household income of $38,269 found in the 25 to 44 years age bracket for the primary householder. A total of 138 households (17.1%) fall into this category. Meanwhile, the 15 to 24 years age bracket for the primary householder has the lowest median household income of $0, with 8 households (1.0%) in this group.
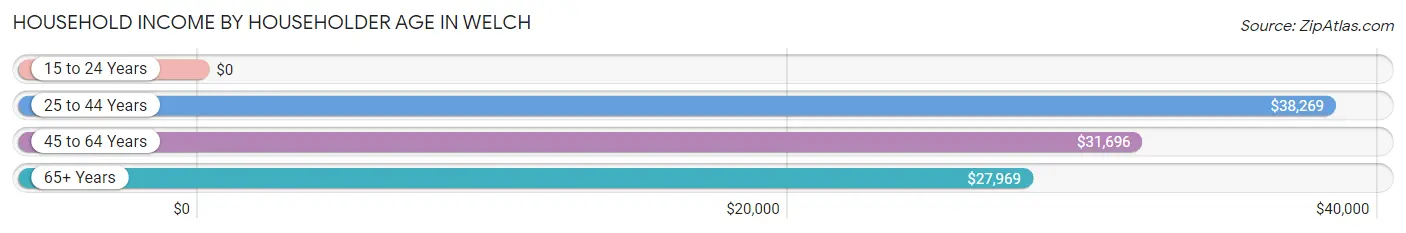
| Income Bracket | # Households | Median Income |
| 15 to 24 Years | 8 (1.0%) | $0 |
| 25 to 44 Years | 138 (17.1%) | $38,269 |
| 45 to 64 Years | 323 (40.0%) | $31,696 |
| 65+ Years | 339 (42.0%) | $27,969 |
| Total | 808 (100.0%) | $32,109 |
Poverty in Welch
Income Below Poverty by Sex and Age in Welch
With 23.2% poverty level for males and 34.0% for females among the residents of Welch, 5 year old males and 16 and 17 year old females are the most vulnerable to poverty, with 60 males (100.0%) and 7 females (100.0%) in their respective age groups living below the poverty level.
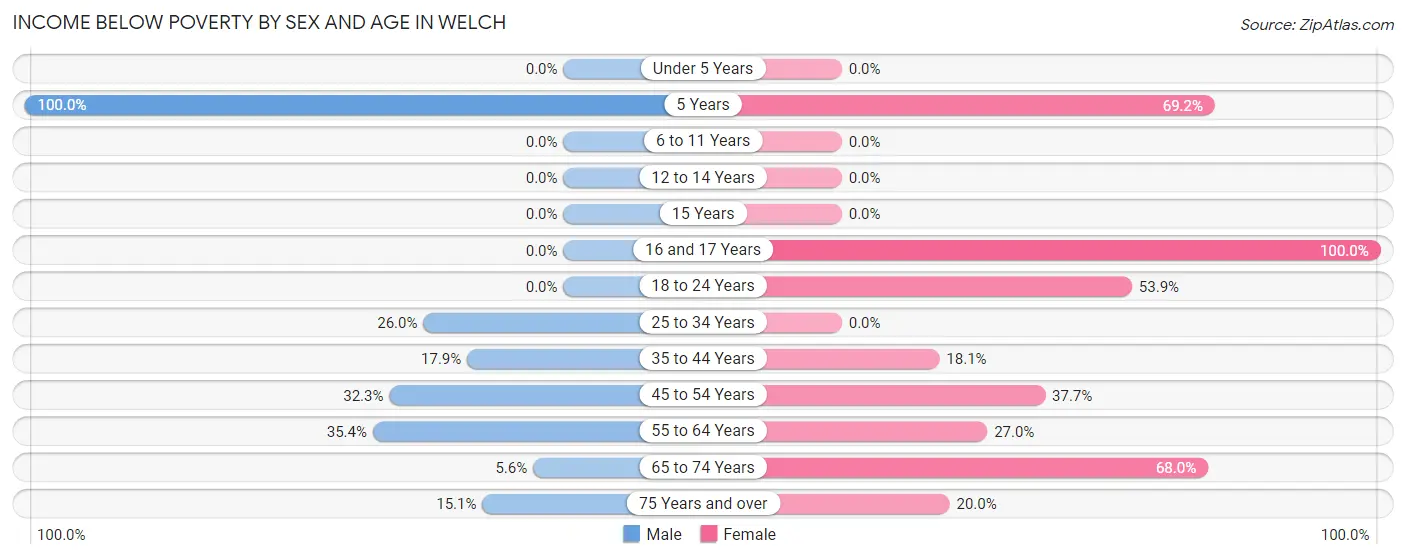
| Age Bracket | Male | Female |
| Under 5 Years | 0 (0.0%) | 0 (0.0%) |
| 5 Years | 60 (100.0%) | 9 (69.2%) |
| 6 to 11 Years | 0 (0.0%) | 0 (0.0%) |
| 12 to 14 Years | 0 (0.0%) | 0 (0.0%) |
| 15 Years | 0 (0.0%) | 0 (0.0%) |
| 16 and 17 Years | 0 (0.0%) | 7 (100.0%) |
| 18 to 24 Years | 0 (0.0%) | 21 (53.8%) |
| 25 to 34 Years | 13 (26.0%) | 0 (0.0%) |
| 35 to 44 Years | 10 (17.9%) | 27 (18.1%) |
| 45 to 54 Years | 21 (32.3%) | 60 (37.7%) |
| 55 to 64 Years | 58 (35.4%) | 44 (27.0%) |
| 65 to 74 Years | 5 (5.6%) | 123 (68.0%) |
| 75 Years and over | 14 (15.0%) | 10 (20.0%) |
| Total | 181 (23.2%) | 301 (34.0%) |
Income Above Poverty by Sex and Age in Welch
According to the poverty statistics in Welch, males aged 6 to 11 years and females aged 6 to 11 years are the age groups that are most secure financially, with 100.0% of males and 100.0% of females in these age groups living above the poverty line.
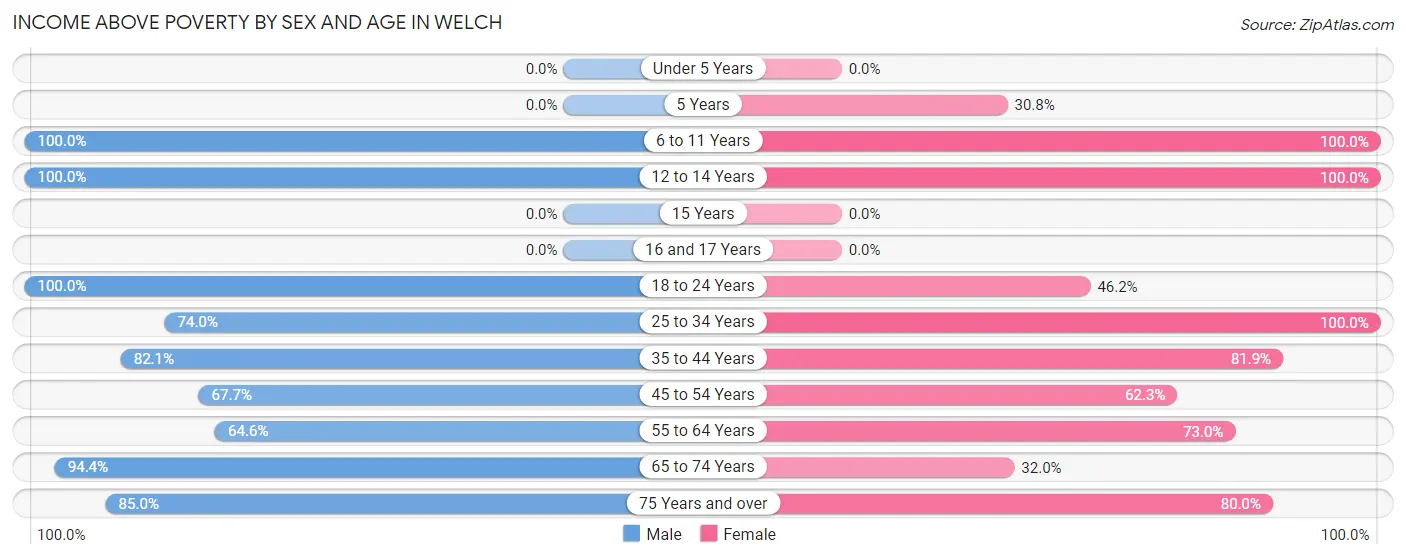
| Age Bracket | Male | Female |
| Under 5 Years | 0 (0.0%) | 0 (0.0%) |
| 5 Years | 0 (0.0%) | 4 (30.8%) |
| 6 to 11 Years | 180 (100.0%) | 34 (100.0%) |
| 12 to 14 Years | 21 (100.0%) | 30 (100.0%) |
| 15 Years | 0 (0.0%) | 0 (0.0%) |
| 16 and 17 Years | 0 (0.0%) | 0 (0.0%) |
| 18 to 24 Years | 4 (100.0%) | 18 (46.2%) |
| 25 to 34 Years | 37 (74.0%) | 60 (100.0%) |
| 35 to 44 Years | 46 (82.1%) | 122 (81.9%) |
| 45 to 54 Years | 44 (67.7%) | 99 (62.3%) |
| 55 to 64 Years | 106 (64.6%) | 119 (73.0%) |
| 65 to 74 Years | 84 (94.4%) | 58 (32.0%) |
| 75 Years and over | 79 (85.0%) | 40 (80.0%) |
| Total | 601 (76.8%) | 584 (66.0%) |
Income Below Poverty Among Married-Couple Families in Welch
The poverty statistics for married-couple families in Welch show that 17.9% or 40 of the total 224 families live below the poverty line. Families with no children have the highest poverty rate of 23.0%, comprising of 40 families. On the other hand, families with 1 or 2 children have the lowest poverty rate of 0.0%, which includes 0 families.
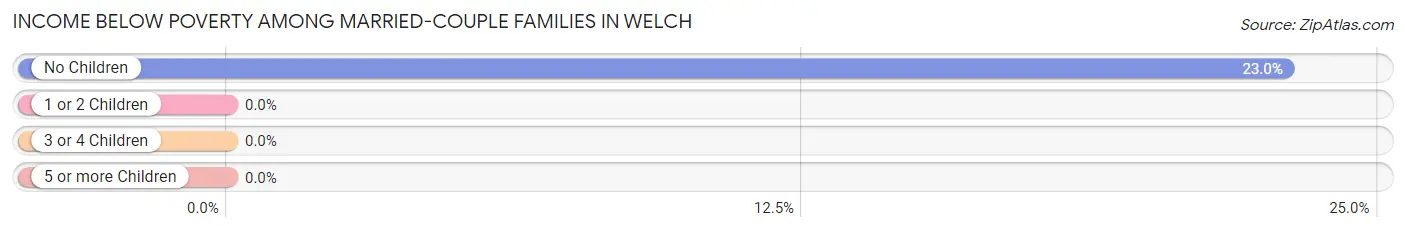
| Children | Above Poverty | Below Poverty |
| No Children | 134 (77.0%) | 40 (23.0%) |
| 1 or 2 Children | 50 (100.0%) | 0 (0.0%) |
| 3 or 4 Children | 0 (0.0%) | 0 (0.0%) |
| 5 or more Children | 0 (0.0%) | 0 (0.0%) |
| Total | 184 (82.1%) | 40 (17.9%) |
Income Below Poverty Among Single-Parent Households in Welch
According to the poverty data in Welch, 39.4% or 13 single-father households and 30.6% or 30 single-mother households are living below the poverty line. Among single-father households, those with 1 or 2 children have the highest poverty rate, with 13 households (52.0%) experiencing poverty. Likewise, among single-mother households, those with no children have the highest poverty rate, with 15 households (39.5%) falling below the poverty line.
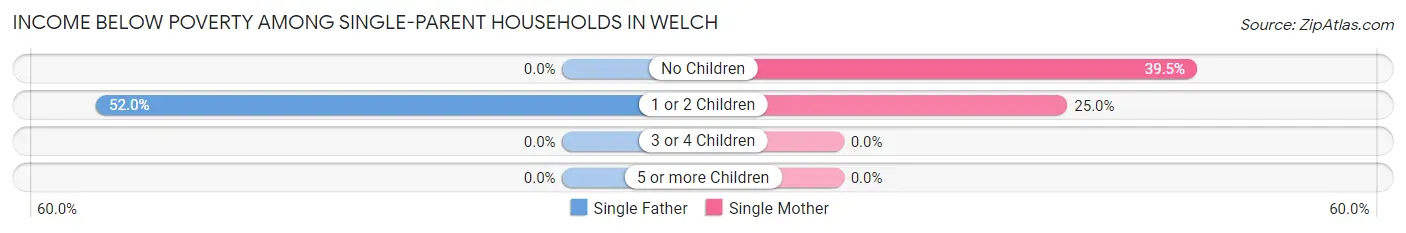
| Children | Single Father | Single Mother |
| No Children | 0 (0.0%) | 15 (39.5%) |
| 1 or 2 Children | 13 (52.0%) | 15 (25.0%) |
| 3 or 4 Children | 0 (0.0%) | 0 (0.0%) |
| 5 or more Children | 0 (0.0%) | 0 (0.0%) |
| Total | 13 (39.4%) | 30 (30.6%) |
Income Below Poverty Among Married-Couple vs Single-Parent Households in Welch
The poverty data for Welch shows that 40 of the married-couple family households (17.9%) and 43 of the single-parent households (32.8%) are living below the poverty level. Within the married-couple family households, those with no children have the highest poverty rate, with 40 households (23.0%) falling below the poverty line. Among the single-parent households, those with 1 or 2 children have the highest poverty rate, with 28 household (32.9%) living below poverty.
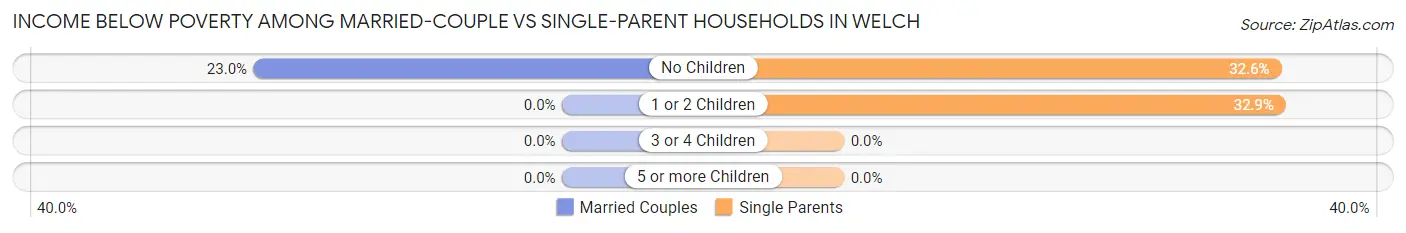
| Children | Married-Couple Families | Single-Parent Households |
| No Children | 40 (23.0%) | 15 (32.6%) |
| 1 or 2 Children | 0 (0.0%) | 28 (32.9%) |
| 3 or 4 Children | 0 (0.0%) | 0 (0.0%) |
| 5 or more Children | 0 (0.0%) | 0 (0.0%) |
| Total | 40 (17.9%) | 43 (32.8%) |
Race in Welch
The most populous races in Welch are White / Caucasian (2,548 | 73.3%), Black / African American (890 | 25.6%), and Hispanic or Latino (257 | 7.4%).
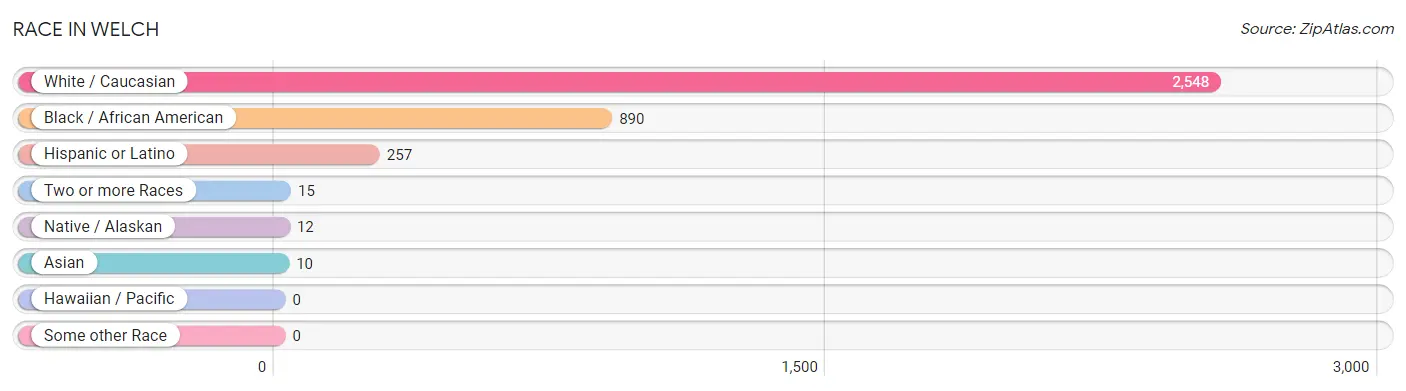
| Race | # Population | % Population |
| Asian | 10 | 0.3% |
| Black / African American | 890 | 25.6% |
| Hawaiian / Pacific | 0 | 0.0% |
| Hispanic or Latino | 257 | 7.4% |
| Native / Alaskan | 12 | 0.4% |
| White / Caucasian | 2,548 | 73.3% |
| Two or more Races | 15 | 0.4% |
| Some other Race | 0 | 0.0% |
| Total | 3,475 | 100.0% |
Ancestry in Welch
The most populous ancestries reported in Welch are European (313 | 9.0%), American (201 | 5.8%), English (154 | 4.4%), German (104 | 3.0%), and Irish (103 | 3.0%), together accounting for 25.2% of all Welch residents.
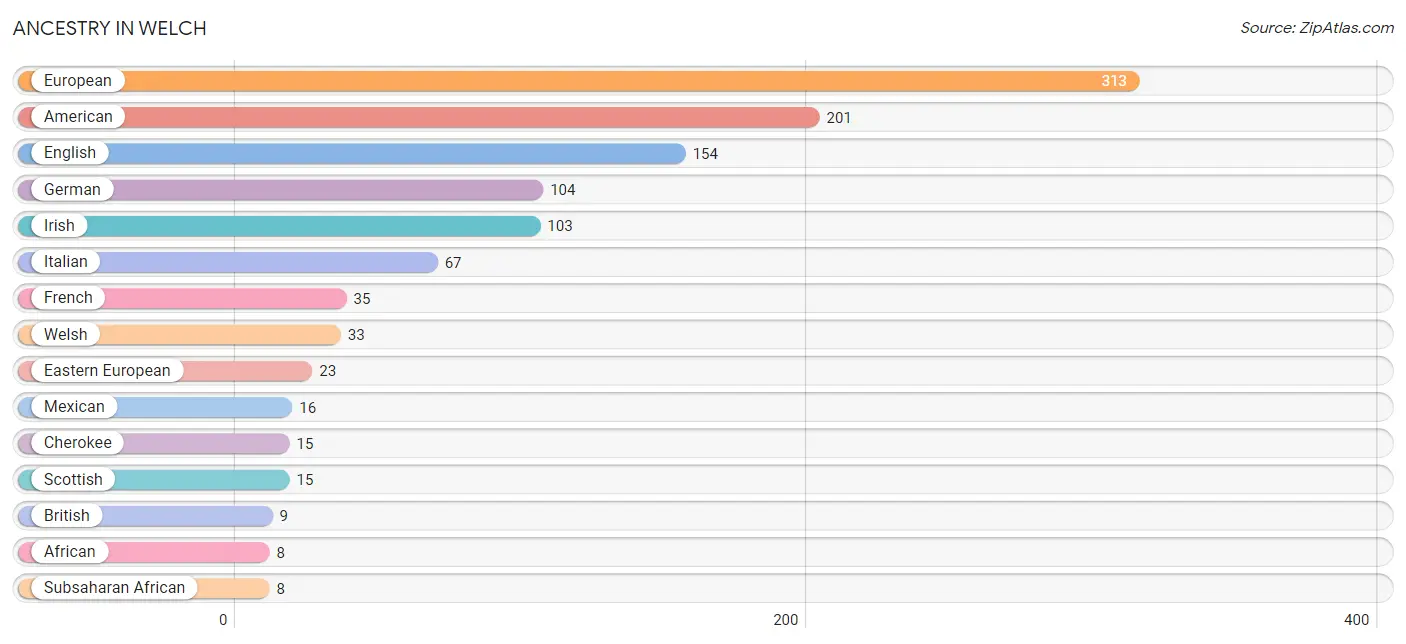
| Ancestry | # Population | % Population |
| African | 8 | 0.2% |
| American | 201 | 5.8% |
| Armenian | 7 | 0.2% |
| British | 9 | 0.3% |
| Cherokee | 15 | 0.4% |
| Dutch | 3 | 0.1% |
| Eastern European | 23 | 0.7% |
| English | 154 | 4.4% |
| European | 313 | 9.0% |
| French | 35 | 1.0% |
| German | 104 | 3.0% |
| Irish | 103 | 3.0% |
| Italian | 67 | 1.9% |
| Mexican | 16 | 0.5% |
| Polish | 7 | 0.2% |
| Puerto Rican | 7 | 0.2% |
| Scottish | 15 | 0.4% |
| Subsaharan African | 8 | 0.2% |
| Welsh | 33 | 0.9% | View All 19 Rows |
Immigrants in Welch
The most numerous immigrant groups reported in Welch came from Latin America (180 | 5.2%), Central America (125 | 3.6%), Mexico (117 | 3.4%), South America (38 | 1.1%), and Europe (34 | 1.0%), together accounting for 14.2% of all Welch residents.
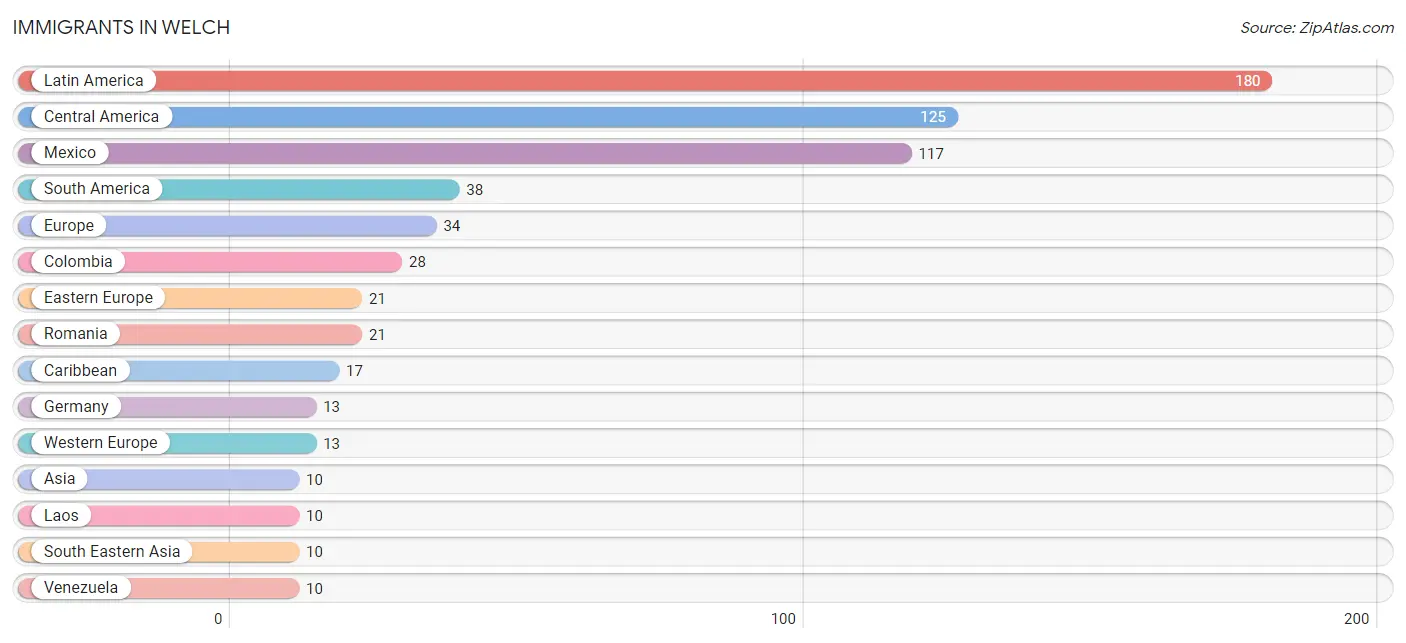
| Immigration Origin | # Population | % Population |
| Africa | 9 | 0.3% |
| Asia | 10 | 0.3% |
| Caribbean | 17 | 0.5% |
| Central America | 125 | 3.6% |
| Colombia | 28 | 0.8% |
| Cuba | 9 | 0.3% |
| Dominican Republic | 8 | 0.2% |
| Eastern Europe | 21 | 0.6% |
| Europe | 34 | 1.0% |
| Germany | 13 | 0.4% |
| Ghana | 9 | 0.3% |
| Guatemala | 8 | 0.2% |
| Laos | 10 | 0.3% |
| Latin America | 180 | 5.2% |
| Mexico | 117 | 3.4% |
| Romania | 21 | 0.6% |
| South America | 38 | 1.1% |
| South Eastern Asia | 10 | 0.3% |
| Venezuela | 10 | 0.3% |
| Western Africa | 9 | 0.3% |
| Western Europe | 13 | 0.4% | View All 21 Rows |
Sex and Age in Welch
Sex and Age in Welch
The most populous age groups in Welch are 35 to 39 Years (394 | 15.2%) for men and 70 to 74 Years (139 | 15.7%) for women.
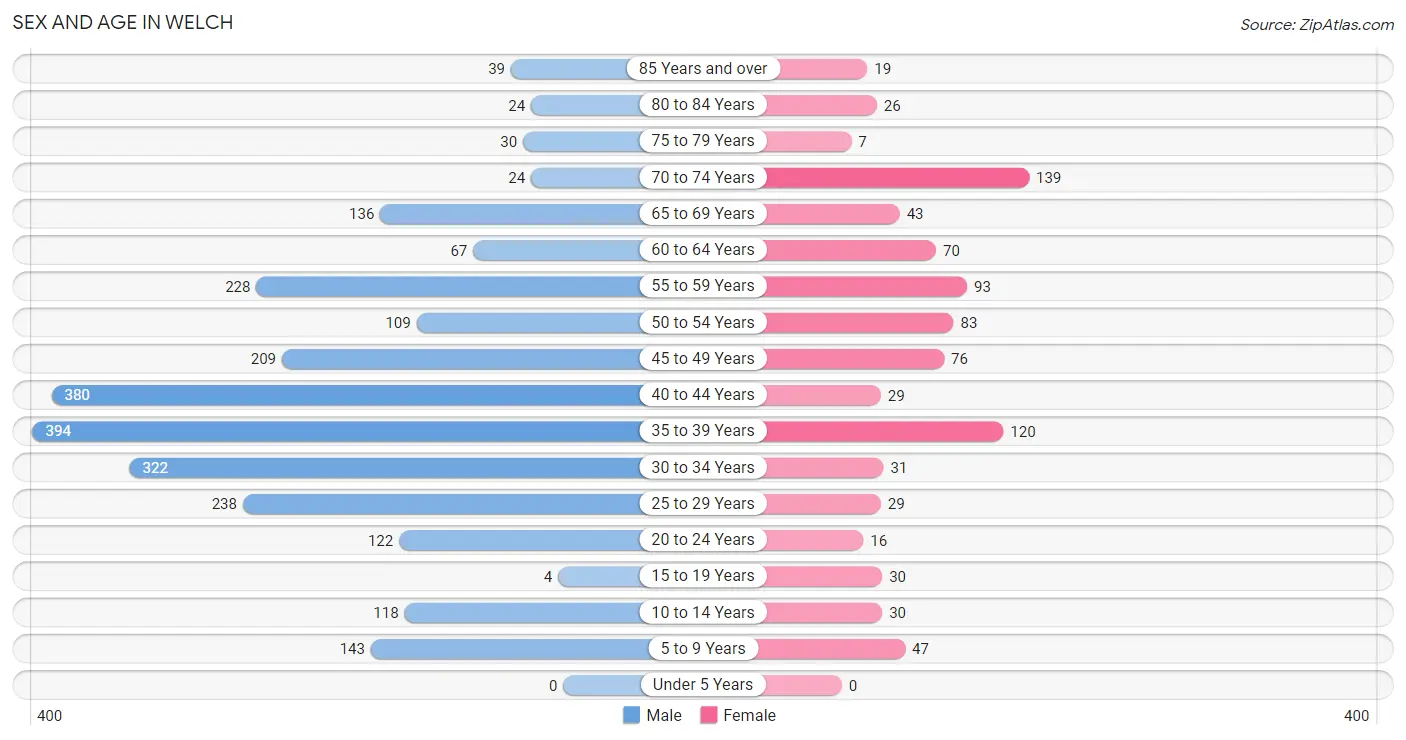
| Age Bracket | Male | Female |
| Under 5 Years | 0 (0.0%) | 0 (0.0%) |
| 5 to 9 Years | 143 (5.5%) | 47 (5.3%) |
| 10 to 14 Years | 118 (4.6%) | 30 (3.4%) |
| 15 to 19 Years | 4 (0.2%) | 30 (3.4%) |
| 20 to 24 Years | 122 (4.7%) | 16 (1.8%) |
| 25 to 29 Years | 238 (9.2%) | 29 (3.3%) |
| 30 to 34 Years | 322 (12.4%) | 31 (3.5%) |
| 35 to 39 Years | 394 (15.2%) | 120 (13.5%) |
| 40 to 44 Years | 380 (14.7%) | 29 (3.3%) |
| 45 to 49 Years | 209 (8.1%) | 76 (8.6%) |
| 50 to 54 Years | 109 (4.2%) | 83 (9.3%) |
| 55 to 59 Years | 228 (8.8%) | 93 (10.5%) |
| 60 to 64 Years | 67 (2.6%) | 70 (7.9%) |
| 65 to 69 Years | 136 (5.3%) | 43 (4.8%) |
| 70 to 74 Years | 24 (0.9%) | 139 (15.7%) |
| 75 to 79 Years | 30 (1.2%) | 7 (0.8%) |
| 80 to 84 Years | 24 (0.9%) | 26 (2.9%) |
| 85 Years and over | 39 (1.5%) | 19 (2.1%) |
| Total | 2,587 (100.0%) | 888 (100.0%) |
Families and Households in Welch
Median Family Size in Welch
The median family size in Welch is 3.22 persons per family, with single male/father families (33 | 9.3%) accounting for the largest median family size of 5.42 persons per family. On the other hand, married-couple families (224 | 63.1%) represent the smallest median family size with 2.77 persons per family.
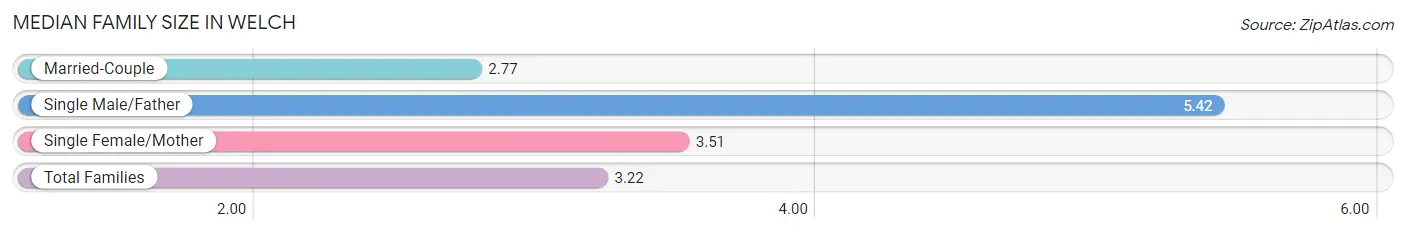
| Family Type | # Families | Family Size |
| Married-Couple | 224 (63.1%) | 2.77 |
| Single Male/Father | 33 (9.3%) | 5.42 |
| Single Female/Mother | 98 (27.6%) | 3.51 |
| Total Families | 355 (100.0%) | 3.22 |
Median Household Size in Welch
The median household size in Welch is 2.06 persons per household, with single male/father households (33 | 4.1%) accounting for the largest median household size of 6.21 persons per household. non-family households (453 | 56.1%) represent the smallest median household size with 1.08 persons per household.
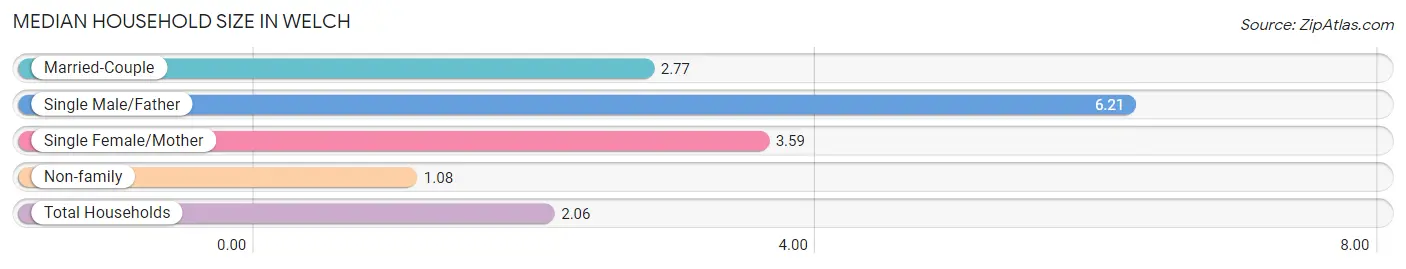
| Household Type | # Households | Household Size |
| Married-Couple | 224 (27.7%) | 2.77 |
| Single Male/Father | 33 (4.1%) | 6.21 |
| Single Female/Mother | 98 (12.1%) | 3.59 |
| Non-family | 453 (56.1%) | 1.08 |
| Total Households | 808 (100.0%) | 2.06 |
Household Size by Marriage Status in Welch
Out of a total of 808 households in Welch, 355 (43.9%) are family households, while 453 (56.1%) are nonfamily households. The most numerous type of family households are 2-person households, comprising 209, and the most common type of nonfamily households are 1-person households, comprising 431.
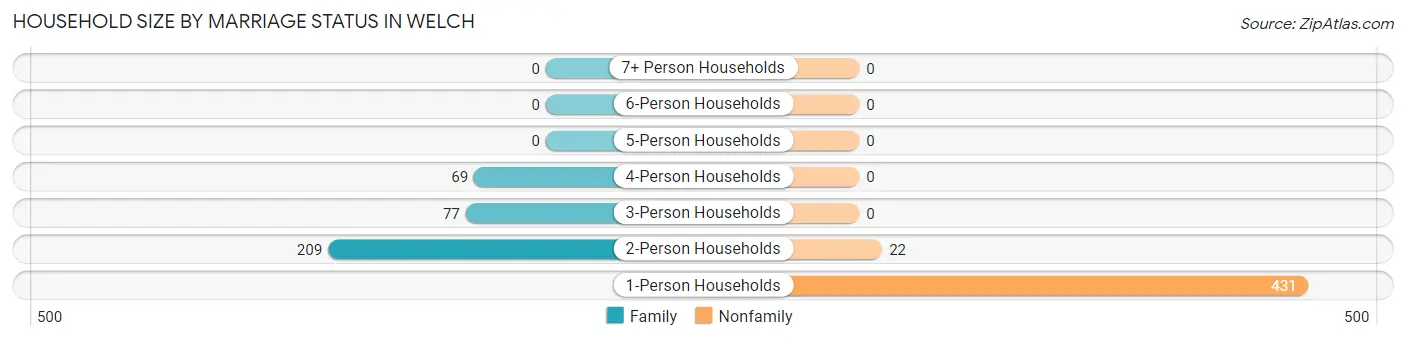
| Household Size | Family Households | Nonfamily Households |
| 1-Person Households | - | 431 (53.3%) |
| 2-Person Households | 209 (25.9%) | 22 (2.7%) |
| 3-Person Households | 77 (9.5%) | 0 (0.0%) |
| 4-Person Households | 69 (8.5%) | 0 (0.0%) |
| 5-Person Households | 0 (0.0%) | 0 (0.0%) |
| 6-Person Households | 0 (0.0%) | 0 (0.0%) |
| 7+ Person Households | 0 (0.0%) | 0 (0.0%) |
| Total | 355 (43.9%) | 453 (56.1%) |
Female Fertility in Welch
Fertility by Age in Welch
| Age Bracket | Women with Births | Births / 1,000 Women |
| 15 to 19 years | 0 (0.0%) | 0.0 |
| 20 to 34 years | 0 (0.0%) | 0.0 |
| 35 to 50 years | 0 (0.0%) | 0.0 |
| Total | 0 (0.0%) | 0.0 |
Fertility by Age by Marriage Status in Welch
| Age Bracket | Married | Unmarried |
| 15 to 19 years | 0 (0.0%) | 0 (0.0%) |
| 20 to 34 years | 0 (0.0%) | 0 (0.0%) |
| 35 to 50 years | 0 (0.0%) | 0 (0.0%) |
| Total | 0 (0.0%) | 0 (0.0%) |
Fertility by Education in Welch
| Educational Attainment | Women with Births | Births / 1,000 Women |
| Less than High School | 0 (0.0%) | 0.0 |
| High School Diploma | 0 (0.0%) | 0.0 |
| College or Associate's Degree | 0 (0.0%) | 0.0 |
| Bachelor's Degree | 0 (0.0%) | 0.0 |
| Graduate Degree | 0 (0.0%) | 0.0 |
| Total | 0 (0.0%) | 0.0 |
Fertility by Education by Marriage Status in Welch
| Educational Attainment | Married | Unmarried |
| Less than High School | 0 (0.0%) | 0 (0.0%) |
| High School Diploma | 0 (0.0%) | 0 (0.0%) |
| College or Associate's Degree | 0 (0.0%) | 0 (0.0%) |
| Bachelor's Degree | 0 (0.0%) | 0 (0.0%) |
| Graduate Degree | 0 (0.0%) | 0 (0.0%) |
| Total | 0 (0.0%) | 0 (0.0%) |
Employment Characteristics in Welch
Employment by Class of Employer in Welch
Among the 450 employed individuals in Welch, private company employees (157 | 34.9%), state government employees (128 | 28.4%), and not-for-profit organizations (69 | 15.3%) make up the most common classes of employment.
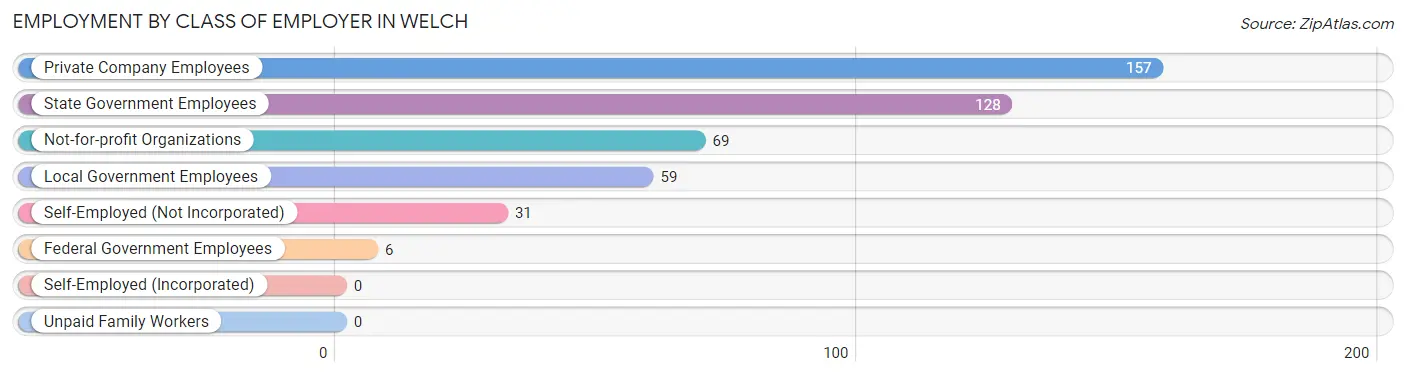
| Employer Class | # Employees | % Employees |
| Private Company Employees | 157 | 34.9% |
| Self-Employed (Incorporated) | 0 | 0.0% |
| Self-Employed (Not Incorporated) | 31 | 6.9% |
| Not-for-profit Organizations | 69 | 15.3% |
| Local Government Employees | 59 | 13.1% |
| State Government Employees | 128 | 28.4% |
| Federal Government Employees | 6 | 1.3% |
| Unpaid Family Workers | 0 | 0.0% |
| Total | 450 | 100.0% |
Employment Status by Age in Welch
According to the labor force statistics for Welch, out of the total population over 16 years of age (3,137), 16.2% or 508 individuals are in the labor force, with 8.7% or 44 of them unemployed. The age group with the highest labor force participation rate is 16 to 19 years, with 38.2% or 13 individuals in the labor force. Within the labor force, the 16 to 19 years age range has the highest percentage of unemployed individuals, with 100.0% or 13 of them being unemployed.
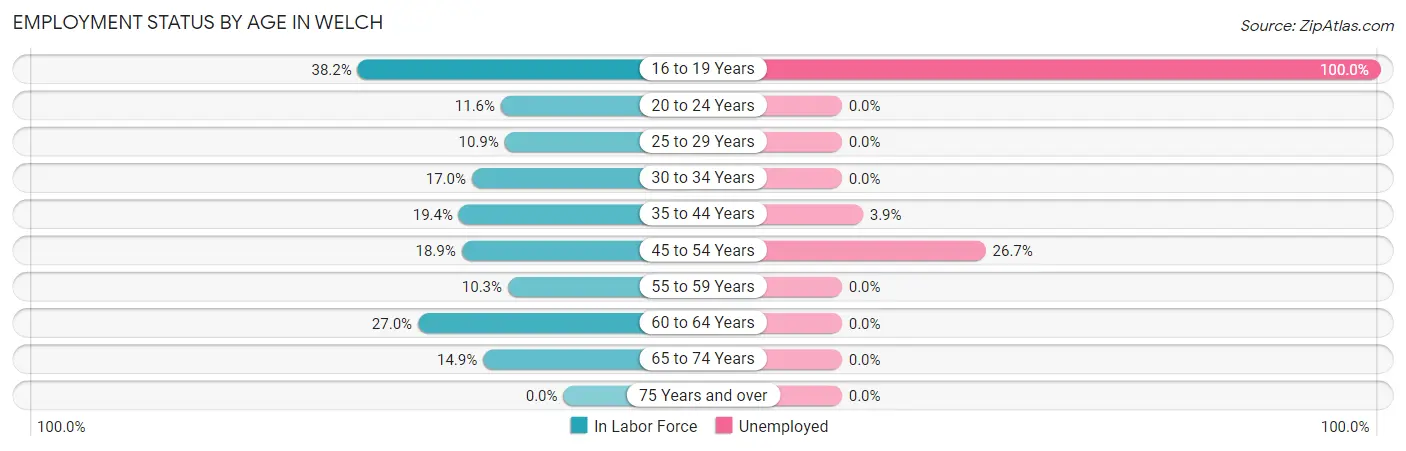
| Age Bracket | In Labor Force | Unemployed |
| 16 to 19 Years | 13 (38.2%) | 13 (100.0%) |
| 20 to 24 Years | 16 (11.6%) | 0 (0.0%) |
| 25 to 29 Years | 29 (10.9%) | 0 (0.0%) |
| 30 to 34 Years | 60 (17.0%) | 0 (0.0%) |
| 35 to 44 Years | 179 (19.4%) | 7 (3.9%) |
| 45 to 54 Years | 90 (18.9%) | 24 (26.7%) |
| 55 to 59 Years | 33 (10.3%) | 0 (0.0%) |
| 60 to 64 Years | 37 (27.0%) | 0 (0.0%) |
| 65 to 74 Years | 51 (14.9%) | 0 (0.0%) |
| 75 Years and over | 0 (0.0%) | 0 (0.0%) |
| Total | 508 (16.2%) | 44 (8.7%) |
Employment Status by Educational Attainment in Welch
According to labor force statistics for Welch, 17.3% of individuals (429) out of the total population between 25 and 64 years of age (2,478) are in the labor force, with 7.2% or 31 of them being unemployed. The group with the highest labor force participation rate are those with the educational attainment of bachelor's degree or higher, with 61.8% or 107 individuals in the labor force. Within the labor force, individuals with college / associate degree education have the highest percentage of unemployment, with 18.6% or 31 of them being unemployed.
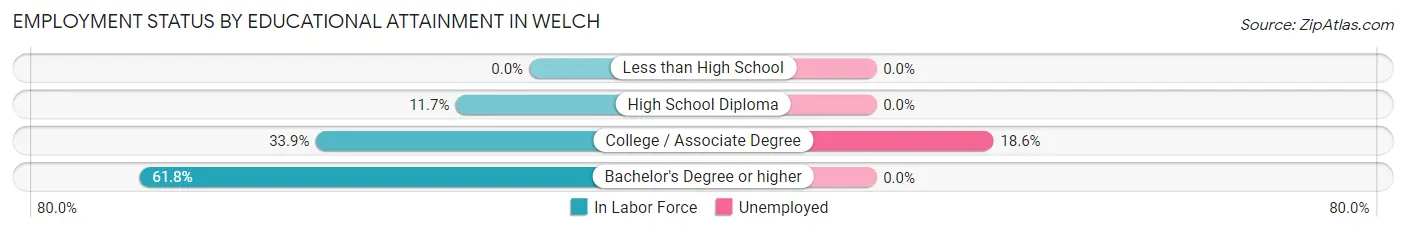
| Educational Attainment | In Labor Force | Unemployed |
| Less than High School | 0 (0.0%) | 0 (0.0%) |
| High School Diploma | 154 (11.7%) | 0 (0.0%) |
| College / Associate Degree | 167 (33.9%) | 92 (18.6%) |
| Bachelor's Degree or higher | 107 (61.8%) | 0 (0.0%) |
| Total | 429 (17.3%) | 178 (7.2%) |
Employment Occupations by Sex in Welch
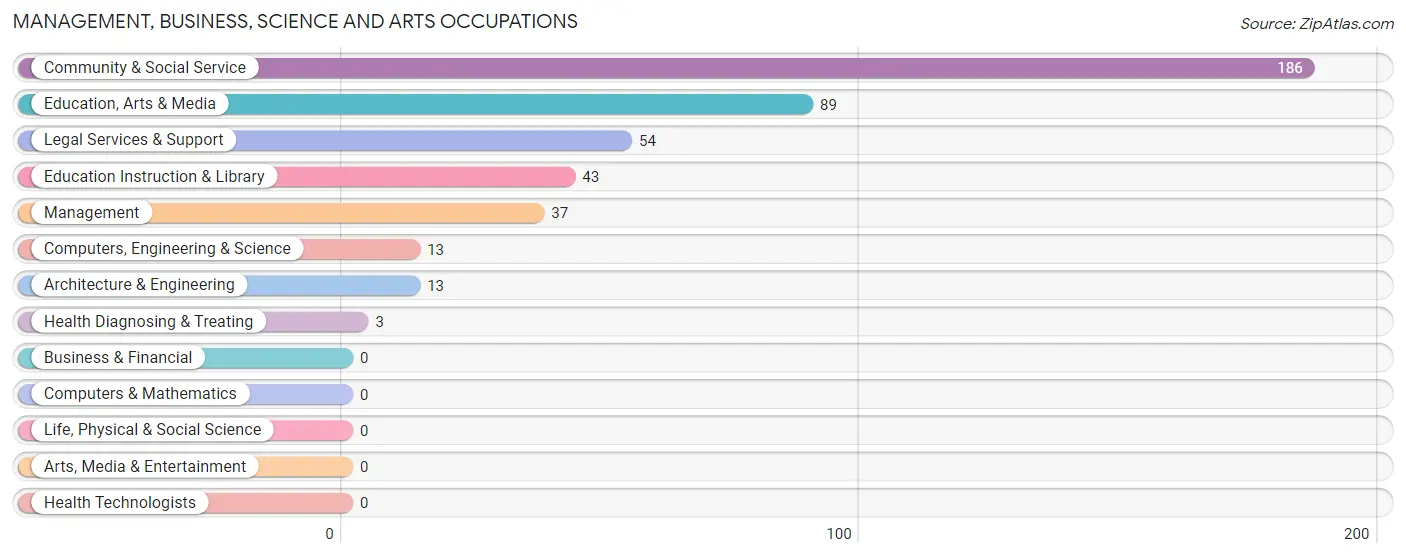
Management, Business, Science and Arts Occupations
The most common Management, Business, Science and Arts occupations in Welch are Community & Social Service (186 | 40.1%), Education, Arts & Media (89 | 19.2%), Legal Services & Support (54 | 11.6%), Education Instruction & Library (43 | 9.3%), and Management (37 | 8.0%).
Management, Business, Science and Arts Occupations by Sex
Within the Management, Business, Science and Arts occupations in Welch, the most male-oriented occupations are Computers, Engineering & Science (100.0%), Architecture & Engineering (100.0%), and Management (46.0%), while the most female-oriented occupations are Education Instruction & Library (100.0%), Health Diagnosing & Treating (100.0%), and Legal Services & Support (88.9%).
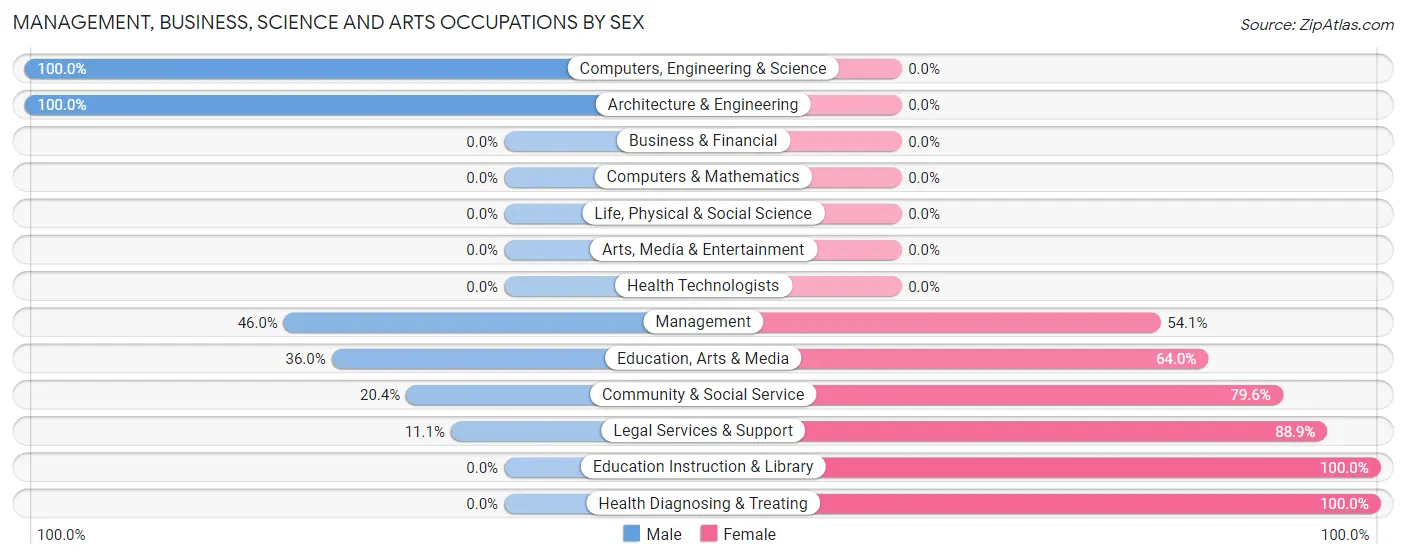
| Occupation | Male | Female |
| Management | 17 (46.0%) | 20 (54.0%) |
| Business & Financial | 0 (0.0%) | 0 (0.0%) |
| Computers, Engineering & Science | 13 (100.0%) | 0 (0.0%) |
| Computers & Mathematics | 0 (0.0%) | 0 (0.0%) |
| Architecture & Engineering | 13 (100.0%) | 0 (0.0%) |
| Life, Physical & Social Science | 0 (0.0%) | 0 (0.0%) |
| Community & Social Service | 38 (20.4%) | 148 (79.6%) |
| Education, Arts & Media | 32 (36.0%) | 57 (64.0%) |
| Legal Services & Support | 6 (11.1%) | 48 (88.9%) |
| Education Instruction & Library | 0 (0.0%) | 43 (100.0%) |
| Arts, Media & Entertainment | 0 (0.0%) | 0 (0.0%) |
| Health Diagnosing & Treating | 0 (0.0%) | 3 (100.0%) |
| Health Technologists | 0 (0.0%) | 0 (0.0%) |
| Total (Category) | 68 (28.4%) | 171 (71.6%) |
| Total (Overall) | 171 (36.8%) | 293 (63.1%) |
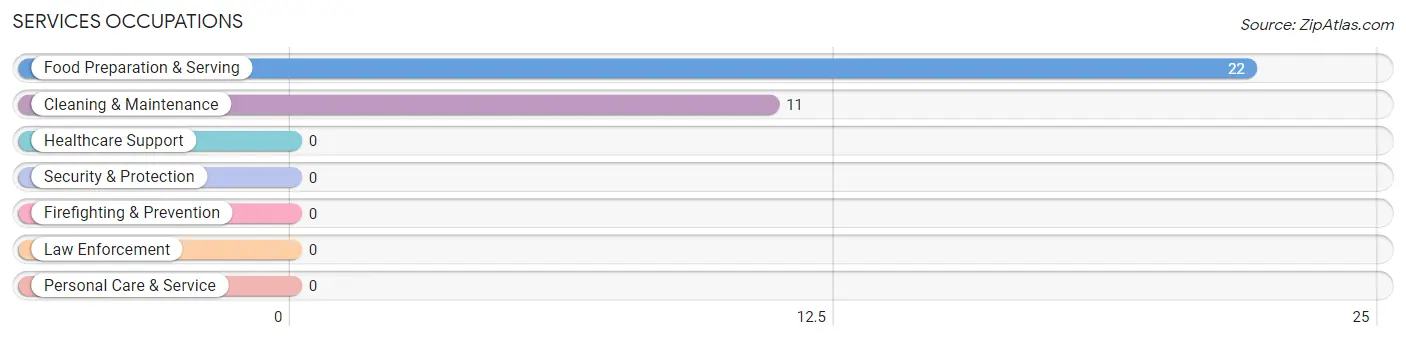
Services Occupations
The most common Services occupations in Welch are Food Preparation & Serving (22 | 4.7%), and Cleaning & Maintenance (11 | 2.4%).
Services Occupations by Sex
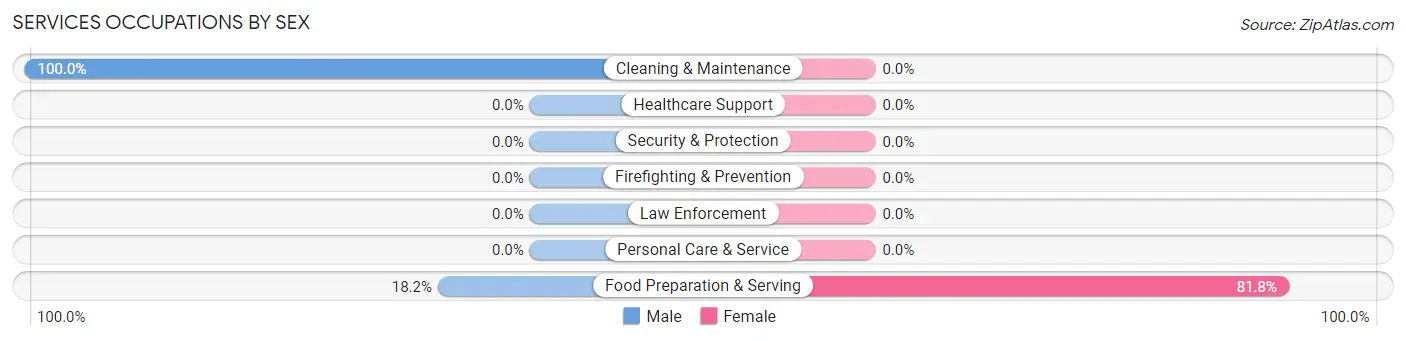
| Occupation | Male | Female |
| Healthcare Support | 0 (0.0%) | 0 (0.0%) |
| Security & Protection | 0 (0.0%) | 0 (0.0%) |
| Firefighting & Prevention | 0 (0.0%) | 0 (0.0%) |
| Law Enforcement | 0 (0.0%) | 0 (0.0%) |
| Food Preparation & Serving | 4 (18.2%) | 18 (81.8%) |
| Cleaning & Maintenance | 11 (100.0%) | 0 (0.0%) |
| Personal Care & Service | 0 (0.0%) | 0 (0.0%) |
| Total (Category) | 15 (45.5%) | 18 (54.5%) |
| Total (Overall) | 171 (36.8%) | 293 (63.1%) |
Sales and Office Occupations
The most common Sales and Office occupations in Welch are Office & Administration (94 | 20.3%), and Sales & Related (50 | 10.8%).

Sales and Office Occupations by Sex
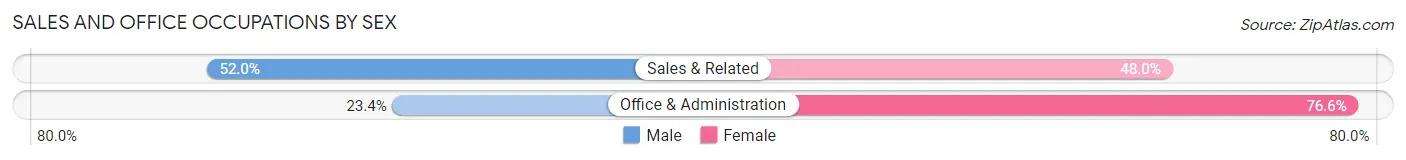
| Occupation | Male | Female |
| Sales & Related | 26 (52.0%) | 24 (48.0%) |
| Office & Administration | 22 (23.4%) | 72 (76.6%) |
| Total (Category) | 48 (33.3%) | 96 (66.7%) |
| Total (Overall) | 171 (36.8%) | 293 (63.1%) |
Natural Resources, Construction and Maintenance Occupations
The most common Natural Resources, Construction and Maintenance occupations in Welch are , and Construction & Extraction (19 | 4.1%).
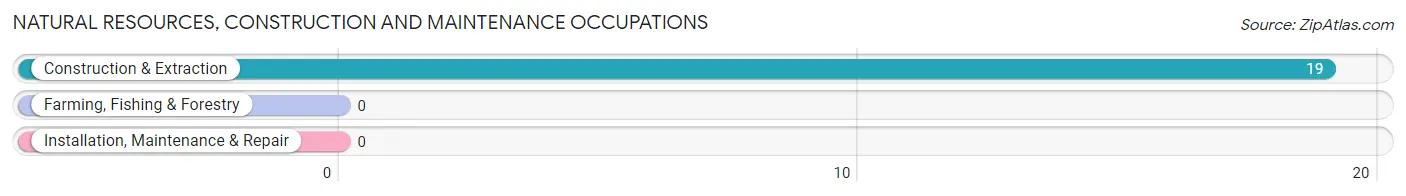
Natural Resources, Construction and Maintenance Occupations by Sex
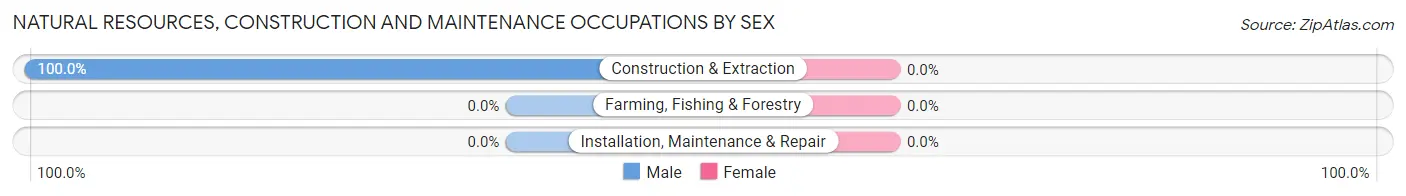
| Occupation | Male | Female |
| Farming, Fishing & Forestry | 0 (0.0%) | 0 (0.0%) |
| Construction & Extraction | 19 (100.0%) | 0 (0.0%) |
| Installation, Maintenance & Repair | 0 (0.0%) | 0 (0.0%) |
| Total (Category) | 19 (100.0%) | 0 (0.0%) |
| Total (Overall) | 171 (36.8%) | 293 (63.1%) |
Production, Transportation and Moving Occupations
The most common Production, Transportation and Moving occupations in Welch are Material Moving (20 | 4.3%), Transportation (8 | 1.7%), and Production (1 | 0.2%).
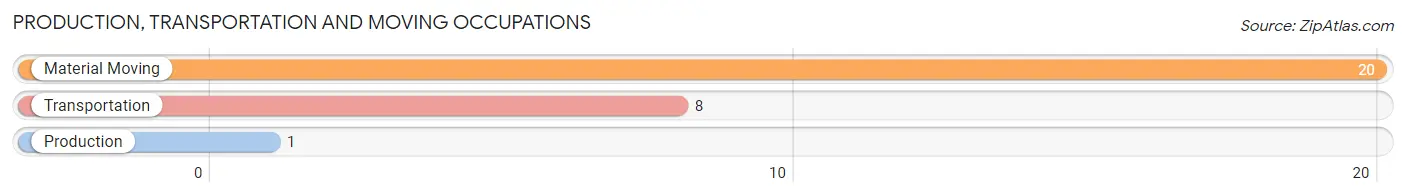
Production, Transportation and Moving Occupations by Sex
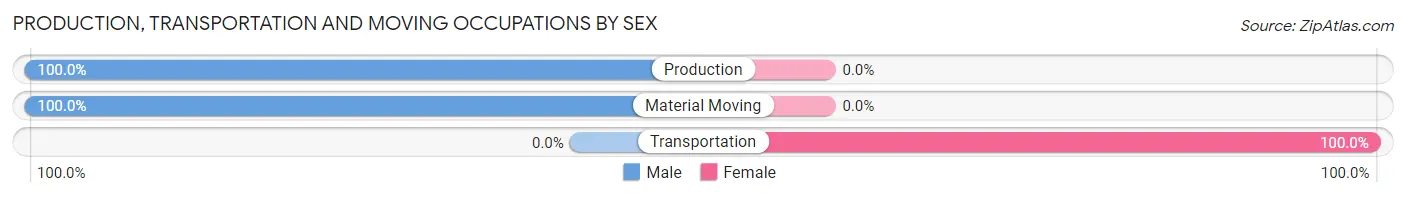
| Occupation | Male | Female |
| Production | 1 (100.0%) | 0 (0.0%) |
| Transportation | 0 (0.0%) | 8 (100.0%) |
| Material Moving | 20 (100.0%) | 0 (0.0%) |
| Total (Category) | 21 (72.4%) | 8 (27.6%) |
| Total (Overall) | 171 (36.8%) | 293 (63.1%) |
Employment Industries by Sex in Welch
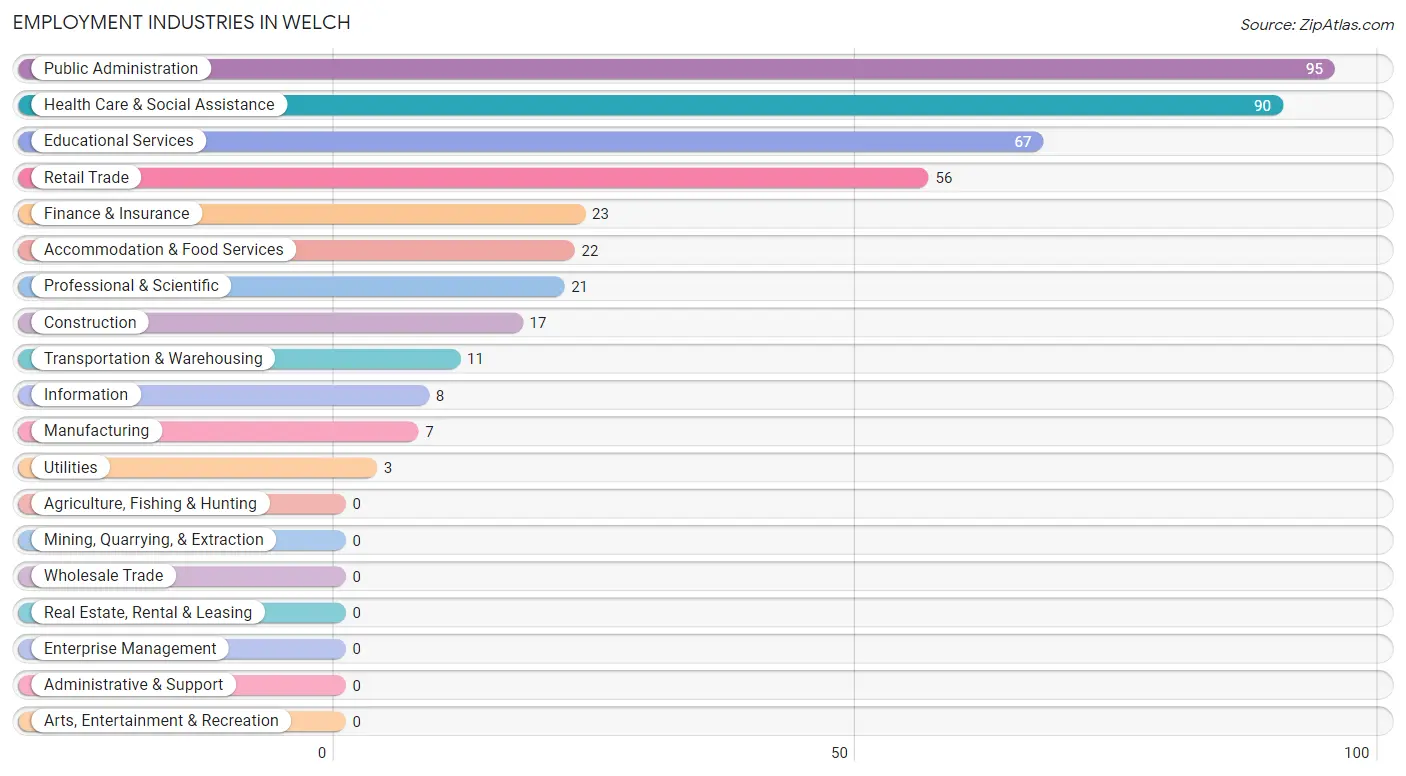
Employment Industries in Welch
The major employment industries in Welch include Public Administration (95 | 20.5%), Health Care & Social Assistance (90 | 19.4%), Educational Services (67 | 14.4%), Retail Trade (56 | 12.1%), and Finance & Insurance (23 | 5.0%).
Employment Industries by Sex in Welch
The Welch industries that see more men than women are Construction (100.0%), Manufacturing (100.0%), and Utilities (100.0%), whereas the industries that tend to have a higher number of women are Transportation & Warehousing (100.0%), Information (100.0%), and Finance & Insurance (100.0%).
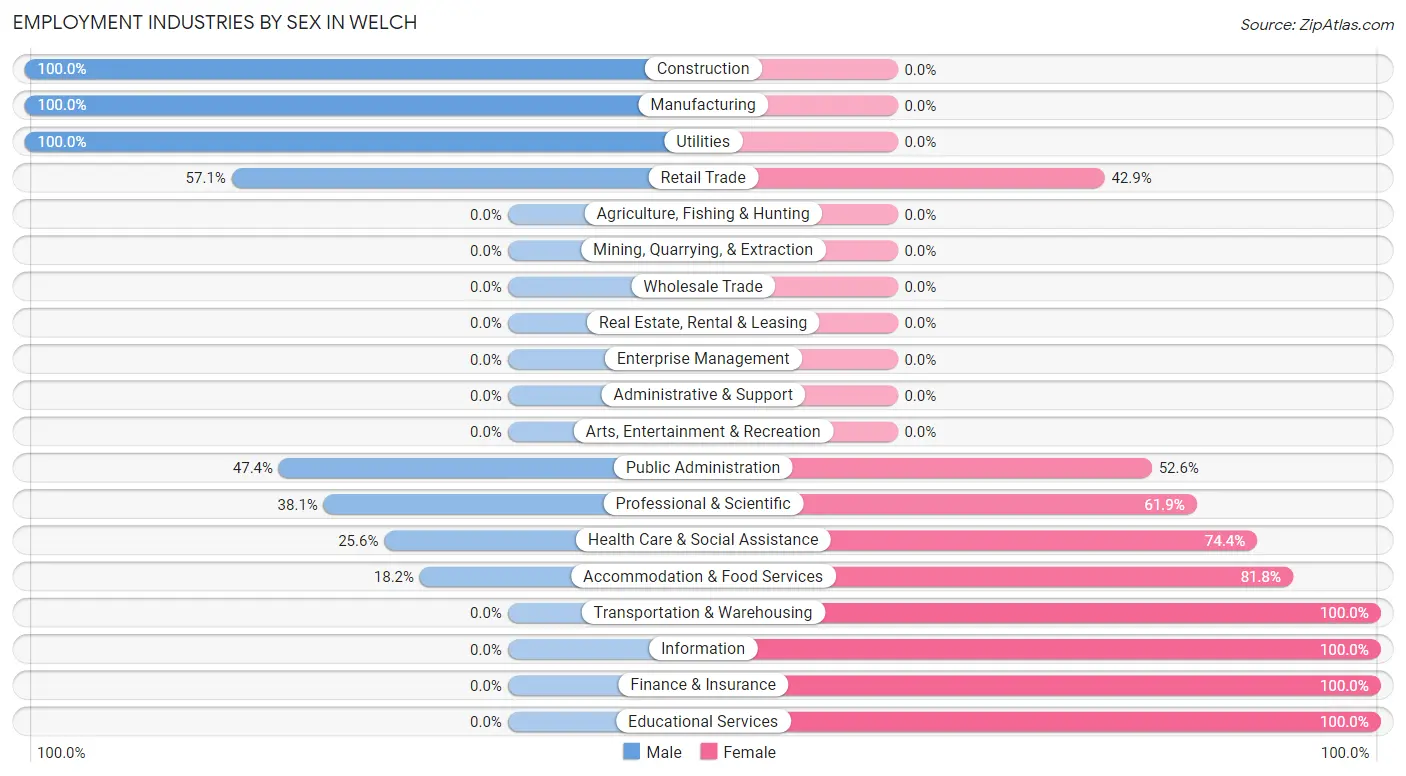
| Industry | Male | Female |
| Agriculture, Fishing & Hunting | 0 (0.0%) | 0 (0.0%) |
| Mining, Quarrying, & Extraction | 0 (0.0%) | 0 (0.0%) |
| Construction | 17 (100.0%) | 0 (0.0%) |
| Manufacturing | 7 (100.0%) | 0 (0.0%) |
| Wholesale Trade | 0 (0.0%) | 0 (0.0%) |
| Retail Trade | 32 (57.1%) | 24 (42.9%) |
| Transportation & Warehousing | 0 (0.0%) | 11 (100.0%) |
| Utilities | 3 (100.0%) | 0 (0.0%) |
| Information | 0 (0.0%) | 8 (100.0%) |
| Finance & Insurance | 0 (0.0%) | 23 (100.0%) |
| Real Estate, Rental & Leasing | 0 (0.0%) | 0 (0.0%) |
| Professional & Scientific | 8 (38.1%) | 13 (61.9%) |
| Enterprise Management | 0 (0.0%) | 0 (0.0%) |
| Administrative & Support | 0 (0.0%) | 0 (0.0%) |
| Educational Services | 0 (0.0%) | 67 (100.0%) |
| Health Care & Social Assistance | 23 (25.6%) | 67 (74.4%) |
| Arts, Entertainment & Recreation | 0 (0.0%) | 0 (0.0%) |
| Accommodation & Food Services | 4 (18.2%) | 18 (81.8%) |
| Public Administration | 45 (47.4%) | 50 (52.6%) |
| Total | 171 (36.8%) | 293 (63.1%) |
Education in Welch
School Enrollment in Welch
The most common levels of schooling among the 397 students in Welch are college / undergraduate (125 | 31.5%), middle school (95 | 23.9%), and kindergarten (73 | 18.4%).
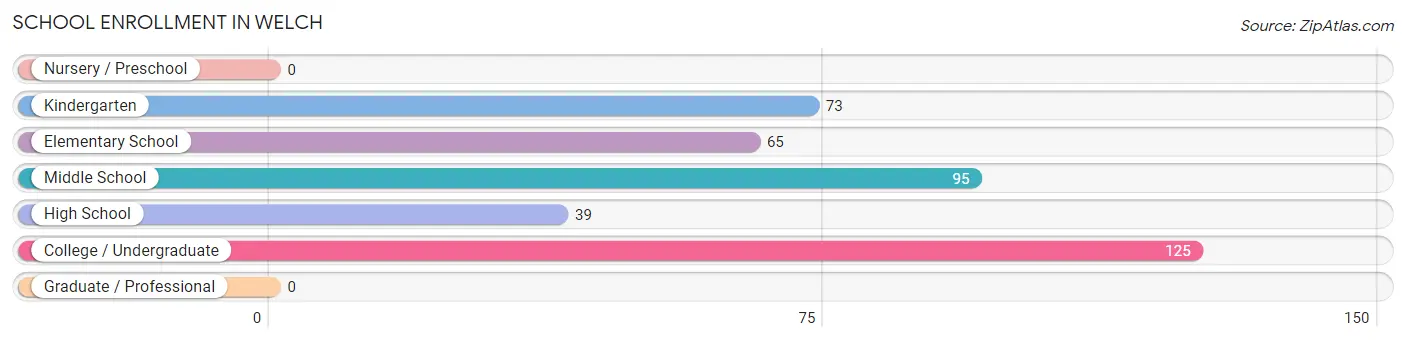
| School Level | # Students | % Students |
| Nursery / Preschool | 0 | 0.0% |
| Kindergarten | 73 | 18.4% |
| Elementary School | 65 | 16.4% |
| Middle School | 95 | 23.9% |
| High School | 39 | 9.8% |
| College / Undergraduate | 125 | 31.5% |
| Graduate / Professional | 0 | 0.0% |
| Total | 397 | 100.0% |
School Enrollment by Age by Funding Source in Welch
Out of a total of 397 students who are enrolled in schools in Welch, 51 (12.8%) attend a private institution, while the remaining 346 (87.2%) are enrolled in public schools. The age group of 15 to 17 year olds has the highest likelihood of being enrolled in private schools, with 7 (100.0% in the age bracket) enrolled. Conversely, the age group of 10 to 14 year olds has the lowest likelihood of being enrolled in a private school, with 95 (100.0% in the age bracket) attending a public institution.
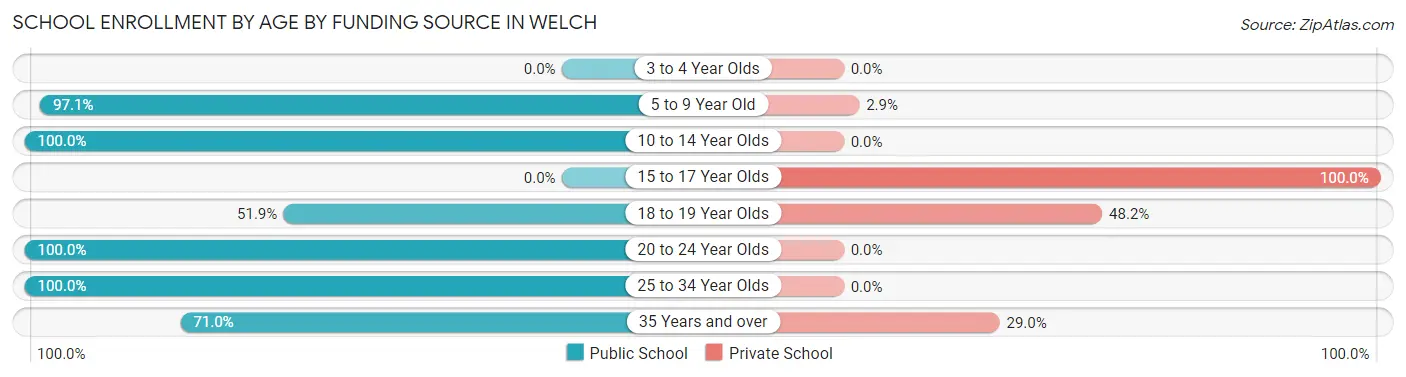
| Age Bracket | Public School | Private School |
| 3 to 4 Year Olds | 0 (0.0%) | 0 (0.0%) |
| 5 to 9 Year Old | 134 (97.1%) | 4 (2.9%) |
| 10 to 14 Year Olds | 95 (100.0%) | 0 (0.0%) |
| 15 to 17 Year Olds | 0 (0.0%) | 7 (100.0%) |
| 18 to 19 Year Olds | 14 (51.8%) | 13 (48.1%) |
| 20 to 24 Year Olds | 30 (100.0%) | 0 (0.0%) |
| 25 to 34 Year Olds | 7 (100.0%) | 0 (0.0%) |
| 35 Years and over | 66 (71.0%) | 27 (29.0%) |
| Total | 346 (87.2%) | 51 (12.8%) |
Educational Attainment by Field of Study in Welch
Business (68 | 30.6%), education (56 | 25.2%), social sciences (24 | 10.8%), science & technology (20 | 9.0%), and physical & health sciences (19 | 8.6%) are the most common fields of study among 222 individuals in Welch who have obtained a bachelor's degree or higher.
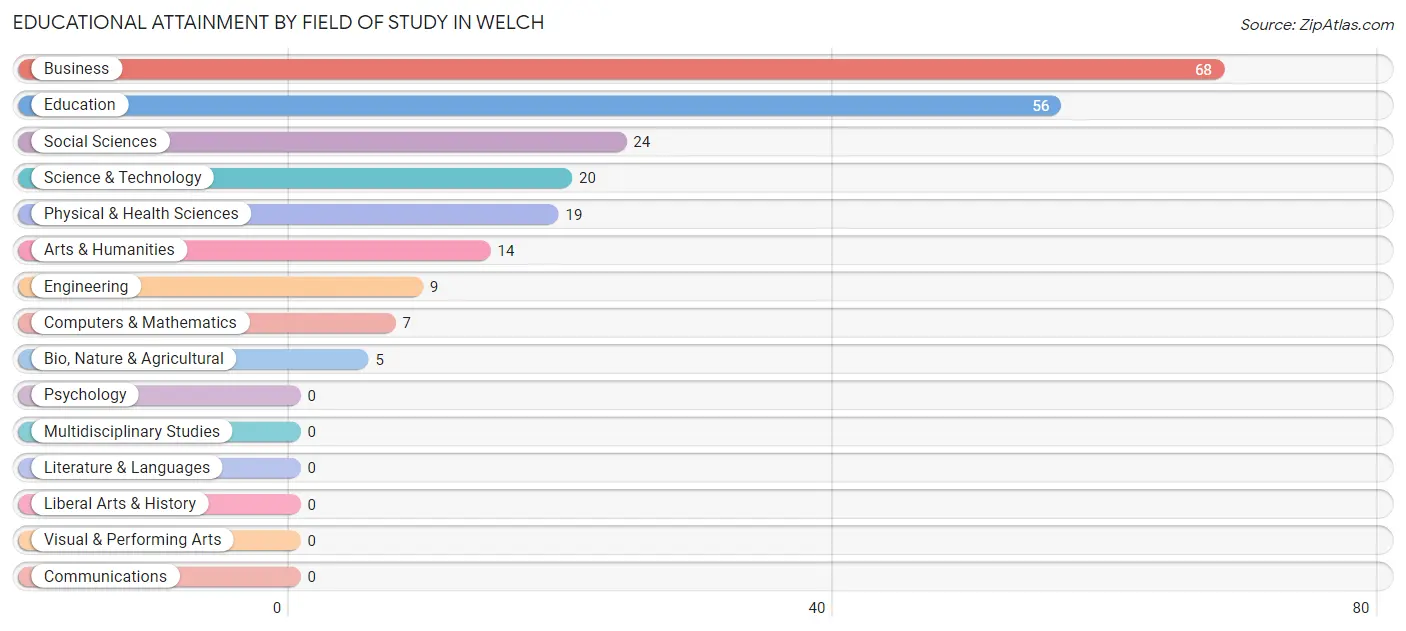
| Field of Study | # Graduates | % Graduates |
| Computers & Mathematics | 7 | 3.2% |
| Bio, Nature & Agricultural | 5 | 2.2% |
| Physical & Health Sciences | 19 | 8.6% |
| Psychology | 0 | 0.0% |
| Social Sciences | 24 | 10.8% |
| Engineering | 9 | 4.1% |
| Multidisciplinary Studies | 0 | 0.0% |
| Science & Technology | 20 | 9.0% |
| Business | 68 | 30.6% |
| Education | 56 | 25.2% |
| Literature & Languages | 0 | 0.0% |
| Liberal Arts & History | 0 | 0.0% |
| Visual & Performing Arts | 0 | 0.0% |
| Communications | 0 | 0.0% |
| Arts & Humanities | 14 | 6.3% |
| Total | 222 | 100.0% |
Transportation & Commute in Welch
Vehicle Availability by Sex in Welch
The most prevalent vehicle ownership categories in Welch are males with 2 vehicles (86, accounting for 54.8%) and females with 2 vehicles (140, making up 29.3%).
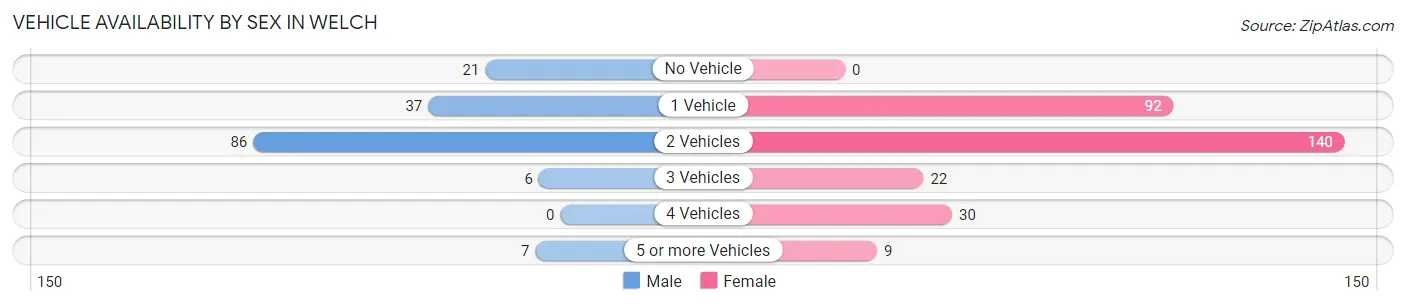
| Vehicles Available | Male | Female |
| No Vehicle | 21 (13.4%) | 0 (0.0%) |
| 1 Vehicle | 37 (23.6%) | 92 (31.4%) |
| 2 Vehicles | 86 (54.8%) | 140 (47.8%) |
| 3 Vehicles | 6 (3.8%) | 22 (7.5%) |
| 4 Vehicles | 0 (0.0%) | 30 (10.2%) |
| 5 or more Vehicles | 7 (4.5%) | 9 (3.1%) |
| Total | 157 (100.0%) | 293 (100.0%) |
Commute Time in Welch
The most frequently occuring commute durations in Welch are 5 to 9 minutes (138 commuters, 30.7%), less than 5 minutes (111 commuters, 24.7%), and 10 to 14 minutes (102 commuters, 22.7%).
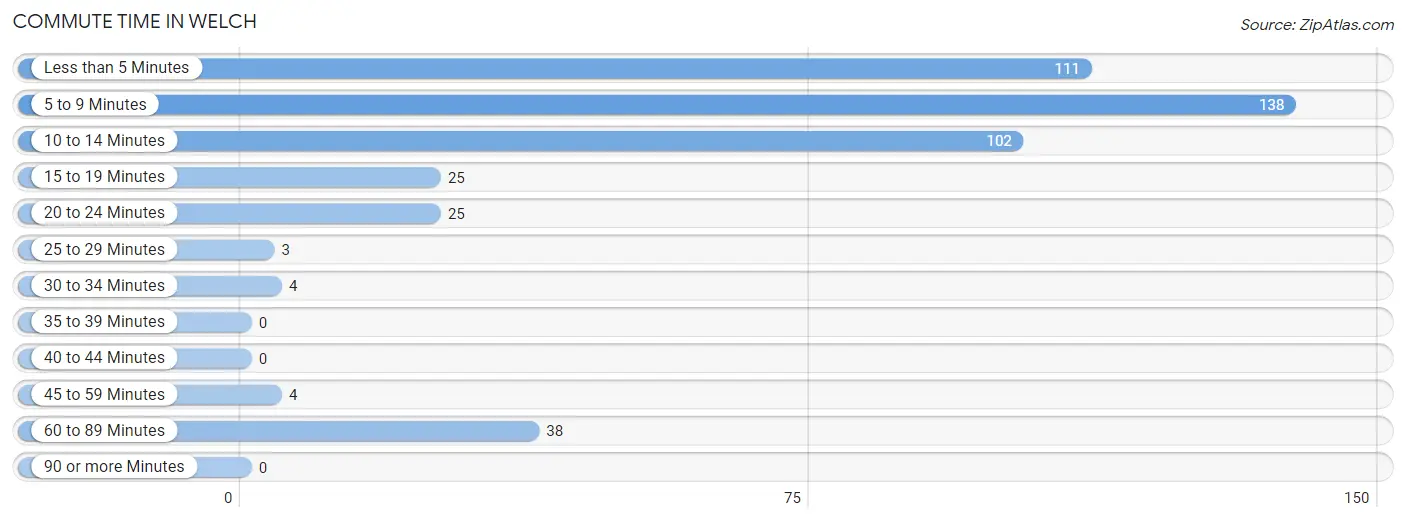
| Commute Time | # Commuters | % Commuters |
| Less than 5 Minutes | 111 | 24.7% |
| 5 to 9 Minutes | 138 | 30.7% |
| 10 to 14 Minutes | 102 | 22.7% |
| 15 to 19 Minutes | 25 | 5.6% |
| 20 to 24 Minutes | 25 | 5.6% |
| 25 to 29 Minutes | 3 | 0.7% |
| 30 to 34 Minutes | 4 | 0.9% |
| 35 to 39 Minutes | 0 | 0.0% |
| 40 to 44 Minutes | 0 | 0.0% |
| 45 to 59 Minutes | 4 | 0.9% |
| 60 to 89 Minutes | 38 | 8.4% |
| 90 or more Minutes | 0 | 0.0% |
Commute Time by Sex in Welch
The most common commute times in Welch are 10 to 14 minutes (46 commuters, 29.3%) for males and 5 to 9 minutes (94 commuters, 32.1%) for females.
| Commute Time | Male | Female |
| Less than 5 Minutes | 24 (15.3%) | 87 (29.7%) |
| 5 to 9 Minutes | 44 (28.0%) | 94 (32.1%) |
| 10 to 14 Minutes | 46 (29.3%) | 56 (19.1%) |
| 15 to 19 Minutes | 0 (0.0%) | 25 (8.5%) |
| 20 to 24 Minutes | 5 (3.2%) | 20 (6.8%) |
| 25 to 29 Minutes | 0 (0.0%) | 3 (1.0%) |
| 30 to 34 Minutes | 0 (0.0%) | 4 (1.4%) |
| 35 to 39 Minutes | 0 (0.0%) | 0 (0.0%) |
| 40 to 44 Minutes | 0 (0.0%) | 0 (0.0%) |
| 45 to 59 Minutes | 0 (0.0%) | 4 (1.4%) |
| 60 to 89 Minutes | 38 (24.2%) | 0 (0.0%) |
| 90 or more Minutes | 0 (0.0%) | 0 (0.0%) |
Time of Departure to Work by Sex in Welch
The most frequent times of departure to work in Welch are 8:00 AM to 8:29 AM (29, 18.5%) for males and 8:00 AM to 8:29 AM (98, 33.5%) for females.
| Time of Departure | Male | Female |
| 12:00 AM to 4:59 AM | 13 (8.3%) | 4 (1.4%) |
| 5:00 AM to 5:29 AM | 17 (10.8%) | 0 (0.0%) |
| 5:30 AM to 5:59 AM | 0 (0.0%) | 0 (0.0%) |
| 6:00 AM to 6:29 AM | 19 (12.1%) | 0 (0.0%) |
| 6:30 AM to 6:59 AM | 8 (5.1%) | 3 (1.0%) |
| 7:00 AM to 7:29 AM | 0 (0.0%) | 15 (5.1%) |
| 7:30 AM to 7:59 AM | 23 (14.6%) | 79 (27.0%) |
| 8:00 AM to 8:29 AM | 29 (18.5%) | 98 (33.5%) |
| 8:30 AM to 8:59 AM | 23 (14.6%) | 39 (13.3%) |
| 9:00 AM to 9:59 AM | 0 (0.0%) | 27 (9.2%) |
| 10:00 AM to 10:59 AM | 0 (0.0%) | 0 (0.0%) |
| 11:00 AM to 11:59 AM | 0 (0.0%) | 0 (0.0%) |
| 12:00 PM to 3:59 PM | 18 (11.5%) | 28 (9.6%) |
| 4:00 PM to 11:59 PM | 7 (4.5%) | 0 (0.0%) |
| Total | 157 (100.0%) | 293 (100.0%) |
Housing Occupancy in Welch
Occupancy by Ownership in Welch
Of the total 808 dwellings in Welch, owner-occupied units account for 569 (70.4%), while renter-occupied units make up 239 (29.6%).
| Occupancy | # Housing Units | % Housing Units |
| Owner Occupied Housing Units | 569 | 70.4% |
| Renter-Occupied Housing Units | 239 | 29.6% |
| Total Occupied Housing Units | 808 | 100.0% |
Occupancy by Household Size in Welch
| Household Size | # Housing Units | % Housing Units |
| 1-Person Household | 431 | 53.3% |
| 2-Person Household | 231 | 28.6% |
| 3-Person Household | 77 | 9.5% |
| 4+ Person Household | 69 | 8.5% |
| Total Housing Units | 808 | 100.0% |
Occupancy by Ownership by Household Size in Welch
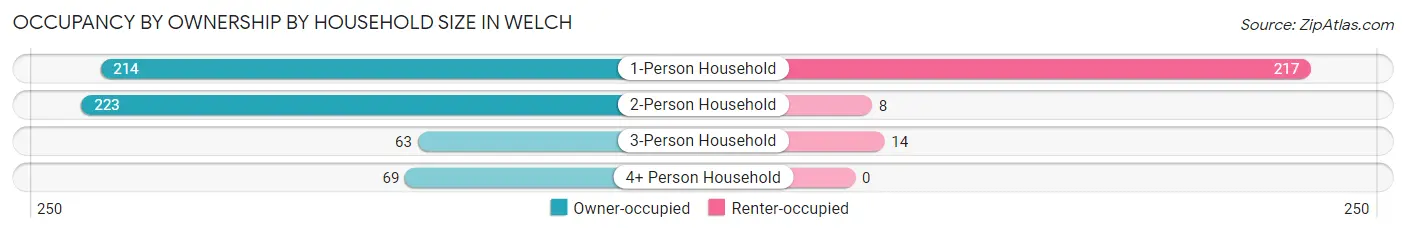
| Household Size | Owner-occupied | Renter-occupied |
| 1-Person Household | 214 (49.6%) | 217 (50.3%) |
| 2-Person Household | 223 (96.5%) | 8 (3.5%) |
| 3-Person Household | 63 (81.8%) | 14 (18.2%) |
| 4+ Person Household | 69 (100.0%) | 0 (0.0%) |
| Total Housing Units | 569 (70.4%) | 239 (29.6%) |
Occupancy by Educational Attainment in Welch
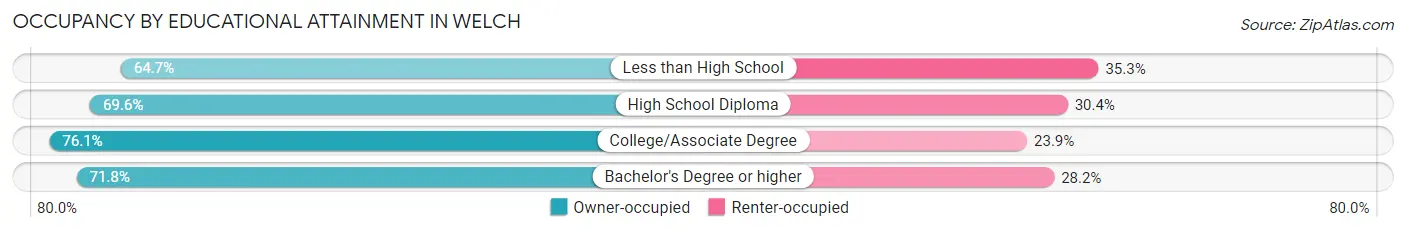
| Household Size | Owner-occupied | Renter-occupied |
| Less than High School | 112 (64.7%) | 61 (35.3%) |
| High School Diploma | 220 (69.6%) | 96 (30.4%) |
| College/Associate Degree | 143 (76.1%) | 45 (23.9%) |
| Bachelor's Degree or higher | 94 (71.8%) | 37 (28.2%) |
Occupancy by Age of Householder in Welch
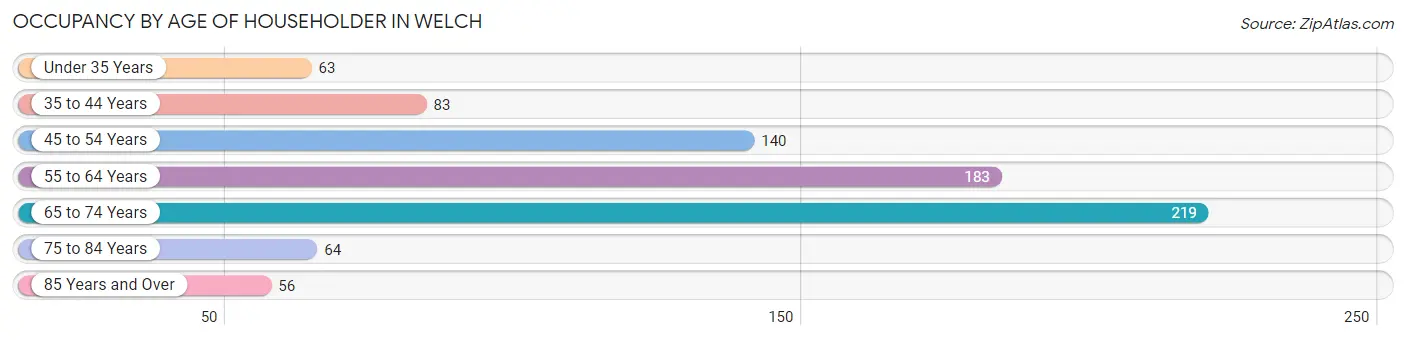
| Age Bracket | # Households | % Households |
| Under 35 Years | 63 | 7.8% |
| 35 to 44 Years | 83 | 10.3% |
| 45 to 54 Years | 140 | 17.3% |
| 55 to 64 Years | 183 | 22.7% |
| 65 to 74 Years | 219 | 27.1% |
| 75 to 84 Years | 64 | 7.9% |
| 85 Years and Over | 56 | 6.9% |
| Total | 808 | 100.0% |
Housing Finances in Welch
Median Income by Occupancy in Welch
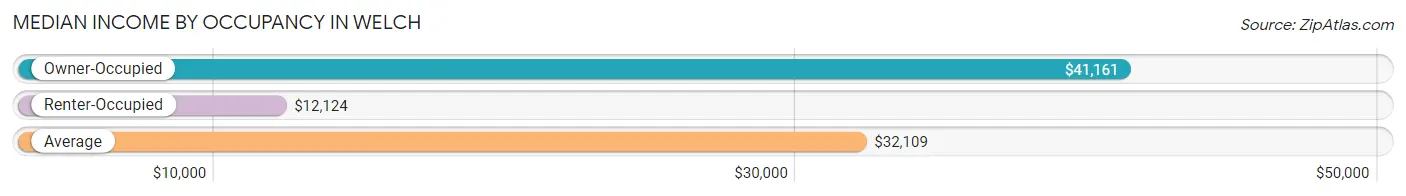
| Occupancy Type | # Households | Median Income |
| Owner-Occupied | 569 (70.4%) | $41,161 |
| Renter-Occupied | 239 (29.6%) | $12,124 |
| Average | 808 (100.0%) | $32,109 |
Occupancy by Householder Income Bracket in Welch
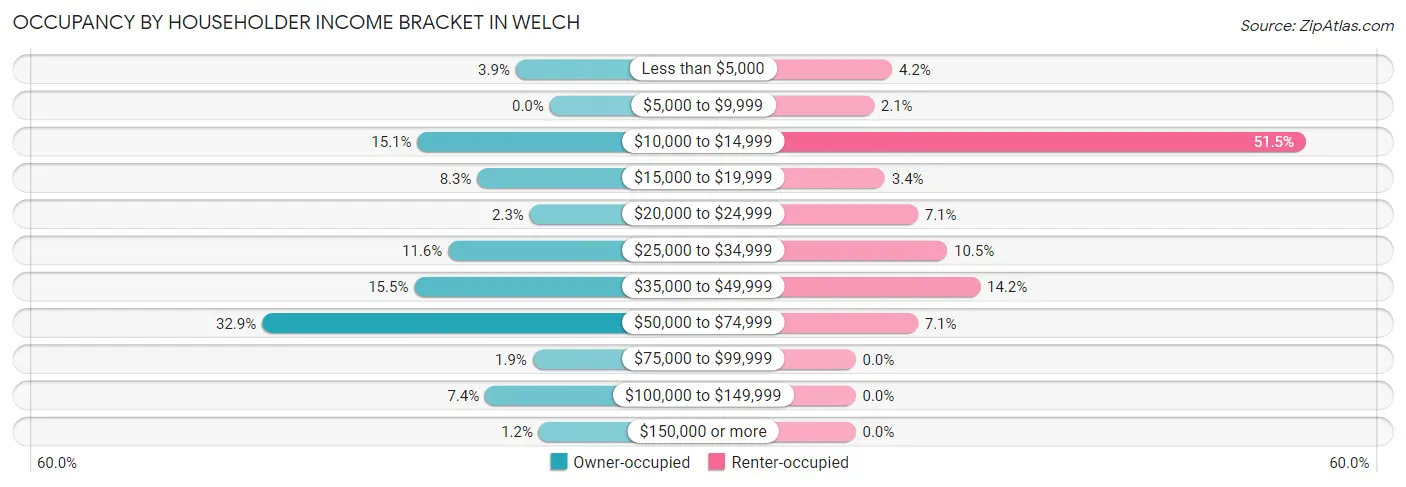
| Income Bracket | Owner-occupied | Renter-occupied |
| Less than $5,000 | 22 (3.9%) | 10 (4.2%) |
| $5,000 to $9,999 | 0 (0.0%) | 5 (2.1%) |
| $10,000 to $14,999 | 86 (15.1%) | 123 (51.5%) |
| $15,000 to $19,999 | 47 (8.3%) | 8 (3.4%) |
| $20,000 to $24,999 | 13 (2.3%) | 17 (7.1%) |
| $25,000 to $34,999 | 66 (11.6%) | 25 (10.5%) |
| $35,000 to $49,999 | 88 (15.5%) | 34 (14.2%) |
| $50,000 to $74,999 | 187 (32.9%) | 17 (7.1%) |
| $75,000 to $99,999 | 11 (1.9%) | 0 (0.0%) |
| $100,000 to $149,999 | 42 (7.4%) | 0 (0.0%) |
| $150,000 or more | 7 (1.2%) | 0 (0.0%) |
| Total | 569 (100.0%) | 239 (100.0%) |
Monthly Housing Cost Tiers in Welch
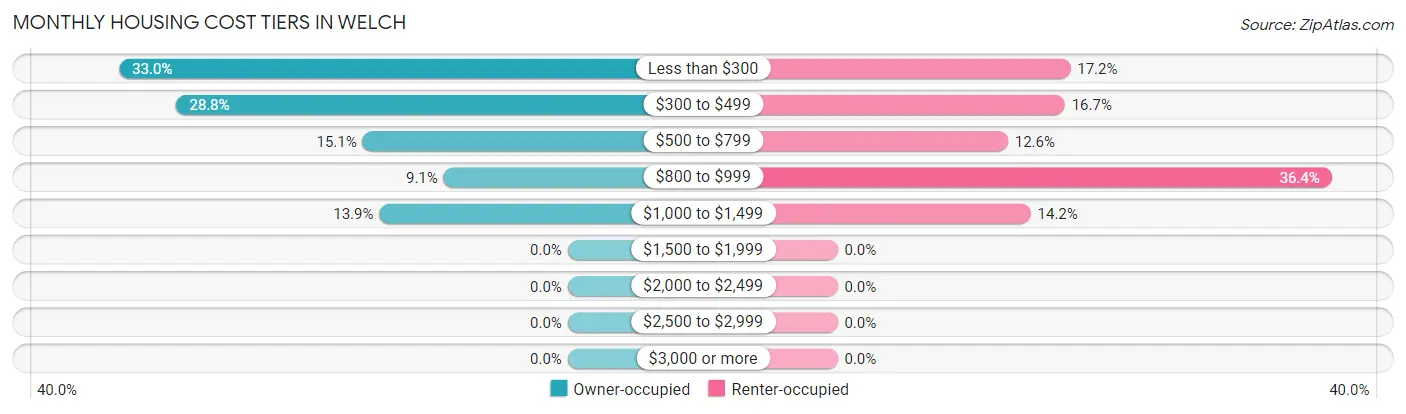
| Monthly Cost | Owner-occupied | Renter-occupied |
| Less than $300 | 188 (33.0%) | 41 (17.2%) |
| $300 to $499 | 164 (28.8%) | 40 (16.7%) |
| $500 to $799 | 86 (15.1%) | 30 (12.6%) |
| $800 to $999 | 52 (9.1%) | 87 (36.4%) |
| $1,000 to $1,499 | 79 (13.9%) | 34 (14.2%) |
| $1,500 to $1,999 | 0 (0.0%) | 0 (0.0%) |
| $2,000 to $2,499 | 0 (0.0%) | 0 (0.0%) |
| $2,500 to $2,999 | 0 (0.0%) | 0 (0.0%) |
| $3,000 or more | 0 (0.0%) | 0 (0.0%) |
| Total | 569 (100.0%) | 239 (100.0%) |
Physical Housing Characteristics in Welch
Housing Structures in Welch
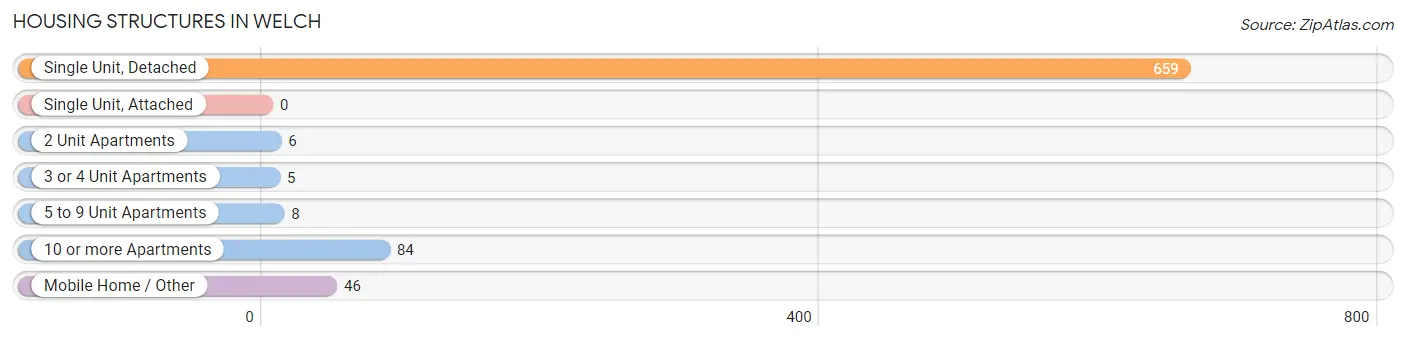
| Structure Type | # Housing Units | % Housing Units |
| Single Unit, Detached | 659 | 81.6% |
| Single Unit, Attached | 0 | 0.0% |
| 2 Unit Apartments | 6 | 0.7% |
| 3 or 4 Unit Apartments | 5 | 0.6% |
| 5 to 9 Unit Apartments | 8 | 1.0% |
| 10 or more Apartments | 84 | 10.4% |
| Mobile Home / Other | 46 | 5.7% |
| Total | 808 | 100.0% |
Housing Structures by Occupancy in Welch
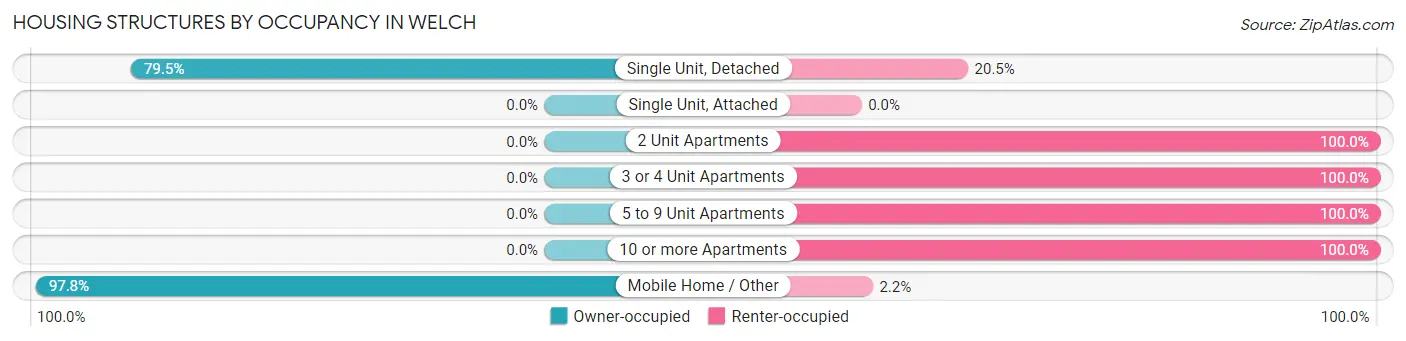
| Structure Type | Owner-occupied | Renter-occupied |
| Single Unit, Detached | 524 (79.5%) | 135 (20.5%) |
| Single Unit, Attached | 0 (0.0%) | 0 (0.0%) |
| 2 Unit Apartments | 0 (0.0%) | 6 (100.0%) |
| 3 or 4 Unit Apartments | 0 (0.0%) | 5 (100.0%) |
| 5 to 9 Unit Apartments | 0 (0.0%) | 8 (100.0%) |
| 10 or more Apartments | 0 (0.0%) | 84 (100.0%) |
| Mobile Home / Other | 45 (97.8%) | 1 (2.2%) |
| Total | 569 (70.4%) | 239 (29.6%) |
Housing Structures by Number of Rooms in Welch
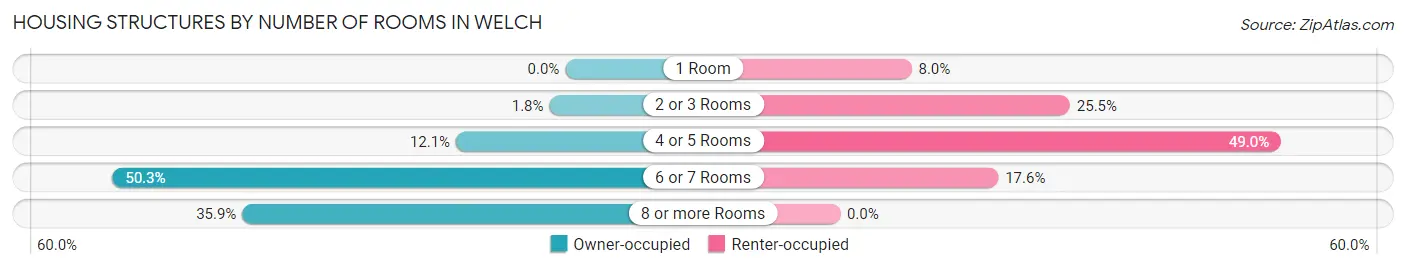
| Number of Rooms | Owner-occupied | Renter-occupied |
| 1 Room | 0 (0.0%) | 19 (8.0%) |
| 2 or 3 Rooms | 10 (1.8%) | 61 (25.5%) |
| 4 or 5 Rooms | 69 (12.1%) | 117 (48.9%) |
| 6 or 7 Rooms | 286 (50.3%) | 42 (17.6%) |
| 8 or more Rooms | 204 (35.8%) | 0 (0.0%) |
| Total | 569 (100.0%) | 239 (100.0%) |
Housing Structure by Heating Type in Welch
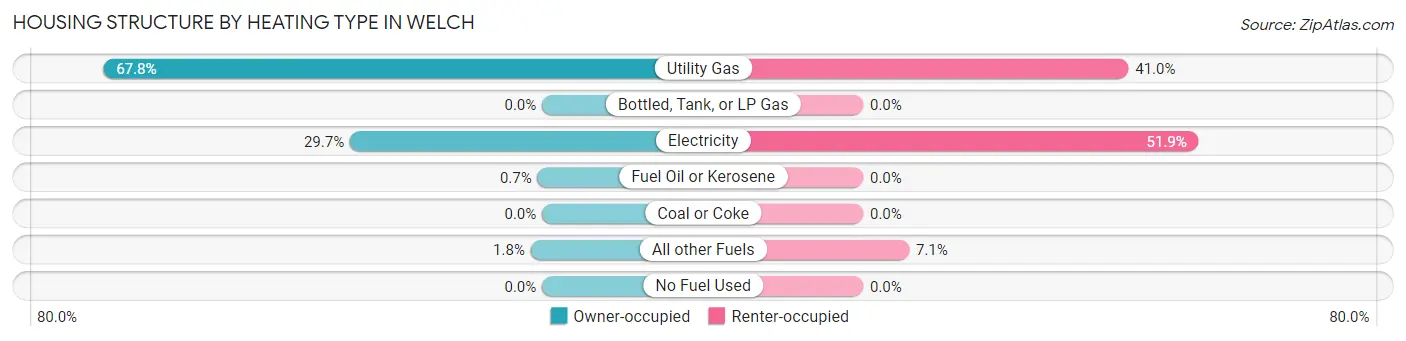
| Heating Type | Owner-occupied | Renter-occupied |
| Utility Gas | 386 (67.8%) | 98 (41.0%) |
| Bottled, Tank, or LP Gas | 0 (0.0%) | 0 (0.0%) |
| Electricity | 169 (29.7%) | 124 (51.9%) |
| Fuel Oil or Kerosene | 4 (0.7%) | 0 (0.0%) |
| Coal or Coke | 0 (0.0%) | 0 (0.0%) |
| All other Fuels | 10 (1.8%) | 17 (7.1%) |
| No Fuel Used | 0 (0.0%) | 0 (0.0%) |
| Total | 569 (100.0%) | 239 (100.0%) |
Household Vehicle Usage in Welch
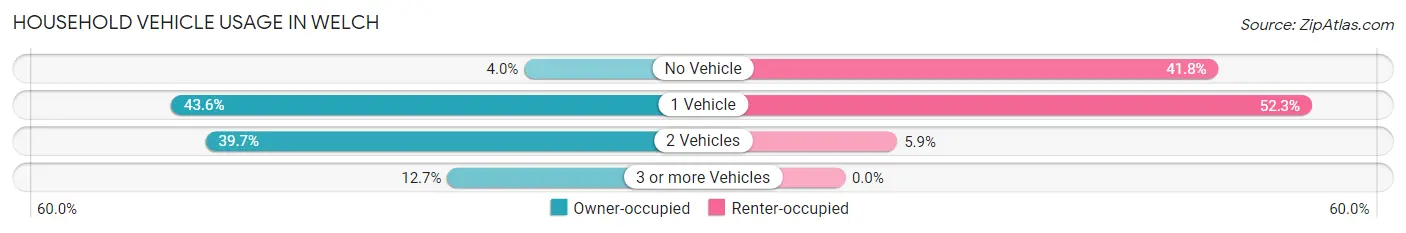
| Vehicles per Household | Owner-occupied | Renter-occupied |
| No Vehicle | 23 (4.0%) | 100 (41.8%) |
| 1 Vehicle | 248 (43.6%) | 125 (52.3%) |
| 2 Vehicles | 226 (39.7%) | 14 (5.9%) |
| 3 or more Vehicles | 72 (12.7%) | 0 (0.0%) |
| Total | 569 (100.0%) | 239 (100.0%) |
Real Estate & Mortgages in Welch
Real Estate and Mortgage Overview in Welch
| Characteristic | Without Mortgage | With Mortgage |
| Housing Units | 428 | 141 |
| Median Property Value | $53,400 | $91,300 |
| Median Household Income | $38,750 | $7 |
| Monthly Housing Costs | $349 | $0 |
| Real Estate Taxes | $261 | $13 |
Property Value by Mortgage Status in Welch
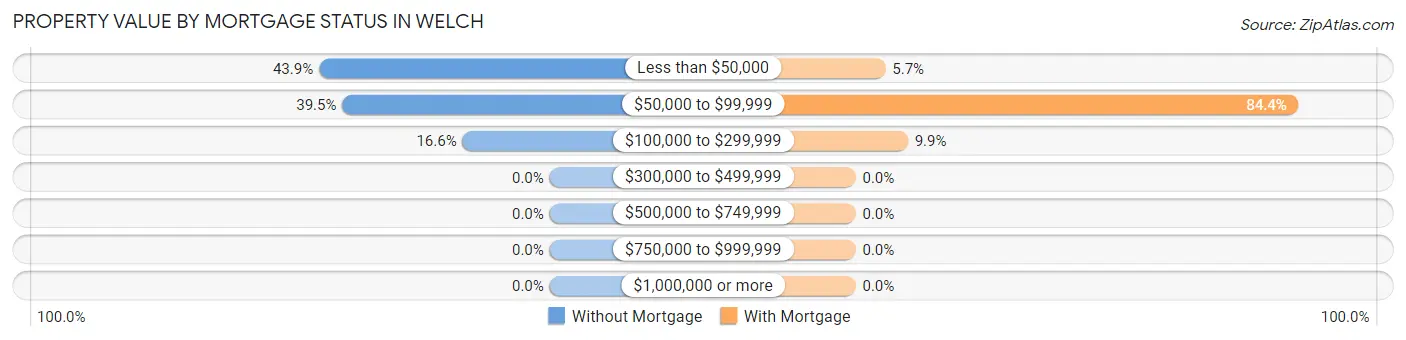
| Property Value | Without Mortgage | With Mortgage |
| Less than $50,000 | 188 (43.9%) | 8 (5.7%) |
| $50,000 to $99,999 | 169 (39.5%) | 119 (84.4%) |
| $100,000 to $299,999 | 71 (16.6%) | 14 (9.9%) |
| $300,000 to $499,999 | 0 (0.0%) | 0 (0.0%) |
| $500,000 to $749,999 | 0 (0.0%) | 0 (0.0%) |
| $750,000 to $999,999 | 0 (0.0%) | 0 (0.0%) |
| $1,000,000 or more | 0 (0.0%) | 0 (0.0%) |
| Total | 428 (100.0%) | 141 (100.0%) |
Household Income by Mortgage Status in Welch
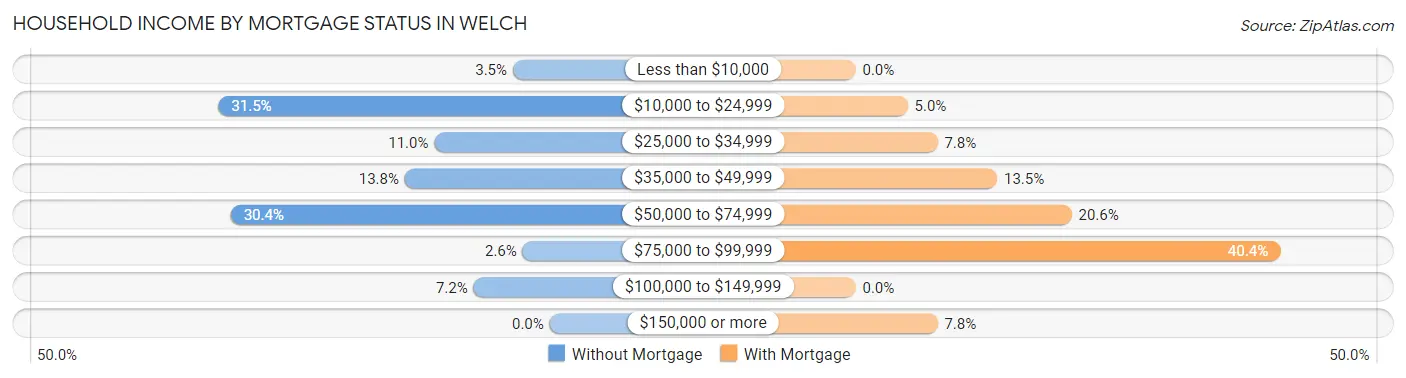
| Household Income | Without Mortgage | With Mortgage |
| Less than $10,000 | 15 (3.5%) | 0 (0.0%) |
| $10,000 to $24,999 | 135 (31.5%) | 7 (5.0%) |
| $25,000 to $34,999 | 47 (11.0%) | 11 (7.8%) |
| $35,000 to $49,999 | 59 (13.8%) | 19 (13.5%) |
| $50,000 to $74,999 | 130 (30.4%) | 29 (20.6%) |
| $75,000 to $99,999 | 11 (2.6%) | 57 (40.4%) |
| $100,000 to $149,999 | 31 (7.2%) | 0 (0.0%) |
| $150,000 or more | 0 (0.0%) | 11 (7.8%) |
| Total | 428 (100.0%) | 141 (100.0%) |
Property Value to Household Income Ratio in Welch
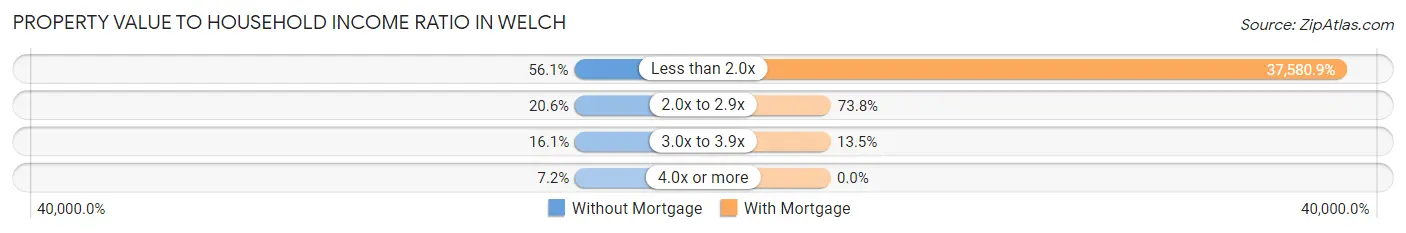
| Value-to-Income Ratio | Without Mortgage | With Mortgage |
| Less than 2.0x | 240 (56.1%) | 52,989 (37,580.8%) |
| 2.0x to 2.9x | 88 (20.6%) | 104 (73.8%) |
| 3.0x to 3.9x | 69 (16.1%) | 19 (13.5%) |
| 4.0x or more | 31 (7.2%) | 0 (0.0%) |
| Total | 428 (100.0%) | 141 (100.0%) |
Real Estate Taxes by Mortgage Status in Welch
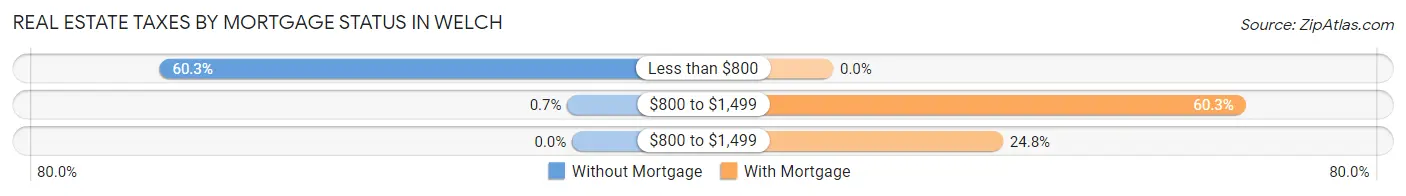
| Property Taxes | Without Mortgage | With Mortgage |
| Less than $800 | 258 (60.3%) | 0 (0.0%) |
| $800 to $1,499 | 3 (0.7%) | 85 (60.3%) |
| $800 to $1,499 | 0 (0.0%) | 35 (24.8%) |
| Total | 428 (100.0%) | 141 (100.0%) |
Health & Disability in Welch
Health Insurance Coverage by Age in Welch
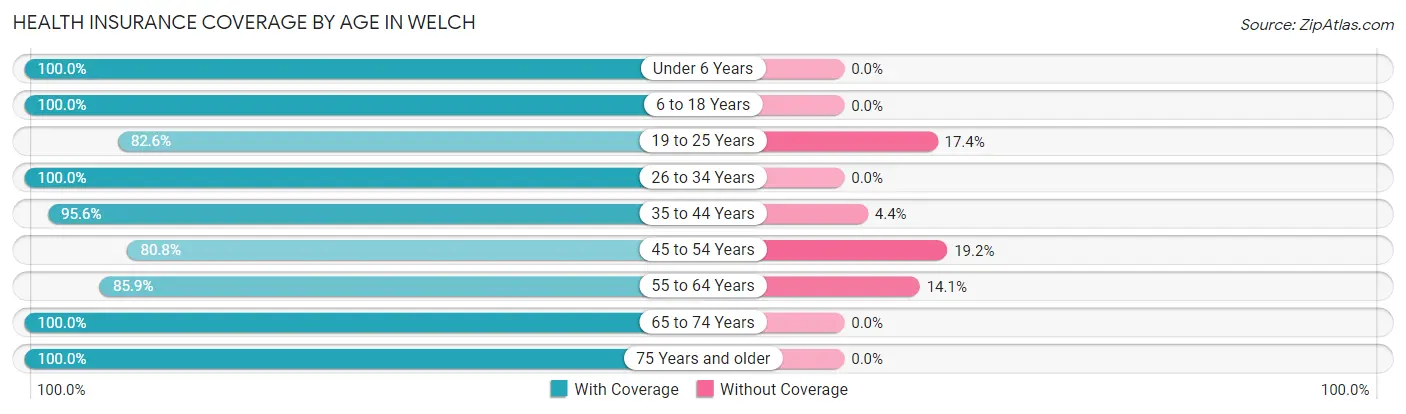
| Age Bracket | With Coverage | Without Coverage |
| Under 6 Years | 73 (100.0%) | 0 (0.0%) |
| 6 to 18 Years | 289 (100.0%) | 0 (0.0%) |
| 19 to 25 Years | 38 (82.6%) | 8 (17.4%) |
| 26 to 34 Years | 90 (100.0%) | 0 (0.0%) |
| 35 to 44 Years | 196 (95.6%) | 9 (4.4%) |
| 45 to 54 Years | 181 (80.8%) | 43 (19.2%) |
| 55 to 64 Years | 281 (85.9%) | 46 (14.1%) |
| 65 to 74 Years | 270 (100.0%) | 0 (0.0%) |
| 75 Years and older | 143 (100.0%) | 0 (0.0%) |
| Total | 1,561 (93.6%) | 106 (6.4%) |
Health Insurance Coverage by Citizenship Status in Welch
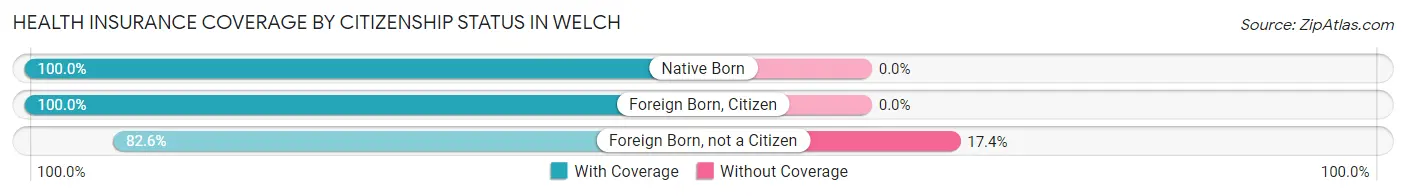
| Citizenship Status | With Coverage | Without Coverage |
| Native Born | 73 (100.0%) | 0 (0.0%) |
| Foreign Born, Citizen | 289 (100.0%) | 0 (0.0%) |
| Foreign Born, not a Citizen | 38 (82.6%) | 8 (17.4%) |
Health Insurance Coverage by Household Income in Welch
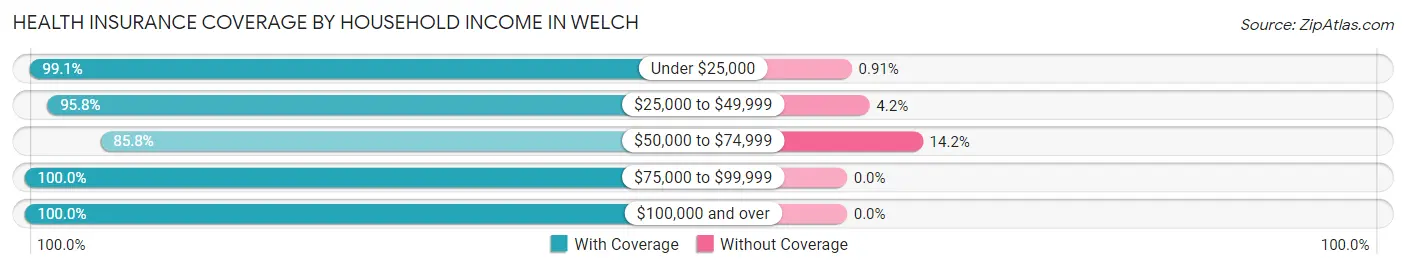
| Household Income | With Coverage | Without Coverage |
| Under $25,000 | 434 (99.1%) | 4 (0.9%) |
| $25,000 to $49,999 | 474 (95.8%) | 21 (4.2%) |
| $50,000 to $74,999 | 489 (85.8%) | 81 (14.2%) |
| $75,000 to $99,999 | 25 (100.0%) | 0 (0.0%) |
| $100,000 and over | 139 (100.0%) | 0 (0.0%) |
Public vs Private Health Insurance Coverage by Age in Welch
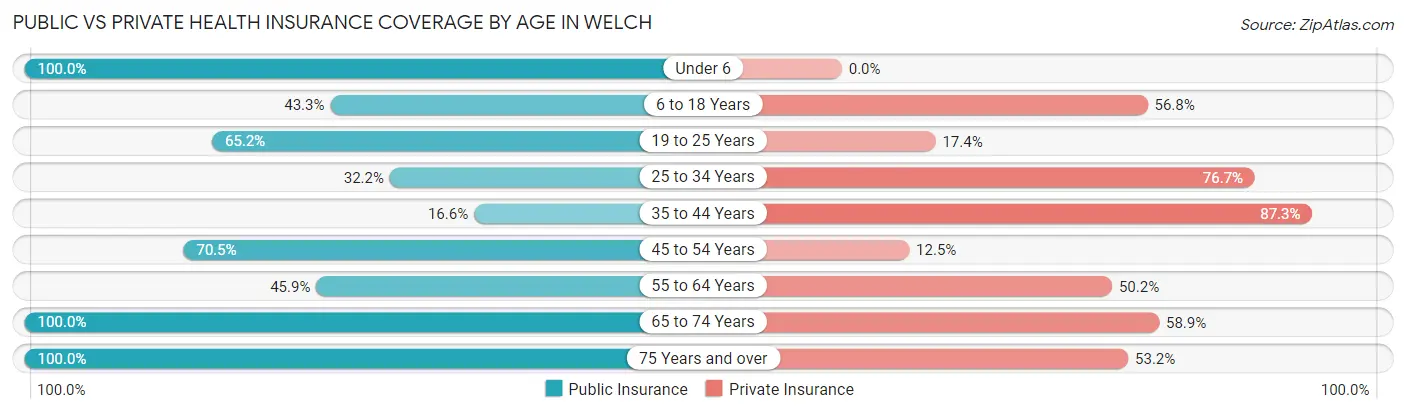
| Age Bracket | Public Insurance | Private Insurance |
| Under 6 | 73 (100.0%) | 0 (0.0%) |
| 6 to 18 Years | 125 (43.2%) | 164 (56.8%) |
| 19 to 25 Years | 30 (65.2%) | 8 (17.4%) |
| 25 to 34 Years | 29 (32.2%) | 69 (76.7%) |
| 35 to 44 Years | 34 (16.6%) | 179 (87.3%) |
| 45 to 54 Years | 158 (70.5%) | 28 (12.5%) |
| 55 to 64 Years | 150 (45.9%) | 164 (50.1%) |
| 65 to 74 Years | 270 (100.0%) | 159 (58.9%) |
| 75 Years and over | 143 (100.0%) | 76 (53.1%) |
| Total | 1,012 (60.7%) | 847 (50.8%) |
Disability Status by Sex by Age in Welch
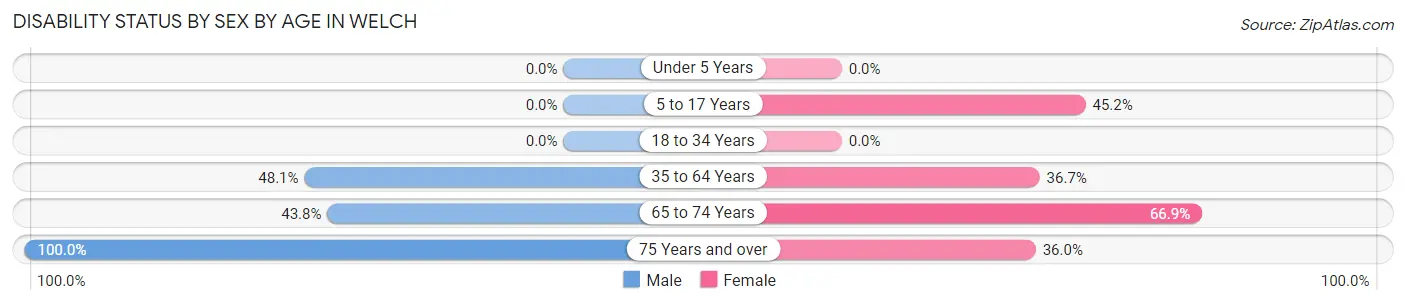
| Age Bracket | Male | Female |
| Under 5 Years | 0 (0.0%) | 0 (0.0%) |
| 5 to 17 Years | 0 (0.0%) | 38 (45.2%) |
| 18 to 34 Years | 0 (0.0%) | 0 (0.0%) |
| 35 to 64 Years | 137 (48.1%) | 173 (36.7%) |
| 65 to 74 Years | 39 (43.8%) | 121 (66.8%) |
| 75 Years and over | 93 (100.0%) | 18 (36.0%) |
Disability Class by Sex by Age in Welch
Disability Class: Hearing Difficulty
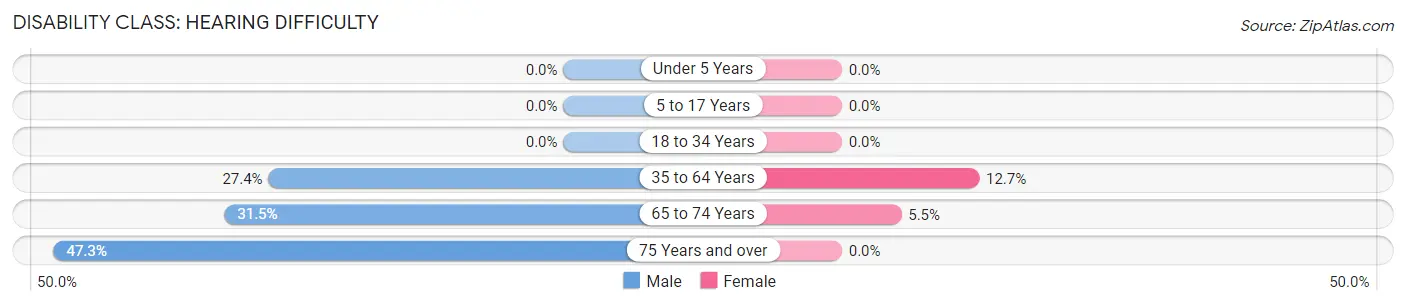
| Age Bracket | Male | Female |
| Under 5 Years | 0 (0.0%) | 0 (0.0%) |
| 5 to 17 Years | 0 (0.0%) | 0 (0.0%) |
| 18 to 34 Years | 0 (0.0%) | 0 (0.0%) |
| 35 to 64 Years | 78 (27.4%) | 60 (12.7%) |
| 65 to 74 Years | 28 (31.5%) | 10 (5.5%) |
| 75 Years and over | 44 (47.3%) | 0 (0.0%) |
Disability Class: Vision Difficulty
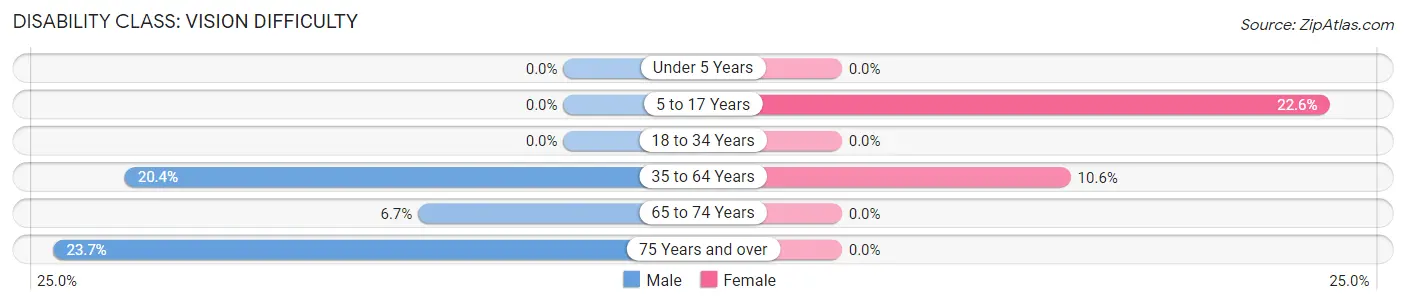
| Age Bracket | Male | Female |
| Under 5 Years | 0 (0.0%) | 0 (0.0%) |
| 5 to 17 Years | 0 (0.0%) | 19 (22.6%) |
| 18 to 34 Years | 0 (0.0%) | 0 (0.0%) |
| 35 to 64 Years | 58 (20.3%) | 50 (10.6%) |
| 65 to 74 Years | 6 (6.7%) | 0 (0.0%) |
| 75 Years and over | 22 (23.7%) | 0 (0.0%) |
Disability Class: Cognitive Difficulty
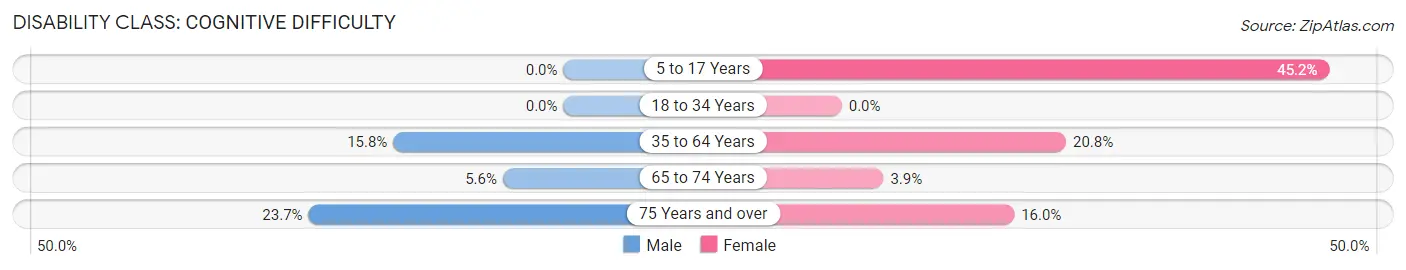
| Age Bracket | Male | Female |
| 5 to 17 Years | 0 (0.0%) | 38 (45.2%) |
| 18 to 34 Years | 0 (0.0%) | 0 (0.0%) |
| 35 to 64 Years | 45 (15.8%) | 98 (20.8%) |
| 65 to 74 Years | 5 (5.6%) | 7 (3.9%) |
| 75 Years and over | 22 (23.7%) | 8 (16.0%) |
Disability Class: Ambulatory Difficulty
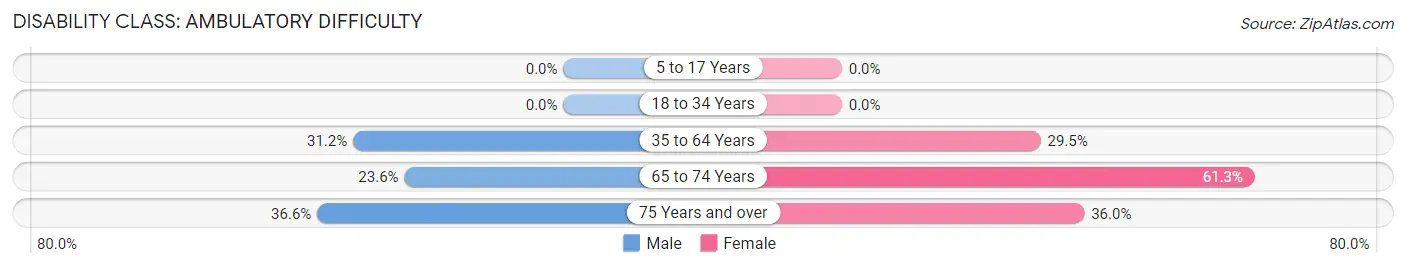
| Age Bracket | Male | Female |
| 5 to 17 Years | 0 (0.0%) | 0 (0.0%) |
| 18 to 34 Years | 0 (0.0%) | 0 (0.0%) |
| 35 to 64 Years | 89 (31.2%) | 139 (29.5%) |
| 65 to 74 Years | 21 (23.6%) | 111 (61.3%) |
| 75 Years and over | 34 (36.6%) | 18 (36.0%) |
Disability Class: Self-Care Difficulty
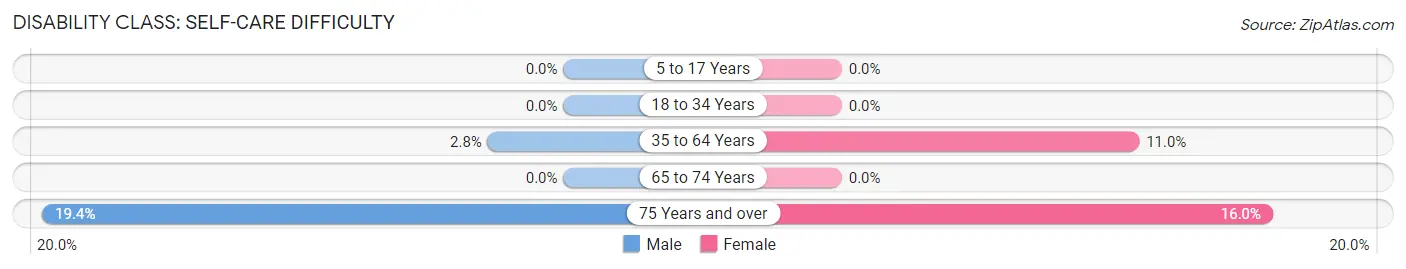
| Age Bracket | Male | Female |
| 5 to 17 Years | 0 (0.0%) | 0 (0.0%) |
| 18 to 34 Years | 0 (0.0%) | 0 (0.0%) |
| 35 to 64 Years | 8 (2.8%) | 52 (11.0%) |
| 65 to 74 Years | 0 (0.0%) | 0 (0.0%) |
| 75 Years and over | 18 (19.4%) | 8 (16.0%) |
Technology Access in Welch
Computing Device Access in Welch
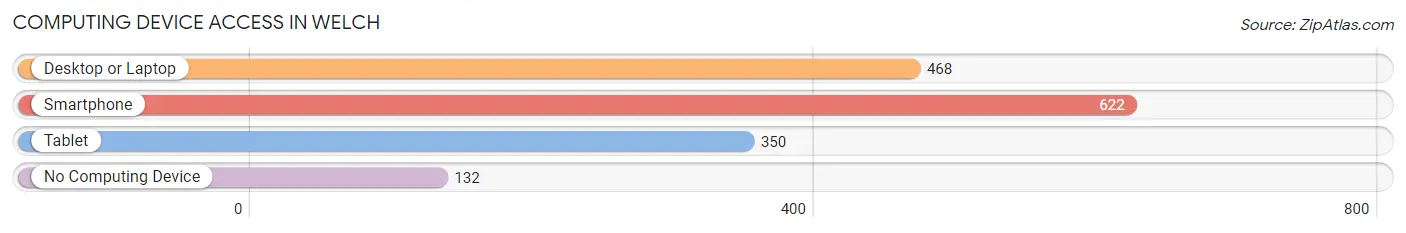
| Device Type | # Households | % Households |
| Desktop or Laptop | 468 | 57.9% |
| Smartphone | 622 | 77.0% |
| Tablet | 350 | 43.3% |
| No Computing Device | 132 | 16.3% |
| Total | 808 | 100.0% |
Internet Access in Welch
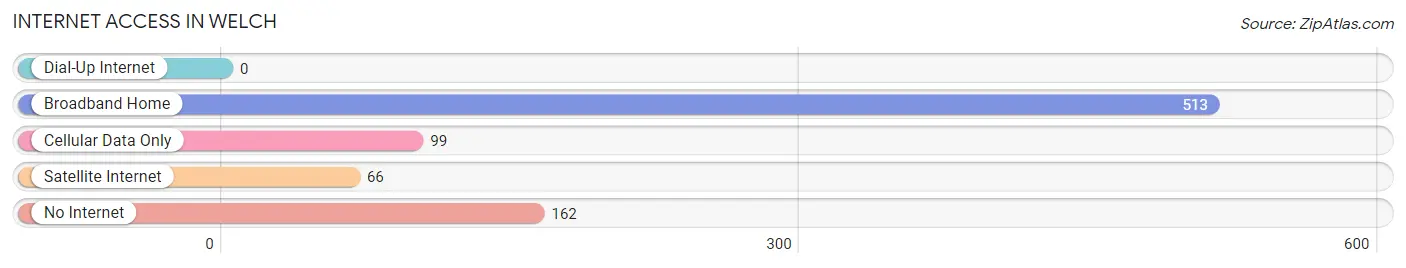
| Internet Type | # Households | % Households |
| Dial-Up Internet | 0 | 0.0% |
| Broadband Home | 513 | 63.5% |
| Cellular Data Only | 99 | 12.2% |
| Satellite Internet | 66 | 8.2% |
| No Internet | 162 | 20.1% |
| Total | 808 | 100.0% |
Welch Summary
Welch, West Virginia is a small city located in McDowell County in the Appalachian Mountains of the United States. It is the county seat of McDowell County and has a population of 2,406 as of the 2010 census. The city is located in the heart of the Appalachian coal mining region and has a long history of coal mining and related industries.
Geography
Welch is located in the Appalachian Mountains of West Virginia, in the southeastern part of the state. It is situated in the Tug Fork Valley, along the Tug Fork River, which is a tributary of the Big Sandy River. The city is surrounded by mountains, including Big Creek Mountain to the north, Big Sandy Mountain to the east, and Little Creek Mountain to the south. The city is located at an elevation of 1,845 feet (562 m).
Economy
Welch has a long history of coal mining and related industries. The city was founded in the late 19th century as a coal mining town and was the site of the first coal mine in McDowell County. The coal industry has been the primary source of employment in the city for many years. In recent years, however, the coal industry has declined due to the rise of natural gas and other energy sources. As a result, the city has seen a decrease in population and economic activity.
In addition to coal mining, Welch is home to several other industries, including timber, manufacturing, and tourism. The city is also home to several small businesses, including restaurants, retail stores, and service providers.
Demographics
As of the 2010 census, Welch had a population of 2,406. The racial makeup of the city was 95.3% White, 2.2% African American, 0.2% Native American, 0.2% Asian, 0.1% Pacific Islander, 0.7% from other races, and 1.3% from two or more races. Hispanic or Latino of any race were 1.3% of the population.
The median income for a household in Welch was $20,972, and the median income for a family was $25,972. The per capita income for the city was $12,845. About 24.3% of families and 28.2% of the population were below the poverty line, including 37.2% of those under age 18 and 16.2% of those age 65 or over.
Conclusion
Welch, West Virginia is a small city located in the Appalachian Mountains of the United States. It has a long history of coal mining and related industries, but in recent years the coal industry has declined due to the rise of natural gas and other energy sources. As a result, the city has seen a decrease in population and economic activity. Despite this, Welch is still home to several other industries, including timber, manufacturing, and tourism, as well as several small businesses. The city has a population of 2,406 as of the 2010 census, with a median household income of $20,972 and a per capita income of $12,845.
Common Questions
What is Per Capita Income in Welch?
Per Capita income in Welch is $11,974.
What is the Median Family Income in Welch?
Median Family Income in Welch is $51,213.
What is the Median Household income in Welch?
Median Household Income in Welch is $32,109.
What is Income or Wage Gap in Welch?
Income or Wage Gap in Welch is 43.9%.
Women in Welch earn 56.1 cents for every dollar earned by a man.
What is Inequality or Gini Index in Welch?
Inequality or Gini Index in Welch is 0.41.
What is the Total Population of Welch?
Total Population of Welch is 3,475.
What is the Total Male Population of Welch?
Total Male Population of Welch is 2,587.
What is the Total Female Population of Welch?
Total Female Population of Welch is 888.
What is the Ratio of Males per 100 Females in Welch?
There are 291.33 Males per 100 Females in Welch.
What is the Ratio of Females per 100 Males in Welch?
There are 34.33 Females per 100 Males in Welch.
What is the Median Population Age in Welch?
Median Population Age in Welch is 41.2 Years.
What is the Average Family Size in Welch
Average Family Size in Welch is 3.2 People.
What is the Average Household Size in Welch
Average Household Size in Welch is 2.1 People.
How Large is the Labor Force in Welch?
There are 508 People in the Labor Forcein in Welch.
What is the Percentage of People in the Labor Force in Welch?
16.2% of People are in the Labor Force in Welch.
What is the Unemployment Rate in Welch?
Unemployment Rate in Welch is 8.7%.