Waverly, WV Map & Demographics
Waverly Map
Waverly Overview
$24,721
PER CAPITA INCOME
$77,202
AVG FAMILY INCOME
$77,833
AVG HOUSEHOLD INCOME
0.22
INEQUALITY / GINI INDEX
482
TOTAL POPULATION
246
MALE POPULATION
236
FEMALE POPULATION
104.24
MALES / 100 FEMALES
95.93
FEMALES / 100 MALES
40.0
MEDIAN AGE
3.1
AVG FAMILY SIZE
2.9
AVG HOUSEHOLD SIZE
152
LABOR FORCE [ PEOPLE ]
43.6%
PERCENT IN LABOR FORCE
Waverly Zip Codes
Waverly Area Codes
Income in Waverly
Income Overview in Waverly
Per Capita Income in Waverly is $24,721, while median incomes of families and households are $77,202 and $77,833 respectively.
| Characteristic | Number | Measure |
| Per Capita Income | 482 | $24,721 |
| Median Family Income | 125 | $77,202 |
| Mean Family Income | 125 | $72,559 |
| Median Household Income | 164 | $77,833 |
| Mean Household Income | 164 | $69,071 |
| Income Deficit | 125 | $0 |
| Wage / Income Gap (%) | 482 | 0.00% |
| Wage / Income Gap ($) | 482 | 100.00¢ per $1 |
| Gini / Inequality Index | 482 | 0.22 |
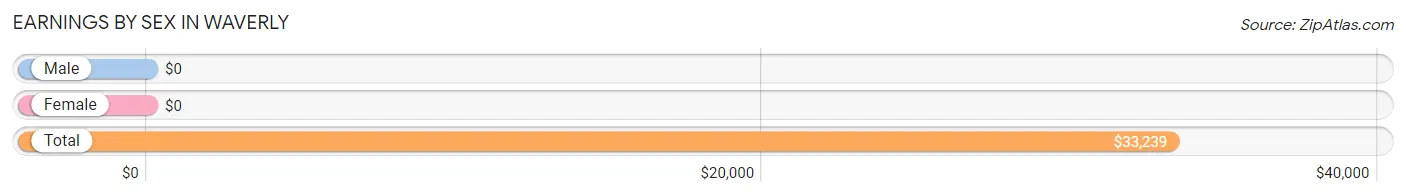
Earnings by Sex in Waverly
| Sex | Number | Average Earnings |
| Male | 87 (52.7%) | $0 |
| Female | 78 (47.3%) | $0 |
| Total | 165 (100.0%) | $33,239 |
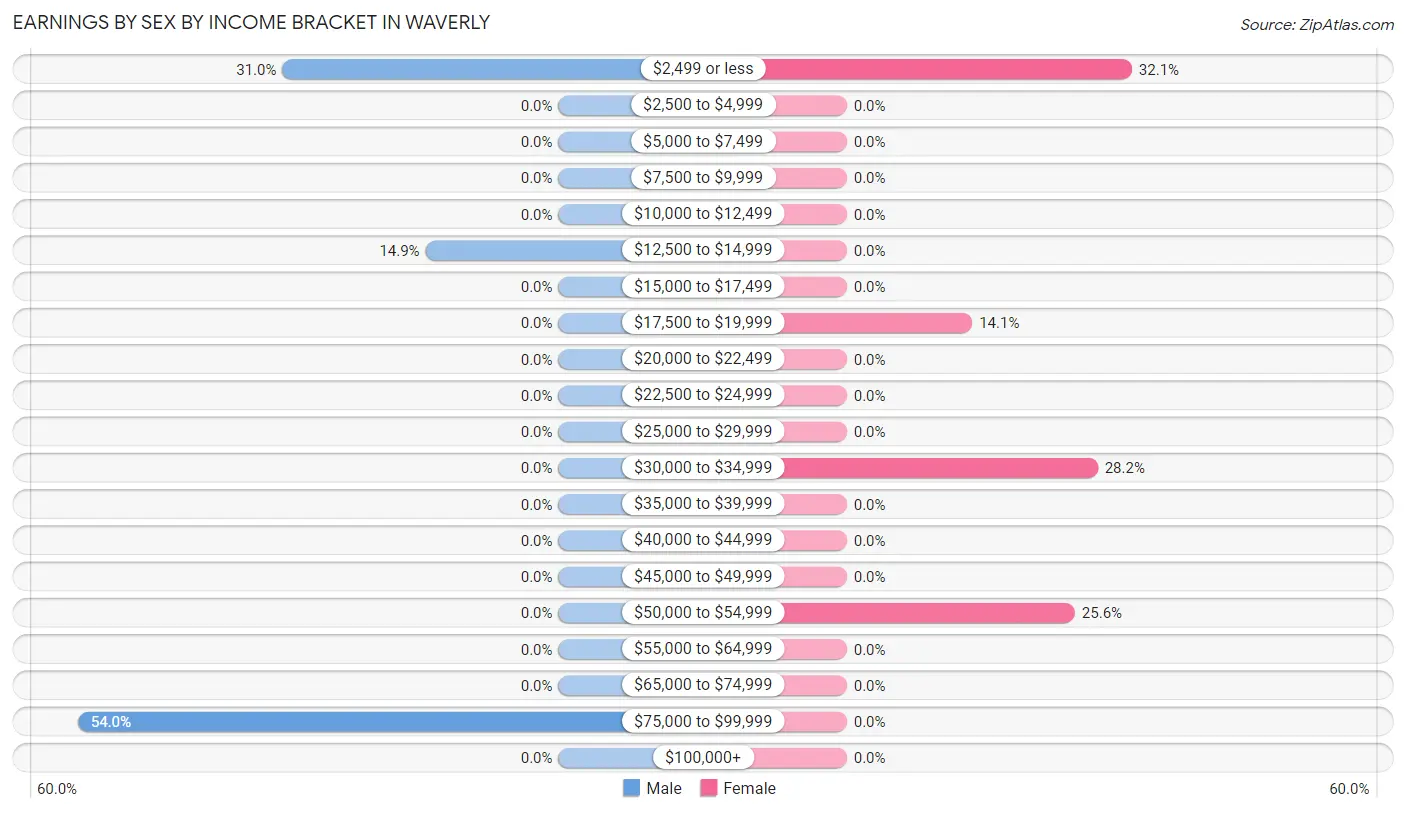
Earnings by Sex by Income Bracket in Waverly
The most common earnings brackets in Waverly are $75,000 to $99,999 for men (47 | 54.0%) and $2,499 or less for women (25 | 32.1%).
| Income | Male | Female |
| $2,499 or less | 27 (31.0%) | 25 (32.1%) |
| $2,500 to $4,999 | 0 (0.0%) | 0 (0.0%) |
| $5,000 to $7,499 | 0 (0.0%) | 0 (0.0%) |
| $7,500 to $9,999 | 0 (0.0%) | 0 (0.0%) |
| $10,000 to $12,499 | 0 (0.0%) | 0 (0.0%) |
| $12,500 to $14,999 | 13 (14.9%) | 0 (0.0%) |
| $15,000 to $17,499 | 0 (0.0%) | 0 (0.0%) |
| $17,500 to $19,999 | 0 (0.0%) | 11 (14.1%) |
| $20,000 to $22,499 | 0 (0.0%) | 0 (0.0%) |
| $22,500 to $24,999 | 0 (0.0%) | 0 (0.0%) |
| $25,000 to $29,999 | 0 (0.0%) | 0 (0.0%) |
| $30,000 to $34,999 | 0 (0.0%) | 22 (28.2%) |
| $35,000 to $39,999 | 0 (0.0%) | 0 (0.0%) |
| $40,000 to $44,999 | 0 (0.0%) | 0 (0.0%) |
| $45,000 to $49,999 | 0 (0.0%) | 0 (0.0%) |
| $50,000 to $54,999 | 0 (0.0%) | 20 (25.6%) |
| $55,000 to $64,999 | 0 (0.0%) | 0 (0.0%) |
| $65,000 to $74,999 | 0 (0.0%) | 0 (0.0%) |
| $75,000 to $99,999 | 47 (54.0%) | 0 (0.0%) |
| $100,000+ | 0 (0.0%) | 0 (0.0%) |
| Total | 87 (100.0%) | 78 (100.0%) |
Earnings by Sex by Educational Attainment in Waverly
| Educational Attainment | Male Income | Female Income |
| Less than High School | - | - |
| High School Diploma | - | - |
| College or Associate's Degree | - | - |
| Bachelor's Degree | - | - |
| Graduate Degree | - | - |
| Total | - | - |
Family Income in Waverly
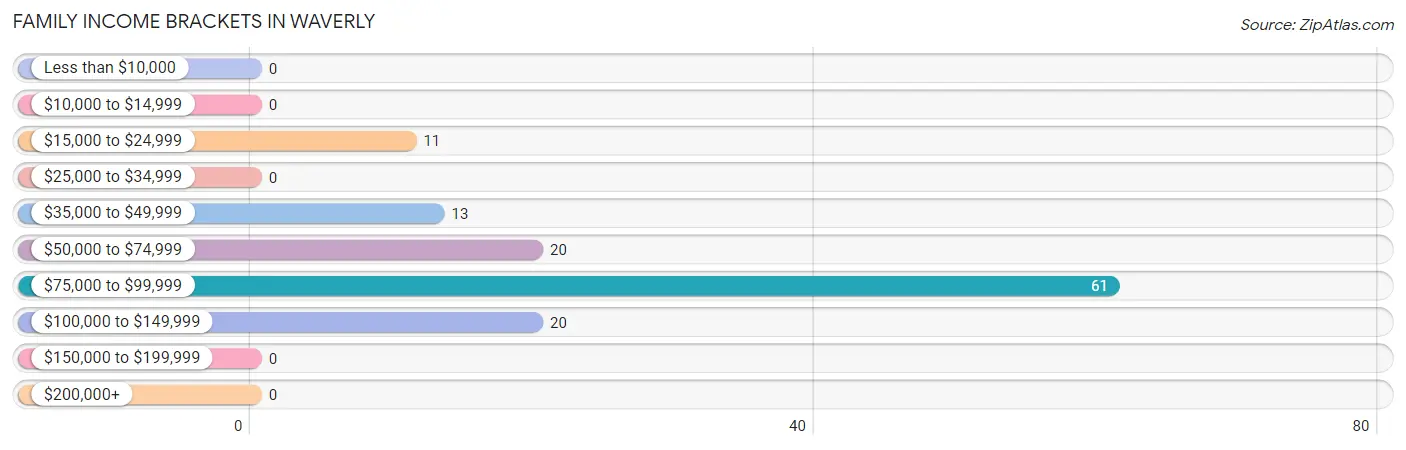
Family Income Brackets in Waverly
According to the Waverly family income data, there are 61 families falling into the $75,000 to $99,999 income range, which is the most common income bracket and makes up 48.8% of all families.
| Income Bracket | # Families | % Families |
| Less than $10,000 | 0 | 0.0% |
| $10,000 to $14,999 | 0 | 0.0% |
| $15,000 to $24,999 | 11 | 8.8% |
| $25,000 to $34,999 | 0 | 0.0% |
| $35,000 to $49,999 | 13 | 10.4% |
| $50,000 to $74,999 | 20 | 16.0% |
| $75,000 to $99,999 | 61 | 48.8% |
| $100,000 to $149,999 | 20 | 16.0% |
| $150,000 to $199,999 | 0 | 0.0% |
| $200,000+ | 0 | 0.0% |
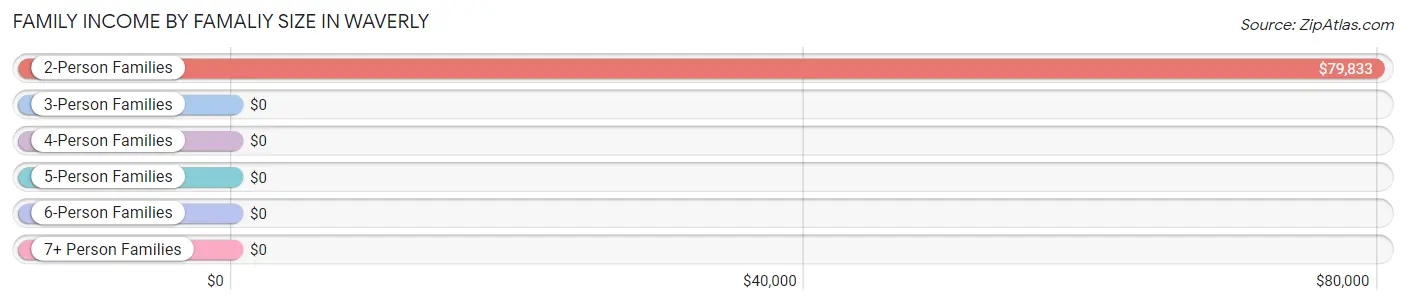
Family Income by Famaliy Size in Waverly
2-person families (92 | 73.6%) account for the highest median family income in Waverly with $79,833 per family, while 2-person families (92 | 73.6%) have the highest median income of $39,916 per family member.
| Income Bracket | # Families | Median Income |
| 2-Person Families | 92 (73.6%) | $79,833 |
| 3-Person Families | 0 (0.0%) | $0 |
| 4-Person Families | 20 (16.0%) | $0 |
| 5-Person Families | 13 (10.4%) | $0 |
| 6-Person Families | 0 (0.0%) | $0 |
| 7+ Person Families | 0 (0.0%) | $0 |
| Total | 125 (100.0%) | $77,202 |
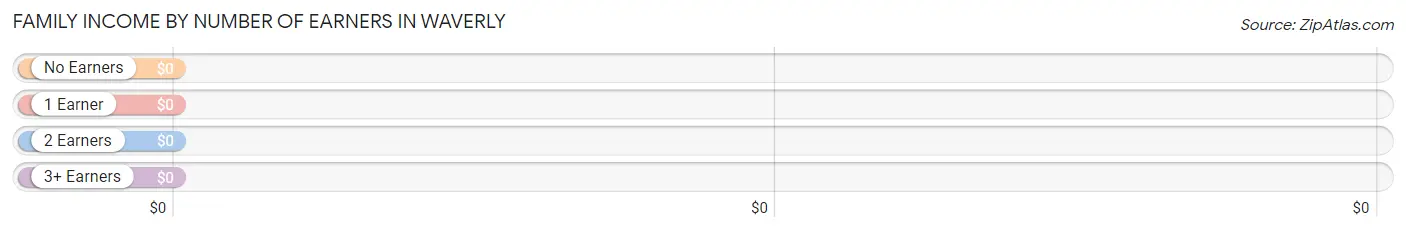
Family Income by Number of Earners in Waverly
| Number of Earners | # Families | Median Income |
| No Earners | 36 (28.8%) | $0 |
| 1 Earner | 51 (40.8%) | $0 |
| 2 Earners | 25 (20.0%) | $0 |
| 3+ Earners | 13 (10.4%) | $0 |
| Total | 125 (100.0%) | $77,202 |
Household Income in Waverly
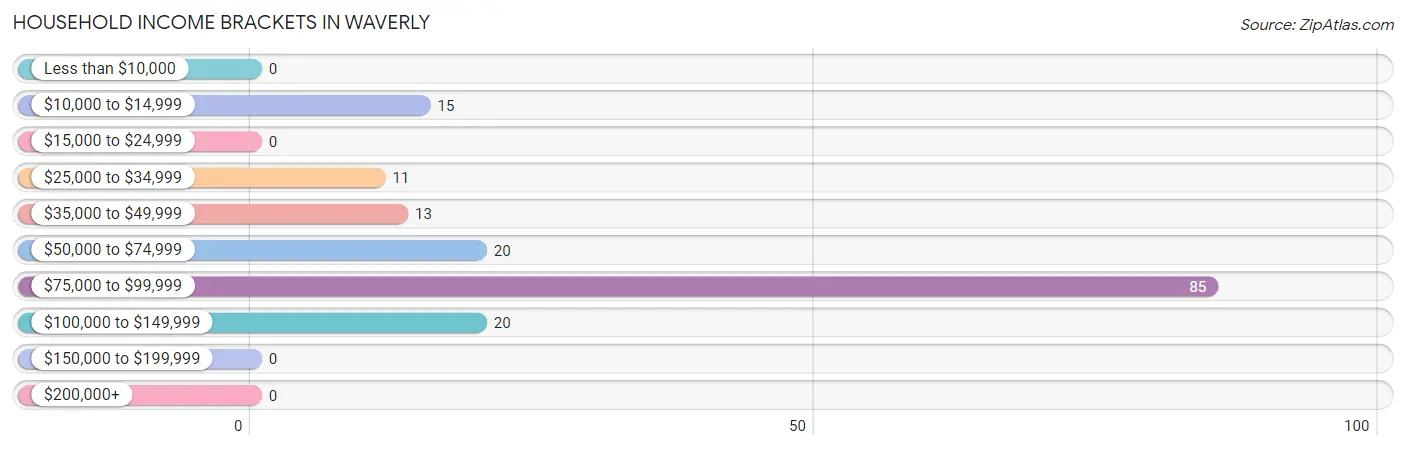
Household Income Brackets in Waverly
With 85 households falling in the category, the $75,000 to $99,999 income range is the most frequent in Waverly, accounting for 51.8% of all households.
| Income Bracket | # Households | % Households |
| Less than $10,000 | 0 | 0.0% |
| $10,000 to $14,999 | 15 | 9.1% |
| $15,000 to $24,999 | 0 | 0.0% |
| $25,000 to $34,999 | 11 | 6.7% |
| $35,000 to $49,999 | 13 | 7.9% |
| $50,000 to $74,999 | 20 | 12.2% |
| $75,000 to $99,999 | 85 | 51.8% |
| $100,000 to $149,999 | 20 | 12.2% |
| $150,000 to $199,999 | 0 | 0.0% |
| $200,000+ | 0 | 0.0% |
Household Income by Householder Age in Waverly
The median household income in Waverly is $77,833, with the highest median household income of $75,774 found in the 45 to 64 years age bracket for the primary householder. A total of 69 households (42.1%) fall into this category. Meanwhile, the 15 to 24 years age bracket for the primary householder has the lowest median household income of $0, with 11 households (6.7%) in this group.
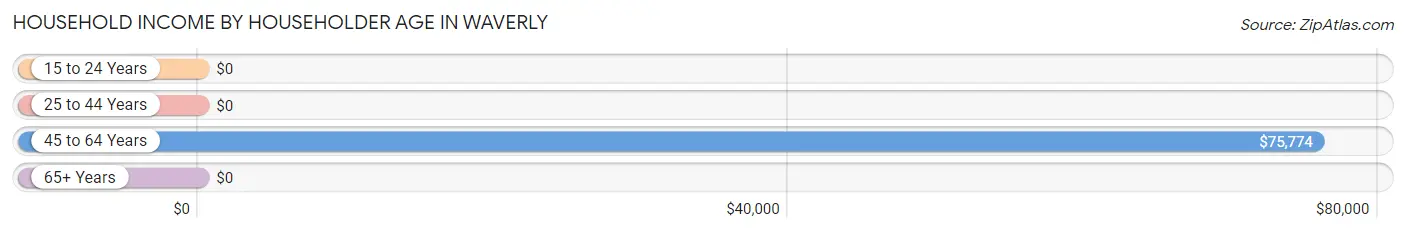
| Income Bracket | # Households | Median Income |
| 15 to 24 Years | 11 (6.7%) | $0 |
| 25 to 44 Years | 45 (27.4%) | $0 |
| 45 to 64 Years | 69 (42.1%) | $75,774 |
| 65+ Years | 39 (23.8%) | $0 |
| Total | 164 (100.0%) | $77,833 |
Poverty in Waverly
Income Below Poverty by Sex and Age in Waverly
With 11.4% poverty level for males and 25.8% for females among the residents of Waverly, 25 to 34 year old males and under 5 year old females are the most vulnerable to poverty, with 28 males (100.0%) and 28 females (100.0%) in their respective age groups living below the poverty level.
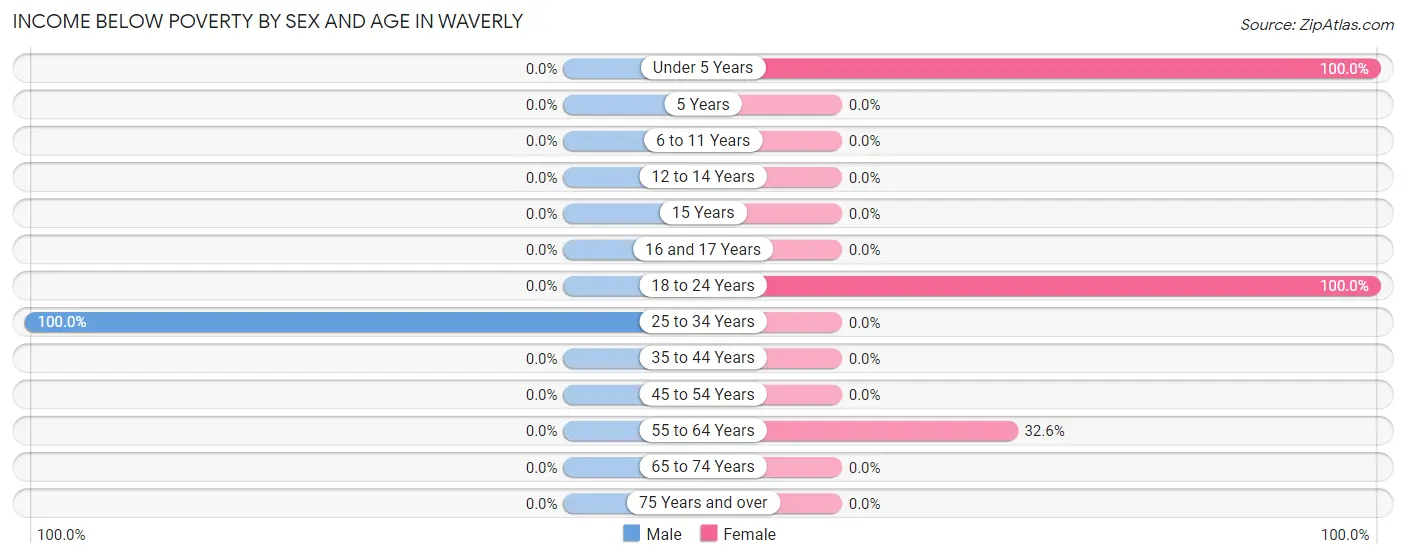
| Age Bracket | Male | Female |
| Under 5 Years | 0 (0.0%) | 28 (100.0%) |
| 5 Years | 0 (0.0%) | 0 (0.0%) |
| 6 to 11 Years | 0 (0.0%) | 0 (0.0%) |
| 12 to 14 Years | 0 (0.0%) | 0 (0.0%) |
| 15 Years | 0 (0.0%) | 0 (0.0%) |
| 16 and 17 Years | 0 (0.0%) | 0 (0.0%) |
| 18 to 24 Years | 0 (0.0%) | 11 (100.0%) |
| 25 to 34 Years | 28 (100.0%) | 0 (0.0%) |
| 35 to 44 Years | 0 (0.0%) | 0 (0.0%) |
| 45 to 54 Years | 0 (0.0%) | 0 (0.0%) |
| 55 to 64 Years | 0 (0.0%) | 15 (32.6%) |
| 65 to 74 Years | 0 (0.0%) | 0 (0.0%) |
| 75 Years and over | 0 (0.0%) | 0 (0.0%) |
| Total | 28 (11.4%) | 54 (25.8%) |
Income Above Poverty by Sex and Age in Waverly
According to the poverty statistics in Waverly, males aged under 5 years and females aged 12 to 14 years are the age groups that are most secure financially, with 100.0% of males and 100.0% of females in these age groups living above the poverty line.
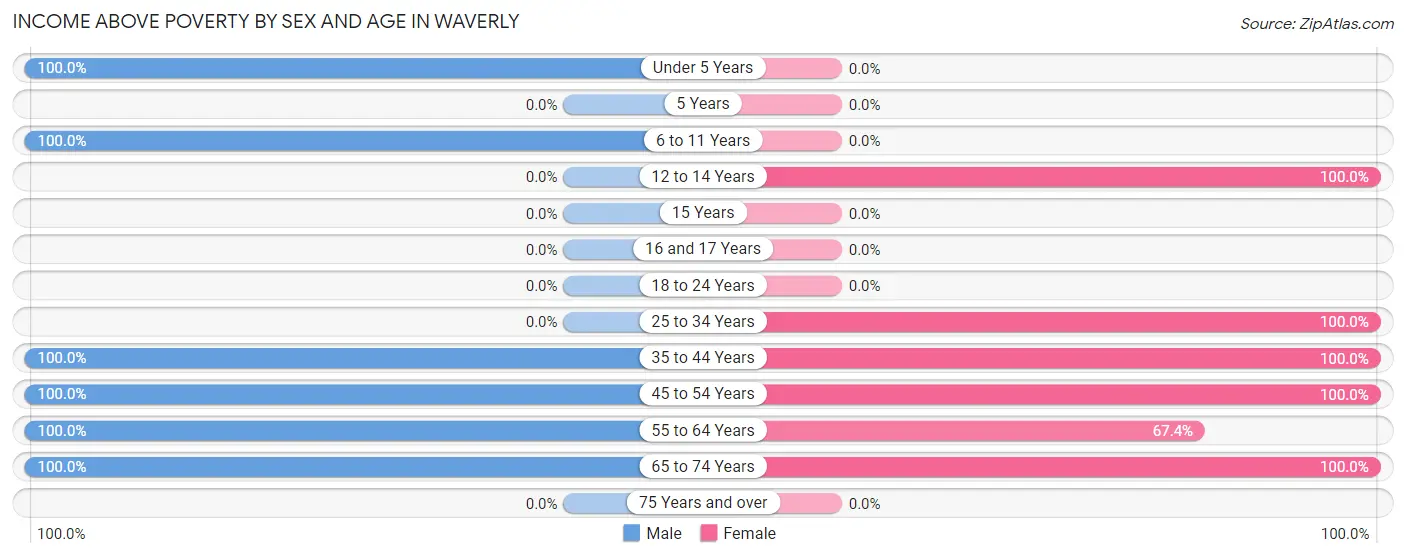
| Age Bracket | Male | Female |
| Under 5 Years | 38 (100.0%) | 0 (0.0%) |
| 5 Years | 0 (0.0%) | 0 (0.0%) |
| 6 to 11 Years | 19 (100.0%) | 0 (0.0%) |
| 12 to 14 Years | 0 (0.0%) | 21 (100.0%) |
| 15 Years | 0 (0.0%) | 0 (0.0%) |
| 16 and 17 Years | 0 (0.0%) | 0 (0.0%) |
| 18 to 24 Years | 0 (0.0%) | 0 (0.0%) |
| 25 to 34 Years | 0 (0.0%) | 42 (100.0%) |
| 35 to 44 Years | 43 (100.0%) | 25 (100.0%) |
| 45 to 54 Years | 27 (100.0%) | 21 (100.0%) |
| 55 to 64 Years | 54 (100.0%) | 31 (67.4%) |
| 65 to 74 Years | 37 (100.0%) | 15 (100.0%) |
| 75 Years and over | 0 (0.0%) | 0 (0.0%) |
| Total | 218 (88.6%) | 155 (74.2%) |
Income Below Poverty Among Married-Couple Families in Waverly
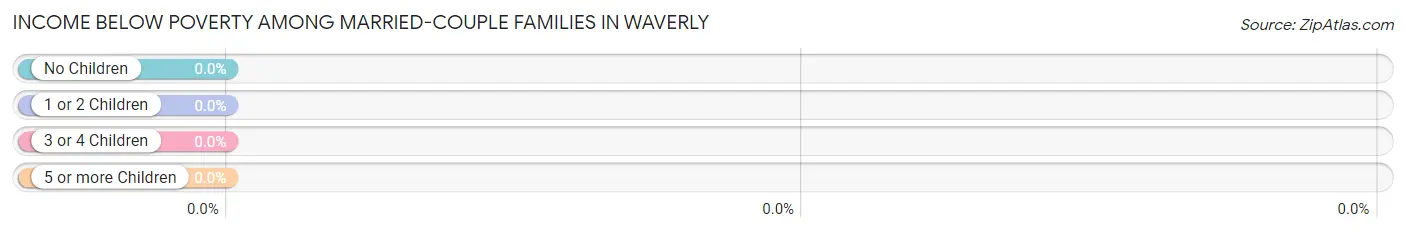
| Children | Above Poverty | Below Poverty |
| No Children | 81 (100.0%) | 0 (0.0%) |
| 1 or 2 Children | 33 (100.0%) | 0 (0.0%) |
| 3 or 4 Children | 0 (0.0%) | 0 (0.0%) |
| 5 or more Children | 0 (0.0%) | 0 (0.0%) |
| Total | 114 (100.0%) | 0 (0.0%) |
Income Below Poverty Among Single-Parent Households in Waverly
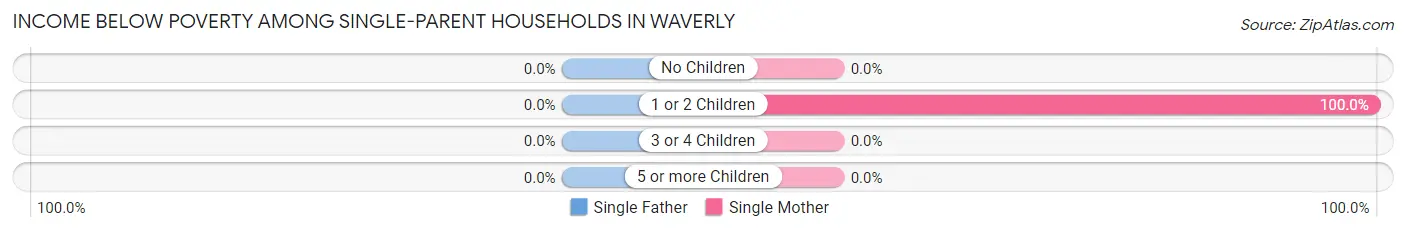
| Children | Single Father | Single Mother |
| No Children | 0 (0.0%) | 0 (0.0%) |
| 1 or 2 Children | 0 (0.0%) | 11 (100.0%) |
| 3 or 4 Children | 0 (0.0%) | 0 (0.0%) |
| 5 or more Children | 0 (0.0%) | 0 (0.0%) |
| Total | 0 (0.0%) | 11 (100.0%) |
Income Below Poverty Among Married-Couple vs Single-Parent Households in Waverly
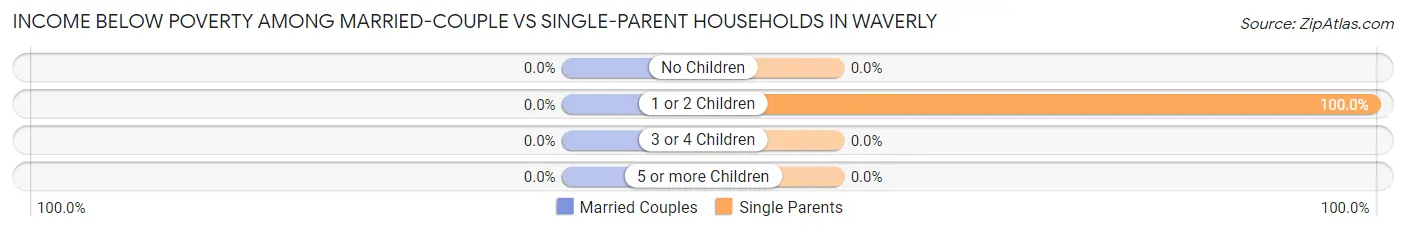
| Children | Married-Couple Families | Single-Parent Households |
| No Children | 0 (0.0%) | 0 (0.0%) |
| 1 or 2 Children | 0 (0.0%) | 11 (100.0%) |
| 3 or 4 Children | 0 (0.0%) | 0 (0.0%) |
| 5 or more Children | 0 (0.0%) | 0 (0.0%) |
| Total | 0 (0.0%) | 11 (100.0%) |
Race in Waverly
The most populous races in Waverly are White / Caucasian (471 | 97.7%), and Native / Alaskan (11 | 2.3%).
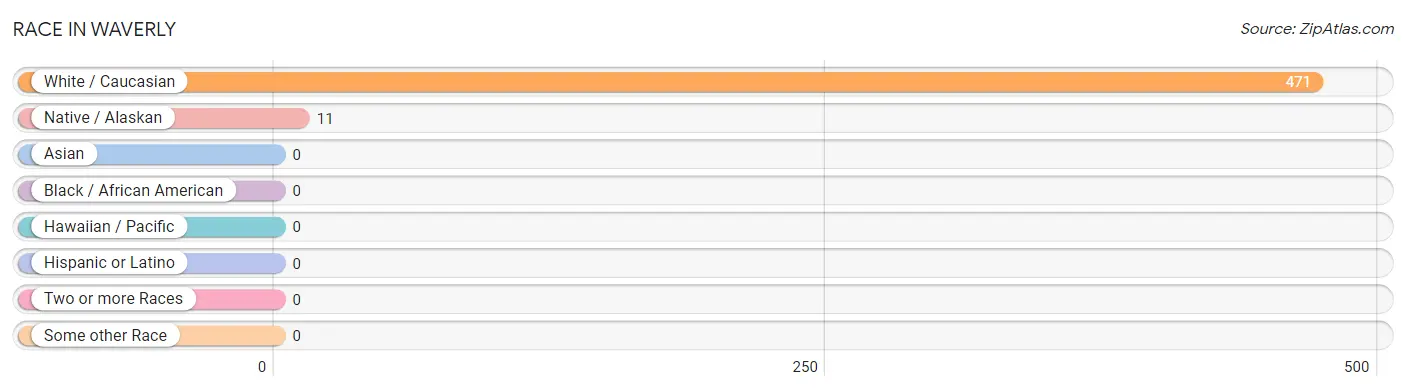
| Race | # Population | % Population |
| Asian | 0 | 0.0% |
| Black / African American | 0 | 0.0% |
| Hawaiian / Pacific | 0 | 0.0% |
| Hispanic or Latino | 0 | 0.0% |
| Native / Alaskan | 11 | 2.3% |
| White / Caucasian | 471 | 97.7% |
| Two or more Races | 0 | 0.0% |
| Some other Race | 0 | 0.0% |
| Total | 482 | 100.0% |
Ancestry in Waverly
The most populous ancestries reported in Waverly are Irish (51 | 10.6%), English (49 | 10.2%), German (42 | 8.7%), American (24 | 5.0%), and Scandinavian (20 | 4.2%), together accounting for 38.6% of all Waverly residents.
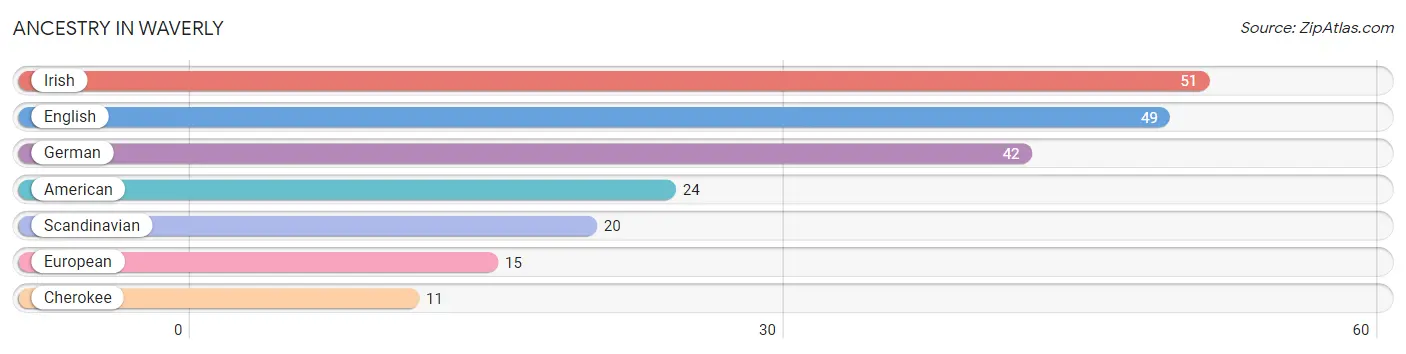
| Ancestry | # Population | % Population |
| American | 24 | 5.0% |
| Cherokee | 11 | 2.3% |
| English | 49 | 10.2% |
| European | 15 | 3.1% |
| German | 42 | 8.7% |
| Irish | 51 | 10.6% |
| Scandinavian | 20 | 4.2% | View All 7 Rows |
Immigrants in Waverly

| Immigration Origin | # Population | % Population | View All 0 Rows |
Sex and Age in Waverly
Sex and Age in Waverly
The most populous age groups in Waverly are 55 to 59 Years (54 | 22.0%) for men and 10 to 14 Years (48 | 20.3%) for women.
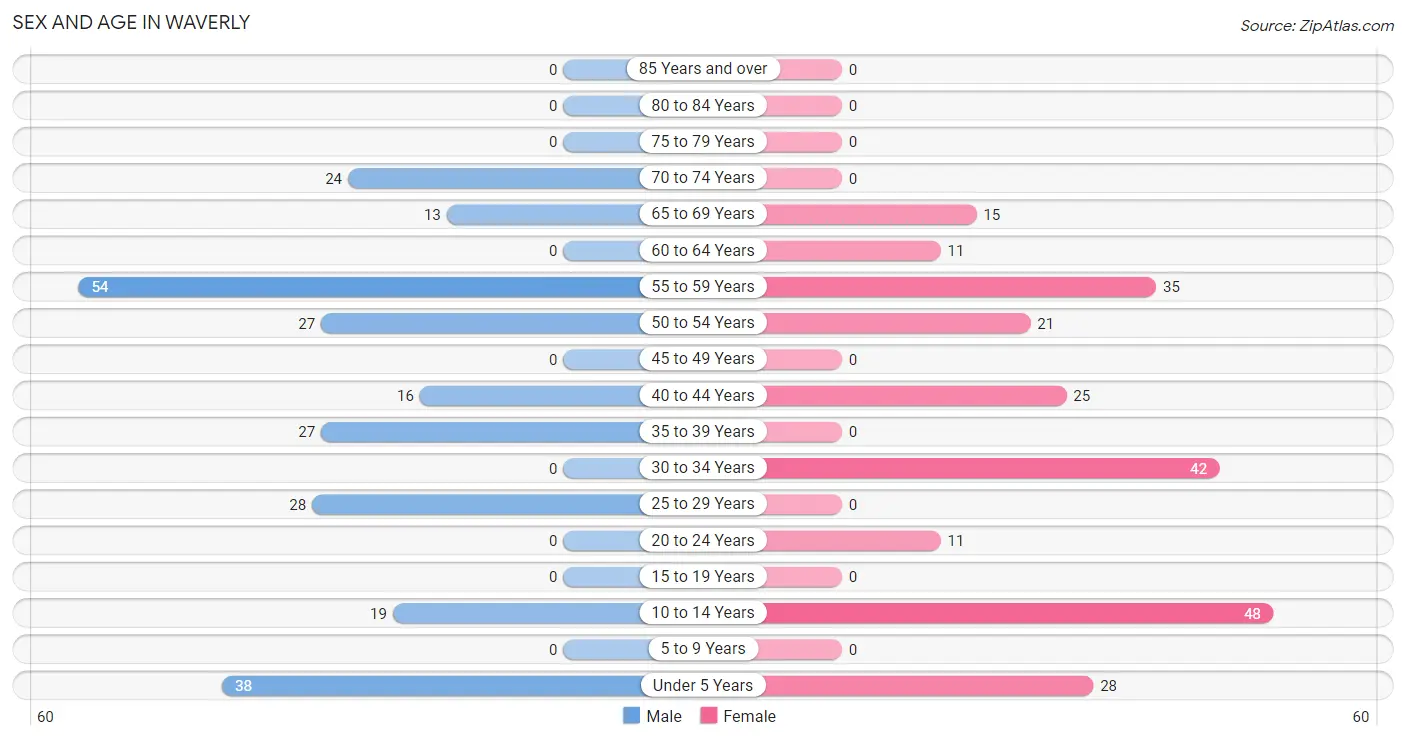
| Age Bracket | Male | Female |
| Under 5 Years | 38 (15.4%) | 28 (11.9%) |
| 5 to 9 Years | 0 (0.0%) | 0 (0.0%) |
| 10 to 14 Years | 19 (7.7%) | 48 (20.3%) |
| 15 to 19 Years | 0 (0.0%) | 0 (0.0%) |
| 20 to 24 Years | 0 (0.0%) | 11 (4.7%) |
| 25 to 29 Years | 28 (11.4%) | 0 (0.0%) |
| 30 to 34 Years | 0 (0.0%) | 42 (17.8%) |
| 35 to 39 Years | 27 (11.0%) | 0 (0.0%) |
| 40 to 44 Years | 16 (6.5%) | 25 (10.6%) |
| 45 to 49 Years | 0 (0.0%) | 0 (0.0%) |
| 50 to 54 Years | 27 (11.0%) | 21 (8.9%) |
| 55 to 59 Years | 54 (22.0%) | 35 (14.8%) |
| 60 to 64 Years | 0 (0.0%) | 11 (4.7%) |
| 65 to 69 Years | 13 (5.3%) | 15 (6.4%) |
| 70 to 74 Years | 24 (9.8%) | 0 (0.0%) |
| 75 to 79 Years | 0 (0.0%) | 0 (0.0%) |
| 80 to 84 Years | 0 (0.0%) | 0 (0.0%) |
| 85 Years and over | 0 (0.0%) | 0 (0.0%) |
| Total | 246 (100.0%) | 236 (100.0%) |
Families and Households in Waverly
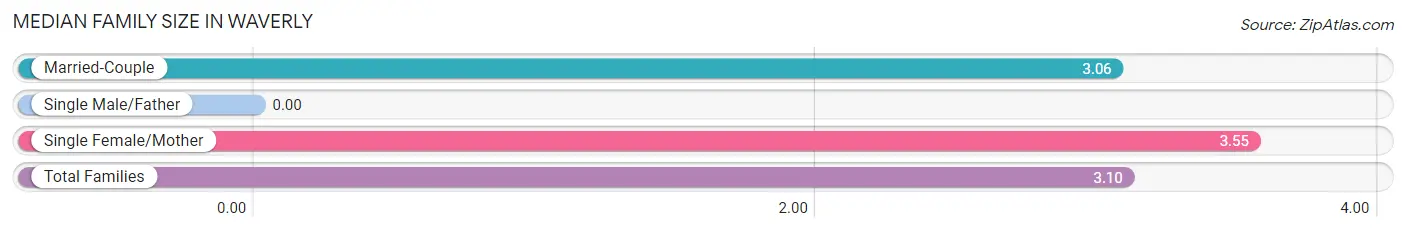
Median Family Size in Waverly
| Family Type | # Families | Family Size |
| Married-Couple | 114 (91.2%) | 3.06 |
| Single Male/Father | 0 (0.0%) | - |
| Single Female/Mother | 11 (8.8%) | 3.55 |
| Total Families | 125 (100.0%) | 3.10 |
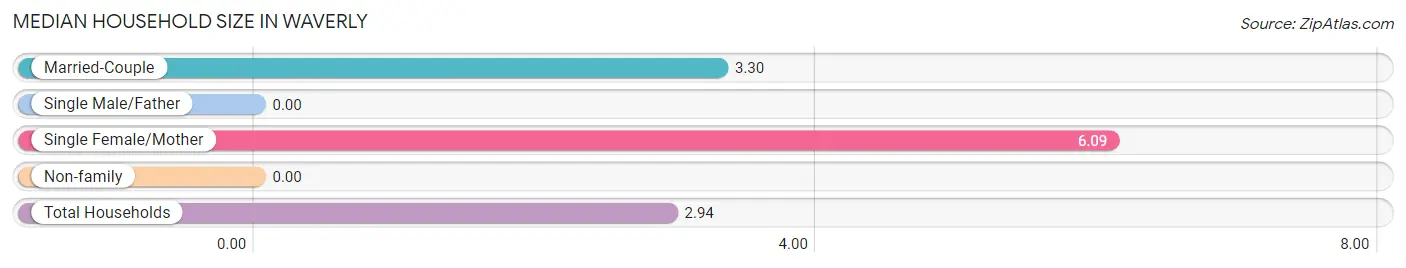
Median Household Size in Waverly
| Household Type | # Households | Household Size |
| Married-Couple | 114 (69.5%) | 3.30 |
| Single Male/Father | 0 (0.0%) | - |
| Single Female/Mother | 11 (6.7%) | 6.09 |
| Non-family | 39 (23.8%) | - |
| Total Households | 164 (100.0%) | 2.94 |
Household Size by Marriage Status in Waverly
Out of a total of 164 households in Waverly, 125 (76.2%) are family households, while 39 (23.8%) are nonfamily households. The most numerous type of family households are 2-person households, comprising 60, and the most common type of nonfamily households are 1-person households, comprising 39.
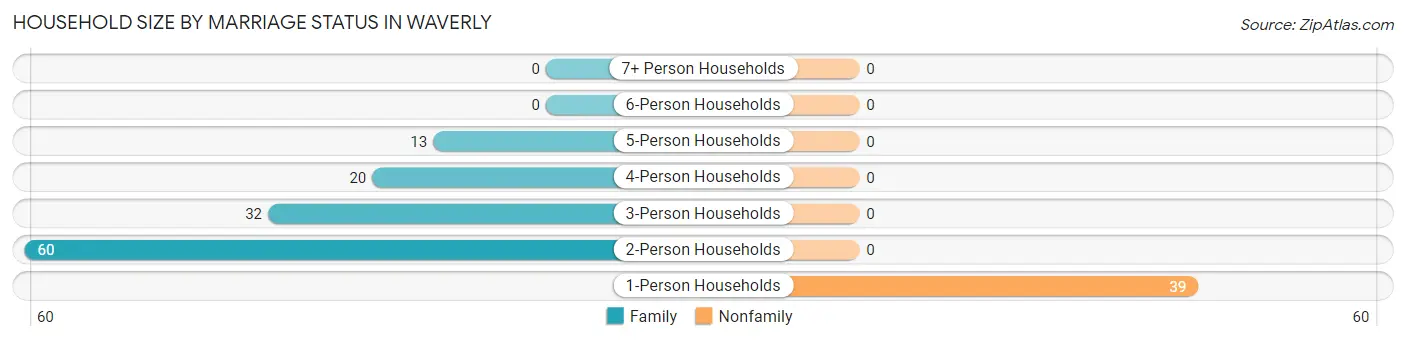
| Household Size | Family Households | Nonfamily Households |
| 1-Person Households | - | 39 (23.8%) |
| 2-Person Households | 60 (36.6%) | 0 (0.0%) |
| 3-Person Households | 32 (19.5%) | 0 (0.0%) |
| 4-Person Households | 20 (12.2%) | 0 (0.0%) |
| 5-Person Households | 13 (7.9%) | 0 (0.0%) |
| 6-Person Households | 0 (0.0%) | 0 (0.0%) |
| 7+ Person Households | 0 (0.0%) | 0 (0.0%) |
| Total | 125 (76.2%) | 39 (23.8%) |
Female Fertility in Waverly
Fertility by Age in Waverly
Average fertility rate in Waverly is 256.0 births per 1,000 women. Women in the age bracket of 20 to 34 years have the highest fertility rate with 377.0 births per 1,000 women. Women in the age bracket of 20 to 34 years acount for 100.0% of all women with births.
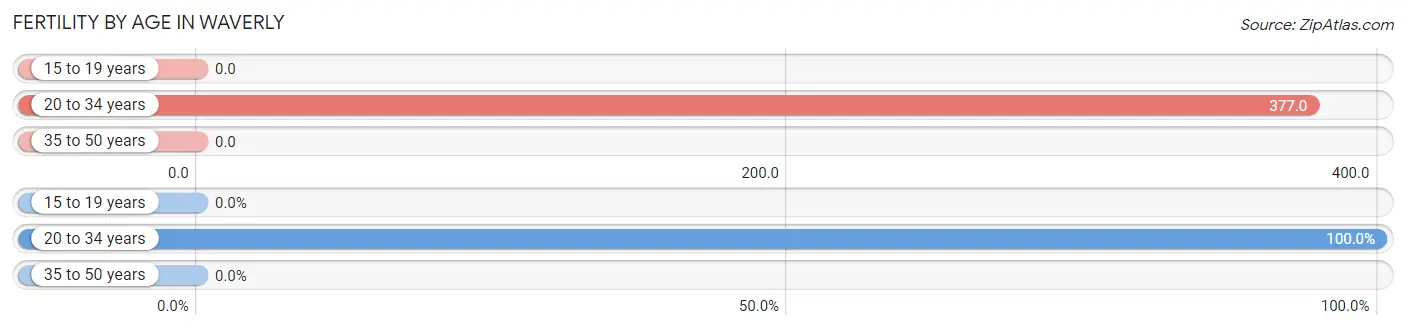
| Age Bracket | Women with Births | Births / 1,000 Women |
| 15 to 19 years | 0 (0.0%) | 0.0 |
| 20 to 34 years | 20 (100.0%) | 377.0 |
| 35 to 50 years | 0 (0.0%) | 0.0 |
| Total | 20 (100.0%) | 256.0 |
Fertility by Age by Marriage Status in Waverly
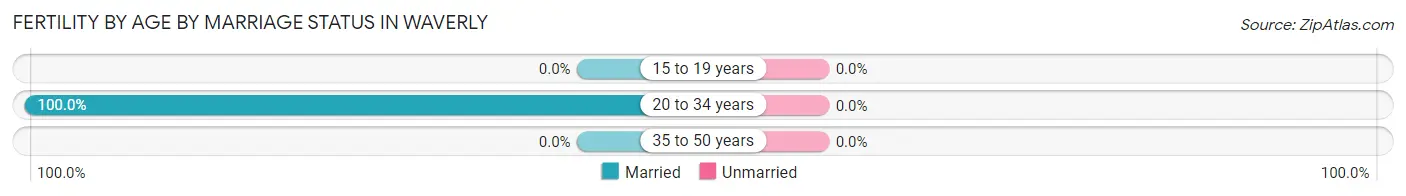
| Age Bracket | Married | Unmarried |
| 15 to 19 years | 0 (0.0%) | 0 (0.0%) |
| 20 to 34 years | 20 (100.0%) | 0 (0.0%) |
| 35 to 50 years | 0 (0.0%) | 0 (0.0%) |
| Total | 20 (100.0%) | 0 (0.0%) |
Fertility by Education in Waverly
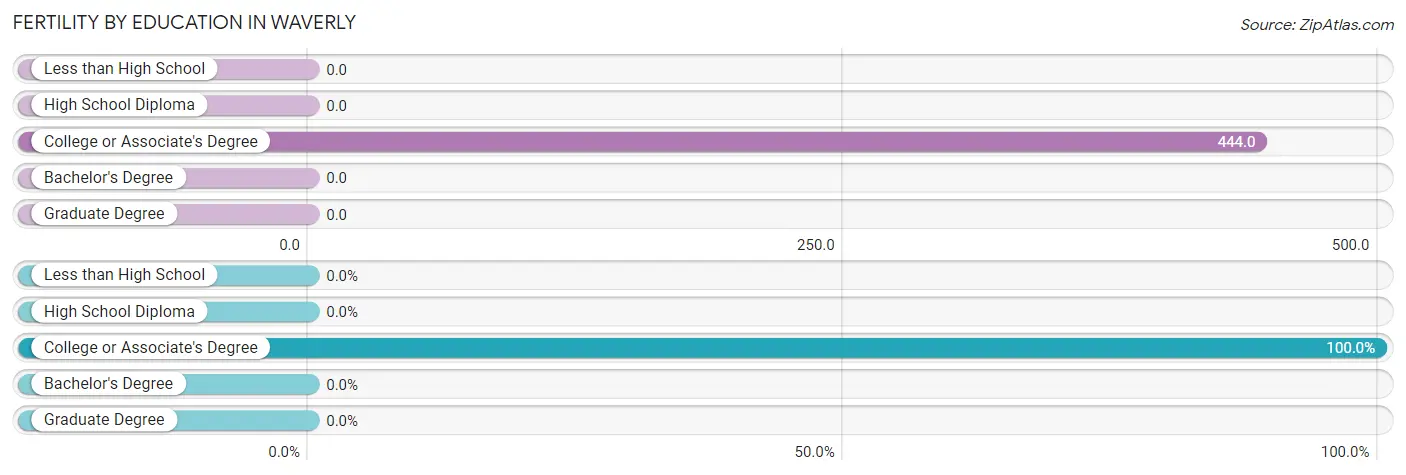
| Educational Attainment | Women with Births | Births / 1,000 Women |
| Less than High School | 0 (0.0%) | 0.0 |
| High School Diploma | 0 (0.0%) | 0.0 |
| College or Associate's Degree | 20 (100.0%) | 444.0 |
| Bachelor's Degree | 0 (0.0%) | 0.0 |
| Graduate Degree | 0 (0.0%) | 0.0 |
| Total | 20 (100.0%) | 256.0 |
Fertility by Education by Marriage Status in Waverly
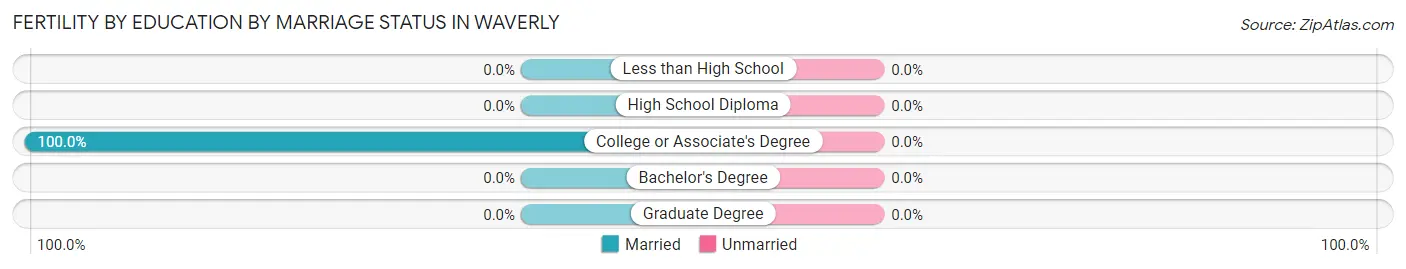
| Educational Attainment | Married | Unmarried |
| Less than High School | 0 (0.0%) | 0 (0.0%) |
| High School Diploma | 0 (0.0%) | 0 (0.0%) |
| College or Associate's Degree | 20 (100.0%) | 0 (0.0%) |
| Bachelor's Degree | 0 (0.0%) | 0 (0.0%) |
| Graduate Degree | 0 (0.0%) | 0 (0.0%) |
| Total | 20 (100.0%) | 0 (0.0%) |
Employment Characteristics in Waverly
Employment by Class of Employer in Waverly
Among the 152 employed individuals in Waverly, private company employees (83 | 54.6%), not-for-profit organizations (27 | 17.8%), and local government employees (22 | 14.5%) make up the most common classes of employment.
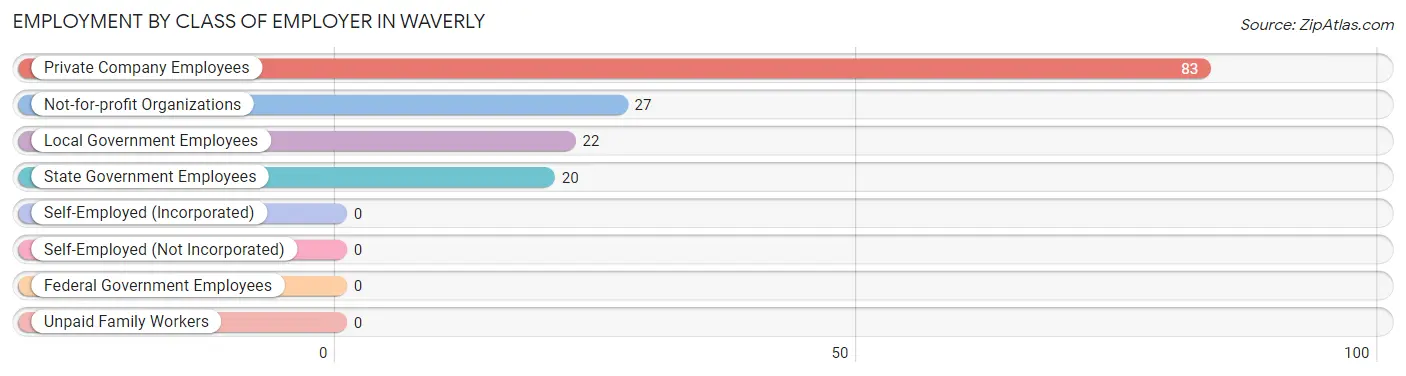
| Employer Class | # Employees | % Employees |
| Private Company Employees | 83 | 54.6% |
| Self-Employed (Incorporated) | 0 | 0.0% |
| Self-Employed (Not Incorporated) | 0 | 0.0% |
| Not-for-profit Organizations | 27 | 17.8% |
| Local Government Employees | 22 | 14.5% |
| State Government Employees | 20 | 13.2% |
| Federal Government Employees | 0 | 0.0% |
| Unpaid Family Workers | 0 | 0.0% |
| Total | 152 | 100.0% |
Employment Status by Age in Waverly

| Age Bracket | In Labor Force | Unemployed |
| 16 to 19 Years | 0 (0.0%) | 0 (0.0%) |
| 20 to 24 Years | 11 (100.0%) | 0 (0.0%) |
| 25 to 29 Years | 0 (0.0%) | 0 (0.0%) |
| 30 to 34 Years | 42 (100.0%) | 0 (0.0%) |
| 35 to 44 Years | 52 (76.5%) | 0 (0.0%) |
| 45 to 54 Years | 27 (56.3%) | 0 (0.0%) |
| 55 to 59 Years | 20 (22.5%) | 0 (0.0%) |
| 60 to 64 Years | 0 (0.0%) | 0 (0.0%) |
| 65 to 74 Years | 0 (0.0%) | 0 (0.0%) |
| 75 Years and over | 0 (0.0%) | 0 (0.0%) |
| Total | 152 (43.6%) | 0 (0.0%) |
Employment Status by Educational Attainment in Waverly
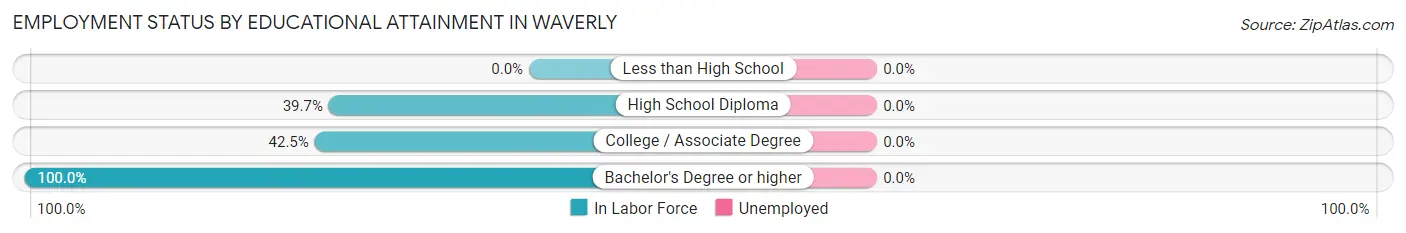
| Educational Attainment | In Labor Force | Unemployed |
| Less than High School | 0 (0.0%) | 0 (0.0%) |
| High School Diploma | 27 (39.7%) | 0 (0.0%) |
| College / Associate Degree | 65 (42.5%) | 0 (0.0%) |
| Bachelor's Degree or higher | 49 (100.0%) | 0 (0.0%) |
| Total | 141 (49.3%) | 0 (0.0%) |
Employment Occupations by Sex in Waverly
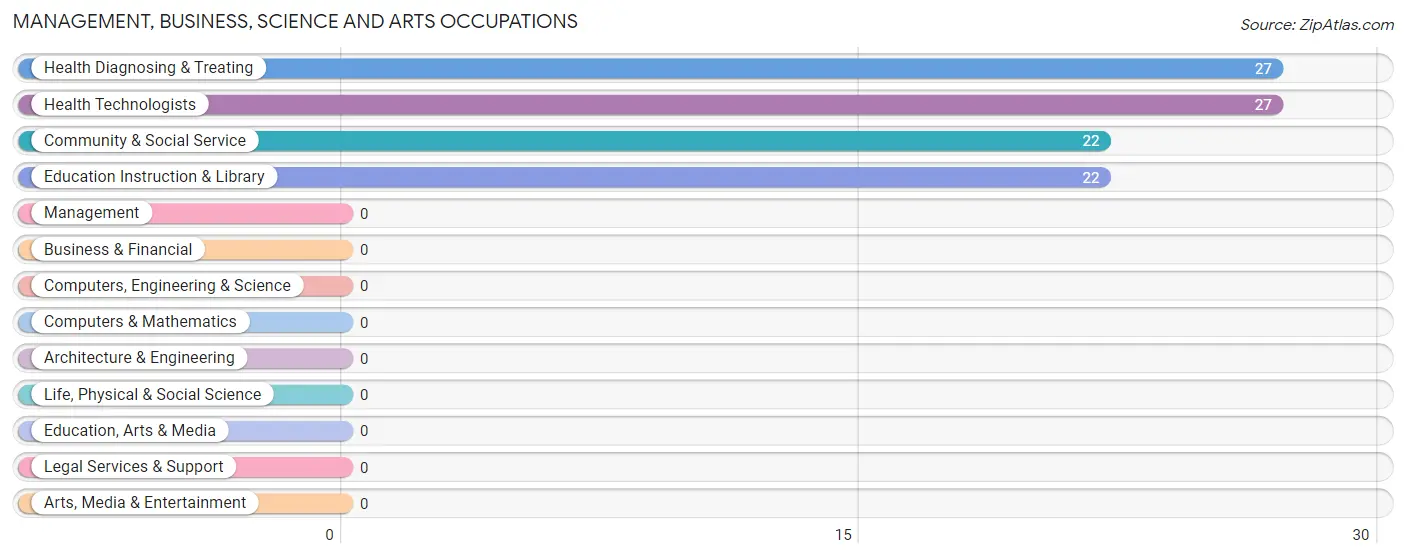
Management, Business, Science and Arts Occupations
The most common Management, Business, Science and Arts occupations in Waverly are Health Diagnosing & Treating (27 | 17.8%), Health Technologists (27 | 17.8%), Community & Social Service (22 | 14.5%), and Education Instruction & Library (22 | 14.5%).
Management, Business, Science and Arts Occupations by Sex
Within the Management, Business, Science and Arts occupations in Waverly, the most male-oriented occupations are Health Diagnosing & Treating (100.0%), and Health Technologists (100.0%), while the most female-oriented occupations are Community & Social Service (100.0%), and Education Instruction & Library (100.0%).
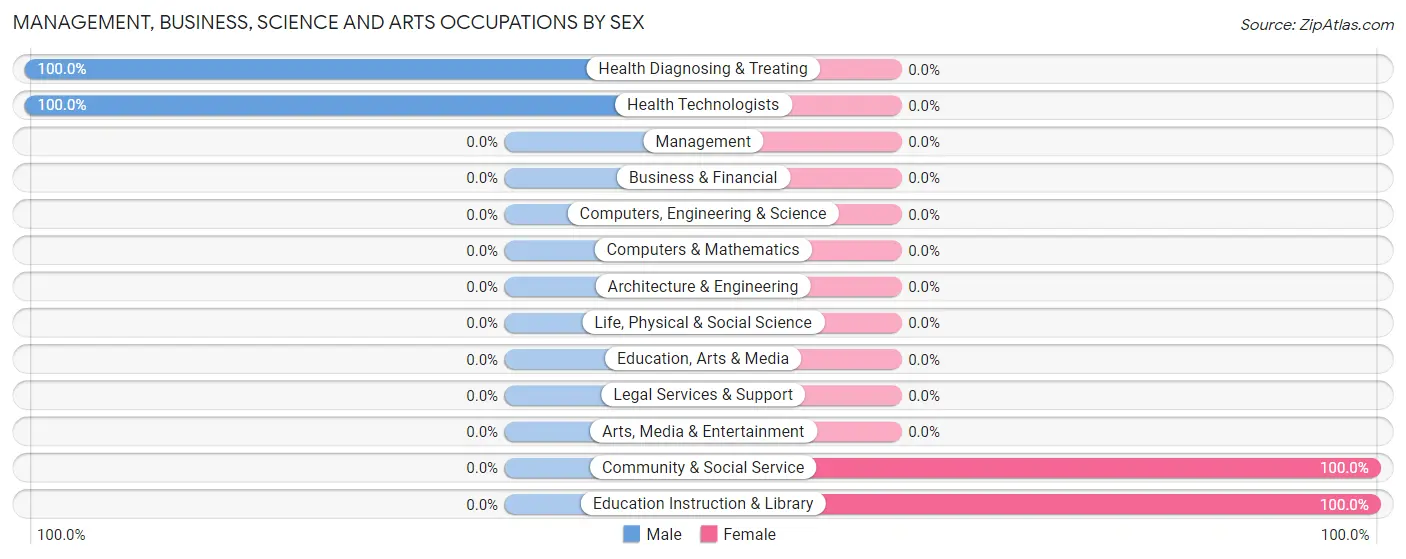
| Occupation | Male | Female |
| Management | 0 (0.0%) | 0 (0.0%) |
| Business & Financial | 0 (0.0%) | 0 (0.0%) |
| Computers, Engineering & Science | 0 (0.0%) | 0 (0.0%) |
| Computers & Mathematics | 0 (0.0%) | 0 (0.0%) |
| Architecture & Engineering | 0 (0.0%) | 0 (0.0%) |
| Life, Physical & Social Science | 0 (0.0%) | 0 (0.0%) |
| Community & Social Service | 0 (0.0%) | 22 (100.0%) |
| Education, Arts & Media | 0 (0.0%) | 0 (0.0%) |
| Legal Services & Support | 0 (0.0%) | 0 (0.0%) |
| Education Instruction & Library | 0 (0.0%) | 22 (100.0%) |
| Arts, Media & Entertainment | 0 (0.0%) | 0 (0.0%) |
| Health Diagnosing & Treating | 27 (100.0%) | 0 (0.0%) |
| Health Technologists | 27 (100.0%) | 0 (0.0%) |
| Total (Category) | 27 (55.1%) | 22 (44.9%) |
| Total (Overall) | 74 (48.7%) | 78 (51.3%) |
Services Occupations
The most common Services occupations in Waverly are Security & Protection (20 | 13.2%), Law Enforcement (20 | 13.2%), and Food Preparation & Serving (11 | 7.2%).
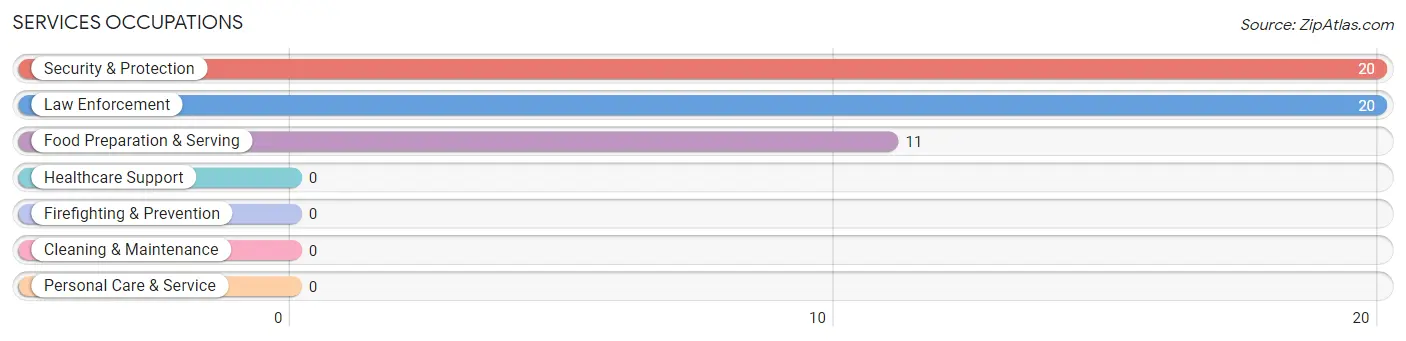
Services Occupations by Sex
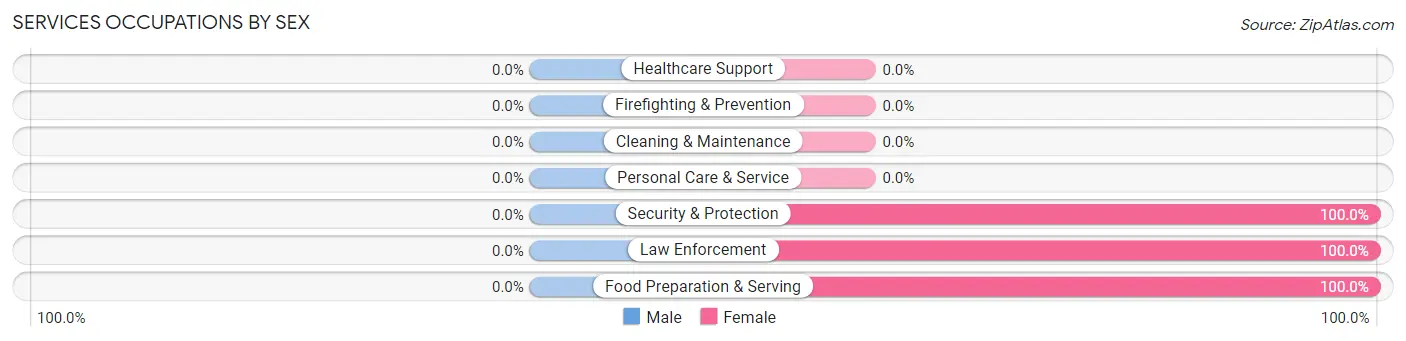
| Occupation | Male | Female |
| Healthcare Support | 0 (0.0%) | 0 (0.0%) |
| Security & Protection | 0 (0.0%) | 20 (100.0%) |
| Firefighting & Prevention | 0 (0.0%) | 0 (0.0%) |
| Law Enforcement | 0 (0.0%) | 20 (100.0%) |
| Food Preparation & Serving | 0 (0.0%) | 11 (100.0%) |
| Cleaning & Maintenance | 0 (0.0%) | 0 (0.0%) |
| Personal Care & Service | 0 (0.0%) | 0 (0.0%) |
| Total (Category) | 0 (0.0%) | 31 (100.0%) |
| Total (Overall) | 74 (48.7%) | 78 (51.3%) |
Sales and Office Occupations
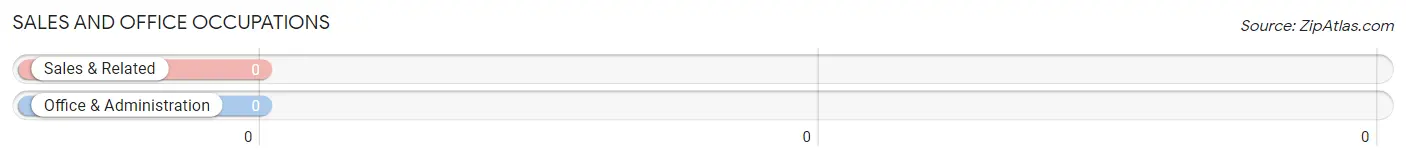
Sales and Office Occupations by Sex
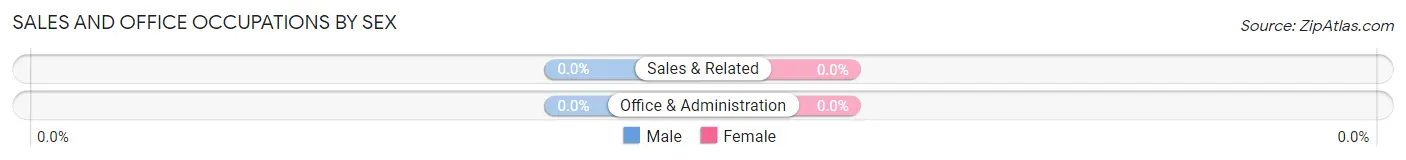
| Occupation | Male | Female |
| Sales & Related | 0 (0.0%) | 0 (0.0%) |
| Office & Administration | 0 (0.0%) | 0 (0.0%) |
| Total (Category) | 0 (0.0%) | 0 (0.0%) |
| Total (Overall) | 74 (48.7%) | 78 (51.3%) |
Natural Resources, Construction and Maintenance Occupations
Natural Resources, Construction and Maintenance Occupations by Sex
| Occupation | Male | Female |
| Farming, Fishing & Forestry | 0 (0.0%) | 0 (0.0%) |
| Construction & Extraction | 0 (0.0%) | 0 (0.0%) |
| Installation, Maintenance & Repair | 0 (0.0%) | 0 (0.0%) |
| Total (Category) | 0 (0.0%) | 0 (0.0%) |
| Total (Overall) | 74 (48.7%) | 78 (51.3%) |
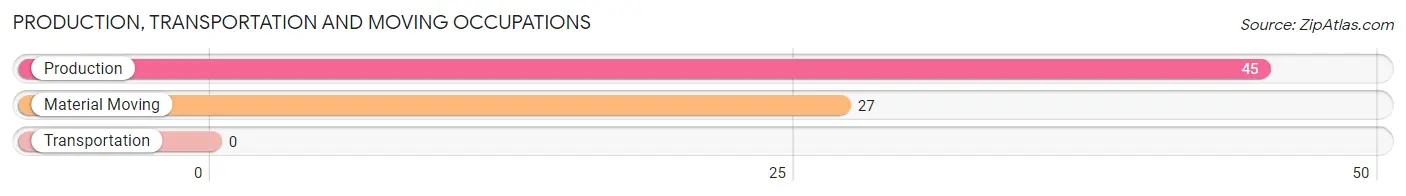
Production, Transportation and Moving Occupations
The most common Production, Transportation and Moving occupations in Waverly are Production (45 | 29.6%), and Material Moving (27 | 17.8%).
Production, Transportation and Moving Occupations by Sex
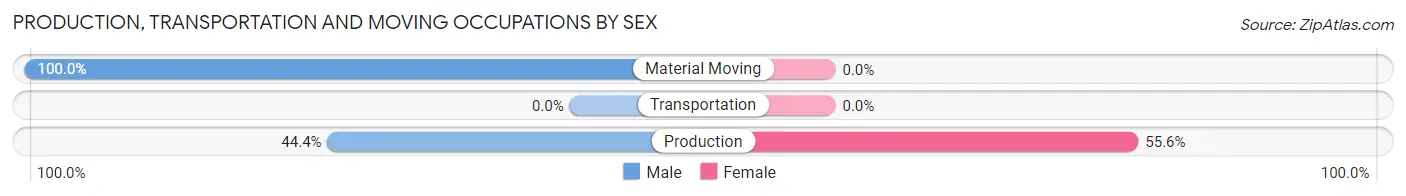
| Occupation | Male | Female |
| Production | 20 (44.4%) | 25 (55.6%) |
| Transportation | 0 (0.0%) | 0 (0.0%) |
| Material Moving | 27 (100.0%) | 0 (0.0%) |
| Total (Category) | 47 (65.3%) | 25 (34.7%) |
| Total (Overall) | 74 (48.7%) | 78 (51.3%) |
Employment Industries by Sex in Waverly
Employment Industries in Waverly
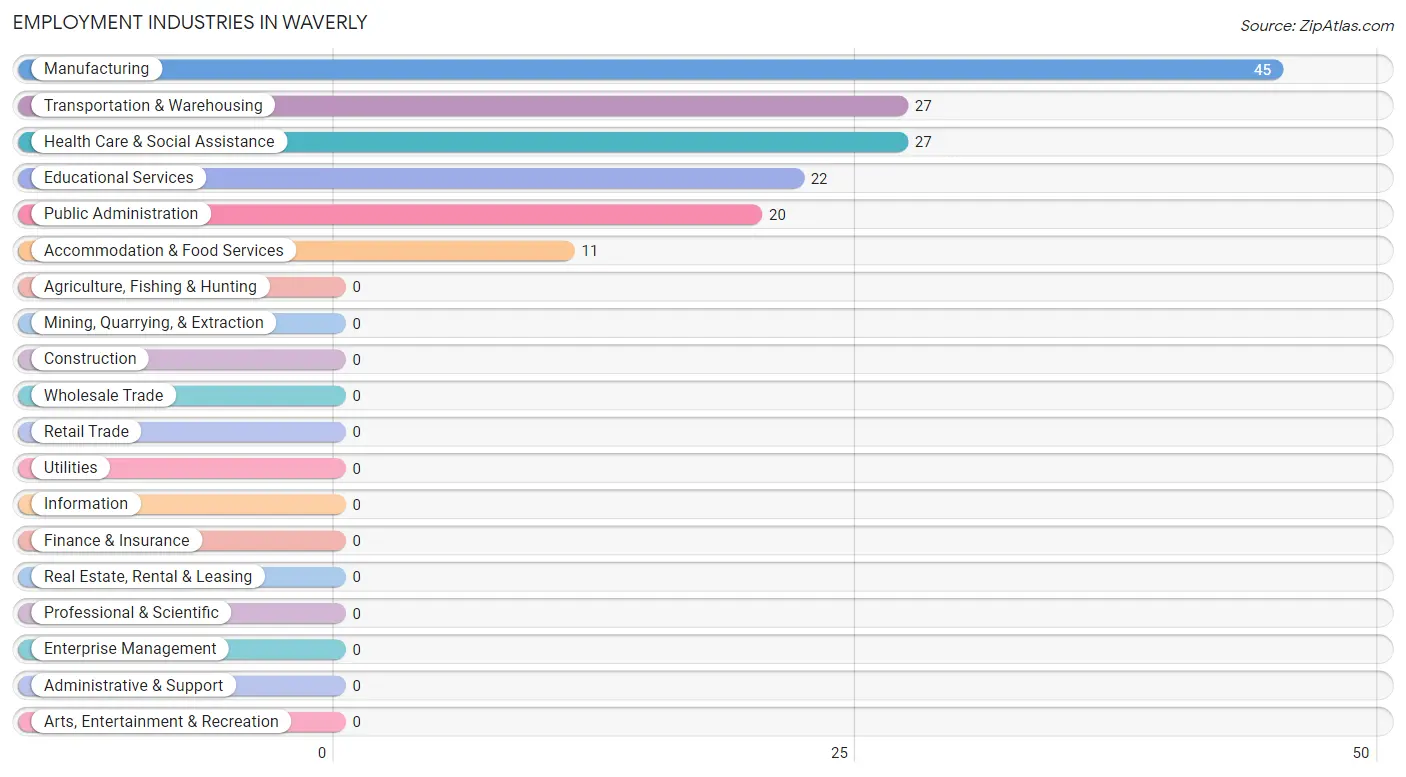
The major employment industries in Waverly include Manufacturing (45 | 29.6%), Transportation & Warehousing (27 | 17.8%), Health Care & Social Assistance (27 | 17.8%), Educational Services (22 | 14.5%), and Public Administration (20 | 13.2%).
Employment Industries by Sex in Waverly
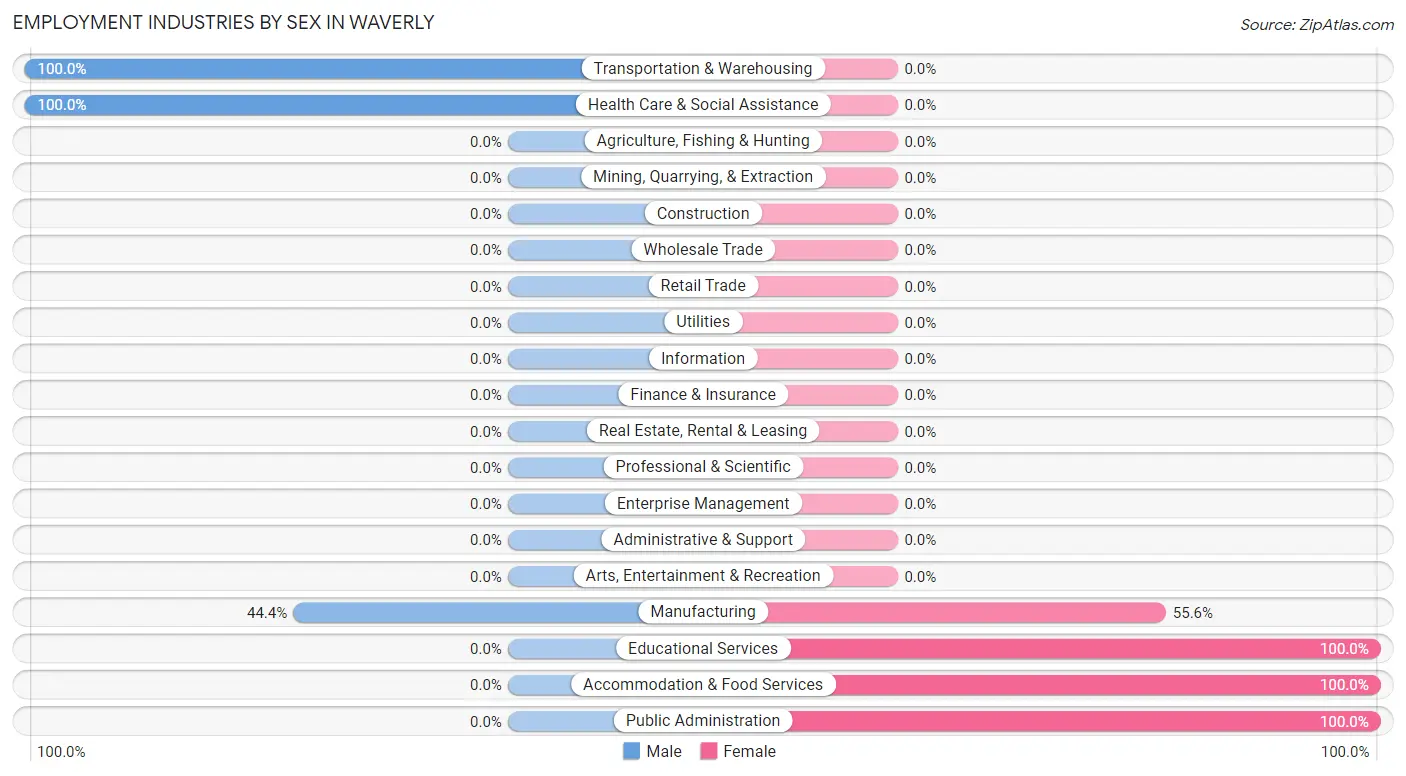
The Waverly industries that see more men than women are Transportation & Warehousing (100.0%), Health Care & Social Assistance (100.0%), and Manufacturing (44.4%), whereas the industries that tend to have a higher number of women are Educational Services (100.0%), Accommodation & Food Services (100.0%), and Public Administration (100.0%).
| Industry | Male | Female |
| Agriculture, Fishing & Hunting | 0 (0.0%) | 0 (0.0%) |
| Mining, Quarrying, & Extraction | 0 (0.0%) | 0 (0.0%) |
| Construction | 0 (0.0%) | 0 (0.0%) |
| Manufacturing | 20 (44.4%) | 25 (55.6%) |
| Wholesale Trade | 0 (0.0%) | 0 (0.0%) |
| Retail Trade | 0 (0.0%) | 0 (0.0%) |
| Transportation & Warehousing | 27 (100.0%) | 0 (0.0%) |
| Utilities | 0 (0.0%) | 0 (0.0%) |
| Information | 0 (0.0%) | 0 (0.0%) |
| Finance & Insurance | 0 (0.0%) | 0 (0.0%) |
| Real Estate, Rental & Leasing | 0 (0.0%) | 0 (0.0%) |
| Professional & Scientific | 0 (0.0%) | 0 (0.0%) |
| Enterprise Management | 0 (0.0%) | 0 (0.0%) |
| Administrative & Support | 0 (0.0%) | 0 (0.0%) |
| Educational Services | 0 (0.0%) | 22 (100.0%) |
| Health Care & Social Assistance | 27 (100.0%) | 0 (0.0%) |
| Arts, Entertainment & Recreation | 0 (0.0%) | 0 (0.0%) |
| Accommodation & Food Services | 0 (0.0%) | 11 (100.0%) |
| Public Administration | 0 (0.0%) | 20 (100.0%) |
| Total | 74 (48.7%) | 78 (51.3%) |
Education in Waverly
School Enrollment in Waverly
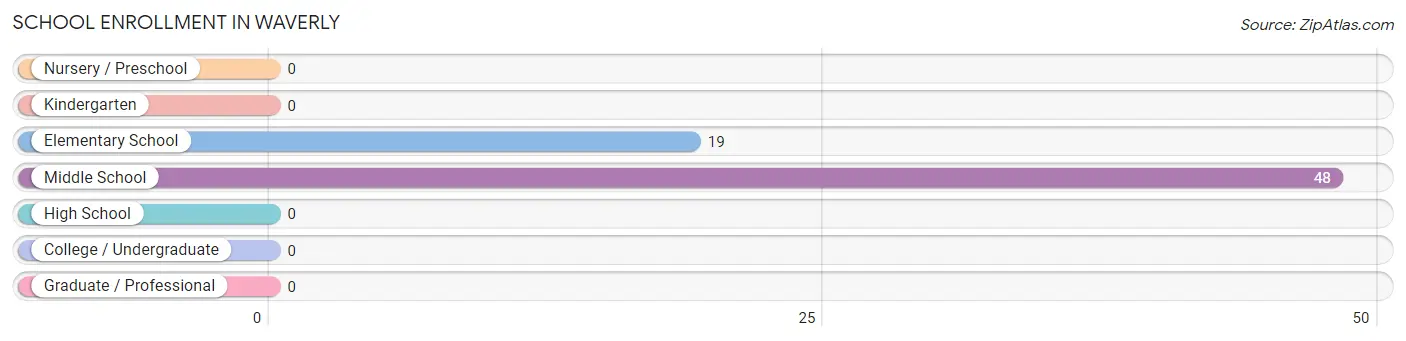
The most common levels of schooling among the 67 students in Waverly are middle school (48 | 71.6%), and elementary school (19 | 28.4%).
| School Level | # Students | % Students |
| Nursery / Preschool | 0 | 0.0% |
| Kindergarten | 0 | 0.0% |
| Elementary School | 19 | 28.4% |
| Middle School | 48 | 71.6% |
| High School | 0 | 0.0% |
| College / Undergraduate | 0 | 0.0% |
| Graduate / Professional | 0 | 0.0% |
| Total | 67 | 100.0% |
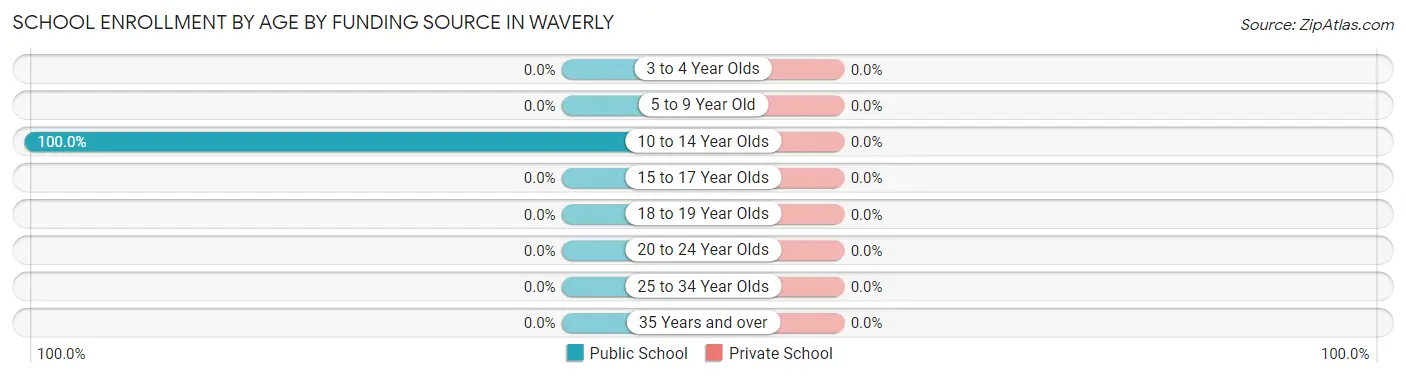
School Enrollment by Age by Funding Source in Waverly
| Age Bracket | Public School | Private School |
| 3 to 4 Year Olds | 0 (0.0%) | 0 (0.0%) |
| 5 to 9 Year Old | 0 (0.0%) | 0 (0.0%) |
| 10 to 14 Year Olds | 67 (100.0%) | 0 (0.0%) |
| 15 to 17 Year Olds | 0 (0.0%) | 0 (0.0%) |
| 18 to 19 Year Olds | 0 (0.0%) | 0 (0.0%) |
| 20 to 24 Year Olds | 0 (0.0%) | 0 (0.0%) |
| 25 to 34 Year Olds | 0 (0.0%) | 0 (0.0%) |
| 35 Years and over | 0 (0.0%) | 0 (0.0%) |
| Total | 67 (100.0%) | 0 (0.0%) |
Educational Attainment by Field of Study in Waverly
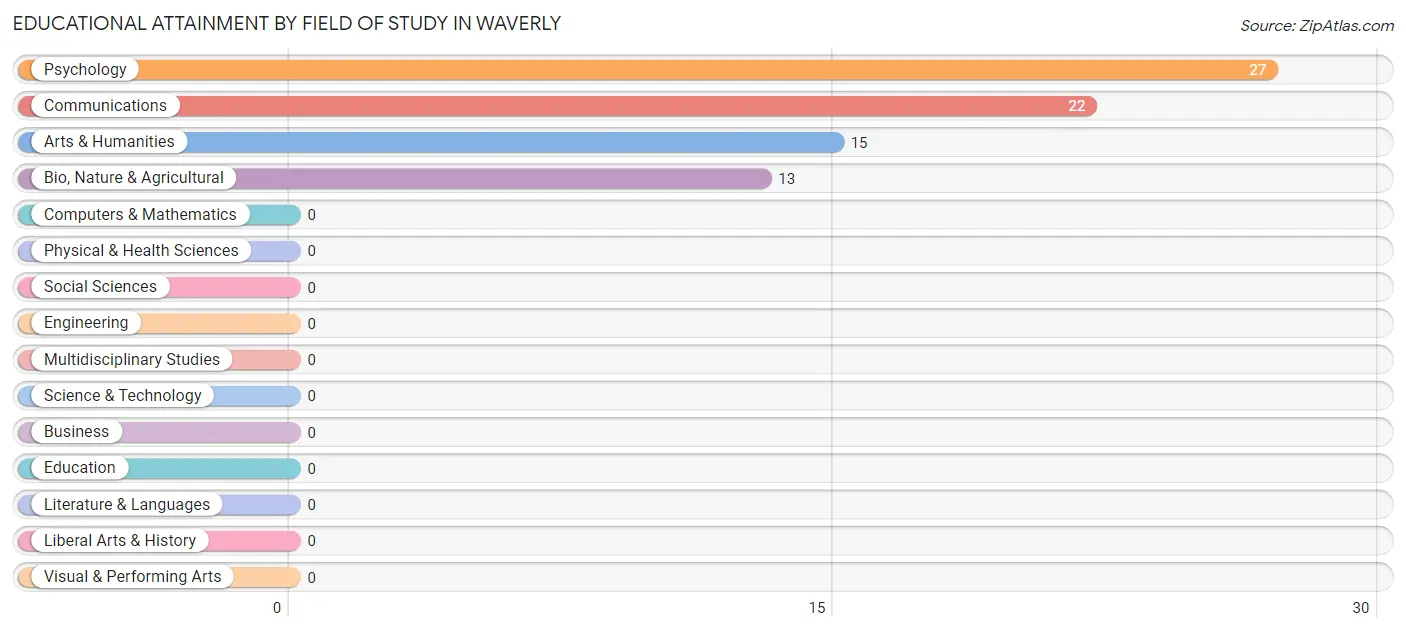
Psychology (27 | 35.1%), communications (22 | 28.6%), arts & humanities (15 | 19.5%), and bio, nature & agricultural (13 | 16.9%) are the most common fields of study among 77 individuals in Waverly who have obtained a bachelor's degree or higher.
| Field of Study | # Graduates | % Graduates |
| Computers & Mathematics | 0 | 0.0% |
| Bio, Nature & Agricultural | 13 | 16.9% |
| Physical & Health Sciences | 0 | 0.0% |
| Psychology | 27 | 35.1% |
| Social Sciences | 0 | 0.0% |
| Engineering | 0 | 0.0% |
| Multidisciplinary Studies | 0 | 0.0% |
| Science & Technology | 0 | 0.0% |
| Business | 0 | 0.0% |
| Education | 0 | 0.0% |
| Literature & Languages | 0 | 0.0% |
| Liberal Arts & History | 0 | 0.0% |
| Visual & Performing Arts | 0 | 0.0% |
| Communications | 22 | 28.6% |
| Arts & Humanities | 15 | 19.5% |
| Total | 77 | 100.0% |
Transportation & Commute in Waverly
Vehicle Availability by Sex in Waverly
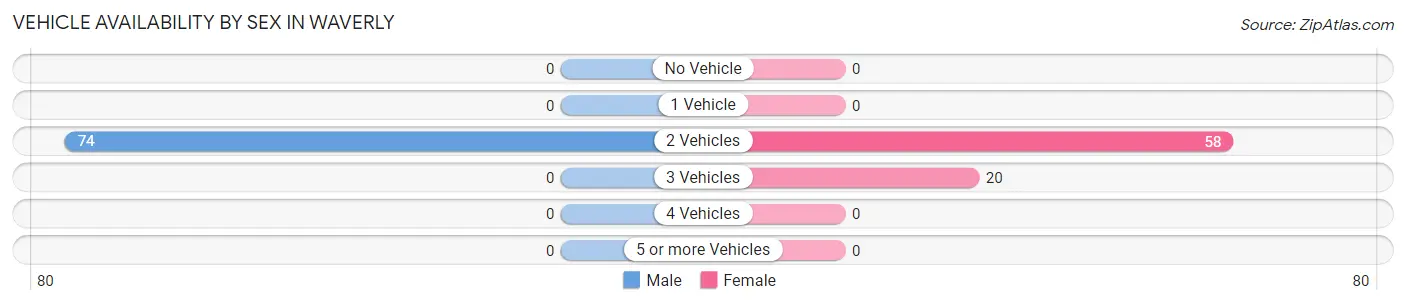
The most prevalent vehicle ownership categories in Waverly are males with 2 vehicles (74, accounting for 100.0%) and females with 2 vehicles (58, making up 94.9%).
| Vehicles Available | Male | Female |
| No Vehicle | 0 (0.0%) | 0 (0.0%) |
| 1 Vehicle | 0 (0.0%) | 0 (0.0%) |
| 2 Vehicles | 74 (100.0%) | 58 (74.4%) |
| 3 Vehicles | 0 (0.0%) | 20 (25.6%) |
| 4 Vehicles | 0 (0.0%) | 0 (0.0%) |
| 5 or more Vehicles | 0 (0.0%) | 0 (0.0%) |
| Total | 74 (100.0%) | 78 (100.0%) |
Commute Time in Waverly
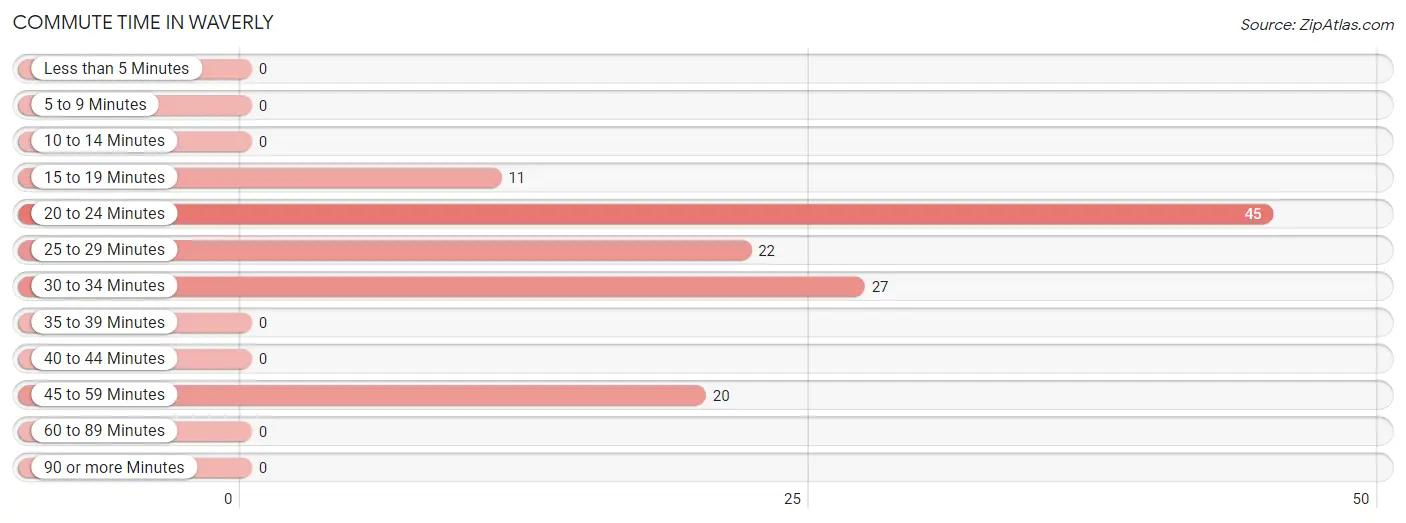
The most frequently occuring commute durations in Waverly are 20 to 24 minutes (45 commuters, 36.0%), 30 to 34 minutes (27 commuters, 21.6%), and 25 to 29 minutes (22 commuters, 17.6%).
| Commute Time | # Commuters | % Commuters |
| Less than 5 Minutes | 0 | 0.0% |
| 5 to 9 Minutes | 0 | 0.0% |
| 10 to 14 Minutes | 0 | 0.0% |
| 15 to 19 Minutes | 11 | 8.8% |
| 20 to 24 Minutes | 45 | 36.0% |
| 25 to 29 Minutes | 22 | 17.6% |
| 30 to 34 Minutes | 27 | 21.6% |
| 35 to 39 Minutes | 0 | 0.0% |
| 40 to 44 Minutes | 0 | 0.0% |
| 45 to 59 Minutes | 20 | 16.0% |
| 60 to 89 Minutes | 0 | 0.0% |
| 90 or more Minutes | 0 | 0.0% |
Commute Time by Sex in Waverly
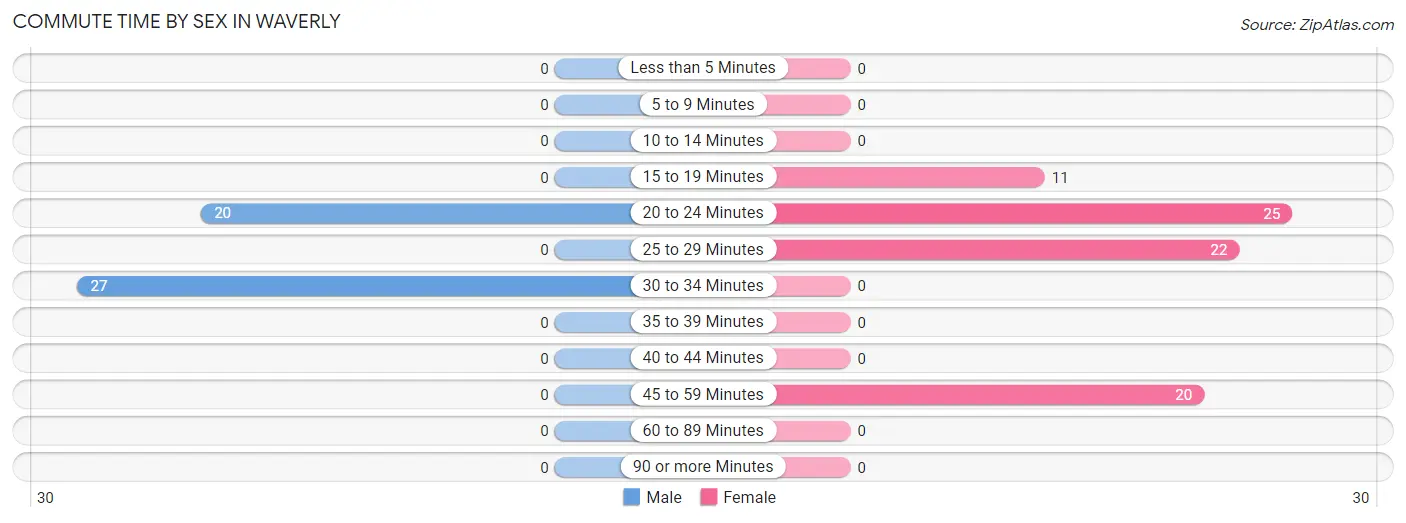
The most common commute times in Waverly are 30 to 34 minutes (27 commuters, 57.5%) for males and 20 to 24 minutes (25 commuters, 32.1%) for females.
| Commute Time | Male | Female |
| Less than 5 Minutes | 0 (0.0%) | 0 (0.0%) |
| 5 to 9 Minutes | 0 (0.0%) | 0 (0.0%) |
| 10 to 14 Minutes | 0 (0.0%) | 0 (0.0%) |
| 15 to 19 Minutes | 0 (0.0%) | 11 (14.1%) |
| 20 to 24 Minutes | 20 (42.5%) | 25 (32.1%) |
| 25 to 29 Minutes | 0 (0.0%) | 22 (28.2%) |
| 30 to 34 Minutes | 27 (57.5%) | 0 (0.0%) |
| 35 to 39 Minutes | 0 (0.0%) | 0 (0.0%) |
| 40 to 44 Minutes | 0 (0.0%) | 0 (0.0%) |
| 45 to 59 Minutes | 0 (0.0%) | 20 (25.6%) |
| 60 to 89 Minutes | 0 (0.0%) | 0 (0.0%) |
| 90 or more Minutes | 0 (0.0%) | 0 (0.0%) |
Time of Departure to Work by Sex in Waverly
The most frequent times of departure to work in Waverly are 7:00 AM to 7:29 AM (27, 57.5%) for males and 7:00 AM to 7:29 AM (47, 60.3%) for females.
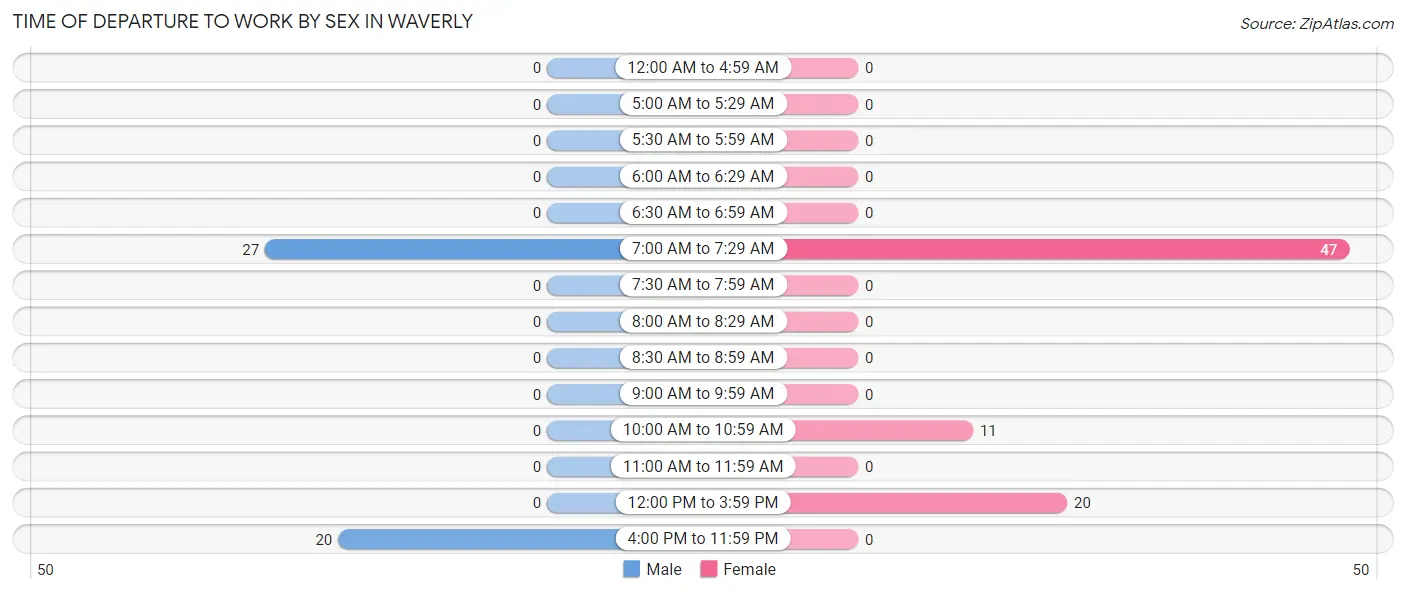
| Time of Departure | Male | Female |
| 12:00 AM to 4:59 AM | 0 (0.0%) | 0 (0.0%) |
| 5:00 AM to 5:29 AM | 0 (0.0%) | 0 (0.0%) |
| 5:30 AM to 5:59 AM | 0 (0.0%) | 0 (0.0%) |
| 6:00 AM to 6:29 AM | 0 (0.0%) | 0 (0.0%) |
| 6:30 AM to 6:59 AM | 0 (0.0%) | 0 (0.0%) |
| 7:00 AM to 7:29 AM | 27 (57.5%) | 47 (60.3%) |
| 7:30 AM to 7:59 AM | 0 (0.0%) | 0 (0.0%) |
| 8:00 AM to 8:29 AM | 0 (0.0%) | 0 (0.0%) |
| 8:30 AM to 8:59 AM | 0 (0.0%) | 0 (0.0%) |
| 9:00 AM to 9:59 AM | 0 (0.0%) | 0 (0.0%) |
| 10:00 AM to 10:59 AM | 0 (0.0%) | 11 (14.1%) |
| 11:00 AM to 11:59 AM | 0 (0.0%) | 0 (0.0%) |
| 12:00 PM to 3:59 PM | 0 (0.0%) | 20 (25.6%) |
| 4:00 PM to 11:59 PM | 20 (42.5%) | 0 (0.0%) |
| Total | 47 (100.0%) | 78 (100.0%) |
Housing Occupancy in Waverly
Occupancy by Ownership in Waverly
Of the total 164 dwellings in Waverly, owner-occupied units account for 115 (70.1%), while renter-occupied units make up 49 (29.9%).
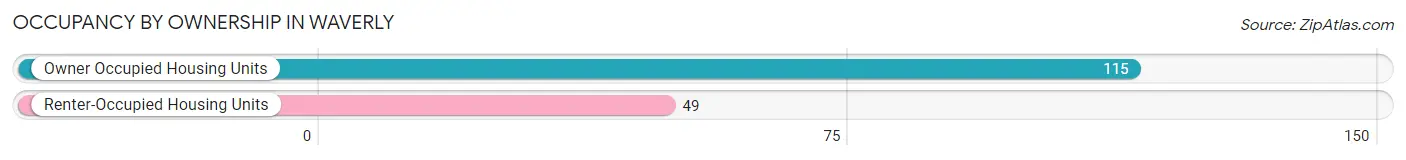
| Occupancy | # Housing Units | % Housing Units |
| Owner Occupied Housing Units | 115 | 70.1% |
| Renter-Occupied Housing Units | 49 | 29.9% |
| Total Occupied Housing Units | 164 | 100.0% |
Occupancy by Household Size in Waverly
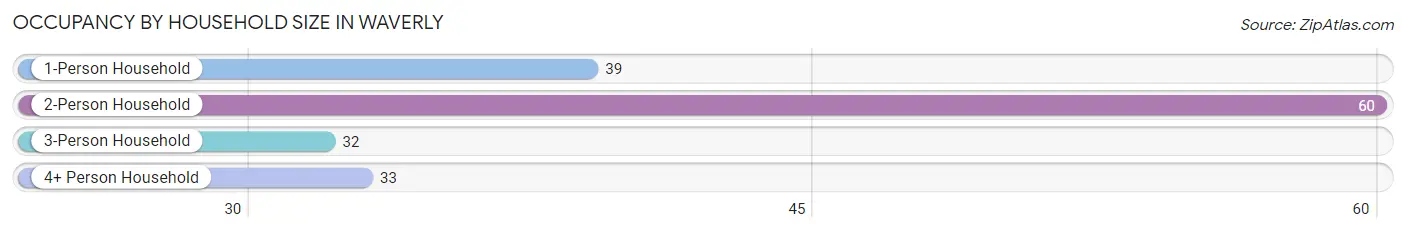
| Household Size | # Housing Units | % Housing Units |
| 1-Person Household | 39 | 23.8% |
| 2-Person Household | 60 | 36.6% |
| 3-Person Household | 32 | 19.5% |
| 4+ Person Household | 33 | 20.1% |
| Total Housing Units | 164 | 100.0% |
Occupancy by Ownership by Household Size in Waverly
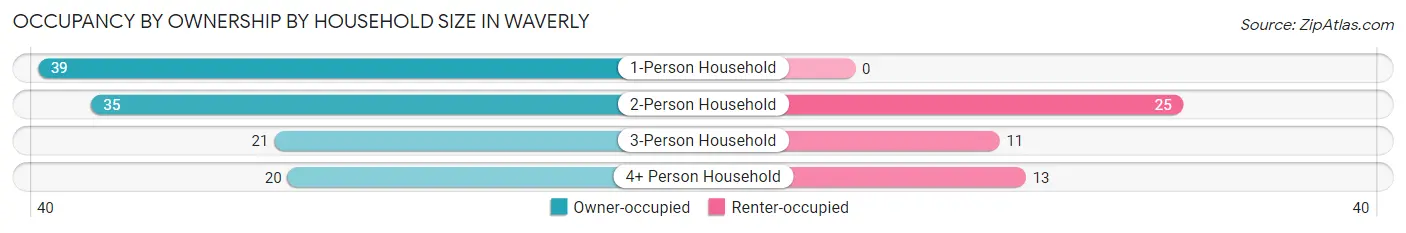
| Household Size | Owner-occupied | Renter-occupied |
| 1-Person Household | 39 (100.0%) | 0 (0.0%) |
| 2-Person Household | 35 (58.3%) | 25 (41.7%) |
| 3-Person Household | 21 (65.6%) | 11 (34.4%) |
| 4+ Person Household | 20 (60.6%) | 13 (39.4%) |
| Total Housing Units | 115 (70.1%) | 49 (29.9%) |
Occupancy by Educational Attainment in Waverly
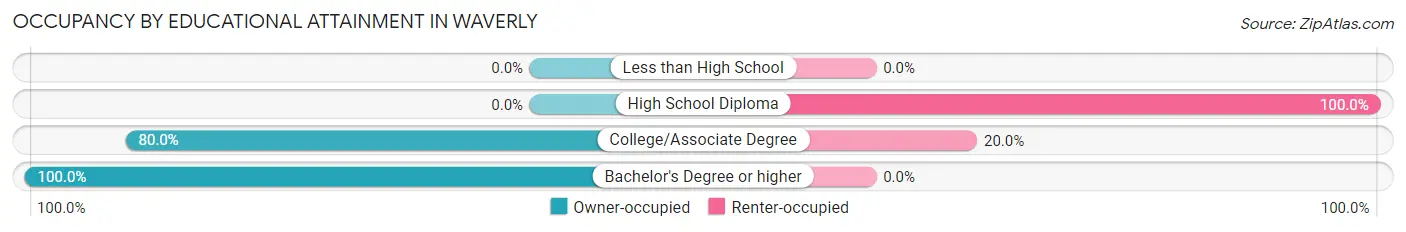
| Household Size | Owner-occupied | Renter-occupied |
| Less than High School | 0 (0.0%) | 0 (0.0%) |
| High School Diploma | 0 (0.0%) | 24 (100.0%) |
| College/Associate Degree | 100 (80.0%) | 25 (20.0%) |
| Bachelor's Degree or higher | 15 (100.0%) | 0 (0.0%) |
Occupancy by Age of Householder in Waverly
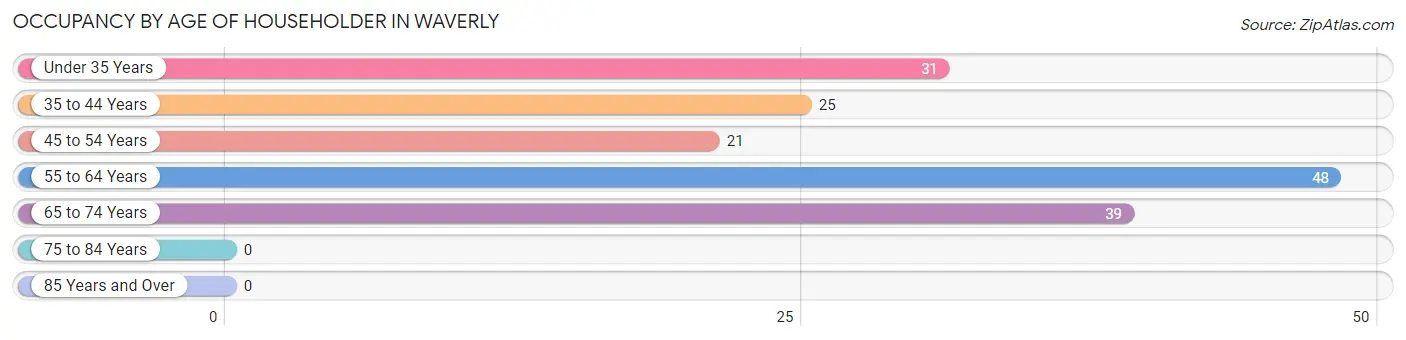
| Age Bracket | # Households | % Households |
| Under 35 Years | 31 | 18.9% |
| 35 to 44 Years | 25 | 15.2% |
| 45 to 54 Years | 21 | 12.8% |
| 55 to 64 Years | 48 | 29.3% |
| 65 to 74 Years | 39 | 23.8% |
| 75 to 84 Years | 0 | 0.0% |
| 85 Years and Over | 0 | 0.0% |
| Total | 164 | 100.0% |
Housing Finances in Waverly
Median Income by Occupancy in Waverly
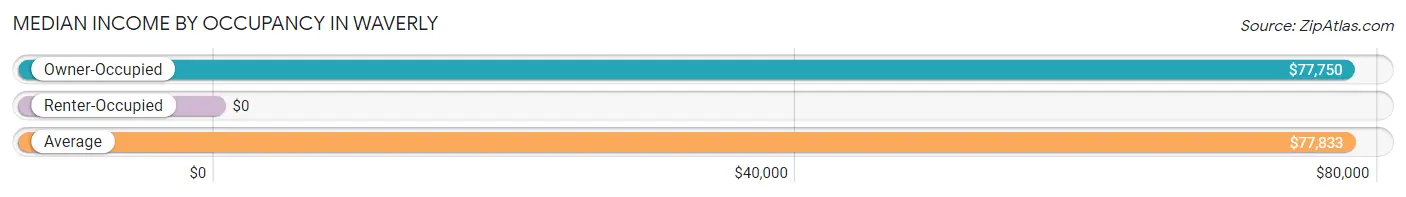
| Occupancy Type | # Households | Median Income |
| Owner-Occupied | 115 (70.1%) | $77,750 |
| Renter-Occupied | 49 (29.9%) | $0 |
| Average | 164 (100.0%) | $77,833 |
Occupancy by Householder Income Bracket in Waverly
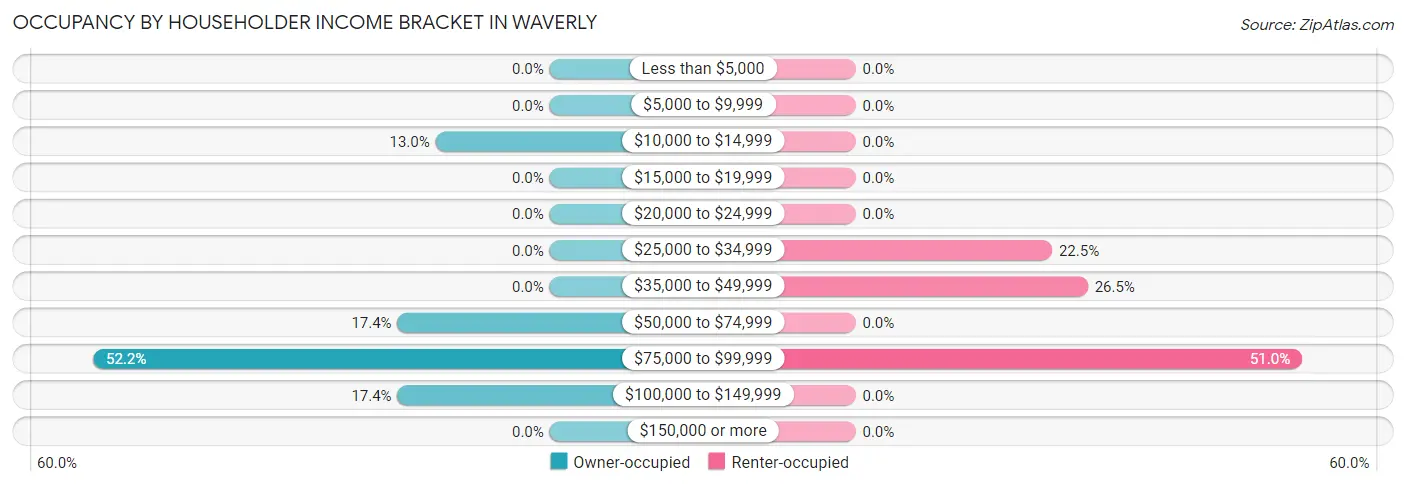
| Income Bracket | Owner-occupied | Renter-occupied |
| Less than $5,000 | 0 (0.0%) | 0 (0.0%) |
| $5,000 to $9,999 | 0 (0.0%) | 0 (0.0%) |
| $10,000 to $14,999 | 15 (13.0%) | 0 (0.0%) |
| $15,000 to $19,999 | 0 (0.0%) | 0 (0.0%) |
| $20,000 to $24,999 | 0 (0.0%) | 0 (0.0%) |
| $25,000 to $34,999 | 0 (0.0%) | 11 (22.5%) |
| $35,000 to $49,999 | 0 (0.0%) | 13 (26.5%) |
| $50,000 to $74,999 | 20 (17.4%) | 0 (0.0%) |
| $75,000 to $99,999 | 60 (52.2%) | 25 (51.0%) |
| $100,000 to $149,999 | 20 (17.4%) | 0 (0.0%) |
| $150,000 or more | 0 (0.0%) | 0 (0.0%) |
| Total | 115 (100.0%) | 49 (100.0%) |
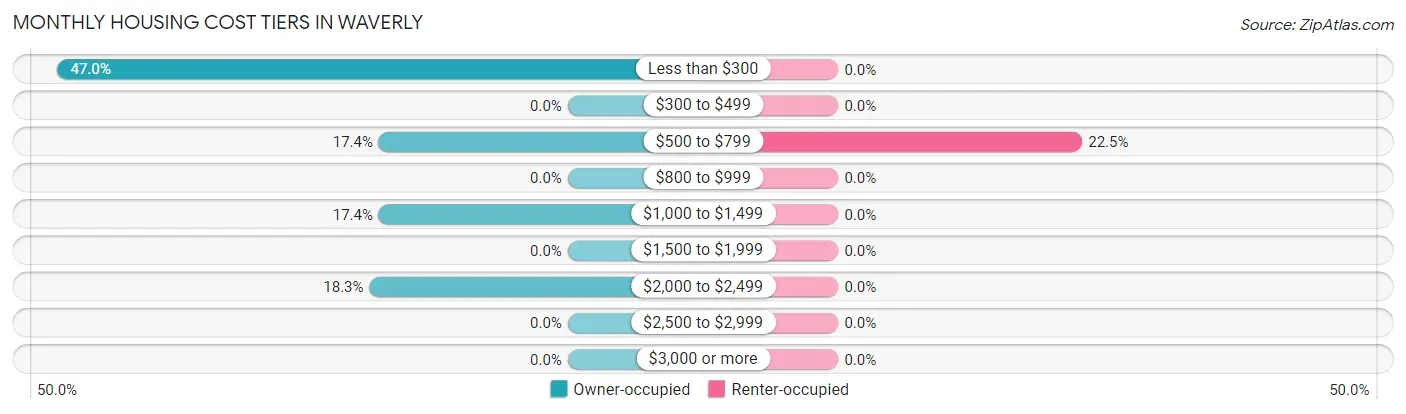
Monthly Housing Cost Tiers in Waverly
| Monthly Cost | Owner-occupied | Renter-occupied |
| Less than $300 | 54 (47.0%) | 0 (0.0%) |
| $300 to $499 | 0 (0.0%) | 0 (0.0%) |
| $500 to $799 | 20 (17.4%) | 11 (22.5%) |
| $800 to $999 | 0 (0.0%) | 0 (0.0%) |
| $1,000 to $1,499 | 20 (17.4%) | 0 (0.0%) |
| $1,500 to $1,999 | 0 (0.0%) | 0 (0.0%) |
| $2,000 to $2,499 | 21 (18.3%) | 0 (0.0%) |
| $2,500 to $2,999 | 0 (0.0%) | 0 (0.0%) |
| $3,000 or more | 0 (0.0%) | 0 (0.0%) |
| Total | 115 (100.0%) | 49 (100.0%) |
Physical Housing Characteristics in Waverly
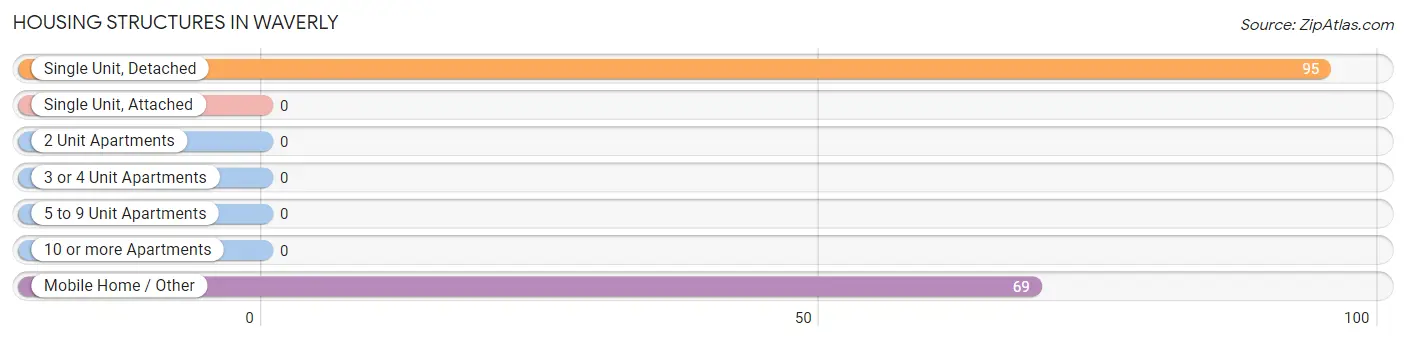
Housing Structures in Waverly
| Structure Type | # Housing Units | % Housing Units |
| Single Unit, Detached | 95 | 57.9% |
| Single Unit, Attached | 0 | 0.0% |
| 2 Unit Apartments | 0 | 0.0% |
| 3 or 4 Unit Apartments | 0 | 0.0% |
| 5 to 9 Unit Apartments | 0 | 0.0% |
| 10 or more Apartments | 0 | 0.0% |
| Mobile Home / Other | 69 | 42.1% |
| Total | 164 | 100.0% |
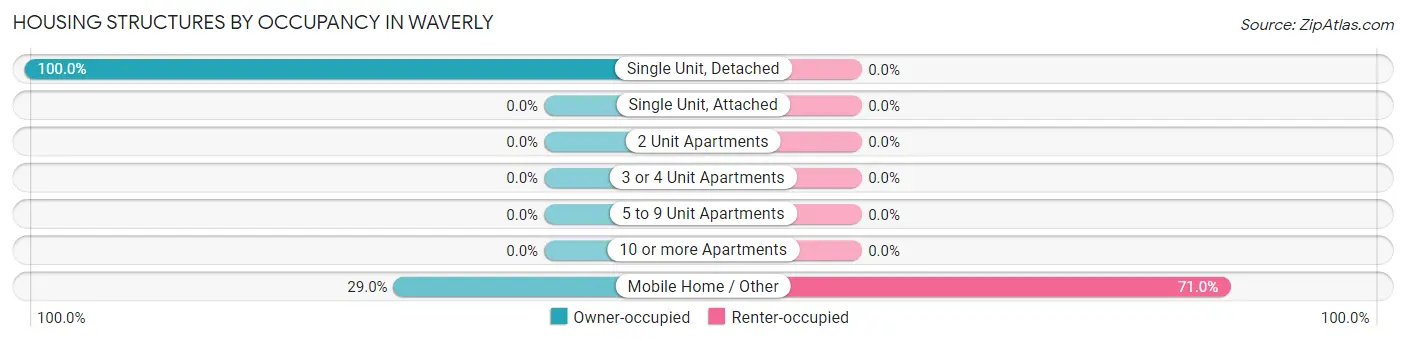
Housing Structures by Occupancy in Waverly
| Structure Type | Owner-occupied | Renter-occupied |
| Single Unit, Detached | 95 (100.0%) | 0 (0.0%) |
| Single Unit, Attached | 0 (0.0%) | 0 (0.0%) |
| 2 Unit Apartments | 0 (0.0%) | 0 (0.0%) |
| 3 or 4 Unit Apartments | 0 (0.0%) | 0 (0.0%) |
| 5 to 9 Unit Apartments | 0 (0.0%) | 0 (0.0%) |
| 10 or more Apartments | 0 (0.0%) | 0 (0.0%) |
| Mobile Home / Other | 20 (29.0%) | 49 (71.0%) |
| Total | 115 (70.1%) | 49 (29.9%) |
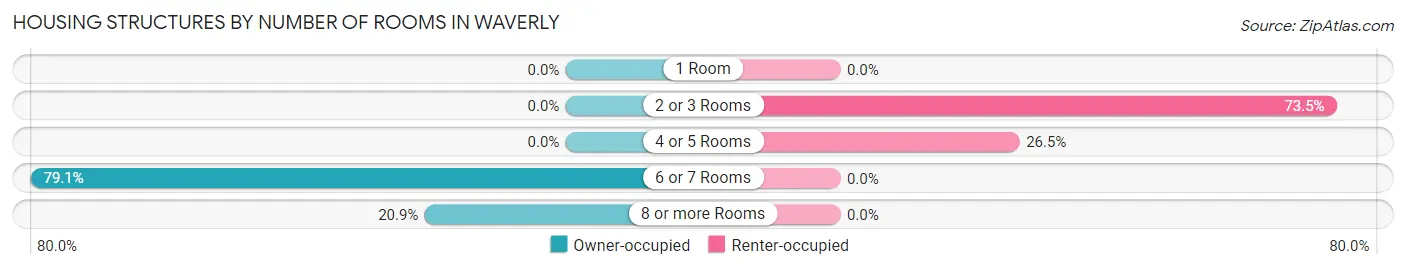
Housing Structures by Number of Rooms in Waverly
| Number of Rooms | Owner-occupied | Renter-occupied |
| 1 Room | 0 (0.0%) | 0 (0.0%) |
| 2 or 3 Rooms | 0 (0.0%) | 36 (73.5%) |
| 4 or 5 Rooms | 0 (0.0%) | 13 (26.5%) |
| 6 or 7 Rooms | 91 (79.1%) | 0 (0.0%) |
| 8 or more Rooms | 24 (20.9%) | 0 (0.0%) |
| Total | 115 (100.0%) | 49 (100.0%) |
Housing Structure by Heating Type in Waverly
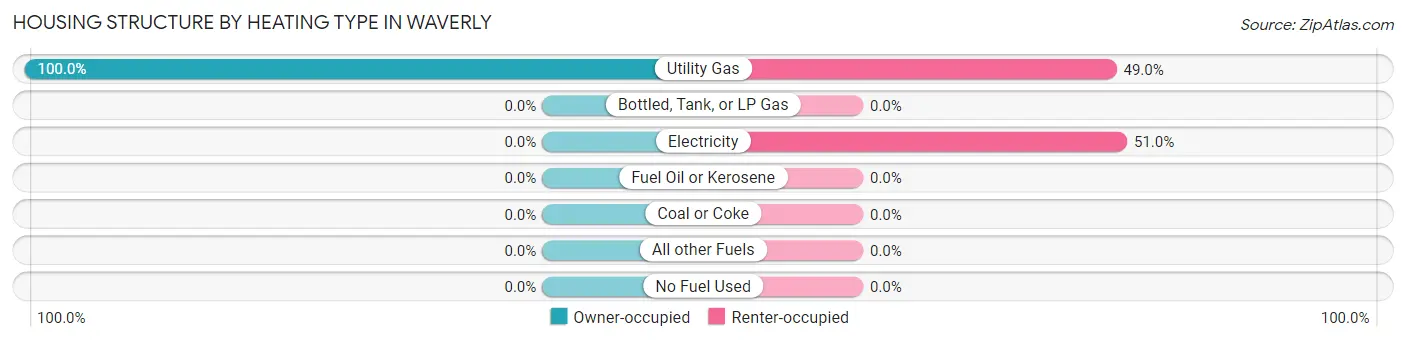
| Heating Type | Owner-occupied | Renter-occupied |
| Utility Gas | 115 (100.0%) | 24 (49.0%) |
| Bottled, Tank, or LP Gas | 0 (0.0%) | 0 (0.0%) |
| Electricity | 0 (0.0%) | 25 (51.0%) |
| Fuel Oil or Kerosene | 0 (0.0%) | 0 (0.0%) |
| Coal or Coke | 0 (0.0%) | 0 (0.0%) |
| All other Fuels | 0 (0.0%) | 0 (0.0%) |
| No Fuel Used | 0 (0.0%) | 0 (0.0%) |
| Total | 115 (100.0%) | 49 (100.0%) |
Household Vehicle Usage in Waverly
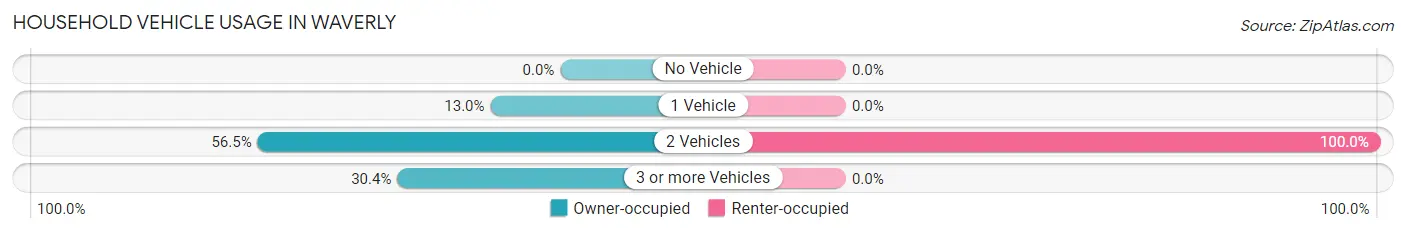
| Vehicles per Household | Owner-occupied | Renter-occupied |
| No Vehicle | 0 (0.0%) | 0 (0.0%) |
| 1 Vehicle | 15 (13.0%) | 0 (0.0%) |
| 2 Vehicles | 65 (56.5%) | 49 (100.0%) |
| 3 or more Vehicles | 35 (30.4%) | 0 (0.0%) |
| Total | 115 (100.0%) | 49 (100.0%) |
Real Estate & Mortgages in Waverly
Real Estate and Mortgage Overview in Waverly
| Characteristic | Without Mortgage | With Mortgage |
| Housing Units | 74 | 41 |
| Median Property Value | $214,600 | $0 |
| Median Household Income | $83,229 | $0 |
| Monthly Housing Costs | $278 | $0 |
| Real Estate Taxes | - | - |
Property Value by Mortgage Status in Waverly
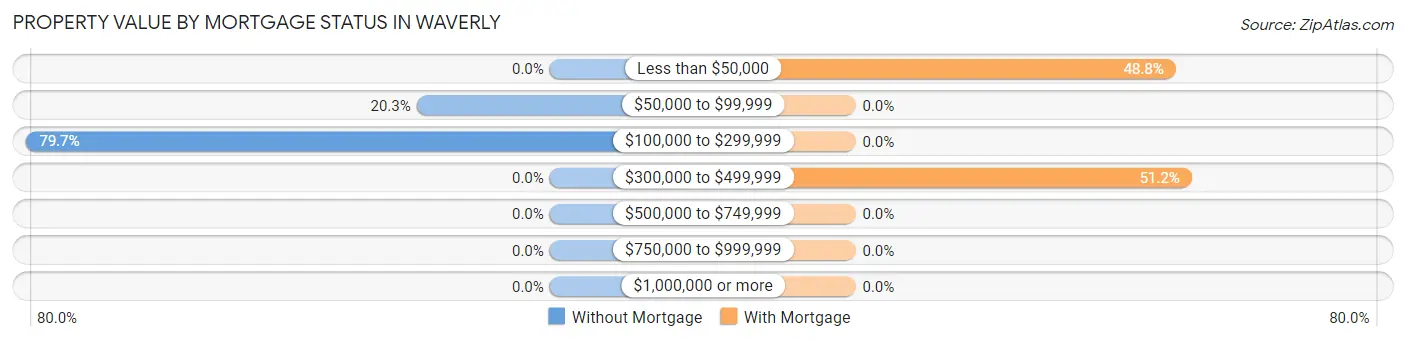
| Property Value | Without Mortgage | With Mortgage |
| Less than $50,000 | 0 (0.0%) | 20 (48.8%) |
| $50,000 to $99,999 | 15 (20.3%) | 0 (0.0%) |
| $100,000 to $299,999 | 59 (79.7%) | 0 (0.0%) |
| $300,000 to $499,999 | 0 (0.0%) | 21 (51.2%) |
| $500,000 to $749,999 | 0 (0.0%) | 0 (0.0%) |
| $750,000 to $999,999 | 0 (0.0%) | 0 (0.0%) |
| $1,000,000 or more | 0 (0.0%) | 0 (0.0%) |
| Total | 74 (100.0%) | 41 (100.0%) |
Household Income by Mortgage Status in Waverly
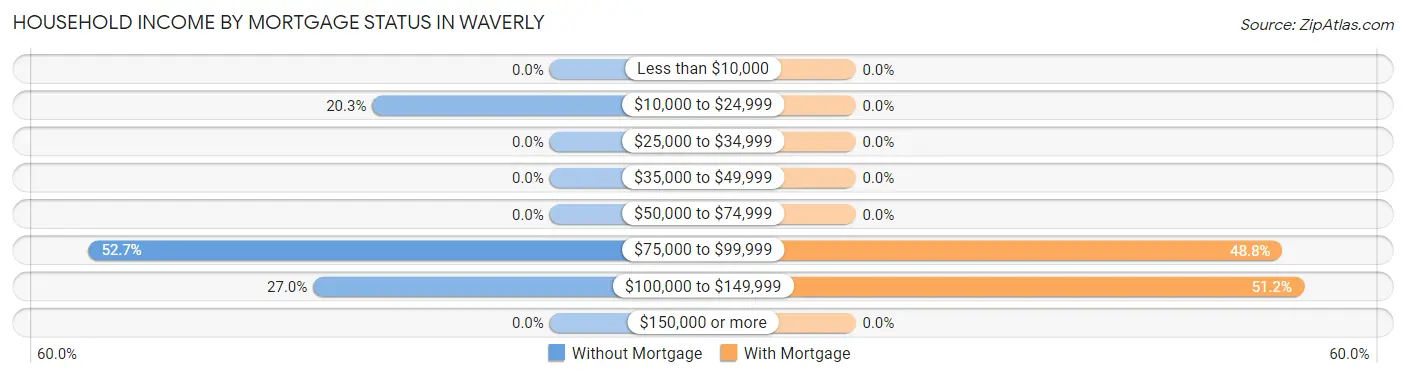
| Household Income | Without Mortgage | With Mortgage |
| Less than $10,000 | 0 (0.0%) | 0 (0.0%) |
| $10,000 to $24,999 | 15 (20.3%) | 0 (0.0%) |
| $25,000 to $34,999 | 0 (0.0%) | 0 (0.0%) |
| $35,000 to $49,999 | 0 (0.0%) | 0 (0.0%) |
| $50,000 to $74,999 | 0 (0.0%) | 0 (0.0%) |
| $75,000 to $99,999 | 39 (52.7%) | 20 (48.8%) |
| $100,000 to $149,999 | 20 (27.0%) | 21 (51.2%) |
| $150,000 or more | 0 (0.0%) | 0 (0.0%) |
| Total | 74 (100.0%) | 41 (100.0%) |
Property Value to Household Income Ratio in Waverly
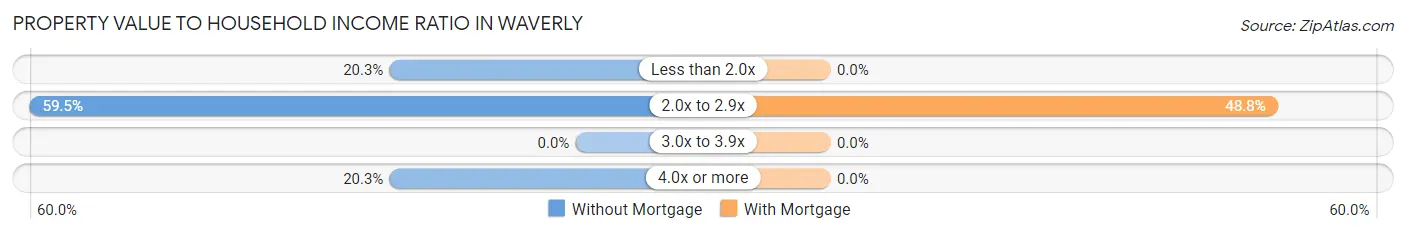
| Value-to-Income Ratio | Without Mortgage | With Mortgage |
| Less than 2.0x | 15 (20.3%) | 0 (0.0%) |
| 2.0x to 2.9x | 44 (59.5%) | 20 (48.8%) |
| 3.0x to 3.9x | 0 (0.0%) | 0 (0.0%) |
| 4.0x or more | 15 (20.3%) | 0 (0.0%) |
| Total | 74 (100.0%) | 41 (100.0%) |
Real Estate Taxes by Mortgage Status in Waverly
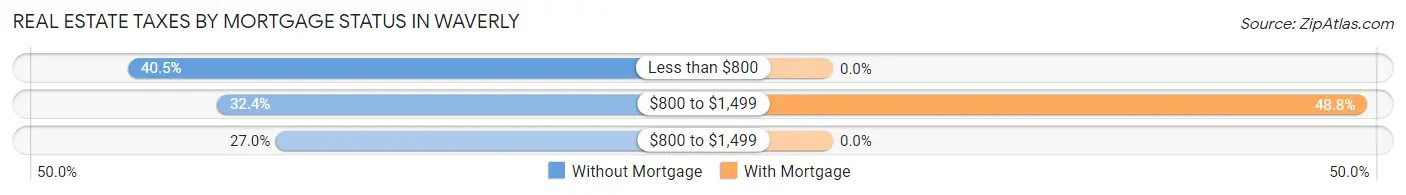
| Property Taxes | Without Mortgage | With Mortgage |
| Less than $800 | 30 (40.5%) | 0 (0.0%) |
| $800 to $1,499 | 24 (32.4%) | 20 (48.8%) |
| $800 to $1,499 | 20 (27.0%) | 0 (0.0%) |
| Total | 74 (100.0%) | 41 (100.0%) |
Health & Disability in Waverly
Health Insurance Coverage by Age in Waverly
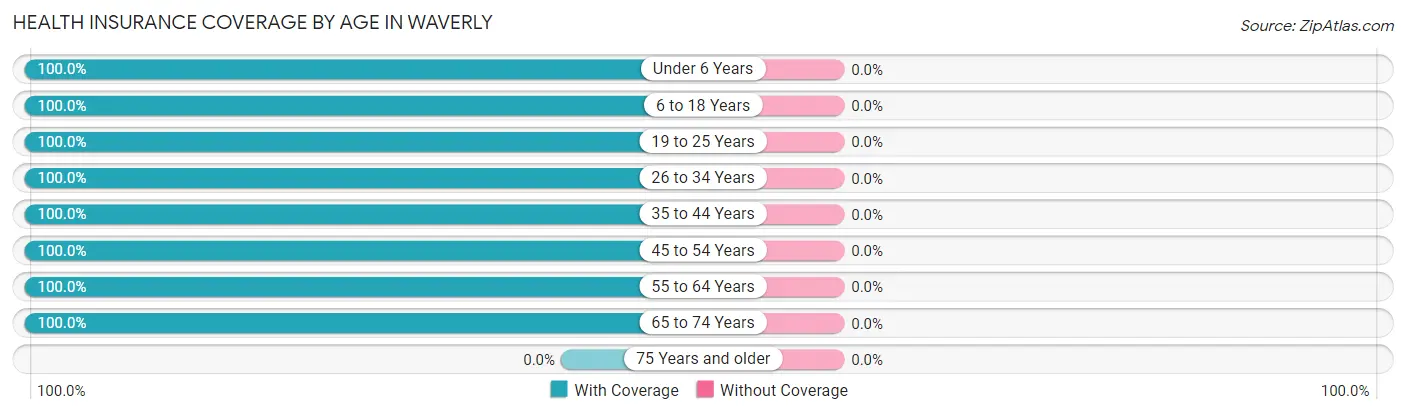
| Age Bracket | With Coverage | Without Coverage |
| Under 6 Years | 66 (100.0%) | 0 (0.0%) |
| 6 to 18 Years | 67 (100.0%) | 0 (0.0%) |
| 19 to 25 Years | 11 (100.0%) | 0 (0.0%) |
| 26 to 34 Years | 70 (100.0%) | 0 (0.0%) |
| 35 to 44 Years | 68 (100.0%) | 0 (0.0%) |
| 45 to 54 Years | 48 (100.0%) | 0 (0.0%) |
| 55 to 64 Years | 100 (100.0%) | 0 (0.0%) |
| 65 to 74 Years | 52 (100.0%) | 0 (0.0%) |
| 75 Years and older | 0 (0.0%) | 0 (0.0%) |
| Total | 482 (100.0%) | 0 (0.0%) |
Health Insurance Coverage by Citizenship Status in Waverly
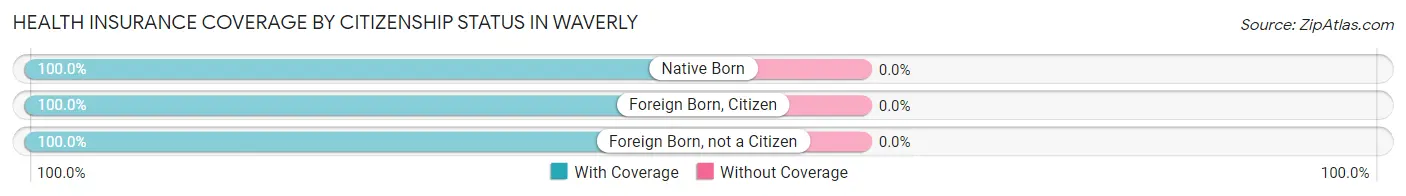
| Citizenship Status | With Coverage | Without Coverage |
| Native Born | 66 (100.0%) | 0 (0.0%) |
| Foreign Born, Citizen | 67 (100.0%) | 0 (0.0%) |
| Foreign Born, not a Citizen | 11 (100.0%) | 0 (0.0%) |
Health Insurance Coverage by Household Income in Waverly
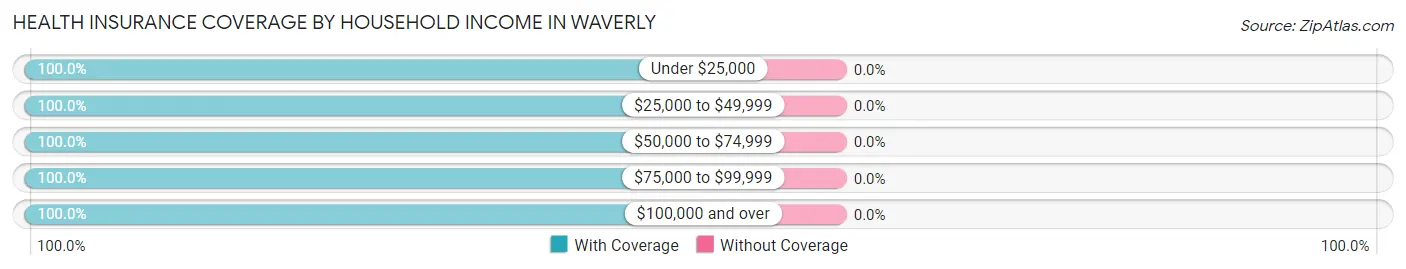
| Household Income | With Coverage | Without Coverage |
| Under $25,000 | 15 (100.0%) | 0 (0.0%) |
| $25,000 to $49,999 | 178 (100.0%) | 0 (0.0%) |
| $50,000 to $74,999 | 76 (100.0%) | 0 (0.0%) |
| $75,000 to $99,999 | 173 (100.0%) | 0 (0.0%) |
| $100,000 and over | 40 (100.0%) | 0 (0.0%) |
Public vs Private Health Insurance Coverage by Age in Waverly
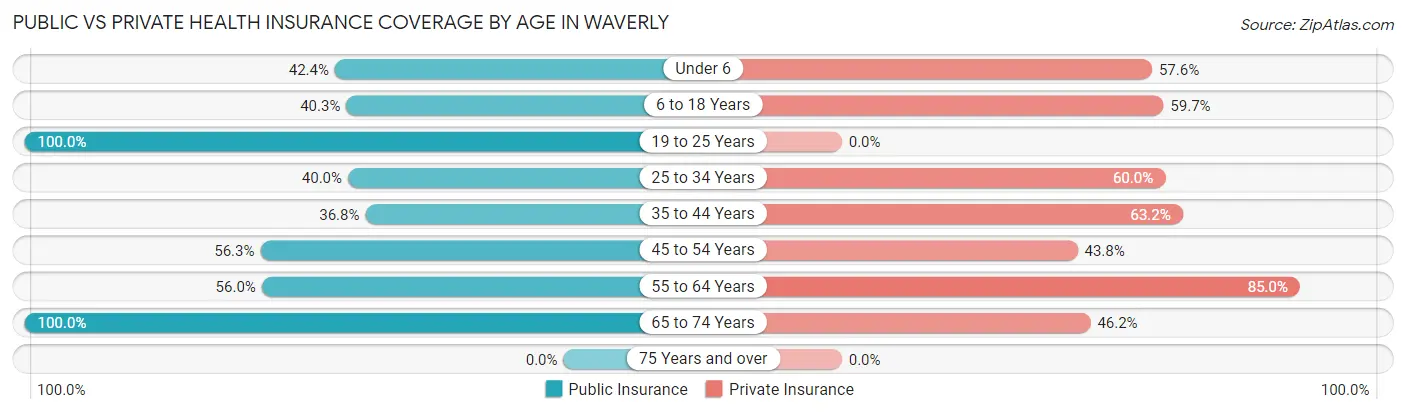
| Age Bracket | Public Insurance | Private Insurance |
| Under 6 | 28 (42.4%) | 38 (57.6%) |
| 6 to 18 Years | 27 (40.3%) | 40 (59.7%) |
| 19 to 25 Years | 11 (100.0%) | 0 (0.0%) |
| 25 to 34 Years | 28 (40.0%) | 42 (60.0%) |
| 35 to 44 Years | 25 (36.8%) | 43 (63.2%) |
| 45 to 54 Years | 27 (56.2%) | 21 (43.8%) |
| 55 to 64 Years | 56 (56.0%) | 85 (85.0%) |
| 65 to 74 Years | 52 (100.0%) | 24 (46.2%) |
| 75 Years and over | 0 (0.0%) | 0 (0.0%) |
| Total | 254 (52.7%) | 293 (60.8%) |
Disability Status by Sex by Age in Waverly
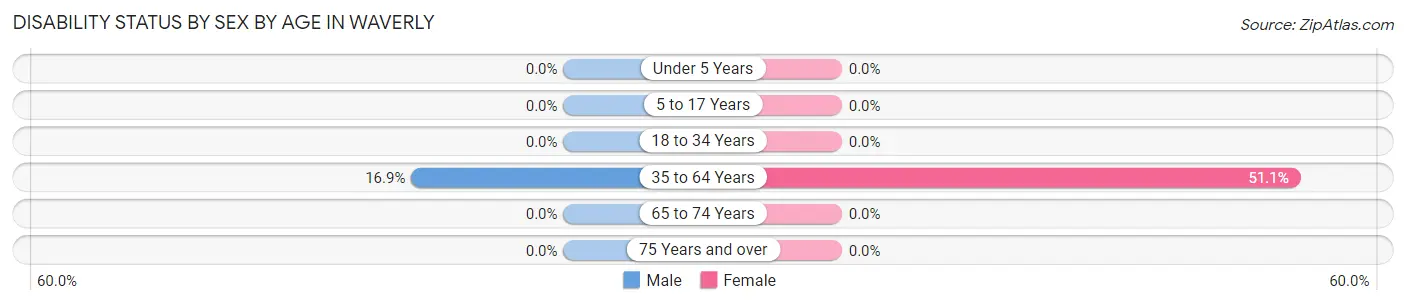
| Age Bracket | Male | Female |
| Under 5 Years | 0 (0.0%) | 0 (0.0%) |
| 5 to 17 Years | 0 (0.0%) | 0 (0.0%) |
| 18 to 34 Years | 0 (0.0%) | 0 (0.0%) |
| 35 to 64 Years | 21 (16.9%) | 47 (51.1%) |
| 65 to 74 Years | 0 (0.0%) | 0 (0.0%) |
| 75 Years and over | 0 (0.0%) | 0 (0.0%) |
Disability Class by Sex by Age in Waverly
Disability Class: Hearing Difficulty
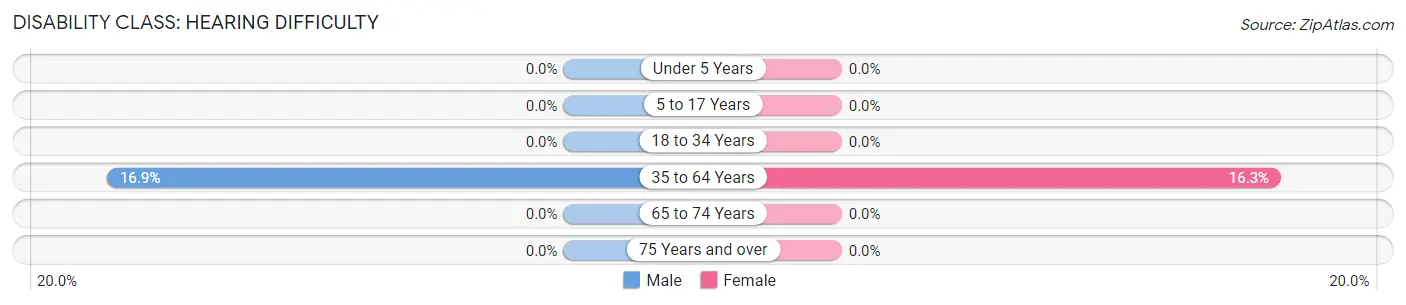
| Age Bracket | Male | Female |
| Under 5 Years | 0 (0.0%) | 0 (0.0%) |
| 5 to 17 Years | 0 (0.0%) | 0 (0.0%) |
| 18 to 34 Years | 0 (0.0%) | 0 (0.0%) |
| 35 to 64 Years | 21 (16.9%) | 15 (16.3%) |
| 65 to 74 Years | 0 (0.0%) | 0 (0.0%) |
| 75 Years and over | 0 (0.0%) | 0 (0.0%) |
Disability Class: Vision Difficulty
| Age Bracket | Male | Female |
| Under 5 Years | 0 (0.0%) | 0 (0.0%) |
| 5 to 17 Years | 0 (0.0%) | 0 (0.0%) |
| 18 to 34 Years | 0 (0.0%) | 0 (0.0%) |
| 35 to 64 Years | 0 (0.0%) | 0 (0.0%) |
| 65 to 74 Years | 0 (0.0%) | 0 (0.0%) |
| 75 Years and over | 0 (0.0%) | 0 (0.0%) |
Disability Class: Cognitive Difficulty
| Age Bracket | Male | Female |
| 5 to 17 Years | 0 (0.0%) | 0 (0.0%) |
| 18 to 34 Years | 0 (0.0%) | 0 (0.0%) |
| 35 to 64 Years | 0 (0.0%) | 21 (22.8%) |
| 65 to 74 Years | 0 (0.0%) | 0 (0.0%) |
| 75 Years and over | 0 (0.0%) | 0 (0.0%) |
Disability Class: Ambulatory Difficulty
| Age Bracket | Male | Female |
| 5 to 17 Years | 0 (0.0%) | 0 (0.0%) |
| 18 to 34 Years | 0 (0.0%) | 0 (0.0%) |
| 35 to 64 Years | 0 (0.0%) | 11 (12.0%) |
| 65 to 74 Years | 0 (0.0%) | 0 (0.0%) |
| 75 Years and over | 0 (0.0%) | 0 (0.0%) |
Disability Class: Self-Care Difficulty
| Age Bracket | Male | Female |
| 5 to 17 Years | 0 (0.0%) | 0 (0.0%) |
| 18 to 34 Years | 0 (0.0%) | 0 (0.0%) |
| 35 to 64 Years | 0 (0.0%) | 11 (12.0%) |
| 65 to 74 Years | 0 (0.0%) | 0 (0.0%) |
| 75 Years and over | 0 (0.0%) | 0 (0.0%) |
Technology Access in Waverly
Computing Device Access in Waverly
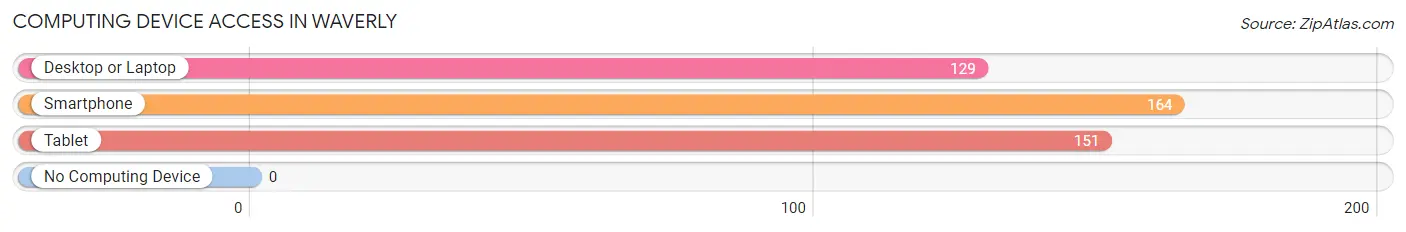
| Device Type | # Households | % Households |
| Desktop or Laptop | 129 | 78.7% |
| Smartphone | 164 | 100.0% |
| Tablet | 151 | 92.1% |
| No Computing Device | 0 | 0.0% |
| Total | 164 | 100.0% |
Internet Access in Waverly
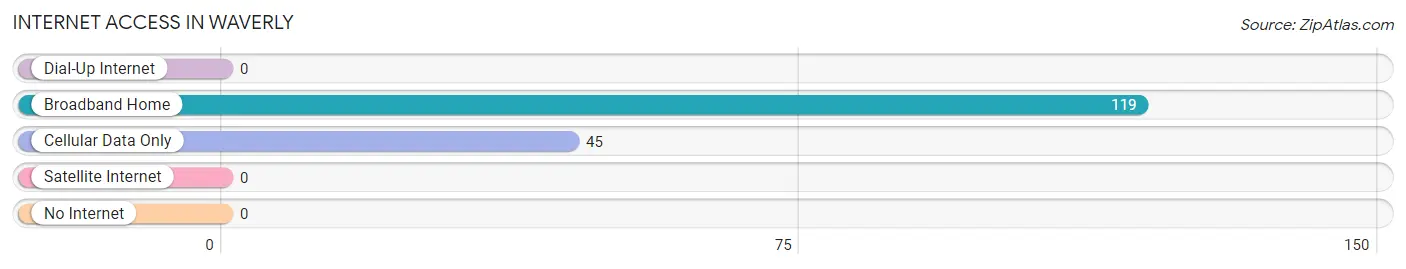
| Internet Type | # Households | % Households |
| Dial-Up Internet | 0 | 0.0% |
| Broadband Home | 119 | 72.6% |
| Cellular Data Only | 45 | 27.4% |
| Satellite Internet | 0 | 0.0% |
| No Internet | 0 | 0.0% |
| Total | 164 | 100.0% |
Waverly Summary
Waverly is a small town located in the northern part of West Virginia, in the United States. It is situated in the Appalachian Mountains, and is part of the larger city of Parkersburg. The town has a population of just over 1,000 people, and is known for its rural charm and small-town atmosphere.
History
Waverly was founded in 1817 by a group of settlers from Pennsylvania. The town was named after the Waverly family, who were among the first settlers. The town was originally a farming community, and the Waverly family owned a large amount of land in the area. The town grew slowly over the years, and by the late 19th century, it had become a popular tourist destination.
In the early 20th century, Waverly experienced a period of growth and development. The town was connected to the rest of the state by the Parkersburg and Marietta Railroad, and the town's economy began to diversify. The town also became a popular destination for outdoor recreation, and the nearby Waverly Lake became a popular spot for fishing and swimming.
Geography
Waverly is located in the northern part of West Virginia, in the Appalachian Mountains. The town is situated in Wood County, and is bordered by the cities of Parkersburg and Vienna. The town is located on the banks of the Little Kanawha River, and is surrounded by rolling hills and forests. The town is located at an elevation of 890 feet above sea level.
Economy
The economy of Waverly is largely based on tourism and outdoor recreation. The town is home to several small businesses, including restaurants, shops, and lodging. The town is also home to a number of small manufacturing companies, which produce a variety of products, including furniture, clothing, and electronics.
The town is also home to a number of outdoor recreation activities, including fishing, hunting, and camping. The nearby Waverly Lake is a popular spot for fishing and swimming, and the town is also home to several parks and trails.
Demographics
As of the 2010 census, the population of Waverly was 1,072. The town has a population density of 545 people per square mile. The median age of the population is 44.7 years, and the median household income is $37,941. The town is predominantly white, with 95.3% of the population identifying as white. The town also has a small Hispanic population, with 2.2% of the population identifying as Hispanic or Latino.
Conclusion
Waverly is a small town located in the northern part of West Virginia. The town has a population of just over 1,000 people, and is known for its rural charm and small-town atmosphere. The town's economy is largely based on tourism and outdoor recreation, and the town is home to several small businesses and manufacturing companies. The town is predominantly white, with 95.3% of the population identifying as white. Waverly is a popular destination for outdoor recreation, and the nearby Waverly Lake is a popular spot for fishing and swimming.
Common Questions
What is Per Capita Income in Waverly?
Per Capita income in Waverly is $24,721.
What is the Median Family Income in Waverly?
Median Family Income in Waverly is $77,202.
What is the Median Household income in Waverly?
Median Household Income in Waverly is $77,833.
What is Inequality or Gini Index in Waverly?
Inequality or Gini Index in Waverly is 0.22.
What is the Total Population of Waverly?
Total Population of Waverly is 482.
What is the Total Male Population of Waverly?
Total Male Population of Waverly is 246.
What is the Total Female Population of Waverly?
Total Female Population of Waverly is 236.
What is the Ratio of Males per 100 Females in Waverly?
There are 104.24 Males per 100 Females in Waverly.
What is the Ratio of Females per 100 Males in Waverly?
There are 95.93 Females per 100 Males in Waverly.
What is the Median Population Age in Waverly?
Median Population Age in Waverly is 40.0 Years.
What is the Average Family Size in Waverly
Average Family Size in Waverly is 3.1 People.
What is the Average Household Size in Waverly
Average Household Size in Waverly is 2.9 People.
How Large is the Labor Force in Waverly?
There are 152 People in the Labor Forcein in Waverly.
What is the Percentage of People in the Labor Force in Waverly?
43.6% of People are in the Labor Force in Waverly.