Triadelphia, WV Map & Demographics
Triadelphia Map
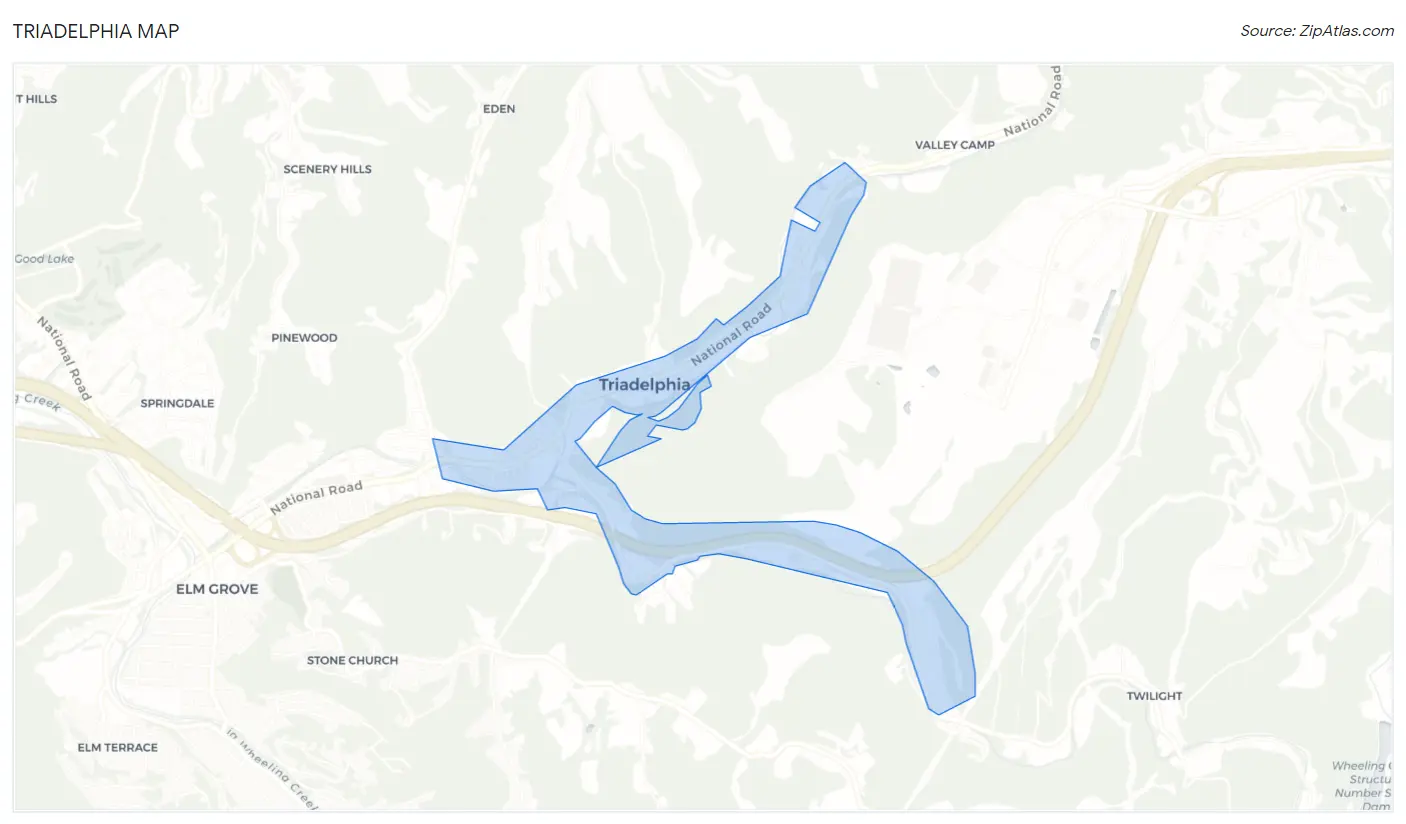
Triadelphia Overview
$26,448
PER CAPITA INCOME
$67,083
AVG FAMILY INCOME
$45,739
AVG HOUSEHOLD INCOME
35.8%
WAGE / INCOME GAP [ % ]
64.2¢/ $1
WAGE / INCOME GAP [ $ ]
0.40
INEQUALITY / GINI INDEX
735
TOTAL POPULATION
353
MALE POPULATION
382
FEMALE POPULATION
92.41
MALES / 100 FEMALES
108.22
FEMALES / 100 MALES
46.3
MEDIAN AGE
2.7
AVG FAMILY SIZE
2.2
AVG HOUSEHOLD SIZE
344
LABOR FORCE [ PEOPLE ]
50.7%
PERCENT IN LABOR FORCE
7.0%
UNEMPLOYMENT RATE
Triadelphia Zip Codes
Triadelphia Area Codes
Income in Triadelphia
Income Overview in Triadelphia
Per Capita Income in Triadelphia is $26,448, while median incomes of families and households are $67,083 and $45,739 respectively.
| Characteristic | Number | Measure |
| Per Capita Income | 735 | $26,448 |
| Median Family Income | 228 | $67,083 |
| Mean Family Income | 228 | $65,132 |
| Median Household Income | 331 | $45,739 |
| Mean Household Income | 331 | $55,655 |
| Income Deficit | 228 | $0 |
| Wage / Income Gap (%) | 735 | 35.82% |
| Wage / Income Gap ($) | 735 | 64.18¢ per $1 |
| Gini / Inequality Index | 735 | 0.40 |
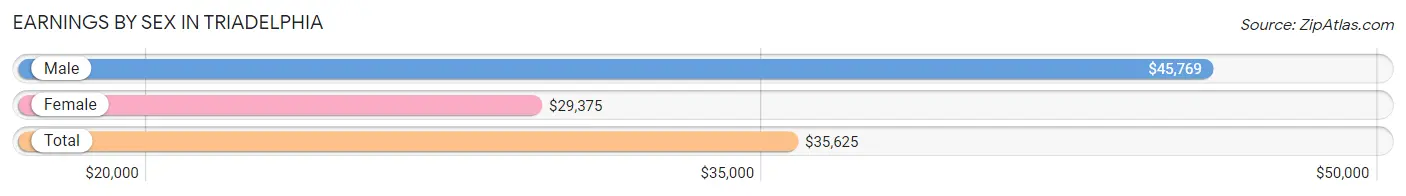
Earnings by Sex in Triadelphia
Average Earnings in Triadelphia are $35,625, $45,769 for men and $29,375 for women, a difference of 35.8%.
| Sex | Number | Average Earnings |
| Male | 172 (47.9%) | $45,769 |
| Female | 187 (52.1%) | $29,375 |
| Total | 359 (100.0%) | $35,625 |
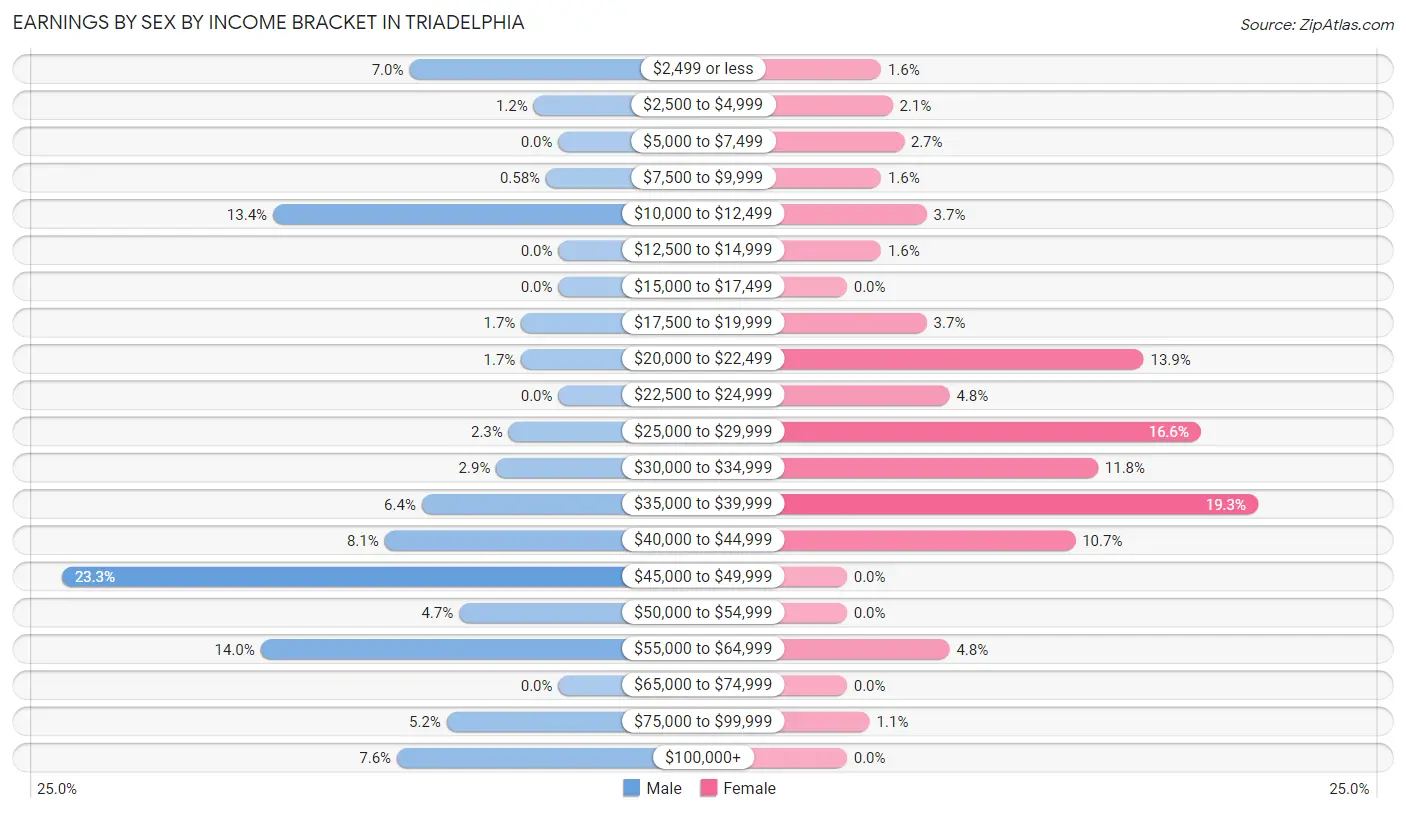
Earnings by Sex by Income Bracket in Triadelphia
The most common earnings brackets in Triadelphia are $45,000 to $49,999 for men (40 | 23.3%) and $35,000 to $39,999 for women (36 | 19.3%).
| Income | Male | Female |
| $2,499 or less | 12 (7.0%) | 3 (1.6%) |
| $2,500 to $4,999 | 2 (1.2%) | 4 (2.1%) |
| $5,000 to $7,499 | 0 (0.0%) | 5 (2.7%) |
| $7,500 to $9,999 | 1 (0.6%) | 3 (1.6%) |
| $10,000 to $12,499 | 23 (13.4%) | 7 (3.7%) |
| $12,500 to $14,999 | 0 (0.0%) | 3 (1.6%) |
| $15,000 to $17,499 | 0 (0.0%) | 0 (0.0%) |
| $17,500 to $19,999 | 3 (1.7%) | 7 (3.7%) |
| $20,000 to $22,499 | 3 (1.7%) | 26 (13.9%) |
| $22,500 to $24,999 | 0 (0.0%) | 9 (4.8%) |
| $25,000 to $29,999 | 4 (2.3%) | 31 (16.6%) |
| $30,000 to $34,999 | 5 (2.9%) | 22 (11.8%) |
| $35,000 to $39,999 | 11 (6.4%) | 36 (19.3%) |
| $40,000 to $44,999 | 14 (8.1%) | 20 (10.7%) |
| $45,000 to $49,999 | 40 (23.3%) | 0 (0.0%) |
| $50,000 to $54,999 | 8 (4.6%) | 0 (0.0%) |
| $55,000 to $64,999 | 24 (14.0%) | 9 (4.8%) |
| $65,000 to $74,999 | 0 (0.0%) | 0 (0.0%) |
| $75,000 to $99,999 | 9 (5.2%) | 2 (1.1%) |
| $100,000+ | 13 (7.6%) | 0 (0.0%) |
| Total | 172 (100.0%) | 187 (100.0%) |
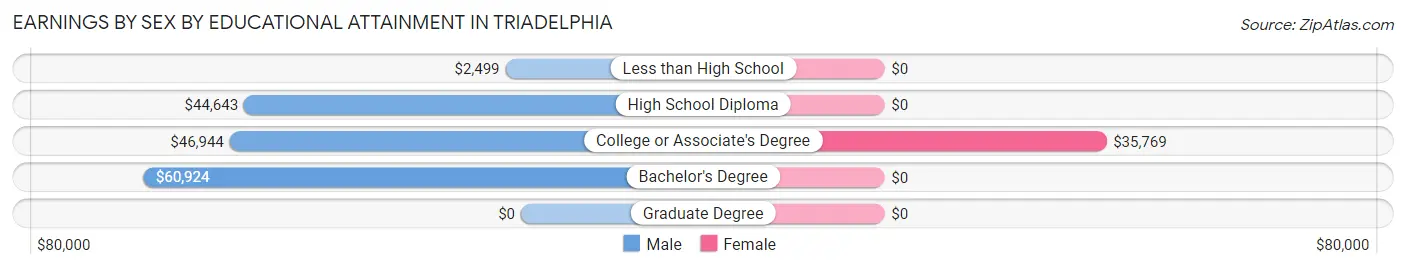
Earnings by Sex by Educational Attainment in Triadelphia
Average earnings in Triadelphia are $46,298 for men and $33,672 for women, a difference of 27.3%. Men with an educational attainment of bachelor's degree enjoy the highest average annual earnings of $60,924, while those with less than high school education earn the least with $2,499. Women with an educational attainment of college or associate's degree earn the most with the average annual earnings of $35,769, while those with college or associate's degree education have the smallest earnings of $35,769.
| Educational Attainment | Male Income | Female Income |
| Less than High School | $2,499 | $0 |
| High School Diploma | $44,643 | $0 |
| College or Associate's Degree | $46,944 | $35,769 |
| Bachelor's Degree | $60,924 | $0 |
| Graduate Degree | - | - |
| Total | $46,298 | $33,672 |
Family Income in Triadelphia
Family Income Brackets in Triadelphia
According to the Triadelphia family income data, there are 82 families falling into the $75,000 to $99,999 income range, which is the most common income bracket and makes up 36.0% of all families.
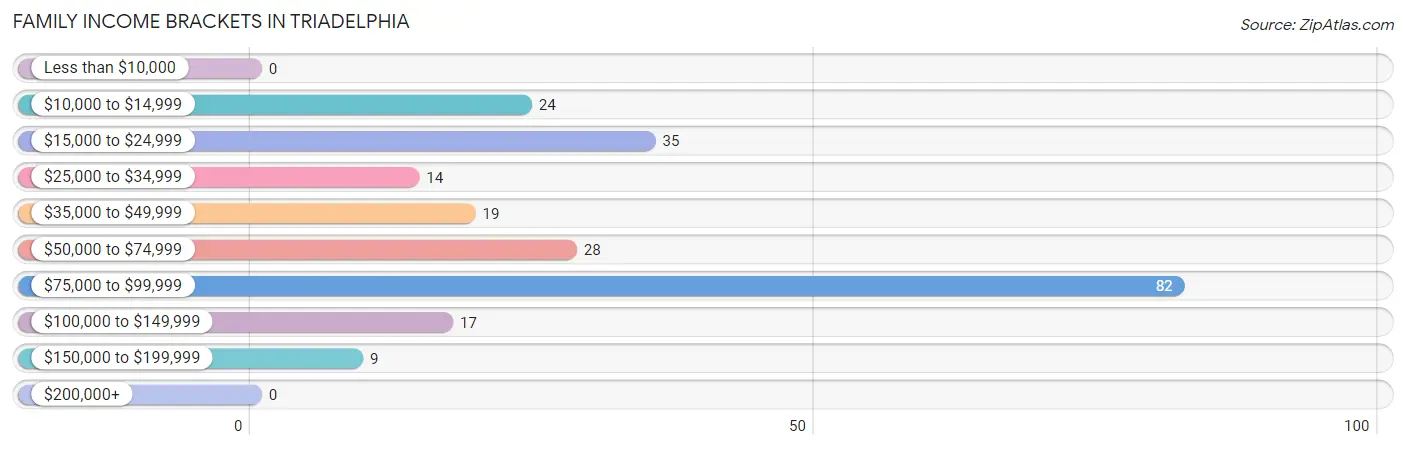
| Income Bracket | # Families | % Families |
| Less than $10,000 | 0 | 0.0% |
| $10,000 to $14,999 | 24 | 10.5% |
| $15,000 to $24,999 | 35 | 15.4% |
| $25,000 to $34,999 | 14 | 6.1% |
| $35,000 to $49,999 | 19 | 8.3% |
| $50,000 to $74,999 | 28 | 12.3% |
| $75,000 to $99,999 | 82 | 36.0% |
| $100,000 to $149,999 | 17 | 7.5% |
| $150,000 to $199,999 | 9 | 3.9% |
| $200,000+ | 0 | 0.0% |
Family Income by Famaliy Size in Triadelphia
4-person families (19 | 8.3%) account for the highest median family income in Triadelphia with $106,458 per family, while 2-person families (142 | 62.3%) have the highest median income of $29,532 per family member.
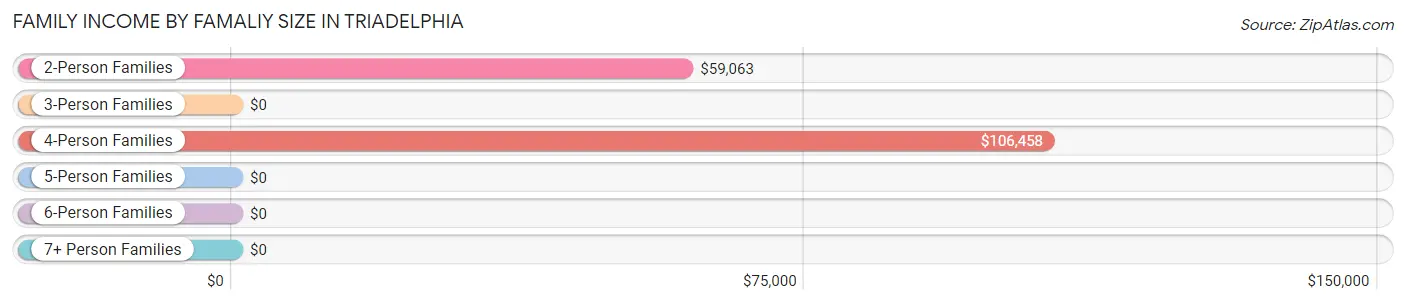
| Income Bracket | # Families | Median Income |
| 2-Person Families | 142 (62.3%) | $59,063 |
| 3-Person Families | 59 (25.9%) | $0 |
| 4-Person Families | 19 (8.3%) | $106,458 |
| 5-Person Families | 8 (3.5%) | $0 |
| 6-Person Families | 0 (0.0%) | $0 |
| 7+ Person Families | 0 (0.0%) | $0 |
| Total | 228 (100.0%) | $67,083 |
Family Income by Number of Earners in Triadelphia
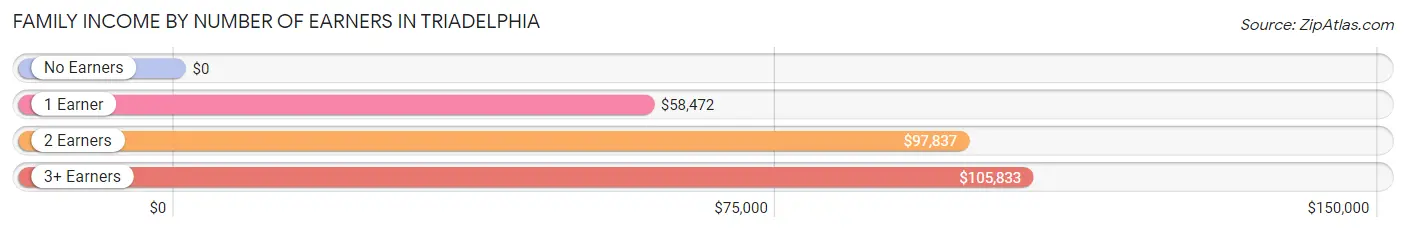
| Number of Earners | # Families | Median Income |
| No Earners | 74 (32.5%) | $0 |
| 1 Earner | 65 (28.5%) | $58,472 |
| 2 Earners | 73 (32.0%) | $97,837 |
| 3+ Earners | 16 (7.0%) | $105,833 |
| Total | 228 (100.0%) | $67,083 |
Household Income in Triadelphia
Household Income Brackets in Triadelphia
With 82 households falling in the category, the $75,000 to $99,999 income range is the most frequent in Triadelphia, accounting for 24.8% of all households.
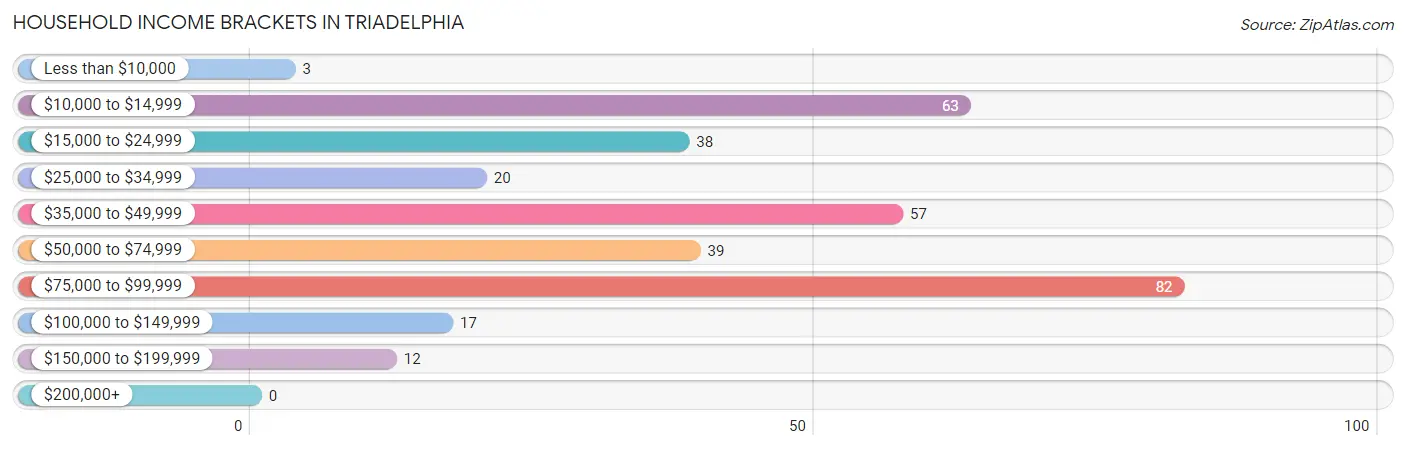
| Income Bracket | # Households | % Households |
| Less than $10,000 | 3 | 0.9% |
| $10,000 to $14,999 | 63 | 19.0% |
| $15,000 to $24,999 | 38 | 11.5% |
| $25,000 to $34,999 | 20 | 6.0% |
| $35,000 to $49,999 | 57 | 17.2% |
| $50,000 to $74,999 | 39 | 11.8% |
| $75,000 to $99,999 | 82 | 24.8% |
| $100,000 to $149,999 | 17 | 5.1% |
| $150,000 to $199,999 | 12 | 3.6% |
| $200,000+ | 0 | 0.0% |
Household Income by Householder Age in Triadelphia
The median household income in Triadelphia is $45,739, with the highest median household income of $86,042 found in the 25 to 44 years age bracket for the primary householder. A total of 83 households (25.1%) fall into this category. Meanwhile, the 15 to 24 years age bracket for the primary householder has the lowest median household income of $0, with 10 households (3.0%) in this group.
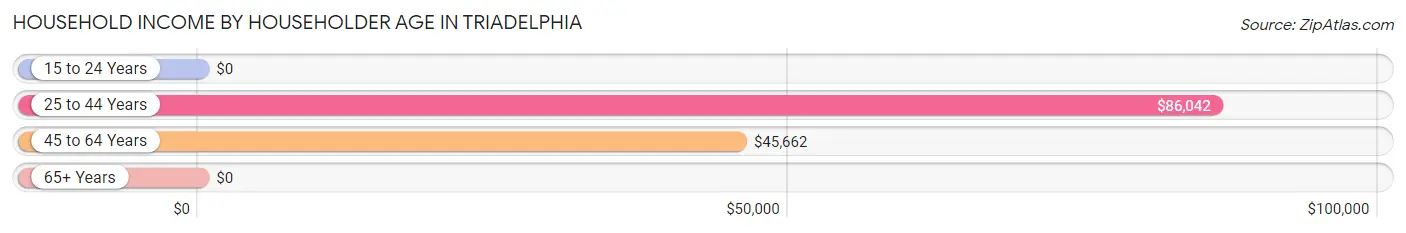
| Income Bracket | # Households | Median Income |
| 15 to 24 Years | 10 (3.0%) | $0 |
| 25 to 44 Years | 83 (25.1%) | $86,042 |
| 45 to 64 Years | 135 (40.8%) | $45,662 |
| 65+ Years | 103 (31.1%) | $0 |
| Total | 331 (100.0%) | $45,739 |
Poverty in Triadelphia
Income Below Poverty by Sex and Age in Triadelphia
With 23.2% poverty level for males and 20.4% for females among the residents of Triadelphia, 18 to 24 year old males and 75 year old and over females are the most vulnerable to poverty, with 32 males (76.2%) and 18 females (51.4%) in their respective age groups living below the poverty level.
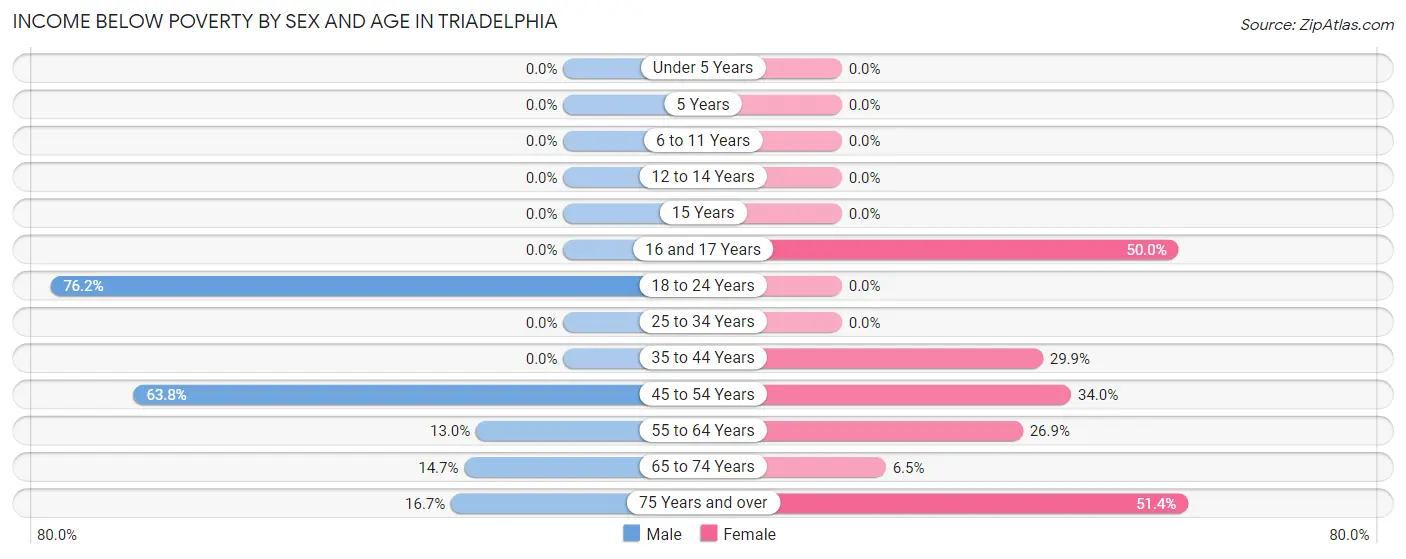
| Age Bracket | Male | Female |
| Under 5 Years | 0 (0.0%) | 0 (0.0%) |
| 5 Years | 0 (0.0%) | 0 (0.0%) |
| 6 to 11 Years | 0 (0.0%) | 0 (0.0%) |
| 12 to 14 Years | 0 (0.0%) | 0 (0.0%) |
| 15 Years | 0 (0.0%) | 0 (0.0%) |
| 16 and 17 Years | 0 (0.0%) | 3 (50.0%) |
| 18 to 24 Years | 32 (76.2%) | 0 (0.0%) |
| 25 to 34 Years | 0 (0.0%) | 0 (0.0%) |
| 35 to 44 Years | 0 (0.0%) | 20 (29.8%) |
| 45 to 54 Years | 30 (63.8%) | 16 (34.0%) |
| 55 to 64 Years | 7 (13.0%) | 18 (26.9%) |
| 65 to 74 Years | 10 (14.7%) | 3 (6.5%) |
| 75 Years and over | 3 (16.7%) | 18 (51.4%) |
| Total | 82 (23.2%) | 78 (20.4%) |
Income Above Poverty by Sex and Age in Triadelphia
According to the poverty statistics in Triadelphia, males aged 6 to 11 years and females aged 5 years are the age groups that are most secure financially, with 100.0% of males and 100.0% of females in these age groups living above the poverty line.
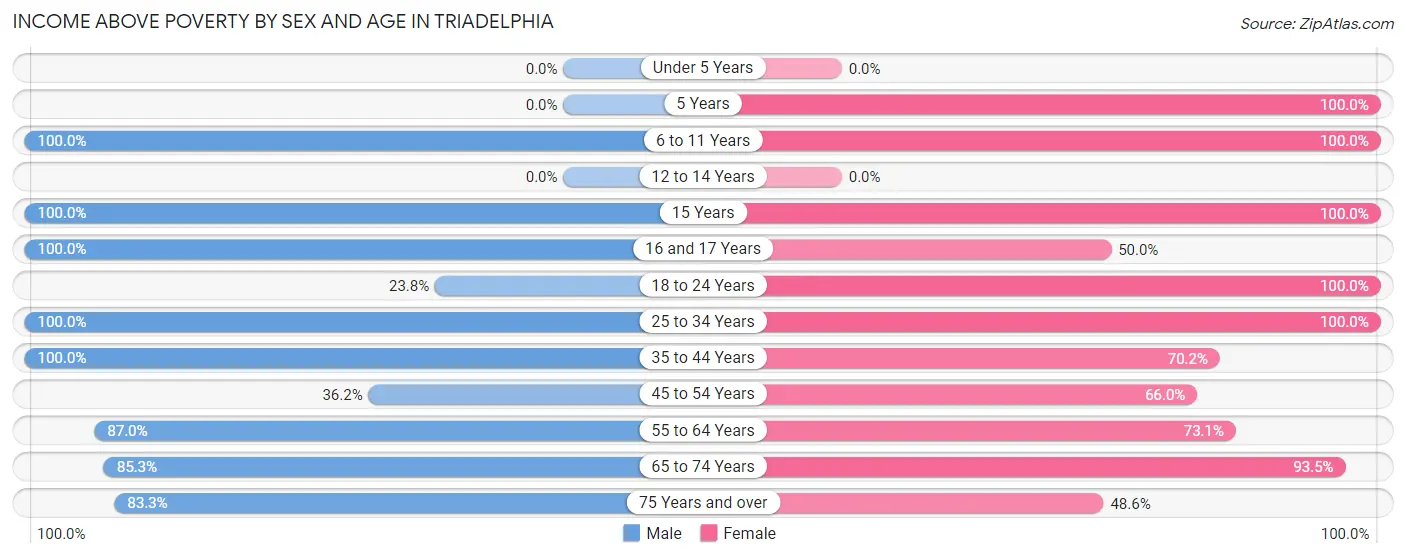
| Age Bracket | Male | Female |
| Under 5 Years | 0 (0.0%) | 0 (0.0%) |
| 5 Years | 0 (0.0%) | 6 (100.0%) |
| 6 to 11 Years | 10 (100.0%) | 23 (100.0%) |
| 12 to 14 Years | 0 (0.0%) | 0 (0.0%) |
| 15 Years | 10 (100.0%) | 7 (100.0%) |
| 16 and 17 Years | 5 (100.0%) | 3 (50.0%) |
| 18 to 24 Years | 10 (23.8%) | 33 (100.0%) |
| 25 to 34 Years | 52 (100.0%) | 45 (100.0%) |
| 35 to 44 Years | 47 (100.0%) | 47 (70.2%) |
| 45 to 54 Years | 17 (36.2%) | 31 (66.0%) |
| 55 to 64 Years | 47 (87.0%) | 49 (73.1%) |
| 65 to 74 Years | 58 (85.3%) | 43 (93.5%) |
| 75 Years and over | 15 (83.3%) | 17 (48.6%) |
| Total | 271 (76.8%) | 304 (79.6%) |
Income Below Poverty Among Married-Couple Families in Triadelphia
The poverty statistics for married-couple families in Triadelphia show that 18.3% or 34 of the total 186 families live below the poverty line. Families with no children have the highest poverty rate of 21.2%, comprising of 31 families. On the other hand, families with 1 or 2 children have the lowest poverty rate of 7.5%, which includes 3 families.
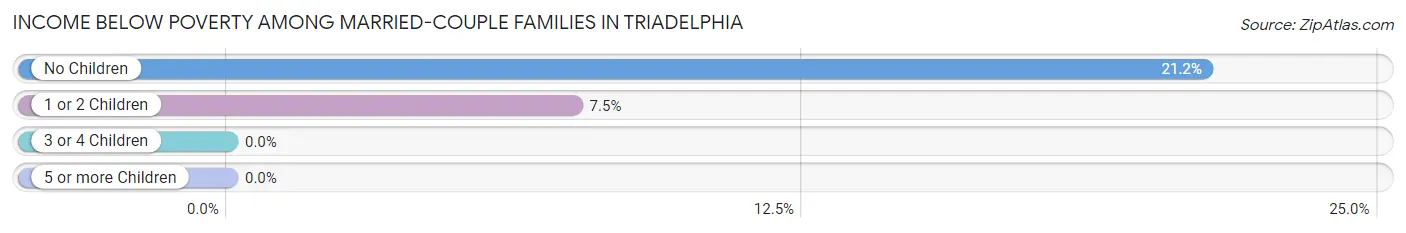
| Children | Above Poverty | Below Poverty |
| No Children | 115 (78.8%) | 31 (21.2%) |
| 1 or 2 Children | 37 (92.5%) | 3 (7.5%) |
| 3 or 4 Children | 0 (0.0%) | 0 (0.0%) |
| 5 or more Children | 0 (0.0%) | 0 (0.0%) |
| Total | 152 (81.7%) | 34 (18.3%) |
Income Below Poverty Among Single-Parent Households in Triadelphia
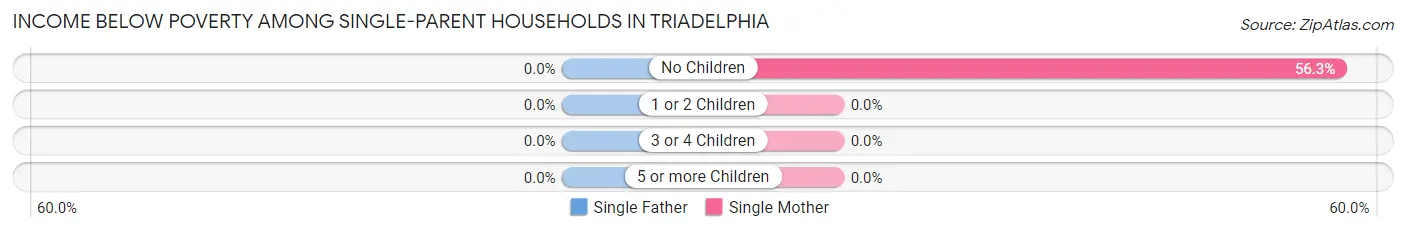
| Children | Single Father | Single Mother |
| No Children | 0 (0.0%) | 18 (56.2%) |
| 1 or 2 Children | 0 (0.0%) | 0 (0.0%) |
| 3 or 4 Children | 0 (0.0%) | 0 (0.0%) |
| 5 or more Children | 0 (0.0%) | 0 (0.0%) |
| Total | 0 (0.0%) | 18 (42.9%) |
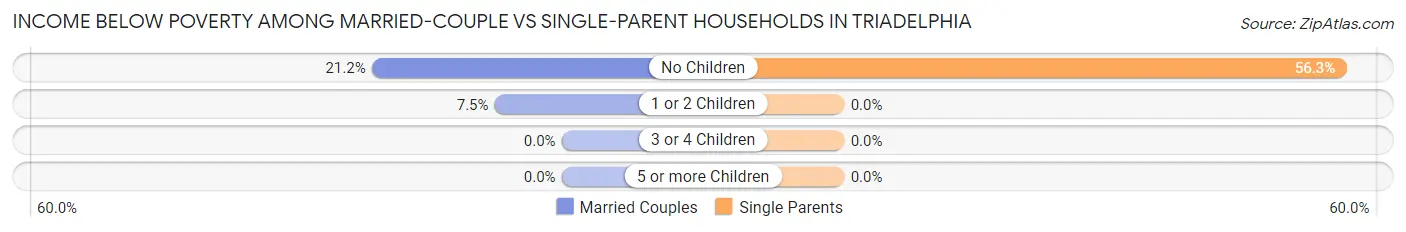
Income Below Poverty Among Married-Couple vs Single-Parent Households in Triadelphia
The poverty data for Triadelphia shows that 34 of the married-couple family households (18.3%) and 18 of the single-parent households (42.9%) are living below the poverty level. Within the married-couple family households, those with no children have the highest poverty rate, with 31 households (21.2%) falling below the poverty line. Among the single-parent households, those with no children have the highest poverty rate, with 18 household (56.2%) living below poverty.
| Children | Married-Couple Families | Single-Parent Households |
| No Children | 31 (21.2%) | 18 (56.2%) |
| 1 or 2 Children | 3 (7.5%) | 0 (0.0%) |
| 3 or 4 Children | 0 (0.0%) | 0 (0.0%) |
| 5 or more Children | 0 (0.0%) | 0 (0.0%) |
| Total | 34 (18.3%) | 18 (42.9%) |
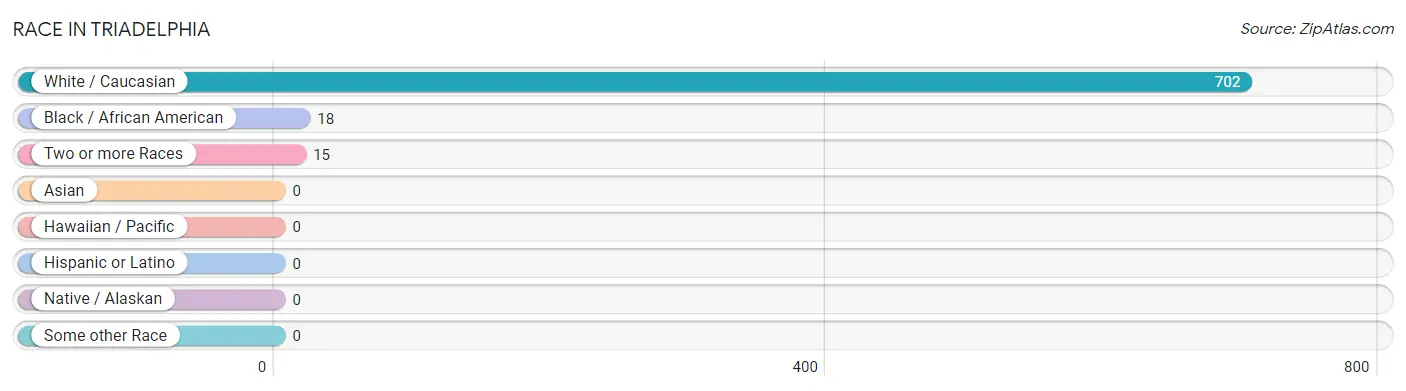
Race in Triadelphia
The most populous races in Triadelphia are White / Caucasian (702 | 95.5%), Black / African American (18 | 2.5%), and Two or more Races (15 | 2.0%).
| Race | # Population | % Population |
| Asian | 0 | 0.0% |
| Black / African American | 18 | 2.5% |
| Hawaiian / Pacific | 0 | 0.0% |
| Hispanic or Latino | 0 | 0.0% |
| Native / Alaskan | 0 | 0.0% |
| White / Caucasian | 702 | 95.5% |
| Two or more Races | 15 | 2.0% |
| Some other Race | 0 | 0.0% |
| Total | 735 | 100.0% |
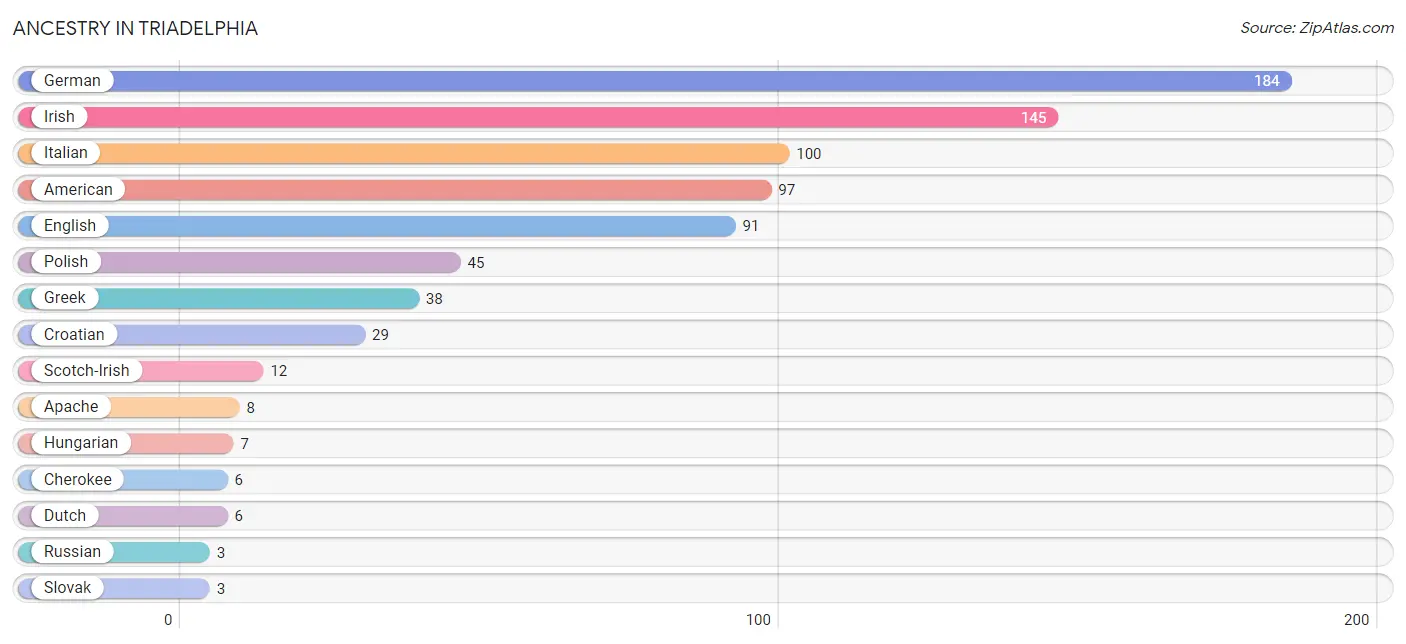
Ancestry in Triadelphia
The most populous ancestries reported in Triadelphia are German (184 | 25.0%), Irish (145 | 19.7%), Italian (100 | 13.6%), American (97 | 13.2%), and English (91 | 12.4%), together accounting for 84.0% of all Triadelphia residents.
| Ancestry | # Population | % Population |
| American | 97 | 13.2% |
| Apache | 8 | 1.1% |
| Cherokee | 6 | 0.8% |
| Croatian | 29 | 4.0% |
| Dutch | 6 | 0.8% |
| English | 91 | 12.4% |
| French | 2 | 0.3% |
| German | 184 | 25.0% |
| Greek | 38 | 5.2% |
| Hungarian | 7 | 0.9% |
| Irish | 145 | 19.7% |
| Italian | 100 | 13.6% |
| Polish | 45 | 6.1% |
| Russian | 3 | 0.4% |
| Scotch-Irish | 12 | 1.6% |
| Slovak | 3 | 0.4% | View All 16 Rows |
Immigrants in Triadelphia

| Immigration Origin | # Population | % Population | View All 0 Rows |
Sex and Age in Triadelphia
Sex and Age in Triadelphia
The most populous age groups in Triadelphia are 20 to 24 Years (42 | 11.9%) for men and 35 to 39 Years (40 | 10.5%) for women.
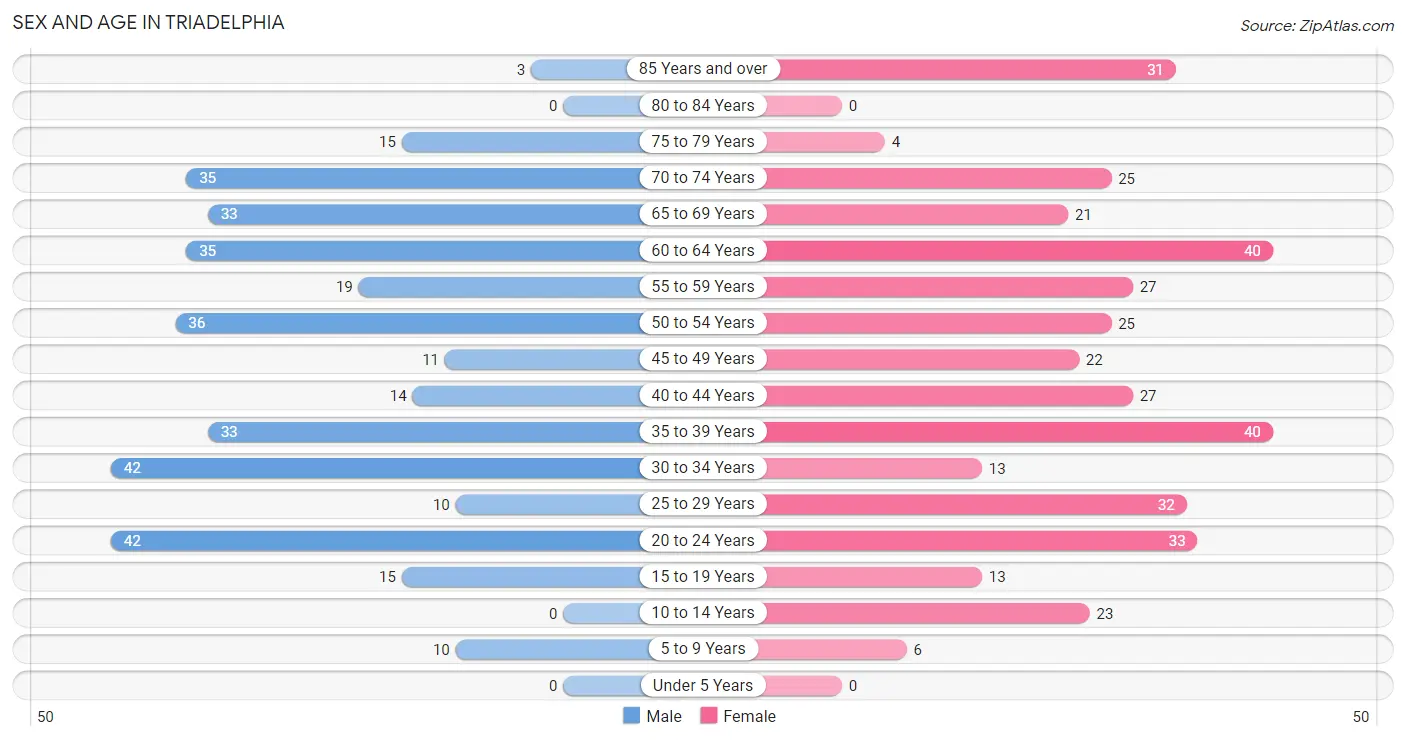
| Age Bracket | Male | Female |
| Under 5 Years | 0 (0.0%) | 0 (0.0%) |
| 5 to 9 Years | 10 (2.8%) | 6 (1.6%) |
| 10 to 14 Years | 0 (0.0%) | 23 (6.0%) |
| 15 to 19 Years | 15 (4.3%) | 13 (3.4%) |
| 20 to 24 Years | 42 (11.9%) | 33 (8.6%) |
| 25 to 29 Years | 10 (2.8%) | 32 (8.4%) |
| 30 to 34 Years | 42 (11.9%) | 13 (3.4%) |
| 35 to 39 Years | 33 (9.3%) | 40 (10.5%) |
| 40 to 44 Years | 14 (4.0%) | 27 (7.1%) |
| 45 to 49 Years | 11 (3.1%) | 22 (5.8%) |
| 50 to 54 Years | 36 (10.2%) | 25 (6.5%) |
| 55 to 59 Years | 19 (5.4%) | 27 (7.1%) |
| 60 to 64 Years | 35 (9.9%) | 40 (10.5%) |
| 65 to 69 Years | 33 (9.3%) | 21 (5.5%) |
| 70 to 74 Years | 35 (9.9%) | 25 (6.5%) |
| 75 to 79 Years | 15 (4.3%) | 4 (1.1%) |
| 80 to 84 Years | 0 (0.0%) | 0 (0.0%) |
| 85 Years and over | 3 (0.9%) | 31 (8.1%) |
| Total | 353 (100.0%) | 382 (100.0%) |
Families and Households in Triadelphia
Median Family Size in Triadelphia
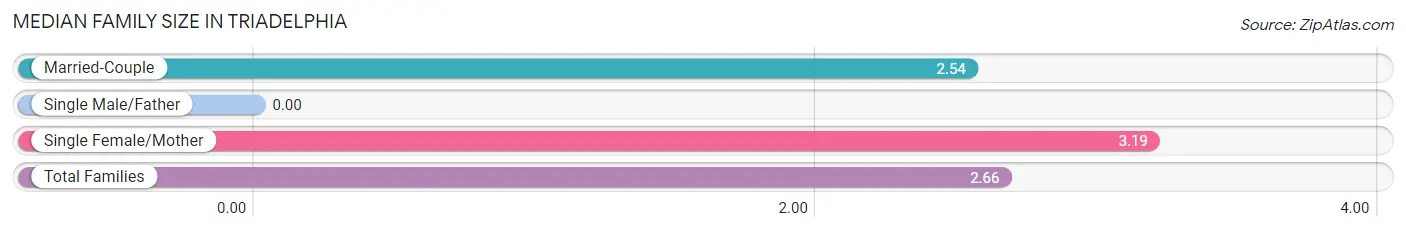
| Family Type | # Families | Family Size |
| Married-Couple | 186 (81.6%) | 2.54 |
| Single Male/Father | 0 (0.0%) | - |
| Single Female/Mother | 42 (18.4%) | 3.19 |
| Total Families | 228 (100.0%) | 2.66 |
Median Household Size in Triadelphia
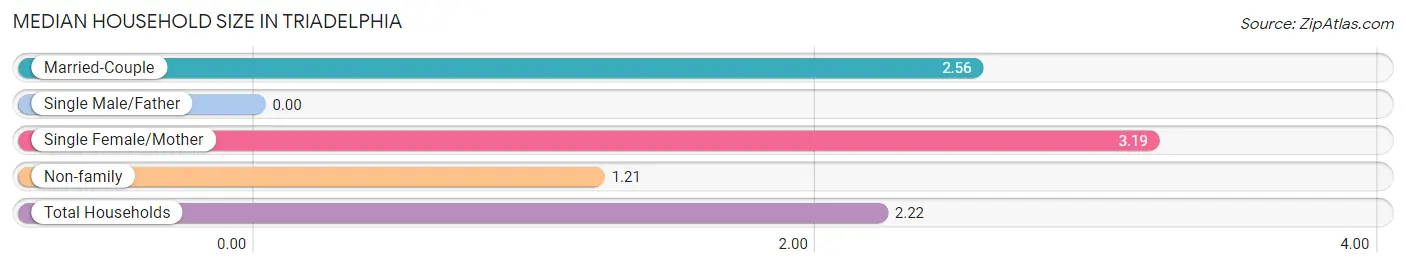
| Household Type | # Households | Household Size |
| Married-Couple | 186 (56.2%) | 2.56 |
| Single Male/Father | 0 (0.0%) | - |
| Single Female/Mother | 42 (12.7%) | 3.19 |
| Non-family | 103 (31.1%) | 1.21 |
| Total Households | 331 (100.0%) | 2.22 |
Household Size by Marriage Status in Triadelphia
Out of a total of 331 households in Triadelphia, 228 (68.9%) are family households, while 103 (31.1%) are nonfamily households. The most numerous type of family households are 2-person households, comprising 142, and the most common type of nonfamily households are 1-person households, comprising 87.
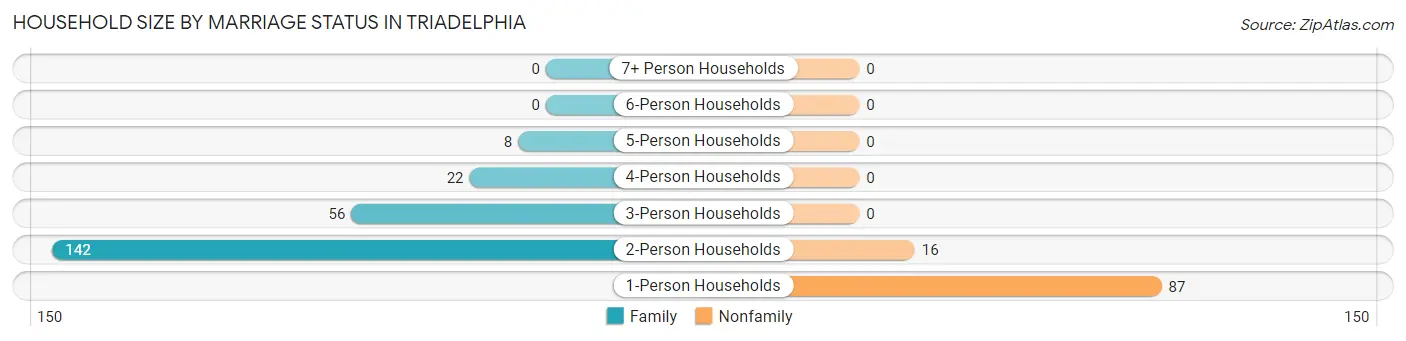
| Household Size | Family Households | Nonfamily Households |
| 1-Person Households | - | 87 (26.3%) |
| 2-Person Households | 142 (42.9%) | 16 (4.8%) |
| 3-Person Households | 56 (16.9%) | 0 (0.0%) |
| 4-Person Households | 22 (6.7%) | 0 (0.0%) |
| 5-Person Households | 8 (2.4%) | 0 (0.0%) |
| 6-Person Households | 0 (0.0%) | 0 (0.0%) |
| 7+ Person Households | 0 (0.0%) | 0 (0.0%) |
| Total | 228 (68.9%) | 103 (31.1%) |
Female Fertility in Triadelphia
Fertility by Age in Triadelphia
| Age Bracket | Women with Births | Births / 1,000 Women |
| 15 to 19 years | 0 (0.0%) | 0.0 |
| 20 to 34 years | 0 (0.0%) | 0.0 |
| 35 to 50 years | 0 (0.0%) | 0.0 |
| Total | 0 (0.0%) | 0.0 |
Fertility by Age by Marriage Status in Triadelphia
| Age Bracket | Married | Unmarried |
| 15 to 19 years | 0 (0.0%) | 0 (0.0%) |
| 20 to 34 years | 0 (0.0%) | 0 (0.0%) |
| 35 to 50 years | 0 (0.0%) | 0 (0.0%) |
| Total | 0 (0.0%) | 0 (0.0%) |
Fertility by Education in Triadelphia
| Educational Attainment | Women with Births | Births / 1,000 Women |
| Less than High School | 0 (0.0%) | 0.0 |
| High School Diploma | 0 (0.0%) | 0.0 |
| College or Associate's Degree | 0 (0.0%) | 0.0 |
| Bachelor's Degree | 0 (0.0%) | 0.0 |
| Graduate Degree | 0 (0.0%) | 0.0 |
| Total | 0 (0.0%) | 0.0 |
Fertility by Education by Marriage Status in Triadelphia
| Educational Attainment | Married | Unmarried |
| Less than High School | 0 (0.0%) | 0 (0.0%) |
| High School Diploma | 0 (0.0%) | 0 (0.0%) |
| College or Associate's Degree | 0 (0.0%) | 0 (0.0%) |
| Bachelor's Degree | 0 (0.0%) | 0 (0.0%) |
| Graduate Degree | 0 (0.0%) | 0 (0.0%) |
| Total | 0 (0.0%) | 0 (0.0%) |
Employment Characteristics in Triadelphia
Employment by Class of Employer in Triadelphia
Among the 320 employed individuals in Triadelphia, private company employees (265 | 82.8%), not-for-profit organizations (22 | 6.9%), and federal government employees (13 | 4.1%) make up the most common classes of employment.
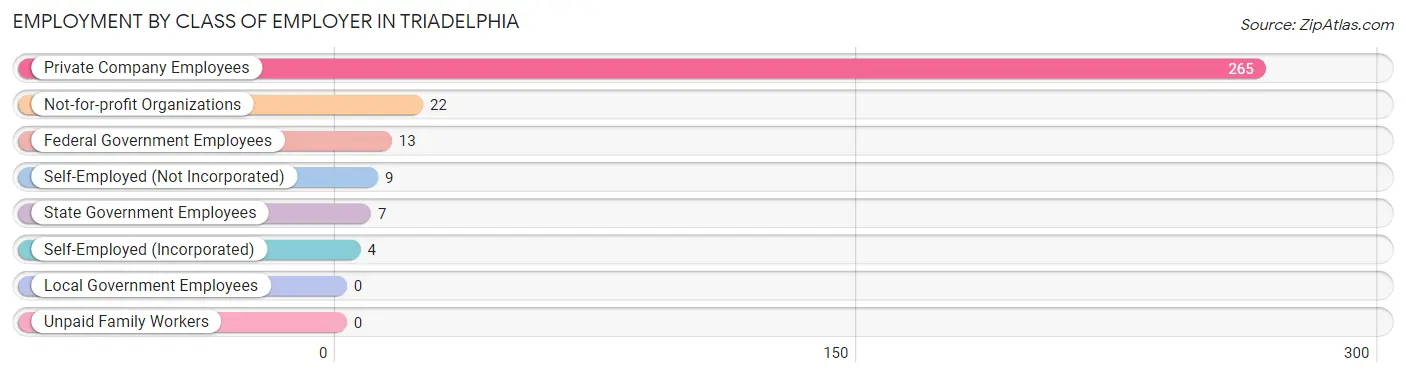
| Employer Class | # Employees | % Employees |
| Private Company Employees | 265 | 82.8% |
| Self-Employed (Incorporated) | 4 | 1.3% |
| Self-Employed (Not Incorporated) | 9 | 2.8% |
| Not-for-profit Organizations | 22 | 6.9% |
| Local Government Employees | 0 | 0.0% |
| State Government Employees | 7 | 2.2% |
| Federal Government Employees | 13 | 4.1% |
| Unpaid Family Workers | 0 | 0.0% |
| Total | 320 | 100.0% |
Employment Status by Age in Triadelphia
According to the labor force statistics for Triadelphia, out of the total population over 16 years of age (679), 50.7% or 344 individuals are in the labor force, with 7.0% or 24 of them unemployed. The age group with the highest labor force participation rate is 25 to 29 years, with 100.0% or 42 individuals in the labor force. Within the labor force, the 20 to 24 years age range has the highest percentage of unemployed individuals, with 26.4% or 14 of them being unemployed.
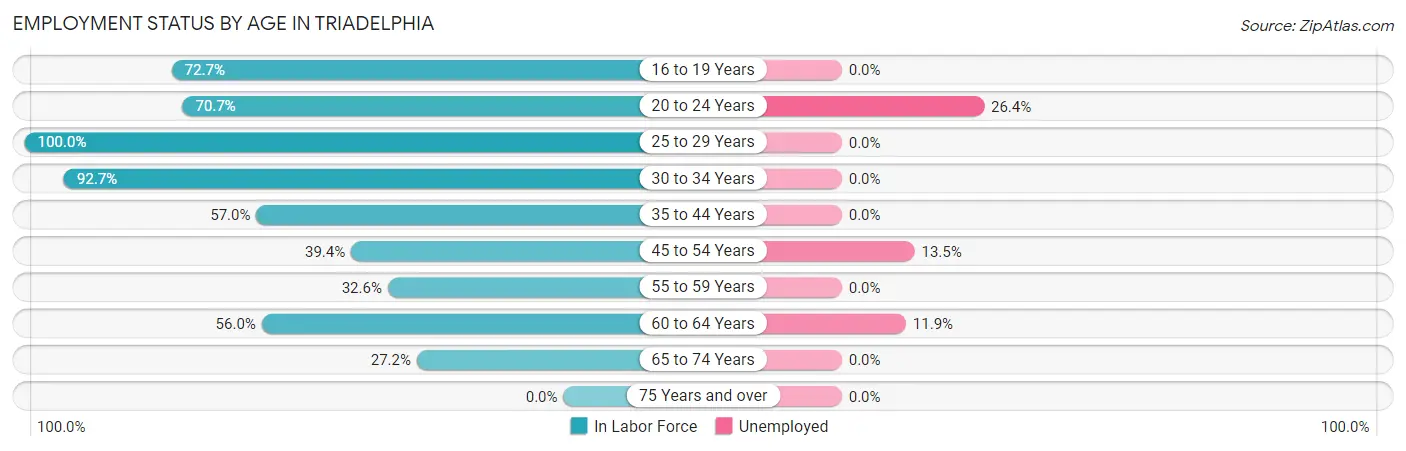
| Age Bracket | In Labor Force | Unemployed |
| 16 to 19 Years | 8 (72.7%) | 0 (0.0%) |
| 20 to 24 Years | 53 (70.7%) | 14 (26.4%) |
| 25 to 29 Years | 42 (100.0%) | 0 (0.0%) |
| 30 to 34 Years | 51 (92.7%) | 0 (0.0%) |
| 35 to 44 Years | 65 (57.0%) | 0 (0.0%) |
| 45 to 54 Years | 37 (39.4%) | 5 (13.5%) |
| 55 to 59 Years | 15 (32.6%) | 0 (0.0%) |
| 60 to 64 Years | 42 (56.0%) | 5 (11.9%) |
| 65 to 74 Years | 31 (27.2%) | 0 (0.0%) |
| 75 Years and over | 0 (0.0%) | 0 (0.0%) |
| Total | 344 (50.7%) | 24 (7.0%) |
Employment Status by Educational Attainment in Triadelphia
According to labor force statistics for Triadelphia, 59.2% of individuals (252) out of the total population between 25 and 64 years of age (426) are in the labor force, with 4.0% or 10 of them being unemployed. The group with the highest labor force participation rate are those with the educational attainment of bachelor's degree or higher, with 86.4% or 51 individuals in the labor force. Within the labor force, individuals with high school diploma education have the highest percentage of unemployment, with 16.4% or 10 of them being unemployed.
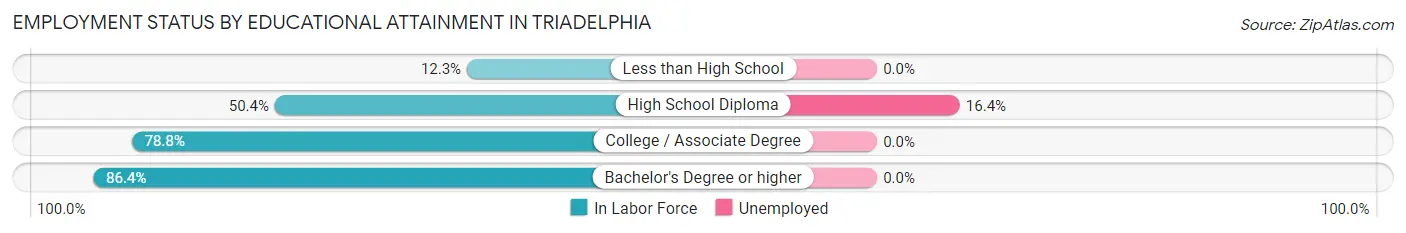
| Educational Attainment | In Labor Force | Unemployed |
| Less than High School | 10 (12.3%) | 0 (0.0%) |
| High School Diploma | 61 (50.4%) | 20 (16.4%) |
| College / Associate Degree | 130 (78.8%) | 0 (0.0%) |
| Bachelor's Degree or higher | 51 (86.4%) | 0 (0.0%) |
| Total | 252 (59.2%) | 17 (4.0%) |
Employment Occupations by Sex in Triadelphia
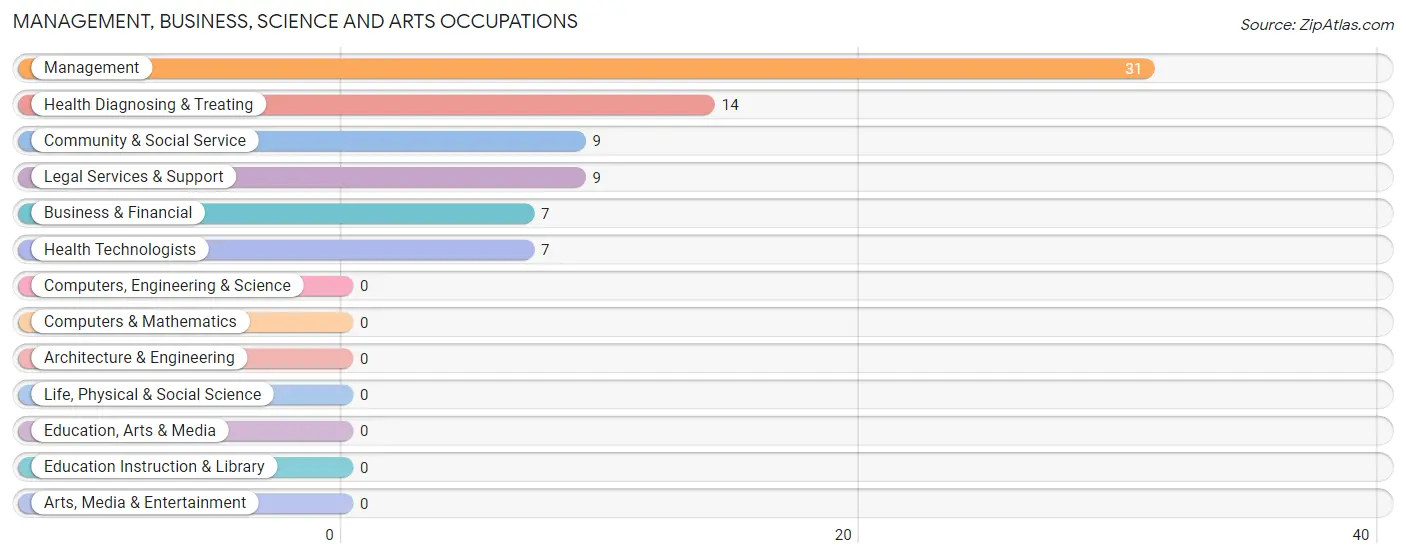
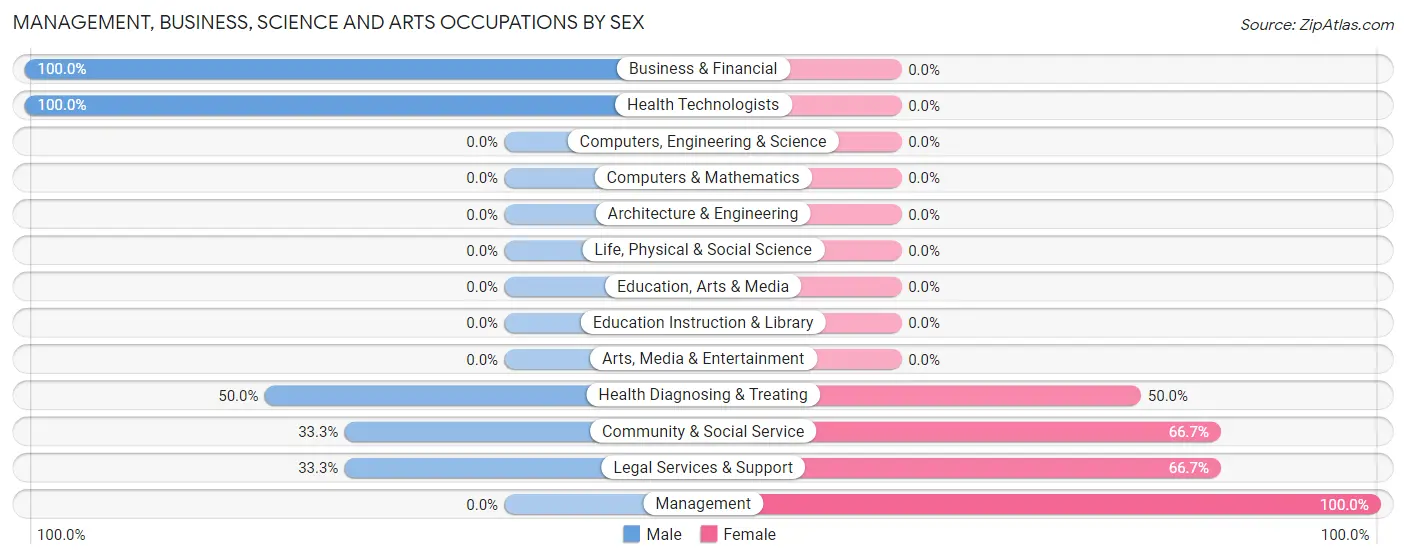
Management, Business, Science and Arts Occupations
The most common Management, Business, Science and Arts occupations in Triadelphia are Management (31 | 9.7%), Health Diagnosing & Treating (14 | 4.4%), Community & Social Service (9 | 2.8%), Legal Services & Support (9 | 2.8%), and Business & Financial (7 | 2.2%).
Management, Business, Science and Arts Occupations by Sex
Within the Management, Business, Science and Arts occupations in Triadelphia, the most male-oriented occupations are Business & Financial (100.0%), Health Technologists (100.0%), and Health Diagnosing & Treating (50.0%), while the most female-oriented occupations are Management (100.0%), Community & Social Service (66.7%), and Legal Services & Support (66.7%).
| Occupation | Male | Female |
| Management | 0 (0.0%) | 31 (100.0%) |
| Business & Financial | 7 (100.0%) | 0 (0.0%) |
| Computers, Engineering & Science | 0 (0.0%) | 0 (0.0%) |
| Computers & Mathematics | 0 (0.0%) | 0 (0.0%) |
| Architecture & Engineering | 0 (0.0%) | 0 (0.0%) |
| Life, Physical & Social Science | 0 (0.0%) | 0 (0.0%) |
| Community & Social Service | 3 (33.3%) | 6 (66.7%) |
| Education, Arts & Media | 0 (0.0%) | 0 (0.0%) |
| Legal Services & Support | 3 (33.3%) | 6 (66.7%) |
| Education Instruction & Library | 0 (0.0%) | 0 (0.0%) |
| Arts, Media & Entertainment | 0 (0.0%) | 0 (0.0%) |
| Health Diagnosing & Treating | 7 (50.0%) | 7 (50.0%) |
| Health Technologists | 7 (100.0%) | 0 (0.0%) |
| Total (Category) | 17 (27.9%) | 44 (72.1%) |
| Total (Overall) | 152 (47.5%) | 168 (52.5%) |
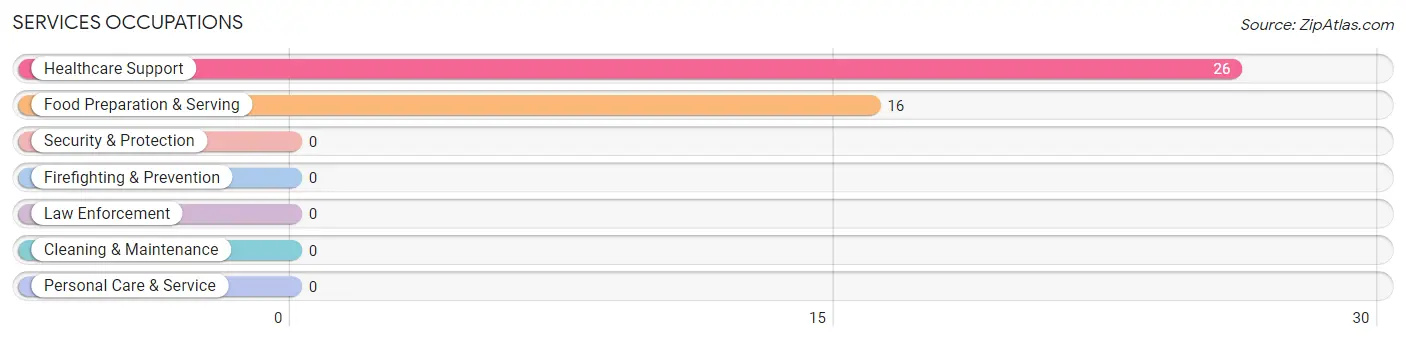
Services Occupations
The most common Services occupations in Triadelphia are Healthcare Support (26 | 8.1%), and Food Preparation & Serving (16 | 5.0%).
Services Occupations by Sex
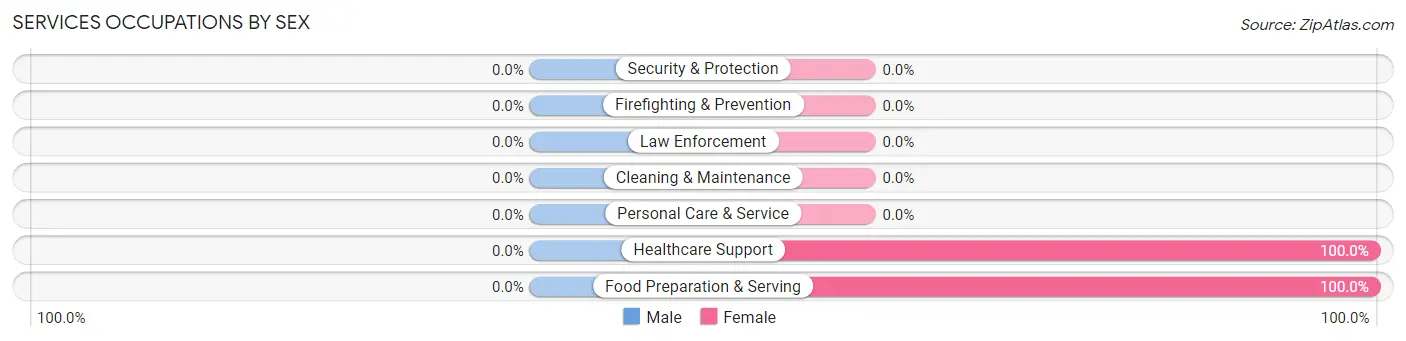
| Occupation | Male | Female |
| Healthcare Support | 0 (0.0%) | 26 (100.0%) |
| Security & Protection | 0 (0.0%) | 0 (0.0%) |
| Firefighting & Prevention | 0 (0.0%) | 0 (0.0%) |
| Law Enforcement | 0 (0.0%) | 0 (0.0%) |
| Food Preparation & Serving | 0 (0.0%) | 16 (100.0%) |
| Cleaning & Maintenance | 0 (0.0%) | 0 (0.0%) |
| Personal Care & Service | 0 (0.0%) | 0 (0.0%) |
| Total (Category) | 0 (0.0%) | 42 (100.0%) |
| Total (Overall) | 152 (47.5%) | 168 (52.5%) |
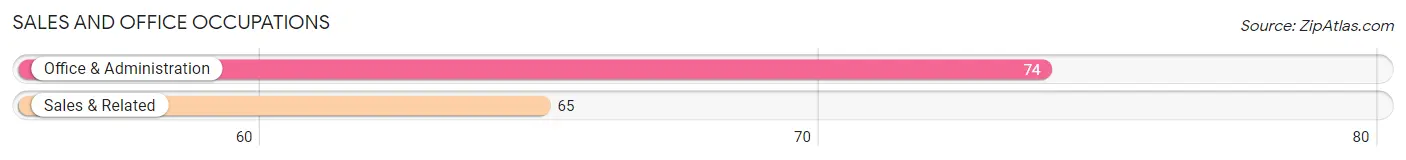
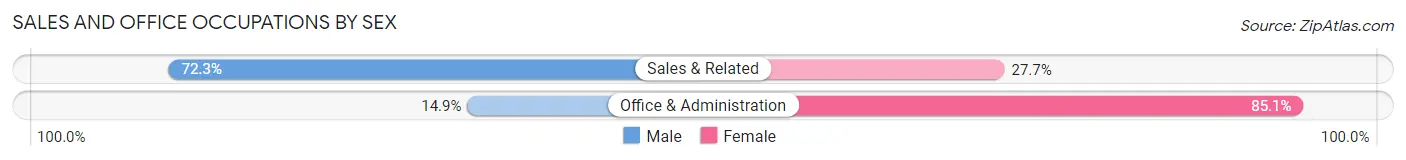
Sales and Office Occupations
The most common Sales and Office occupations in Triadelphia are Office & Administration (74 | 23.1%), and Sales & Related (65 | 20.3%).
Sales and Office Occupations by Sex
| Occupation | Male | Female |
| Sales & Related | 47 (72.3%) | 18 (27.7%) |
| Office & Administration | 11 (14.9%) | 63 (85.1%) |
| Total (Category) | 58 (41.7%) | 81 (58.3%) |
| Total (Overall) | 152 (47.5%) | 168 (52.5%) |
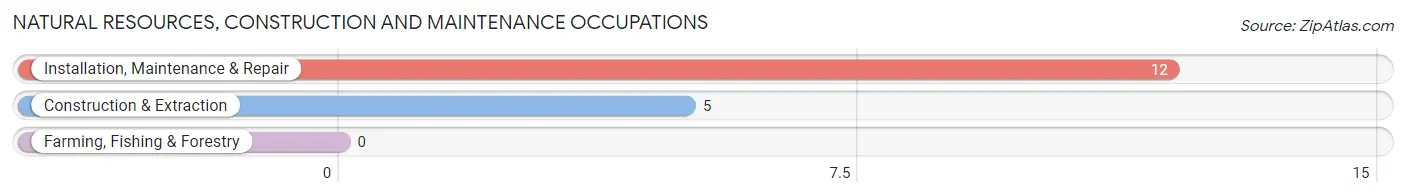
Natural Resources, Construction and Maintenance Occupations
The most common Natural Resources, Construction and Maintenance occupations in Triadelphia are Installation, Maintenance & Repair (12 | 3.7%), and Construction & Extraction (5 | 1.6%).
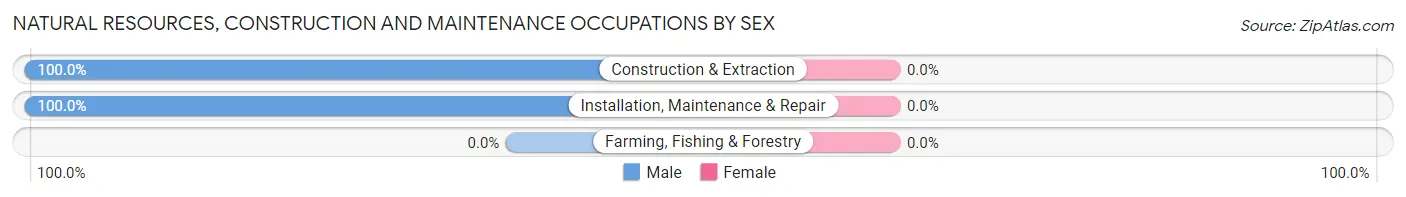
Natural Resources, Construction and Maintenance Occupations by Sex
| Occupation | Male | Female |
| Farming, Fishing & Forestry | 0 (0.0%) | 0 (0.0%) |
| Construction & Extraction | 5 (100.0%) | 0 (0.0%) |
| Installation, Maintenance & Repair | 12 (100.0%) | 0 (0.0%) |
| Total (Category) | 17 (100.0%) | 0 (0.0%) |
| Total (Overall) | 152 (47.5%) | 168 (52.5%) |
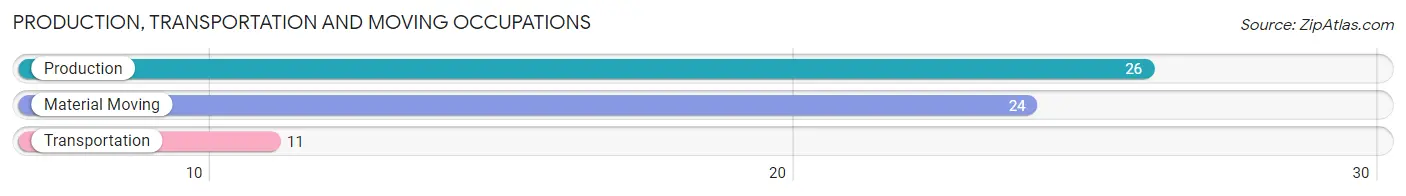
Production, Transportation and Moving Occupations
The most common Production, Transportation and Moving occupations in Triadelphia are Production (26 | 8.1%), Material Moving (24 | 7.5%), and Transportation (11 | 3.4%).
Production, Transportation and Moving Occupations by Sex
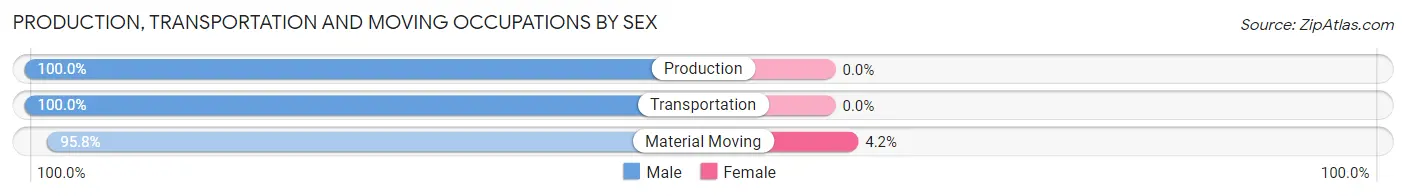
| Occupation | Male | Female |
| Production | 26 (100.0%) | 0 (0.0%) |
| Transportation | 11 (100.0%) | 0 (0.0%) |
| Material Moving | 23 (95.8%) | 1 (4.2%) |
| Total (Category) | 60 (98.4%) | 1 (1.6%) |
| Total (Overall) | 152 (47.5%) | 168 (52.5%) |
Employment Industries by Sex in Triadelphia
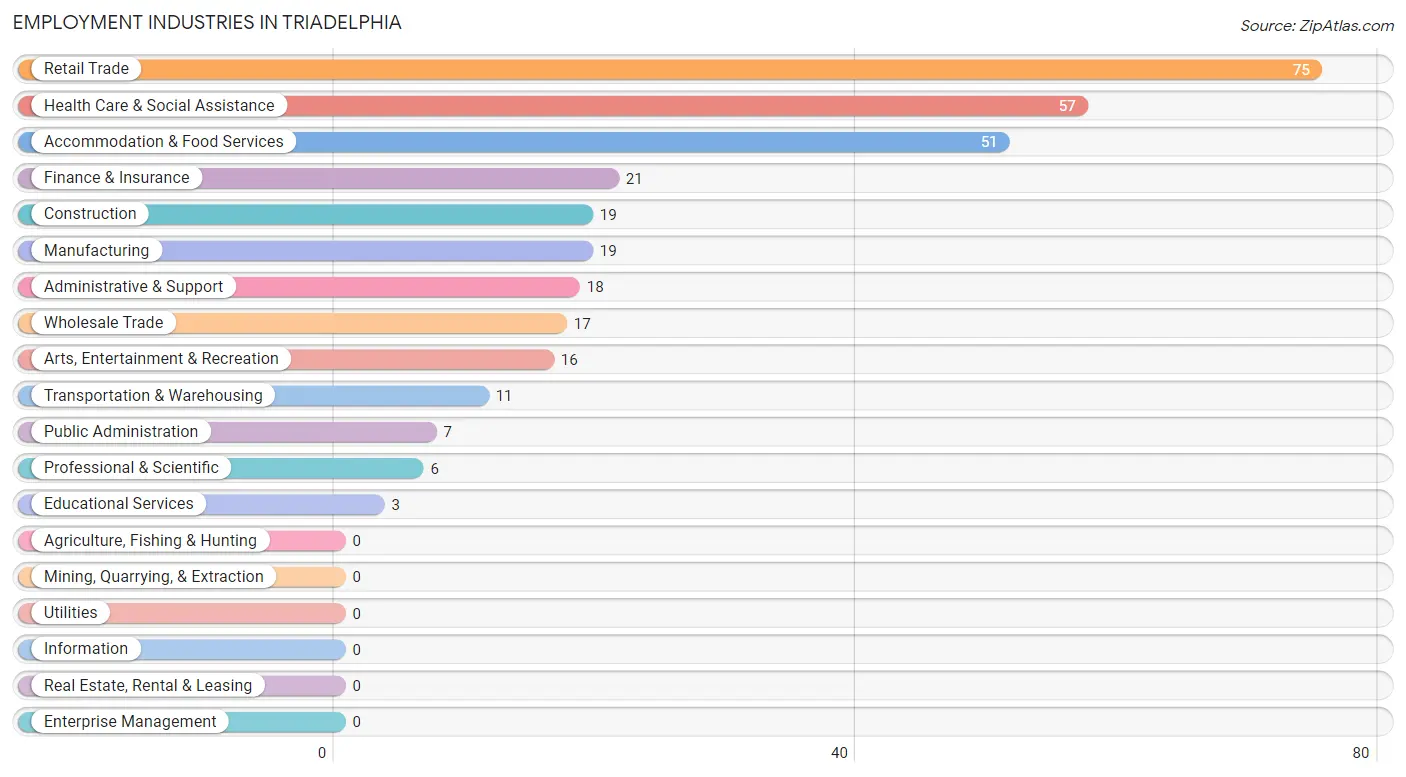
Employment Industries in Triadelphia
The major employment industries in Triadelphia include Retail Trade (75 | 23.4%), Health Care & Social Assistance (57 | 17.8%), Accommodation & Food Services (51 | 15.9%), Finance & Insurance (21 | 6.6%), and Construction (19 | 5.9%).
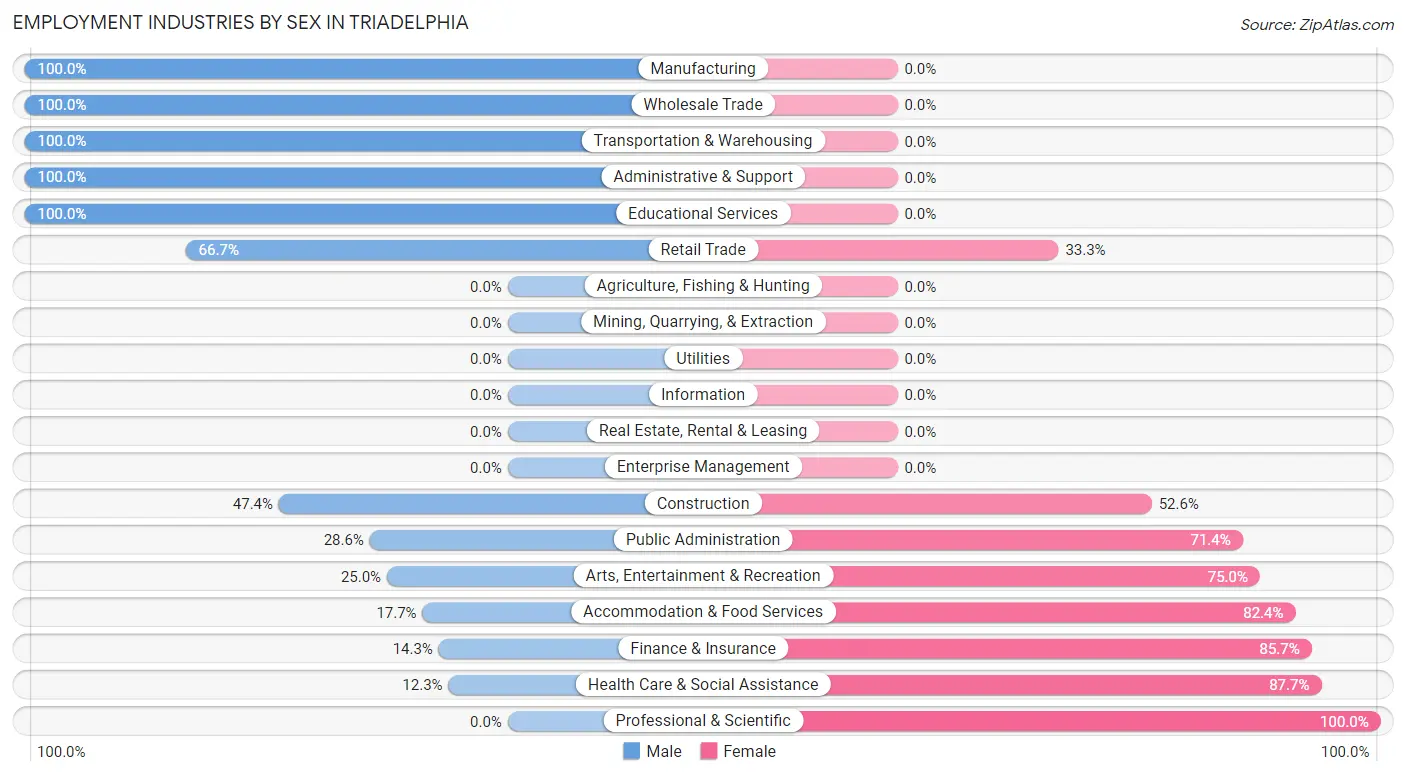
Employment Industries by Sex in Triadelphia
The Triadelphia industries that see more men than women are Manufacturing (100.0%), Wholesale Trade (100.0%), and Transportation & Warehousing (100.0%), whereas the industries that tend to have a higher number of women are Professional & Scientific (100.0%), Health Care & Social Assistance (87.7%), and Finance & Insurance (85.7%).
| Industry | Male | Female |
| Agriculture, Fishing & Hunting | 0 (0.0%) | 0 (0.0%) |
| Mining, Quarrying, & Extraction | 0 (0.0%) | 0 (0.0%) |
| Construction | 9 (47.4%) | 10 (52.6%) |
| Manufacturing | 19 (100.0%) | 0 (0.0%) |
| Wholesale Trade | 17 (100.0%) | 0 (0.0%) |
| Retail Trade | 50 (66.7%) | 25 (33.3%) |
| Transportation & Warehousing | 11 (100.0%) | 0 (0.0%) |
| Utilities | 0 (0.0%) | 0 (0.0%) |
| Information | 0 (0.0%) | 0 (0.0%) |
| Finance & Insurance | 3 (14.3%) | 18 (85.7%) |
| Real Estate, Rental & Leasing | 0 (0.0%) | 0 (0.0%) |
| Professional & Scientific | 0 (0.0%) | 6 (100.0%) |
| Enterprise Management | 0 (0.0%) | 0 (0.0%) |
| Administrative & Support | 18 (100.0%) | 0 (0.0%) |
| Educational Services | 3 (100.0%) | 0 (0.0%) |
| Health Care & Social Assistance | 7 (12.3%) | 50 (87.7%) |
| Arts, Entertainment & Recreation | 4 (25.0%) | 12 (75.0%) |
| Accommodation & Food Services | 9 (17.6%) | 42 (82.4%) |
| Public Administration | 2 (28.6%) | 5 (71.4%) |
| Total | 152 (47.5%) | 168 (52.5%) |
Education in Triadelphia
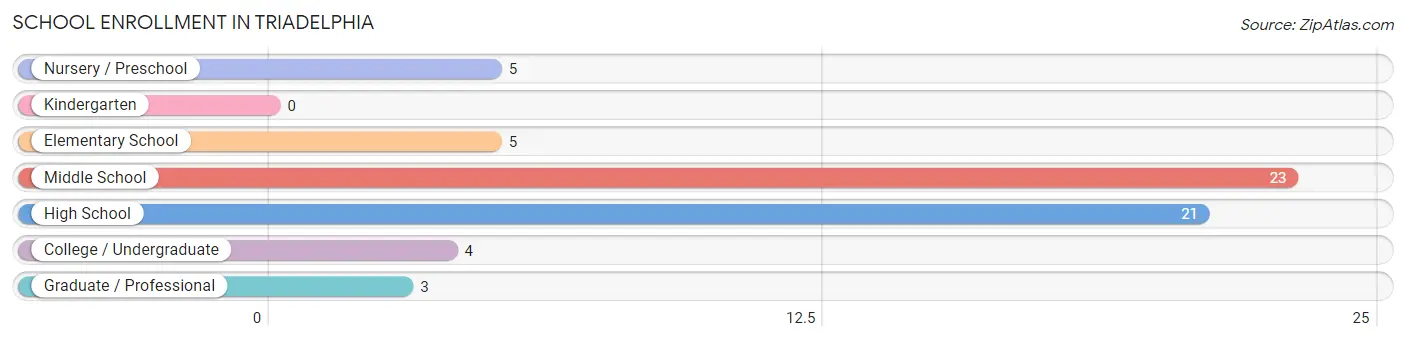
School Enrollment in Triadelphia
The most common levels of schooling among the 61 students in Triadelphia are middle school (23 | 37.7%), high school (21 | 34.4%), and nursery / preschool (5 | 8.2%).
| School Level | # Students | % Students |
| Nursery / Preschool | 5 | 8.2% |
| Kindergarten | 0 | 0.0% |
| Elementary School | 5 | 8.2% |
| Middle School | 23 | 37.7% |
| High School | 21 | 34.4% |
| College / Undergraduate | 4 | 6.6% |
| Graduate / Professional | 3 | 4.9% |
| Total | 61 | 100.0% |
School Enrollment by Age by Funding Source in Triadelphia
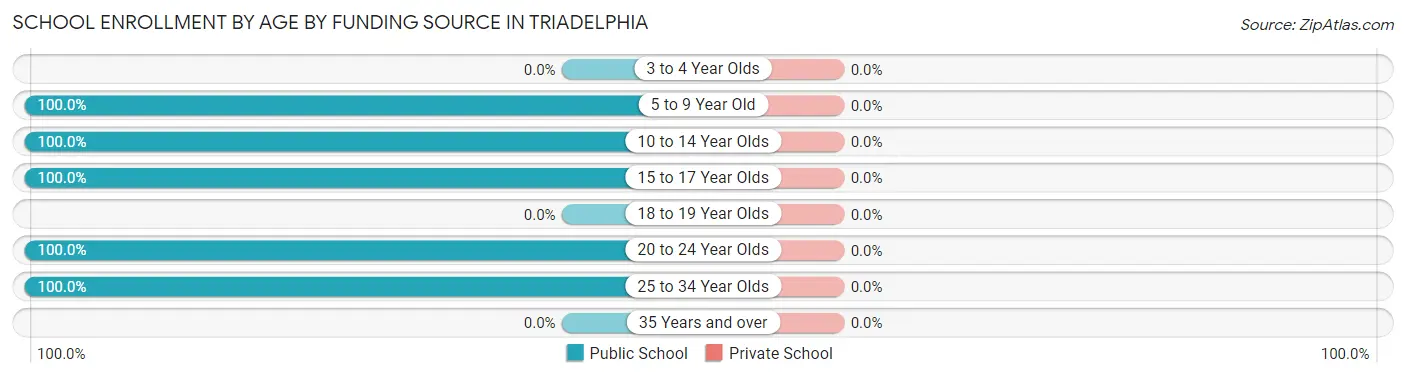
| Age Bracket | Public School | Private School |
| 3 to 4 Year Olds | 0 (0.0%) | 0 (0.0%) |
| 5 to 9 Year Old | 10 (100.0%) | 0 (0.0%) |
| 10 to 14 Year Olds | 23 (100.0%) | 0 (0.0%) |
| 15 to 17 Year Olds | 21 (100.0%) | 0 (0.0%) |
| 18 to 19 Year Olds | 0 (0.0%) | 0 (0.0%) |
| 20 to 24 Year Olds | 4 (100.0%) | 0 (0.0%) |
| 25 to 34 Year Olds | 3 (100.0%) | 0 (0.0%) |
| 35 Years and over | 0 (0.0%) | 0 (0.0%) |
| Total | 61 (100.0%) | 0 (0.0%) |
Educational Attainment by Field of Study in Triadelphia
Science & technology (28 | 24.3%), social sciences (23 | 20.0%), business (21 | 18.3%), education (18 | 15.7%), and bio, nature & agricultural (5 | 4.3%) are the most common fields of study among 115 individuals in Triadelphia who have obtained a bachelor's degree or higher.
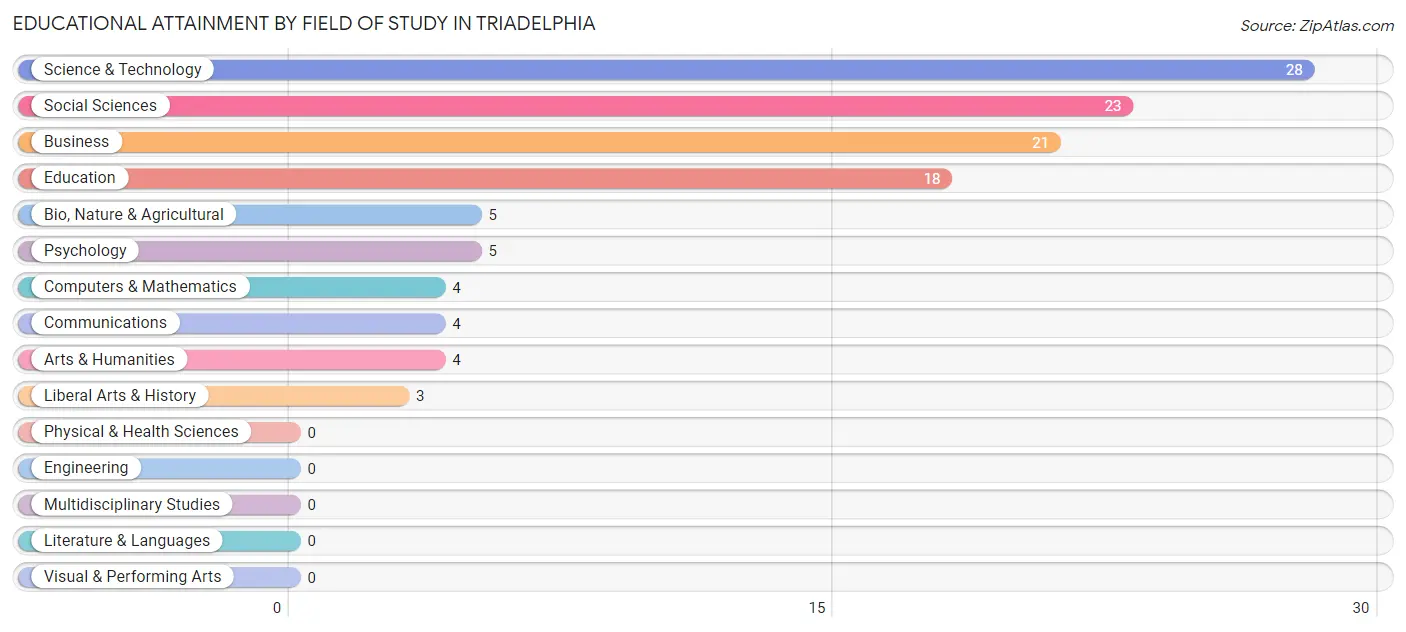
| Field of Study | # Graduates | % Graduates |
| Computers & Mathematics | 4 | 3.5% |
| Bio, Nature & Agricultural | 5 | 4.3% |
| Physical & Health Sciences | 0 | 0.0% |
| Psychology | 5 | 4.3% |
| Social Sciences | 23 | 20.0% |
| Engineering | 0 | 0.0% |
| Multidisciplinary Studies | 0 | 0.0% |
| Science & Technology | 28 | 24.3% |
| Business | 21 | 18.3% |
| Education | 18 | 15.7% |
| Literature & Languages | 0 | 0.0% |
| Liberal Arts & History | 3 | 2.6% |
| Visual & Performing Arts | 0 | 0.0% |
| Communications | 4 | 3.5% |
| Arts & Humanities | 4 | 3.5% |
| Total | 115 | 100.0% |
Transportation & Commute in Triadelphia
Vehicle Availability by Sex in Triadelphia
The most prevalent vehicle ownership categories in Triadelphia are males with 2 vehicles (77, accounting for 50.7%) and females with 2 vehicles (88, making up 45.8%).
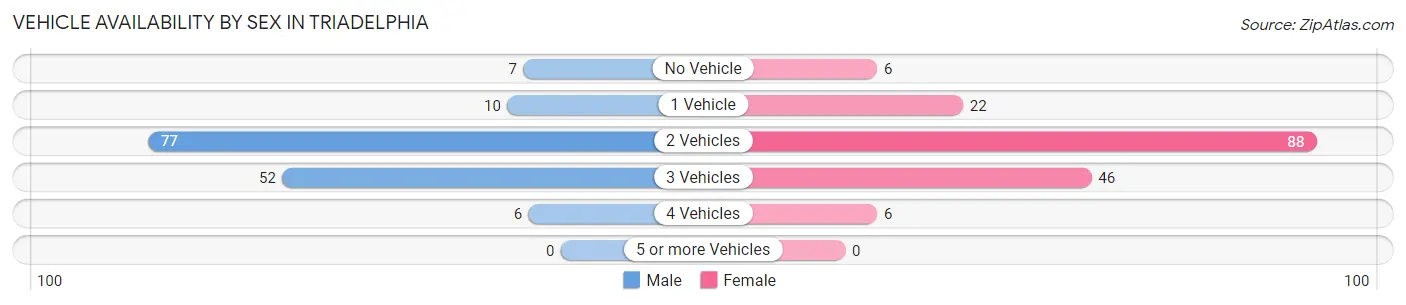
| Vehicles Available | Male | Female |
| No Vehicle | 7 (4.6%) | 6 (3.6%) |
| 1 Vehicle | 10 (6.6%) | 22 (13.1%) |
| 2 Vehicles | 77 (50.7%) | 88 (52.4%) |
| 3 Vehicles | 52 (34.2%) | 46 (27.4%) |
| 4 Vehicles | 6 (4.0%) | 6 (3.6%) |
| 5 or more Vehicles | 0 (0.0%) | 0 (0.0%) |
| Total | 152 (100.0%) | 168 (100.0%) |
Commute Time in Triadelphia
The most frequently occuring commute durations in Triadelphia are 10 to 14 minutes (79 commuters, 25.4%), 5 to 9 minutes (55 commuters, 17.7%), and 15 to 19 minutes (47 commuters, 15.1%).
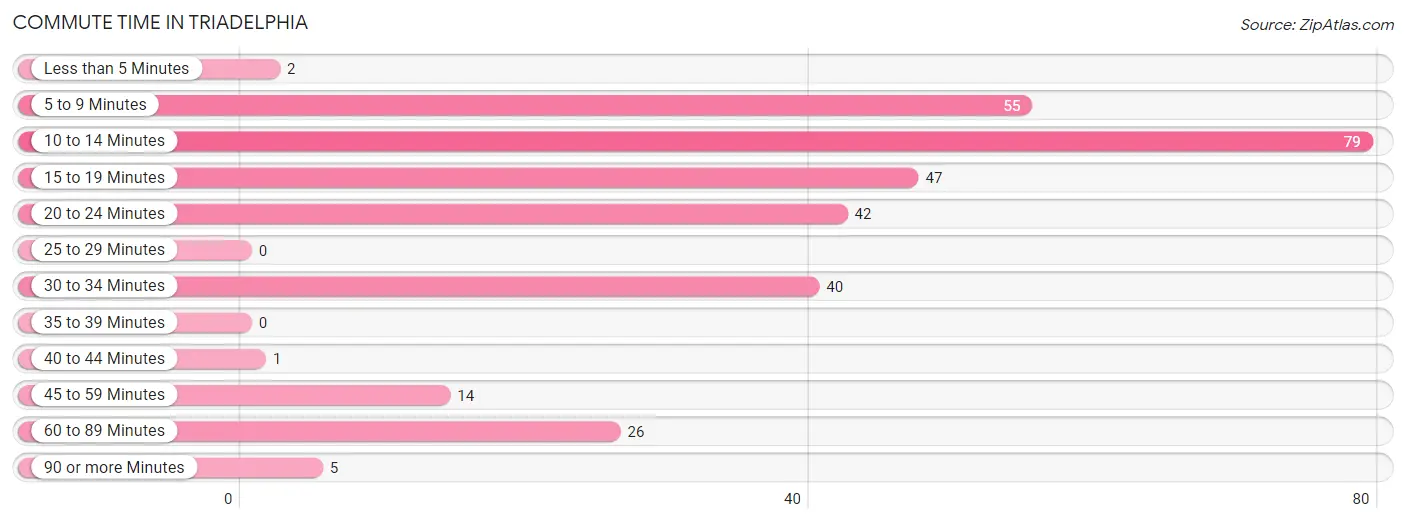
| Commute Time | # Commuters | % Commuters |
| Less than 5 Minutes | 2 | 0.6% |
| 5 to 9 Minutes | 55 | 17.7% |
| 10 to 14 Minutes | 79 | 25.4% |
| 15 to 19 Minutes | 47 | 15.1% |
| 20 to 24 Minutes | 42 | 13.5% |
| 25 to 29 Minutes | 0 | 0.0% |
| 30 to 34 Minutes | 40 | 12.9% |
| 35 to 39 Minutes | 0 | 0.0% |
| 40 to 44 Minutes | 1 | 0.3% |
| 45 to 59 Minutes | 14 | 4.5% |
| 60 to 89 Minutes | 26 | 8.4% |
| 90 or more Minutes | 5 | 1.6% |
Commute Time by Sex in Triadelphia
The most common commute times in Triadelphia are 5 to 9 minutes (29 commuters, 19.7%) for males and 10 to 14 minutes (52 commuters, 31.7%) for females.
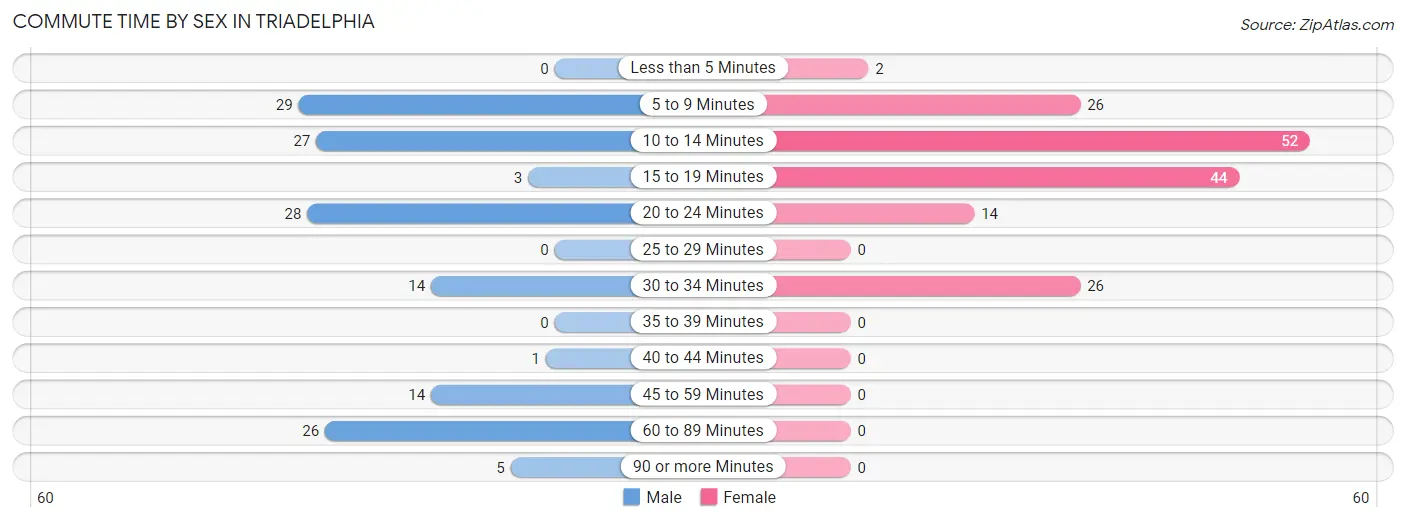
| Commute Time | Male | Female |
| Less than 5 Minutes | 0 (0.0%) | 2 (1.2%) |
| 5 to 9 Minutes | 29 (19.7%) | 26 (15.9%) |
| 10 to 14 Minutes | 27 (18.4%) | 52 (31.7%) |
| 15 to 19 Minutes | 3 (2.0%) | 44 (26.8%) |
| 20 to 24 Minutes | 28 (19.1%) | 14 (8.5%) |
| 25 to 29 Minutes | 0 (0.0%) | 0 (0.0%) |
| 30 to 34 Minutes | 14 (9.5%) | 26 (15.9%) |
| 35 to 39 Minutes | 0 (0.0%) | 0 (0.0%) |
| 40 to 44 Minutes | 1 (0.7%) | 0 (0.0%) |
| 45 to 59 Minutes | 14 (9.5%) | 0 (0.0%) |
| 60 to 89 Minutes | 26 (17.7%) | 0 (0.0%) |
| 90 or more Minutes | 5 (3.4%) | 0 (0.0%) |
Time of Departure to Work by Sex in Triadelphia
The most frequent times of departure to work in Triadelphia are 7:30 AM to 7:59 AM (31, 21.1%) for males and 7:30 AM to 7:59 AM (66, 40.2%) for females.
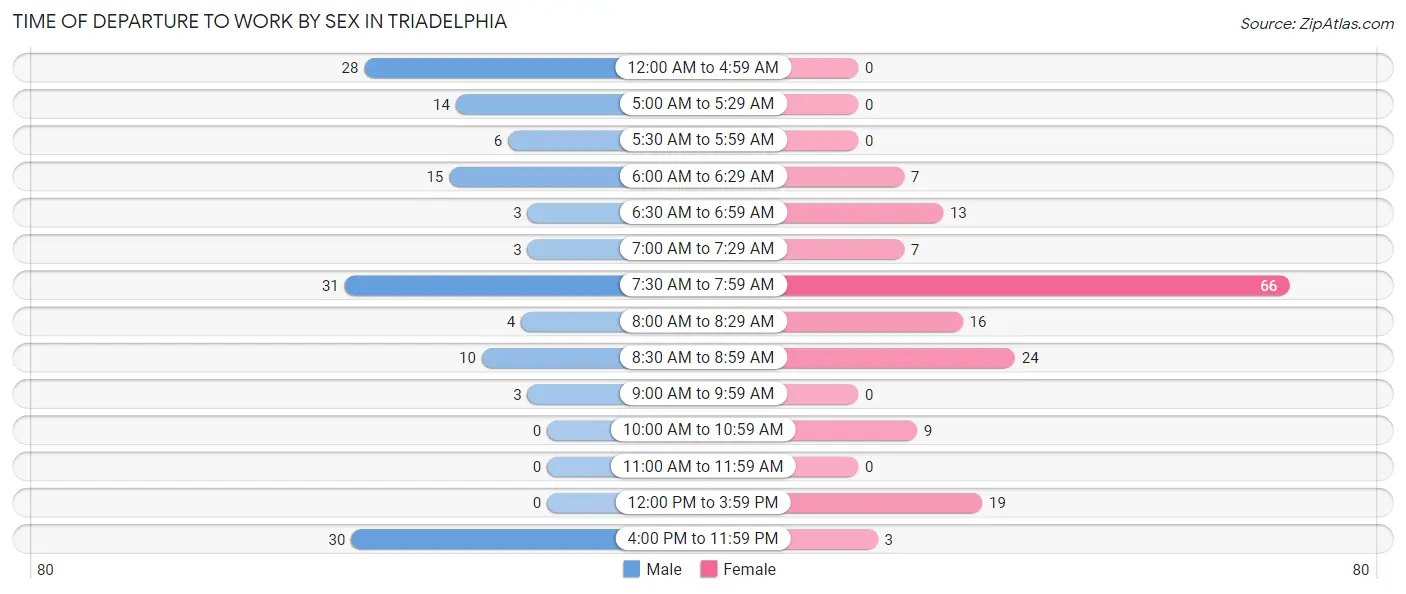
| Time of Departure | Male | Female |
| 12:00 AM to 4:59 AM | 28 (19.1%) | 0 (0.0%) |
| 5:00 AM to 5:29 AM | 14 (9.5%) | 0 (0.0%) |
| 5:30 AM to 5:59 AM | 6 (4.1%) | 0 (0.0%) |
| 6:00 AM to 6:29 AM | 15 (10.2%) | 7 (4.3%) |
| 6:30 AM to 6:59 AM | 3 (2.0%) | 13 (7.9%) |
| 7:00 AM to 7:29 AM | 3 (2.0%) | 7 (4.3%) |
| 7:30 AM to 7:59 AM | 31 (21.1%) | 66 (40.2%) |
| 8:00 AM to 8:29 AM | 4 (2.7%) | 16 (9.8%) |
| 8:30 AM to 8:59 AM | 10 (6.8%) | 24 (14.6%) |
| 9:00 AM to 9:59 AM | 3 (2.0%) | 0 (0.0%) |
| 10:00 AM to 10:59 AM | 0 (0.0%) | 9 (5.5%) |
| 11:00 AM to 11:59 AM | 0 (0.0%) | 0 (0.0%) |
| 12:00 PM to 3:59 PM | 0 (0.0%) | 19 (11.6%) |
| 4:00 PM to 11:59 PM | 30 (20.4%) | 3 (1.8%) |
| Total | 147 (100.0%) | 164 (100.0%) |
Housing Occupancy in Triadelphia
Occupancy by Ownership in Triadelphia
Of the total 331 dwellings in Triadelphia, owner-occupied units account for 236 (71.3%), while renter-occupied units make up 95 (28.7%).
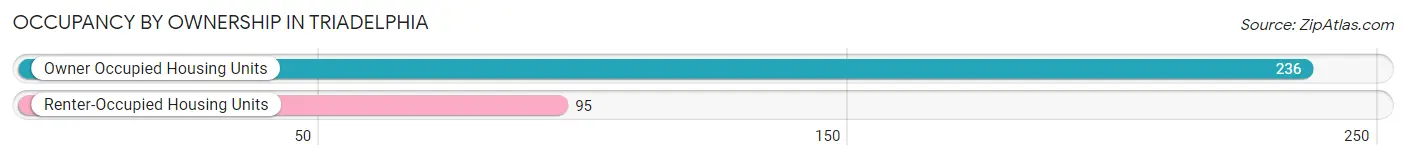
| Occupancy | # Housing Units | % Housing Units |
| Owner Occupied Housing Units | 236 | 71.3% |
| Renter-Occupied Housing Units | 95 | 28.7% |
| Total Occupied Housing Units | 331 | 100.0% |
Occupancy by Household Size in Triadelphia
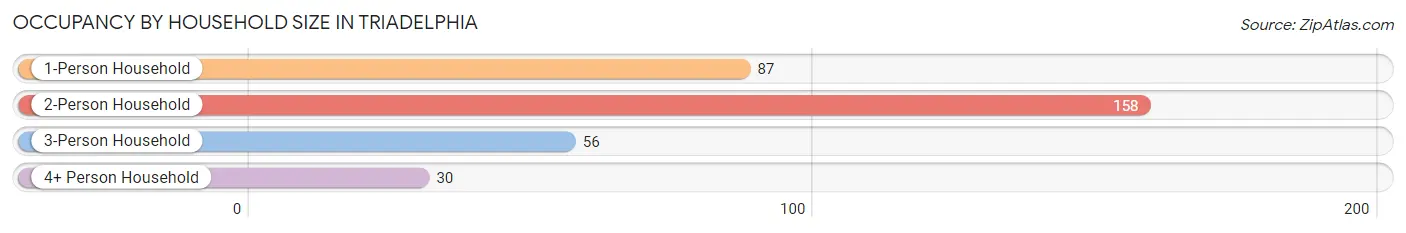
| Household Size | # Housing Units | % Housing Units |
| 1-Person Household | 87 | 26.3% |
| 2-Person Household | 158 | 47.7% |
| 3-Person Household | 56 | 16.9% |
| 4+ Person Household | 30 | 9.1% |
| Total Housing Units | 331 | 100.0% |
Occupancy by Ownership by Household Size in Triadelphia
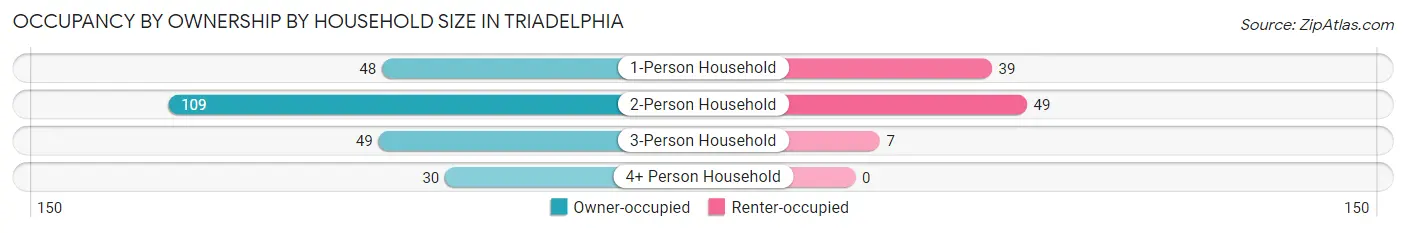
| Household Size | Owner-occupied | Renter-occupied |
| 1-Person Household | 48 (55.2%) | 39 (44.8%) |
| 2-Person Household | 109 (69.0%) | 49 (31.0%) |
| 3-Person Household | 49 (87.5%) | 7 (12.5%) |
| 4+ Person Household | 30 (100.0%) | 0 (0.0%) |
| Total Housing Units | 236 (71.3%) | 95 (28.7%) |
Occupancy by Educational Attainment in Triadelphia
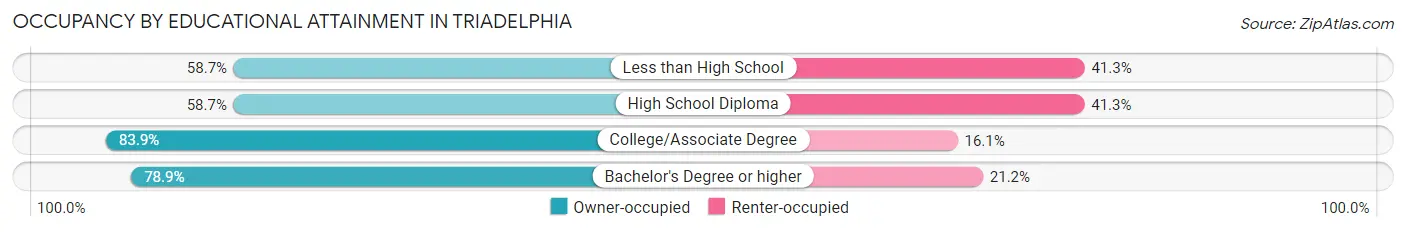
| Household Size | Owner-occupied | Renter-occupied |
| Less than High School | 54 (58.7%) | 38 (41.3%) |
| High School Diploma | 37 (58.7%) | 26 (41.3%) |
| College/Associate Degree | 104 (83.9%) | 20 (16.1%) |
| Bachelor's Degree or higher | 41 (78.8%) | 11 (21.1%) |
Occupancy by Age of Householder in Triadelphia
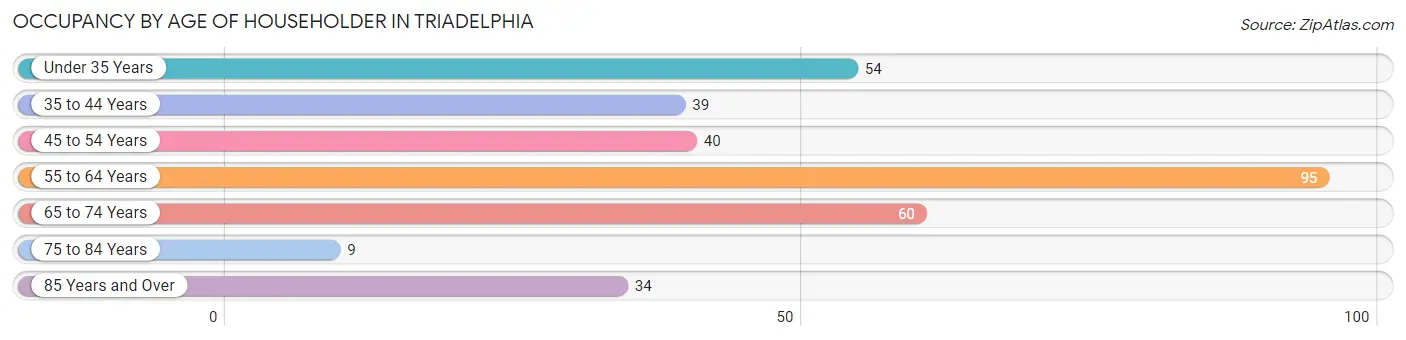
| Age Bracket | # Households | % Households |
| Under 35 Years | 54 | 16.3% |
| 35 to 44 Years | 39 | 11.8% |
| 45 to 54 Years | 40 | 12.1% |
| 55 to 64 Years | 95 | 28.7% |
| 65 to 74 Years | 60 | 18.1% |
| 75 to 84 Years | 9 | 2.7% |
| 85 Years and Over | 34 | 10.3% |
| Total | 331 | 100.0% |
Housing Finances in Triadelphia
Median Income by Occupancy in Triadelphia
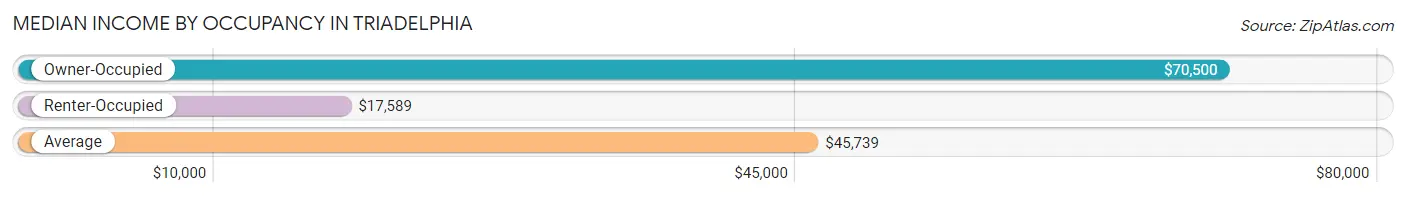
| Occupancy Type | # Households | Median Income |
| Owner-Occupied | 236 (71.3%) | $70,500 |
| Renter-Occupied | 95 (28.7%) | $17,589 |
| Average | 331 (100.0%) | $45,739 |
Occupancy by Householder Income Bracket in Triadelphia
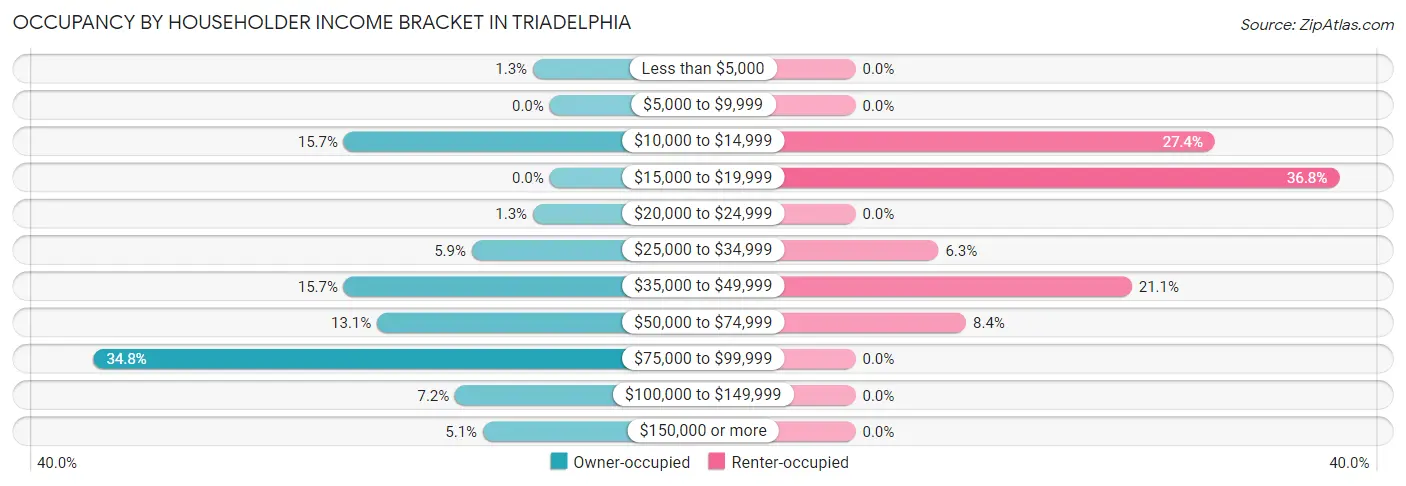
| Income Bracket | Owner-occupied | Renter-occupied |
| Less than $5,000 | 3 (1.3%) | 0 (0.0%) |
| $5,000 to $9,999 | 0 (0.0%) | 0 (0.0%) |
| $10,000 to $14,999 | 37 (15.7%) | 26 (27.4%) |
| $15,000 to $19,999 | 0 (0.0%) | 35 (36.8%) |
| $20,000 to $24,999 | 3 (1.3%) | 0 (0.0%) |
| $25,000 to $34,999 | 14 (5.9%) | 6 (6.3%) |
| $35,000 to $49,999 | 37 (15.7%) | 20 (21.0%) |
| $50,000 to $74,999 | 31 (13.1%) | 8 (8.4%) |
| $75,000 to $99,999 | 82 (34.7%) | 0 (0.0%) |
| $100,000 to $149,999 | 17 (7.2%) | 0 (0.0%) |
| $150,000 or more | 12 (5.1%) | 0 (0.0%) |
| Total | 236 (100.0%) | 95 (100.0%) |
Monthly Housing Cost Tiers in Triadelphia
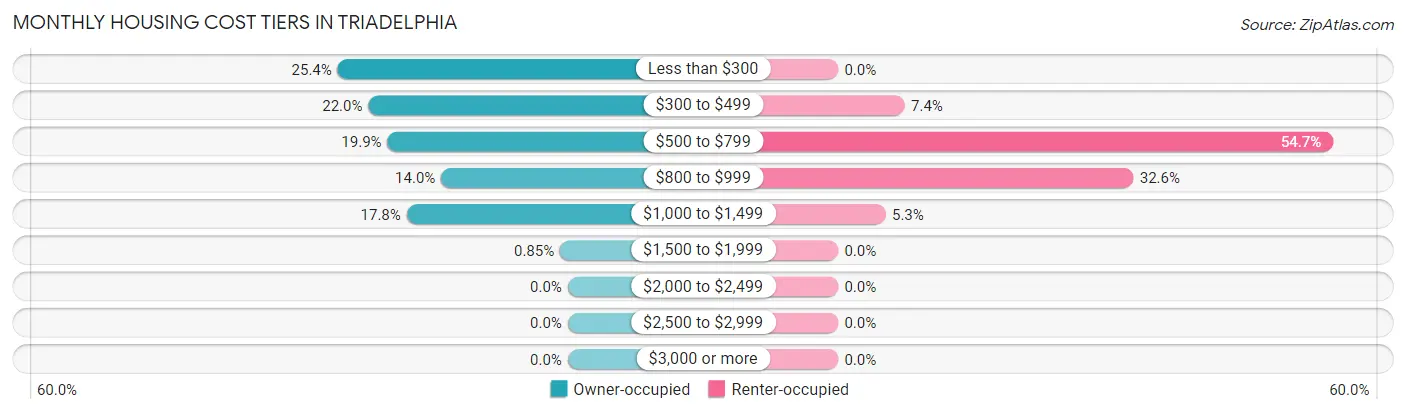
| Monthly Cost | Owner-occupied | Renter-occupied |
| Less than $300 | 60 (25.4%) | 0 (0.0%) |
| $300 to $499 | 52 (22.0%) | 7 (7.4%) |
| $500 to $799 | 47 (19.9%) | 52 (54.7%) |
| $800 to $999 | 33 (14.0%) | 31 (32.6%) |
| $1,000 to $1,499 | 42 (17.8%) | 5 (5.3%) |
| $1,500 to $1,999 | 2 (0.9%) | 0 (0.0%) |
| $2,000 to $2,499 | 0 (0.0%) | 0 (0.0%) |
| $2,500 to $2,999 | 0 (0.0%) | 0 (0.0%) |
| $3,000 or more | 0 (0.0%) | 0 (0.0%) |
| Total | 236 (100.0%) | 95 (100.0%) |
Physical Housing Characteristics in Triadelphia
Housing Structures in Triadelphia
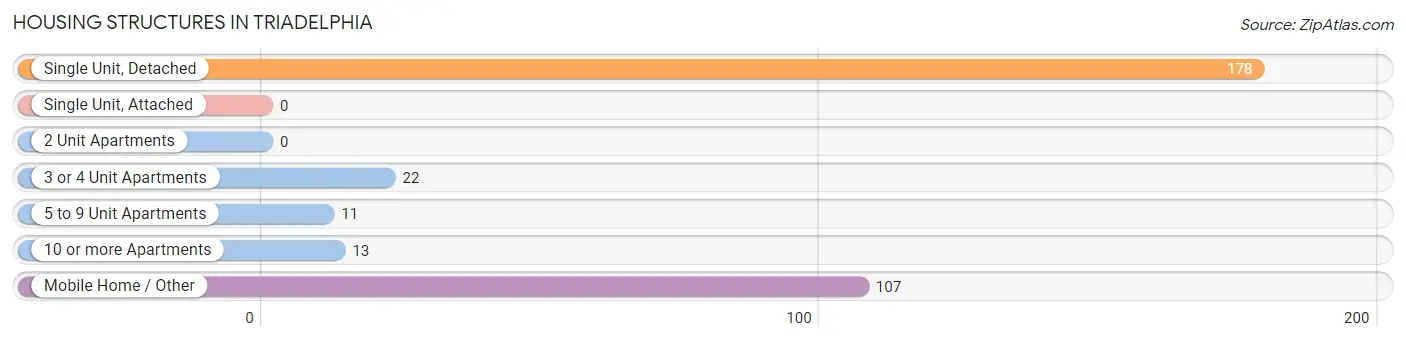
| Structure Type | # Housing Units | % Housing Units |
| Single Unit, Detached | 178 | 53.8% |
| Single Unit, Attached | 0 | 0.0% |
| 2 Unit Apartments | 0 | 0.0% |
| 3 or 4 Unit Apartments | 22 | 6.7% |
| 5 to 9 Unit Apartments | 11 | 3.3% |
| 10 or more Apartments | 13 | 3.9% |
| Mobile Home / Other | 107 | 32.3% |
| Total | 331 | 100.0% |
Housing Structures by Occupancy in Triadelphia
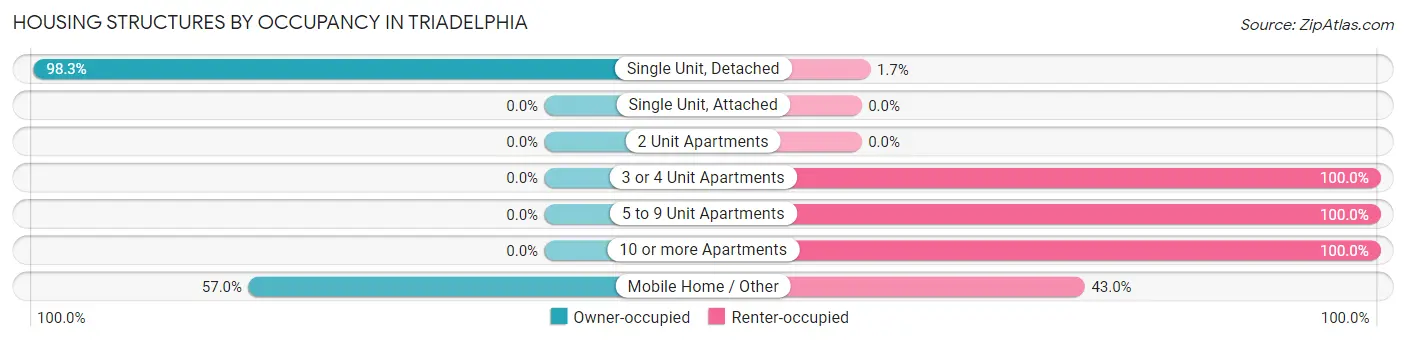
| Structure Type | Owner-occupied | Renter-occupied |
| Single Unit, Detached | 175 (98.3%) | 3 (1.7%) |
| Single Unit, Attached | 0 (0.0%) | 0 (0.0%) |
| 2 Unit Apartments | 0 (0.0%) | 0 (0.0%) |
| 3 or 4 Unit Apartments | 0 (0.0%) | 22 (100.0%) |
| 5 to 9 Unit Apartments | 0 (0.0%) | 11 (100.0%) |
| 10 or more Apartments | 0 (0.0%) | 13 (100.0%) |
| Mobile Home / Other | 61 (57.0%) | 46 (43.0%) |
| Total | 236 (71.3%) | 95 (28.7%) |
Housing Structures by Number of Rooms in Triadelphia
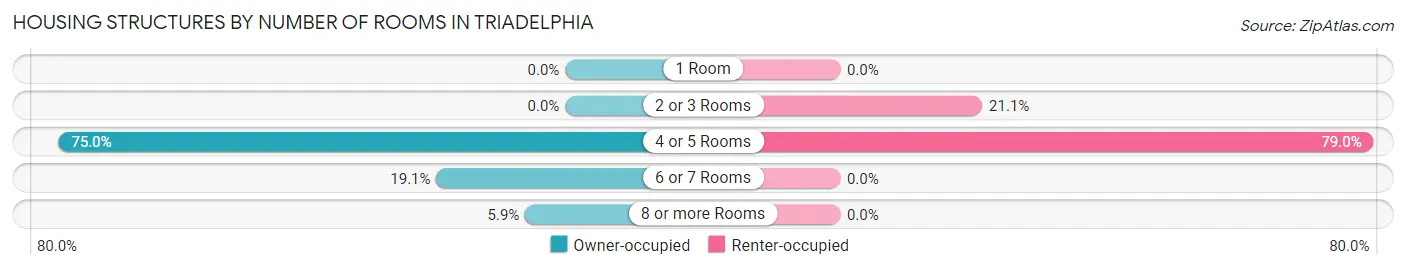
| Number of Rooms | Owner-occupied | Renter-occupied |
| 1 Room | 0 (0.0%) | 0 (0.0%) |
| 2 or 3 Rooms | 0 (0.0%) | 20 (21.0%) |
| 4 or 5 Rooms | 177 (75.0%) | 75 (78.9%) |
| 6 or 7 Rooms | 45 (19.1%) | 0 (0.0%) |
| 8 or more Rooms | 14 (5.9%) | 0 (0.0%) |
| Total | 236 (100.0%) | 95 (100.0%) |
Housing Structure by Heating Type in Triadelphia
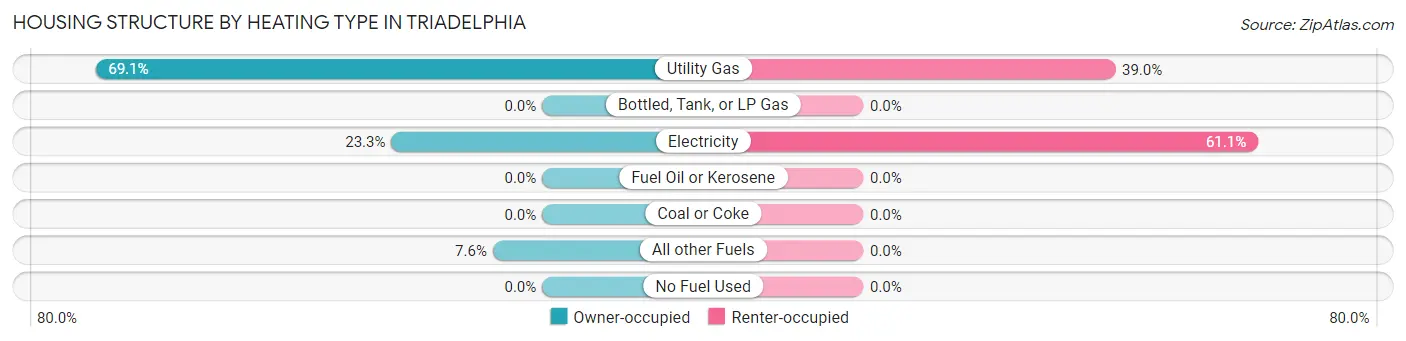
| Heating Type | Owner-occupied | Renter-occupied |
| Utility Gas | 163 (69.1%) | 37 (39.0%) |
| Bottled, Tank, or LP Gas | 0 (0.0%) | 0 (0.0%) |
| Electricity | 55 (23.3%) | 58 (61.1%) |
| Fuel Oil or Kerosene | 0 (0.0%) | 0 (0.0%) |
| Coal or Coke | 0 (0.0%) | 0 (0.0%) |
| All other Fuels | 18 (7.6%) | 0 (0.0%) |
| No Fuel Used | 0 (0.0%) | 0 (0.0%) |
| Total | 236 (100.0%) | 95 (100.0%) |
Household Vehicle Usage in Triadelphia
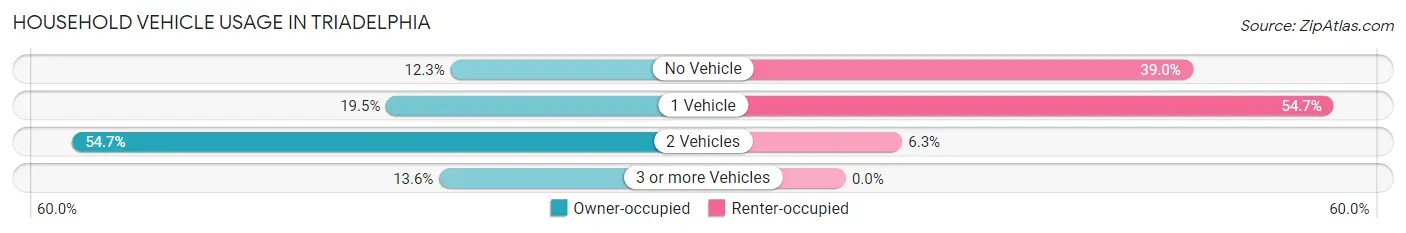
| Vehicles per Household | Owner-occupied | Renter-occupied |
| No Vehicle | 29 (12.3%) | 37 (39.0%) |
| 1 Vehicle | 46 (19.5%) | 52 (54.7%) |
| 2 Vehicles | 129 (54.7%) | 6 (6.3%) |
| 3 or more Vehicles | 32 (13.6%) | 0 (0.0%) |
| Total | 236 (100.0%) | 95 (100.0%) |
Real Estate & Mortgages in Triadelphia
Real Estate and Mortgage Overview in Triadelphia
| Characteristic | Without Mortgage | With Mortgage |
| Housing Units | 128 | 108 |
| Median Property Value | $45,400 | $103,900 |
| Median Household Income | $46,000 | $12 |
| Monthly Housing Costs | $352 | $0 |
| Real Estate Taxes | $350 | $10 |
Property Value by Mortgage Status in Triadelphia
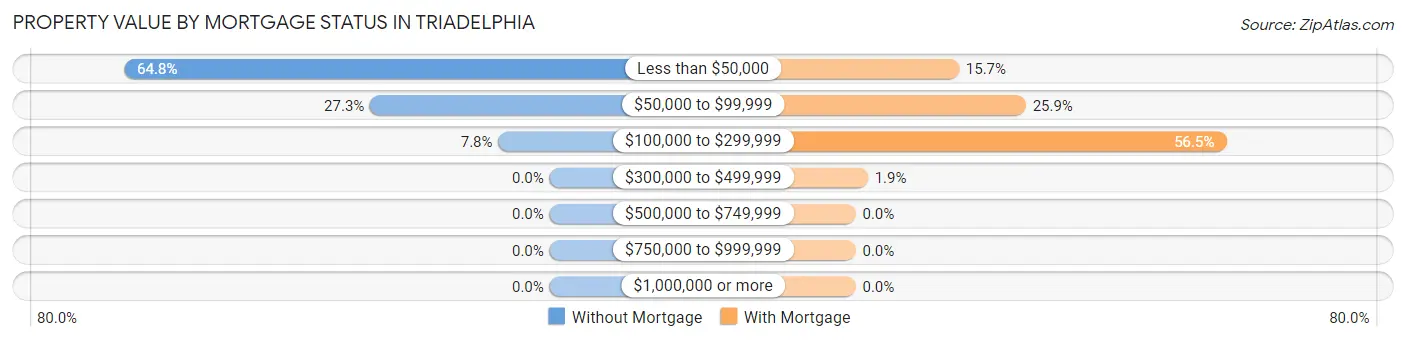
| Property Value | Without Mortgage | With Mortgage |
| Less than $50,000 | 83 (64.8%) | 17 (15.7%) |
| $50,000 to $99,999 | 35 (27.3%) | 28 (25.9%) |
| $100,000 to $299,999 | 10 (7.8%) | 61 (56.5%) |
| $300,000 to $499,999 | 0 (0.0%) | 2 (1.8%) |
| $500,000 to $749,999 | 0 (0.0%) | 0 (0.0%) |
| $750,000 to $999,999 | 0 (0.0%) | 0 (0.0%) |
| $1,000,000 or more | 0 (0.0%) | 0 (0.0%) |
| Total | 128 (100.0%) | 108 (100.0%) |
Household Income by Mortgage Status in Triadelphia
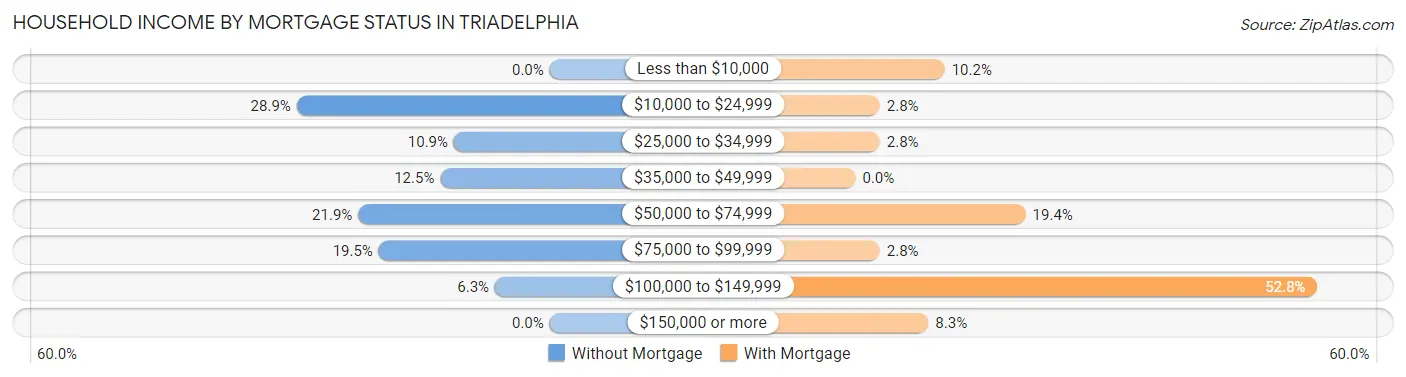
| Household Income | Without Mortgage | With Mortgage |
| Less than $10,000 | 0 (0.0%) | 11 (10.2%) |
| $10,000 to $24,999 | 37 (28.9%) | 3 (2.8%) |
| $25,000 to $34,999 | 14 (10.9%) | 3 (2.8%) |
| $35,000 to $49,999 | 16 (12.5%) | 0 (0.0%) |
| $50,000 to $74,999 | 28 (21.9%) | 21 (19.4%) |
| $75,000 to $99,999 | 25 (19.5%) | 3 (2.8%) |
| $100,000 to $149,999 | 8 (6.2%) | 57 (52.8%) |
| $150,000 or more | 0 (0.0%) | 9 (8.3%) |
| Total | 128 (100.0%) | 108 (100.0%) |
Property Value to Household Income Ratio in Triadelphia
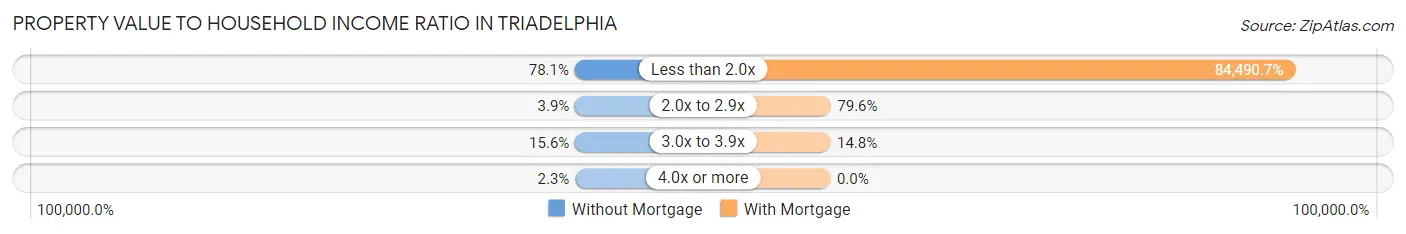
| Value-to-Income Ratio | Without Mortgage | With Mortgage |
| Less than 2.0x | 100 (78.1%) | 91,250 (84,490.7%) |
| 2.0x to 2.9x | 5 (3.9%) | 86 (79.6%) |
| 3.0x to 3.9x | 20 (15.6%) | 16 (14.8%) |
| 4.0x or more | 3 (2.3%) | 0 (0.0%) |
| Total | 128 (100.0%) | 108 (100.0%) |
Real Estate Taxes by Mortgage Status in Triadelphia
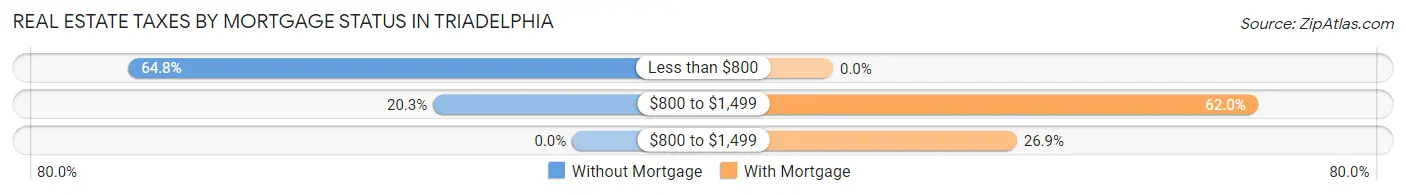
| Property Taxes | Without Mortgage | With Mortgage |
| Less than $800 | 83 (64.8%) | 0 (0.0%) |
| $800 to $1,499 | 26 (20.3%) | 67 (62.0%) |
| $800 to $1,499 | 0 (0.0%) | 29 (26.9%) |
| Total | 128 (100.0%) | 108 (100.0%) |
Health & Disability in Triadelphia
Health Insurance Coverage by Age in Triadelphia
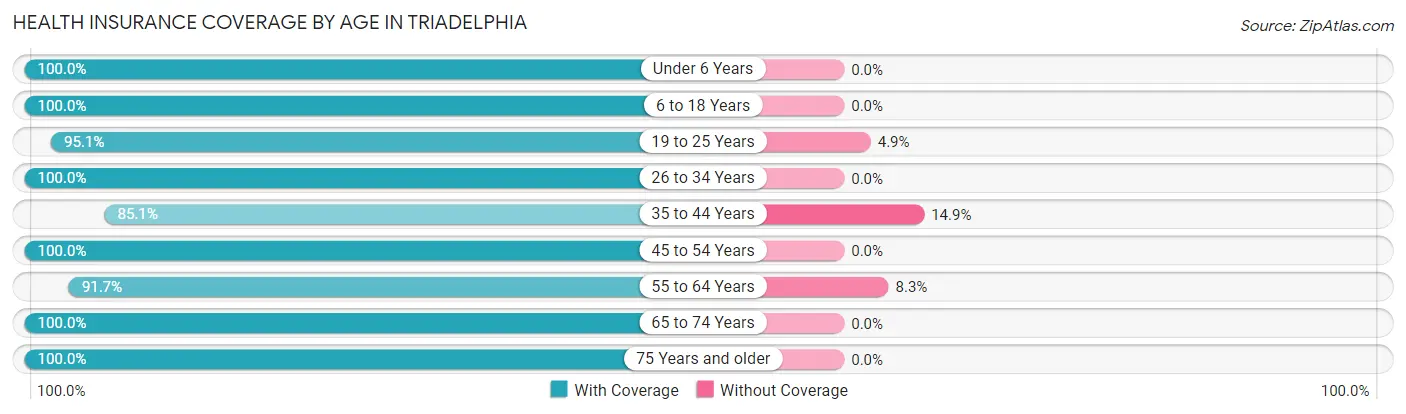
| Age Bracket | With Coverage | Without Coverage |
| Under 6 Years | 6 (100.0%) | 0 (0.0%) |
| 6 to 18 Years | 61 (100.0%) | 0 (0.0%) |
| 19 to 25 Years | 77 (95.1%) | 4 (4.9%) |
| 26 to 34 Years | 91 (100.0%) | 0 (0.0%) |
| 35 to 44 Years | 97 (85.1%) | 17 (14.9%) |
| 45 to 54 Years | 94 (100.0%) | 0 (0.0%) |
| 55 to 64 Years | 111 (91.7%) | 10 (8.3%) |
| 65 to 74 Years | 114 (100.0%) | 0 (0.0%) |
| 75 Years and older | 53 (100.0%) | 0 (0.0%) |
| Total | 704 (95.8%) | 31 (4.2%) |
Health Insurance Coverage by Citizenship Status in Triadelphia
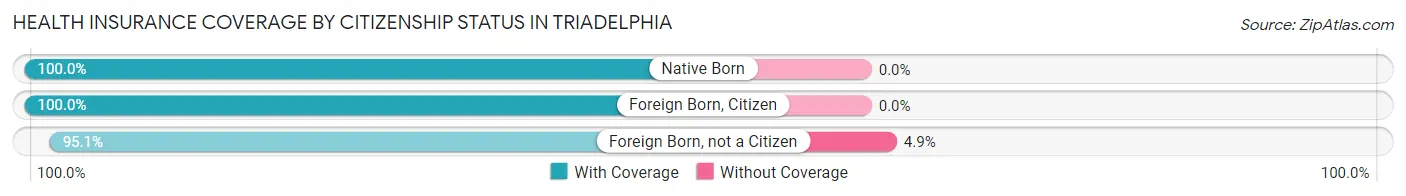
| Citizenship Status | With Coverage | Without Coverage |
| Native Born | 6 (100.0%) | 0 (0.0%) |
| Foreign Born, Citizen | 61 (100.0%) | 0 (0.0%) |
| Foreign Born, not a Citizen | 77 (95.1%) | 4 (4.9%) |
Health Insurance Coverage by Household Income in Triadelphia
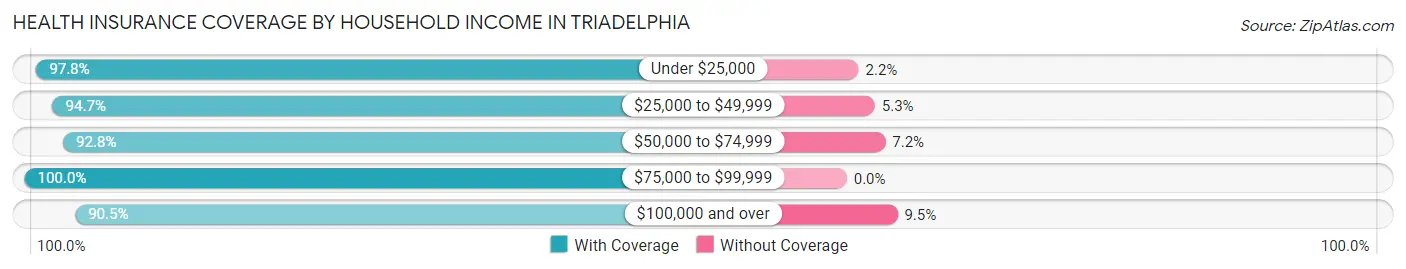
| Household Income | With Coverage | Without Coverage |
| Under $25,000 | 177 (97.8%) | 4 (2.2%) |
| $25,000 to $49,999 | 126 (94.7%) | 7 (5.3%) |
| $50,000 to $74,999 | 90 (92.8%) | 7 (7.2%) |
| $75,000 to $99,999 | 187 (100.0%) | 0 (0.0%) |
| $100,000 and over | 124 (90.5%) | 13 (9.5%) |
Public vs Private Health Insurance Coverage by Age in Triadelphia
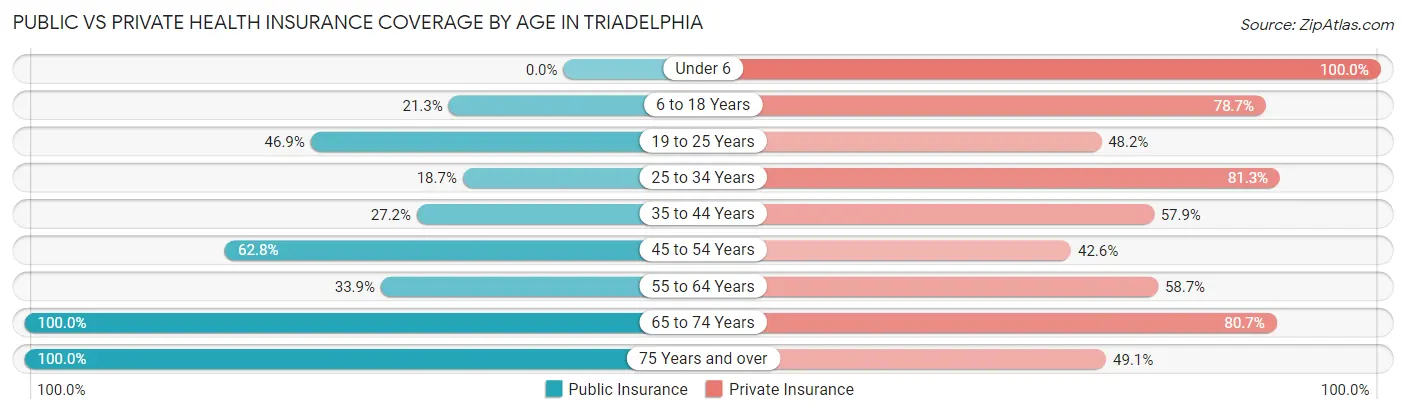
| Age Bracket | Public Insurance | Private Insurance |
| Under 6 | 0 (0.0%) | 6 (100.0%) |
| 6 to 18 Years | 13 (21.3%) | 48 (78.7%) |
| 19 to 25 Years | 38 (46.9%) | 39 (48.1%) |
| 25 to 34 Years | 17 (18.7%) | 74 (81.3%) |
| 35 to 44 Years | 31 (27.2%) | 66 (57.9%) |
| 45 to 54 Years | 59 (62.8%) | 40 (42.5%) |
| 55 to 64 Years | 41 (33.9%) | 71 (58.7%) |
| 65 to 74 Years | 114 (100.0%) | 92 (80.7%) |
| 75 Years and over | 53 (100.0%) | 26 (49.1%) |
| Total | 366 (49.8%) | 462 (62.9%) |
Disability Status by Sex by Age in Triadelphia
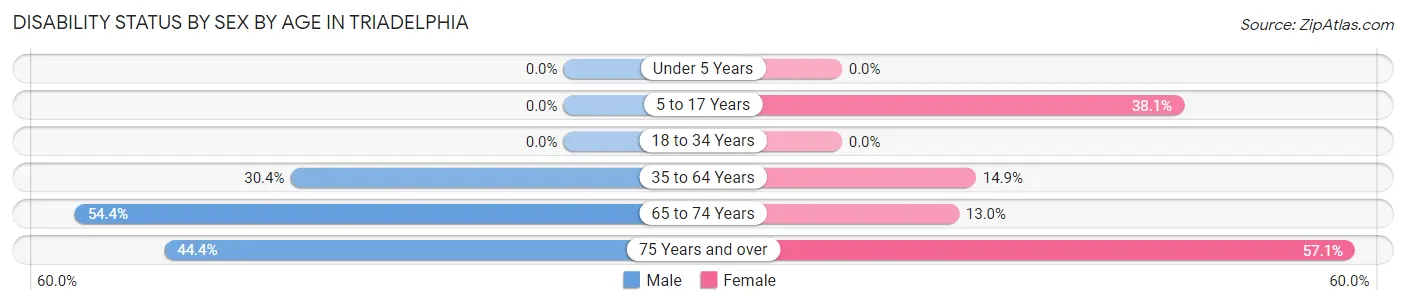
| Age Bracket | Male | Female |
| Under 5 Years | 0 (0.0%) | 0 (0.0%) |
| 5 to 17 Years | 0 (0.0%) | 16 (38.1%) |
| 18 to 34 Years | 0 (0.0%) | 0 (0.0%) |
| 35 to 64 Years | 45 (30.4%) | 27 (14.9%) |
| 65 to 74 Years | 37 (54.4%) | 6 (13.0%) |
| 75 Years and over | 8 (44.4%) | 20 (57.1%) |
Disability Class by Sex by Age in Triadelphia
Disability Class: Hearing Difficulty
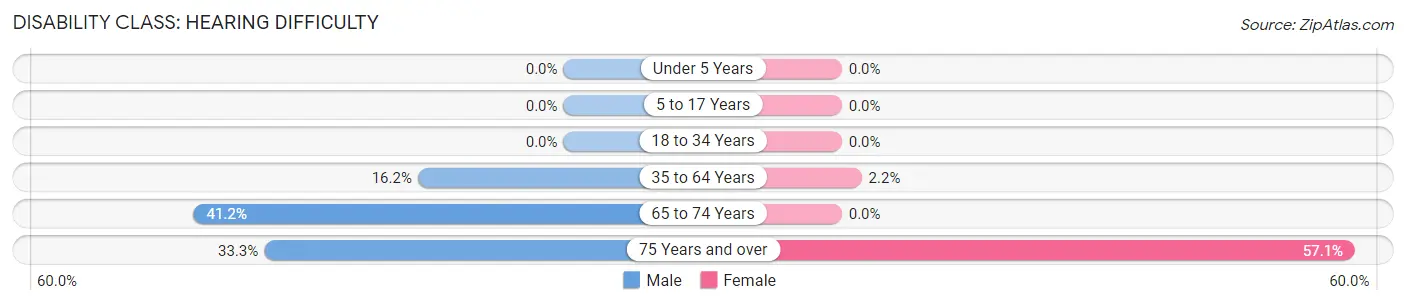
| Age Bracket | Male | Female |
| Under 5 Years | 0 (0.0%) | 0 (0.0%) |
| 5 to 17 Years | 0 (0.0%) | 0 (0.0%) |
| 18 to 34 Years | 0 (0.0%) | 0 (0.0%) |
| 35 to 64 Years | 24 (16.2%) | 4 (2.2%) |
| 65 to 74 Years | 28 (41.2%) | 0 (0.0%) |
| 75 Years and over | 6 (33.3%) | 20 (57.1%) |
Disability Class: Vision Difficulty
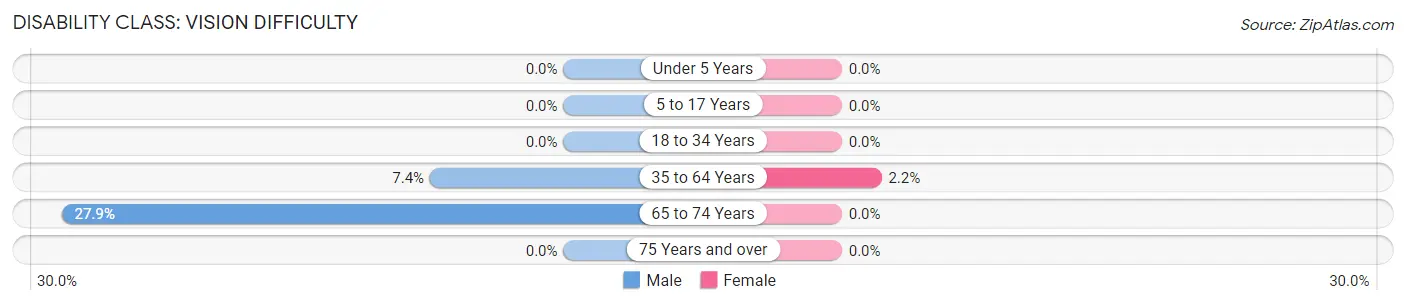
| Age Bracket | Male | Female |
| Under 5 Years | 0 (0.0%) | 0 (0.0%) |
| 5 to 17 Years | 0 (0.0%) | 0 (0.0%) |
| 18 to 34 Years | 0 (0.0%) | 0 (0.0%) |
| 35 to 64 Years | 11 (7.4%) | 4 (2.2%) |
| 65 to 74 Years | 19 (27.9%) | 0 (0.0%) |
| 75 Years and over | 0 (0.0%) | 0 (0.0%) |
Disability Class: Cognitive Difficulty
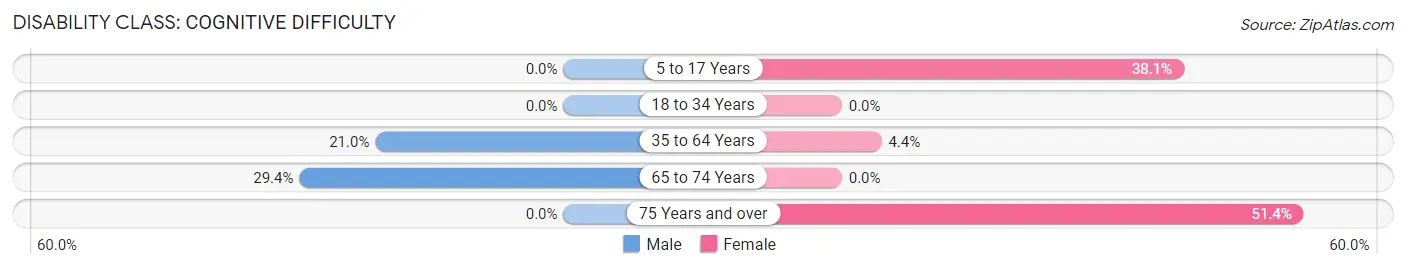
| Age Bracket | Male | Female |
| 5 to 17 Years | 0 (0.0%) | 16 (38.1%) |
| 18 to 34 Years | 0 (0.0%) | 0 (0.0%) |
| 35 to 64 Years | 31 (20.9%) | 8 (4.4%) |
| 65 to 74 Years | 20 (29.4%) | 0 (0.0%) |
| 75 Years and over | 0 (0.0%) | 18 (51.4%) |
Disability Class: Ambulatory Difficulty
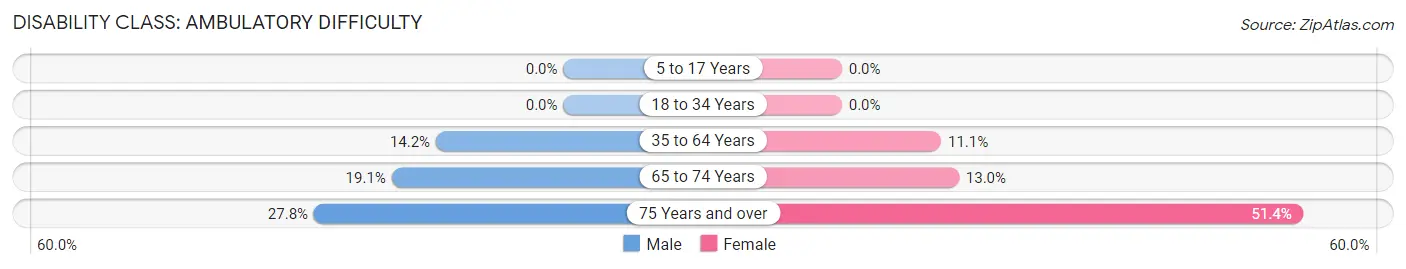
| Age Bracket | Male | Female |
| 5 to 17 Years | 0 (0.0%) | 0 (0.0%) |
| 18 to 34 Years | 0 (0.0%) | 0 (0.0%) |
| 35 to 64 Years | 21 (14.2%) | 20 (11.1%) |
| 65 to 74 Years | 13 (19.1%) | 6 (13.0%) |
| 75 Years and over | 5 (27.8%) | 18 (51.4%) |
Disability Class: Self-Care Difficulty
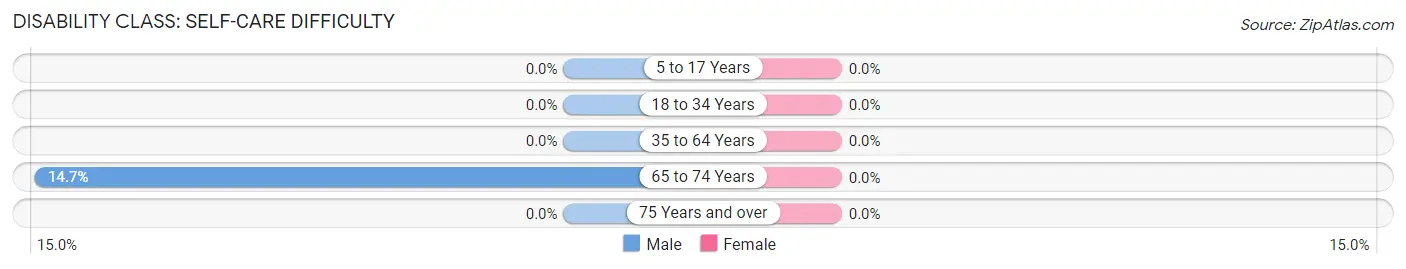
| Age Bracket | Male | Female |
| 5 to 17 Years | 0 (0.0%) | 0 (0.0%) |
| 18 to 34 Years | 0 (0.0%) | 0 (0.0%) |
| 35 to 64 Years | 0 (0.0%) | 0 (0.0%) |
| 65 to 74 Years | 10 (14.7%) | 0 (0.0%) |
| 75 Years and over | 0 (0.0%) | 0 (0.0%) |
Technology Access in Triadelphia
Computing Device Access in Triadelphia
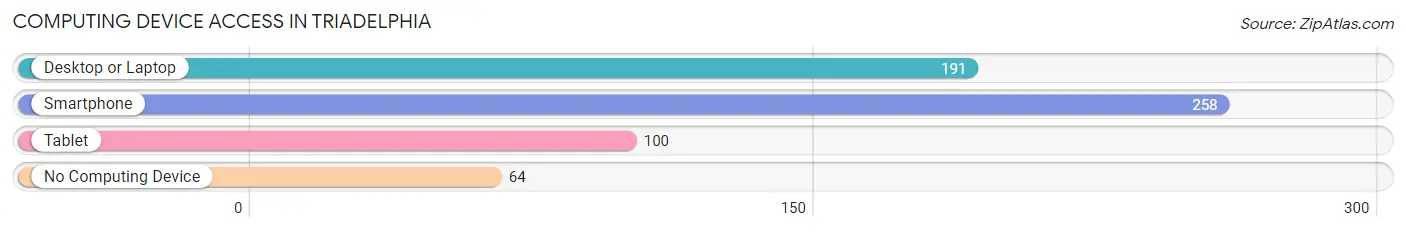
| Device Type | # Households | % Households |
| Desktop or Laptop | 191 | 57.7% |
| Smartphone | 258 | 77.9% |
| Tablet | 100 | 30.2% |
| No Computing Device | 64 | 19.3% |
| Total | 331 | 100.0% |
Internet Access in Triadelphia
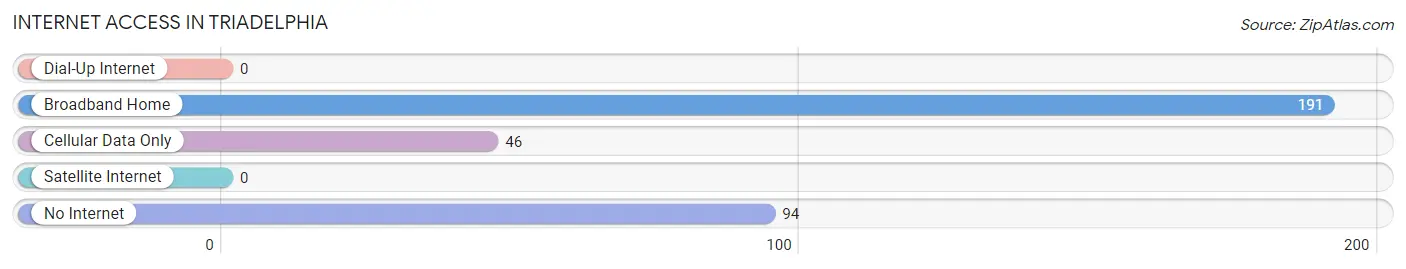
| Internet Type | # Households | % Households |
| Dial-Up Internet | 0 | 0.0% |
| Broadband Home | 191 | 57.7% |
| Cellular Data Only | 46 | 13.9% |
| Satellite Internet | 0 | 0.0% |
| No Internet | 94 | 28.4% |
| Total | 331 | 100.0% |
Triadelphia Summary
Triadelphia, West Virginia is a small town located in the northern part of the state, just outside of Wheeling. It is situated along the Ohio River and is part of the Ohio Valley region. The town has a population of just over 1,000 people and is part of the Ohio County School District.
History
Triadelphia was founded in 1817 by a group of settlers from Pennsylvania. The town was named after the three rivers that converge near the town: the Ohio, the Little Kanawha, and the West Fork of the Little Kanawha. The town was originally a farming community, but it soon became a center for industry and commerce. The town was home to several mills, including a paper mill, a flour mill, and a sawmill.
In the late 19th century, Triadelphia became a popular tourist destination. The town was home to several resorts, including the Triadelphia Hotel, which was built in 1891. The hotel was a popular destination for wealthy visitors from Pittsburgh and other nearby cities.
Geography
Triadelphia is located in the northern part of West Virginia, just outside of Wheeling. The town is situated along the Ohio River and is part of the Ohio Valley region. The town is surrounded by rolling hills and is located in a valley between two mountain ranges. The town is located at an elevation of 890 feet above sea level.
The climate in Triadelphia is humid continental, with hot summers and cold winters. The average annual temperature is around 50 degrees Fahrenheit. The town receives an average of 40 inches of precipitation per year.
Economy
The economy of Triadelphia is largely based on agriculture and tourism. The town is home to several farms, which produce a variety of crops, including corn, soybeans, and hay. The town is also home to several tourist attractions, including the Triadelphia Hotel and the Triadelphia Museum.
The town is also home to several small businesses, including restaurants, retail stores, and service providers. The town is home to several manufacturing companies, including a paper mill and a sawmill.
Demographics
As of the 2010 census, the population of Triadelphia was 1,072. The town is predominantly white, with 92.3% of the population identifying as white. The town is also home to a small African American population, with 4.2% of the population identifying as African American. The town is also home to a small Hispanic population, with 1.3% of the population identifying as Hispanic or Latino.
The median household income in Triadelphia is $41,250, and the median home value is $90,000. The town has a poverty rate of 15.3%, which is higher than the national average. The town has a high school graduation rate of 87.3%, which is higher than the national average.
Conclusion
Triadelphia, West Virginia is a small town located in the northern part of the state, just outside of Wheeling. The town has a population of just over 1,000 people and is part of the Ohio County School District. The town was founded in 1817 and was originally a farming community. Today, the town is home to several farms, tourist attractions, and small businesses. The town has a predominantly white population, with a small African American and Hispanic population. The town has a median household income of $41,250 and a median home value of $90,000. The town has a high school graduation rate of 87.3%, which is higher than the national average.
Common Questions
What is Per Capita Income in Triadelphia?
Per Capita income in Triadelphia is $26,448.
What is the Median Family Income in Triadelphia?
Median Family Income in Triadelphia is $67,083.
What is the Median Household income in Triadelphia?
Median Household Income in Triadelphia is $45,739.
What is Income or Wage Gap in Triadelphia?
Income or Wage Gap in Triadelphia is 35.8%.
Women in Triadelphia earn 64.2 cents for every dollar earned by a man.
What is Inequality or Gini Index in Triadelphia?
Inequality or Gini Index in Triadelphia is 0.40.
What is the Total Population of Triadelphia?
Total Population of Triadelphia is 735.
What is the Total Male Population of Triadelphia?
Total Male Population of Triadelphia is 353.
What is the Total Female Population of Triadelphia?
Total Female Population of Triadelphia is 382.
What is the Ratio of Males per 100 Females in Triadelphia?
There are 92.41 Males per 100 Females in Triadelphia.
What is the Ratio of Females per 100 Males in Triadelphia?
There are 108.22 Females per 100 Males in Triadelphia.
What is the Median Population Age in Triadelphia?
Median Population Age in Triadelphia is 46.3 Years.
What is the Average Family Size in Triadelphia
Average Family Size in Triadelphia is 2.7 People.
What is the Average Household Size in Triadelphia
Average Household Size in Triadelphia is 2.2 People.
How Large is the Labor Force in Triadelphia?
There are 344 People in the Labor Forcein in Triadelphia.
What is the Percentage of People in the Labor Force in Triadelphia?
50.7% of People are in the Labor Force in Triadelphia.
What is the Unemployment Rate in Triadelphia?
Unemployment Rate in Triadelphia is 7.0%.