Sutton, WV Map & Demographics
Sutton Map
Sutton Overview
$23,062
PER CAPITA INCOME
$49,464
AVG FAMILY INCOME
$37,167
AVG HOUSEHOLD INCOME
29.5%
WAGE / INCOME GAP [ % ]
70.5¢/ $1
WAGE / INCOME GAP [ $ ]
0.37
INEQUALITY / GINI INDEX
859
TOTAL POPULATION
363
MALE POPULATION
496
FEMALE POPULATION
73.19
MALES / 100 FEMALES
136.64
FEMALES / 100 MALES
53.6
MEDIAN AGE
3.3
AVG FAMILY SIZE
2.3
AVG HOUSEHOLD SIZE
388
LABOR FORCE [ PEOPLE ]
51.1%
PERCENT IN LABOR FORCE
4.9%
UNEMPLOYMENT RATE
Sutton Zip Codes
Sutton Area Codes
Income in Sutton
Income Overview in Sutton
Per Capita Income in Sutton is $23,062, while median incomes of families and households are $49,464 and $37,167 respectively.
| Characteristic | Number | Measure |
| Per Capita Income | 859 | $23,062 |
| Median Family Income | 209 | $49,464 |
| Mean Family Income | 209 | $59,172 |
| Median Household Income | 366 | $37,167 |
| Mean Household Income | 366 | $47,899 |
| Income Deficit | 209 | $0 |
| Wage / Income Gap (%) | 859 | 29.52% |
| Wage / Income Gap ($) | 859 | 70.48¢ per $1 |
| Gini / Inequality Index | 859 | 0.37 |
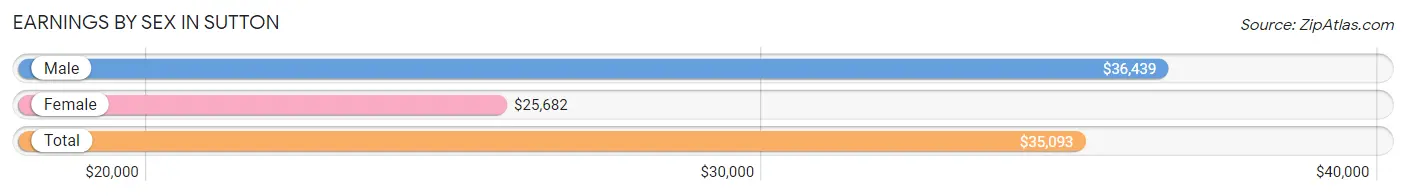
Earnings by Sex in Sutton
Average Earnings in Sutton are $35,093, $36,439 for men and $25,682 for women, a difference of 29.5%.
| Sex | Number | Average Earnings |
| Male | 168 (44.4%) | $36,439 |
| Female | 210 (55.6%) | $25,682 |
| Total | 378 (100.0%) | $35,093 |
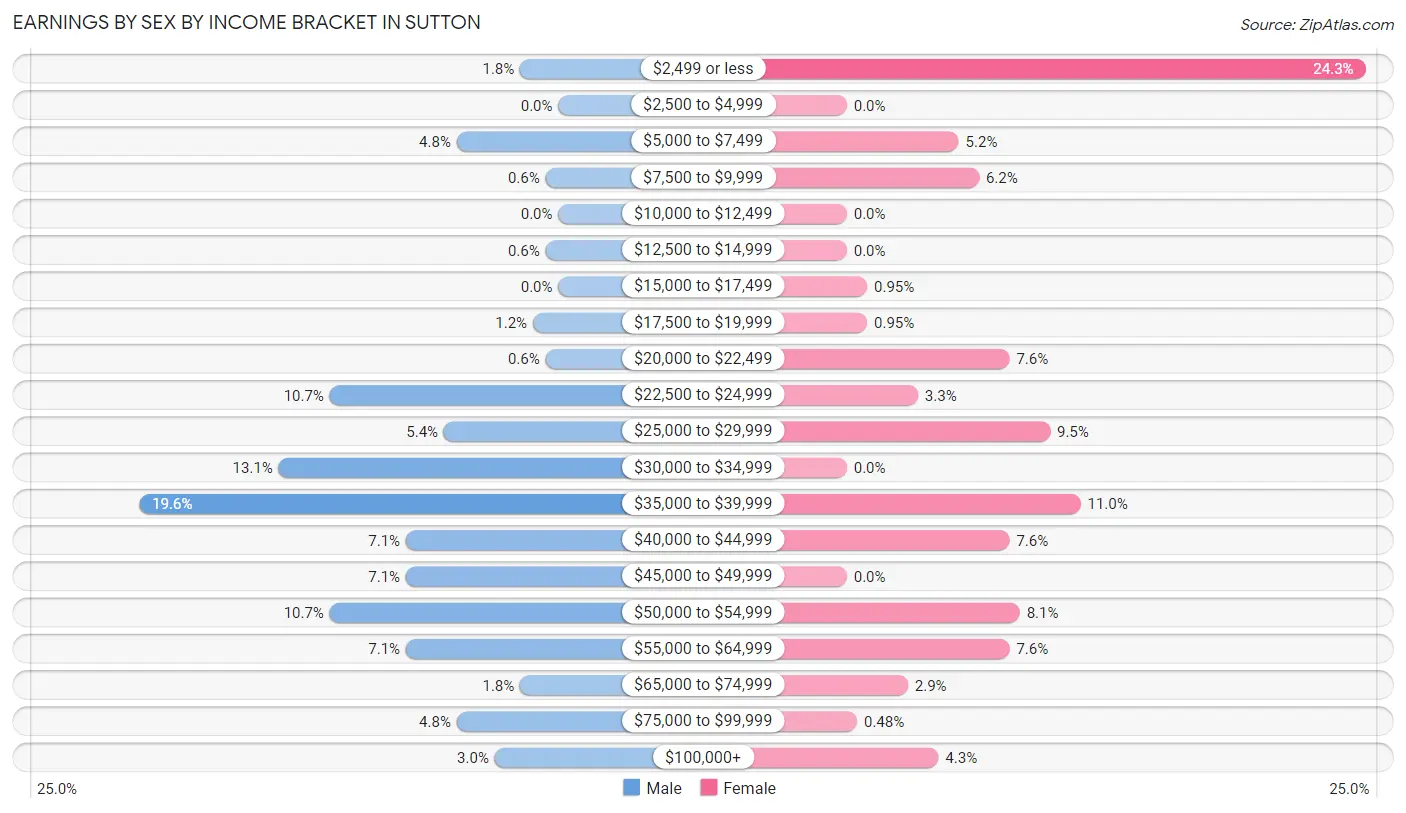
Earnings by Sex by Income Bracket in Sutton
The most common earnings brackets in Sutton are $35,000 to $39,999 for men (33 | 19.6%) and $2,499 or less for women (51 | 24.3%).
| Income | Male | Female |
| $2,499 or less | 3 (1.8%) | 51 (24.3%) |
| $2,500 to $4,999 | 0 (0.0%) | 0 (0.0%) |
| $5,000 to $7,499 | 8 (4.8%) | 11 (5.2%) |
| $7,500 to $9,999 | 1 (0.6%) | 13 (6.2%) |
| $10,000 to $12,499 | 0 (0.0%) | 0 (0.0%) |
| $12,500 to $14,999 | 1 (0.6%) | 0 (0.0%) |
| $15,000 to $17,499 | 0 (0.0%) | 2 (0.9%) |
| $17,500 to $19,999 | 2 (1.2%) | 2 (0.9%) |
| $20,000 to $22,499 | 1 (0.6%) | 16 (7.6%) |
| $22,500 to $24,999 | 18 (10.7%) | 7 (3.3%) |
| $25,000 to $29,999 | 9 (5.4%) | 20 (9.5%) |
| $30,000 to $34,999 | 22 (13.1%) | 0 (0.0%) |
| $35,000 to $39,999 | 33 (19.6%) | 23 (11.0%) |
| $40,000 to $44,999 | 12 (7.1%) | 16 (7.6%) |
| $45,000 to $49,999 | 12 (7.1%) | 0 (0.0%) |
| $50,000 to $54,999 | 18 (10.7%) | 17 (8.1%) |
| $55,000 to $64,999 | 12 (7.1%) | 16 (7.6%) |
| $65,000 to $74,999 | 3 (1.8%) | 6 (2.9%) |
| $75,000 to $99,999 | 8 (4.8%) | 1 (0.5%) |
| $100,000+ | 5 (3.0%) | 9 (4.3%) |
| Total | 168 (100.0%) | 210 (100.0%) |
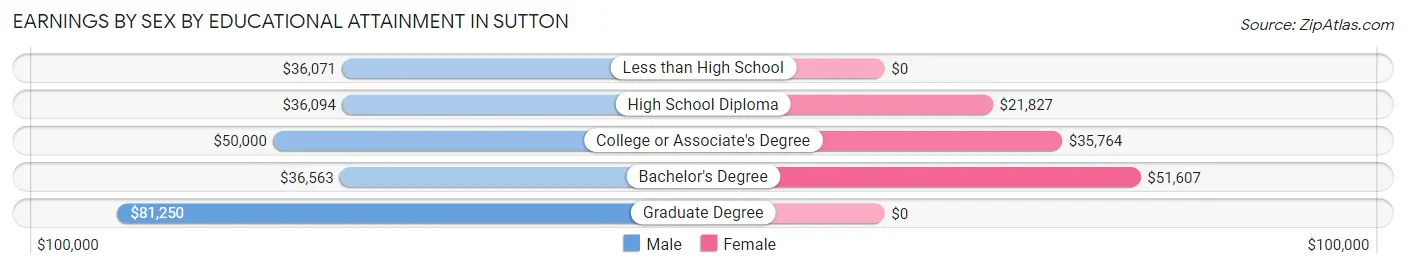
Earnings by Sex by Educational Attainment in Sutton
Average earnings in Sutton are $36,780 for men and $35,536 for women, a difference of 3.4%. Men with an educational attainment of graduate degree enjoy the highest average annual earnings of $81,250, while those with less than high school education earn the least with $36,071. Women with an educational attainment of bachelor's degree earn the most with the average annual earnings of $51,607, while those with high school diploma education have the smallest earnings of $21,827.
| Educational Attainment | Male Income | Female Income |
| Less than High School | $36,071 | $0 |
| High School Diploma | $36,094 | $21,827 |
| College or Associate's Degree | $50,000 | $35,764 |
| Bachelor's Degree | $36,563 | $51,607 |
| Graduate Degree | $81,250 | $0 |
| Total | $36,780 | $35,536 |
Family Income in Sutton
Family Income Brackets in Sutton
According to the Sutton family income data, there are 63 families falling into the $50,000 to $74,999 income range, which is the most common income bracket and makes up 30.1% of all families.
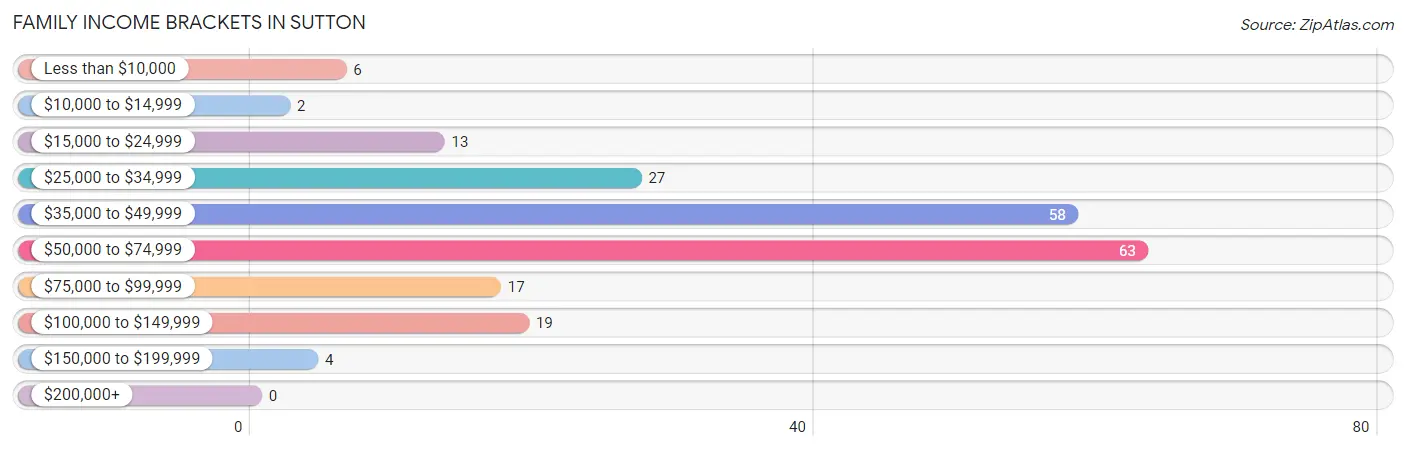
| Income Bracket | # Families | % Families |
| Less than $10,000 | 6 | 2.9% |
| $10,000 to $14,999 | 2 | 1.0% |
| $15,000 to $24,999 | 13 | 6.2% |
| $25,000 to $34,999 | 27 | 12.9% |
| $35,000 to $49,999 | 58 | 27.8% |
| $50,000 to $74,999 | 63 | 30.1% |
| $75,000 to $99,999 | 17 | 8.1% |
| $100,000 to $149,999 | 19 | 9.1% |
| $150,000 to $199,999 | 4 | 1.9% |
| $200,000+ | 0 | 0.0% |
Family Income by Famaliy Size in Sutton
3-person families (45 | 21.5%) account for the highest median family income in Sutton with $72,768 per family, while 3-person families (45 | 21.5%) have the highest median income of $24,256 per family member.
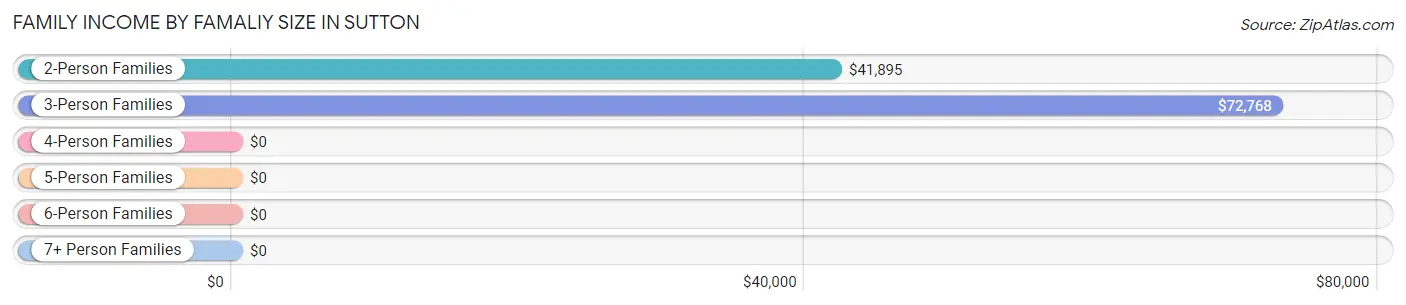
| Income Bracket | # Families | Median Income |
| 2-Person Families | 133 (63.6%) | $41,895 |
| 3-Person Families | 45 (21.5%) | $72,768 |
| 4-Person Families | 29 (13.9%) | $0 |
| 5-Person Families | 0 (0.0%) | $0 |
| 6-Person Families | 1 (0.5%) | $0 |
| 7+ Person Families | 1 (0.5%) | $0 |
| Total | 209 (100.0%) | $49,464 |
Family Income by Number of Earners in Sutton
The median family income in Sutton is $49,464, with families comprising 3+ earners (6) having the highest median family income of $106,875, while families with no earners (70) have the lowest median family income of $40,645, accounting for 2.9% and 33.5% of families, respectively.
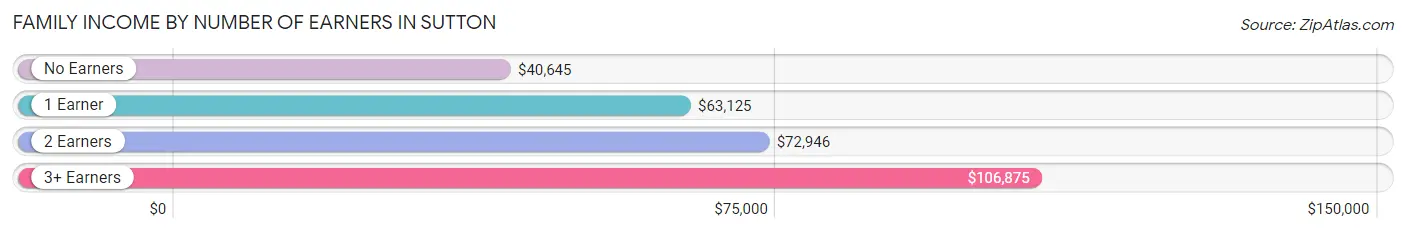
| Number of Earners | # Families | Median Income |
| No Earners | 70 (33.5%) | $40,645 |
| 1 Earner | 76 (36.4%) | $63,125 |
| 2 Earners | 57 (27.3%) | $72,946 |
| 3+ Earners | 6 (2.9%) | $106,875 |
| Total | 209 (100.0%) | $49,464 |
Household Income in Sutton
Household Income Brackets in Sutton
With 88 households falling in the category, the $35,000 to $49,999 income range is the most frequent in Sutton, accounting for 24.0% of all households.
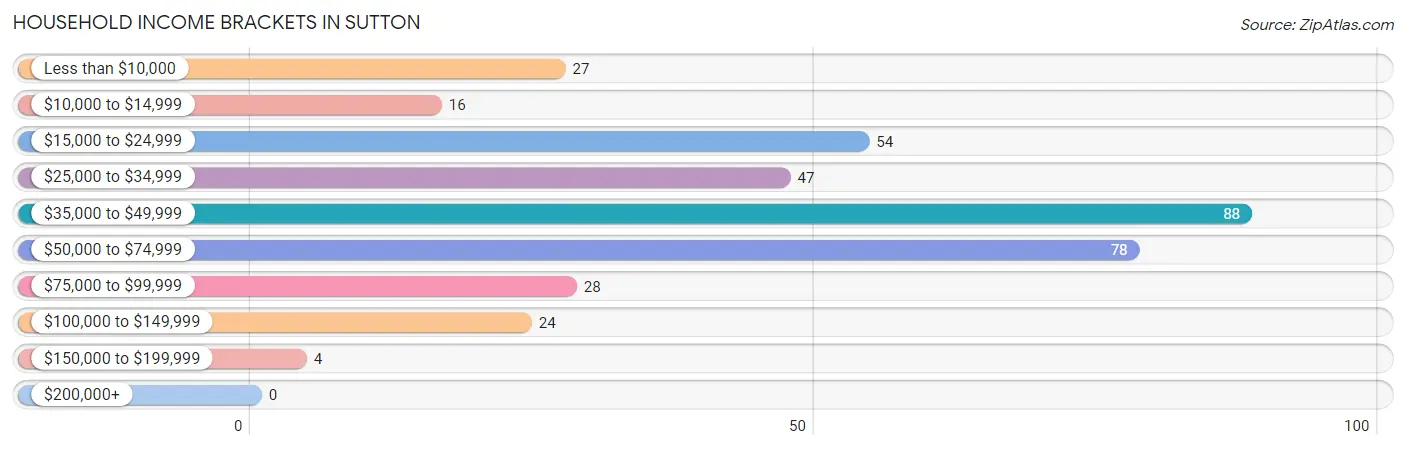
| Income Bracket | # Households | % Households |
| Less than $10,000 | 27 | 7.4% |
| $10,000 to $14,999 | 16 | 4.4% |
| $15,000 to $24,999 | 54 | 14.8% |
| $25,000 to $34,999 | 47 | 12.8% |
| $35,000 to $49,999 | 88 | 24.0% |
| $50,000 to $74,999 | 78 | 21.3% |
| $75,000 to $99,999 | 28 | 7.7% |
| $100,000 to $149,999 | 24 | 6.6% |
| $150,000 to $199,999 | 4 | 1.1% |
| $200,000+ | 0 | 0.0% |
Household Income by Householder Age in Sutton
The median household income in Sutton is $37,167, with the highest median household income of $36,625 found in the 65+ years age bracket for the primary householder. A total of 152 households (41.5%) fall into this category. Meanwhile, the 15 to 24 years age bracket for the primary householder has the lowest median household income of $0, with 1 households (0.3%) in this group.
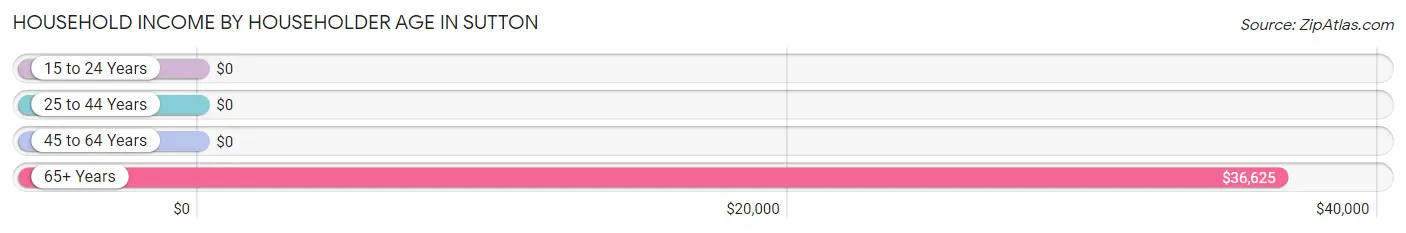
| Income Bracket | # Households | Median Income |
| 15 to 24 Years | 1 (0.3%) | $0 |
| 25 to 44 Years | 37 (10.1%) | $0 |
| 45 to 64 Years | 176 (48.1%) | $0 |
| 65+ Years | 152 (41.5%) | $36,625 |
| Total | 366 (100.0%) | $37,167 |
Poverty in Sutton
Income Below Poverty by Sex and Age in Sutton
With 11.0% poverty level for males and 11.7% for females among the residents of Sutton, 15 year old males and 35 to 44 year old females are the most vulnerable to poverty, with 5 males (83.3%) and 17 females (51.5%) in their respective age groups living below the poverty level.
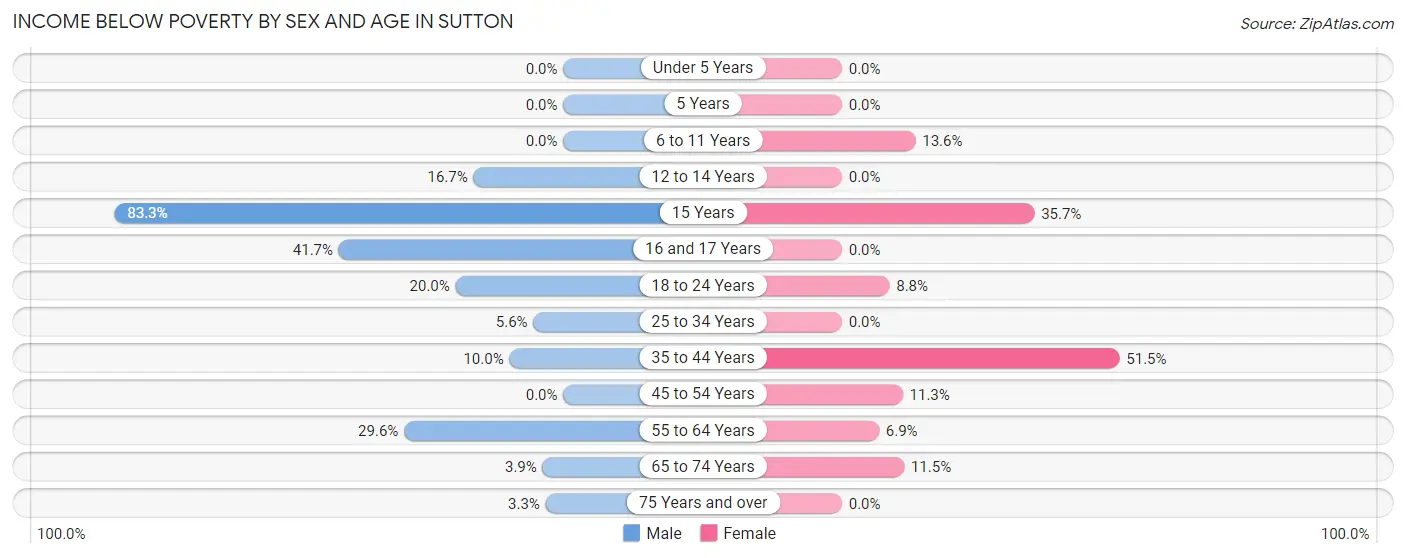
| Age Bracket | Male | Female |
| Under 5 Years | 0 (0.0%) | 0 (0.0%) |
| 5 Years | 0 (0.0%) | 0 (0.0%) |
| 6 to 11 Years | 0 (0.0%) | 3 (13.6%) |
| 12 to 14 Years | 5 (16.7%) | 0 (0.0%) |
| 15 Years | 5 (83.3%) | 10 (35.7%) |
| 16 and 17 Years | 5 (41.7%) | 0 (0.0%) |
| 18 to 24 Years | 3 (20.0%) | 3 (8.8%) |
| 25 to 34 Years | 1 (5.6%) | 0 (0.0%) |
| 35 to 44 Years | 4 (10.0%) | 17 (51.5%) |
| 45 to 54 Years | 0 (0.0%) | 7 (11.3%) |
| 55 to 64 Years | 13 (29.5%) | 9 (6.9%) |
| 65 to 74 Years | 2 (3.8%) | 9 (11.5%) |
| 75 Years and over | 2 (3.3%) | 0 (0.0%) |
| Total | 40 (11.0%) | 58 (11.7%) |
Income Above Poverty by Sex and Age in Sutton
According to the poverty statistics in Sutton, males aged under 5 years and females aged under 5 years are the age groups that are most secure financially, with 100.0% of males and 100.0% of females in these age groups living above the poverty line.
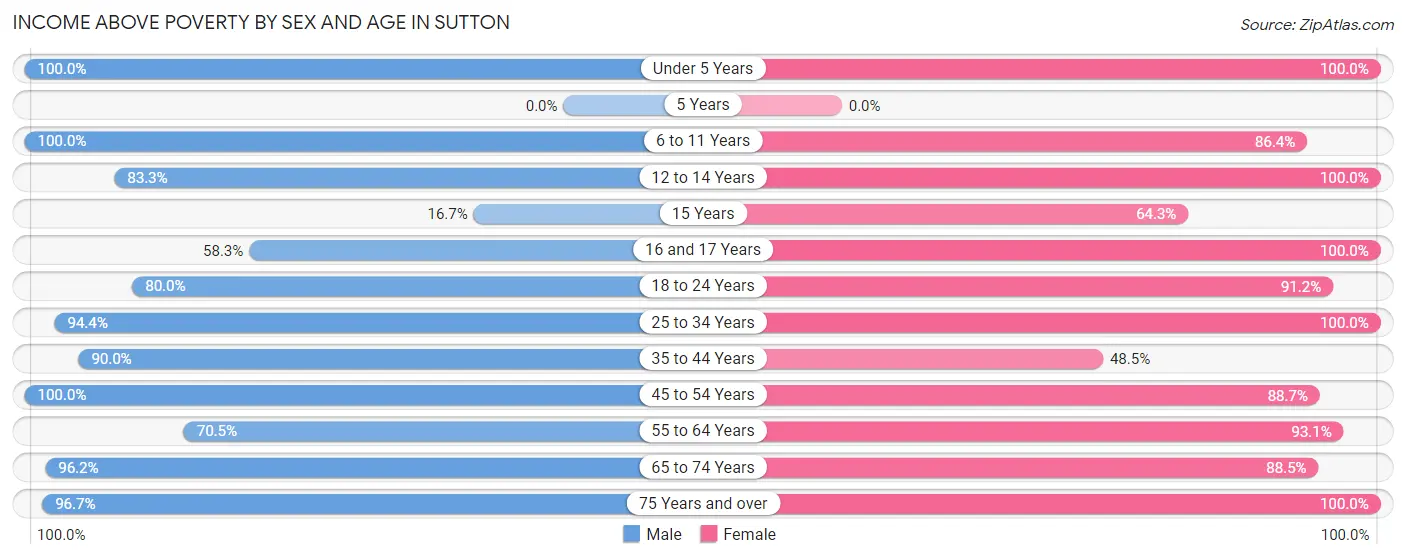
| Age Bracket | Male | Female |
| Under 5 Years | 3 (100.0%) | 4 (100.0%) |
| 5 Years | 0 (0.0%) | 0 (0.0%) |
| 6 to 11 Years | 2 (100.0%) | 19 (86.4%) |
| 12 to 14 Years | 25 (83.3%) | 5 (100.0%) |
| 15 Years | 1 (16.7%) | 18 (64.3%) |
| 16 and 17 Years | 7 (58.3%) | 36 (100.0%) |
| 18 to 24 Years | 12 (80.0%) | 31 (91.2%) |
| 25 to 34 Years | 17 (94.4%) | 14 (100.0%) |
| 35 to 44 Years | 36 (90.0%) | 16 (48.5%) |
| 45 to 54 Years | 80 (100.0%) | 55 (88.7%) |
| 55 to 64 Years | 31 (70.5%) | 122 (93.1%) |
| 65 to 74 Years | 50 (96.2%) | 69 (88.5%) |
| 75 Years and over | 59 (96.7%) | 49 (100.0%) |
| Total | 323 (89.0%) | 438 (88.3%) |
Income Below Poverty Among Married-Couple Families in Sutton
The poverty statistics for married-couple families in Sutton show that 2.7% or 4 of the total 146 families live below the poverty line. Families with 1 or 2 children have the highest poverty rate of 4.4%, comprising of 2 families. On the other hand, families with 3 or 4 children have the lowest poverty rate of 0.0%, which includes 0 families.
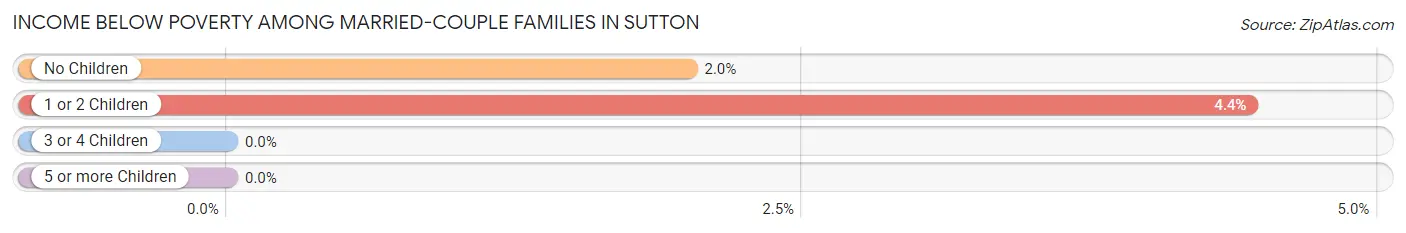
| Children | Above Poverty | Below Poverty |
| No Children | 98 (98.0%) | 2 (2.0%) |
| 1 or 2 Children | 43 (95.6%) | 2 (4.4%) |
| 3 or 4 Children | 1 (100.0%) | 0 (0.0%) |
| 5 or more Children | 0 (0.0%) | 0 (0.0%) |
| Total | 142 (97.3%) | 4 (2.7%) |
Income Below Poverty Among Single-Parent Households in Sutton
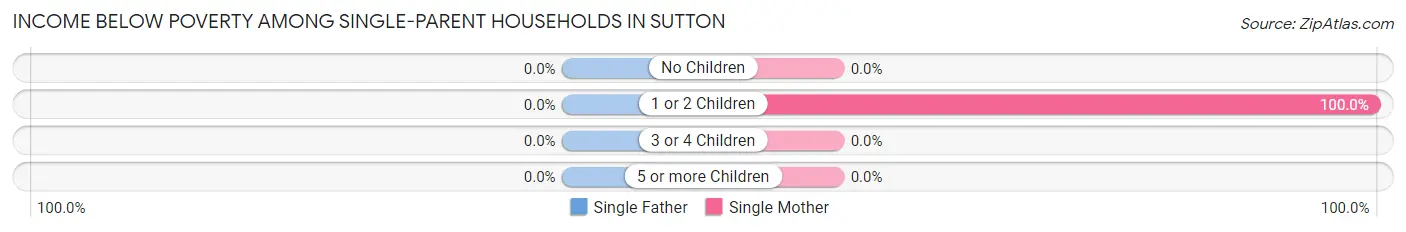
| Children | Single Father | Single Mother |
| No Children | 0 (0.0%) | 0 (0.0%) |
| 1 or 2 Children | 0 (0.0%) | 8 (100.0%) |
| 3 or 4 Children | 0 (0.0%) | 0 (0.0%) |
| 5 or more Children | 0 (0.0%) | 0 (0.0%) |
| Total | 0 (0.0%) | 8 (21.0%) |
Income Below Poverty Among Married-Couple vs Single-Parent Households in Sutton
The poverty data for Sutton shows that 4 of the married-couple family households (2.7%) and 8 of the single-parent households (12.7%) are living below the poverty level. Within the married-couple family households, those with 1 or 2 children have the highest poverty rate, with 2 households (4.4%) falling below the poverty line. Among the single-parent households, those with 1 or 2 children have the highest poverty rate, with 8 household (100.0%) living below poverty.
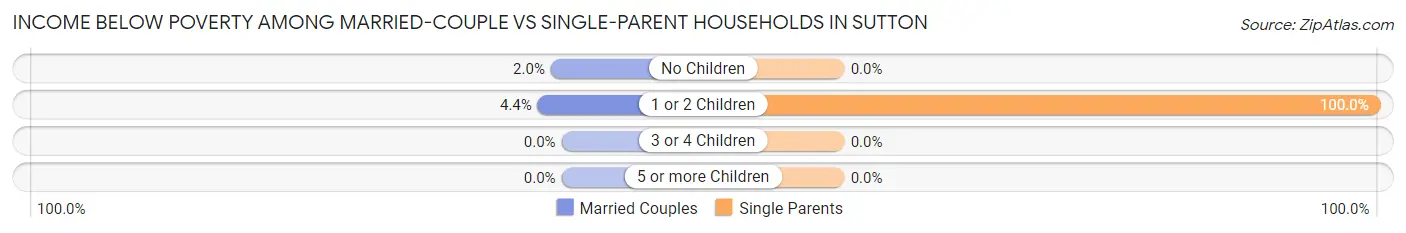
| Children | Married-Couple Families | Single-Parent Households |
| No Children | 2 (2.0%) | 0 (0.0%) |
| 1 or 2 Children | 2 (4.4%) | 8 (100.0%) |
| 3 or 4 Children | 0 (0.0%) | 0 (0.0%) |
| 5 or more Children | 0 (0.0%) | 0 (0.0%) |
| Total | 4 (2.7%) | 8 (12.7%) |
Race in Sutton
The most populous races in Sutton are White / Caucasian (737 | 85.8%), Two or more Races (79 | 9.2%), and Black / African American (32 | 3.7%).
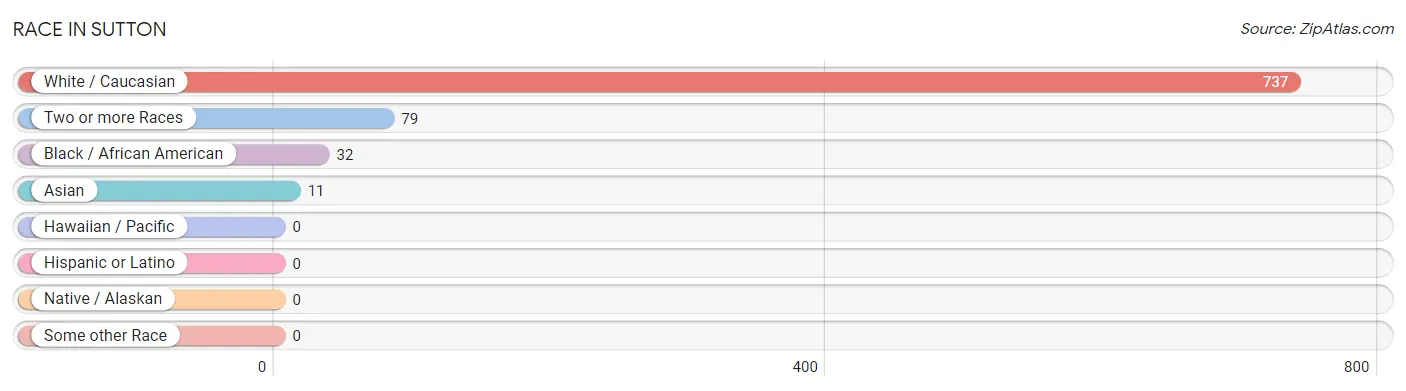
| Race | # Population | % Population |
| Asian | 11 | 1.3% |
| Black / African American | 32 | 3.7% |
| Hawaiian / Pacific | 0 | 0.0% |
| Hispanic or Latino | 0 | 0.0% |
| Native / Alaskan | 0 | 0.0% |
| White / Caucasian | 737 | 85.8% |
| Two or more Races | 79 | 9.2% |
| Some other Race | 0 | 0.0% |
| Total | 859 | 100.0% |
Ancestry in Sutton
The most populous ancestries reported in Sutton are German (204 | 23.7%), Irish (106 | 12.3%), English (80 | 9.3%), French (68 | 7.9%), and American (55 | 6.4%), together accounting for 59.7% of all Sutton residents.
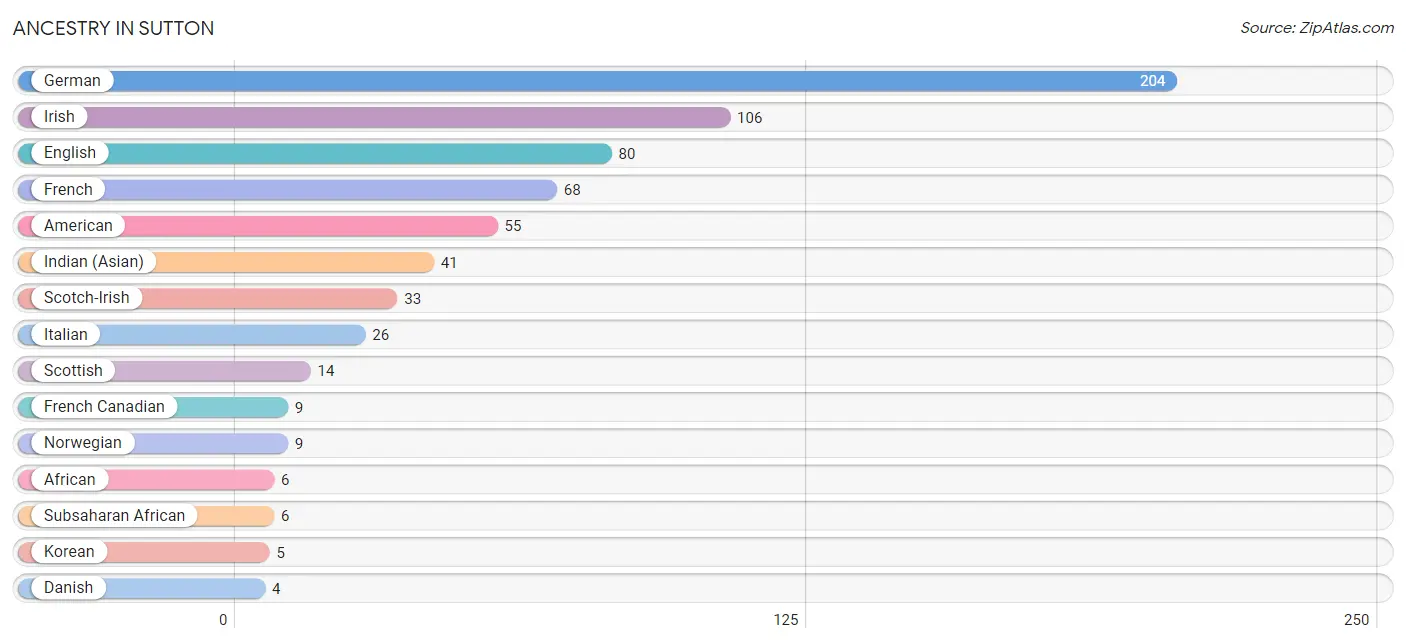
| Ancestry | # Population | % Population |
| African | 6 | 0.7% |
| American | 55 | 6.4% |
| Danish | 4 | 0.5% |
| Dutch | 4 | 0.5% |
| English | 80 | 9.3% |
| European | 3 | 0.4% |
| French | 68 | 7.9% |
| French Canadian | 9 | 1.1% |
| German | 204 | 23.7% |
| Hungarian | 2 | 0.2% |
| Indian (Asian) | 41 | 4.8% |
| Irish | 106 | 12.3% |
| Italian | 26 | 3.0% |
| Korean | 5 | 0.6% |
| Norwegian | 9 | 1.1% |
| Polish | 3 | 0.4% |
| Scandinavian | 2 | 0.2% |
| Scotch-Irish | 33 | 3.8% |
| Scottish | 14 | 1.6% |
| Subsaharan African | 6 | 0.7% | View All 20 Rows |
Immigrants in Sutton
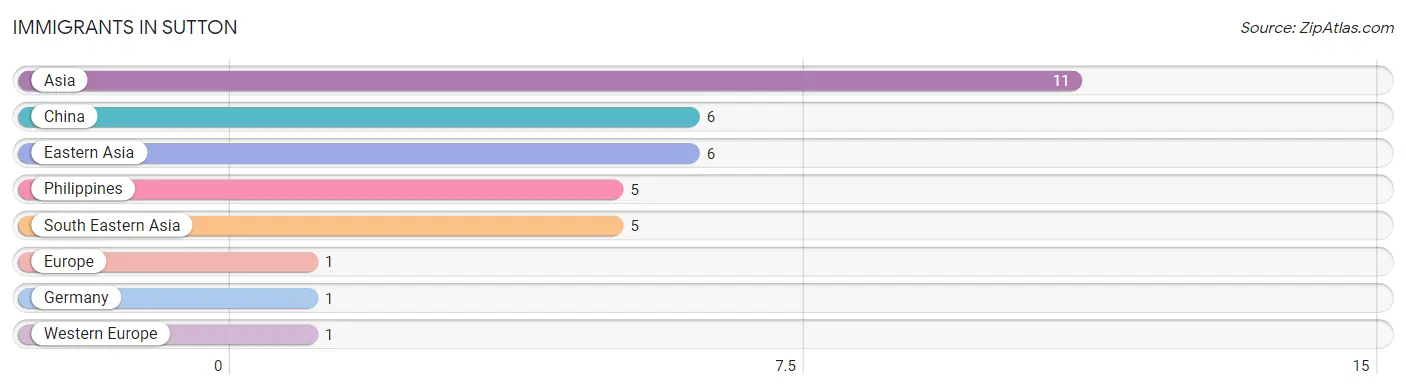
The most numerous immigrant groups reported in Sutton came from Asia (11 | 1.3%), China (6 | 0.7%), Eastern Asia (6 | 0.7%), Philippines (5 | 0.6%), and South Eastern Asia (5 | 0.6%), together accounting for 3.8% of all Sutton residents.
| Immigration Origin | # Population | % Population |
| Asia | 11 | 1.3% |
| China | 6 | 0.7% |
| Eastern Asia | 6 | 0.7% |
| Europe | 1 | 0.1% |
| Germany | 1 | 0.1% |
| Philippines | 5 | 0.6% |
| South Eastern Asia | 5 | 0.6% |
| Western Europe | 1 | 0.1% | View All 8 Rows |
Sex and Age in Sutton
Sex and Age in Sutton
The most populous age groups in Sutton are 45 to 49 Years (44 | 12.1%) for men and 15 to 19 Years (79 | 15.9%) for women.
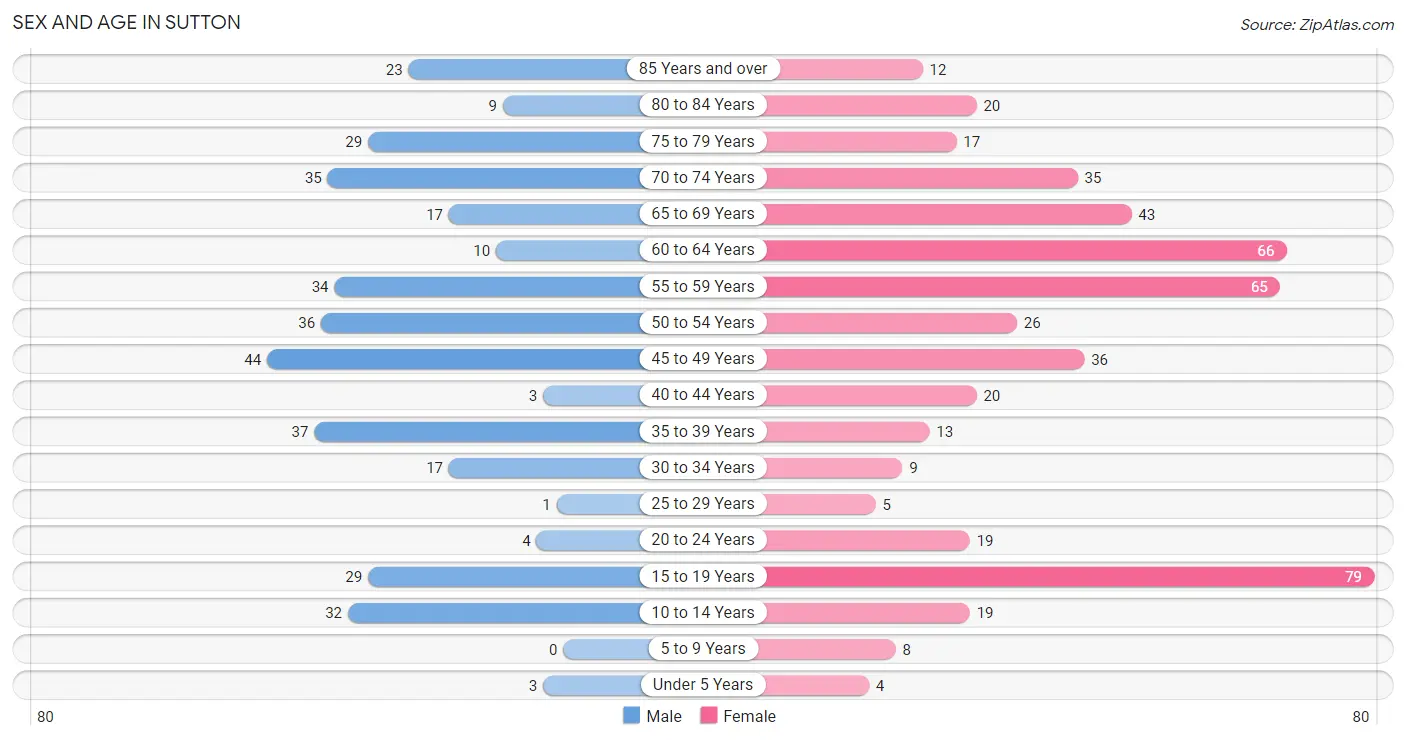
| Age Bracket | Male | Female |
| Under 5 Years | 3 (0.8%) | 4 (0.8%) |
| 5 to 9 Years | 0 (0.0%) | 8 (1.6%) |
| 10 to 14 Years | 32 (8.8%) | 19 (3.8%) |
| 15 to 19 Years | 29 (8.0%) | 79 (15.9%) |
| 20 to 24 Years | 4 (1.1%) | 19 (3.8%) |
| 25 to 29 Years | 1 (0.3%) | 5 (1.0%) |
| 30 to 34 Years | 17 (4.7%) | 9 (1.8%) |
| 35 to 39 Years | 37 (10.2%) | 13 (2.6%) |
| 40 to 44 Years | 3 (0.8%) | 20 (4.0%) |
| 45 to 49 Years | 44 (12.1%) | 36 (7.3%) |
| 50 to 54 Years | 36 (9.9%) | 26 (5.2%) |
| 55 to 59 Years | 34 (9.4%) | 65 (13.1%) |
| 60 to 64 Years | 10 (2.8%) | 66 (13.3%) |
| 65 to 69 Years | 17 (4.7%) | 43 (8.7%) |
| 70 to 74 Years | 35 (9.6%) | 35 (7.1%) |
| 75 to 79 Years | 29 (8.0%) | 17 (3.4%) |
| 80 to 84 Years | 9 (2.5%) | 20 (4.0%) |
| 85 Years and over | 23 (6.3%) | 12 (2.4%) |
| Total | 363 (100.0%) | 496 (100.0%) |
Families and Households in Sutton
Median Family Size in Sutton
The median family size in Sutton is 3.26 persons per family, with single male/father families (25 | 12.0%) accounting for the largest median family size of 4.6 persons per family. On the other hand, married-couple families (146 | 69.9%) represent the smallest median family size with 2.77 persons per family.
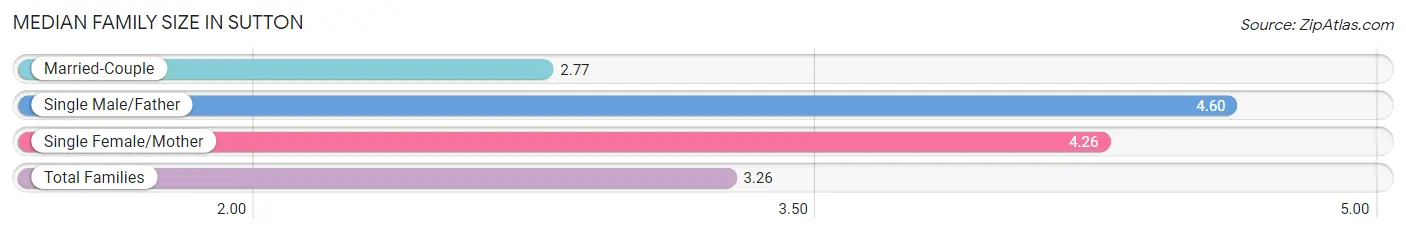
| Family Type | # Families | Family Size |
| Married-Couple | 146 (69.9%) | 2.77 |
| Single Male/Father | 25 (12.0%) | 4.60 |
| Single Female/Mother | 38 (18.2%) | 4.26 |
| Total Families | 209 (100.0%) | 3.26 |
Median Household Size in Sutton
The median household size in Sutton is 2.33 persons per household, with single male/father households (25 | 6.8%) accounting for the largest median household size of 4.68 persons per household. non-family households (157 | 42.9%) represent the smallest median household size with 1.03 persons per household.
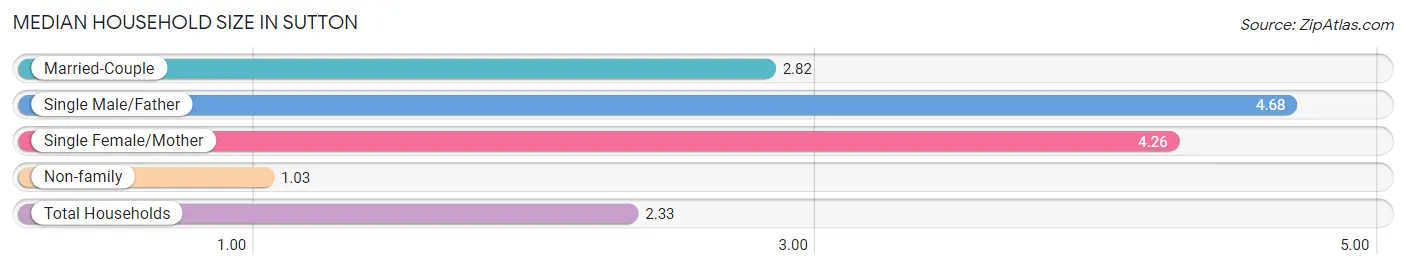
| Household Type | # Households | Household Size |
| Married-Couple | 146 (39.9%) | 2.82 |
| Single Male/Father | 25 (6.8%) | 4.68 |
| Single Female/Mother | 38 (10.4%) | 4.26 |
| Non-family | 157 (42.9%) | 1.03 |
| Total Households | 366 (100.0%) | 2.33 |
Household Size by Marriage Status in Sutton
Out of a total of 366 households in Sutton, 209 (57.1%) are family households, while 157 (42.9%) are nonfamily households. The most numerous type of family households are 2-person households, comprising 133, and the most common type of nonfamily households are 1-person households, comprising 156.
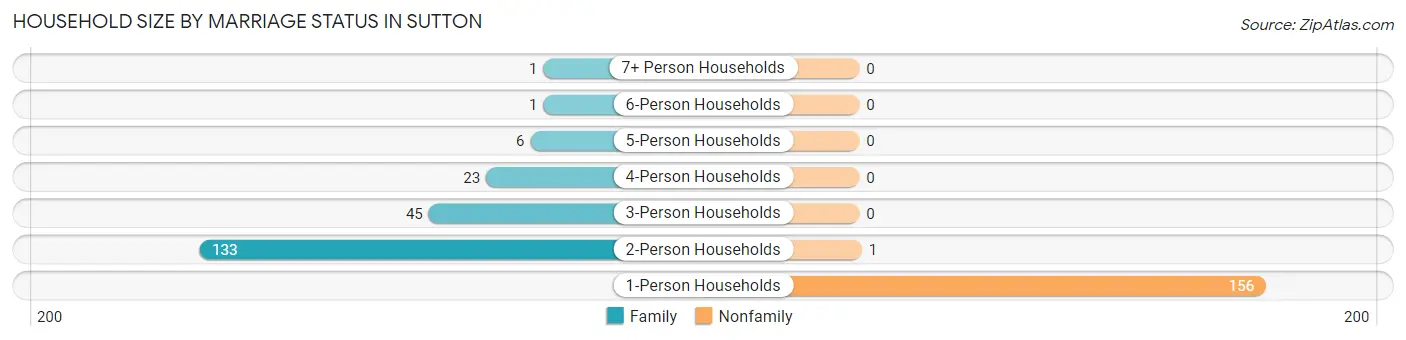
| Household Size | Family Households | Nonfamily Households |
| 1-Person Households | - | 156 (42.6%) |
| 2-Person Households | 133 (36.3%) | 1 (0.3%) |
| 3-Person Households | 45 (12.3%) | 0 (0.0%) |
| 4-Person Households | 23 (6.3%) | 0 (0.0%) |
| 5-Person Households | 6 (1.6%) | 0 (0.0%) |
| 6-Person Households | 1 (0.3%) | 0 (0.0%) |
| 7+ Person Households | 1 (0.3%) | 0 (0.0%) |
| Total | 209 (57.1%) | 157 (42.9%) |
Female Fertility in Sutton
Fertility by Age in Sutton
| Age Bracket | Women with Births | Births / 1,000 Women |
| 15 to 19 years | 0 (0.0%) | 0.0 |
| 20 to 34 years | 0 (0.0%) | 0.0 |
| 35 to 50 years | 0 (0.0%) | 0.0 |
| Total | 0 (0.0%) | 0.0 |
Fertility by Age by Marriage Status in Sutton
| Age Bracket | Married | Unmarried |
| 15 to 19 years | 0 (0.0%) | 0 (0.0%) |
| 20 to 34 years | 0 (0.0%) | 0 (0.0%) |
| 35 to 50 years | 0 (0.0%) | 0 (0.0%) |
| Total | 0 (0.0%) | 0 (0.0%) |
Fertility by Education in Sutton
| Educational Attainment | Women with Births | Births / 1,000 Women |
| Less than High School | 0 (0.0%) | 0.0 |
| High School Diploma | 0 (0.0%) | 0.0 |
| College or Associate's Degree | 0 (0.0%) | 0.0 |
| Bachelor's Degree | 0 (0.0%) | 0.0 |
| Graduate Degree | 0 (0.0%) | 0.0 |
| Total | 0 (0.0%) | 0.0 |
Fertility by Education by Marriage Status in Sutton
| Educational Attainment | Married | Unmarried |
| Less than High School | 0 (0.0%) | 0 (0.0%) |
| High School Diploma | 0 (0.0%) | 0 (0.0%) |
| College or Associate's Degree | 0 (0.0%) | 0 (0.0%) |
| Bachelor's Degree | 0 (0.0%) | 0 (0.0%) |
| Graduate Degree | 0 (0.0%) | 0 (0.0%) |
| Total | 0 (0.0%) | 0 (0.0%) |
Employment Characteristics in Sutton
Employment by Class of Employer in Sutton
Among the 323 employed individuals in Sutton, private company employees (252 | 78.0%), local government employees (23 | 7.1%), and state government employees (16 | 5.0%) make up the most common classes of employment.
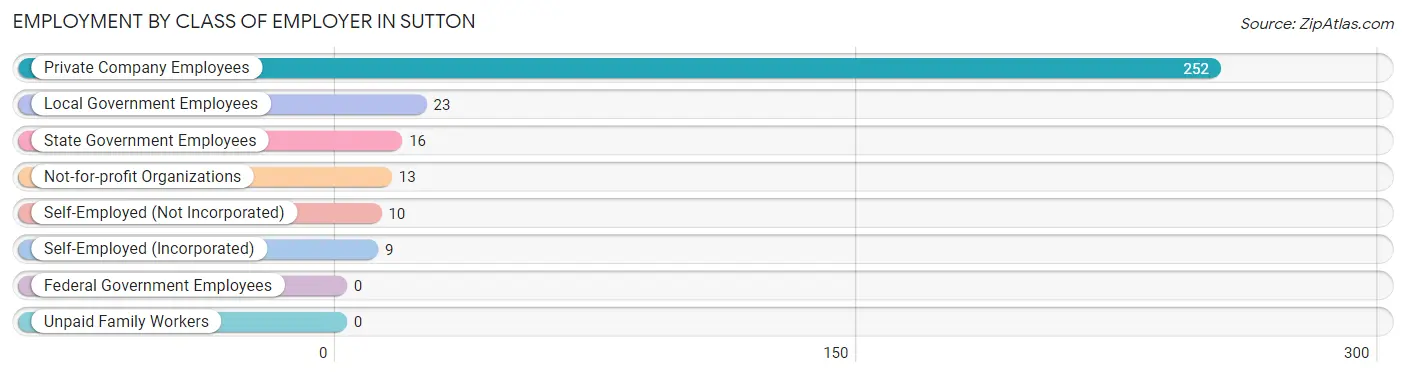
| Employer Class | # Employees | % Employees |
| Private Company Employees | 252 | 78.0% |
| Self-Employed (Incorporated) | 9 | 2.8% |
| Self-Employed (Not Incorporated) | 10 | 3.1% |
| Not-for-profit Organizations | 13 | 4.0% |
| Local Government Employees | 23 | 7.1% |
| State Government Employees | 16 | 5.0% |
| Federal Government Employees | 0 | 0.0% |
| Unpaid Family Workers | 0 | 0.0% |
| Total | 323 | 100.0% |
Employment Status by Age in Sutton
According to the labor force statistics for Sutton, out of the total population over 16 years of age (759), 51.1% or 388 individuals are in the labor force, with 4.9% or 19 of them unemployed. The age group with the highest labor force participation rate is 20 to 24 years, with 100.0% or 23 individuals in the labor force. Within the labor force, the 20 to 24 years age range has the highest percentage of unemployed individuals, with 39.1% or 9 of them being unemployed.
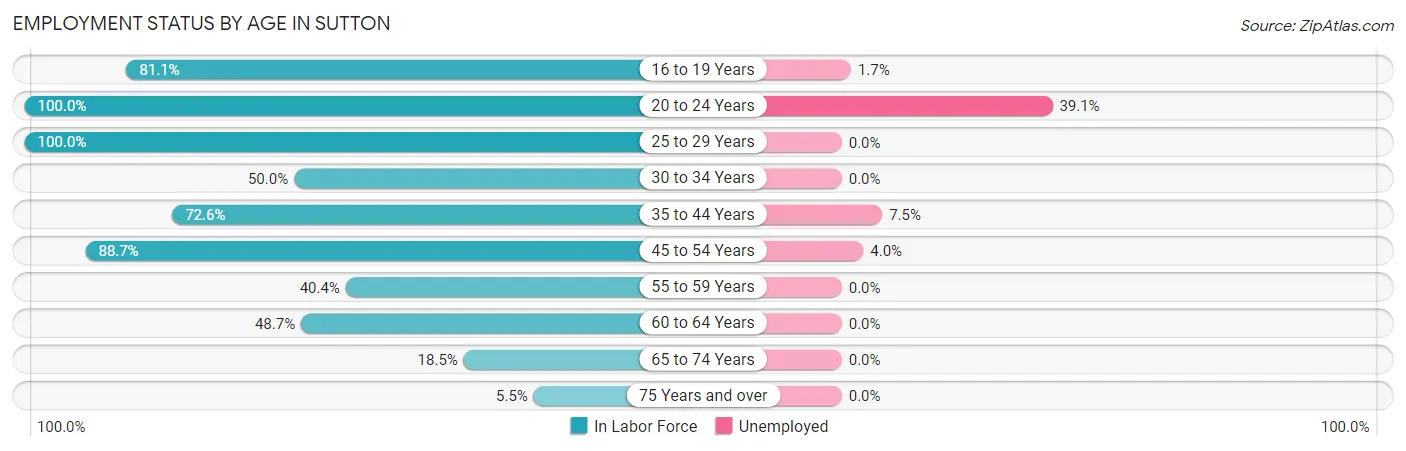
| Age Bracket | In Labor Force | Unemployed |
| 16 to 19 Years | 60 (81.1%) | 1 (1.7%) |
| 20 to 24 Years | 23 (100.0%) | 9 (39.1%) |
| 25 to 29 Years | 6 (100.0%) | 0 (0.0%) |
| 30 to 34 Years | 13 (50.0%) | 0 (0.0%) |
| 35 to 44 Years | 53 (72.6%) | 4 (7.5%) |
| 45 to 54 Years | 126 (88.7%) | 5 (4.0%) |
| 55 to 59 Years | 40 (40.4%) | 0 (0.0%) |
| 60 to 64 Years | 37 (48.7%) | 0 (0.0%) |
| 65 to 74 Years | 24 (18.5%) | 0 (0.0%) |
| 75 Years and over | 6 (5.5%) | 0 (0.0%) |
| Total | 388 (51.1%) | 19 (4.9%) |
Employment Status by Educational Attainment in Sutton
According to labor force statistics for Sutton, 65.2% of individuals (275) out of the total population between 25 and 64 years of age (422) are in the labor force, with 3.3% or 9 of them being unemployed. The group with the highest labor force participation rate are those with the educational attainment of bachelor's degree or higher, with 84.0% or 84 individuals in the labor force. Within the labor force, individuals with high school diploma education have the highest percentage of unemployment, with 9.4% or 9 of them being unemployed.
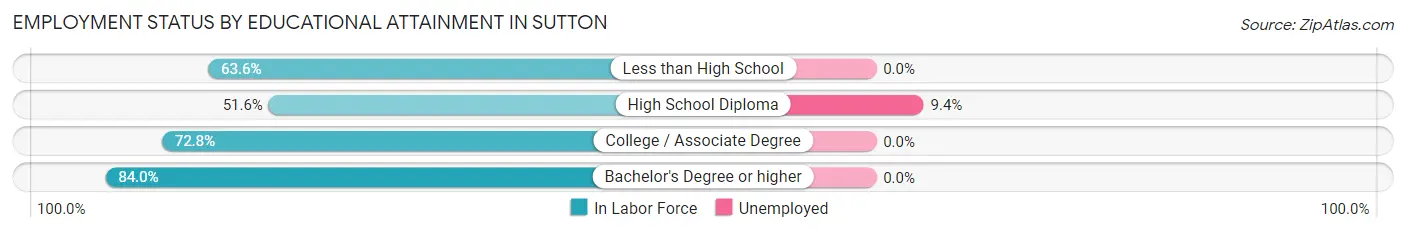
| Educational Attainment | In Labor Force | Unemployed |
| Less than High School | 28 (63.6%) | 0 (0.0%) |
| High School Diploma | 96 (51.6%) | 17 (9.4%) |
| College / Associate Degree | 67 (72.8%) | 0 (0.0%) |
| Bachelor's Degree or higher | 84 (84.0%) | 0 (0.0%) |
| Total | 275 (65.2%) | 14 (3.3%) |
Employment Occupations by Sex in Sutton
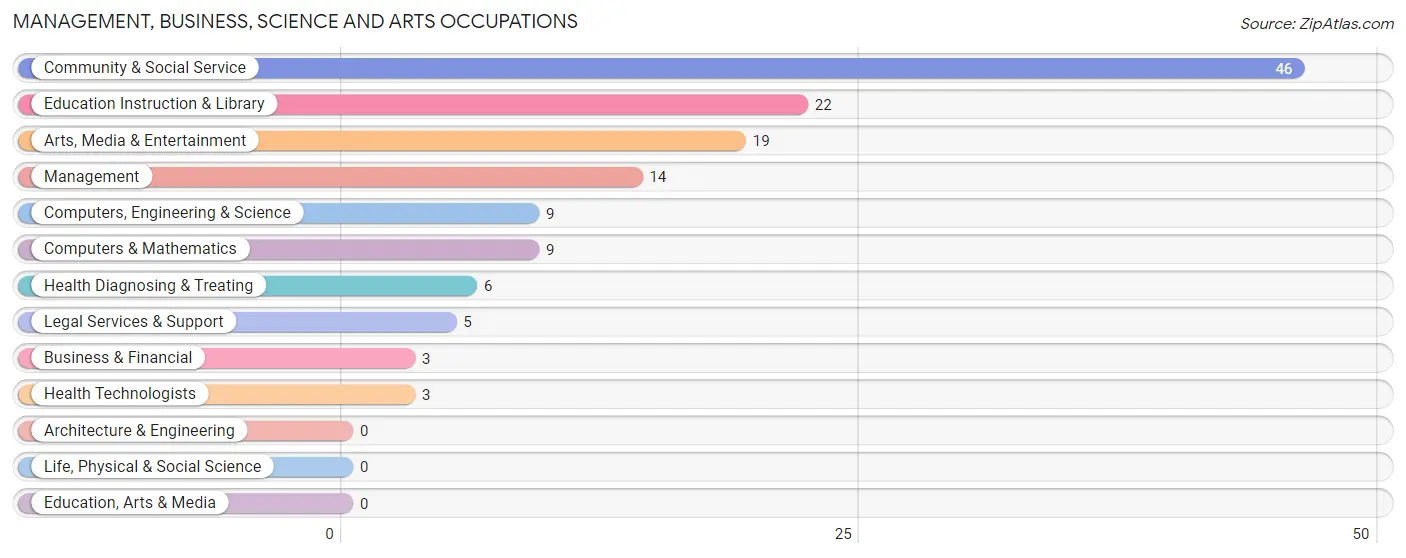
Management, Business, Science and Arts Occupations
The most common Management, Business, Science and Arts occupations in Sutton are Community & Social Service (46 | 12.5%), Education Instruction & Library (22 | 6.0%), Arts, Media & Entertainment (19 | 5.1%), Management (14 | 3.8%), and Computers, Engineering & Science (9 | 2.4%).
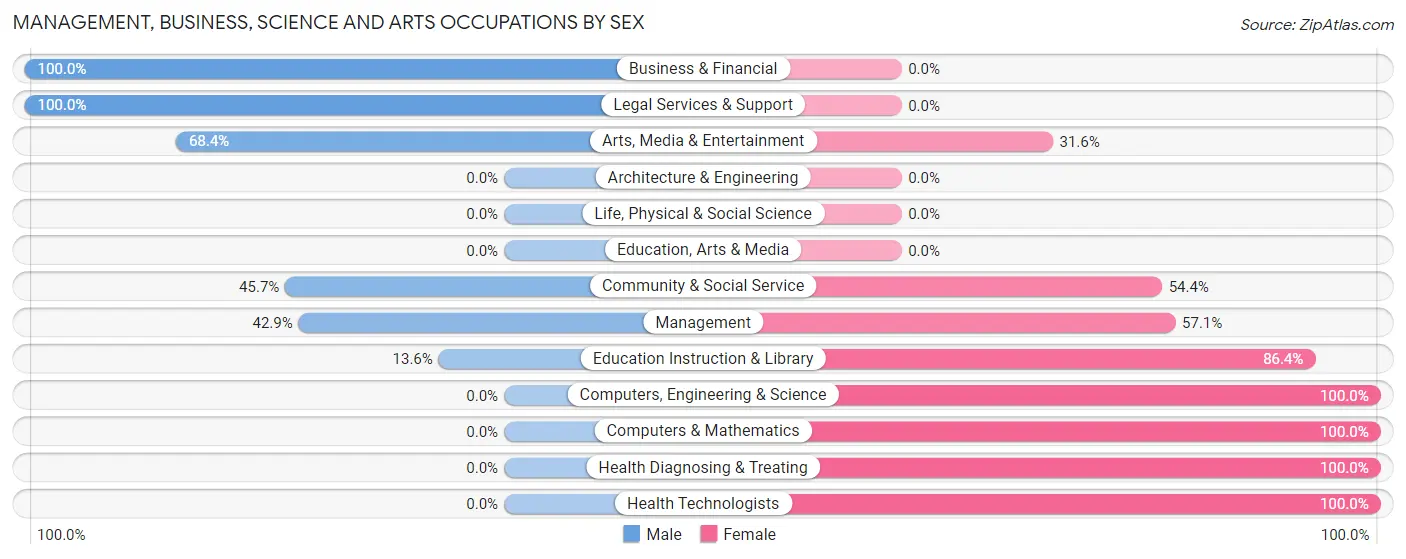
Management, Business, Science and Arts Occupations by Sex
Within the Management, Business, Science and Arts occupations in Sutton, the most male-oriented occupations are Business & Financial (100.0%), Legal Services & Support (100.0%), and Arts, Media & Entertainment (68.4%), while the most female-oriented occupations are Computers, Engineering & Science (100.0%), Computers & Mathematics (100.0%), and Health Diagnosing & Treating (100.0%).
| Occupation | Male | Female |
| Management | 6 (42.9%) | 8 (57.1%) |
| Business & Financial | 3 (100.0%) | 0 (0.0%) |
| Computers, Engineering & Science | 0 (0.0%) | 9 (100.0%) |
| Computers & Mathematics | 0 (0.0%) | 9 (100.0%) |
| Architecture & Engineering | 0 (0.0%) | 0 (0.0%) |
| Life, Physical & Social Science | 0 (0.0%) | 0 (0.0%) |
| Community & Social Service | 21 (45.7%) | 25 (54.3%) |
| Education, Arts & Media | 0 (0.0%) | 0 (0.0%) |
| Legal Services & Support | 5 (100.0%) | 0 (0.0%) |
| Education Instruction & Library | 3 (13.6%) | 19 (86.4%) |
| Arts, Media & Entertainment | 13 (68.4%) | 6 (31.6%) |
| Health Diagnosing & Treating | 0 (0.0%) | 6 (100.0%) |
| Health Technologists | 0 (0.0%) | 3 (100.0%) |
| Total (Category) | 30 (38.5%) | 48 (61.5%) |
| Total (Overall) | 168 (45.5%) | 201 (54.5%) |
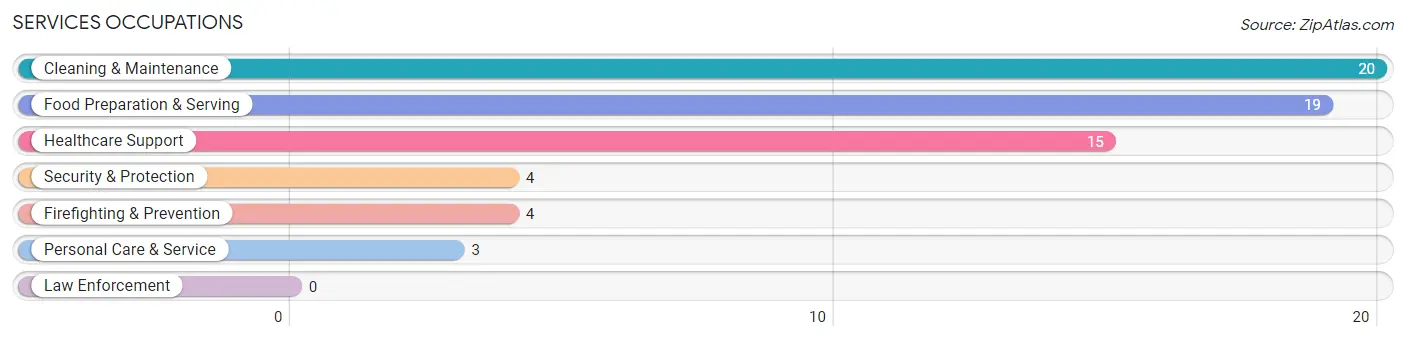
Services Occupations
The most common Services occupations in Sutton are Cleaning & Maintenance (20 | 5.4%), Food Preparation & Serving (19 | 5.1%), Healthcare Support (15 | 4.1%), Security & Protection (4 | 1.1%), and Firefighting & Prevention (4 | 1.1%).
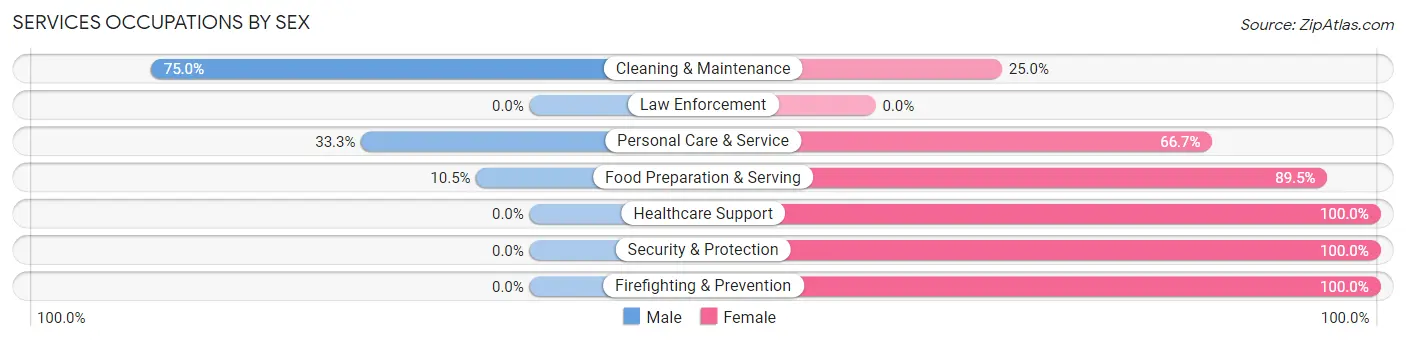
Services Occupations by Sex
Within the Services occupations in Sutton, the most male-oriented occupations are Cleaning & Maintenance (75.0%), Personal Care & Service (33.3%), and Food Preparation & Serving (10.5%), while the most female-oriented occupations are Healthcare Support (100.0%), Security & Protection (100.0%), and Firefighting & Prevention (100.0%).
| Occupation | Male | Female |
| Healthcare Support | 0 (0.0%) | 15 (100.0%) |
| Security & Protection | 0 (0.0%) | 4 (100.0%) |
| Firefighting & Prevention | 0 (0.0%) | 4 (100.0%) |
| Law Enforcement | 0 (0.0%) | 0 (0.0%) |
| Food Preparation & Serving | 2 (10.5%) | 17 (89.5%) |
| Cleaning & Maintenance | 15 (75.0%) | 5 (25.0%) |
| Personal Care & Service | 1 (33.3%) | 2 (66.7%) |
| Total (Category) | 18 (29.5%) | 43 (70.5%) |
| Total (Overall) | 168 (45.5%) | 201 (54.5%) |
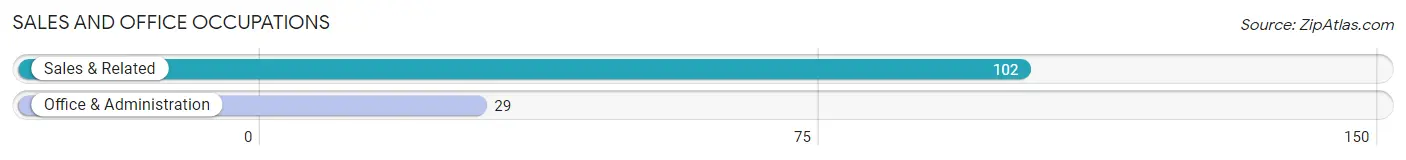
Sales and Office Occupations
The most common Sales and Office occupations in Sutton are Sales & Related (102 | 27.6%), and Office & Administration (29 | 7.9%).
Sales and Office Occupations by Sex
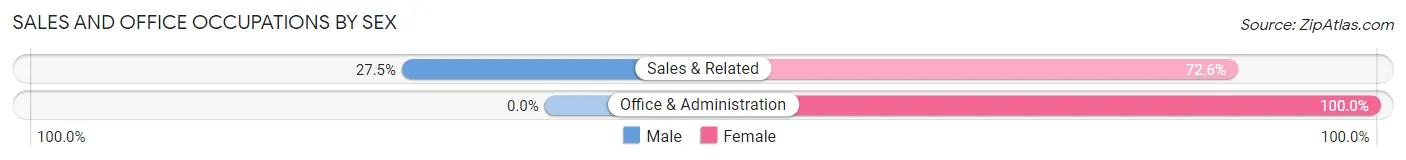
| Occupation | Male | Female |
| Sales & Related | 28 (27.5%) | 74 (72.6%) |
| Office & Administration | 0 (0.0%) | 29 (100.0%) |
| Total (Category) | 28 (21.4%) | 103 (78.6%) |
| Total (Overall) | 168 (45.5%) | 201 (54.5%) |
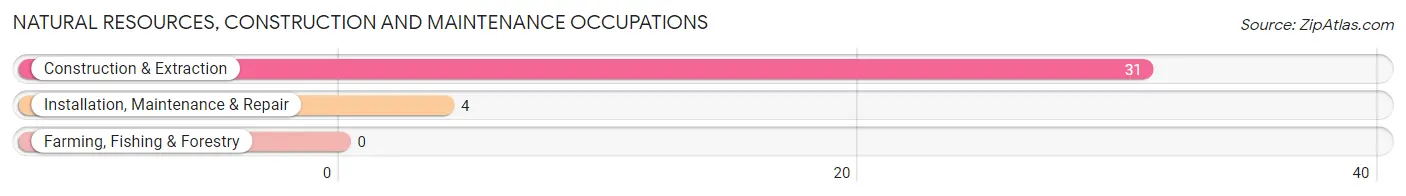
Natural Resources, Construction and Maintenance Occupations
The most common Natural Resources, Construction and Maintenance occupations in Sutton are Construction & Extraction (31 | 8.4%), and Installation, Maintenance & Repair (4 | 1.1%).
Natural Resources, Construction and Maintenance Occupations by Sex
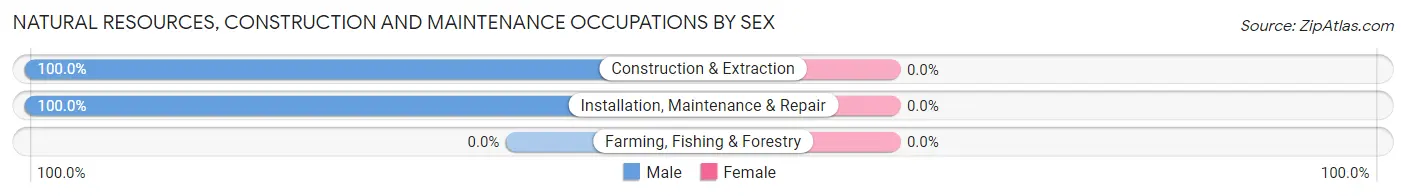
| Occupation | Male | Female |
| Farming, Fishing & Forestry | 0 (0.0%) | 0 (0.0%) |
| Construction & Extraction | 31 (100.0%) | 0 (0.0%) |
| Installation, Maintenance & Repair | 4 (100.0%) | 0 (0.0%) |
| Total (Category) | 35 (100.0%) | 0 (0.0%) |
| Total (Overall) | 168 (45.5%) | 201 (54.5%) |
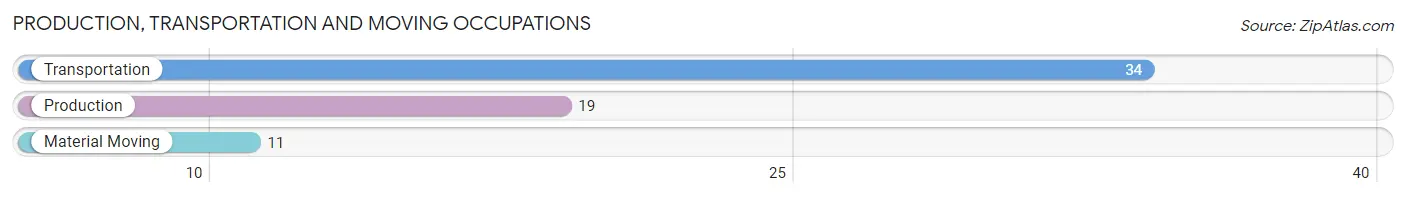
Production, Transportation and Moving Occupations
The most common Production, Transportation and Moving occupations in Sutton are Transportation (34 | 9.2%), Production (19 | 5.1%), and Material Moving (11 | 3.0%).
Production, Transportation and Moving Occupations by Sex
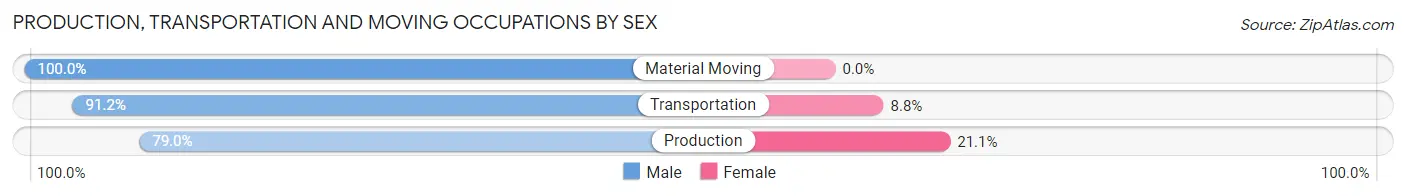
| Occupation | Male | Female |
| Production | 15 (78.9%) | 4 (21.0%) |
| Transportation | 31 (91.2%) | 3 (8.8%) |
| Material Moving | 11 (100.0%) | 0 (0.0%) |
| Total (Category) | 57 (89.1%) | 7 (10.9%) |
| Total (Overall) | 168 (45.5%) | 201 (54.5%) |
Employment Industries by Sex in Sutton
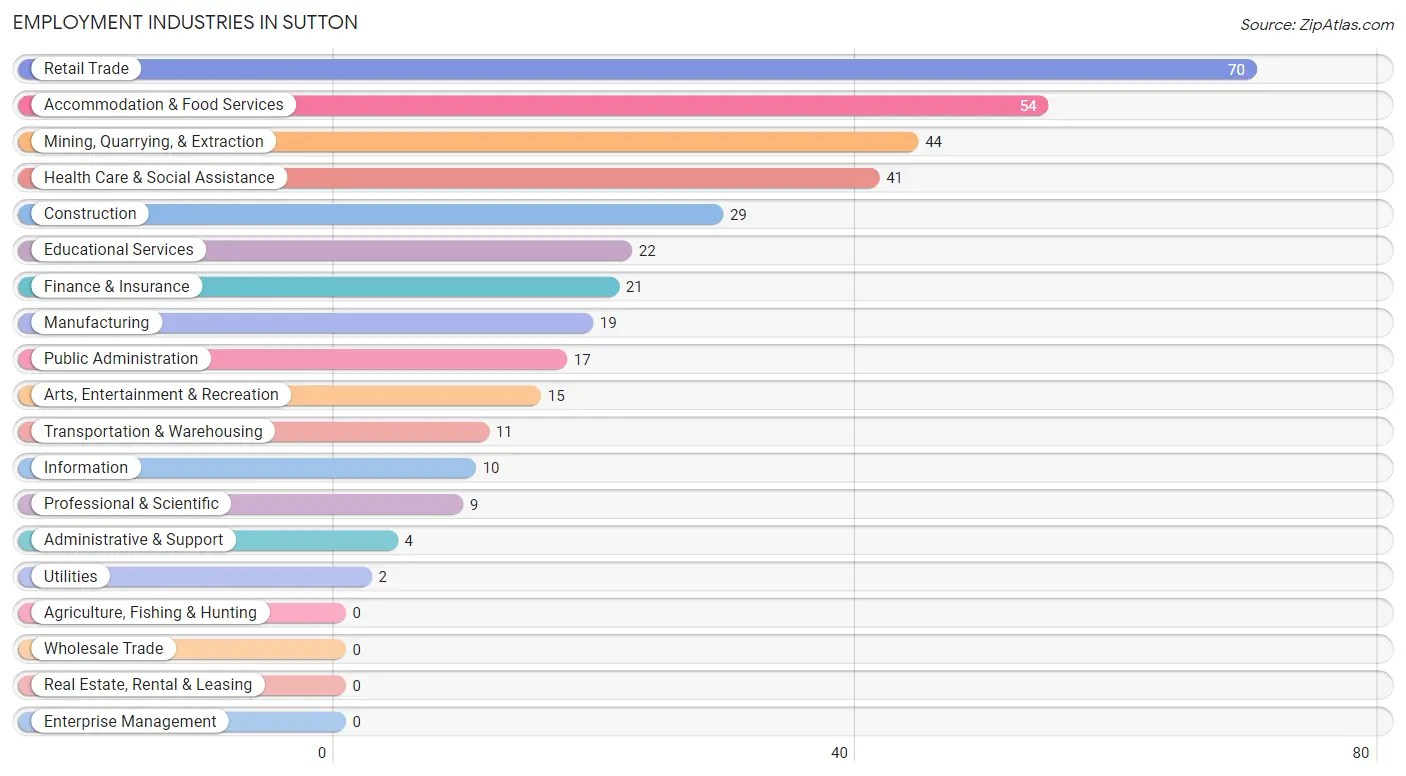
Employment Industries in Sutton
The major employment industries in Sutton include Retail Trade (70 | 19.0%), Accommodation & Food Services (54 | 14.6%), Mining, Quarrying, & Extraction (44 | 11.9%), Health Care & Social Assistance (41 | 11.1%), and Construction (29 | 7.9%).
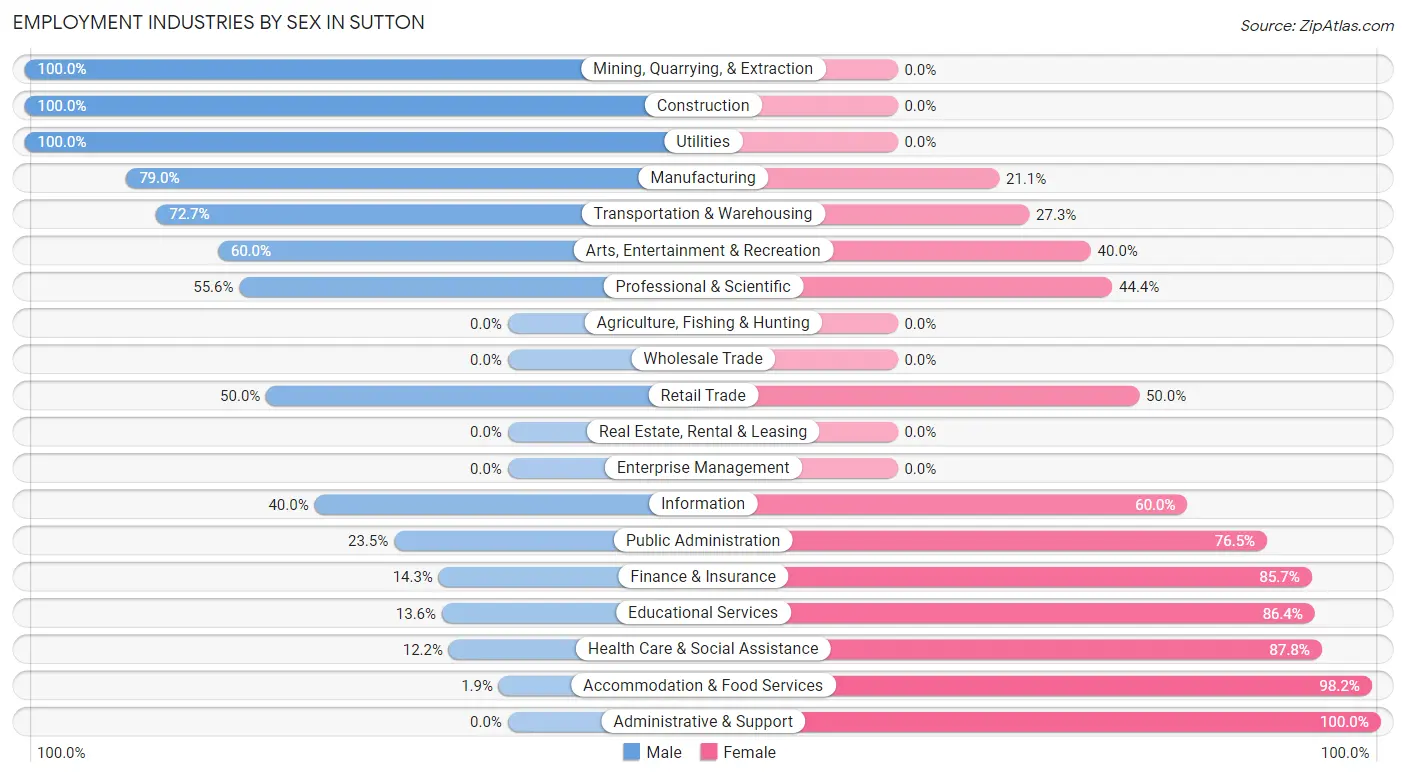
Employment Industries by Sex in Sutton
The Sutton industries that see more men than women are Mining, Quarrying, & Extraction (100.0%), Construction (100.0%), and Utilities (100.0%), whereas the industries that tend to have a higher number of women are Administrative & Support (100.0%), Accommodation & Food Services (98.2%), and Health Care & Social Assistance (87.8%).
| Industry | Male | Female |
| Agriculture, Fishing & Hunting | 0 (0.0%) | 0 (0.0%) |
| Mining, Quarrying, & Extraction | 44 (100.0%) | 0 (0.0%) |
| Construction | 29 (100.0%) | 0 (0.0%) |
| Manufacturing | 15 (78.9%) | 4 (21.0%) |
| Wholesale Trade | 0 (0.0%) | 0 (0.0%) |
| Retail Trade | 35 (50.0%) | 35 (50.0%) |
| Transportation & Warehousing | 8 (72.7%) | 3 (27.3%) |
| Utilities | 2 (100.0%) | 0 (0.0%) |
| Information | 4 (40.0%) | 6 (60.0%) |
| Finance & Insurance | 3 (14.3%) | 18 (85.7%) |
| Real Estate, Rental & Leasing | 0 (0.0%) | 0 (0.0%) |
| Professional & Scientific | 5 (55.6%) | 4 (44.4%) |
| Enterprise Management | 0 (0.0%) | 0 (0.0%) |
| Administrative & Support | 0 (0.0%) | 4 (100.0%) |
| Educational Services | 3 (13.6%) | 19 (86.4%) |
| Health Care & Social Assistance | 5 (12.2%) | 36 (87.8%) |
| Arts, Entertainment & Recreation | 9 (60.0%) | 6 (40.0%) |
| Accommodation & Food Services | 1 (1.8%) | 53 (98.2%) |
| Public Administration | 4 (23.5%) | 13 (76.5%) |
| Total | 168 (45.5%) | 201 (54.5%) |
Education in Sutton
School Enrollment in Sutton
The most common levels of schooling among the 156 students in Sutton are high school (111 | 71.2%), middle school (35 | 22.4%), and elementary school (10 | 6.4%).
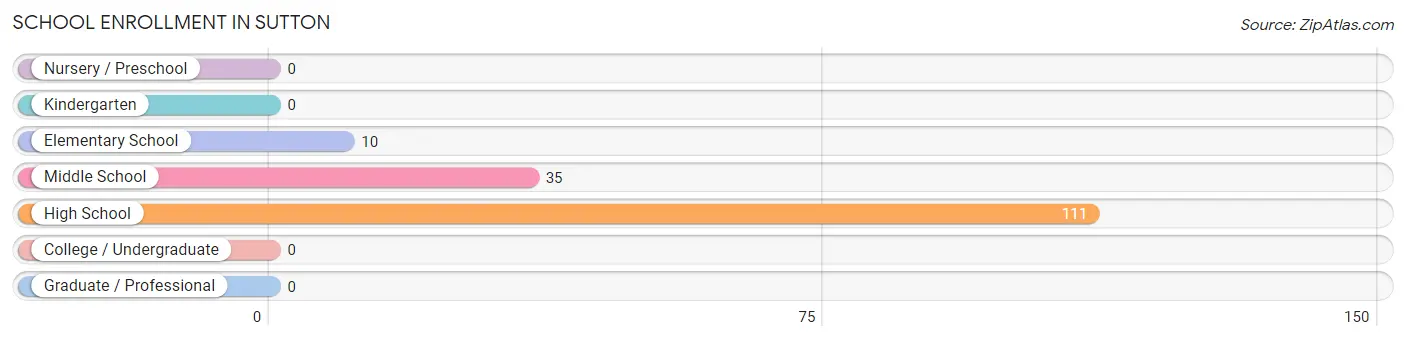
| School Level | # Students | % Students |
| Nursery / Preschool | 0 | 0.0% |
| Kindergarten | 0 | 0.0% |
| Elementary School | 10 | 6.4% |
| Middle School | 35 | 22.4% |
| High School | 111 | 71.2% |
| College / Undergraduate | 0 | 0.0% |
| Graduate / Professional | 0 | 0.0% |
| Total | 156 | 100.0% |
School Enrollment by Age by Funding Source in Sutton
Out of a total of 156 students who are enrolled in schools in Sutton, 11 (7.1%) attend a private institution, while the remaining 145 (92.9%) are enrolled in public schools. The age group of 15 to 17 year olds has the highest likelihood of being enrolled in private schools, with 11 (13.4% in the age bracket) enrolled. Conversely, the age group of 5 to 9 year old has the lowest likelihood of being enrolled in a private school, with 8 (100.0% in the age bracket) attending a public institution.
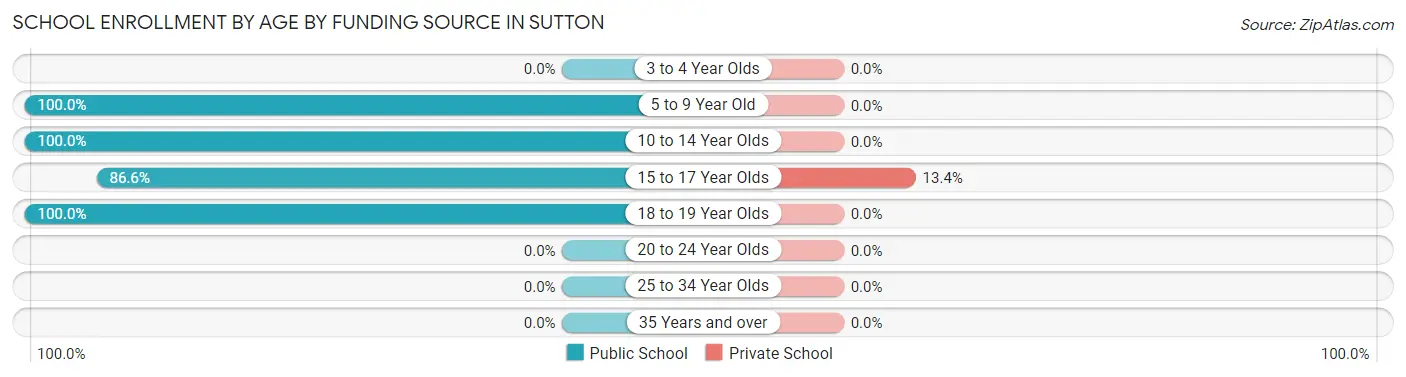
| Age Bracket | Public School | Private School |
| 3 to 4 Year Olds | 0 (0.0%) | 0 (0.0%) |
| 5 to 9 Year Old | 8 (100.0%) | 0 (0.0%) |
| 10 to 14 Year Olds | 51 (100.0%) | 0 (0.0%) |
| 15 to 17 Year Olds | 71 (86.6%) | 11 (13.4%) |
| 18 to 19 Year Olds | 15 (100.0%) | 0 (0.0%) |
| 20 to 24 Year Olds | 0 (0.0%) | 0 (0.0%) |
| 25 to 34 Year Olds | 0 (0.0%) | 0 (0.0%) |
| 35 Years and over | 0 (0.0%) | 0 (0.0%) |
| Total | 145 (92.9%) | 11 (7.1%) |
Educational Attainment by Field of Study in Sutton
Arts & humanities (28 | 22.8%), business (27 | 22.0%), science & technology (21 | 17.1%), education (18 | 14.6%), and psychology (16 | 13.0%) are the most common fields of study among 123 individuals in Sutton who have obtained a bachelor's degree or higher.
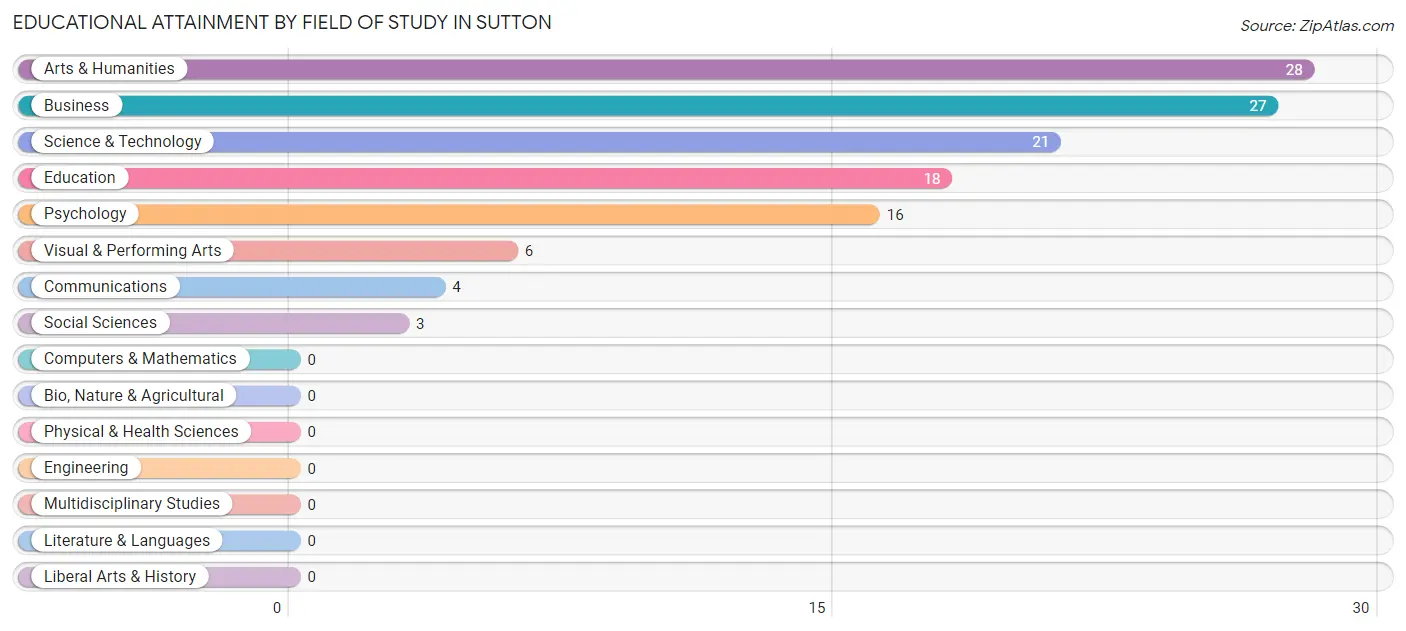
| Field of Study | # Graduates | % Graduates |
| Computers & Mathematics | 0 | 0.0% |
| Bio, Nature & Agricultural | 0 | 0.0% |
| Physical & Health Sciences | 0 | 0.0% |
| Psychology | 16 | 13.0% |
| Social Sciences | 3 | 2.4% |
| Engineering | 0 | 0.0% |
| Multidisciplinary Studies | 0 | 0.0% |
| Science & Technology | 21 | 17.1% |
| Business | 27 | 22.0% |
| Education | 18 | 14.6% |
| Literature & Languages | 0 | 0.0% |
| Liberal Arts & History | 0 | 0.0% |
| Visual & Performing Arts | 6 | 4.9% |
| Communications | 4 | 3.3% |
| Arts & Humanities | 28 | 22.8% |
| Total | 123 | 100.0% |
Transportation & Commute in Sutton
Vehicle Availability by Sex in Sutton
The most prevalent vehicle ownership categories in Sutton are males with 2 vehicles (49, accounting for 36.6%) and females with 2 vehicles (85, making up 25.9%).
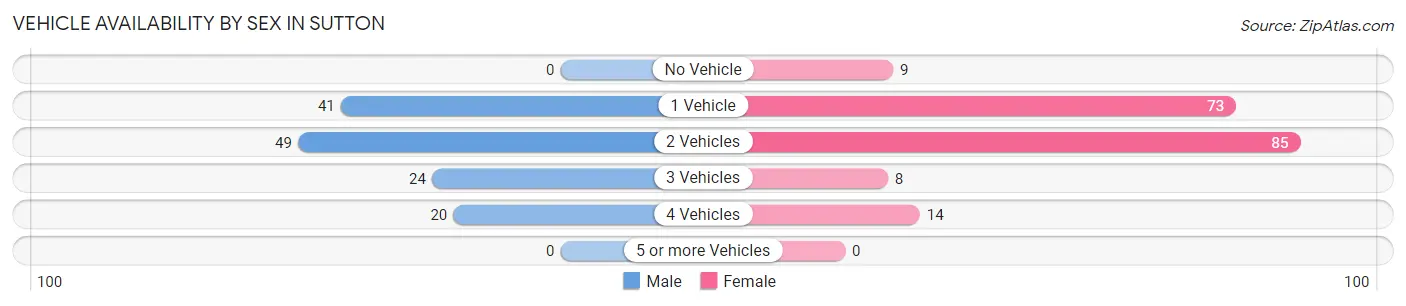
| Vehicles Available | Male | Female |
| No Vehicle | 0 (0.0%) | 9 (4.8%) |
| 1 Vehicle | 41 (30.6%) | 73 (38.6%) |
| 2 Vehicles | 49 (36.6%) | 85 (45.0%) |
| 3 Vehicles | 24 (17.9%) | 8 (4.2%) |
| 4 Vehicles | 20 (14.9%) | 14 (7.4%) |
| 5 or more Vehicles | 0 (0.0%) | 0 (0.0%) |
| Total | 134 (100.0%) | 189 (100.0%) |
Commute Time in Sutton
The most frequently occuring commute durations in Sutton are 5 to 9 minutes (73 commuters, 25.3%), 15 to 19 minutes (67 commuters, 23.2%), and 10 to 14 minutes (45 commuters, 15.6%).
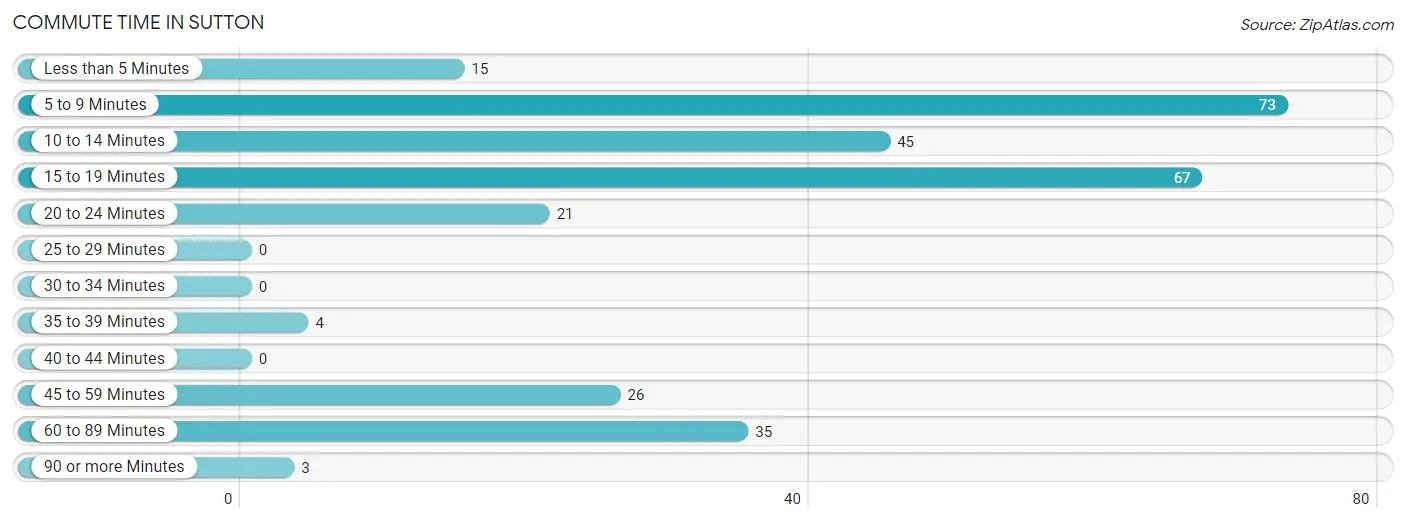
| Commute Time | # Commuters | % Commuters |
| Less than 5 Minutes | 15 | 5.2% |
| 5 to 9 Minutes | 73 | 25.3% |
| 10 to 14 Minutes | 45 | 15.6% |
| 15 to 19 Minutes | 67 | 23.2% |
| 20 to 24 Minutes | 21 | 7.3% |
| 25 to 29 Minutes | 0 | 0.0% |
| 30 to 34 Minutes | 0 | 0.0% |
| 35 to 39 Minutes | 4 | 1.4% |
| 40 to 44 Minutes | 0 | 0.0% |
| 45 to 59 Minutes | 26 | 9.0% |
| 60 to 89 Minutes | 35 | 12.1% |
| 90 or more Minutes | 3 | 1.0% |
Commute Time by Sex in Sutton
The most common commute times in Sutton are 5 to 9 minutes (24 commuters, 22.2%) for males and 15 to 19 minutes (58 commuters, 32.0%) for females.
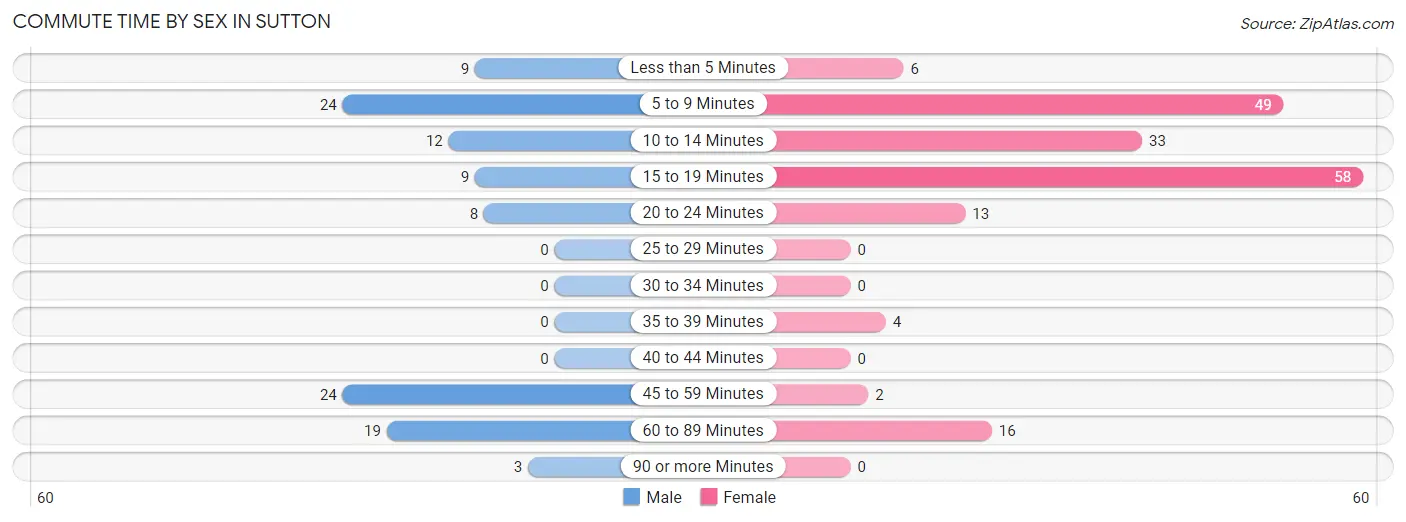
| Commute Time | Male | Female |
| Less than 5 Minutes | 9 (8.3%) | 6 (3.3%) |
| 5 to 9 Minutes | 24 (22.2%) | 49 (27.1%) |
| 10 to 14 Minutes | 12 (11.1%) | 33 (18.2%) |
| 15 to 19 Minutes | 9 (8.3%) | 58 (32.0%) |
| 20 to 24 Minutes | 8 (7.4%) | 13 (7.2%) |
| 25 to 29 Minutes | 0 (0.0%) | 0 (0.0%) |
| 30 to 34 Minutes | 0 (0.0%) | 0 (0.0%) |
| 35 to 39 Minutes | 0 (0.0%) | 4 (2.2%) |
| 40 to 44 Minutes | 0 (0.0%) | 0 (0.0%) |
| 45 to 59 Minutes | 24 (22.2%) | 2 (1.1%) |
| 60 to 89 Minutes | 19 (17.6%) | 16 (8.8%) |
| 90 or more Minutes | 3 (2.8%) | 0 (0.0%) |
Time of Departure to Work by Sex in Sutton
The most frequent times of departure to work in Sutton are 7:30 AM to 7:59 AM (21, 19.4%) for males and 4:00 PM to 11:59 PM (36, 19.9%) for females.
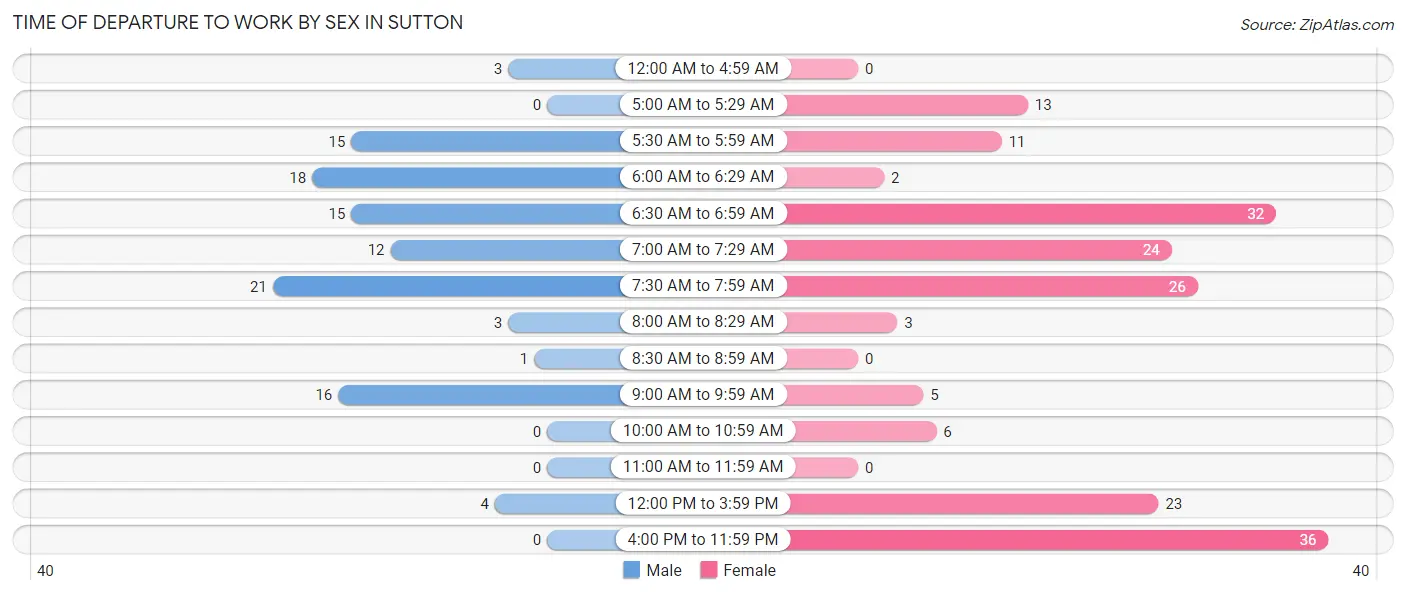
| Time of Departure | Male | Female |
| 12:00 AM to 4:59 AM | 3 (2.8%) | 0 (0.0%) |
| 5:00 AM to 5:29 AM | 0 (0.0%) | 13 (7.2%) |
| 5:30 AM to 5:59 AM | 15 (13.9%) | 11 (6.1%) |
| 6:00 AM to 6:29 AM | 18 (16.7%) | 2 (1.1%) |
| 6:30 AM to 6:59 AM | 15 (13.9%) | 32 (17.7%) |
| 7:00 AM to 7:29 AM | 12 (11.1%) | 24 (13.3%) |
| 7:30 AM to 7:59 AM | 21 (19.4%) | 26 (14.4%) |
| 8:00 AM to 8:29 AM | 3 (2.8%) | 3 (1.7%) |
| 8:30 AM to 8:59 AM | 1 (0.9%) | 0 (0.0%) |
| 9:00 AM to 9:59 AM | 16 (14.8%) | 5 (2.8%) |
| 10:00 AM to 10:59 AM | 0 (0.0%) | 6 (3.3%) |
| 11:00 AM to 11:59 AM | 0 (0.0%) | 0 (0.0%) |
| 12:00 PM to 3:59 PM | 4 (3.7%) | 23 (12.7%) |
| 4:00 PM to 11:59 PM | 0 (0.0%) | 36 (19.9%) |
| Total | 108 (100.0%) | 181 (100.0%) |
Housing Occupancy in Sutton
Occupancy by Ownership in Sutton
Of the total 366 dwellings in Sutton, owner-occupied units account for 268 (73.2%), while renter-occupied units make up 98 (26.8%).
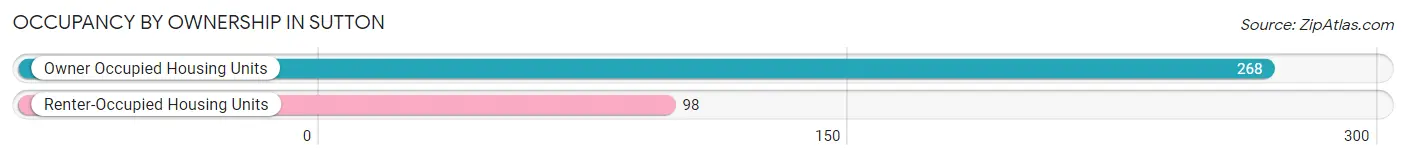
| Occupancy | # Housing Units | % Housing Units |
| Owner Occupied Housing Units | 268 | 73.2% |
| Renter-Occupied Housing Units | 98 | 26.8% |
| Total Occupied Housing Units | 366 | 100.0% |
Occupancy by Household Size in Sutton
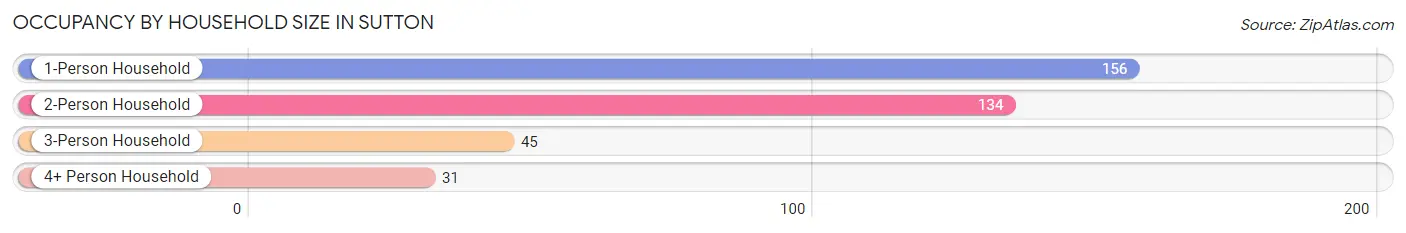
| Household Size | # Housing Units | % Housing Units |
| 1-Person Household | 156 | 42.6% |
| 2-Person Household | 134 | 36.6% |
| 3-Person Household | 45 | 12.3% |
| 4+ Person Household | 31 | 8.5% |
| Total Housing Units | 366 | 100.0% |
Occupancy by Ownership by Household Size in Sutton
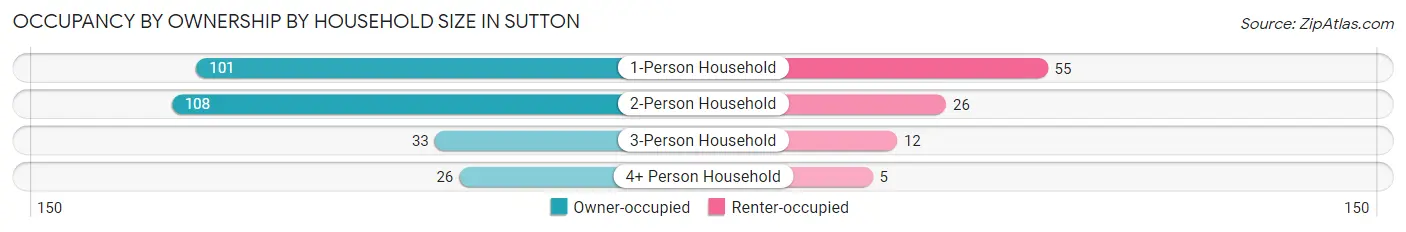
| Household Size | Owner-occupied | Renter-occupied |
| 1-Person Household | 101 (64.7%) | 55 (35.3%) |
| 2-Person Household | 108 (80.6%) | 26 (19.4%) |
| 3-Person Household | 33 (73.3%) | 12 (26.7%) |
| 4+ Person Household | 26 (83.9%) | 5 (16.1%) |
| Total Housing Units | 268 (73.2%) | 98 (26.8%) |
Occupancy by Educational Attainment in Sutton
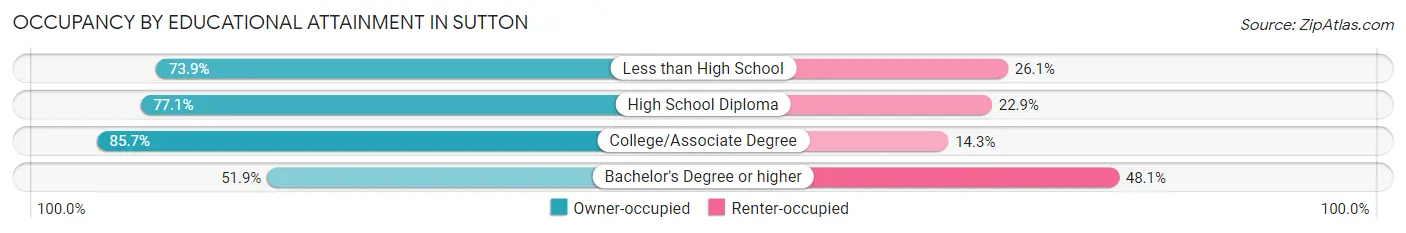
| Household Size | Owner-occupied | Renter-occupied |
| Less than High School | 34 (73.9%) | 12 (26.1%) |
| High School Diploma | 121 (77.1%) | 36 (22.9%) |
| College/Associate Degree | 72 (85.7%) | 12 (14.3%) |
| Bachelor's Degree or higher | 41 (51.9%) | 38 (48.1%) |
Occupancy by Age of Householder in Sutton
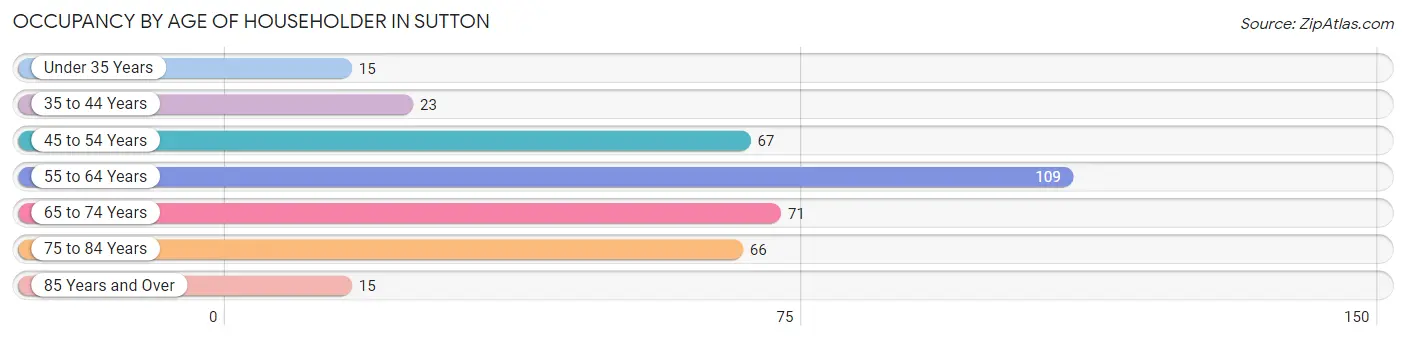
| Age Bracket | # Households | % Households |
| Under 35 Years | 15 | 4.1% |
| 35 to 44 Years | 23 | 6.3% |
| 45 to 54 Years | 67 | 18.3% |
| 55 to 64 Years | 109 | 29.8% |
| 65 to 74 Years | 71 | 19.4% |
| 75 to 84 Years | 66 | 18.0% |
| 85 Years and Over | 15 | 4.1% |
| Total | 366 | 100.0% |
Housing Finances in Sutton
Median Income by Occupancy in Sutton
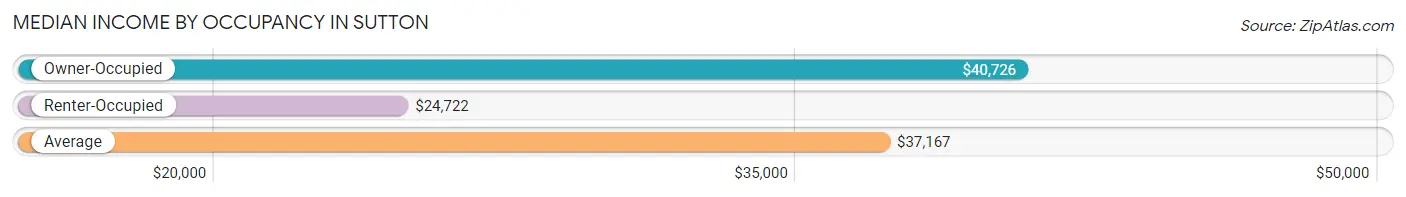
| Occupancy Type | # Households | Median Income |
| Owner-Occupied | 268 (73.2%) | $40,726 |
| Renter-Occupied | 98 (26.8%) | $24,722 |
| Average | 366 (100.0%) | $37,167 |
Occupancy by Householder Income Bracket in Sutton
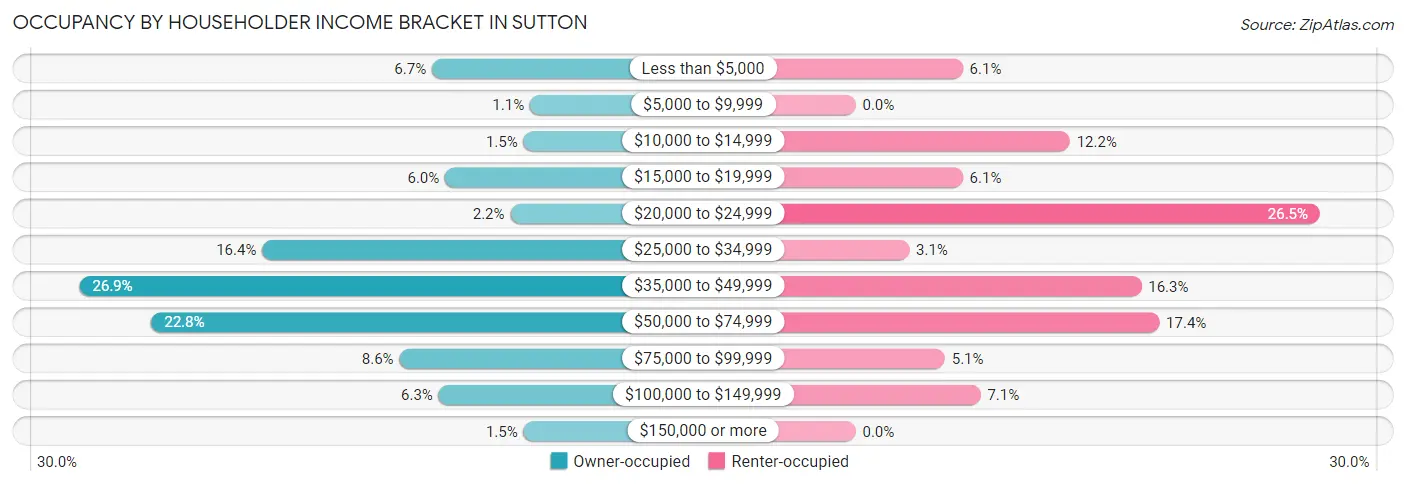
| Income Bracket | Owner-occupied | Renter-occupied |
| Less than $5,000 | 18 (6.7%) | 6 (6.1%) |
| $5,000 to $9,999 | 3 (1.1%) | 0 (0.0%) |
| $10,000 to $14,999 | 4 (1.5%) | 12 (12.2%) |
| $15,000 to $19,999 | 16 (6.0%) | 6 (6.1%) |
| $20,000 to $24,999 | 6 (2.2%) | 26 (26.5%) |
| $25,000 to $34,999 | 44 (16.4%) | 3 (3.1%) |
| $35,000 to $49,999 | 72 (26.9%) | 16 (16.3%) |
| $50,000 to $74,999 | 61 (22.8%) | 17 (17.3%) |
| $75,000 to $99,999 | 23 (8.6%) | 5 (5.1%) |
| $100,000 to $149,999 | 17 (6.3%) | 7 (7.1%) |
| $150,000 or more | 4 (1.5%) | 0 (0.0%) |
| Total | 268 (100.0%) | 98 (100.0%) |
Monthly Housing Cost Tiers in Sutton
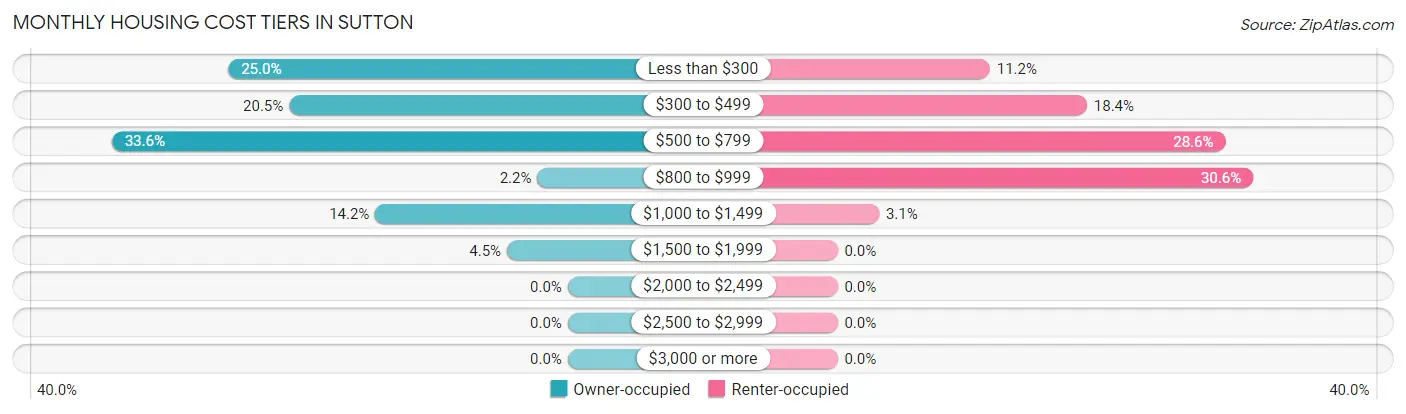
| Monthly Cost | Owner-occupied | Renter-occupied |
| Less than $300 | 67 (25.0%) | 11 (11.2%) |
| $300 to $499 | 55 (20.5%) | 18 (18.4%) |
| $500 to $799 | 90 (33.6%) | 28 (28.6%) |
| $800 to $999 | 6 (2.2%) | 30 (30.6%) |
| $1,000 to $1,499 | 38 (14.2%) | 3 (3.1%) |
| $1,500 to $1,999 | 12 (4.5%) | 0 (0.0%) |
| $2,000 to $2,499 | 0 (0.0%) | 0 (0.0%) |
| $2,500 to $2,999 | 0 (0.0%) | 0 (0.0%) |
| $3,000 or more | 0 (0.0%) | 0 (0.0%) |
| Total | 268 (100.0%) | 98 (100.0%) |
Physical Housing Characteristics in Sutton
Housing Structures in Sutton
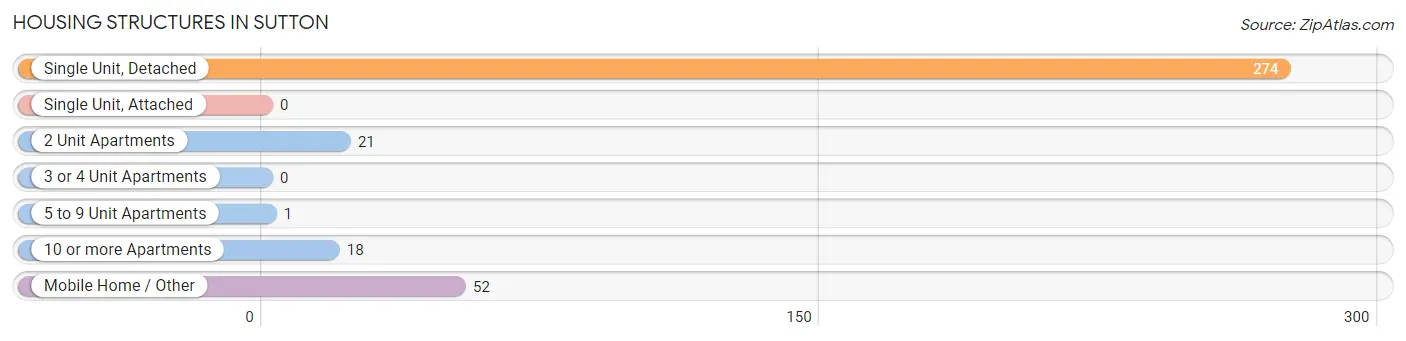
| Structure Type | # Housing Units | % Housing Units |
| Single Unit, Detached | 274 | 74.9% |
| Single Unit, Attached | 0 | 0.0% |
| 2 Unit Apartments | 21 | 5.7% |
| 3 or 4 Unit Apartments | 0 | 0.0% |
| 5 to 9 Unit Apartments | 1 | 0.3% |
| 10 or more Apartments | 18 | 4.9% |
| Mobile Home / Other | 52 | 14.2% |
| Total | 366 | 100.0% |
Housing Structures by Occupancy in Sutton
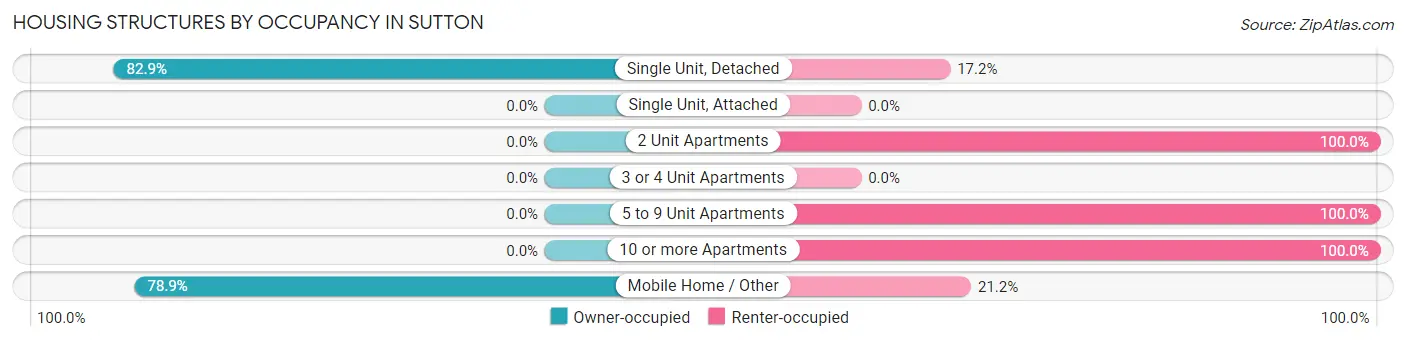
| Structure Type | Owner-occupied | Renter-occupied |
| Single Unit, Detached | 227 (82.9%) | 47 (17.2%) |
| Single Unit, Attached | 0 (0.0%) | 0 (0.0%) |
| 2 Unit Apartments | 0 (0.0%) | 21 (100.0%) |
| 3 or 4 Unit Apartments | 0 (0.0%) | 0 (0.0%) |
| 5 to 9 Unit Apartments | 0 (0.0%) | 1 (100.0%) |
| 10 or more Apartments | 0 (0.0%) | 18 (100.0%) |
| Mobile Home / Other | 41 (78.8%) | 11 (21.1%) |
| Total | 268 (73.2%) | 98 (26.8%) |
Housing Structures by Number of Rooms in Sutton
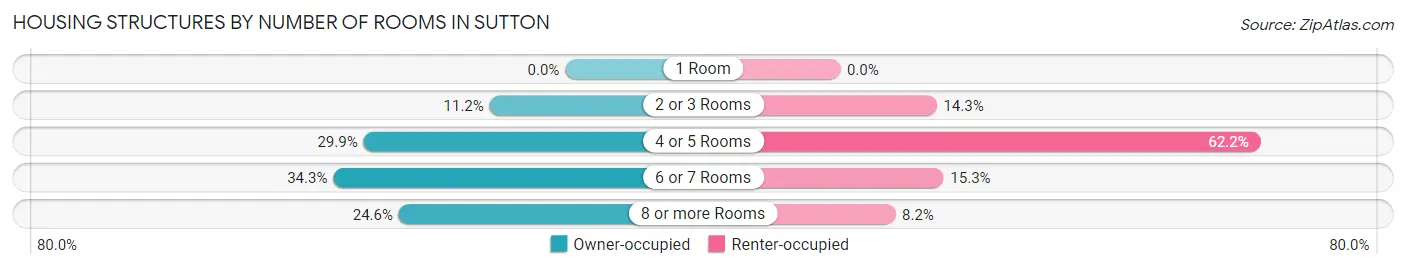
| Number of Rooms | Owner-occupied | Renter-occupied |
| 1 Room | 0 (0.0%) | 0 (0.0%) |
| 2 or 3 Rooms | 30 (11.2%) | 14 (14.3%) |
| 4 or 5 Rooms | 80 (29.8%) | 61 (62.2%) |
| 6 or 7 Rooms | 92 (34.3%) | 15 (15.3%) |
| 8 or more Rooms | 66 (24.6%) | 8 (8.2%) |
| Total | 268 (100.0%) | 98 (100.0%) |
Housing Structure by Heating Type in Sutton
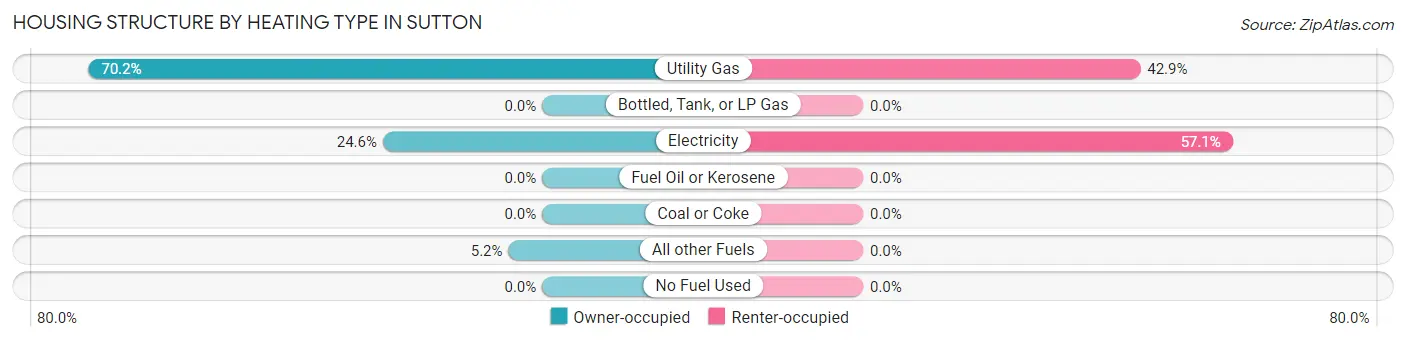
| Heating Type | Owner-occupied | Renter-occupied |
| Utility Gas | 188 (70.2%) | 42 (42.9%) |
| Bottled, Tank, or LP Gas | 0 (0.0%) | 0 (0.0%) |
| Electricity | 66 (24.6%) | 56 (57.1%) |
| Fuel Oil or Kerosene | 0 (0.0%) | 0 (0.0%) |
| Coal or Coke | 0 (0.0%) | 0 (0.0%) |
| All other Fuels | 14 (5.2%) | 0 (0.0%) |
| No Fuel Used | 0 (0.0%) | 0 (0.0%) |
| Total | 268 (100.0%) | 98 (100.0%) |
Household Vehicle Usage in Sutton
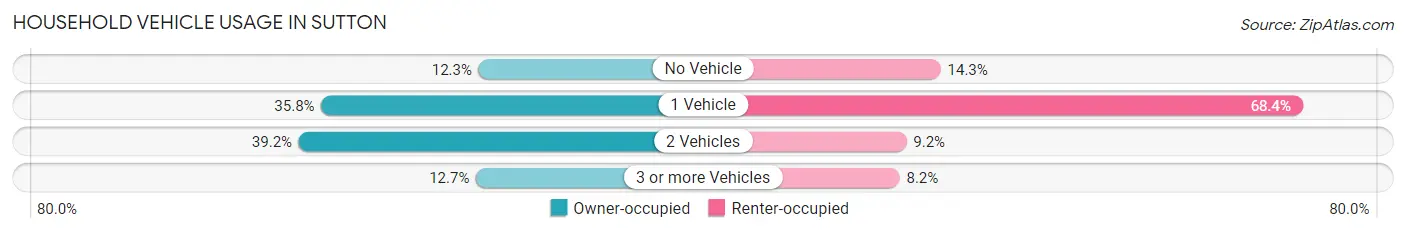
| Vehicles per Household | Owner-occupied | Renter-occupied |
| No Vehicle | 33 (12.3%) | 14 (14.3%) |
| 1 Vehicle | 96 (35.8%) | 67 (68.4%) |
| 2 Vehicles | 105 (39.2%) | 9 (9.2%) |
| 3 or more Vehicles | 34 (12.7%) | 8 (8.2%) |
| Total | 268 (100.0%) | 98 (100.0%) |
Real Estate & Mortgages in Sutton
Real Estate and Mortgage Overview in Sutton
| Characteristic | Without Mortgage | With Mortgage |
| Housing Units | 142 | 126 |
| Median Property Value | $80,000 | $72,900 |
| Median Household Income | $45,000 | $0 |
| Monthly Housing Costs | $312 | $0 |
| Real Estate Taxes | $369 | $0 |
Property Value by Mortgage Status in Sutton
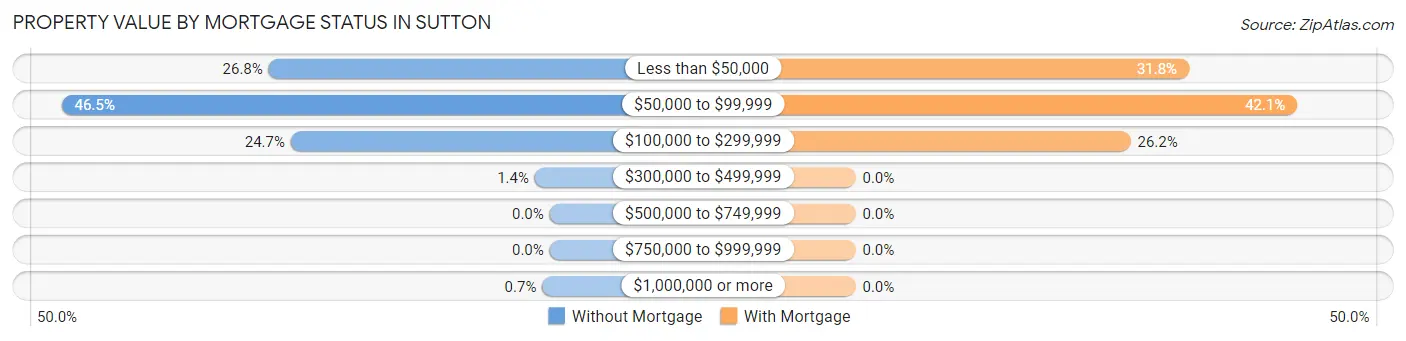
| Property Value | Without Mortgage | With Mortgage |
| Less than $50,000 | 38 (26.8%) | 40 (31.8%) |
| $50,000 to $99,999 | 66 (46.5%) | 53 (42.1%) |
| $100,000 to $299,999 | 35 (24.6%) | 33 (26.2%) |
| $300,000 to $499,999 | 2 (1.4%) | 0 (0.0%) |
| $500,000 to $749,999 | 0 (0.0%) | 0 (0.0%) |
| $750,000 to $999,999 | 0 (0.0%) | 0 (0.0%) |
| $1,000,000 or more | 1 (0.7%) | 0 (0.0%) |
| Total | 142 (100.0%) | 126 (100.0%) |
Household Income by Mortgage Status in Sutton
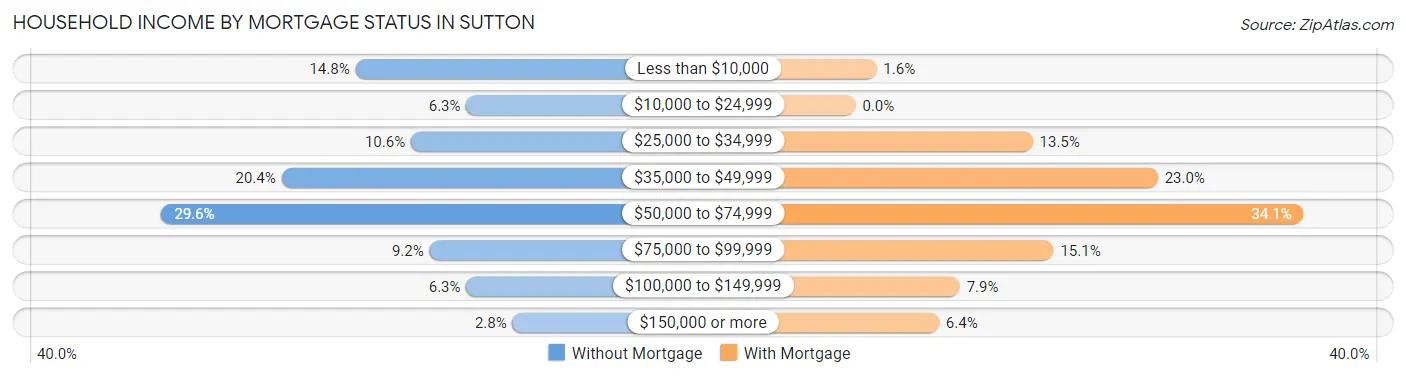
| Household Income | Without Mortgage | With Mortgage |
| Less than $10,000 | 21 (14.8%) | 2 (1.6%) |
| $10,000 to $24,999 | 9 (6.3%) | 0 (0.0%) |
| $25,000 to $34,999 | 15 (10.6%) | 17 (13.5%) |
| $35,000 to $49,999 | 29 (20.4%) | 29 (23.0%) |
| $50,000 to $74,999 | 42 (29.6%) | 43 (34.1%) |
| $75,000 to $99,999 | 13 (9.1%) | 19 (15.1%) |
| $100,000 to $149,999 | 9 (6.3%) | 10 (7.9%) |
| $150,000 or more | 4 (2.8%) | 8 (6.4%) |
| Total | 142 (100.0%) | 126 (100.0%) |
Property Value to Household Income Ratio in Sutton
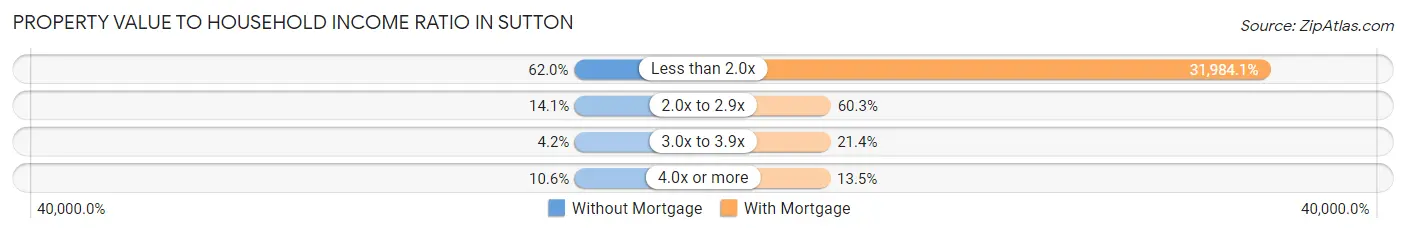
| Value-to-Income Ratio | Without Mortgage | With Mortgage |
| Less than 2.0x | 88 (62.0%) | 40,300 (31,984.1%) |
| 2.0x to 2.9x | 20 (14.1%) | 76 (60.3%) |
| 3.0x to 3.9x | 6 (4.2%) | 27 (21.4%) |
| 4.0x or more | 15 (10.6%) | 17 (13.5%) |
| Total | 142 (100.0%) | 126 (100.0%) |
Real Estate Taxes by Mortgage Status in Sutton
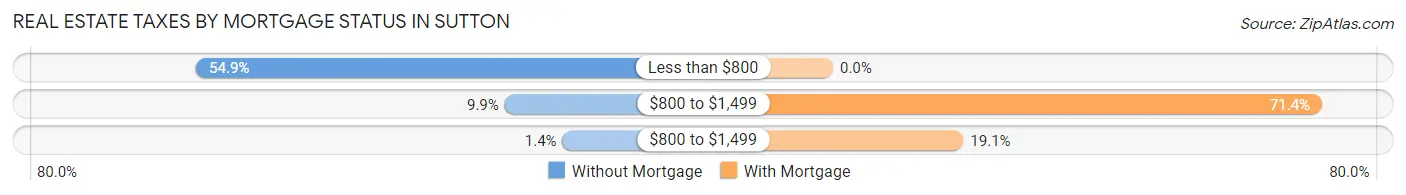
| Property Taxes | Without Mortgage | With Mortgage |
| Less than $800 | 78 (54.9%) | 0 (0.0%) |
| $800 to $1,499 | 14 (9.9%) | 90 (71.4%) |
| $800 to $1,499 | 2 (1.4%) | 24 (19.1%) |
| Total | 142 (100.0%) | 126 (100.0%) |
Health & Disability in Sutton
Health Insurance Coverage by Age in Sutton
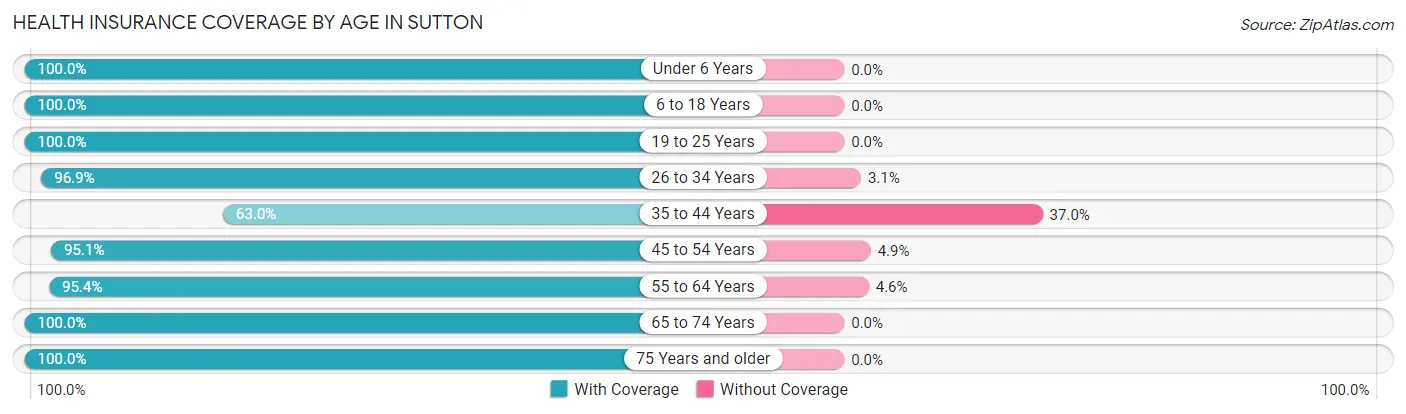
| Age Bracket | With Coverage | Without Coverage |
| Under 6 Years | 7 (100.0%) | 0 (0.0%) |
| 6 to 18 Years | 159 (100.0%) | 0 (0.0%) |
| 19 to 25 Years | 31 (100.0%) | 0 (0.0%) |
| 26 to 34 Years | 31 (96.9%) | 1 (3.1%) |
| 35 to 44 Years | 46 (63.0%) | 27 (37.0%) |
| 45 to 54 Years | 135 (95.1%) | 7 (4.9%) |
| 55 to 64 Years | 167 (95.4%) | 8 (4.6%) |
| 65 to 74 Years | 130 (100.0%) | 0 (0.0%) |
| 75 Years and older | 110 (100.0%) | 0 (0.0%) |
| Total | 816 (95.0%) | 43 (5.0%) |
Health Insurance Coverage by Citizenship Status in Sutton
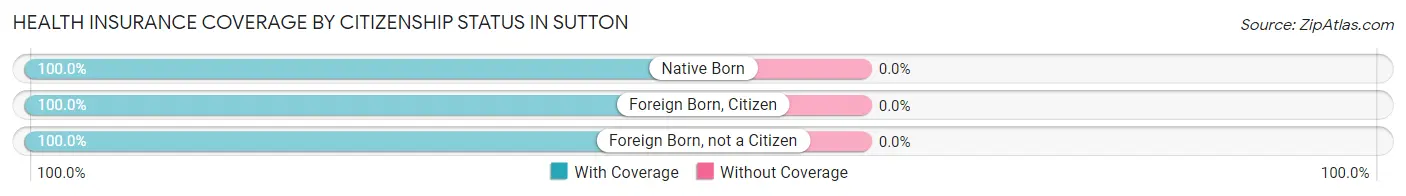
| Citizenship Status | With Coverage | Without Coverage |
| Native Born | 7 (100.0%) | 0 (0.0%) |
| Foreign Born, Citizen | 159 (100.0%) | 0 (0.0%) |
| Foreign Born, not a Citizen | 31 (100.0%) | 0 (0.0%) |
Health Insurance Coverage by Household Income in Sutton
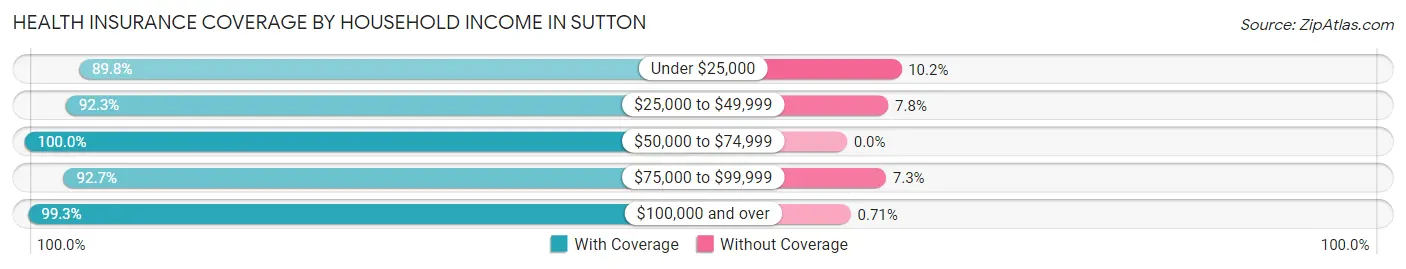
| Household Income | With Coverage | Without Coverage |
| Under $25,000 | 132 (89.8%) | 15 (10.2%) |
| $25,000 to $49,999 | 250 (92.2%) | 21 (7.7%) |
| $50,000 to $74,999 | 210 (100.0%) | 0 (0.0%) |
| $75,000 to $99,999 | 76 (92.7%) | 6 (7.3%) |
| $100,000 and over | 140 (99.3%) | 1 (0.7%) |
Public vs Private Health Insurance Coverage by Age in Sutton
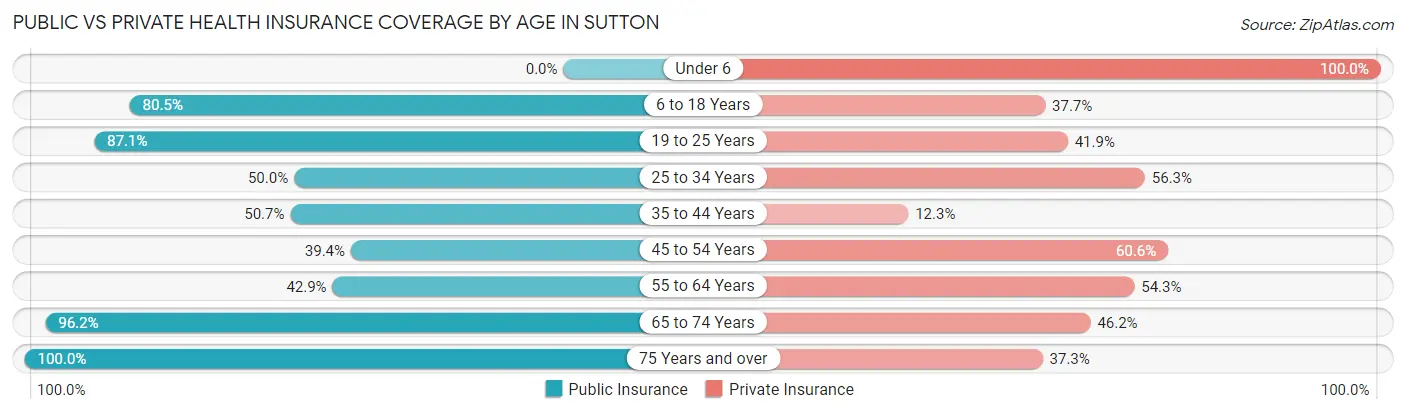
| Age Bracket | Public Insurance | Private Insurance |
| Under 6 | 0 (0.0%) | 7 (100.0%) |
| 6 to 18 Years | 128 (80.5%) | 60 (37.7%) |
| 19 to 25 Years | 27 (87.1%) | 13 (41.9%) |
| 25 to 34 Years | 16 (50.0%) | 18 (56.2%) |
| 35 to 44 Years | 37 (50.7%) | 9 (12.3%) |
| 45 to 54 Years | 56 (39.4%) | 86 (60.6%) |
| 55 to 64 Years | 75 (42.9%) | 95 (54.3%) |
| 65 to 74 Years | 125 (96.2%) | 60 (46.2%) |
| 75 Years and over | 110 (100.0%) | 41 (37.3%) |
| Total | 574 (66.8%) | 389 (45.3%) |
Disability Status by Sex by Age in Sutton
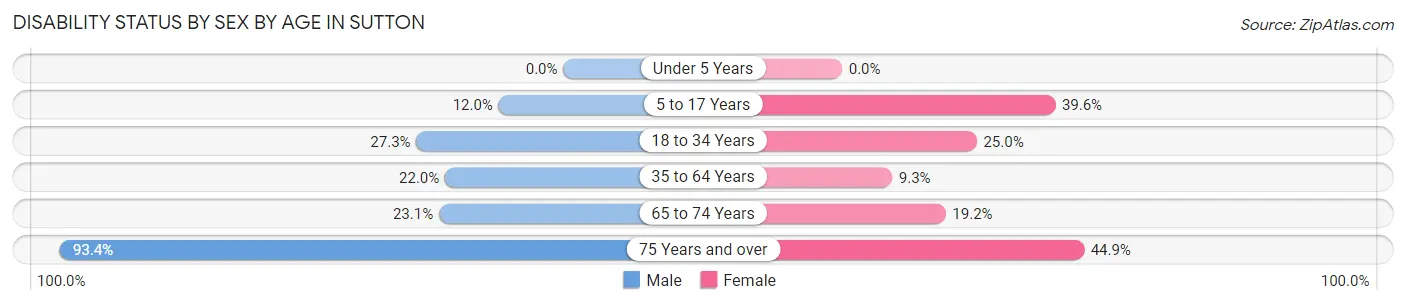
| Age Bracket | Male | Female |
| Under 5 Years | 0 (0.0%) | 0 (0.0%) |
| 5 to 17 Years | 6 (12.0%) | 36 (39.6%) |
| 18 to 34 Years | 9 (27.3%) | 12 (25.0%) |
| 35 to 64 Years | 36 (22.0%) | 21 (9.3%) |
| 65 to 74 Years | 12 (23.1%) | 15 (19.2%) |
| 75 Years and over | 57 (93.4%) | 22 (44.9%) |
Disability Class by Sex by Age in Sutton
Disability Class: Hearing Difficulty
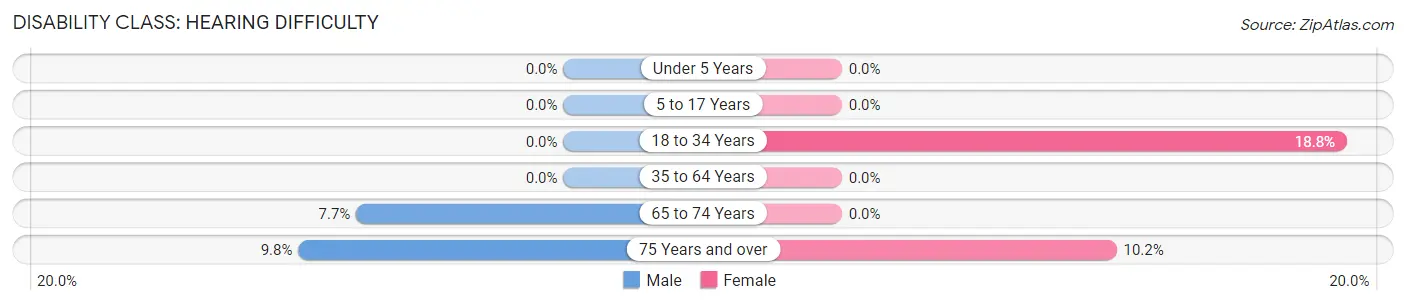
| Age Bracket | Male | Female |
| Under 5 Years | 0 (0.0%) | 0 (0.0%) |
| 5 to 17 Years | 0 (0.0%) | 0 (0.0%) |
| 18 to 34 Years | 0 (0.0%) | 9 (18.8%) |
| 35 to 64 Years | 0 (0.0%) | 0 (0.0%) |
| 65 to 74 Years | 4 (7.7%) | 0 (0.0%) |
| 75 Years and over | 6 (9.8%) | 5 (10.2%) |
Disability Class: Vision Difficulty
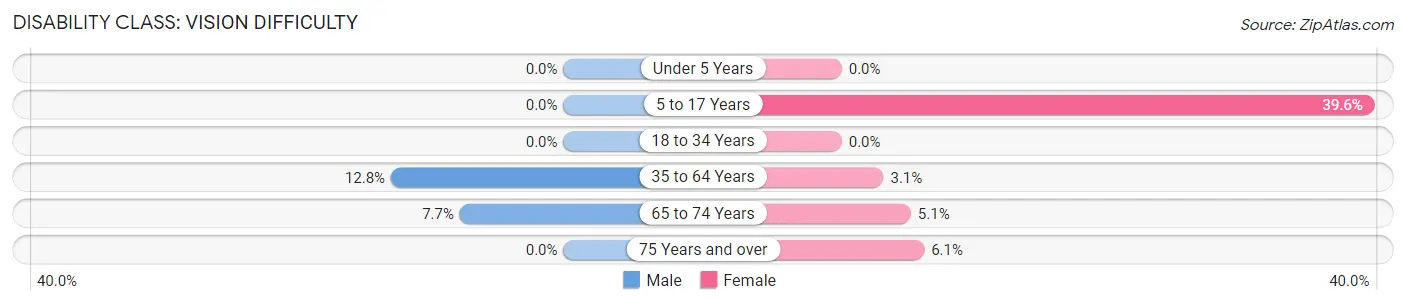
| Age Bracket | Male | Female |
| Under 5 Years | 0 (0.0%) | 0 (0.0%) |
| 5 to 17 Years | 0 (0.0%) | 36 (39.6%) |
| 18 to 34 Years | 0 (0.0%) | 0 (0.0%) |
| 35 to 64 Years | 21 (12.8%) | 7 (3.1%) |
| 65 to 74 Years | 4 (7.7%) | 4 (5.1%) |
| 75 Years and over | 0 (0.0%) | 3 (6.1%) |
Disability Class: Cognitive Difficulty
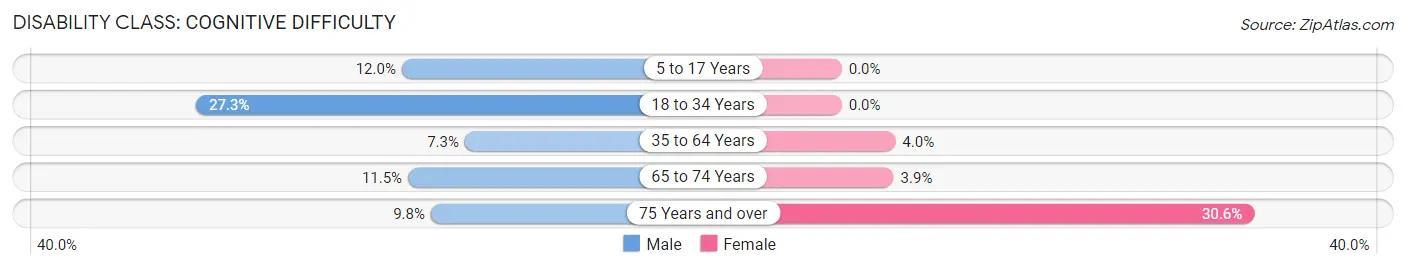
| Age Bracket | Male | Female |
| 5 to 17 Years | 6 (12.0%) | 0 (0.0%) |
| 18 to 34 Years | 9 (27.3%) | 0 (0.0%) |
| 35 to 64 Years | 12 (7.3%) | 9 (4.0%) |
| 65 to 74 Years | 6 (11.5%) | 3 (3.8%) |
| 75 Years and over | 6 (9.8%) | 15 (30.6%) |
Disability Class: Ambulatory Difficulty
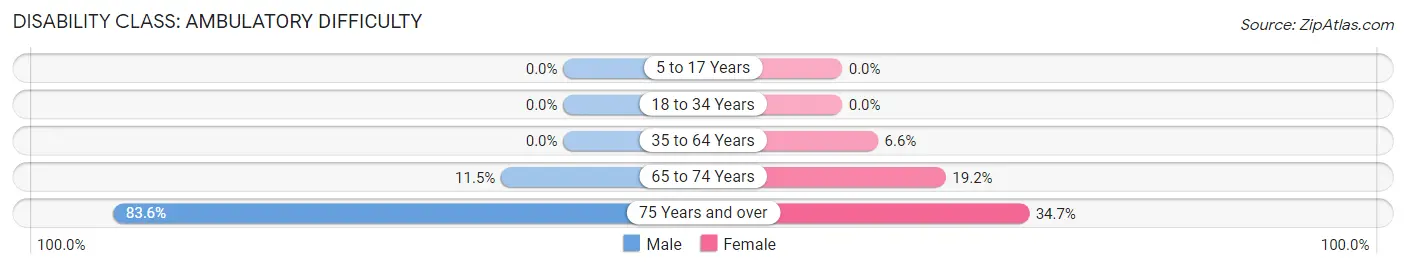
| Age Bracket | Male | Female |
| 5 to 17 Years | 0 (0.0%) | 0 (0.0%) |
| 18 to 34 Years | 0 (0.0%) | 0 (0.0%) |
| 35 to 64 Years | 0 (0.0%) | 15 (6.6%) |
| 65 to 74 Years | 6 (11.5%) | 15 (19.2%) |
| 75 Years and over | 51 (83.6%) | 17 (34.7%) |
Disability Class: Self-Care Difficulty
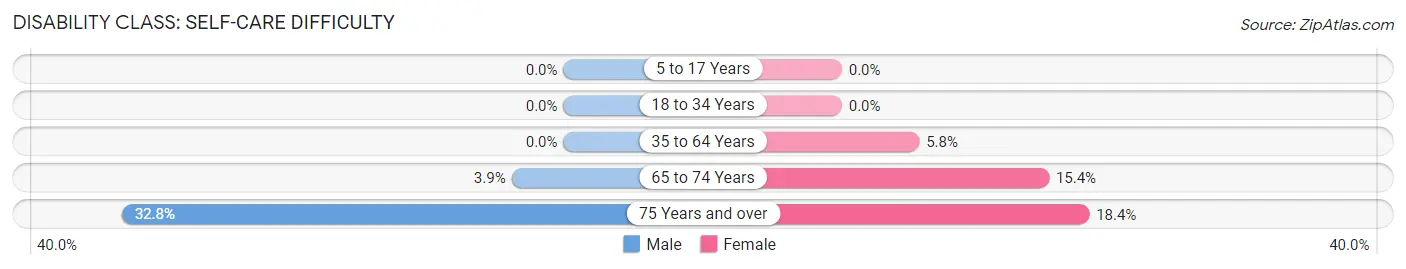
| Age Bracket | Male | Female |
| 5 to 17 Years | 0 (0.0%) | 0 (0.0%) |
| 18 to 34 Years | 0 (0.0%) | 0 (0.0%) |
| 35 to 64 Years | 0 (0.0%) | 13 (5.8%) |
| 65 to 74 Years | 2 (3.8%) | 12 (15.4%) |
| 75 Years and over | 20 (32.8%) | 9 (18.4%) |
Technology Access in Sutton
Computing Device Access in Sutton
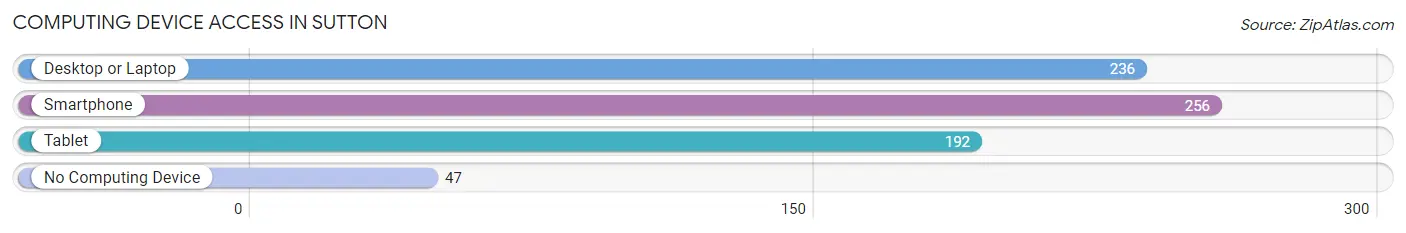
| Device Type | # Households | % Households |
| Desktop or Laptop | 236 | 64.5% |
| Smartphone | 256 | 70.0% |
| Tablet | 192 | 52.5% |
| No Computing Device | 47 | 12.8% |
| Total | 366 | 100.0% |
Internet Access in Sutton
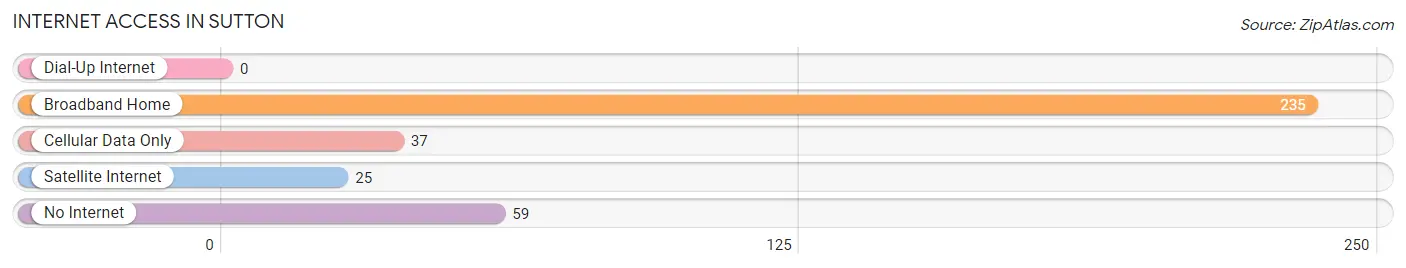
| Internet Type | # Households | % Households |
| Dial-Up Internet | 0 | 0.0% |
| Broadband Home | 235 | 64.2% |
| Cellular Data Only | 37 | 10.1% |
| Satellite Internet | 25 | 6.8% |
| No Internet | 59 | 16.1% |
| Total | 366 | 100.0% |
Sutton Summary
Sutton is a town located in Braxton County, West Virginia, United States. The population was 1,817 at the 2010 census. It is the county seat of Braxton County.
History
Sutton was founded in 1817 by William Sutton, a Revolutionary War veteran. The town was originally known as Suttonville, but the name was changed to Sutton in 1872. The town was incorporated in 1882.
Sutton was an important stop on the Staunton-Parkersburg Turnpike, which was the main route between the Shenandoah Valley and the Ohio River Valley. The turnpike was completed in 1838 and was the first major road in the area.
The town was also an important stop on the Baltimore and Ohio Railroad, which was completed in 1857. The railroad brought economic growth to the area and helped to make Sutton a major commercial center.
Geography
Sutton is located at the confluence of the Elk and Little Kanawha Rivers. The town is situated in the Appalachian Mountains and is surrounded by rolling hills and forests.
The climate in Sutton is humid continental, with hot summers and cold winters. The average annual temperature is 54°F (12°C).
Economy
The economy of Sutton is largely based on agriculture and tourism. The town is home to several small businesses, including restaurants, shops, and a variety of services.
The town is also home to several manufacturing companies, including a furniture factory, a plastics factory, and a paper mill.
Demographics
As of the 2010 census, the population of Sutton was 1,817. The racial makeup of the town was 97.3% White, 0.7% African American, 0.2% Native American, 0.2% Asian, 0.2% from other races, and 1.4% from two or more races.
The median household income in Sutton was $30,938, and the median family income was $37,813. The per capita income was $17,845. About 16.2% of the population was below the poverty line.
Conclusion
Sutton is a small town located in Braxton County, West Virginia. The town was founded in 1817 and has a long history of being an important stop on the Staunton-Parkersburg Turnpike and the Baltimore and Ohio Railroad. The economy of Sutton is largely based on agriculture and tourism, and the town is home to several small businesses and manufacturing companies. The population of Sutton was 1,817 at the 2010 census, and the median household income was $30,938.
Common Questions
What is Per Capita Income in Sutton?
Per Capita income in Sutton is $23,062.
What is the Median Family Income in Sutton?
Median Family Income in Sutton is $49,464.
What is the Median Household income in Sutton?
Median Household Income in Sutton is $37,167.
What is Income or Wage Gap in Sutton?
Income or Wage Gap in Sutton is 29.5%.
Women in Sutton earn 70.5 cents for every dollar earned by a man.
What is Inequality or Gini Index in Sutton?
Inequality or Gini Index in Sutton is 0.37.
What is the Total Population of Sutton?
Total Population of Sutton is 859.
What is the Total Male Population of Sutton?
Total Male Population of Sutton is 363.
What is the Total Female Population of Sutton?
Total Female Population of Sutton is 496.
What is the Ratio of Males per 100 Females in Sutton?
There are 73.19 Males per 100 Females in Sutton.
What is the Ratio of Females per 100 Males in Sutton?
There are 136.64 Females per 100 Males in Sutton.
What is the Median Population Age in Sutton?
Median Population Age in Sutton is 53.6 Years.
What is the Average Family Size in Sutton
Average Family Size in Sutton is 3.3 People.
What is the Average Household Size in Sutton
Average Household Size in Sutton is 2.3 People.
How Large is the Labor Force in Sutton?
There are 388 People in the Labor Forcein in Sutton.
What is the Percentage of People in the Labor Force in Sutton?
51.1% of People are in the Labor Force in Sutton.
What is the Unemployment Rate in Sutton?
Unemployment Rate in Sutton is 4.9%.