Summersville, WV Map & Demographics
Summersville Map
Summersville Overview
$34,368
PER CAPITA INCOME
$90,757
AVG FAMILY INCOME
$53,529
AVG HOUSEHOLD INCOME
5.3%
WAGE / INCOME GAP [ % ]
94.7¢/ $1
WAGE / INCOME GAP [ $ ]
0.49
INEQUALITY / GINI INDEX
3,415
TOTAL POPULATION
1,730
MALE POPULATION
1,685
FEMALE POPULATION
102.67
MALES / 100 FEMALES
97.40
FEMALES / 100 MALES
56.1
MEDIAN AGE
2.6
AVG FAMILY SIZE
2.1
AVG HOUSEHOLD SIZE
1,256
LABOR FORCE [ PEOPLE ]
43.3%
PERCENT IN LABOR FORCE
5.3%
UNEMPLOYMENT RATE
Summersville Zip Codes
Income in Summersville
Income Overview in Summersville
Per Capita Income in Summersville is $34,368, while median incomes of families and households are $90,757 and $53,529 respectively.
| Characteristic | Number | Measure |
| Per Capita Income | 3,415 | $34,368 |
| Median Family Income | 1,033 | $90,757 |
| Mean Family Income | 1,033 | $94,644 |
| Median Household Income | 1,556 | $53,529 |
| Mean Household Income | 1,556 | $75,163 |
| Income Deficit | 1,033 | $0 |
| Wage / Income Gap (%) | 3,415 | 5.28% |
| Wage / Income Gap ($) | 3,415 | 94.72¢ per $1 |
| Gini / Inequality Index | 3,415 | 0.49 |
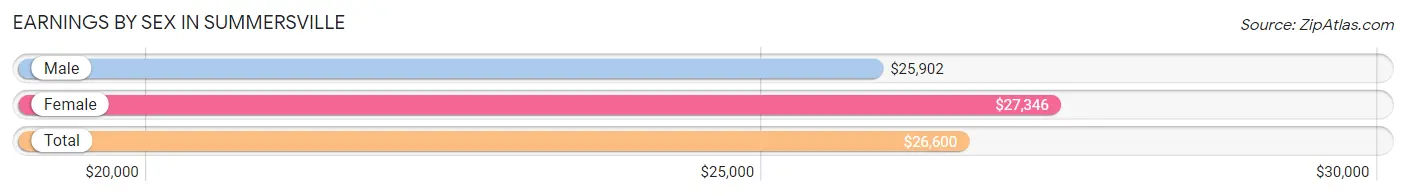
Earnings by Sex in Summersville
Average Earnings in Summersville are $26,600, $25,902 for men and $27,346 for women, a difference of 5.3%.
| Sex | Number | Average Earnings |
| Male | 718 (52.3%) | $25,902 |
| Female | 655 (47.7%) | $27,346 |
| Total | 1,373 (100.0%) | $26,600 |
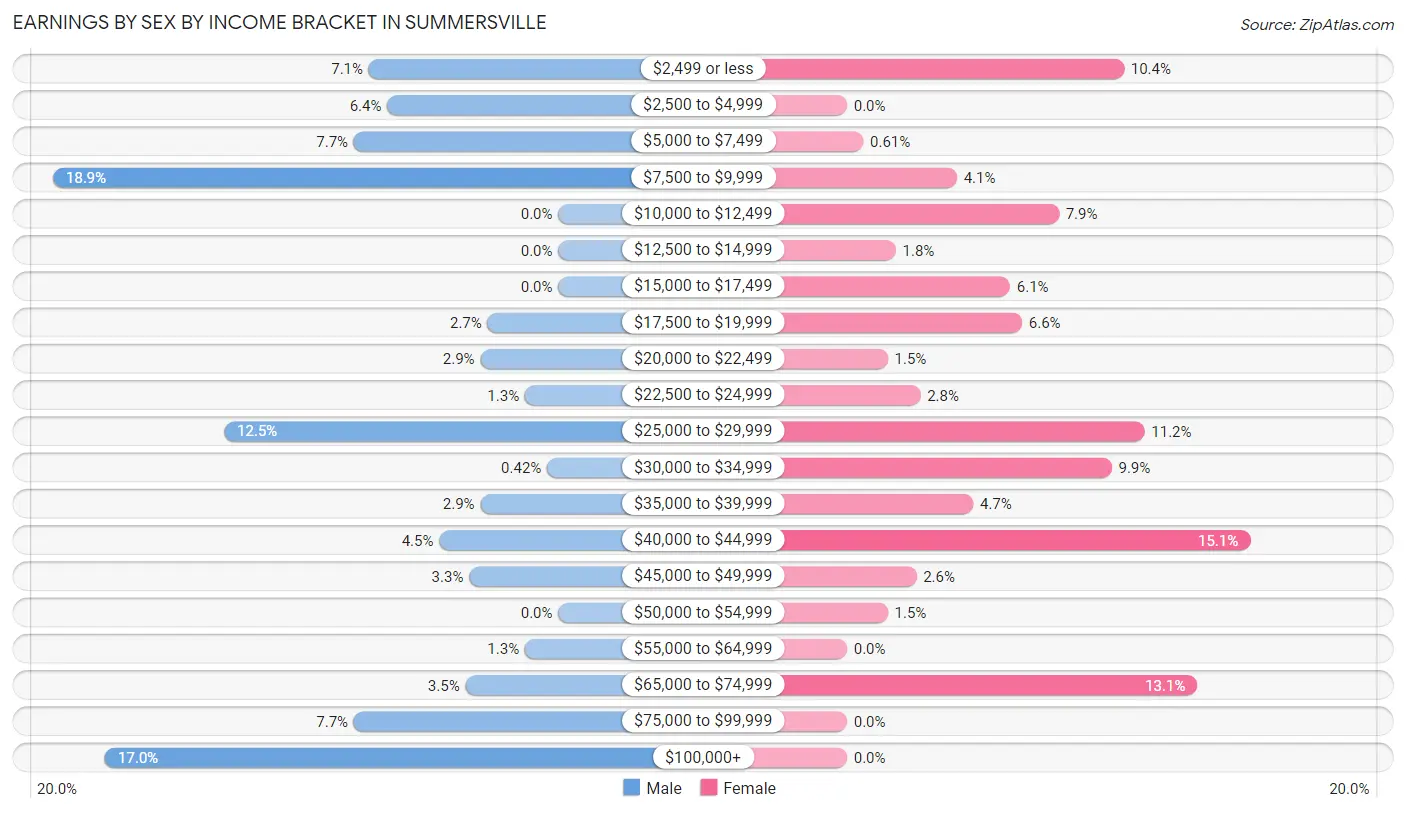
Earnings by Sex by Income Bracket in Summersville
The most common earnings brackets in Summersville are $7,500 to $9,999 for men (136 | 18.9%) and $40,000 to $44,999 for women (99 | 15.1%).
| Income | Male | Female |
| $2,499 or less | 51 (7.1%) | 68 (10.4%) |
| $2,500 to $4,999 | 46 (6.4%) | 0 (0.0%) |
| $5,000 to $7,499 | 55 (7.7%) | 4 (0.6%) |
| $7,500 to $9,999 | 136 (18.9%) | 27 (4.1%) |
| $10,000 to $12,499 | 0 (0.0%) | 52 (7.9%) |
| $12,500 to $14,999 | 0 (0.0%) | 12 (1.8%) |
| $15,000 to $17,499 | 0 (0.0%) | 40 (6.1%) |
| $17,500 to $19,999 | 19 (2.6%) | 43 (6.6%) |
| $20,000 to $22,499 | 21 (2.9%) | 10 (1.5%) |
| $22,500 to $24,999 | 9 (1.3%) | 18 (2.8%) |
| $25,000 to $29,999 | 90 (12.5%) | 73 (11.2%) |
| $30,000 to $34,999 | 3 (0.4%) | 65 (9.9%) |
| $35,000 to $39,999 | 21 (2.9%) | 31 (4.7%) |
| $40,000 to $44,999 | 32 (4.5%) | 99 (15.1%) |
| $45,000 to $49,999 | 24 (3.3%) | 17 (2.6%) |
| $50,000 to $54,999 | 0 (0.0%) | 10 (1.5%) |
| $55,000 to $64,999 | 9 (1.3%) | 0 (0.0%) |
| $65,000 to $74,999 | 25 (3.5%) | 86 (13.1%) |
| $75,000 to $99,999 | 55 (7.7%) | 0 (0.0%) |
| $100,000+ | 122 (17.0%) | 0 (0.0%) |
| Total | 718 (100.0%) | 655 (100.0%) |
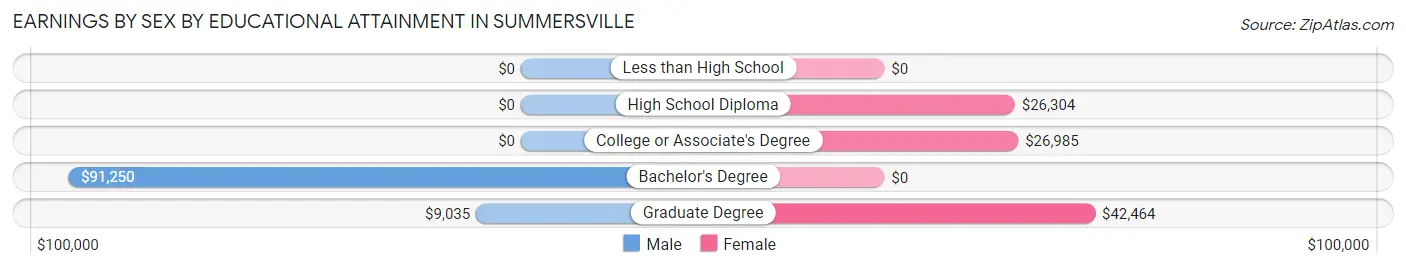
Earnings by Sex by Educational Attainment in Summersville
Average earnings in Summersville are $26,189 for men and $29,844 for women, a difference of 12.2%. Men with an educational attainment of bachelor's degree enjoy the highest average annual earnings of $91,250, while those with graduate degree education earn the least with $9,035. Women with an educational attainment of graduate degree earn the most with the average annual earnings of $42,464, while those with high school diploma education have the smallest earnings of $26,304.
| Educational Attainment | Male Income | Female Income |
| Less than High School | - | - |
| High School Diploma | - | - |
| College or Associate's Degree | - | - |
| Bachelor's Degree | $91,250 | $0 |
| Graduate Degree | $9,035 | $42,464 |
| Total | $26,189 | $29,844 |
Family Income in Summersville
Family Income Brackets in Summersville
According to the Summersville family income data, there are 429 families falling into the $100,000 to $149,999 income range, which is the most common income bracket and makes up 41.5% of all families.
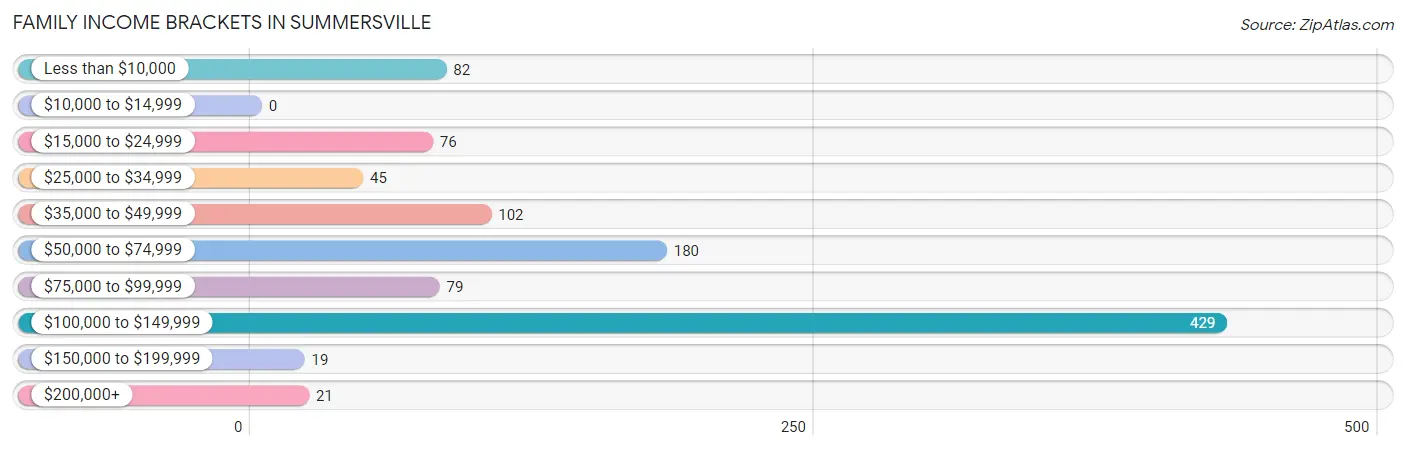
| Income Bracket | # Families | % Families |
| Less than $10,000 | 82 | 7.9% |
| $10,000 to $14,999 | 0 | 0.0% |
| $15,000 to $24,999 | 76 | 7.4% |
| $25,000 to $34,999 | 45 | 4.4% |
| $35,000 to $49,999 | 102 | 9.9% |
| $50,000 to $74,999 | 180 | 17.4% |
| $75,000 to $99,999 | 79 | 7.6% |
| $100,000 to $149,999 | 429 | 41.5% |
| $150,000 to $199,999 | 19 | 1.8% |
| $200,000+ | 21 | 2.0% |
Family Income by Famaliy Size in Summersville
2-person families (749 | 72.5%) account for the highest median family income in Summersville with $94,226 per family, while 2-person families (749 | 72.5%) have the highest median income of $47,113 per family member.
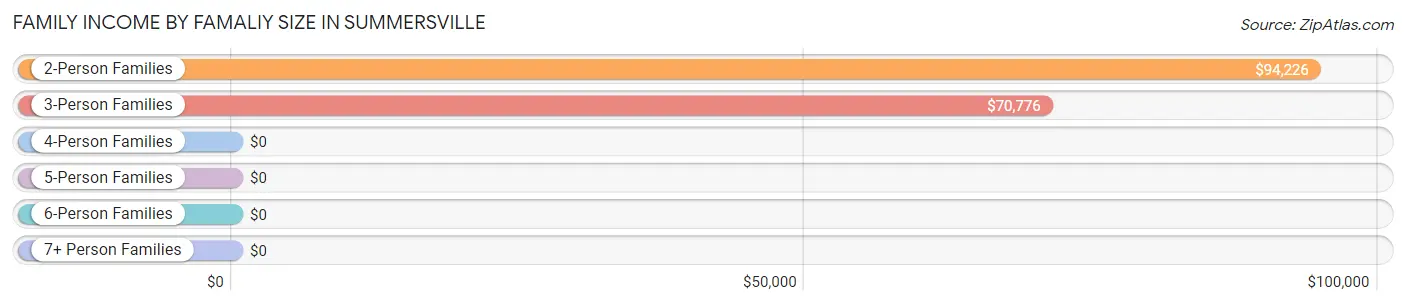
| Income Bracket | # Families | Median Income |
| 2-Person Families | 749 (72.5%) | $94,226 |
| 3-Person Families | 176 (17.0%) | $70,776 |
| 4-Person Families | 74 (7.2%) | $0 |
| 5-Person Families | 34 (3.3%) | $0 |
| 6-Person Families | 0 (0.0%) | $0 |
| 7+ Person Families | 0 (0.0%) | $0 |
| Total | 1,033 (100.0%) | $90,757 |
Family Income by Number of Earners in Summersville
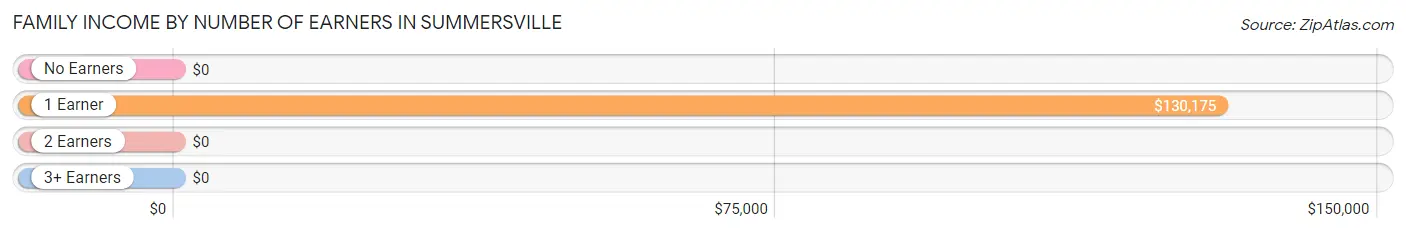
| Number of Earners | # Families | Median Income |
| No Earners | 289 (28.0%) | $0 |
| 1 Earner | 346 (33.5%) | $130,175 |
| 2 Earners | 371 (35.9%) | $0 |
| 3+ Earners | 27 (2.6%) | $0 |
| Total | 1,033 (100.0%) | $90,757 |
Household Income in Summersville
Household Income Brackets in Summersville
With 443 households falling in the category, the $100,000 to $149,999 income range is the most frequent in Summersville, accounting for 28.5% of all households. In contrast, only 19 households (1.2%) fall into the $150,000 to $199,999 income bracket, making it the least populous group.
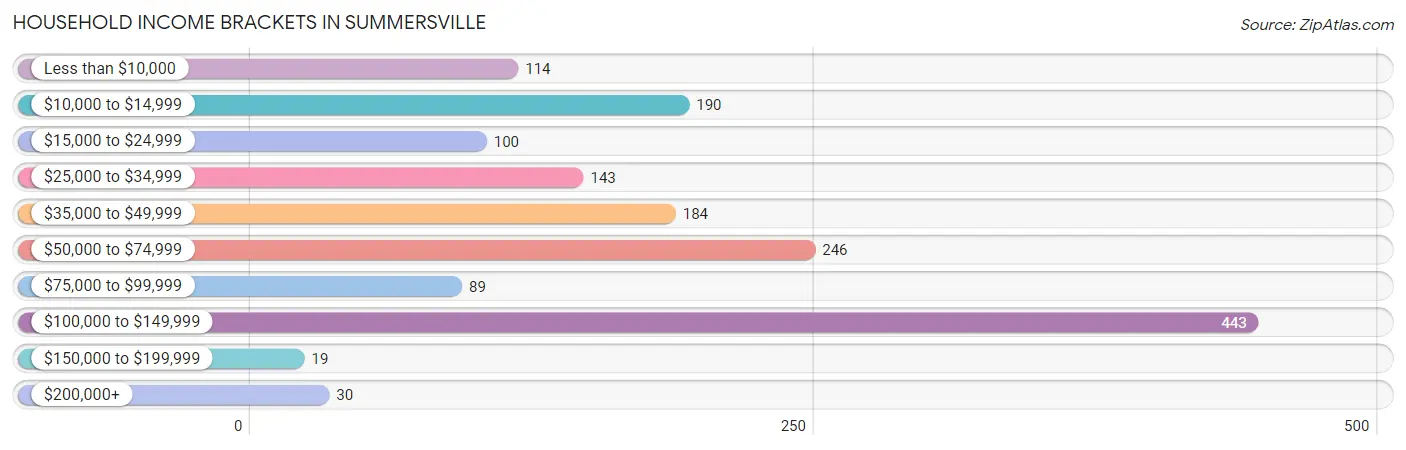
| Income Bracket | # Households | % Households |
| Less than $10,000 | 114 | 7.3% |
| $10,000 to $14,999 | 190 | 12.2% |
| $15,000 to $24,999 | 100 | 6.4% |
| $25,000 to $34,999 | 143 | 9.2% |
| $35,000 to $49,999 | 184 | 11.8% |
| $50,000 to $74,999 | 246 | 15.8% |
| $75,000 to $99,999 | 89 | 5.7% |
| $100,000 to $149,999 | 443 | 28.5% |
| $150,000 to $199,999 | 19 | 1.2% |
| $200,000+ | 30 | 1.9% |
Household Income by Householder Age in Summersville
The median household income in Summersville is $53,529, with the highest median household income of $67,961 found in the 65+ years age bracket for the primary householder. A total of 853 households (54.8%) fall into this category. Meanwhile, the 15 to 24 years age bracket for the primary householder has the lowest median household income of $0, with 29 households (1.9%) in this group.
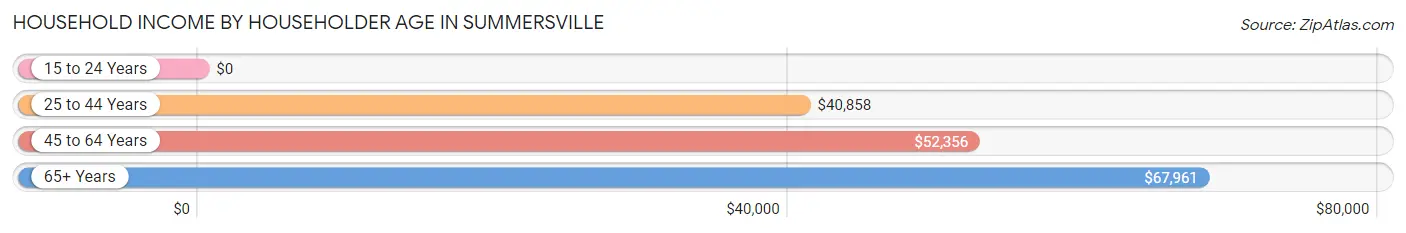
| Income Bracket | # Households | Median Income |
| 15 to 24 Years | 29 (1.9%) | $0 |
| 25 to 44 Years | 227 (14.6%) | $40,858 |
| 45 to 64 Years | 447 (28.7%) | $52,356 |
| 65+ Years | 853 (54.8%) | $67,961 |
| Total | 1,556 (100.0%) | $53,529 |
Poverty in Summersville
Income Below Poverty by Sex and Age in Summersville
With 9.6% poverty level for males and 25.5% for females among the residents of Summersville, 25 to 34 year old males and under 5 year old females are the most vulnerable to poverty, with 31 males (26.1%) and 32 females (100.0%) in their respective age groups living below the poverty level.
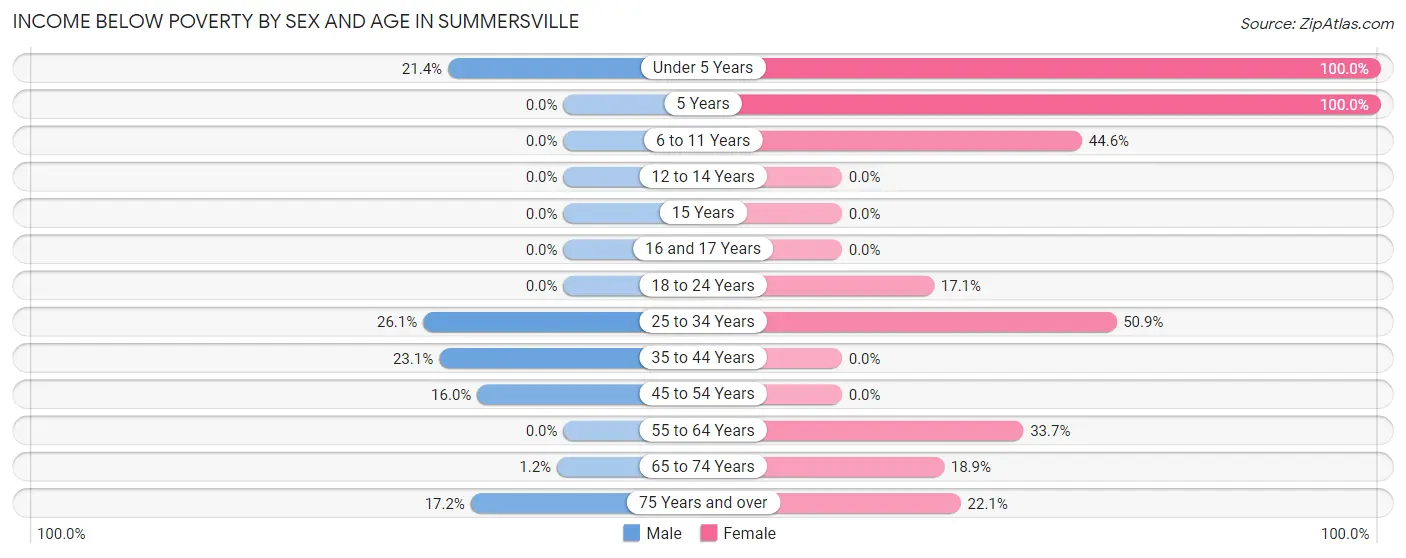
| Age Bracket | Male | Female |
| Under 5 Years | 24 (21.4%) | 32 (100.0%) |
| 5 Years | 0 (0.0%) | 23 (100.0%) |
| 6 to 11 Years | 0 (0.0%) | 41 (44.6%) |
| 12 to 14 Years | 0 (0.0%) | 0 (0.0%) |
| 15 Years | 0 (0.0%) | 0 (0.0%) |
| 16 and 17 Years | 0 (0.0%) | 0 (0.0%) |
| 18 to 24 Years | 0 (0.0%) | 20 (17.1%) |
| 25 to 34 Years | 31 (26.1%) | 82 (50.9%) |
| 35 to 44 Years | 15 (23.1%) | 0 (0.0%) |
| 45 to 54 Years | 24 (16.0%) | 0 (0.0%) |
| 55 to 64 Years | 0 (0.0%) | 97 (33.7%) |
| 65 to 74 Years | 3 (1.2%) | 71 (18.9%) |
| 75 Years and over | 65 (17.2%) | 56 (22.1%) |
| Total | 162 (9.6%) | 422 (25.5%) |
Income Above Poverty by Sex and Age in Summersville
According to the poverty statistics in Summersville, males aged 6 to 11 years and females aged 15 years are the age groups that are most secure financially, with 100.0% of males and 100.0% of females in these age groups living above the poverty line.
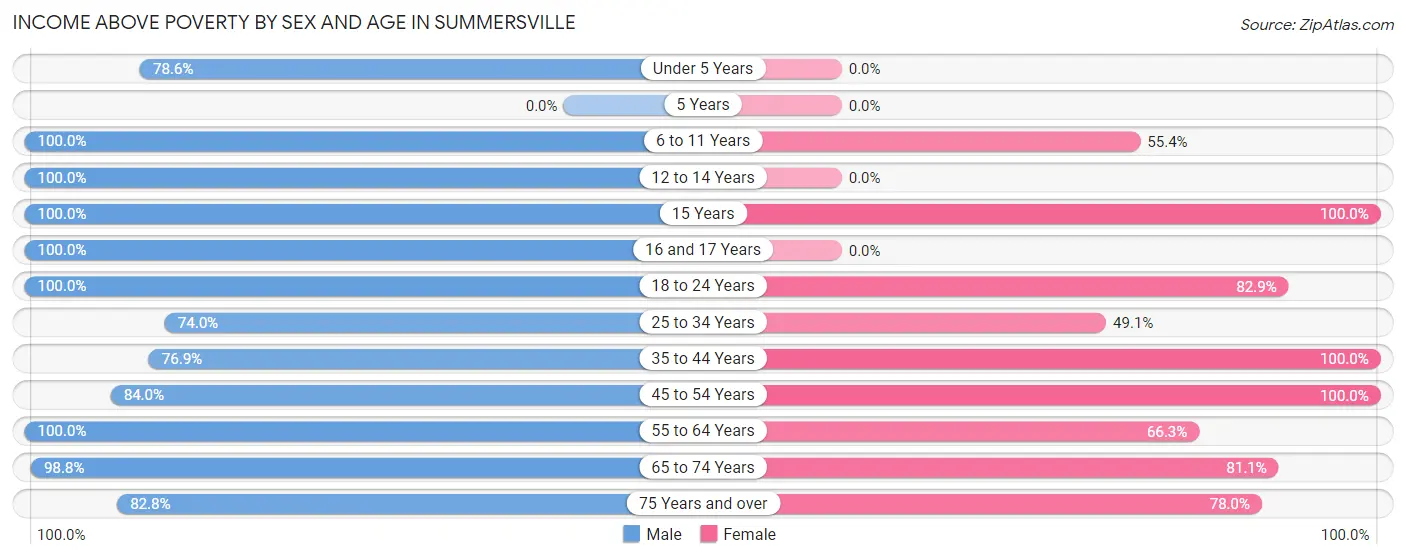
| Age Bracket | Male | Female |
| Under 5 Years | 88 (78.6%) | 0 (0.0%) |
| 5 Years | 0 (0.0%) | 0 (0.0%) |
| 6 to 11 Years | 88 (100.0%) | 51 (55.4%) |
| 12 to 14 Years | 38 (100.0%) | 0 (0.0%) |
| 15 Years | 111 (100.0%) | 19 (100.0%) |
| 16 and 17 Years | 193 (100.0%) | 0 (0.0%) |
| 18 to 24 Years | 32 (100.0%) | 97 (82.9%) |
| 25 to 34 Years | 88 (74.0%) | 79 (49.1%) |
| 35 to 44 Years | 50 (76.9%) | 71 (100.0%) |
| 45 to 54 Years | 126 (84.0%) | 226 (100.0%) |
| 55 to 64 Years | 153 (100.0%) | 191 (66.3%) |
| 65 to 74 Years | 250 (98.8%) | 304 (81.1%) |
| 75 Years and over | 313 (82.8%) | 198 (77.9%) |
| Total | 1,530 (90.4%) | 1,236 (74.6%) |
Income Below Poverty Among Married-Couple Families in Summersville
The poverty statistics for married-couple families in Summersville show that 6.4% or 57 of the total 886 families live below the poverty line. Families with no children have the highest poverty rate of 8.4%, comprising of 57 families. On the other hand, families with 1 or 2 children have the lowest poverty rate of 0.0%, which includes 0 families.
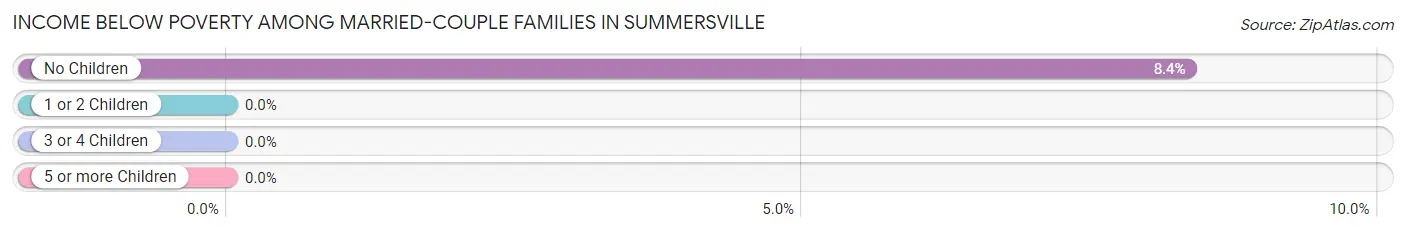
| Children | Above Poverty | Below Poverty |
| No Children | 626 (91.6%) | 57 (8.4%) |
| 1 or 2 Children | 203 (100.0%) | 0 (0.0%) |
| 3 or 4 Children | 0 (0.0%) | 0 (0.0%) |
| 5 or more Children | 0 (0.0%) | 0 (0.0%) |
| Total | 829 (93.6%) | 57 (6.4%) |
Income Below Poverty Among Single-Parent Households in Summersville
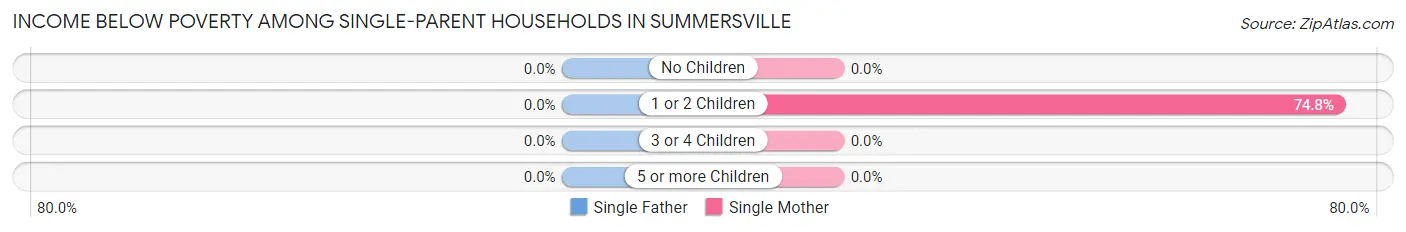
| Children | Single Father | Single Mother |
| No Children | 0 (0.0%) | 0 (0.0%) |
| 1 or 2 Children | 0 (0.0%) | 101 (74.8%) |
| 3 or 4 Children | 0 (0.0%) | 0 (0.0%) |
| 5 or more Children | 0 (0.0%) | 0 (0.0%) |
| Total | 0 (0.0%) | 101 (68.7%) |
Income Below Poverty Among Married-Couple vs Single-Parent Households in Summersville
The poverty data for Summersville shows that 57 of the married-couple family households (6.4%) and 101 of the single-parent households (68.7%) are living below the poverty level. Within the married-couple family households, those with no children have the highest poverty rate, with 57 households (8.4%) falling below the poverty line. Among the single-parent households, those with 1 or 2 children have the highest poverty rate, with 101 household (74.8%) living below poverty.
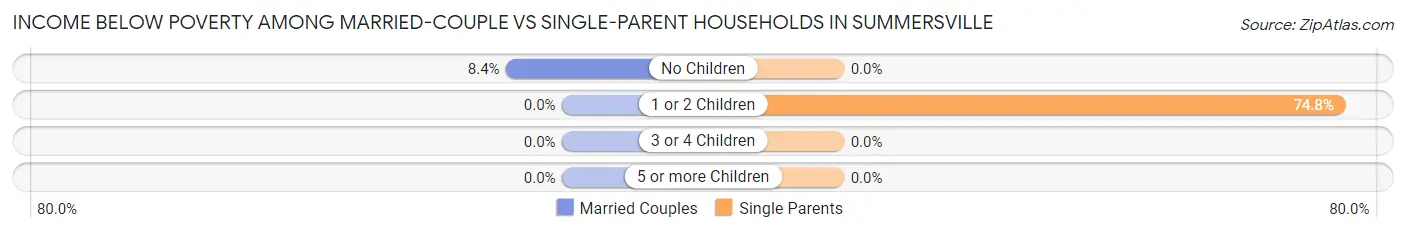
| Children | Married-Couple Families | Single-Parent Households |
| No Children | 57 (8.4%) | 0 (0.0%) |
| 1 or 2 Children | 0 (0.0%) | 101 (74.8%) |
| 3 or 4 Children | 0 (0.0%) | 0 (0.0%) |
| 5 or more Children | 0 (0.0%) | 0 (0.0%) |
| Total | 57 (6.4%) | 101 (68.7%) |
Race in Summersville
The most populous races in Summersville are White / Caucasian (3,151 | 92.3%), Hispanic or Latino (223 | 6.5%), and Some other Race (223 | 6.5%).
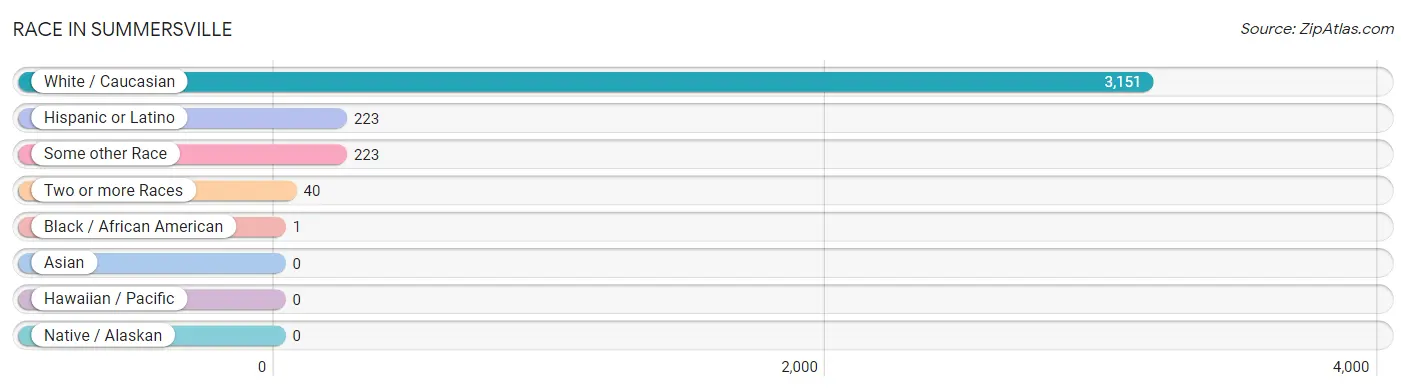
| Race | # Population | % Population |
| Asian | 0 | 0.0% |
| Black / African American | 1 | 0.0% |
| Hawaiian / Pacific | 0 | 0.0% |
| Hispanic or Latino | 223 | 6.5% |
| Native / Alaskan | 0 | 0.0% |
| White / Caucasian | 3,151 | 92.3% |
| Two or more Races | 40 | 1.2% |
| Some other Race | 223 | 6.5% |
| Total | 3,415 | 100.0% |
Ancestry in Summersville
The most populous ancestries reported in Summersville are Irish (544 | 15.9%), German (527 | 15.4%), English (317 | 9.3%), American (281 | 8.2%), and Central American (223 | 6.5%), together accounting for 55.4% of all Summersville residents.
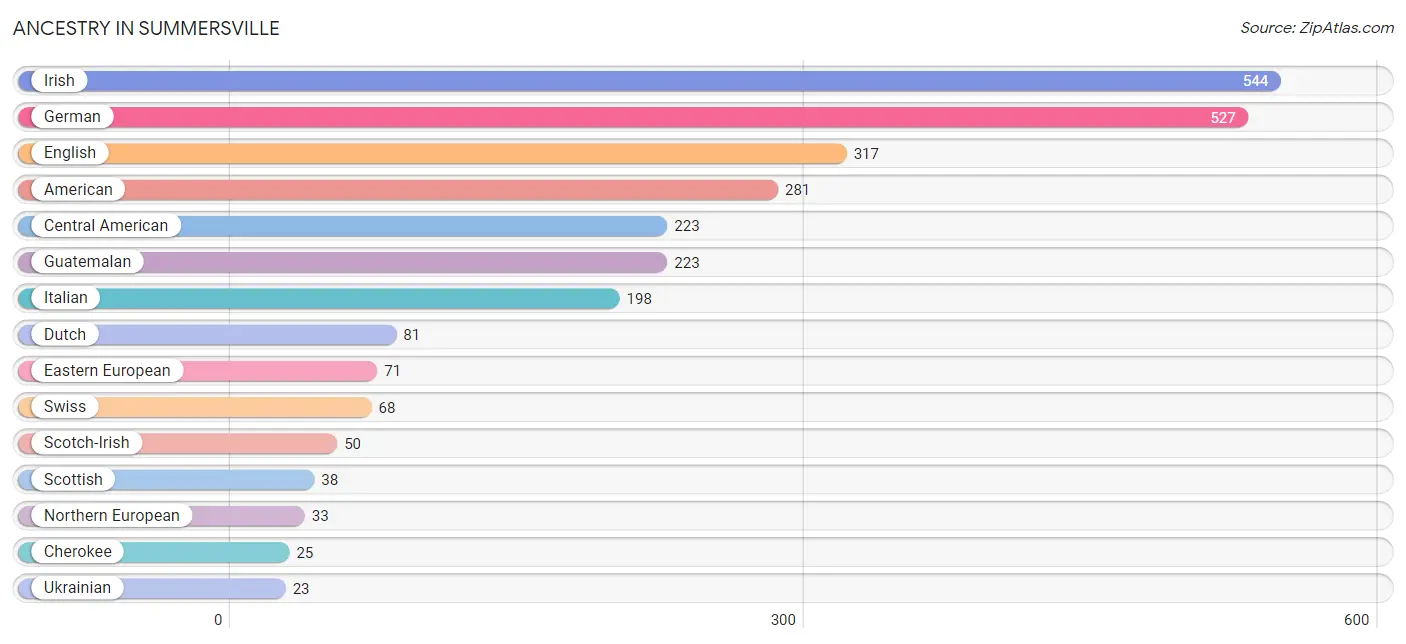
| Ancestry | # Population | % Population |
| American | 281 | 8.2% |
| Central American | 223 | 6.5% |
| Cherokee | 25 | 0.7% |
| Dutch | 81 | 2.4% |
| Eastern European | 71 | 2.1% |
| English | 317 | 9.3% |
| German | 527 | 15.4% |
| Guatemalan | 223 | 6.5% |
| Irish | 544 | 15.9% |
| Italian | 198 | 5.8% |
| Northern European | 33 | 1.0% |
| Polish | 18 | 0.5% |
| Scotch-Irish | 50 | 1.5% |
| Scottish | 38 | 1.1% |
| Swiss | 68 | 2.0% |
| Ukrainian | 23 | 0.7% | View All 16 Rows |
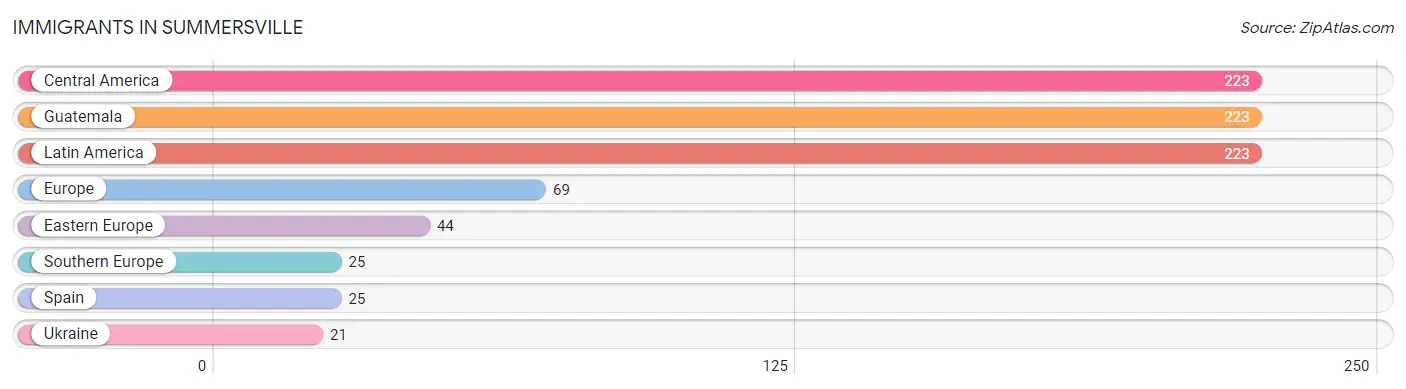
Immigrants in Summersville
The most numerous immigrant groups reported in Summersville came from Central America (223 | 6.5%), Guatemala (223 | 6.5%), Latin America (223 | 6.5%), Europe (69 | 2.0%), and Eastern Europe (44 | 1.3%), together accounting for 22.9% of all Summersville residents.
| Immigration Origin | # Population | % Population |
| Central America | 223 | 6.5% |
| Eastern Europe | 44 | 1.3% |
| Europe | 69 | 2.0% |
| Guatemala | 223 | 6.5% |
| Latin America | 223 | 6.5% |
| Southern Europe | 25 | 0.7% |
| Spain | 25 | 0.7% |
| Ukraine | 21 | 0.6% | View All 8 Rows |
Sex and Age in Summersville
Sex and Age in Summersville
The most populous age groups in Summersville are 75 to 79 Years (329 | 19.0%) for men and 70 to 74 Years (222 | 13.2%) for women.
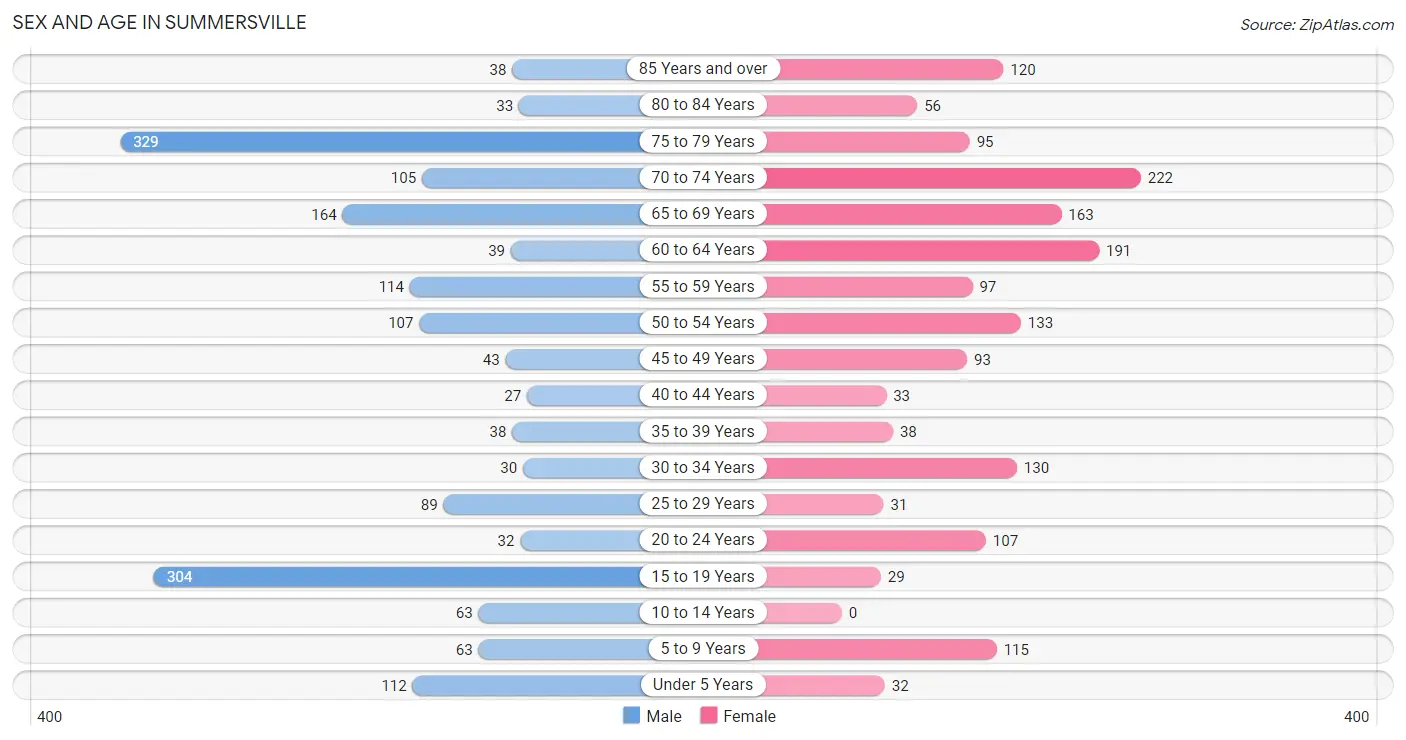
| Age Bracket | Male | Female |
| Under 5 Years | 112 (6.5%) | 32 (1.9%) |
| 5 to 9 Years | 63 (3.6%) | 115 (6.8%) |
| 10 to 14 Years | 63 (3.6%) | 0 (0.0%) |
| 15 to 19 Years | 304 (17.6%) | 29 (1.7%) |
| 20 to 24 Years | 32 (1.8%) | 107 (6.4%) |
| 25 to 29 Years | 89 (5.1%) | 31 (1.8%) |
| 30 to 34 Years | 30 (1.7%) | 130 (7.7%) |
| 35 to 39 Years | 38 (2.2%) | 38 (2.3%) |
| 40 to 44 Years | 27 (1.6%) | 33 (2.0%) |
| 45 to 49 Years | 43 (2.5%) | 93 (5.5%) |
| 50 to 54 Years | 107 (6.2%) | 133 (7.9%) |
| 55 to 59 Years | 114 (6.6%) | 97 (5.8%) |
| 60 to 64 Years | 39 (2.2%) | 191 (11.3%) |
| 65 to 69 Years | 164 (9.5%) | 163 (9.7%) |
| 70 to 74 Years | 105 (6.1%) | 222 (13.2%) |
| 75 to 79 Years | 329 (19.0%) | 95 (5.6%) |
| 80 to 84 Years | 33 (1.9%) | 56 (3.3%) |
| 85 Years and over | 38 (2.2%) | 120 (7.1%) |
| Total | 1,730 (100.0%) | 1,685 (100.0%) |
Families and Households in Summersville
Median Family Size in Summersville
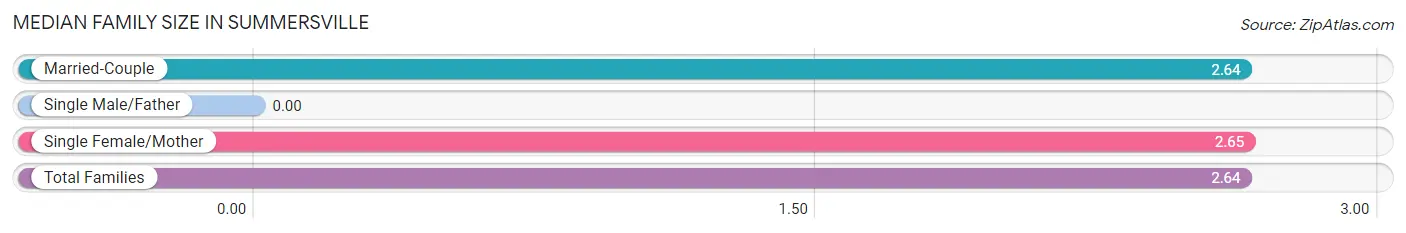
| Family Type | # Families | Family Size |
| Married-Couple | 886 (85.8%) | 2.64 |
| Single Male/Father | 0 (0.0%) | - |
| Single Female/Mother | 147 (14.2%) | 2.65 |
| Total Families | 1,033 (100.0%) | 2.64 |
Median Household Size in Summersville
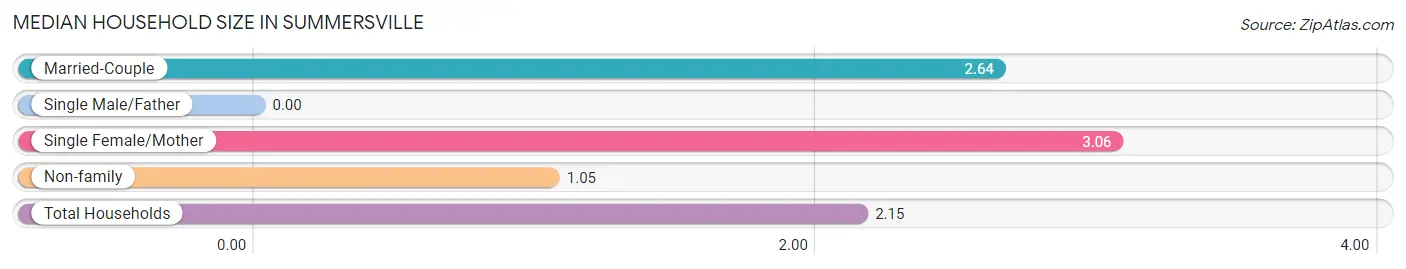
| Household Type | # Households | Household Size |
| Married-Couple | 886 (56.9%) | 2.64 |
| Single Male/Father | 0 (0.0%) | - |
| Single Female/Mother | 147 (9.5%) | 3.06 |
| Non-family | 523 (33.6%) | 1.05 |
| Total Households | 1,556 (100.0%) | 2.15 |
Household Size by Marriage Status in Summersville
Out of a total of 1,556 households in Summersville, 1,033 (66.4%) are family households, while 523 (33.6%) are nonfamily households. The most numerous type of family households are 2-person households, comprising 711, and the most common type of nonfamily households are 1-person households, comprising 499.
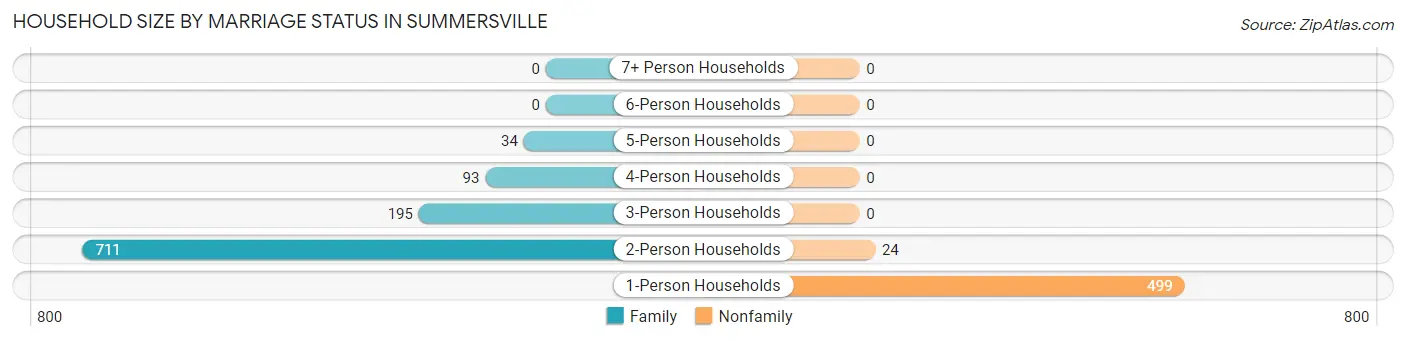
| Household Size | Family Households | Nonfamily Households |
| 1-Person Households | - | 499 (32.1%) |
| 2-Person Households | 711 (45.7%) | 24 (1.5%) |
| 3-Person Households | 195 (12.5%) | 0 (0.0%) |
| 4-Person Households | 93 (6.0%) | 0 (0.0%) |
| 5-Person Households | 34 (2.2%) | 0 (0.0%) |
| 6-Person Households | 0 (0.0%) | 0 (0.0%) |
| 7+ Person Households | 0 (0.0%) | 0 (0.0%) |
| Total | 1,033 (66.4%) | 523 (33.6%) |
Female Fertility in Summersville
Fertility by Age in Summersville
Average fertility rate in Summersville is 206.0 births per 1,000 women. Women in the age bracket of 20 to 34 years have the highest fertility rate with 354.0 births per 1,000 women. Women in the age bracket of 20 to 34 years acount for 100.0% of all women with births.
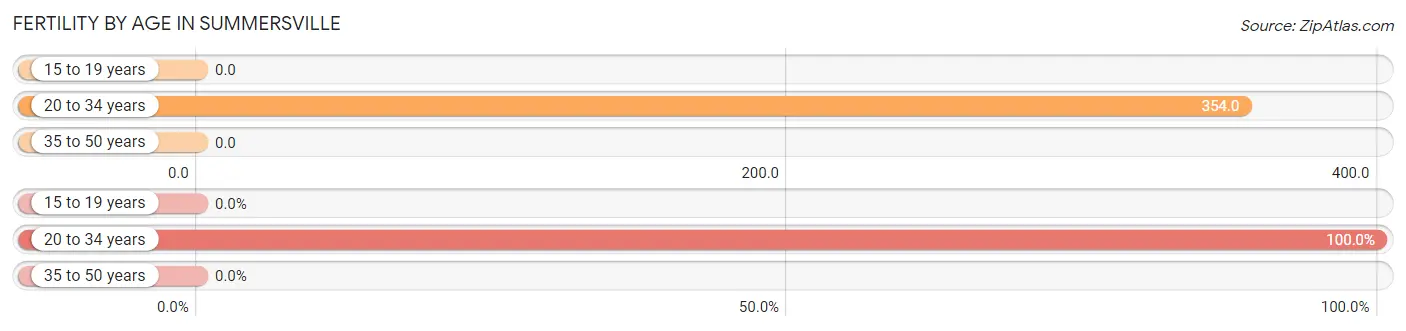
| Age Bracket | Women with Births | Births / 1,000 Women |
| 15 to 19 years | 0 (0.0%) | 0.0 |
| 20 to 34 years | 95 (100.0%) | 354.0 |
| 35 to 50 years | 0 (0.0%) | 0.0 |
| Total | 95 (100.0%) | 206.0 |
Fertility by Age by Marriage Status in Summersville
53.7% of women with births (95) in Summersville are married. The highest percentage of unmarried women with births falls into 20 to 34 years age bracket with 46.3% of them unmarried at the time of birth, while the lowest percentage of unmarried women with births belong to 20 to 34 years age bracket with 46.3% of them unmarried.
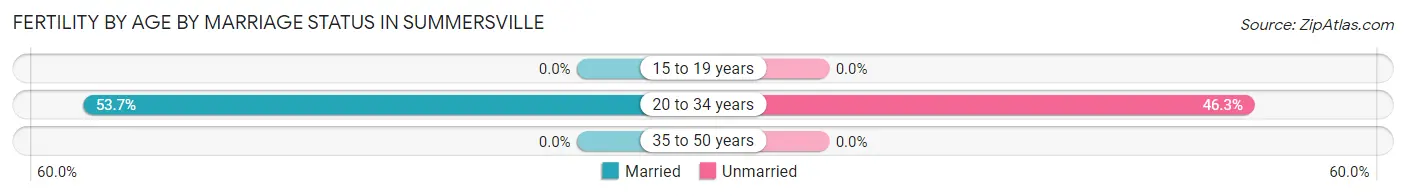
| Age Bracket | Married | Unmarried |
| 15 to 19 years | 0 (0.0%) | 0 (0.0%) |
| 20 to 34 years | 51 (53.7%) | 44 (46.3%) |
| 35 to 50 years | 0 (0.0%) | 0 (0.0%) |
| Total | 51 (53.7%) | 44 (46.3%) |
Fertility by Education in Summersville
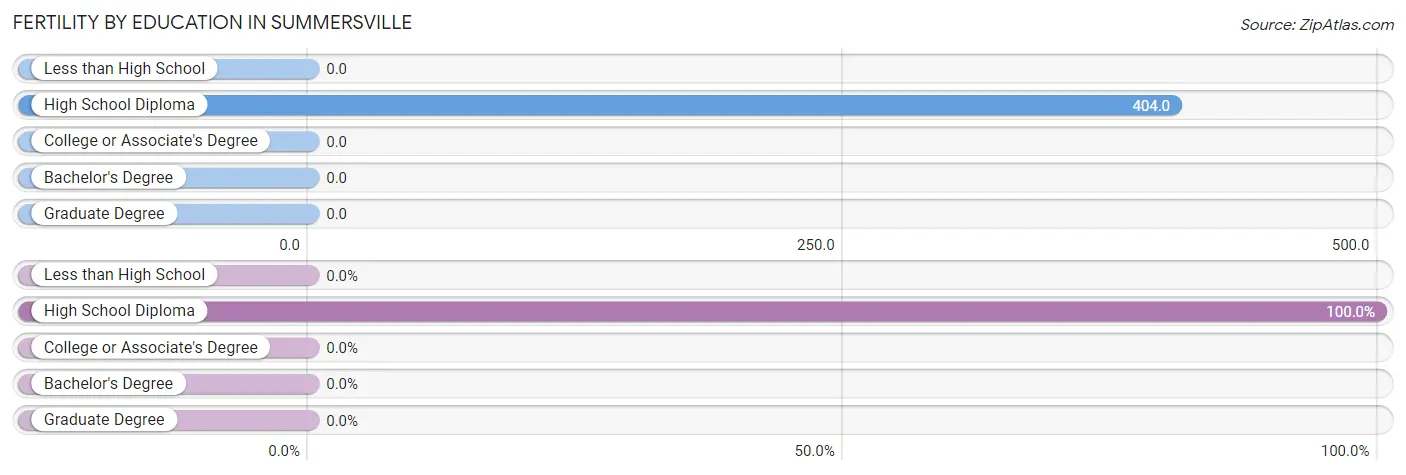
| Educational Attainment | Women with Births | Births / 1,000 Women |
| Less than High School | 0 (0.0%) | 0.0 |
| High School Diploma | 95 (100.0%) | 404.0 |
| College or Associate's Degree | 0 (0.0%) | 0.0 |
| Bachelor's Degree | 0 (0.0%) | 0.0 |
| Graduate Degree | 0 (0.0%) | 0.0 |
| Total | 95 (100.0%) | 206.0 |
Fertility by Education by Marriage Status in Summersville
46.3% of women with births in Summersville are unmarried. Women with the educational attainment of high school diploma are most likely to be married with 53.7% of them married at childbirth, while women with the educational attainment of high school diploma are least likely to be married with 46.3% of them unmarried at childbirth.
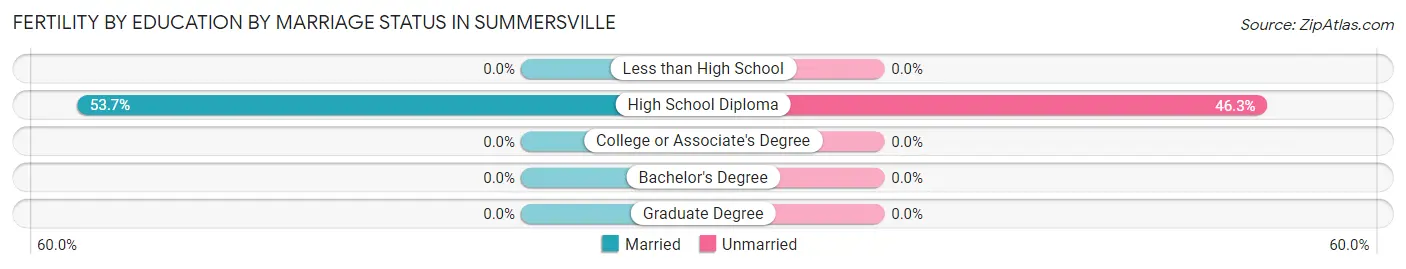
| Educational Attainment | Married | Unmarried |
| Less than High School | 0 (0.0%) | 0 (0.0%) |
| High School Diploma | 51 (53.7%) | 44 (46.3%) |
| College or Associate's Degree | 0 (0.0%) | 0 (0.0%) |
| Bachelor's Degree | 0 (0.0%) | 0 (0.0%) |
| Graduate Degree | 0 (0.0%) | 0 (0.0%) |
| Total | 51 (53.7%) | 44 (46.3%) |
Employment Characteristics in Summersville
Employment by Class of Employer in Summersville
Among the 1,189 employed individuals in Summersville, private company employees (689 | 58.0%), state government employees (157 | 13.2%), and not-for-profit organizations (147 | 12.4%) make up the most common classes of employment.
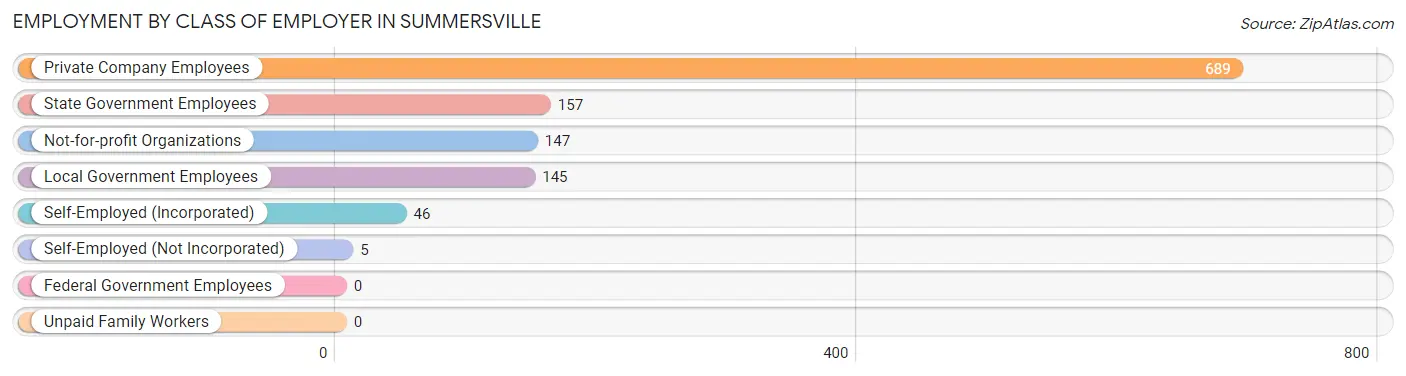
| Employer Class | # Employees | % Employees |
| Private Company Employees | 689 | 58.0% |
| Self-Employed (Incorporated) | 46 | 3.9% |
| Self-Employed (Not Incorporated) | 5 | 0.4% |
| Not-for-profit Organizations | 147 | 12.4% |
| Local Government Employees | 145 | 12.2% |
| State Government Employees | 157 | 13.2% |
| Federal Government Employees | 0 | 0.0% |
| Unpaid Family Workers | 0 | 0.0% |
| Total | 1,189 | 100.0% |
Employment Status by Age in Summersville
According to the labor force statistics for Summersville, out of the total population over 16 years of age (2,900), 43.3% or 1,256 individuals are in the labor force, with 5.3% or 67 of them unemployed. The age group with the highest labor force participation rate is 25 to 29 years, with 100.0% or 120 individuals in the labor force. Within the labor force, the 16 to 19 years age range has the highest percentage of unemployed individuals, with 81.5% or 44 of them being unemployed.
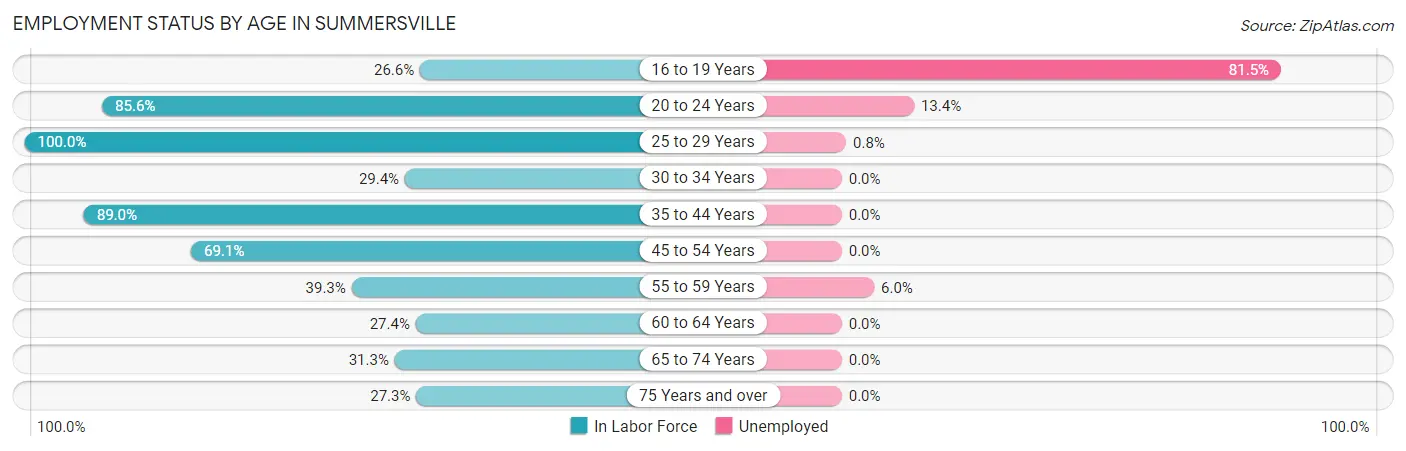
| Age Bracket | In Labor Force | Unemployed |
| 16 to 19 Years | 54 (26.6%) | 44 (81.5%) |
| 20 to 24 Years | 119 (85.6%) | 16 (13.4%) |
| 25 to 29 Years | 120 (100.0%) | 1 (0.8%) |
| 30 to 34 Years | 47 (29.4%) | 0 (0.0%) |
| 35 to 44 Years | 121 (89.0%) | 0 (0.0%) |
| 45 to 54 Years | 260 (69.1%) | 0 (0.0%) |
| 55 to 59 Years | 83 (39.3%) | 5 (6.0%) |
| 60 to 64 Years | 63 (27.4%) | 0 (0.0%) |
| 65 to 74 Years | 205 (31.3%) | 0 (0.0%) |
| 75 Years and over | 183 (27.3%) | 0 (0.0%) |
| Total | 1,256 (43.3%) | 67 (5.3%) |
Employment Status by Educational Attainment in Summersville
According to labor force statistics for Summersville, 56.3% of individuals (694) out of the total population between 25 and 64 years of age (1,233) are in the labor force, with 0.9% or 6 of them being unemployed. The group with the highest labor force participation rate are those with the educational attainment of bachelor's degree or higher, with 100.0% or 260 individuals in the labor force. Within the labor force, individuals with college / associate degree education have the highest percentage of unemployment, with 2.3% or 5 of them being unemployed.
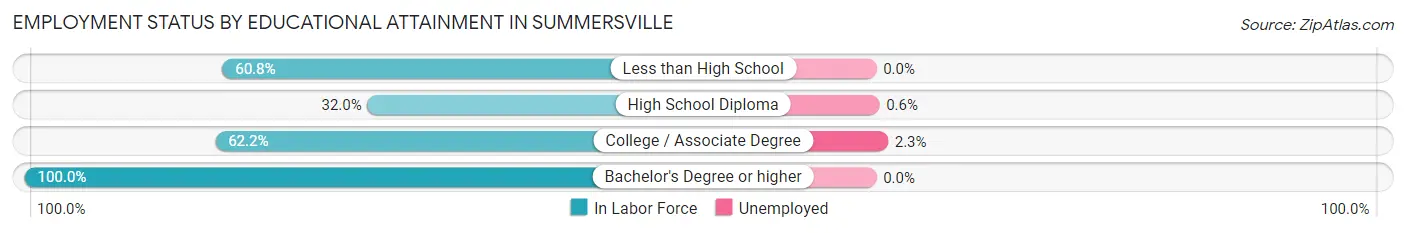
| Educational Attainment | In Labor Force | Unemployed |
| Less than High School | 31 (60.8%) | 0 (0.0%) |
| High School Diploma | 181 (32.0%) | 3 (0.6%) |
| College / Associate Degree | 222 (62.2%) | 8 (2.3%) |
| Bachelor's Degree or higher | 260 (100.0%) | 0 (0.0%) |
| Total | 694 (56.3%) | 11 (0.9%) |
Employment Occupations by Sex in Summersville
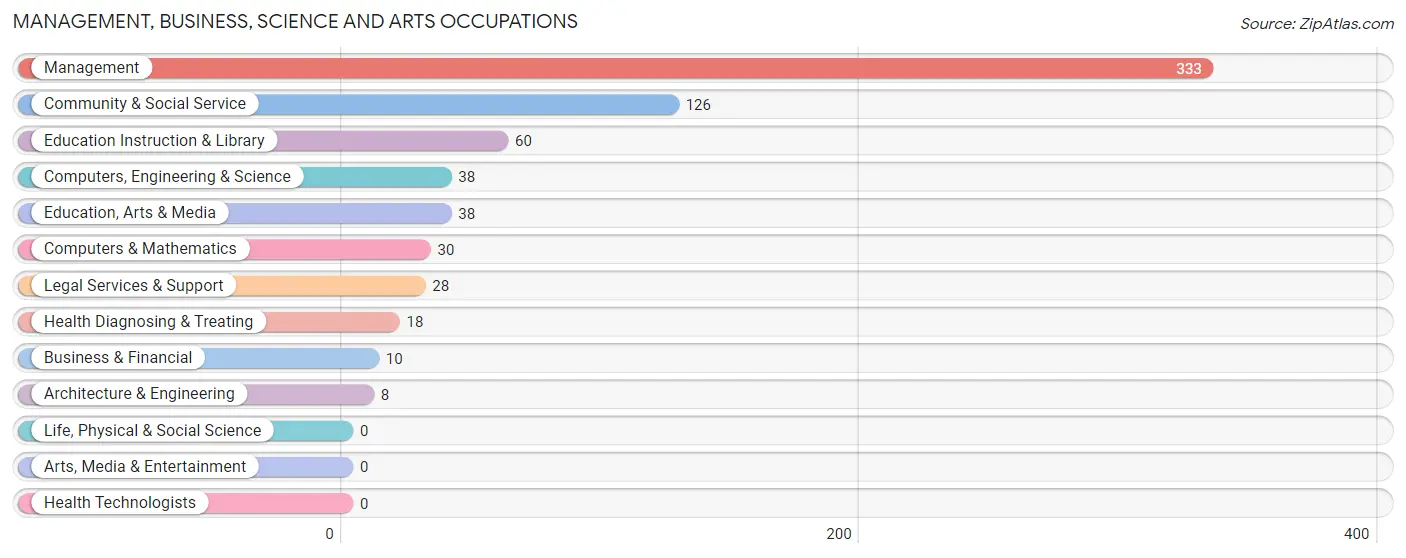
Management, Business, Science and Arts Occupations
The most common Management, Business, Science and Arts occupations in Summersville are Management (333 | 28.0%), Community & Social Service (126 | 10.6%), Education Instruction & Library (60 | 5.1%), Computers, Engineering & Science (38 | 3.2%), and Education, Arts & Media (38 | 3.2%).
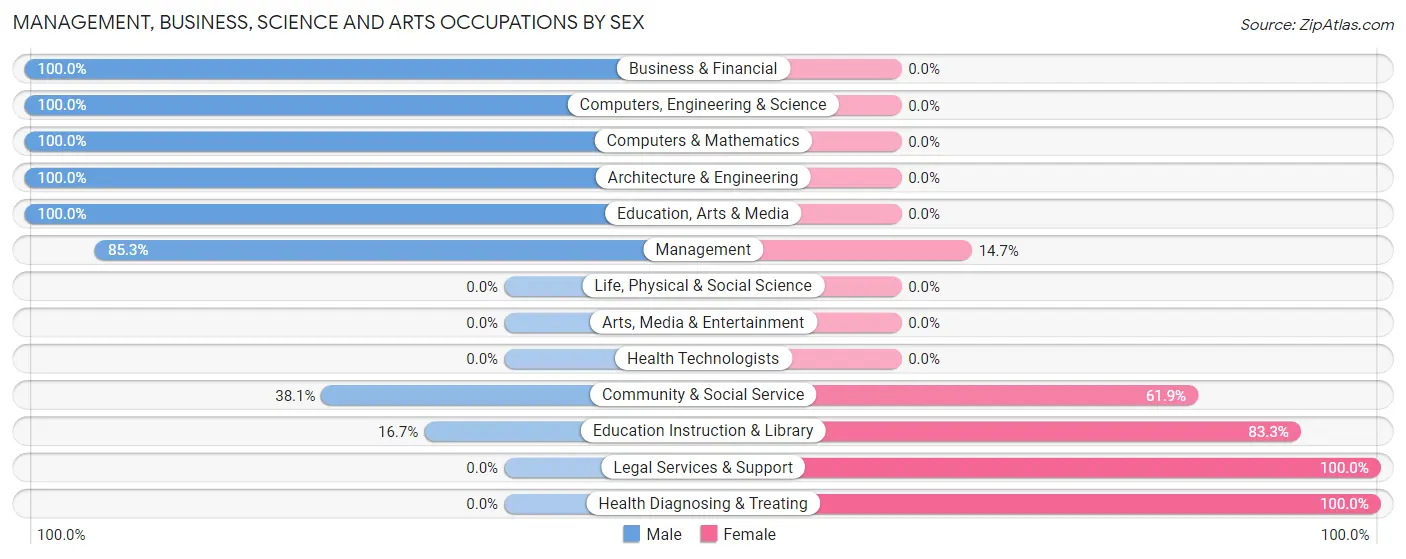
Management, Business, Science and Arts Occupations by Sex
Within the Management, Business, Science and Arts occupations in Summersville, the most male-oriented occupations are Business & Financial (100.0%), Computers, Engineering & Science (100.0%), and Computers & Mathematics (100.0%), while the most female-oriented occupations are Legal Services & Support (100.0%), Health Diagnosing & Treating (100.0%), and Education Instruction & Library (83.3%).
| Occupation | Male | Female |
| Management | 284 (85.3%) | 49 (14.7%) |
| Business & Financial | 10 (100.0%) | 0 (0.0%) |
| Computers, Engineering & Science | 38 (100.0%) | 0 (0.0%) |
| Computers & Mathematics | 30 (100.0%) | 0 (0.0%) |
| Architecture & Engineering | 8 (100.0%) | 0 (0.0%) |
| Life, Physical & Social Science | 0 (0.0%) | 0 (0.0%) |
| Community & Social Service | 48 (38.1%) | 78 (61.9%) |
| Education, Arts & Media | 38 (100.0%) | 0 (0.0%) |
| Legal Services & Support | 0 (0.0%) | 28 (100.0%) |
| Education Instruction & Library | 10 (16.7%) | 50 (83.3%) |
| Arts, Media & Entertainment | 0 (0.0%) | 0 (0.0%) |
| Health Diagnosing & Treating | 0 (0.0%) | 18 (100.0%) |
| Health Technologists | 0 (0.0%) | 0 (0.0%) |
| Total (Category) | 380 (72.4%) | 145 (27.6%) |
| Total (Overall) | 678 (57.0%) | 511 (43.0%) |
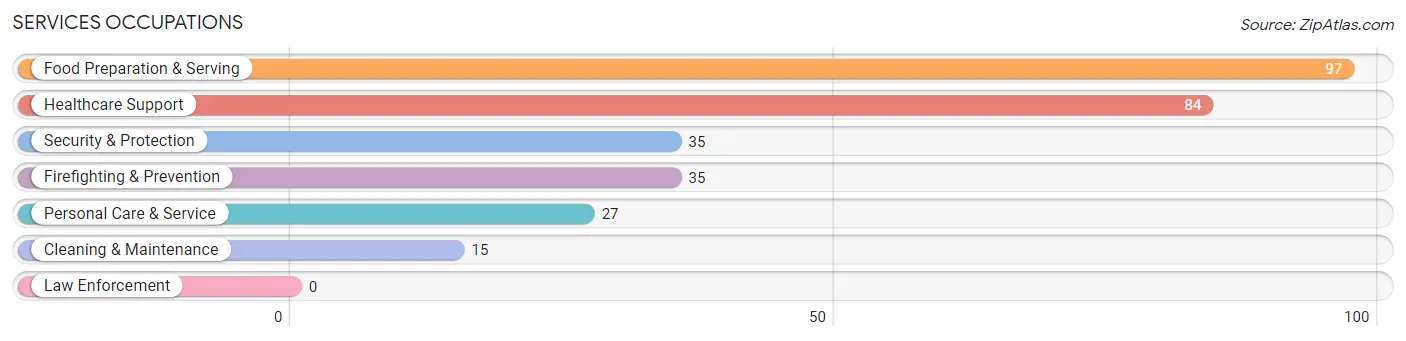
Services Occupations
The most common Services occupations in Summersville are Food Preparation & Serving (97 | 8.2%), Healthcare Support (84 | 7.1%), Security & Protection (35 | 2.9%), Firefighting & Prevention (35 | 2.9%), and Personal Care & Service (27 | 2.3%).
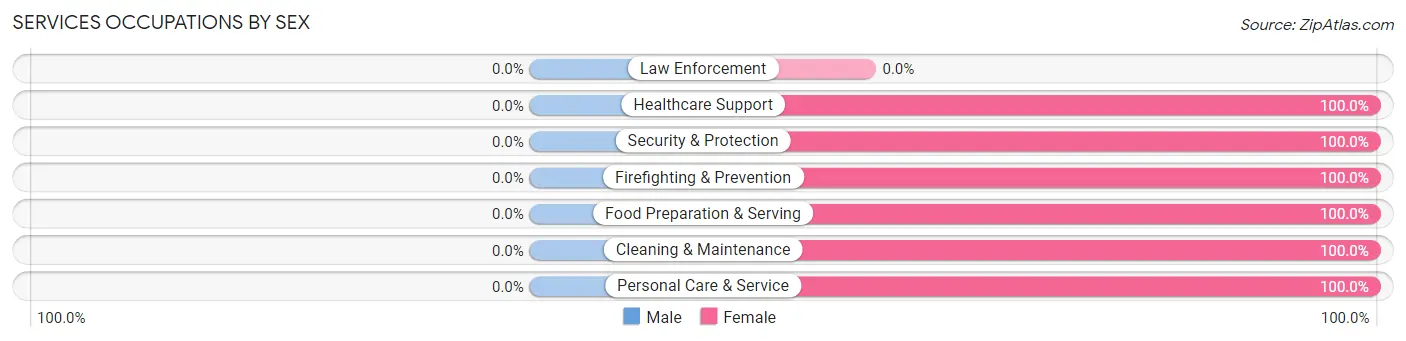
Services Occupations by Sex
| Occupation | Male | Female |
| Healthcare Support | 0 (0.0%) | 84 (100.0%) |
| Security & Protection | 0 (0.0%) | 35 (100.0%) |
| Firefighting & Prevention | 0 (0.0%) | 35 (100.0%) |
| Law Enforcement | 0 (0.0%) | 0 (0.0%) |
| Food Preparation & Serving | 0 (0.0%) | 97 (100.0%) |
| Cleaning & Maintenance | 0 (0.0%) | 15 (100.0%) |
| Personal Care & Service | 0 (0.0%) | 27 (100.0%) |
| Total (Category) | 0 (0.0%) | 258 (100.0%) |
| Total (Overall) | 678 (57.0%) | 511 (43.0%) |
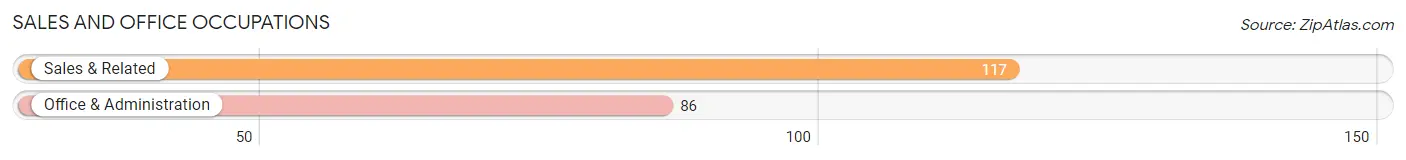
Sales and Office Occupations
The most common Sales and Office occupations in Summersville are Sales & Related (117 | 9.8%), and Office & Administration (86 | 7.2%).
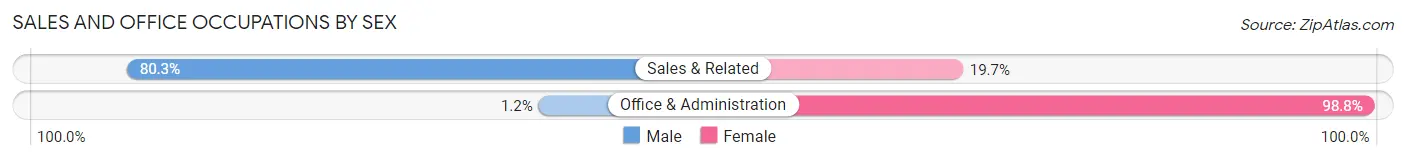
Sales and Office Occupations by Sex
| Occupation | Male | Female |
| Sales & Related | 94 (80.3%) | 23 (19.7%) |
| Office & Administration | 1 (1.2%) | 85 (98.8%) |
| Total (Category) | 95 (46.8%) | 108 (53.2%) |
| Total (Overall) | 678 (57.0%) | 511 (43.0%) |
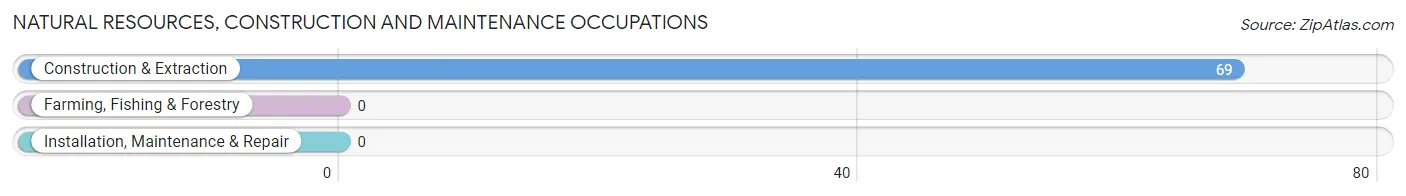
Natural Resources, Construction and Maintenance Occupations
The most common Natural Resources, Construction and Maintenance occupations in Summersville are , and Construction & Extraction (69 | 5.8%).
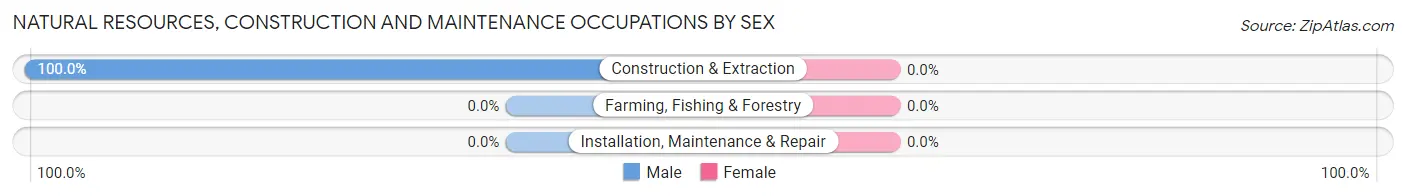
Natural Resources, Construction and Maintenance Occupations by Sex
| Occupation | Male | Female |
| Farming, Fishing & Forestry | 0 (0.0%) | 0 (0.0%) |
| Construction & Extraction | 69 (100.0%) | 0 (0.0%) |
| Installation, Maintenance & Repair | 0 (0.0%) | 0 (0.0%) |
| Total (Category) | 69 (100.0%) | 0 (0.0%) |
| Total (Overall) | 678 (57.0%) | 511 (43.0%) |
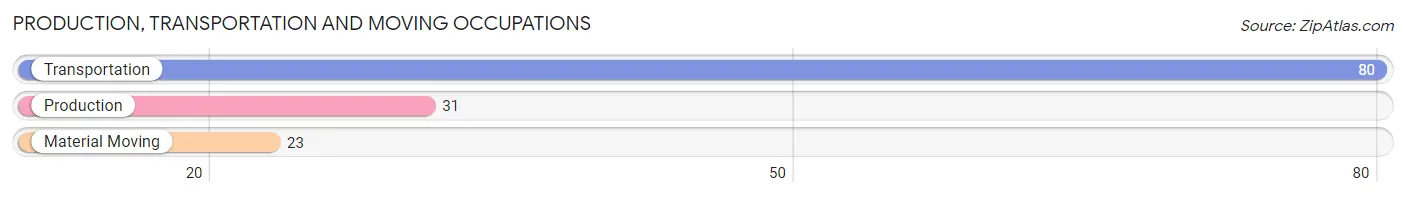
Production, Transportation and Moving Occupations
The most common Production, Transportation and Moving occupations in Summersville are Transportation (80 | 6.7%), Production (31 | 2.6%), and Material Moving (23 | 1.9%).
Production, Transportation and Moving Occupations by Sex
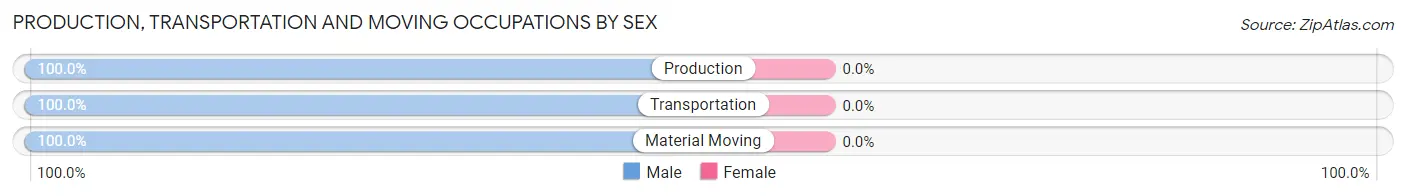
| Occupation | Male | Female |
| Production | 31 (100.0%) | 0 (0.0%) |
| Transportation | 80 (100.0%) | 0 (0.0%) |
| Material Moving | 23 (100.0%) | 0 (0.0%) |
| Total (Category) | 134 (100.0%) | 0 (0.0%) |
| Total (Overall) | 678 (57.0%) | 511 (43.0%) |
Employment Industries by Sex in Summersville
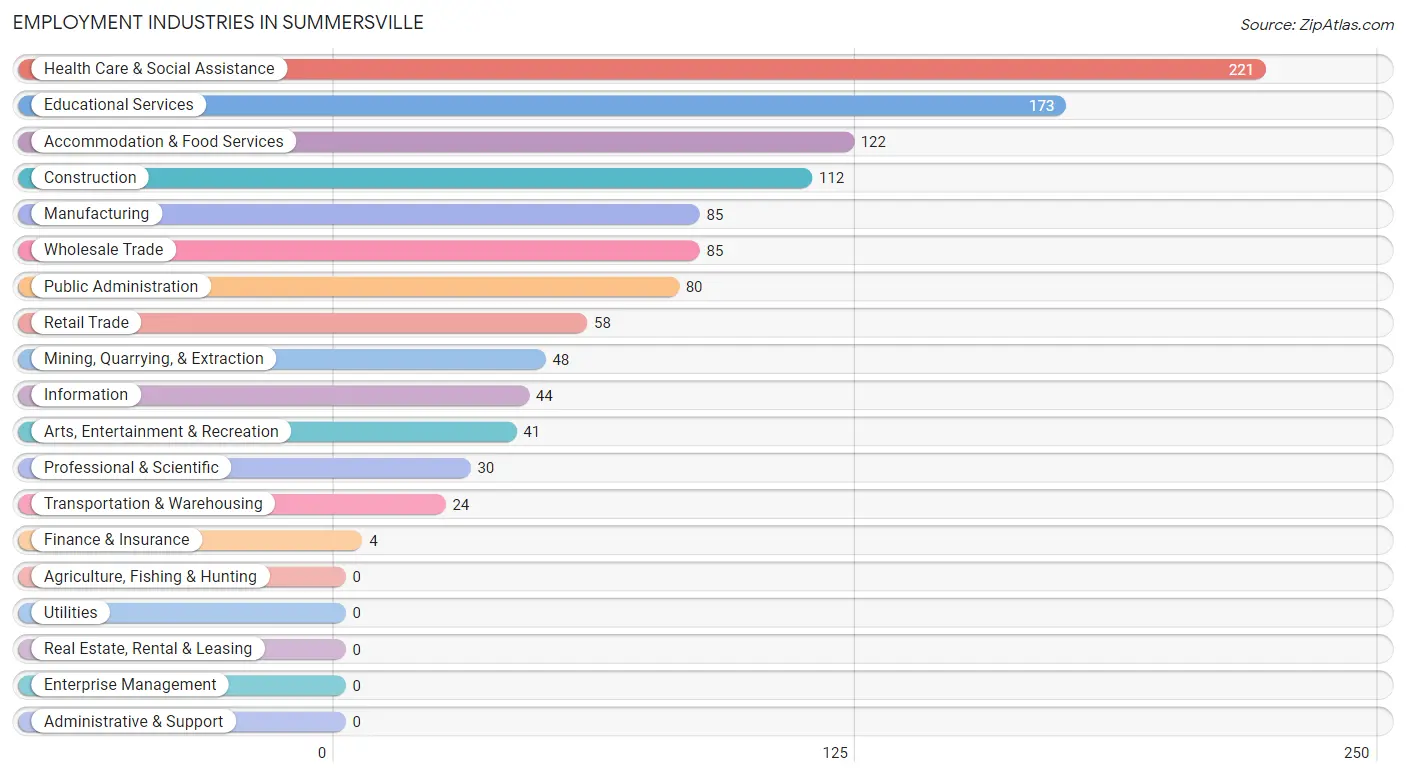
Employment Industries in Summersville
The major employment industries in Summersville include Health Care & Social Assistance (221 | 18.6%), Educational Services (173 | 14.5%), Accommodation & Food Services (122 | 10.3%), Construction (112 | 9.4%), and Manufacturing (85 | 7.1%).
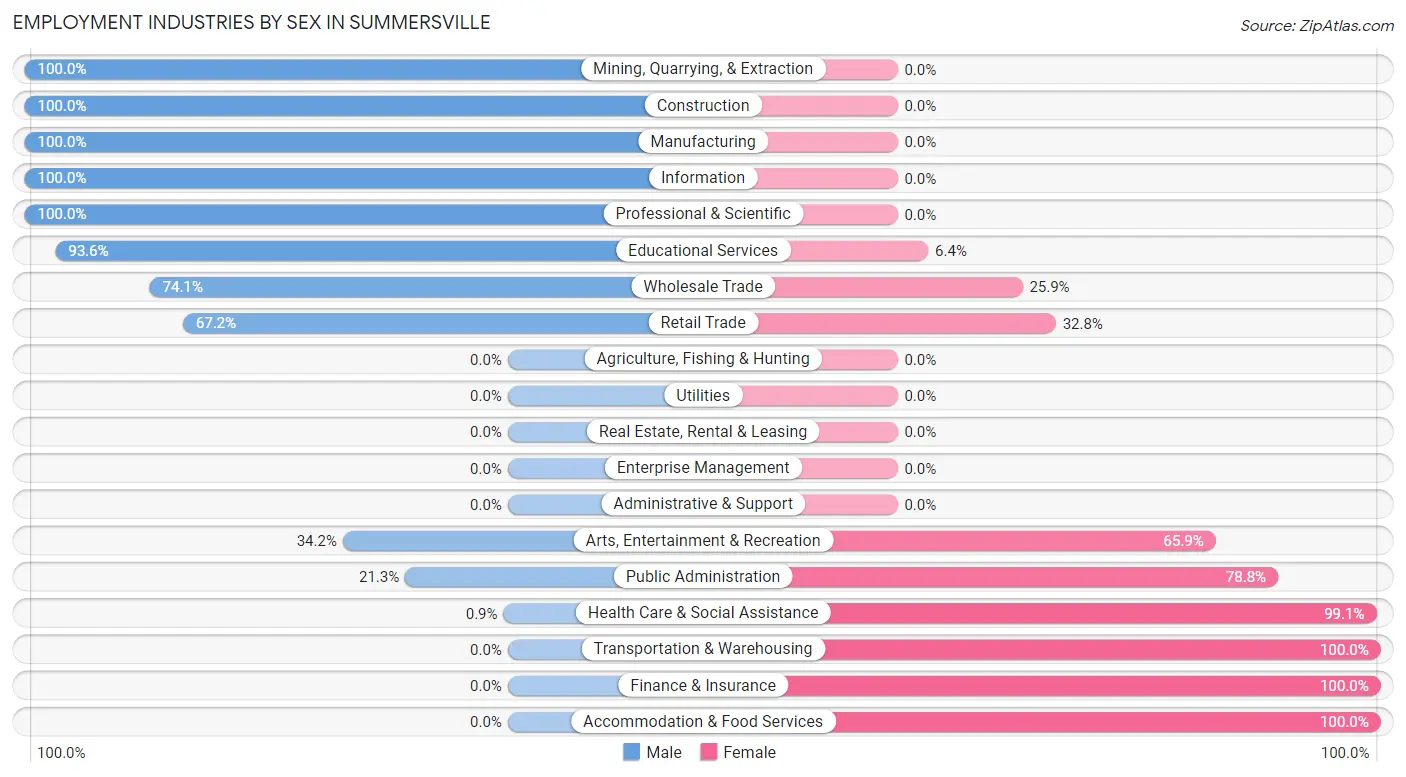
Employment Industries by Sex in Summersville
The Summersville industries that see more men than women are Mining, Quarrying, & Extraction (100.0%), Construction (100.0%), and Manufacturing (100.0%), whereas the industries that tend to have a higher number of women are Transportation & Warehousing (100.0%), Finance & Insurance (100.0%), and Accommodation & Food Services (100.0%).
| Industry | Male | Female |
| Agriculture, Fishing & Hunting | 0 (0.0%) | 0 (0.0%) |
| Mining, Quarrying, & Extraction | 48 (100.0%) | 0 (0.0%) |
| Construction | 112 (100.0%) | 0 (0.0%) |
| Manufacturing | 85 (100.0%) | 0 (0.0%) |
| Wholesale Trade | 63 (74.1%) | 22 (25.9%) |
| Retail Trade | 39 (67.2%) | 19 (32.8%) |
| Transportation & Warehousing | 0 (0.0%) | 24 (100.0%) |
| Utilities | 0 (0.0%) | 0 (0.0%) |
| Information | 44 (100.0%) | 0 (0.0%) |
| Finance & Insurance | 0 (0.0%) | 4 (100.0%) |
| Real Estate, Rental & Leasing | 0 (0.0%) | 0 (0.0%) |
| Professional & Scientific | 30 (100.0%) | 0 (0.0%) |
| Enterprise Management | 0 (0.0%) | 0 (0.0%) |
| Administrative & Support | 0 (0.0%) | 0 (0.0%) |
| Educational Services | 162 (93.6%) | 11 (6.4%) |
| Health Care & Social Assistance | 2 (0.9%) | 219 (99.1%) |
| Arts, Entertainment & Recreation | 14 (34.2%) | 27 (65.8%) |
| Accommodation & Food Services | 0 (0.0%) | 122 (100.0%) |
| Public Administration | 17 (21.2%) | 63 (78.7%) |
| Total | 678 (57.0%) | 511 (43.0%) |
Education in Summersville
School Enrollment in Summersville
The most common levels of schooling among the 600 students in Summersville are high school (323 | 53.8%), elementary school (180 | 30.0%), and nursery / preschool (48 | 8.0%).
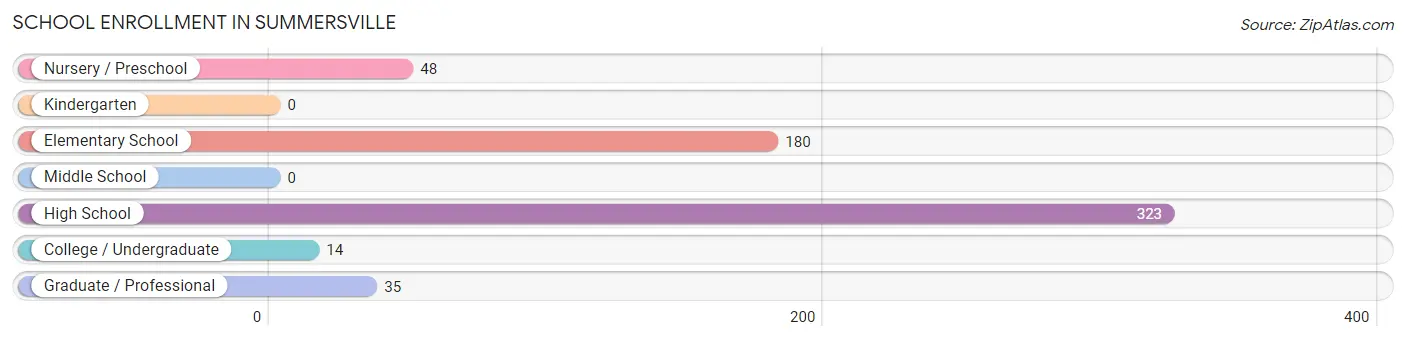
| School Level | # Students | % Students |
| Nursery / Preschool | 48 | 8.0% |
| Kindergarten | 0 | 0.0% |
| Elementary School | 180 | 30.0% |
| Middle School | 0 | 0.0% |
| High School | 323 | 53.8% |
| College / Undergraduate | 14 | 2.3% |
| Graduate / Professional | 35 | 5.8% |
| Total | 600 | 100.0% |
School Enrollment by Age by Funding Source in Summersville
Out of a total of 600 students who are enrolled in schools in Summersville, 38 (6.3%) attend a private institution, while the remaining 562 (93.7%) are enrolled in public schools. The age group of 5 to 9 year old has the highest likelihood of being enrolled in private schools, with 38 (21.3% in the age bracket) enrolled. Conversely, the age group of 3 to 4 year olds has the lowest likelihood of being enrolled in a private school, with 25 (100.0% in the age bracket) attending a public institution.
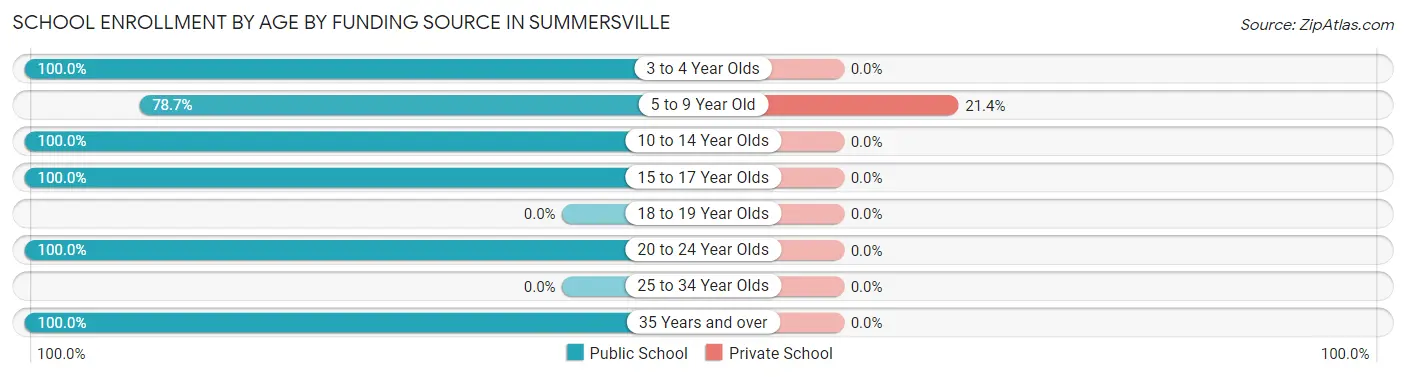
| Age Bracket | Public School | Private School |
| 3 to 4 Year Olds | 25 (100.0%) | 0 (0.0%) |
| 5 to 9 Year Old | 140 (78.6%) | 38 (21.3%) |
| 10 to 14 Year Olds | 25 (100.0%) | 0 (0.0%) |
| 15 to 17 Year Olds | 323 (100.0%) | 0 (0.0%) |
| 18 to 19 Year Olds | 0 (0.0%) | 0 (0.0%) |
| 20 to 24 Year Olds | 14 (100.0%) | 0 (0.0%) |
| 25 to 34 Year Olds | 0 (0.0%) | 0 (0.0%) |
| 35 Years and over | 35 (100.0%) | 0 (0.0%) |
| Total | 562 (93.7%) | 38 (6.3%) |
Educational Attainment by Field of Study in Summersville
Education (325 | 37.4%), arts & humanities (186 | 21.4%), engineering (81 | 9.3%), psychology (56 | 6.5%), and computers & mathematics (47 | 5.4%) are the most common fields of study among 868 individuals in Summersville who have obtained a bachelor's degree or higher.
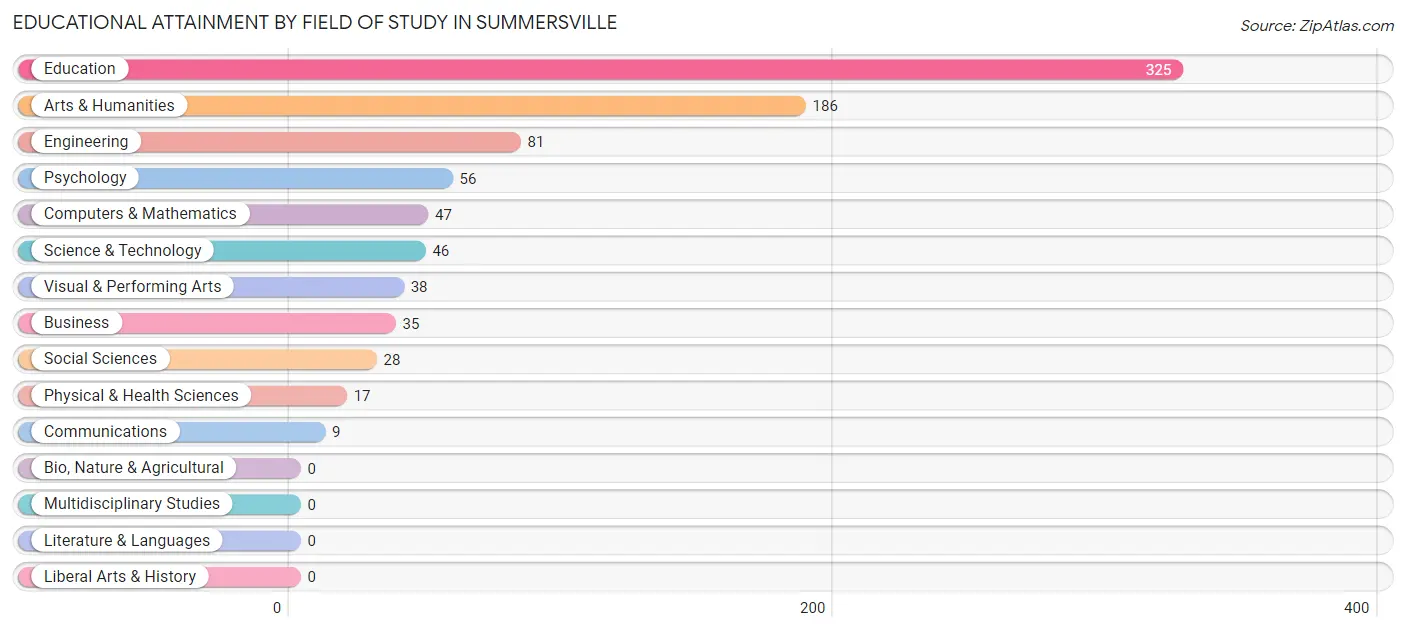
| Field of Study | # Graduates | % Graduates |
| Computers & Mathematics | 47 | 5.4% |
| Bio, Nature & Agricultural | 0 | 0.0% |
| Physical & Health Sciences | 17 | 2.0% |
| Psychology | 56 | 6.5% |
| Social Sciences | 28 | 3.2% |
| Engineering | 81 | 9.3% |
| Multidisciplinary Studies | 0 | 0.0% |
| Science & Technology | 46 | 5.3% |
| Business | 35 | 4.0% |
| Education | 325 | 37.4% |
| Literature & Languages | 0 | 0.0% |
| Liberal Arts & History | 0 | 0.0% |
| Visual & Performing Arts | 38 | 4.4% |
| Communications | 9 | 1.0% |
| Arts & Humanities | 186 | 21.4% |
| Total | 868 | 100.0% |
Transportation & Commute in Summersville
Vehicle Availability by Sex in Summersville
The most prevalent vehicle ownership categories in Summersville are males with 3 vehicles (307, accounting for 45.4%) and females with 3 vehicles (104, making up 60.1%).
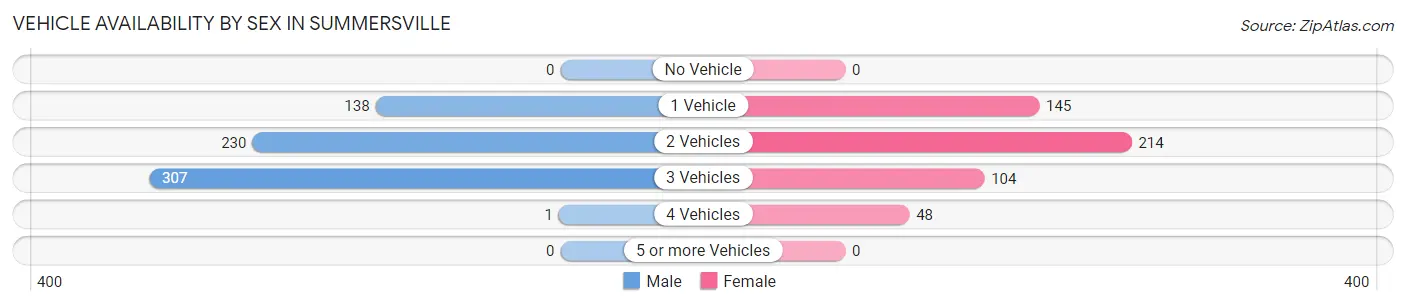
| Vehicles Available | Male | Female |
| No Vehicle | 0 (0.0%) | 0 (0.0%) |
| 1 Vehicle | 138 (20.4%) | 145 (28.4%) |
| 2 Vehicles | 230 (34.0%) | 214 (41.9%) |
| 3 Vehicles | 307 (45.4%) | 104 (20.3%) |
| 4 Vehicles | 1 (0.2%) | 48 (9.4%) |
| 5 or more Vehicles | 0 (0.0%) | 0 (0.0%) |
| Total | 676 (100.0%) | 511 (100.0%) |
Commute Time in Summersville
The most frequently occuring commute durations in Summersville are 5 to 9 minutes (360 commuters, 32.4%), 10 to 14 minutes (182 commuters, 16.4%), and 20 to 24 minutes (130 commuters, 11.7%).
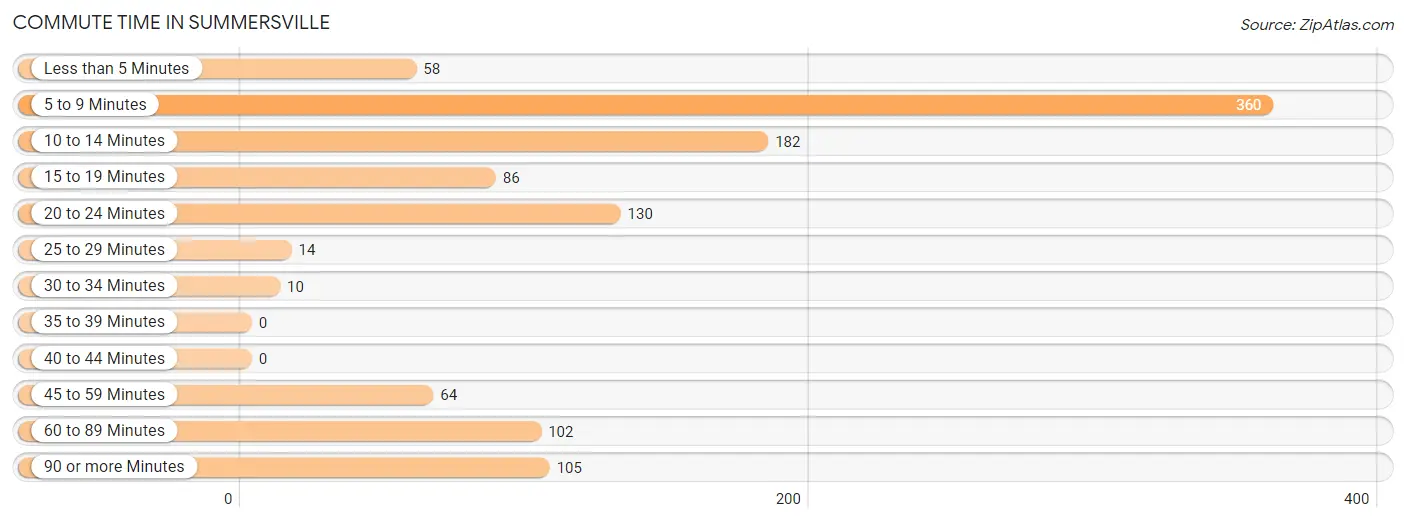
| Commute Time | # Commuters | % Commuters |
| Less than 5 Minutes | 58 | 5.2% |
| 5 to 9 Minutes | 360 | 32.4% |
| 10 to 14 Minutes | 182 | 16.4% |
| 15 to 19 Minutes | 86 | 7.7% |
| 20 to 24 Minutes | 130 | 11.7% |
| 25 to 29 Minutes | 14 | 1.3% |
| 30 to 34 Minutes | 10 | 0.9% |
| 35 to 39 Minutes | 0 | 0.0% |
| 40 to 44 Minutes | 0 | 0.0% |
| 45 to 59 Minutes | 64 | 5.8% |
| 60 to 89 Minutes | 102 | 9.2% |
| 90 or more Minutes | 105 | 9.5% |
Commute Time by Sex in Summersville
The most common commute times in Summersville are 5 to 9 minutes (194 commuters, 31.0%) for males and 5 to 9 minutes (166 commuters, 34.2%) for females.
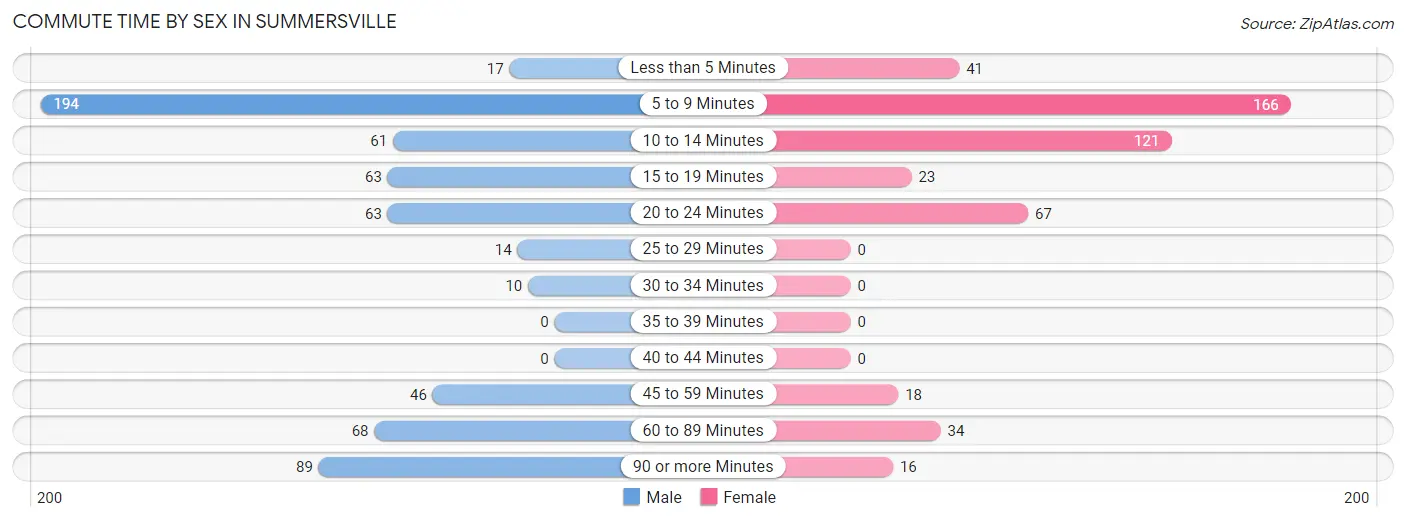
| Commute Time | Male | Female |
| Less than 5 Minutes | 17 (2.7%) | 41 (8.4%) |
| 5 to 9 Minutes | 194 (31.0%) | 166 (34.2%) |
| 10 to 14 Minutes | 61 (9.8%) | 121 (24.9%) |
| 15 to 19 Minutes | 63 (10.1%) | 23 (4.7%) |
| 20 to 24 Minutes | 63 (10.1%) | 67 (13.8%) |
| 25 to 29 Minutes | 14 (2.2%) | 0 (0.0%) |
| 30 to 34 Minutes | 10 (1.6%) | 0 (0.0%) |
| 35 to 39 Minutes | 0 (0.0%) | 0 (0.0%) |
| 40 to 44 Minutes | 0 (0.0%) | 0 (0.0%) |
| 45 to 59 Minutes | 46 (7.4%) | 18 (3.7%) |
| 60 to 89 Minutes | 68 (10.9%) | 34 (7.0%) |
| 90 or more Minutes | 89 (14.2%) | 16 (3.3%) |
Time of Departure to Work by Sex in Summersville
The most frequent times of departure to work in Summersville are 4:00 PM to 11:59 PM (192, 30.7%) for males and 12:00 PM to 3:59 PM (125, 25.7%) for females.
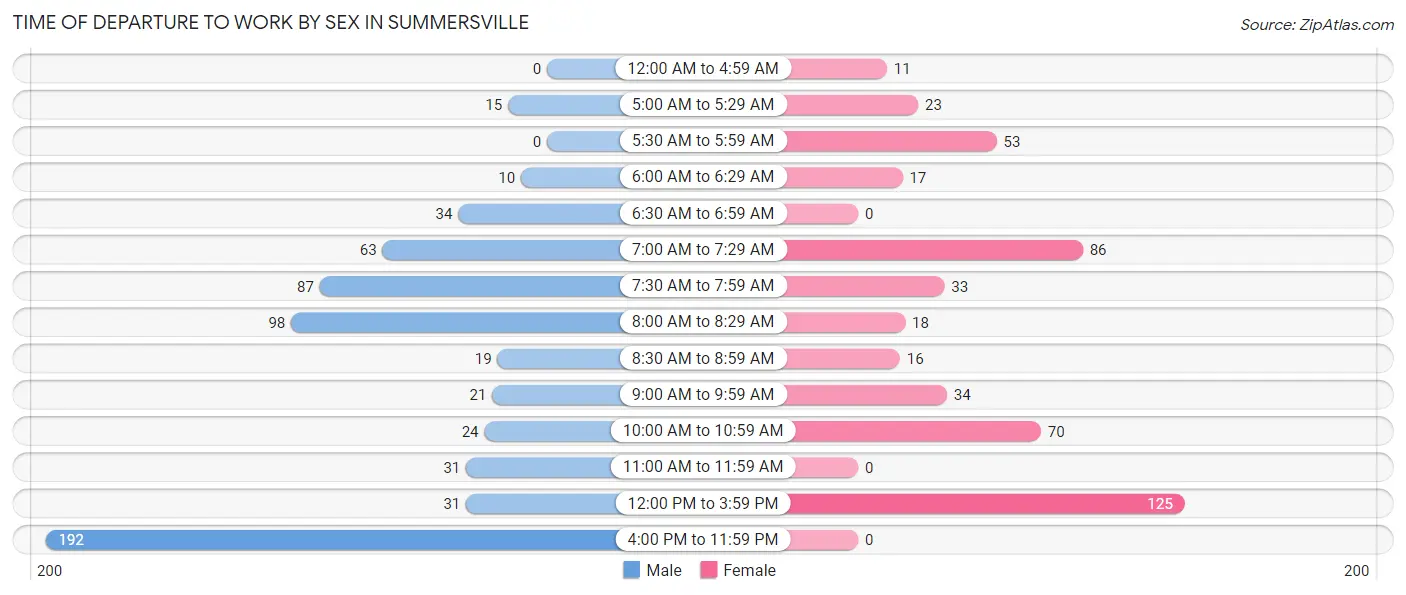
| Time of Departure | Male | Female |
| 12:00 AM to 4:59 AM | 0 (0.0%) | 11 (2.3%) |
| 5:00 AM to 5:29 AM | 15 (2.4%) | 23 (4.7%) |
| 5:30 AM to 5:59 AM | 0 (0.0%) | 53 (10.9%) |
| 6:00 AM to 6:29 AM | 10 (1.6%) | 17 (3.5%) |
| 6:30 AM to 6:59 AM | 34 (5.4%) | 0 (0.0%) |
| 7:00 AM to 7:29 AM | 63 (10.1%) | 86 (17.7%) |
| 7:30 AM to 7:59 AM | 87 (13.9%) | 33 (6.8%) |
| 8:00 AM to 8:29 AM | 98 (15.7%) | 18 (3.7%) |
| 8:30 AM to 8:59 AM | 19 (3.0%) | 16 (3.3%) |
| 9:00 AM to 9:59 AM | 21 (3.4%) | 34 (7.0%) |
| 10:00 AM to 10:59 AM | 24 (3.8%) | 70 (14.4%) |
| 11:00 AM to 11:59 AM | 31 (5.0%) | 0 (0.0%) |
| 12:00 PM to 3:59 PM | 31 (5.0%) | 125 (25.7%) |
| 4:00 PM to 11:59 PM | 192 (30.7%) | 0 (0.0%) |
| Total | 625 (100.0%) | 486 (100.0%) |
Housing Occupancy in Summersville
Occupancy by Ownership in Summersville
Of the total 1,556 dwellings in Summersville, owner-occupied units account for 920 (59.1%), while renter-occupied units make up 636 (40.9%).
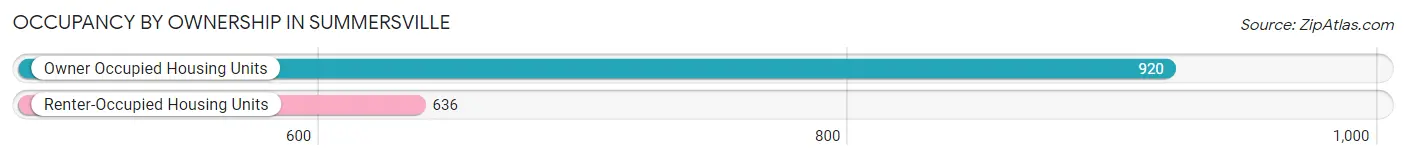
| Occupancy | # Housing Units | % Housing Units |
| Owner Occupied Housing Units | 920 | 59.1% |
| Renter-Occupied Housing Units | 636 | 40.9% |
| Total Occupied Housing Units | 1,556 | 100.0% |
Occupancy by Household Size in Summersville
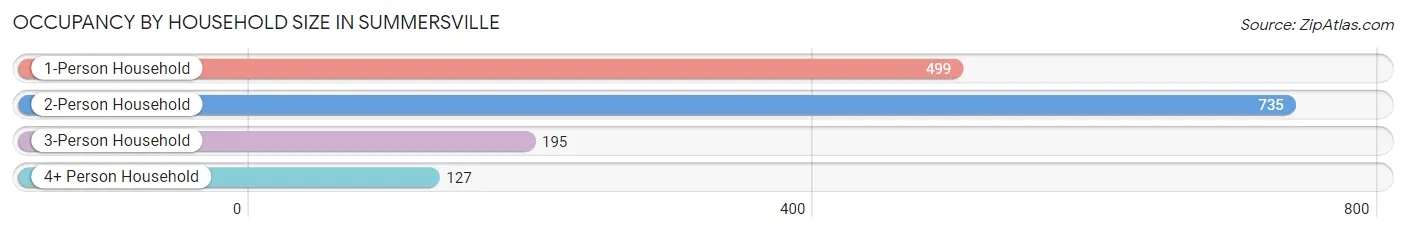
| Household Size | # Housing Units | % Housing Units |
| 1-Person Household | 499 | 32.1% |
| 2-Person Household | 735 | 47.2% |
| 3-Person Household | 195 | 12.5% |
| 4+ Person Household | 127 | 8.2% |
| Total Housing Units | 1,556 | 100.0% |
Occupancy by Ownership by Household Size in Summersville
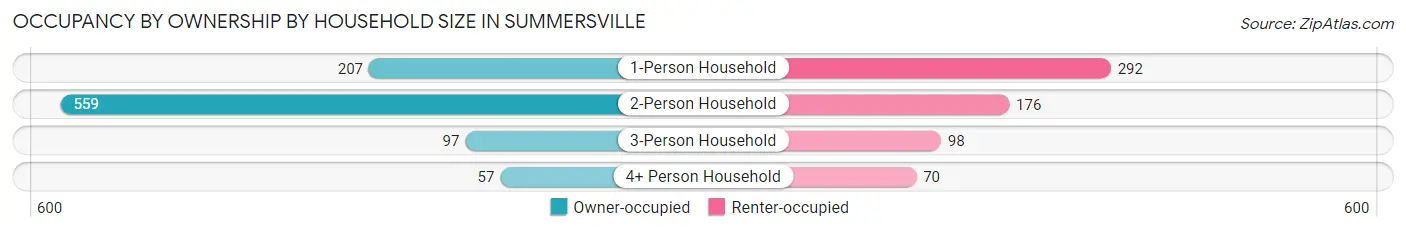
| Household Size | Owner-occupied | Renter-occupied |
| 1-Person Household | 207 (41.5%) | 292 (58.5%) |
| 2-Person Household | 559 (76.0%) | 176 (23.9%) |
| 3-Person Household | 97 (49.7%) | 98 (50.3%) |
| 4+ Person Household | 57 (44.9%) | 70 (55.1%) |
| Total Housing Units | 920 (59.1%) | 636 (40.9%) |
Occupancy by Educational Attainment in Summersville
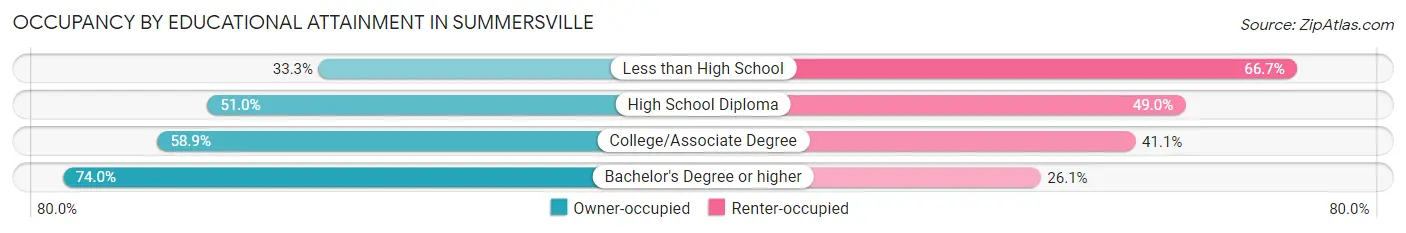
| Household Size | Owner-occupied | Renter-occupied |
| Less than High School | 23 (33.3%) | 46 (66.7%) |
| High School Diploma | 327 (51.0%) | 314 (49.0%) |
| College/Associate Degree | 218 (58.9%) | 152 (41.1%) |
| Bachelor's Degree or higher | 352 (74.0%) | 124 (26.1%) |
Occupancy by Age of Householder in Summersville
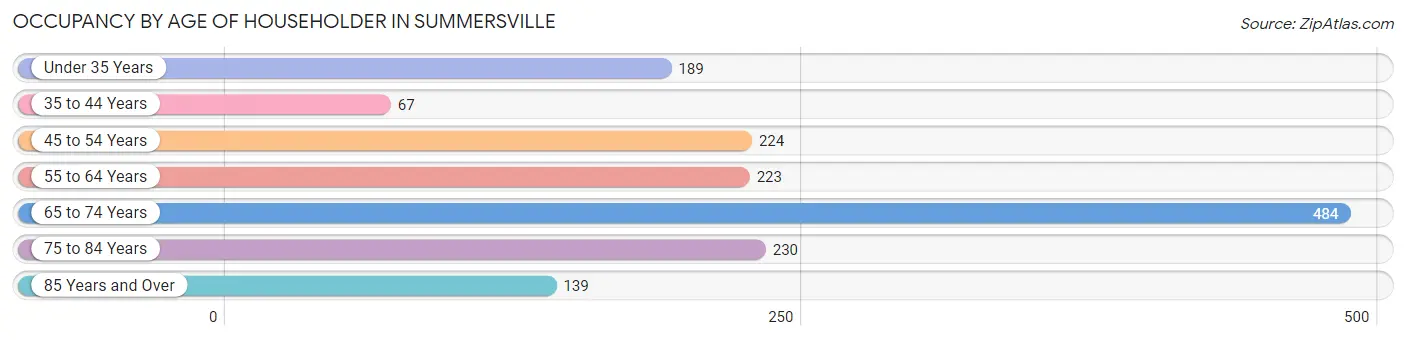
| Age Bracket | # Households | % Households |
| Under 35 Years | 189 | 12.1% |
| 35 to 44 Years | 67 | 4.3% |
| 45 to 54 Years | 224 | 14.4% |
| 55 to 64 Years | 223 | 14.3% |
| 65 to 74 Years | 484 | 31.1% |
| 75 to 84 Years | 230 | 14.8% |
| 85 Years and Over | 139 | 8.9% |
| Total | 1,556 | 100.0% |
Housing Finances in Summersville
Median Income by Occupancy in Summersville
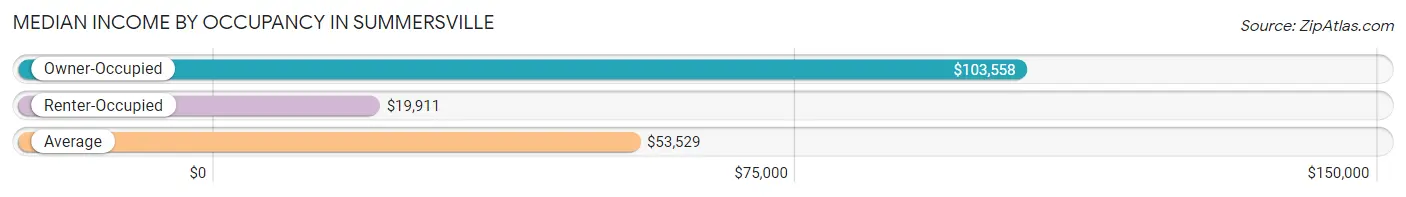
| Occupancy Type | # Households | Median Income |
| Owner-Occupied | 920 (59.1%) | $103,558 |
| Renter-Occupied | 636 (40.9%) | $19,911 |
| Average | 1,556 (100.0%) | $53,529 |
Occupancy by Householder Income Bracket in Summersville
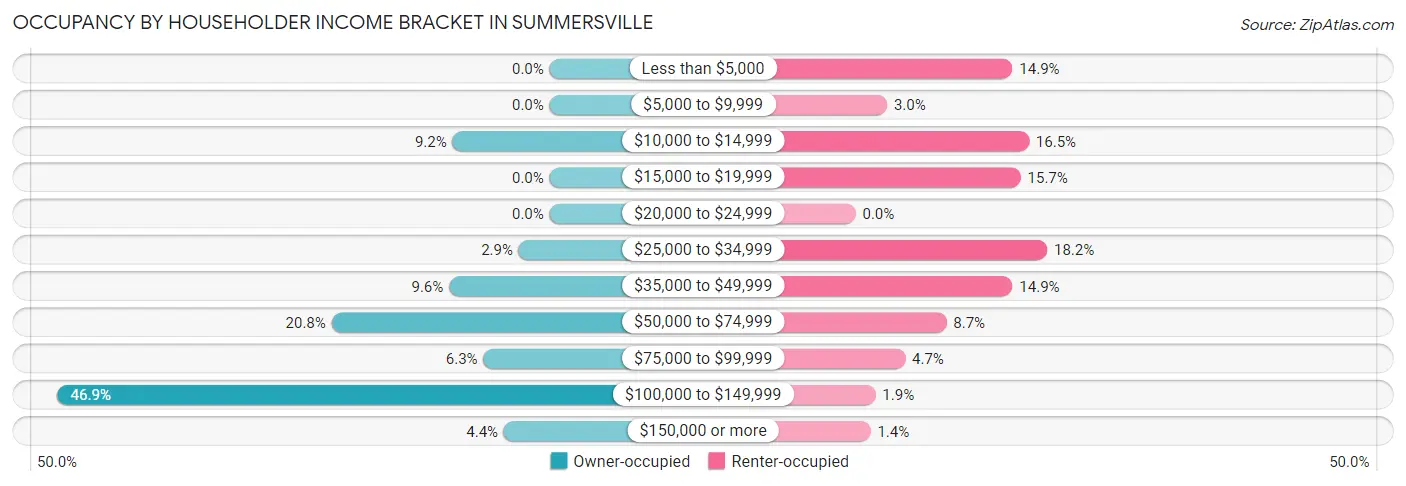
| Income Bracket | Owner-occupied | Renter-occupied |
| Less than $5,000 | 0 (0.0%) | 95 (14.9%) |
| $5,000 to $9,999 | 0 (0.0%) | 19 (3.0%) |
| $10,000 to $14,999 | 85 (9.2%) | 105 (16.5%) |
| $15,000 to $19,999 | 0 (0.0%) | 100 (15.7%) |
| $20,000 to $24,999 | 0 (0.0%) | 0 (0.0%) |
| $25,000 to $34,999 | 27 (2.9%) | 116 (18.2%) |
| $35,000 to $49,999 | 88 (9.6%) | 95 (14.9%) |
| $50,000 to $74,999 | 191 (20.8%) | 55 (8.6%) |
| $75,000 to $99,999 | 58 (6.3%) | 30 (4.7%) |
| $100,000 to $149,999 | 431 (46.9%) | 12 (1.9%) |
| $150,000 or more | 40 (4.3%) | 9 (1.4%) |
| Total | 920 (100.0%) | 636 (100.0%) |
Monthly Housing Cost Tiers in Summersville
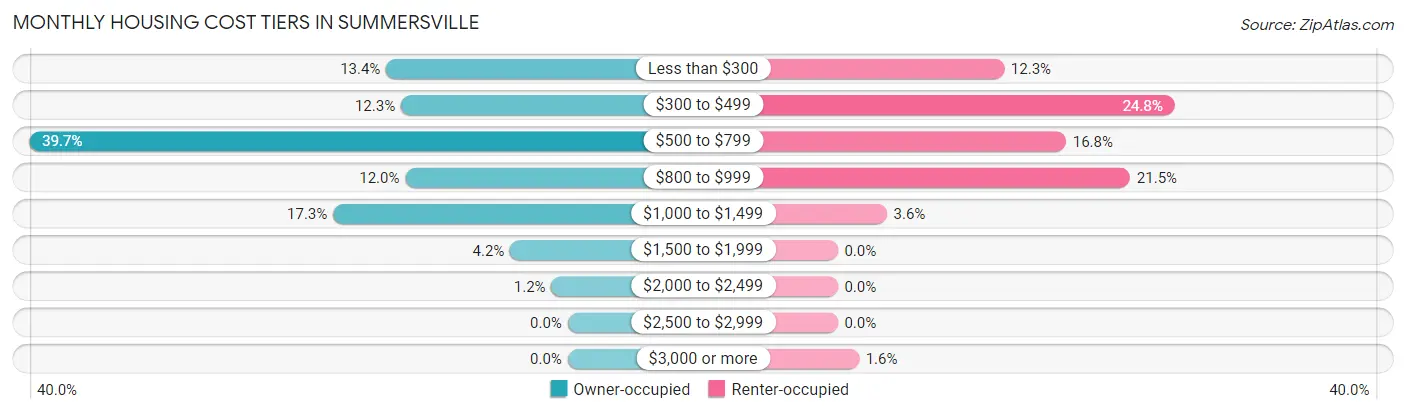
| Monthly Cost | Owner-occupied | Renter-occupied |
| Less than $300 | 123 (13.4%) | 78 (12.3%) |
| $300 to $499 | 113 (12.3%) | 158 (24.8%) |
| $500 to $799 | 365 (39.7%) | 107 (16.8%) |
| $800 to $999 | 110 (12.0%) | 137 (21.5%) |
| $1,000 to $1,499 | 159 (17.3%) | 23 (3.6%) |
| $1,500 to $1,999 | 39 (4.2%) | 0 (0.0%) |
| $2,000 to $2,499 | 11 (1.2%) | 0 (0.0%) |
| $2,500 to $2,999 | 0 (0.0%) | 0 (0.0%) |
| $3,000 or more | 0 (0.0%) | 10 (1.6%) |
| Total | 920 (100.0%) | 636 (100.0%) |
Physical Housing Characteristics in Summersville
Housing Structures in Summersville
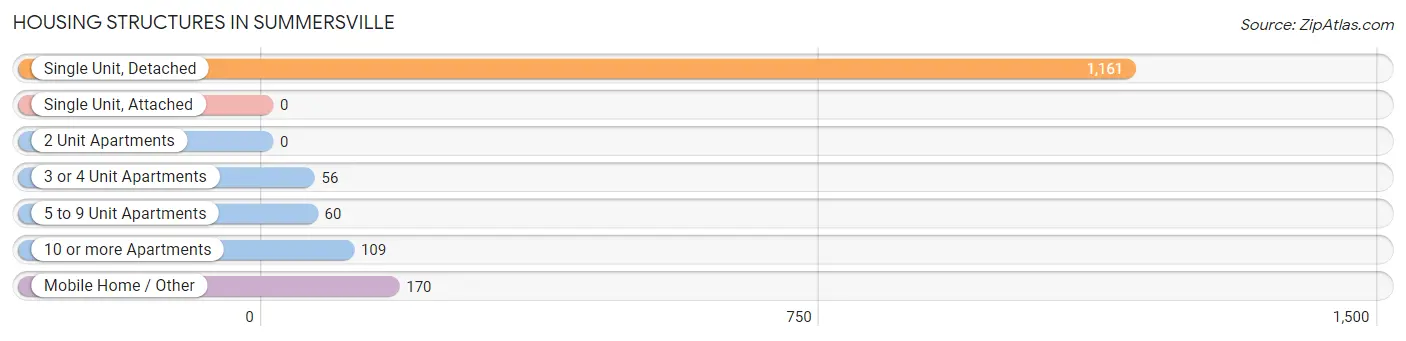
| Structure Type | # Housing Units | % Housing Units |
| Single Unit, Detached | 1,161 | 74.6% |
| Single Unit, Attached | 0 | 0.0% |
| 2 Unit Apartments | 0 | 0.0% |
| 3 or 4 Unit Apartments | 56 | 3.6% |
| 5 to 9 Unit Apartments | 60 | 3.9% |
| 10 or more Apartments | 109 | 7.0% |
| Mobile Home / Other | 170 | 10.9% |
| Total | 1,556 | 100.0% |
Housing Structures by Occupancy in Summersville
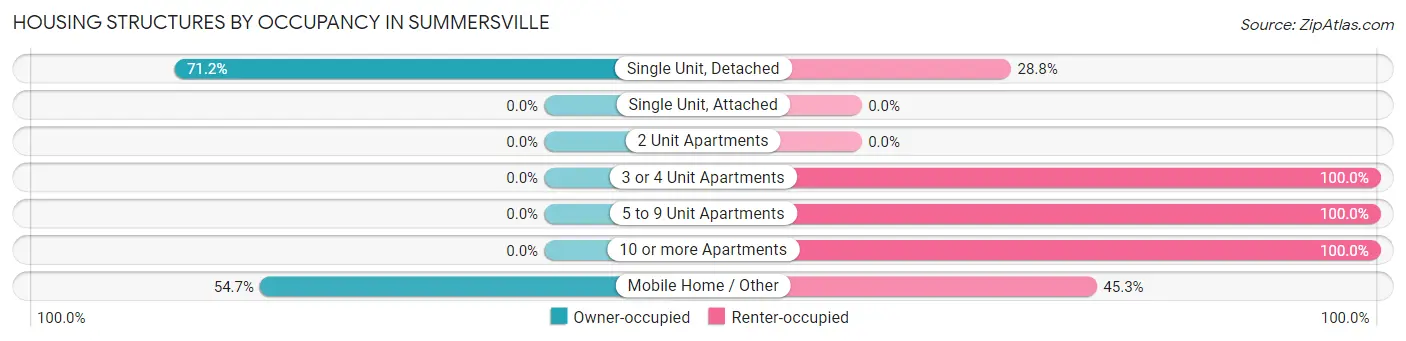
| Structure Type | Owner-occupied | Renter-occupied |
| Single Unit, Detached | 827 (71.2%) | 334 (28.8%) |
| Single Unit, Attached | 0 (0.0%) | 0 (0.0%) |
| 2 Unit Apartments | 0 (0.0%) | 0 (0.0%) |
| 3 or 4 Unit Apartments | 0 (0.0%) | 56 (100.0%) |
| 5 to 9 Unit Apartments | 0 (0.0%) | 60 (100.0%) |
| 10 or more Apartments | 0 (0.0%) | 109 (100.0%) |
| Mobile Home / Other | 93 (54.7%) | 77 (45.3%) |
| Total | 920 (59.1%) | 636 (40.9%) |
Housing Structures by Number of Rooms in Summersville
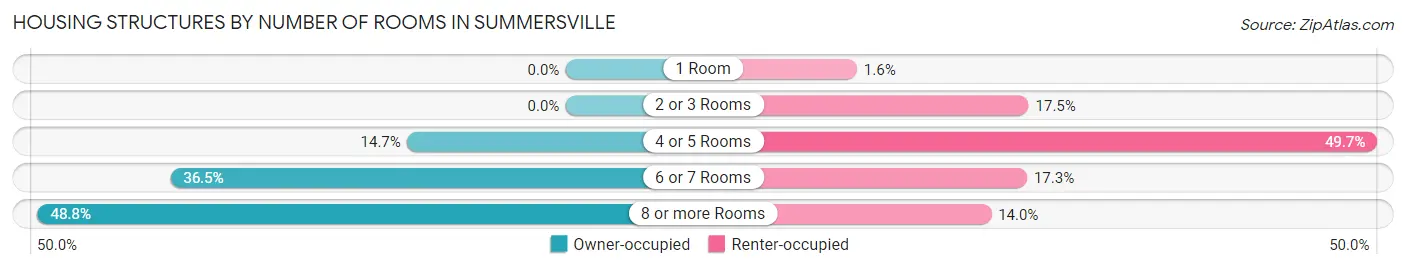
| Number of Rooms | Owner-occupied | Renter-occupied |
| 1 Room | 0 (0.0%) | 10 (1.6%) |
| 2 or 3 Rooms | 0 (0.0%) | 111 (17.4%) |
| 4 or 5 Rooms | 135 (14.7%) | 316 (49.7%) |
| 6 or 7 Rooms | 336 (36.5%) | 110 (17.3%) |
| 8 or more Rooms | 449 (48.8%) | 89 (14.0%) |
| Total | 920 (100.0%) | 636 (100.0%) |
Housing Structure by Heating Type in Summersville
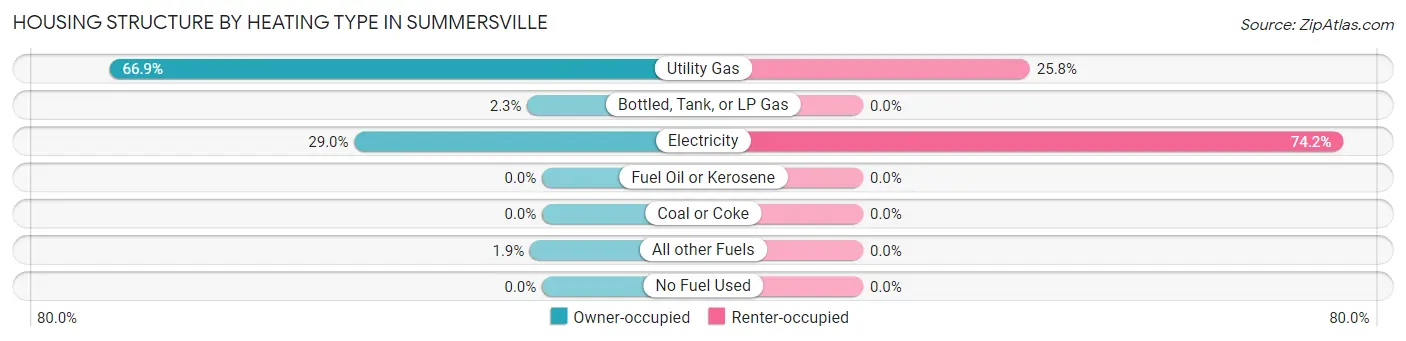
| Heating Type | Owner-occupied | Renter-occupied |
| Utility Gas | 615 (66.8%) | 164 (25.8%) |
| Bottled, Tank, or LP Gas | 21 (2.3%) | 0 (0.0%) |
| Electricity | 267 (29.0%) | 472 (74.2%) |
| Fuel Oil or Kerosene | 0 (0.0%) | 0 (0.0%) |
| Coal or Coke | 0 (0.0%) | 0 (0.0%) |
| All other Fuels | 17 (1.8%) | 0 (0.0%) |
| No Fuel Used | 0 (0.0%) | 0 (0.0%) |
| Total | 920 (100.0%) | 636 (100.0%) |
Household Vehicle Usage in Summersville
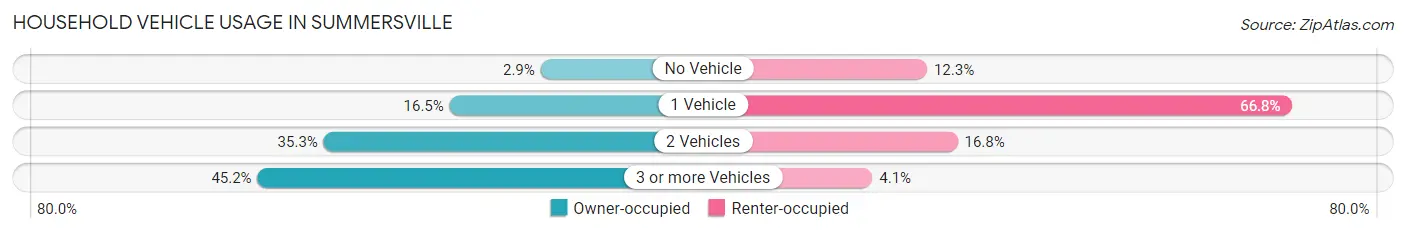
| Vehicles per Household | Owner-occupied | Renter-occupied |
| No Vehicle | 27 (2.9%) | 78 (12.3%) |
| 1 Vehicle | 152 (16.5%) | 425 (66.8%) |
| 2 Vehicles | 325 (35.3%) | 107 (16.8%) |
| 3 or more Vehicles | 416 (45.2%) | 26 (4.1%) |
| Total | 920 (100.0%) | 636 (100.0%) |
Real Estate & Mortgages in Summersville
Real Estate and Mortgage Overview in Summersville
| Characteristic | Without Mortgage | With Mortgage |
| Housing Units | 594 | 326 |
| Median Property Value | $237,500 | $158,600 |
| Median Household Income | $74,375 | $0 |
| Monthly Housing Costs | $551 | $0 |
| Real Estate Taxes | $1,402 | $0 |
Property Value by Mortgage Status in Summersville

| Property Value | Without Mortgage | With Mortgage |
| Less than $50,000 | 79 (13.3%) | 0 (0.0%) |
| $50,000 to $99,999 | 0 (0.0%) | 22 (6.8%) |
| $100,000 to $299,999 | 300 (50.5%) | 277 (85.0%) |
| $300,000 to $499,999 | 17 (2.9%) | 27 (8.3%) |
| $500,000 to $749,999 | 198 (33.3%) | 0 (0.0%) |
| $750,000 to $999,999 | 0 (0.0%) | 0 (0.0%) |
| $1,000,000 or more | 0 (0.0%) | 0 (0.0%) |
| Total | 594 (100.0%) | 326 (100.0%) |
Household Income by Mortgage Status in Summersville
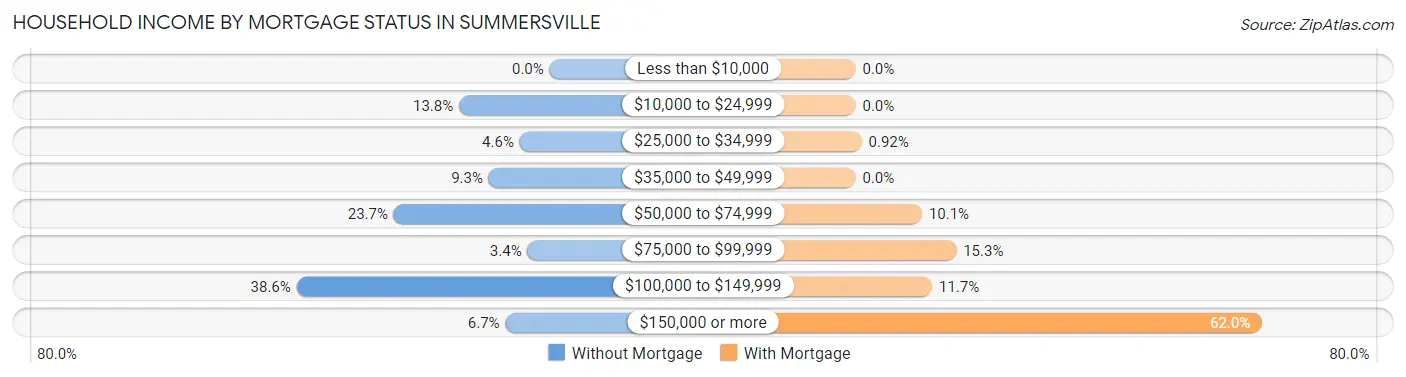
| Household Income | Without Mortgage | With Mortgage |
| Less than $10,000 | 0 (0.0%) | 0 (0.0%) |
| $10,000 to $24,999 | 82 (13.8%) | 0 (0.0%) |
| $25,000 to $34,999 | 27 (4.5%) | 3 (0.9%) |
| $35,000 to $49,999 | 55 (9.3%) | 0 (0.0%) |
| $50,000 to $74,999 | 141 (23.7%) | 33 (10.1%) |
| $75,000 to $99,999 | 20 (3.4%) | 50 (15.3%) |
| $100,000 to $149,999 | 229 (38.6%) | 38 (11.7%) |
| $150,000 or more | 40 (6.7%) | 202 (62.0%) |
| Total | 594 (100.0%) | 326 (100.0%) |
Property Value to Household Income Ratio in Summersville
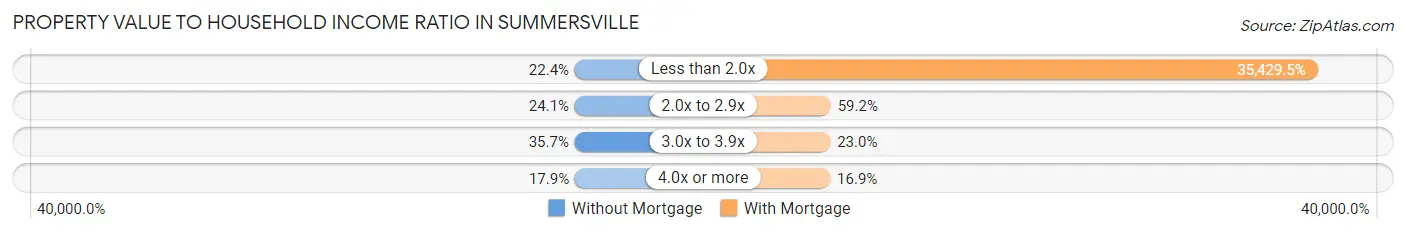
| Value-to-Income Ratio | Without Mortgage | With Mortgage |
| Less than 2.0x | 133 (22.4%) | 115,500 (35,429.5%) |
| 2.0x to 2.9x | 143 (24.1%) | 193 (59.2%) |
| 3.0x to 3.9x | 212 (35.7%) | 75 (23.0%) |
| 4.0x or more | 106 (17.8%) | 55 (16.9%) |
| Total | 594 (100.0%) | 326 (100.0%) |
Real Estate Taxes by Mortgage Status in Summersville
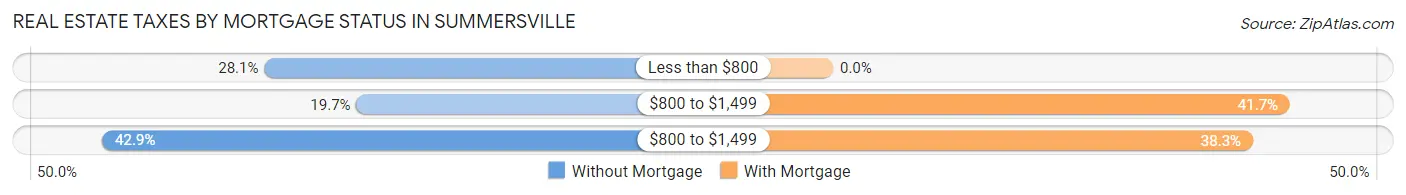
| Property Taxes | Without Mortgage | With Mortgage |
| Less than $800 | 167 (28.1%) | 0 (0.0%) |
| $800 to $1,499 | 117 (19.7%) | 136 (41.7%) |
| $800 to $1,499 | 255 (42.9%) | 125 (38.3%) |
| Total | 594 (100.0%) | 326 (100.0%) |
Health & Disability in Summersville
Health Insurance Coverage by Age in Summersville
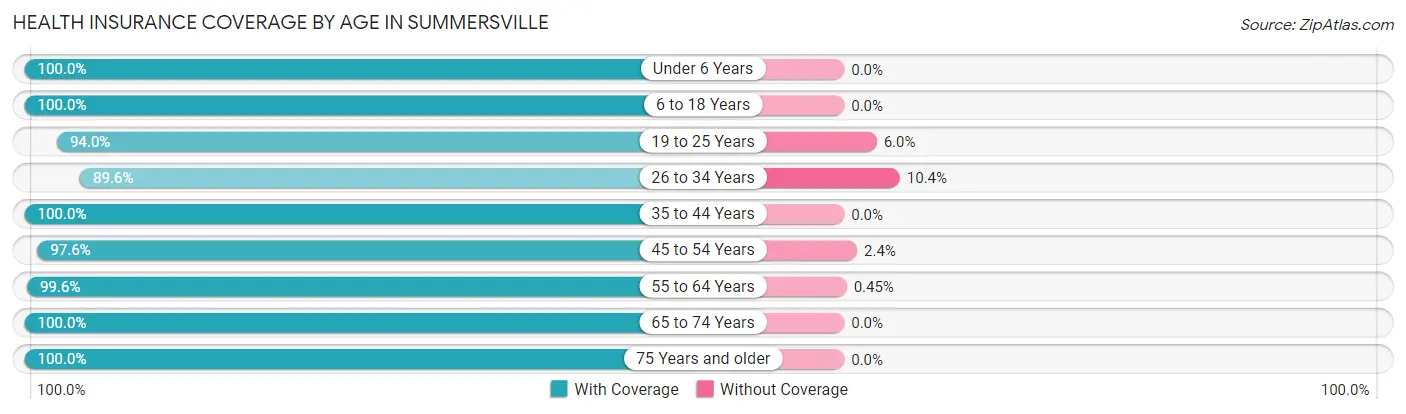
| Age Bracket | With Coverage | Without Coverage |
| Under 6 Years | 167 (100.0%) | 0 (0.0%) |
| 6 to 18 Years | 541 (100.0%) | 0 (0.0%) |
| 19 to 25 Years | 140 (94.0%) | 9 (6.0%) |
| 26 to 34 Years | 251 (89.6%) | 29 (10.4%) |
| 35 to 44 Years | 136 (100.0%) | 0 (0.0%) |
| 45 to 54 Years | 367 (97.6%) | 9 (2.4%) |
| 55 to 64 Years | 439 (99.6%) | 2 (0.4%) |
| 65 to 74 Years | 628 (100.0%) | 0 (0.0%) |
| 75 Years and older | 632 (100.0%) | 0 (0.0%) |
| Total | 3,301 (98.5%) | 49 (1.5%) |
Health Insurance Coverage by Citizenship Status in Summersville
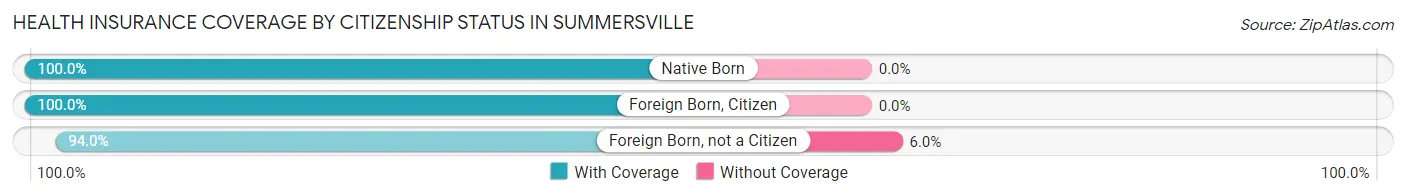
| Citizenship Status | With Coverage | Without Coverage |
| Native Born | 167 (100.0%) | 0 (0.0%) |
| Foreign Born, Citizen | 541 (100.0%) | 0 (0.0%) |
| Foreign Born, not a Citizen | 140 (94.0%) | 9 (6.0%) |
Health Insurance Coverage by Household Income in Summersville
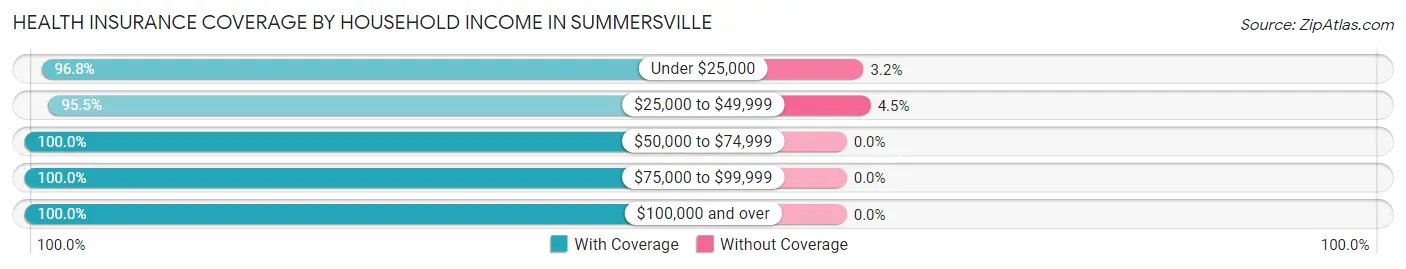
| Household Income | With Coverage | Without Coverage |
| Under $25,000 | 552 (96.8%) | 18 (3.2%) |
| $25,000 to $49,999 | 619 (95.5%) | 29 (4.5%) |
| $50,000 to $74,999 | 849 (100.0%) | 0 (0.0%) |
| $75,000 to $99,999 | 177 (100.0%) | 0 (0.0%) |
| $100,000 and over | 1,096 (100.0%) | 0 (0.0%) |
Public vs Private Health Insurance Coverage by Age in Summersville
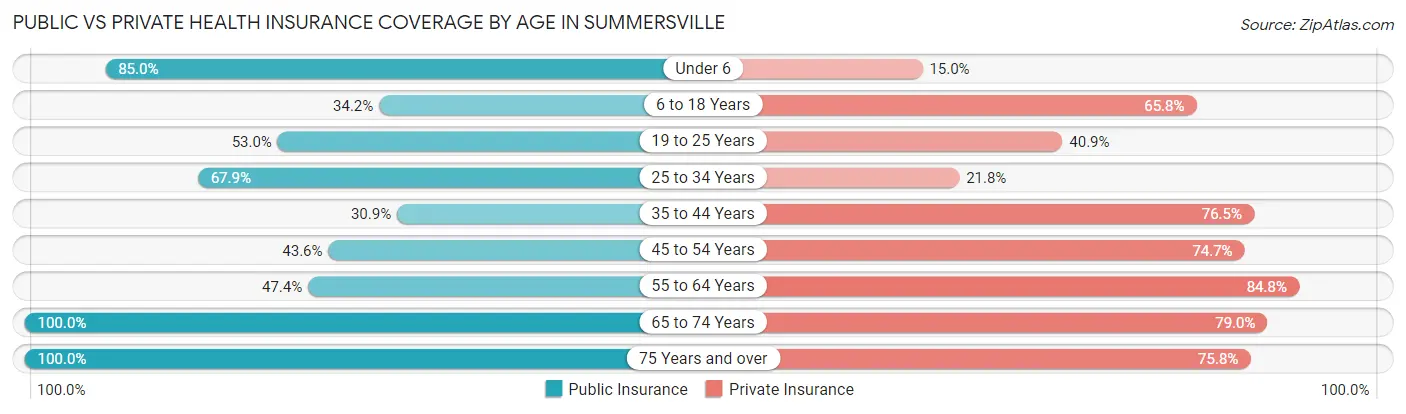
| Age Bracket | Public Insurance | Private Insurance |
| Under 6 | 142 (85.0%) | 25 (15.0%) |
| 6 to 18 Years | 185 (34.2%) | 356 (65.8%) |
| 19 to 25 Years | 79 (53.0%) | 61 (40.9%) |
| 25 to 34 Years | 190 (67.9%) | 61 (21.8%) |
| 35 to 44 Years | 42 (30.9%) | 104 (76.5%) |
| 45 to 54 Years | 164 (43.6%) | 281 (74.7%) |
| 55 to 64 Years | 209 (47.4%) | 374 (84.8%) |
| 65 to 74 Years | 628 (100.0%) | 496 (79.0%) |
| 75 Years and over | 632 (100.0%) | 479 (75.8%) |
| Total | 2,271 (67.8%) | 2,237 (66.8%) |
Disability Status by Sex by Age in Summersville
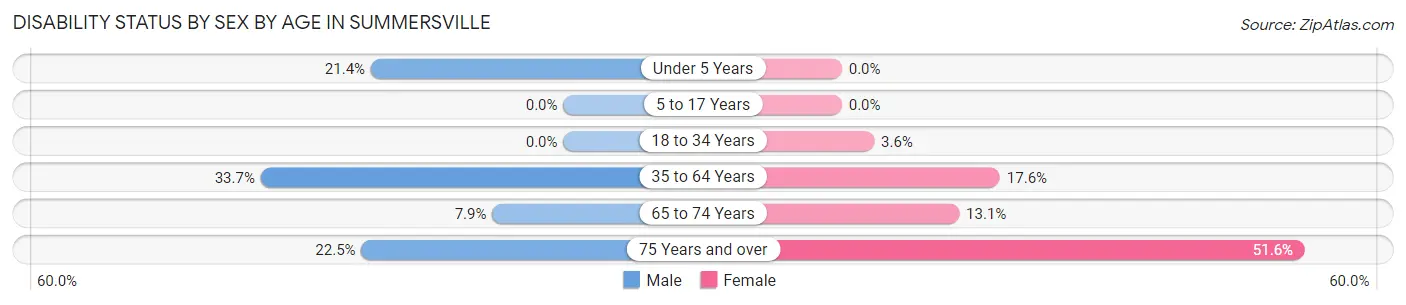
| Age Bracket | Male | Female |
| Under 5 Years | 24 (21.4%) | 0 (0.0%) |
| 5 to 17 Years | 0 (0.0%) | 0 (0.0%) |
| 18 to 34 Years | 0 (0.0%) | 10 (3.6%) |
| 35 to 64 Years | 124 (33.7%) | 103 (17.6%) |
| 65 to 74 Years | 20 (7.9%) | 49 (13.1%) |
| 75 Years and over | 85 (22.5%) | 131 (51.6%) |
Disability Class by Sex by Age in Summersville
Disability Class: Hearing Difficulty
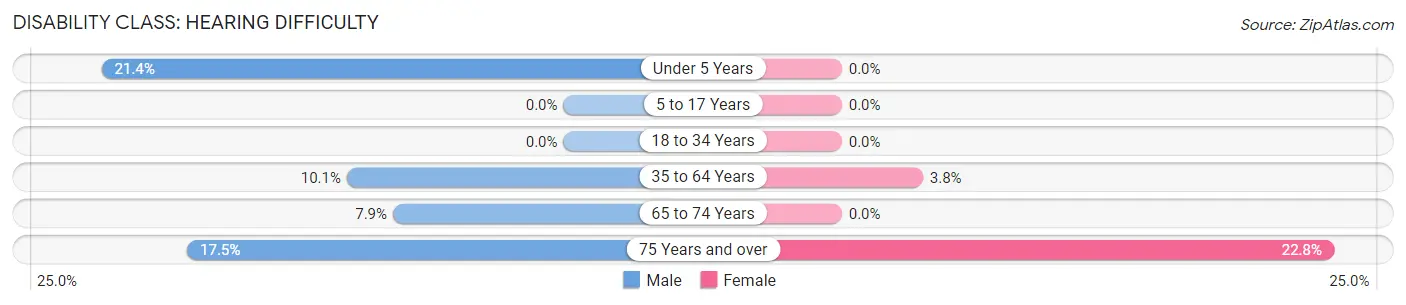
| Age Bracket | Male | Female |
| Under 5 Years | 24 (21.4%) | 0 (0.0%) |
| 5 to 17 Years | 0 (0.0%) | 0 (0.0%) |
| 18 to 34 Years | 0 (0.0%) | 0 (0.0%) |
| 35 to 64 Years | 37 (10.1%) | 22 (3.8%) |
| 65 to 74 Years | 20 (7.9%) | 0 (0.0%) |
| 75 Years and over | 66 (17.5%) | 58 (22.8%) |
Disability Class: Vision Difficulty
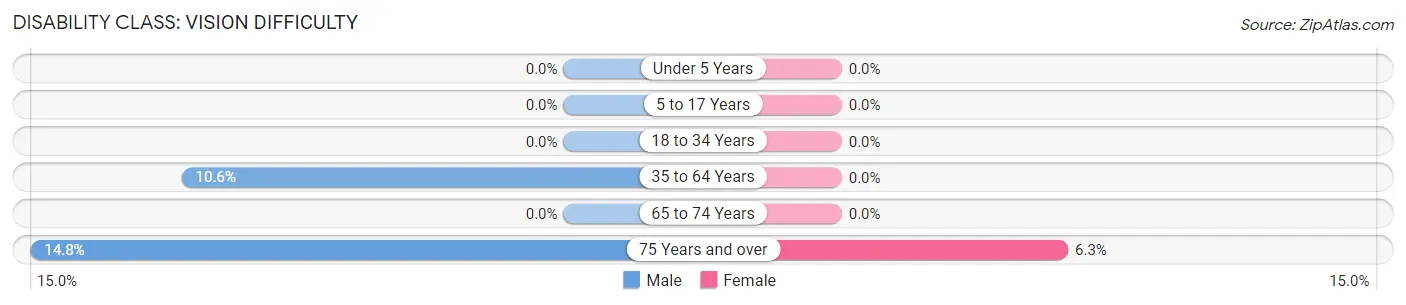
| Age Bracket | Male | Female |
| Under 5 Years | 0 (0.0%) | 0 (0.0%) |
| 5 to 17 Years | 0 (0.0%) | 0 (0.0%) |
| 18 to 34 Years | 0 (0.0%) | 0 (0.0%) |
| 35 to 64 Years | 39 (10.6%) | 0 (0.0%) |
| 65 to 74 Years | 0 (0.0%) | 0 (0.0%) |
| 75 Years and over | 56 (14.8%) | 16 (6.3%) |
Disability Class: Cognitive Difficulty
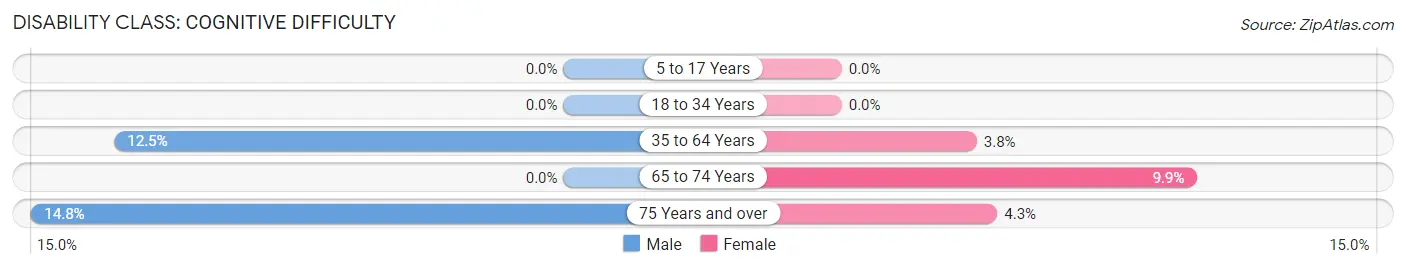
| Age Bracket | Male | Female |
| 5 to 17 Years | 0 (0.0%) | 0 (0.0%) |
| 18 to 34 Years | 0 (0.0%) | 0 (0.0%) |
| 35 to 64 Years | 46 (12.5%) | 22 (3.8%) |
| 65 to 74 Years | 0 (0.0%) | 37 (9.9%) |
| 75 Years and over | 56 (14.8%) | 11 (4.3%) |
Disability Class: Ambulatory Difficulty
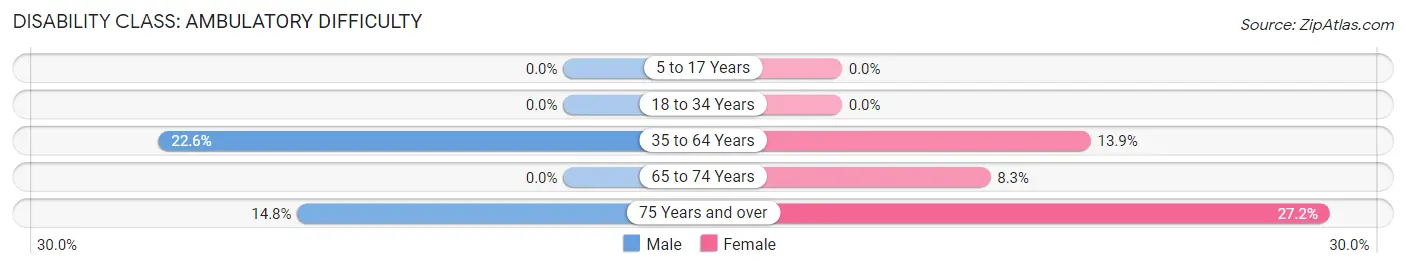
| Age Bracket | Male | Female |
| 5 to 17 Years | 0 (0.0%) | 0 (0.0%) |
| 18 to 34 Years | 0 (0.0%) | 0 (0.0%) |
| 35 to 64 Years | 83 (22.6%) | 81 (13.9%) |
| 65 to 74 Years | 0 (0.0%) | 31 (8.3%) |
| 75 Years and over | 56 (14.8%) | 69 (27.2%) |
Disability Class: Self-Care Difficulty
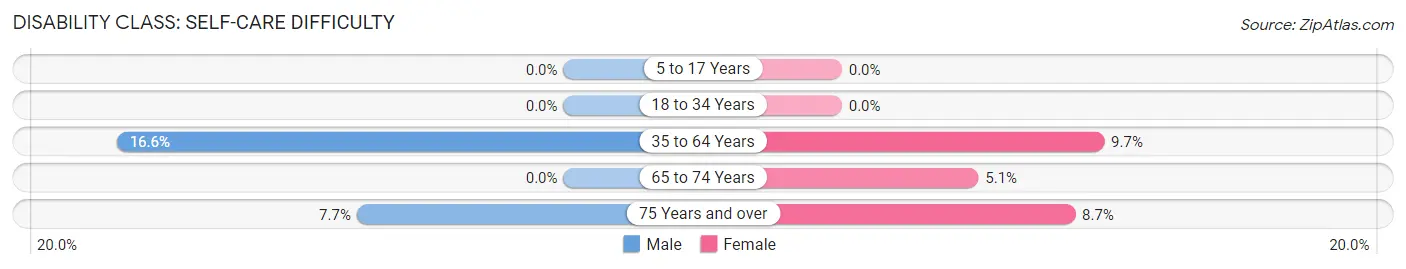
| Age Bracket | Male | Female |
| 5 to 17 Years | 0 (0.0%) | 0 (0.0%) |
| 18 to 34 Years | 0 (0.0%) | 0 (0.0%) |
| 35 to 64 Years | 61 (16.6%) | 57 (9.7%) |
| 65 to 74 Years | 0 (0.0%) | 19 (5.1%) |
| 75 Years and over | 29 (7.7%) | 22 (8.7%) |
Technology Access in Summersville
Computing Device Access in Summersville
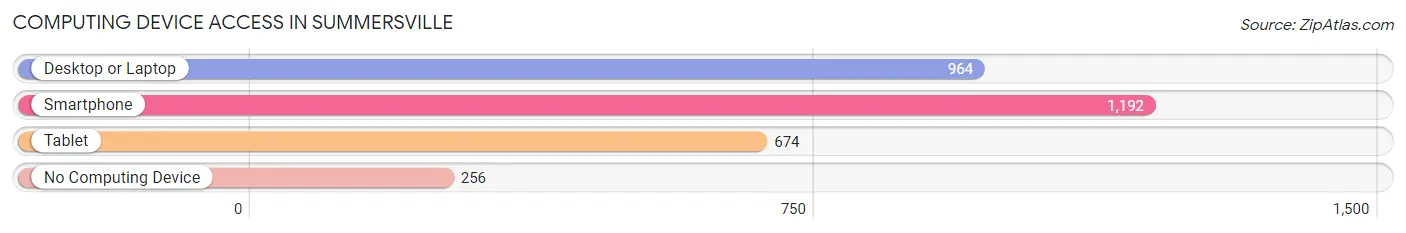
| Device Type | # Households | % Households |
| Desktop or Laptop | 964 | 62.0% |
| Smartphone | 1,192 | 76.6% |
| Tablet | 674 | 43.3% |
| No Computing Device | 256 | 16.5% |
| Total | 1,556 | 100.0% |
Internet Access in Summersville
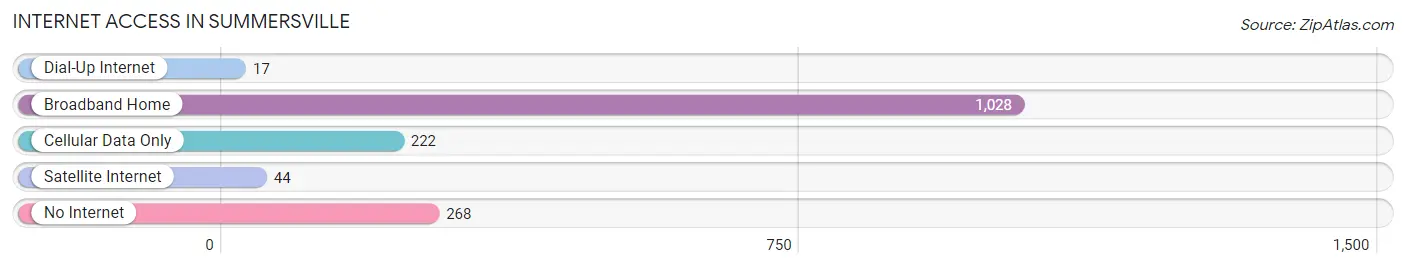
| Internet Type | # Households | % Households |
| Dial-Up Internet | 17 | 1.1% |
| Broadband Home | 1,028 | 66.1% |
| Cellular Data Only | 222 | 14.3% |
| Satellite Internet | 44 | 2.8% |
| No Internet | 268 | 17.2% |
| Total | 1,556 | 100.0% |
Summersville Summary
Summersville, West Virginia is a small town located in Nicholas County, in the southeastern part of the state. It is situated on the Gauley River, and is the county seat of Nicholas County. The town was founded in 1817 and named after William Summers, a local landowner. The population of Summersville was 2,919 at the 2010 census.
Geography
Summersville is located at the confluence of the Gauley and Cherry Rivers, in the Appalachian Mountains. The town is situated at an elevation of 1,845 feet (562 m) above sea level. Summersville is located approximately 50 miles (80 km) southeast of Charleston, the state capital.
The town is surrounded by the Monongahela National Forest, which covers over 900,000 acres (3,600 km2) of land in West Virginia. Summersville is also located near the New River Gorge National River, which is a popular destination for whitewater rafting and other outdoor activities.
Climate
Summersville has a humid subtropical climate, with hot, humid summers and cold, snowy winters. The average annual temperature is 54.3°F (12.4°C), and the average annual precipitation is 43.3 inches (110 cm).
Demographics
As of the 2010 census, there were 2,919 people, 1,213 households, and 790 families residing in Summersville. The population density was 1,072.3 people per square mile (414.7/km2). The racial makeup of the town was 97.2% White, 0.7% African American, 0.2% Native American, 0.3% Asian, 0.1% Pacific Islander, 0.3% from other races, and 1.3% from two or more races. Hispanic or Latino of any race were 1.2% of the population.
Economy
Summersville’s economy is largely based on tourism, with many visitors coming to the area to enjoy the outdoor activities offered in the surrounding national forests and rivers. The town is also home to several small businesses, including restaurants, retail stores, and service providers.
The town is also home to several manufacturing companies, including a plastics manufacturer, a furniture manufacturer, and a paper mill. Summersville is also home to a large coal mine, which is the largest employer in the area.
Conclusion
Summersville, West Virginia is a small town located in Nicholas County, in the southeastern part of the state. It is situated on the Gauley River, and is the county seat of Nicholas County. The town was founded in 1817 and named after William Summers, a local landowner. The population of Summersville was 2,919 at the 2010 census. Summersville has a humid subtropical climate, with hot, humid summers and cold, snowy winters. The town’s economy is largely based on tourism, with many visitors coming to the area to enjoy the outdoor activities offered in the surrounding national forests and rivers. Summersville is also home to several small businesses, manufacturing companies, and a large coal mine.
Common Questions
What is Per Capita Income in Summersville?
Per Capita income in Summersville is $34,368.
What is the Median Family Income in Summersville?
Median Family Income in Summersville is $90,757.
What is the Median Household income in Summersville?
Median Household Income in Summersville is $53,529.
What is Income or Wage Gap in Summersville?
Income or Wage Gap in Summersville is 5.3%.
Women in Summersville earn 94.7 cents for every dollar earned by a man.
What is Inequality or Gini Index in Summersville?
Inequality or Gini Index in Summersville is 0.49.
What is the Total Population of Summersville?
Total Population of Summersville is 3,415.
What is the Total Male Population of Summersville?
Total Male Population of Summersville is 1,730.
What is the Total Female Population of Summersville?
Total Female Population of Summersville is 1,685.
What is the Ratio of Males per 100 Females in Summersville?
There are 102.67 Males per 100 Females in Summersville.
What is the Ratio of Females per 100 Males in Summersville?
There are 97.40 Females per 100 Males in Summersville.
What is the Median Population Age in Summersville?
Median Population Age in Summersville is 56.1 Years.
What is the Average Family Size in Summersville
Average Family Size in Summersville is 2.6 People.
What is the Average Household Size in Summersville
Average Household Size in Summersville is 2.1 People.
How Large is the Labor Force in Summersville?
There are 1,256 People in the Labor Forcein in Summersville.
What is the Percentage of People in the Labor Force in Summersville?
43.3% of People are in the Labor Force in Summersville.
What is the Unemployment Rate in Summersville?
Unemployment Rate in Summersville is 5.3%.