Shady Spring, WV Map & Demographics
Shady Spring Map
Shady Spring Overview
$31,602
PER CAPITA INCOME
$66,806
AVG FAMILY INCOME
$64,215
AVG HOUSEHOLD INCOME
16.4%
WAGE / INCOME GAP [ % ]
83.6¢/ $1
WAGE / INCOME GAP [ $ ]
0.45
INEQUALITY / GINI INDEX
3,581
TOTAL POPULATION
1,725
MALE POPULATION
1,856
FEMALE POPULATION
92.94
MALES / 100 FEMALES
107.59
FEMALES / 100 MALES
43.8
MEDIAN AGE
3.0
AVG FAMILY SIZE
2.8
AVG HOUSEHOLD SIZE
1,465
LABOR FORCE [ PEOPLE ]
53.8%
PERCENT IN LABOR FORCE
10.4%
UNEMPLOYMENT RATE
Shady Spring Zip Codes
Shady Spring Area Codes
Income in Shady Spring
Income Overview in Shady Spring
Per Capita Income in Shady Spring is $31,602, while median incomes of families and households are $66,806 and $64,215 respectively.
| Characteristic | Number | Measure |
| Per Capita Income | 3,581 | $31,602 |
| Median Family Income | 1,089 | $66,806 |
| Mean Family Income | 1,089 | $91,976 |
| Median Household Income | 1,293 | $64,215 |
| Mean Household Income | 1,293 | $85,988 |
| Income Deficit | 1,089 | $0 |
| Wage / Income Gap (%) | 3,581 | 16.43% |
| Wage / Income Gap ($) | 3,581 | 83.57¢ per $1 |
| Gini / Inequality Index | 3,581 | 0.45 |
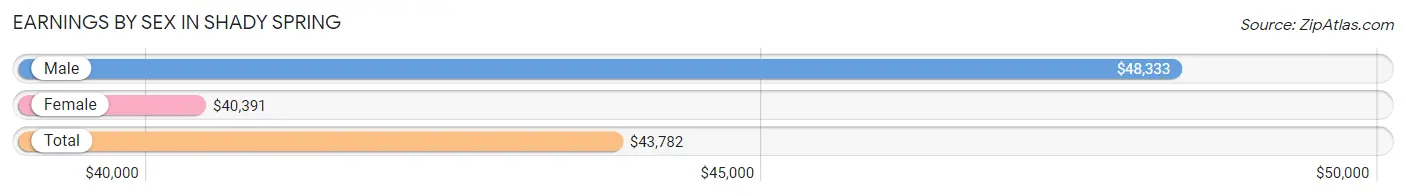
Earnings by Sex in Shady Spring
Average Earnings in Shady Spring are $43,782, $48,333 for men and $40,391 for women, a difference of 16.4%.
| Sex | Number | Average Earnings |
| Male | 774 (50.7%) | $48,333 |
| Female | 751 (49.2%) | $40,391 |
| Total | 1,525 (100.0%) | $43,782 |
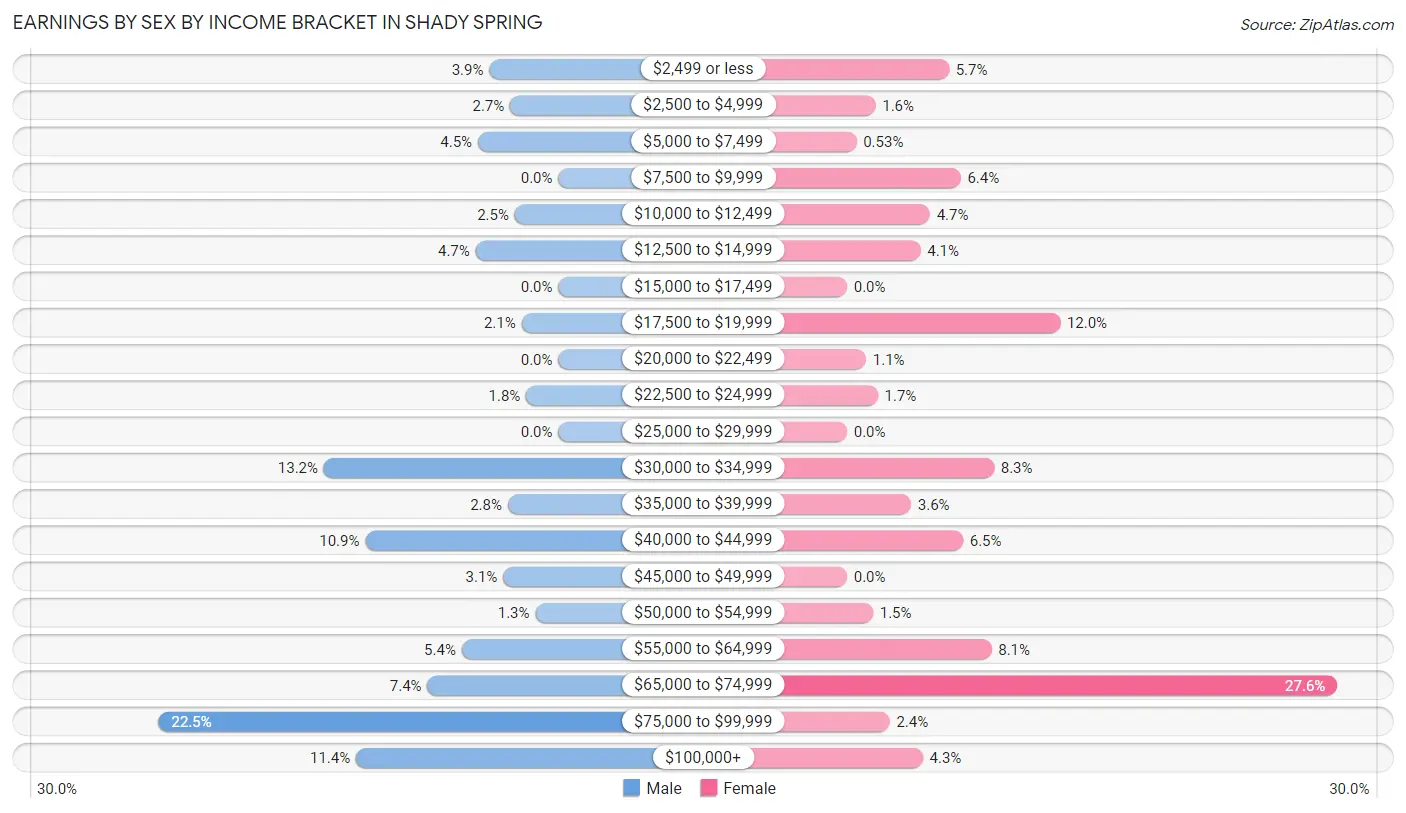
Earnings by Sex by Income Bracket in Shady Spring
The most common earnings brackets in Shady Spring are $75,000 to $99,999 for men (174 | 22.5%) and $65,000 to $74,999 for women (207 | 27.6%).
| Income | Male | Female |
| $2,499 or less | 30 (3.9%) | 43 (5.7%) |
| $2,500 to $4,999 | 21 (2.7%) | 12 (1.6%) |
| $5,000 to $7,499 | 35 (4.5%) | 4 (0.5%) |
| $7,500 to $9,999 | 0 (0.0%) | 48 (6.4%) |
| $10,000 to $12,499 | 19 (2.5%) | 35 (4.7%) |
| $12,500 to $14,999 | 36 (4.6%) | 31 (4.1%) |
| $15,000 to $17,499 | 0 (0.0%) | 0 (0.0%) |
| $17,500 to $19,999 | 16 (2.1%) | 90 (12.0%) |
| $20,000 to $22,499 | 0 (0.0%) | 8 (1.1%) |
| $22,500 to $24,999 | 14 (1.8%) | 13 (1.7%) |
| $25,000 to $29,999 | 0 (0.0%) | 0 (0.0%) |
| $30,000 to $34,999 | 102 (13.2%) | 62 (8.3%) |
| $35,000 to $39,999 | 22 (2.8%) | 27 (3.6%) |
| $40,000 to $44,999 | 84 (10.8%) | 49 (6.5%) |
| $45,000 to $49,999 | 24 (3.1%) | 0 (0.0%) |
| $50,000 to $54,999 | 10 (1.3%) | 11 (1.5%) |
| $55,000 to $64,999 | 42 (5.4%) | 61 (8.1%) |
| $65,000 to $74,999 | 57 (7.4%) | 207 (27.6%) |
| $75,000 to $99,999 | 174 (22.5%) | 18 (2.4%) |
| $100,000+ | 88 (11.4%) | 32 (4.3%) |
| Total | 774 (100.0%) | 751 (100.0%) |
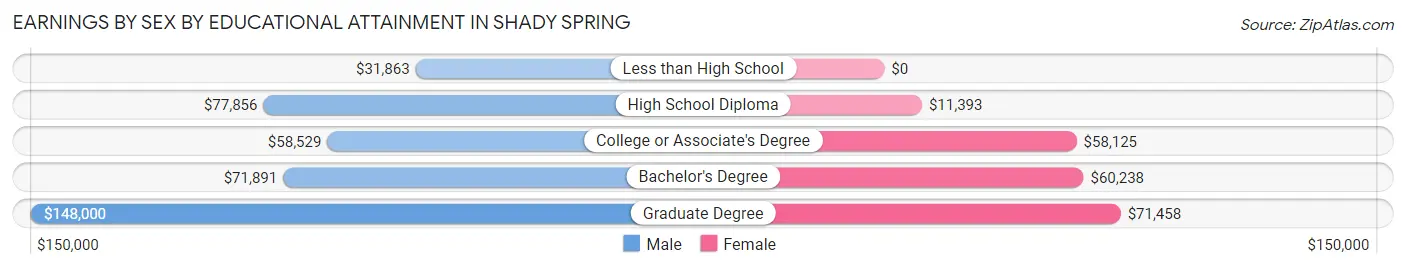
Earnings by Sex by Educational Attainment in Shady Spring
Average earnings in Shady Spring are $59,559 for men and $42,188 for women, a difference of 29.2%. Men with an educational attainment of graduate degree enjoy the highest average annual earnings of $148,000, while those with less than high school education earn the least with $31,863. Women with an educational attainment of graduate degree earn the most with the average annual earnings of $71,458, while those with high school diploma education have the smallest earnings of $11,393.
| Educational Attainment | Male Income | Female Income |
| Less than High School | $31,863 | $0 |
| High School Diploma | $77,856 | $11,393 |
| College or Associate's Degree | $58,529 | $58,125 |
| Bachelor's Degree | $71,891 | $60,238 |
| Graduate Degree | $148,000 | $71,458 |
| Total | $59,559 | $42,188 |
Family Income in Shady Spring
Family Income Brackets in Shady Spring
According to the Shady Spring family income data, there are 326 families falling into the $100,000 to $149,999 income range, which is the most common income bracket and makes up 29.9% of all families. Conversely, the less than $10,000 income bracket is the least frequent group with only 19 families (1.7%) belonging to this category.
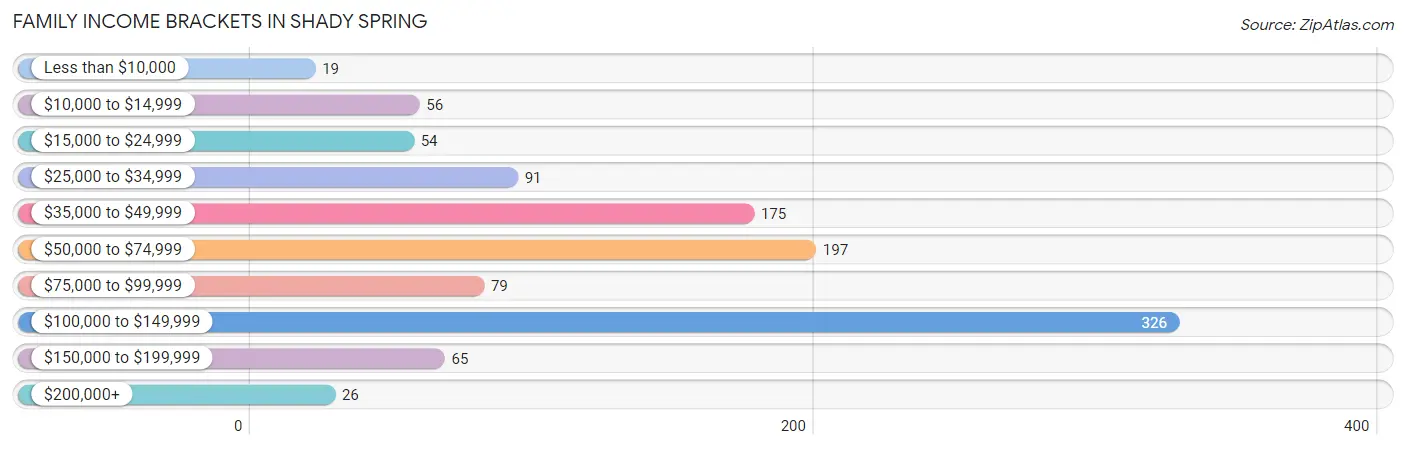
| Income Bracket | # Families | % Families |
| Less than $10,000 | 19 | 1.7% |
| $10,000 to $14,999 | 56 | 5.1% |
| $15,000 to $24,999 | 54 | 5.0% |
| $25,000 to $34,999 | 91 | 8.4% |
| $35,000 to $49,999 | 175 | 16.1% |
| $50,000 to $74,999 | 197 | 18.1% |
| $75,000 to $99,999 | 79 | 7.3% |
| $100,000 to $149,999 | 326 | 29.9% |
| $150,000 to $199,999 | 65 | 6.0% |
| $200,000+ | 26 | 2.4% |
Family Income by Famaliy Size in Shady Spring
2-person families (555 | 51.0%) account for the highest median family income in Shady Spring with $103,291 per family, while 2-person families (555 | 51.0%) have the highest median income of $51,646 per family member.
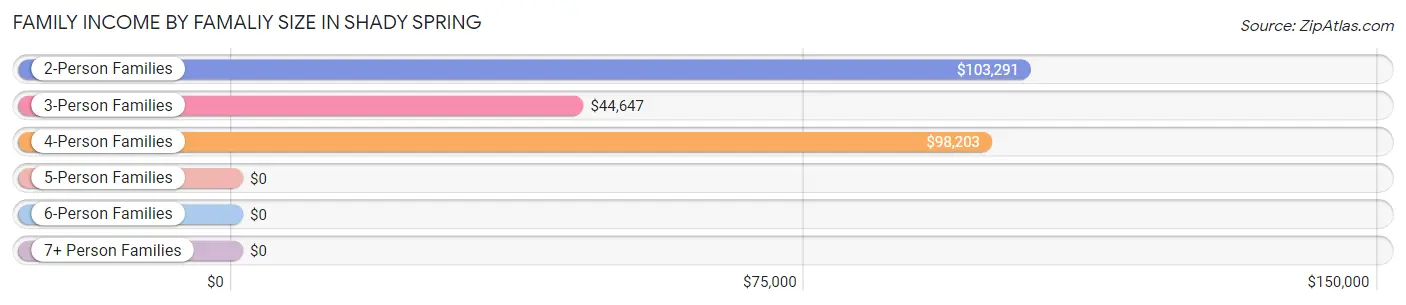
| Income Bracket | # Families | Median Income |
| 2-Person Families | 555 (51.0%) | $103,291 |
| 3-Person Families | 319 (29.3%) | $44,647 |
| 4-Person Families | 139 (12.8%) | $98,203 |
| 5-Person Families | 45 (4.1%) | $0 |
| 6-Person Families | 31 (2.9%) | $0 |
| 7+ Person Families | 0 (0.0%) | $0 |
| Total | 1,089 (100.0%) | $66,806 |
Family Income by Number of Earners in Shady Spring
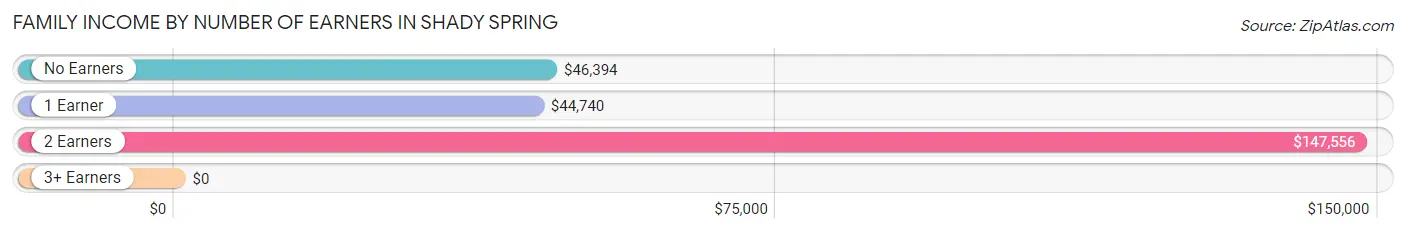
| Number of Earners | # Families | Median Income |
| No Earners | 268 (24.6%) | $46,394 |
| 1 Earner | 357 (32.8%) | $44,740 |
| 2 Earners | 441 (40.5%) | $147,556 |
| 3+ Earners | 23 (2.1%) | $0 |
| Total | 1,089 (100.0%) | $66,806 |
Household Income in Shady Spring
Household Income Brackets in Shady Spring
With 345 households falling in the category, the $100,000 to $149,999 income range is the most frequent in Shady Spring, accounting for 26.7% of all households. In contrast, only 56 households (4.3%) fall into the $150,000 to $199,999 income bracket, making it the least populous group.
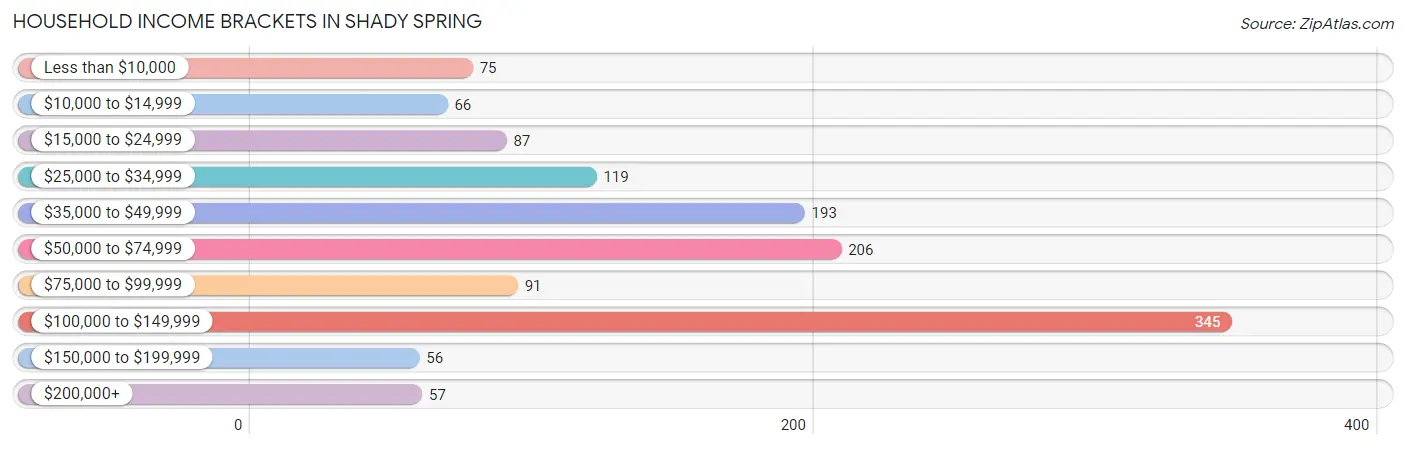
| Income Bracket | # Households | % Households |
| Less than $10,000 | 75 | 5.8% |
| $10,000 to $14,999 | 66 | 5.1% |
| $15,000 to $24,999 | 87 | 6.7% |
| $25,000 to $34,999 | 119 | 9.2% |
| $35,000 to $49,999 | 193 | 14.9% |
| $50,000 to $74,999 | 206 | 15.9% |
| $75,000 to $99,999 | 91 | 7.0% |
| $100,000 to $149,999 | 345 | 26.7% |
| $150,000 to $199,999 | 56 | 4.3% |
| $200,000+ | 57 | 4.4% |
Household Income by Householder Age in Shady Spring
The median household income in Shady Spring is $64,215, with the highest median household income of $62,878 found in the 65+ years age bracket for the primary householder. A total of 421 households (32.6%) fall into this category. Meanwhile, the 15 to 24 years age bracket for the primary householder has the lowest median household income of $0, with 9 households (0.7%) in this group.
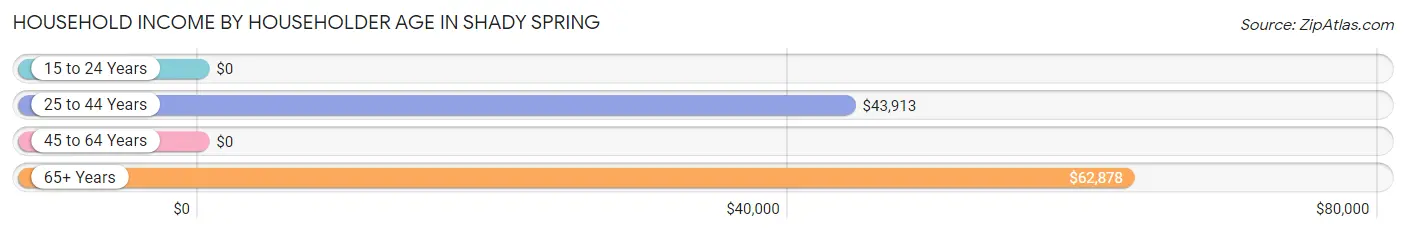
| Income Bracket | # Households | Median Income |
| 15 to 24 Years | 9 (0.7%) | $0 |
| 25 to 44 Years | 358 (27.7%) | $43,913 |
| 45 to 64 Years | 505 (39.1%) | $0 |
| 65+ Years | 421 (32.6%) | $62,878 |
| Total | 1,293 (100.0%) | $64,215 |
Poverty in Shady Spring
Income Below Poverty by Sex and Age in Shady Spring
With 19.7% poverty level for males and 19.8% for females among the residents of Shady Spring, 18 to 24 year old males and under 5 year old females are the most vulnerable to poverty, with 71 males (78.9%) and 44 females (69.8%) in their respective age groups living below the poverty level.
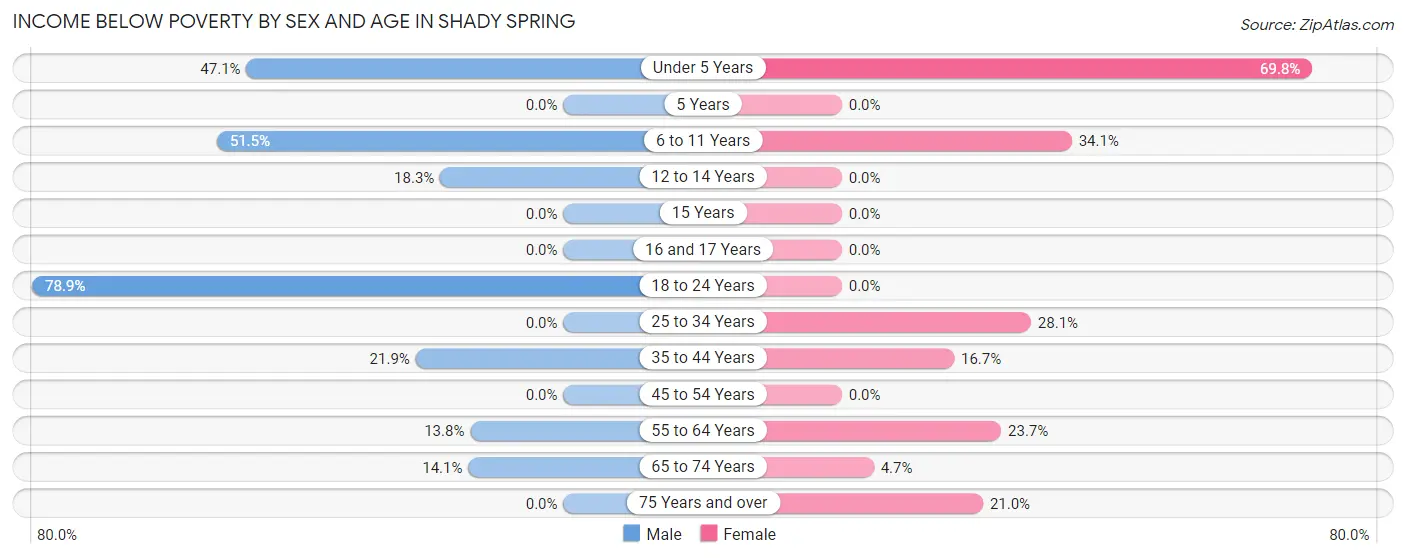
| Age Bracket | Male | Female |
| Under 5 Years | 56 (47.1%) | 44 (69.8%) |
| 5 Years | 0 (0.0%) | 0 (0.0%) |
| 6 to 11 Years | 88 (51.5%) | 99 (34.1%) |
| 12 to 14 Years | 15 (18.3%) | 0 (0.0%) |
| 15 Years | 0 (0.0%) | 0 (0.0%) |
| 16 and 17 Years | 0 (0.0%) | 0 (0.0%) |
| 18 to 24 Years | 71 (78.9%) | 0 (0.0%) |
| 25 to 34 Years | 0 (0.0%) | 73 (28.1%) |
| 35 to 44 Years | 41 (21.9%) | 32 (16.7%) |
| 45 to 54 Years | 0 (0.0%) | 0 (0.0%) |
| 55 to 64 Years | 43 (13.8%) | 75 (23.7%) |
| 65 to 74 Years | 25 (14.1%) | 10 (4.7%) |
| 75 Years and over | 0 (0.0%) | 35 (21.0%) |
| Total | 339 (19.7%) | 368 (19.8%) |
Income Above Poverty by Sex and Age in Shady Spring
According to the poverty statistics in Shady Spring, males aged 5 years and females aged 5 years are the age groups that are most secure financially, with 100.0% of males and 100.0% of females in these age groups living above the poverty line.
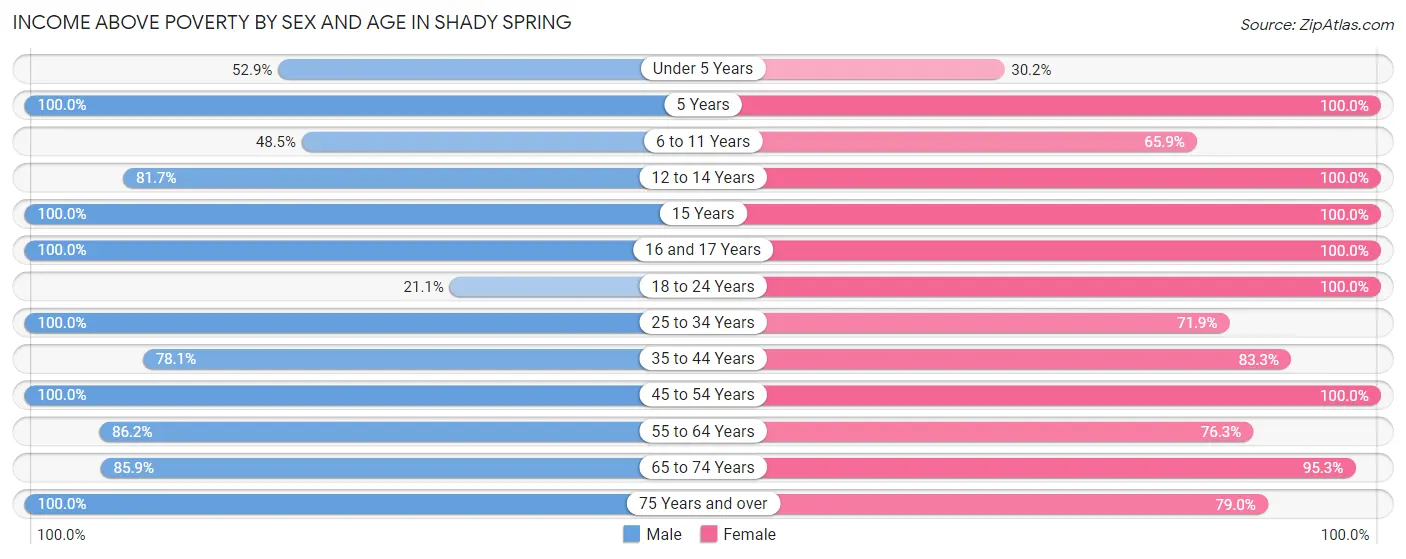
| Age Bracket | Male | Female |
| Under 5 Years | 63 (52.9%) | 19 (30.2%) |
| 5 Years | 2 (100.0%) | 17 (100.0%) |
| 6 to 11 Years | 83 (48.5%) | 191 (65.9%) |
| 12 to 14 Years | 67 (81.7%) | 15 (100.0%) |
| 15 Years | 66 (100.0%) | 33 (100.0%) |
| 16 and 17 Years | 8 (100.0%) | 8 (100.0%) |
| 18 to 24 Years | 19 (21.1%) | 68 (100.0%) |
| 25 to 34 Years | 139 (100.0%) | 187 (71.9%) |
| 35 to 44 Years | 146 (78.1%) | 160 (83.3%) |
| 45 to 54 Years | 218 (100.0%) | 215 (100.0%) |
| 55 to 64 Years | 268 (86.2%) | 242 (76.3%) |
| 65 to 74 Years | 152 (85.9%) | 201 (95.3%) |
| 75 Years and over | 155 (100.0%) | 132 (79.0%) |
| Total | 1,386 (80.3%) | 1,488 (80.2%) |
Income Below Poverty Among Married-Couple Families in Shady Spring
The poverty statistics for married-couple families in Shady Spring show that 5.0% or 38 of the total 765 families live below the poverty line. Families with 1 or 2 children have the highest poverty rate of 6.0%, comprising of 13 families. On the other hand, families with 3 or 4 children have the lowest poverty rate of 0.0%, which includes 0 families.
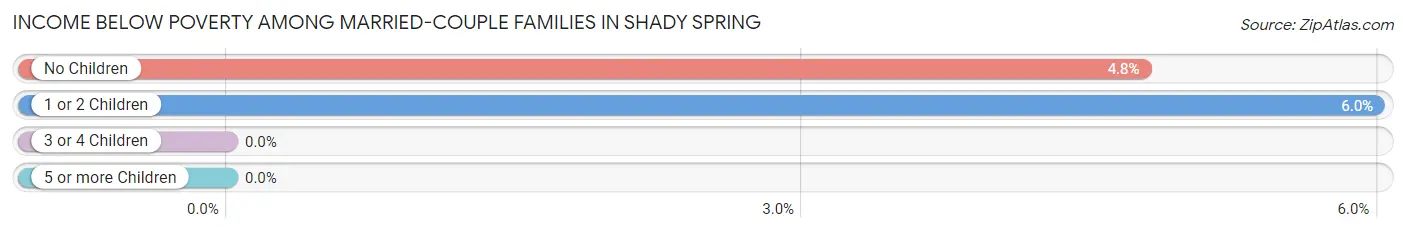
| Children | Above Poverty | Below Poverty |
| No Children | 499 (95.2%) | 25 (4.8%) |
| 1 or 2 Children | 204 (94.0%) | 13 (6.0%) |
| 3 or 4 Children | 24 (100.0%) | 0 (0.0%) |
| 5 or more Children | 0 (0.0%) | 0 (0.0%) |
| Total | 727 (95.0%) | 38 (5.0%) |
Income Below Poverty Among Single-Parent Households in Shady Spring
According to the poverty data in Shady Spring, 17.6% or 12 single-father households and 35.9% or 92 single-mother households are living below the poverty line. Among single-father households, those with 3 or 4 children have the highest poverty rate, with 12 households (100.0%) experiencing poverty. Likewise, among single-mother households, those with 5 or more children have the highest poverty rate, with 19 households (100.0%) falling below the poverty line.
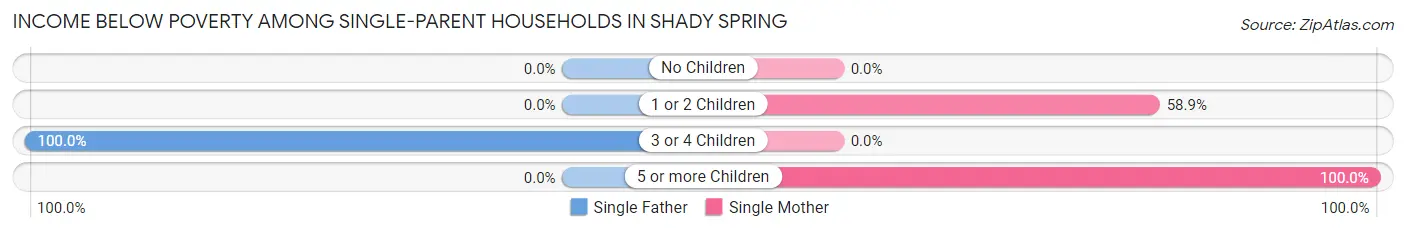
| Children | Single Father | Single Mother |
| No Children | 0 (0.0%) | 0 (0.0%) |
| 1 or 2 Children | 0 (0.0%) | 73 (58.9%) |
| 3 or 4 Children | 12 (100.0%) | 0 (0.0%) |
| 5 or more Children | 0 (0.0%) | 19 (100.0%) |
| Total | 12 (17.6%) | 92 (35.9%) |
Income Below Poverty Among Married-Couple vs Single-Parent Households in Shady Spring
The poverty data for Shady Spring shows that 38 of the married-couple family households (5.0%) and 104 of the single-parent households (32.1%) are living below the poverty level. Within the married-couple family households, those with 1 or 2 children have the highest poverty rate, with 13 households (6.0%) falling below the poverty line. Among the single-parent households, those with 5 or more children have the highest poverty rate, with 19 household (100.0%) living below poverty.
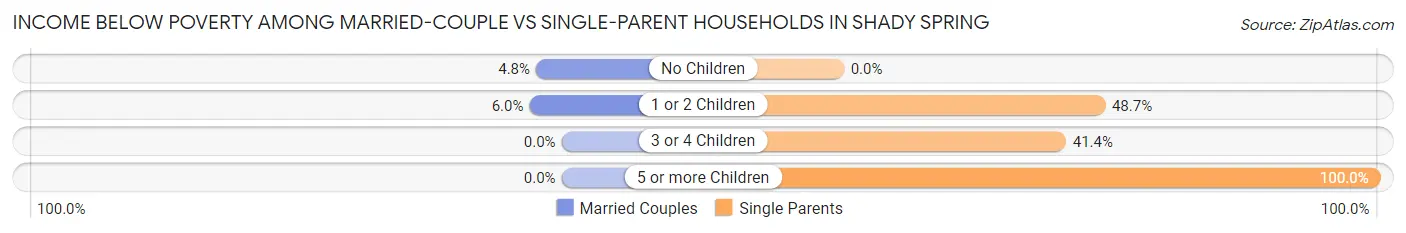
| Children | Married-Couple Families | Single-Parent Households |
| No Children | 25 (4.8%) | 0 (0.0%) |
| 1 or 2 Children | 13 (6.0%) | 73 (48.7%) |
| 3 or 4 Children | 0 (0.0%) | 12 (41.4%) |
| 5 or more Children | 0 (0.0%) | 19 (100.0%) |
| Total | 38 (5.0%) | 104 (32.1%) |
Race in Shady Spring
The most populous races in Shady Spring are White / Caucasian (3,412 | 95.3%), Black / African American (117 | 3.3%), and Two or more Races (52 | 1.5%).
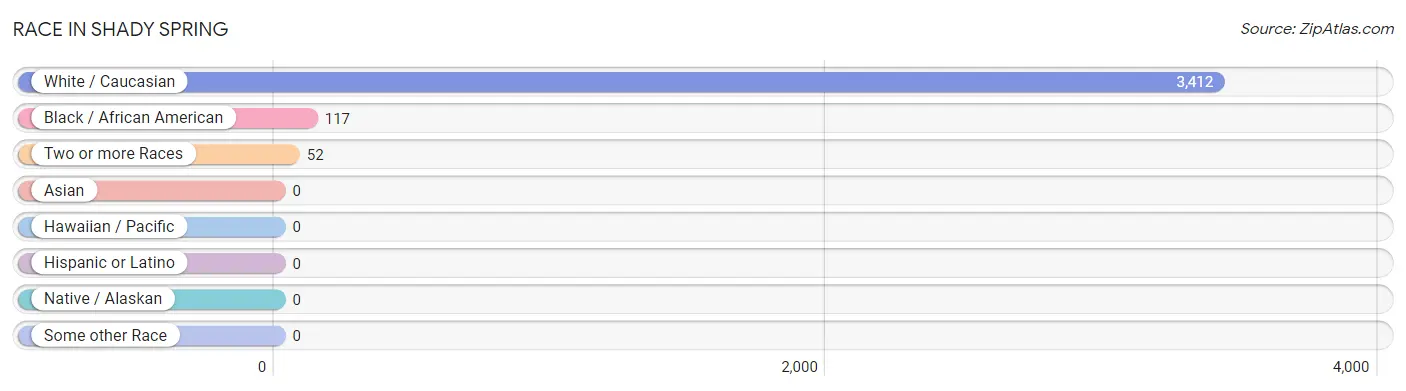
| Race | # Population | % Population |
| Asian | 0 | 0.0% |
| Black / African American | 117 | 3.3% |
| Hawaiian / Pacific | 0 | 0.0% |
| Hispanic or Latino | 0 | 0.0% |
| Native / Alaskan | 0 | 0.0% |
| White / Caucasian | 3,412 | 95.3% |
| Two or more Races | 52 | 1.5% |
| Some other Race | 0 | 0.0% |
| Total | 3,581 | 100.0% |
Ancestry in Shady Spring
The most populous ancestries reported in Shady Spring are English (1,340 | 37.4%), German (456 | 12.7%), Irish (435 | 12.1%), American (217 | 6.1%), and French Canadian (120 | 3.4%), together accounting for 71.7% of all Shady Spring residents.
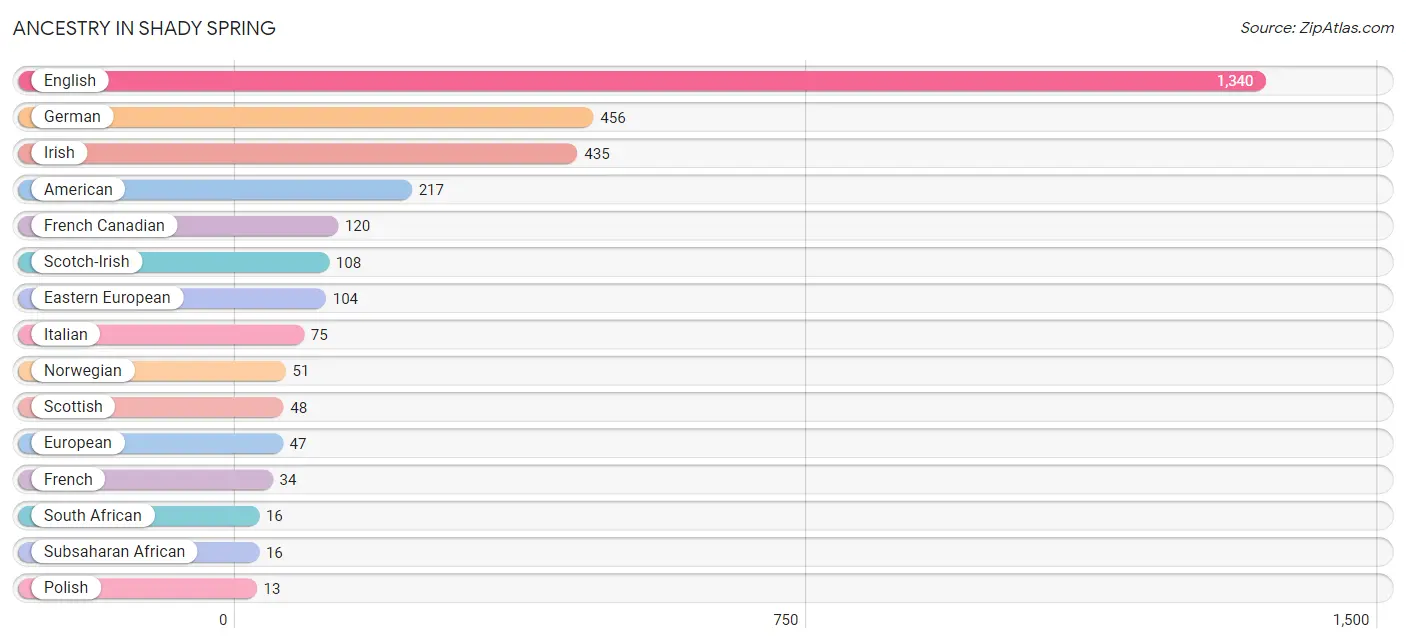
| Ancestry | # Population | % Population |
| American | 217 | 6.1% |
| British | 7 | 0.2% |
| Eastern European | 104 | 2.9% |
| English | 1,340 | 37.4% |
| European | 47 | 1.3% |
| French | 34 | 0.9% |
| French Canadian | 120 | 3.4% |
| German | 456 | 12.7% |
| Hungarian | 10 | 0.3% |
| Irish | 435 | 12.1% |
| Italian | 75 | 2.1% |
| Norwegian | 51 | 1.4% |
| Polish | 13 | 0.4% |
| Romanian | 10 | 0.3% |
| Scotch-Irish | 108 | 3.0% |
| Scottish | 48 | 1.3% |
| South African | 16 | 0.4% |
| Subsaharan African | 16 | 0.4% |
| Turkish | 12 | 0.3% |
| Welsh | 10 | 0.3% | View All 20 Rows |
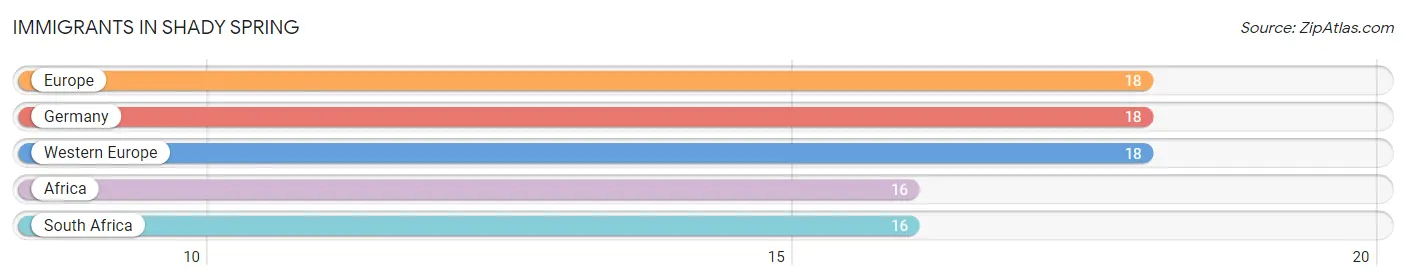
Immigrants in Shady Spring
The most numerous immigrant groups reported in Shady Spring came from Europe (18 | 0.5%), Germany (18 | 0.5%), Western Europe (18 | 0.5%), Africa (16 | 0.4%), and South Africa (16 | 0.4%), together accounting for 2.4% of all Shady Spring residents.
| Immigration Origin | # Population | % Population |
| Africa | 16 | 0.4% |
| Europe | 18 | 0.5% |
| Germany | 18 | 0.5% |
| South Africa | 16 | 0.4% |
| Western Europe | 18 | 0.5% | View All 5 Rows |
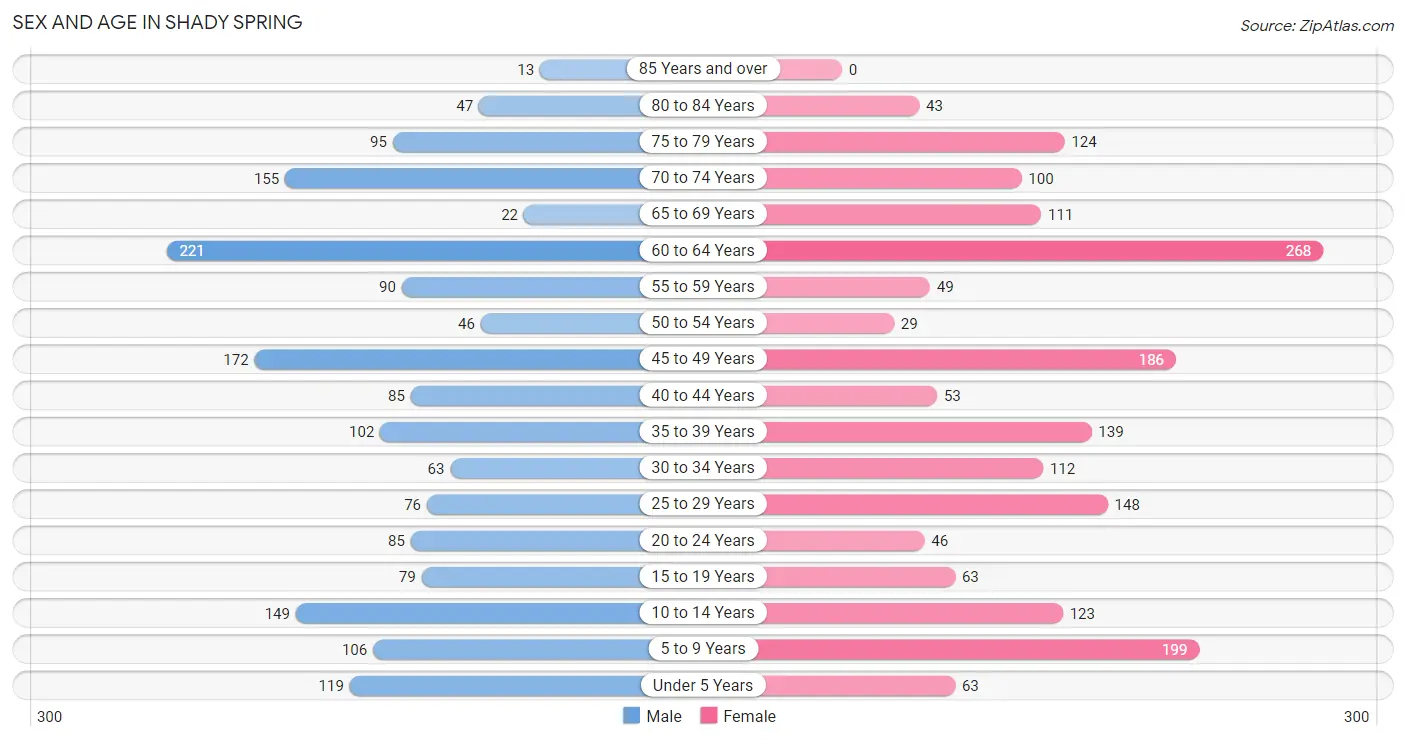
Sex and Age in Shady Spring
Sex and Age in Shady Spring
The most populous age groups in Shady Spring are 60 to 64 Years (221 | 12.8%) for men and 60 to 64 Years (268 | 14.4%) for women.
| Age Bracket | Male | Female |
| Under 5 Years | 119 (6.9%) | 63 (3.4%) |
| 5 to 9 Years | 106 (6.1%) | 199 (10.7%) |
| 10 to 14 Years | 149 (8.6%) | 123 (6.6%) |
| 15 to 19 Years | 79 (4.6%) | 63 (3.4%) |
| 20 to 24 Years | 85 (4.9%) | 46 (2.5%) |
| 25 to 29 Years | 76 (4.4%) | 148 (8.0%) |
| 30 to 34 Years | 63 (3.6%) | 112 (6.0%) |
| 35 to 39 Years | 102 (5.9%) | 139 (7.5%) |
| 40 to 44 Years | 85 (4.9%) | 53 (2.9%) |
| 45 to 49 Years | 172 (10.0%) | 186 (10.0%) |
| 50 to 54 Years | 46 (2.7%) | 29 (1.6%) |
| 55 to 59 Years | 90 (5.2%) | 49 (2.6%) |
| 60 to 64 Years | 221 (12.8%) | 268 (14.4%) |
| 65 to 69 Years | 22 (1.3%) | 111 (6.0%) |
| 70 to 74 Years | 155 (9.0%) | 100 (5.4%) |
| 75 to 79 Years | 95 (5.5%) | 124 (6.7%) |
| 80 to 84 Years | 47 (2.7%) | 43 (2.3%) |
| 85 Years and over | 13 (0.7%) | 0 (0.0%) |
| Total | 1,725 (100.0%) | 1,856 (100.0%) |
Families and Households in Shady Spring
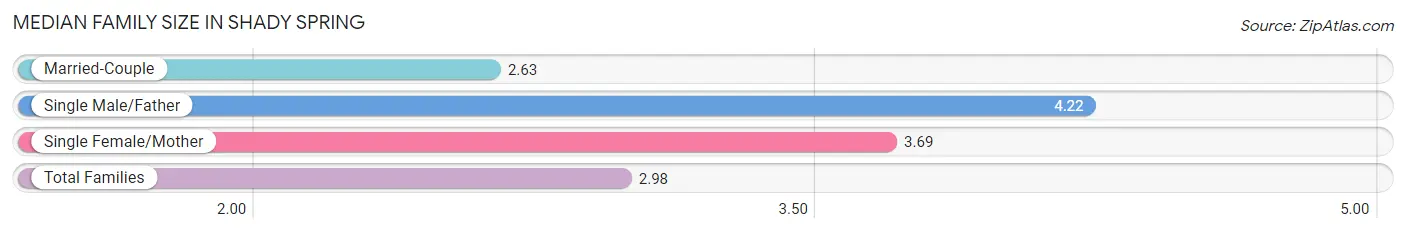
Median Family Size in Shady Spring
The median family size in Shady Spring is 2.98 persons per family, with single male/father families (68 | 6.2%) accounting for the largest median family size of 4.22 persons per family. On the other hand, married-couple families (765 | 70.3%) represent the smallest median family size with 2.63 persons per family.
| Family Type | # Families | Family Size |
| Married-Couple | 765 (70.3%) | 2.63 |
| Single Male/Father | 68 (6.2%) | 4.22 |
| Single Female/Mother | 256 (23.5%) | 3.69 |
| Total Families | 1,089 (100.0%) | 2.98 |
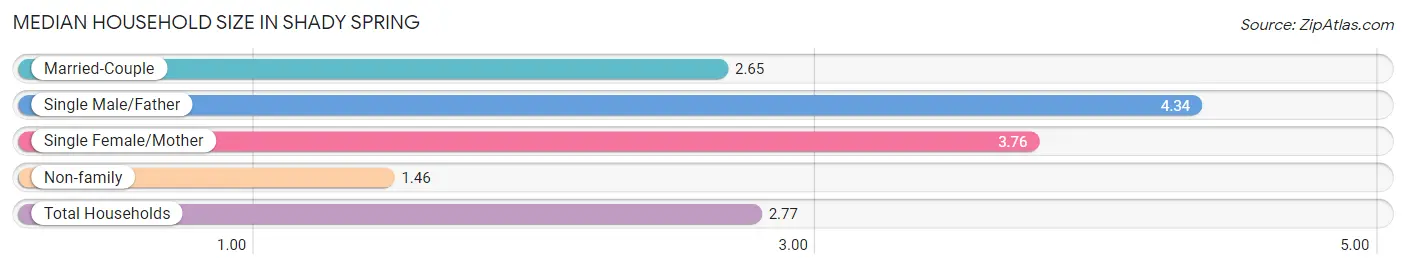
Median Household Size in Shady Spring
The median household size in Shady Spring is 2.77 persons per household, with single male/father households (68 | 5.3%) accounting for the largest median household size of 4.34 persons per household. non-family households (204 | 15.8%) represent the smallest median household size with 1.46 persons per household.
| Household Type | # Households | Household Size |
| Married-Couple | 765 (59.2%) | 2.65 |
| Single Male/Father | 68 (5.3%) | 4.34 |
| Single Female/Mother | 256 (19.8%) | 3.76 |
| Non-family | 204 (15.8%) | 1.46 |
| Total Households | 1,293 (100.0%) | 2.77 |
Household Size by Marriage Status in Shady Spring
Out of a total of 1,293 households in Shady Spring, 1,089 (84.2%) are family households, while 204 (15.8%) are nonfamily households. The most numerous type of family households are 2-person households, comprising 555, and the most common type of nonfamily households are 1-person households, comprising 124.
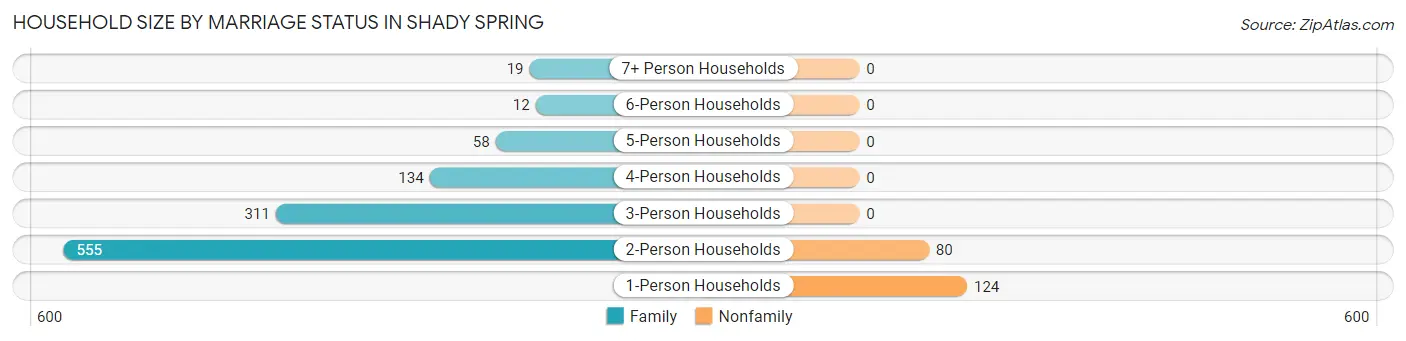
| Household Size | Family Households | Nonfamily Households |
| 1-Person Households | - | 124 (9.6%) |
| 2-Person Households | 555 (42.9%) | 80 (6.2%) |
| 3-Person Households | 311 (24.0%) | 0 (0.0%) |
| 4-Person Households | 134 (10.4%) | 0 (0.0%) |
| 5-Person Households | 58 (4.5%) | 0 (0.0%) |
| 6-Person Households | 12 (0.9%) | 0 (0.0%) |
| 7+ Person Households | 19 (1.5%) | 0 (0.0%) |
| Total | 1,089 (84.2%) | 204 (15.8%) |
Female Fertility in Shady Spring
Fertility by Age in Shady Spring
Average fertility rate in Shady Spring is 16.0 births per 1,000 women. Women in the age bracket of 20 to 34 years have the highest fertility rate with 39.0 births per 1,000 women. Women in the age bracket of 20 to 34 years acount for 100.0% of all women with births.
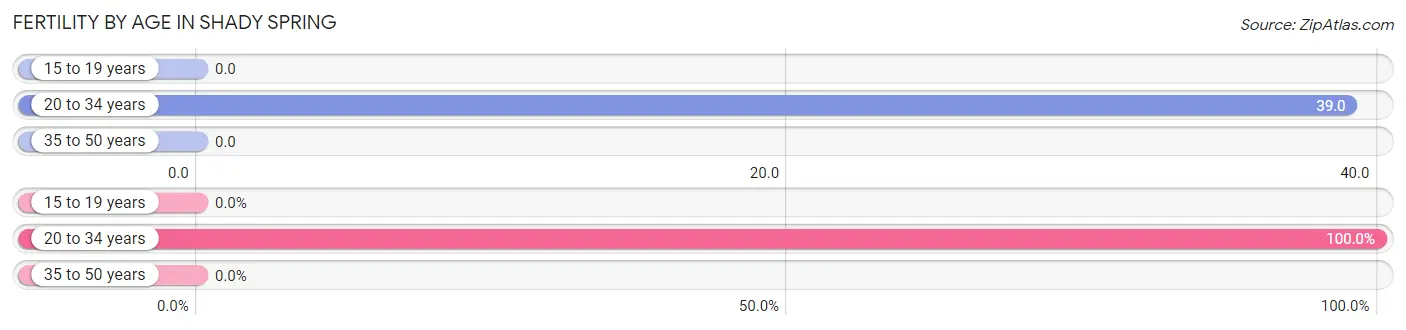
| Age Bracket | Women with Births | Births / 1,000 Women |
| 15 to 19 years | 0 (0.0%) | 0.0 |
| 20 to 34 years | 12 (100.0%) | 39.0 |
| 35 to 50 years | 0 (0.0%) | 0.0 |
| Total | 12 (100.0%) | 16.0 |
Fertility by Age by Marriage Status in Shady Spring
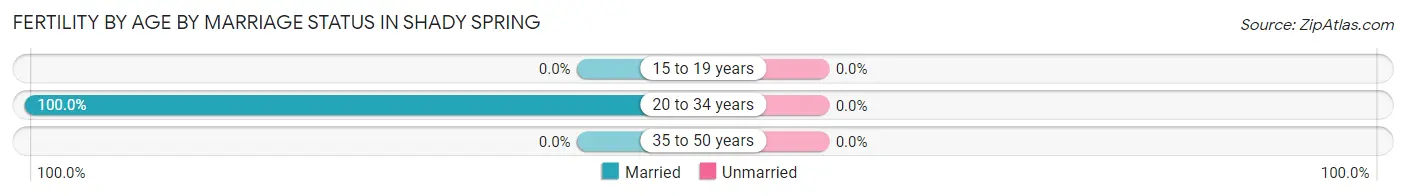
| Age Bracket | Married | Unmarried |
| 15 to 19 years | 0 (0.0%) | 0 (0.0%) |
| 20 to 34 years | 12 (100.0%) | 0 (0.0%) |
| 35 to 50 years | 0 (0.0%) | 0 (0.0%) |
| Total | 12 (100.0%) | 0 (0.0%) |
Fertility by Education in Shady Spring
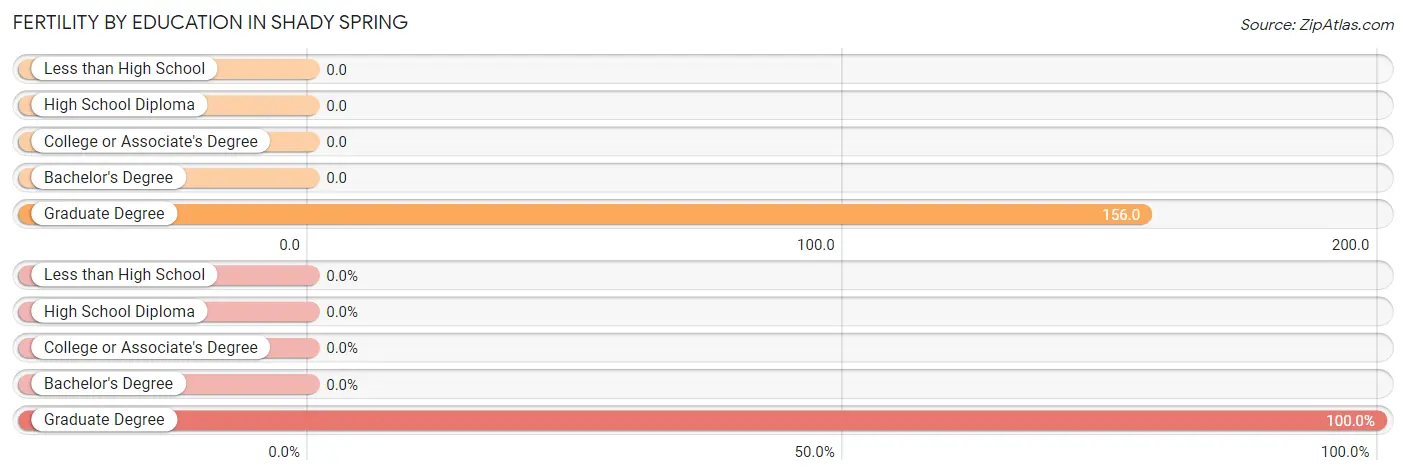
| Educational Attainment | Women with Births | Births / 1,000 Women |
| Less than High School | 0 (0.0%) | 0.0 |
| High School Diploma | 0 (0.0%) | 0.0 |
| College or Associate's Degree | 0 (0.0%) | 0.0 |
| Bachelor's Degree | 0 (0.0%) | 0.0 |
| Graduate Degree | 12 (100.0%) | 156.0 |
| Total | 12 (100.0%) | 16.0 |
Fertility by Education by Marriage Status in Shady Spring
| Educational Attainment | Married | Unmarried |
| Less than High School | 0 (0.0%) | 0 (0.0%) |
| High School Diploma | 0 (0.0%) | 0 (0.0%) |
| College or Associate's Degree | 0 (0.0%) | 0 (0.0%) |
| Bachelor's Degree | 0 (0.0%) | 0 (0.0%) |
| Graduate Degree | 12 (100.0%) | 0 (0.0%) |
| Total | 12 (100.0%) | 0 (0.0%) |
Employment Characteristics in Shady Spring
Employment by Class of Employer in Shady Spring
Among the 1,261 employed individuals in Shady Spring, private company employees (757 | 60.0%), federal government employees (254 | 20.1%), and state government employees (72 | 5.7%) make up the most common classes of employment.
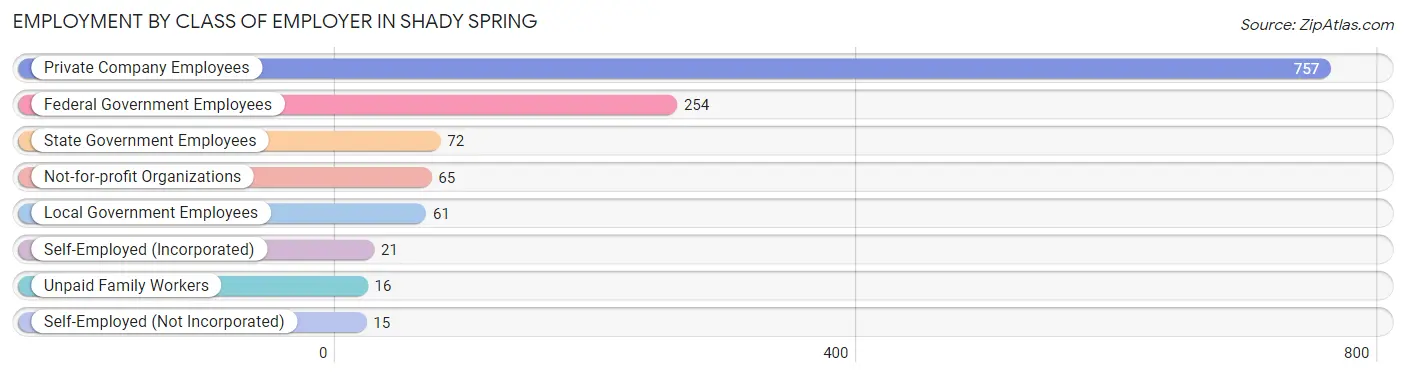
| Employer Class | # Employees | % Employees |
| Private Company Employees | 757 | 60.0% |
| Self-Employed (Incorporated) | 21 | 1.7% |
| Self-Employed (Not Incorporated) | 15 | 1.2% |
| Not-for-profit Organizations | 65 | 5.1% |
| Local Government Employees | 61 | 4.8% |
| State Government Employees | 72 | 5.7% |
| Federal Government Employees | 254 | 20.1% |
| Unpaid Family Workers | 16 | 1.3% |
| Total | 1,261 | 100.0% |
Employment Status by Age in Shady Spring
According to the labor force statistics for Shady Spring, out of the total population over 16 years of age (2,723), 53.8% or 1,465 individuals are in the labor force, with 10.4% or 152 of them unemployed. The age group with the highest labor force participation rate is 30 to 34 years, with 95.4% or 167 individuals in the labor force. Within the labor force, the 55 to 59 years age range has the highest percentage of unemployed individuals, with 49.3% or 36 of them being unemployed.
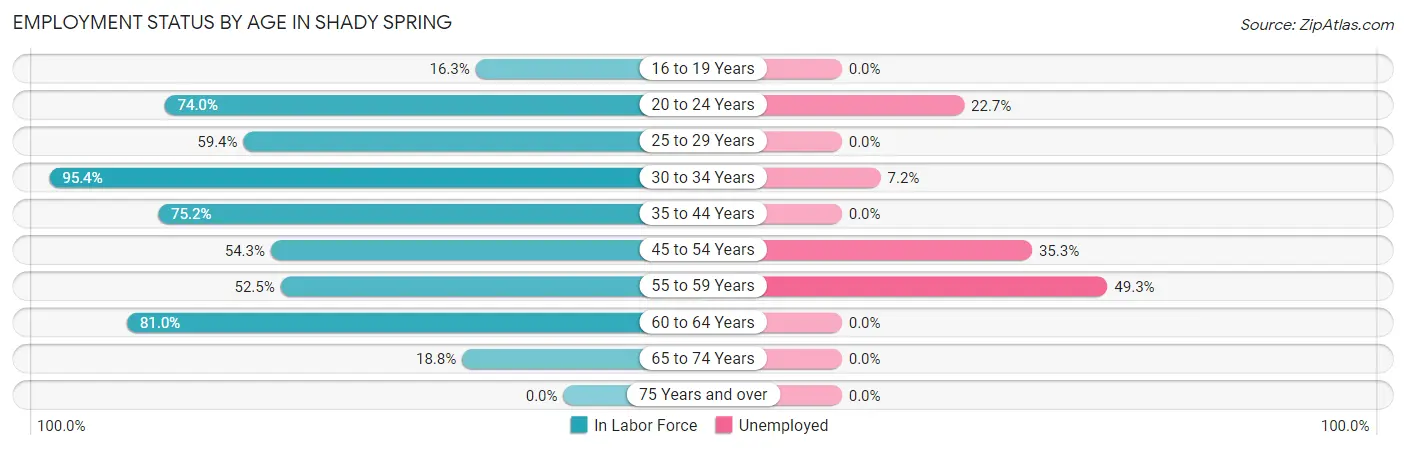
| Age Bracket | In Labor Force | Unemployed |
| 16 to 19 Years | 7 (16.3%) | 0 (0.0%) |
| 20 to 24 Years | 97 (74.0%) | 22 (22.7%) |
| 25 to 29 Years | 133 (59.4%) | 0 (0.0%) |
| 30 to 34 Years | 167 (95.4%) | 12 (7.2%) |
| 35 to 44 Years | 285 (75.2%) | 0 (0.0%) |
| 45 to 54 Years | 235 (54.3%) | 83 (35.3%) |
| 55 to 59 Years | 73 (52.5%) | 36 (49.3%) |
| 60 to 64 Years | 396 (81.0%) | 0 (0.0%) |
| 65 to 74 Years | 73 (18.8%) | 0 (0.0%) |
| 75 Years and over | 0 (0.0%) | 0 (0.0%) |
| Total | 1,465 (53.8%) | 152 (10.4%) |
Employment Status by Educational Attainment in Shady Spring
According to labor force statistics for Shady Spring, 70.1% of individuals (1,289) out of the total population between 25 and 64 years of age (1,839) are in the labor force, with 10.2% or 131 of them being unemployed. The group with the highest labor force participation rate are those with the educational attainment of bachelor's degree or higher, with 83.0% or 347 individuals in the labor force. Within the labor force, individuals with high school diploma education have the highest percentage of unemployment, with 23.4% or 119 of them being unemployed.
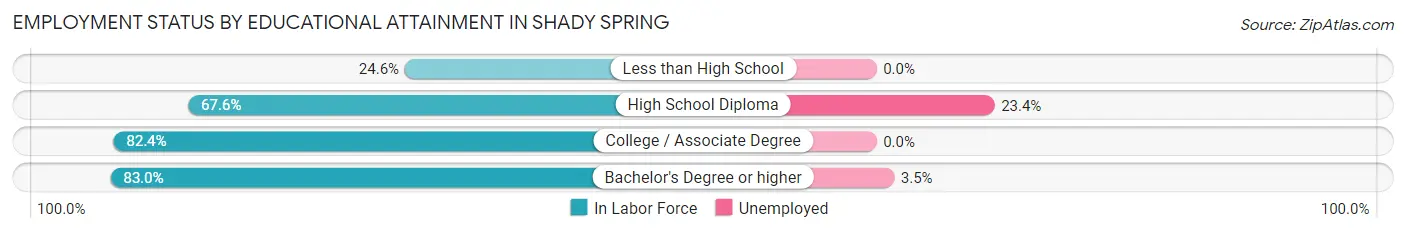
| Educational Attainment | In Labor Force | Unemployed |
| Less than High School | 50 (24.6%) | 0 (0.0%) |
| High School Diploma | 508 (67.6%) | 176 (23.4%) |
| College / Associate Degree | 384 (82.4%) | 0 (0.0%) |
| Bachelor's Degree or higher | 347 (83.0%) | 15 (3.5%) |
| Total | 1,289 (70.1%) | 188 (10.2%) |
Employment Occupations by Sex in Shady Spring
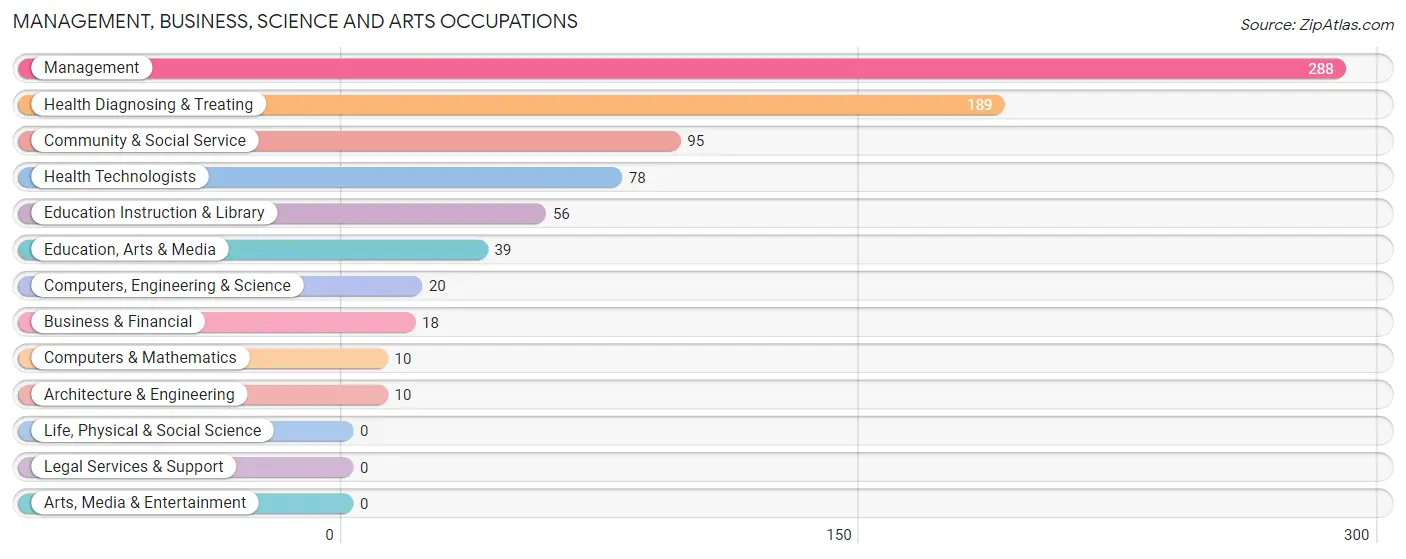
Management, Business, Science and Arts Occupations
The most common Management, Business, Science and Arts occupations in Shady Spring are Management (288 | 21.9%), Health Diagnosing & Treating (189 | 14.4%), Community & Social Service (95 | 7.2%), Health Technologists (78 | 5.9%), and Education Instruction & Library (56 | 4.3%).
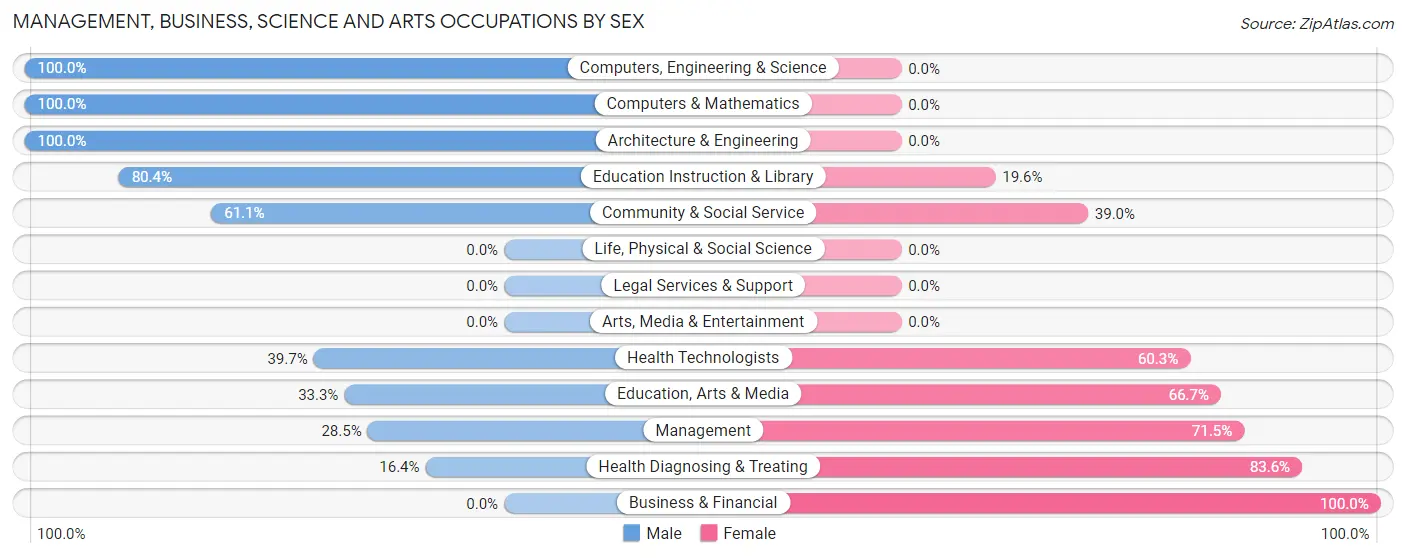
Management, Business, Science and Arts Occupations by Sex
Within the Management, Business, Science and Arts occupations in Shady Spring, the most male-oriented occupations are Computers, Engineering & Science (100.0%), Computers & Mathematics (100.0%), and Architecture & Engineering (100.0%), while the most female-oriented occupations are Business & Financial (100.0%), Health Diagnosing & Treating (83.6%), and Management (71.5%).
| Occupation | Male | Female |
| Management | 82 (28.5%) | 206 (71.5%) |
| Business & Financial | 0 (0.0%) | 18 (100.0%) |
| Computers, Engineering & Science | 20 (100.0%) | 0 (0.0%) |
| Computers & Mathematics | 10 (100.0%) | 0 (0.0%) |
| Architecture & Engineering | 10 (100.0%) | 0 (0.0%) |
| Life, Physical & Social Science | 0 (0.0%) | 0 (0.0%) |
| Community & Social Service | 58 (61.1%) | 37 (39.0%) |
| Education, Arts & Media | 13 (33.3%) | 26 (66.7%) |
| Legal Services & Support | 0 (0.0%) | 0 (0.0%) |
| Education Instruction & Library | 45 (80.4%) | 11 (19.6%) |
| Arts, Media & Entertainment | 0 (0.0%) | 0 (0.0%) |
| Health Diagnosing & Treating | 31 (16.4%) | 158 (83.6%) |
| Health Technologists | 31 (39.7%) | 47 (60.3%) |
| Total (Category) | 191 (31.3%) | 419 (68.7%) |
| Total (Overall) | 613 (46.7%) | 700 (53.3%) |
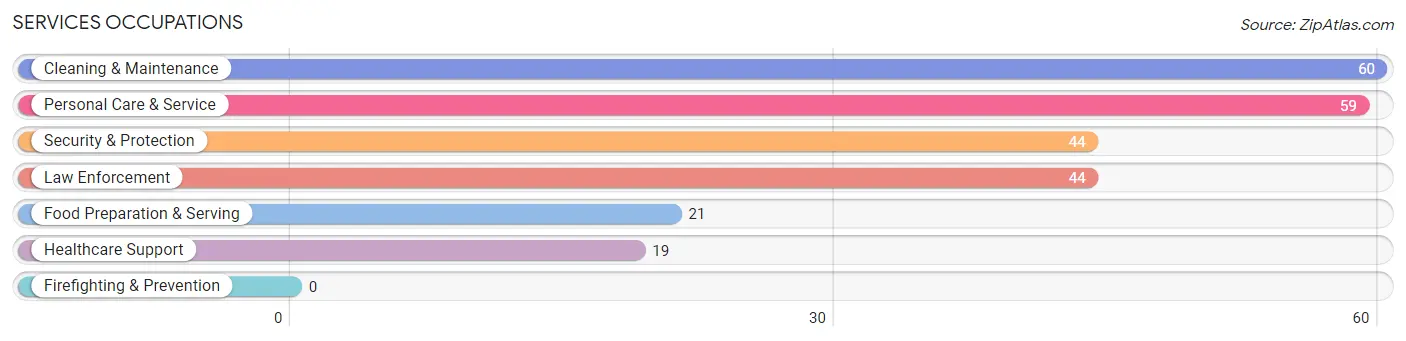
Services Occupations
The most common Services occupations in Shady Spring are Cleaning & Maintenance (60 | 4.6%), Personal Care & Service (59 | 4.5%), Security & Protection (44 | 3.4%), Law Enforcement (44 | 3.4%), and Food Preparation & Serving (21 | 1.6%).
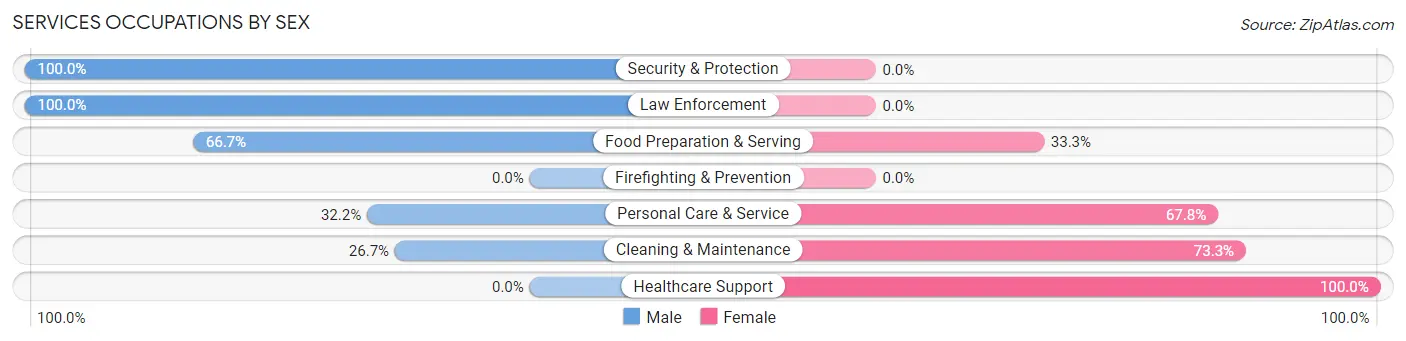
Services Occupations by Sex
Within the Services occupations in Shady Spring, the most male-oriented occupations are Security & Protection (100.0%), Law Enforcement (100.0%), and Food Preparation & Serving (66.7%), while the most female-oriented occupations are Healthcare Support (100.0%), Cleaning & Maintenance (73.3%), and Personal Care & Service (67.8%).
| Occupation | Male | Female |
| Healthcare Support | 0 (0.0%) | 19 (100.0%) |
| Security & Protection | 44 (100.0%) | 0 (0.0%) |
| Firefighting & Prevention | 0 (0.0%) | 0 (0.0%) |
| Law Enforcement | 44 (100.0%) | 0 (0.0%) |
| Food Preparation & Serving | 14 (66.7%) | 7 (33.3%) |
| Cleaning & Maintenance | 16 (26.7%) | 44 (73.3%) |
| Personal Care & Service | 19 (32.2%) | 40 (67.8%) |
| Total (Category) | 93 (45.8%) | 110 (54.2%) |
| Total (Overall) | 613 (46.7%) | 700 (53.3%) |
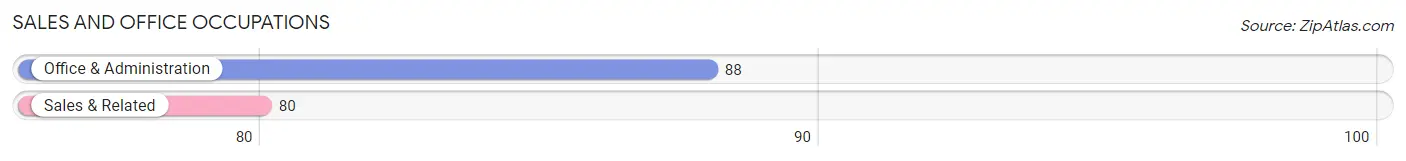
Sales and Office Occupations
The most common Sales and Office occupations in Shady Spring are Office & Administration (88 | 6.7%), and Sales & Related (80 | 6.1%).
Sales and Office Occupations by Sex
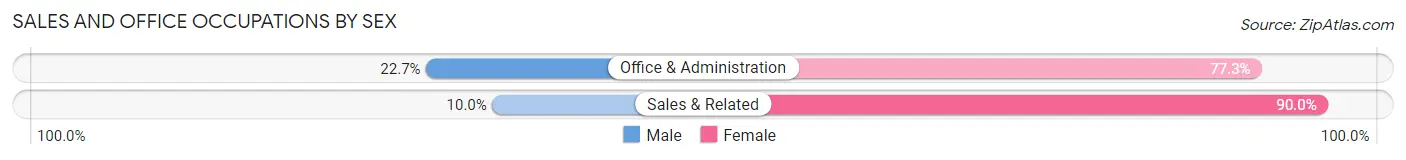
| Occupation | Male | Female |
| Sales & Related | 8 (10.0%) | 72 (90.0%) |
| Office & Administration | 20 (22.7%) | 68 (77.3%) |
| Total (Category) | 28 (16.7%) | 140 (83.3%) |
| Total (Overall) | 613 (46.7%) | 700 (53.3%) |
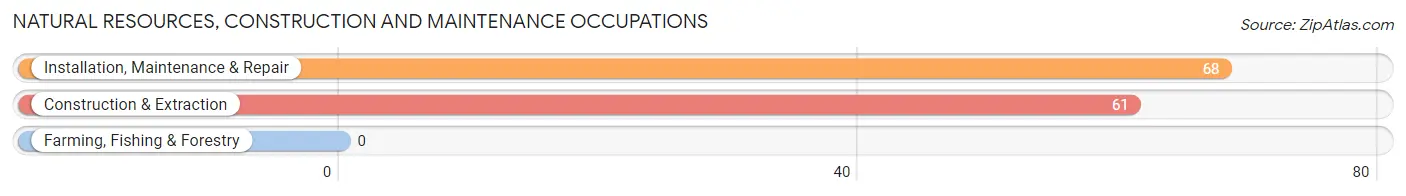
Natural Resources, Construction and Maintenance Occupations
The most common Natural Resources, Construction and Maintenance occupations in Shady Spring are Installation, Maintenance & Repair (68 | 5.2%), and Construction & Extraction (61 | 4.6%).
Natural Resources, Construction and Maintenance Occupations by Sex
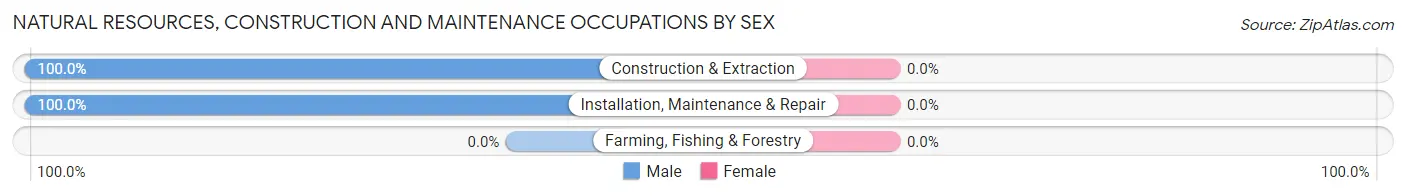
| Occupation | Male | Female |
| Farming, Fishing & Forestry | 0 (0.0%) | 0 (0.0%) |
| Construction & Extraction | 61 (100.0%) | 0 (0.0%) |
| Installation, Maintenance & Repair | 68 (100.0%) | 0 (0.0%) |
| Total (Category) | 129 (100.0%) | 0 (0.0%) |
| Total (Overall) | 613 (46.7%) | 700 (53.3%) |
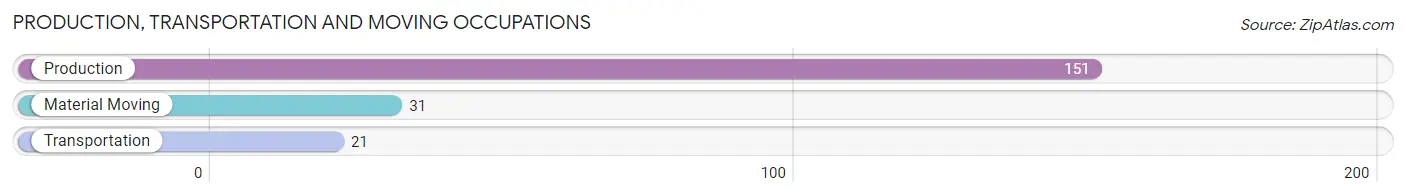
Production, Transportation and Moving Occupations
The most common Production, Transportation and Moving occupations in Shady Spring are Production (151 | 11.5%), Material Moving (31 | 2.4%), and Transportation (21 | 1.6%).
Production, Transportation and Moving Occupations by Sex
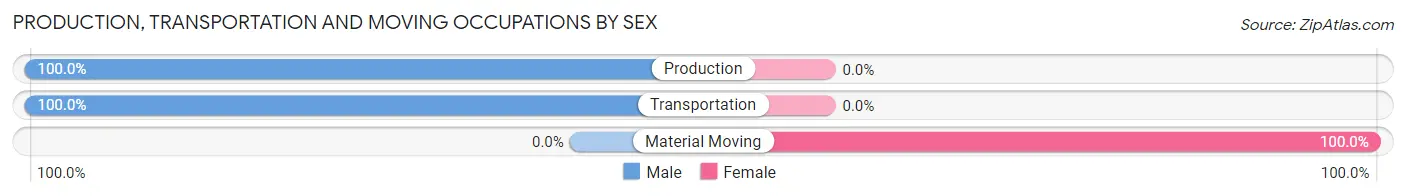
| Occupation | Male | Female |
| Production | 151 (100.0%) | 0 (0.0%) |
| Transportation | 21 (100.0%) | 0 (0.0%) |
| Material Moving | 0 (0.0%) | 31 (100.0%) |
| Total (Category) | 172 (84.7%) | 31 (15.3%) |
| Total (Overall) | 613 (46.7%) | 700 (53.3%) |
Employment Industries by Sex in Shady Spring
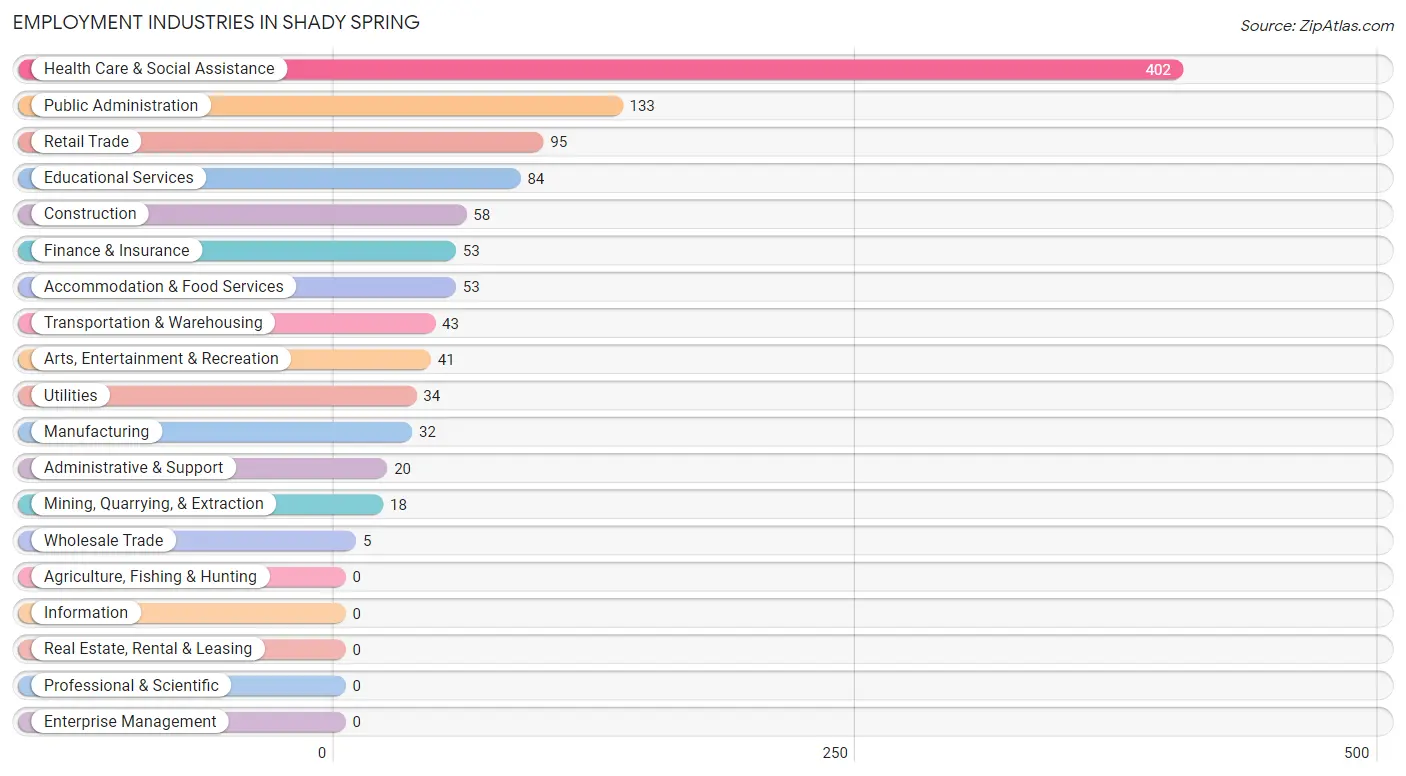
Employment Industries in Shady Spring
The major employment industries in Shady Spring include Health Care & Social Assistance (402 | 30.6%), Public Administration (133 | 10.1%), Retail Trade (95 | 7.2%), Educational Services (84 | 6.4%), and Construction (58 | 4.4%).
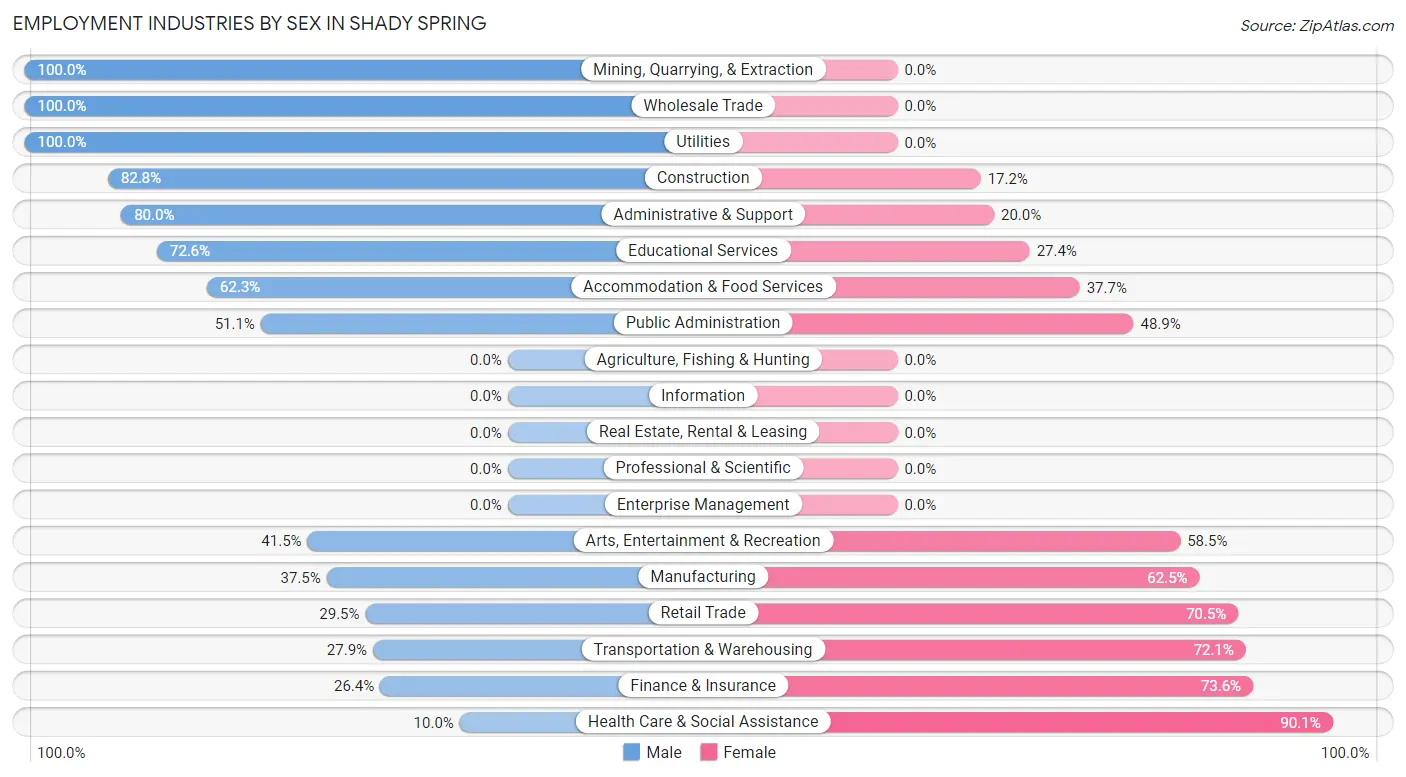
Employment Industries by Sex in Shady Spring
The Shady Spring industries that see more men than women are Mining, Quarrying, & Extraction (100.0%), Wholesale Trade (100.0%), and Utilities (100.0%), whereas the industries that tend to have a higher number of women are Health Care & Social Assistance (90.0%), Finance & Insurance (73.6%), and Transportation & Warehousing (72.1%).
| Industry | Male | Female |
| Agriculture, Fishing & Hunting | 0 (0.0%) | 0 (0.0%) |
| Mining, Quarrying, & Extraction | 18 (100.0%) | 0 (0.0%) |
| Construction | 48 (82.8%) | 10 (17.2%) |
| Manufacturing | 12 (37.5%) | 20 (62.5%) |
| Wholesale Trade | 5 (100.0%) | 0 (0.0%) |
| Retail Trade | 28 (29.5%) | 67 (70.5%) |
| Transportation & Warehousing | 12 (27.9%) | 31 (72.1%) |
| Utilities | 34 (100.0%) | 0 (0.0%) |
| Information | 0 (0.0%) | 0 (0.0%) |
| Finance & Insurance | 14 (26.4%) | 39 (73.6%) |
| Real Estate, Rental & Leasing | 0 (0.0%) | 0 (0.0%) |
| Professional & Scientific | 0 (0.0%) | 0 (0.0%) |
| Enterprise Management | 0 (0.0%) | 0 (0.0%) |
| Administrative & Support | 16 (80.0%) | 4 (20.0%) |
| Educational Services | 61 (72.6%) | 23 (27.4%) |
| Health Care & Social Assistance | 40 (10.0%) | 362 (90.0%) |
| Arts, Entertainment & Recreation | 17 (41.5%) | 24 (58.5%) |
| Accommodation & Food Services | 33 (62.3%) | 20 (37.7%) |
| Public Administration | 68 (51.1%) | 65 (48.9%) |
| Total | 613 (46.7%) | 700 (53.3%) |
Education in Shady Spring
School Enrollment in Shady Spring
The most common levels of schooling among the 866 students in Shady Spring are elementary school (280 | 32.3%), middle school (208 | 24.0%), and high school (101 | 11.7%).
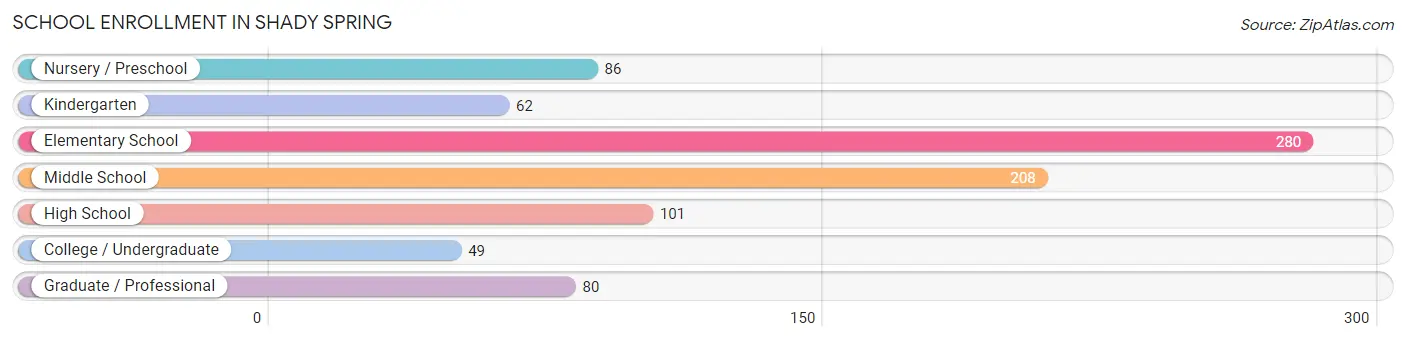
| School Level | # Students | % Students |
| Nursery / Preschool | 86 | 9.9% |
| Kindergarten | 62 | 7.2% |
| Elementary School | 280 | 32.3% |
| Middle School | 208 | 24.0% |
| High School | 101 | 11.7% |
| College / Undergraduate | 49 | 5.7% |
| Graduate / Professional | 80 | 9.2% |
| Total | 866 | 100.0% |
School Enrollment by Age by Funding Source in Shady Spring
Out of a total of 866 students who are enrolled in schools in Shady Spring, 61 (7.0%) attend a private institution, while the remaining 805 (93.0%) are enrolled in public schools. The age group of 35 years and over has the highest likelihood of being enrolled in private schools, with 13 (39.4% in the age bracket) enrolled. Conversely, the age group of 5 to 9 year old has the lowest likelihood of being enrolled in a private school, with 303 (100.0% in the age bracket) attending a public institution.
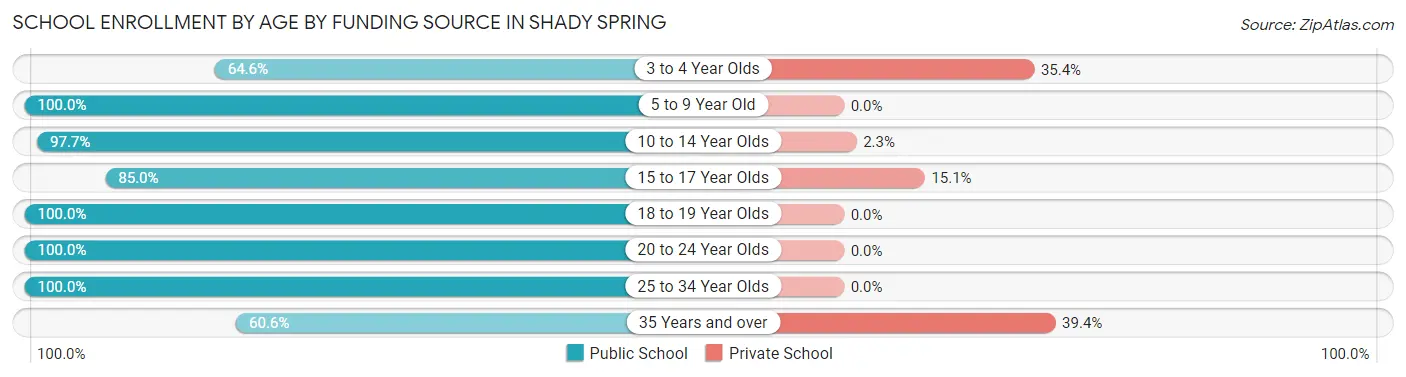
| Age Bracket | Public School | Private School |
| 3 to 4 Year Olds | 51 (64.6%) | 28 (35.4%) |
| 5 to 9 Year Old | 303 (100.0%) | 0 (0.0%) |
| 10 to 14 Year Olds | 251 (97.7%) | 6 (2.3%) |
| 15 to 17 Year Olds | 79 (85.0%) | 14 (15.0%) |
| 18 to 19 Year Olds | 23 (100.0%) | 0 (0.0%) |
| 20 to 24 Year Olds | 64 (100.0%) | 0 (0.0%) |
| 25 to 34 Year Olds | 14 (100.0%) | 0 (0.0%) |
| 35 Years and over | 20 (60.6%) | 13 (39.4%) |
| Total | 805 (93.0%) | 61 (7.0%) |
Educational Attainment by Field of Study in Shady Spring
Business (145 | 27.2%), science & technology (113 | 21.2%), bio, nature & agricultural (60 | 11.2%), education (48 | 9.0%), and computers & mathematics (31 | 5.8%) are the most common fields of study among 534 individuals in Shady Spring who have obtained a bachelor's degree or higher.
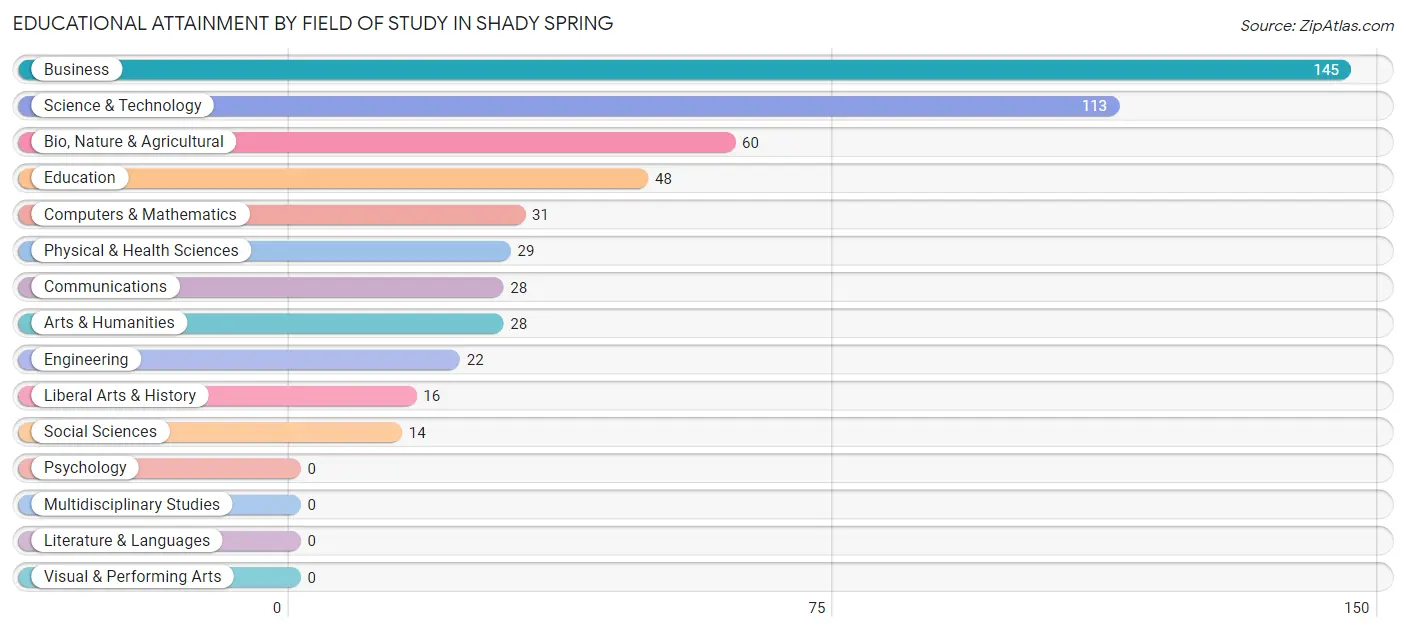
| Field of Study | # Graduates | % Graduates |
| Computers & Mathematics | 31 | 5.8% |
| Bio, Nature & Agricultural | 60 | 11.2% |
| Physical & Health Sciences | 29 | 5.4% |
| Psychology | 0 | 0.0% |
| Social Sciences | 14 | 2.6% |
| Engineering | 22 | 4.1% |
| Multidisciplinary Studies | 0 | 0.0% |
| Science & Technology | 113 | 21.2% |
| Business | 145 | 27.2% |
| Education | 48 | 9.0% |
| Literature & Languages | 0 | 0.0% |
| Liberal Arts & History | 16 | 3.0% |
| Visual & Performing Arts | 0 | 0.0% |
| Communications | 28 | 5.2% |
| Arts & Humanities | 28 | 5.2% |
| Total | 534 | 100.0% |
Transportation & Commute in Shady Spring
Vehicle Availability by Sex in Shady Spring
The most prevalent vehicle ownership categories in Shady Spring are males with 2 vehicles (298, accounting for 52.0%) and females with 2 vehicles (338, making up 43.3%).
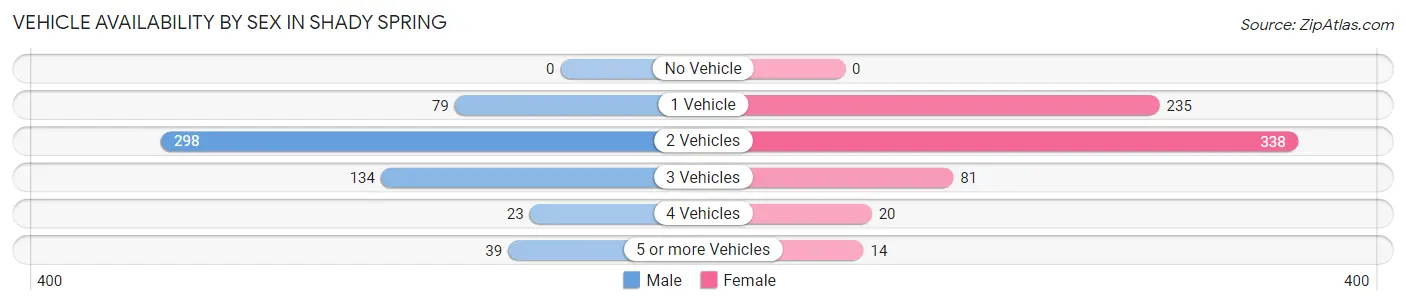
| Vehicles Available | Male | Female |
| No Vehicle | 0 (0.0%) | 0 (0.0%) |
| 1 Vehicle | 79 (13.8%) | 235 (34.2%) |
| 2 Vehicles | 298 (52.0%) | 338 (49.1%) |
| 3 Vehicles | 134 (23.4%) | 81 (11.8%) |
| 4 Vehicles | 23 (4.0%) | 20 (2.9%) |
| 5 or more Vehicles | 39 (6.8%) | 14 (2.0%) |
| Total | 573 (100.0%) | 688 (100.0%) |
Commute Time in Shady Spring
The most frequently occuring commute durations in Shady Spring are 20 to 24 minutes (489 commuters, 41.3%), 25 to 29 minutes (153 commuters, 12.9%), and 60 to 89 minutes (138 commuters, 11.7%).
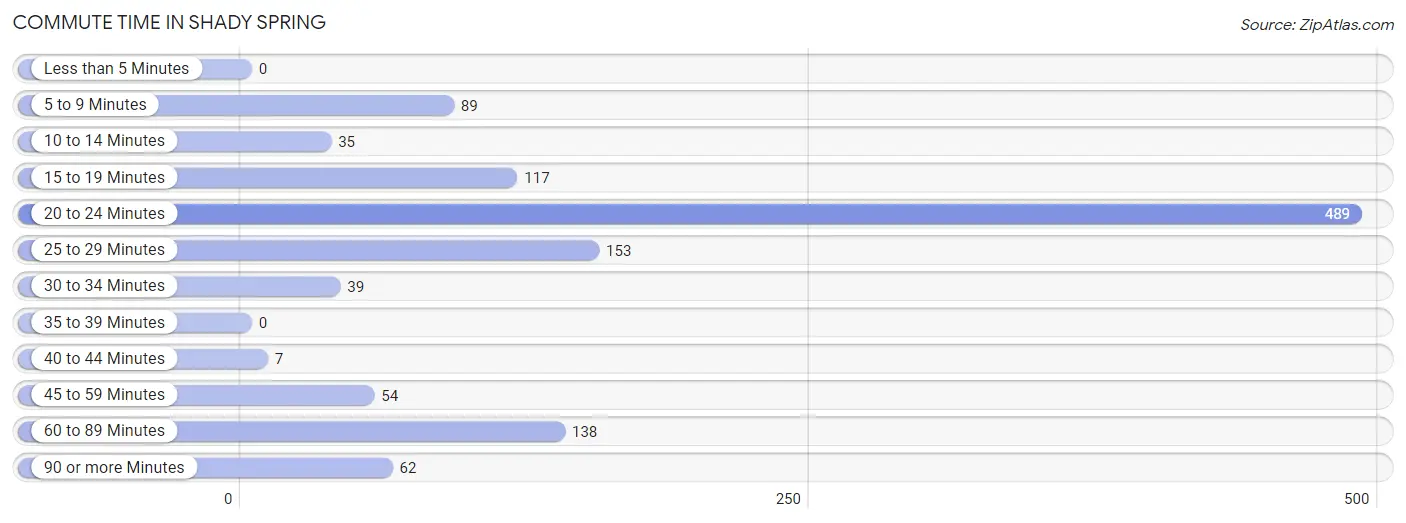
| Commute Time | # Commuters | % Commuters |
| Less than 5 Minutes | 0 | 0.0% |
| 5 to 9 Minutes | 89 | 7.5% |
| 10 to 14 Minutes | 35 | 3.0% |
| 15 to 19 Minutes | 117 | 9.9% |
| 20 to 24 Minutes | 489 | 41.3% |
| 25 to 29 Minutes | 153 | 12.9% |
| 30 to 34 Minutes | 39 | 3.3% |
| 35 to 39 Minutes | 0 | 0.0% |
| 40 to 44 Minutes | 7 | 0.6% |
| 45 to 59 Minutes | 54 | 4.6% |
| 60 to 89 Minutes | 138 | 11.7% |
| 90 or more Minutes | 62 | 5.2% |
Commute Time by Sex in Shady Spring
The most common commute times in Shady Spring are 20 to 24 minutes (209 commuters, 37.2%) for males and 20 to 24 minutes (280 commuters, 45.0%) for females.
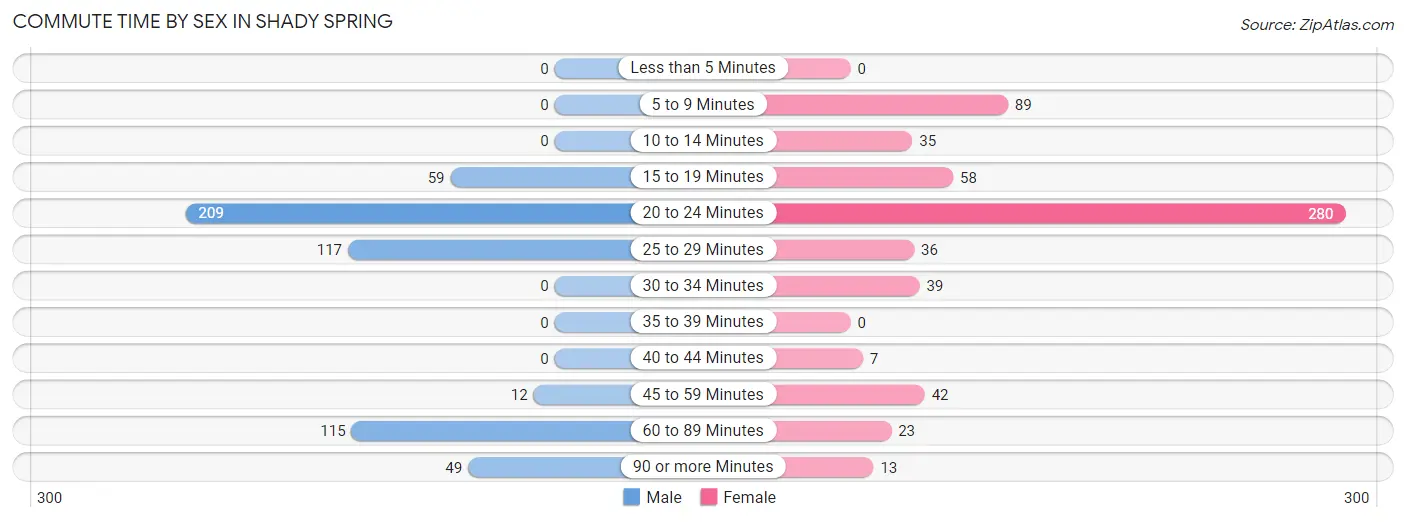
| Commute Time | Male | Female |
| Less than 5 Minutes | 0 (0.0%) | 0 (0.0%) |
| 5 to 9 Minutes | 0 (0.0%) | 89 (14.3%) |
| 10 to 14 Minutes | 0 (0.0%) | 35 (5.6%) |
| 15 to 19 Minutes | 59 (10.5%) | 58 (9.3%) |
| 20 to 24 Minutes | 209 (37.2%) | 280 (45.0%) |
| 25 to 29 Minutes | 117 (20.9%) | 36 (5.8%) |
| 30 to 34 Minutes | 0 (0.0%) | 39 (6.3%) |
| 35 to 39 Minutes | 0 (0.0%) | 0 (0.0%) |
| 40 to 44 Minutes | 0 (0.0%) | 7 (1.1%) |
| 45 to 59 Minutes | 12 (2.1%) | 42 (6.8%) |
| 60 to 89 Minutes | 115 (20.5%) | 23 (3.7%) |
| 90 or more Minutes | 49 (8.7%) | 13 (2.1%) |
Time of Departure to Work by Sex in Shady Spring
The most frequent times of departure to work in Shady Spring are 6:00 AM to 6:29 AM (225, 40.1%) for males and 6:00 AM to 6:29 AM (219, 35.2%) for females.
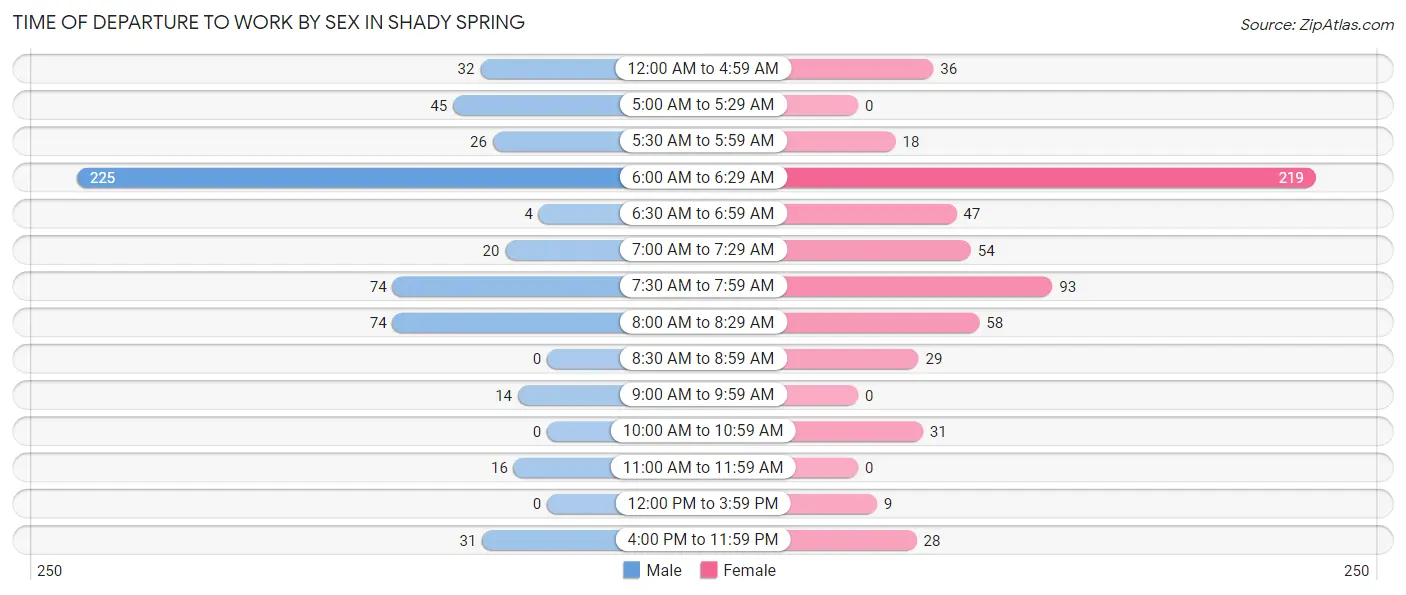
| Time of Departure | Male | Female |
| 12:00 AM to 4:59 AM | 32 (5.7%) | 36 (5.8%) |
| 5:00 AM to 5:29 AM | 45 (8.0%) | 0 (0.0%) |
| 5:30 AM to 5:59 AM | 26 (4.6%) | 18 (2.9%) |
| 6:00 AM to 6:29 AM | 225 (40.1%) | 219 (35.2%) |
| 6:30 AM to 6:59 AM | 4 (0.7%) | 47 (7.6%) |
| 7:00 AM to 7:29 AM | 20 (3.6%) | 54 (8.7%) |
| 7:30 AM to 7:59 AM | 74 (13.2%) | 93 (14.9%) |
| 8:00 AM to 8:29 AM | 74 (13.2%) | 58 (9.3%) |
| 8:30 AM to 8:59 AM | 0 (0.0%) | 29 (4.7%) |
| 9:00 AM to 9:59 AM | 14 (2.5%) | 0 (0.0%) |
| 10:00 AM to 10:59 AM | 0 (0.0%) | 31 (5.0%) |
| 11:00 AM to 11:59 AM | 16 (2.9%) | 0 (0.0%) |
| 12:00 PM to 3:59 PM | 0 (0.0%) | 9 (1.5%) |
| 4:00 PM to 11:59 PM | 31 (5.5%) | 28 (4.5%) |
| Total | 561 (100.0%) | 622 (100.0%) |
Housing Occupancy in Shady Spring
Occupancy by Ownership in Shady Spring
Of the total 1,293 dwellings in Shady Spring, owner-occupied units account for 1,164 (90.0%), while renter-occupied units make up 129 (10.0%).
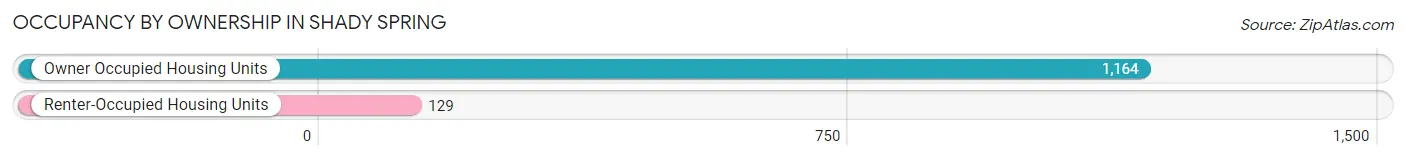
| Occupancy | # Housing Units | % Housing Units |
| Owner Occupied Housing Units | 1,164 | 90.0% |
| Renter-Occupied Housing Units | 129 | 10.0% |
| Total Occupied Housing Units | 1,293 | 100.0% |
Occupancy by Household Size in Shady Spring
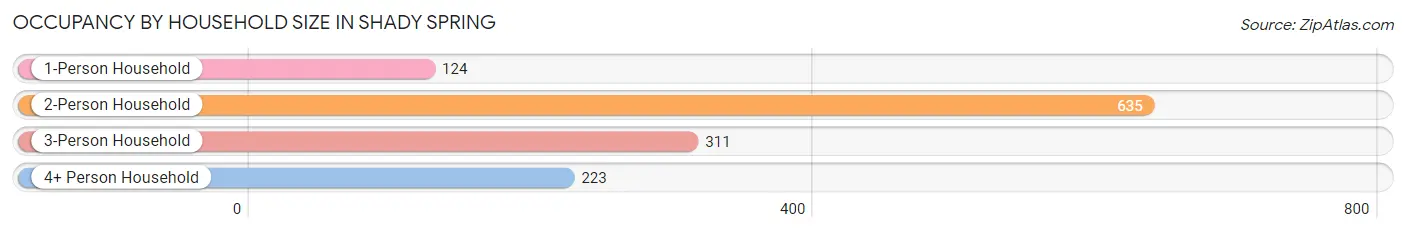
| Household Size | # Housing Units | % Housing Units |
| 1-Person Household | 124 | 9.6% |
| 2-Person Household | 635 | 49.1% |
| 3-Person Household | 311 | 24.0% |
| 4+ Person Household | 223 | 17.2% |
| Total Housing Units | 1,293 | 100.0% |
Occupancy by Ownership by Household Size in Shady Spring
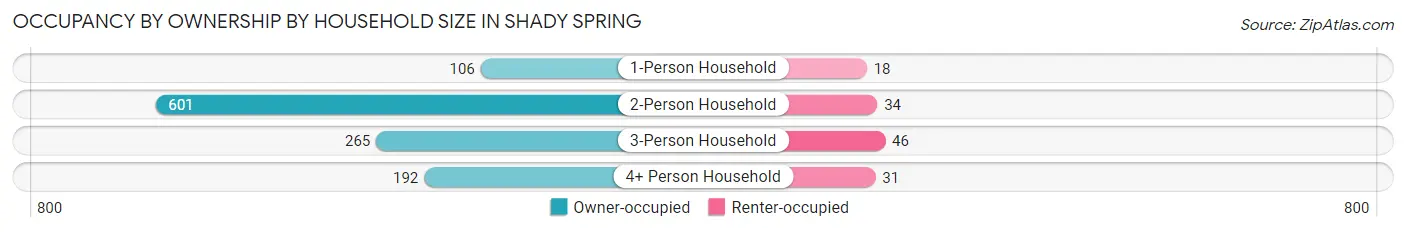
| Household Size | Owner-occupied | Renter-occupied |
| 1-Person Household | 106 (85.5%) | 18 (14.5%) |
| 2-Person Household | 601 (94.7%) | 34 (5.3%) |
| 3-Person Household | 265 (85.2%) | 46 (14.8%) |
| 4+ Person Household | 192 (86.1%) | 31 (13.9%) |
| Total Housing Units | 1,164 (90.0%) | 129 (10.0%) |
Occupancy by Educational Attainment in Shady Spring
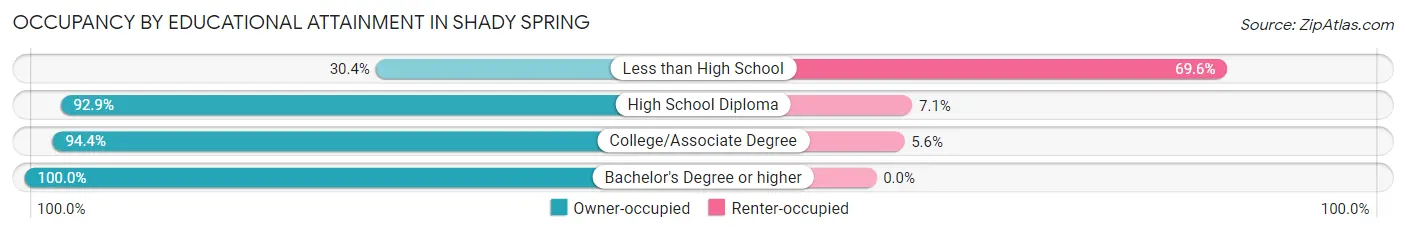
| Household Size | Owner-occupied | Renter-occupied |
| Less than High School | 31 (30.4%) | 71 (69.6%) |
| High School Diploma | 509 (92.9%) | 39 (7.1%) |
| College/Associate Degree | 323 (94.4%) | 19 (5.6%) |
| Bachelor's Degree or higher | 301 (100.0%) | 0 (0.0%) |
Occupancy by Age of Householder in Shady Spring
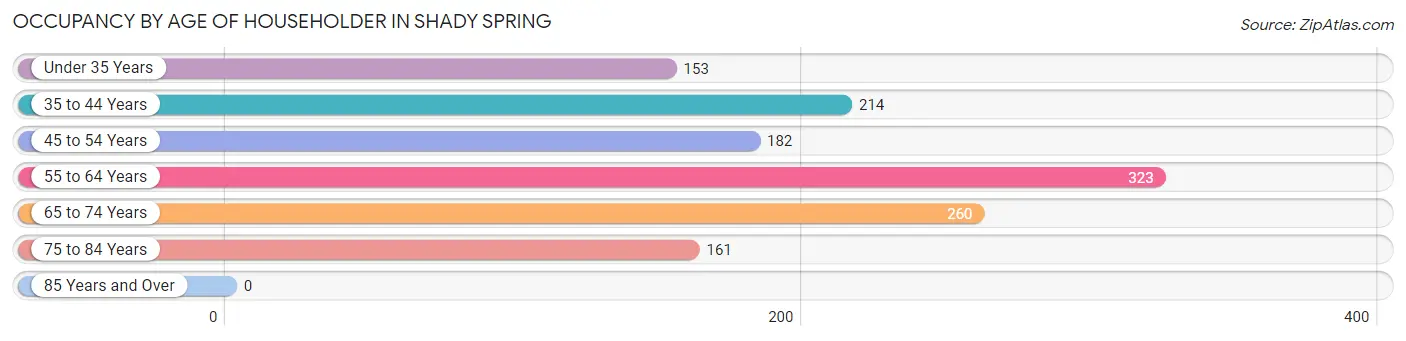
| Age Bracket | # Households | % Households |
| Under 35 Years | 153 | 11.8% |
| 35 to 44 Years | 214 | 16.6% |
| 45 to 54 Years | 182 | 14.1% |
| 55 to 64 Years | 323 | 25.0% |
| 65 to 74 Years | 260 | 20.1% |
| 75 to 84 Years | 161 | 12.4% |
| 85 Years and Over | 0 | 0.0% |
| Total | 1,293 | 100.0% |
Housing Finances in Shady Spring
Median Income by Occupancy in Shady Spring
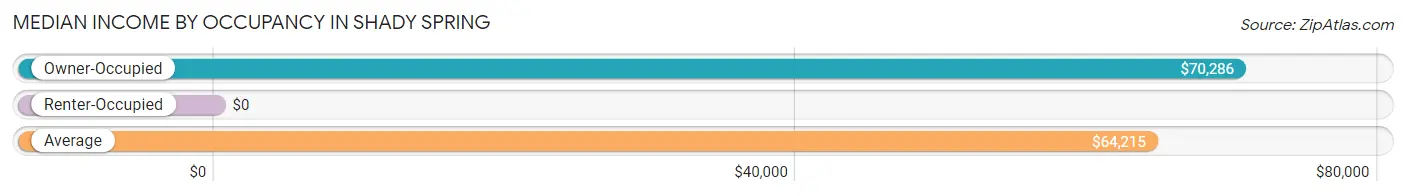
| Occupancy Type | # Households | Median Income |
| Owner-Occupied | 1,164 (90.0%) | $70,286 |
| Renter-Occupied | 129 (10.0%) | $0 |
| Average | 1,293 (100.0%) | $64,215 |
Occupancy by Householder Income Bracket in Shady Spring
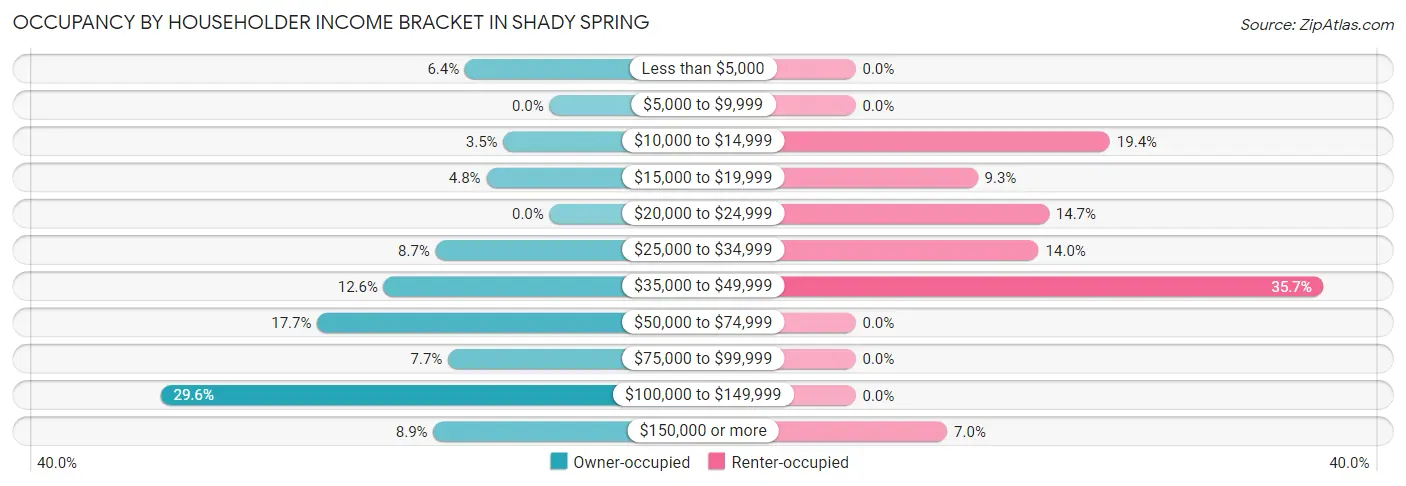
| Income Bracket | Owner-occupied | Renter-occupied |
| Less than $5,000 | 75 (6.4%) | 0 (0.0%) |
| $5,000 to $9,999 | 0 (0.0%) | 0 (0.0%) |
| $10,000 to $14,999 | 41 (3.5%) | 25 (19.4%) |
| $15,000 to $19,999 | 56 (4.8%) | 12 (9.3%) |
| $20,000 to $24,999 | 0 (0.0%) | 19 (14.7%) |
| $25,000 to $34,999 | 101 (8.7%) | 18 (14.0%) |
| $35,000 to $49,999 | 147 (12.6%) | 46 (35.7%) |
| $50,000 to $74,999 | 206 (17.7%) | 0 (0.0%) |
| $75,000 to $99,999 | 90 (7.7%) | 0 (0.0%) |
| $100,000 to $149,999 | 345 (29.6%) | 0 (0.0%) |
| $150,000 or more | 103 (8.8%) | 9 (7.0%) |
| Total | 1,164 (100.0%) | 129 (100.0%) |
Monthly Housing Cost Tiers in Shady Spring
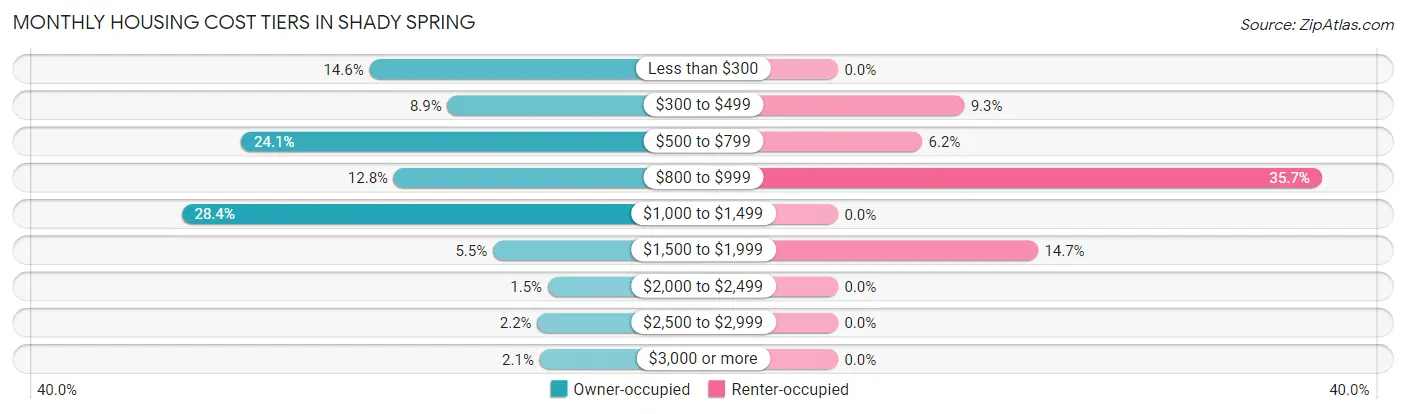
| Monthly Cost | Owner-occupied | Renter-occupied |
| Less than $300 | 170 (14.6%) | 0 (0.0%) |
| $300 to $499 | 103 (8.8%) | 12 (9.3%) |
| $500 to $799 | 280 (24.0%) | 8 (6.2%) |
| $800 to $999 | 149 (12.8%) | 46 (35.7%) |
| $1,000 to $1,499 | 331 (28.4%) | 0 (0.0%) |
| $1,500 to $1,999 | 64 (5.5%) | 19 (14.7%) |
| $2,000 to $2,499 | 17 (1.5%) | 0 (0.0%) |
| $2,500 to $2,999 | 26 (2.2%) | 0 (0.0%) |
| $3,000 or more | 24 (2.1%) | 0 (0.0%) |
| Total | 1,164 (100.0%) | 129 (100.0%) |
Physical Housing Characteristics in Shady Spring
Housing Structures in Shady Spring
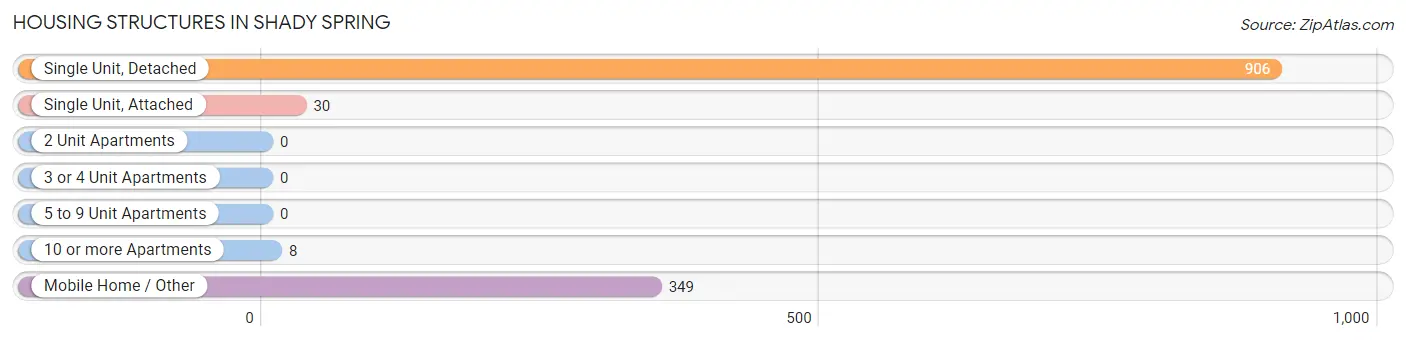
| Structure Type | # Housing Units | % Housing Units |
| Single Unit, Detached | 906 | 70.1% |
| Single Unit, Attached | 30 | 2.3% |
| 2 Unit Apartments | 0 | 0.0% |
| 3 or 4 Unit Apartments | 0 | 0.0% |
| 5 to 9 Unit Apartments | 0 | 0.0% |
| 10 or more Apartments | 8 | 0.6% |
| Mobile Home / Other | 349 | 27.0% |
| Total | 1,293 | 100.0% |
Housing Structures by Occupancy in Shady Spring
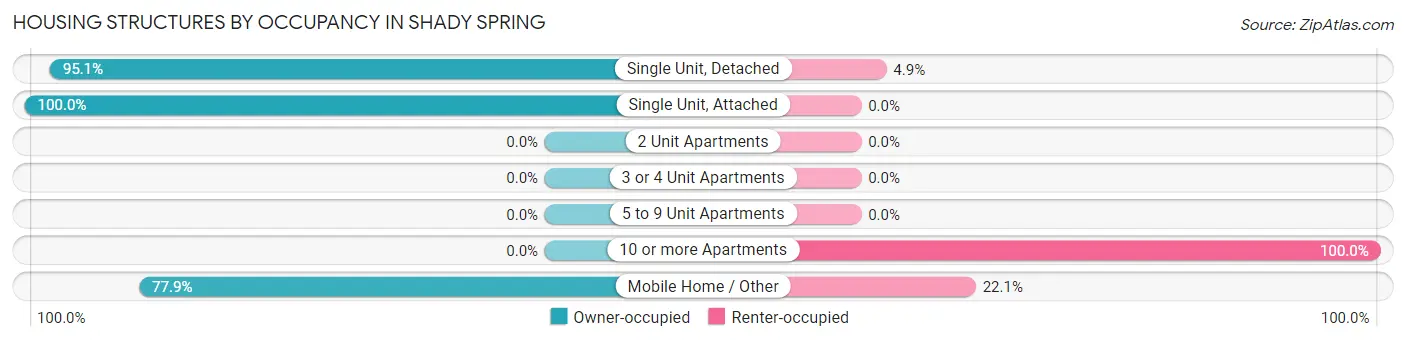
| Structure Type | Owner-occupied | Renter-occupied |
| Single Unit, Detached | 862 (95.1%) | 44 (4.9%) |
| Single Unit, Attached | 30 (100.0%) | 0 (0.0%) |
| 2 Unit Apartments | 0 (0.0%) | 0 (0.0%) |
| 3 or 4 Unit Apartments | 0 (0.0%) | 0 (0.0%) |
| 5 to 9 Unit Apartments | 0 (0.0%) | 0 (0.0%) |
| 10 or more Apartments | 0 (0.0%) | 8 (100.0%) |
| Mobile Home / Other | 272 (77.9%) | 77 (22.1%) |
| Total | 1,164 (90.0%) | 129 (10.0%) |
Housing Structures by Number of Rooms in Shady Spring
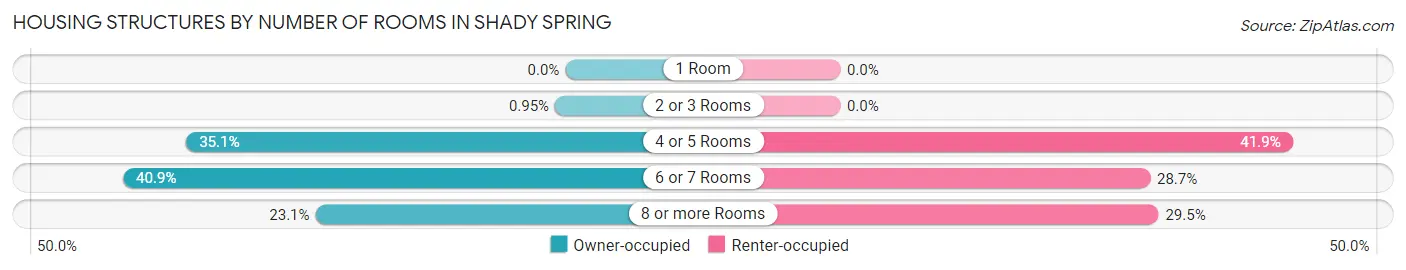
| Number of Rooms | Owner-occupied | Renter-occupied |
| 1 Room | 0 (0.0%) | 0 (0.0%) |
| 2 or 3 Rooms | 11 (0.9%) | 0 (0.0%) |
| 4 or 5 Rooms | 408 (35.0%) | 54 (41.9%) |
| 6 or 7 Rooms | 476 (40.9%) | 37 (28.7%) |
| 8 or more Rooms | 269 (23.1%) | 38 (29.5%) |
| Total | 1,164 (100.0%) | 129 (100.0%) |
Housing Structure by Heating Type in Shady Spring
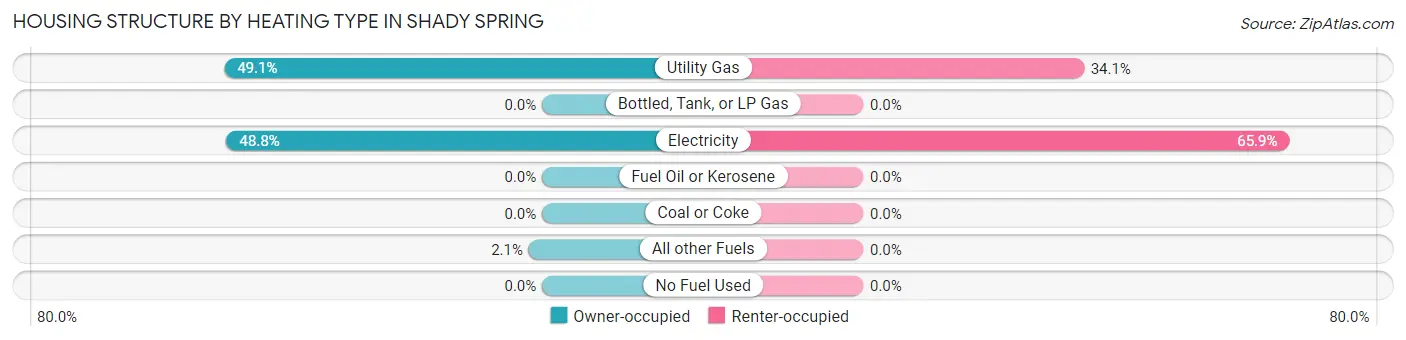
| Heating Type | Owner-occupied | Renter-occupied |
| Utility Gas | 572 (49.1%) | 44 (34.1%) |
| Bottled, Tank, or LP Gas | 0 (0.0%) | 0 (0.0%) |
| Electricity | 568 (48.8%) | 85 (65.9%) |
| Fuel Oil or Kerosene | 0 (0.0%) | 0 (0.0%) |
| Coal or Coke | 0 (0.0%) | 0 (0.0%) |
| All other Fuels | 24 (2.1%) | 0 (0.0%) |
| No Fuel Used | 0 (0.0%) | 0 (0.0%) |
| Total | 1,164 (100.0%) | 129 (100.0%) |
Household Vehicle Usage in Shady Spring
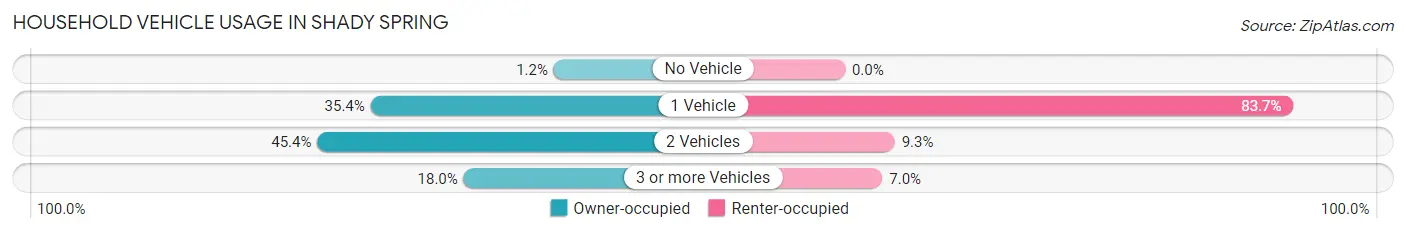
| Vehicles per Household | Owner-occupied | Renter-occupied |
| No Vehicle | 14 (1.2%) | 0 (0.0%) |
| 1 Vehicle | 412 (35.4%) | 108 (83.7%) |
| 2 Vehicles | 528 (45.4%) | 12 (9.3%) |
| 3 or more Vehicles | 210 (18.0%) | 9 (7.0%) |
| Total | 1,164 (100.0%) | 129 (100.0%) |
Real Estate & Mortgages in Shady Spring
Real Estate and Mortgage Overview in Shady Spring
| Characteristic | Without Mortgage | With Mortgage |
| Housing Units | 483 | 681 |
| Median Property Value | $111,200 | $171,500 |
| Median Household Income | $51,771 | $72 |
| Monthly Housing Costs | $439 | $24 |
| Real Estate Taxes | $496 | $9 |
Property Value by Mortgage Status in Shady Spring
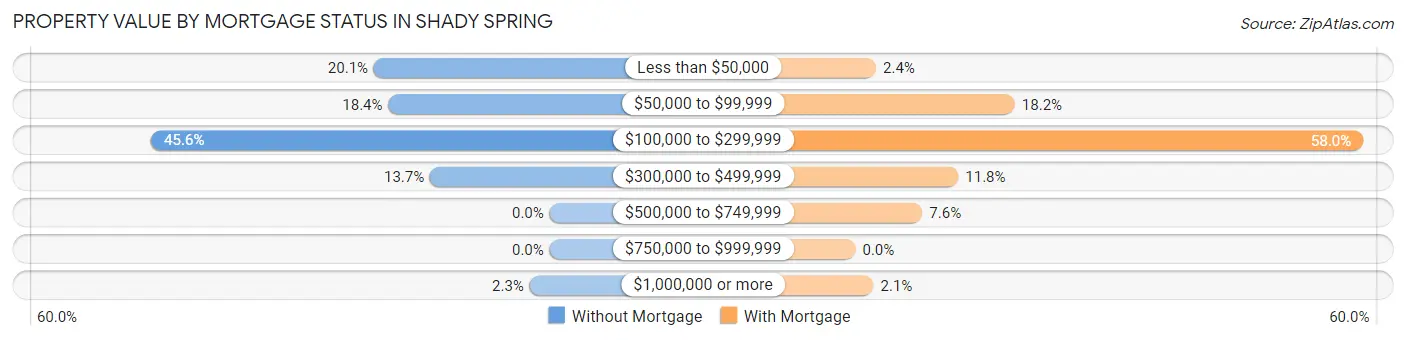
| Property Value | Without Mortgage | With Mortgage |
| Less than $50,000 | 97 (20.1%) | 16 (2.4%) |
| $50,000 to $99,999 | 89 (18.4%) | 124 (18.2%) |
| $100,000 to $299,999 | 220 (45.6%) | 395 (58.0%) |
| $300,000 to $499,999 | 66 (13.7%) | 80 (11.7%) |
| $500,000 to $749,999 | 0 (0.0%) | 52 (7.6%) |
| $750,000 to $999,999 | 0 (0.0%) | 0 (0.0%) |
| $1,000,000 or more | 11 (2.3%) | 14 (2.1%) |
| Total | 483 (100.0%) | 681 (100.0%) |
Household Income by Mortgage Status in Shady Spring
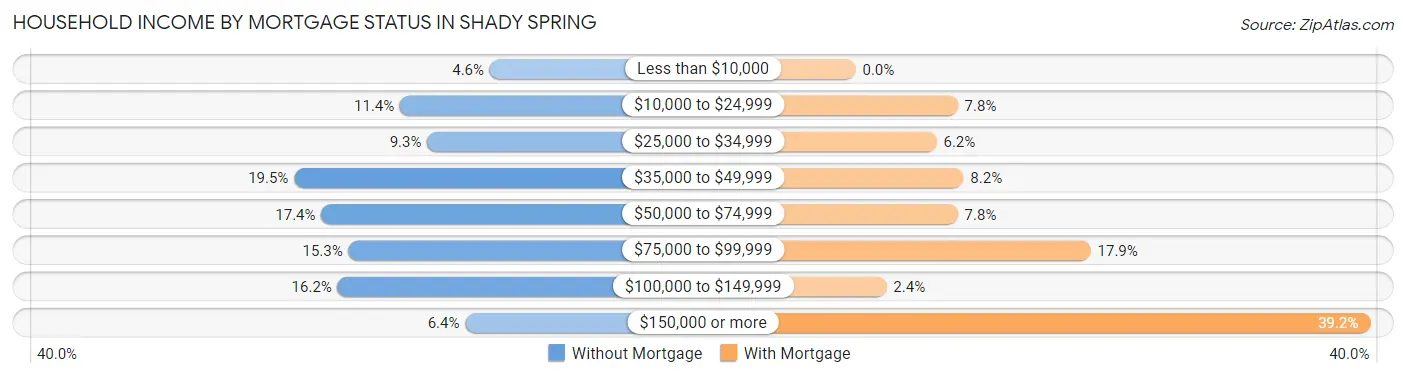
| Household Income | Without Mortgage | With Mortgage |
| Less than $10,000 | 22 (4.5%) | 0 (0.0%) |
| $10,000 to $24,999 | 55 (11.4%) | 53 (7.8%) |
| $25,000 to $34,999 | 45 (9.3%) | 42 (6.2%) |
| $35,000 to $49,999 | 94 (19.5%) | 56 (8.2%) |
| $50,000 to $74,999 | 84 (17.4%) | 53 (7.8%) |
| $75,000 to $99,999 | 74 (15.3%) | 122 (17.9%) |
| $100,000 to $149,999 | 78 (16.2%) | 16 (2.4%) |
| $150,000 or more | 31 (6.4%) | 267 (39.2%) |
| Total | 483 (100.0%) | 681 (100.0%) |
Property Value to Household Income Ratio in Shady Spring
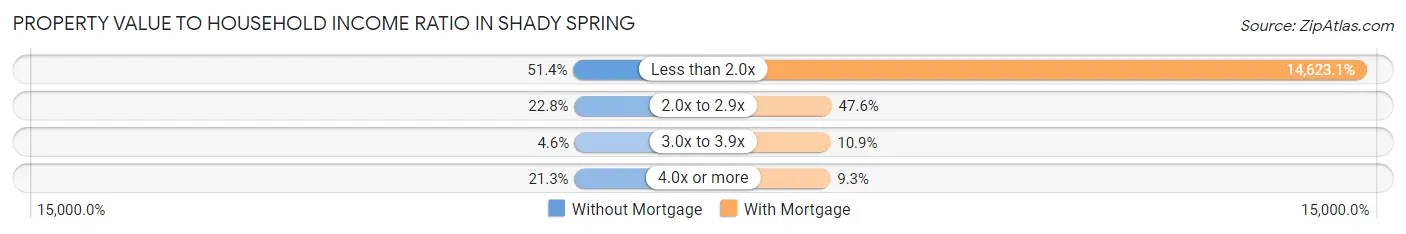
| Value-to-Income Ratio | Without Mortgage | With Mortgage |
| Less than 2.0x | 248 (51.3%) | 99,583 (14,623.1%) |
| 2.0x to 2.9x | 110 (22.8%) | 324 (47.6%) |
| 3.0x to 3.9x | 22 (4.5%) | 74 (10.9%) |
| 4.0x or more | 103 (21.3%) | 63 (9.2%) |
| Total | 483 (100.0%) | 681 (100.0%) |
Real Estate Taxes by Mortgage Status in Shady Spring
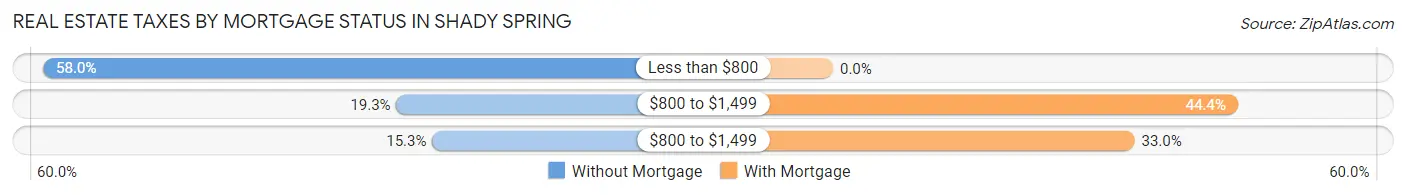
| Property Taxes | Without Mortgage | With Mortgage |
| Less than $800 | 280 (58.0%) | 0 (0.0%) |
| $800 to $1,499 | 93 (19.3%) | 302 (44.4%) |
| $800 to $1,499 | 74 (15.3%) | 225 (33.0%) |
| Total | 483 (100.0%) | 681 (100.0%) |
Health & Disability in Shady Spring
Health Insurance Coverage by Age in Shady Spring
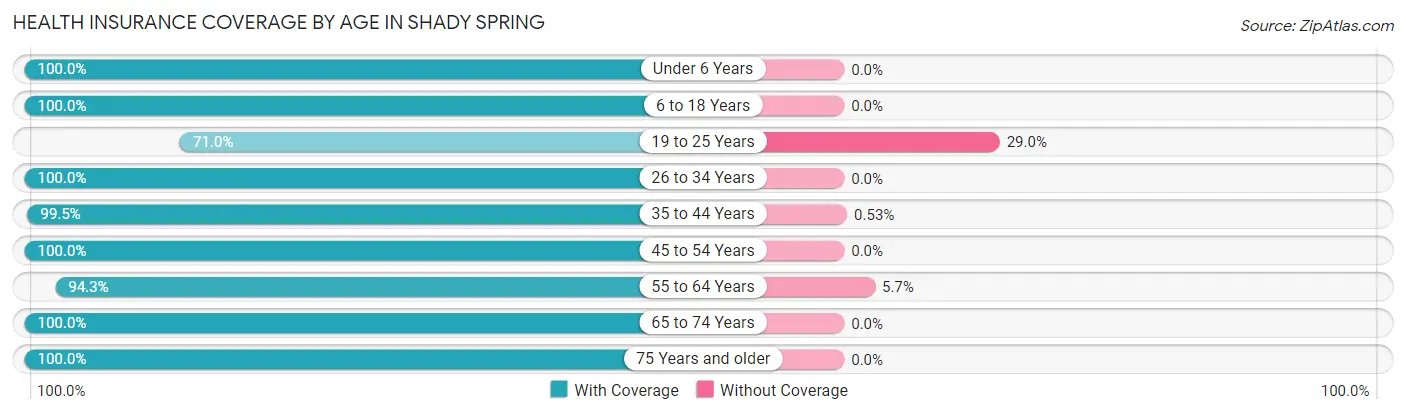
| Age Bracket | With Coverage | Without Coverage |
| Under 6 Years | 201 (100.0%) | 0 (0.0%) |
| 6 to 18 Years | 678 (100.0%) | 0 (0.0%) |
| 19 to 25 Years | 120 (71.0%) | 49 (29.0%) |
| 26 to 34 Years | 383 (100.0%) | 0 (0.0%) |
| 35 to 44 Years | 377 (99.5%) | 2 (0.5%) |
| 45 to 54 Years | 433 (100.0%) | 0 (0.0%) |
| 55 to 64 Years | 592 (94.3%) | 36 (5.7%) |
| 65 to 74 Years | 388 (100.0%) | 0 (0.0%) |
| 75 Years and older | 322 (100.0%) | 0 (0.0%) |
| Total | 3,494 (97.6%) | 87 (2.4%) |
Health Insurance Coverage by Citizenship Status in Shady Spring
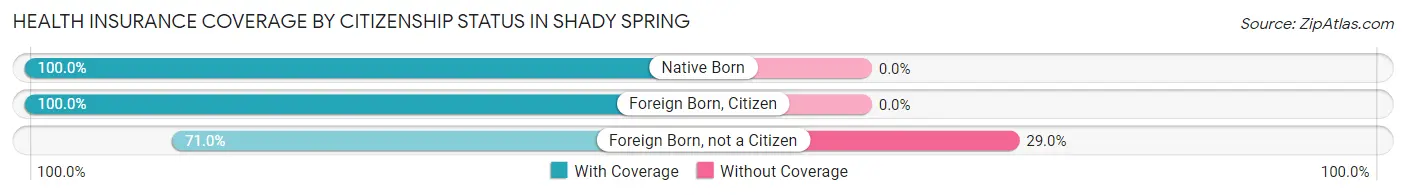
| Citizenship Status | With Coverage | Without Coverage |
| Native Born | 201 (100.0%) | 0 (0.0%) |
| Foreign Born, Citizen | 678 (100.0%) | 0 (0.0%) |
| Foreign Born, not a Citizen | 120 (71.0%) | 49 (29.0%) |
Health Insurance Coverage by Household Income in Shady Spring
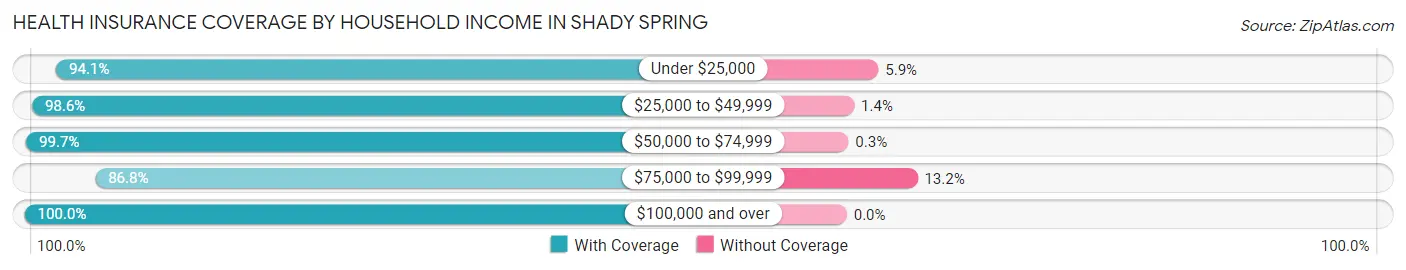
| Household Income | With Coverage | Without Coverage |
| Under $25,000 | 589 (94.1%) | 37 (5.9%) |
| $25,000 to $49,999 | 858 (98.6%) | 12 (1.4%) |
| $50,000 to $74,999 | 656 (99.7%) | 2 (0.3%) |
| $75,000 to $99,999 | 236 (86.8%) | 36 (13.2%) |
| $100,000 and over | 1,155 (100.0%) | 0 (0.0%) |
Public vs Private Health Insurance Coverage by Age in Shady Spring
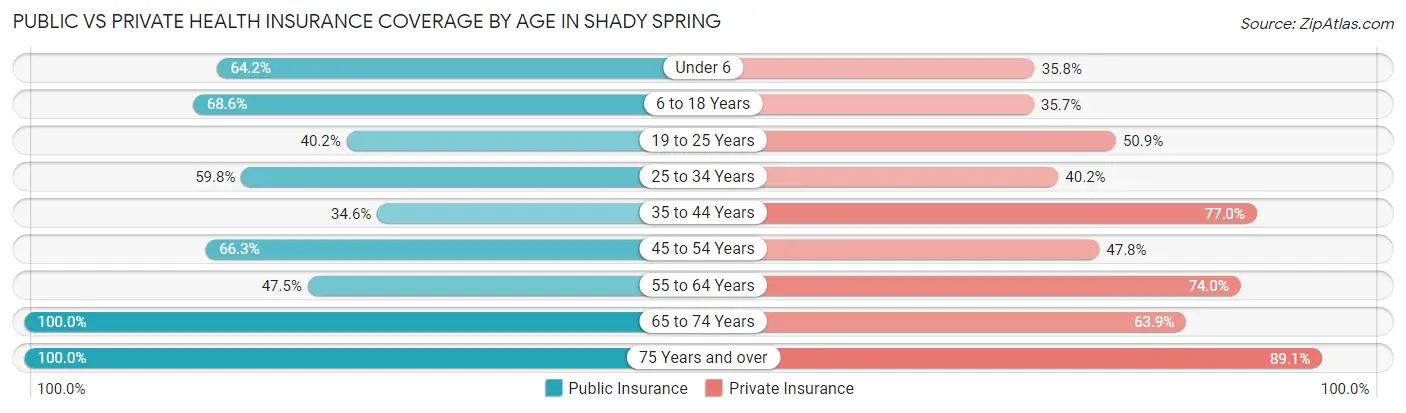
| Age Bracket | Public Insurance | Private Insurance |
| Under 6 | 129 (64.2%) | 72 (35.8%) |
| 6 to 18 Years | 465 (68.6%) | 242 (35.7%) |
| 19 to 25 Years | 68 (40.2%) | 86 (50.9%) |
| 25 to 34 Years | 229 (59.8%) | 154 (40.2%) |
| 35 to 44 Years | 131 (34.6%) | 292 (77.0%) |
| 45 to 54 Years | 287 (66.3%) | 207 (47.8%) |
| 55 to 64 Years | 298 (47.4%) | 465 (74.0%) |
| 65 to 74 Years | 388 (100.0%) | 248 (63.9%) |
| 75 Years and over | 322 (100.0%) | 287 (89.1%) |
| Total | 2,317 (64.7%) | 2,053 (57.3%) |
Disability Status by Sex by Age in Shady Spring
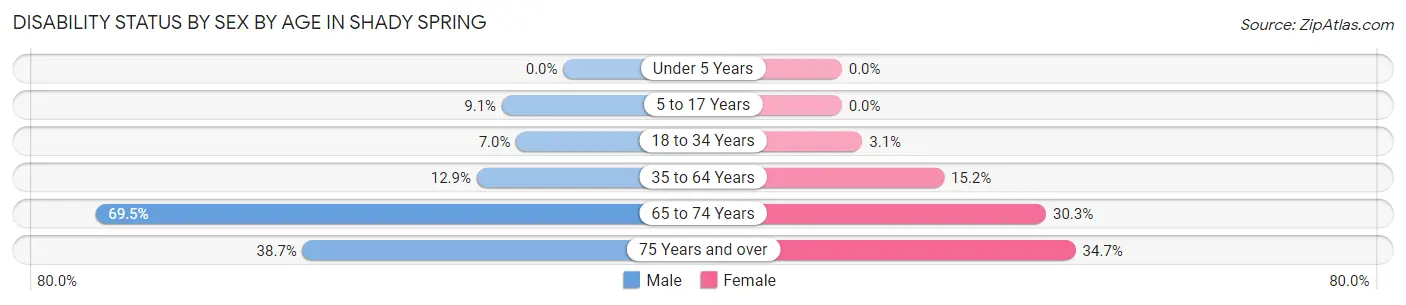
| Age Bracket | Male | Female |
| Under 5 Years | 0 (0.0%) | 0 (0.0%) |
| 5 to 17 Years | 30 (9.1%) | 0 (0.0%) |
| 18 to 34 Years | 16 (7.0%) | 10 (3.0%) |
| 35 to 64 Years | 92 (12.9%) | 110 (15.2%) |
| 65 to 74 Years | 123 (69.5%) | 64 (30.3%) |
| 75 Years and over | 60 (38.7%) | 58 (34.7%) |
Disability Class by Sex by Age in Shady Spring
Disability Class: Hearing Difficulty
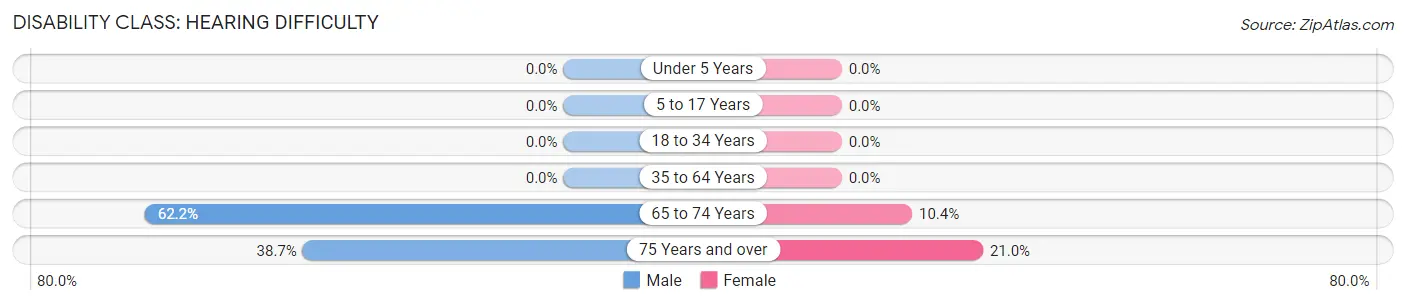
| Age Bracket | Male | Female |
| Under 5 Years | 0 (0.0%) | 0 (0.0%) |
| 5 to 17 Years | 0 (0.0%) | 0 (0.0%) |
| 18 to 34 Years | 0 (0.0%) | 0 (0.0%) |
| 35 to 64 Years | 0 (0.0%) | 0 (0.0%) |
| 65 to 74 Years | 110 (62.2%) | 22 (10.4%) |
| 75 Years and over | 60 (38.7%) | 35 (21.0%) |
Disability Class: Vision Difficulty
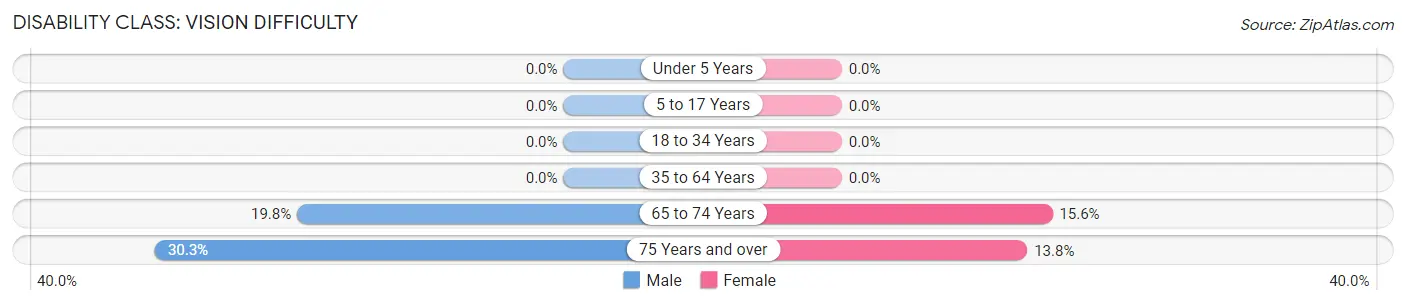
| Age Bracket | Male | Female |
| Under 5 Years | 0 (0.0%) | 0 (0.0%) |
| 5 to 17 Years | 0 (0.0%) | 0 (0.0%) |
| 18 to 34 Years | 0 (0.0%) | 0 (0.0%) |
| 35 to 64 Years | 0 (0.0%) | 0 (0.0%) |
| 65 to 74 Years | 35 (19.8%) | 33 (15.6%) |
| 75 Years and over | 47 (30.3%) | 23 (13.8%) |
Disability Class: Cognitive Difficulty
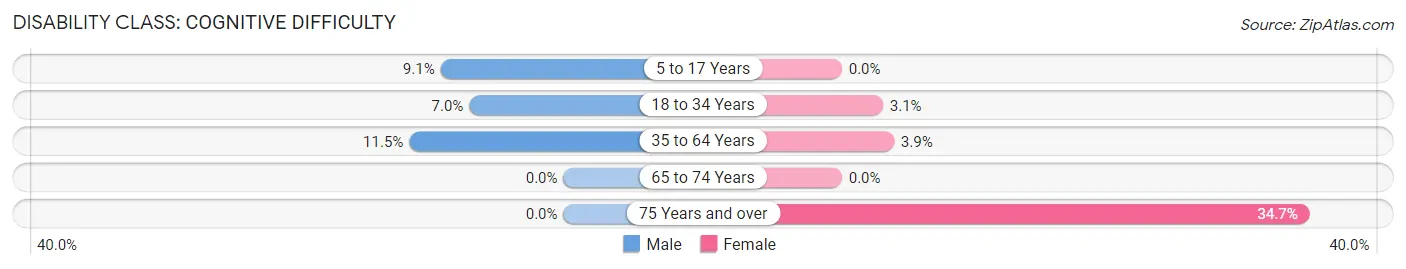
| Age Bracket | Male | Female |
| 5 to 17 Years | 30 (9.1%) | 0 (0.0%) |
| 18 to 34 Years | 16 (7.0%) | 10 (3.0%) |
| 35 to 64 Years | 82 (11.5%) | 28 (3.9%) |
| 65 to 74 Years | 0 (0.0%) | 0 (0.0%) |
| 75 Years and over | 0 (0.0%) | 58 (34.7%) |
Disability Class: Ambulatory Difficulty
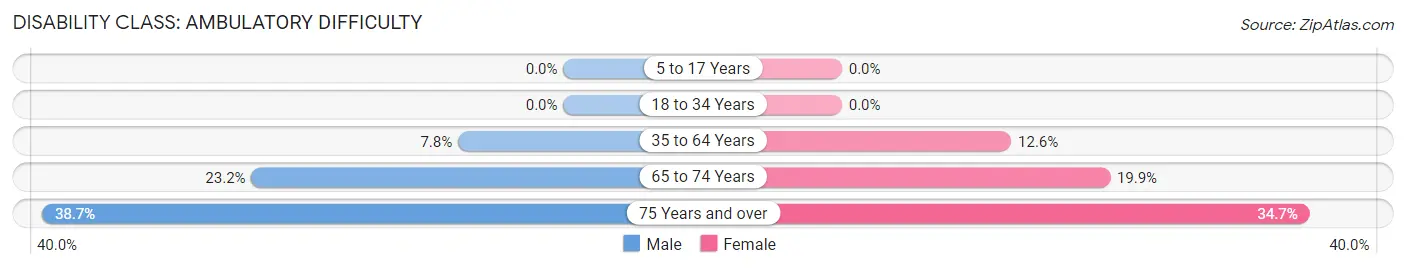
| Age Bracket | Male | Female |
| 5 to 17 Years | 0 (0.0%) | 0 (0.0%) |
| 18 to 34 Years | 0 (0.0%) | 0 (0.0%) |
| 35 to 64 Years | 56 (7.8%) | 91 (12.6%) |
| 65 to 74 Years | 41 (23.2%) | 42 (19.9%) |
| 75 Years and over | 60 (38.7%) | 58 (34.7%) |
Disability Class: Self-Care Difficulty
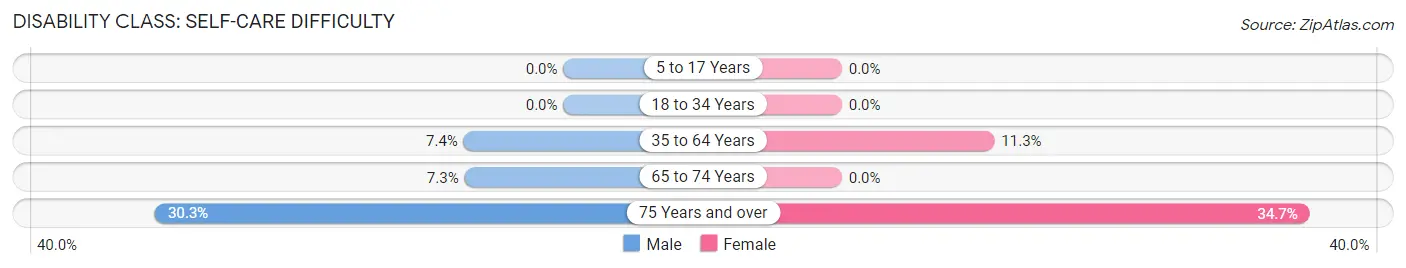
| Age Bracket | Male | Female |
| 5 to 17 Years | 0 (0.0%) | 0 (0.0%) |
| 18 to 34 Years | 0 (0.0%) | 0 (0.0%) |
| 35 to 64 Years | 53 (7.4%) | 82 (11.3%) |
| 65 to 74 Years | 13 (7.3%) | 0 (0.0%) |
| 75 Years and over | 47 (30.3%) | 58 (34.7%) |
Technology Access in Shady Spring
Computing Device Access in Shady Spring
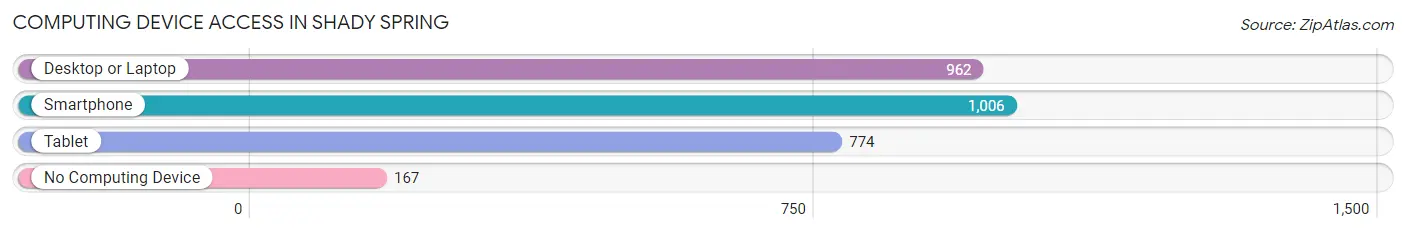
| Device Type | # Households | % Households |
| Desktop or Laptop | 962 | 74.4% |
| Smartphone | 1,006 | 77.8% |
| Tablet | 774 | 59.9% |
| No Computing Device | 167 | 12.9% |
| Total | 1,293 | 100.0% |
Internet Access in Shady Spring
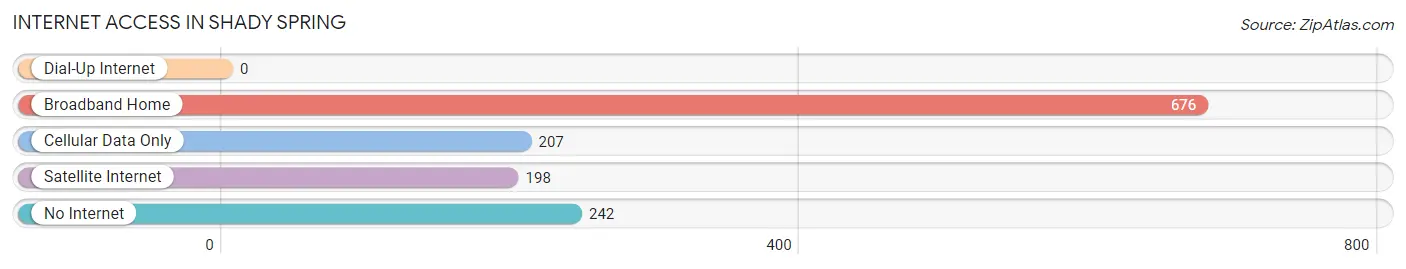
| Internet Type | # Households | % Households |
| Dial-Up Internet | 0 | 0.0% |
| Broadband Home | 676 | 52.3% |
| Cellular Data Only | 207 | 16.0% |
| Satellite Internet | 198 | 15.3% |
| No Internet | 242 | 18.7% |
| Total | 1,293 | 100.0% |
Shady Spring Summary
Shady Spring is a small town located in Raleigh County, West Virginia. It is situated in the Appalachian Mountains and is part of the Beckley-Raleigh County Metropolitan Statistical Area. The town has a population of approximately 1,500 people and is located about 20 miles south of the city of Beckley.
Geography
Shady Spring is located in the Appalachian Mountains of West Virginia. The town is situated in the Appalachian Plateau, which is characterized by rolling hills and valleys. The town is located in the New River Gorge National River, which is a protected area of the National Park Service. The town is also located near the Bluestone River, which is a tributary of the New River. The town is located at an elevation of 1,890 feet above sea level.
The climate in Shady Spring is classified as humid subtropical. Summers are hot and humid, with temperatures reaching into the 90s. Winters are cold and snowy, with temperatures dropping into the teens. The town receives an average of 43 inches of precipitation per year.
Economy
The economy of Shady Spring is largely based on the coal mining industry. The town is home to several coal mines, including the Shady Spring Mine, which is owned by the Appalachian Coal Company. The town is also home to several small businesses, including a grocery store, a hardware store, and a restaurant.
The town is also home to several tourist attractions, including the New River Gorge National River, which is a popular destination for whitewater rafting and other outdoor activities. The town is also home to the Shady Spring Wildlife Management Area, which is a popular destination for hunting and fishing.
Demographics
As of the 2010 census, the population of Shady Spring was 1,500. The racial makeup of the town was 97.3% White, 0.7% African American, 0.3% Native American, 0.3% Asian, and 1.3% from two or more races. The median household income was $30,000, and the median family income was $35,000.
The town is served by the Raleigh County School District, which includes Shady Spring Elementary School, Shady Spring Middle School, and Shady Spring High School. The town is also home to several churches, including the Shady Spring United Methodist Church, the Shady Spring Baptist Church, and the Shady Spring Church of God.
Conclusion
Shady Spring is a small town located in the Appalachian Mountains of West Virginia. The town has a population of approximately 1,500 people and is located in the New River Gorge National River. The economy of the town is largely based on the coal mining industry, and the town is also home to several small businesses and tourist attractions. The town is served by the Raleigh County School District, and is home to several churches.
Common Questions
What is Per Capita Income in Shady Spring?
Per Capita income in Shady Spring is $31,602.
What is the Median Family Income in Shady Spring?
Median Family Income in Shady Spring is $66,806.
What is the Median Household income in Shady Spring?
Median Household Income in Shady Spring is $64,215.
What is Income or Wage Gap in Shady Spring?
Income or Wage Gap in Shady Spring is 16.4%.
Women in Shady Spring earn 83.6 cents for every dollar earned by a man.
What is Inequality or Gini Index in Shady Spring?
Inequality or Gini Index in Shady Spring is 0.45.
What is the Total Population of Shady Spring?
Total Population of Shady Spring is 3,581.
What is the Total Male Population of Shady Spring?
Total Male Population of Shady Spring is 1,725.
What is the Total Female Population of Shady Spring?
Total Female Population of Shady Spring is 1,856.
What is the Ratio of Males per 100 Females in Shady Spring?
There are 92.94 Males per 100 Females in Shady Spring.
What is the Ratio of Females per 100 Males in Shady Spring?
There are 107.59 Females per 100 Males in Shady Spring.
What is the Median Population Age in Shady Spring?
Median Population Age in Shady Spring is 43.8 Years.
What is the Average Family Size in Shady Spring
Average Family Size in Shady Spring is 3.0 People.
What is the Average Household Size in Shady Spring
Average Household Size in Shady Spring is 2.8 People.
How Large is the Labor Force in Shady Spring?
There are 1,465 People in the Labor Forcein in Shady Spring.
What is the Percentage of People in the Labor Force in Shady Spring?
53.8% of People are in the Labor Force in Shady Spring.
What is the Unemployment Rate in Shady Spring?
Unemployment Rate in Shady Spring is 10.4%.