Rowlesburg, WV Map & Demographics
Rowlesburg Map
Rowlesburg Overview
$25,109
PER CAPITA INCOME
$54,219
AVG FAMILY INCOME
$50,139
AVG HOUSEHOLD INCOME
12.1%
WAGE / INCOME GAP [ % ]
87.9¢/ $1
WAGE / INCOME GAP [ $ ]
$3,475
FAMILY INCOME DEFICIT
0.37
INEQUALITY / GINI INDEX
585
TOTAL POPULATION
304
MALE POPULATION
281
FEMALE POPULATION
108.19
MALES / 100 FEMALES
92.43
FEMALES / 100 MALES
53.9
MEDIAN AGE
2.7
AVG FAMILY SIZE
2.2
AVG HOUSEHOLD SIZE
266
LABOR FORCE [ PEOPLE ]
49.9%
PERCENT IN LABOR FORCE
15.4%
UNEMPLOYMENT RATE
Rowlesburg Zip Codes
Rowlesburg Area Codes
Income in Rowlesburg
Income Overview in Rowlesburg
Per Capita Income in Rowlesburg is $25,109, while median incomes of families and households are $54,219 and $50,139 respectively.
| Characteristic | Number | Measure |
| Per Capita Income | 585 | $25,109 |
| Median Family Income | 157 | $54,219 |
| Mean Family Income | 157 | $67,084 |
| Median Household Income | 269 | $50,139 |
| Mean Household Income | 269 | $57,187 |
| Income Deficit | 157 | $3,475 |
| Wage / Income Gap (%) | 585 | 12.05% |
| Wage / Income Gap ($) | 585 | 87.95¢ per $1 |
| Gini / Inequality Index | 585 | 0.37 |
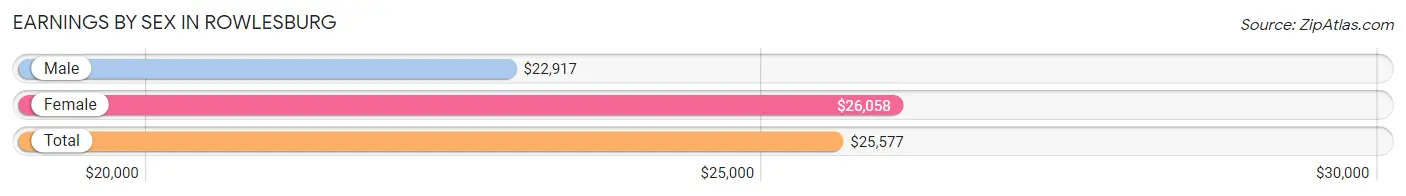
Earnings by Sex in Rowlesburg
Average Earnings in Rowlesburg are $25,577, $22,917 for men and $26,058 for women, a difference of 12.0%.
| Sex | Number | Average Earnings |
| Male | 143 (59.6%) | $22,917 |
| Female | 97 (40.4%) | $26,058 |
| Total | 240 (100.0%) | $25,577 |
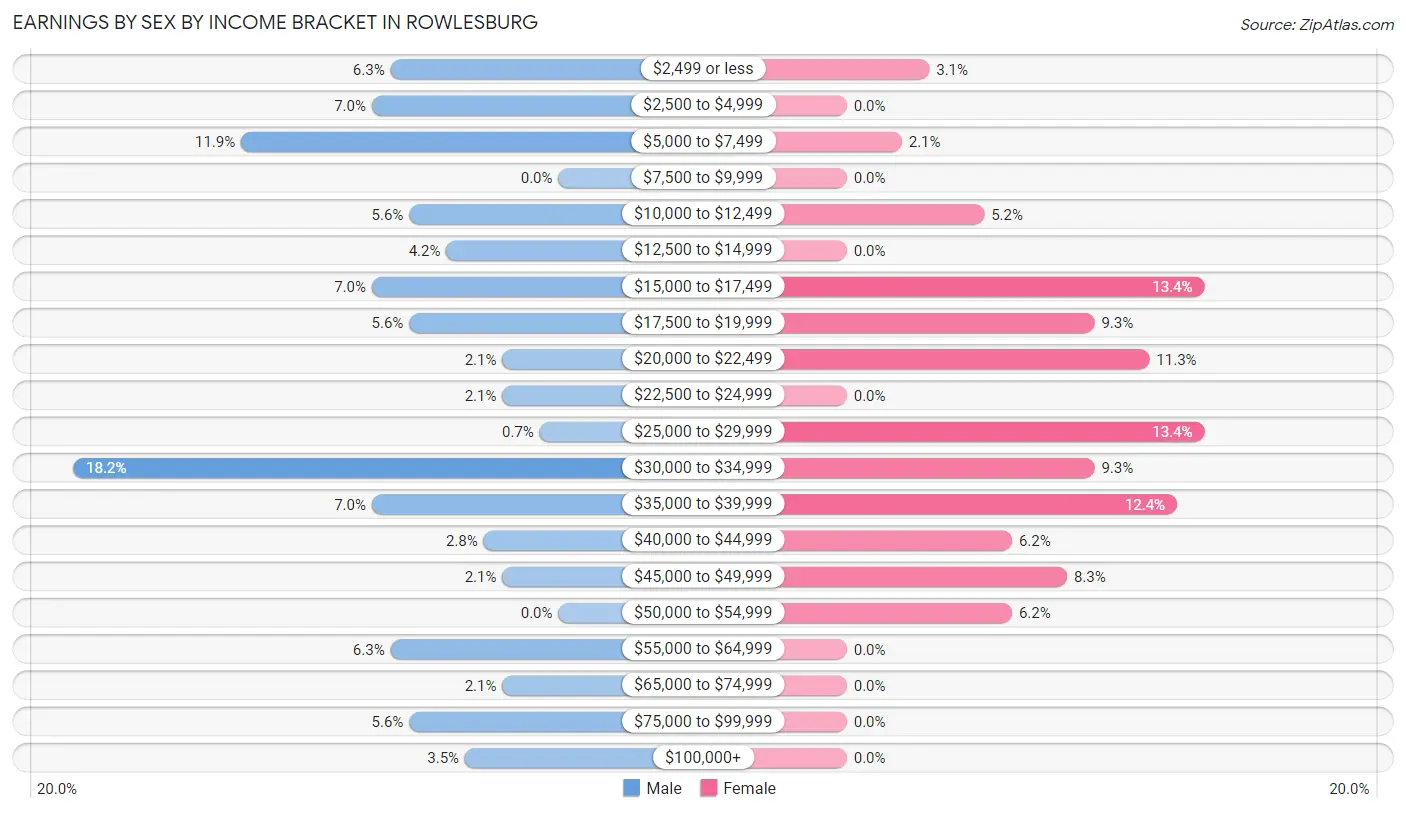
Earnings by Sex by Income Bracket in Rowlesburg
The most common earnings brackets in Rowlesburg are $30,000 to $34,999 for men (26 | 18.2%) and $15,000 to $17,499 for women (13 | 13.4%).
| Income | Male | Female |
| $2,499 or less | 9 (6.3%) | 3 (3.1%) |
| $2,500 to $4,999 | 10 (7.0%) | 0 (0.0%) |
| $5,000 to $7,499 | 17 (11.9%) | 2 (2.1%) |
| $7,500 to $9,999 | 0 (0.0%) | 0 (0.0%) |
| $10,000 to $12,499 | 8 (5.6%) | 5 (5.1%) |
| $12,500 to $14,999 | 6 (4.2%) | 0 (0.0%) |
| $15,000 to $17,499 | 10 (7.0%) | 13 (13.4%) |
| $17,500 to $19,999 | 8 (5.6%) | 9 (9.3%) |
| $20,000 to $22,499 | 3 (2.1%) | 11 (11.3%) |
| $22,500 to $24,999 | 3 (2.1%) | 0 (0.0%) |
| $25,000 to $29,999 | 1 (0.7%) | 13 (13.4%) |
| $30,000 to $34,999 | 26 (18.2%) | 9 (9.3%) |
| $35,000 to $39,999 | 10 (7.0%) | 12 (12.4%) |
| $40,000 to $44,999 | 4 (2.8%) | 6 (6.2%) |
| $45,000 to $49,999 | 3 (2.1%) | 8 (8.3%) |
| $50,000 to $54,999 | 0 (0.0%) | 6 (6.2%) |
| $55,000 to $64,999 | 9 (6.3%) | 0 (0.0%) |
| $65,000 to $74,999 | 3 (2.1%) | 0 (0.0%) |
| $75,000 to $99,999 | 8 (5.6%) | 0 (0.0%) |
| $100,000+ | 5 (3.5%) | 0 (0.0%) |
| Total | 143 (100.0%) | 97 (100.0%) |
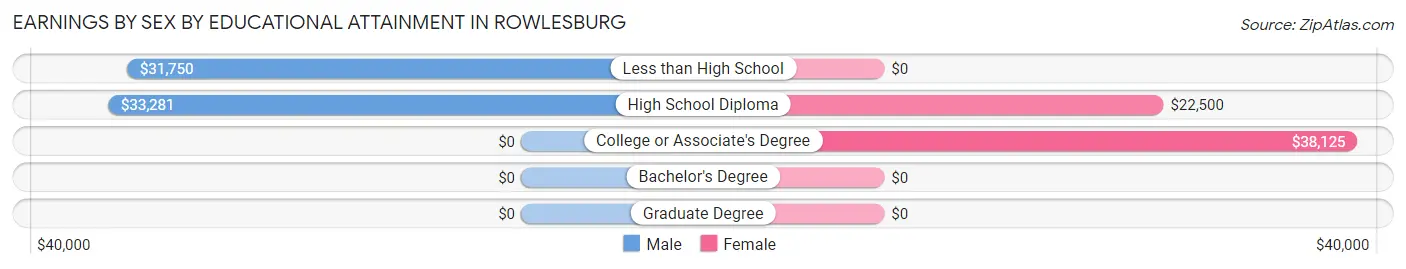
Earnings by Sex by Educational Attainment in Rowlesburg
Average earnings in Rowlesburg are $33,810 for men and $26,346 for women, a difference of 22.1%. Men with an educational attainment of high school diploma enjoy the highest average annual earnings of $33,281, while those with less than high school education earn the least with $31,750. Women with an educational attainment of college or associate's degree earn the most with the average annual earnings of $38,125, while those with high school diploma education have the smallest earnings of $22,500.
| Educational Attainment | Male Income | Female Income |
| Less than High School | $31,750 | $0 |
| High School Diploma | $33,281 | $22,500 |
| College or Associate's Degree | - | - |
| Bachelor's Degree | - | - |
| Graduate Degree | - | - |
| Total | $33,810 | $26,346 |
Family Income in Rowlesburg
Family Income Brackets in Rowlesburg
According to the Rowlesburg family income data, there are 38 families falling into the $50,000 to $74,999 income range, which is the most common income bracket and makes up 24.2% of all families.
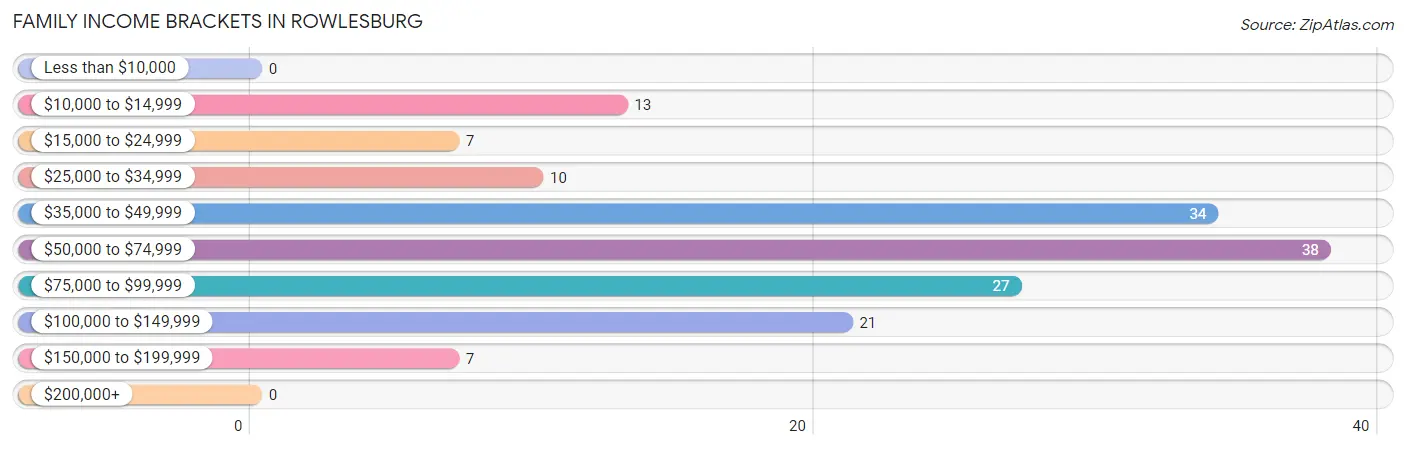
| Income Bracket | # Families | % Families |
| Less than $10,000 | 0 | 0.0% |
| $10,000 to $14,999 | 13 | 8.3% |
| $15,000 to $24,999 | 7 | 4.5% |
| $25,000 to $34,999 | 10 | 6.4% |
| $35,000 to $49,999 | 34 | 21.7% |
| $50,000 to $74,999 | 38 | 24.2% |
| $75,000 to $99,999 | 27 | 17.2% |
| $100,000 to $149,999 | 21 | 13.4% |
| $150,000 to $199,999 | 7 | 4.5% |
| $200,000+ | 0 | 0.0% |
Family Income by Famaliy Size in Rowlesburg
3-person families (53 | 33.8%) account for the highest median family income in Rowlesburg with $54,844 per family, while 2-person families (87 | 55.4%) have the highest median income of $23,875 per family member.
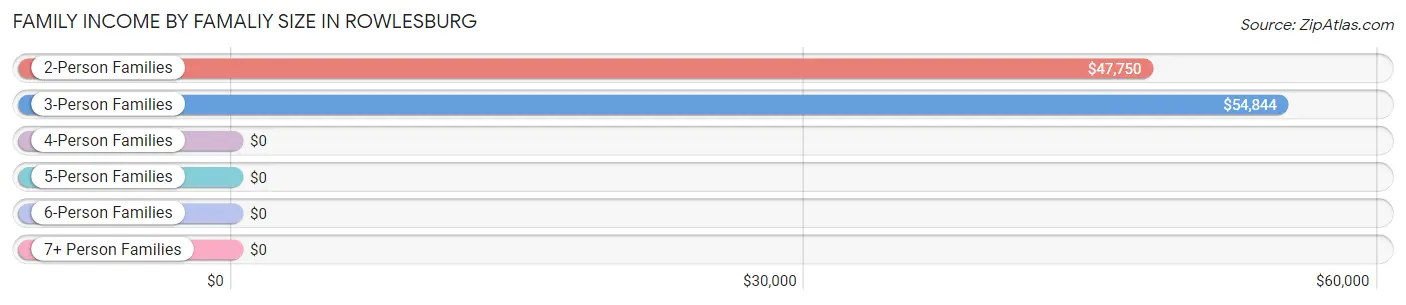
| Income Bracket | # Families | Median Income |
| 2-Person Families | 87 (55.4%) | $47,750 |
| 3-Person Families | 53 (33.8%) | $54,844 |
| 4-Person Families | 9 (5.7%) | $0 |
| 5-Person Families | 8 (5.1%) | $0 |
| 6-Person Families | 0 (0.0%) | $0 |
| 7+ Person Families | 0 (0.0%) | $0 |
| Total | 157 (100.0%) | $54,219 |
Family Income by Number of Earners in Rowlesburg
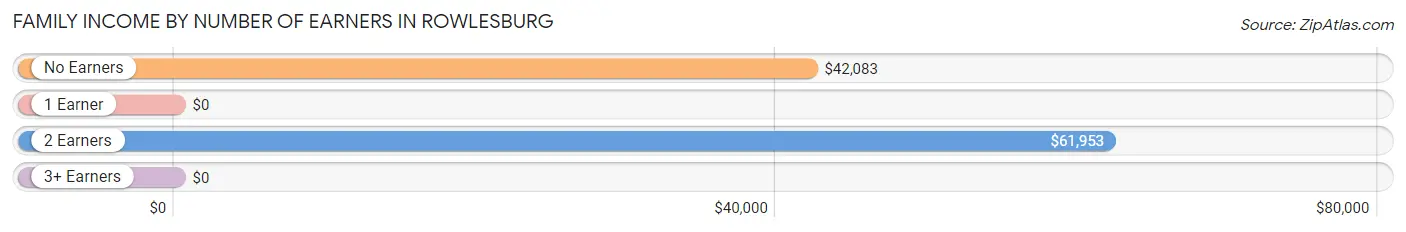
| Number of Earners | # Families | Median Income |
| No Earners | 54 (34.4%) | $42,083 |
| 1 Earner | 34 (21.7%) | $0 |
| 2 Earners | 63 (40.1%) | $61,953 |
| 3+ Earners | 6 (3.8%) | $0 |
| Total | 157 (100.0%) | $54,219 |
Household Income in Rowlesburg
Household Income Brackets in Rowlesburg
With 53 households falling in the category, the $50,000 to $74,999 income range is the most frequent in Rowlesburg, accounting for 19.7% of all households.
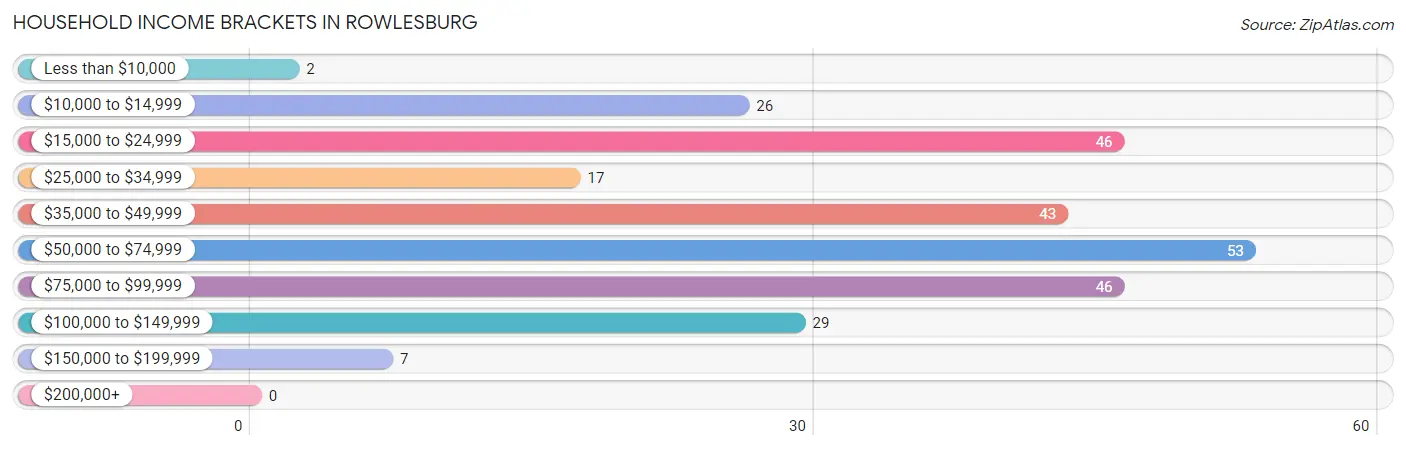
| Income Bracket | # Households | % Households |
| Less than $10,000 | 2 | 0.7% |
| $10,000 to $14,999 | 26 | 9.7% |
| $15,000 to $24,999 | 46 | 17.1% |
| $25,000 to $34,999 | 17 | 6.3% |
| $35,000 to $49,999 | 43 | 16.0% |
| $50,000 to $74,999 | 53 | 19.7% |
| $75,000 to $99,999 | 46 | 17.1% |
| $100,000 to $149,999 | 29 | 10.8% |
| $150,000 to $199,999 | 7 | 2.6% |
| $200,000+ | 0 | 0.0% |
Household Income by Householder Age in Rowlesburg
The median household income in Rowlesburg is $50,139, with the highest median household income of $54,659 found in the 45 to 64 years age bracket for the primary householder. A total of 111 households (41.3%) fall into this category. Meanwhile, the 15 to 24 years age bracket for the primary householder has the lowest median household income of $0, with 11 households (4.1%) in this group.
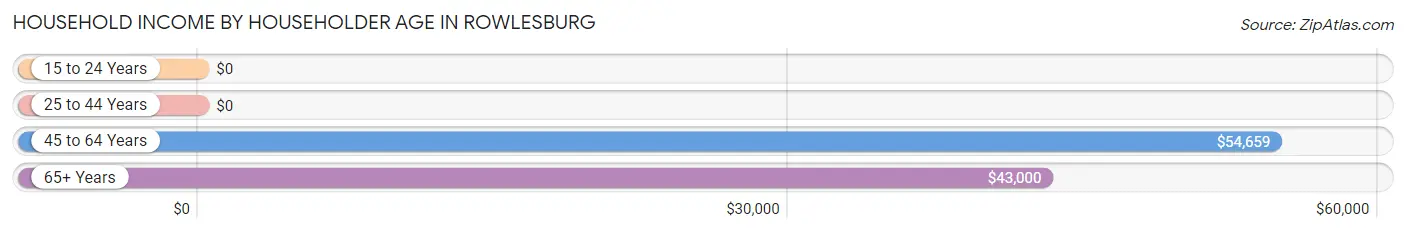
| Income Bracket | # Households | Median Income |
| 15 to 24 Years | 11 (4.1%) | $0 |
| 25 to 44 Years | 41 (15.2%) | $0 |
| 45 to 64 Years | 111 (41.3%) | $54,659 |
| 65+ Years | 106 (39.4%) | $43,000 |
| Total | 269 (100.0%) | $50,139 |
Poverty in Rowlesburg
Income Below Poverty by Sex and Age in Rowlesburg
With 18.1% poverty level for males and 20.6% for females among the residents of Rowlesburg, 6 to 11 year old males and 18 to 24 year old females are the most vulnerable to poverty, with 5 males (62.5%) and 12 females (80.0%) in their respective age groups living below the poverty level.
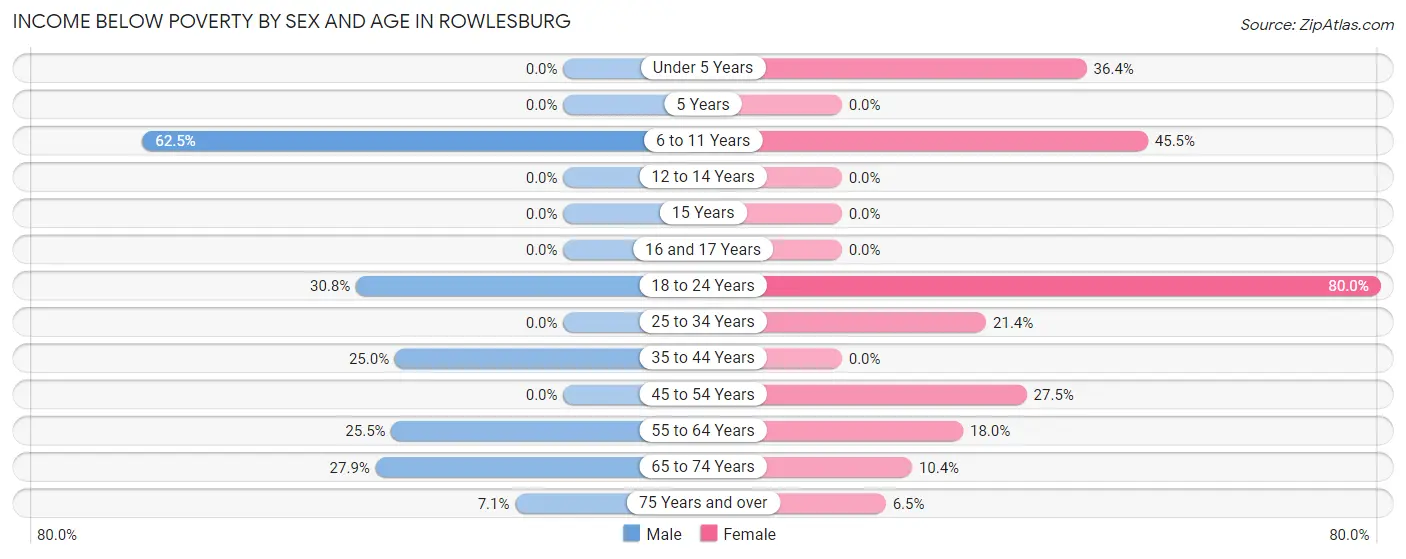
| Age Bracket | Male | Female |
| Under 5 Years | 0 (0.0%) | 4 (36.4%) |
| 5 Years | 0 (0.0%) | 0 (0.0%) |
| 6 to 11 Years | 5 (62.5%) | 5 (45.5%) |
| 12 to 14 Years | 0 (0.0%) | 0 (0.0%) |
| 15 Years | 0 (0.0%) | 0 (0.0%) |
| 16 and 17 Years | 0 (0.0%) | 0 (0.0%) |
| 18 to 24 Years | 12 (30.8%) | 12 (80.0%) |
| 25 to 34 Years | 0 (0.0%) | 6 (21.4%) |
| 35 to 44 Years | 5 (25.0%) | 0 (0.0%) |
| 45 to 54 Years | 0 (0.0%) | 14 (27.5%) |
| 55 to 64 Years | 12 (25.5%) | 9 (18.0%) |
| 65 to 74 Years | 17 (27.9%) | 5 (10.4%) |
| 75 Years and over | 2 (7.1%) | 3 (6.5%) |
| Total | 53 (18.1%) | 58 (20.6%) |
Income Above Poverty by Sex and Age in Rowlesburg
According to the poverty statistics in Rowlesburg, males aged 12 to 14 years and females aged 12 to 14 years are the age groups that are most secure financially, with 100.0% of males and 100.0% of females in these age groups living above the poverty line.
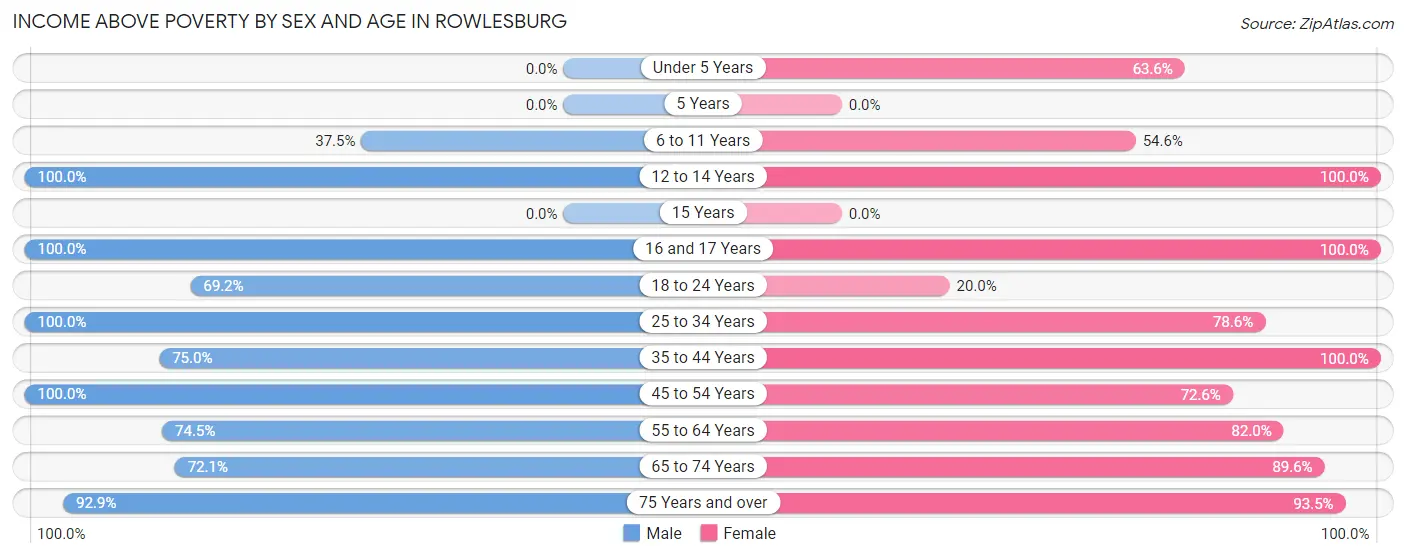
| Age Bracket | Male | Female |
| Under 5 Years | 0 (0.0%) | 7 (63.6%) |
| 5 Years | 0 (0.0%) | 0 (0.0%) |
| 6 to 11 Years | 3 (37.5%) | 6 (54.5%) |
| 12 to 14 Years | 3 (100.0%) | 7 (100.0%) |
| 15 Years | 0 (0.0%) | 0 (0.0%) |
| 16 and 17 Years | 4 (100.0%) | 5 (100.0%) |
| 18 to 24 Years | 27 (69.2%) | 3 (20.0%) |
| 25 to 34 Years | 56 (100.0%) | 22 (78.6%) |
| 35 to 44 Years | 15 (75.0%) | 9 (100.0%) |
| 45 to 54 Years | 26 (100.0%) | 37 (72.6%) |
| 55 to 64 Years | 35 (74.5%) | 41 (82.0%) |
| 65 to 74 Years | 44 (72.1%) | 43 (89.6%) |
| 75 Years and over | 26 (92.9%) | 43 (93.5%) |
| Total | 239 (81.9%) | 223 (79.4%) |
Income Below Poverty Among Married-Couple Families in Rowlesburg
The poverty statistics for married-couple families in Rowlesburg show that 18.2% or 24 of the total 132 families live below the poverty line. Families with 3 or 4 children have the highest poverty rate of 100.0%, comprising of 6 families. On the other hand, families with 1 or 2 children have the lowest poverty rate of 0.0%, which includes 0 families.
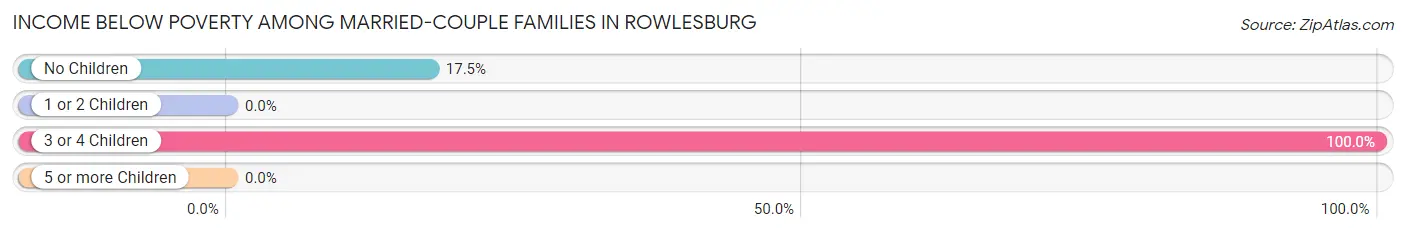
| Children | Above Poverty | Below Poverty |
| No Children | 85 (82.5%) | 18 (17.5%) |
| 1 or 2 Children | 23 (100.0%) | 0 (0.0%) |
| 3 or 4 Children | 0 (0.0%) | 6 (100.0%) |
| 5 or more Children | 0 (0.0%) | 0 (0.0%) |
| Total | 108 (81.8%) | 24 (18.2%) |
Income Below Poverty Among Single-Parent Households in Rowlesburg
| Children | Single Father | Single Mother |
| No Children | 0 (0.0%) | 0 (0.0%) |
| 1 or 2 Children | 0 (0.0%) | 0 (0.0%) |
| 3 or 4 Children | 0 (0.0%) | 0 (0.0%) |
| 5 or more Children | 0 (0.0%) | 0 (0.0%) |
| Total | 0 (0.0%) | 0 (0.0%) |
Income Below Poverty Among Married-Couple vs Single-Parent Households in Rowlesburg
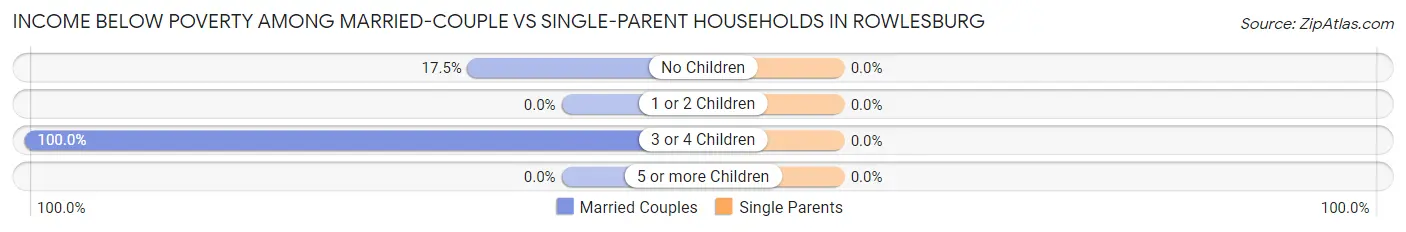
| Children | Married-Couple Families | Single-Parent Households |
| No Children | 18 (17.5%) | 0 (0.0%) |
| 1 or 2 Children | 0 (0.0%) | 0 (0.0%) |
| 3 or 4 Children | 6 (100.0%) | 0 (0.0%) |
| 5 or more Children | 0 (0.0%) | 0 (0.0%) |
| Total | 24 (18.2%) | 0 (0.0%) |
Race in Rowlesburg
The most populous races in Rowlesburg are White / Caucasian (569 | 97.3%), Two or more Races (14 | 2.4%), and Hawaiian / Pacific (2 | 0.3%).
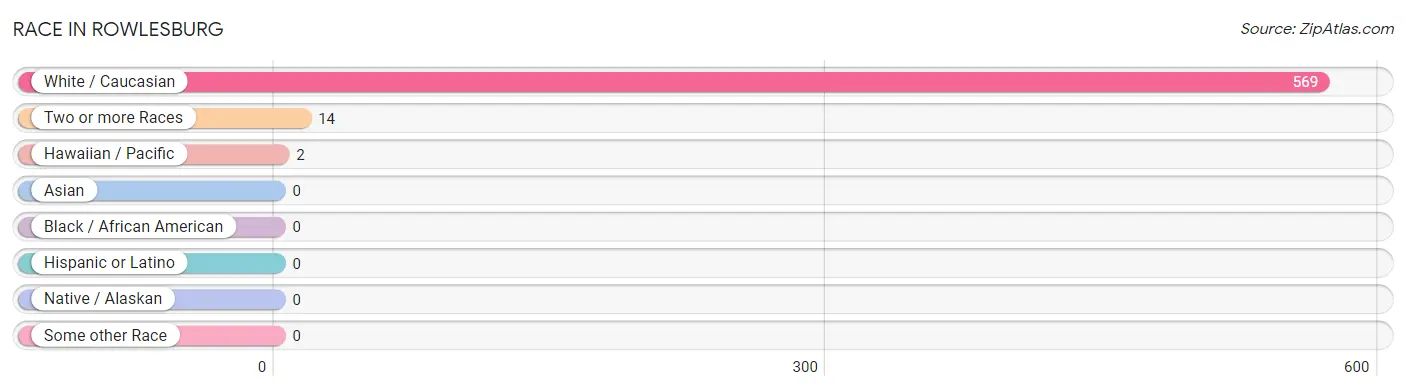
| Race | # Population | % Population |
| Asian | 0 | 0.0% |
| Black / African American | 0 | 0.0% |
| Hawaiian / Pacific | 2 | 0.3% |
| Hispanic or Latino | 0 | 0.0% |
| Native / Alaskan | 0 | 0.0% |
| White / Caucasian | 569 | 97.3% |
| Two or more Races | 14 | 2.4% |
| Some other Race | 0 | 0.0% |
| Total | 585 | 100.0% |
Ancestry in Rowlesburg
The most populous ancestries reported in Rowlesburg are American (308 | 52.6%), German (99 | 16.9%), Irish (59 | 10.1%), English (40 | 6.8%), and Scottish (15 | 2.6%), together accounting for 89.1% of all Rowlesburg residents.
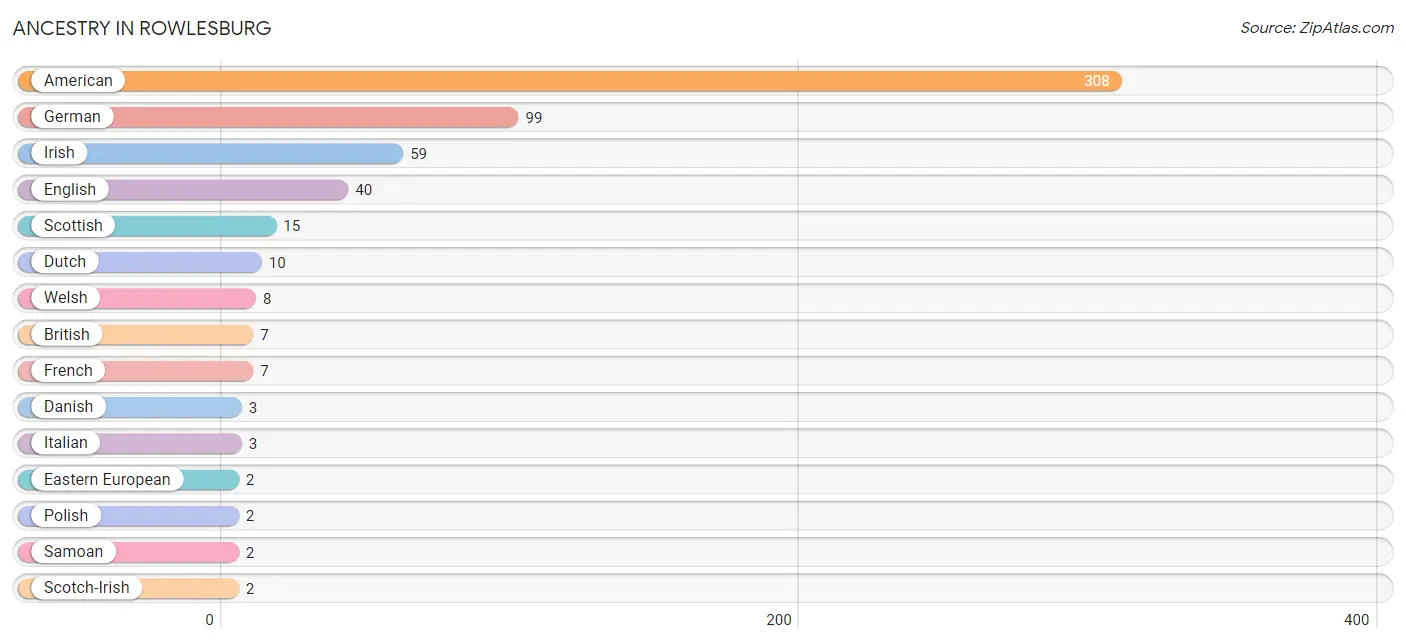
| Ancestry | # Population | % Population |
| American | 308 | 52.6% |
| British | 7 | 1.2% |
| Danish | 3 | 0.5% |
| Dutch | 10 | 1.7% |
| Eastern European | 2 | 0.3% |
| English | 40 | 6.8% |
| French | 7 | 1.2% |
| German | 99 | 16.9% |
| Irish | 59 | 10.1% |
| Italian | 3 | 0.5% |
| Polish | 2 | 0.3% |
| Samoan | 2 | 0.3% |
| Scotch-Irish | 2 | 0.3% |
| Scottish | 15 | 2.6% |
| Welsh | 8 | 1.4% | View All 15 Rows |
Immigrants in Rowlesburg

| Immigration Origin | # Population | % Population | View All 0 Rows |
Sex and Age in Rowlesburg
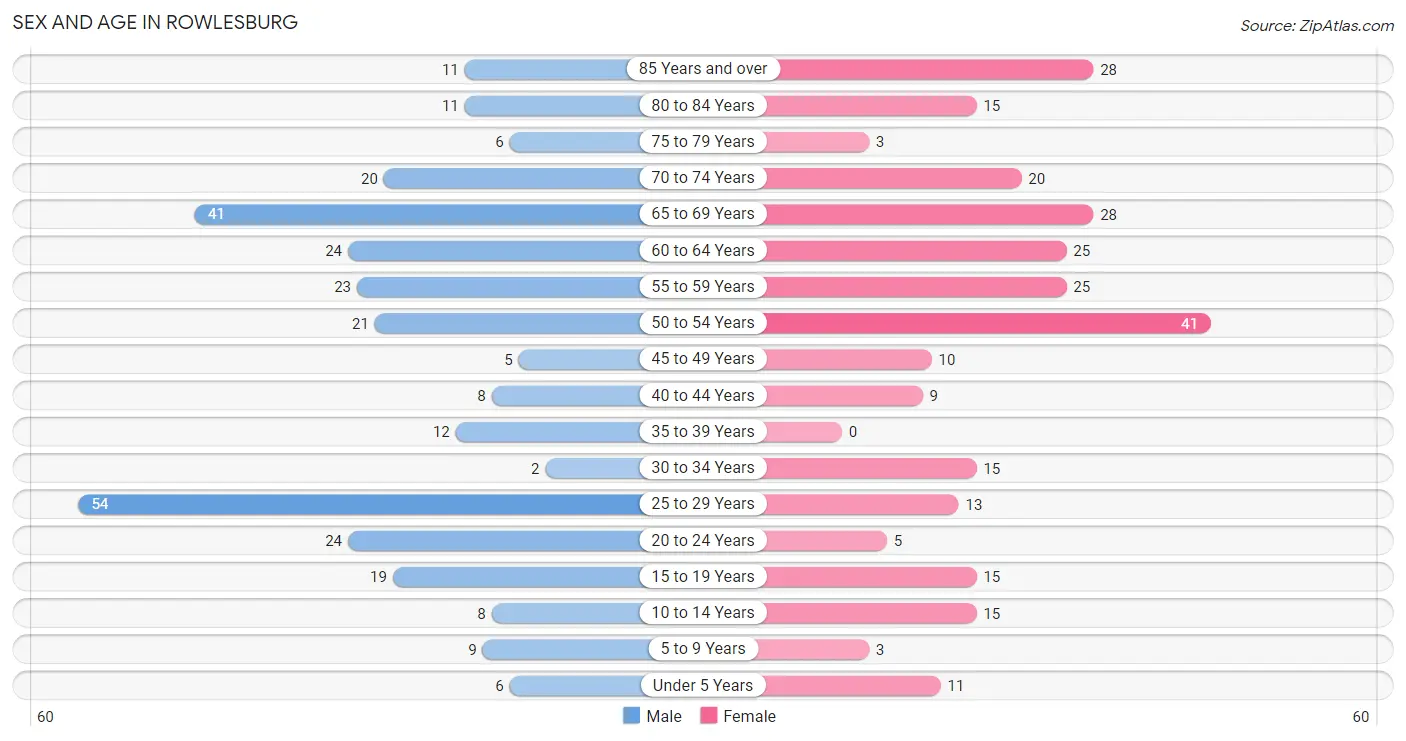
Sex and Age in Rowlesburg
The most populous age groups in Rowlesburg are 25 to 29 Years (54 | 17.8%) for men and 50 to 54 Years (41 | 14.6%) for women.
| Age Bracket | Male | Female |
| Under 5 Years | 6 (2.0%) | 11 (3.9%) |
| 5 to 9 Years | 9 (3.0%) | 3 (1.1%) |
| 10 to 14 Years | 8 (2.6%) | 15 (5.3%) |
| 15 to 19 Years | 19 (6.2%) | 15 (5.3%) |
| 20 to 24 Years | 24 (7.9%) | 5 (1.8%) |
| 25 to 29 Years | 54 (17.8%) | 13 (4.6%) |
| 30 to 34 Years | 2 (0.7%) | 15 (5.3%) |
| 35 to 39 Years | 12 (4.0%) | 0 (0.0%) |
| 40 to 44 Years | 8 (2.6%) | 9 (3.2%) |
| 45 to 49 Years | 5 (1.6%) | 10 (3.6%) |
| 50 to 54 Years | 21 (6.9%) | 41 (14.6%) |
| 55 to 59 Years | 23 (7.6%) | 25 (8.9%) |
| 60 to 64 Years | 24 (7.9%) | 25 (8.9%) |
| 65 to 69 Years | 41 (13.5%) | 28 (10.0%) |
| 70 to 74 Years | 20 (6.6%) | 20 (7.1%) |
| 75 to 79 Years | 6 (2.0%) | 3 (1.1%) |
| 80 to 84 Years | 11 (3.6%) | 15 (5.3%) |
| 85 Years and over | 11 (3.6%) | 28 (10.0%) |
| Total | 304 (100.0%) | 281 (100.0%) |
Families and Households in Rowlesburg
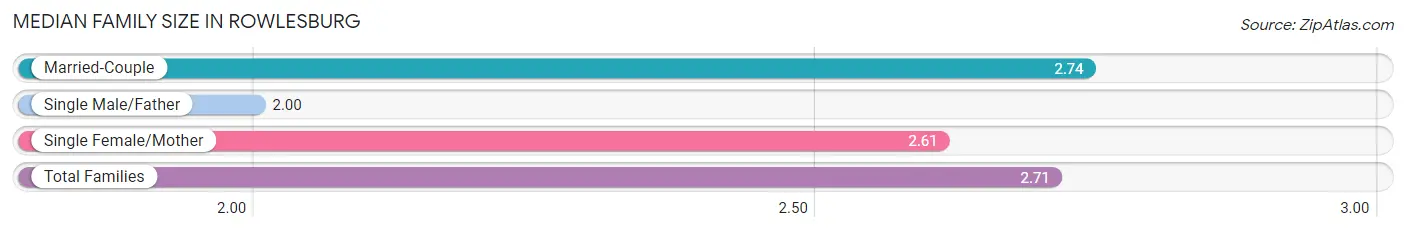
Median Family Size in Rowlesburg
The median family size in Rowlesburg is 2.71 persons per family, with married-couple families (132 | 84.1%) accounting for the largest median family size of 2.74 persons per family. On the other hand, single male/father families (2 | 1.3%) represent the smallest median family size with 2.00 persons per family.
| Family Type | # Families | Family Size |
| Married-Couple | 132 (84.1%) | 2.74 |
| Single Male/Father | 2 (1.3%) | 2.00 |
| Single Female/Mother | 23 (14.6%) | 2.61 |
| Total Families | 157 (100.0%) | 2.71 |
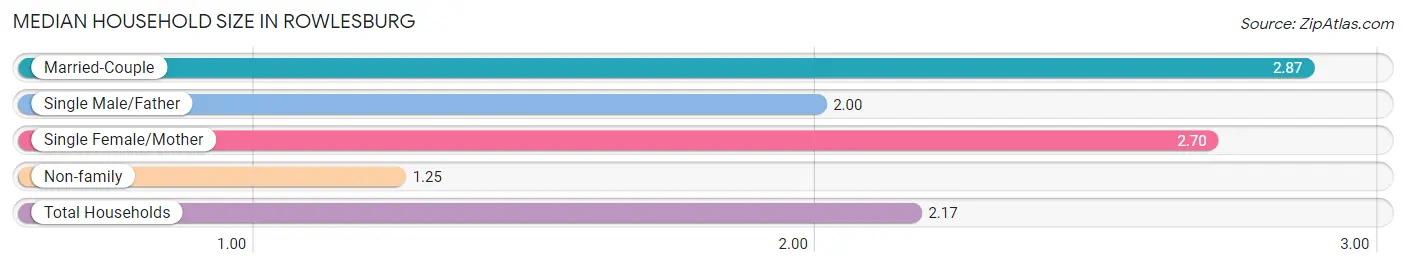
Median Household Size in Rowlesburg
The median household size in Rowlesburg is 2.17 persons per household, with married-couple households (132 | 49.1%) accounting for the largest median household size of 2.87 persons per household. non-family households (112 | 41.6%) represent the smallest median household size with 1.25 persons per household.
| Household Type | # Households | Household Size |
| Married-Couple | 132 (49.1%) | 2.87 |
| Single Male/Father | 2 (0.7%) | 2.00 |
| Single Female/Mother | 23 (8.6%) | 2.70 |
| Non-family | 112 (41.6%) | 1.25 |
| Total Households | 269 (100.0%) | 2.17 |
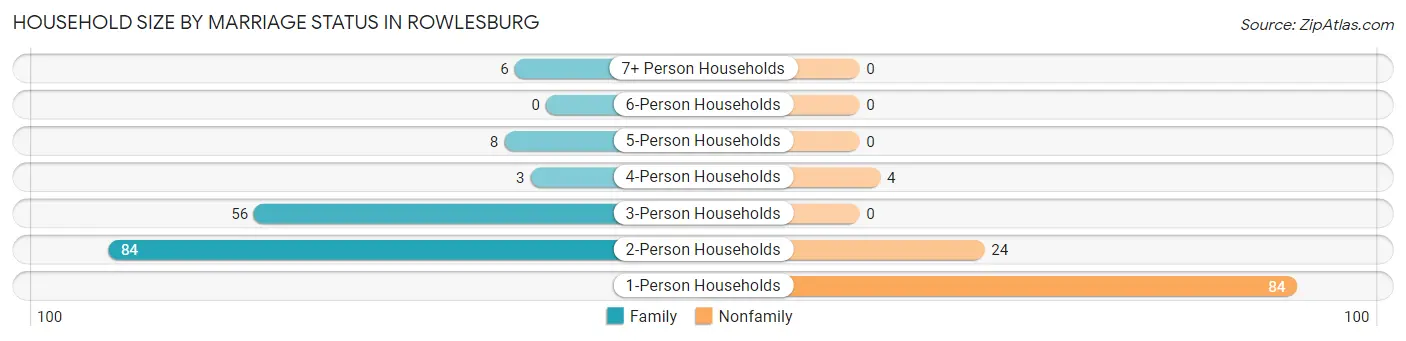
Household Size by Marriage Status in Rowlesburg
Out of a total of 269 households in Rowlesburg, 157 (58.4%) are family households, while 112 (41.6%) are nonfamily households. The most numerous type of family households are 2-person households, comprising 84, and the most common type of nonfamily households are 1-person households, comprising 84.
| Household Size | Family Households | Nonfamily Households |
| 1-Person Households | - | 84 (31.2%) |
| 2-Person Households | 84 (31.2%) | 24 (8.9%) |
| 3-Person Households | 56 (20.8%) | 0 (0.0%) |
| 4-Person Households | 3 (1.1%) | 4 (1.5%) |
| 5-Person Households | 8 (3.0%) | 0 (0.0%) |
| 6-Person Households | 0 (0.0%) | 0 (0.0%) |
| 7+ Person Households | 6 (2.2%) | 0 (0.0%) |
| Total | 157 (58.4%) | 112 (41.6%) |
Female Fertility in Rowlesburg
Fertility by Age in Rowlesburg
| Age Bracket | Women with Births | Births / 1,000 Women |
| 15 to 19 years | 0 (0.0%) | 0.0 |
| 20 to 34 years | 0 (0.0%) | 0.0 |
| 35 to 50 years | 0 (0.0%) | 0.0 |
| Total | 0 (0.0%) | 0.0 |
Fertility by Age by Marriage Status in Rowlesburg
| Age Bracket | Married | Unmarried |
| 15 to 19 years | 0 (0.0%) | 0 (0.0%) |
| 20 to 34 years | 0 (0.0%) | 0 (0.0%) |
| 35 to 50 years | 0 (0.0%) | 0 (0.0%) |
| Total | 0 (0.0%) | 0 (0.0%) |
Fertility by Education in Rowlesburg
| Educational Attainment | Women with Births | Births / 1,000 Women |
| Less than High School | 0 (0.0%) | 0.0 |
| High School Diploma | 0 (0.0%) | 0.0 |
| College or Associate's Degree | 0 (0.0%) | 0.0 |
| Bachelor's Degree | 0 (0.0%) | 0.0 |
| Graduate Degree | 0 (0.0%) | 0.0 |
| Total | 0 (0.0%) | 0.0 |
Fertility by Education by Marriage Status in Rowlesburg
| Educational Attainment | Married | Unmarried |
| Less than High School | 0 (0.0%) | 0 (0.0%) |
| High School Diploma | 0 (0.0%) | 0 (0.0%) |
| College or Associate's Degree | 0 (0.0%) | 0 (0.0%) |
| Bachelor's Degree | 0 (0.0%) | 0 (0.0%) |
| Graduate Degree | 0 (0.0%) | 0 (0.0%) |
| Total | 0 (0.0%) | 0 (0.0%) |
Employment Characteristics in Rowlesburg
Employment by Class of Employer in Rowlesburg
Among the 225 employed individuals in Rowlesburg, private company employees (125 | 55.6%), local government employees (43 | 19.1%), and state government employees (36 | 16.0%) make up the most common classes of employment.
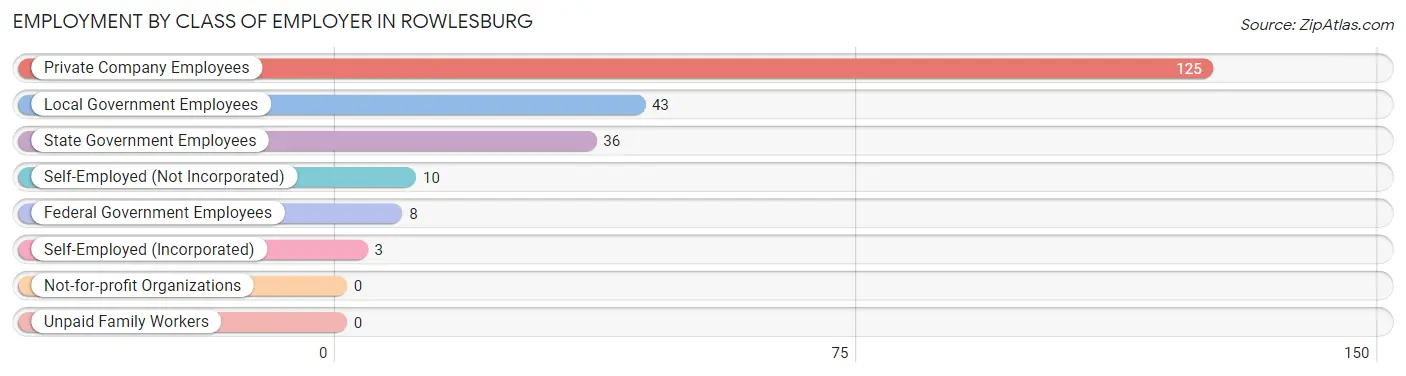
| Employer Class | # Employees | % Employees |
| Private Company Employees | 125 | 55.6% |
| Self-Employed (Incorporated) | 3 | 1.3% |
| Self-Employed (Not Incorporated) | 10 | 4.4% |
| Not-for-profit Organizations | 0 | 0.0% |
| Local Government Employees | 43 | 19.1% |
| State Government Employees | 36 | 16.0% |
| Federal Government Employees | 8 | 3.6% |
| Unpaid Family Workers | 0 | 0.0% |
| Total | 225 | 100.0% |
Employment Status by Age in Rowlesburg
According to the labor force statistics for Rowlesburg, out of the total population over 16 years of age (533), 49.9% or 266 individuals are in the labor force, with 15.4% or 41 of them unemployed. The age group with the highest labor force participation rate is 25 to 29 years, with 89.6% or 60 individuals in the labor force. Within the labor force, the 25 to 29 years age range has the highest percentage of unemployed individuals, with 65.0% or 39 of them being unemployed.
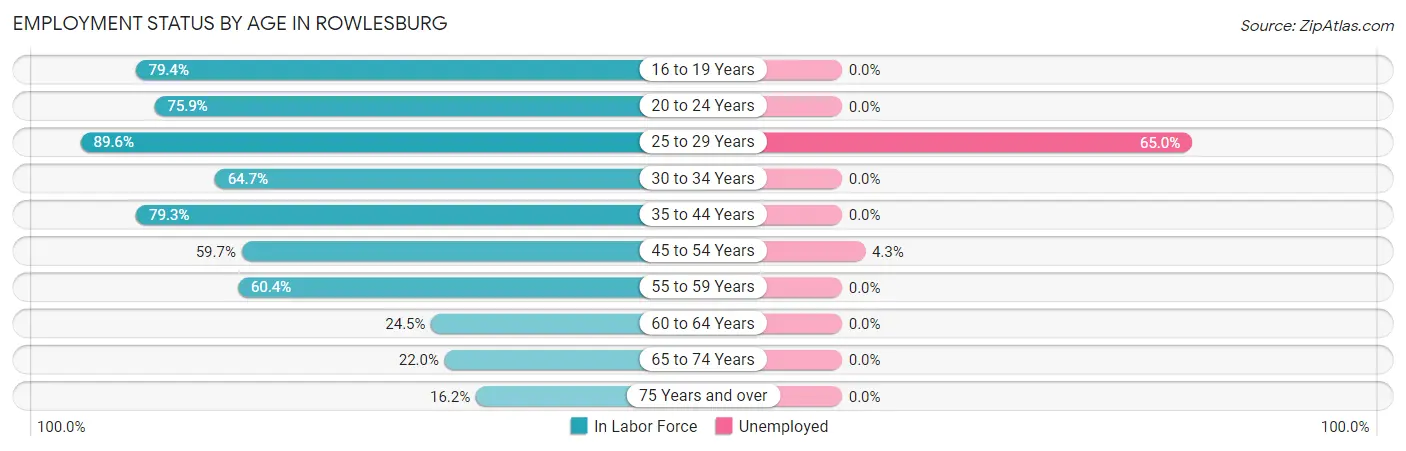
| Age Bracket | In Labor Force | Unemployed |
| 16 to 19 Years | 27 (79.4%) | 0 (0.0%) |
| 20 to 24 Years | 22 (75.9%) | 0 (0.0%) |
| 25 to 29 Years | 60 (89.6%) | 39 (65.0%) |
| 30 to 34 Years | 11 (64.7%) | 0 (0.0%) |
| 35 to 44 Years | 23 (79.3%) | 0 (0.0%) |
| 45 to 54 Years | 46 (59.7%) | 2 (4.3%) |
| 55 to 59 Years | 29 (60.4%) | 0 (0.0%) |
| 60 to 64 Years | 12 (24.5%) | 0 (0.0%) |
| 65 to 74 Years | 24 (22.0%) | 0 (0.0%) |
| 75 Years and over | 12 (16.2%) | 0 (0.0%) |
| Total | 266 (49.9%) | 41 (15.4%) |
Employment Status by Educational Attainment in Rowlesburg
According to labor force statistics for Rowlesburg, 63.1% of individuals (181) out of the total population between 25 and 64 years of age (287) are in the labor force, with 22.7% or 41 of them being unemployed. The group with the highest labor force participation rate are those with the educational attainment of college / associate degree, with 72.0% or 36 individuals in the labor force. Within the labor force, individuals with less than high school education have the highest percentage of unemployment, with 76.5% or 39 of them being unemployed.
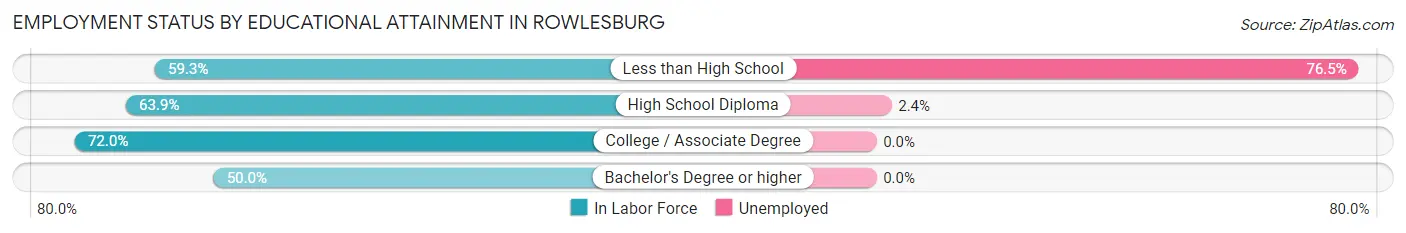
| Educational Attainment | In Labor Force | Unemployed |
| Less than High School | 51 (59.3%) | 66 (76.5%) |
| High School Diploma | 85 (63.9%) | 3 (2.4%) |
| College / Associate Degree | 36 (72.0%) | 0 (0.0%) |
| Bachelor's Degree or higher | 9 (50.0%) | 0 (0.0%) |
| Total | 181 (63.1%) | 65 (22.7%) |
Employment Occupations by Sex in Rowlesburg
Management, Business, Science and Arts Occupations
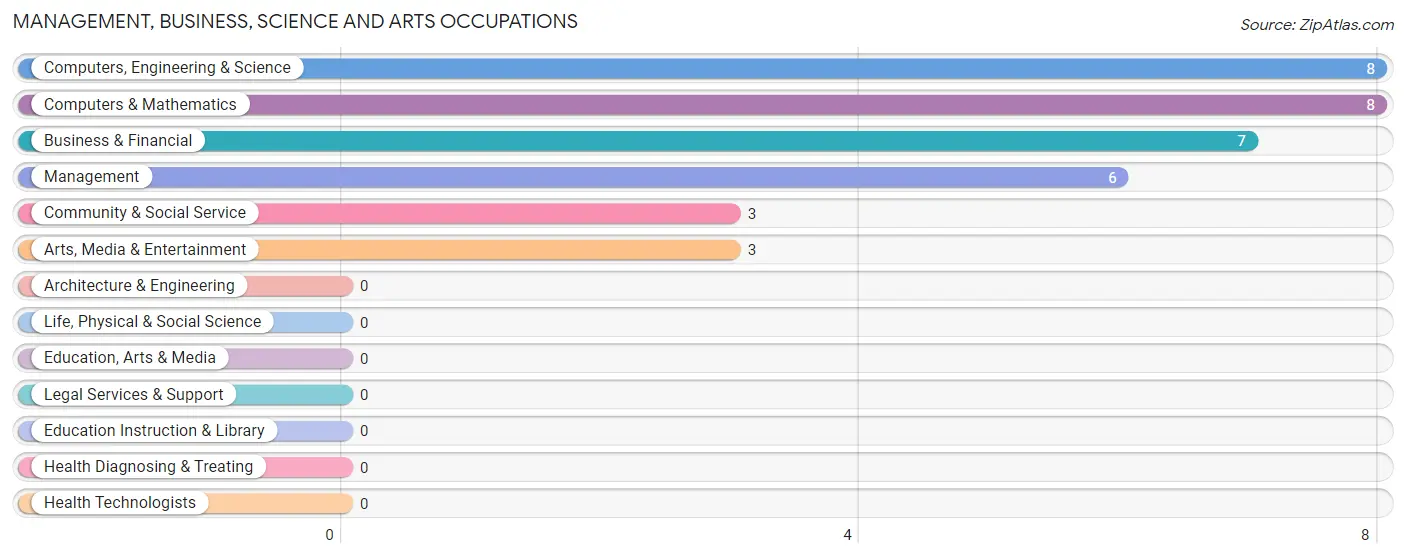
The most common Management, Business, Science and Arts occupations in Rowlesburg are Computers, Engineering & Science (8 | 3.6%), Computers & Mathematics (8 | 3.6%), Business & Financial (7 | 3.1%), Management (6 | 2.7%), and Community & Social Service (3 | 1.3%).
Management, Business, Science and Arts Occupations by Sex
Within the Management, Business, Science and Arts occupations in Rowlesburg, the most male-oriented occupations are Business & Financial (100.0%), Computers, Engineering & Science (75.0%), and Computers & Mathematics (75.0%), while the most female-oriented occupations are Management (100.0%), Community & Social Service (100.0%), and Arts, Media & Entertainment (100.0%).
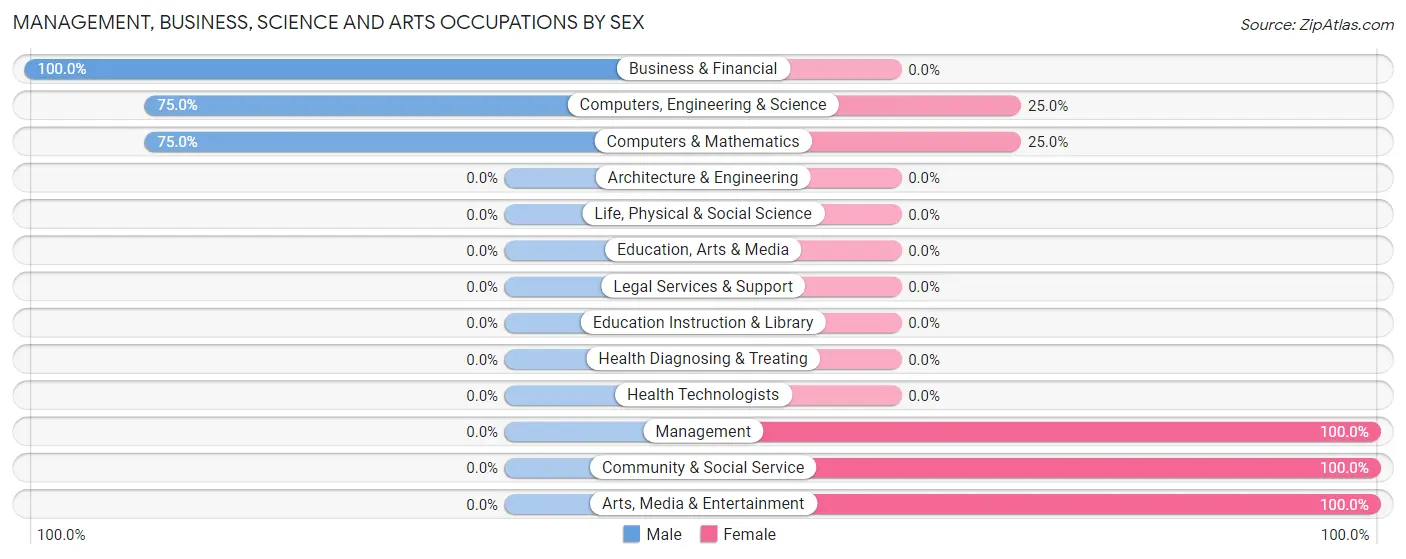
| Occupation | Male | Female |
| Management | 0 (0.0%) | 6 (100.0%) |
| Business & Financial | 7 (100.0%) | 0 (0.0%) |
| Computers, Engineering & Science | 6 (75.0%) | 2 (25.0%) |
| Computers & Mathematics | 6 (75.0%) | 2 (25.0%) |
| Architecture & Engineering | 0 (0.0%) | 0 (0.0%) |
| Life, Physical & Social Science | 0 (0.0%) | 0 (0.0%) |
| Community & Social Service | 0 (0.0%) | 3 (100.0%) |
| Education, Arts & Media | 0 (0.0%) | 0 (0.0%) |
| Legal Services & Support | 0 (0.0%) | 0 (0.0%) |
| Education Instruction & Library | 0 (0.0%) | 0 (0.0%) |
| Arts, Media & Entertainment | 0 (0.0%) | 3 (100.0%) |
| Health Diagnosing & Treating | 0 (0.0%) | 0 (0.0%) |
| Health Technologists | 0 (0.0%) | 0 (0.0%) |
| Total (Category) | 13 (54.2%) | 11 (45.8%) |
| Total (Overall) | 128 (56.9%) | 97 (43.1%) |
Services Occupations
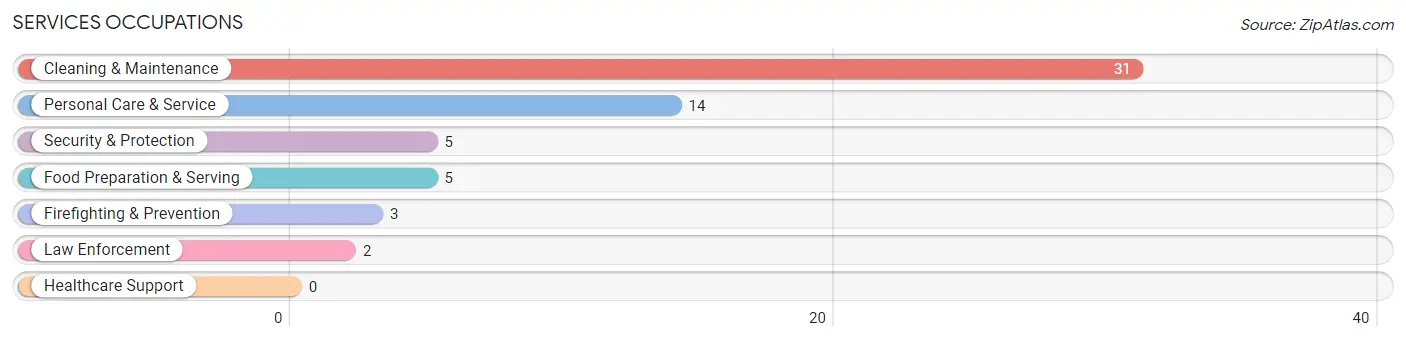
The most common Services occupations in Rowlesburg are Cleaning & Maintenance (31 | 13.8%), Personal Care & Service (14 | 6.2%), Security & Protection (5 | 2.2%), Food Preparation & Serving (5 | 2.2%), and Firefighting & Prevention (3 | 1.3%).
Services Occupations by Sex
Within the Services occupations in Rowlesburg, the most male-oriented occupations are Security & Protection (100.0%), Firefighting & Prevention (100.0%), and Law Enforcement (100.0%), while the most female-oriented occupations are Food Preparation & Serving (100.0%), Personal Care & Service (100.0%), and Cleaning & Maintenance (41.9%).
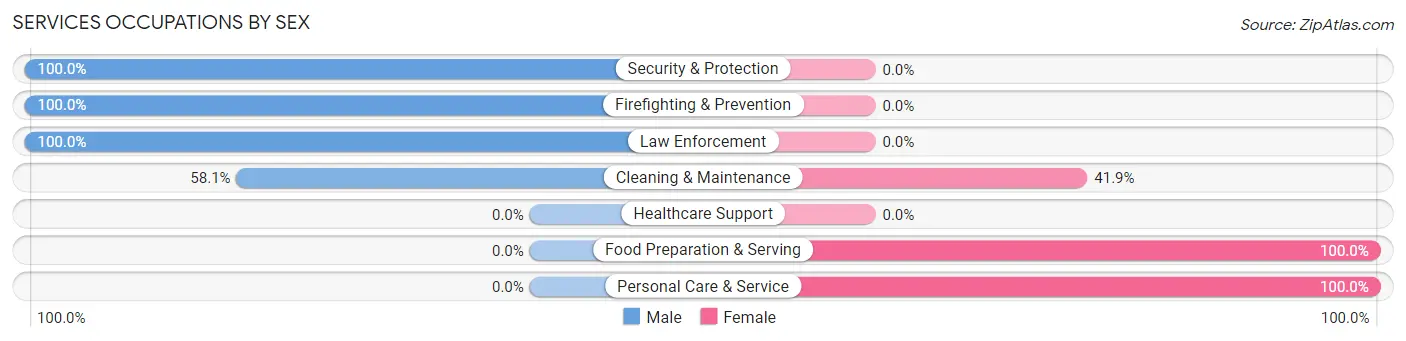
| Occupation | Male | Female |
| Healthcare Support | 0 (0.0%) | 0 (0.0%) |
| Security & Protection | 5 (100.0%) | 0 (0.0%) |
| Firefighting & Prevention | 3 (100.0%) | 0 (0.0%) |
| Law Enforcement | 2 (100.0%) | 0 (0.0%) |
| Food Preparation & Serving | 0 (0.0%) | 5 (100.0%) |
| Cleaning & Maintenance | 18 (58.1%) | 13 (41.9%) |
| Personal Care & Service | 0 (0.0%) | 14 (100.0%) |
| Total (Category) | 23 (41.8%) | 32 (58.2%) |
| Total (Overall) | 128 (56.9%) | 97 (43.1%) |
Sales and Office Occupations
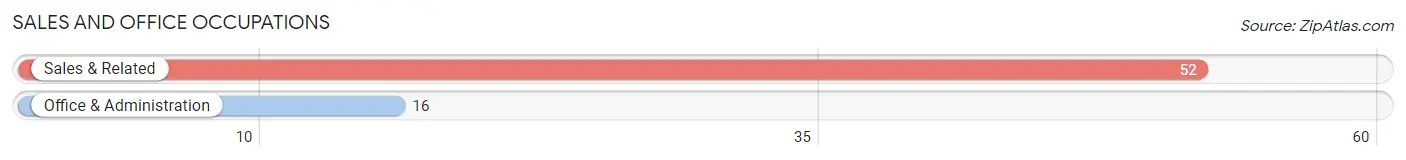
The most common Sales and Office occupations in Rowlesburg are Sales & Related (52 | 23.1%), and Office & Administration (16 | 7.1%).
Sales and Office Occupations by Sex
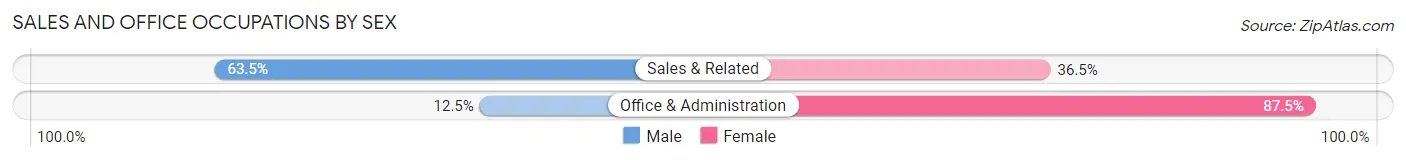
| Occupation | Male | Female |
| Sales & Related | 33 (63.5%) | 19 (36.5%) |
| Office & Administration | 2 (12.5%) | 14 (87.5%) |
| Total (Category) | 35 (51.5%) | 33 (48.5%) |
| Total (Overall) | 128 (56.9%) | 97 (43.1%) |
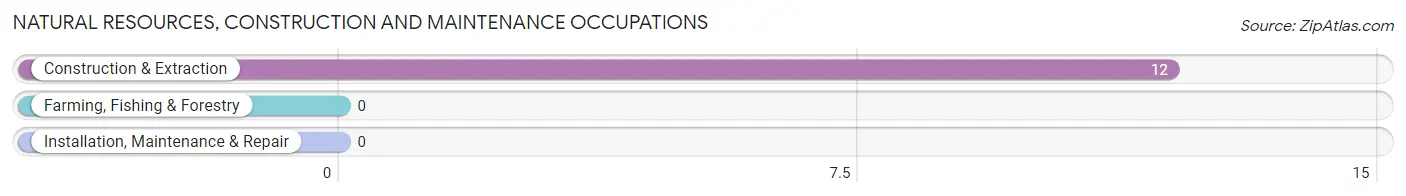
Natural Resources, Construction and Maintenance Occupations
The most common Natural Resources, Construction and Maintenance occupations in Rowlesburg are , and Construction & Extraction (12 | 5.3%).
Natural Resources, Construction and Maintenance Occupations by Sex
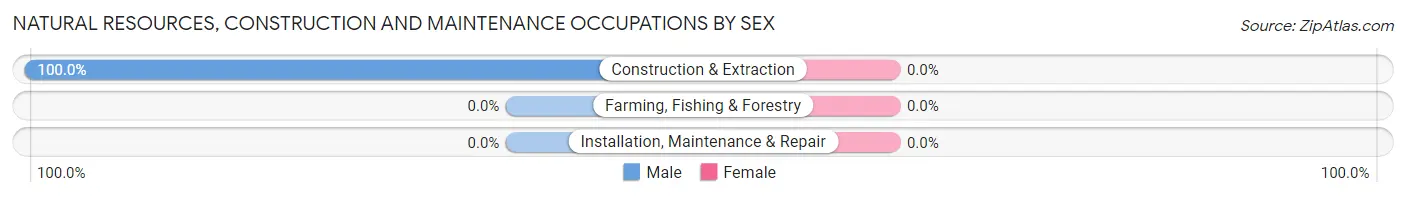
| Occupation | Male | Female |
| Farming, Fishing & Forestry | 0 (0.0%) | 0 (0.0%) |
| Construction & Extraction | 12 (100.0%) | 0 (0.0%) |
| Installation, Maintenance & Repair | 0 (0.0%) | 0 (0.0%) |
| Total (Category) | 12 (100.0%) | 0 (0.0%) |
| Total (Overall) | 128 (56.9%) | 97 (43.1%) |
Production, Transportation and Moving Occupations
The most common Production, Transportation and Moving occupations in Rowlesburg are Production (33 | 14.7%), Material Moving (21 | 9.3%), and Transportation (12 | 5.3%).
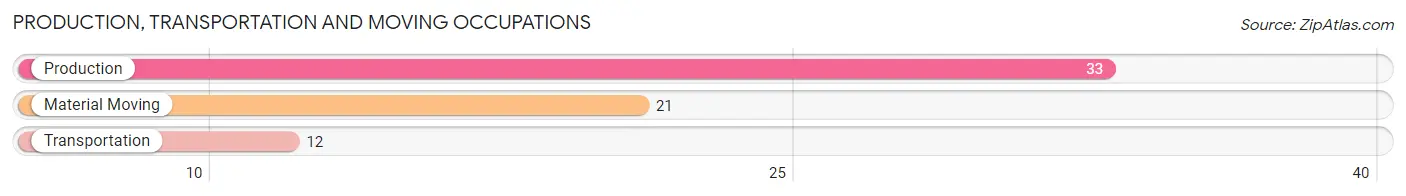
Production, Transportation and Moving Occupations by Sex
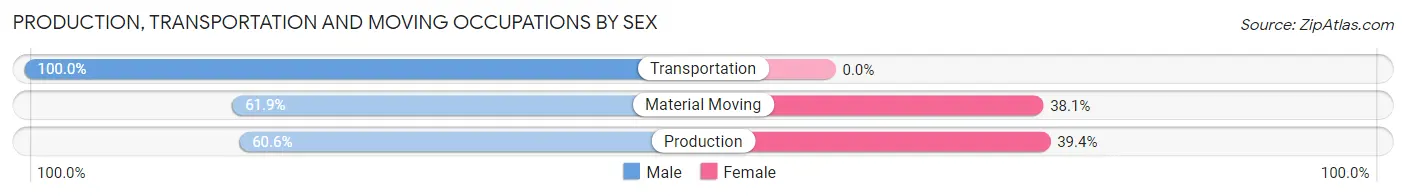
| Occupation | Male | Female |
| Production | 20 (60.6%) | 13 (39.4%) |
| Transportation | 12 (100.0%) | 0 (0.0%) |
| Material Moving | 13 (61.9%) | 8 (38.1%) |
| Total (Category) | 45 (68.2%) | 21 (31.8%) |
| Total (Overall) | 128 (56.9%) | 97 (43.1%) |
Employment Industries by Sex in Rowlesburg
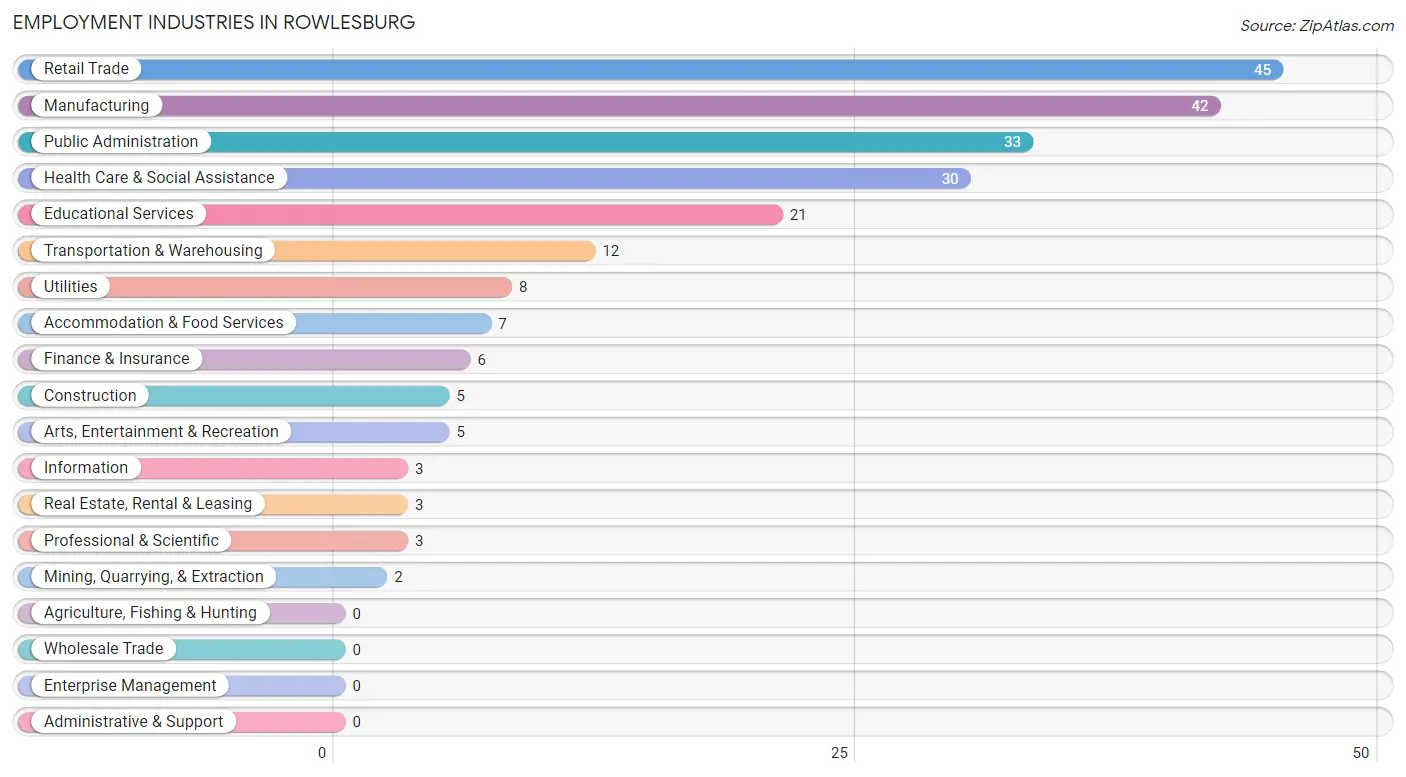
Employment Industries in Rowlesburg
The major employment industries in Rowlesburg include Retail Trade (45 | 20.0%), Manufacturing (42 | 18.7%), Public Administration (33 | 14.7%), Health Care & Social Assistance (30 | 13.3%), and Educational Services (21 | 9.3%).
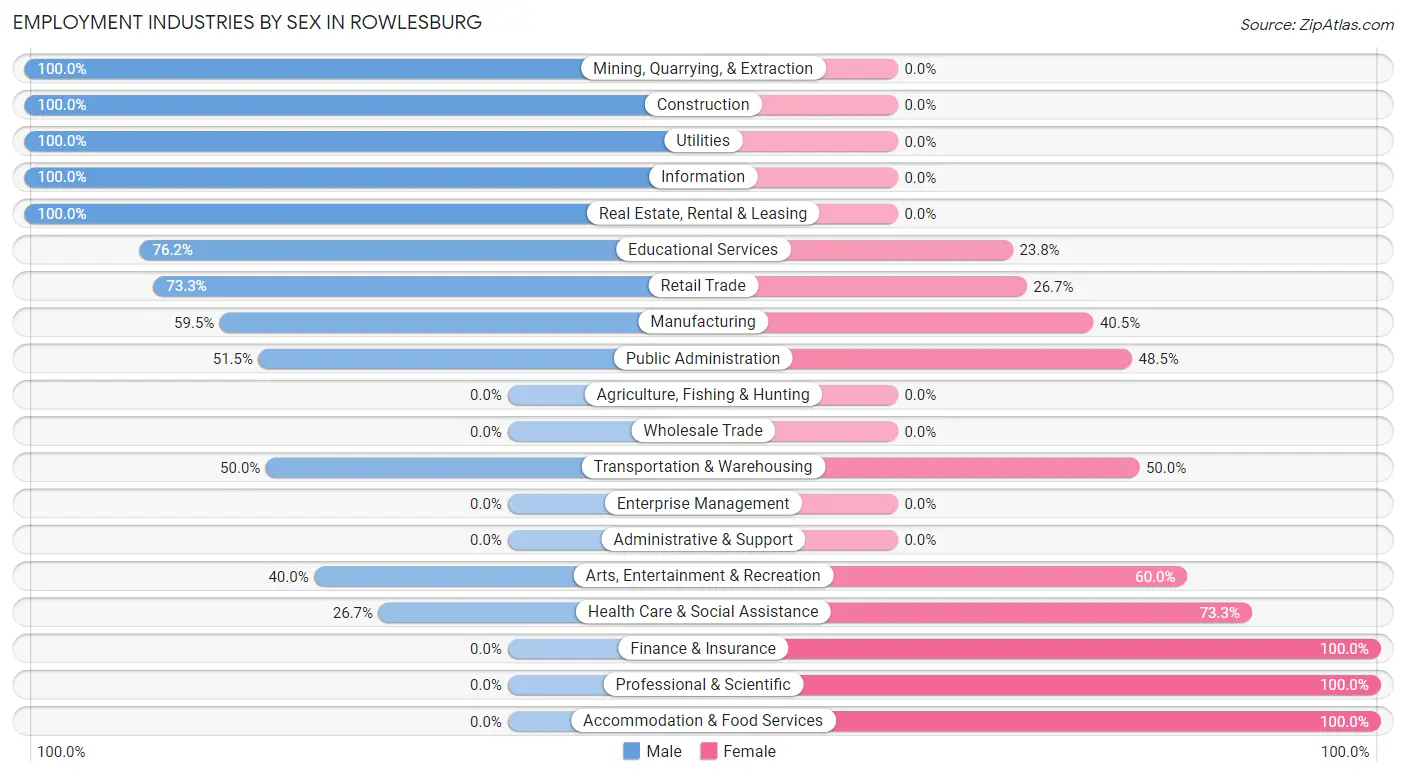
Employment Industries by Sex in Rowlesburg
The Rowlesburg industries that see more men than women are Mining, Quarrying, & Extraction (100.0%), Construction (100.0%), and Utilities (100.0%), whereas the industries that tend to have a higher number of women are Finance & Insurance (100.0%), Professional & Scientific (100.0%), and Accommodation & Food Services (100.0%).
| Industry | Male | Female |
| Agriculture, Fishing & Hunting | 0 (0.0%) | 0 (0.0%) |
| Mining, Quarrying, & Extraction | 2 (100.0%) | 0 (0.0%) |
| Construction | 5 (100.0%) | 0 (0.0%) |
| Manufacturing | 25 (59.5%) | 17 (40.5%) |
| Wholesale Trade | 0 (0.0%) | 0 (0.0%) |
| Retail Trade | 33 (73.3%) | 12 (26.7%) |
| Transportation & Warehousing | 6 (50.0%) | 6 (50.0%) |
| Utilities | 8 (100.0%) | 0 (0.0%) |
| Information | 3 (100.0%) | 0 (0.0%) |
| Finance & Insurance | 0 (0.0%) | 6 (100.0%) |
| Real Estate, Rental & Leasing | 3 (100.0%) | 0 (0.0%) |
| Professional & Scientific | 0 (0.0%) | 3 (100.0%) |
| Enterprise Management | 0 (0.0%) | 0 (0.0%) |
| Administrative & Support | 0 (0.0%) | 0 (0.0%) |
| Educational Services | 16 (76.2%) | 5 (23.8%) |
| Health Care & Social Assistance | 8 (26.7%) | 22 (73.3%) |
| Arts, Entertainment & Recreation | 2 (40.0%) | 3 (60.0%) |
| Accommodation & Food Services | 0 (0.0%) | 7 (100.0%) |
| Public Administration | 17 (51.5%) | 16 (48.5%) |
| Total | 128 (56.9%) | 97 (43.1%) |
Education in Rowlesburg
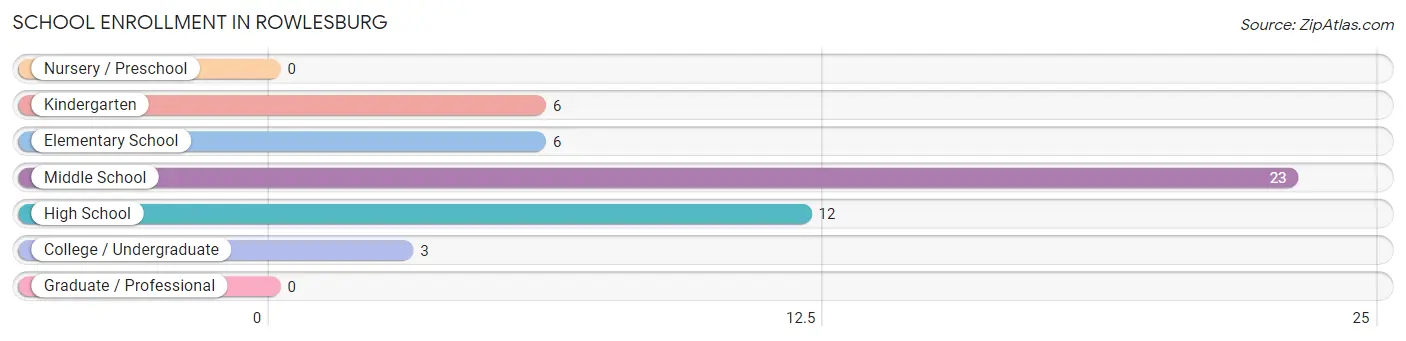
School Enrollment in Rowlesburg
The most common levels of schooling among the 50 students in Rowlesburg are middle school (23 | 46.0%), high school (12 | 24.0%), and kindergarten (6 | 12.0%).
| School Level | # Students | % Students |
| Nursery / Preschool | 0 | 0.0% |
| Kindergarten | 6 | 12.0% |
| Elementary School | 6 | 12.0% |
| Middle School | 23 | 46.0% |
| High School | 12 | 24.0% |
| College / Undergraduate | 3 | 6.0% |
| Graduate / Professional | 0 | 0.0% |
| Total | 50 | 100.0% |
School Enrollment by Age by Funding Source in Rowlesburg
Out of a total of 50 students who are enrolled in schools in Rowlesburg, 10 (20.0%) attend a private institution, while the remaining 40 (80.0%) are enrolled in public schools. The age group of 15 to 17 year olds has the highest likelihood of being enrolled in private schools, with 3 (33.3% in the age bracket) enrolled. Conversely, the age group of 5 to 9 year old has the lowest likelihood of being enrolled in a private school, with 12 (100.0% in the age bracket) attending a public institution.
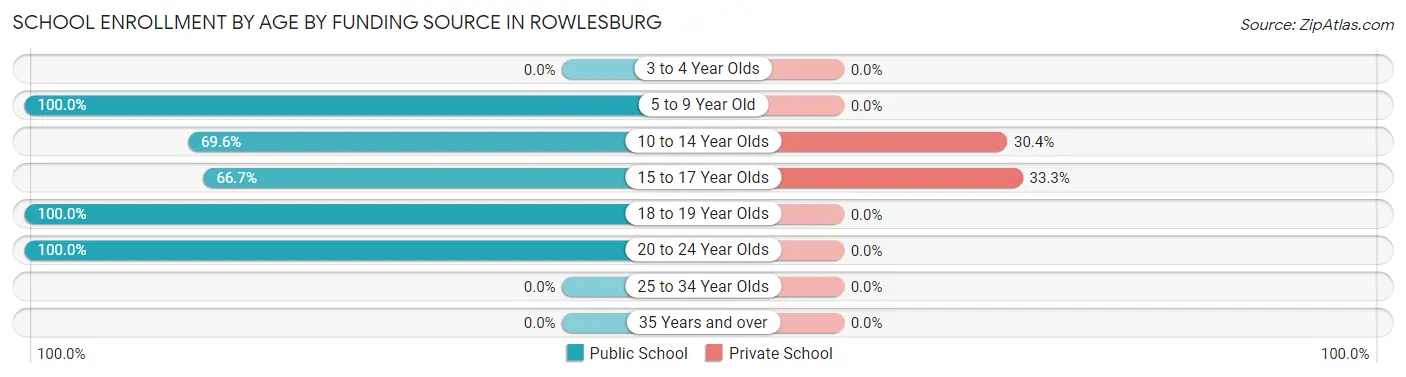
| Age Bracket | Public School | Private School |
| 3 to 4 Year Olds | 0 (0.0%) | 0 (0.0%) |
| 5 to 9 Year Old | 12 (100.0%) | 0 (0.0%) |
| 10 to 14 Year Olds | 16 (69.6%) | 7 (30.4%) |
| 15 to 17 Year Olds | 6 (66.7%) | 3 (33.3%) |
| 18 to 19 Year Olds | 3 (100.0%) | 0 (0.0%) |
| 20 to 24 Year Olds | 3 (100.0%) | 0 (0.0%) |
| 25 to 34 Year Olds | 0 (0.0%) | 0 (0.0%) |
| 35 Years and over | 0 (0.0%) | 0 (0.0%) |
| Total | 40 (80.0%) | 10 (20.0%) |
Educational Attainment by Field of Study in Rowlesburg
Social sciences (16 | 30.2%), education (16 | 30.2%), business (13 | 24.5%), liberal arts & history (3 | 5.7%), and communications (3 | 5.7%) are the most common fields of study among 53 individuals in Rowlesburg who have obtained a bachelor's degree or higher.
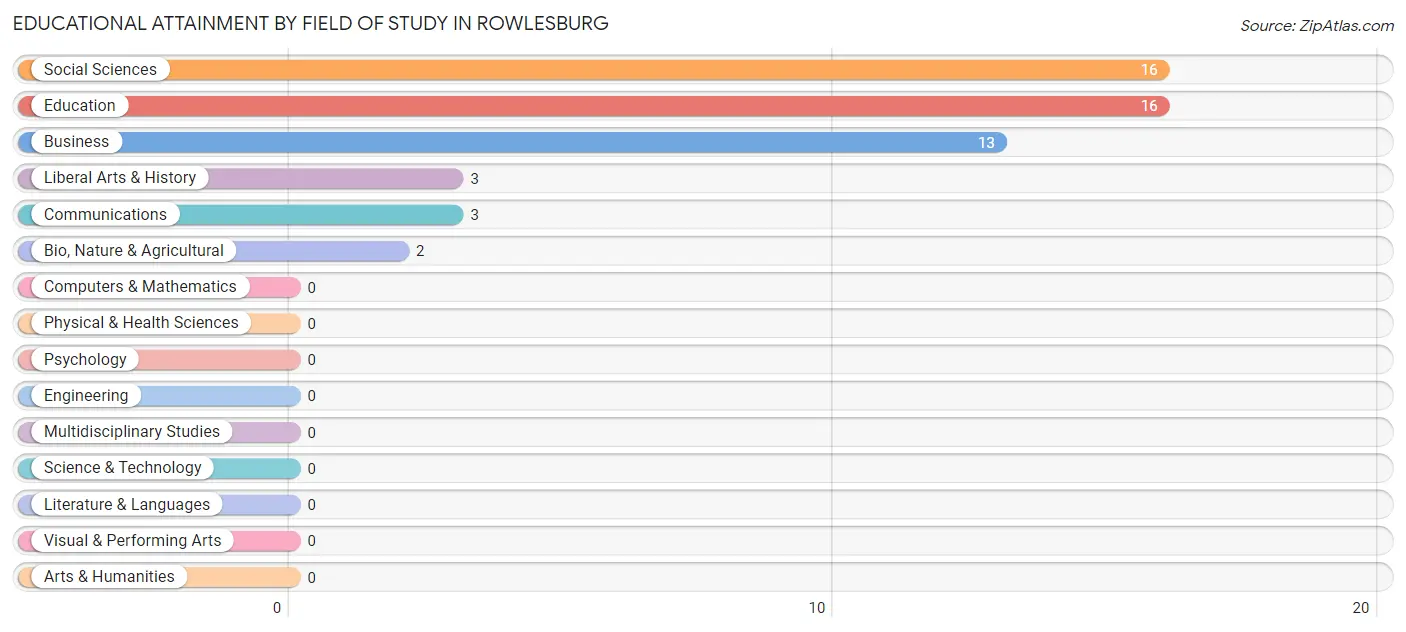
| Field of Study | # Graduates | % Graduates |
| Computers & Mathematics | 0 | 0.0% |
| Bio, Nature & Agricultural | 2 | 3.8% |
| Physical & Health Sciences | 0 | 0.0% |
| Psychology | 0 | 0.0% |
| Social Sciences | 16 | 30.2% |
| Engineering | 0 | 0.0% |
| Multidisciplinary Studies | 0 | 0.0% |
| Science & Technology | 0 | 0.0% |
| Business | 13 | 24.5% |
| Education | 16 | 30.2% |
| Literature & Languages | 0 | 0.0% |
| Liberal Arts & History | 3 | 5.7% |
| Visual & Performing Arts | 0 | 0.0% |
| Communications | 3 | 5.7% |
| Arts & Humanities | 0 | 0.0% |
| Total | 53 | 100.0% |
Transportation & Commute in Rowlesburg
Vehicle Availability by Sex in Rowlesburg
The most prevalent vehicle ownership categories in Rowlesburg are males with 2 vehicles (42, accounting for 32.8%) and females with 2 vehicles (30, making up 43.3%).
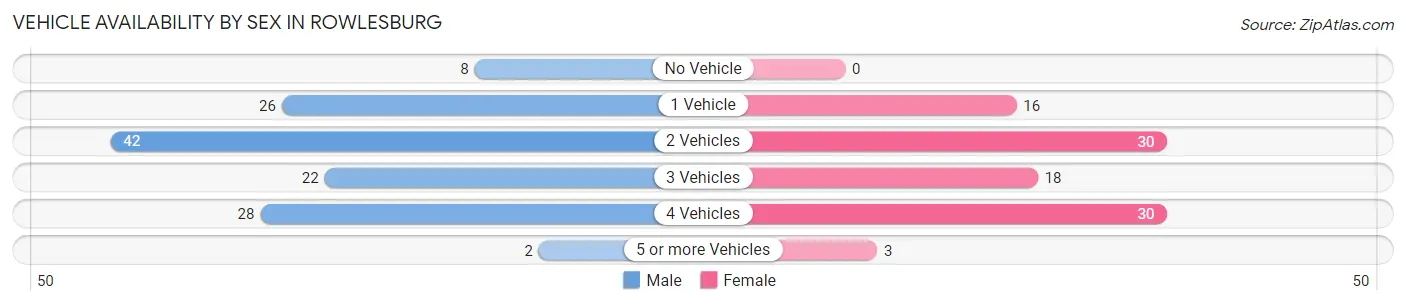
| Vehicles Available | Male | Female |
| No Vehicle | 8 (6.2%) | 0 (0.0%) |
| 1 Vehicle | 26 (20.3%) | 16 (16.5%) |
| 2 Vehicles | 42 (32.8%) | 30 (30.9%) |
| 3 Vehicles | 22 (17.2%) | 18 (18.6%) |
| 4 Vehicles | 28 (21.9%) | 30 (30.9%) |
| 5 or more Vehicles | 2 (1.6%) | 3 (3.1%) |
| Total | 128 (100.0%) | 97 (100.0%) |
Commute Time in Rowlesburg
The most frequently occuring commute durations in Rowlesburg are 30 to 34 minutes (51 commuters, 23.1%), 25 to 29 minutes (40 commuters, 18.1%), and 5 to 9 minutes (35 commuters, 15.8%).
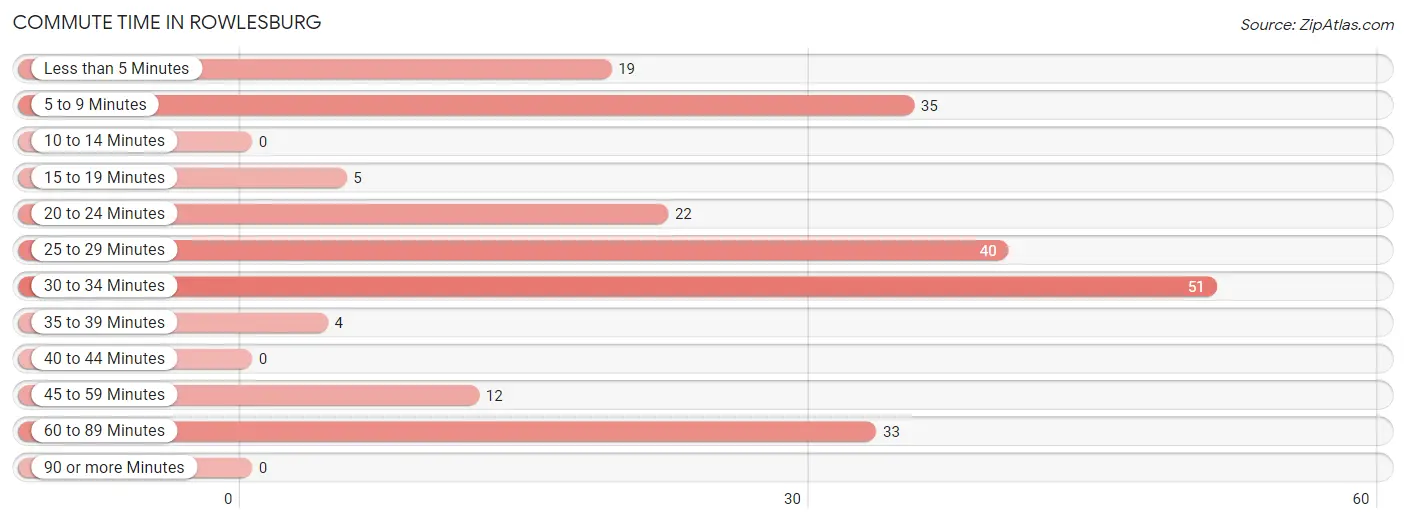
| Commute Time | # Commuters | % Commuters |
| Less than 5 Minutes | 19 | 8.6% |
| 5 to 9 Minutes | 35 | 15.8% |
| 10 to 14 Minutes | 0 | 0.0% |
| 15 to 19 Minutes | 5 | 2.3% |
| 20 to 24 Minutes | 22 | 10.0% |
| 25 to 29 Minutes | 40 | 18.1% |
| 30 to 34 Minutes | 51 | 23.1% |
| 35 to 39 Minutes | 4 | 1.8% |
| 40 to 44 Minutes | 0 | 0.0% |
| 45 to 59 Minutes | 12 | 5.4% |
| 60 to 89 Minutes | 33 | 14.9% |
| 90 or more Minutes | 0 | 0.0% |
Commute Time by Sex in Rowlesburg
The most common commute times in Rowlesburg are 5 to 9 minutes (29 commuters, 23.4%) for males and 30 to 34 minutes (27 commuters, 27.8%) for females.
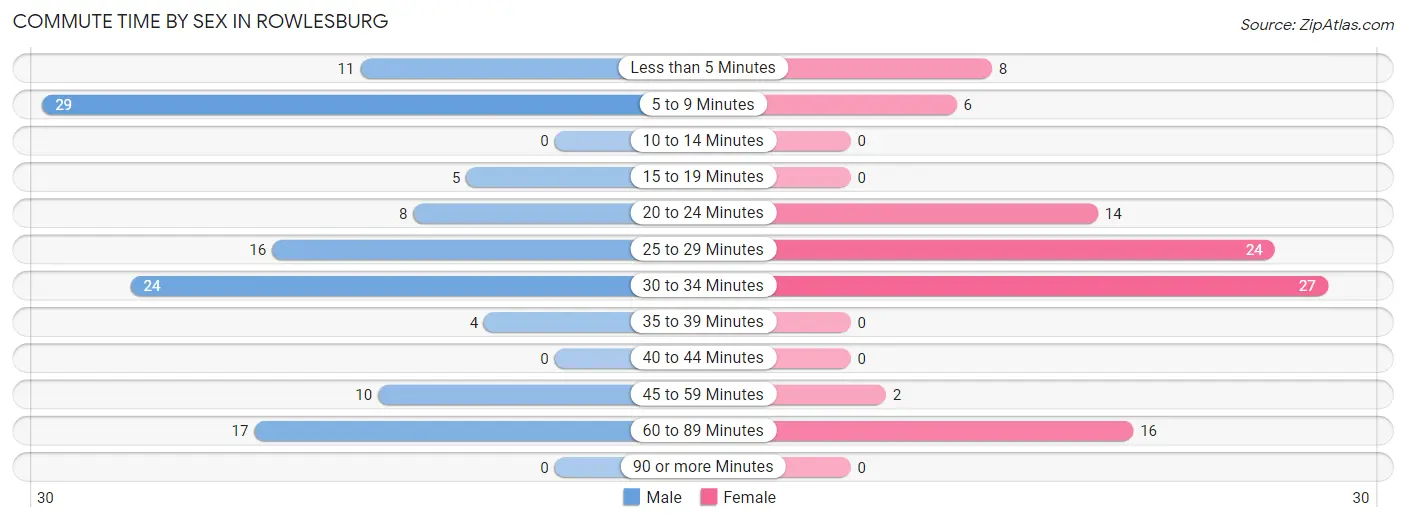
| Commute Time | Male | Female |
| Less than 5 Minutes | 11 (8.9%) | 8 (8.3%) |
| 5 to 9 Minutes | 29 (23.4%) | 6 (6.2%) |
| 10 to 14 Minutes | 0 (0.0%) | 0 (0.0%) |
| 15 to 19 Minutes | 5 (4.0%) | 0 (0.0%) |
| 20 to 24 Minutes | 8 (6.5%) | 14 (14.4%) |
| 25 to 29 Minutes | 16 (12.9%) | 24 (24.7%) |
| 30 to 34 Minutes | 24 (19.4%) | 27 (27.8%) |
| 35 to 39 Minutes | 4 (3.2%) | 0 (0.0%) |
| 40 to 44 Minutes | 0 (0.0%) | 0 (0.0%) |
| 45 to 59 Minutes | 10 (8.1%) | 2 (2.1%) |
| 60 to 89 Minutes | 17 (13.7%) | 16 (16.5%) |
| 90 or more Minutes | 0 (0.0%) | 0 (0.0%) |
Time of Departure to Work by Sex in Rowlesburg
The most frequent times of departure to work in Rowlesburg are 12:00 PM to 3:59 PM (28, 22.6%) for males and 6:30 AM to 6:59 AM (23, 23.7%) for females.
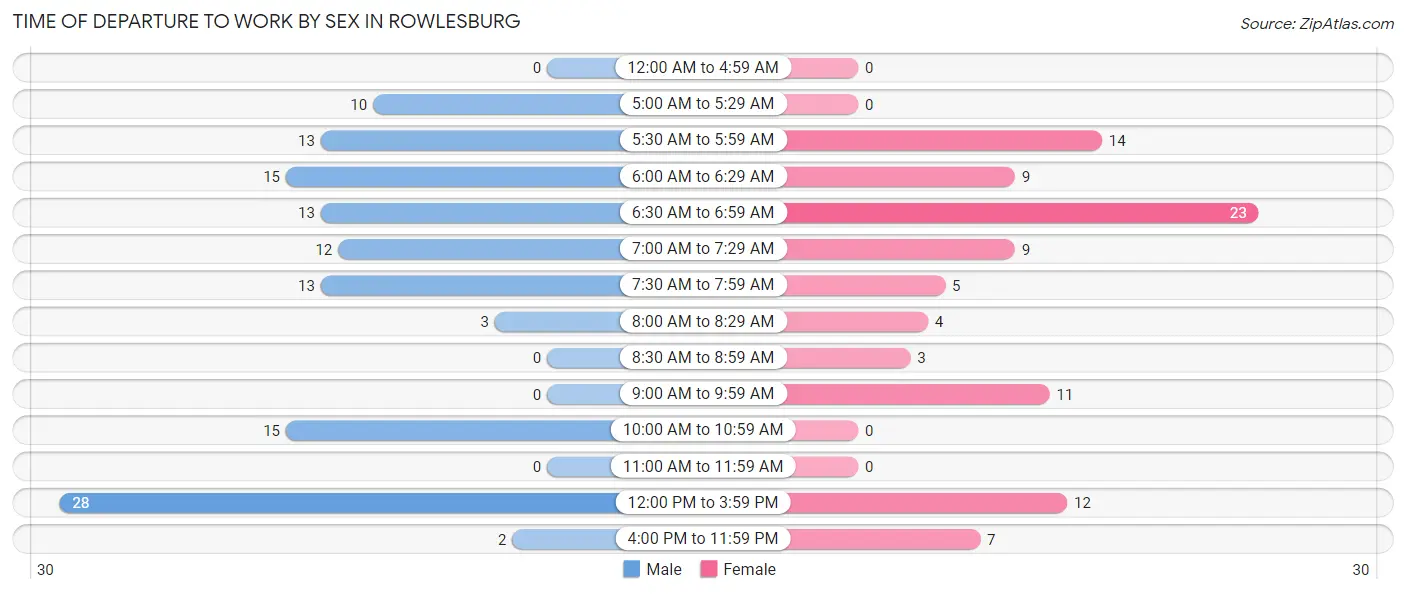
| Time of Departure | Male | Female |
| 12:00 AM to 4:59 AM | 0 (0.0%) | 0 (0.0%) |
| 5:00 AM to 5:29 AM | 10 (8.1%) | 0 (0.0%) |
| 5:30 AM to 5:59 AM | 13 (10.5%) | 14 (14.4%) |
| 6:00 AM to 6:29 AM | 15 (12.1%) | 9 (9.3%) |
| 6:30 AM to 6:59 AM | 13 (10.5%) | 23 (23.7%) |
| 7:00 AM to 7:29 AM | 12 (9.7%) | 9 (9.3%) |
| 7:30 AM to 7:59 AM | 13 (10.5%) | 5 (5.1%) |
| 8:00 AM to 8:29 AM | 3 (2.4%) | 4 (4.1%) |
| 8:30 AM to 8:59 AM | 0 (0.0%) | 3 (3.1%) |
| 9:00 AM to 9:59 AM | 0 (0.0%) | 11 (11.3%) |
| 10:00 AM to 10:59 AM | 15 (12.1%) | 0 (0.0%) |
| 11:00 AM to 11:59 AM | 0 (0.0%) | 0 (0.0%) |
| 12:00 PM to 3:59 PM | 28 (22.6%) | 12 (12.4%) |
| 4:00 PM to 11:59 PM | 2 (1.6%) | 7 (7.2%) |
| Total | 124 (100.0%) | 97 (100.0%) |
Housing Occupancy in Rowlesburg
Occupancy by Ownership in Rowlesburg
Of the total 269 dwellings in Rowlesburg, owner-occupied units account for 207 (76.9%), while renter-occupied units make up 62 (23.1%).
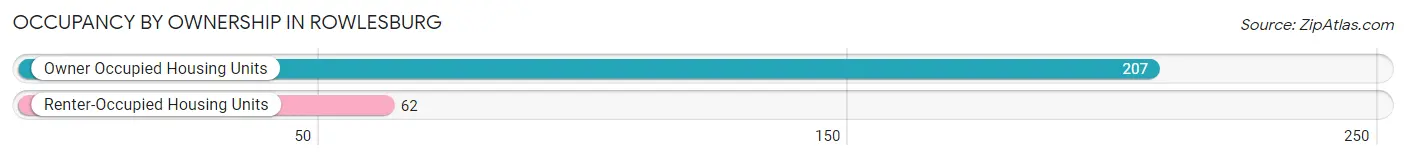
| Occupancy | # Housing Units | % Housing Units |
| Owner Occupied Housing Units | 207 | 76.9% |
| Renter-Occupied Housing Units | 62 | 23.1% |
| Total Occupied Housing Units | 269 | 100.0% |
Occupancy by Household Size in Rowlesburg
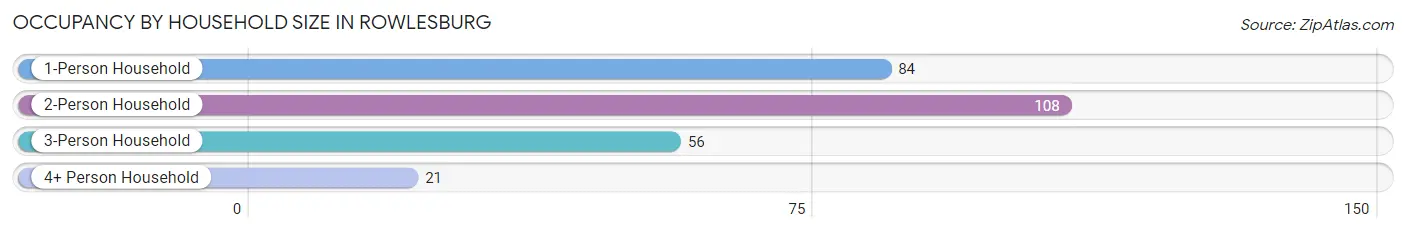
| Household Size | # Housing Units | % Housing Units |
| 1-Person Household | 84 | 31.2% |
| 2-Person Household | 108 | 40.2% |
| 3-Person Household | 56 | 20.8% |
| 4+ Person Household | 21 | 7.8% |
| Total Housing Units | 269 | 100.0% |
Occupancy by Ownership by Household Size in Rowlesburg
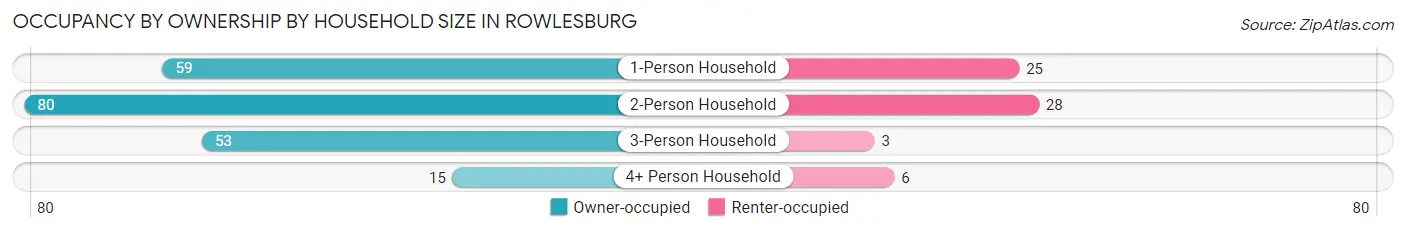
| Household Size | Owner-occupied | Renter-occupied |
| 1-Person Household | 59 (70.2%) | 25 (29.8%) |
| 2-Person Household | 80 (74.1%) | 28 (25.9%) |
| 3-Person Household | 53 (94.6%) | 3 (5.4%) |
| 4+ Person Household | 15 (71.4%) | 6 (28.6%) |
| Total Housing Units | 207 (76.9%) | 62 (23.1%) |
Occupancy by Educational Attainment in Rowlesburg
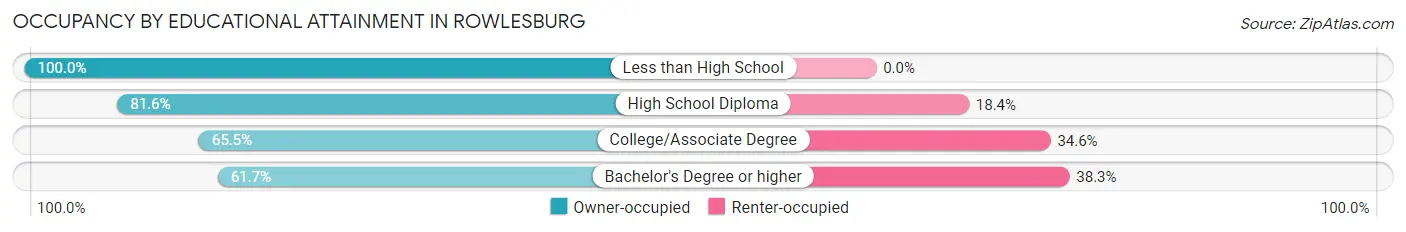
| Household Size | Owner-occupied | Renter-occupied |
| Less than High School | 31 (100.0%) | 0 (0.0%) |
| High School Diploma | 111 (81.6%) | 25 (18.4%) |
| College/Associate Degree | 36 (65.4%) | 19 (34.5%) |
| Bachelor's Degree or higher | 29 (61.7%) | 18 (38.3%) |
Occupancy by Age of Householder in Rowlesburg
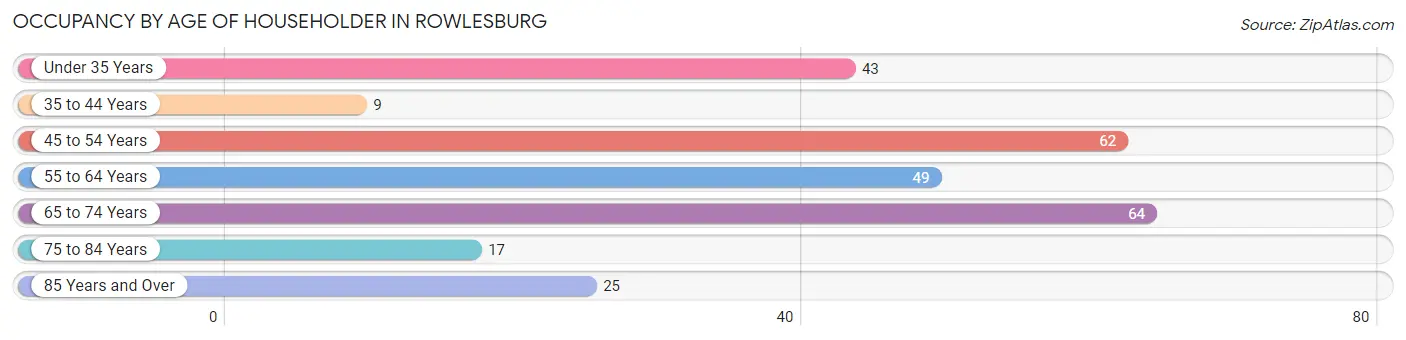
| Age Bracket | # Households | % Households |
| Under 35 Years | 43 | 16.0% |
| 35 to 44 Years | 9 | 3.4% |
| 45 to 54 Years | 62 | 23.1% |
| 55 to 64 Years | 49 | 18.2% |
| 65 to 74 Years | 64 | 23.8% |
| 75 to 84 Years | 17 | 6.3% |
| 85 Years and Over | 25 | 9.3% |
| Total | 269 | 100.0% |
Housing Finances in Rowlesburg
Median Income by Occupancy in Rowlesburg
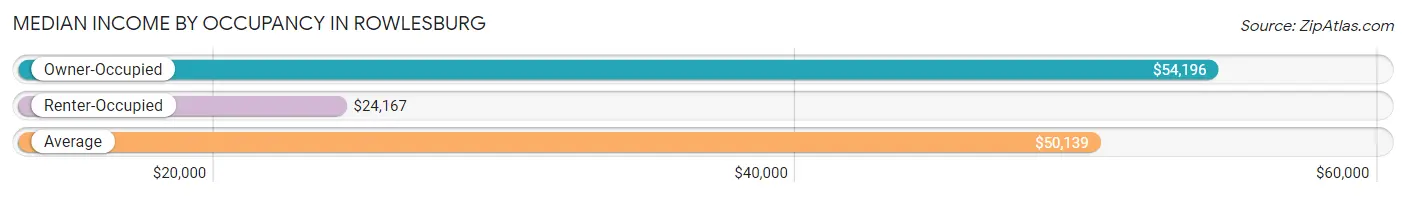
| Occupancy Type | # Households | Median Income |
| Owner-Occupied | 207 (76.9%) | $54,196 |
| Renter-Occupied | 62 (23.1%) | $24,167 |
| Average | 269 (100.0%) | $50,139 |
Occupancy by Householder Income Bracket in Rowlesburg
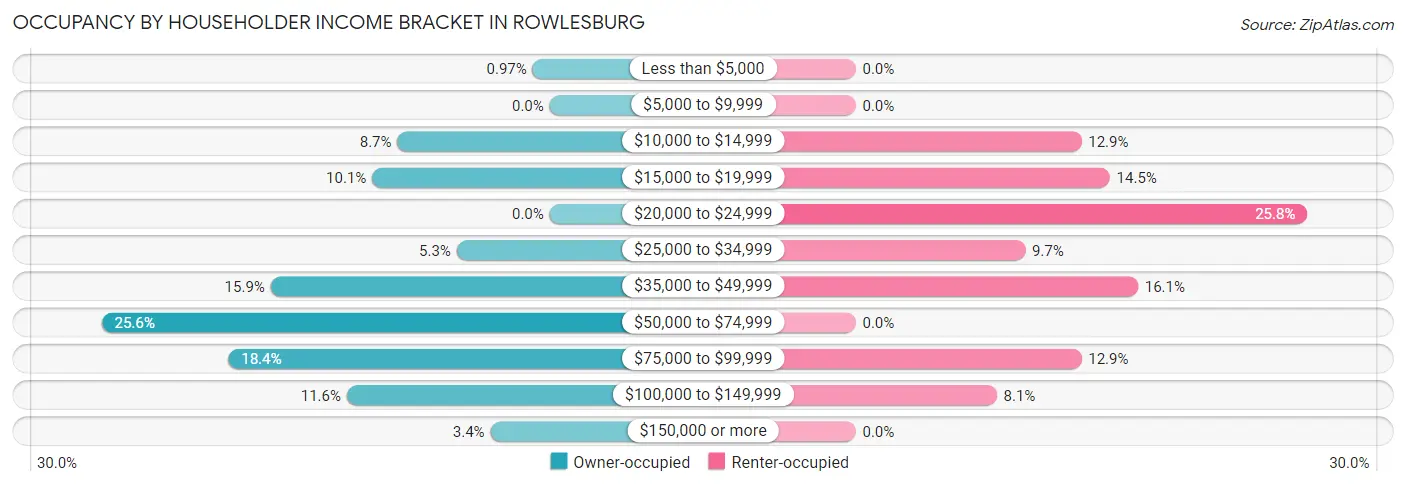
| Income Bracket | Owner-occupied | Renter-occupied |
| Less than $5,000 | 2 (1.0%) | 0 (0.0%) |
| $5,000 to $9,999 | 0 (0.0%) | 0 (0.0%) |
| $10,000 to $14,999 | 18 (8.7%) | 8 (12.9%) |
| $15,000 to $19,999 | 21 (10.1%) | 9 (14.5%) |
| $20,000 to $24,999 | 0 (0.0%) | 16 (25.8%) |
| $25,000 to $34,999 | 11 (5.3%) | 6 (9.7%) |
| $35,000 to $49,999 | 33 (15.9%) | 10 (16.1%) |
| $50,000 to $74,999 | 53 (25.6%) | 0 (0.0%) |
| $75,000 to $99,999 | 38 (18.4%) | 8 (12.9%) |
| $100,000 to $149,999 | 24 (11.6%) | 5 (8.1%) |
| $150,000 or more | 7 (3.4%) | 0 (0.0%) |
| Total | 207 (100.0%) | 62 (100.0%) |
Monthly Housing Cost Tiers in Rowlesburg
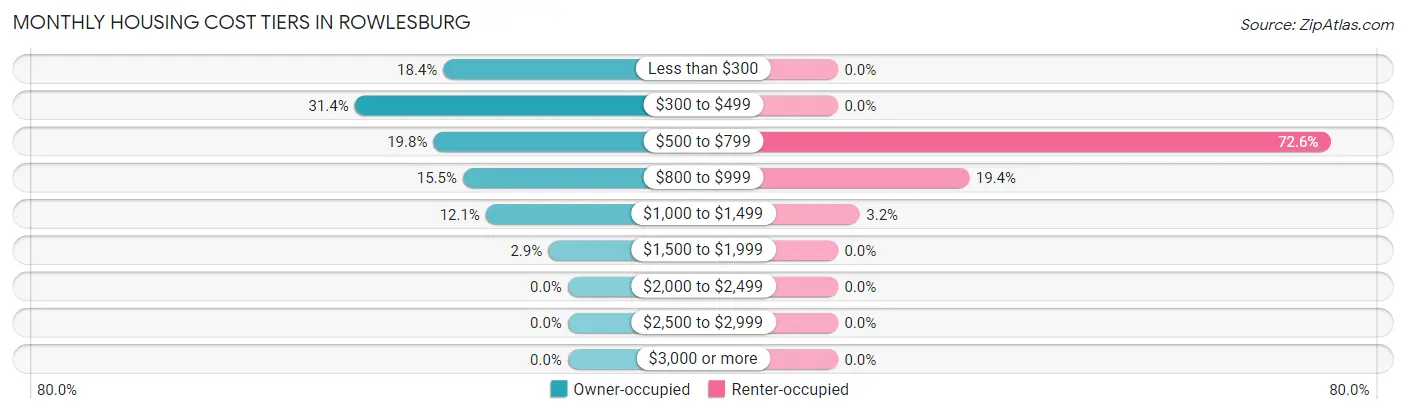
| Monthly Cost | Owner-occupied | Renter-occupied |
| Less than $300 | 38 (18.4%) | 0 (0.0%) |
| $300 to $499 | 65 (31.4%) | 0 (0.0%) |
| $500 to $799 | 41 (19.8%) | 45 (72.6%) |
| $800 to $999 | 32 (15.5%) | 12 (19.4%) |
| $1,000 to $1,499 | 25 (12.1%) | 2 (3.2%) |
| $1,500 to $1,999 | 6 (2.9%) | 0 (0.0%) |
| $2,000 to $2,499 | 0 (0.0%) | 0 (0.0%) |
| $2,500 to $2,999 | 0 (0.0%) | 0 (0.0%) |
| $3,000 or more | 0 (0.0%) | 0 (0.0%) |
| Total | 207 (100.0%) | 62 (100.0%) |
Physical Housing Characteristics in Rowlesburg
Housing Structures in Rowlesburg
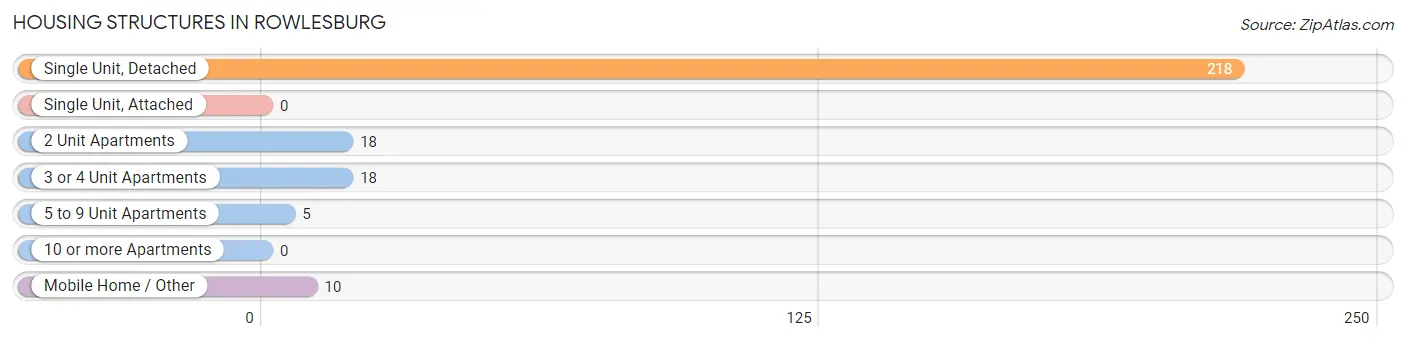
| Structure Type | # Housing Units | % Housing Units |
| Single Unit, Detached | 218 | 81.0% |
| Single Unit, Attached | 0 | 0.0% |
| 2 Unit Apartments | 18 | 6.7% |
| 3 or 4 Unit Apartments | 18 | 6.7% |
| 5 to 9 Unit Apartments | 5 | 1.9% |
| 10 or more Apartments | 0 | 0.0% |
| Mobile Home / Other | 10 | 3.7% |
| Total | 269 | 100.0% |
Housing Structures by Occupancy in Rowlesburg
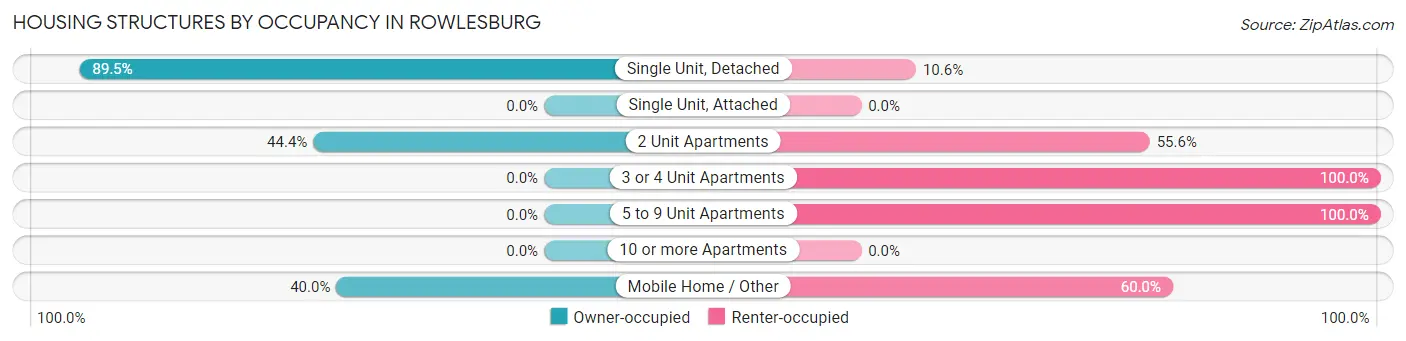
| Structure Type | Owner-occupied | Renter-occupied |
| Single Unit, Detached | 195 (89.4%) | 23 (10.5%) |
| Single Unit, Attached | 0 (0.0%) | 0 (0.0%) |
| 2 Unit Apartments | 8 (44.4%) | 10 (55.6%) |
| 3 or 4 Unit Apartments | 0 (0.0%) | 18 (100.0%) |
| 5 to 9 Unit Apartments | 0 (0.0%) | 5 (100.0%) |
| 10 or more Apartments | 0 (0.0%) | 0 (0.0%) |
| Mobile Home / Other | 4 (40.0%) | 6 (60.0%) |
| Total | 207 (76.9%) | 62 (23.1%) |
Housing Structures by Number of Rooms in Rowlesburg
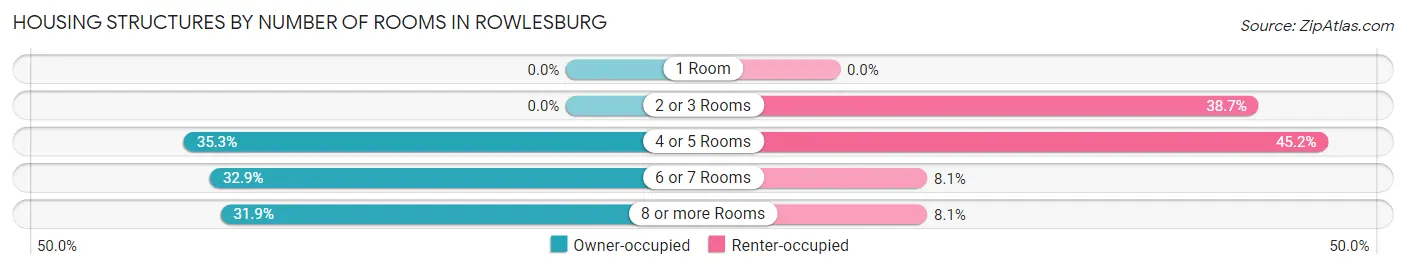
| Number of Rooms | Owner-occupied | Renter-occupied |
| 1 Room | 0 (0.0%) | 0 (0.0%) |
| 2 or 3 Rooms | 0 (0.0%) | 24 (38.7%) |
| 4 or 5 Rooms | 73 (35.3%) | 28 (45.2%) |
| 6 or 7 Rooms | 68 (32.9%) | 5 (8.1%) |
| 8 or more Rooms | 66 (31.9%) | 5 (8.1%) |
| Total | 207 (100.0%) | 62 (100.0%) |
Housing Structure by Heating Type in Rowlesburg
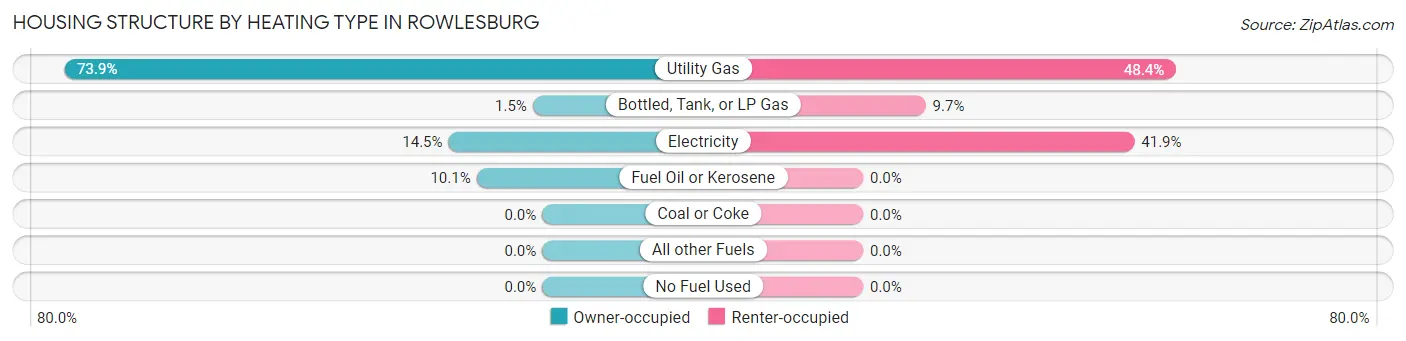
| Heating Type | Owner-occupied | Renter-occupied |
| Utility Gas | 153 (73.9%) | 30 (48.4%) |
| Bottled, Tank, or LP Gas | 3 (1.5%) | 6 (9.7%) |
| Electricity | 30 (14.5%) | 26 (41.9%) |
| Fuel Oil or Kerosene | 21 (10.1%) | 0 (0.0%) |
| Coal or Coke | 0 (0.0%) | 0 (0.0%) |
| All other Fuels | 0 (0.0%) | 0 (0.0%) |
| No Fuel Used | 0 (0.0%) | 0 (0.0%) |
| Total | 207 (100.0%) | 62 (100.0%) |
Household Vehicle Usage in Rowlesburg
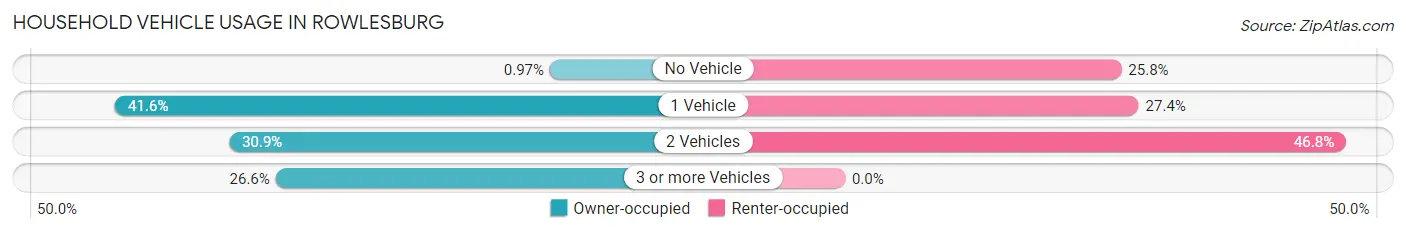
| Vehicles per Household | Owner-occupied | Renter-occupied |
| No Vehicle | 2 (1.0%) | 16 (25.8%) |
| 1 Vehicle | 86 (41.5%) | 17 (27.4%) |
| 2 Vehicles | 64 (30.9%) | 29 (46.8%) |
| 3 or more Vehicles | 55 (26.6%) | 0 (0.0%) |
| Total | 207 (100.0%) | 62 (100.0%) |
Real Estate & Mortgages in Rowlesburg
Real Estate and Mortgage Overview in Rowlesburg
| Characteristic | Without Mortgage | With Mortgage |
| Housing Units | 134 | 73 |
| Median Property Value | $90,600 | $79,600 |
| Median Household Income | $53,750 | $3 |
| Monthly Housing Costs | $366 | $0 |
| Real Estate Taxes | $372 | $0 |
Property Value by Mortgage Status in Rowlesburg
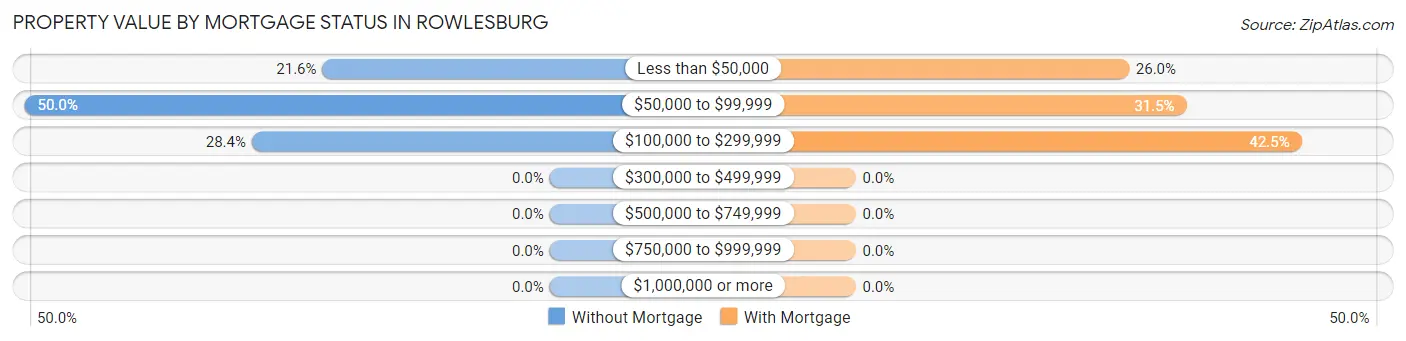
| Property Value | Without Mortgage | With Mortgage |
| Less than $50,000 | 29 (21.6%) | 19 (26.0%) |
| $50,000 to $99,999 | 67 (50.0%) | 23 (31.5%) |
| $100,000 to $299,999 | 38 (28.4%) | 31 (42.5%) |
| $300,000 to $499,999 | 0 (0.0%) | 0 (0.0%) |
| $500,000 to $749,999 | 0 (0.0%) | 0 (0.0%) |
| $750,000 to $999,999 | 0 (0.0%) | 0 (0.0%) |
| $1,000,000 or more | 0 (0.0%) | 0 (0.0%) |
| Total | 134 (100.0%) | 73 (100.0%) |
Household Income by Mortgage Status in Rowlesburg
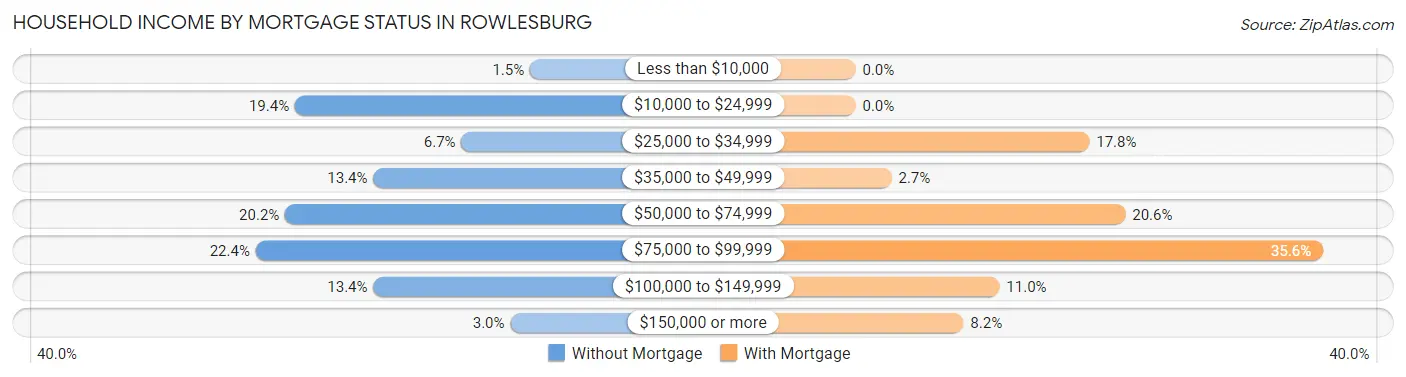
| Household Income | Without Mortgage | With Mortgage |
| Less than $10,000 | 2 (1.5%) | 0 (0.0%) |
| $10,000 to $24,999 | 26 (19.4%) | 0 (0.0%) |
| $25,000 to $34,999 | 9 (6.7%) | 13 (17.8%) |
| $35,000 to $49,999 | 18 (13.4%) | 2 (2.7%) |
| $50,000 to $74,999 | 27 (20.2%) | 15 (20.5%) |
| $75,000 to $99,999 | 30 (22.4%) | 26 (35.6%) |
| $100,000 to $149,999 | 18 (13.4%) | 8 (11.0%) |
| $150,000 or more | 4 (3.0%) | 6 (8.2%) |
| Total | 134 (100.0%) | 73 (100.0%) |
Property Value to Household Income Ratio in Rowlesburg
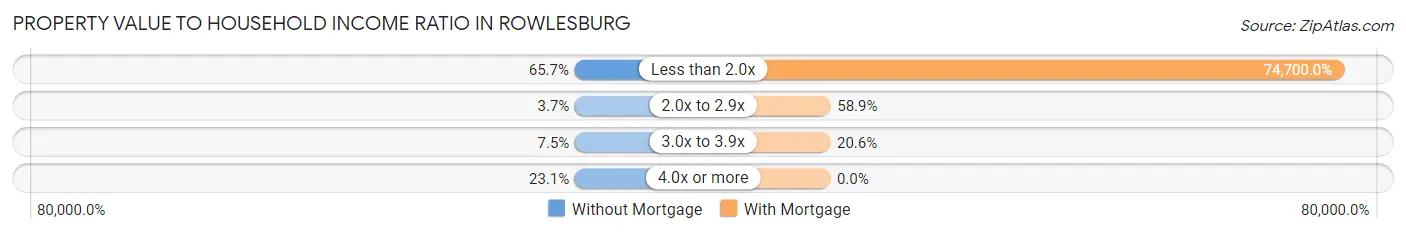
| Value-to-Income Ratio | Without Mortgage | With Mortgage |
| Less than 2.0x | 88 (65.7%) | 54,531 (74,700.0%) |
| 2.0x to 2.9x | 5 (3.7%) | 43 (58.9%) |
| 3.0x to 3.9x | 10 (7.5%) | 15 (20.5%) |
| 4.0x or more | 31 (23.1%) | 0 (0.0%) |
| Total | 134 (100.0%) | 73 (100.0%) |
Real Estate Taxes by Mortgage Status in Rowlesburg
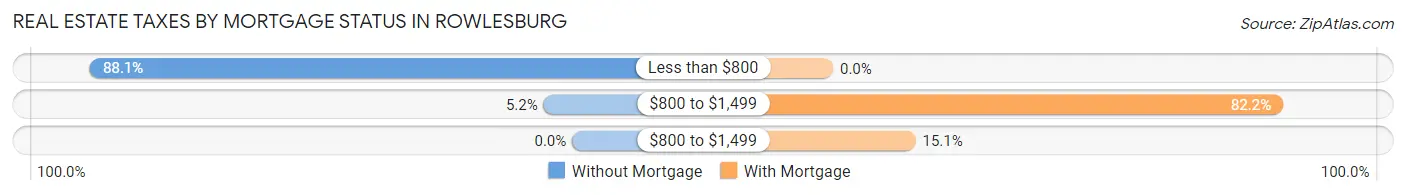
| Property Taxes | Without Mortgage | With Mortgage |
| Less than $800 | 118 (88.1%) | 0 (0.0%) |
| $800 to $1,499 | 7 (5.2%) | 60 (82.2%) |
| $800 to $1,499 | 0 (0.0%) | 11 (15.1%) |
| Total | 134 (100.0%) | 73 (100.0%) |
Health & Disability in Rowlesburg
Health Insurance Coverage by Age in Rowlesburg
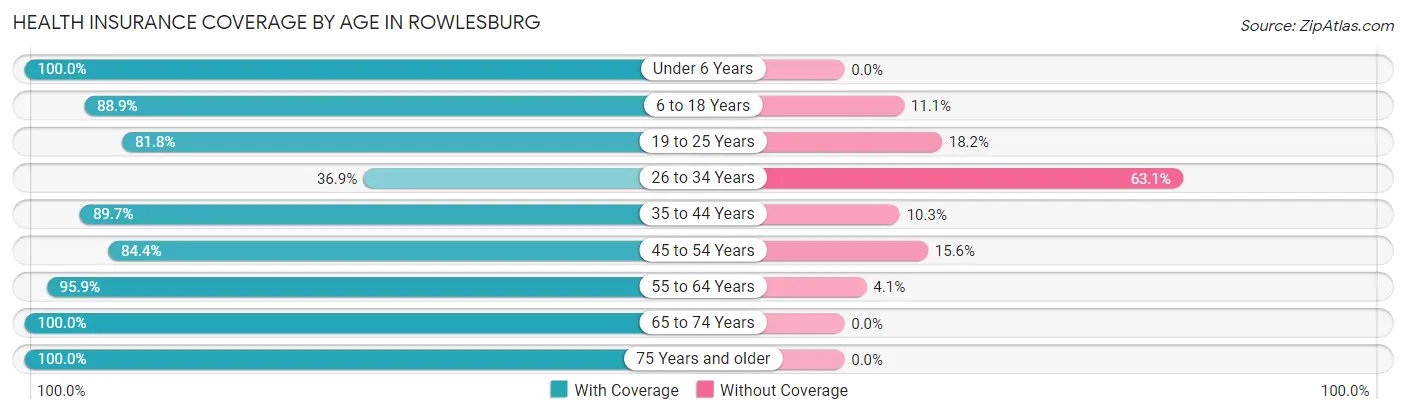
| Age Bracket | With Coverage | Without Coverage |
| Under 6 Years | 17 (100.0%) | 0 (0.0%) |
| 6 to 18 Years | 48 (88.9%) | 6 (11.1%) |
| 19 to 25 Years | 36 (81.8%) | 8 (18.2%) |
| 26 to 34 Years | 31 (36.9%) | 53 (63.1%) |
| 35 to 44 Years | 26 (89.7%) | 3 (10.3%) |
| 45 to 54 Years | 65 (84.4%) | 12 (15.6%) |
| 55 to 64 Years | 93 (95.9%) | 4 (4.1%) |
| 65 to 74 Years | 109 (100.0%) | 0 (0.0%) |
| 75 Years and older | 74 (100.0%) | 0 (0.0%) |
| Total | 499 (85.3%) | 86 (14.7%) |
Health Insurance Coverage by Citizenship Status in Rowlesburg
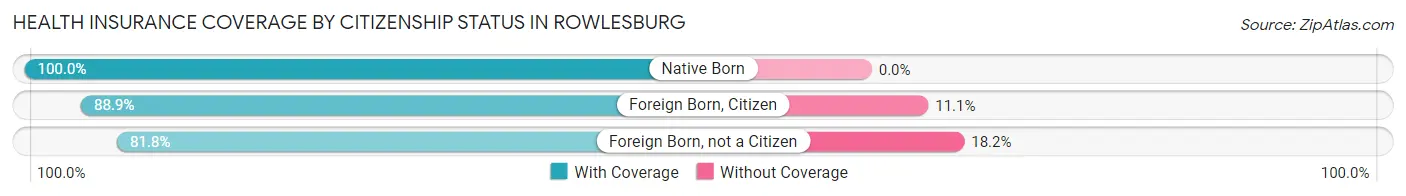
| Citizenship Status | With Coverage | Without Coverage |
| Native Born | 17 (100.0%) | 0 (0.0%) |
| Foreign Born, Citizen | 48 (88.9%) | 6 (11.1%) |
| Foreign Born, not a Citizen | 36 (81.8%) | 8 (18.2%) |
Health Insurance Coverage by Household Income in Rowlesburg
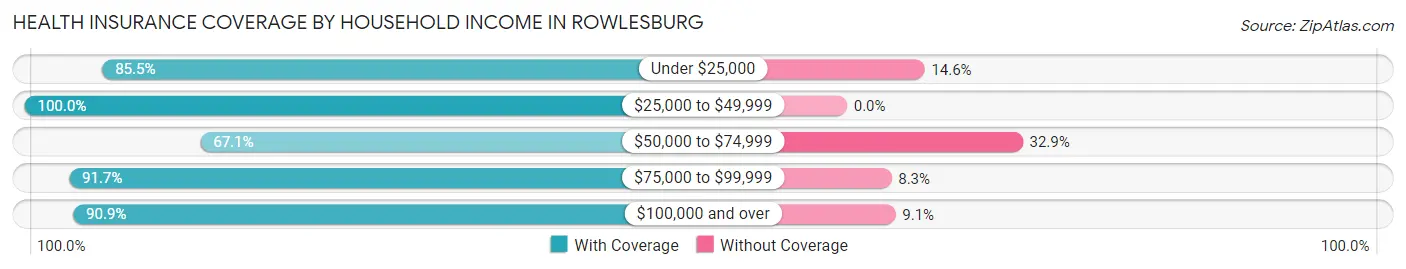
| Household Income | With Coverage | Without Coverage |
| Under $25,000 | 94 (85.5%) | 16 (14.5%) |
| $25,000 to $49,999 | 118 (100.0%) | 0 (0.0%) |
| $50,000 to $74,999 | 108 (67.1%) | 53 (32.9%) |
| $75,000 to $99,999 | 99 (91.7%) | 9 (8.3%) |
| $100,000 and over | 80 (90.9%) | 8 (9.1%) |
Public vs Private Health Insurance Coverage by Age in Rowlesburg
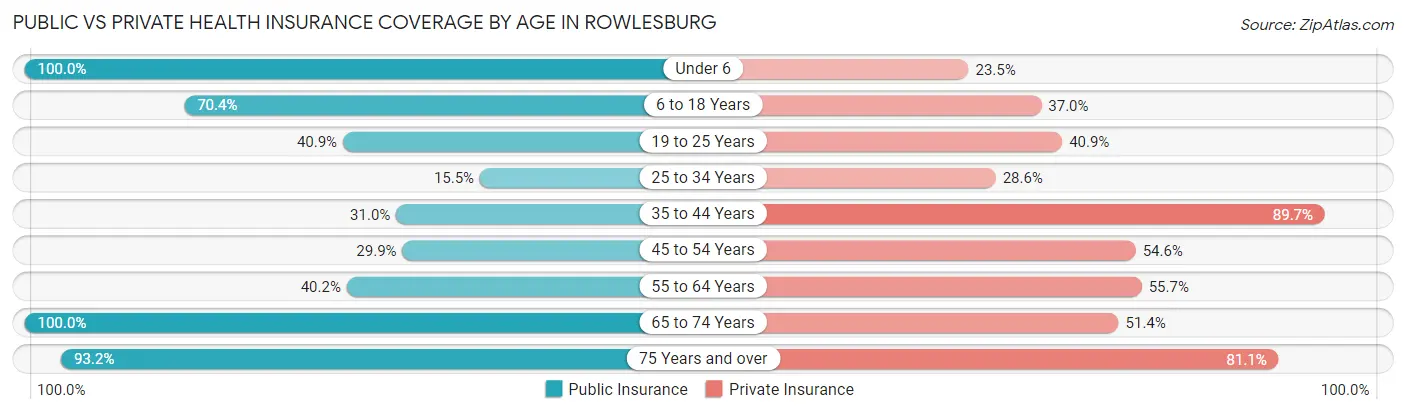
| Age Bracket | Public Insurance | Private Insurance |
| Under 6 | 17 (100.0%) | 4 (23.5%) |
| 6 to 18 Years | 38 (70.4%) | 20 (37.0%) |
| 19 to 25 Years | 18 (40.9%) | 18 (40.9%) |
| 25 to 34 Years | 13 (15.5%) | 24 (28.6%) |
| 35 to 44 Years | 9 (31.0%) | 26 (89.7%) |
| 45 to 54 Years | 23 (29.9%) | 42 (54.5%) |
| 55 to 64 Years | 39 (40.2%) | 54 (55.7%) |
| 65 to 74 Years | 109 (100.0%) | 56 (51.4%) |
| 75 Years and over | 69 (93.2%) | 60 (81.1%) |
| Total | 335 (57.3%) | 304 (52.0%) |
Disability Status by Sex by Age in Rowlesburg
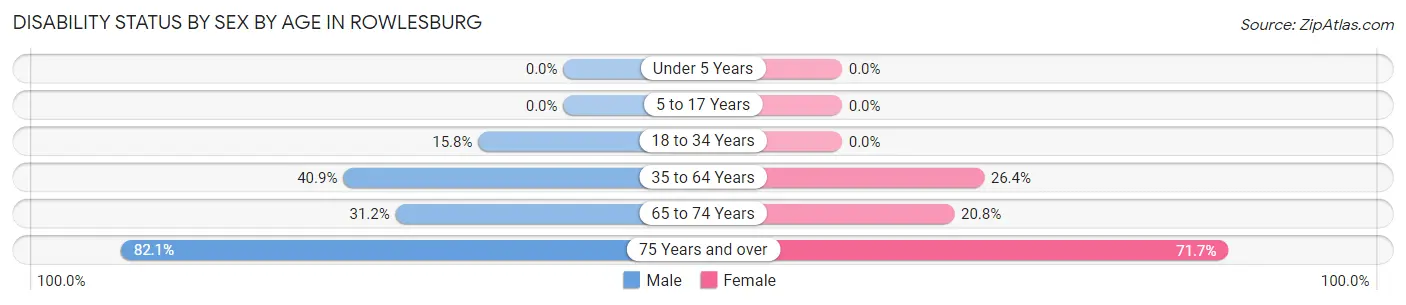
| Age Bracket | Male | Female |
| Under 5 Years | 0 (0.0%) | 0 (0.0%) |
| 5 to 17 Years | 0 (0.0%) | 0 (0.0%) |
| 18 to 34 Years | 15 (15.8%) | 0 (0.0%) |
| 35 to 64 Years | 38 (40.9%) | 29 (26.4%) |
| 65 to 74 Years | 19 (31.1%) | 10 (20.8%) |
| 75 Years and over | 23 (82.1%) | 33 (71.7%) |
Disability Class by Sex by Age in Rowlesburg
Disability Class: Hearing Difficulty
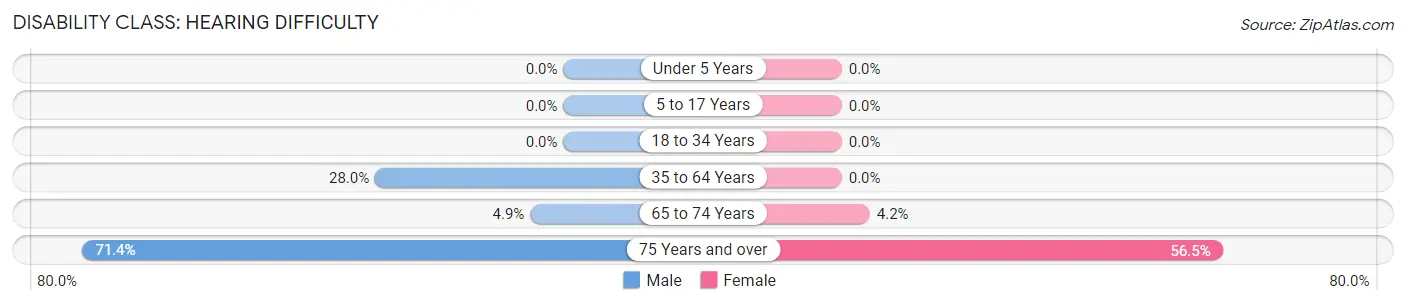
| Age Bracket | Male | Female |
| Under 5 Years | 0 (0.0%) | 0 (0.0%) |
| 5 to 17 Years | 0 (0.0%) | 0 (0.0%) |
| 18 to 34 Years | 0 (0.0%) | 0 (0.0%) |
| 35 to 64 Years | 26 (28.0%) | 0 (0.0%) |
| 65 to 74 Years | 3 (4.9%) | 2 (4.2%) |
| 75 Years and over | 20 (71.4%) | 26 (56.5%) |
Disability Class: Vision Difficulty
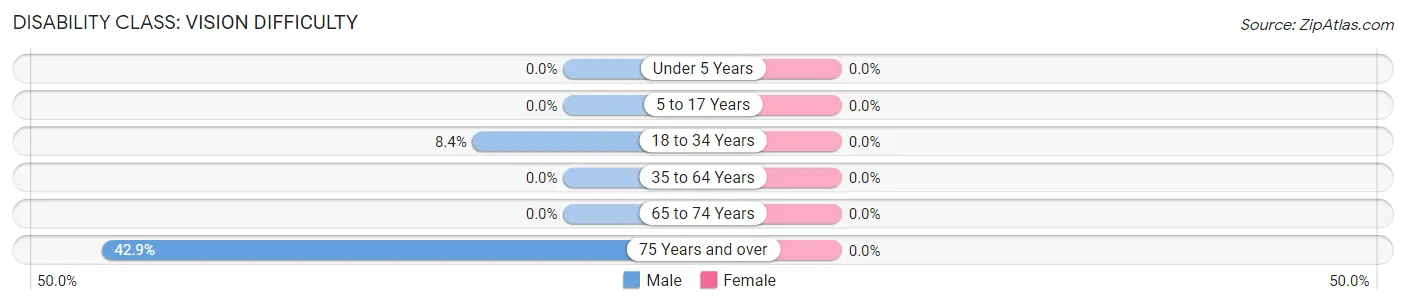
| Age Bracket | Male | Female |
| Under 5 Years | 0 (0.0%) | 0 (0.0%) |
| 5 to 17 Years | 0 (0.0%) | 0 (0.0%) |
| 18 to 34 Years | 8 (8.4%) | 0 (0.0%) |
| 35 to 64 Years | 0 (0.0%) | 0 (0.0%) |
| 65 to 74 Years | 0 (0.0%) | 0 (0.0%) |
| 75 Years and over | 12 (42.9%) | 0 (0.0%) |
Disability Class: Cognitive Difficulty
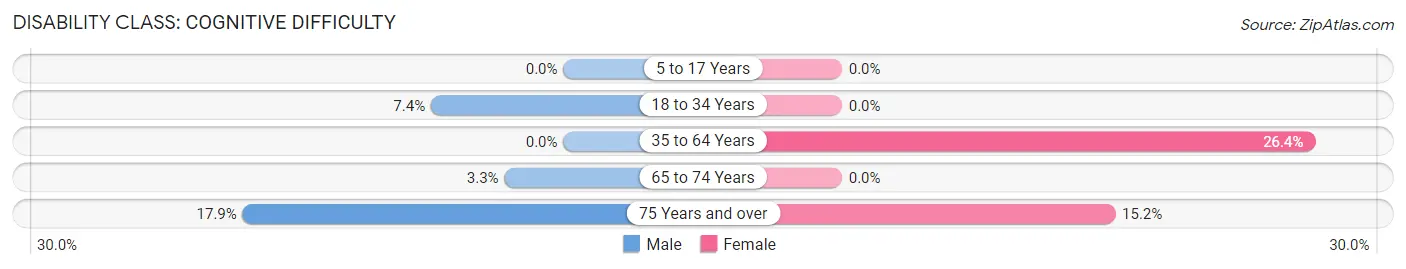
| Age Bracket | Male | Female |
| 5 to 17 Years | 0 (0.0%) | 0 (0.0%) |
| 18 to 34 Years | 7 (7.4%) | 0 (0.0%) |
| 35 to 64 Years | 0 (0.0%) | 29 (26.4%) |
| 65 to 74 Years | 2 (3.3%) | 0 (0.0%) |
| 75 Years and over | 5 (17.9%) | 7 (15.2%) |
Disability Class: Ambulatory Difficulty
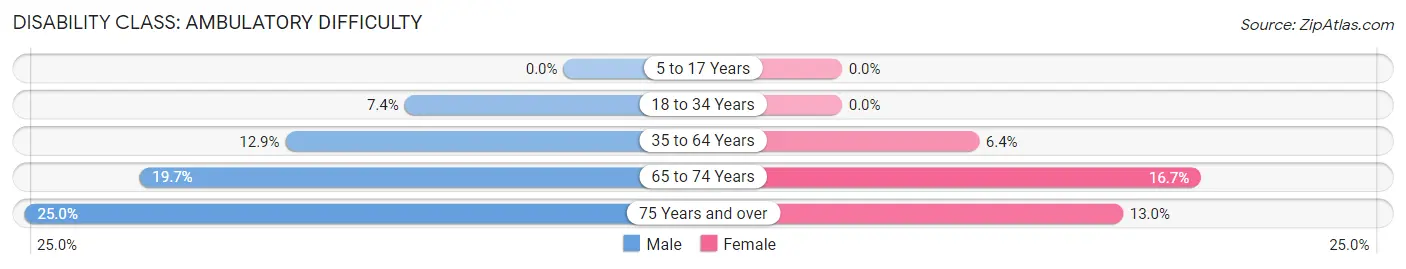
| Age Bracket | Male | Female |
| 5 to 17 Years | 0 (0.0%) | 0 (0.0%) |
| 18 to 34 Years | 7 (7.4%) | 0 (0.0%) |
| 35 to 64 Years | 12 (12.9%) | 7 (6.4%) |
| 65 to 74 Years | 12 (19.7%) | 8 (16.7%) |
| 75 Years and over | 7 (25.0%) | 6 (13.0%) |
Disability Class: Self-Care Difficulty
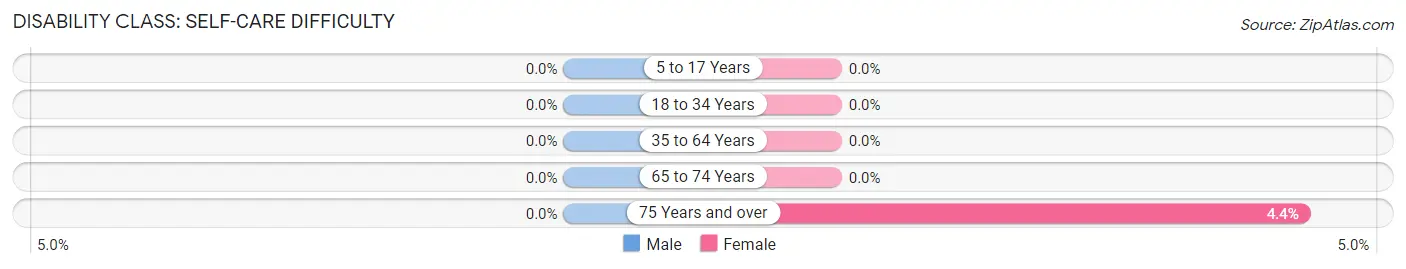
| Age Bracket | Male | Female |
| 5 to 17 Years | 0 (0.0%) | 0 (0.0%) |
| 18 to 34 Years | 0 (0.0%) | 0 (0.0%) |
| 35 to 64 Years | 0 (0.0%) | 0 (0.0%) |
| 65 to 74 Years | 0 (0.0%) | 0 (0.0%) |
| 75 Years and over | 0 (0.0%) | 2 (4.3%) |
Technology Access in Rowlesburg
Computing Device Access in Rowlesburg
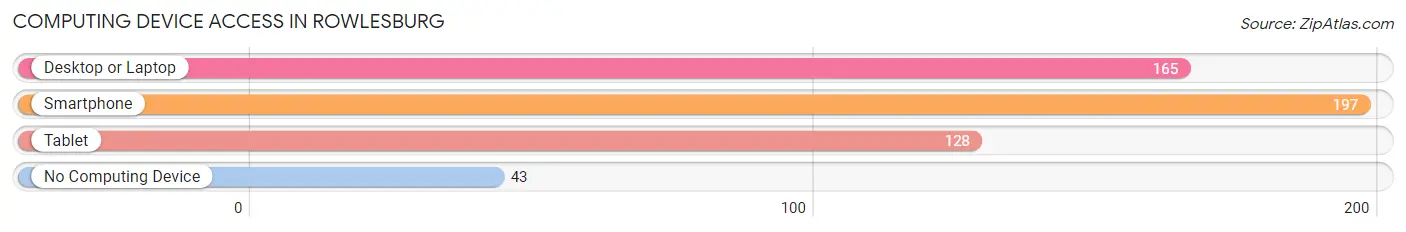
| Device Type | # Households | % Households |
| Desktop or Laptop | 165 | 61.3% |
| Smartphone | 197 | 73.2% |
| Tablet | 128 | 47.6% |
| No Computing Device | 43 | 16.0% |
| Total | 269 | 100.0% |
Internet Access in Rowlesburg
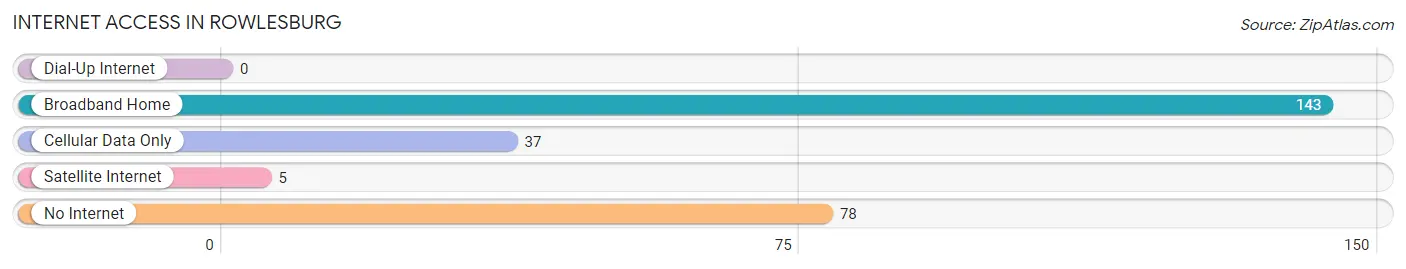
| Internet Type | # Households | % Households |
| Dial-Up Internet | 0 | 0.0% |
| Broadband Home | 143 | 53.2% |
| Cellular Data Only | 37 | 13.8% |
| Satellite Internet | 5 | 1.9% |
| No Internet | 78 | 29.0% |
| Total | 269 | 100.0% |
Rowlesburg Summary
Rowlesburg is a small town located in Preston County, West Virginia. It is situated along the Cheat River, and is part of the Morgantown, WV Metropolitan Statistical Area. The town was founded in 1817 and has a population of approximately 590 people as of the 2010 census.
History
Rowlesburg was founded in 1817 by William Rowles, a Revolutionary War veteran. The town was originally known as Rowlesburg Station, and was a stop on the Baltimore and Ohio Railroad. The town was incorporated in 1891.
In the late 19th century, Rowlesburg was a major coal mining center. The town was home to several coal mines, including the Rowlesburg Coal and Coke Company, which operated from 1891 to 1910. The town also had a number of other businesses, including a hotel, a bank, a post office, and a general store.
In the early 20th century, Rowlesburg experienced a period of decline. The coal mines closed, and the town's population decreased. In the 1950s, the town was revitalized with the construction of the Cheat River Dam. The dam created a large lake, which is now a popular recreational area.
Geography
Rowlesburg is located in Preston County, West Virginia. It is situated along the Cheat River, and is part of the Morgantown, WV Metropolitan Statistical Area. The town is located at an elevation of 1,845 feet.
The climate in Rowlesburg is humid continental, with hot summers and cold winters. The average annual temperature is 52.3°F, and the average annual precipitation is 41.3 inches.
Economy
The economy of Rowlesburg is largely based on tourism. The town is home to the Cheat River Dam, which is a popular recreational area. The town also has a number of small businesses, including restaurants, shops, and a gas station.
Demographics
As of the 2010 census, the population of Rowlesburg was 590. The racial makeup of the town was 97.3% White, 0.2% African American, 0.2% Native American, 0.2% Asian, 0.2% from other races, and 1.9% from two or more races. The median household income was $31,250, and the median family income was $37,500.
Conclusion
Rowlesburg is a small town located in Preston County, West Virginia. It was founded in 1817 and has a population of approximately 590 people as of the 2010 census. The town's economy is largely based on tourism, and it is home to the Cheat River Dam, which is a popular recreational area. The town has a diverse population, with a median household income of $31,250 and a median family income of $37,500.
Common Questions
What is Per Capita Income in Rowlesburg?
Per Capita income in Rowlesburg is $25,109.
What is the Median Family Income in Rowlesburg?
Median Family Income in Rowlesburg is $54,219.
What is the Median Household income in Rowlesburg?
Median Household Income in Rowlesburg is $50,139.
What is Income or Wage Gap in Rowlesburg?
Income or Wage Gap in Rowlesburg is 12.1%.
Women in Rowlesburg earn 87.9 cents for every dollar earned by a man.
What is Family Income Deficit in Rowlesburg?
Family Income Deficit in Rowlesburg is $3,475.
Families that are below poverty line in Rowlesburg earn $3,475 less on average than the poverty threshold level.
What is Inequality or Gini Index in Rowlesburg?
Inequality or Gini Index in Rowlesburg is 0.37.
What is the Total Population of Rowlesburg?
Total Population of Rowlesburg is 585.
What is the Total Male Population of Rowlesburg?
Total Male Population of Rowlesburg is 304.
What is the Total Female Population of Rowlesburg?
Total Female Population of Rowlesburg is 281.
What is the Ratio of Males per 100 Females in Rowlesburg?
There are 108.19 Males per 100 Females in Rowlesburg.
What is the Ratio of Females per 100 Males in Rowlesburg?
There are 92.43 Females per 100 Males in Rowlesburg.
What is the Median Population Age in Rowlesburg?
Median Population Age in Rowlesburg is 53.9 Years.
What is the Average Family Size in Rowlesburg
Average Family Size in Rowlesburg is 2.7 People.
What is the Average Household Size in Rowlesburg
Average Household Size in Rowlesburg is 2.2 People.
How Large is the Labor Force in Rowlesburg?
There are 266 People in the Labor Forcein in Rowlesburg.
What is the Percentage of People in the Labor Force in Rowlesburg?
49.9% of People are in the Labor Force in Rowlesburg.
What is the Unemployment Rate in Rowlesburg?
Unemployment Rate in Rowlesburg is 15.4%.