Ronceverte, WV Map & Demographics
Ronceverte Map
Ronceverte Overview
$27,496
PER CAPITA INCOME
$46,250
AVG FAMILY INCOME
$40,605
AVG HOUSEHOLD INCOME
0.1%
WAGE / INCOME GAP [ % ]
99.9¢/ $1
WAGE / INCOME GAP [ $ ]
$10,422
FAMILY INCOME DEFICIT
0.47
INEQUALITY / GINI INDEX
1,426
TOTAL POPULATION
666
MALE POPULATION
760
FEMALE POPULATION
87.63
MALES / 100 FEMALES
114.11
FEMALES / 100 MALES
37.9
MEDIAN AGE
2.7
AVG FAMILY SIZE
2.2
AVG HOUSEHOLD SIZE
791
LABOR FORCE [ PEOPLE ]
68.4%
PERCENT IN LABOR FORCE
3.2%
UNEMPLOYMENT RATE
Ronceverte Zip Codes
Ronceverte Area Codes
Income in Ronceverte
Income Overview in Ronceverte
Per Capita Income in Ronceverte is $27,496, while median incomes of families and households are $46,250 and $40,605 respectively.
| Characteristic | Number | Measure |
| Per Capita Income | 1,426 | $27,496 |
| Median Family Income | 377 | $46,250 |
| Mean Family Income | 377 | $69,444 |
| Median Household Income | 651 | $40,605 |
| Mean Household Income | 651 | $57,543 |
| Income Deficit | 377 | $10,422 |
| Wage / Income Gap (%) | 1,426 | 0.13% |
| Wage / Income Gap ($) | 1,426 | 99.87¢ per $1 |
| Gini / Inequality Index | 1,426 | 0.47 |
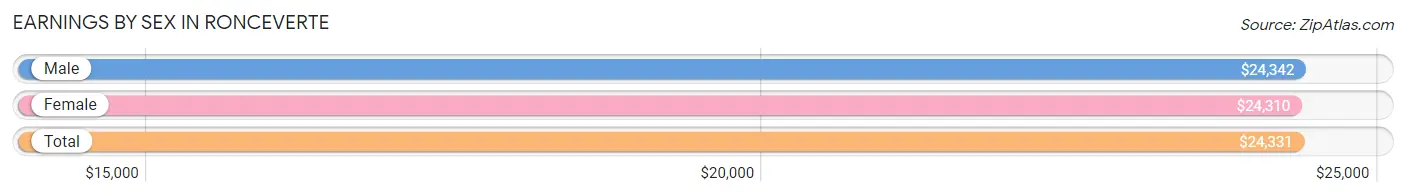
Earnings by Sex in Ronceverte
Average Earnings in Ronceverte are $24,331, $24,342 for men and $24,310 for women, a difference of 0.1%.
| Sex | Number | Average Earnings |
| Male | 456 (54.8%) | $24,342 |
| Female | 376 (45.2%) | $24,310 |
| Total | 832 (100.0%) | $24,331 |
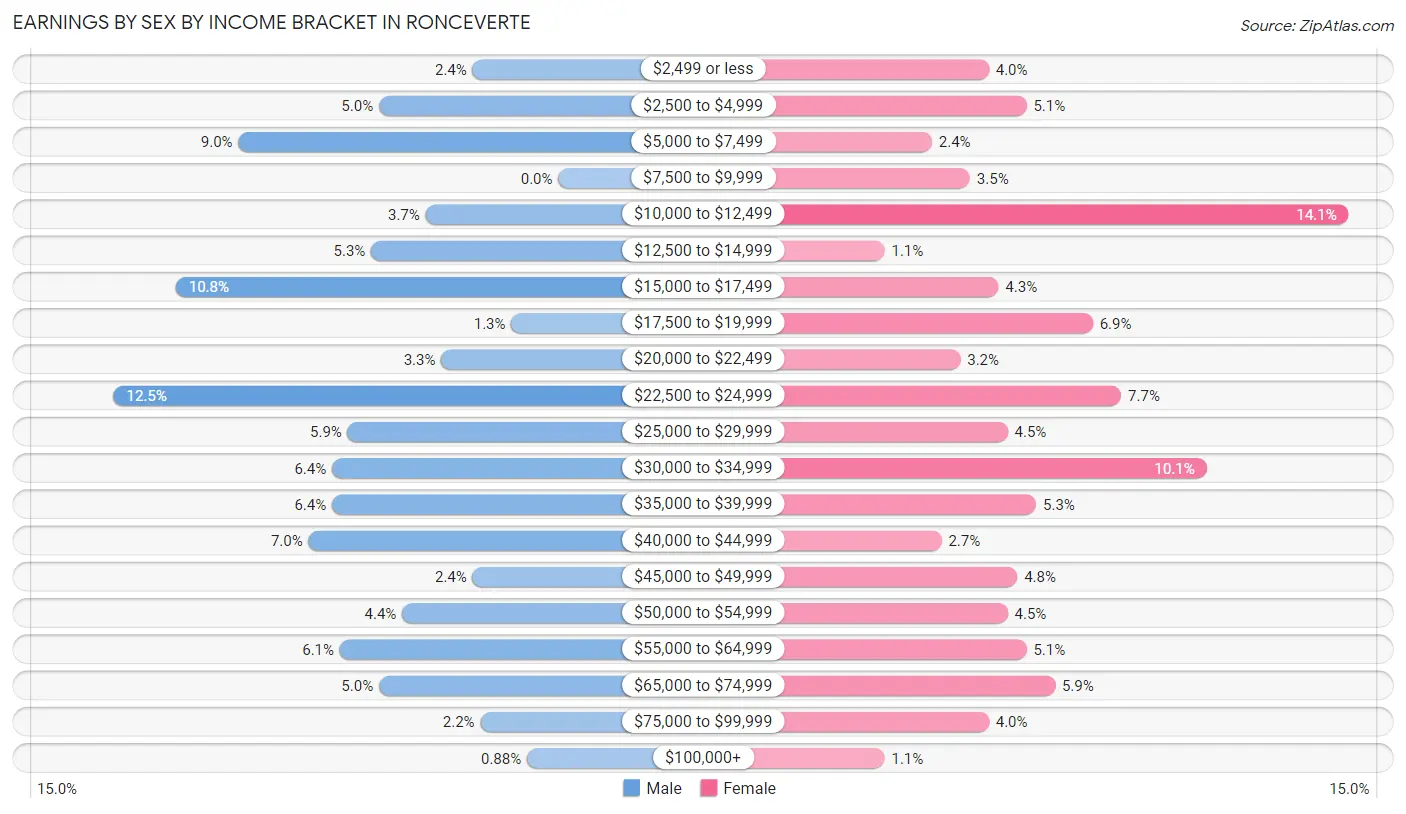
Earnings by Sex by Income Bracket in Ronceverte
The most common earnings brackets in Ronceverte are $22,500 to $24,999 for men (57 | 12.5%) and $10,000 to $12,499 for women (53 | 14.1%).
| Income | Male | Female |
| $2,499 or less | 11 (2.4%) | 15 (4.0%) |
| $2,500 to $4,999 | 23 (5.0%) | 19 (5.1%) |
| $5,000 to $7,499 | 41 (9.0%) | 9 (2.4%) |
| $7,500 to $9,999 | 0 (0.0%) | 13 (3.5%) |
| $10,000 to $12,499 | 17 (3.7%) | 53 (14.1%) |
| $12,500 to $14,999 | 24 (5.3%) | 4 (1.1%) |
| $15,000 to $17,499 | 49 (10.7%) | 16 (4.3%) |
| $17,500 to $19,999 | 6 (1.3%) | 26 (6.9%) |
| $20,000 to $22,499 | 15 (3.3%) | 12 (3.2%) |
| $22,500 to $24,999 | 57 (12.5%) | 29 (7.7%) |
| $25,000 to $29,999 | 27 (5.9%) | 17 (4.5%) |
| $30,000 to $34,999 | 29 (6.4%) | 38 (10.1%) |
| $35,000 to $39,999 | 29 (6.4%) | 20 (5.3%) |
| $40,000 to $44,999 | 32 (7.0%) | 10 (2.7%) |
| $45,000 to $49,999 | 11 (2.4%) | 18 (4.8%) |
| $50,000 to $54,999 | 20 (4.4%) | 17 (4.5%) |
| $55,000 to $64,999 | 28 (6.1%) | 19 (5.1%) |
| $65,000 to $74,999 | 23 (5.0%) | 22 (5.9%) |
| $75,000 to $99,999 | 10 (2.2%) | 15 (4.0%) |
| $100,000+ | 4 (0.9%) | 4 (1.1%) |
| Total | 456 (100.0%) | 376 (100.0%) |
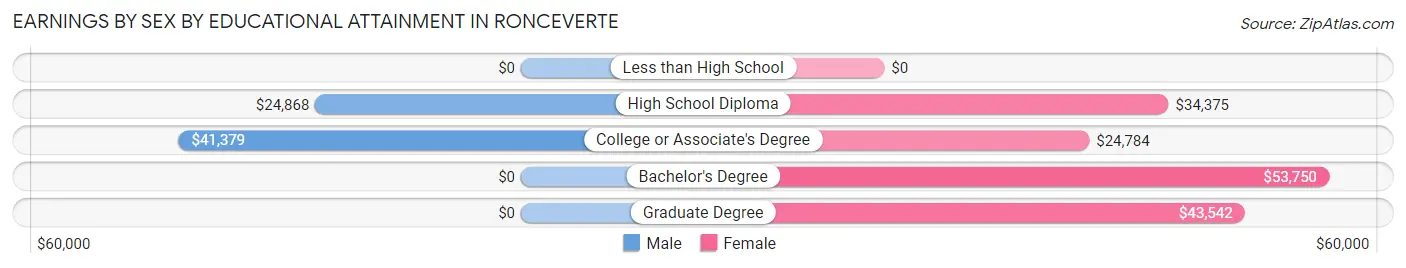
Earnings by Sex by Educational Attainment in Ronceverte
Average earnings in Ronceverte are $32,083 for men and $31,838 for women, a difference of 0.8%. Men with an educational attainment of college or associate's degree enjoy the highest average annual earnings of $41,379, while those with high school diploma education earn the least with $24,868. Women with an educational attainment of bachelor's degree earn the most with the average annual earnings of $53,750, while those with college or associate's degree education have the smallest earnings of $24,784.
| Educational Attainment | Male Income | Female Income |
| Less than High School | - | - |
| High School Diploma | $24,868 | $34,375 |
| College or Associate's Degree | $41,379 | $24,784 |
| Bachelor's Degree | - | - |
| Graduate Degree | - | - |
| Total | $32,083 | $31,838 |
Family Income in Ronceverte
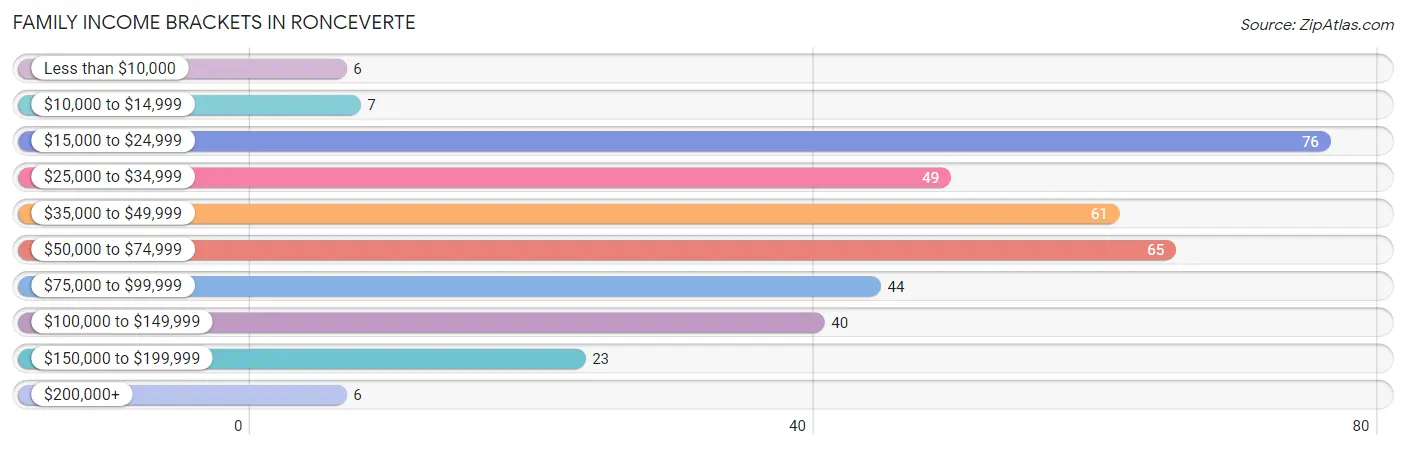
Family Income Brackets in Ronceverte
According to the Ronceverte family income data, there are 76 families falling into the $15,000 to $24,999 income range, which is the most common income bracket and makes up 20.2% of all families. Conversely, the less than $10,000 income bracket is the least frequent group with only 6 families (1.6%) belonging to this category.
| Income Bracket | # Families | % Families |
| Less than $10,000 | 6 | 1.6% |
| $10,000 to $14,999 | 7 | 1.9% |
| $15,000 to $24,999 | 76 | 20.2% |
| $25,000 to $34,999 | 49 | 13.0% |
| $35,000 to $49,999 | 61 | 16.2% |
| $50,000 to $74,999 | 65 | 17.2% |
| $75,000 to $99,999 | 44 | 11.7% |
| $100,000 to $149,999 | 40 | 10.6% |
| $150,000 to $199,999 | 23 | 6.1% |
| $200,000+ | 6 | 1.6% |
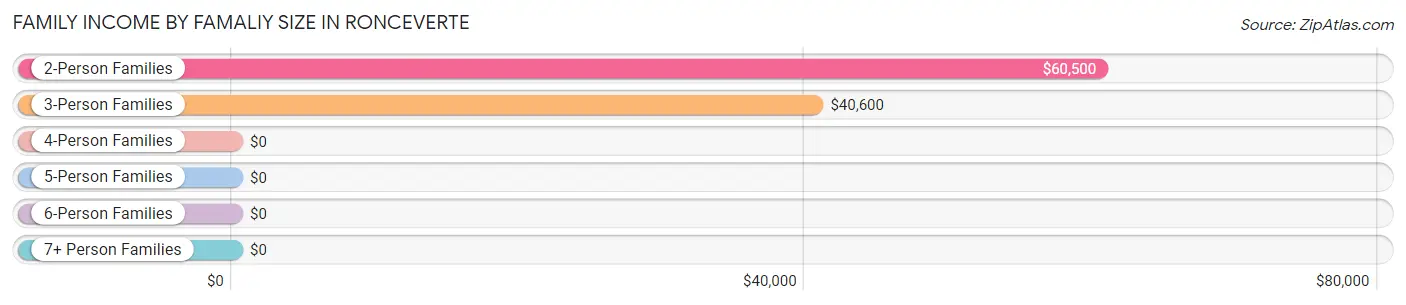
Family Income by Famaliy Size in Ronceverte
2-person families (182 | 48.3%) account for the highest median family income in Ronceverte with $60,500 per family, while 2-person families (182 | 48.3%) have the highest median income of $30,250 per family member.
| Income Bracket | # Families | Median Income |
| 2-Person Families | 182 (48.3%) | $60,500 |
| 3-Person Families | 100 (26.5%) | $40,600 |
| 4-Person Families | 66 (17.5%) | $0 |
| 5-Person Families | 23 (6.1%) | $0 |
| 6-Person Families | 0 (0.0%) | $0 |
| 7+ Person Families | 6 (1.6%) | $0 |
| Total | 377 (100.0%) | $46,250 |
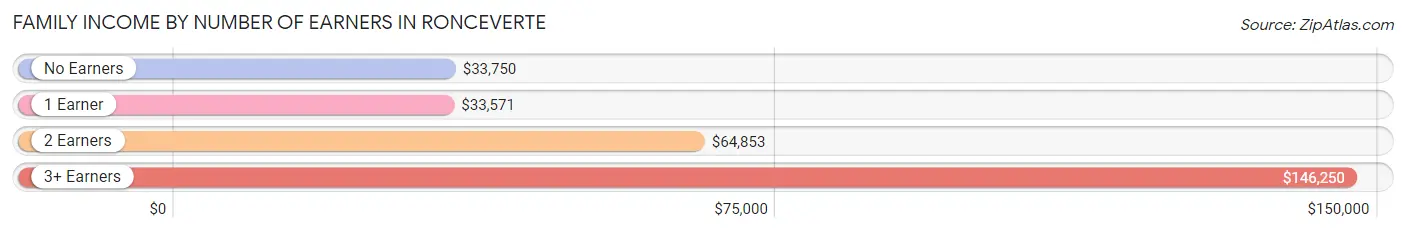
Family Income by Number of Earners in Ronceverte
The median family income in Ronceverte is $46,250, with families comprising 3+ earners (38) having the highest median family income of $146,250, while families with 1 earner (150) have the lowest median family income of $33,571, accounting for 10.1% and 39.8% of families, respectively.
| Number of Earners | # Families | Median Income |
| No Earners | 47 (12.5%) | $33,750 |
| 1 Earner | 150 (39.8%) | $33,571 |
| 2 Earners | 142 (37.7%) | $64,853 |
| 3+ Earners | 38 (10.1%) | $146,250 |
| Total | 377 (100.0%) | $46,250 |
Household Income in Ronceverte
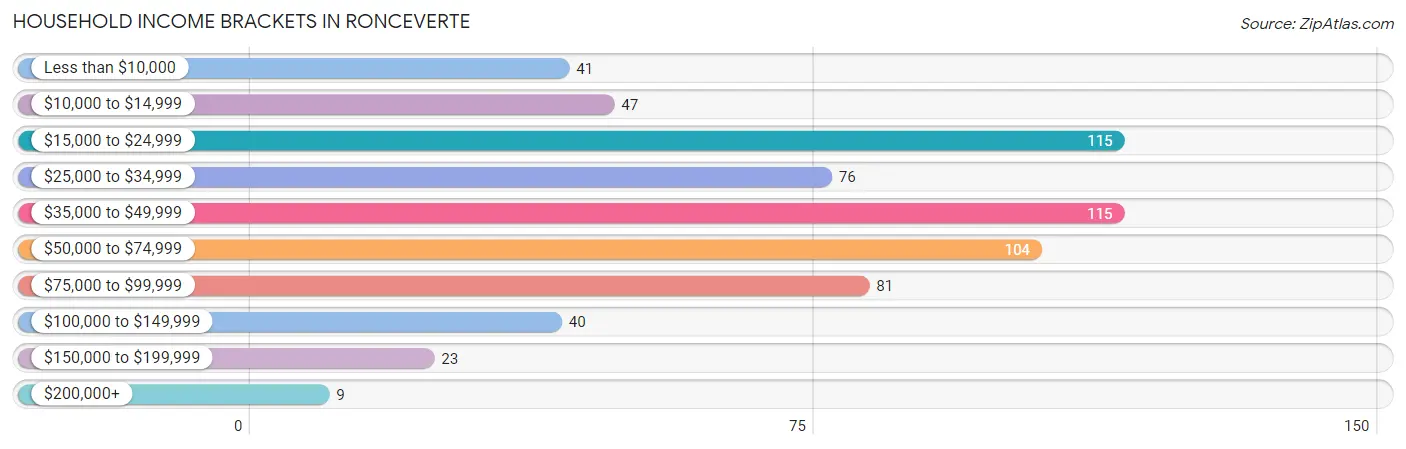
Household Income Brackets in Ronceverte
With 115 households falling in the category, the $15,000 to $24,999 income range is the most frequent in Ronceverte, accounting for 17.7% of all households. In contrast, only 9 households (1.4%) fall into the $200,000+ income bracket, making it the least populous group.
| Income Bracket | # Households | % Households |
| Less than $10,000 | 41 | 6.3% |
| $10,000 to $14,999 | 47 | 7.2% |
| $15,000 to $24,999 | 115 | 17.7% |
| $25,000 to $34,999 | 76 | 11.7% |
| $35,000 to $49,999 | 115 | 17.7% |
| $50,000 to $74,999 | 104 | 16.0% |
| $75,000 to $99,999 | 81 | 12.4% |
| $100,000 to $149,999 | 40 | 6.1% |
| $150,000 to $199,999 | 23 | 3.5% |
| $200,000+ | 9 | 1.4% |
Household Income by Householder Age in Ronceverte
The median household income in Ronceverte is $40,605, with the highest median household income of $48,750 found in the 25 to 44 years age bracket for the primary householder. A total of 245 households (37.6%) fall into this category. Meanwhile, the 15 to 24 years age bracket for the primary householder has the lowest median household income of $30,074, with 33 households (5.1%) in this group.
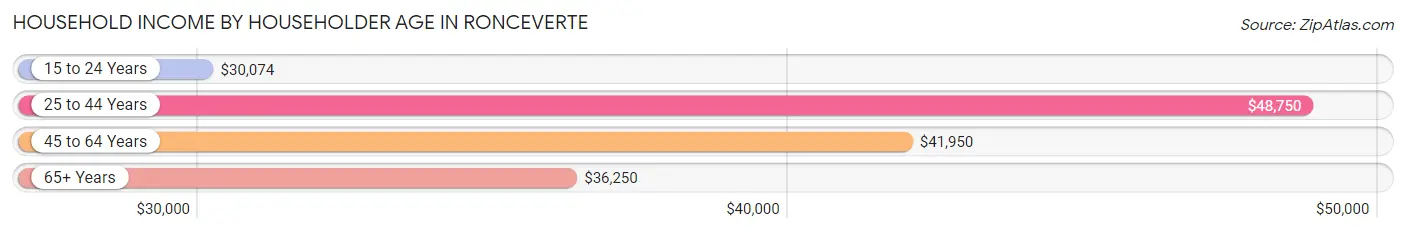
| Income Bracket | # Households | Median Income |
| 15 to 24 Years | 33 (5.1%) | $30,074 |
| 25 to 44 Years | 245 (37.6%) | $48,750 |
| 45 to 64 Years | 227 (34.9%) | $41,950 |
| 65+ Years | 146 (22.4%) | $36,250 |
| Total | 651 (100.0%) | $40,605 |
Poverty in Ronceverte
Income Below Poverty by Sex and Age in Ronceverte
With 17.5% poverty level for males and 23.3% for females among the residents of Ronceverte, 75 year old and over males and 12 to 14 year old females are the most vulnerable to poverty, with 13 males (56.5%) and 15 females (42.9%) in their respective age groups living below the poverty level.
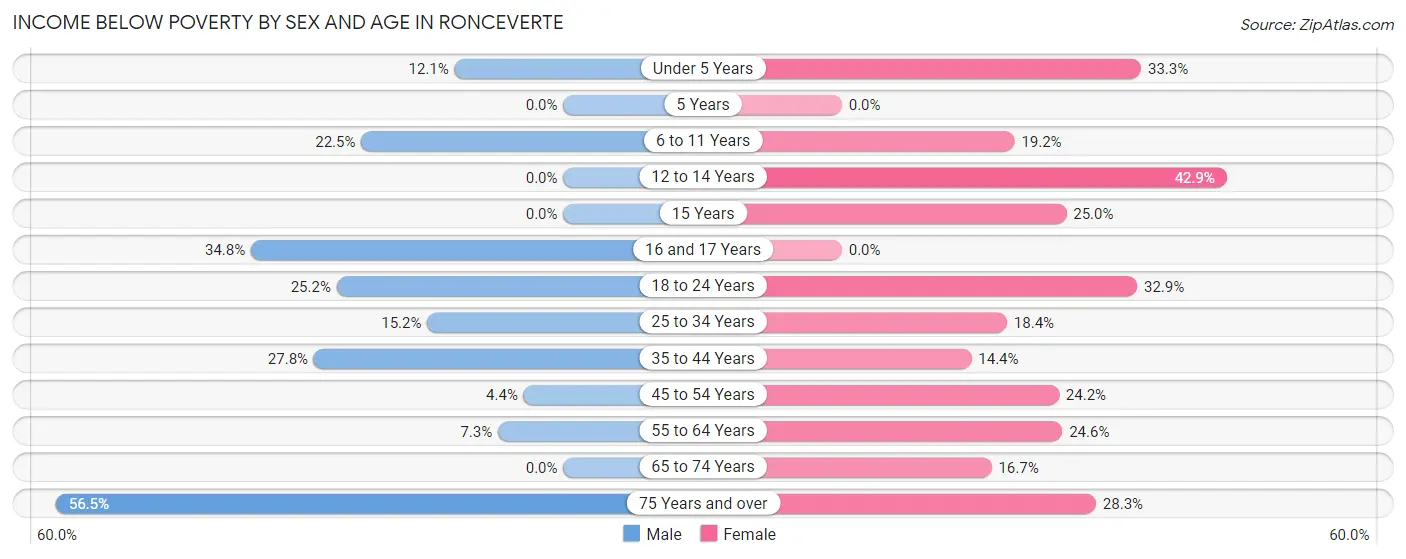
| Age Bracket | Male | Female |
| Under 5 Years | 4 (12.1%) | 12 (33.3%) |
| 5 Years | 0 (0.0%) | 0 (0.0%) |
| 6 to 11 Years | 9 (22.5%) | 15 (19.2%) |
| 12 to 14 Years | 0 (0.0%) | 15 (42.9%) |
| 15 Years | 0 (0.0%) | 5 (25.0%) |
| 16 and 17 Years | 8 (34.8%) | 0 (0.0%) |
| 18 to 24 Years | 26 (25.2%) | 24 (32.9%) |
| 25 to 34 Years | 15 (15.1%) | 16 (18.4%) |
| 35 to 44 Years | 30 (27.8%) | 14 (14.4%) |
| 45 to 54 Years | 3 (4.4%) | 22 (24.2%) |
| 55 to 64 Years | 8 (7.3%) | 27 (24.5%) |
| 65 to 74 Years | 0 (0.0%) | 12 (16.7%) |
| 75 Years and over | 13 (56.5%) | 15 (28.3%) |
| Total | 116 (17.5%) | 177 (23.3%) |
Income Above Poverty by Sex and Age in Ronceverte
According to the poverty statistics in Ronceverte, males aged 12 to 14 years and females aged 5 years are the age groups that are most secure financially, with 100.0% of males and 100.0% of females in these age groups living above the poverty line.
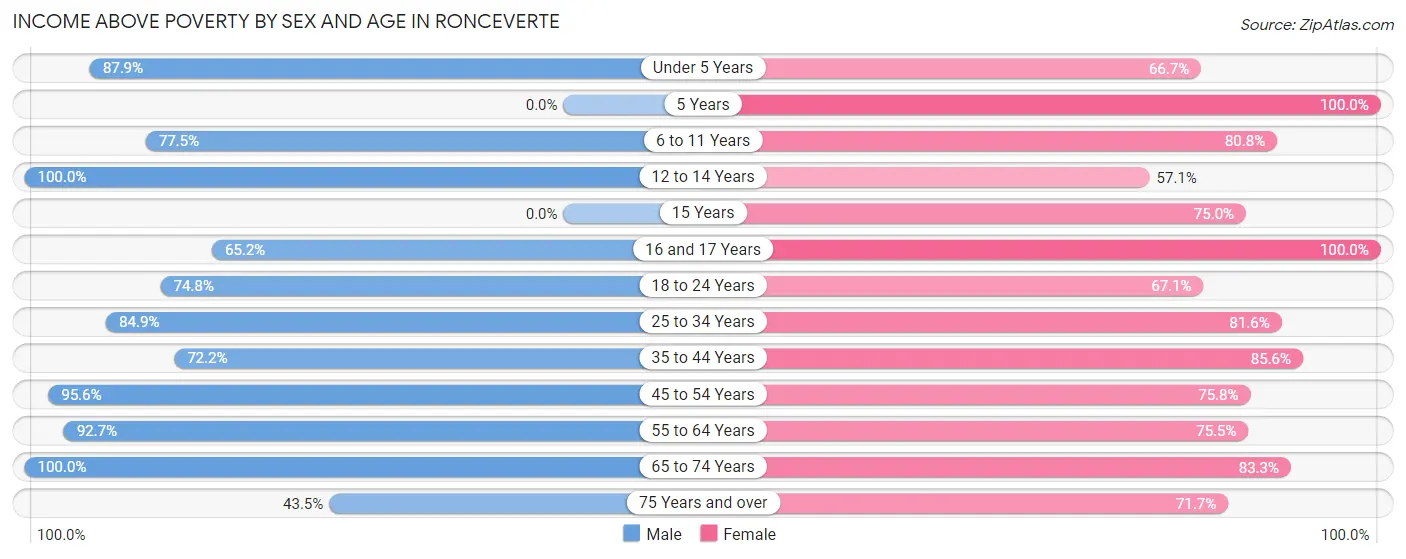
| Age Bracket | Male | Female |
| Under 5 Years | 29 (87.9%) | 24 (66.7%) |
| 5 Years | 0 (0.0%) | 6 (100.0%) |
| 6 to 11 Years | 31 (77.5%) | 63 (80.8%) |
| 12 to 14 Years | 17 (100.0%) | 20 (57.1%) |
| 15 Years | 0 (0.0%) | 15 (75.0%) |
| 16 and 17 Years | 15 (65.2%) | 2 (100.0%) |
| 18 to 24 Years | 77 (74.8%) | 49 (67.1%) |
| 25 to 34 Years | 84 (84.9%) | 71 (81.6%) |
| 35 to 44 Years | 78 (72.2%) | 83 (85.6%) |
| 45 to 54 Years | 65 (95.6%) | 69 (75.8%) |
| 55 to 64 Years | 102 (92.7%) | 83 (75.4%) |
| 65 to 74 Years | 38 (100.0%) | 60 (83.3%) |
| 75 Years and over | 10 (43.5%) | 38 (71.7%) |
| Total | 546 (82.5%) | 583 (76.7%) |
Income Below Poverty Among Married-Couple Families in Ronceverte
The poverty statistics for married-couple families in Ronceverte show that 8.6% or 20 of the total 233 families live below the poverty line. Families with 3 or 4 children have the highest poverty rate of 72.2%, comprising of 13 families. On the other hand, families with no children have the lowest poverty rate of 0.0%, which includes 0 families.
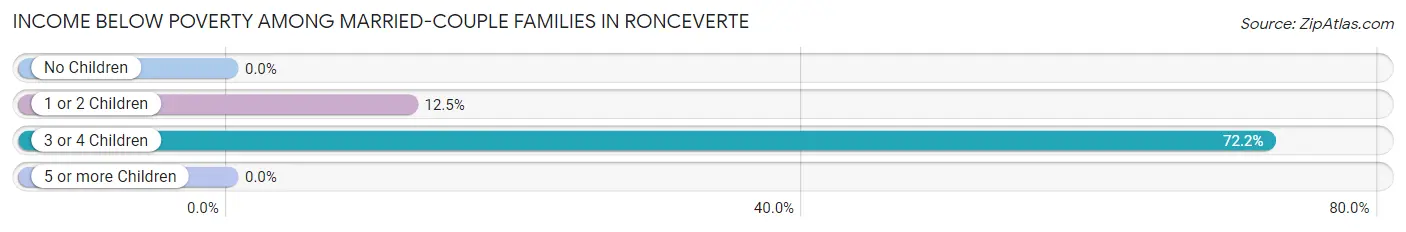
| Children | Above Poverty | Below Poverty |
| No Children | 153 (100.0%) | 0 (0.0%) |
| 1 or 2 Children | 49 (87.5%) | 7 (12.5%) |
| 3 or 4 Children | 5 (27.8%) | 13 (72.2%) |
| 5 or more Children | 6 (100.0%) | 0 (0.0%) |
| Total | 213 (91.4%) | 20 (8.6%) |
Income Below Poverty Among Single-Parent Households in Ronceverte
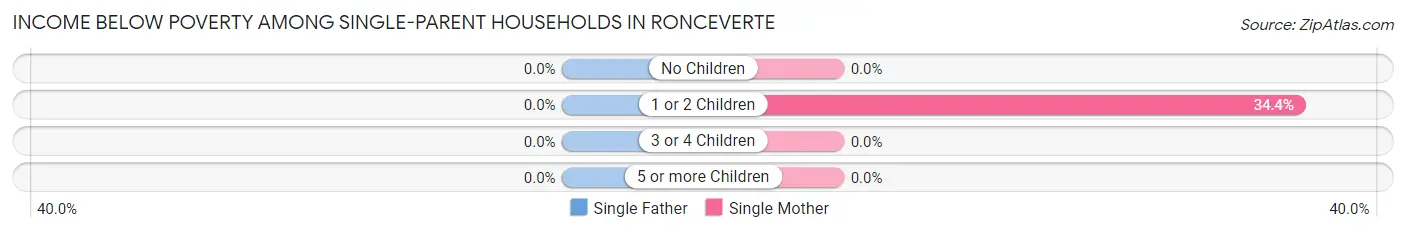
| Children | Single Father | Single Mother |
| No Children | 0 (0.0%) | 0 (0.0%) |
| 1 or 2 Children | 0 (0.0%) | 21 (34.4%) |
| 3 or 4 Children | 0 (0.0%) | 0 (0.0%) |
| 5 or more Children | 0 (0.0%) | 0 (0.0%) |
| Total | 0 (0.0%) | 21 (19.3%) |
Income Below Poverty Among Married-Couple vs Single-Parent Households in Ronceverte
The poverty data for Ronceverte shows that 20 of the married-couple family households (8.6%) and 21 of the single-parent households (14.6%) are living below the poverty level. Within the married-couple family households, those with 3 or 4 children have the highest poverty rate, with 13 households (72.2%) falling below the poverty line. Among the single-parent households, those with 1 or 2 children have the highest poverty rate, with 21 household (22.8%) living below poverty.
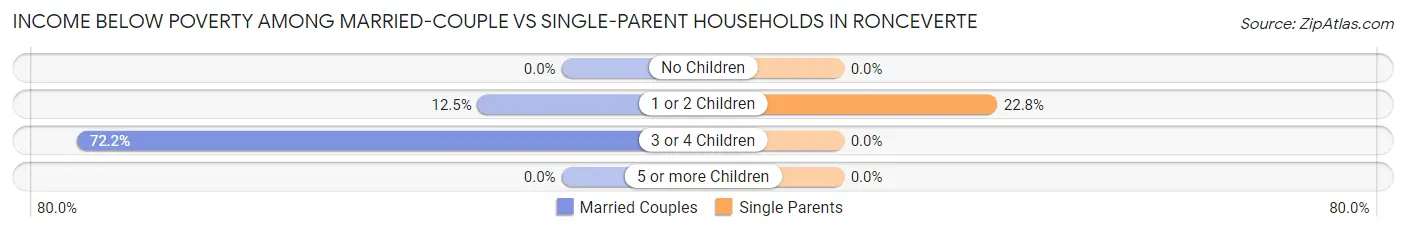
| Children | Married-Couple Families | Single-Parent Households |
| No Children | 0 (0.0%) | 0 (0.0%) |
| 1 or 2 Children | 7 (12.5%) | 21 (22.8%) |
| 3 or 4 Children | 13 (72.2%) | 0 (0.0%) |
| 5 or more Children | 0 (0.0%) | 0 (0.0%) |
| Total | 20 (8.6%) | 21 (14.6%) |
Race in Ronceverte
The most populous races in Ronceverte are White / Caucasian (1,304 | 91.4%), Black / African American (62 | 4.3%), and Two or more Races (40 | 2.8%).
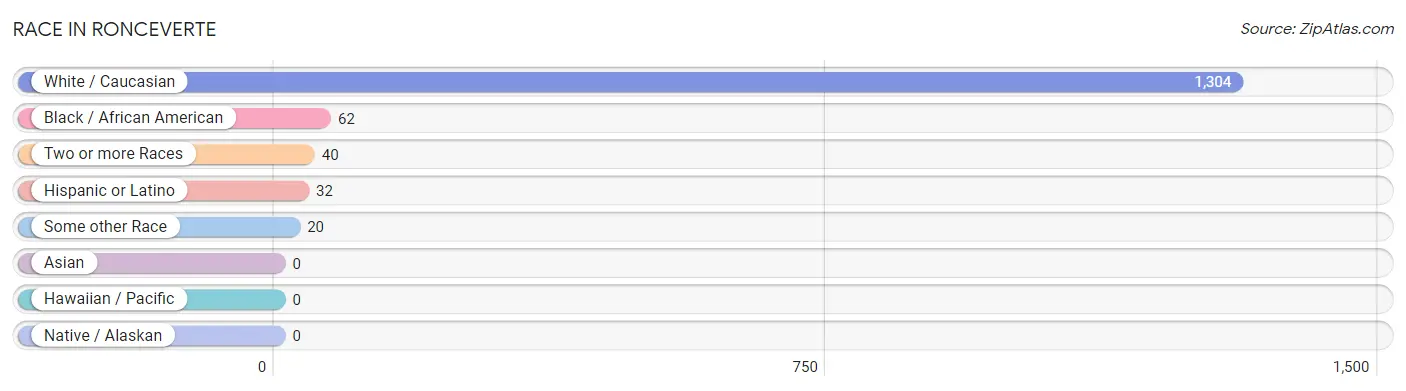
| Race | # Population | % Population |
| Asian | 0 | 0.0% |
| Black / African American | 62 | 4.3% |
| Hawaiian / Pacific | 0 | 0.0% |
| Hispanic or Latino | 32 | 2.2% |
| Native / Alaskan | 0 | 0.0% |
| White / Caucasian | 1,304 | 91.4% |
| Two or more Races | 40 | 2.8% |
| Some other Race | 20 | 1.4% |
| Total | 1,426 | 100.0% |
Ancestry in Ronceverte
The most populous ancestries reported in Ronceverte are American (543 | 38.1%), Irish (152 | 10.7%), English (110 | 7.7%), German (104 | 7.3%), and Italian (50 | 3.5%), together accounting for 67.2% of all Ronceverte residents.
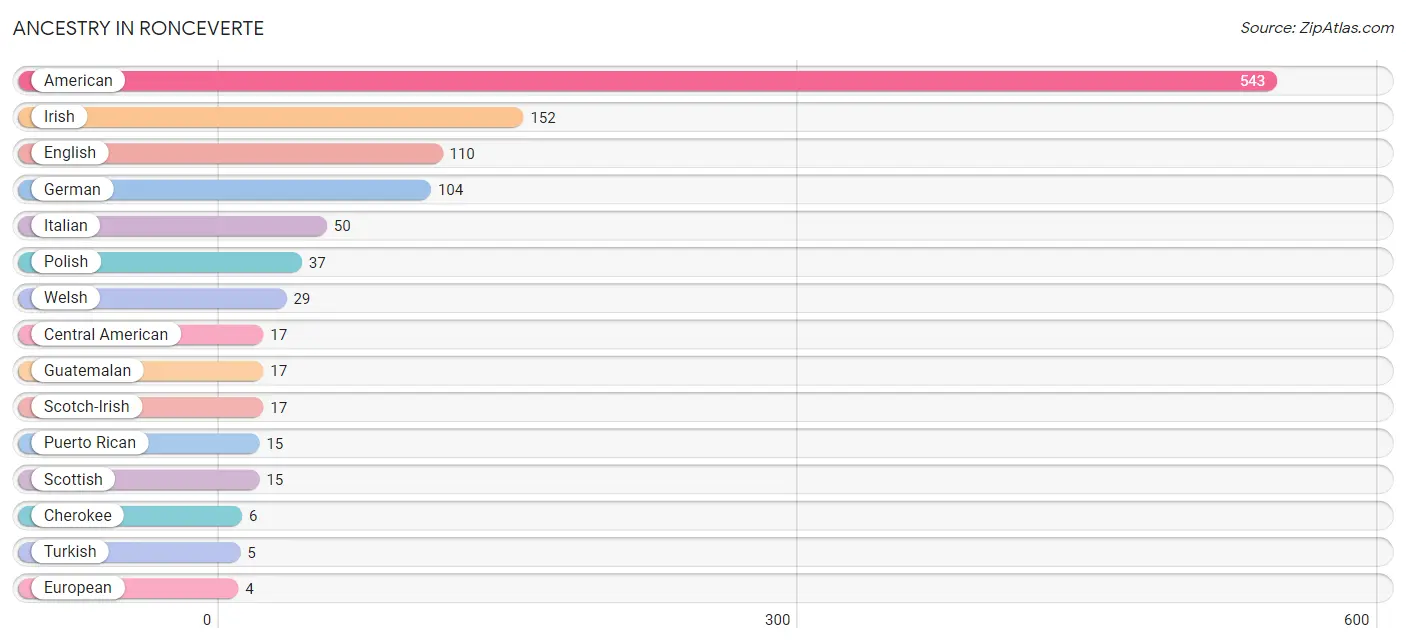
| Ancestry | # Population | % Population |
| American | 543 | 38.1% |
| Central American | 17 | 1.2% |
| Cherokee | 6 | 0.4% |
| Danish | 2 | 0.1% |
| Dutch | 2 | 0.1% |
| English | 110 | 7.7% |
| European | 4 | 0.3% |
| French | 4 | 0.3% |
| German | 104 | 7.3% |
| Guatemalan | 17 | 1.2% |
| Irish | 152 | 10.7% |
| Italian | 50 | 3.5% |
| Jamaican | 3 | 0.2% |
| Polish | 37 | 2.6% |
| Puerto Rican | 15 | 1.1% |
| Scotch-Irish | 17 | 1.2% |
| Scottish | 15 | 1.1% |
| Swedish | 2 | 0.1% |
| Swiss | 3 | 0.2% |
| Turkish | 5 | 0.4% |
| Welsh | 29 | 2.0% | View All 21 Rows |
Immigrants in Ronceverte
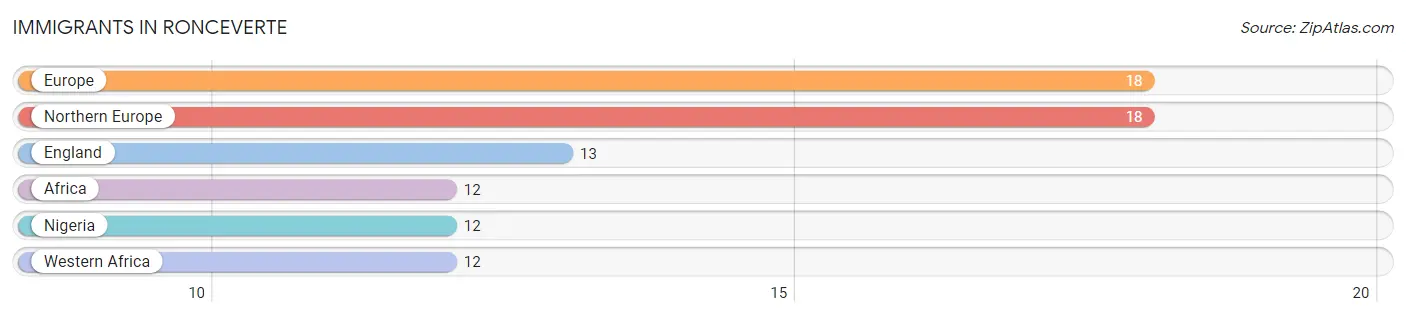
The most numerous immigrant groups reported in Ronceverte came from Europe (18 | 1.3%), Northern Europe (18 | 1.3%), England (13 | 0.9%), Africa (12 | 0.8%), and Nigeria (12 | 0.8%), together accounting for 5.1% of all Ronceverte residents.
| Immigration Origin | # Population | % Population |
| Africa | 12 | 0.8% |
| England | 13 | 0.9% |
| Europe | 18 | 1.3% |
| Nigeria | 12 | 0.8% |
| Northern Europe | 18 | 1.3% |
| Western Africa | 12 | 0.8% | View All 6 Rows |
Sex and Age in Ronceverte
Sex and Age in Ronceverte
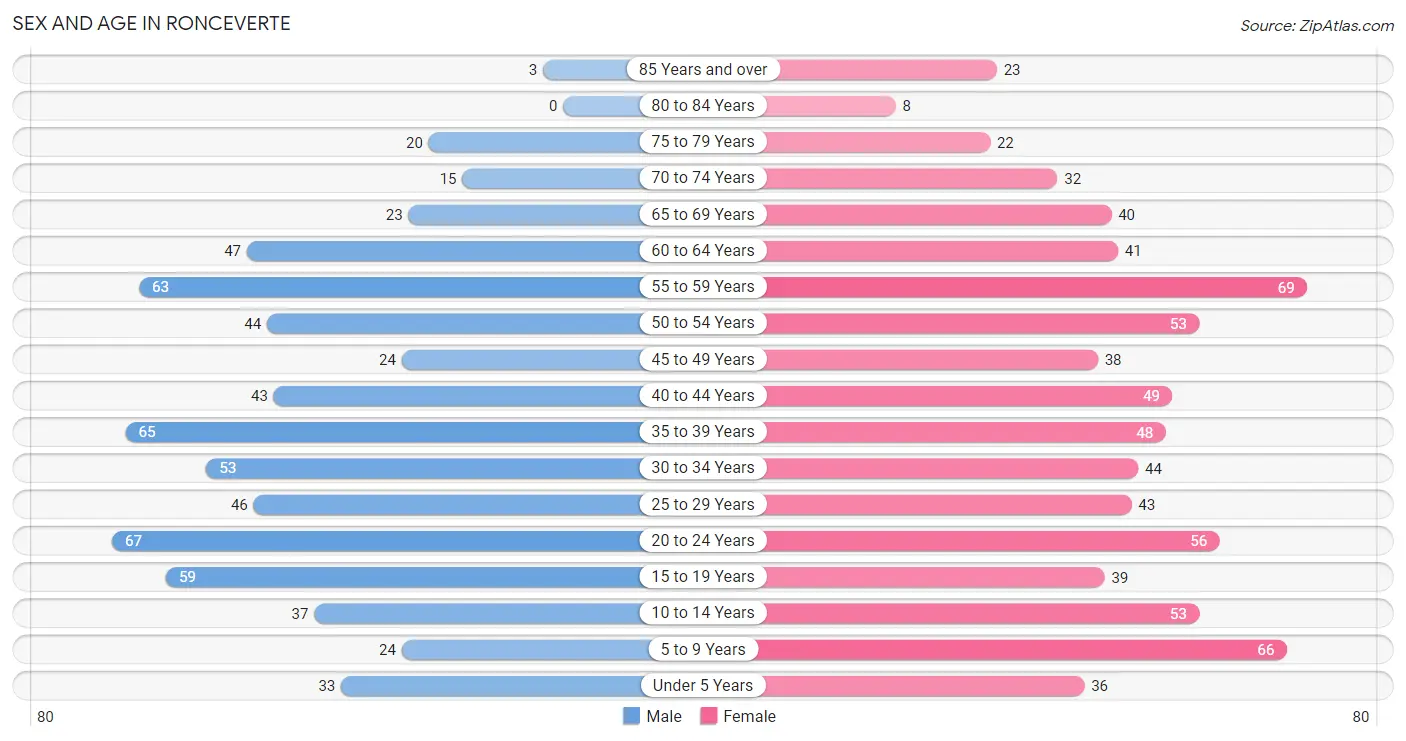
The most populous age groups in Ronceverte are 20 to 24 Years (67 | 10.1%) for men and 55 to 59 Years (69 | 9.1%) for women.
| Age Bracket | Male | Female |
| Under 5 Years | 33 (5.0%) | 36 (4.7%) |
| 5 to 9 Years | 24 (3.6%) | 66 (8.7%) |
| 10 to 14 Years | 37 (5.6%) | 53 (7.0%) |
| 15 to 19 Years | 59 (8.9%) | 39 (5.1%) |
| 20 to 24 Years | 67 (10.1%) | 56 (7.4%) |
| 25 to 29 Years | 46 (6.9%) | 43 (5.7%) |
| 30 to 34 Years | 53 (8.0%) | 44 (5.8%) |
| 35 to 39 Years | 65 (9.8%) | 48 (6.3%) |
| 40 to 44 Years | 43 (6.5%) | 49 (6.5%) |
| 45 to 49 Years | 24 (3.6%) | 38 (5.0%) |
| 50 to 54 Years | 44 (6.6%) | 53 (7.0%) |
| 55 to 59 Years | 63 (9.5%) | 69 (9.1%) |
| 60 to 64 Years | 47 (7.1%) | 41 (5.4%) |
| 65 to 69 Years | 23 (3.5%) | 40 (5.3%) |
| 70 to 74 Years | 15 (2.2%) | 32 (4.2%) |
| 75 to 79 Years | 20 (3.0%) | 22 (2.9%) |
| 80 to 84 Years | 0 (0.0%) | 8 (1.1%) |
| 85 Years and over | 3 (0.4%) | 23 (3.0%) |
| Total | 666 (100.0%) | 760 (100.0%) |
Families and Households in Ronceverte
Median Family Size in Ronceverte
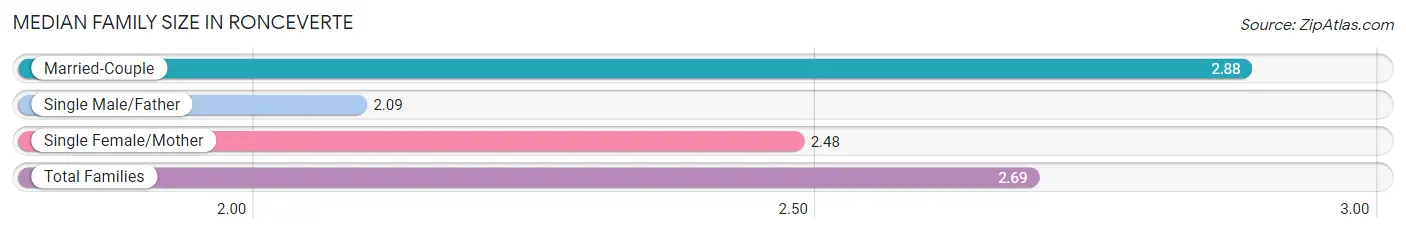
The median family size in Ronceverte is 2.69 persons per family, with married-couple families (233 | 61.8%) accounting for the largest median family size of 2.88 persons per family. On the other hand, single male/father families (35 | 9.3%) represent the smallest median family size with 2.09 persons per family.
| Family Type | # Families | Family Size |
| Married-Couple | 233 (61.8%) | 2.88 |
| Single Male/Father | 35 (9.3%) | 2.09 |
| Single Female/Mother | 109 (28.9%) | 2.48 |
| Total Families | 377 (100.0%) | 2.69 |
Median Household Size in Ronceverte
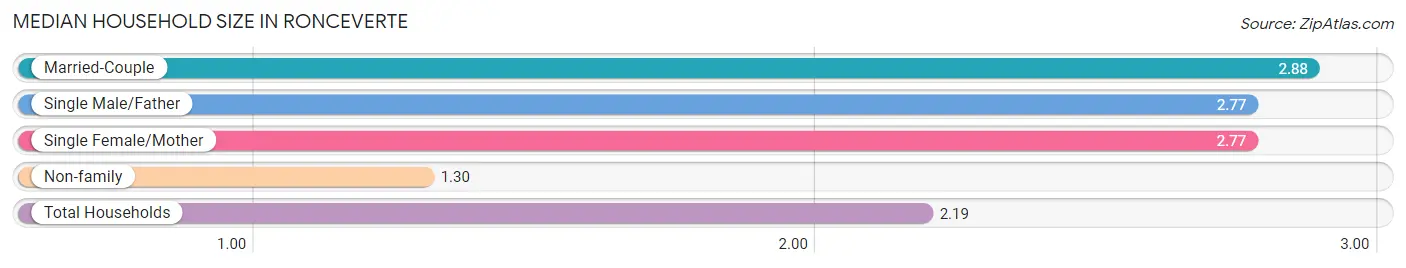
The median household size in Ronceverte is 2.19 persons per household, with married-couple households (233 | 35.8%) accounting for the largest median household size of 2.88 persons per household. non-family households (274 | 42.1%) represent the smallest median household size with 1.30 persons per household.
| Household Type | # Households | Household Size |
| Married-Couple | 233 (35.8%) | 2.88 |
| Single Male/Father | 35 (5.4%) | 2.77 |
| Single Female/Mother | 109 (16.7%) | 2.77 |
| Non-family | 274 (42.1%) | 1.30 |
| Total Households | 651 (100.0%) | 2.19 |
Household Size by Marriage Status in Ronceverte
Out of a total of 651 households in Ronceverte, 377 (57.9%) are family households, while 274 (42.1%) are nonfamily households. The most numerous type of family households are 2-person households, comprising 150, and the most common type of nonfamily households are 1-person households, comprising 200.
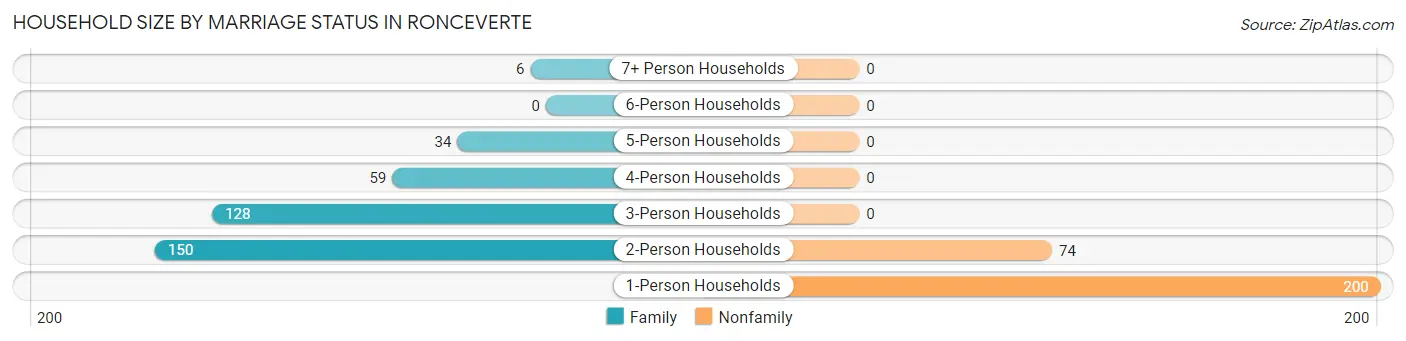
| Household Size | Family Households | Nonfamily Households |
| 1-Person Households | - | 200 (30.7%) |
| 2-Person Households | 150 (23.0%) | 74 (11.4%) |
| 3-Person Households | 128 (19.7%) | 0 (0.0%) |
| 4-Person Households | 59 (9.1%) | 0 (0.0%) |
| 5-Person Households | 34 (5.2%) | 0 (0.0%) |
| 6-Person Households | 0 (0.0%) | 0 (0.0%) |
| 7+ Person Households | 6 (0.9%) | 0 (0.0%) |
| Total | 377 (57.9%) | 274 (42.1%) |
Female Fertility in Ronceverte
Fertility by Age in Ronceverte
Average fertility rate in Ronceverte is 60.0 births per 1,000 women. Women in the age bracket of 20 to 34 years have the highest fertility rate with 112.0 births per 1,000 women. Women in the age bracket of 20 to 34 years acount for 80.0% of all women with births.
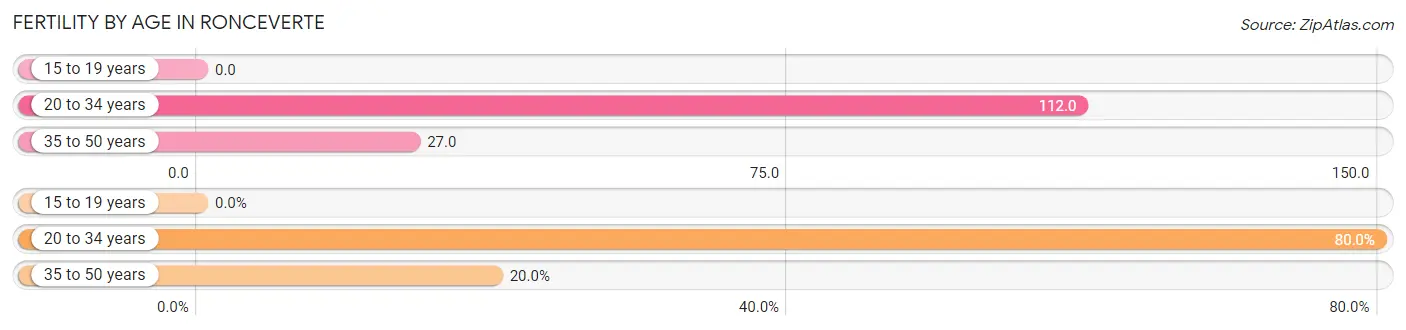
| Age Bracket | Women with Births | Births / 1,000 Women |
| 15 to 19 years | 0 (0.0%) | 0.0 |
| 20 to 34 years | 16 (80.0%) | 112.0 |
| 35 to 50 years | 4 (20.0%) | 27.0 |
| Total | 20 (100.0%) | 60.0 |
Fertility by Age by Marriage Status in Ronceverte
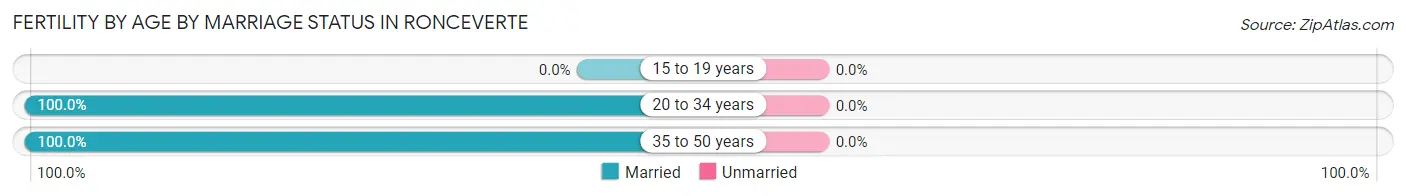
| Age Bracket | Married | Unmarried |
| 15 to 19 years | 0 (0.0%) | 0 (0.0%) |
| 20 to 34 years | 16 (100.0%) | 0 (0.0%) |
| 35 to 50 years | 4 (100.0%) | 0 (0.0%) |
| Total | 20 (100.0%) | 0 (0.0%) |
Fertility by Education in Ronceverte
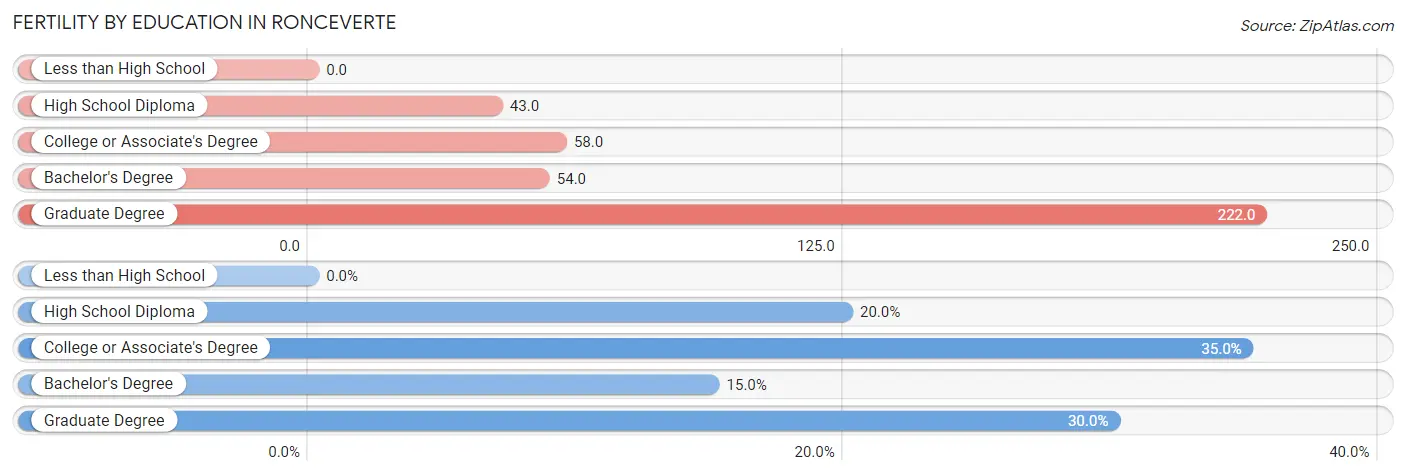
| Educational Attainment | Women with Births | Births / 1,000 Women |
| Less than High School | 0 (0.0%) | 0.0 |
| High School Diploma | 4 (20.0%) | 43.0 |
| College or Associate's Degree | 7 (35.0%) | 58.0 |
| Bachelor's Degree | 3 (15.0%) | 54.0 |
| Graduate Degree | 6 (30.0%) | 222.0 |
| Total | 20 (100.0%) | 60.0 |
Fertility by Education by Marriage Status in Ronceverte
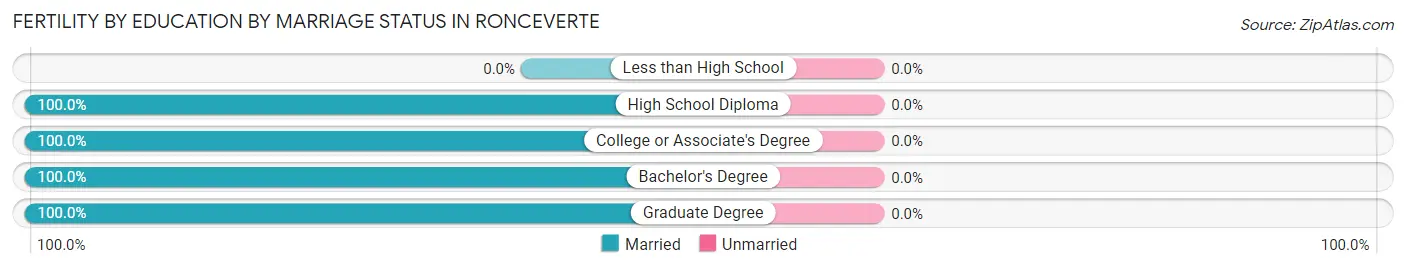
| Educational Attainment | Married | Unmarried |
| Less than High School | 0 (0.0%) | 0 (0.0%) |
| High School Diploma | 4 (100.0%) | 0 (0.0%) |
| College or Associate's Degree | 7 (100.0%) | 0 (0.0%) |
| Bachelor's Degree | 3 (100.0%) | 0 (0.0%) |
| Graduate Degree | 6 (100.0%) | 0 (0.0%) |
| Total | 20 (100.0%) | 0 (0.0%) |
Employment Characteristics in Ronceverte
Employment by Class of Employer in Ronceverte
Among the 761 employed individuals in Ronceverte, private company employees (507 | 66.6%), state government employees (108 | 14.2%), and local government employees (61 | 8.0%) make up the most common classes of employment.
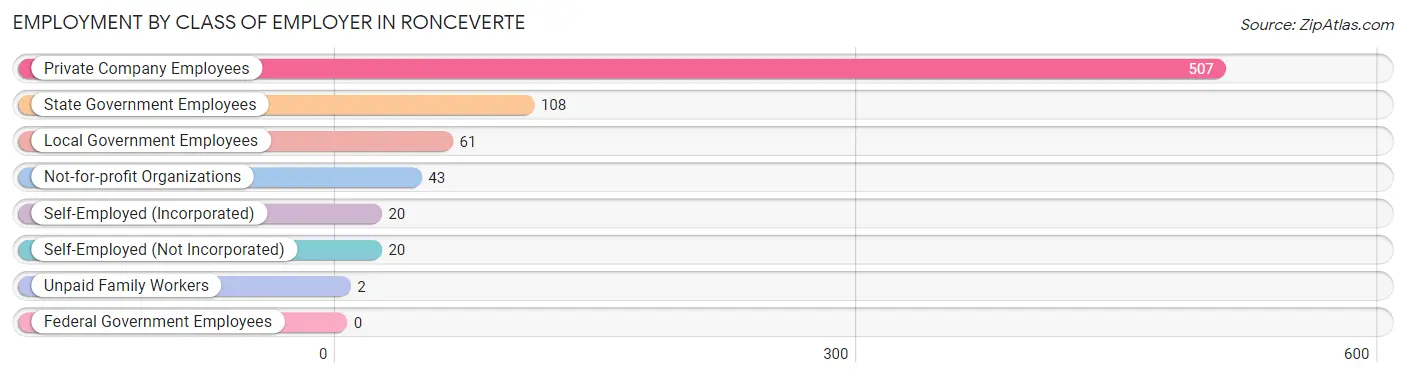
| Employer Class | # Employees | % Employees |
| Private Company Employees | 507 | 66.6% |
| Self-Employed (Incorporated) | 20 | 2.6% |
| Self-Employed (Not Incorporated) | 20 | 2.6% |
| Not-for-profit Organizations | 43 | 5.7% |
| Local Government Employees | 61 | 8.0% |
| State Government Employees | 108 | 14.2% |
| Federal Government Employees | 0 | 0.0% |
| Unpaid Family Workers | 2 | 0.3% |
| Total | 761 | 100.0% |
Employment Status by Age in Ronceverte
According to the labor force statistics for Ronceverte, out of the total population over 16 years of age (1,157), 68.4% or 791 individuals are in the labor force, with 3.2% or 25 of them unemployed. The age group with the highest labor force participation rate is 20 to 24 years, with 94.3% or 116 individuals in the labor force. Within the labor force, the 16 to 19 years age range has the highest percentage of unemployed individuals, with 23.3% or 10 of them being unemployed.
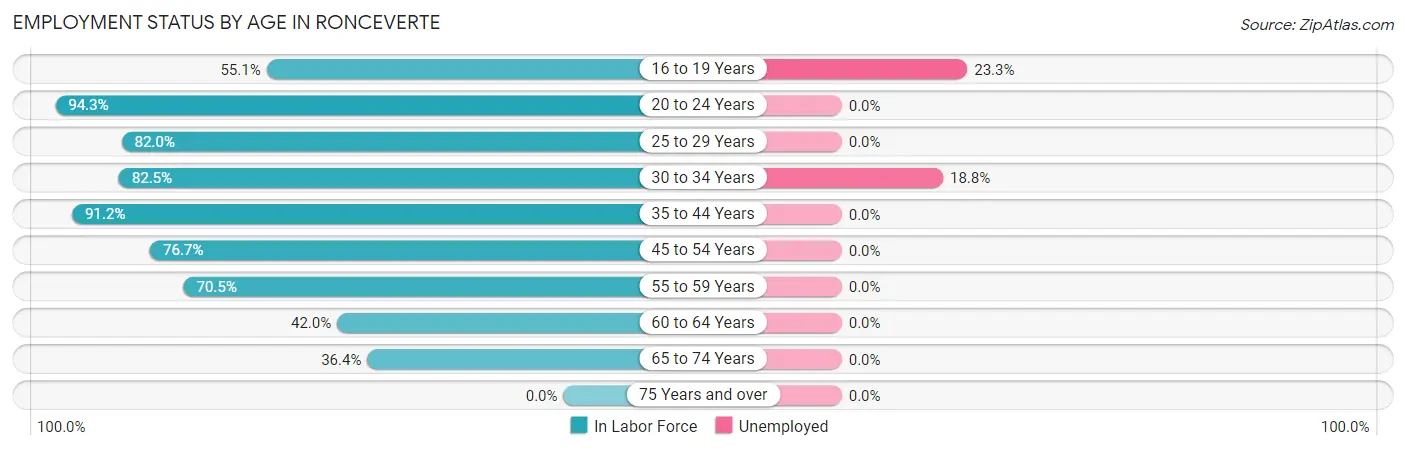
| Age Bracket | In Labor Force | Unemployed |
| 16 to 19 Years | 43 (55.1%) | 10 (23.3%) |
| 20 to 24 Years | 116 (94.3%) | 0 (0.0%) |
| 25 to 29 Years | 73 (82.0%) | 0 (0.0%) |
| 30 to 34 Years | 80 (82.5%) | 15 (18.8%) |
| 35 to 44 Years | 187 (91.2%) | 0 (0.0%) |
| 45 to 54 Years | 122 (76.7%) | 0 (0.0%) |
| 55 to 59 Years | 93 (70.5%) | 0 (0.0%) |
| 60 to 64 Years | 37 (42.0%) | 0 (0.0%) |
| 65 to 74 Years | 40 (36.4%) | 0 (0.0%) |
| 75 Years and over | 0 (0.0%) | 0 (0.0%) |
| Total | 791 (68.4%) | 25 (3.2%) |
Employment Status by Educational Attainment in Ronceverte
According to labor force statistics for Ronceverte, 76.9% of individuals (592) out of the total population between 25 and 64 years of age (770) are in the labor force, with 2.5% or 15 of them being unemployed. The group with the highest labor force participation rate are those with the educational attainment of bachelor's degree or higher, with 93.0% or 120 individuals in the labor force. Within the labor force, individuals with high school diploma education have the highest percentage of unemployment, with 7.2% or 15 of them being unemployed.
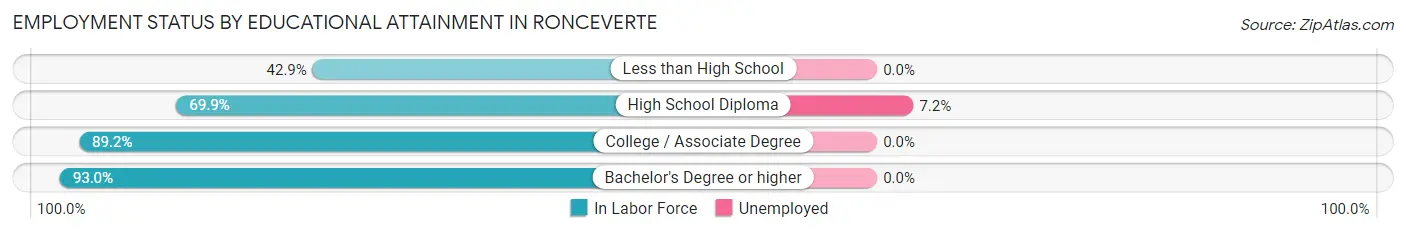
| Educational Attainment | In Labor Force | Unemployed |
| Less than High School | 39 (42.9%) | 0 (0.0%) |
| High School Diploma | 209 (69.9%) | 22 (7.2%) |
| College / Associate Degree | 224 (89.2%) | 0 (0.0%) |
| Bachelor's Degree or higher | 120 (93.0%) | 0 (0.0%) |
| Total | 592 (76.9%) | 19 (2.5%) |
Employment Occupations by Sex in Ronceverte
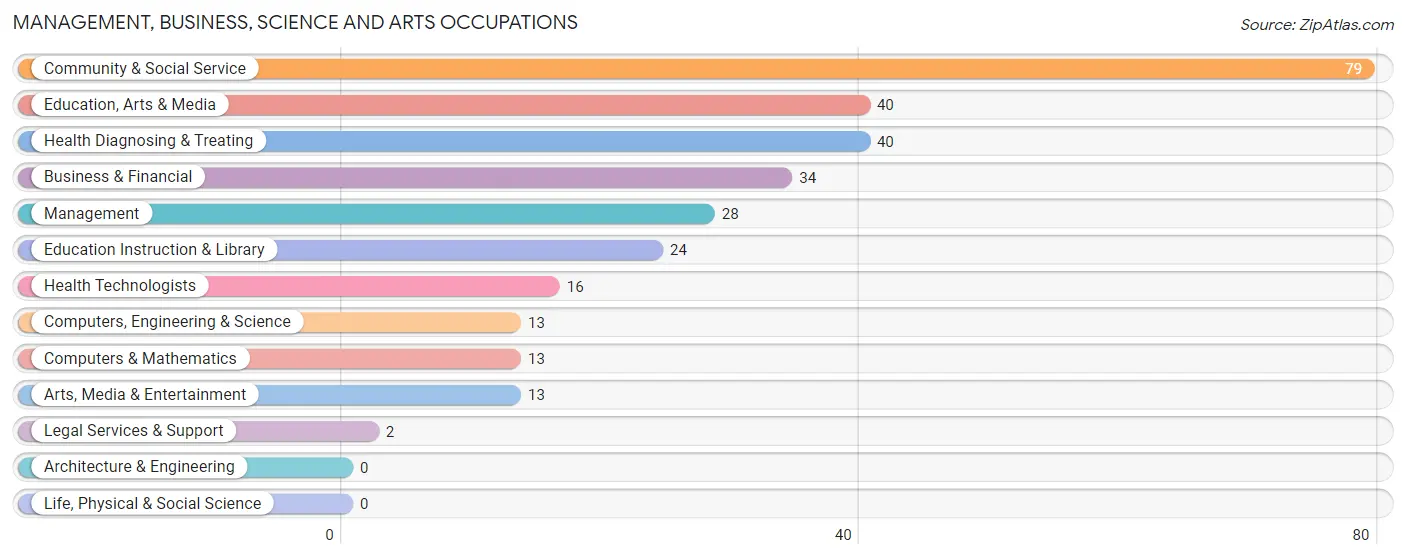
Management, Business, Science and Arts Occupations
The most common Management, Business, Science and Arts occupations in Ronceverte are Community & Social Service (79 | 10.3%), Education, Arts & Media (40 | 5.2%), Health Diagnosing & Treating (40 | 5.2%), Business & Financial (34 | 4.4%), and Management (28 | 3.7%).
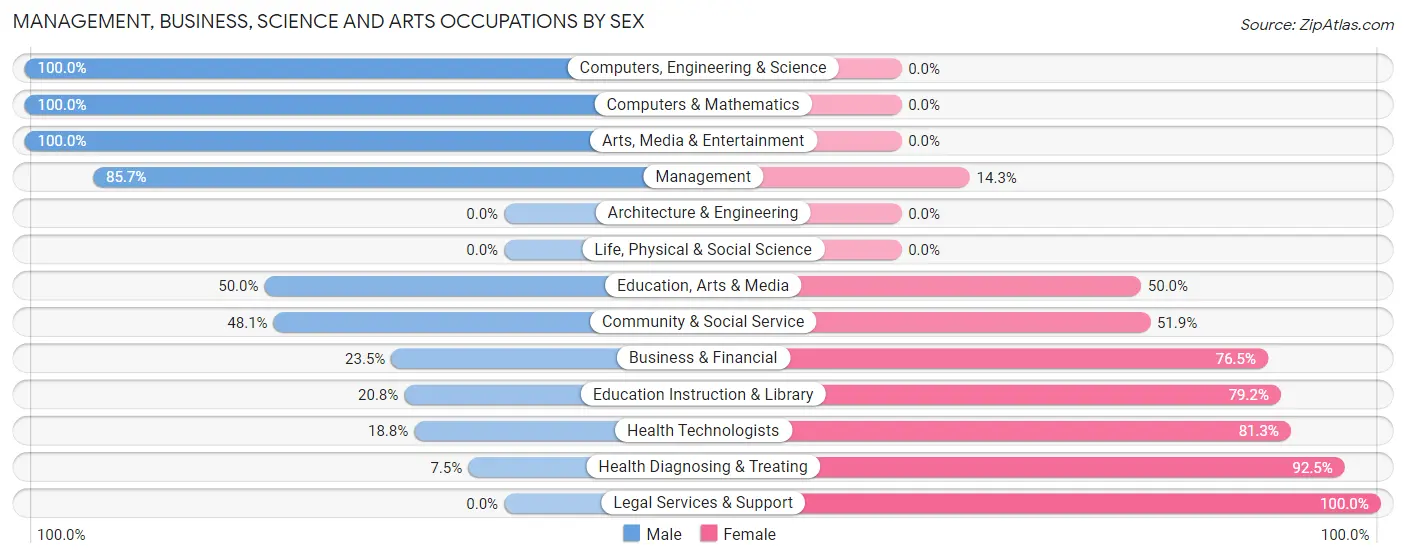
Management, Business, Science and Arts Occupations by Sex
Within the Management, Business, Science and Arts occupations in Ronceverte, the most male-oriented occupations are Computers, Engineering & Science (100.0%), Computers & Mathematics (100.0%), and Arts, Media & Entertainment (100.0%), while the most female-oriented occupations are Legal Services & Support (100.0%), Health Diagnosing & Treating (92.5%), and Health Technologists (81.2%).
| Occupation | Male | Female |
| Management | 24 (85.7%) | 4 (14.3%) |
| Business & Financial | 8 (23.5%) | 26 (76.5%) |
| Computers, Engineering & Science | 13 (100.0%) | 0 (0.0%) |
| Computers & Mathematics | 13 (100.0%) | 0 (0.0%) |
| Architecture & Engineering | 0 (0.0%) | 0 (0.0%) |
| Life, Physical & Social Science | 0 (0.0%) | 0 (0.0%) |
| Community & Social Service | 38 (48.1%) | 41 (51.9%) |
| Education, Arts & Media | 20 (50.0%) | 20 (50.0%) |
| Legal Services & Support | 0 (0.0%) | 2 (100.0%) |
| Education Instruction & Library | 5 (20.8%) | 19 (79.2%) |
| Arts, Media & Entertainment | 13 (100.0%) | 0 (0.0%) |
| Health Diagnosing & Treating | 3 (7.5%) | 37 (92.5%) |
| Health Technologists | 3 (18.8%) | 13 (81.2%) |
| Total (Category) | 86 (44.3%) | 108 (55.7%) |
| Total (Overall) | 411 (53.7%) | 355 (46.3%) |
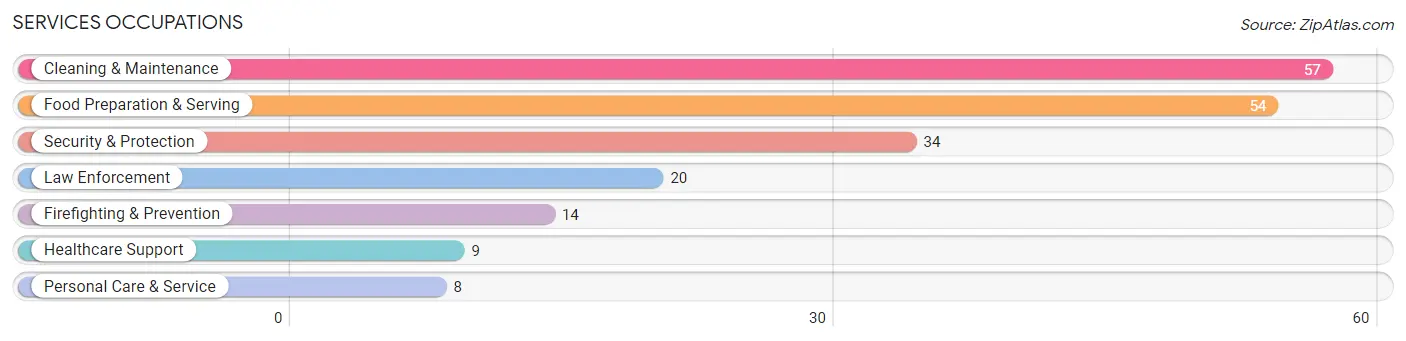
Services Occupations
The most common Services occupations in Ronceverte are Cleaning & Maintenance (57 | 7.4%), Food Preparation & Serving (54 | 7.0%), Security & Protection (34 | 4.4%), Law Enforcement (20 | 2.6%), and Firefighting & Prevention (14 | 1.8%).
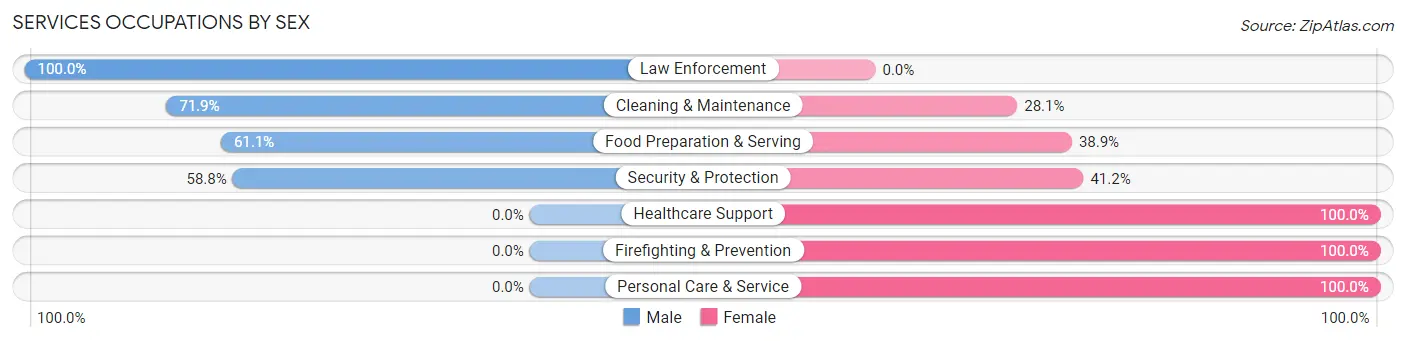
Services Occupations by Sex
Within the Services occupations in Ronceverte, the most male-oriented occupations are Law Enforcement (100.0%), Cleaning & Maintenance (71.9%), and Food Preparation & Serving (61.1%), while the most female-oriented occupations are Healthcare Support (100.0%), Firefighting & Prevention (100.0%), and Personal Care & Service (100.0%).
| Occupation | Male | Female |
| Healthcare Support | 0 (0.0%) | 9 (100.0%) |
| Security & Protection | 20 (58.8%) | 14 (41.2%) |
| Firefighting & Prevention | 0 (0.0%) | 14 (100.0%) |
| Law Enforcement | 20 (100.0%) | 0 (0.0%) |
| Food Preparation & Serving | 33 (61.1%) | 21 (38.9%) |
| Cleaning & Maintenance | 41 (71.9%) | 16 (28.1%) |
| Personal Care & Service | 0 (0.0%) | 8 (100.0%) |
| Total (Category) | 94 (58.0%) | 68 (42.0%) |
| Total (Overall) | 411 (53.7%) | 355 (46.3%) |
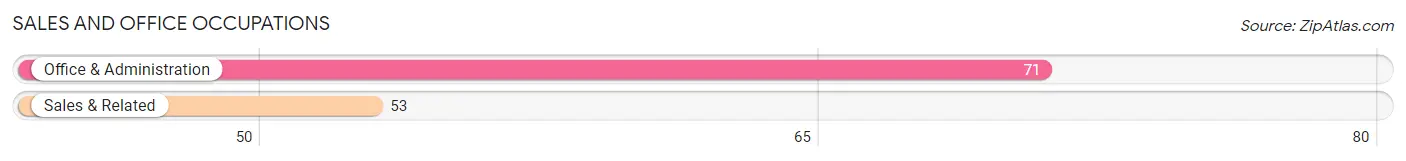
Sales and Office Occupations
The most common Sales and Office occupations in Ronceverte are Office & Administration (71 | 9.3%), and Sales & Related (53 | 6.9%).
Sales and Office Occupations by Sex
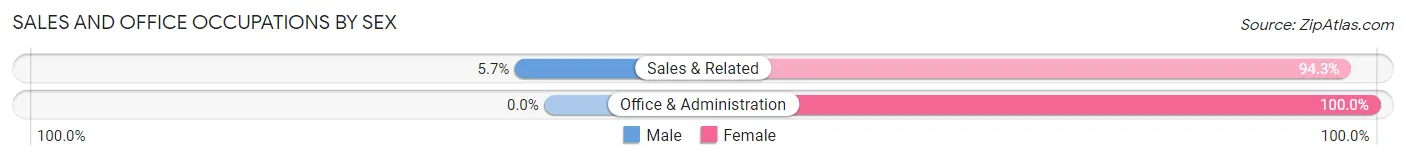
| Occupation | Male | Female |
| Sales & Related | 3 (5.7%) | 50 (94.3%) |
| Office & Administration | 0 (0.0%) | 71 (100.0%) |
| Total (Category) | 3 (2.4%) | 121 (97.6%) |
| Total (Overall) | 411 (53.7%) | 355 (46.3%) |
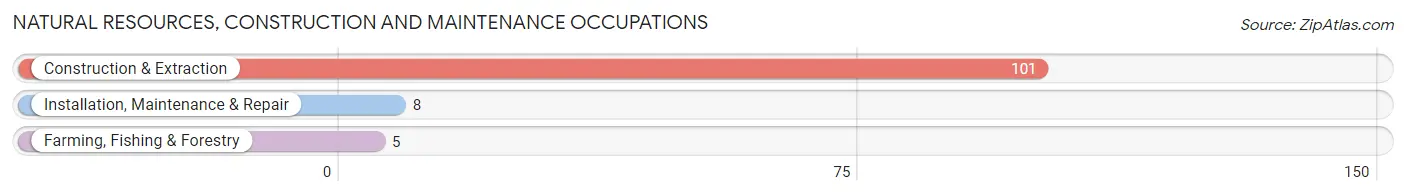
Natural Resources, Construction and Maintenance Occupations
The most common Natural Resources, Construction and Maintenance occupations in Ronceverte are Construction & Extraction (101 | 13.2%), Installation, Maintenance & Repair (8 | 1.0%), and Farming, Fishing & Forestry (5 | 0.6%).
Natural Resources, Construction and Maintenance Occupations by Sex
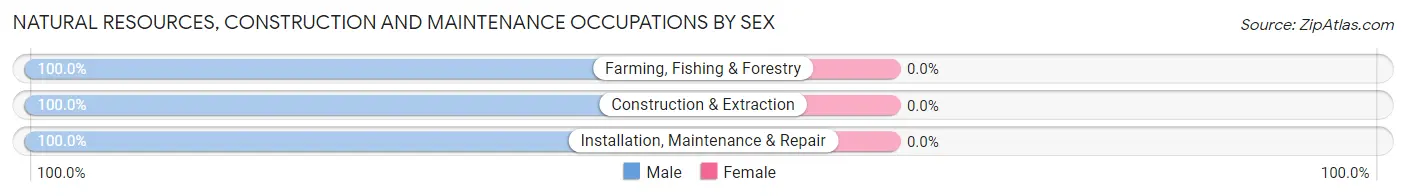
| Occupation | Male | Female |
| Farming, Fishing & Forestry | 5 (100.0%) | 0 (0.0%) |
| Construction & Extraction | 101 (100.0%) | 0 (0.0%) |
| Installation, Maintenance & Repair | 8 (100.0%) | 0 (0.0%) |
| Total (Category) | 114 (100.0%) | 0 (0.0%) |
| Total (Overall) | 411 (53.7%) | 355 (46.3%) |
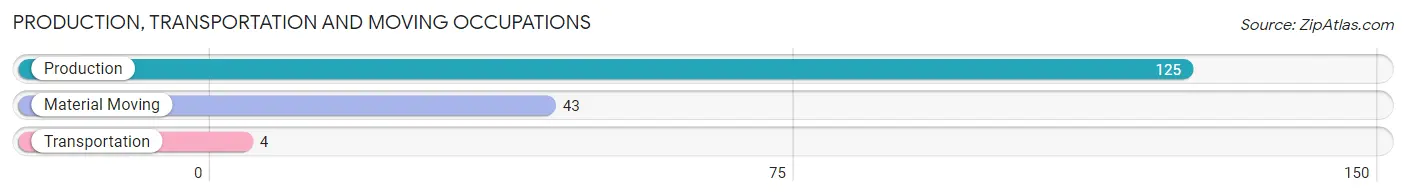
Production, Transportation and Moving Occupations
The most common Production, Transportation and Moving occupations in Ronceverte are Production (125 | 16.3%), Material Moving (43 | 5.6%), and Transportation (4 | 0.5%).
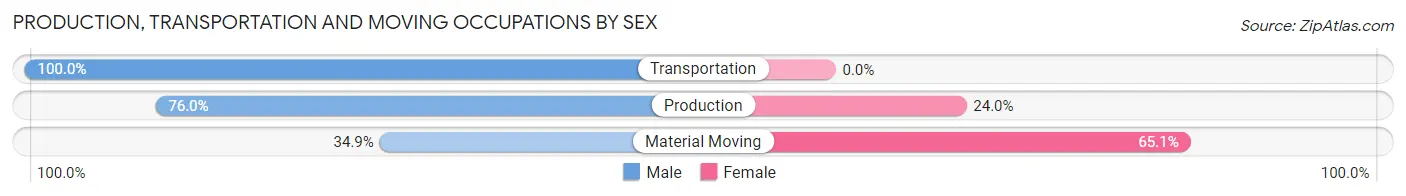
Production, Transportation and Moving Occupations by Sex
| Occupation | Male | Female |
| Production | 95 (76.0%) | 30 (24.0%) |
| Transportation | 4 (100.0%) | 0 (0.0%) |
| Material Moving | 15 (34.9%) | 28 (65.1%) |
| Total (Category) | 114 (66.3%) | 58 (33.7%) |
| Total (Overall) | 411 (53.7%) | 355 (46.3%) |
Employment Industries by Sex in Ronceverte
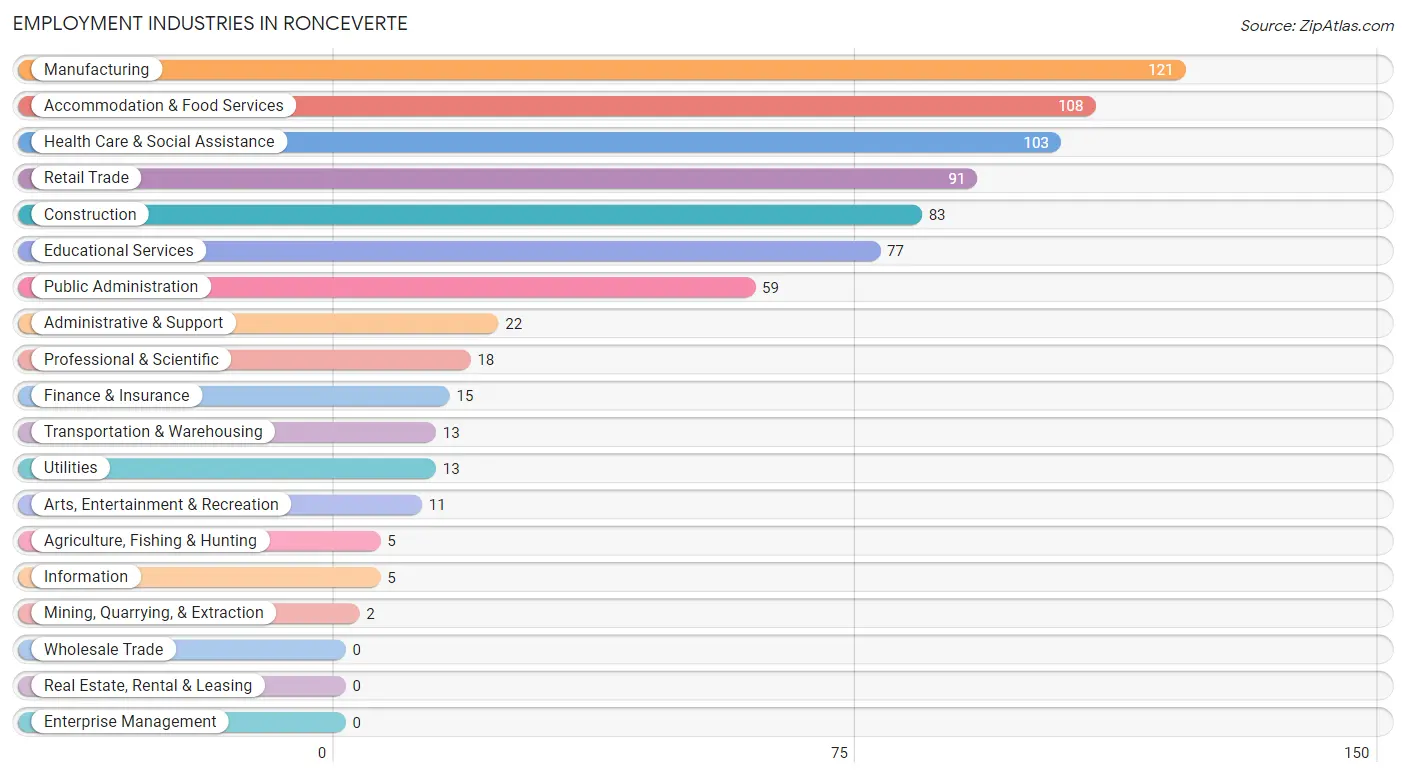
Employment Industries in Ronceverte
The major employment industries in Ronceverte include Manufacturing (121 | 15.8%), Accommodation & Food Services (108 | 14.1%), Health Care & Social Assistance (103 | 13.5%), Retail Trade (91 | 11.9%), and Construction (83 | 10.8%).
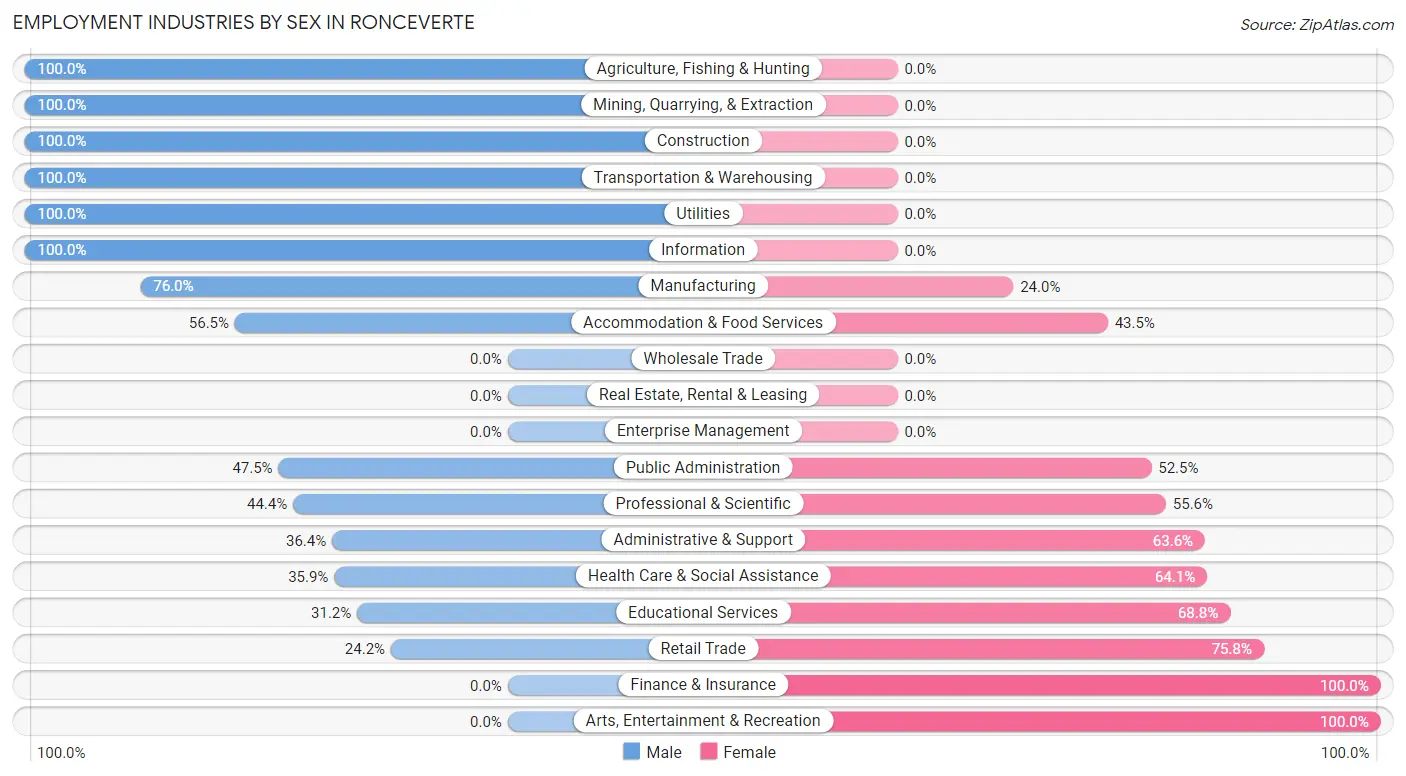
Employment Industries by Sex in Ronceverte
The Ronceverte industries that see more men than women are Agriculture, Fishing & Hunting (100.0%), Mining, Quarrying, & Extraction (100.0%), and Construction (100.0%), whereas the industries that tend to have a higher number of women are Finance & Insurance (100.0%), Arts, Entertainment & Recreation (100.0%), and Retail Trade (75.8%).
| Industry | Male | Female |
| Agriculture, Fishing & Hunting | 5 (100.0%) | 0 (0.0%) |
| Mining, Quarrying, & Extraction | 2 (100.0%) | 0 (0.0%) |
| Construction | 83 (100.0%) | 0 (0.0%) |
| Manufacturing | 92 (76.0%) | 29 (24.0%) |
| Wholesale Trade | 0 (0.0%) | 0 (0.0%) |
| Retail Trade | 22 (24.2%) | 69 (75.8%) |
| Transportation & Warehousing | 13 (100.0%) | 0 (0.0%) |
| Utilities | 13 (100.0%) | 0 (0.0%) |
| Information | 5 (100.0%) | 0 (0.0%) |
| Finance & Insurance | 0 (0.0%) | 15 (100.0%) |
| Real Estate, Rental & Leasing | 0 (0.0%) | 0 (0.0%) |
| Professional & Scientific | 8 (44.4%) | 10 (55.6%) |
| Enterprise Management | 0 (0.0%) | 0 (0.0%) |
| Administrative & Support | 8 (36.4%) | 14 (63.6%) |
| Educational Services | 24 (31.2%) | 53 (68.8%) |
| Health Care & Social Assistance | 37 (35.9%) | 66 (64.1%) |
| Arts, Entertainment & Recreation | 0 (0.0%) | 11 (100.0%) |
| Accommodation & Food Services | 61 (56.5%) | 47 (43.5%) |
| Public Administration | 28 (47.5%) | 31 (52.5%) |
| Total | 411 (53.7%) | 355 (46.3%) |
Education in Ronceverte
School Enrollment in Ronceverte
The most common levels of schooling among the 311 students in Ronceverte are high school (87 | 28.0%), elementary school (83 | 26.7%), and middle school (50 | 16.1%).
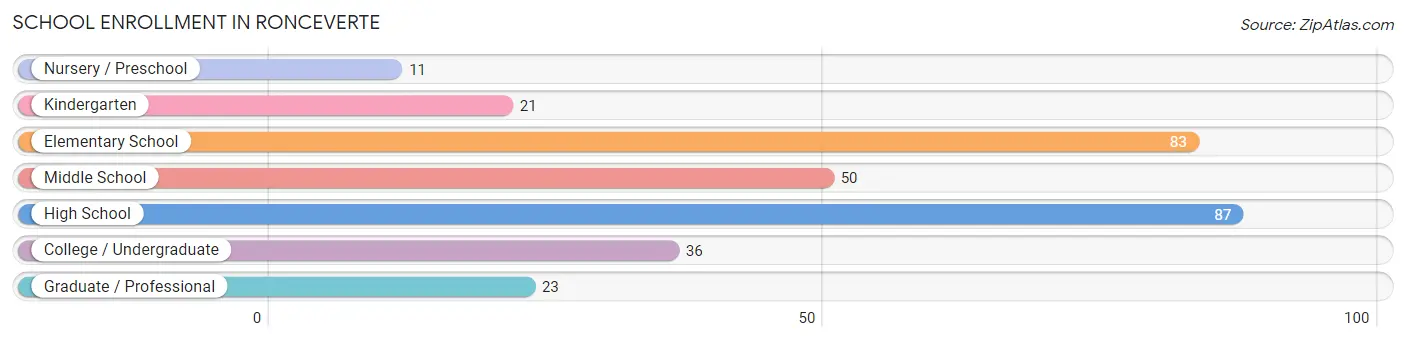
| School Level | # Students | % Students |
| Nursery / Preschool | 11 | 3.5% |
| Kindergarten | 21 | 6.8% |
| Elementary School | 83 | 26.7% |
| Middle School | 50 | 16.1% |
| High School | 87 | 28.0% |
| College / Undergraduate | 36 | 11.6% |
| Graduate / Professional | 23 | 7.4% |
| Total | 311 | 100.0% |
School Enrollment by Age by Funding Source in Ronceverte
Out of a total of 311 students who are enrolled in schools in Ronceverte, 21 (6.8%) attend a private institution, while the remaining 290 (93.2%) are enrolled in public schools. The age group of 18 to 19 year olds has the highest likelihood of being enrolled in private schools, with 9 (32.1% in the age bracket) enrolled. Conversely, the age group of 3 to 4 year olds has the lowest likelihood of being enrolled in a private school, with 11 (100.0% in the age bracket) attending a public institution.
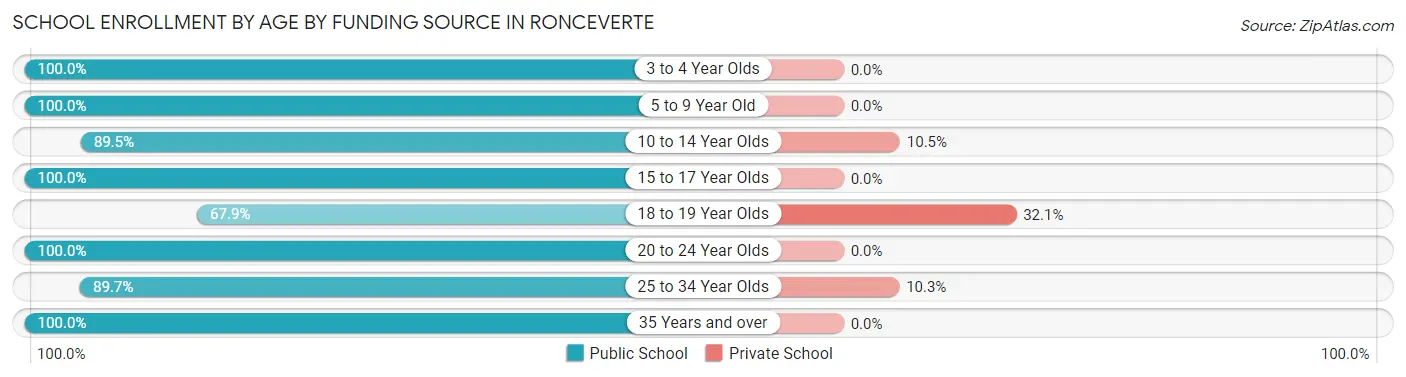
| Age Bracket | Public School | Private School |
| 3 to 4 Year Olds | 11 (100.0%) | 0 (0.0%) |
| 5 to 9 Year Old | 90 (100.0%) | 0 (0.0%) |
| 10 to 14 Year Olds | 77 (89.5%) | 9 (10.5%) |
| 15 to 17 Year Olds | 45 (100.0%) | 0 (0.0%) |
| 18 to 19 Year Olds | 19 (67.9%) | 9 (32.1%) |
| 20 to 24 Year Olds | 4 (100.0%) | 0 (0.0%) |
| 25 to 34 Year Olds | 26 (89.7%) | 3 (10.3%) |
| 35 Years and over | 18 (100.0%) | 0 (0.0%) |
| Total | 290 (93.2%) | 21 (6.8%) |
Educational Attainment by Field of Study in Ronceverte
Arts & humanities (42 | 20.3%), education (41 | 19.8%), business (29 | 14.0%), science & technology (23 | 11.1%), and computers & mathematics (15 | 7.2%) are the most common fields of study among 207 individuals in Ronceverte who have obtained a bachelor's degree or higher.
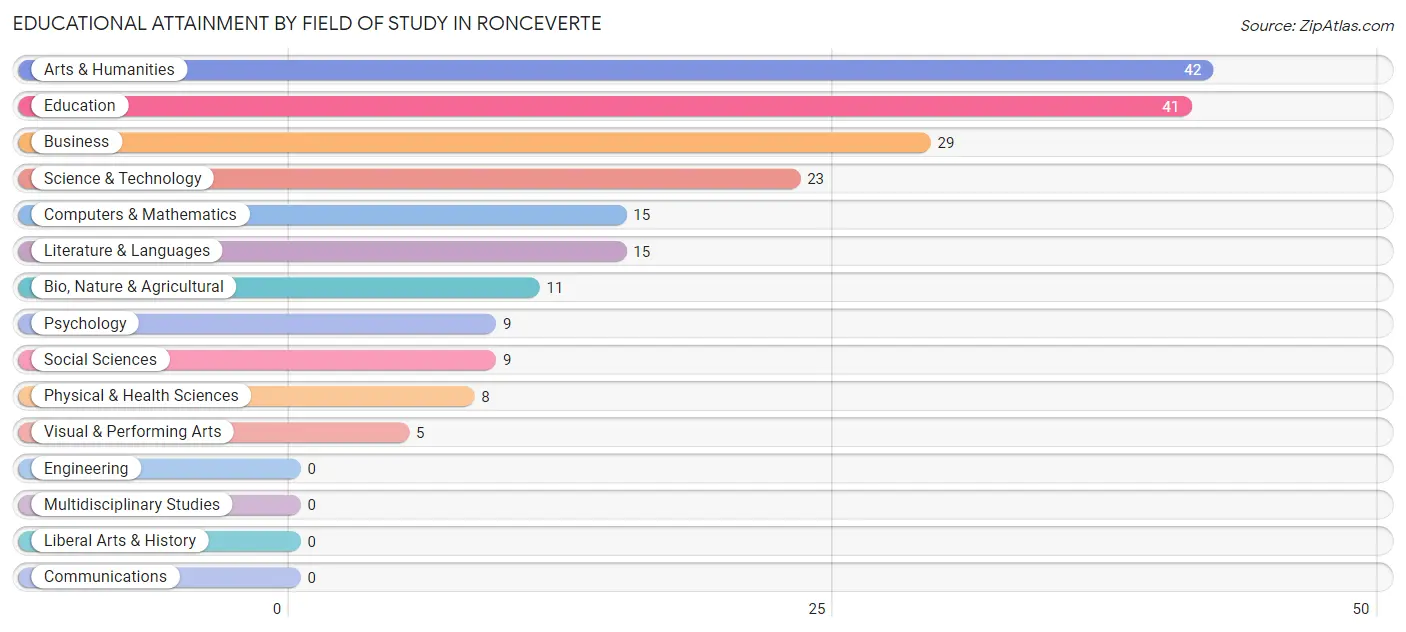
| Field of Study | # Graduates | % Graduates |
| Computers & Mathematics | 15 | 7.2% |
| Bio, Nature & Agricultural | 11 | 5.3% |
| Physical & Health Sciences | 8 | 3.9% |
| Psychology | 9 | 4.3% |
| Social Sciences | 9 | 4.3% |
| Engineering | 0 | 0.0% |
| Multidisciplinary Studies | 0 | 0.0% |
| Science & Technology | 23 | 11.1% |
| Business | 29 | 14.0% |
| Education | 41 | 19.8% |
| Literature & Languages | 15 | 7.2% |
| Liberal Arts & History | 0 | 0.0% |
| Visual & Performing Arts | 5 | 2.4% |
| Communications | 0 | 0.0% |
| Arts & Humanities | 42 | 20.3% |
| Total | 207 | 100.0% |
Transportation & Commute in Ronceverte
Vehicle Availability by Sex in Ronceverte
The most prevalent vehicle ownership categories in Ronceverte are males with 2 vehicles (169, accounting for 41.6%) and females with 2 vehicles (133, making up 47.6%).
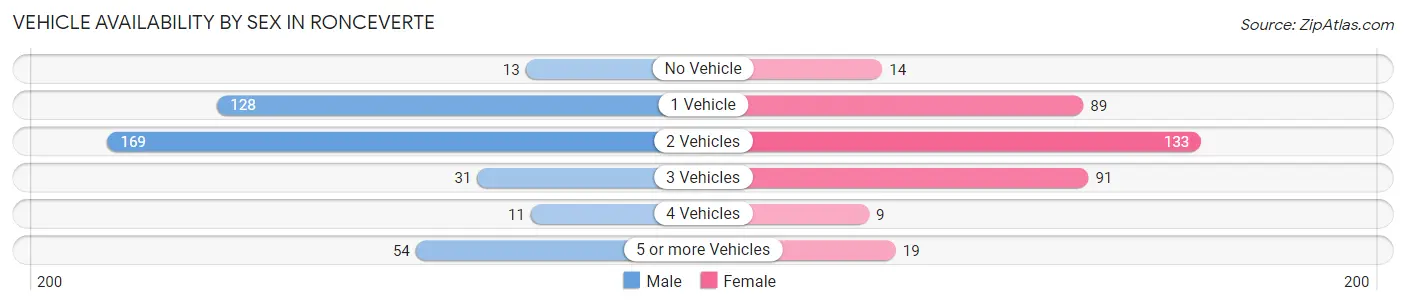
| Vehicles Available | Male | Female |
| No Vehicle | 13 (3.2%) | 14 (3.9%) |
| 1 Vehicle | 128 (31.5%) | 89 (25.1%) |
| 2 Vehicles | 169 (41.6%) | 133 (37.5%) |
| 3 Vehicles | 31 (7.6%) | 91 (25.6%) |
| 4 Vehicles | 11 (2.7%) | 9 (2.5%) |
| 5 or more Vehicles | 54 (13.3%) | 19 (5.3%) |
| Total | 406 (100.0%) | 355 (100.0%) |
Commute Time in Ronceverte
The most frequently occuring commute durations in Ronceverte are 10 to 14 minutes (195 commuters, 26.0%), 15 to 19 minutes (133 commuters, 17.7%), and 5 to 9 minutes (100 commuters, 13.3%).
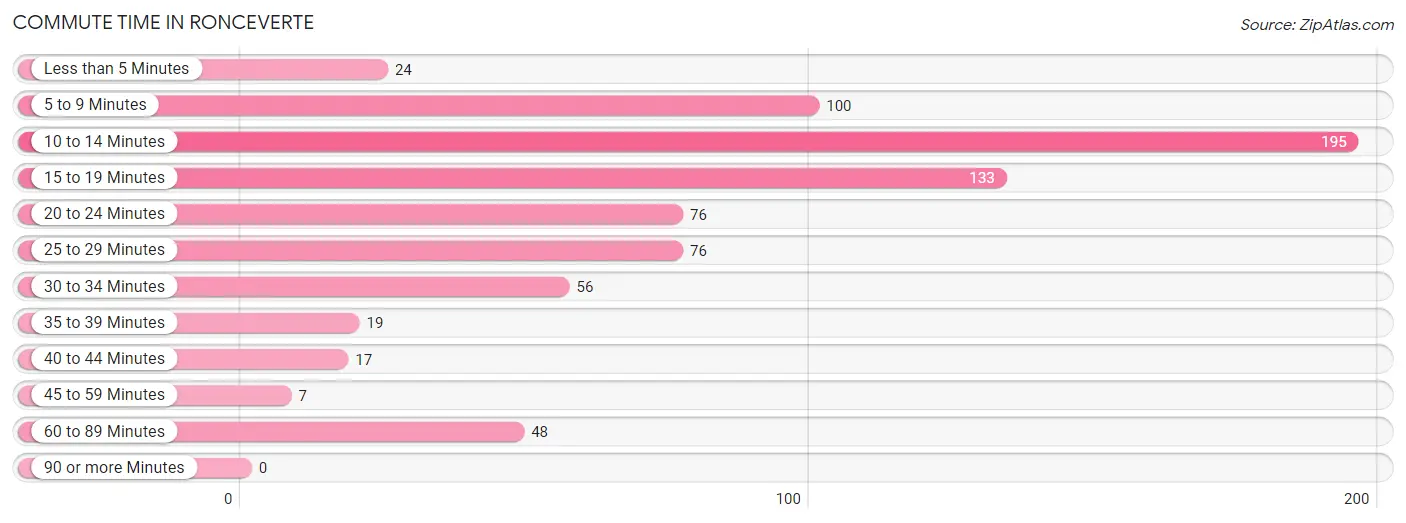
| Commute Time | # Commuters | % Commuters |
| Less than 5 Minutes | 24 | 3.2% |
| 5 to 9 Minutes | 100 | 13.3% |
| 10 to 14 Minutes | 195 | 26.0% |
| 15 to 19 Minutes | 133 | 17.7% |
| 20 to 24 Minutes | 76 | 10.1% |
| 25 to 29 Minutes | 76 | 10.1% |
| 30 to 34 Minutes | 56 | 7.5% |
| 35 to 39 Minutes | 19 | 2.5% |
| 40 to 44 Minutes | 17 | 2.3% |
| 45 to 59 Minutes | 7 | 0.9% |
| 60 to 89 Minutes | 48 | 6.4% |
| 90 or more Minutes | 0 | 0.0% |
Commute Time by Sex in Ronceverte
The most common commute times in Ronceverte are 10 to 14 minutes (74 commuters, 18.4%) for males and 10 to 14 minutes (121 commuters, 34.6%) for females.
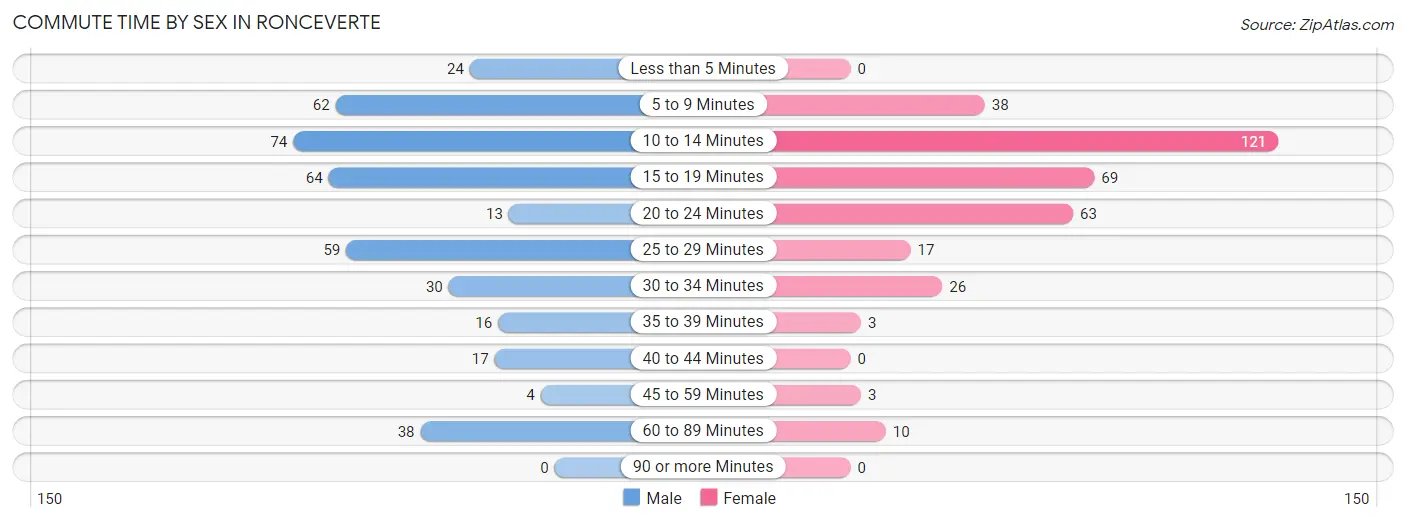
| Commute Time | Male | Female |
| Less than 5 Minutes | 24 (6.0%) | 0 (0.0%) |
| 5 to 9 Minutes | 62 (15.5%) | 38 (10.9%) |
| 10 to 14 Minutes | 74 (18.4%) | 121 (34.6%) |
| 15 to 19 Minutes | 64 (16.0%) | 69 (19.7%) |
| 20 to 24 Minutes | 13 (3.2%) | 63 (18.0%) |
| 25 to 29 Minutes | 59 (14.7%) | 17 (4.9%) |
| 30 to 34 Minutes | 30 (7.5%) | 26 (7.4%) |
| 35 to 39 Minutes | 16 (4.0%) | 3 (0.9%) |
| 40 to 44 Minutes | 17 (4.2%) | 0 (0.0%) |
| 45 to 59 Minutes | 4 (1.0%) | 3 (0.9%) |
| 60 to 89 Minutes | 38 (9.5%) | 10 (2.9%) |
| 90 or more Minutes | 0 (0.0%) | 0 (0.0%) |
Time of Departure to Work by Sex in Ronceverte
The most frequent times of departure to work in Ronceverte are 7:00 AM to 7:29 AM (79, 19.7%) for males and 7:00 AM to 7:29 AM (78, 22.3%) for females.
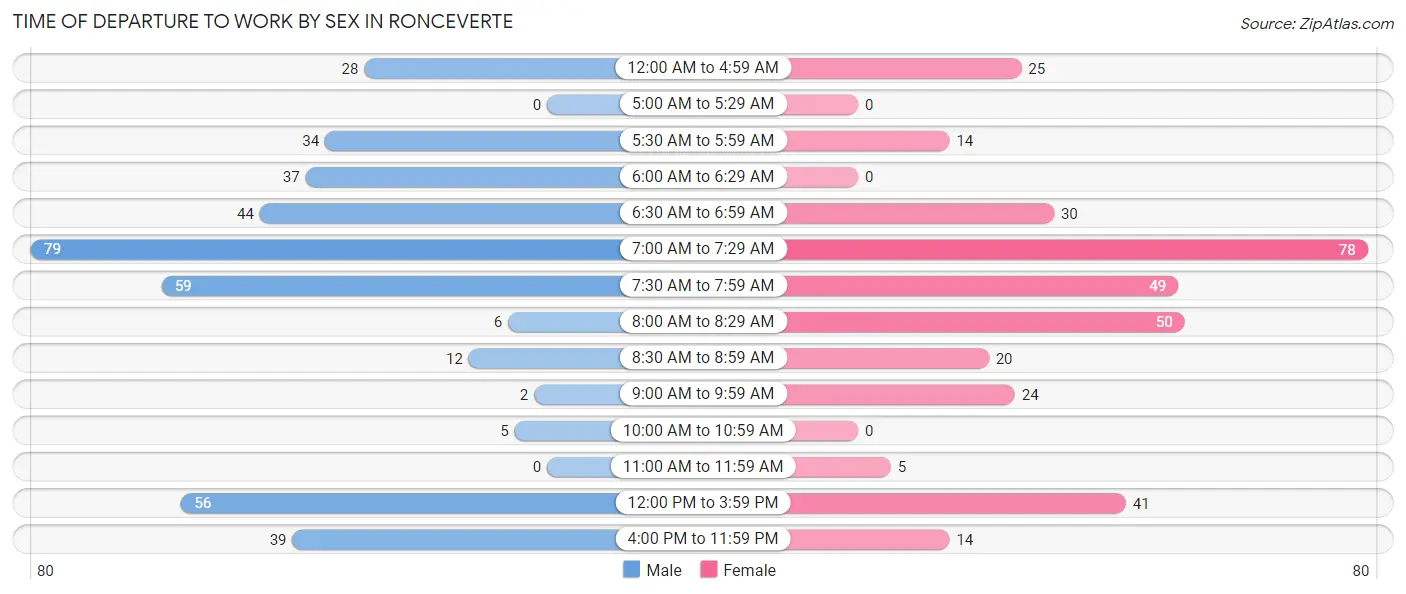
| Time of Departure | Male | Female |
| 12:00 AM to 4:59 AM | 28 (7.0%) | 25 (7.1%) |
| 5:00 AM to 5:29 AM | 0 (0.0%) | 0 (0.0%) |
| 5:30 AM to 5:59 AM | 34 (8.5%) | 14 (4.0%) |
| 6:00 AM to 6:29 AM | 37 (9.2%) | 0 (0.0%) |
| 6:30 AM to 6:59 AM | 44 (11.0%) | 30 (8.6%) |
| 7:00 AM to 7:29 AM | 79 (19.7%) | 78 (22.3%) |
| 7:30 AM to 7:59 AM | 59 (14.7%) | 49 (14.0%) |
| 8:00 AM to 8:29 AM | 6 (1.5%) | 50 (14.3%) |
| 8:30 AM to 8:59 AM | 12 (3.0%) | 20 (5.7%) |
| 9:00 AM to 9:59 AM | 2 (0.5%) | 24 (6.9%) |
| 10:00 AM to 10:59 AM | 5 (1.3%) | 0 (0.0%) |
| 11:00 AM to 11:59 AM | 0 (0.0%) | 5 (1.4%) |
| 12:00 PM to 3:59 PM | 56 (14.0%) | 41 (11.7%) |
| 4:00 PM to 11:59 PM | 39 (9.7%) | 14 (4.0%) |
| Total | 401 (100.0%) | 350 (100.0%) |
Housing Occupancy in Ronceverte
Occupancy by Ownership in Ronceverte
Of the total 651 dwellings in Ronceverte, owner-occupied units account for 438 (67.3%), while renter-occupied units make up 213 (32.7%).
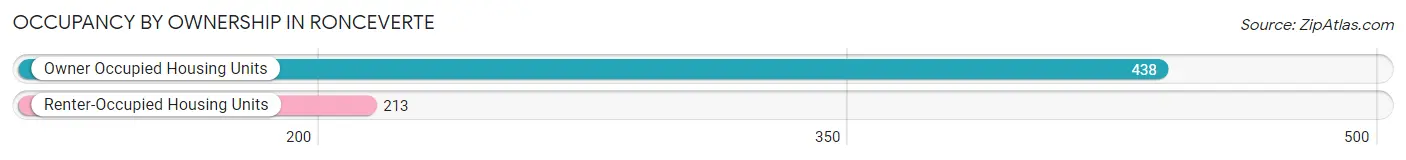
| Occupancy | # Housing Units | % Housing Units |
| Owner Occupied Housing Units | 438 | 67.3% |
| Renter-Occupied Housing Units | 213 | 32.7% |
| Total Occupied Housing Units | 651 | 100.0% |
Occupancy by Household Size in Ronceverte
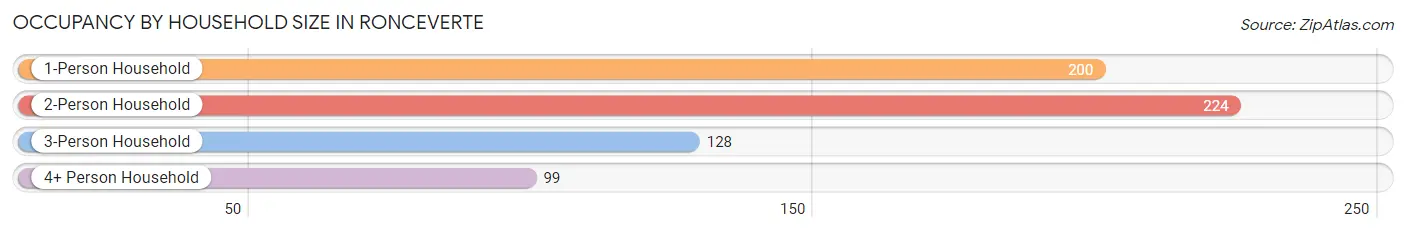
| Household Size | # Housing Units | % Housing Units |
| 1-Person Household | 200 | 30.7% |
| 2-Person Household | 224 | 34.4% |
| 3-Person Household | 128 | 19.7% |
| 4+ Person Household | 99 | 15.2% |
| Total Housing Units | 651 | 100.0% |
Occupancy by Ownership by Household Size in Ronceverte
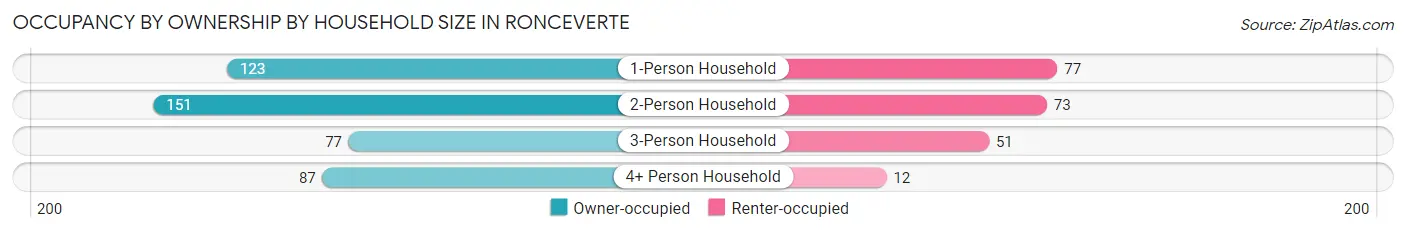
| Household Size | Owner-occupied | Renter-occupied |
| 1-Person Household | 123 (61.5%) | 77 (38.5%) |
| 2-Person Household | 151 (67.4%) | 73 (32.6%) |
| 3-Person Household | 77 (60.2%) | 51 (39.8%) |
| 4+ Person Household | 87 (87.9%) | 12 (12.1%) |
| Total Housing Units | 438 (67.3%) | 213 (32.7%) |
Occupancy by Educational Attainment in Ronceverte
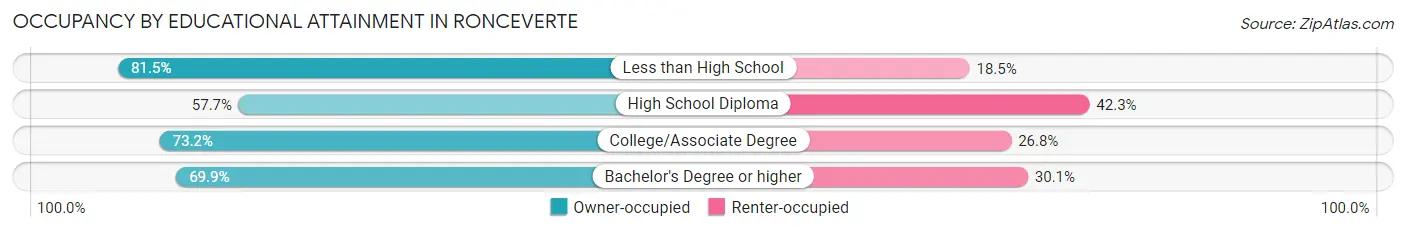
| Household Size | Owner-occupied | Renter-occupied |
| Less than High School | 44 (81.5%) | 10 (18.5%) |
| High School Diploma | 142 (57.7%) | 104 (42.3%) |
| College/Associate Degree | 145 (73.2%) | 53 (26.8%) |
| Bachelor's Degree or higher | 107 (69.9%) | 46 (30.1%) |
Occupancy by Age of Householder in Ronceverte
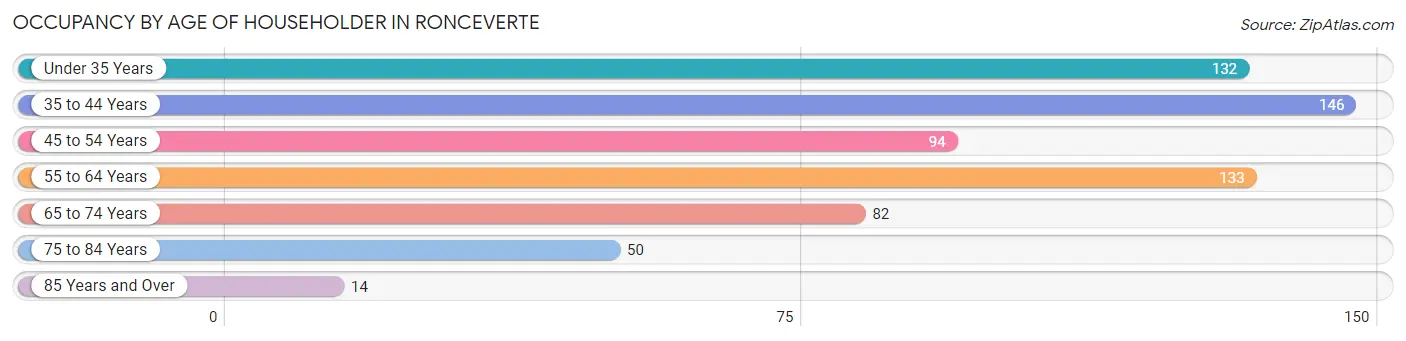
| Age Bracket | # Households | % Households |
| Under 35 Years | 132 | 20.3% |
| 35 to 44 Years | 146 | 22.4% |
| 45 to 54 Years | 94 | 14.4% |
| 55 to 64 Years | 133 | 20.4% |
| 65 to 74 Years | 82 | 12.6% |
| 75 to 84 Years | 50 | 7.7% |
| 85 Years and Over | 14 | 2.1% |
| Total | 651 | 100.0% |
Housing Finances in Ronceverte
Median Income by Occupancy in Ronceverte
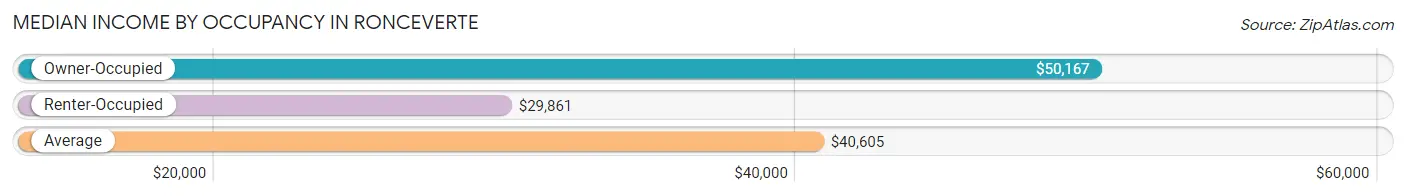
| Occupancy Type | # Households | Median Income |
| Owner-Occupied | 438 (67.3%) | $50,167 |
| Renter-Occupied | 213 (32.7%) | $29,861 |
| Average | 651 (100.0%) | $40,605 |
Occupancy by Householder Income Bracket in Ronceverte
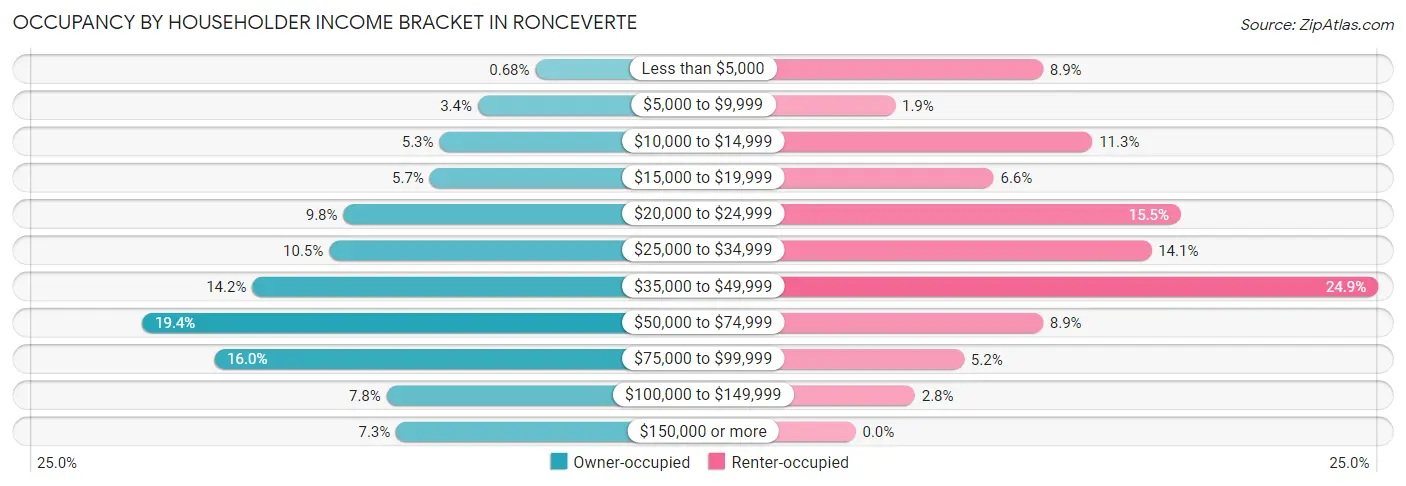
| Income Bracket | Owner-occupied | Renter-occupied |
| Less than $5,000 | 3 (0.7%) | 19 (8.9%) |
| $5,000 to $9,999 | 15 (3.4%) | 4 (1.9%) |
| $10,000 to $14,999 | 23 (5.2%) | 24 (11.3%) |
| $15,000 to $19,999 | 25 (5.7%) | 14 (6.6%) |
| $20,000 to $24,999 | 43 (9.8%) | 33 (15.5%) |
| $25,000 to $34,999 | 46 (10.5%) | 30 (14.1%) |
| $35,000 to $49,999 | 62 (14.2%) | 53 (24.9%) |
| $50,000 to $74,999 | 85 (19.4%) | 19 (8.9%) |
| $75,000 to $99,999 | 70 (16.0%) | 11 (5.2%) |
| $100,000 to $149,999 | 34 (7.8%) | 6 (2.8%) |
| $150,000 or more | 32 (7.3%) | 0 (0.0%) |
| Total | 438 (100.0%) | 213 (100.0%) |
Monthly Housing Cost Tiers in Ronceverte
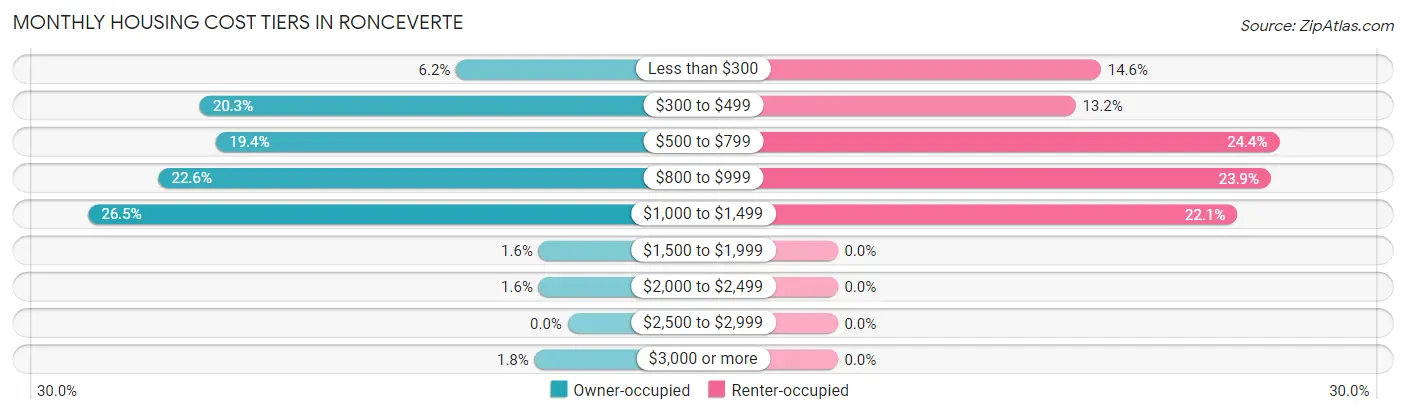
| Monthly Cost | Owner-occupied | Renter-occupied |
| Less than $300 | 27 (6.2%) | 31 (14.5%) |
| $300 to $499 | 89 (20.3%) | 28 (13.2%) |
| $500 to $799 | 85 (19.4%) | 52 (24.4%) |
| $800 to $999 | 99 (22.6%) | 51 (23.9%) |
| $1,000 to $1,499 | 116 (26.5%) | 47 (22.1%) |
| $1,500 to $1,999 | 7 (1.6%) | 0 (0.0%) |
| $2,000 to $2,499 | 7 (1.6%) | 0 (0.0%) |
| $2,500 to $2,999 | 0 (0.0%) | 0 (0.0%) |
| $3,000 or more | 8 (1.8%) | 0 (0.0%) |
| Total | 438 (100.0%) | 213 (100.0%) |
Physical Housing Characteristics in Ronceverte
Housing Structures in Ronceverte
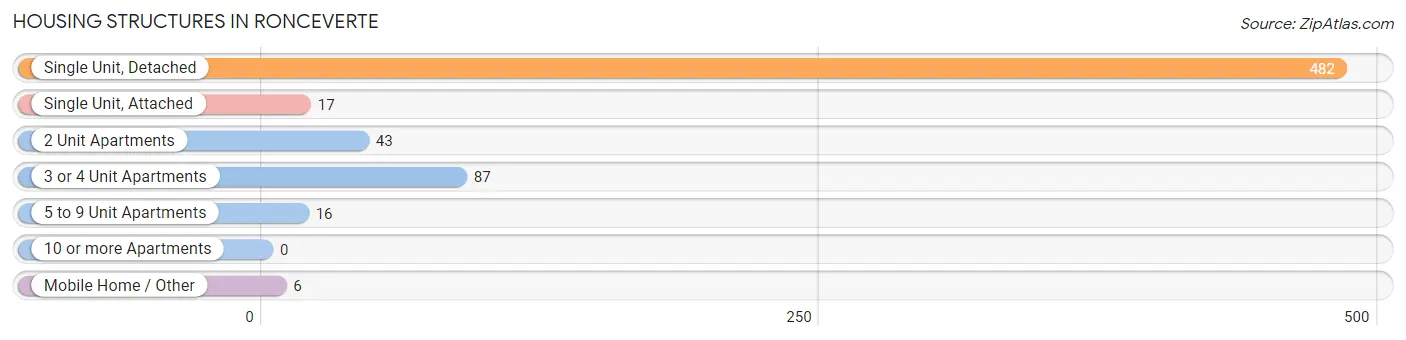
| Structure Type | # Housing Units | % Housing Units |
| Single Unit, Detached | 482 | 74.0% |
| Single Unit, Attached | 17 | 2.6% |
| 2 Unit Apartments | 43 | 6.6% |
| 3 or 4 Unit Apartments | 87 | 13.4% |
| 5 to 9 Unit Apartments | 16 | 2.5% |
| 10 or more Apartments | 0 | 0.0% |
| Mobile Home / Other | 6 | 0.9% |
| Total | 651 | 100.0% |
Housing Structures by Occupancy in Ronceverte
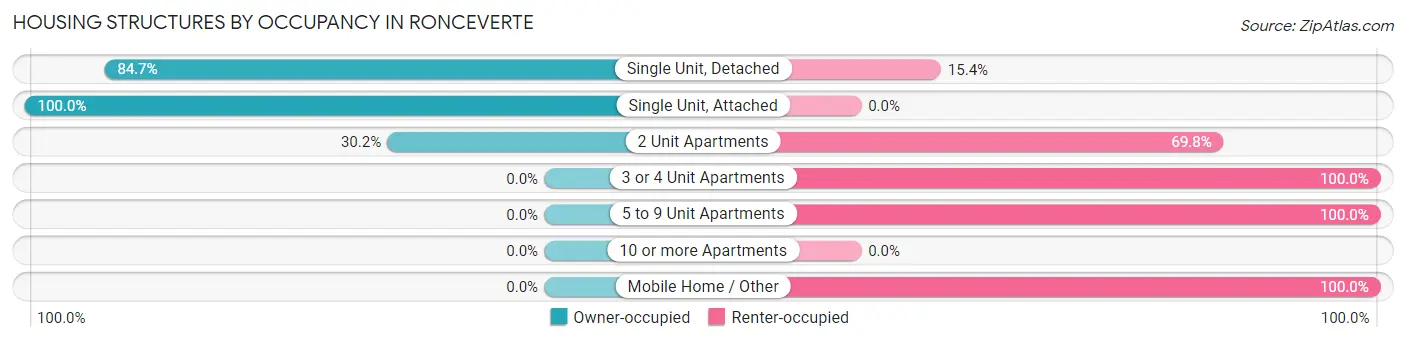
| Structure Type | Owner-occupied | Renter-occupied |
| Single Unit, Detached | 408 (84.7%) | 74 (15.3%) |
| Single Unit, Attached | 17 (100.0%) | 0 (0.0%) |
| 2 Unit Apartments | 13 (30.2%) | 30 (69.8%) |
| 3 or 4 Unit Apartments | 0 (0.0%) | 87 (100.0%) |
| 5 to 9 Unit Apartments | 0 (0.0%) | 16 (100.0%) |
| 10 or more Apartments | 0 (0.0%) | 0 (0.0%) |
| Mobile Home / Other | 0 (0.0%) | 6 (100.0%) |
| Total | 438 (67.3%) | 213 (32.7%) |
Housing Structures by Number of Rooms in Ronceverte
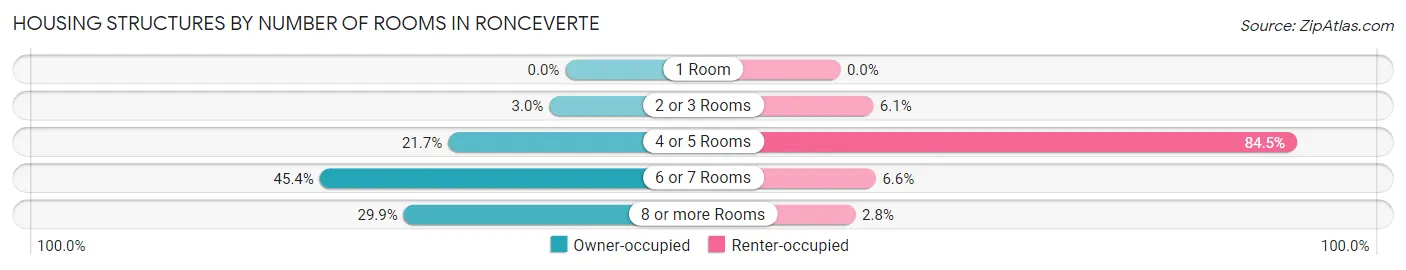
| Number of Rooms | Owner-occupied | Renter-occupied |
| 1 Room | 0 (0.0%) | 0 (0.0%) |
| 2 or 3 Rooms | 13 (3.0%) | 13 (6.1%) |
| 4 or 5 Rooms | 95 (21.7%) | 180 (84.5%) |
| 6 or 7 Rooms | 199 (45.4%) | 14 (6.6%) |
| 8 or more Rooms | 131 (29.9%) | 6 (2.8%) |
| Total | 438 (100.0%) | 213 (100.0%) |
Housing Structure by Heating Type in Ronceverte
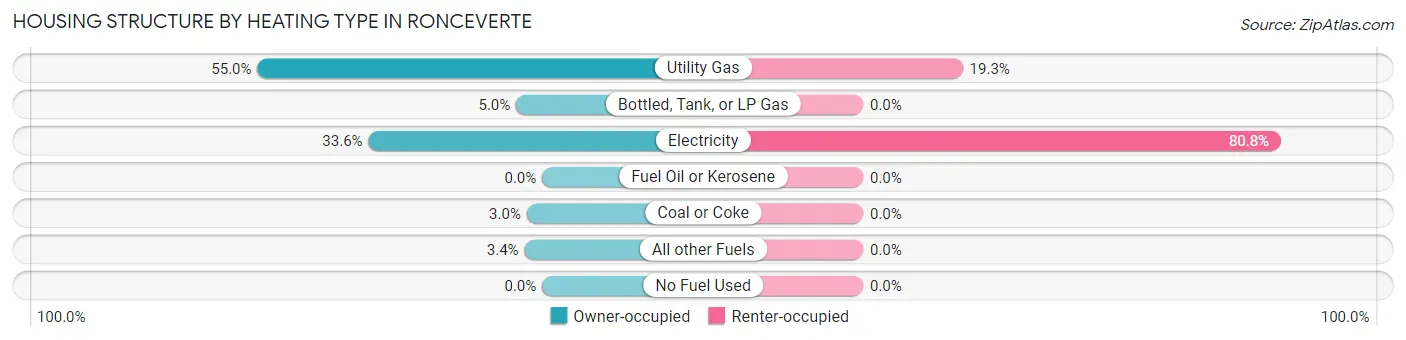
| Heating Type | Owner-occupied | Renter-occupied |
| Utility Gas | 241 (55.0%) | 41 (19.3%) |
| Bottled, Tank, or LP Gas | 22 (5.0%) | 0 (0.0%) |
| Electricity | 147 (33.6%) | 172 (80.7%) |
| Fuel Oil or Kerosene | 0 (0.0%) | 0 (0.0%) |
| Coal or Coke | 13 (3.0%) | 0 (0.0%) |
| All other Fuels | 15 (3.4%) | 0 (0.0%) |
| No Fuel Used | 0 (0.0%) | 0 (0.0%) |
| Total | 438 (100.0%) | 213 (100.0%) |
Household Vehicle Usage in Ronceverte
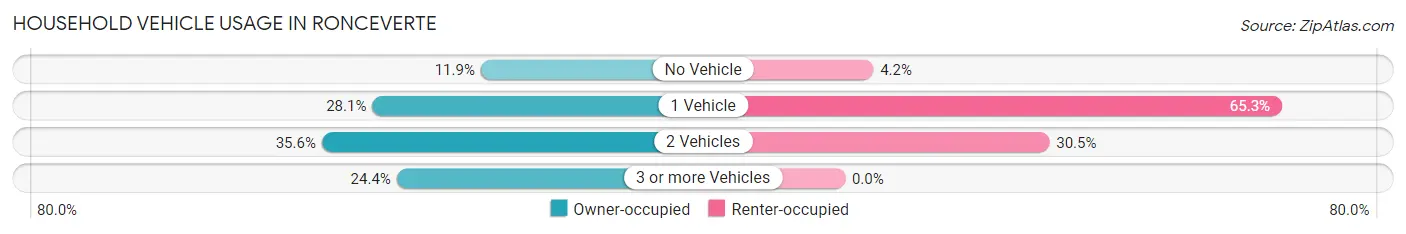
| Vehicles per Household | Owner-occupied | Renter-occupied |
| No Vehicle | 52 (11.9%) | 9 (4.2%) |
| 1 Vehicle | 123 (28.1%) | 139 (65.3%) |
| 2 Vehicles | 156 (35.6%) | 65 (30.5%) |
| 3 or more Vehicles | 107 (24.4%) | 0 (0.0%) |
| Total | 438 (100.0%) | 213 (100.0%) |
Real Estate & Mortgages in Ronceverte
Real Estate and Mortgage Overview in Ronceverte
| Characteristic | Without Mortgage | With Mortgage |
| Housing Units | 149 | 289 |
| Median Property Value | $117,800 | $109,500 |
| Median Household Income | $45,568 | $27 |
| Monthly Housing Costs | $434 | $8 |
| Real Estate Taxes | $738 | $18 |
Property Value by Mortgage Status in Ronceverte
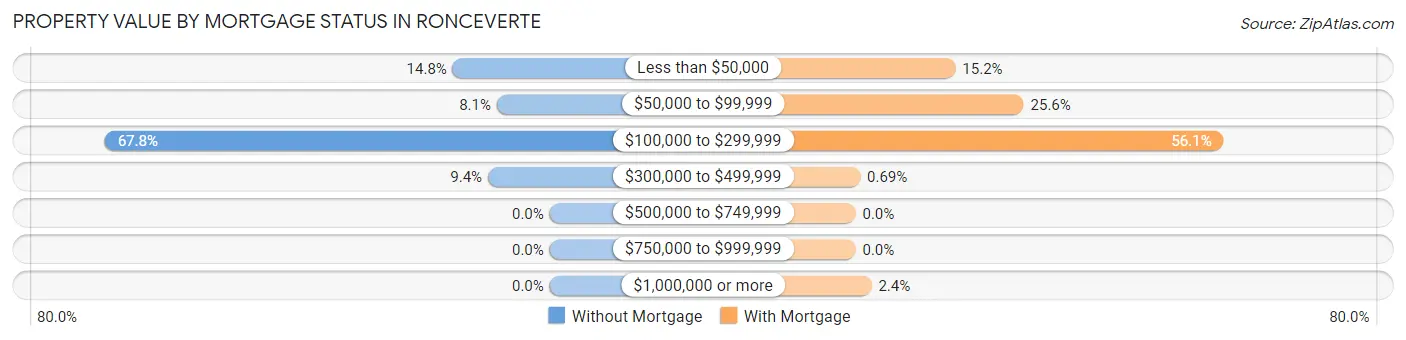
| Property Value | Without Mortgage | With Mortgage |
| Less than $50,000 | 22 (14.8%) | 44 (15.2%) |
| $50,000 to $99,999 | 12 (8.1%) | 74 (25.6%) |
| $100,000 to $299,999 | 101 (67.8%) | 162 (56.1%) |
| $300,000 to $499,999 | 14 (9.4%) | 2 (0.7%) |
| $500,000 to $749,999 | 0 (0.0%) | 0 (0.0%) |
| $750,000 to $999,999 | 0 (0.0%) | 0 (0.0%) |
| $1,000,000 or more | 0 (0.0%) | 7 (2.4%) |
| Total | 149 (100.0%) | 289 (100.0%) |
Household Income by Mortgage Status in Ronceverte
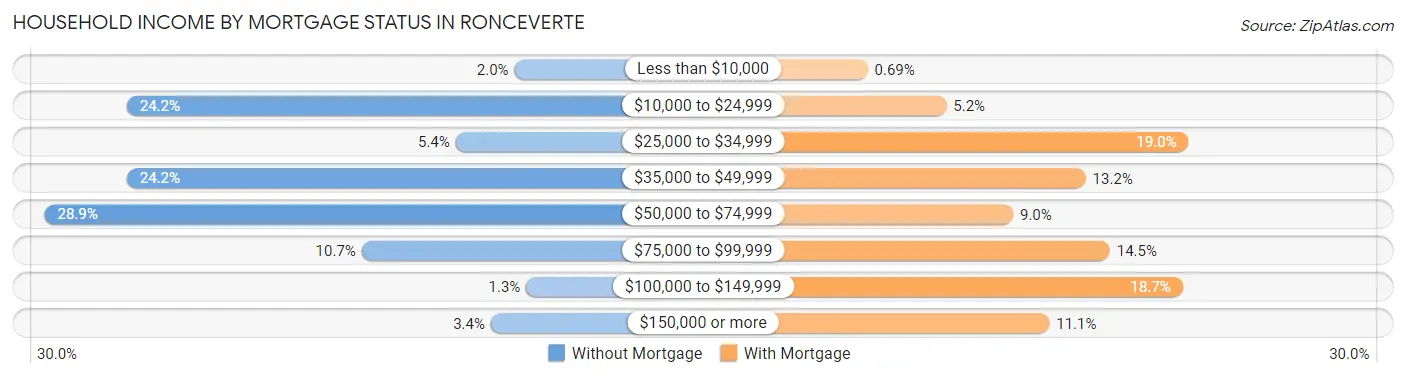
| Household Income | Without Mortgage | With Mortgage |
| Less than $10,000 | 3 (2.0%) | 2 (0.7%) |
| $10,000 to $24,999 | 36 (24.2%) | 15 (5.2%) |
| $25,000 to $34,999 | 8 (5.4%) | 55 (19.0%) |
| $35,000 to $49,999 | 36 (24.2%) | 38 (13.2%) |
| $50,000 to $74,999 | 43 (28.9%) | 26 (9.0%) |
| $75,000 to $99,999 | 16 (10.7%) | 42 (14.5%) |
| $100,000 to $149,999 | 2 (1.3%) | 54 (18.7%) |
| $150,000 or more | 5 (3.4%) | 32 (11.1%) |
| Total | 149 (100.0%) | 289 (100.0%) |
Property Value to Household Income Ratio in Ronceverte
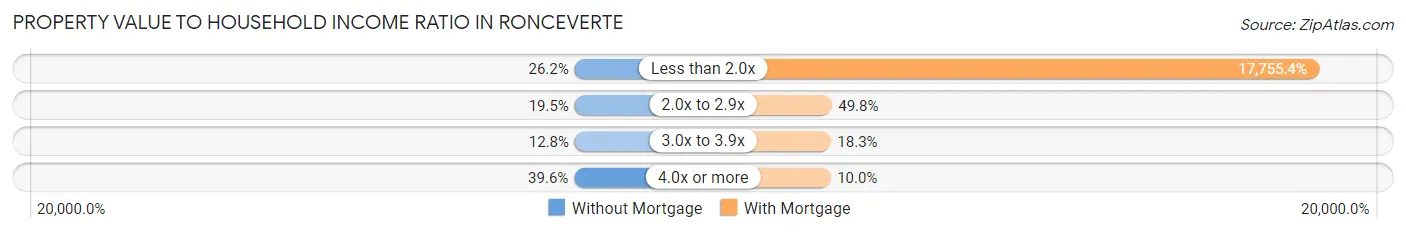
| Value-to-Income Ratio | Without Mortgage | With Mortgage |
| Less than 2.0x | 39 (26.2%) | 51,313 (17,755.4%) |
| 2.0x to 2.9x | 29 (19.5%) | 144 (49.8%) |
| 3.0x to 3.9x | 19 (12.8%) | 53 (18.3%) |
| 4.0x or more | 59 (39.6%) | 29 (10.0%) |
| Total | 149 (100.0%) | 289 (100.0%) |
Real Estate Taxes by Mortgage Status in Ronceverte
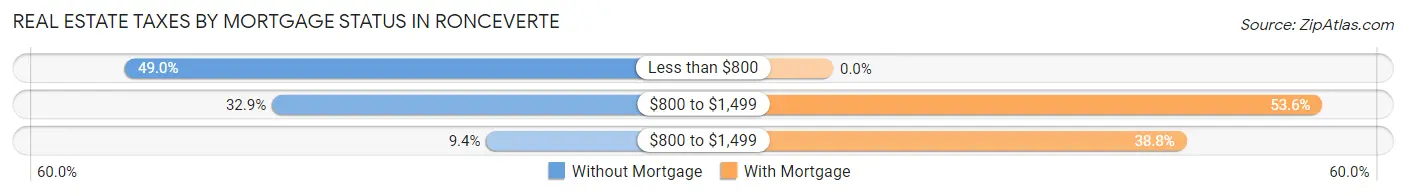
| Property Taxes | Without Mortgage | With Mortgage |
| Less than $800 | 73 (49.0%) | 0 (0.0%) |
| $800 to $1,499 | 49 (32.9%) | 155 (53.6%) |
| $800 to $1,499 | 14 (9.4%) | 112 (38.8%) |
| Total | 149 (100.0%) | 289 (100.0%) |
Health & Disability in Ronceverte
Health Insurance Coverage by Age in Ronceverte
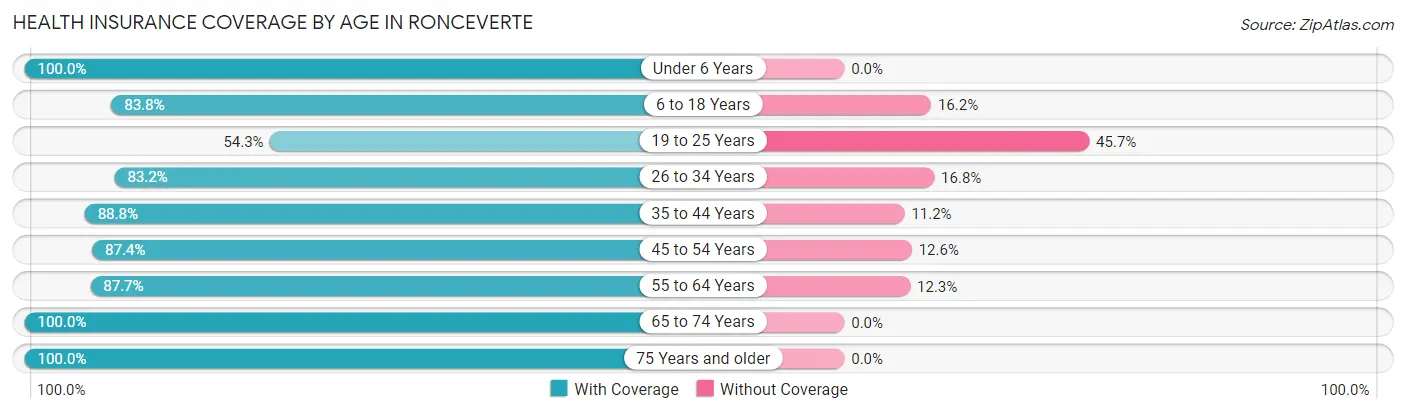
| Age Bracket | With Coverage | Without Coverage |
| Under 6 Years | 75 (100.0%) | 0 (0.0%) |
| 6 to 18 Years | 197 (83.8%) | 38 (16.2%) |
| 19 to 25 Years | 94 (54.3%) | 79 (45.7%) |
| 26 to 34 Years | 144 (83.2%) | 29 (16.8%) |
| 35 to 44 Years | 182 (88.8%) | 23 (11.2%) |
| 45 to 54 Years | 139 (87.4%) | 20 (12.6%) |
| 55 to 64 Years | 193 (87.7%) | 27 (12.3%) |
| 65 to 74 Years | 110 (100.0%) | 0 (0.0%) |
| 75 Years and older | 76 (100.0%) | 0 (0.0%) |
| Total | 1,210 (84.9%) | 216 (15.1%) |
Health Insurance Coverage by Citizenship Status in Ronceverte
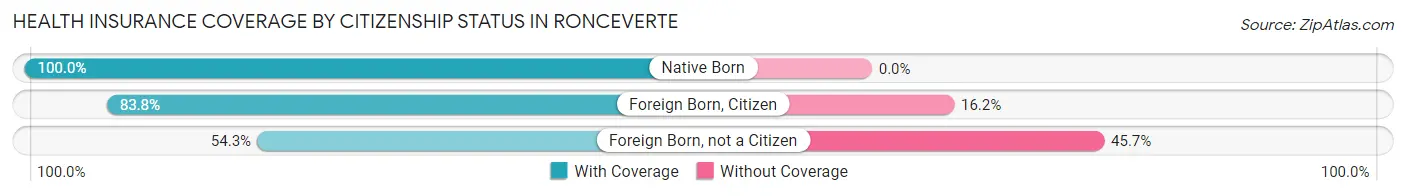
| Citizenship Status | With Coverage | Without Coverage |
| Native Born | 75 (100.0%) | 0 (0.0%) |
| Foreign Born, Citizen | 197 (83.8%) | 38 (16.2%) |
| Foreign Born, not a Citizen | 94 (54.3%) | 79 (45.7%) |
Health Insurance Coverage by Household Income in Ronceverte
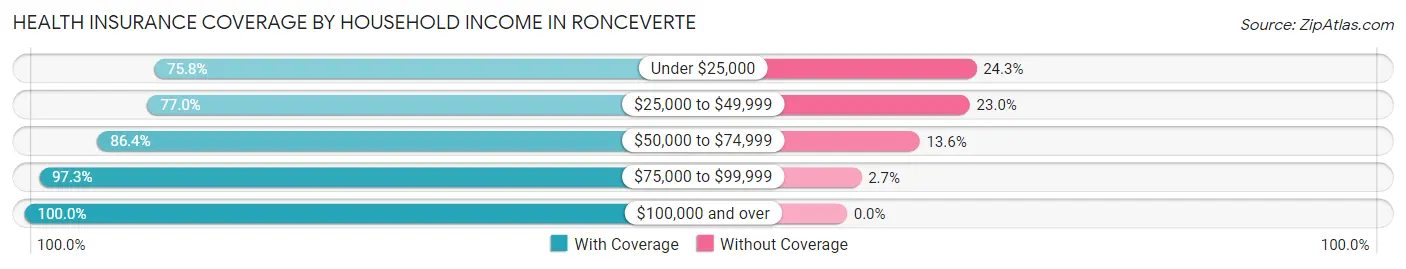
| Household Income | With Coverage | Without Coverage |
| Under $25,000 | 278 (75.7%) | 89 (24.2%) |
| $25,000 to $49,999 | 291 (77.0%) | 87 (23.0%) |
| $50,000 to $74,999 | 222 (86.4%) | 35 (13.6%) |
| $75,000 to $99,999 | 180 (97.3%) | 5 (2.7%) |
| $100,000 and over | 239 (100.0%) | 0 (0.0%) |
Public vs Private Health Insurance Coverage by Age in Ronceverte
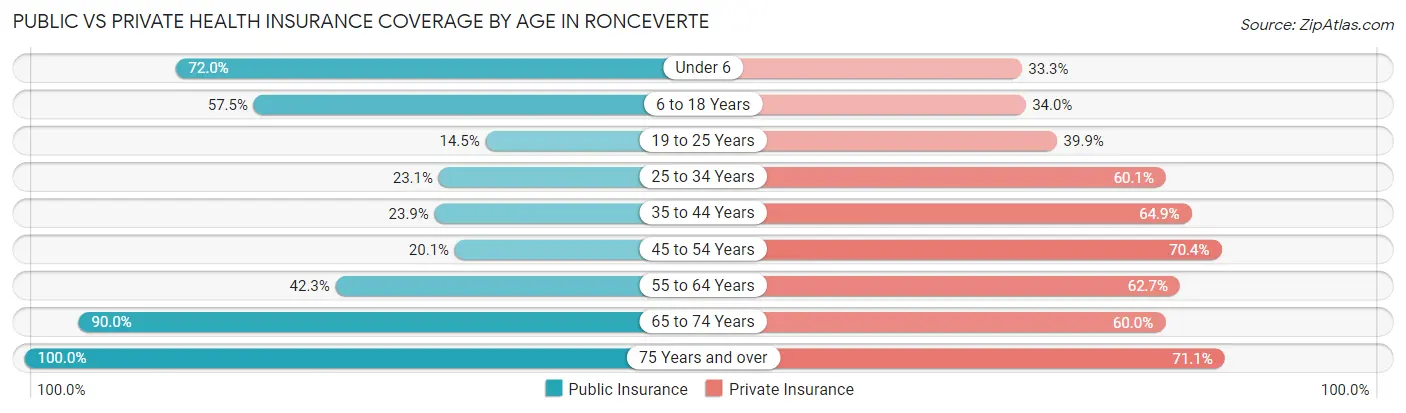
| Age Bracket | Public Insurance | Private Insurance |
| Under 6 | 54 (72.0%) | 25 (33.3%) |
| 6 to 18 Years | 135 (57.5%) | 80 (34.0%) |
| 19 to 25 Years | 25 (14.4%) | 69 (39.9%) |
| 25 to 34 Years | 40 (23.1%) | 104 (60.1%) |
| 35 to 44 Years | 49 (23.9%) | 133 (64.9%) |
| 45 to 54 Years | 32 (20.1%) | 112 (70.4%) |
| 55 to 64 Years | 93 (42.3%) | 138 (62.7%) |
| 65 to 74 Years | 99 (90.0%) | 66 (60.0%) |
| 75 Years and over | 76 (100.0%) | 54 (71.1%) |
| Total | 603 (42.3%) | 781 (54.8%) |
Disability Status by Sex by Age in Ronceverte
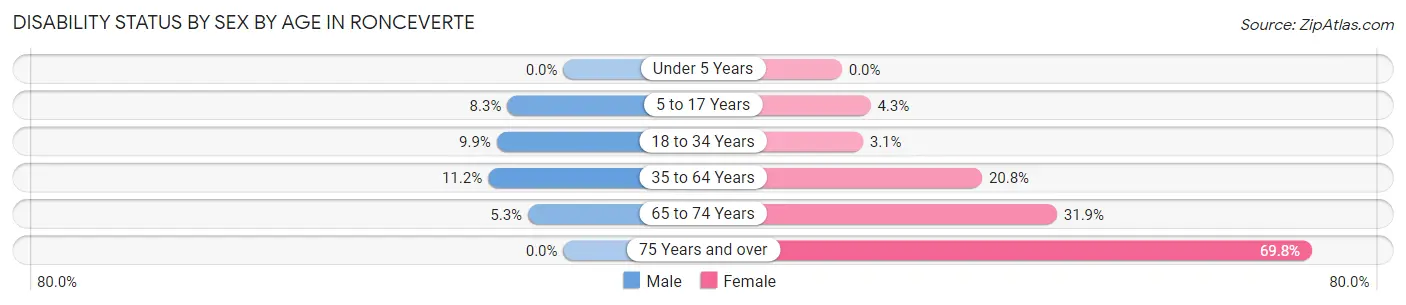
| Age Bracket | Male | Female |
| Under 5 Years | 0 (0.0%) | 0 (0.0%) |
| 5 to 17 Years | 7 (8.3%) | 6 (4.3%) |
| 18 to 34 Years | 20 (9.9%) | 5 (3.1%) |
| 35 to 64 Years | 32 (11.2%) | 62 (20.8%) |
| 65 to 74 Years | 2 (5.3%) | 23 (31.9%) |
| 75 Years and over | 0 (0.0%) | 37 (69.8%) |
Disability Class by Sex by Age in Ronceverte
Disability Class: Hearing Difficulty
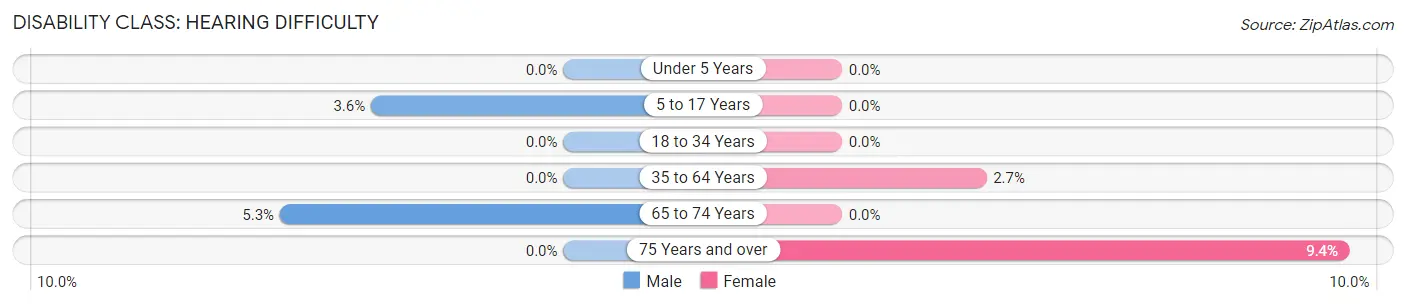
| Age Bracket | Male | Female |
| Under 5 Years | 0 (0.0%) | 0 (0.0%) |
| 5 to 17 Years | 3 (3.6%) | 0 (0.0%) |
| 18 to 34 Years | 0 (0.0%) | 0 (0.0%) |
| 35 to 64 Years | 0 (0.0%) | 8 (2.7%) |
| 65 to 74 Years | 2 (5.3%) | 0 (0.0%) |
| 75 Years and over | 0 (0.0%) | 5 (9.4%) |
Disability Class: Vision Difficulty
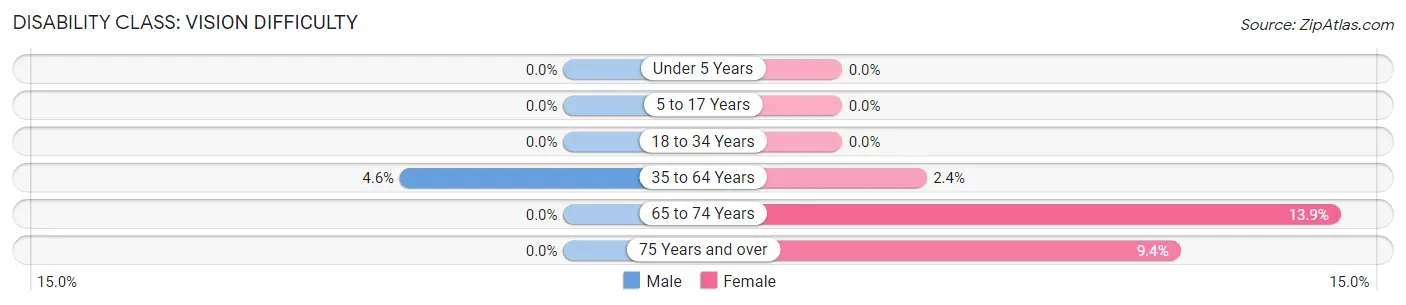
| Age Bracket | Male | Female |
| Under 5 Years | 0 (0.0%) | 0 (0.0%) |
| 5 to 17 Years | 0 (0.0%) | 0 (0.0%) |
| 18 to 34 Years | 0 (0.0%) | 0 (0.0%) |
| 35 to 64 Years | 13 (4.5%) | 7 (2.4%) |
| 65 to 74 Years | 0 (0.0%) | 10 (13.9%) |
| 75 Years and over | 0 (0.0%) | 5 (9.4%) |
Disability Class: Cognitive Difficulty
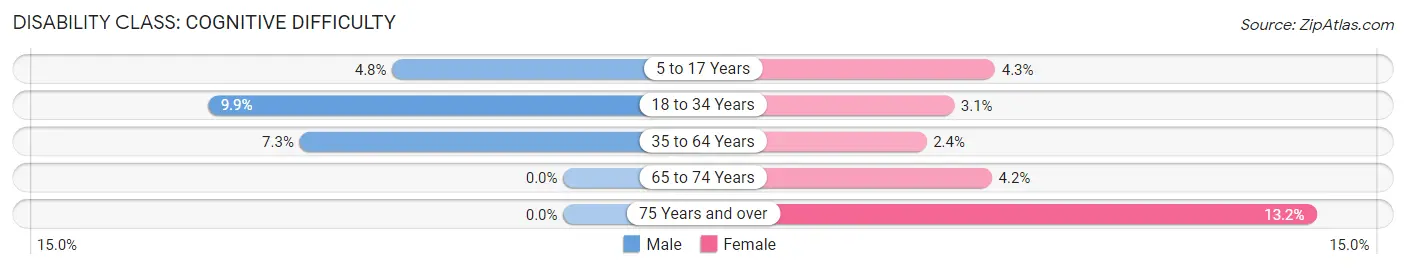
| Age Bracket | Male | Female |
| 5 to 17 Years | 4 (4.8%) | 6 (4.3%) |
| 18 to 34 Years | 20 (9.9%) | 5 (3.1%) |
| 35 to 64 Years | 21 (7.3%) | 7 (2.4%) |
| 65 to 74 Years | 0 (0.0%) | 3 (4.2%) |
| 75 Years and over | 0 (0.0%) | 7 (13.2%) |
Disability Class: Ambulatory Difficulty
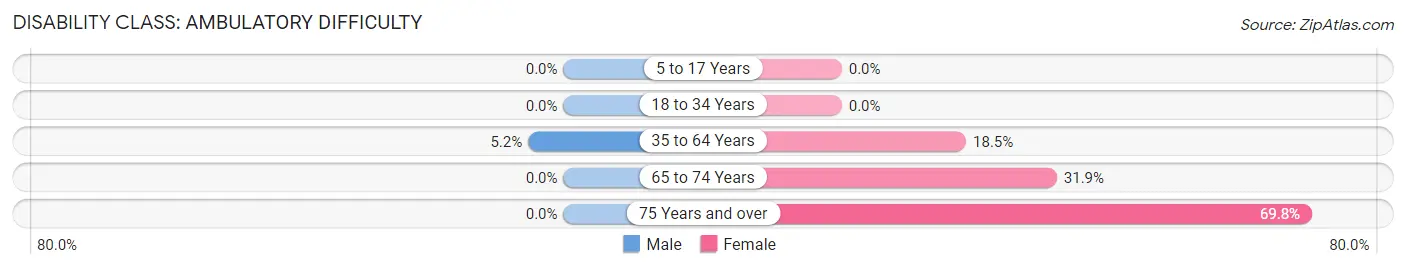
| Age Bracket | Male | Female |
| 5 to 17 Years | 0 (0.0%) | 0 (0.0%) |
| 18 to 34 Years | 0 (0.0%) | 0 (0.0%) |
| 35 to 64 Years | 15 (5.2%) | 55 (18.5%) |
| 65 to 74 Years | 0 (0.0%) | 23 (31.9%) |
| 75 Years and over | 0 (0.0%) | 37 (69.8%) |
Disability Class: Self-Care Difficulty
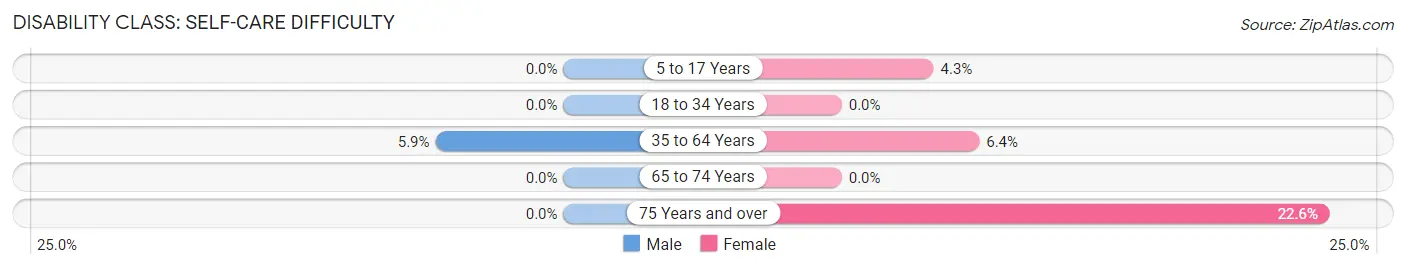
| Age Bracket | Male | Female |
| 5 to 17 Years | 0 (0.0%) | 6 (4.3%) |
| 18 to 34 Years | 0 (0.0%) | 0 (0.0%) |
| 35 to 64 Years | 17 (5.9%) | 19 (6.4%) |
| 65 to 74 Years | 0 (0.0%) | 0 (0.0%) |
| 75 Years and over | 0 (0.0%) | 12 (22.6%) |
Technology Access in Ronceverte
Computing Device Access in Ronceverte
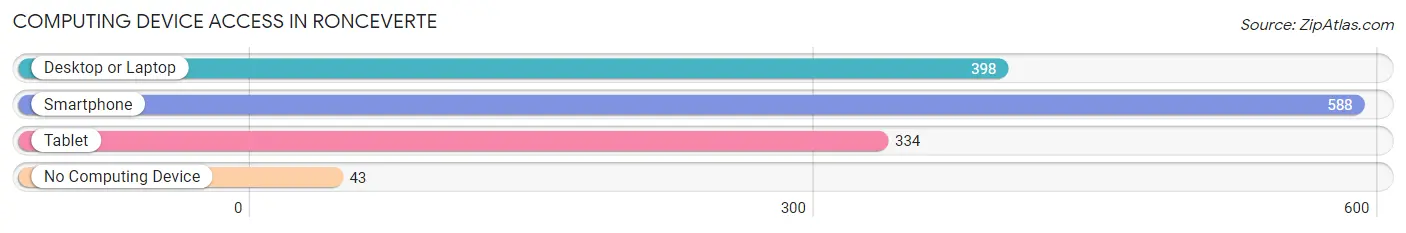
| Device Type | # Households | % Households |
| Desktop or Laptop | 398 | 61.1% |
| Smartphone | 588 | 90.3% |
| Tablet | 334 | 51.3% |
| No Computing Device | 43 | 6.6% |
| Total | 651 | 100.0% |
Internet Access in Ronceverte
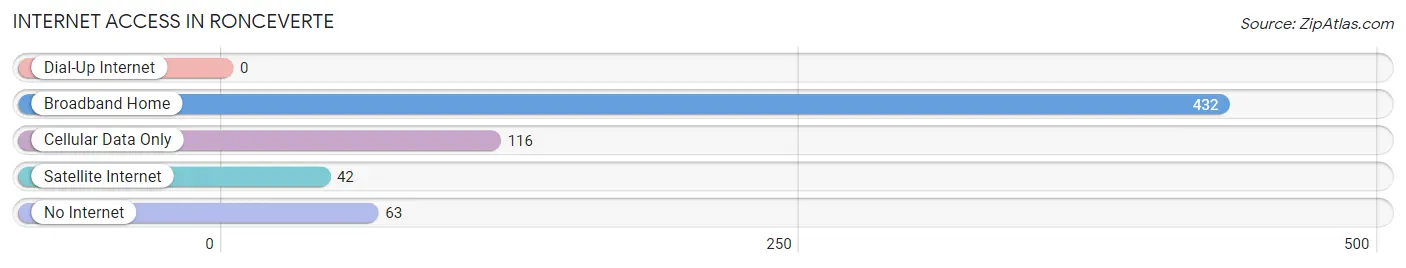
| Internet Type | # Households | % Households |
| Dial-Up Internet | 0 | 0.0% |
| Broadband Home | 432 | 66.4% |
| Cellular Data Only | 116 | 17.8% |
| Satellite Internet | 42 | 6.5% |
| No Internet | 63 | 9.7% |
| Total | 651 | 100.0% |
Ronceverte Summary
Ronceverte is a small town located in Greenbrier County, West Virginia. It is situated along the Greenbrier River, and is part of the Lewisburg, WV Micropolitan Statistical Area. The town was founded in 1792 by John Lewis, and was named after the French phrase for “greenbrier”. The town has a population of 1,480 as of the 2010 census.
History
Ronceverte was founded in 1792 by John Lewis, who named the town after the French phrase for “greenbrier”. The town was originally a trading post, and was the first settlement in Greenbrier County. In 1810, the town was incorporated, and the first post office was established in 1817.
During the Civil War, the town was the site of a skirmish between Union and Confederate forces in 1863. The town was also the site of a major battle in 1864, when Confederate forces attempted to retake the town from Union forces. The Union forces were successful in defending the town, and the Confederate forces retreated.
In the late 19th century, the town became a popular tourist destination, due to its proximity to the Greenbrier River and the nearby Greenbrier Resort. The town was also home to several mills, including a paper mill, a flour mill, and a sawmill.
Geography
Ronceverte is located in Greenbrier County, West Virginia, along the Greenbrier River. The town is situated at an elevation of 1,068 feet (325 m). The town has a total area of 0.9 square miles (2.3 km2), all of which is land.
The town is located in the Appalachian Mountains, and is surrounded by forests and rolling hills. The climate is humid subtropical, with hot, humid summers and cold, wet winters.
Economy
The economy of Ronceverte is largely based on tourism and agriculture. The town is home to several tourist attractions, including the Greenbrier Resort, the Greenbrier River Trail, and the Lewisburg Historic District. The town is also home to several farms, which produce a variety of crops, including corn, soybeans, and hay.
The town is also home to several small businesses, including restaurants, retail stores, and service providers. The town is also home to several manufacturing companies, including a paper mill, a flour mill, and a sawmill.
Demographics
As of the 2010 census, the population of Ronceverte was 1,480. The racial makeup of the town was 95.2% White, 2.2% African American, 0.2% Native American, 0.2% Asian, 0.1% Pacific Islander, 0.7% from other races, and 1.0% from two or more races. Hispanic or Latino of any race were 1.7% of the population.
The median income for a household in the town was $30,938, and the median income for a family was $37,500. The per capita income for the town was $17,845. About 11.2% of families and 14.2% of the population were below the poverty line, including 18.2% of those under age 18 and 8.3% of those age 65 or over.
Common Questions
What is Per Capita Income in Ronceverte?
Per Capita income in Ronceverte is $27,496.
What is the Median Family Income in Ronceverte?
Median Family Income in Ronceverte is $46,250.
What is the Median Household income in Ronceverte?
Median Household Income in Ronceverte is $40,605.
What is Income or Wage Gap in Ronceverte?
Income or Wage Gap in Ronceverte is 0.1%.
Women in Ronceverte earn 99.9 cents for every dollar earned by a man.
What is Family Income Deficit in Ronceverte?
Family Income Deficit in Ronceverte is $10,422.
Families that are below poverty line in Ronceverte earn $10,422 less on average than the poverty threshold level.
What is Inequality or Gini Index in Ronceverte?
Inequality or Gini Index in Ronceverte is 0.47.
What is the Total Population of Ronceverte?
Total Population of Ronceverte is 1,426.
What is the Total Male Population of Ronceverte?
Total Male Population of Ronceverte is 666.
What is the Total Female Population of Ronceverte?
Total Female Population of Ronceverte is 760.
What is the Ratio of Males per 100 Females in Ronceverte?
There are 87.63 Males per 100 Females in Ronceverte.
What is the Ratio of Females per 100 Males in Ronceverte?
There are 114.11 Females per 100 Males in Ronceverte.
What is the Median Population Age in Ronceverte?
Median Population Age in Ronceverte is 37.9 Years.
What is the Average Family Size in Ronceverte
Average Family Size in Ronceverte is 2.7 People.
What is the Average Household Size in Ronceverte
Average Household Size in Ronceverte is 2.2 People.
How Large is the Labor Force in Ronceverte?
There are 791 People in the Labor Forcein in Ronceverte.
What is the Percentage of People in the Labor Force in Ronceverte?
68.4% of People are in the Labor Force in Ronceverte.
What is the Unemployment Rate in Ronceverte?
Unemployment Rate in Ronceverte is 3.2%.