Romney, WV Map & Demographics
Romney Map
Romney Overview
$19,698
PER CAPITA INCOME
$59,250
AVG FAMILY INCOME
$34,063
AVG HOUSEHOLD INCOME
38.2%
WAGE / INCOME GAP [ % ]
61.8¢/ $1
WAGE / INCOME GAP [ $ ]
0.48
INEQUALITY / GINI INDEX
2,062
TOTAL POPULATION
950
MALE POPULATION
1,112
FEMALE POPULATION
85.43
MALES / 100 FEMALES
117.05
FEMALES / 100 MALES
47.7
MEDIAN AGE
4.2
AVG FAMILY SIZE
2.6
AVG HOUSEHOLD SIZE
617
LABOR FORCE [ PEOPLE ]
39.0%
PERCENT IN LABOR FORCE
13.9%
UNEMPLOYMENT RATE
Romney Zip Codes
Romney Area Codes
Income in Romney
Income Overview in Romney
Per Capita Income in Romney is $19,698, while median incomes of families and households are $59,250 and $34,063 respectively.
| Characteristic | Number | Measure |
| Per Capita Income | 2,062 | $19,698 |
| Median Family Income | 327 | $59,250 |
| Mean Family Income | 327 | $67,509 |
| Median Household Income | 738 | $34,063 |
| Mean Household Income | 738 | $49,396 |
| Income Deficit | 327 | $0 |
| Wage / Income Gap (%) | 2,062 | 38.18% |
| Wage / Income Gap ($) | 2,062 | 61.82¢ per $1 |
| Gini / Inequality Index | 2,062 | 0.48 |
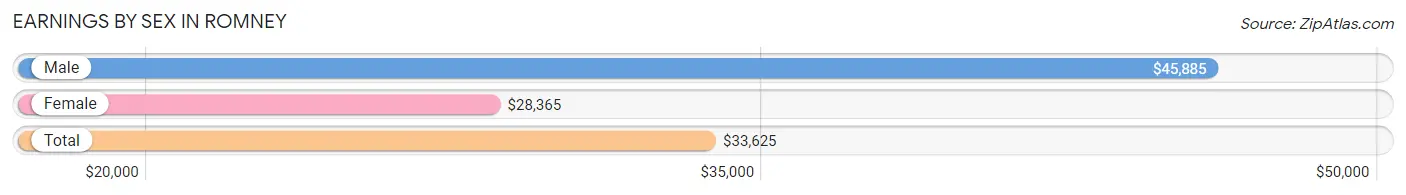
Earnings by Sex in Romney
Average Earnings in Romney are $33,625, $45,885 for men and $28,365 for women, a difference of 38.2%.
| Sex | Number | Average Earnings |
| Male | 241 (39.4%) | $45,885 |
| Female | 370 (60.6%) | $28,365 |
| Total | 611 (100.0%) | $33,625 |
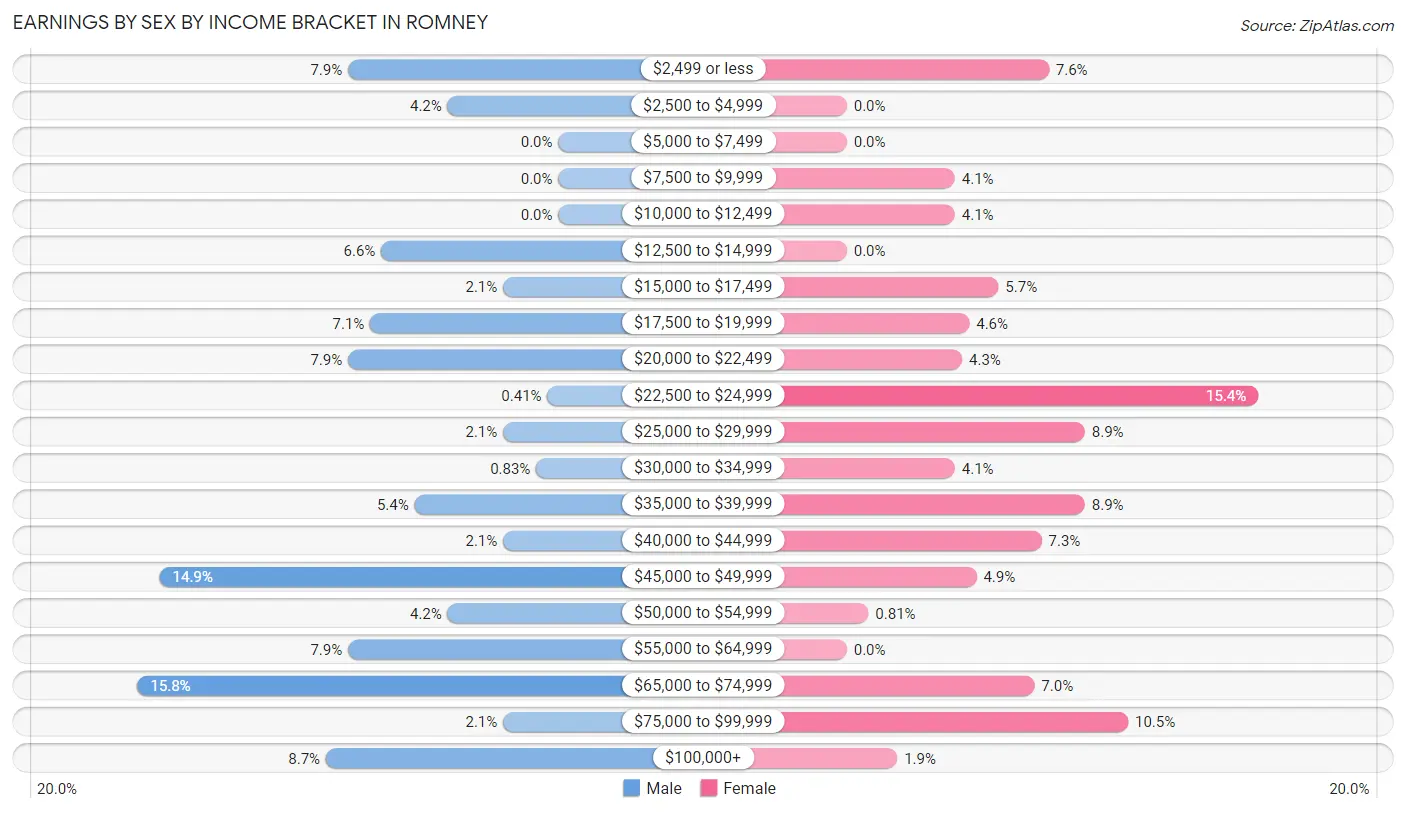
Earnings by Sex by Income Bracket in Romney
The most common earnings brackets in Romney are $65,000 to $74,999 for men (38 | 15.8%) and $22,500 to $24,999 for women (57 | 15.4%).
| Income | Male | Female |
| $2,499 or less | 19 (7.9%) | 28 (7.6%) |
| $2,500 to $4,999 | 10 (4.2%) | 0 (0.0%) |
| $5,000 to $7,499 | 0 (0.0%) | 0 (0.0%) |
| $7,500 to $9,999 | 0 (0.0%) | 15 (4.1%) |
| $10,000 to $12,499 | 0 (0.0%) | 15 (4.1%) |
| $12,500 to $14,999 | 16 (6.6%) | 0 (0.0%) |
| $15,000 to $17,499 | 5 (2.1%) | 21 (5.7%) |
| $17,500 to $19,999 | 17 (7.0%) | 17 (4.6%) |
| $20,000 to $22,499 | 19 (7.9%) | 16 (4.3%) |
| $22,500 to $24,999 | 1 (0.4%) | 57 (15.4%) |
| $25,000 to $29,999 | 5 (2.1%) | 33 (8.9%) |
| $30,000 to $34,999 | 2 (0.8%) | 15 (4.1%) |
| $35,000 to $39,999 | 13 (5.4%) | 33 (8.9%) |
| $40,000 to $44,999 | 5 (2.1%) | 27 (7.3%) |
| $45,000 to $49,999 | 36 (14.9%) | 18 (4.9%) |
| $50,000 to $54,999 | 10 (4.2%) | 3 (0.8%) |
| $55,000 to $64,999 | 19 (7.9%) | 0 (0.0%) |
| $65,000 to $74,999 | 38 (15.8%) | 26 (7.0%) |
| $75,000 to $99,999 | 5 (2.1%) | 39 (10.5%) |
| $100,000+ | 21 (8.7%) | 7 (1.9%) |
| Total | 241 (100.0%) | 370 (100.0%) |
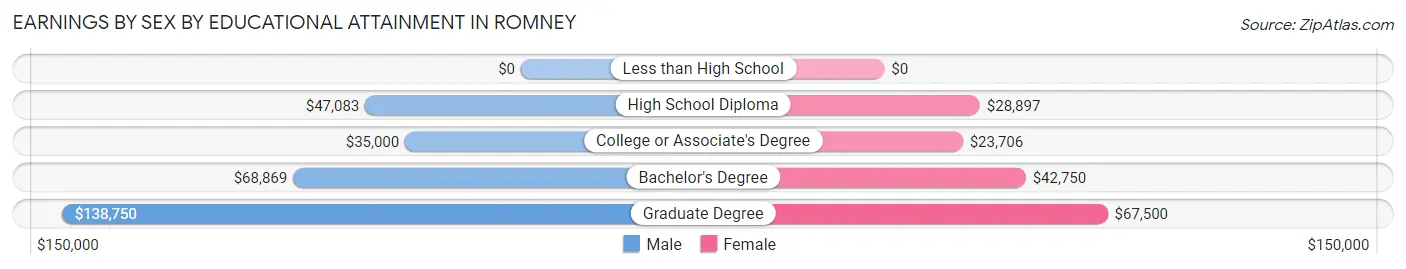
Earnings by Sex by Educational Attainment in Romney
Average earnings in Romney are $48,646 for men and $28,221 for women, a difference of 42.0%. Men with an educational attainment of graduate degree enjoy the highest average annual earnings of $138,750, while those with college or associate's degree education earn the least with $35,000. Women with an educational attainment of graduate degree earn the most with the average annual earnings of $67,500, while those with college or associate's degree education have the smallest earnings of $23,706.
| Educational Attainment | Male Income | Female Income |
| Less than High School | - | - |
| High School Diploma | $47,083 | $28,897 |
| College or Associate's Degree | $35,000 | $23,706 |
| Bachelor's Degree | $68,869 | $42,750 |
| Graduate Degree | $138,750 | $67,500 |
| Total | $48,646 | $28,221 |
Family Income in Romney
Family Income Brackets in Romney
According to the Romney family income data, there are 67 families falling into the $50,000 to $74,999 income range, which is the most common income bracket and makes up 20.5% of all families. Conversely, the $25,000 to $34,999 income bracket is the least frequent group with only 10 families (3.1%) belonging to this category.
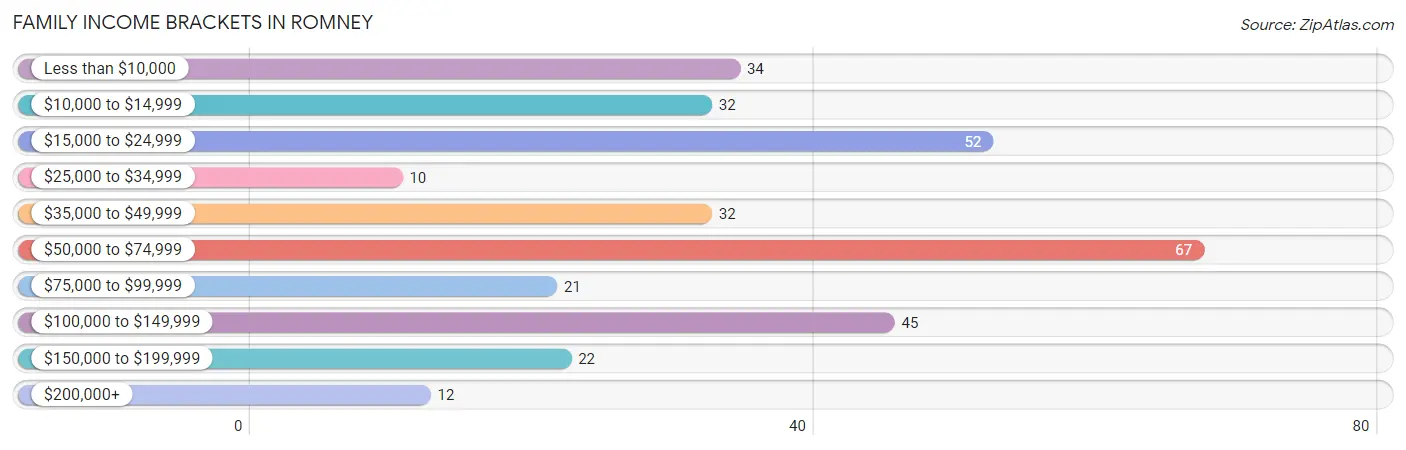
| Income Bracket | # Families | % Families |
| Less than $10,000 | 34 | 10.4% |
| $10,000 to $14,999 | 32 | 9.8% |
| $15,000 to $24,999 | 52 | 15.9% |
| $25,000 to $34,999 | 10 | 3.1% |
| $35,000 to $49,999 | 32 | 9.8% |
| $50,000 to $74,999 | 67 | 20.5% |
| $75,000 to $99,999 | 21 | 6.4% |
| $100,000 to $149,999 | 45 | 13.8% |
| $150,000 to $199,999 | 22 | 6.7% |
| $200,000+ | 12 | 3.7% |
Family Income by Famaliy Size in Romney
3-person families (83 | 25.4%) account for the highest median family income in Romney with $65,987 per family, while 2-person families (196 | 59.9%) have the highest median income of $30,000 per family member.
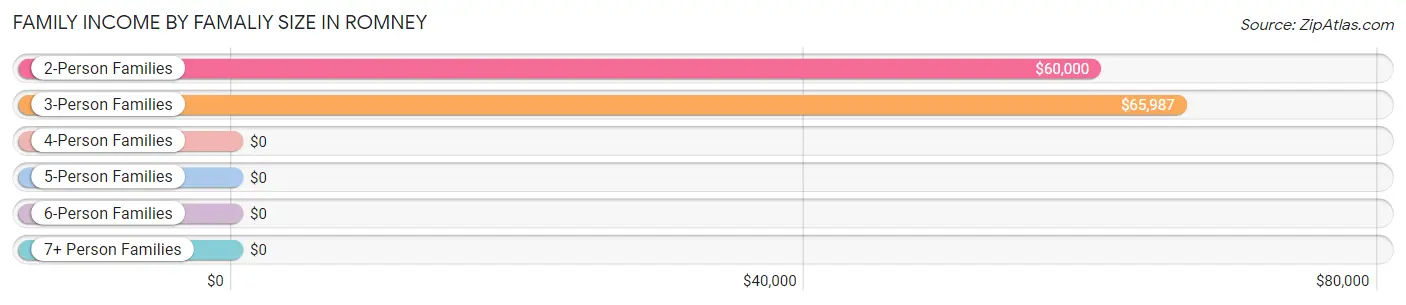
| Income Bracket | # Families | Median Income |
| 2-Person Families | 196 (59.9%) | $60,000 |
| 3-Person Families | 83 (25.4%) | $65,987 |
| 4-Person Families | 29 (8.9%) | $0 |
| 5-Person Families | 11 (3.4%) | $0 |
| 6-Person Families | 8 (2.5%) | $0 |
| 7+ Person Families | 0 (0.0%) | $0 |
| Total | 327 (100.0%) | $59,250 |
Family Income by Number of Earners in Romney
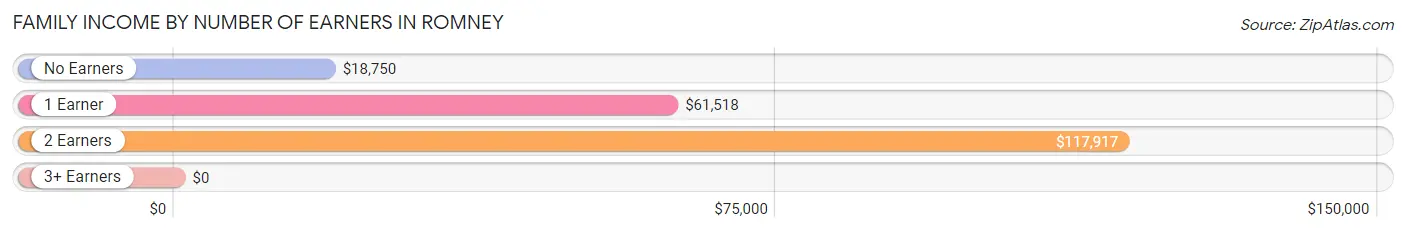
| Number of Earners | # Families | Median Income |
| No Earners | 133 (40.7%) | $18,750 |
| 1 Earner | 99 (30.3%) | $61,518 |
| 2 Earners | 91 (27.8%) | $117,917 |
| 3+ Earners | 4 (1.2%) | $0 |
| Total | 327 (100.0%) | $59,250 |
Household Income in Romney
Household Income Brackets in Romney
With 150 households falling in the category, the $50,000 to $74,999 income range is the most frequent in Romney, accounting for 20.3% of all households. In contrast, only 12 households (1.6%) fall into the $200,000+ income bracket, making it the least populous group.
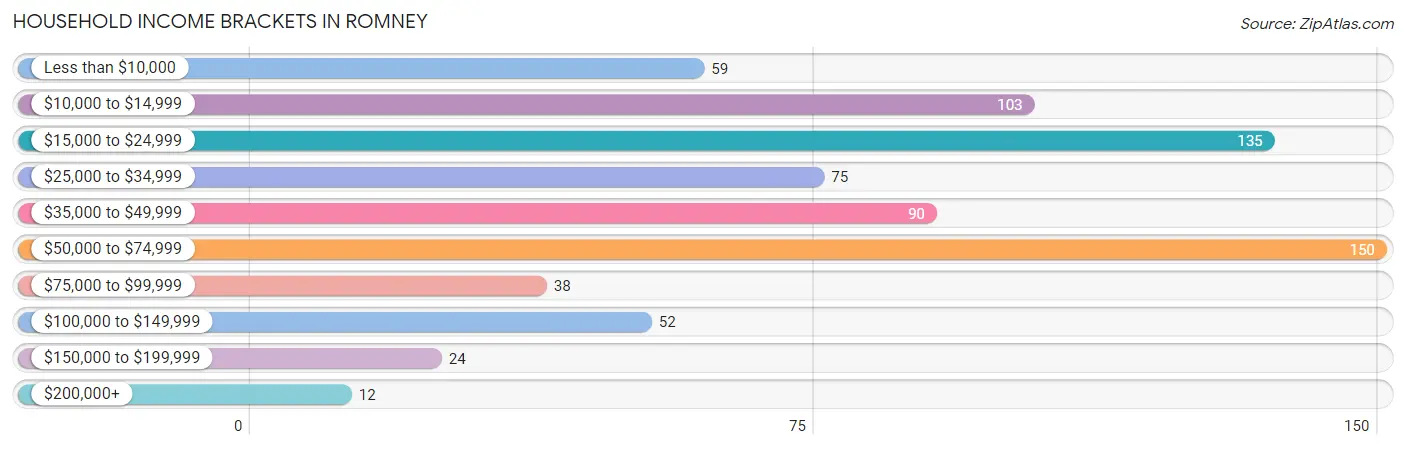
| Income Bracket | # Households | % Households |
| Less than $10,000 | 59 | 8.0% |
| $10,000 to $14,999 | 103 | 14.0% |
| $15,000 to $24,999 | 135 | 18.3% |
| $25,000 to $34,999 | 75 | 10.2% |
| $35,000 to $49,999 | 90 | 12.2% |
| $50,000 to $74,999 | 150 | 20.3% |
| $75,000 to $99,999 | 38 | 5.1% |
| $100,000 to $149,999 | 52 | 7.0% |
| $150,000 to $199,999 | 24 | 3.3% |
| $200,000+ | 12 | 1.6% |
Household Income by Householder Age in Romney
The median household income in Romney is $34,063, with the highest median household income of $53,571 found in the 45 to 64 years age bracket for the primary householder. A total of 302 households (40.9%) fall into this category. Meanwhile, the 15 to 24 years age bracket for the primary householder has the lowest median household income of $0, with 6 households (0.8%) in this group.
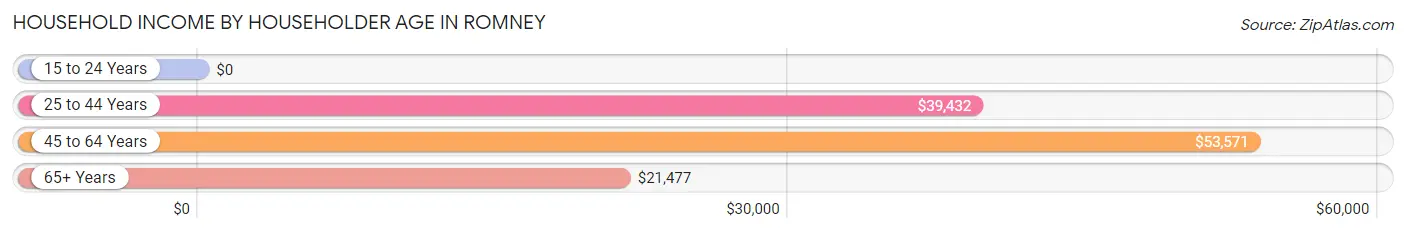
| Income Bracket | # Households | Median Income |
| 15 to 24 Years | 6 (0.8%) | $0 |
| 25 to 44 Years | 131 (17.7%) | $39,432 |
| 45 to 64 Years | 302 (40.9%) | $53,571 |
| 65+ Years | 299 (40.5%) | $21,477 |
| Total | 738 (100.0%) | $34,063 |
Poverty in Romney
Income Below Poverty by Sex and Age in Romney
With 31.5% poverty level for males and 34.6% for females among the residents of Romney, 16 and 17 year old males and 16 and 17 year old females are the most vulnerable to poverty, with 7 males (100.0%) and 45 females (100.0%) in their respective age groups living below the poverty level.
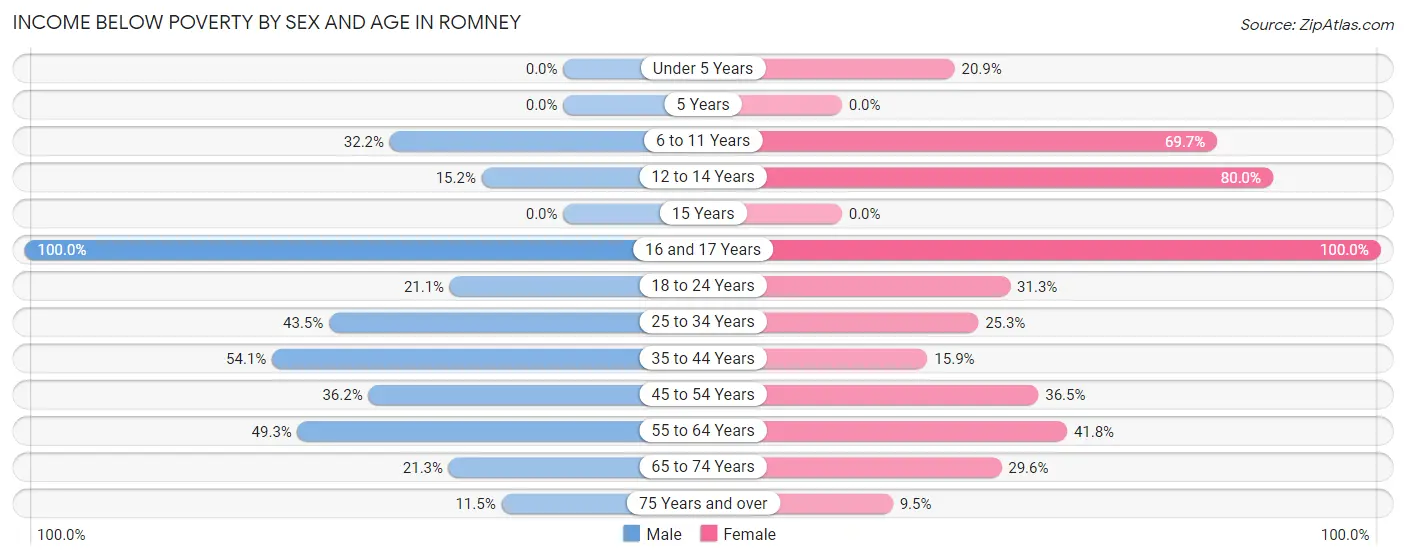
| Age Bracket | Male | Female |
| Under 5 Years | 0 (0.0%) | 9 (20.9%) |
| 5 Years | 0 (0.0%) | 0 (0.0%) |
| 6 to 11 Years | 38 (32.2%) | 62 (69.7%) |
| 12 to 14 Years | 15 (15.1%) | 32 (80.0%) |
| 15 Years | 0 (0.0%) | 0 (0.0%) |
| 16 and 17 Years | 7 (100.0%) | 45 (100.0%) |
| 18 to 24 Years | 4 (21.0%) | 10 (31.2%) |
| 25 to 34 Years | 10 (43.5%) | 20 (25.3%) |
| 35 to 44 Years | 40 (54.0%) | 17 (15.9%) |
| 45 to 54 Years | 68 (36.2%) | 58 (36.5%) |
| 55 to 64 Years | 73 (49.3%) | 56 (41.8%) |
| 65 to 74 Years | 17 (21.2%) | 37 (29.6%) |
| 75 Years and over | 7 (11.5%) | 19 (9.5%) |
| Total | 279 (31.5%) | 365 (34.6%) |
Income Above Poverty by Sex and Age in Romney
According to the poverty statistics in Romney, males aged 5 years and females aged 75 years and over are the age groups that are most secure financially, with 100.0% of males and 90.5% of females in these age groups living above the poverty line.
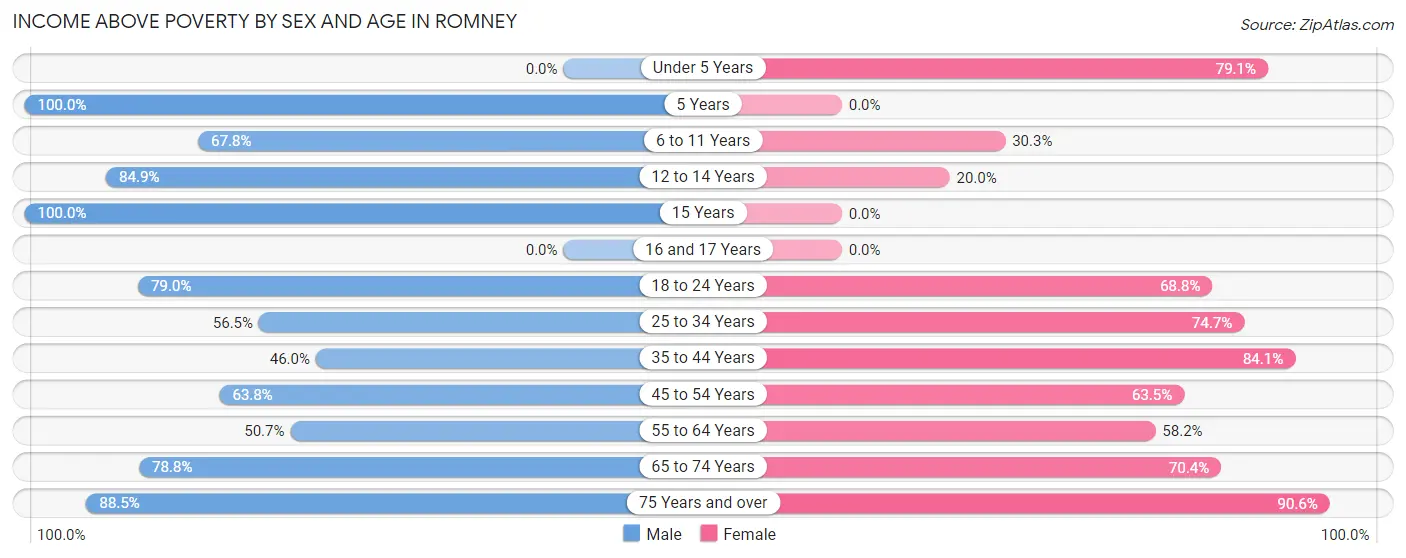
| Age Bracket | Male | Female |
| Under 5 Years | 0 (0.0%) | 34 (79.1%) |
| 5 Years | 32 (100.0%) | 0 (0.0%) |
| 6 to 11 Years | 80 (67.8%) | 27 (30.3%) |
| 12 to 14 Years | 84 (84.9%) | 8 (20.0%) |
| 15 Years | 37 (100.0%) | 0 (0.0%) |
| 16 and 17 Years | 0 (0.0%) | 0 (0.0%) |
| 18 to 24 Years | 15 (78.9%) | 22 (68.8%) |
| 25 to 34 Years | 13 (56.5%) | 59 (74.7%) |
| 35 to 44 Years | 34 (46.0%) | 90 (84.1%) |
| 45 to 54 Years | 120 (63.8%) | 101 (63.5%) |
| 55 to 64 Years | 75 (50.7%) | 78 (58.2%) |
| 65 to 74 Years | 63 (78.7%) | 88 (70.4%) |
| 75 Years and over | 54 (88.5%) | 182 (90.5%) |
| Total | 607 (68.5%) | 689 (65.4%) |
Income Below Poverty Among Married-Couple Families in Romney
The poverty statistics for married-couple families in Romney show that 4.9% or 9 of the total 183 families live below the poverty line. Families with no children have the highest poverty rate of 7.0%, comprising of 9 families. On the other hand, families with 1 or 2 children have the lowest poverty rate of 0.0%, which includes 0 families.
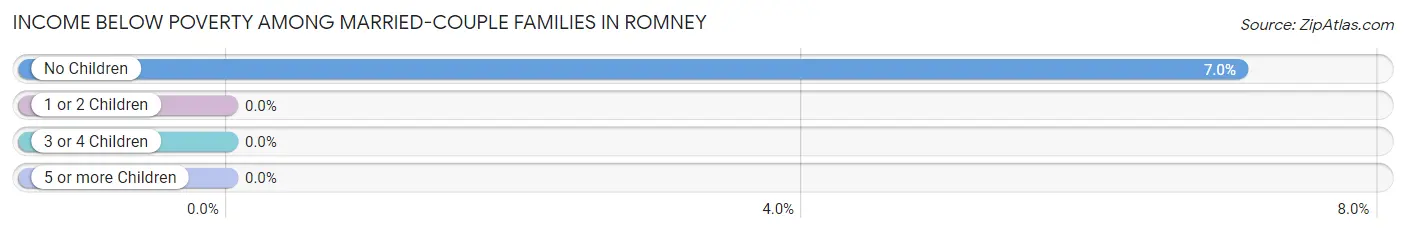
| Children | Above Poverty | Below Poverty |
| No Children | 119 (93.0%) | 9 (7.0%) |
| 1 or 2 Children | 36 (100.0%) | 0 (0.0%) |
| 3 or 4 Children | 19 (100.0%) | 0 (0.0%) |
| 5 or more Children | 0 (0.0%) | 0 (0.0%) |
| Total | 174 (95.1%) | 9 (4.9%) |
Income Below Poverty Among Single-Parent Households in Romney
According to the poverty data in Romney, 66.7% or 8 single-father households and 75.8% or 100 single-mother households are living below the poverty line. Among single-father households, those with no children have the highest poverty rate, with 8 households (66.7%) experiencing poverty. Likewise, among single-mother households, those with 3 or 4 children have the highest poverty rate, with 17 households (100.0%) falling below the poverty line.
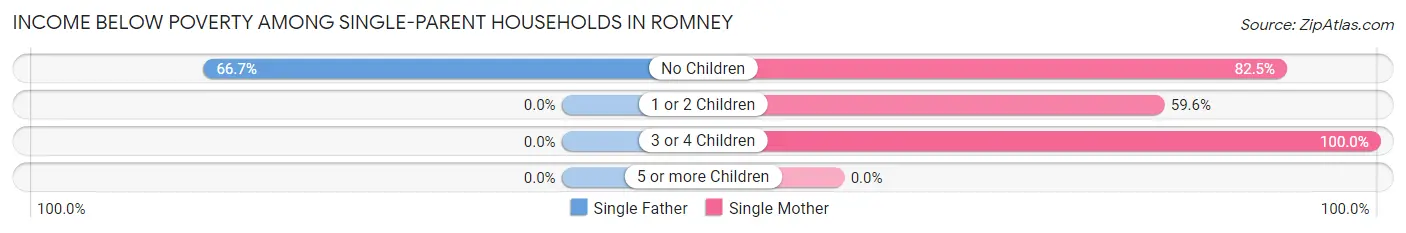
| Children | Single Father | Single Mother |
| No Children | 8 (66.7%) | 52 (82.5%) |
| 1 or 2 Children | 0 (0.0%) | 31 (59.6%) |
| 3 or 4 Children | 0 (0.0%) | 17 (100.0%) |
| 5 or more Children | 0 (0.0%) | 0 (0.0%) |
| Total | 8 (66.7%) | 100 (75.8%) |
Income Below Poverty Among Married-Couple vs Single-Parent Households in Romney
The poverty data for Romney shows that 9 of the married-couple family households (4.9%) and 108 of the single-parent households (75.0%) are living below the poverty level. Within the married-couple family households, those with no children have the highest poverty rate, with 9 households (7.0%) falling below the poverty line. Among the single-parent households, those with 3 or 4 children have the highest poverty rate, with 17 household (100.0%) living below poverty.
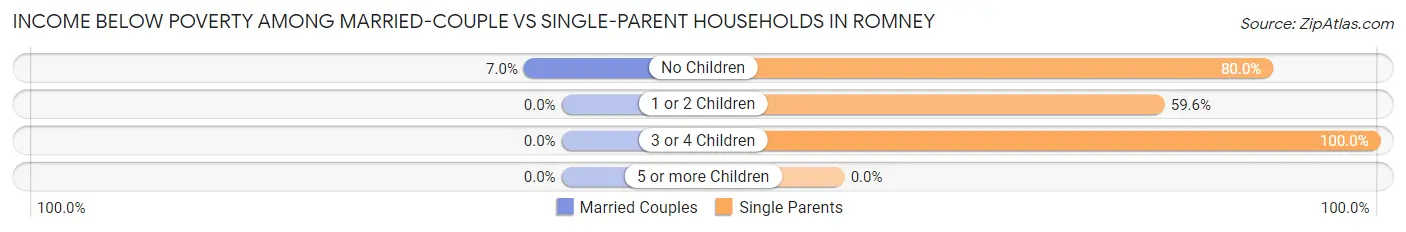
| Children | Married-Couple Families | Single-Parent Households |
| No Children | 9 (7.0%) | 60 (80.0%) |
| 1 or 2 Children | 0 (0.0%) | 31 (59.6%) |
| 3 or 4 Children | 0 (0.0%) | 17 (100.0%) |
| 5 or more Children | 0 (0.0%) | 0 (0.0%) |
| Total | 9 (4.9%) | 108 (75.0%) |
Race in Romney
The most populous races in Romney are White / Caucasian (1,762 | 85.5%), Two or more Races (273 | 13.2%), and Hispanic or Latino (125 | 6.1%).
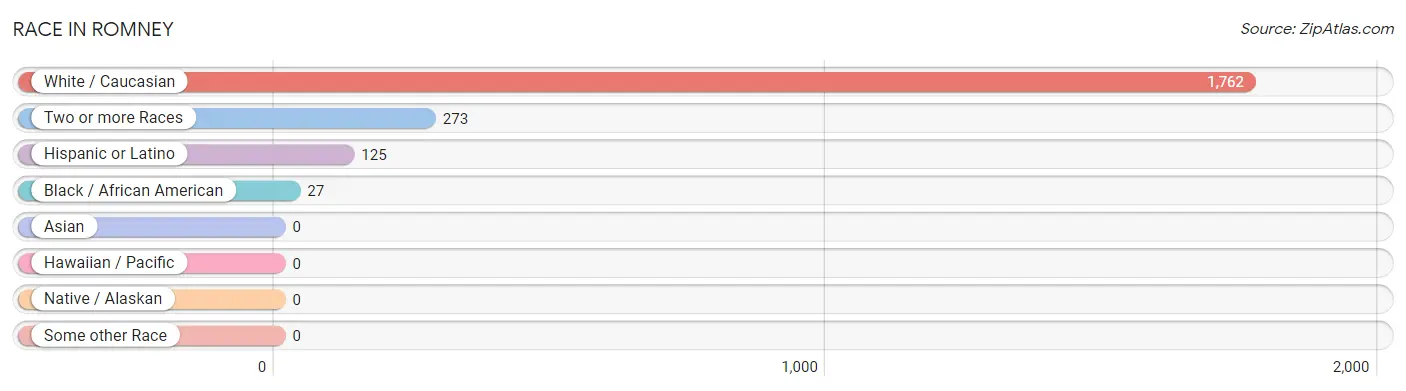
| Race | # Population | % Population |
| Asian | 0 | 0.0% |
| Black / African American | 27 | 1.3% |
| Hawaiian / Pacific | 0 | 0.0% |
| Hispanic or Latino | 125 | 6.1% |
| Native / Alaskan | 0 | 0.0% |
| White / Caucasian | 1,762 | 85.5% |
| Two or more Races | 273 | 13.2% |
| Some other Race | 0 | 0.0% |
| Total | 2,062 | 100.0% |
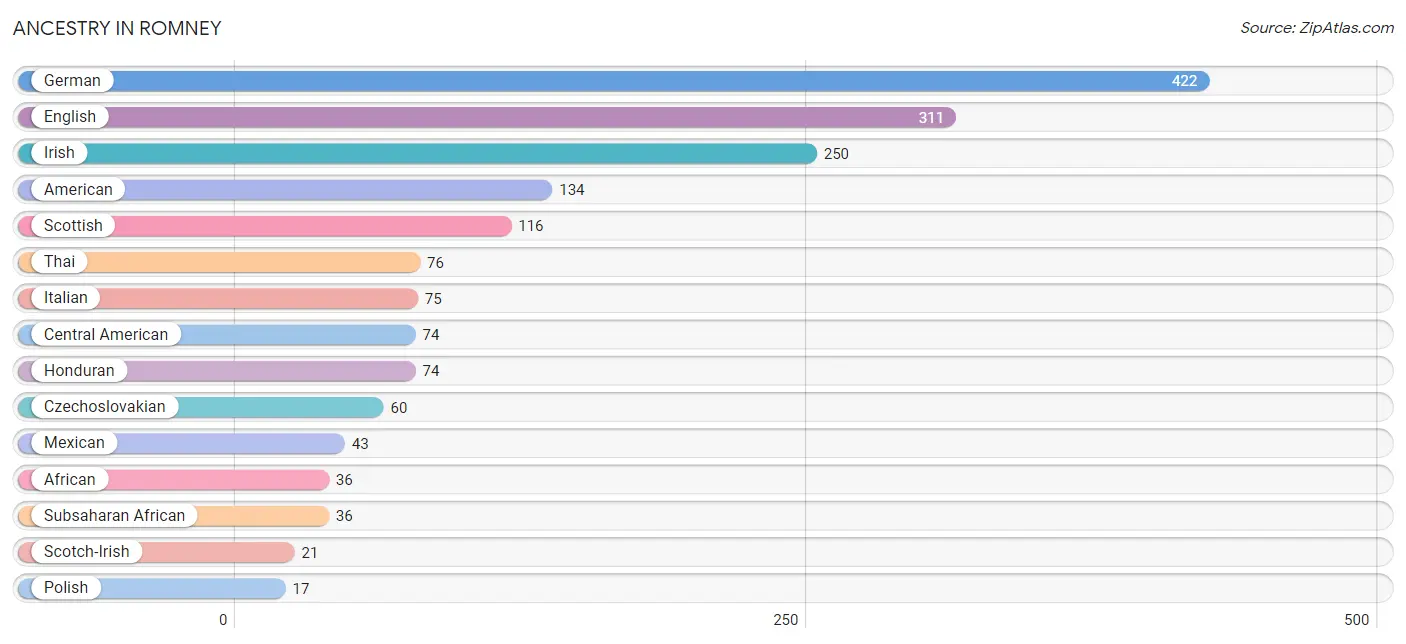
Ancestry in Romney
The most populous ancestries reported in Romney are German (422 | 20.5%), English (311 | 15.1%), Irish (250 | 12.1%), American (134 | 6.5%), and Scottish (116 | 5.6%), together accounting for 59.8% of all Romney residents.
| Ancestry | # Population | % Population |
| African | 36 | 1.8% |
| American | 134 | 6.5% |
| British | 5 | 0.2% |
| Canadian | 6 | 0.3% |
| Central American | 74 | 3.6% |
| Czechoslovakian | 60 | 2.9% |
| Dutch | 5 | 0.2% |
| English | 311 | 15.1% |
| European | 11 | 0.5% |
| French | 8 | 0.4% |
| German | 422 | 20.5% |
| Honduran | 74 | 3.6% |
| Hungarian | 13 | 0.6% |
| Irish | 250 | 12.1% |
| Italian | 75 | 3.6% |
| Mexican | 43 | 2.1% |
| Polish | 17 | 0.8% |
| Scotch-Irish | 21 | 1.0% |
| Scottish | 116 | 5.6% |
| Subsaharan African | 36 | 1.8% |
| Thai | 76 | 3.7% |
| Ukrainian | 5 | 0.2% |
| Welsh | 4 | 0.2% | View All 23 Rows |
Immigrants in Romney
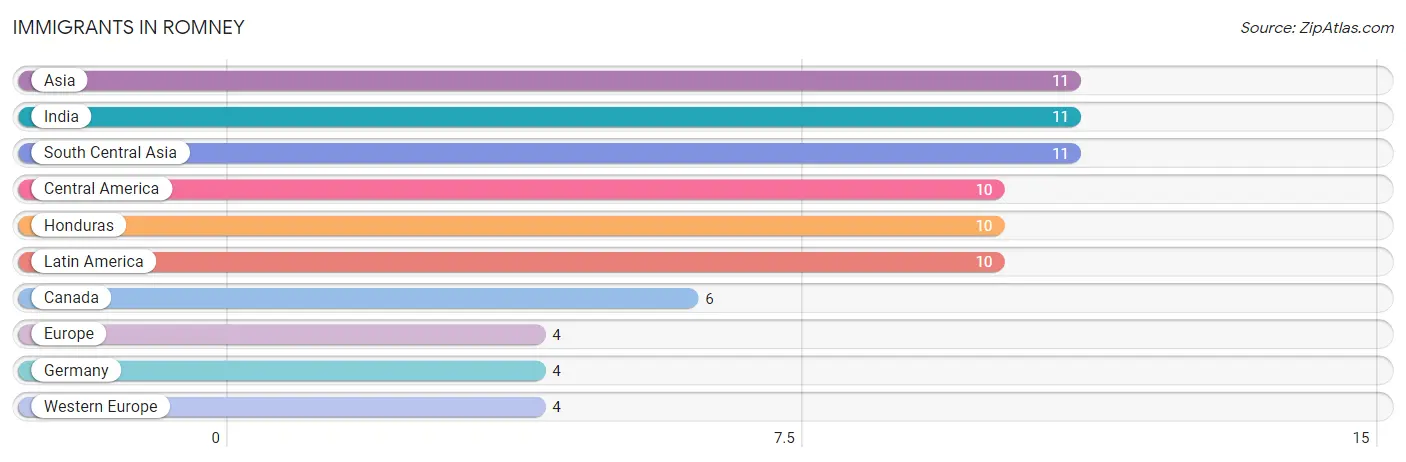
The most numerous immigrant groups reported in Romney came from Asia (11 | 0.5%), India (11 | 0.5%), South Central Asia (11 | 0.5%), Central America (10 | 0.5%), and Honduras (10 | 0.5%), together accounting for 2.5% of all Romney residents.
| Immigration Origin | # Population | % Population |
| Asia | 11 | 0.5% |
| Canada | 6 | 0.3% |
| Central America | 10 | 0.5% |
| Europe | 4 | 0.2% |
| Germany | 4 | 0.2% |
| Honduras | 10 | 0.5% |
| India | 11 | 0.5% |
| Latin America | 10 | 0.5% |
| South Central Asia | 11 | 0.5% |
| Western Europe | 4 | 0.2% | View All 10 Rows |
Sex and Age in Romney
Sex and Age in Romney
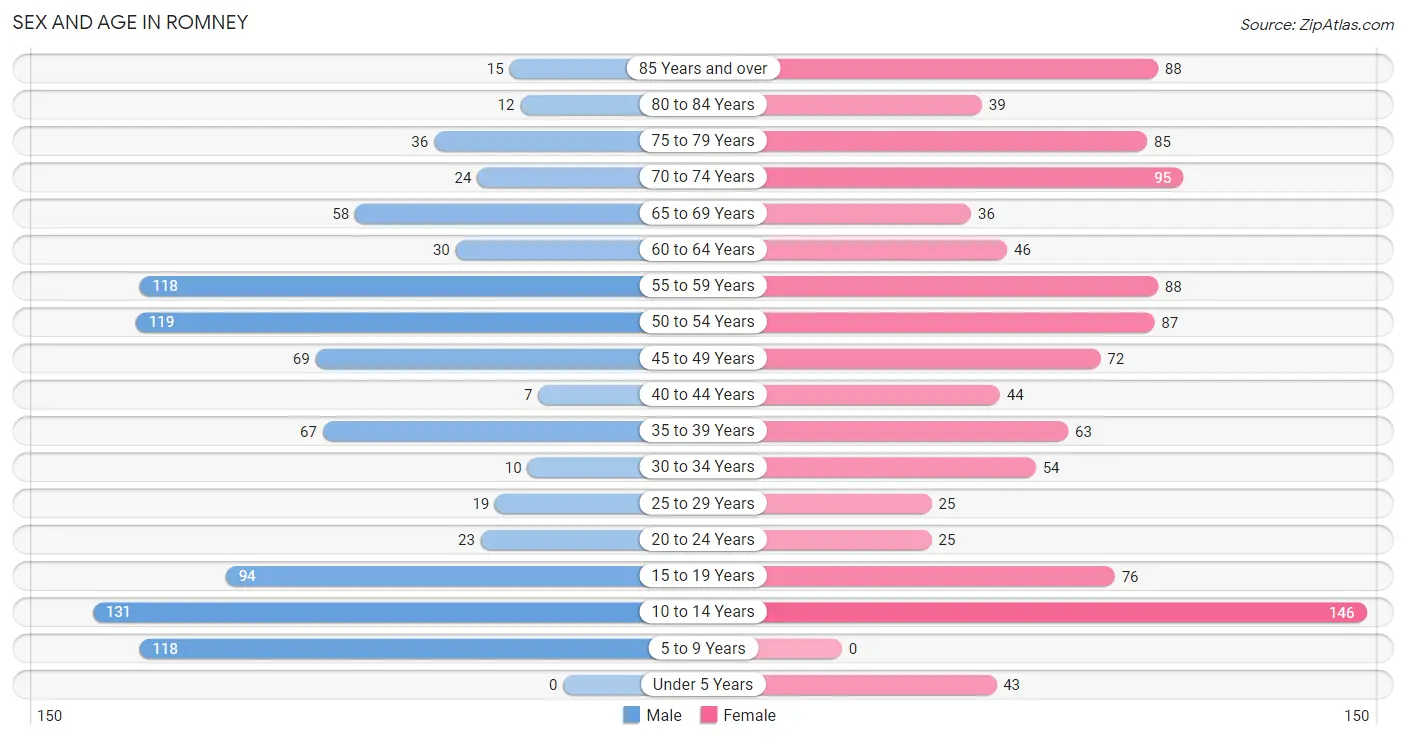
The most populous age groups in Romney are 10 to 14 Years (131 | 13.8%) for men and 10 to 14 Years (146 | 13.1%) for women.
| Age Bracket | Male | Female |
| Under 5 Years | 0 (0.0%) | 43 (3.9%) |
| 5 to 9 Years | 118 (12.4%) | 0 (0.0%) |
| 10 to 14 Years | 131 (13.8%) | 146 (13.1%) |
| 15 to 19 Years | 94 (9.9%) | 76 (6.8%) |
| 20 to 24 Years | 23 (2.4%) | 25 (2.2%) |
| 25 to 29 Years | 19 (2.0%) | 25 (2.2%) |
| 30 to 34 Years | 10 (1.1%) | 54 (4.9%) |
| 35 to 39 Years | 67 (7.0%) | 63 (5.7%) |
| 40 to 44 Years | 7 (0.7%) | 44 (4.0%) |
| 45 to 49 Years | 69 (7.3%) | 72 (6.5%) |
| 50 to 54 Years | 119 (12.5%) | 87 (7.8%) |
| 55 to 59 Years | 118 (12.4%) | 88 (7.9%) |
| 60 to 64 Years | 30 (3.2%) | 46 (4.1%) |
| 65 to 69 Years | 58 (6.1%) | 36 (3.2%) |
| 70 to 74 Years | 24 (2.5%) | 95 (8.5%) |
| 75 to 79 Years | 36 (3.8%) | 85 (7.6%) |
| 80 to 84 Years | 12 (1.3%) | 39 (3.5%) |
| 85 Years and over | 15 (1.6%) | 88 (7.9%) |
| Total | 950 (100.0%) | 1,112 (100.0%) |
Families and Households in Romney
Median Family Size in Romney
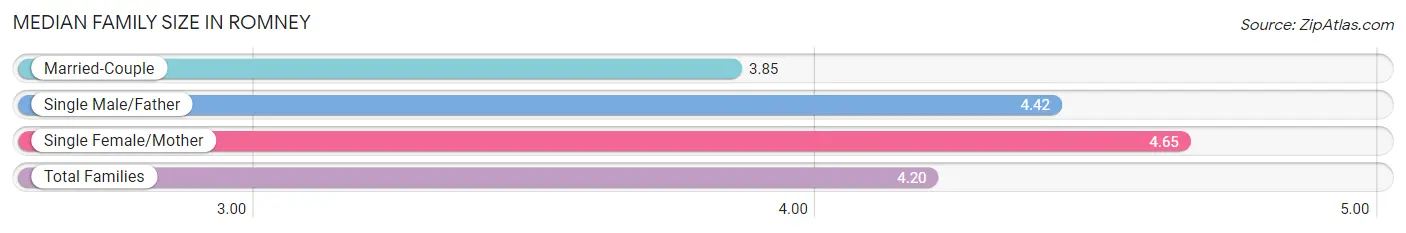
The median family size in Romney is 4.20 persons per family, with single female/mother families (132 | 40.4%) accounting for the largest median family size of 4.65 persons per family. On the other hand, married-couple families (183 | 56.0%) represent the smallest median family size with 3.85 persons per family.
| Family Type | # Families | Family Size |
| Married-Couple | 183 (56.0%) | 3.85 |
| Single Male/Father | 12 (3.7%) | 4.42 |
| Single Female/Mother | 132 (40.4%) | 4.65 |
| Total Families | 327 (100.0%) | 4.20 |
Median Household Size in Romney
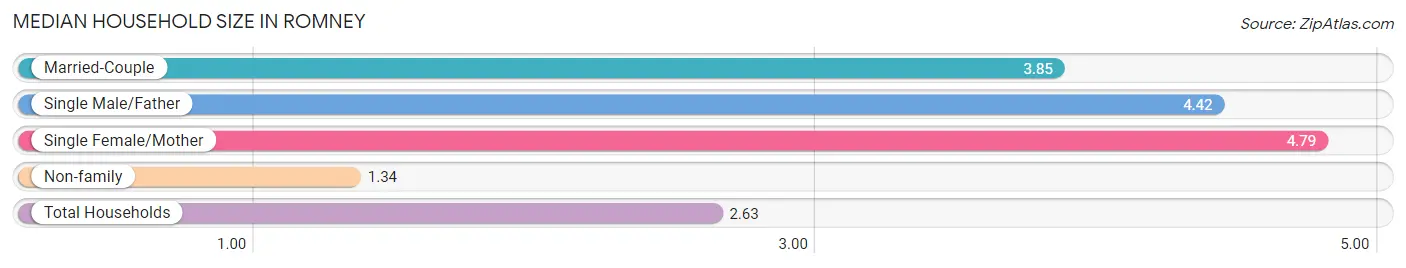
The median household size in Romney is 2.63 persons per household, with single female/mother households (132 | 17.9%) accounting for the largest median household size of 4.79 persons per household. non-family households (411 | 55.7%) represent the smallest median household size with 1.34 persons per household.
| Household Type | # Households | Household Size |
| Married-Couple | 183 (24.8%) | 3.85 |
| Single Male/Father | 12 (1.6%) | 4.42 |
| Single Female/Mother | 132 (17.9%) | 4.79 |
| Non-family | 411 (55.7%) | 1.34 |
| Total Households | 738 (100.0%) | 2.63 |
Household Size by Marriage Status in Romney
Out of a total of 738 households in Romney, 327 (44.3%) are family households, while 411 (55.7%) are nonfamily households. The most numerous type of family households are 2-person households, comprising 194, and the most common type of nonfamily households are 1-person households, comprising 372.
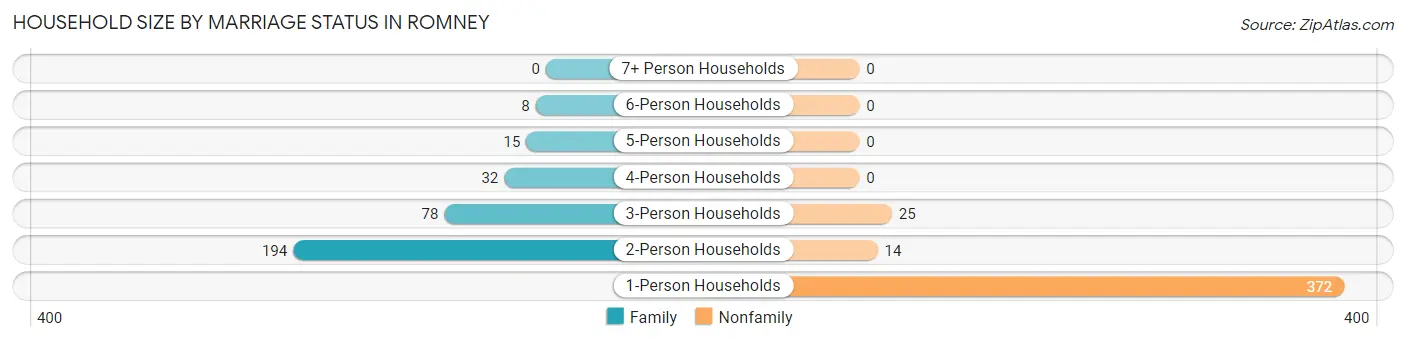
| Household Size | Family Households | Nonfamily Households |
| 1-Person Households | - | 372 (50.4%) |
| 2-Person Households | 194 (26.3%) | 14 (1.9%) |
| 3-Person Households | 78 (10.6%) | 25 (3.4%) |
| 4-Person Households | 32 (4.3%) | 0 (0.0%) |
| 5-Person Households | 15 (2.0%) | 0 (0.0%) |
| 6-Person Households | 8 (1.1%) | 0 (0.0%) |
| 7+ Person Households | 0 (0.0%) | 0 (0.0%) |
| Total | 327 (44.3%) | 411 (55.7%) |
Female Fertility in Romney
Fertility by Age in Romney
| Age Bracket | Women with Births | Births / 1,000 Women |
| 15 to 19 years | 0 (0.0%) | 0.0 |
| 20 to 34 years | 0 (0.0%) | 0.0 |
| 35 to 50 years | 0 (0.0%) | 0.0 |
| Total | 0 (0.0%) | 0.0 |
Fertility by Age by Marriage Status in Romney
| Age Bracket | Married | Unmarried |
| 15 to 19 years | 0 (0.0%) | 0 (0.0%) |
| 20 to 34 years | 0 (0.0%) | 0 (0.0%) |
| 35 to 50 years | 0 (0.0%) | 0 (0.0%) |
| Total | 0 (0.0%) | 0 (0.0%) |
Fertility by Education in Romney
| Educational Attainment | Women with Births | Births / 1,000 Women |
| Less than High School | 0 (0.0%) | 0.0 |
| High School Diploma | 0 (0.0%) | 0.0 |
| College or Associate's Degree | 0 (0.0%) | 0.0 |
| Bachelor's Degree | 0 (0.0%) | 0.0 |
| Graduate Degree | 0 (0.0%) | 0.0 |
| Total | 0 (0.0%) | 0.0 |
Fertility by Education by Marriage Status in Romney
| Educational Attainment | Married | Unmarried |
| Less than High School | 0 (0.0%) | 0 (0.0%) |
| High School Diploma | 0 (0.0%) | 0 (0.0%) |
| College or Associate's Degree | 0 (0.0%) | 0 (0.0%) |
| Bachelor's Degree | 0 (0.0%) | 0 (0.0%) |
| Graduate Degree | 0 (0.0%) | 0 (0.0%) |
| Total | 0 (0.0%) | 0 (0.0%) |
Employment Characteristics in Romney
Employment by Class of Employer in Romney
Among the 524 employed individuals in Romney, private company employees (296 | 56.5%), not-for-profit organizations (79 | 15.1%), and state government employees (53 | 10.1%) make up the most common classes of employment.
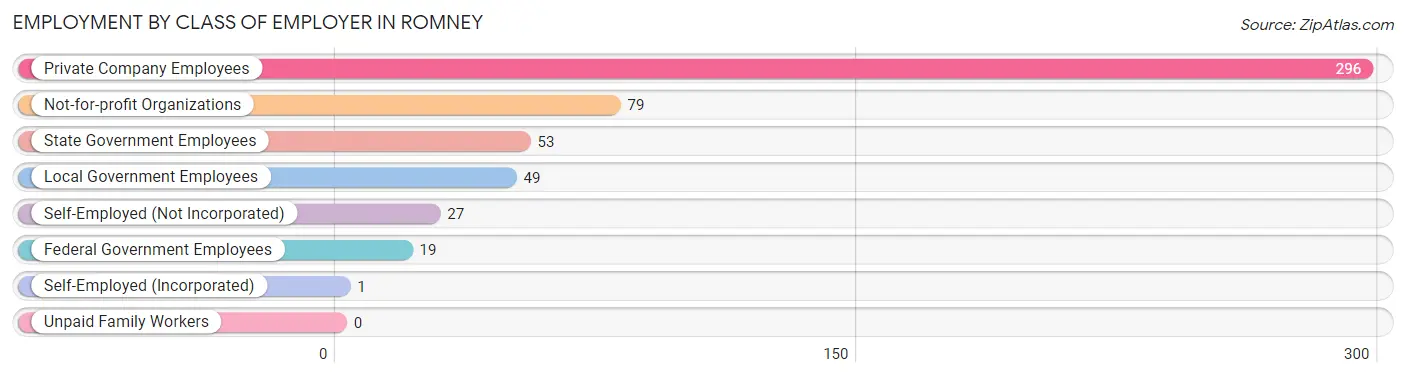
| Employer Class | # Employees | % Employees |
| Private Company Employees | 296 | 56.5% |
| Self-Employed (Incorporated) | 1 | 0.2% |
| Self-Employed (Not Incorporated) | 27 | 5.1% |
| Not-for-profit Organizations | 79 | 15.1% |
| Local Government Employees | 49 | 9.3% |
| State Government Employees | 53 | 10.1% |
| Federal Government Employees | 19 | 3.6% |
| Unpaid Family Workers | 0 | 0.0% |
| Total | 524 | 100.0% |
Employment Status by Age in Romney
According to the labor force statistics for Romney, out of the total population over 16 years of age (1,583), 39.0% or 617 individuals are in the labor force, with 13.9% or 86 of them unemployed. The age group with the highest labor force participation rate is 35 to 44 years, with 77.9% or 141 individuals in the labor force. Within the labor force, the 16 to 19 years age range has the highest percentage of unemployed individuals, with 42.9% or 12 of them being unemployed.
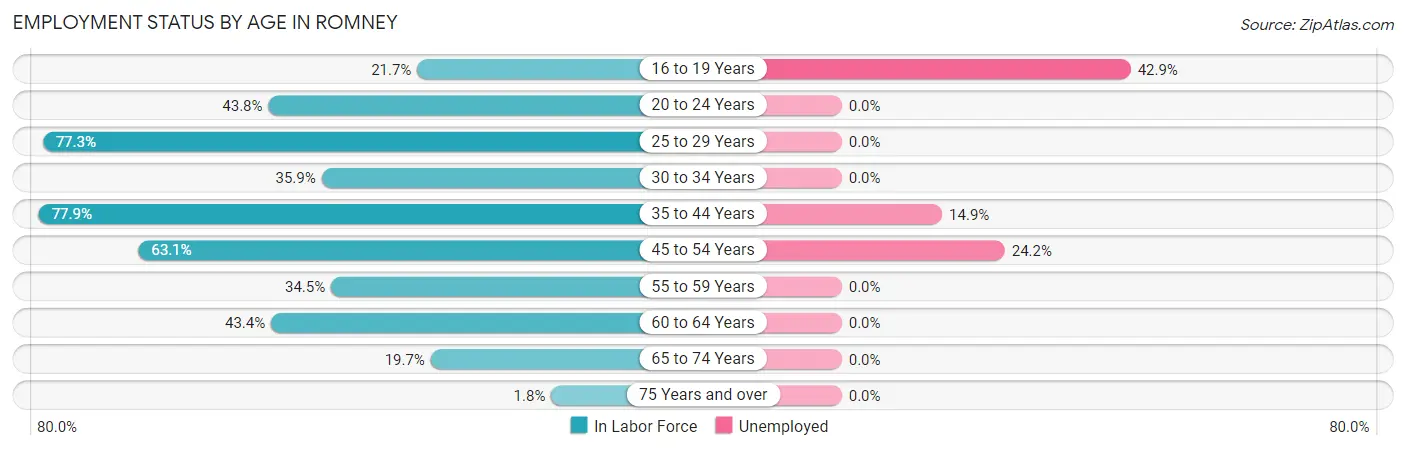
| Age Bracket | In Labor Force | Unemployed |
| 16 to 19 Years | 28 (21.7%) | 12 (42.9%) |
| 20 to 24 Years | 21 (43.8%) | 0 (0.0%) |
| 25 to 29 Years | 34 (77.3%) | 0 (0.0%) |
| 30 to 34 Years | 23 (35.9%) | 0 (0.0%) |
| 35 to 44 Years | 141 (77.9%) | 21 (14.9%) |
| 45 to 54 Years | 219 (63.1%) | 53 (24.2%) |
| 55 to 59 Years | 71 (34.5%) | 0 (0.0%) |
| 60 to 64 Years | 33 (43.4%) | 0 (0.0%) |
| 65 to 74 Years | 42 (19.7%) | 0 (0.0%) |
| 75 Years and over | 5 (1.8%) | 0 (0.0%) |
| Total | 617 (39.0%) | 86 (13.9%) |
Employment Status by Educational Attainment in Romney
According to labor force statistics for Romney, 56.8% of individuals (521) out of the total population between 25 and 64 years of age (918) are in the labor force, with 14.2% or 74 of them being unemployed. The group with the highest labor force participation rate are those with the educational attainment of bachelor's degree or higher, with 95.1% or 135 individuals in the labor force. Within the labor force, individuals with high school diploma education have the highest percentage of unemployment, with 24.8% or 53 of them being unemployed.
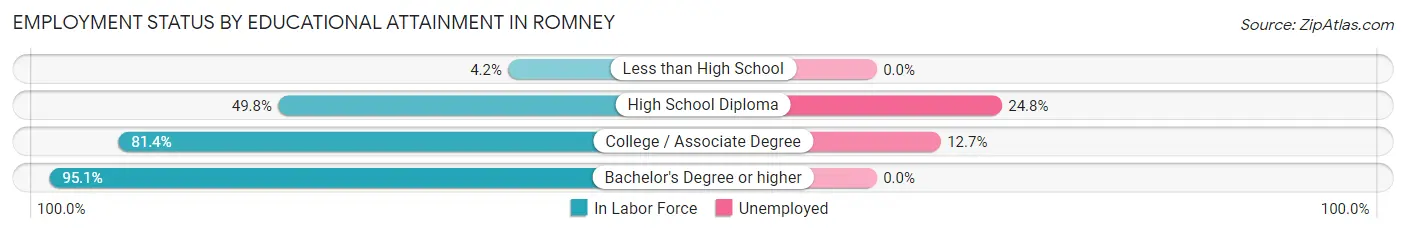
| Educational Attainment | In Labor Force | Unemployed |
| Less than High School | 6 (4.2%) | 0 (0.0%) |
| High School Diploma | 214 (49.8%) | 107 (24.8%) |
| College / Associate Degree | 166 (81.4%) | 26 (12.7%) |
| Bachelor's Degree or higher | 135 (95.1%) | 0 (0.0%) |
| Total | 521 (56.8%) | 130 (14.2%) |
Employment Occupations by Sex in Romney
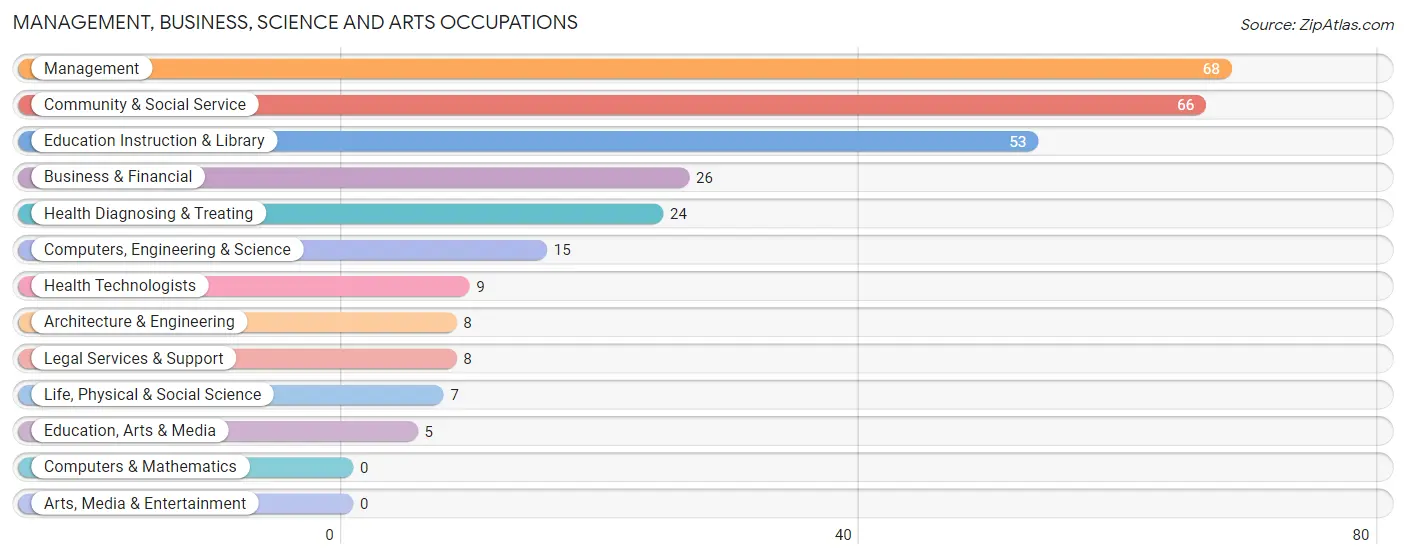
Management, Business, Science and Arts Occupations
The most common Management, Business, Science and Arts occupations in Romney are Management (68 | 12.8%), Community & Social Service (66 | 12.4%), Education Instruction & Library (53 | 10.0%), Business & Financial (26 | 4.9%), and Health Diagnosing & Treating (24 | 4.5%).
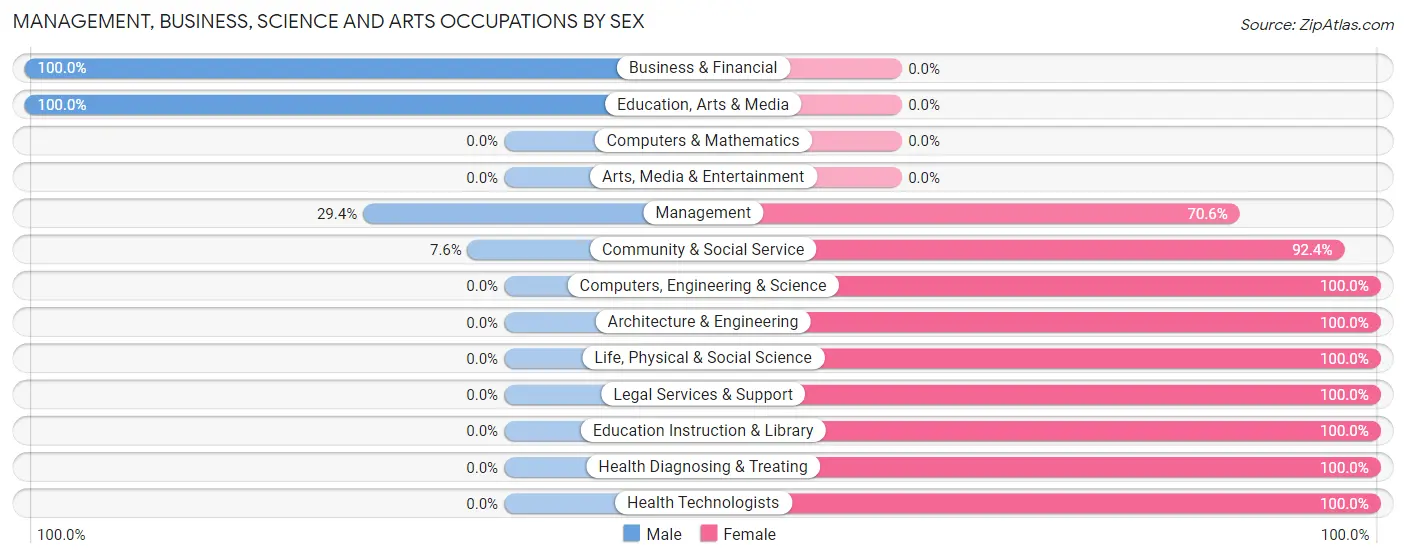
Management, Business, Science and Arts Occupations by Sex
Within the Management, Business, Science and Arts occupations in Romney, the most male-oriented occupations are Business & Financial (100.0%), Education, Arts & Media (100.0%), and Management (29.4%), while the most female-oriented occupations are Computers, Engineering & Science (100.0%), Architecture & Engineering (100.0%), and Life, Physical & Social Science (100.0%).
| Occupation | Male | Female |
| Management | 20 (29.4%) | 48 (70.6%) |
| Business & Financial | 26 (100.0%) | 0 (0.0%) |
| Computers, Engineering & Science | 0 (0.0%) | 15 (100.0%) |
| Computers & Mathematics | 0 (0.0%) | 0 (0.0%) |
| Architecture & Engineering | 0 (0.0%) | 8 (100.0%) |
| Life, Physical & Social Science | 0 (0.0%) | 7 (100.0%) |
| Community & Social Service | 5 (7.6%) | 61 (92.4%) |
| Education, Arts & Media | 5 (100.0%) | 0 (0.0%) |
| Legal Services & Support | 0 (0.0%) | 8 (100.0%) |
| Education Instruction & Library | 0 (0.0%) | 53 (100.0%) |
| Arts, Media & Entertainment | 0 (0.0%) | 0 (0.0%) |
| Health Diagnosing & Treating | 0 (0.0%) | 24 (100.0%) |
| Health Technologists | 0 (0.0%) | 9 (100.0%) |
| Total (Category) | 51 (25.6%) | 148 (74.4%) |
| Total (Overall) | 193 (36.3%) | 338 (63.6%) |
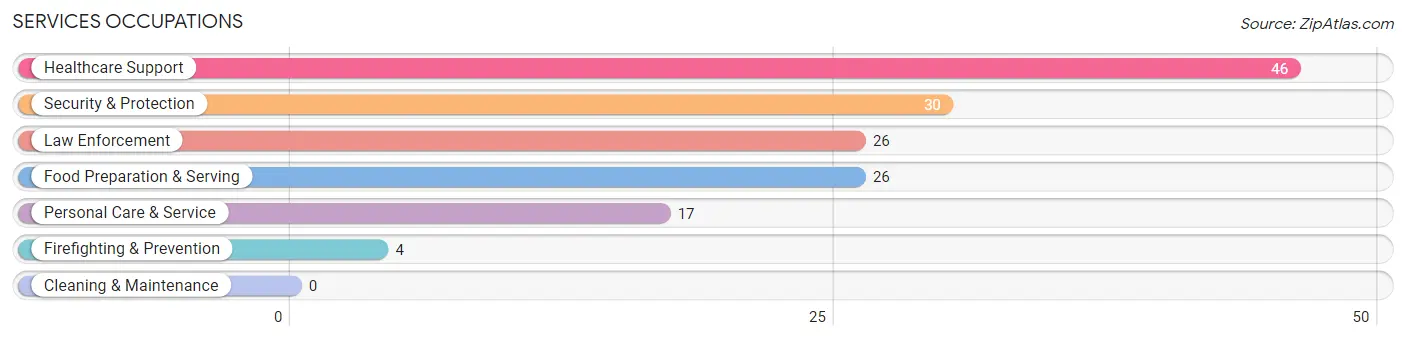
Services Occupations
The most common Services occupations in Romney are Healthcare Support (46 | 8.7%), Security & Protection (30 | 5.7%), Law Enforcement (26 | 4.9%), Food Preparation & Serving (26 | 4.9%), and Personal Care & Service (17 | 3.2%).
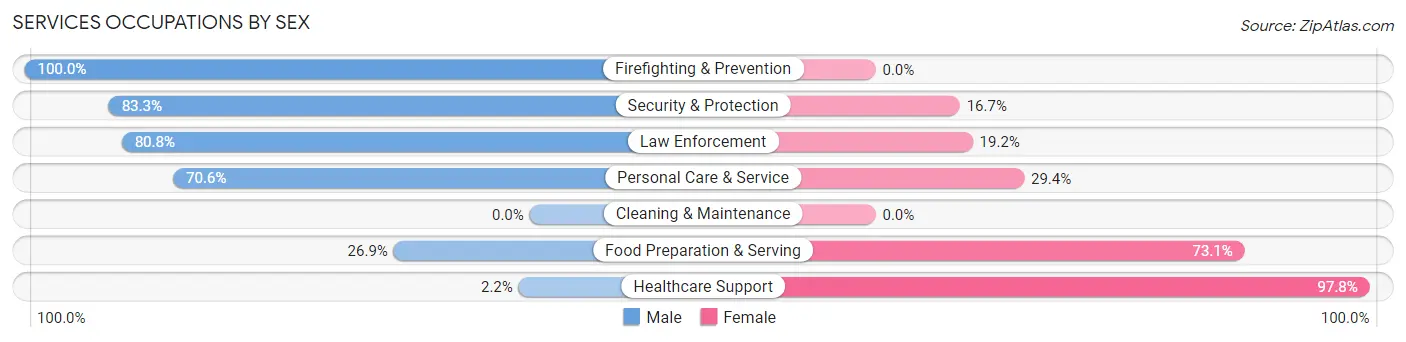
Services Occupations by Sex
Within the Services occupations in Romney, the most male-oriented occupations are Firefighting & Prevention (100.0%), Security & Protection (83.3%), and Law Enforcement (80.8%), while the most female-oriented occupations are Healthcare Support (97.8%), Food Preparation & Serving (73.1%), and Personal Care & Service (29.4%).
| Occupation | Male | Female |
| Healthcare Support | 1 (2.2%) | 45 (97.8%) |
| Security & Protection | 25 (83.3%) | 5 (16.7%) |
| Firefighting & Prevention | 4 (100.0%) | 0 (0.0%) |
| Law Enforcement | 21 (80.8%) | 5 (19.2%) |
| Food Preparation & Serving | 7 (26.9%) | 19 (73.1%) |
| Cleaning & Maintenance | 0 (0.0%) | 0 (0.0%) |
| Personal Care & Service | 12 (70.6%) | 5 (29.4%) |
| Total (Category) | 45 (37.8%) | 74 (62.2%) |
| Total (Overall) | 193 (36.3%) | 338 (63.6%) |
Sales and Office Occupations
The most common Sales and Office occupations in Romney are Sales & Related (68 | 12.8%), and Office & Administration (35 | 6.6%).
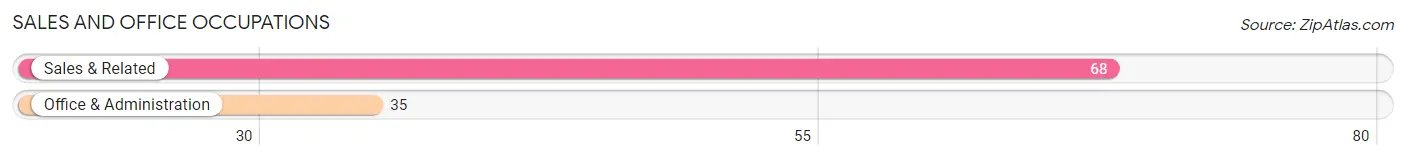
Sales and Office Occupations by Sex
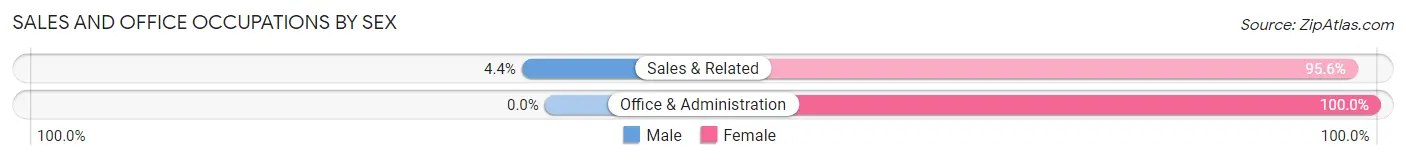
| Occupation | Male | Female |
| Sales & Related | 3 (4.4%) | 65 (95.6%) |
| Office & Administration | 0 (0.0%) | 35 (100.0%) |
| Total (Category) | 3 (2.9%) | 100 (97.1%) |
| Total (Overall) | 193 (36.3%) | 338 (63.6%) |
Natural Resources, Construction and Maintenance Occupations
The most common Natural Resources, Construction and Maintenance occupations in Romney are Construction & Extraction (26 | 4.9%), and Installation, Maintenance & Repair (14 | 2.6%).
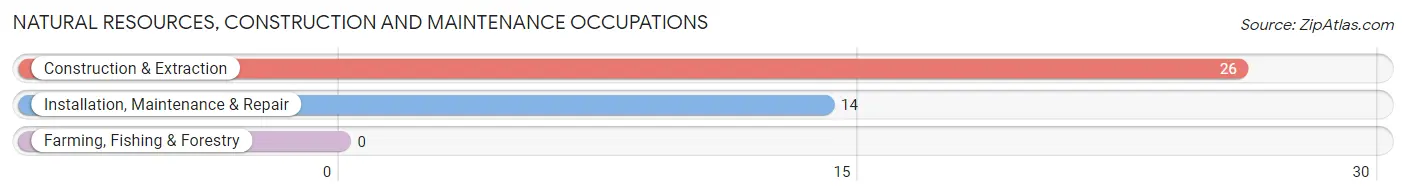
Natural Resources, Construction and Maintenance Occupations by Sex
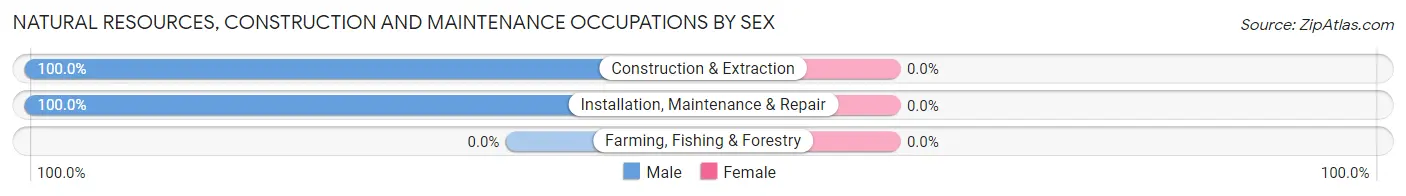
| Occupation | Male | Female |
| Farming, Fishing & Forestry | 0 (0.0%) | 0 (0.0%) |
| Construction & Extraction | 26 (100.0%) | 0 (0.0%) |
| Installation, Maintenance & Repair | 14 (100.0%) | 0 (0.0%) |
| Total (Category) | 40 (100.0%) | 0 (0.0%) |
| Total (Overall) | 193 (36.3%) | 338 (63.6%) |
Production, Transportation and Moving Occupations
The most common Production, Transportation and Moving occupations in Romney are Transportation (38 | 7.2%), Material Moving (21 | 4.0%), and Production (11 | 2.1%).
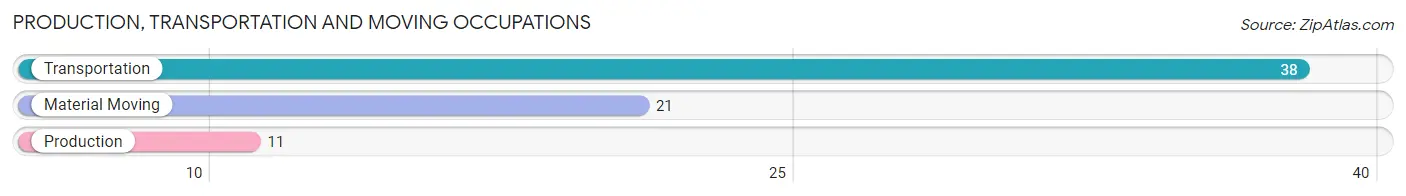
Production, Transportation and Moving Occupations by Sex
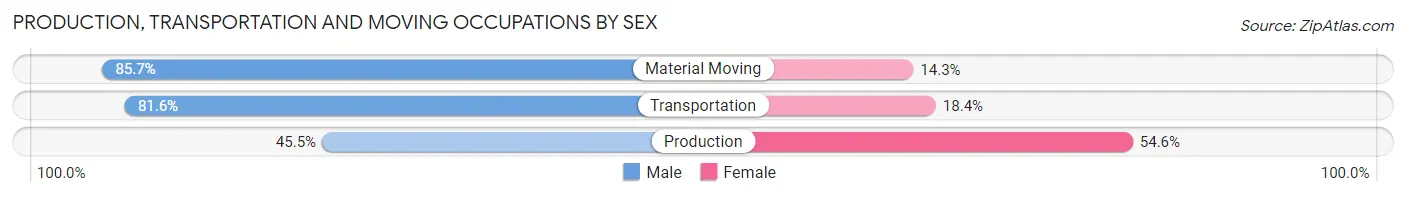
| Occupation | Male | Female |
| Production | 5 (45.5%) | 6 (54.5%) |
| Transportation | 31 (81.6%) | 7 (18.4%) |
| Material Moving | 18 (85.7%) | 3 (14.3%) |
| Total (Category) | 54 (77.1%) | 16 (22.9%) |
| Total (Overall) | 193 (36.3%) | 338 (63.6%) |
Employment Industries by Sex in Romney
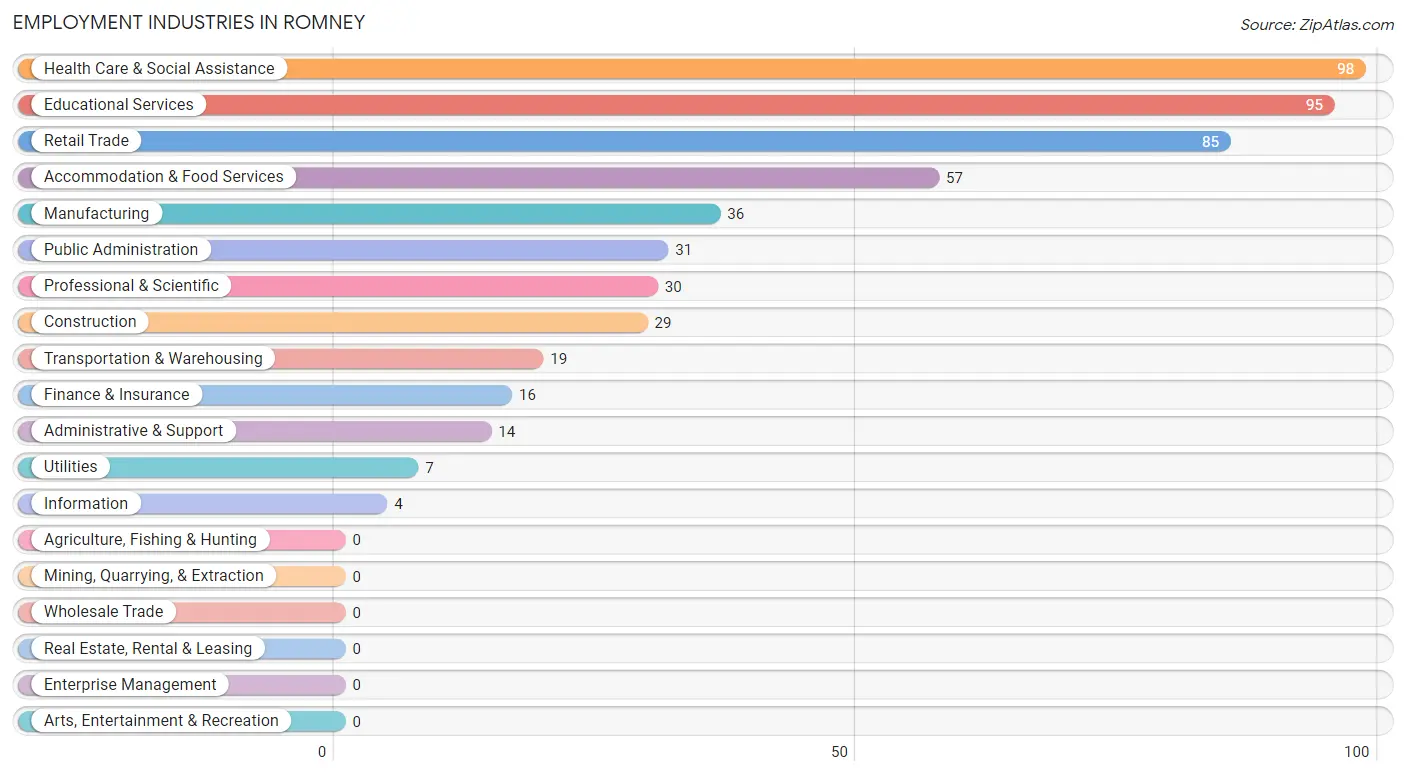
Employment Industries in Romney
The major employment industries in Romney include Health Care & Social Assistance (98 | 18.5%), Educational Services (95 | 17.9%), Retail Trade (85 | 16.0%), Accommodation & Food Services (57 | 10.7%), and Manufacturing (36 | 6.8%).
Employment Industries by Sex in Romney
The Romney industries that see more men than women are Administrative & Support (100.0%), Construction (89.7%), and Manufacturing (75.0%), whereas the industries that tend to have a higher number of women are Utilities (100.0%), Information (100.0%), and Educational Services (99.0%).
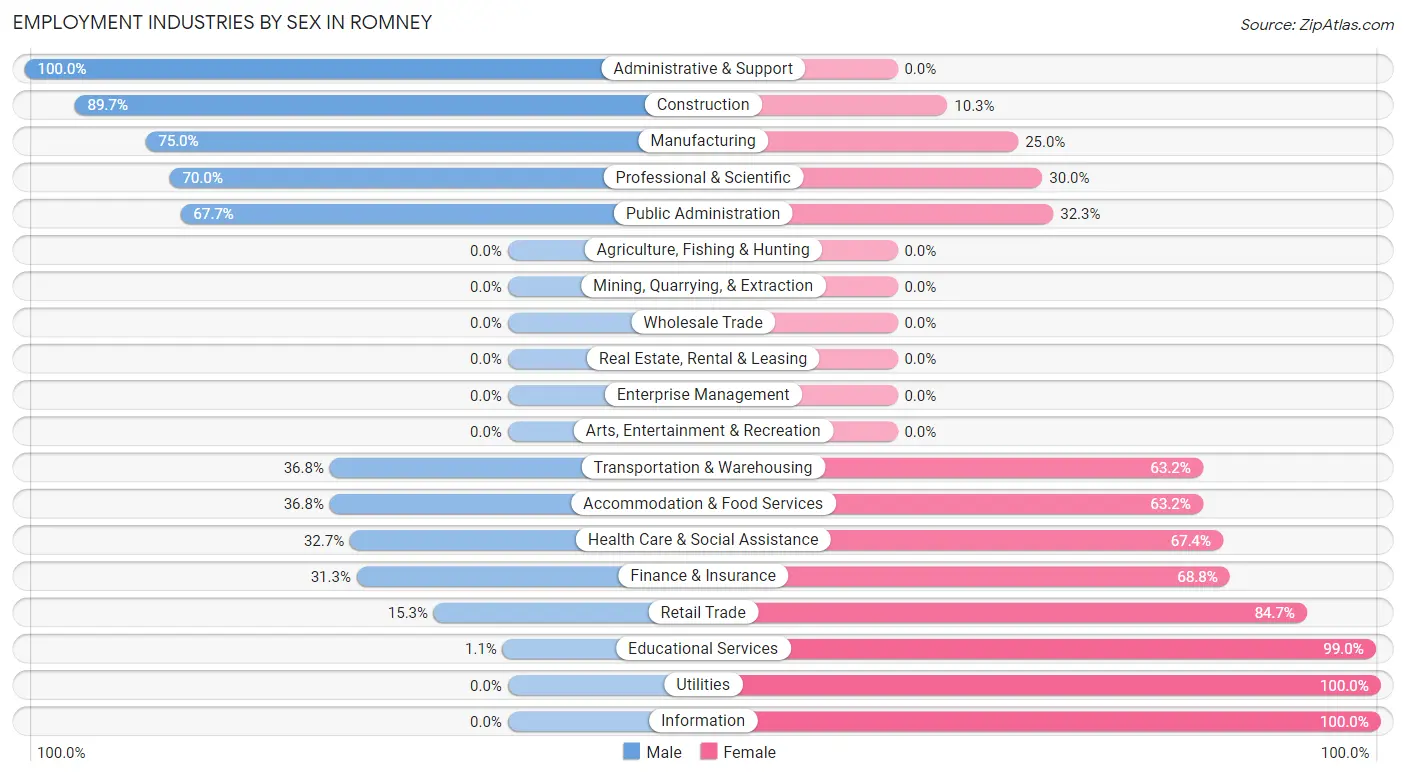
| Industry | Male | Female |
| Agriculture, Fishing & Hunting | 0 (0.0%) | 0 (0.0%) |
| Mining, Quarrying, & Extraction | 0 (0.0%) | 0 (0.0%) |
| Construction | 26 (89.7%) | 3 (10.3%) |
| Manufacturing | 27 (75.0%) | 9 (25.0%) |
| Wholesale Trade | 0 (0.0%) | 0 (0.0%) |
| Retail Trade | 13 (15.3%) | 72 (84.7%) |
| Transportation & Warehousing | 7 (36.8%) | 12 (63.2%) |
| Utilities | 0 (0.0%) | 7 (100.0%) |
| Information | 0 (0.0%) | 4 (100.0%) |
| Finance & Insurance | 5 (31.2%) | 11 (68.8%) |
| Real Estate, Rental & Leasing | 0 (0.0%) | 0 (0.0%) |
| Professional & Scientific | 21 (70.0%) | 9 (30.0%) |
| Enterprise Management | 0 (0.0%) | 0 (0.0%) |
| Administrative & Support | 14 (100.0%) | 0 (0.0%) |
| Educational Services | 1 (1.1%) | 94 (99.0%) |
| Health Care & Social Assistance | 32 (32.7%) | 66 (67.3%) |
| Arts, Entertainment & Recreation | 0 (0.0%) | 0 (0.0%) |
| Accommodation & Food Services | 21 (36.8%) | 36 (63.2%) |
| Public Administration | 21 (67.7%) | 10 (32.3%) |
| Total | 193 (36.3%) | 338 (63.6%) |
Education in Romney
School Enrollment in Romney
The most common levels of schooling among the 564 students in Romney are middle school (264 | 46.8%), high school (151 | 26.8%), and elementary school (86 | 15.2%).
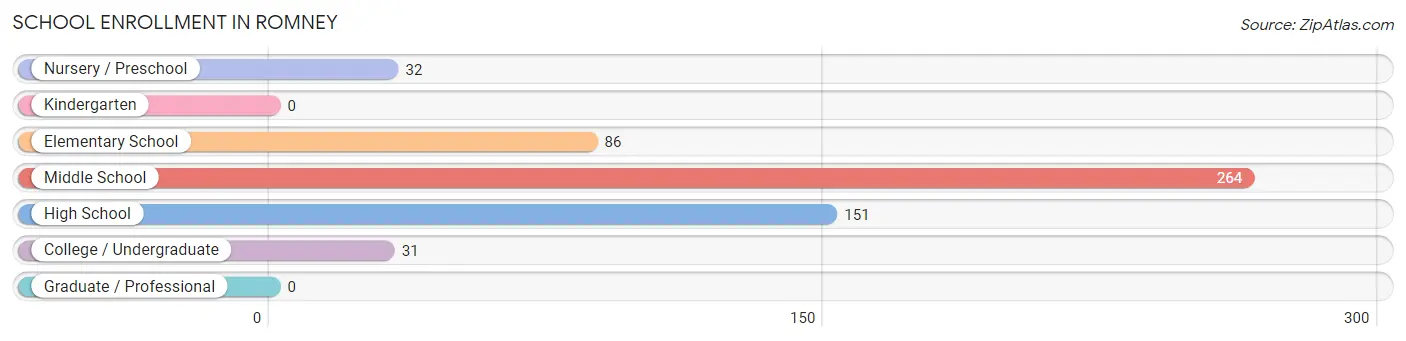
| School Level | # Students | % Students |
| Nursery / Preschool | 32 | 5.7% |
| Kindergarten | 0 | 0.0% |
| Elementary School | 86 | 15.2% |
| Middle School | 264 | 46.8% |
| High School | 151 | 26.8% |
| College / Undergraduate | 31 | 5.5% |
| Graduate / Professional | 0 | 0.0% |
| Total | 564 | 100.0% |
School Enrollment by Age by Funding Source in Romney
Out of a total of 564 students who are enrolled in schools in Romney, 3 (0.5%) attend a private institution, while the remaining 561 (99.5%) are enrolled in public schools. The age group of 15 to 17 year olds has the highest likelihood of being enrolled in private schools, with 3 (2.1% in the age bracket) enrolled. Conversely, the age group of 5 to 9 year old has the lowest likelihood of being enrolled in a private school, with 118 (100.0% in the age bracket) attending a public institution.
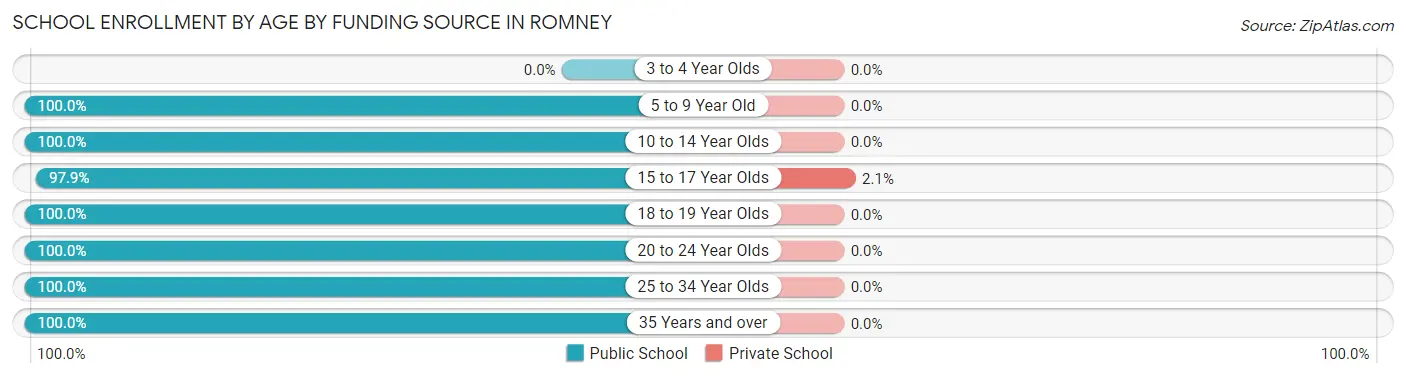
| Age Bracket | Public School | Private School |
| 3 to 4 Year Olds | 0 (0.0%) | 0 (0.0%) |
| 5 to 9 Year Old | 118 (100.0%) | 0 (0.0%) |
| 10 to 14 Year Olds | 264 (100.0%) | 0 (0.0%) |
| 15 to 17 Year Olds | 137 (97.9%) | 3 (2.1%) |
| 18 to 19 Year Olds | 20 (100.0%) | 0 (0.0%) |
| 20 to 24 Year Olds | 13 (100.0%) | 0 (0.0%) |
| 25 to 34 Year Olds | 1 (100.0%) | 0 (0.0%) |
| 35 Years and over | 8 (100.0%) | 0 (0.0%) |
| Total | 561 (99.5%) | 3 (0.5%) |
Educational Attainment by Field of Study in Romney
Education (89 | 33.8%), business (32 | 12.2%), social sciences (28 | 10.6%), science & technology (24 | 9.1%), and psychology (20 | 7.6%) are the most common fields of study among 263 individuals in Romney who have obtained a bachelor's degree or higher.
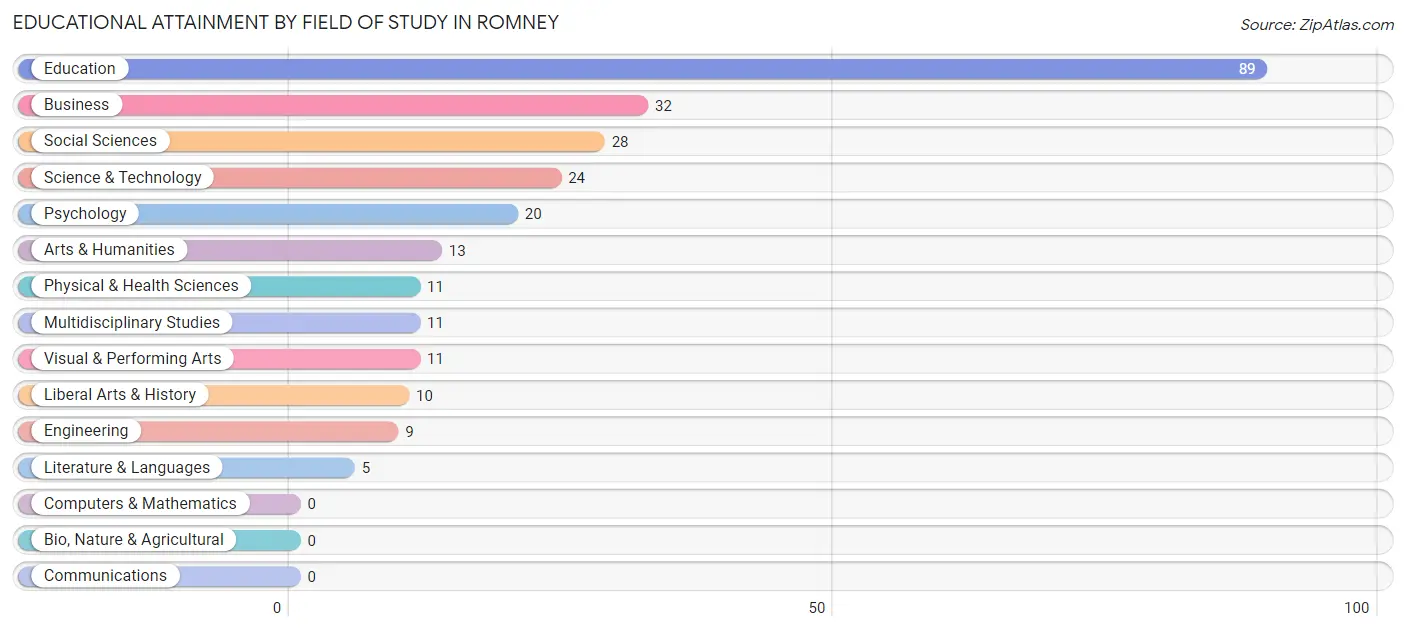
| Field of Study | # Graduates | % Graduates |
| Computers & Mathematics | 0 | 0.0% |
| Bio, Nature & Agricultural | 0 | 0.0% |
| Physical & Health Sciences | 11 | 4.2% |
| Psychology | 20 | 7.6% |
| Social Sciences | 28 | 10.6% |
| Engineering | 9 | 3.4% |
| Multidisciplinary Studies | 11 | 4.2% |
| Science & Technology | 24 | 9.1% |
| Business | 32 | 12.2% |
| Education | 89 | 33.8% |
| Literature & Languages | 5 | 1.9% |
| Liberal Arts & History | 10 | 3.8% |
| Visual & Performing Arts | 11 | 4.2% |
| Communications | 0 | 0.0% |
| Arts & Humanities | 13 | 4.9% |
| Total | 263 | 100.0% |
Transportation & Commute in Romney
Vehicle Availability by Sex in Romney
The most prevalent vehicle ownership categories in Romney are males with 2 vehicles (81, accounting for 42.0%) and females with 2 vehicles (76, making up 24.5%).
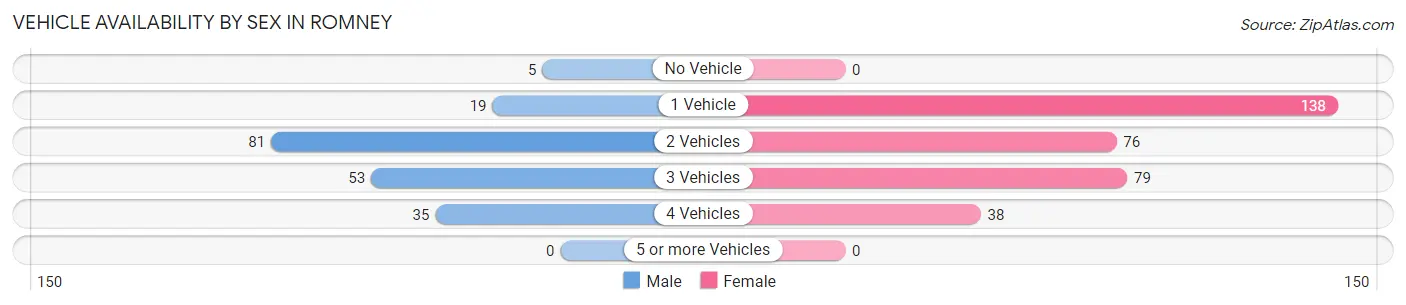
| Vehicles Available | Male | Female |
| No Vehicle | 5 (2.6%) | 0 (0.0%) |
| 1 Vehicle | 19 (9.8%) | 138 (41.7%) |
| 2 Vehicles | 81 (42.0%) | 76 (23.0%) |
| 3 Vehicles | 53 (27.5%) | 79 (23.9%) |
| 4 Vehicles | 35 (18.1%) | 38 (11.5%) |
| 5 or more Vehicles | 0 (0.0%) | 0 (0.0%) |
| Total | 193 (100.0%) | 331 (100.0%) |
Commute Time in Romney
The most frequently occuring commute durations in Romney are less than 5 minutes (161 commuters, 30.7%), 5 to 9 minutes (106 commuters, 20.2%), and 45 to 59 minutes (103 commuters, 19.7%).
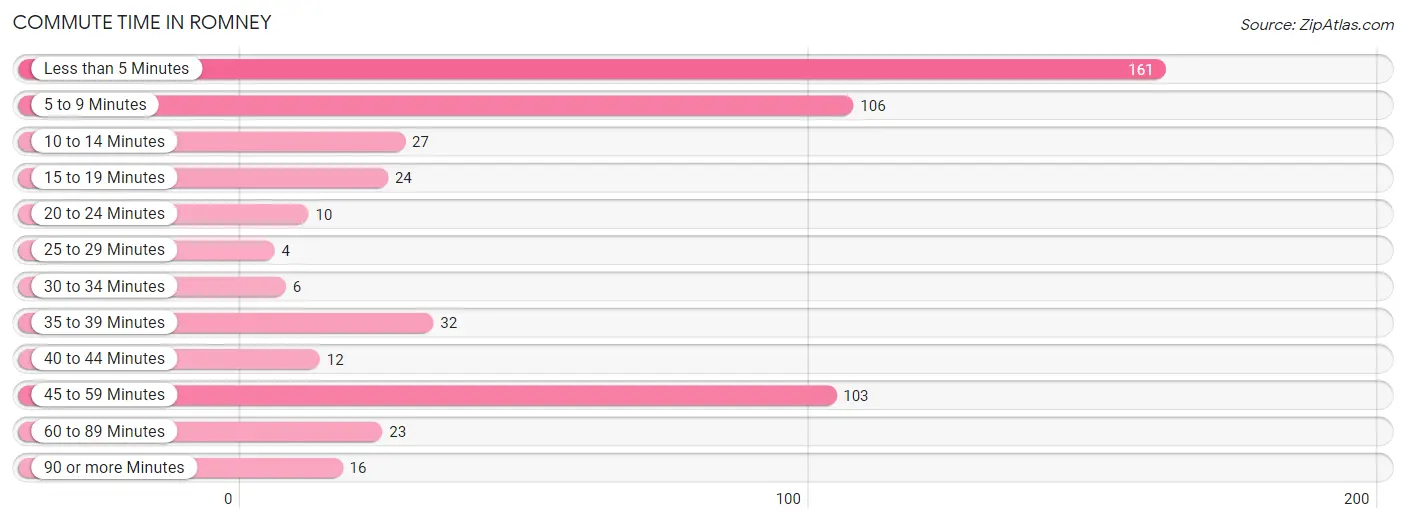
| Commute Time | # Commuters | % Commuters |
| Less than 5 Minutes | 161 | 30.7% |
| 5 to 9 Minutes | 106 | 20.2% |
| 10 to 14 Minutes | 27 | 5.1% |
| 15 to 19 Minutes | 24 | 4.6% |
| 20 to 24 Minutes | 10 | 1.9% |
| 25 to 29 Minutes | 4 | 0.8% |
| 30 to 34 Minutes | 6 | 1.1% |
| 35 to 39 Minutes | 32 | 6.1% |
| 40 to 44 Minutes | 12 | 2.3% |
| 45 to 59 Minutes | 103 | 19.7% |
| 60 to 89 Minutes | 23 | 4.4% |
| 90 or more Minutes | 16 | 3.0% |
Commute Time by Sex in Romney
The most common commute times in Romney are less than 5 minutes (81 commuters, 42.0%) for males and 5 to 9 minutes (93 commuters, 28.1%) for females.
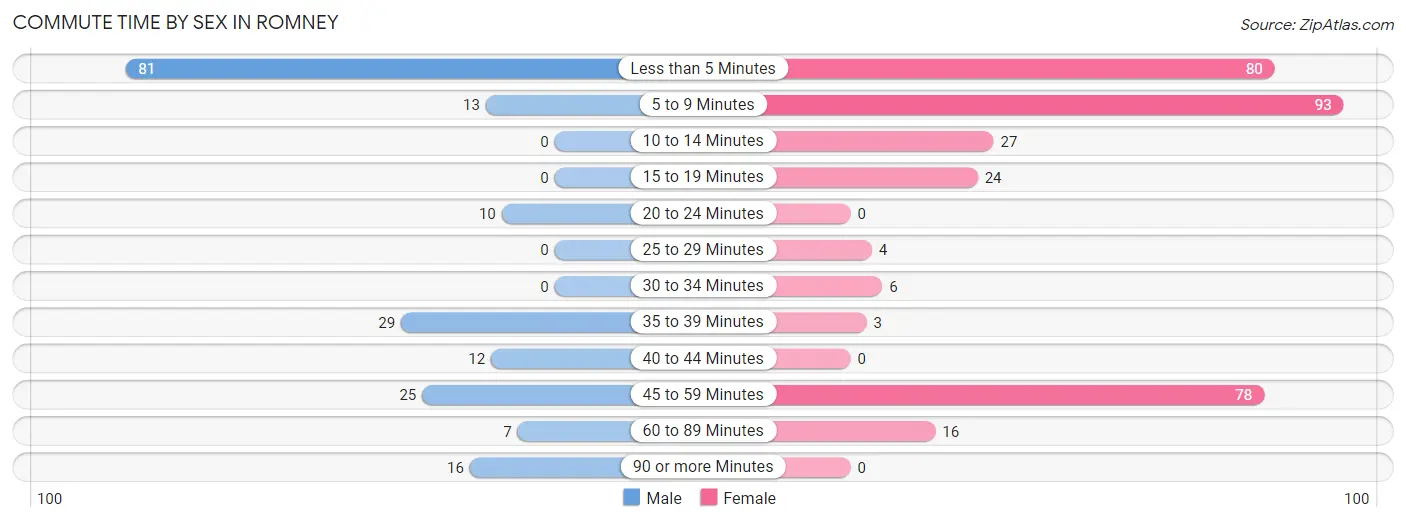
| Commute Time | Male | Female |
| Less than 5 Minutes | 81 (42.0%) | 80 (24.2%) |
| 5 to 9 Minutes | 13 (6.7%) | 93 (28.1%) |
| 10 to 14 Minutes | 0 (0.0%) | 27 (8.2%) |
| 15 to 19 Minutes | 0 (0.0%) | 24 (7.2%) |
| 20 to 24 Minutes | 10 (5.2%) | 0 (0.0%) |
| 25 to 29 Minutes | 0 (0.0%) | 4 (1.2%) |
| 30 to 34 Minutes | 0 (0.0%) | 6 (1.8%) |
| 35 to 39 Minutes | 29 (15.0%) | 3 (0.9%) |
| 40 to 44 Minutes | 12 (6.2%) | 0 (0.0%) |
| 45 to 59 Minutes | 25 (13.0%) | 78 (23.6%) |
| 60 to 89 Minutes | 7 (3.6%) | 16 (4.8%) |
| 90 or more Minutes | 16 (8.3%) | 0 (0.0%) |
Time of Departure to Work by Sex in Romney
The most frequent times of departure to work in Romney are 6:30 AM to 6:59 AM (44, 22.8%) for males and 8:00 AM to 8:29 AM (61, 18.4%) for females.
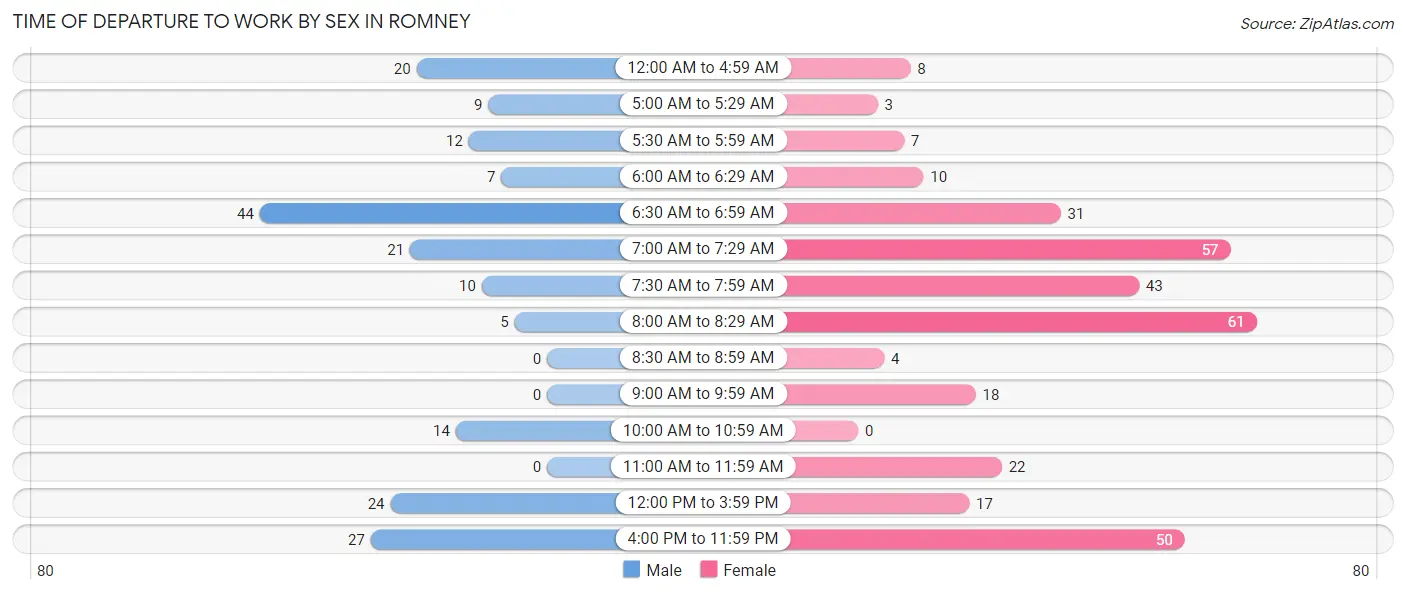
| Time of Departure | Male | Female |
| 12:00 AM to 4:59 AM | 20 (10.4%) | 8 (2.4%) |
| 5:00 AM to 5:29 AM | 9 (4.7%) | 3 (0.9%) |
| 5:30 AM to 5:59 AM | 12 (6.2%) | 7 (2.1%) |
| 6:00 AM to 6:29 AM | 7 (3.6%) | 10 (3.0%) |
| 6:30 AM to 6:59 AM | 44 (22.8%) | 31 (9.4%) |
| 7:00 AM to 7:29 AM | 21 (10.9%) | 57 (17.2%) |
| 7:30 AM to 7:59 AM | 10 (5.2%) | 43 (13.0%) |
| 8:00 AM to 8:29 AM | 5 (2.6%) | 61 (18.4%) |
| 8:30 AM to 8:59 AM | 0 (0.0%) | 4 (1.2%) |
| 9:00 AM to 9:59 AM | 0 (0.0%) | 18 (5.4%) |
| 10:00 AM to 10:59 AM | 14 (7.2%) | 0 (0.0%) |
| 11:00 AM to 11:59 AM | 0 (0.0%) | 22 (6.7%) |
| 12:00 PM to 3:59 PM | 24 (12.4%) | 17 (5.1%) |
| 4:00 PM to 11:59 PM | 27 (14.0%) | 50 (15.1%) |
| Total | 193 (100.0%) | 331 (100.0%) |
Housing Occupancy in Romney
Occupancy by Ownership in Romney
Of the total 738 dwellings in Romney, owner-occupied units account for 395 (53.5%), while renter-occupied units make up 343 (46.5%).
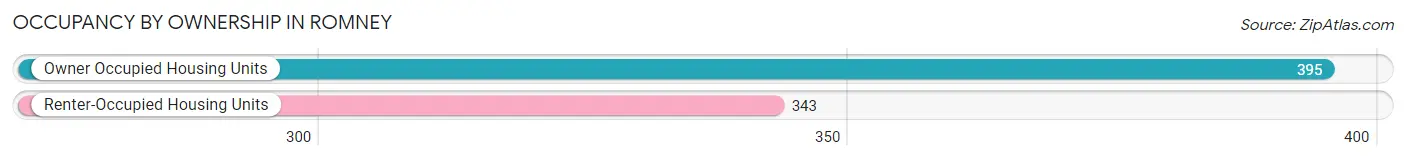
| Occupancy | # Housing Units | % Housing Units |
| Owner Occupied Housing Units | 395 | 53.5% |
| Renter-Occupied Housing Units | 343 | 46.5% |
| Total Occupied Housing Units | 738 | 100.0% |
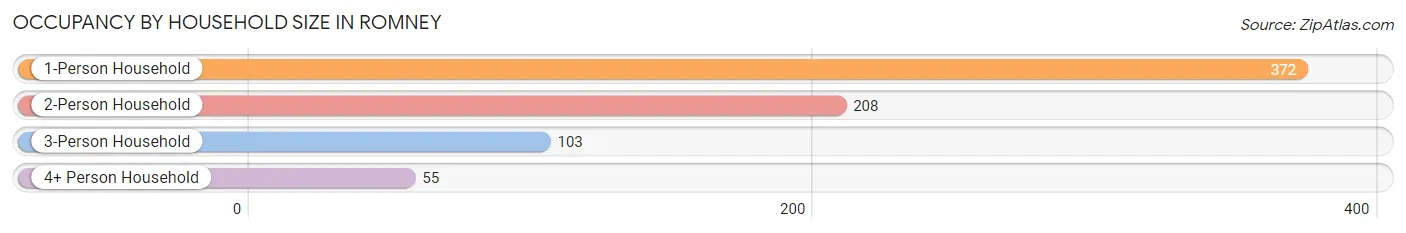
Occupancy by Household Size in Romney
| Household Size | # Housing Units | % Housing Units |
| 1-Person Household | 372 | 50.4% |
| 2-Person Household | 208 | 28.2% |
| 3-Person Household | 103 | 14.0% |
| 4+ Person Household | 55 | 7.4% |
| Total Housing Units | 738 | 100.0% |
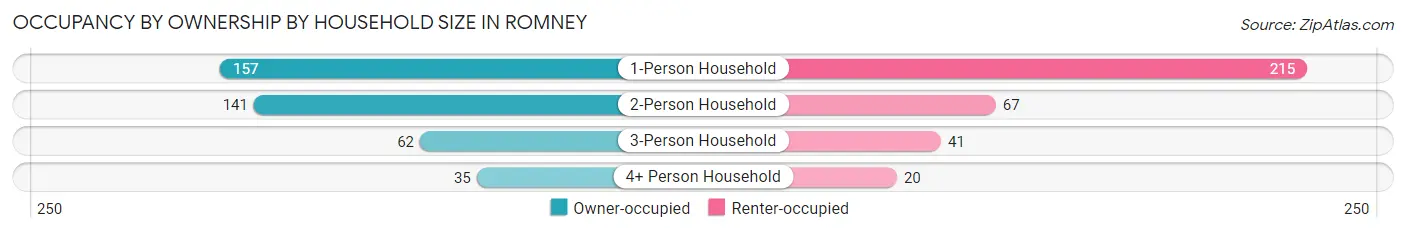
Occupancy by Ownership by Household Size in Romney
| Household Size | Owner-occupied | Renter-occupied |
| 1-Person Household | 157 (42.2%) | 215 (57.8%) |
| 2-Person Household | 141 (67.8%) | 67 (32.2%) |
| 3-Person Household | 62 (60.2%) | 41 (39.8%) |
| 4+ Person Household | 35 (63.6%) | 20 (36.4%) |
| Total Housing Units | 395 (53.5%) | 343 (46.5%) |
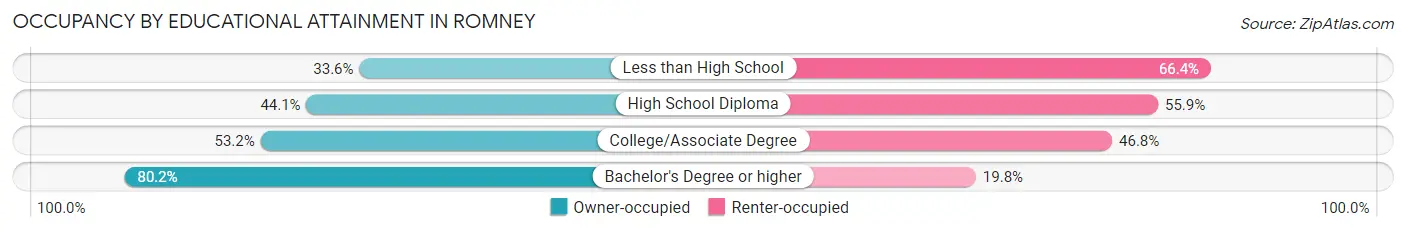
Occupancy by Educational Attainment in Romney
| Household Size | Owner-occupied | Renter-occupied |
| Less than High School | 38 (33.6%) | 75 (66.4%) |
| High School Diploma | 120 (44.1%) | 152 (55.9%) |
| College/Associate Degree | 91 (53.2%) | 80 (46.8%) |
| Bachelor's Degree or higher | 146 (80.2%) | 36 (19.8%) |
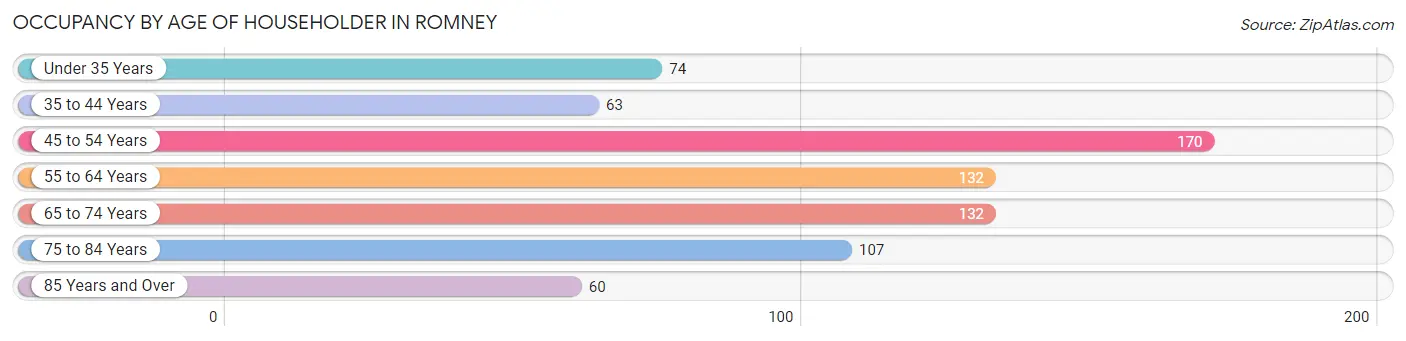
Occupancy by Age of Householder in Romney
| Age Bracket | # Households | % Households |
| Under 35 Years | 74 | 10.0% |
| 35 to 44 Years | 63 | 8.5% |
| 45 to 54 Years | 170 | 23.0% |
| 55 to 64 Years | 132 | 17.9% |
| 65 to 74 Years | 132 | 17.9% |
| 75 to 84 Years | 107 | 14.5% |
| 85 Years and Over | 60 | 8.1% |
| Total | 738 | 100.0% |
Housing Finances in Romney
Median Income by Occupancy in Romney
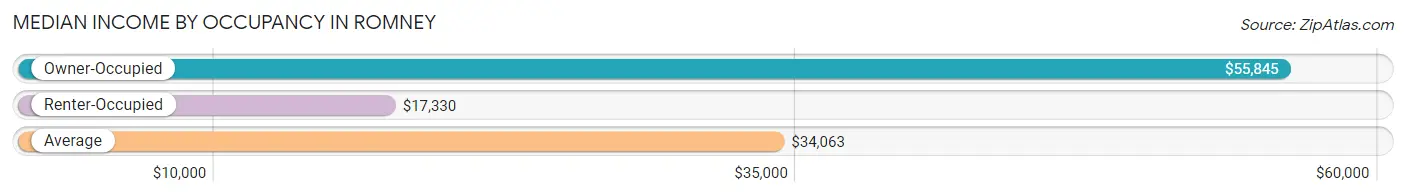
| Occupancy Type | # Households | Median Income |
| Owner-Occupied | 395 (53.5%) | $55,845 |
| Renter-Occupied | 343 (46.5%) | $17,330 |
| Average | 738 (100.0%) | $34,063 |
Occupancy by Householder Income Bracket in Romney
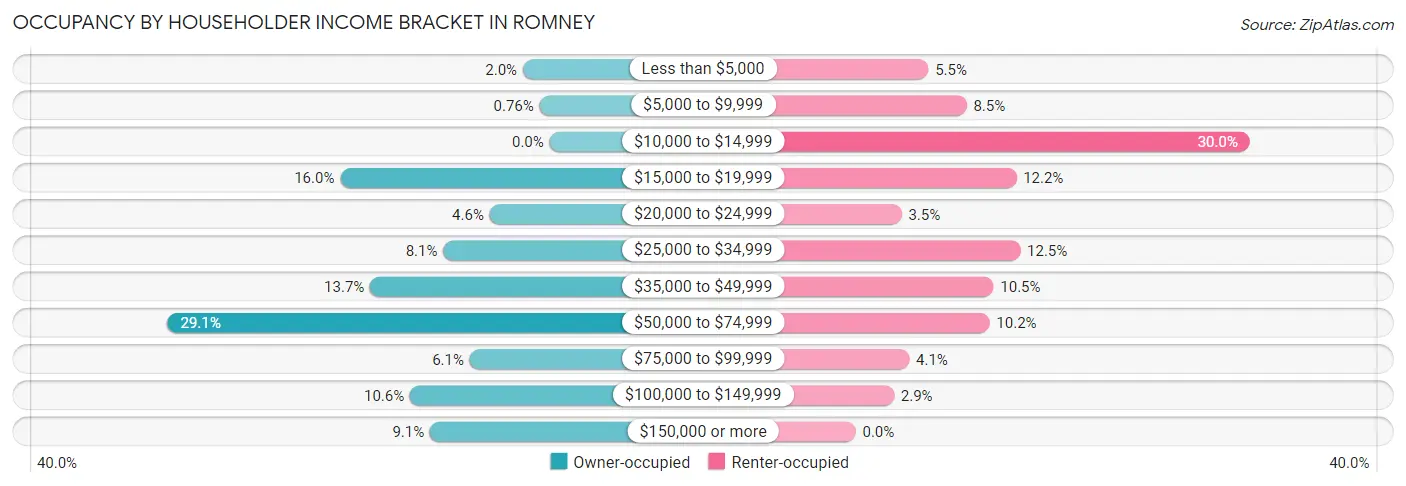
| Income Bracket | Owner-occupied | Renter-occupied |
| Less than $5,000 | 8 (2.0%) | 19 (5.5%) |
| $5,000 to $9,999 | 3 (0.8%) | 29 (8.5%) |
| $10,000 to $14,999 | 0 (0.0%) | 103 (30.0%) |
| $15,000 to $19,999 | 63 (16.0%) | 42 (12.2%) |
| $20,000 to $24,999 | 18 (4.6%) | 12 (3.5%) |
| $25,000 to $34,999 | 32 (8.1%) | 43 (12.5%) |
| $35,000 to $49,999 | 54 (13.7%) | 36 (10.5%) |
| $50,000 to $74,999 | 115 (29.1%) | 35 (10.2%) |
| $75,000 to $99,999 | 24 (6.1%) | 14 (4.1%) |
| $100,000 to $149,999 | 42 (10.6%) | 10 (2.9%) |
| $150,000 or more | 36 (9.1%) | 0 (0.0%) |
| Total | 395 (100.0%) | 343 (100.0%) |
Monthly Housing Cost Tiers in Romney
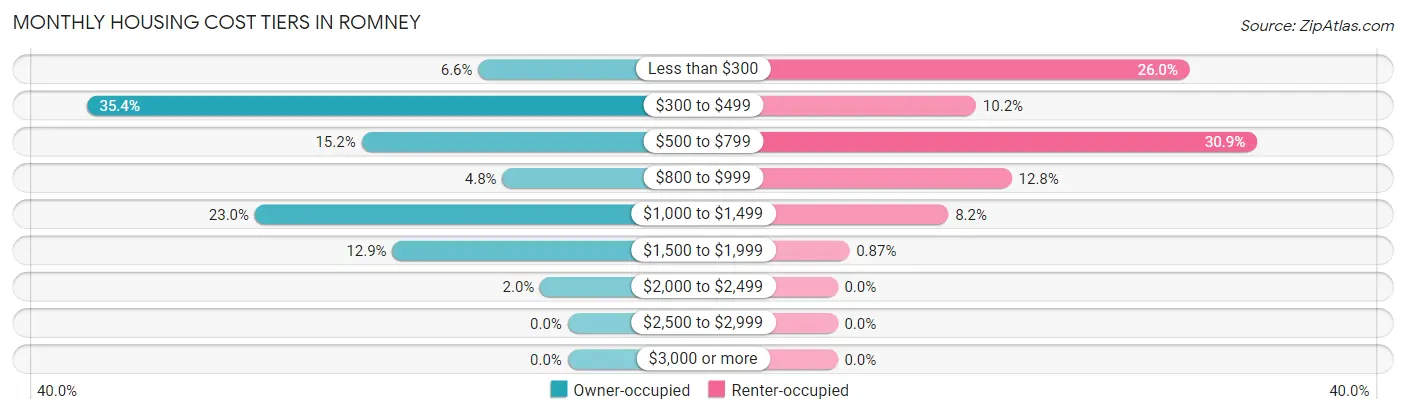
| Monthly Cost | Owner-occupied | Renter-occupied |
| Less than $300 | 26 (6.6%) | 89 (26.0%) |
| $300 to $499 | 140 (35.4%) | 35 (10.2%) |
| $500 to $799 | 60 (15.2%) | 106 (30.9%) |
| $800 to $999 | 19 (4.8%) | 44 (12.8%) |
| $1,000 to $1,499 | 91 (23.0%) | 28 (8.2%) |
| $1,500 to $1,999 | 51 (12.9%) | 3 (0.9%) |
| $2,000 to $2,499 | 8 (2.0%) | 0 (0.0%) |
| $2,500 to $2,999 | 0 (0.0%) | 0 (0.0%) |
| $3,000 or more | 0 (0.0%) | 0 (0.0%) |
| Total | 395 (100.0%) | 343 (100.0%) |
Physical Housing Characteristics in Romney
Housing Structures in Romney
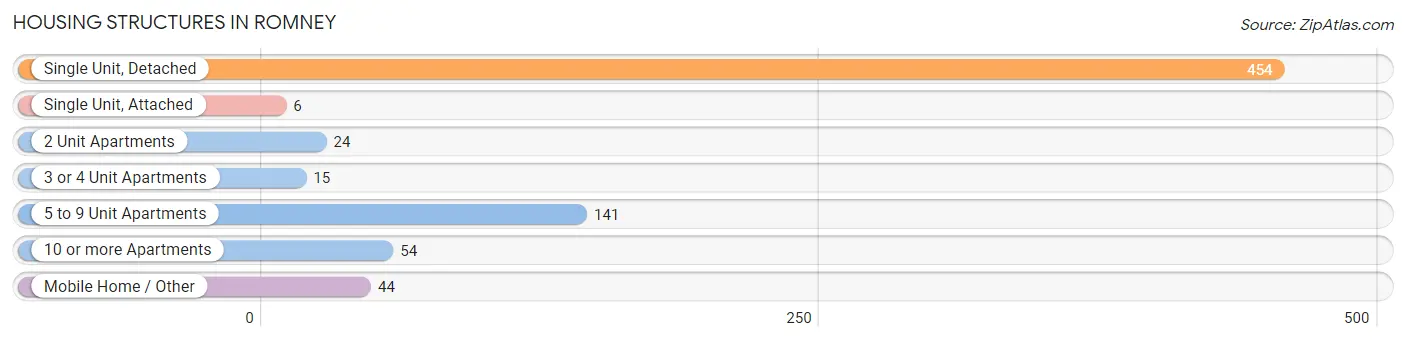
| Structure Type | # Housing Units | % Housing Units |
| Single Unit, Detached | 454 | 61.5% |
| Single Unit, Attached | 6 | 0.8% |
| 2 Unit Apartments | 24 | 3.3% |
| 3 or 4 Unit Apartments | 15 | 2.0% |
| 5 to 9 Unit Apartments | 141 | 19.1% |
| 10 or more Apartments | 54 | 7.3% |
| Mobile Home / Other | 44 | 6.0% |
| Total | 738 | 100.0% |
Housing Structures by Occupancy in Romney
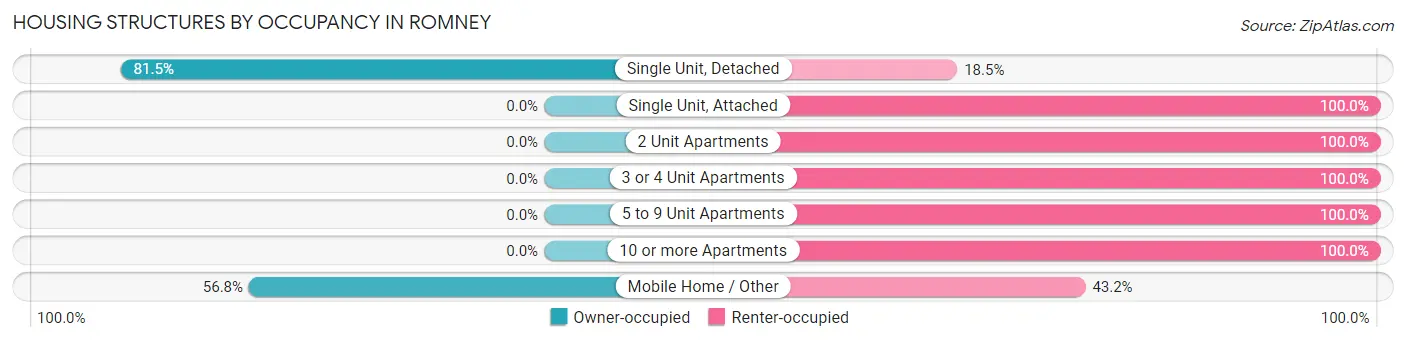
| Structure Type | Owner-occupied | Renter-occupied |
| Single Unit, Detached | 370 (81.5%) | 84 (18.5%) |
| Single Unit, Attached | 0 (0.0%) | 6 (100.0%) |
| 2 Unit Apartments | 0 (0.0%) | 24 (100.0%) |
| 3 or 4 Unit Apartments | 0 (0.0%) | 15 (100.0%) |
| 5 to 9 Unit Apartments | 0 (0.0%) | 141 (100.0%) |
| 10 or more Apartments | 0 (0.0%) | 54 (100.0%) |
| Mobile Home / Other | 25 (56.8%) | 19 (43.2%) |
| Total | 395 (53.5%) | 343 (46.5%) |
Housing Structures by Number of Rooms in Romney
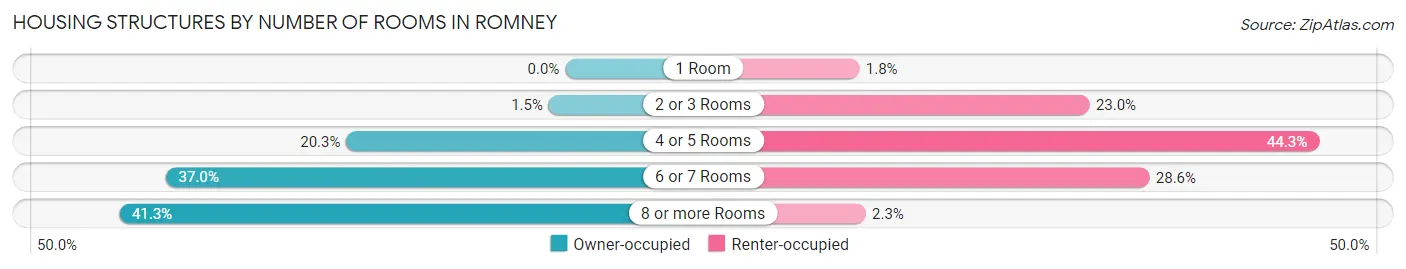
| Number of Rooms | Owner-occupied | Renter-occupied |
| 1 Room | 0 (0.0%) | 6 (1.8%) |
| 2 or 3 Rooms | 6 (1.5%) | 79 (23.0%) |
| 4 or 5 Rooms | 80 (20.3%) | 152 (44.3%) |
| 6 or 7 Rooms | 146 (37.0%) | 98 (28.6%) |
| 8 or more Rooms | 163 (41.3%) | 8 (2.3%) |
| Total | 395 (100.0%) | 343 (100.0%) |
Housing Structure by Heating Type in Romney
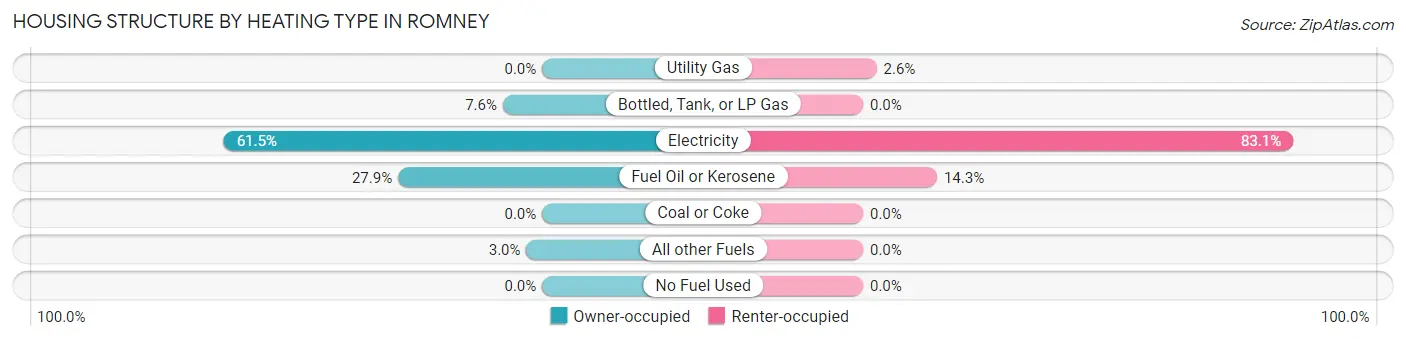
| Heating Type | Owner-occupied | Renter-occupied |
| Utility Gas | 0 (0.0%) | 9 (2.6%) |
| Bottled, Tank, or LP Gas | 30 (7.6%) | 0 (0.0%) |
| Electricity | 243 (61.5%) | 285 (83.1%) |
| Fuel Oil or Kerosene | 110 (27.9%) | 49 (14.3%) |
| Coal or Coke | 0 (0.0%) | 0 (0.0%) |
| All other Fuels | 12 (3.0%) | 0 (0.0%) |
| No Fuel Used | 0 (0.0%) | 0 (0.0%) |
| Total | 395 (100.0%) | 343 (100.0%) |
Household Vehicle Usage in Romney
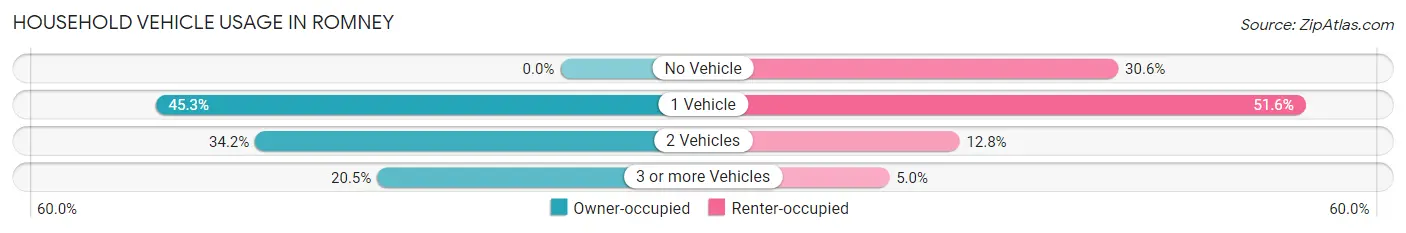
| Vehicles per Household | Owner-occupied | Renter-occupied |
| No Vehicle | 0 (0.0%) | 105 (30.6%) |
| 1 Vehicle | 179 (45.3%) | 177 (51.6%) |
| 2 Vehicles | 135 (34.2%) | 44 (12.8%) |
| 3 or more Vehicles | 81 (20.5%) | 17 (5.0%) |
| Total | 395 (100.0%) | 343 (100.0%) |
Real Estate & Mortgages in Romney
Real Estate and Mortgage Overview in Romney
| Characteristic | Without Mortgage | With Mortgage |
| Housing Units | 196 | 199 |
| Median Property Value | $118,900 | $158,200 |
| Median Household Income | $32,143 | $25 |
| Monthly Housing Costs | $344 | $0 |
| Real Estate Taxes | $560 | $0 |
Property Value by Mortgage Status in Romney
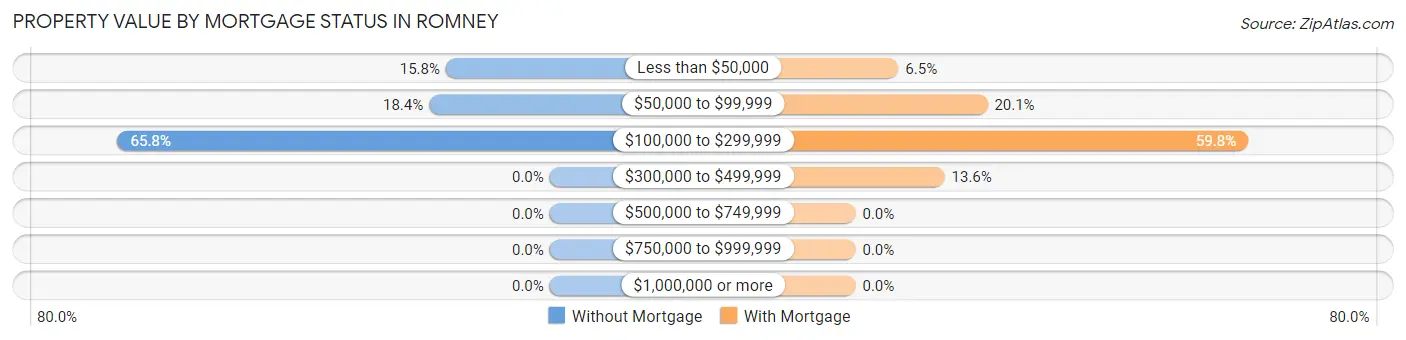
| Property Value | Without Mortgage | With Mortgage |
| Less than $50,000 | 31 (15.8%) | 13 (6.5%) |
| $50,000 to $99,999 | 36 (18.4%) | 40 (20.1%) |
| $100,000 to $299,999 | 129 (65.8%) | 119 (59.8%) |
| $300,000 to $499,999 | 0 (0.0%) | 27 (13.6%) |
| $500,000 to $749,999 | 0 (0.0%) | 0 (0.0%) |
| $750,000 to $999,999 | 0 (0.0%) | 0 (0.0%) |
| $1,000,000 or more | 0 (0.0%) | 0 (0.0%) |
| Total | 196 (100.0%) | 199 (100.0%) |
Household Income by Mortgage Status in Romney
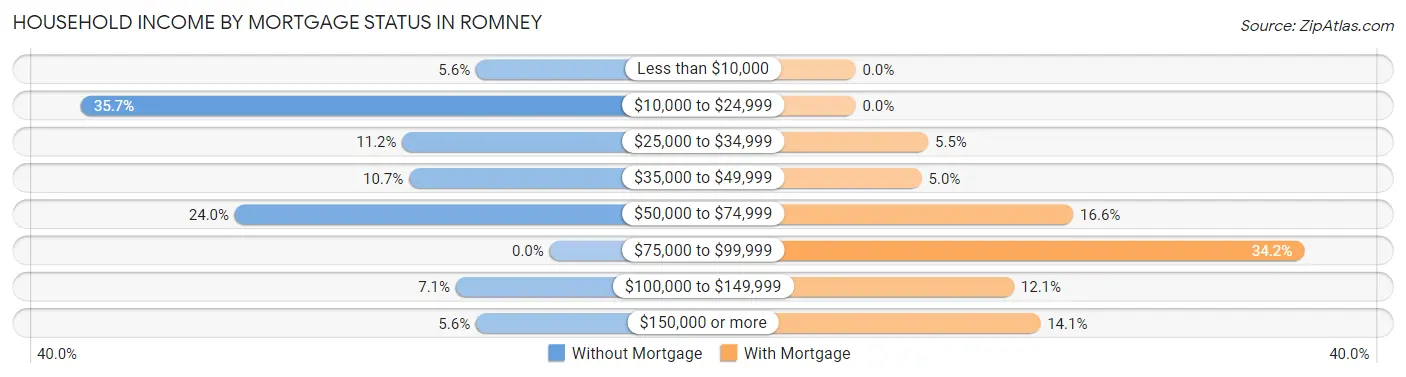
| Household Income | Without Mortgage | With Mortgage |
| Less than $10,000 | 11 (5.6%) | 0 (0.0%) |
| $10,000 to $24,999 | 70 (35.7%) | 0 (0.0%) |
| $25,000 to $34,999 | 22 (11.2%) | 11 (5.5%) |
| $35,000 to $49,999 | 21 (10.7%) | 10 (5.0%) |
| $50,000 to $74,999 | 47 (24.0%) | 33 (16.6%) |
| $75,000 to $99,999 | 0 (0.0%) | 68 (34.2%) |
| $100,000 to $149,999 | 14 (7.1%) | 24 (12.1%) |
| $150,000 or more | 11 (5.6%) | 28 (14.1%) |
| Total | 196 (100.0%) | 199 (100.0%) |
Property Value to Household Income Ratio in Romney
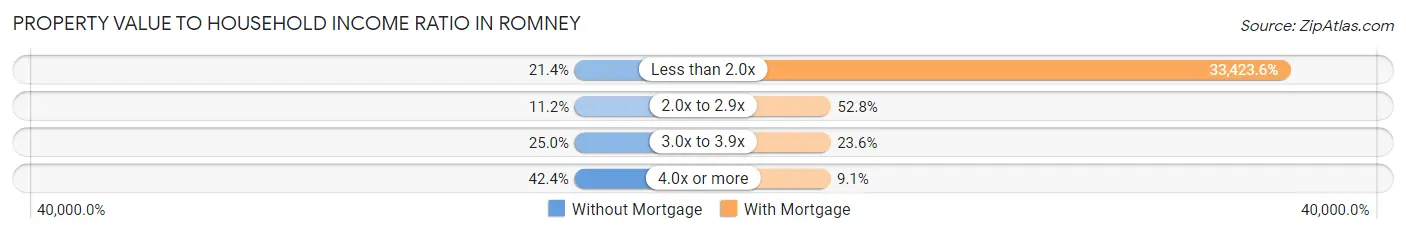
| Value-to-Income Ratio | Without Mortgage | With Mortgage |
| Less than 2.0x | 42 (21.4%) | 66,513 (33,423.6%) |
| 2.0x to 2.9x | 22 (11.2%) | 105 (52.8%) |
| 3.0x to 3.9x | 49 (25.0%) | 47 (23.6%) |
| 4.0x or more | 83 (42.3%) | 18 (9.0%) |
| Total | 196 (100.0%) | 199 (100.0%) |
Real Estate Taxes by Mortgage Status in Romney
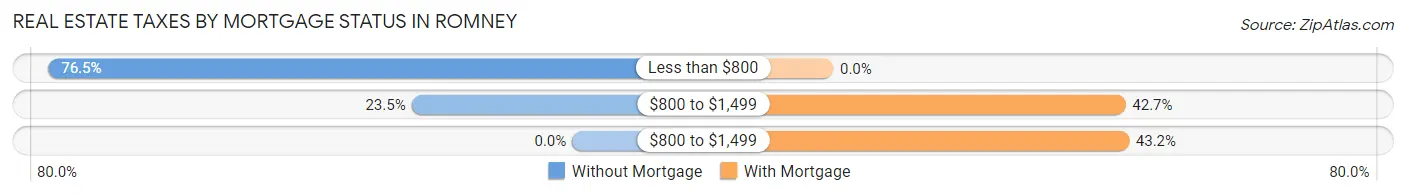
| Property Taxes | Without Mortgage | With Mortgage |
| Less than $800 | 150 (76.5%) | 0 (0.0%) |
| $800 to $1,499 | 46 (23.5%) | 85 (42.7%) |
| $800 to $1,499 | 0 (0.0%) | 86 (43.2%) |
| Total | 196 (100.0%) | 199 (100.0%) |
Health & Disability in Romney
Health Insurance Coverage by Age in Romney
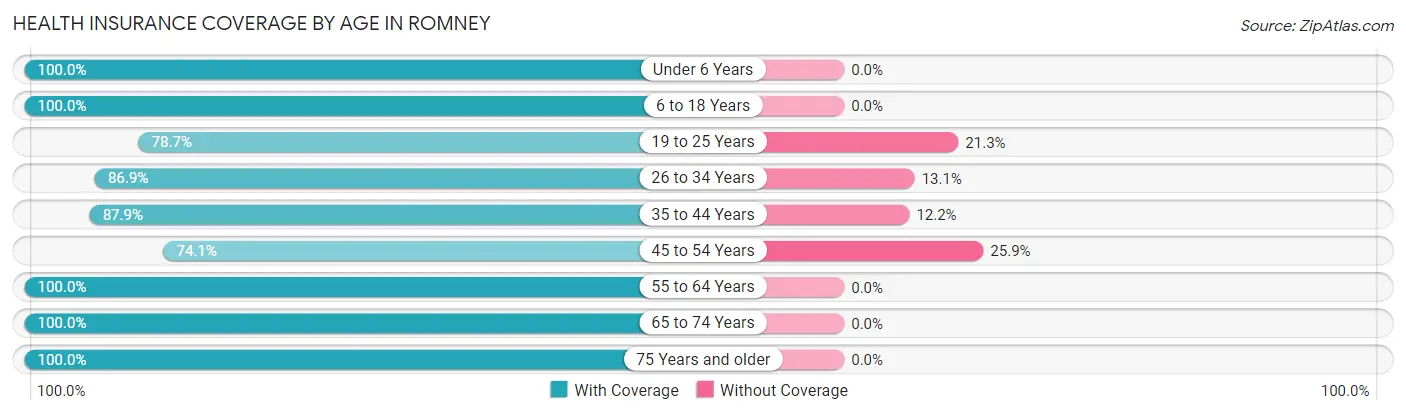
| Age Bracket | With Coverage | Without Coverage |
| Under 6 Years | 75 (100.0%) | 0 (0.0%) |
| 6 to 18 Years | 442 (100.0%) | 0 (0.0%) |
| 19 to 25 Years | 37 (78.7%) | 10 (21.3%) |
| 26 to 34 Years | 86 (86.9%) | 13 (13.1%) |
| 35 to 44 Years | 159 (87.8%) | 22 (12.1%) |
| 45 to 54 Years | 257 (74.1%) | 90 (25.9%) |
| 55 to 64 Years | 282 (100.0%) | 0 (0.0%) |
| 65 to 74 Years | 205 (100.0%) | 0 (0.0%) |
| 75 Years and older | 262 (100.0%) | 0 (0.0%) |
| Total | 1,805 (93.0%) | 135 (7.0%) |
Health Insurance Coverage by Citizenship Status in Romney
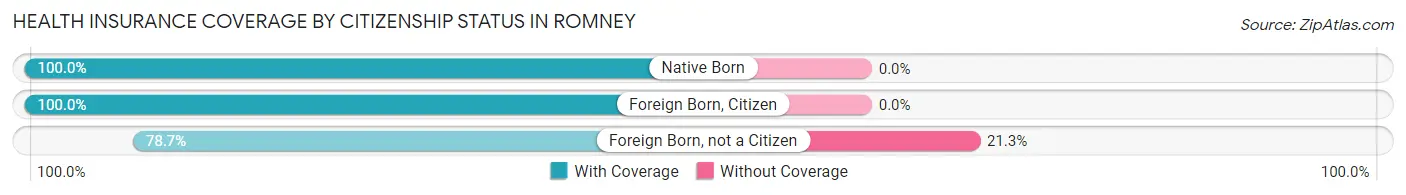
| Citizenship Status | With Coverage | Without Coverage |
| Native Born | 75 (100.0%) | 0 (0.0%) |
| Foreign Born, Citizen | 442 (100.0%) | 0 (0.0%) |
| Foreign Born, not a Citizen | 37 (78.7%) | 10 (21.3%) |
Health Insurance Coverage by Household Income in Romney
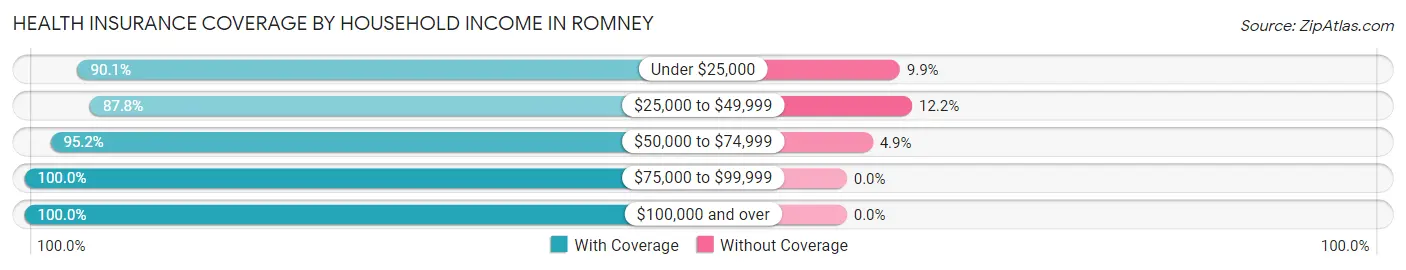
| Household Income | With Coverage | Without Coverage |
| Under $25,000 | 625 (90.1%) | 69 (9.9%) |
| $25,000 to $49,999 | 330 (87.8%) | 46 (12.2%) |
| $50,000 to $74,999 | 392 (95.2%) | 20 (4.9%) |
| $75,000 to $99,999 | 214 (100.0%) | 0 (0.0%) |
| $100,000 and over | 244 (100.0%) | 0 (0.0%) |
Public vs Private Health Insurance Coverage by Age in Romney
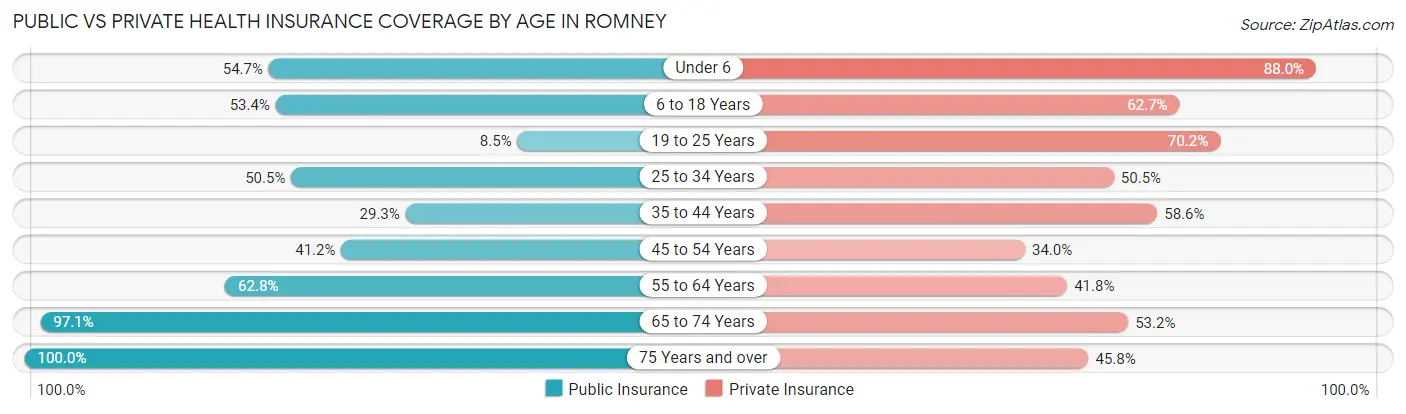
| Age Bracket | Public Insurance | Private Insurance |
| Under 6 | 41 (54.7%) | 66 (88.0%) |
| 6 to 18 Years | 236 (53.4%) | 277 (62.7%) |
| 19 to 25 Years | 4 (8.5%) | 33 (70.2%) |
| 25 to 34 Years | 50 (50.5%) | 50 (50.5%) |
| 35 to 44 Years | 53 (29.3%) | 106 (58.6%) |
| 45 to 54 Years | 143 (41.2%) | 118 (34.0%) |
| 55 to 64 Years | 177 (62.8%) | 118 (41.8%) |
| 65 to 74 Years | 199 (97.1%) | 109 (53.2%) |
| 75 Years and over | 262 (100.0%) | 120 (45.8%) |
| Total | 1,165 (60.1%) | 997 (51.4%) |
Disability Status by Sex by Age in Romney
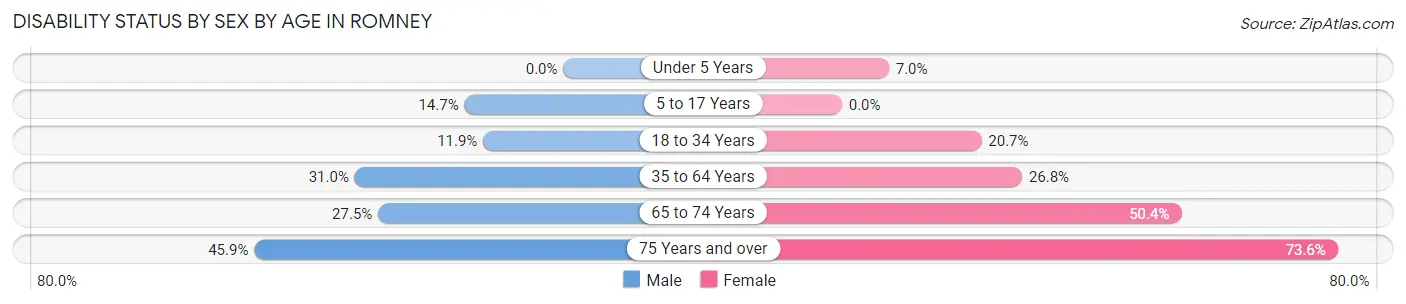
| Age Bracket | Male | Female |
| Under 5 Years | 0 (0.0%) | 3 (7.0%) |
| 5 to 17 Years | 43 (14.7%) | 0 (0.0%) |
| 18 to 34 Years | 5 (11.9%) | 23 (20.7%) |
| 35 to 64 Years | 127 (31.0%) | 107 (26.8%) |
| 65 to 74 Years | 22 (27.5%) | 63 (50.4%) |
| 75 Years and over | 28 (45.9%) | 148 (73.6%) |
Disability Class by Sex by Age in Romney
Disability Class: Hearing Difficulty
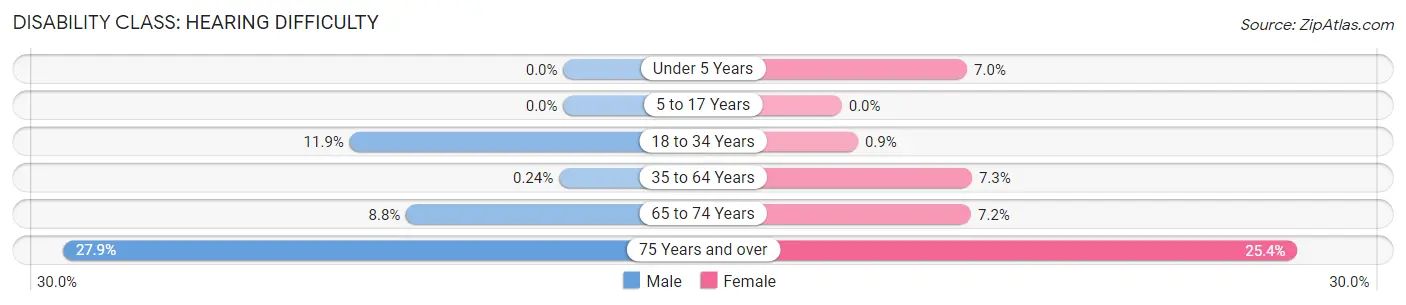
| Age Bracket | Male | Female |
| Under 5 Years | 0 (0.0%) | 3 (7.0%) |
| 5 to 17 Years | 0 (0.0%) | 0 (0.0%) |
| 18 to 34 Years | 5 (11.9%) | 1 (0.9%) |
| 35 to 64 Years | 1 (0.2%) | 29 (7.2%) |
| 65 to 74 Years | 7 (8.7%) | 9 (7.2%) |
| 75 Years and over | 17 (27.9%) | 51 (25.4%) |
Disability Class: Vision Difficulty
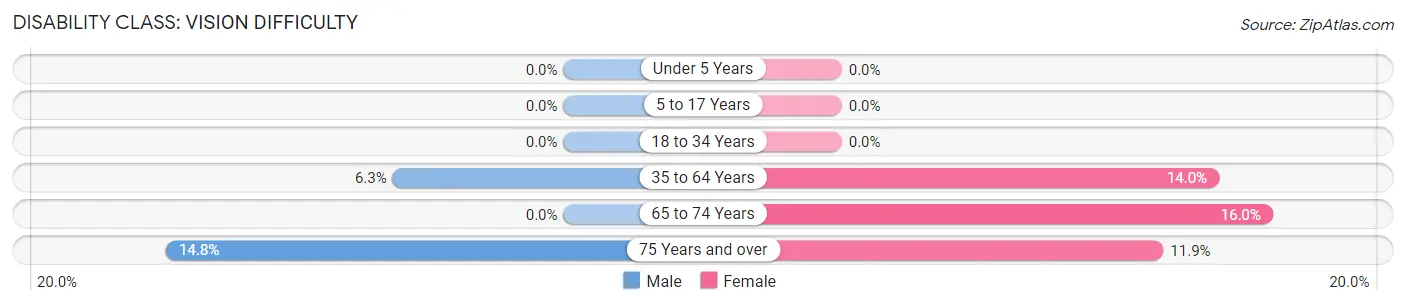
| Age Bracket | Male | Female |
| Under 5 Years | 0 (0.0%) | 0 (0.0%) |
| 5 to 17 Years | 0 (0.0%) | 0 (0.0%) |
| 18 to 34 Years | 0 (0.0%) | 0 (0.0%) |
| 35 to 64 Years | 26 (6.3%) | 56 (14.0%) |
| 65 to 74 Years | 0 (0.0%) | 20 (16.0%) |
| 75 Years and over | 9 (14.7%) | 24 (11.9%) |
Disability Class: Cognitive Difficulty
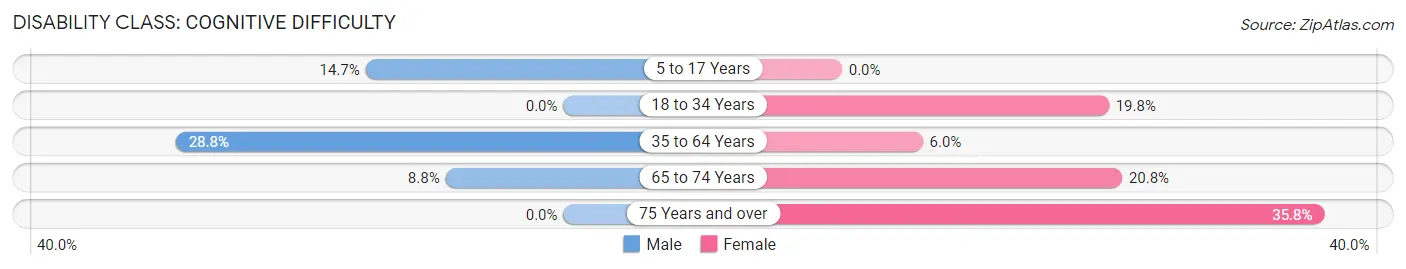
| Age Bracket | Male | Female |
| 5 to 17 Years | 43 (14.7%) | 0 (0.0%) |
| 18 to 34 Years | 0 (0.0%) | 22 (19.8%) |
| 35 to 64 Years | 118 (28.8%) | 24 (6.0%) |
| 65 to 74 Years | 7 (8.7%) | 26 (20.8%) |
| 75 Years and over | 0 (0.0%) | 72 (35.8%) |
Disability Class: Ambulatory Difficulty
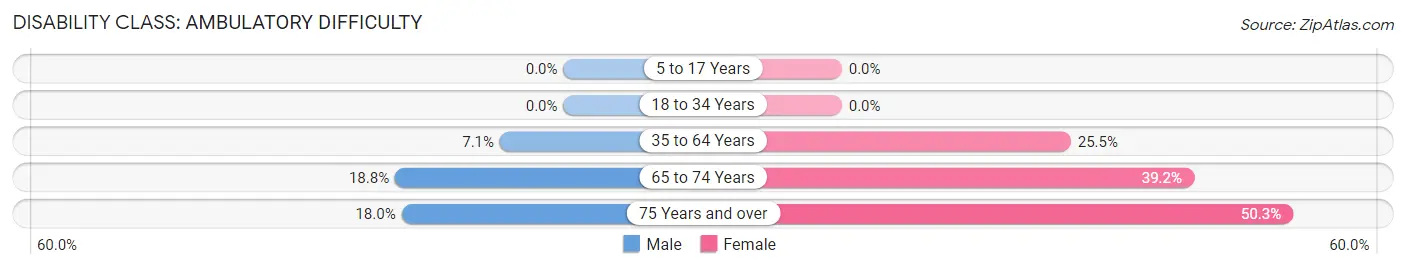
| Age Bracket | Male | Female |
| 5 to 17 Years | 0 (0.0%) | 0 (0.0%) |
| 18 to 34 Years | 0 (0.0%) | 0 (0.0%) |
| 35 to 64 Years | 29 (7.1%) | 102 (25.5%) |
| 65 to 74 Years | 15 (18.8%) | 49 (39.2%) |
| 75 Years and over | 11 (18.0%) | 101 (50.2%) |
Disability Class: Self-Care Difficulty
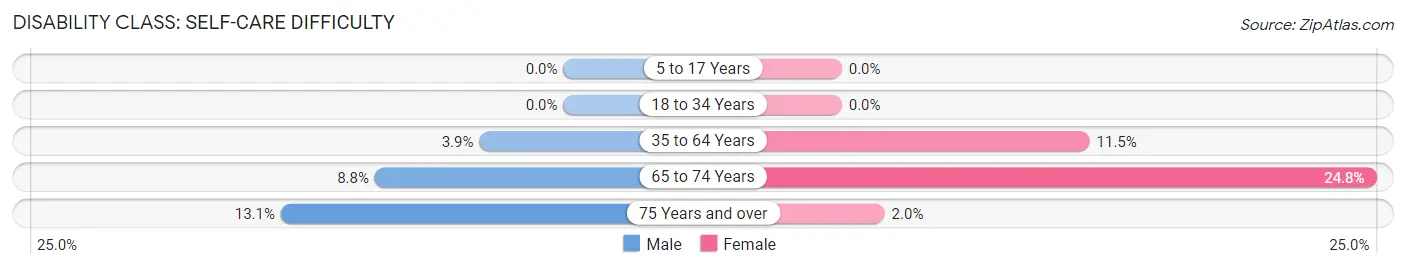
| Age Bracket | Male | Female |
| 5 to 17 Years | 0 (0.0%) | 0 (0.0%) |
| 18 to 34 Years | 0 (0.0%) | 0 (0.0%) |
| 35 to 64 Years | 16 (3.9%) | 46 (11.5%) |
| 65 to 74 Years | 7 (8.7%) | 31 (24.8%) |
| 75 Years and over | 8 (13.1%) | 4 (2.0%) |
Technology Access in Romney
Computing Device Access in Romney
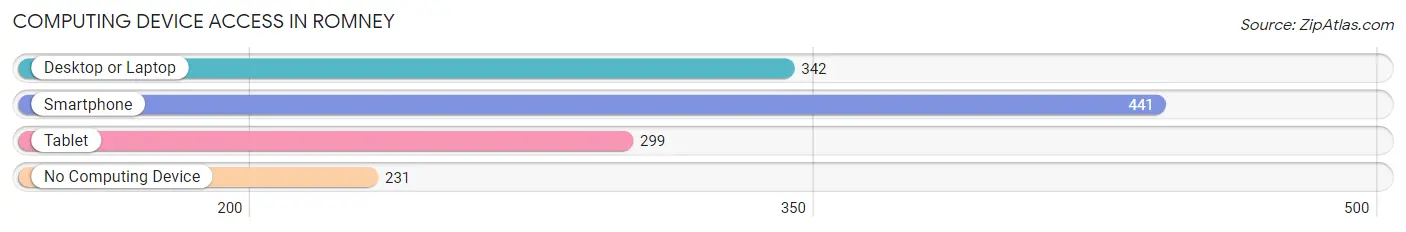
| Device Type | # Households | % Households |
| Desktop or Laptop | 342 | 46.3% |
| Smartphone | 441 | 59.8% |
| Tablet | 299 | 40.5% |
| No Computing Device | 231 | 31.3% |
| Total | 738 | 100.0% |
Internet Access in Romney
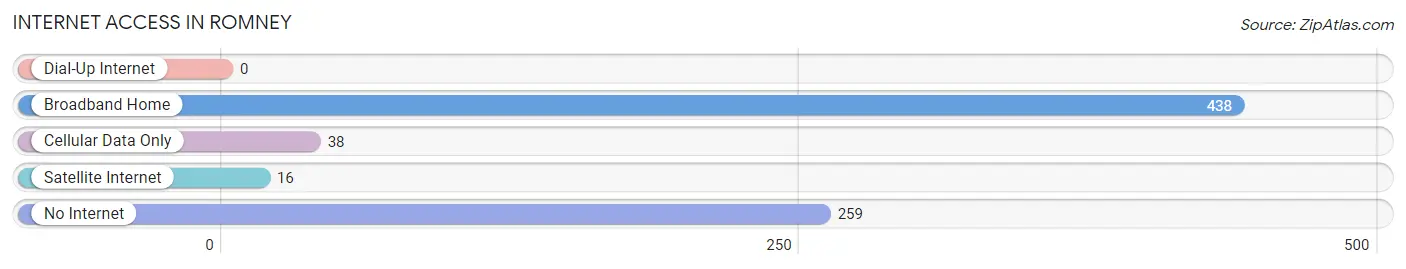
| Internet Type | # Households | % Households |
| Dial-Up Internet | 0 | 0.0% |
| Broadband Home | 438 | 59.4% |
| Cellular Data Only | 38 | 5.1% |
| Satellite Internet | 16 | 2.2% |
| No Internet | 259 | 35.1% |
| Total | 738 | 100.0% |
Romney Summary
Romney, West Virginia is a small town located in the Eastern Panhandle of the state. It is the county seat of Hampshire County and is located along the South Branch of the Potomac River. The town was founded in 1762 and was named after the English town of Romney, Kent. It is the oldest town in West Virginia and is the only incorporated town in the state.
Geography
Romney is located in the Eastern Panhandle of West Virginia, in the Appalachian Mountains. It is situated in the South Branch Valley of the Potomac River, at the confluence of the South Branch and the Cacapon River. The town is located at the intersection of US Route 50 and West Virginia Route 28. The town is surrounded by rolling hills and mountains, with the Allegheny Front to the west and the Blue Ridge Mountains to the east.
Economy
The economy of Romney is largely based on agriculture and tourism. The town is home to several small businesses, including a grocery store, a hardware store, a pharmacy, and a variety of restaurants. The town is also home to several manufacturing companies, including a paper mill, a furniture factory, and a plastics factory. The town is also home to a number of small farms, which produce a variety of crops, including corn, wheat, and hay.
Demographics
As of the 2010 census, the population of Romney was 1,848. The racial makeup of the town was 95.3% White, 1.2% African American, 0.3% Native American, 0.3% Asian, 0.1% Pacific Islander, 0.7% from other races, and 2.3% from two or more races. Hispanic or Latino of any race were 1.7% of the population.
The median income for a household in the town was $30,938, and the median income for a family was $37,917. The per capita income for the town was $17,845. About 11.2% of families and 14.2% of the population were below the poverty line, including 18.2% of those under age 18 and 11.2% of those age 65 or over.
History
Romney was founded in 1762 by Thomas Fairfax, 6th Lord Fairfax of Cameron. The town was named after the English town of Romney, Kent. It was the first town in West Virginia to be incorporated, in 1832. During the Civil War, Romney was the site of several skirmishes between Union and Confederate forces. After the war, the town experienced a period of growth and prosperity, with the construction of several new buildings, including a courthouse, a jail, and a post office.
In the late 19th century, the town experienced a period of decline, as the railroad bypassed the town and the local economy suffered. In the early 20th century, the town experienced a resurgence, with the construction of a new railroad line and the opening of several new businesses. The town has continued to grow and prosper in the 21st century, with the opening of several new businesses and the construction of a new hospital.
Common Questions
What is Per Capita Income in Romney?
Per Capita income in Romney is $19,698.
What is the Median Family Income in Romney?
Median Family Income in Romney is $59,250.
What is the Median Household income in Romney?
Median Household Income in Romney is $34,063.
What is Income or Wage Gap in Romney?
Income or Wage Gap in Romney is 38.2%.
Women in Romney earn 61.8 cents for every dollar earned by a man.
What is Inequality or Gini Index in Romney?
Inequality or Gini Index in Romney is 0.48.
What is the Total Population of Romney?
Total Population of Romney is 2,062.
What is the Total Male Population of Romney?
Total Male Population of Romney is 950.
What is the Total Female Population of Romney?
Total Female Population of Romney is 1,112.
What is the Ratio of Males per 100 Females in Romney?
There are 85.43 Males per 100 Females in Romney.
What is the Ratio of Females per 100 Males in Romney?
There are 117.05 Females per 100 Males in Romney.
What is the Median Population Age in Romney?
Median Population Age in Romney is 47.7 Years.
What is the Average Family Size in Romney
Average Family Size in Romney is 4.2 People.
What is the Average Household Size in Romney
Average Household Size in Romney is 2.6 People.
How Large is the Labor Force in Romney?
There are 617 People in the Labor Forcein in Romney.
What is the Percentage of People in the Labor Force in Romney?
39.0% of People are in the Labor Force in Romney.
What is the Unemployment Rate in Romney?
Unemployment Rate in Romney is 13.9%.