Richwood, WV Map & Demographics
Richwood Map
Richwood Overview
$20,572
PER CAPITA INCOME
$58,889
AVG FAMILY INCOME
$30,962
AVG HOUSEHOLD INCOME
40.8%
WAGE / INCOME GAP [ % ]
59.2¢/ $1
WAGE / INCOME GAP [ $ ]
0.46
INEQUALITY / GINI INDEX
2,567
TOTAL POPULATION
1,136
MALE POPULATION
1,431
FEMALE POPULATION
79.39
MALES / 100 FEMALES
125.97
FEMALES / 100 MALES
44.7
MEDIAN AGE
3.5
AVG FAMILY SIZE
2.5
AVG HOUSEHOLD SIZE
820
LABOR FORCE [ PEOPLE ]
39.4%
PERCENT IN LABOR FORCE
21.7%
UNEMPLOYMENT RATE
Richwood Zip Codes
Richwood Area Codes
Income in Richwood
Income Overview in Richwood
Per Capita Income in Richwood is $20,572, while median incomes of families and households are $58,889 and $30,962 respectively.
| Characteristic | Number | Measure |
| Per Capita Income | 2,567 | $20,572 |
| Median Family Income | 488 | $58,889 |
| Mean Family Income | 488 | $71,910 |
| Median Household Income | 978 | $30,962 |
| Mean Household Income | 978 | $48,531 |
| Income Deficit | 488 | $0 |
| Wage / Income Gap (%) | 2,567 | 40.78% |
| Wage / Income Gap ($) | 2,567 | 59.22¢ per $1 |
| Gini / Inequality Index | 2,567 | 0.46 |
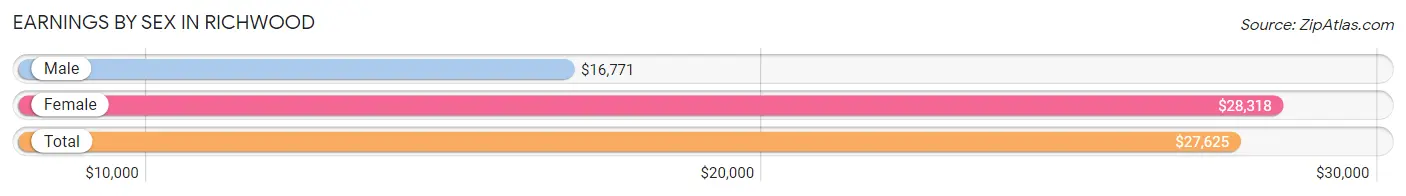
Earnings by Sex in Richwood
Average Earnings in Richwood are $27,625, $16,771 for men and $28,318 for women, a difference of 40.8%.
| Sex | Number | Average Earnings |
| Male | 281 (35.5%) | $16,771 |
| Female | 510 (64.5%) | $28,318 |
| Total | 791 (100.0%) | $27,625 |
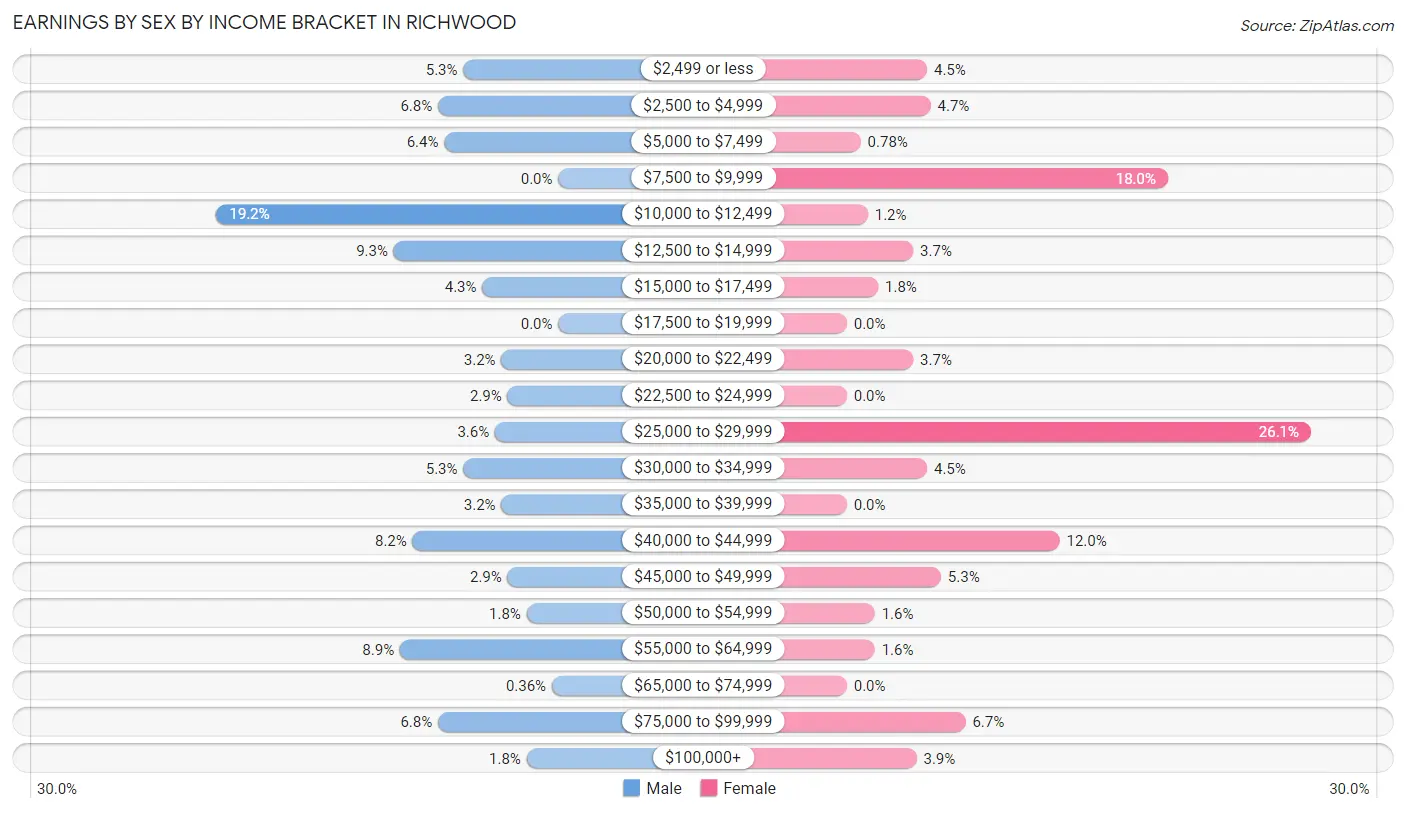
Earnings by Sex by Income Bracket in Richwood
The most common earnings brackets in Richwood are $10,000 to $12,499 for men (54 | 19.2%) and $25,000 to $29,999 for women (133 | 26.1%).
| Income | Male | Female |
| $2,499 or less | 15 (5.3%) | 23 (4.5%) |
| $2,500 to $4,999 | 19 (6.8%) | 24 (4.7%) |
| $5,000 to $7,499 | 18 (6.4%) | 4 (0.8%) |
| $7,500 to $9,999 | 0 (0.0%) | 92 (18.0%) |
| $10,000 to $12,499 | 54 (19.2%) | 6 (1.2%) |
| $12,500 to $14,999 | 26 (9.2%) | 19 (3.7%) |
| $15,000 to $17,499 | 12 (4.3%) | 9 (1.8%) |
| $17,500 to $19,999 | 0 (0.0%) | 0 (0.0%) |
| $20,000 to $22,499 | 9 (3.2%) | 19 (3.7%) |
| $22,500 to $24,999 | 8 (2.9%) | 0 (0.0%) |
| $25,000 to $29,999 | 10 (3.6%) | 133 (26.1%) |
| $30,000 to $34,999 | 15 (5.3%) | 23 (4.5%) |
| $35,000 to $39,999 | 9 (3.2%) | 0 (0.0%) |
| $40,000 to $44,999 | 23 (8.2%) | 61 (12.0%) |
| $45,000 to $49,999 | 8 (2.9%) | 27 (5.3%) |
| $50,000 to $54,999 | 5 (1.8%) | 8 (1.6%) |
| $55,000 to $64,999 | 25 (8.9%) | 8 (1.6%) |
| $65,000 to $74,999 | 1 (0.4%) | 0 (0.0%) |
| $75,000 to $99,999 | 19 (6.8%) | 34 (6.7%) |
| $100,000+ | 5 (1.8%) | 20 (3.9%) |
| Total | 281 (100.0%) | 510 (100.0%) |
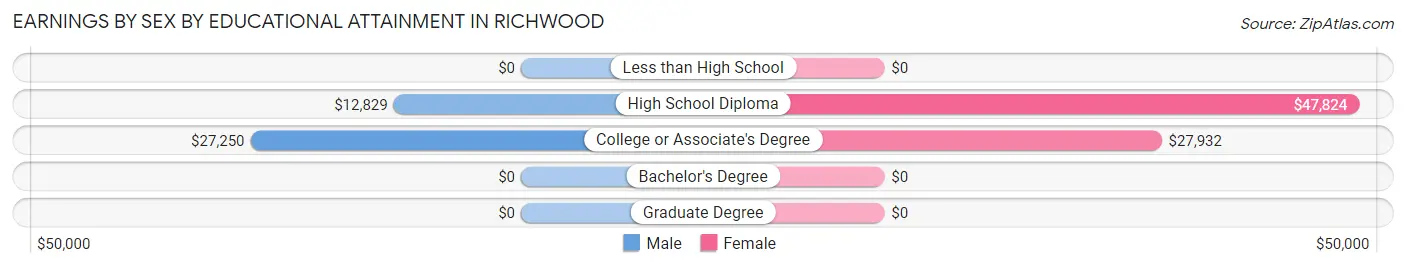
Earnings by Sex by Educational Attainment in Richwood
| Educational Attainment | Male Income | Female Income |
| Less than High School | - | - |
| High School Diploma | $12,829 | $47,824 |
| College or Associate's Degree | $27,250 | $27,932 |
| Bachelor's Degree | - | - |
| Graduate Degree | - | - |
| Total | - | - |
Family Income in Richwood
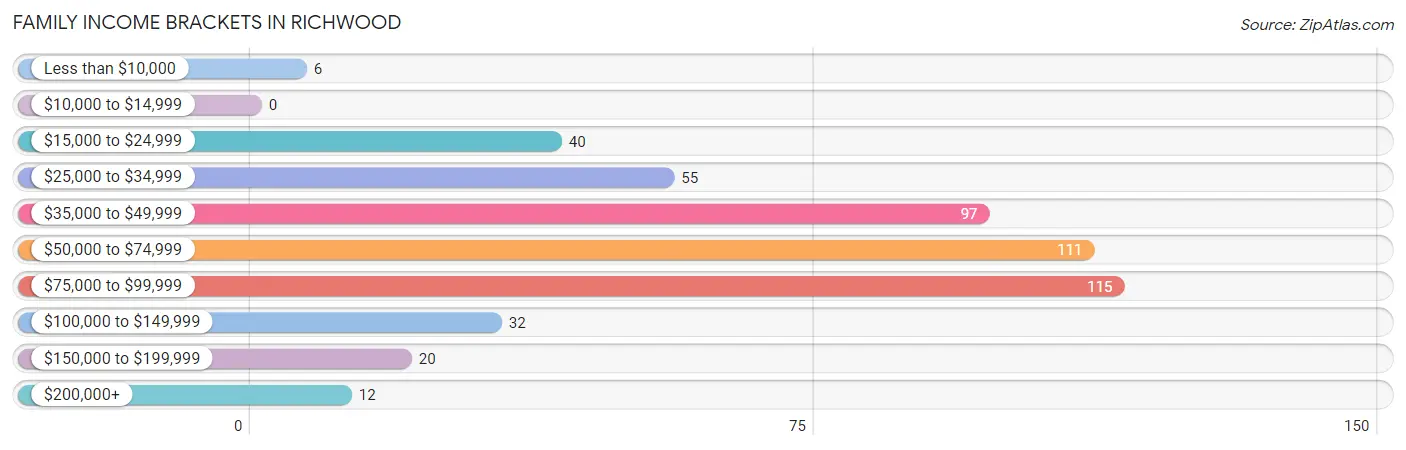
Family Income Brackets in Richwood
According to the Richwood family income data, there are 115 families falling into the $75,000 to $99,999 income range, which is the most common income bracket and makes up 23.6% of all families.
| Income Bracket | # Families | % Families |
| Less than $10,000 | 6 | 1.2% |
| $10,000 to $14,999 | 0 | 0.0% |
| $15,000 to $24,999 | 40 | 8.2% |
| $25,000 to $34,999 | 55 | 11.3% |
| $35,000 to $49,999 | 97 | 19.9% |
| $50,000 to $74,999 | 111 | 22.7% |
| $75,000 to $99,999 | 115 | 23.6% |
| $100,000 to $149,999 | 32 | 6.6% |
| $150,000 to $199,999 | 20 | 4.1% |
| $200,000+ | 12 | 2.5% |
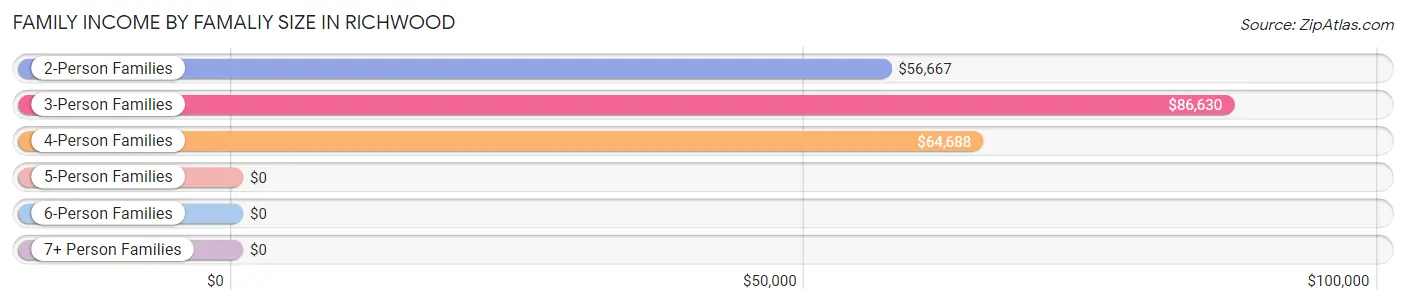
Family Income by Famaliy Size in Richwood
3-person families (72 | 14.7%) account for the highest median family income in Richwood with $86,630 per family, while 3-person families (72 | 14.7%) have the highest median income of $28,877 per family member.
| Income Bracket | # Families | Median Income |
| 2-Person Families | 260 (53.3%) | $56,667 |
| 3-Person Families | 72 (14.7%) | $86,630 |
| 4-Person Families | 81 (16.6%) | $64,688 |
| 5-Person Families | 8 (1.6%) | $0 |
| 6-Person Families | 67 (13.7%) | $0 |
| 7+ Person Families | 0 (0.0%) | $0 |
| Total | 488 (100.0%) | $58,889 |
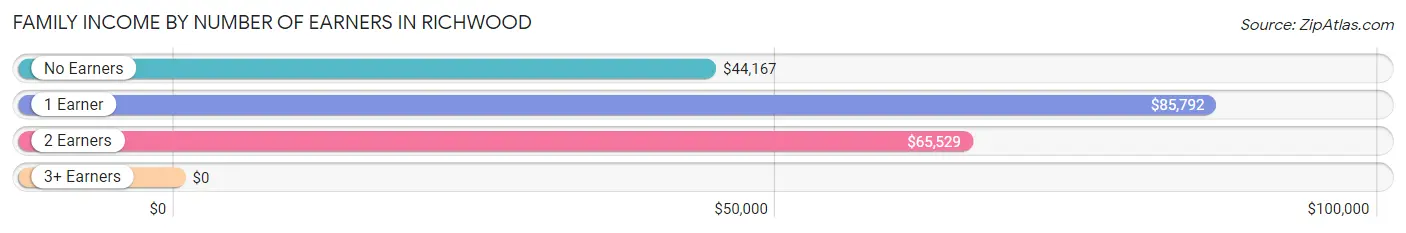
Family Income by Number of Earners in Richwood
| Number of Earners | # Families | Median Income |
| No Earners | 178 (36.5%) | $44,167 |
| 1 Earner | 173 (35.4%) | $85,792 |
| 2 Earners | 131 (26.8%) | $65,529 |
| 3+ Earners | 6 (1.2%) | $0 |
| Total | 488 (100.0%) | $58,889 |
Household Income in Richwood
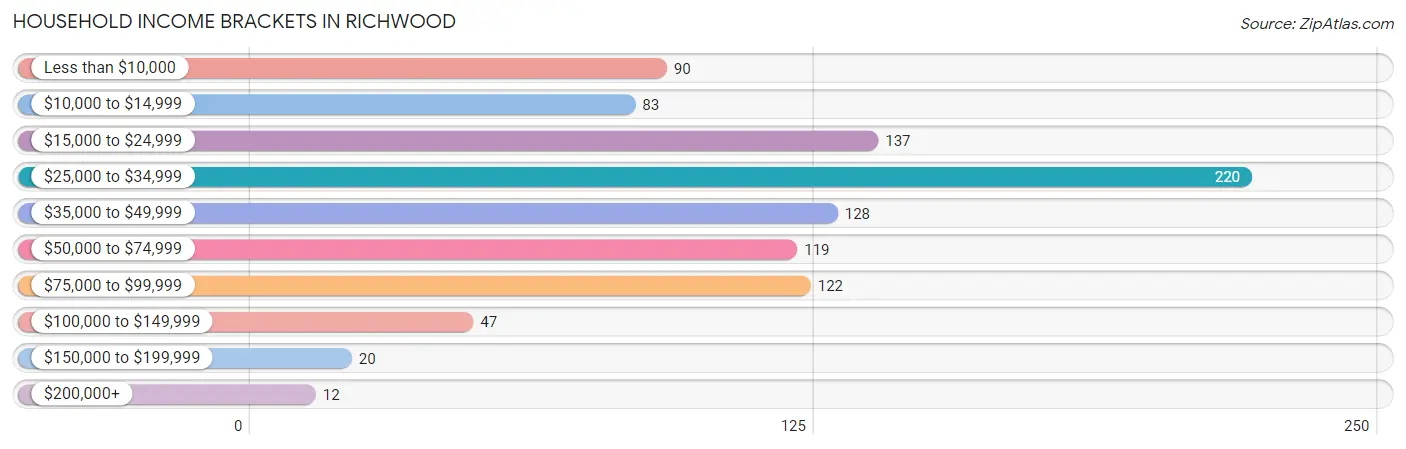
Household Income Brackets in Richwood
With 220 households falling in the category, the $25,000 to $34,999 income range is the most frequent in Richwood, accounting for 22.5% of all households. In contrast, only 12 households (1.2%) fall into the $200,000+ income bracket, making it the least populous group.
| Income Bracket | # Households | % Households |
| Less than $10,000 | 90 | 9.2% |
| $10,000 to $14,999 | 83 | 8.5% |
| $15,000 to $24,999 | 137 | 14.0% |
| $25,000 to $34,999 | 220 | 22.5% |
| $35,000 to $49,999 | 128 | 13.1% |
| $50,000 to $74,999 | 119 | 12.2% |
| $75,000 to $99,999 | 122 | 12.5% |
| $100,000 to $149,999 | 47 | 4.8% |
| $150,000 to $199,999 | 20 | 2.0% |
| $200,000+ | 12 | 1.2% |
Household Income by Householder Age in Richwood
The median household income in Richwood is $30,962, with the highest median household income of $36,685 found in the 25 to 44 years age bracket for the primary householder. A total of 217 households (22.2%) fall into this category. Meanwhile, the 15 to 24 years age bracket for the primary householder has the lowest median household income of $0, with 4 households (0.4%) in this group.
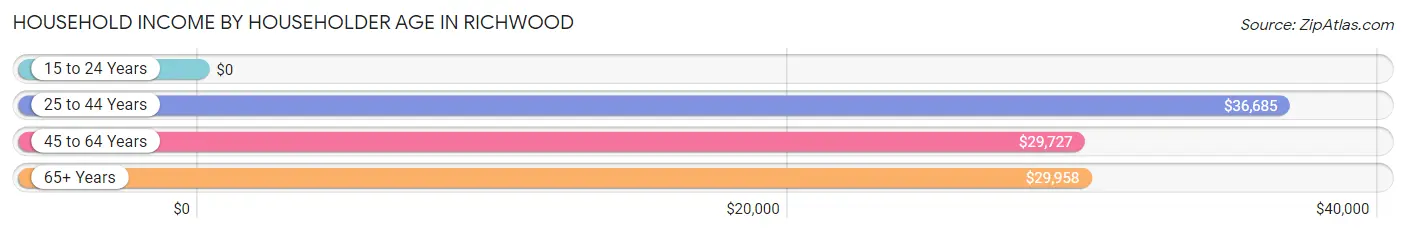
| Income Bracket | # Households | Median Income |
| 15 to 24 Years | 4 (0.4%) | $0 |
| 25 to 44 Years | 217 (22.2%) | $36,685 |
| 45 to 64 Years | 424 (43.3%) | $29,727 |
| 65+ Years | 333 (34.1%) | $29,958 |
| Total | 978 (100.0%) | $30,962 |
Poverty in Richwood
Income Below Poverty by Sex and Age in Richwood
With 31.4% poverty level for males and 29.8% for females among the residents of Richwood, 12 to 14 year old males and 5 year old females are the most vulnerable to poverty, with 7 males (100.0%) and 8 females (100.0%) in their respective age groups living below the poverty level.
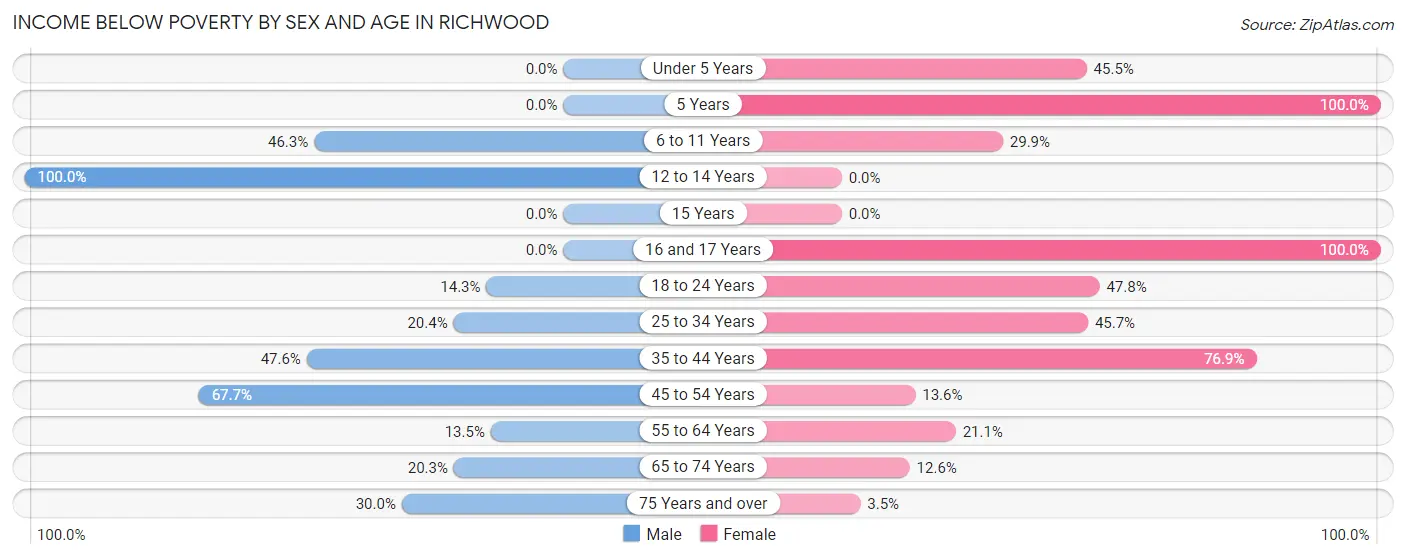
| Age Bracket | Male | Female |
| Under 5 Years | 0 (0.0%) | 20 (45.5%) |
| 5 Years | 0 (0.0%) | 8 (100.0%) |
| 6 to 11 Years | 62 (46.3%) | 58 (29.9%) |
| 12 to 14 Years | 7 (100.0%) | 0 (0.0%) |
| 15 Years | 0 (0.0%) | 0 (0.0%) |
| 16 and 17 Years | 0 (0.0%) | 5 (100.0%) |
| 18 to 24 Years | 8 (14.3%) | 11 (47.8%) |
| 25 to 34 Years | 21 (20.4%) | 106 (45.7%) |
| 35 to 44 Years | 111 (47.6%) | 110 (76.9%) |
| 45 to 54 Years | 67 (67.7%) | 27 (13.6%) |
| 55 to 64 Years | 19 (13.5%) | 37 (21.1%) |
| 65 to 74 Years | 50 (20.3%) | 16 (12.6%) |
| 75 Years and over | 12 (30.0%) | 6 (3.5%) |
| Total | 357 (31.4%) | 404 (29.8%) |
Income Above Poverty by Sex and Age in Richwood
According to the poverty statistics in Richwood, males aged under 5 years and females aged 12 to 14 years are the age groups that are most secure financially, with 100.0% of males and 100.0% of females in these age groups living above the poverty line.
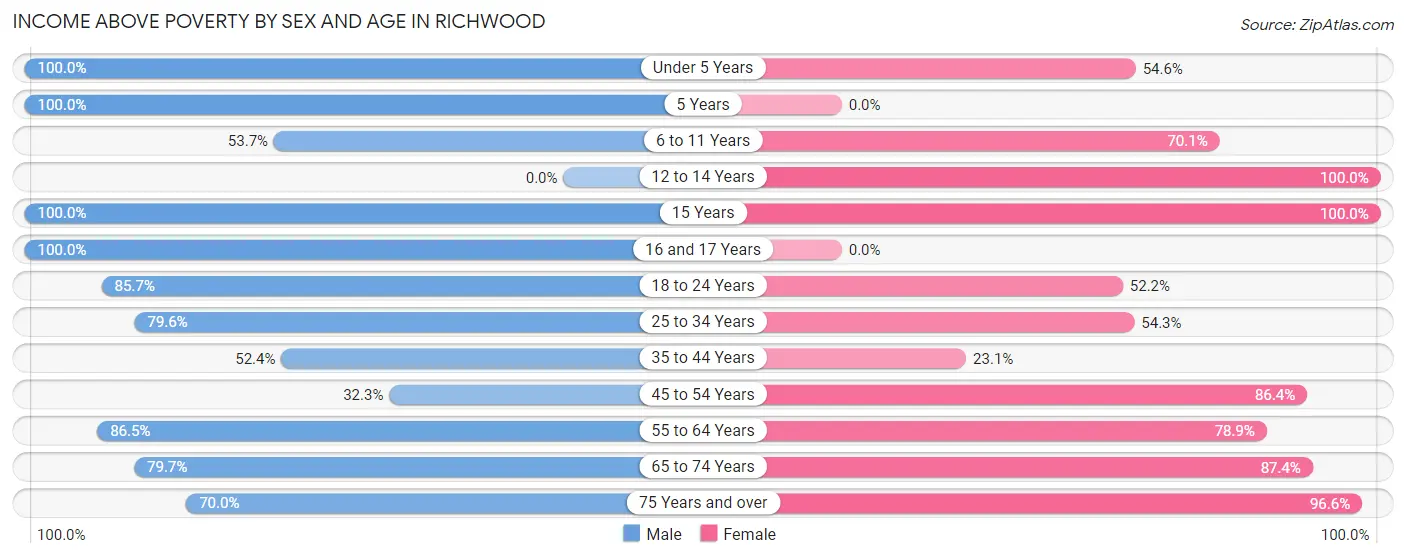
| Age Bracket | Male | Female |
| Under 5 Years | 54 (100.0%) | 24 (54.5%) |
| 5 Years | 7 (100.0%) | 0 (0.0%) |
| 6 to 11 Years | 72 (53.7%) | 136 (70.1%) |
| 12 to 14 Years | 0 (0.0%) | 7 (100.0%) |
| 15 Years | 8 (100.0%) | 24 (100.0%) |
| 16 and 17 Years | 8 (100.0%) | 0 (0.0%) |
| 18 to 24 Years | 48 (85.7%) | 12 (52.2%) |
| 25 to 34 Years | 82 (79.6%) | 126 (54.3%) |
| 35 to 44 Years | 122 (52.4%) | 33 (23.1%) |
| 45 to 54 Years | 32 (32.3%) | 171 (86.4%) |
| 55 to 64 Years | 122 (86.5%) | 138 (78.9%) |
| 65 to 74 Years | 196 (79.7%) | 111 (87.4%) |
| 75 Years and over | 28 (70.0%) | 168 (96.6%) |
| Total | 779 (68.6%) | 950 (70.2%) |
Income Below Poverty Among Married-Couple Families in Richwood
The poverty statistics for married-couple families in Richwood show that 13.9% or 51 of the total 368 families live below the poverty line. Families with 3 or 4 children have the highest poverty rate of 53.8%, comprising of 35 families. On the other hand, families with 1 or 2 children have the lowest poverty rate of 3.8%, which includes 3 families.
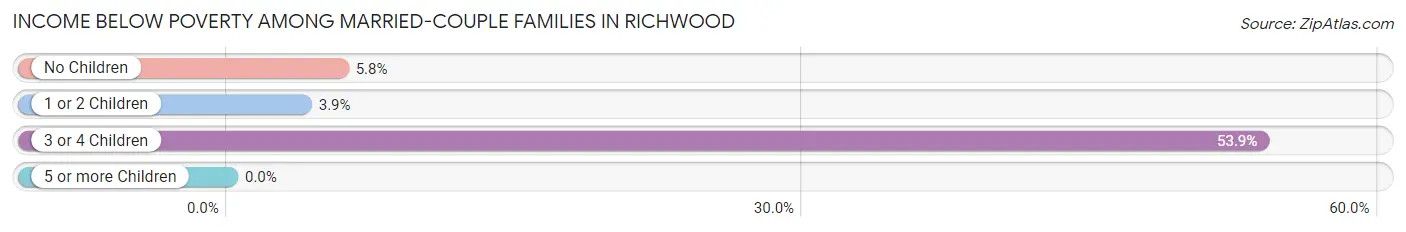
| Children | Above Poverty | Below Poverty |
| No Children | 212 (94.2%) | 13 (5.8%) |
| 1 or 2 Children | 75 (96.2%) | 3 (3.8%) |
| 3 or 4 Children | 30 (46.2%) | 35 (53.8%) |
| 5 or more Children | 0 (0.0%) | 0 (0.0%) |
| Total | 317 (86.1%) | 51 (13.9%) |
Income Below Poverty Among Single-Parent Households in Richwood
According to the poverty data in Richwood, 33.3% or 6 single-father households and 15.7% or 16 single-mother households are living below the poverty line. Among single-father households, those with no children have the highest poverty rate, with 6 households (50.0%) experiencing poverty. Likewise, among single-mother households, those with 1 or 2 children have the highest poverty rate, with 16 households (31.4%) falling below the poverty line.
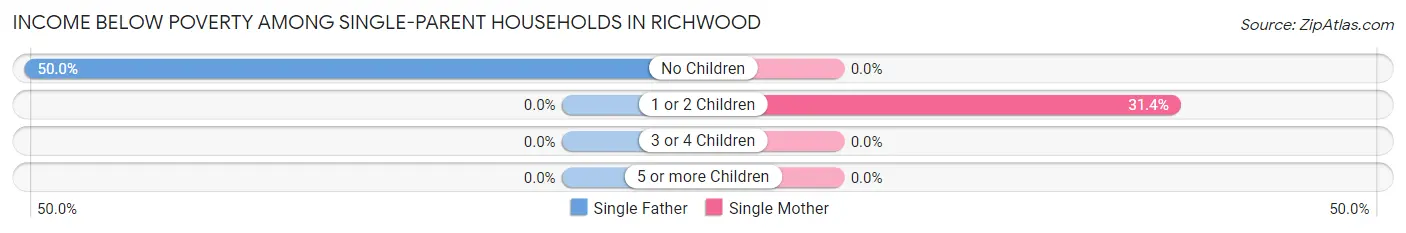
| Children | Single Father | Single Mother |
| No Children | 6 (50.0%) | 0 (0.0%) |
| 1 or 2 Children | 0 (0.0%) | 16 (31.4%) |
| 3 or 4 Children | 0 (0.0%) | 0 (0.0%) |
| 5 or more Children | 0 (0.0%) | 0 (0.0%) |
| Total | 6 (33.3%) | 16 (15.7%) |
Income Below Poverty Among Married-Couple vs Single-Parent Households in Richwood
The poverty data for Richwood shows that 51 of the married-couple family households (13.9%) and 22 of the single-parent households (18.3%) are living below the poverty level. Within the married-couple family households, those with 3 or 4 children have the highest poverty rate, with 35 households (53.8%) falling below the poverty line. Among the single-parent households, those with 1 or 2 children have the highest poverty rate, with 16 household (31.4%) living below poverty.
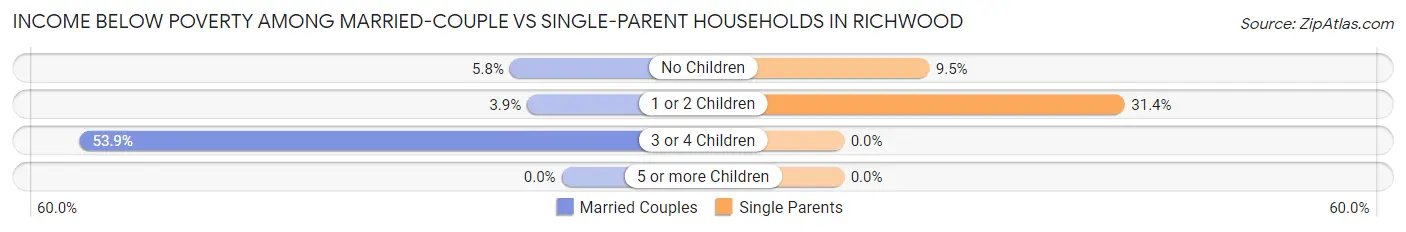
| Children | Married-Couple Families | Single-Parent Households |
| No Children | 13 (5.8%) | 6 (9.5%) |
| 1 or 2 Children | 3 (3.8%) | 16 (31.4%) |
| 3 or 4 Children | 35 (53.8%) | 0 (0.0%) |
| 5 or more Children | 0 (0.0%) | 0 (0.0%) |
| Total | 51 (13.9%) | 22 (18.3%) |
Race in Richwood
The most populous races in Richwood are White / Caucasian (2,540 | 99.0%), Two or more Races (16 | 0.6%), and Asian (7 | 0.3%).
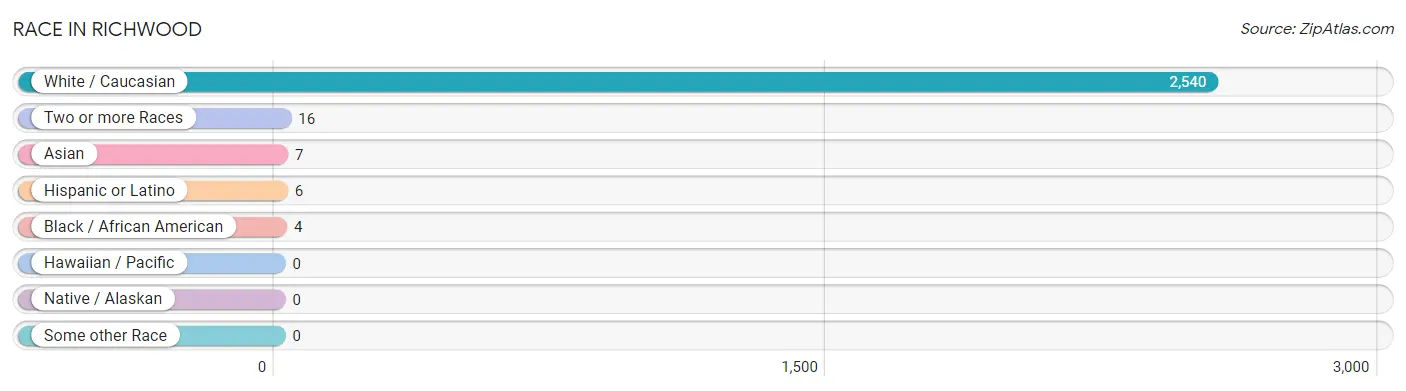
| Race | # Population | % Population |
| Asian | 7 | 0.3% |
| Black / African American | 4 | 0.2% |
| Hawaiian / Pacific | 0 | 0.0% |
| Hispanic or Latino | 6 | 0.2% |
| Native / Alaskan | 0 | 0.0% |
| White / Caucasian | 2,540 | 99.0% |
| Two or more Races | 16 | 0.6% |
| Some other Race | 0 | 0.0% |
| Total | 2,567 | 100.0% |
Ancestry in Richwood
The most populous ancestries reported in Richwood are German (424 | 16.5%), Irish (413 | 16.1%), English (299 | 11.7%), American (256 | 10.0%), and Dutch (212 | 8.3%), together accounting for 62.5% of all Richwood residents.
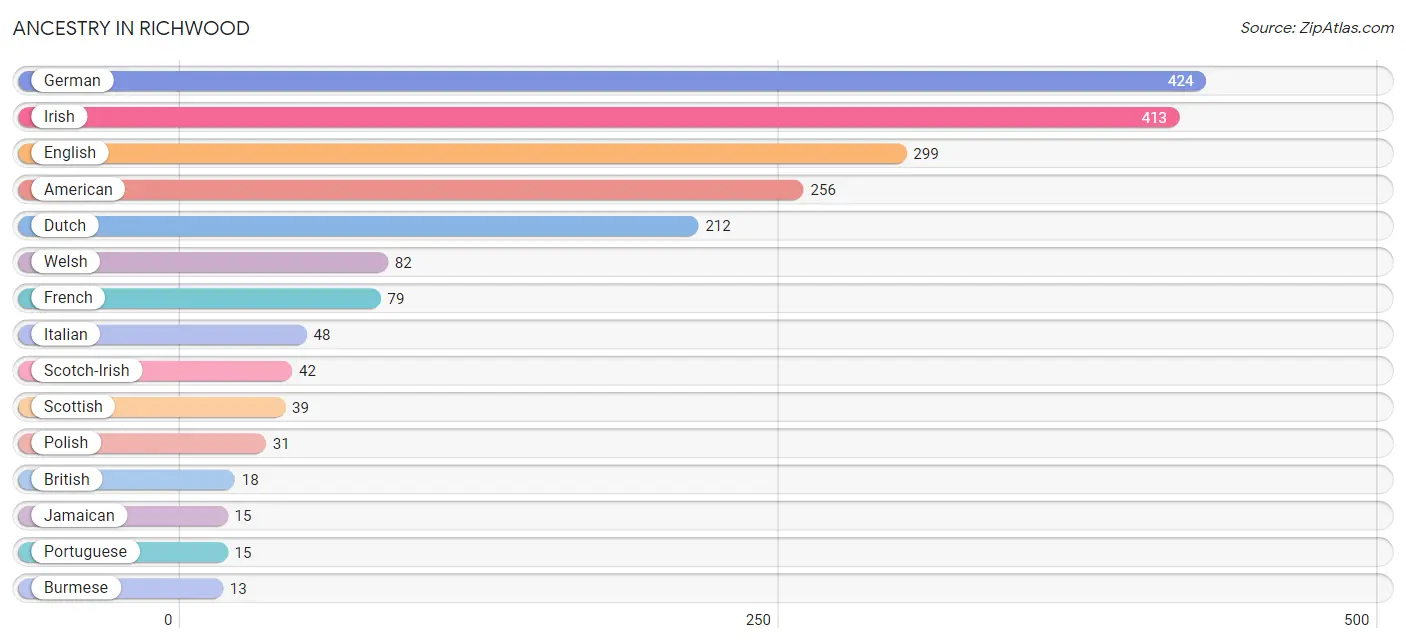
| Ancestry | # Population | % Population |
| American | 256 | 10.0% |
| Bhutanese | 1 | 0.0% |
| British | 18 | 0.7% |
| Burmese | 13 | 0.5% |
| Dutch | 212 | 8.3% |
| Eastern European | 6 | 0.2% |
| English | 299 | 11.7% |
| Filipino | 3 | 0.1% |
| French | 79 | 3.1% |
| French Canadian | 5 | 0.2% |
| German | 424 | 16.5% |
| Irish | 413 | 16.1% |
| Italian | 48 | 1.9% |
| Jamaican | 15 | 0.6% |
| Korean | 6 | 0.2% |
| Pennsylvania German | 5 | 0.2% |
| Polish | 31 | 1.2% |
| Portuguese | 15 | 0.6% |
| Scandinavian | 7 | 0.3% |
| Scotch-Irish | 42 | 1.6% |
| Scottish | 39 | 1.5% |
| Welsh | 82 | 3.2% | View All 22 Rows |
Immigrants in Richwood
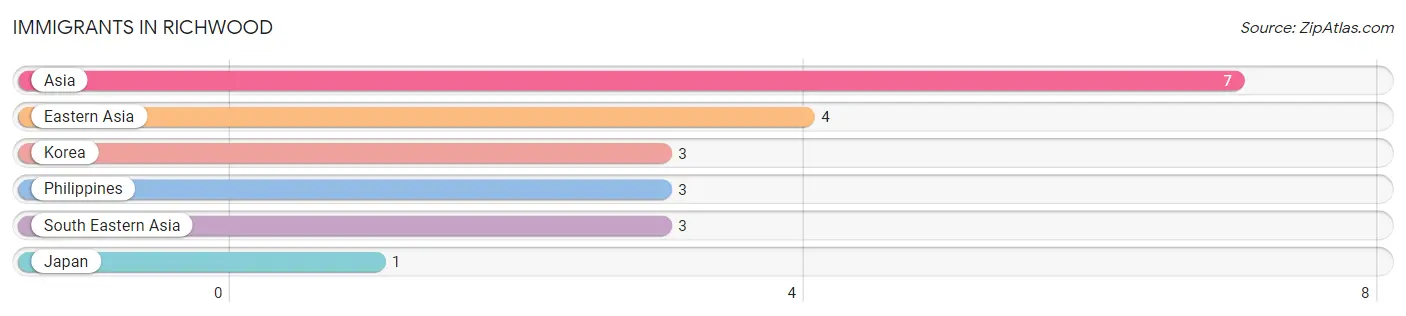
The most numerous immigrant groups reported in Richwood came from Asia (7 | 0.3%), Eastern Asia (4 | 0.2%), Korea (3 | 0.1%), Philippines (3 | 0.1%), and South Eastern Asia (3 | 0.1%), together accounting for 0.8% of all Richwood residents.
| Immigration Origin | # Population | % Population |
| Asia | 7 | 0.3% |
| Eastern Asia | 4 | 0.2% |
| Japan | 1 | 0.0% |
| Korea | 3 | 0.1% |
| Philippines | 3 | 0.1% |
| South Eastern Asia | 3 | 0.1% | View All 6 Rows |
Sex and Age in Richwood
Sex and Age in Richwood
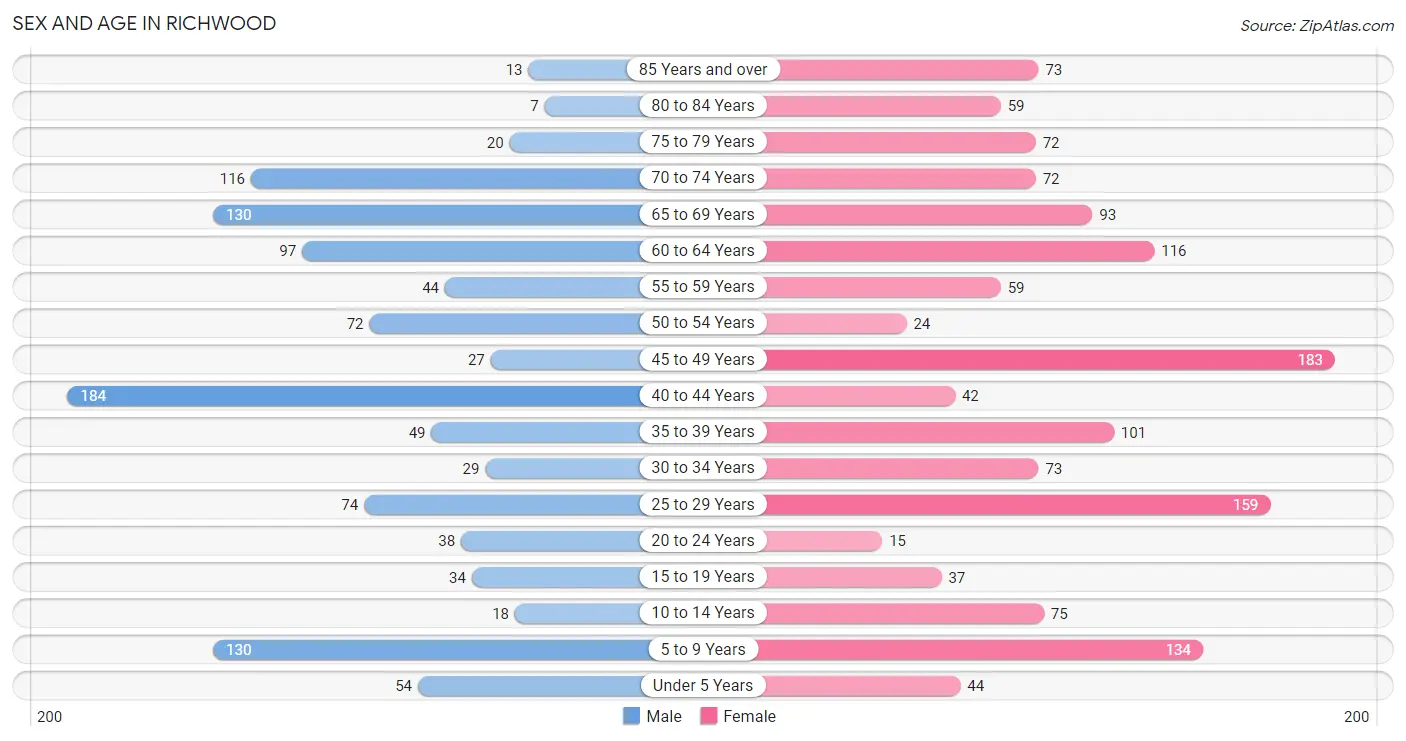
The most populous age groups in Richwood are 40 to 44 Years (184 | 16.2%) for men and 45 to 49 Years (183 | 12.8%) for women.
| Age Bracket | Male | Female |
| Under 5 Years | 54 (4.8%) | 44 (3.1%) |
| 5 to 9 Years | 130 (11.4%) | 134 (9.4%) |
| 10 to 14 Years | 18 (1.6%) | 75 (5.2%) |
| 15 to 19 Years | 34 (3.0%) | 37 (2.6%) |
| 20 to 24 Years | 38 (3.4%) | 15 (1.1%) |
| 25 to 29 Years | 74 (6.5%) | 159 (11.1%) |
| 30 to 34 Years | 29 (2.5%) | 73 (5.1%) |
| 35 to 39 Years | 49 (4.3%) | 101 (7.1%) |
| 40 to 44 Years | 184 (16.2%) | 42 (2.9%) |
| 45 to 49 Years | 27 (2.4%) | 183 (12.8%) |
| 50 to 54 Years | 72 (6.3%) | 24 (1.7%) |
| 55 to 59 Years | 44 (3.9%) | 59 (4.1%) |
| 60 to 64 Years | 97 (8.5%) | 116 (8.1%) |
| 65 to 69 Years | 130 (11.4%) | 93 (6.5%) |
| 70 to 74 Years | 116 (10.2%) | 72 (5.0%) |
| 75 to 79 Years | 20 (1.8%) | 72 (5.0%) |
| 80 to 84 Years | 7 (0.6%) | 59 (4.1%) |
| 85 Years and over | 13 (1.1%) | 73 (5.1%) |
| Total | 1,136 (100.0%) | 1,431 (100.0%) |
Families and Households in Richwood
Median Family Size in Richwood
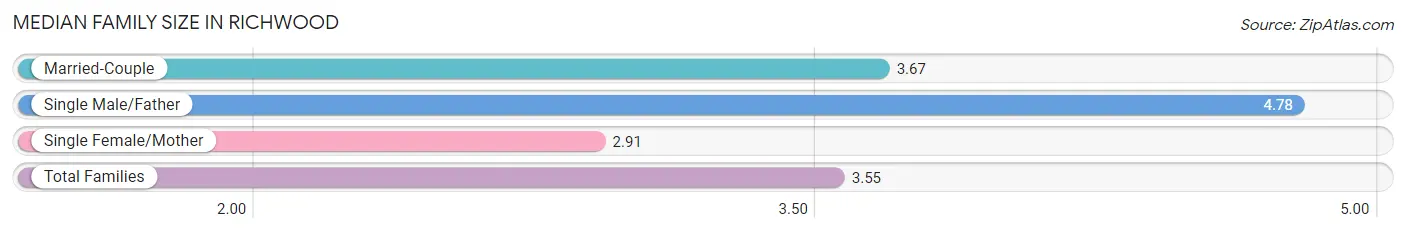
The median family size in Richwood is 3.55 persons per family, with single male/father families (18 | 3.7%) accounting for the largest median family size of 4.78 persons per family. On the other hand, single female/mother families (102 | 20.9%) represent the smallest median family size with 2.91 persons per family.
| Family Type | # Families | Family Size |
| Married-Couple | 368 (75.4%) | 3.67 |
| Single Male/Father | 18 (3.7%) | 4.78 |
| Single Female/Mother | 102 (20.9%) | 2.91 |
| Total Families | 488 (100.0%) | 3.55 |
Median Household Size in Richwood
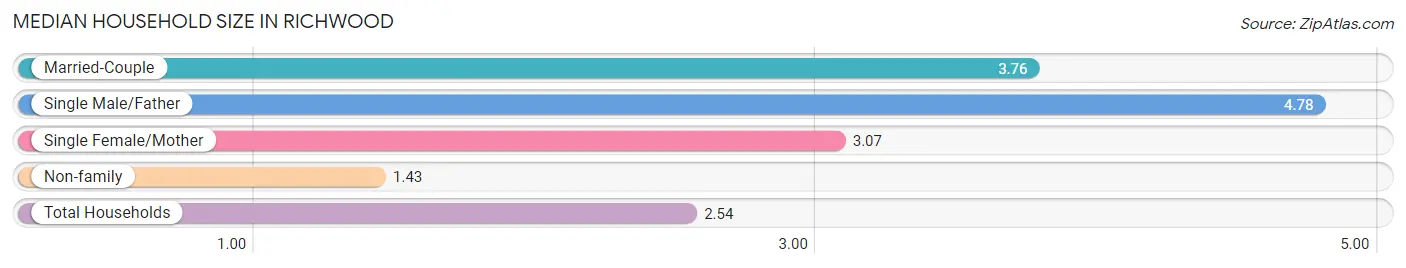
The median household size in Richwood is 2.54 persons per household, with single male/father households (18 | 1.8%) accounting for the largest median household size of 4.78 persons per household. non-family households (490 | 50.1%) represent the smallest median household size with 1.43 persons per household.
| Household Type | # Households | Household Size |
| Married-Couple | 368 (37.6%) | 3.76 |
| Single Male/Father | 18 (1.8%) | 4.78 |
| Single Female/Mother | 102 (10.4%) | 3.07 |
| Non-family | 490 (50.1%) | 1.43 |
| Total Households | 978 (100.0%) | 2.54 |
Household Size by Marriage Status in Richwood
Out of a total of 978 households in Richwood, 488 (49.9%) are family households, while 490 (50.1%) are nonfamily households. The most numerous type of family households are 2-person households, comprising 260, and the most common type of nonfamily households are 1-person households, comprising 411.
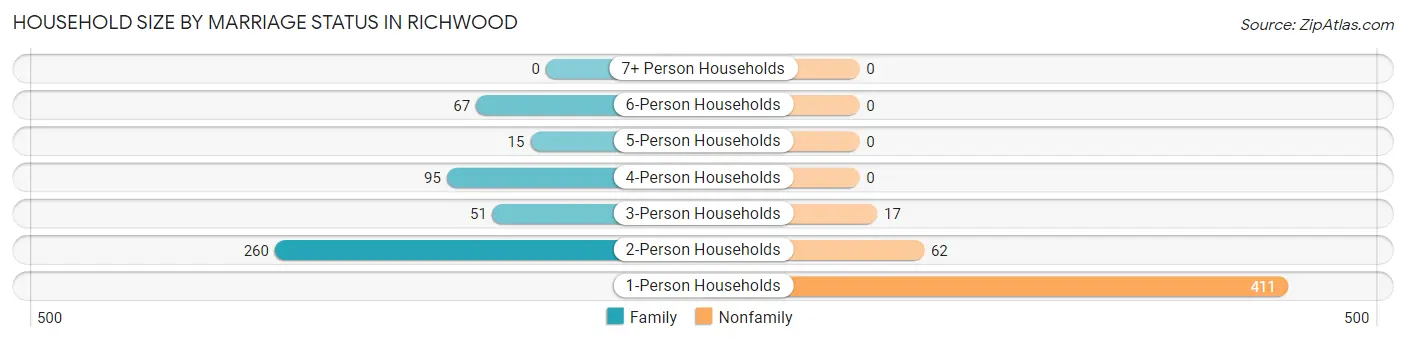
| Household Size | Family Households | Nonfamily Households |
| 1-Person Households | - | 411 (42.0%) |
| 2-Person Households | 260 (26.6%) | 62 (6.3%) |
| 3-Person Households | 51 (5.2%) | 17 (1.7%) |
| 4-Person Households | 95 (9.7%) | 0 (0.0%) |
| 5-Person Households | 15 (1.5%) | 0 (0.0%) |
| 6-Person Households | 67 (6.9%) | 0 (0.0%) |
| 7+ Person Households | 0 (0.0%) | 0 (0.0%) |
| Total | 488 (49.9%) | 490 (50.1%) |
Female Fertility in Richwood
Fertility by Age in Richwood
Average fertility rate in Richwood is 13.0 births per 1,000 women. Women in the age bracket of 35 to 50 years have the highest fertility rate with 24.0 births per 1,000 women. Women in the age bracket of 35 to 50 years acount for 100.0% of all women with births.
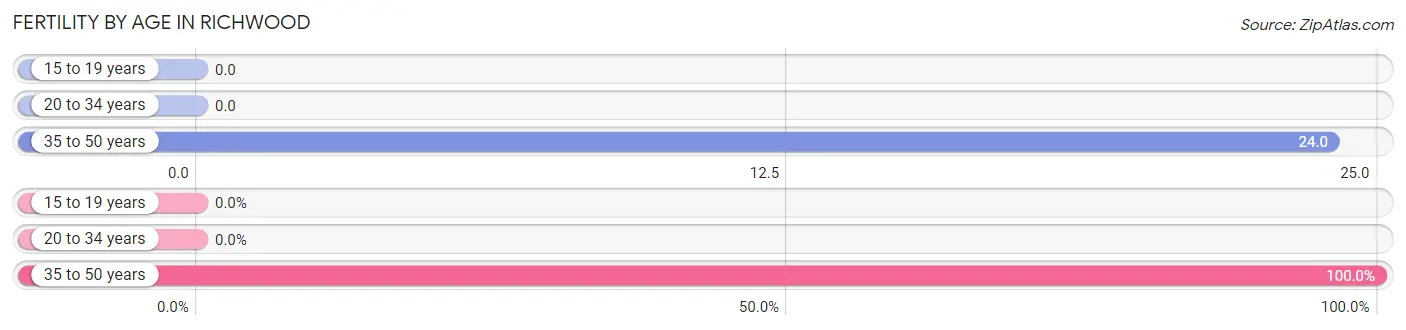
| Age Bracket | Women with Births | Births / 1,000 Women |
| 15 to 19 years | 0 (0.0%) | 0.0 |
| 20 to 34 years | 0 (0.0%) | 0.0 |
| 35 to 50 years | 8 (100.0%) | 24.0 |
| Total | 8 (100.0%) | 13.0 |
Fertility by Age by Marriage Status in Richwood
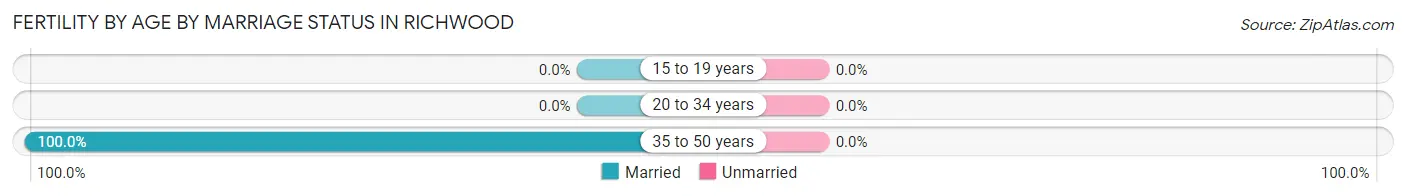
| Age Bracket | Married | Unmarried |
| 15 to 19 years | 0 (0.0%) | 0 (0.0%) |
| 20 to 34 years | 0 (0.0%) | 0 (0.0%) |
| 35 to 50 years | 8 (100.0%) | 0 (0.0%) |
| Total | 8 (100.0%) | 0 (0.0%) |
Fertility by Education in Richwood
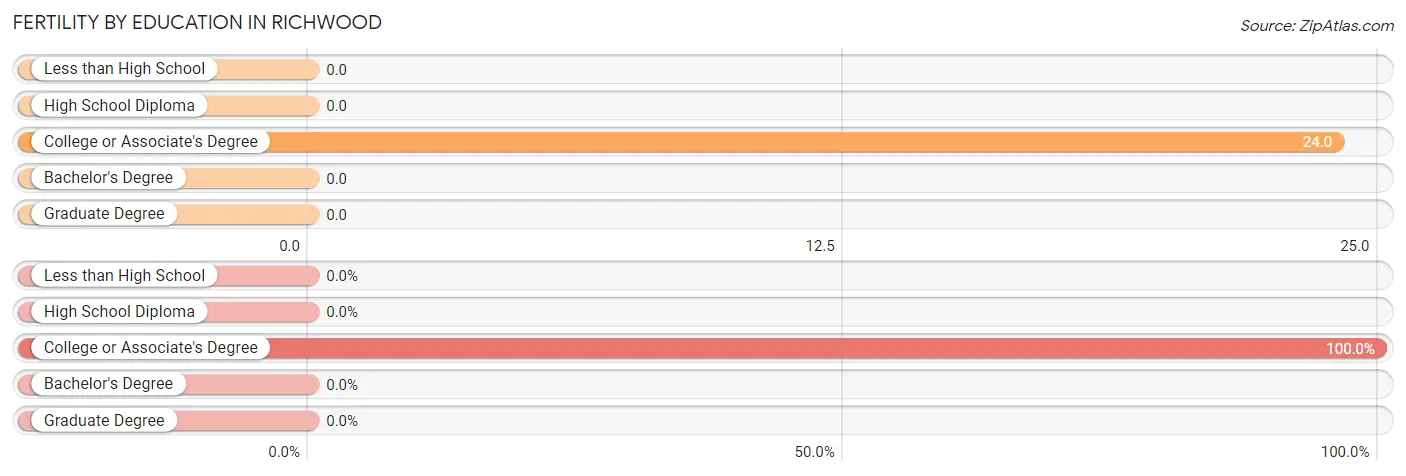
| Educational Attainment | Women with Births | Births / 1,000 Women |
| Less than High School | 0 (0.0%) | 0.0 |
| High School Diploma | 0 (0.0%) | 0.0 |
| College or Associate's Degree | 8 (100.0%) | 24.0 |
| Bachelor's Degree | 0 (0.0%) | 0.0 |
| Graduate Degree | 0 (0.0%) | 0.0 |
| Total | 8 (100.0%) | 13.0 |
Fertility by Education by Marriage Status in Richwood
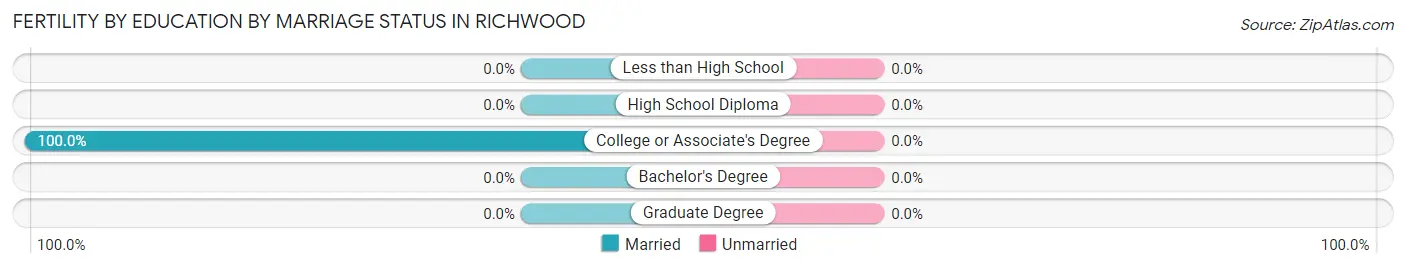
| Educational Attainment | Married | Unmarried |
| Less than High School | 0 (0.0%) | 0 (0.0%) |
| High School Diploma | 0 (0.0%) | 0 (0.0%) |
| College or Associate's Degree | 8 (100.0%) | 0 (0.0%) |
| Bachelor's Degree | 0 (0.0%) | 0 (0.0%) |
| Graduate Degree | 0 (0.0%) | 0 (0.0%) |
| Total | 8 (100.0%) | 0 (0.0%) |
Employment Characteristics in Richwood
Employment by Class of Employer in Richwood
Among the 642 employed individuals in Richwood, private company employees (523 | 81.5%), self-employed (incorporated) (49 | 7.6%), and local government employees (25 | 3.9%) make up the most common classes of employment.
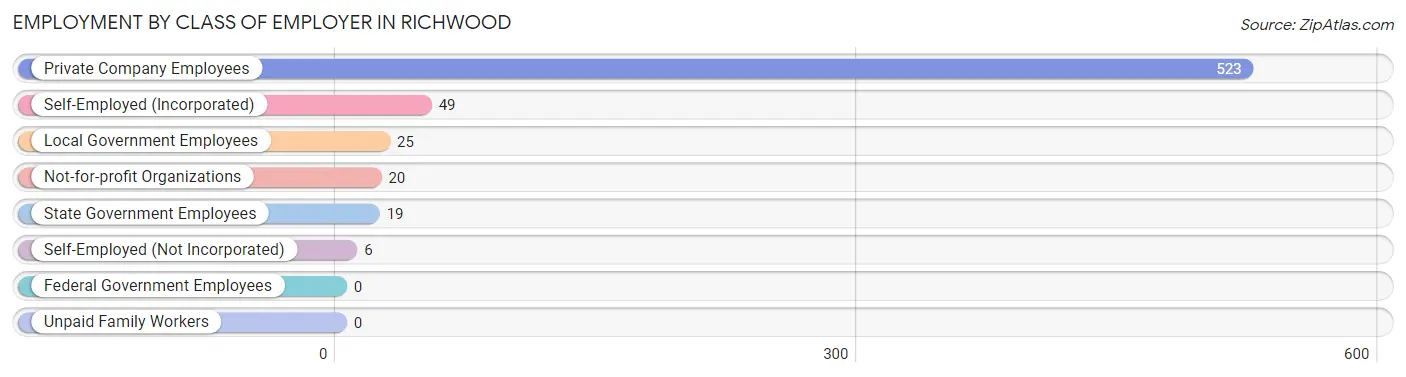
| Employer Class | # Employees | % Employees |
| Private Company Employees | 523 | 81.5% |
| Self-Employed (Incorporated) | 49 | 7.6% |
| Self-Employed (Not Incorporated) | 6 | 0.9% |
| Not-for-profit Organizations | 20 | 3.1% |
| Local Government Employees | 25 | 3.9% |
| State Government Employees | 19 | 3.0% |
| Federal Government Employees | 0 | 0.0% |
| Unpaid Family Workers | 0 | 0.0% |
| Total | 642 | 100.0% |
Employment Status by Age in Richwood
According to the labor force statistics for Richwood, out of the total population over 16 years of age (2,080), 39.4% or 820 individuals are in the labor force, with 21.7% or 178 of them unemployed. The age group with the highest labor force participation rate is 25 to 29 years, with 77.7% or 181 individuals in the labor force. Within the labor force, the 30 to 34 years age range has the highest percentage of unemployed individuals, with 80.9% or 55 of them being unemployed.
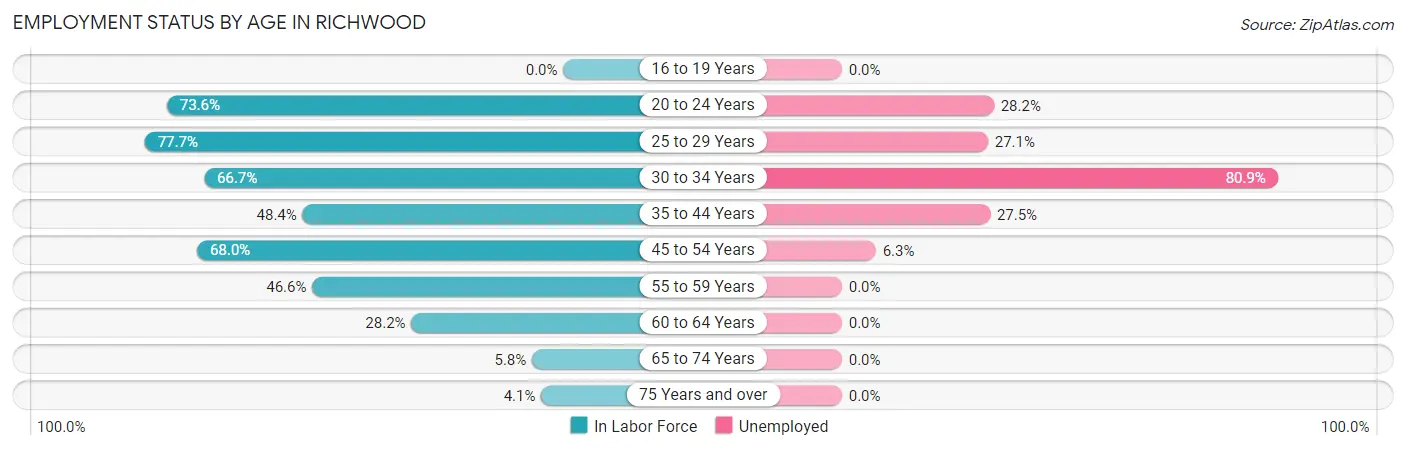
| Age Bracket | In Labor Force | Unemployed |
| 16 to 19 Years | 0 (0.0%) | 0 (0.0%) |
| 20 to 24 Years | 39 (73.6%) | 11 (28.2%) |
| 25 to 29 Years | 181 (77.7%) | 49 (27.1%) |
| 30 to 34 Years | 68 (66.7%) | 55 (80.9%) |
| 35 to 44 Years | 182 (48.4%) | 50 (27.5%) |
| 45 to 54 Years | 208 (68.0%) | 13 (6.3%) |
| 55 to 59 Years | 48 (46.6%) | 0 (0.0%) |
| 60 to 64 Years | 60 (28.2%) | 0 (0.0%) |
| 65 to 74 Years | 24 (5.8%) | 0 (0.0%) |
| 75 Years and over | 10 (4.1%) | 0 (0.0%) |
| Total | 820 (39.4%) | 178 (21.7%) |
Employment Status by Educational Attainment in Richwood
According to labor force statistics for Richwood, 56.0% of individuals (746) out of the total population between 25 and 64 years of age (1,333) are in the labor force, with 22.4% or 167 of them being unemployed. The group with the highest labor force participation rate are those with the educational attainment of college / associate degree, with 72.6% or 384 individuals in the labor force. Within the labor force, individuals with high school diploma education have the highest percentage of unemployment, with 37.5% or 97 of them being unemployed.
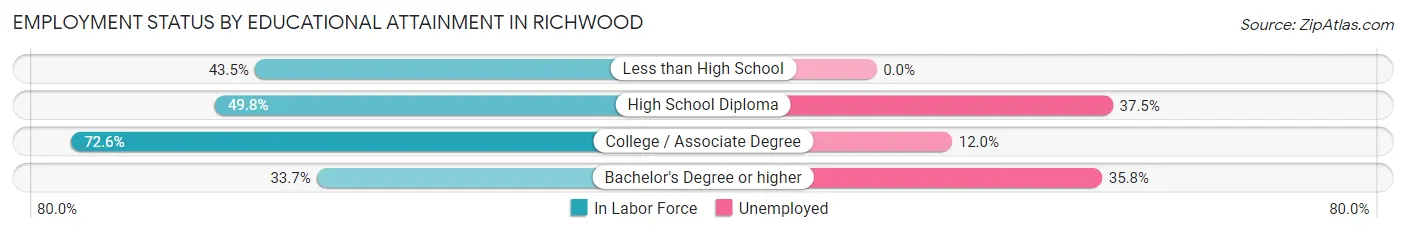
| Educational Attainment | In Labor Force | Unemployed |
| Less than High School | 37 (43.5%) | 0 (0.0%) |
| High School Diploma | 259 (49.8%) | 195 (37.5%) |
| College / Associate Degree | 384 (72.6%) | 63 (12.0%) |
| Bachelor's Degree or higher | 67 (33.7%) | 71 (35.8%) |
| Total | 746 (56.0%) | 299 (22.4%) |
Employment Occupations by Sex in Richwood
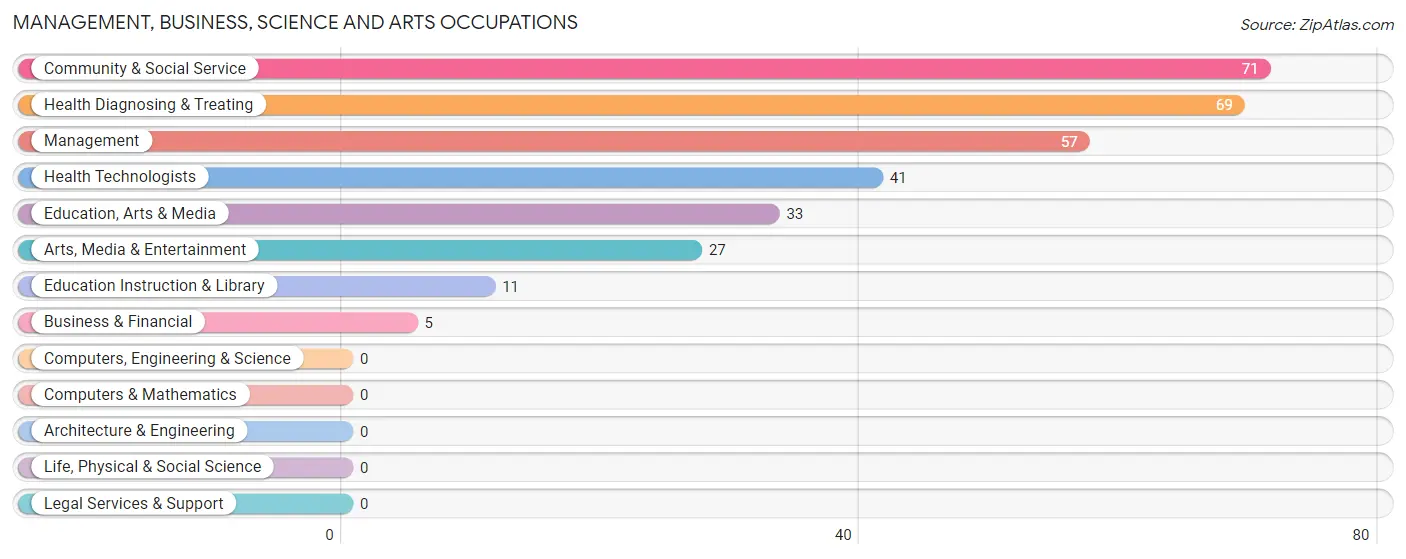
Management, Business, Science and Arts Occupations
The most common Management, Business, Science and Arts occupations in Richwood are Community & Social Service (71 | 11.1%), Health Diagnosing & Treating (69 | 10.7%), Management (57 | 8.9%), Health Technologists (41 | 6.4%), and Education, Arts & Media (33 | 5.1%).
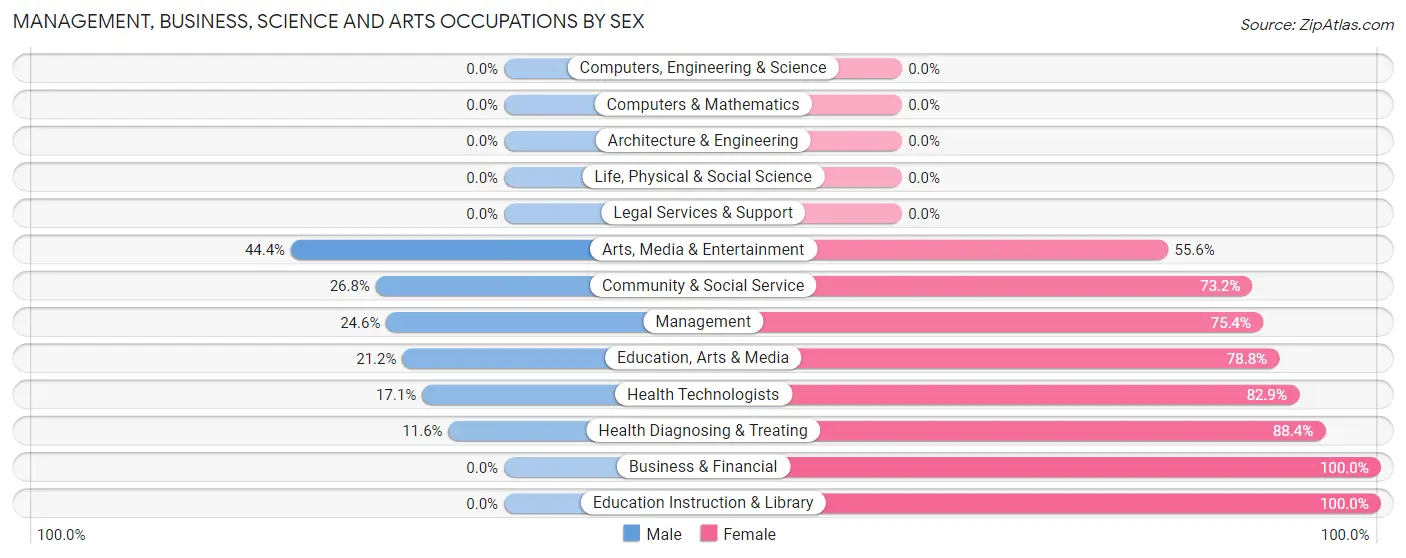
Management, Business, Science and Arts Occupations by Sex
Within the Management, Business, Science and Arts occupations in Richwood, the most male-oriented occupations are Arts, Media & Entertainment (44.4%), Community & Social Service (26.8%), and Management (24.6%), while the most female-oriented occupations are Business & Financial (100.0%), Education Instruction & Library (100.0%), and Health Diagnosing & Treating (88.4%).
| Occupation | Male | Female |
| Management | 14 (24.6%) | 43 (75.4%) |
| Business & Financial | 0 (0.0%) | 5 (100.0%) |
| Computers, Engineering & Science | 0 (0.0%) | 0 (0.0%) |
| Computers & Mathematics | 0 (0.0%) | 0 (0.0%) |
| Architecture & Engineering | 0 (0.0%) | 0 (0.0%) |
| Life, Physical & Social Science | 0 (0.0%) | 0 (0.0%) |
| Community & Social Service | 19 (26.8%) | 52 (73.2%) |
| Education, Arts & Media | 7 (21.2%) | 26 (78.8%) |
| Legal Services & Support | 0 (0.0%) | 0 (0.0%) |
| Education Instruction & Library | 0 (0.0%) | 11 (100.0%) |
| Arts, Media & Entertainment | 12 (44.4%) | 15 (55.6%) |
| Health Diagnosing & Treating | 8 (11.6%) | 61 (88.4%) |
| Health Technologists | 7 (17.1%) | 34 (82.9%) |
| Total (Category) | 41 (20.3%) | 161 (79.7%) |
| Total (Overall) | 198 (30.8%) | 444 (69.2%) |
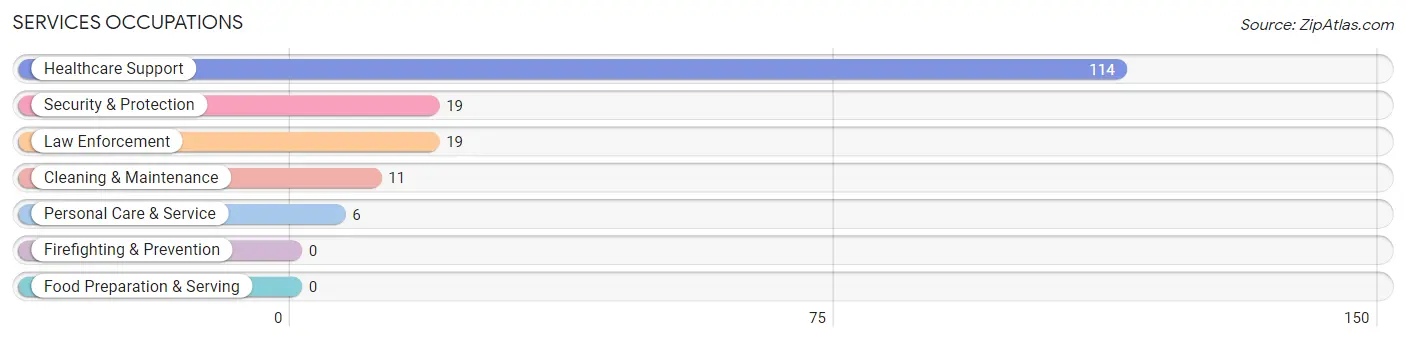
Services Occupations
The most common Services occupations in Richwood are Healthcare Support (114 | 17.8%), Security & Protection (19 | 3.0%), Law Enforcement (19 | 3.0%), Cleaning & Maintenance (11 | 1.7%), and Personal Care & Service (6 | 0.9%).
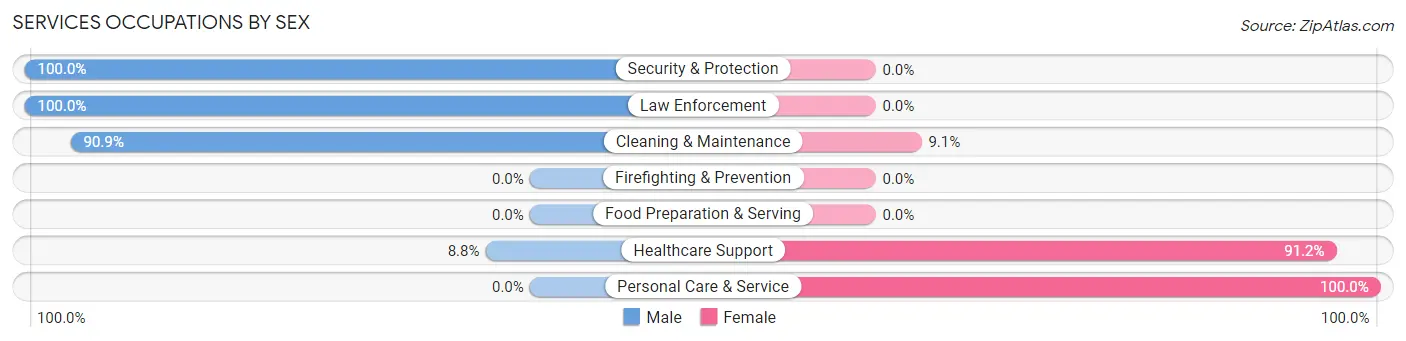
Services Occupations by Sex
Within the Services occupations in Richwood, the most male-oriented occupations are Security & Protection (100.0%), Law Enforcement (100.0%), and Cleaning & Maintenance (90.9%), while the most female-oriented occupations are Personal Care & Service (100.0%), Healthcare Support (91.2%), and Cleaning & Maintenance (9.1%).
| Occupation | Male | Female |
| Healthcare Support | 10 (8.8%) | 104 (91.2%) |
| Security & Protection | 19 (100.0%) | 0 (0.0%) |
| Firefighting & Prevention | 0 (0.0%) | 0 (0.0%) |
| Law Enforcement | 19 (100.0%) | 0 (0.0%) |
| Food Preparation & Serving | 0 (0.0%) | 0 (0.0%) |
| Cleaning & Maintenance | 10 (90.9%) | 1 (9.1%) |
| Personal Care & Service | 0 (0.0%) | 6 (100.0%) |
| Total (Category) | 39 (26.0%) | 111 (74.0%) |
| Total (Overall) | 198 (30.8%) | 444 (69.2%) |
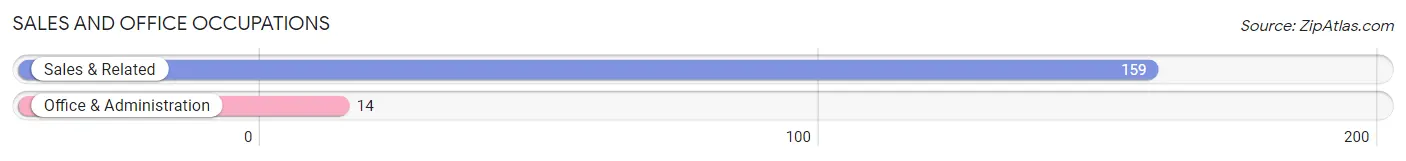
Sales and Office Occupations
The most common Sales and Office occupations in Richwood are Sales & Related (159 | 24.8%), and Office & Administration (14 | 2.2%).
Sales and Office Occupations by Sex
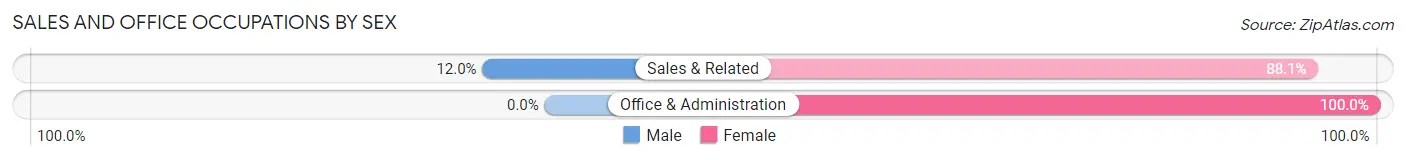
| Occupation | Male | Female |
| Sales & Related | 19 (11.9%) | 140 (88.0%) |
| Office & Administration | 0 (0.0%) | 14 (100.0%) |
| Total (Category) | 19 (11.0%) | 154 (89.0%) |
| Total (Overall) | 198 (30.8%) | 444 (69.2%) |
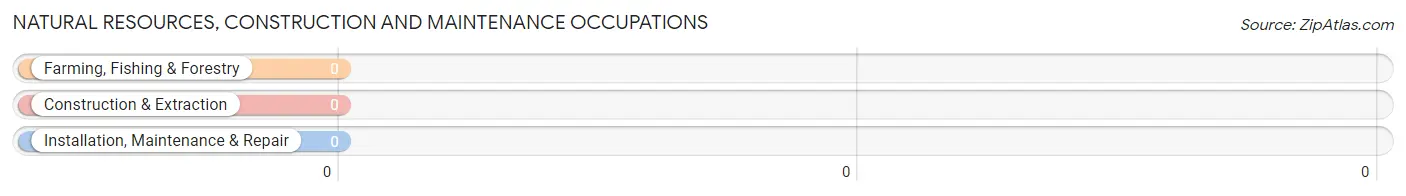
Natural Resources, Construction and Maintenance Occupations
Natural Resources, Construction and Maintenance Occupations by Sex
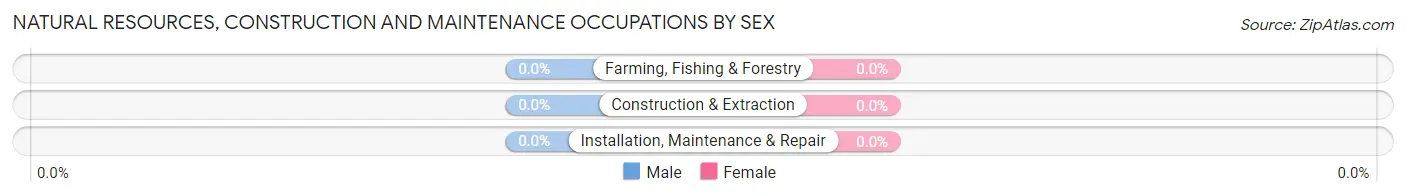
| Occupation | Male | Female |
| Farming, Fishing & Forestry | 0 (0.0%) | 0 (0.0%) |
| Construction & Extraction | 0 (0.0%) | 0 (0.0%) |
| Installation, Maintenance & Repair | 0 (0.0%) | 0 (0.0%) |
| Total (Category) | 0 (0.0%) | 0 (0.0%) |
| Total (Overall) | 198 (30.8%) | 444 (69.2%) |
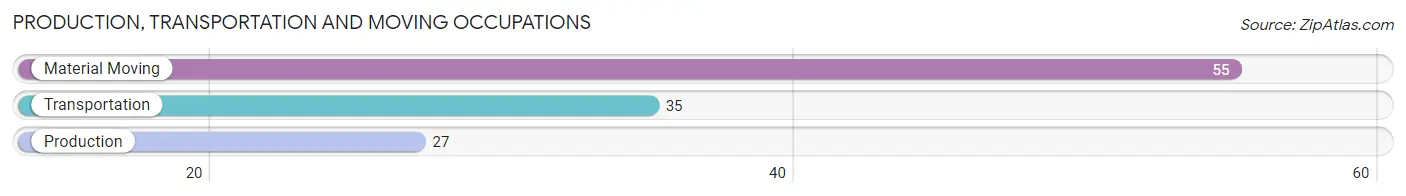
Production, Transportation and Moving Occupations
The most common Production, Transportation and Moving occupations in Richwood are Material Moving (55 | 8.6%), Transportation (35 | 5.4%), and Production (27 | 4.2%).
Production, Transportation and Moving Occupations by Sex
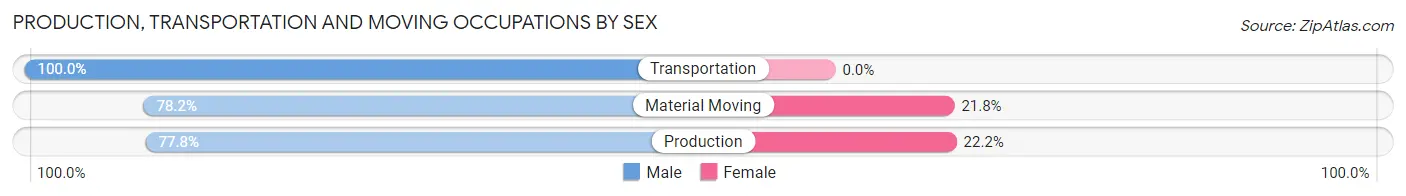
| Occupation | Male | Female |
| Production | 21 (77.8%) | 6 (22.2%) |
| Transportation | 35 (100.0%) | 0 (0.0%) |
| Material Moving | 43 (78.2%) | 12 (21.8%) |
| Total (Category) | 99 (84.6%) | 18 (15.4%) |
| Total (Overall) | 198 (30.8%) | 444 (69.2%) |
Employment Industries by Sex in Richwood
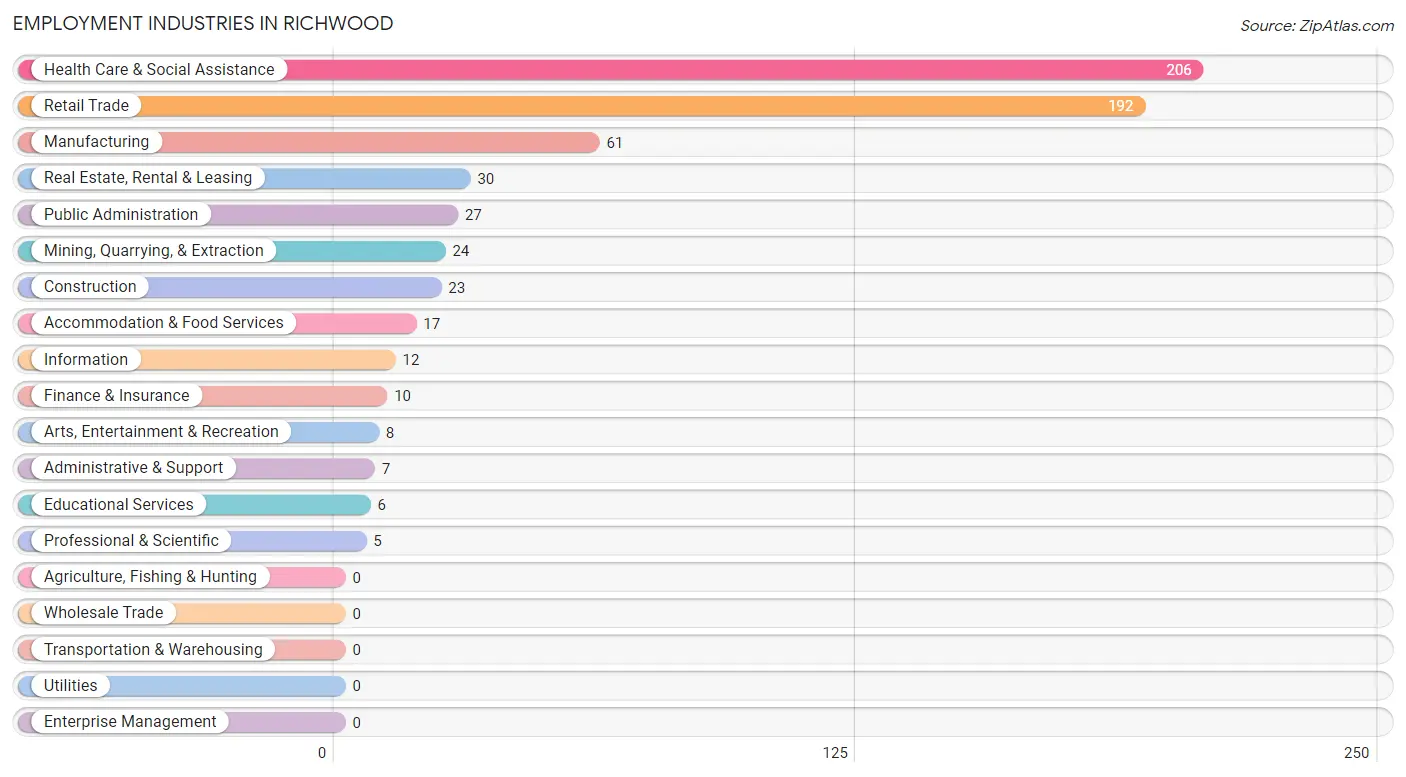
Employment Industries in Richwood
The major employment industries in Richwood include Health Care & Social Assistance (206 | 32.1%), Retail Trade (192 | 29.9%), Manufacturing (61 | 9.5%), Real Estate, Rental & Leasing (30 | 4.7%), and Public Administration (27 | 4.2%).
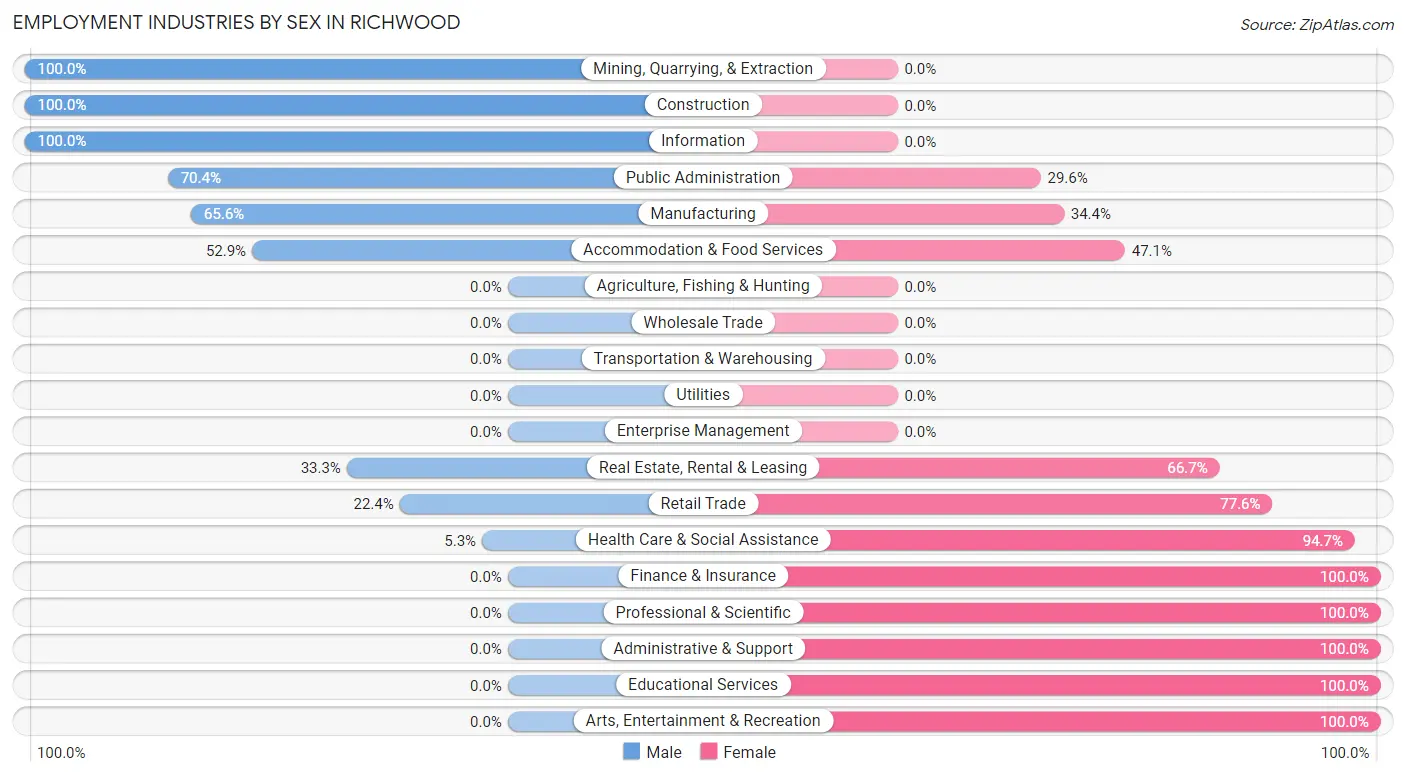
Employment Industries by Sex in Richwood
The Richwood industries that see more men than women are Mining, Quarrying, & Extraction (100.0%), Construction (100.0%), and Information (100.0%), whereas the industries that tend to have a higher number of women are Finance & Insurance (100.0%), Professional & Scientific (100.0%), and Administrative & Support (100.0%).
| Industry | Male | Female |
| Agriculture, Fishing & Hunting | 0 (0.0%) | 0 (0.0%) |
| Mining, Quarrying, & Extraction | 24 (100.0%) | 0 (0.0%) |
| Construction | 23 (100.0%) | 0 (0.0%) |
| Manufacturing | 40 (65.6%) | 21 (34.4%) |
| Wholesale Trade | 0 (0.0%) | 0 (0.0%) |
| Retail Trade | 43 (22.4%) | 149 (77.6%) |
| Transportation & Warehousing | 0 (0.0%) | 0 (0.0%) |
| Utilities | 0 (0.0%) | 0 (0.0%) |
| Information | 12 (100.0%) | 0 (0.0%) |
| Finance & Insurance | 0 (0.0%) | 10 (100.0%) |
| Real Estate, Rental & Leasing | 10 (33.3%) | 20 (66.7%) |
| Professional & Scientific | 0 (0.0%) | 5 (100.0%) |
| Enterprise Management | 0 (0.0%) | 0 (0.0%) |
| Administrative & Support | 0 (0.0%) | 7 (100.0%) |
| Educational Services | 0 (0.0%) | 6 (100.0%) |
| Health Care & Social Assistance | 11 (5.3%) | 195 (94.7%) |
| Arts, Entertainment & Recreation | 0 (0.0%) | 8 (100.0%) |
| Accommodation & Food Services | 9 (52.9%) | 8 (47.1%) |
| Public Administration | 19 (70.4%) | 8 (29.6%) |
| Total | 198 (30.8%) | 444 (69.2%) |
Education in Richwood
School Enrollment in Richwood
The most common levels of schooling among the 456 students in Richwood are elementary school (218 | 47.8%), middle school (98 | 21.5%), and nursery / preschool (43 | 9.4%).
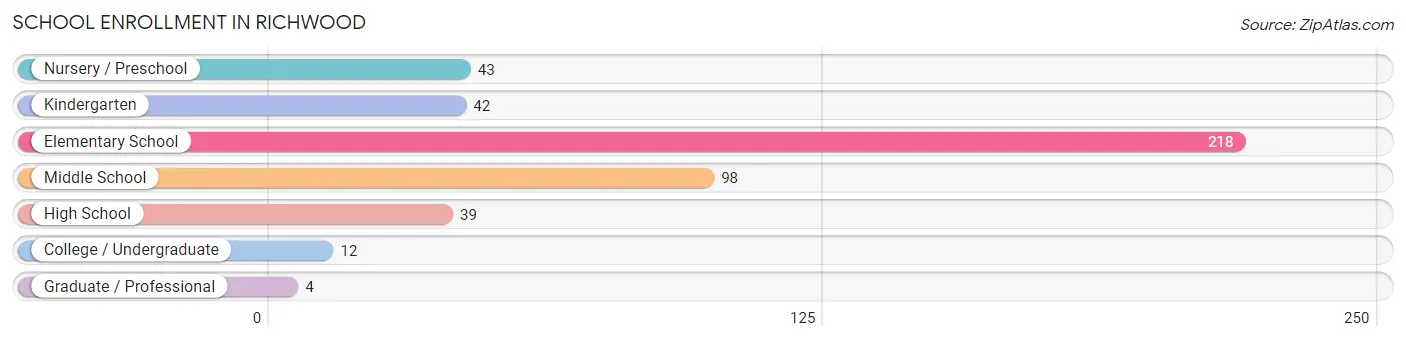
| School Level | # Students | % Students |
| Nursery / Preschool | 43 | 9.4% |
| Kindergarten | 42 | 9.2% |
| Elementary School | 218 | 47.8% |
| Middle School | 98 | 21.5% |
| High School | 39 | 8.6% |
| College / Undergraduate | 12 | 2.6% |
| Graduate / Professional | 4 | 0.9% |
| Total | 456 | 100.0% |
School Enrollment by Age by Funding Source in Richwood
Out of a total of 456 students who are enrolled in schools in Richwood, 9 (2.0%) attend a private institution, while the remaining 447 (98.0%) are enrolled in public schools. The age group of 35 years and over has the highest likelihood of being enrolled in private schools, with 4 (100.0% in the age bracket) enrolled. Conversely, the age group of 3 to 4 year olds has the lowest likelihood of being enrolled in a private school, with 28 (100.0% in the age bracket) attending a public institution.
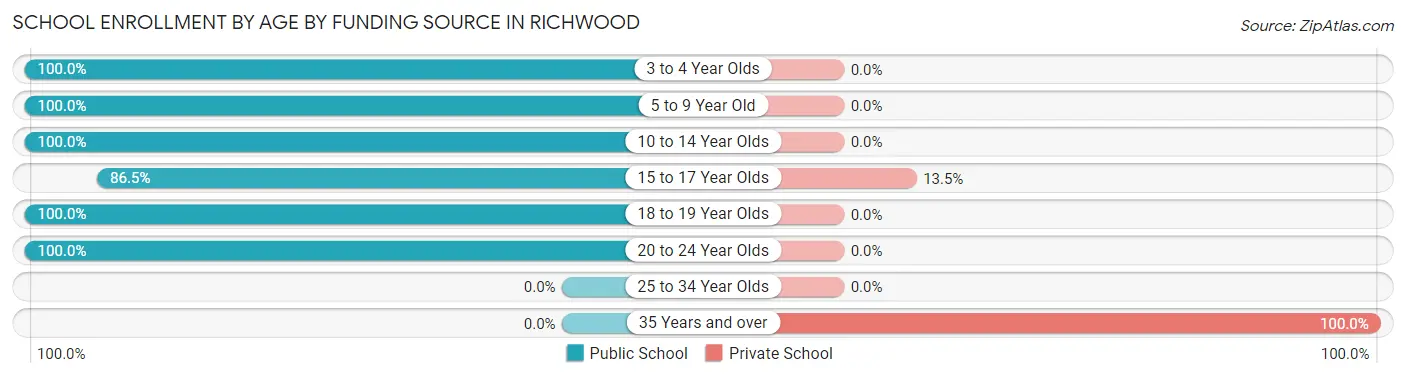
| Age Bracket | Public School | Private School |
| 3 to 4 Year Olds | 28 (100.0%) | 0 (0.0%) |
| 5 to 9 Year Old | 264 (100.0%) | 0 (0.0%) |
| 10 to 14 Year Olds | 93 (100.0%) | 0 (0.0%) |
| 15 to 17 Year Olds | 32 (86.5%) | 5 (13.5%) |
| 18 to 19 Year Olds | 18 (100.0%) | 0 (0.0%) |
| 20 to 24 Year Olds | 12 (100.0%) | 0 (0.0%) |
| 25 to 34 Year Olds | 0 (0.0%) | 0 (0.0%) |
| 35 Years and over | 0 (0.0%) | 4 (100.0%) |
| Total | 447 (98.0%) | 9 (2.0%) |
Educational Attainment by Field of Study in Richwood
Business (78 | 24.7%), education (49 | 15.5%), science & technology (37 | 11.7%), engineering (25 | 7.9%), and social sciences (24 | 7.6%) are the most common fields of study among 316 individuals in Richwood who have obtained a bachelor's degree or higher.
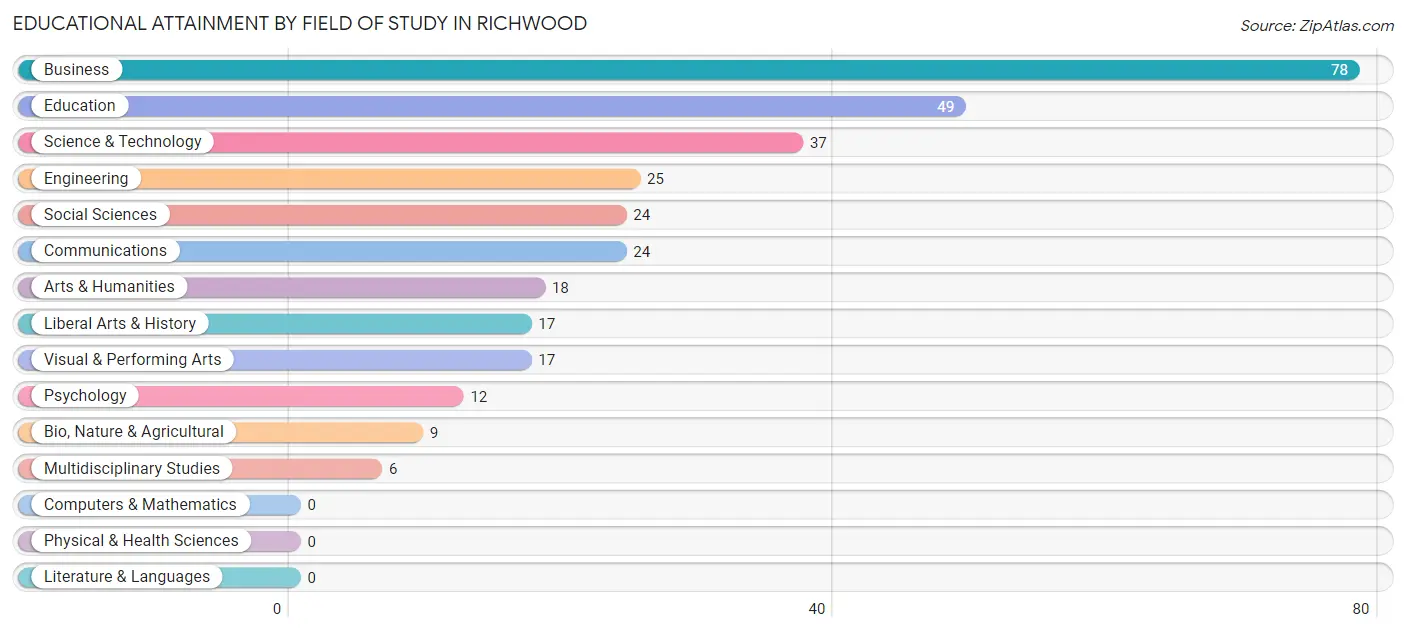
| Field of Study | # Graduates | % Graduates |
| Computers & Mathematics | 0 | 0.0% |
| Bio, Nature & Agricultural | 9 | 2.9% |
| Physical & Health Sciences | 0 | 0.0% |
| Psychology | 12 | 3.8% |
| Social Sciences | 24 | 7.6% |
| Engineering | 25 | 7.9% |
| Multidisciplinary Studies | 6 | 1.9% |
| Science & Technology | 37 | 11.7% |
| Business | 78 | 24.7% |
| Education | 49 | 15.5% |
| Literature & Languages | 0 | 0.0% |
| Liberal Arts & History | 17 | 5.4% |
| Visual & Performing Arts | 17 | 5.4% |
| Communications | 24 | 7.6% |
| Arts & Humanities | 18 | 5.7% |
| Total | 316 | 100.0% |
Transportation & Commute in Richwood
Vehicle Availability by Sex in Richwood
The most prevalent vehicle ownership categories in Richwood are males with 1 vehicle (70, accounting for 35.7%) and females with 1 vehicle (329, making up 15.8%).
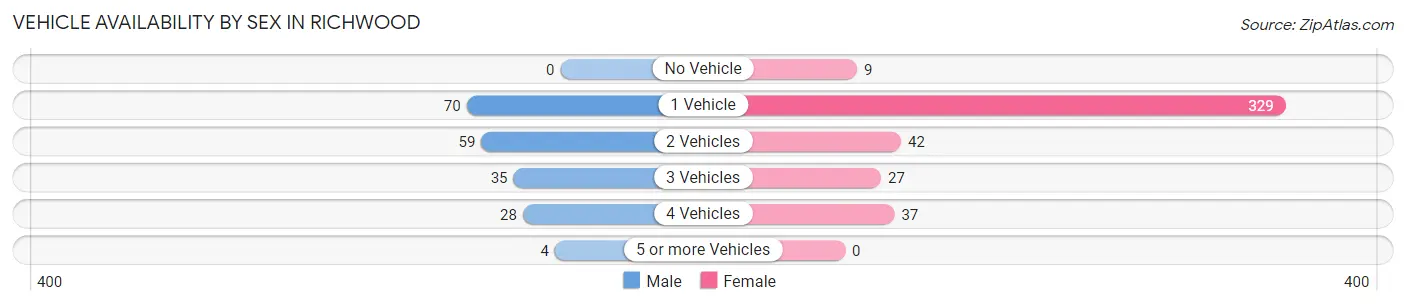
| Vehicles Available | Male | Female |
| No Vehicle | 0 (0.0%) | 9 (2.0%) |
| 1 Vehicle | 70 (35.7%) | 329 (74.1%) |
| 2 Vehicles | 59 (30.1%) | 42 (9.5%) |
| 3 Vehicles | 35 (17.9%) | 27 (6.1%) |
| 4 Vehicles | 28 (14.3%) | 37 (8.3%) |
| 5 or more Vehicles | 4 (2.0%) | 0 (0.0%) |
| Total | 196 (100.0%) | 444 (100.0%) |
Commute Time in Richwood
The most frequently occuring commute durations in Richwood are 30 to 34 minutes (159 commuters, 25.5%), 45 to 59 minutes (118 commuters, 18.9%), and 5 to 9 minutes (102 commuters, 16.4%).
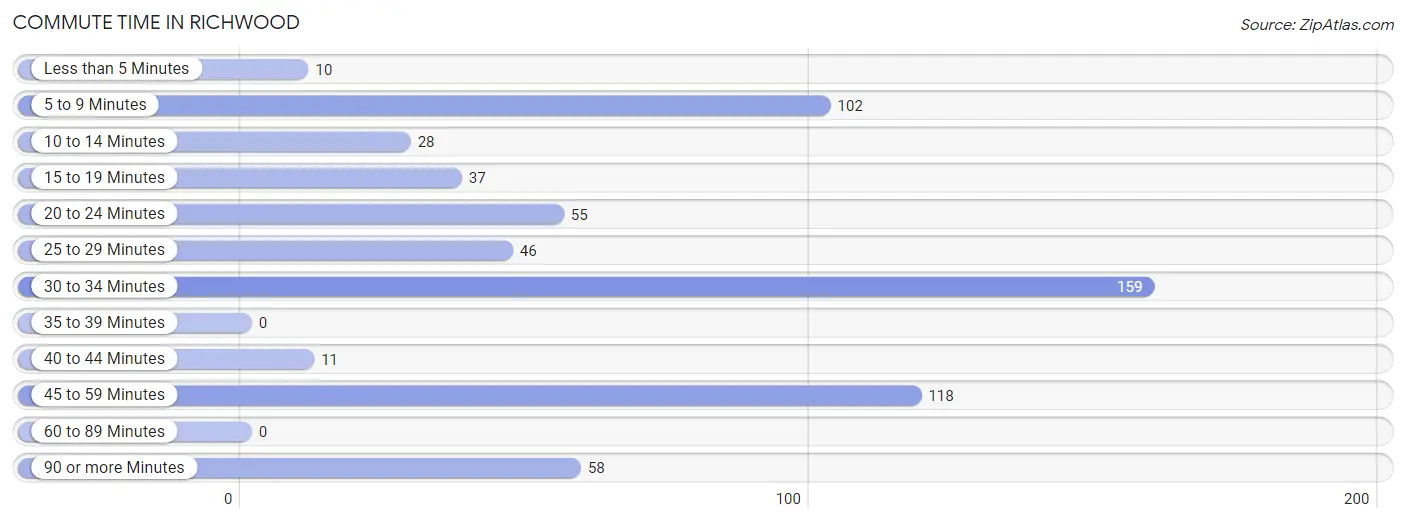
| Commute Time | # Commuters | % Commuters |
| Less than 5 Minutes | 10 | 1.6% |
| 5 to 9 Minutes | 102 | 16.4% |
| 10 to 14 Minutes | 28 | 4.5% |
| 15 to 19 Minutes | 37 | 5.9% |
| 20 to 24 Minutes | 55 | 8.8% |
| 25 to 29 Minutes | 46 | 7.4% |
| 30 to 34 Minutes | 159 | 25.5% |
| 35 to 39 Minutes | 0 | 0.0% |
| 40 to 44 Minutes | 11 | 1.8% |
| 45 to 59 Minutes | 118 | 18.9% |
| 60 to 89 Minutes | 0 | 0.0% |
| 90 or more Minutes | 58 | 9.3% |
Commute Time by Sex in Richwood
The most common commute times in Richwood are 5 to 9 minutes (56 commuters, 29.9%) for males and 30 to 34 minutes (145 commuters, 33.2%) for females.
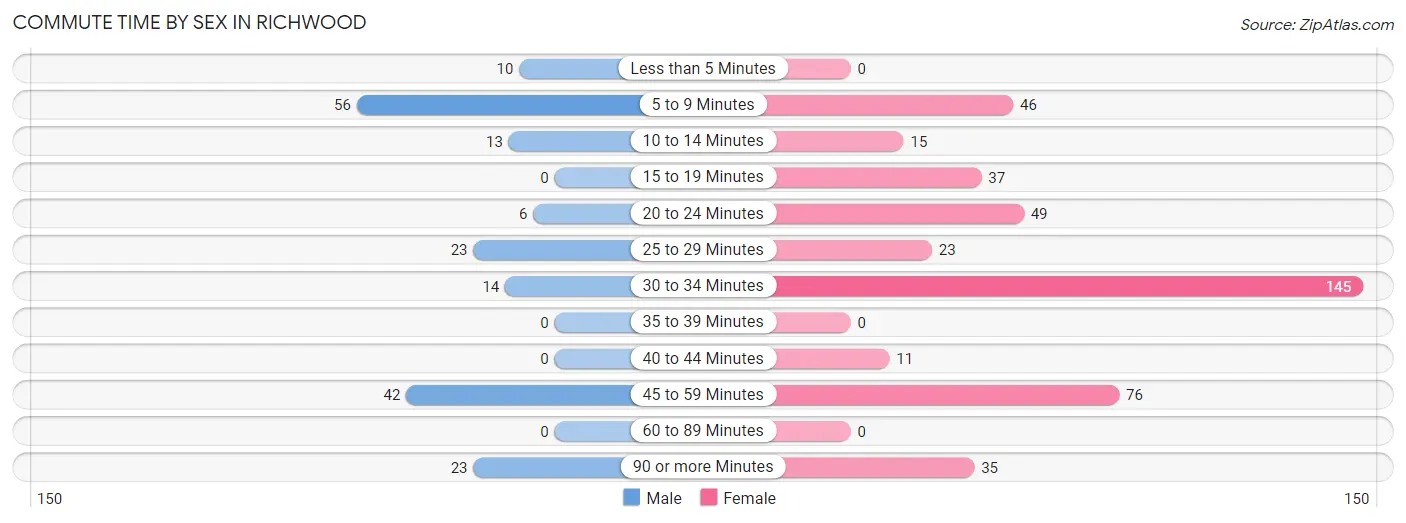
| Commute Time | Male | Female |
| Less than 5 Minutes | 10 (5.3%) | 0 (0.0%) |
| 5 to 9 Minutes | 56 (29.9%) | 46 (10.5%) |
| 10 to 14 Minutes | 13 (7.0%) | 15 (3.4%) |
| 15 to 19 Minutes | 0 (0.0%) | 37 (8.5%) |
| 20 to 24 Minutes | 6 (3.2%) | 49 (11.2%) |
| 25 to 29 Minutes | 23 (12.3%) | 23 (5.3%) |
| 30 to 34 Minutes | 14 (7.5%) | 145 (33.2%) |
| 35 to 39 Minutes | 0 (0.0%) | 0 (0.0%) |
| 40 to 44 Minutes | 0 (0.0%) | 11 (2.5%) |
| 45 to 59 Minutes | 42 (22.5%) | 76 (17.4%) |
| 60 to 89 Minutes | 0 (0.0%) | 0 (0.0%) |
| 90 or more Minutes | 23 (12.3%) | 35 (8.0%) |
Time of Departure to Work by Sex in Richwood
The most frequent times of departure to work in Richwood are 4:00 PM to 11:59 PM (50, 26.7%) for males and 7:00 AM to 7:29 AM (145, 33.2%) for females.
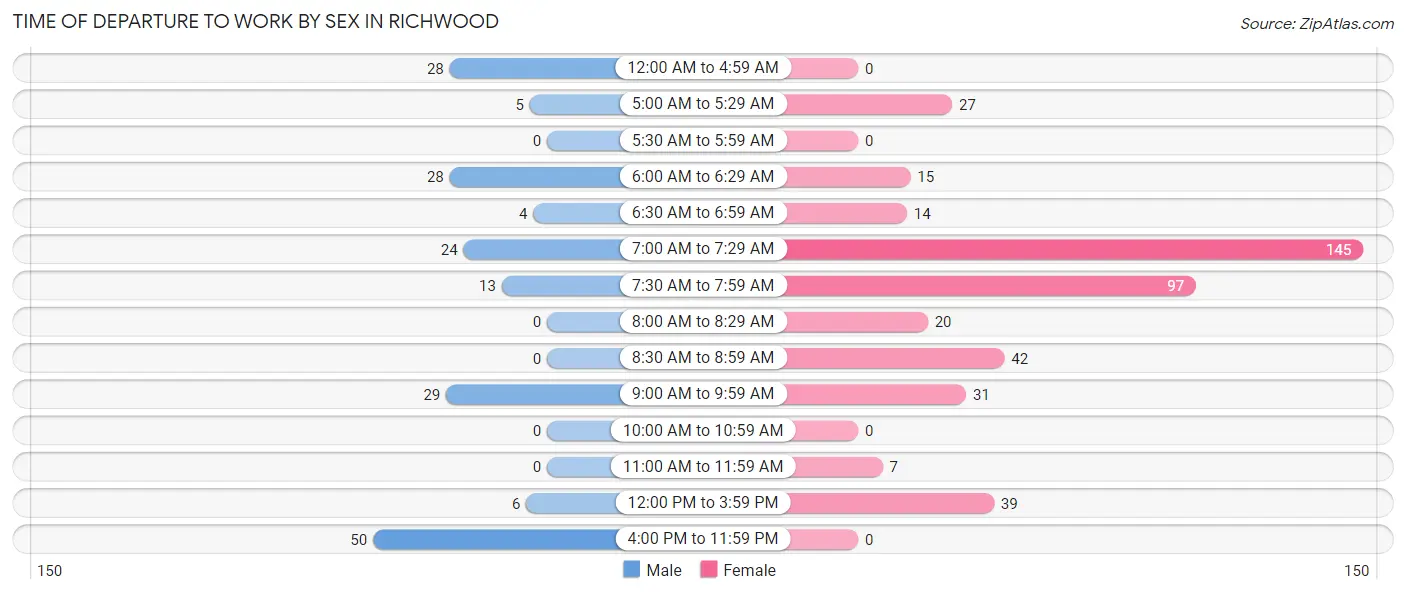
| Time of Departure | Male | Female |
| 12:00 AM to 4:59 AM | 28 (15.0%) | 0 (0.0%) |
| 5:00 AM to 5:29 AM | 5 (2.7%) | 27 (6.2%) |
| 5:30 AM to 5:59 AM | 0 (0.0%) | 0 (0.0%) |
| 6:00 AM to 6:29 AM | 28 (15.0%) | 15 (3.4%) |
| 6:30 AM to 6:59 AM | 4 (2.1%) | 14 (3.2%) |
| 7:00 AM to 7:29 AM | 24 (12.8%) | 145 (33.2%) |
| 7:30 AM to 7:59 AM | 13 (7.0%) | 97 (22.2%) |
| 8:00 AM to 8:29 AM | 0 (0.0%) | 20 (4.6%) |
| 8:30 AM to 8:59 AM | 0 (0.0%) | 42 (9.6%) |
| 9:00 AM to 9:59 AM | 29 (15.5%) | 31 (7.1%) |
| 10:00 AM to 10:59 AM | 0 (0.0%) | 0 (0.0%) |
| 11:00 AM to 11:59 AM | 0 (0.0%) | 7 (1.6%) |
| 12:00 PM to 3:59 PM | 6 (3.2%) | 39 (8.9%) |
| 4:00 PM to 11:59 PM | 50 (26.7%) | 0 (0.0%) |
| Total | 187 (100.0%) | 437 (100.0%) |
Housing Occupancy in Richwood
Occupancy by Ownership in Richwood
Of the total 978 dwellings in Richwood, owner-occupied units account for 742 (75.9%), while renter-occupied units make up 236 (24.1%).
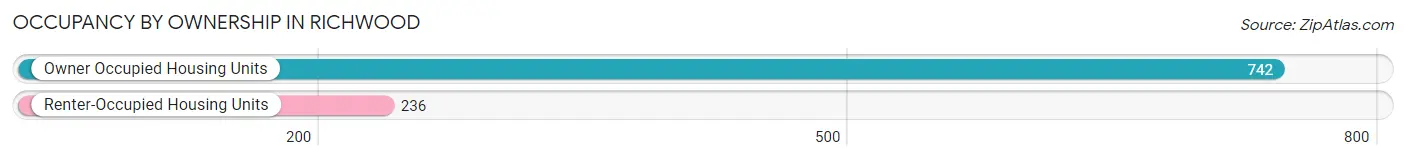
| Occupancy | # Housing Units | % Housing Units |
| Owner Occupied Housing Units | 742 | 75.9% |
| Renter-Occupied Housing Units | 236 | 24.1% |
| Total Occupied Housing Units | 978 | 100.0% |
Occupancy by Household Size in Richwood
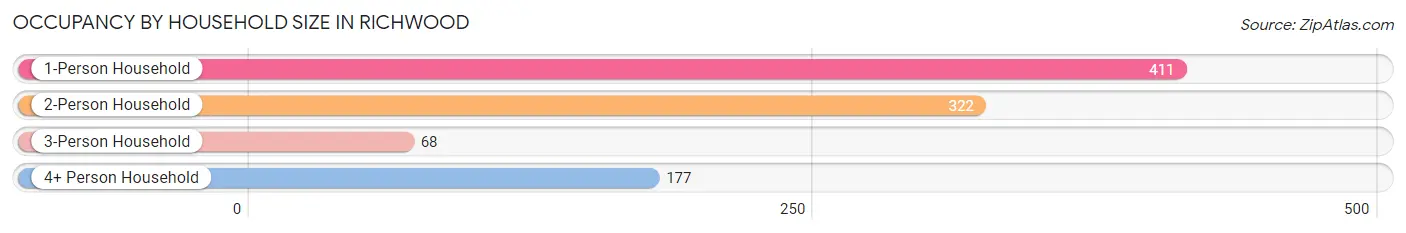
| Household Size | # Housing Units | % Housing Units |
| 1-Person Household | 411 | 42.0% |
| 2-Person Household | 322 | 32.9% |
| 3-Person Household | 68 | 7.0% |
| 4+ Person Household | 177 | 18.1% |
| Total Housing Units | 978 | 100.0% |
Occupancy by Ownership by Household Size in Richwood
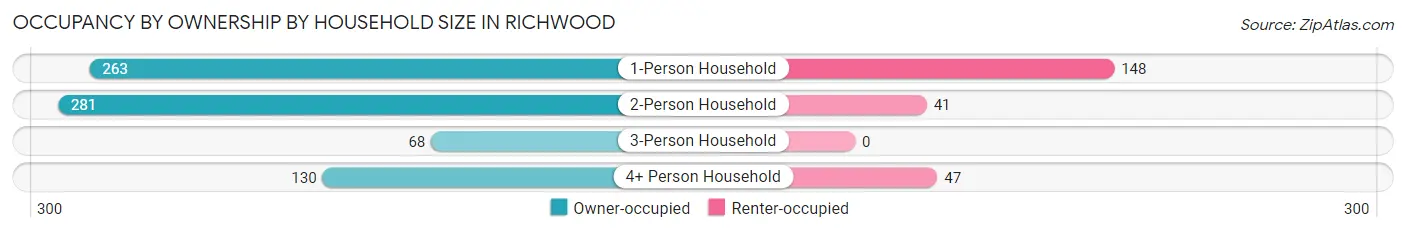
| Household Size | Owner-occupied | Renter-occupied |
| 1-Person Household | 263 (64.0%) | 148 (36.0%) |
| 2-Person Household | 281 (87.3%) | 41 (12.7%) |
| 3-Person Household | 68 (100.0%) | 0 (0.0%) |
| 4+ Person Household | 130 (73.5%) | 47 (26.6%) |
| Total Housing Units | 742 (75.9%) | 236 (24.1%) |
Occupancy by Educational Attainment in Richwood
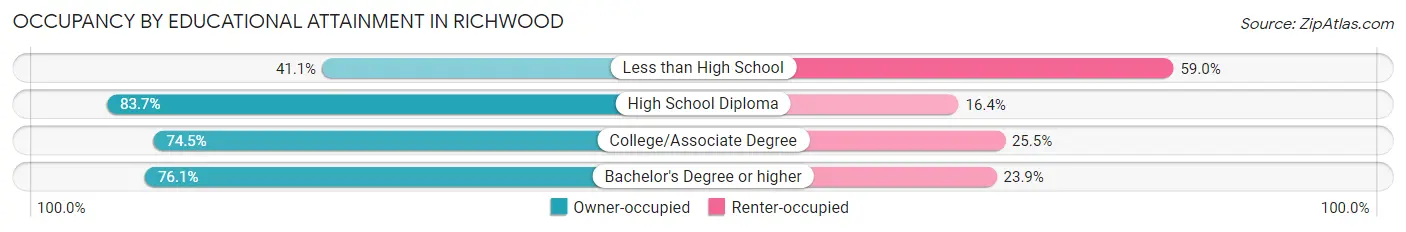
| Household Size | Owner-occupied | Renter-occupied |
| Less than High School | 39 (41.0%) | 56 (59.0%) |
| High School Diploma | 394 (83.7%) | 77 (16.4%) |
| College/Associate Degree | 207 (74.5%) | 71 (25.5%) |
| Bachelor's Degree or higher | 102 (76.1%) | 32 (23.9%) |
Occupancy by Age of Householder in Richwood
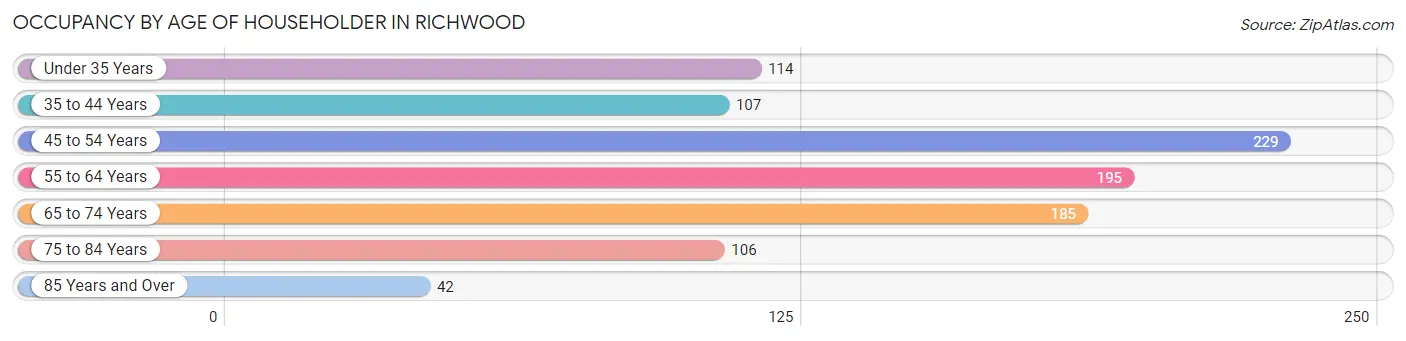
| Age Bracket | # Households | % Households |
| Under 35 Years | 114 | 11.7% |
| 35 to 44 Years | 107 | 10.9% |
| 45 to 54 Years | 229 | 23.4% |
| 55 to 64 Years | 195 | 19.9% |
| 65 to 74 Years | 185 | 18.9% |
| 75 to 84 Years | 106 | 10.8% |
| 85 Years and Over | 42 | 4.3% |
| Total | 978 | 100.0% |
Housing Finances in Richwood
Median Income by Occupancy in Richwood
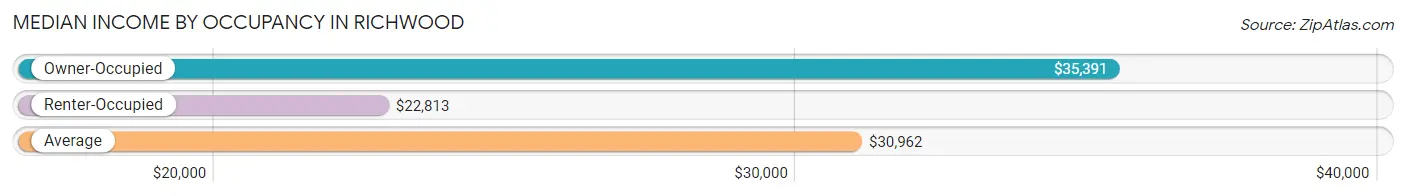
| Occupancy Type | # Households | Median Income |
| Owner-Occupied | 742 (75.9%) | $35,391 |
| Renter-Occupied | 236 (24.1%) | $22,813 |
| Average | 978 (100.0%) | $30,962 |
Occupancy by Householder Income Bracket in Richwood
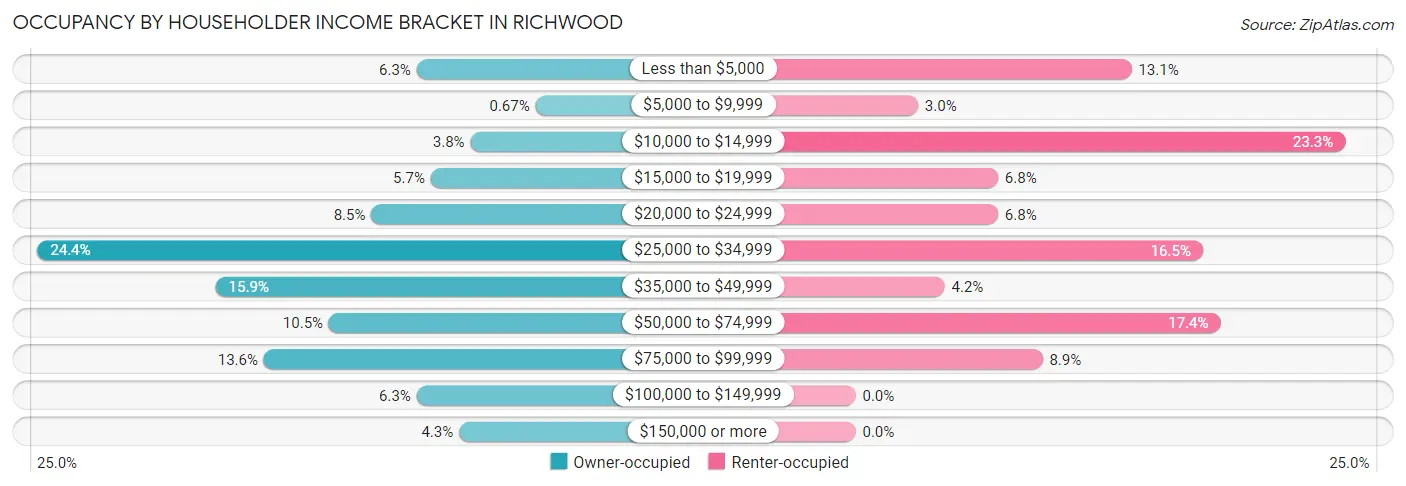
| Income Bracket | Owner-occupied | Renter-occupied |
| Less than $5,000 | 47 (6.3%) | 31 (13.1%) |
| $5,000 to $9,999 | 5 (0.7%) | 7 (3.0%) |
| $10,000 to $14,999 | 28 (3.8%) | 55 (23.3%) |
| $15,000 to $19,999 | 42 (5.7%) | 16 (6.8%) |
| $20,000 to $24,999 | 63 (8.5%) | 16 (6.8%) |
| $25,000 to $34,999 | 181 (24.4%) | 39 (16.5%) |
| $35,000 to $49,999 | 118 (15.9%) | 10 (4.2%) |
| $50,000 to $74,999 | 78 (10.5%) | 41 (17.4%) |
| $75,000 to $99,999 | 101 (13.6%) | 21 (8.9%) |
| $100,000 to $149,999 | 47 (6.3%) | 0 (0.0%) |
| $150,000 or more | 32 (4.3%) | 0 (0.0%) |
| Total | 742 (100.0%) | 236 (100.0%) |
Monthly Housing Cost Tiers in Richwood
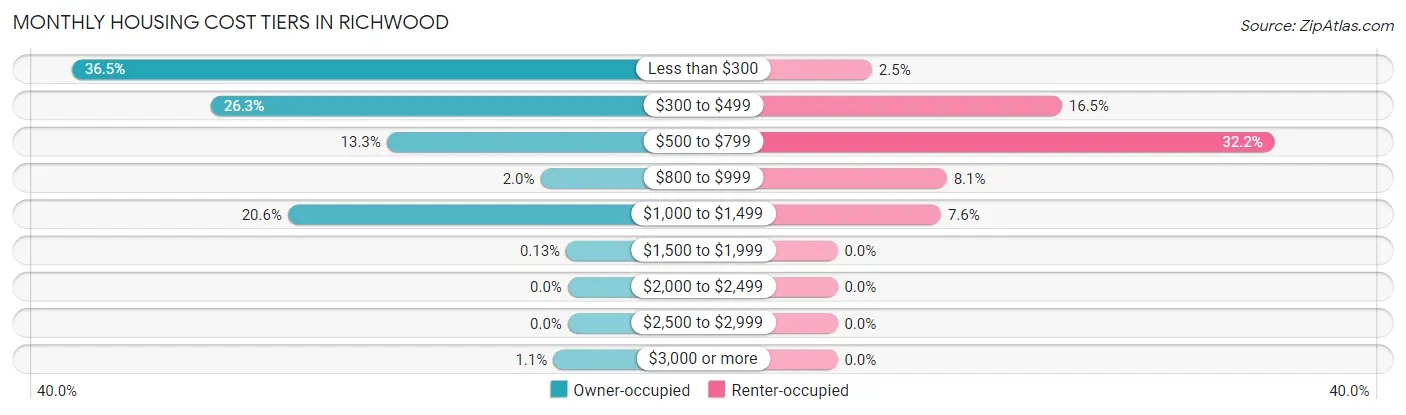
| Monthly Cost | Owner-occupied | Renter-occupied |
| Less than $300 | 271 (36.5%) | 6 (2.5%) |
| $300 to $499 | 195 (26.3%) | 39 (16.5%) |
| $500 to $799 | 99 (13.3%) | 76 (32.2%) |
| $800 to $999 | 15 (2.0%) | 19 (8.1%) |
| $1,000 to $1,499 | 153 (20.6%) | 18 (7.6%) |
| $1,500 to $1,999 | 1 (0.1%) | 0 (0.0%) |
| $2,000 to $2,499 | 0 (0.0%) | 0 (0.0%) |
| $2,500 to $2,999 | 0 (0.0%) | 0 (0.0%) |
| $3,000 or more | 8 (1.1%) | 0 (0.0%) |
| Total | 742 (100.0%) | 236 (100.0%) |
Physical Housing Characteristics in Richwood
Housing Structures in Richwood
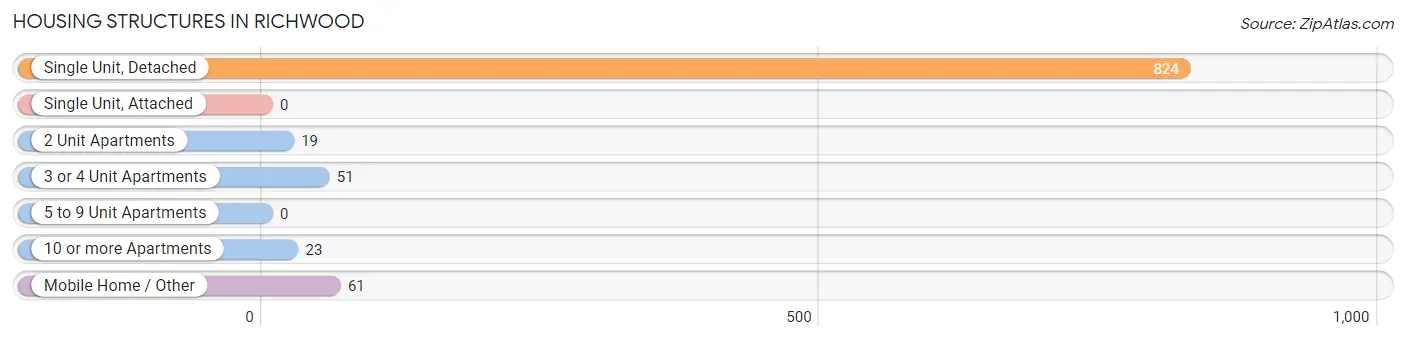
| Structure Type | # Housing Units | % Housing Units |
| Single Unit, Detached | 824 | 84.3% |
| Single Unit, Attached | 0 | 0.0% |
| 2 Unit Apartments | 19 | 1.9% |
| 3 or 4 Unit Apartments | 51 | 5.2% |
| 5 to 9 Unit Apartments | 0 | 0.0% |
| 10 or more Apartments | 23 | 2.4% |
| Mobile Home / Other | 61 | 6.2% |
| Total | 978 | 100.0% |
Housing Structures by Occupancy in Richwood
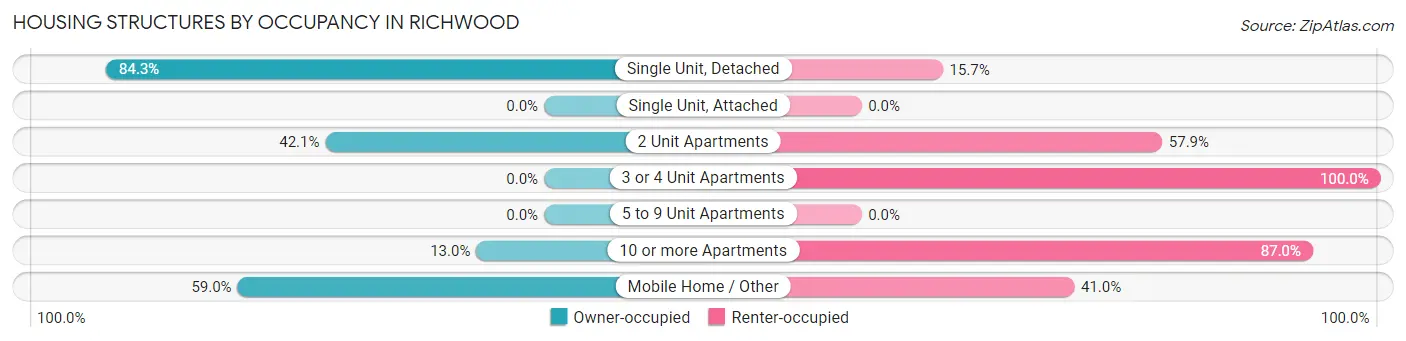
| Structure Type | Owner-occupied | Renter-occupied |
| Single Unit, Detached | 695 (84.3%) | 129 (15.7%) |
| Single Unit, Attached | 0 (0.0%) | 0 (0.0%) |
| 2 Unit Apartments | 8 (42.1%) | 11 (57.9%) |
| 3 or 4 Unit Apartments | 0 (0.0%) | 51 (100.0%) |
| 5 to 9 Unit Apartments | 0 (0.0%) | 0 (0.0%) |
| 10 or more Apartments | 3 (13.0%) | 20 (87.0%) |
| Mobile Home / Other | 36 (59.0%) | 25 (41.0%) |
| Total | 742 (75.9%) | 236 (24.1%) |
Housing Structures by Number of Rooms in Richwood
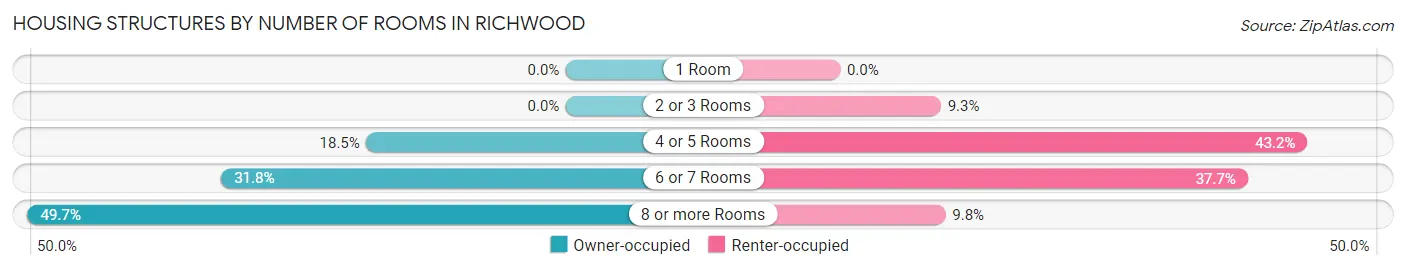
| Number of Rooms | Owner-occupied | Renter-occupied |
| 1 Room | 0 (0.0%) | 0 (0.0%) |
| 2 or 3 Rooms | 0 (0.0%) | 22 (9.3%) |
| 4 or 5 Rooms | 137 (18.5%) | 102 (43.2%) |
| 6 or 7 Rooms | 236 (31.8%) | 89 (37.7%) |
| 8 or more Rooms | 369 (49.7%) | 23 (9.8%) |
| Total | 742 (100.0%) | 236 (100.0%) |
Housing Structure by Heating Type in Richwood
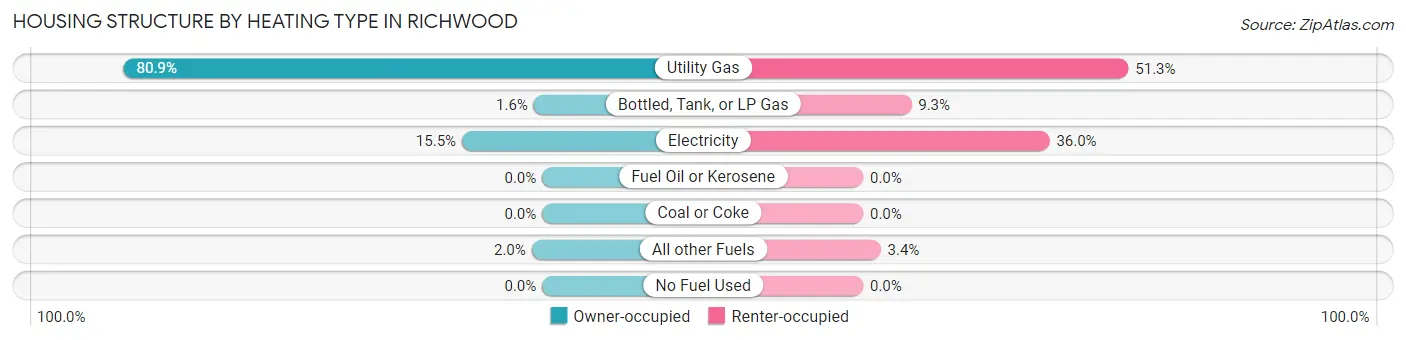
| Heating Type | Owner-occupied | Renter-occupied |
| Utility Gas | 600 (80.9%) | 121 (51.3%) |
| Bottled, Tank, or LP Gas | 12 (1.6%) | 22 (9.3%) |
| Electricity | 115 (15.5%) | 85 (36.0%) |
| Fuel Oil or Kerosene | 0 (0.0%) | 0 (0.0%) |
| Coal or Coke | 0 (0.0%) | 0 (0.0%) |
| All other Fuels | 15 (2.0%) | 8 (3.4%) |
| No Fuel Used | 0 (0.0%) | 0 (0.0%) |
| Total | 742 (100.0%) | 236 (100.0%) |
Household Vehicle Usage in Richwood
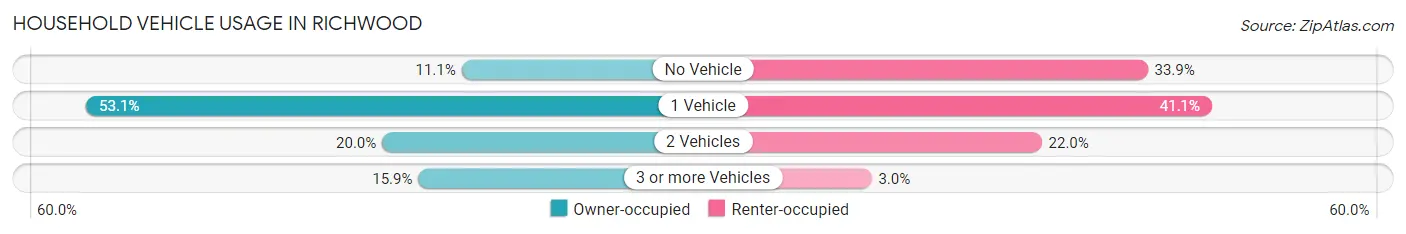
| Vehicles per Household | Owner-occupied | Renter-occupied |
| No Vehicle | 82 (11.1%) | 80 (33.9%) |
| 1 Vehicle | 394 (53.1%) | 97 (41.1%) |
| 2 Vehicles | 148 (20.0%) | 52 (22.0%) |
| 3 or more Vehicles | 118 (15.9%) | 7 (3.0%) |
| Total | 742 (100.0%) | 236 (100.0%) |
Real Estate & Mortgages in Richwood
Real Estate and Mortgage Overview in Richwood
| Characteristic | Without Mortgage | With Mortgage |
| Housing Units | 538 | 204 |
| Median Property Value | $54,700 | $108,200 |
| Median Household Income | $43,200 | $0 |
| Monthly Housing Costs | $300 | $0 |
| Real Estate Taxes | $300 | $4 |
Property Value by Mortgage Status in Richwood
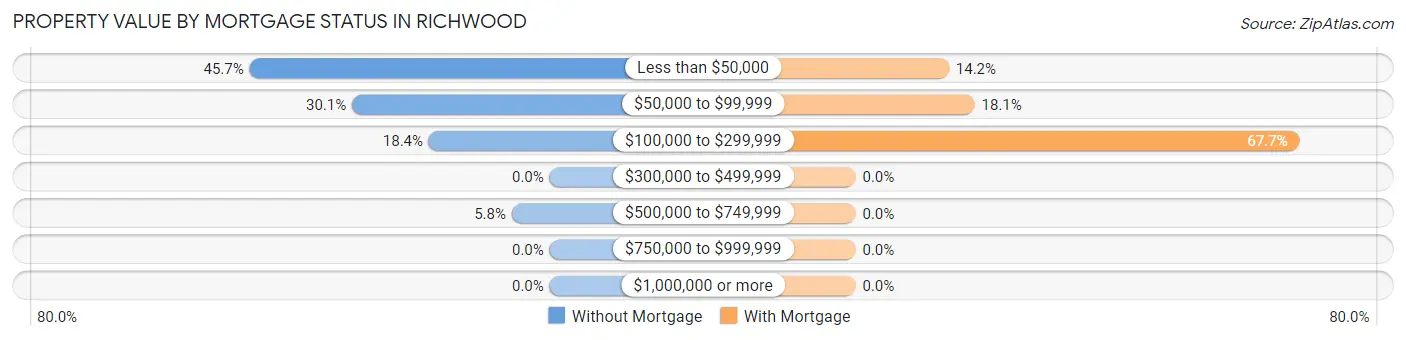
| Property Value | Without Mortgage | With Mortgage |
| Less than $50,000 | 246 (45.7%) | 29 (14.2%) |
| $50,000 to $99,999 | 162 (30.1%) | 37 (18.1%) |
| $100,000 to $299,999 | 99 (18.4%) | 138 (67.6%) |
| $300,000 to $499,999 | 0 (0.0%) | 0 (0.0%) |
| $500,000 to $749,999 | 31 (5.8%) | 0 (0.0%) |
| $750,000 to $999,999 | 0 (0.0%) | 0 (0.0%) |
| $1,000,000 or more | 0 (0.0%) | 0 (0.0%) |
| Total | 538 (100.0%) | 204 (100.0%) |
Household Income by Mortgage Status in Richwood
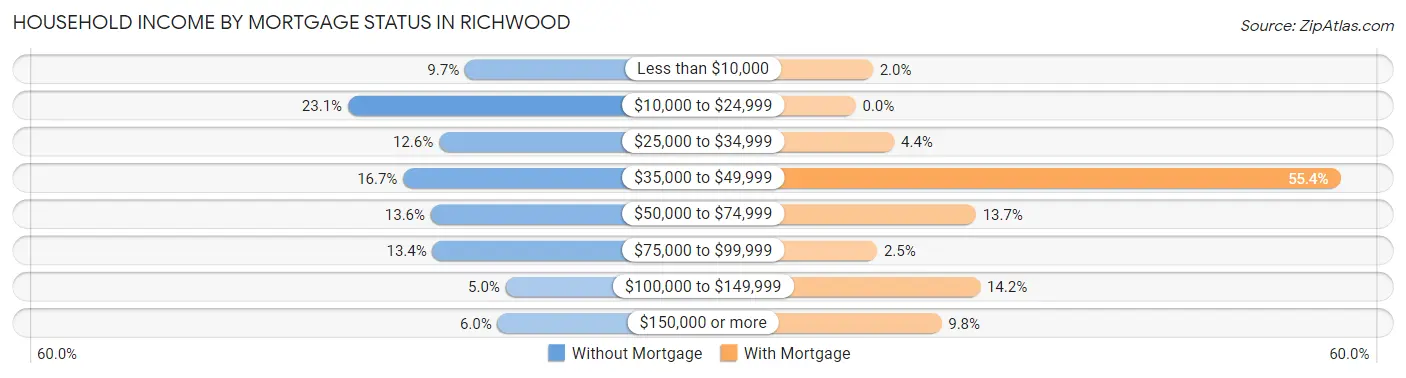
| Household Income | Without Mortgage | With Mortgage |
| Less than $10,000 | 52 (9.7%) | 4 (2.0%) |
| $10,000 to $24,999 | 124 (23.1%) | 0 (0.0%) |
| $25,000 to $34,999 | 68 (12.6%) | 9 (4.4%) |
| $35,000 to $49,999 | 90 (16.7%) | 113 (55.4%) |
| $50,000 to $74,999 | 73 (13.6%) | 28 (13.7%) |
| $75,000 to $99,999 | 72 (13.4%) | 5 (2.5%) |
| $100,000 to $149,999 | 27 (5.0%) | 29 (14.2%) |
| $150,000 or more | 32 (5.9%) | 20 (9.8%) |
| Total | 538 (100.0%) | 204 (100.0%) |
Property Value to Household Income Ratio in Richwood
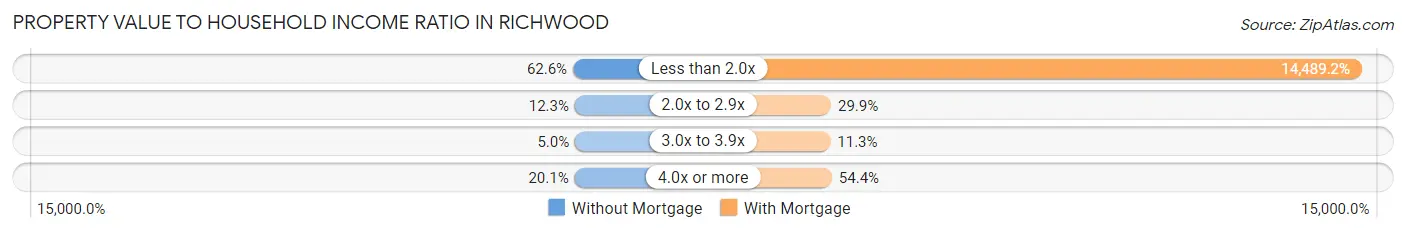
| Value-to-Income Ratio | Without Mortgage | With Mortgage |
| Less than 2.0x | 337 (62.6%) | 29,558 (14,489.2%) |
| 2.0x to 2.9x | 66 (12.3%) | 61 (29.9%) |
| 3.0x to 3.9x | 27 (5.0%) | 23 (11.3%) |
| 4.0x or more | 108 (20.1%) | 111 (54.4%) |
| Total | 538 (100.0%) | 204 (100.0%) |
Real Estate Taxes by Mortgage Status in Richwood
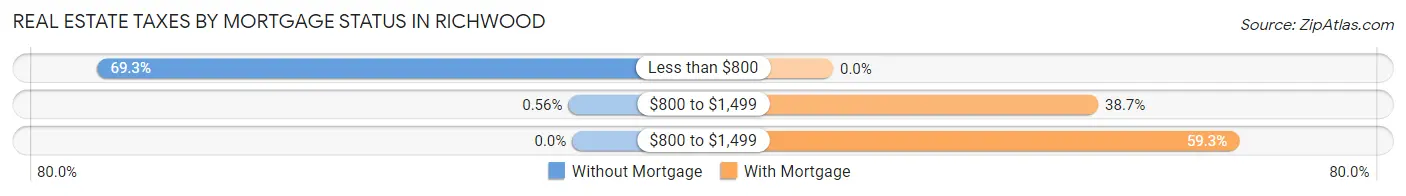
| Property Taxes | Without Mortgage | With Mortgage |
| Less than $800 | 373 (69.3%) | 0 (0.0%) |
| $800 to $1,499 | 3 (0.6%) | 79 (38.7%) |
| $800 to $1,499 | 0 (0.0%) | 121 (59.3%) |
| Total | 538 (100.0%) | 204 (100.0%) |
Health & Disability in Richwood
Health Insurance Coverage by Age in Richwood
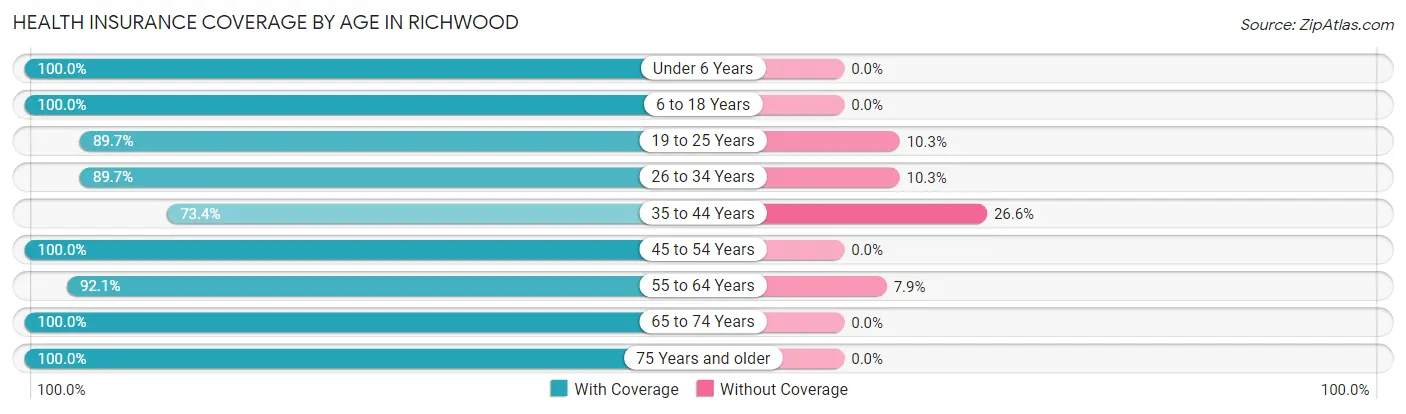
| Age Bracket | With Coverage | Without Coverage |
| Under 6 Years | 113 (100.0%) | 0 (0.0%) |
| 6 to 18 Years | 413 (100.0%) | 0 (0.0%) |
| 19 to 25 Years | 52 (89.7%) | 6 (10.3%) |
| 26 to 34 Years | 296 (89.7%) | 34 (10.3%) |
| 35 to 44 Years | 276 (73.4%) | 100 (26.6%) |
| 45 to 54 Years | 297 (100.0%) | 0 (0.0%) |
| 55 to 64 Years | 291 (92.1%) | 25 (7.9%) |
| 65 to 74 Years | 373 (100.0%) | 0 (0.0%) |
| 75 Years and older | 214 (100.0%) | 0 (0.0%) |
| Total | 2,325 (93.4%) | 165 (6.6%) |
Health Insurance Coverage by Citizenship Status in Richwood
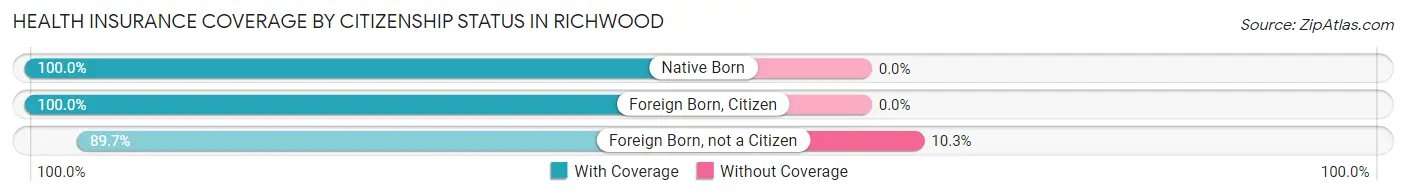
| Citizenship Status | With Coverage | Without Coverage |
| Native Born | 113 (100.0%) | 0 (0.0%) |
| Foreign Born, Citizen | 413 (100.0%) | 0 (0.0%) |
| Foreign Born, not a Citizen | 52 (89.7%) | 6 (10.3%) |
Health Insurance Coverage by Household Income in Richwood
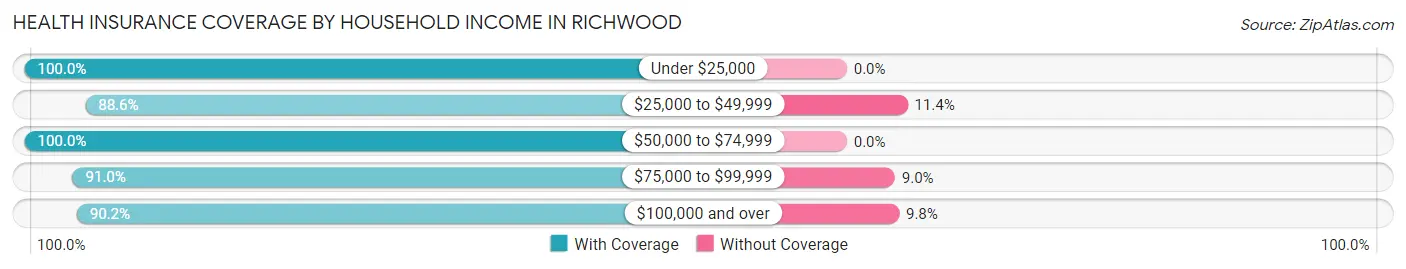
| Household Income | With Coverage | Without Coverage |
| Under $25,000 | 480 (100.0%) | 0 (0.0%) |
| $25,000 to $49,999 | 779 (88.6%) | 100 (11.4%) |
| $50,000 to $74,999 | 432 (100.0%) | 0 (0.0%) |
| $75,000 to $99,999 | 455 (91.0%) | 45 (9.0%) |
| $100,000 and over | 175 (90.2%) | 19 (9.8%) |
Public vs Private Health Insurance Coverage by Age in Richwood
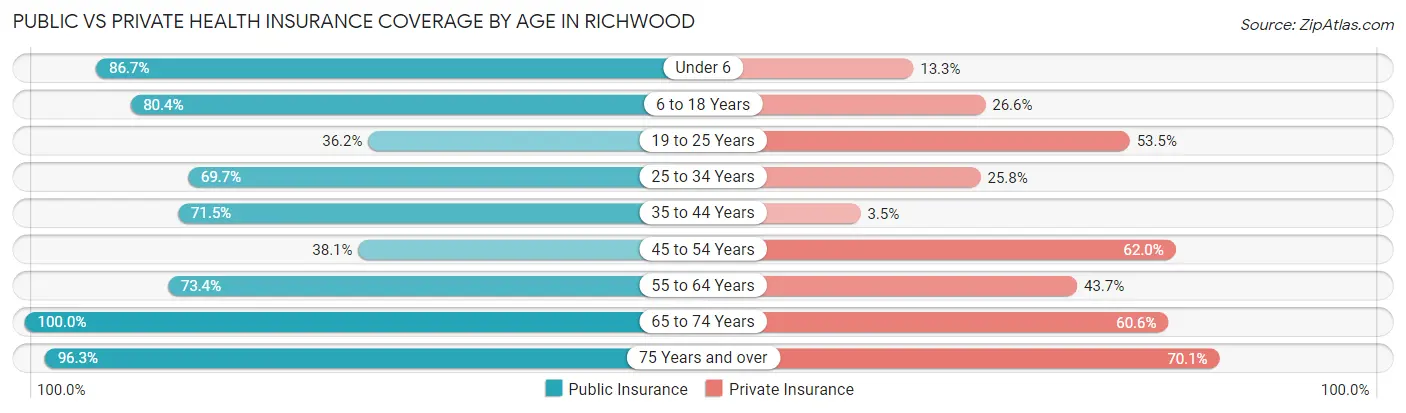
| Age Bracket | Public Insurance | Private Insurance |
| Under 6 | 98 (86.7%) | 15 (13.3%) |
| 6 to 18 Years | 332 (80.4%) | 110 (26.6%) |
| 19 to 25 Years | 21 (36.2%) | 31 (53.4%) |
| 25 to 34 Years | 230 (69.7%) | 85 (25.8%) |
| 35 to 44 Years | 269 (71.5%) | 13 (3.5%) |
| 45 to 54 Years | 113 (38.1%) | 184 (62.0%) |
| 55 to 64 Years | 232 (73.4%) | 138 (43.7%) |
| 65 to 74 Years | 373 (100.0%) | 226 (60.6%) |
| 75 Years and over | 206 (96.3%) | 150 (70.1%) |
| Total | 1,874 (75.3%) | 952 (38.2%) |
Disability Status by Sex by Age in Richwood
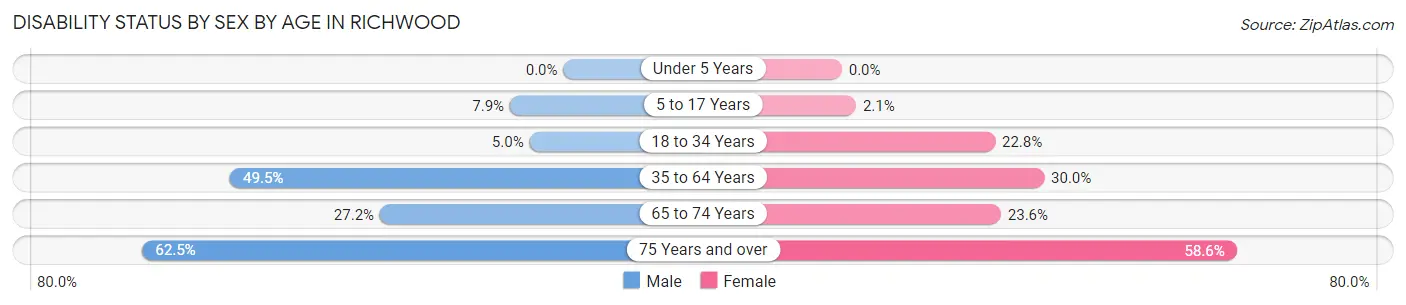
| Age Bracket | Male | Female |
| Under 5 Years | 0 (0.0%) | 0 (0.0%) |
| 5 to 17 Years | 13 (7.9%) | 5 (2.1%) |
| 18 to 34 Years | 8 (5.0%) | 58 (22.8%) |
| 35 to 64 Years | 234 (49.5%) | 155 (30.0%) |
| 65 to 74 Years | 67 (27.2%) | 30 (23.6%) |
| 75 Years and over | 25 (62.5%) | 102 (58.6%) |
Disability Class by Sex by Age in Richwood
Disability Class: Hearing Difficulty
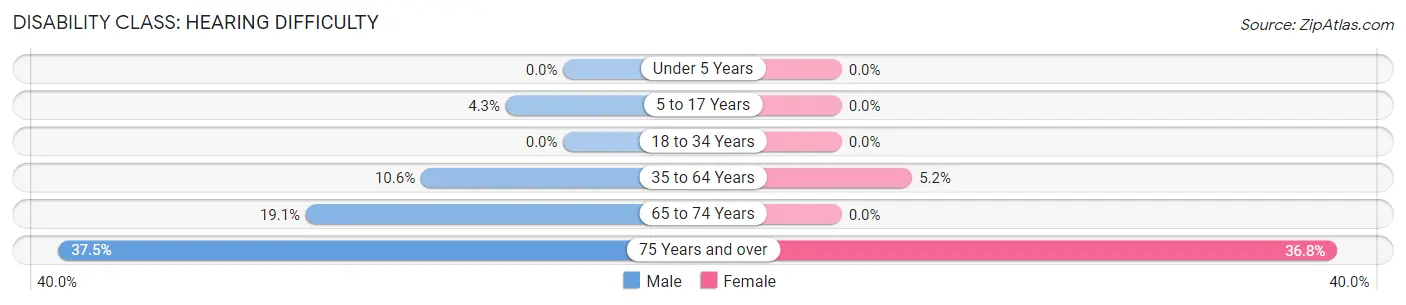
| Age Bracket | Male | Female |
| Under 5 Years | 0 (0.0%) | 0 (0.0%) |
| 5 to 17 Years | 7 (4.3%) | 0 (0.0%) |
| 18 to 34 Years | 0 (0.0%) | 0 (0.0%) |
| 35 to 64 Years | 50 (10.6%) | 27 (5.2%) |
| 65 to 74 Years | 47 (19.1%) | 0 (0.0%) |
| 75 Years and over | 15 (37.5%) | 64 (36.8%) |
Disability Class: Vision Difficulty
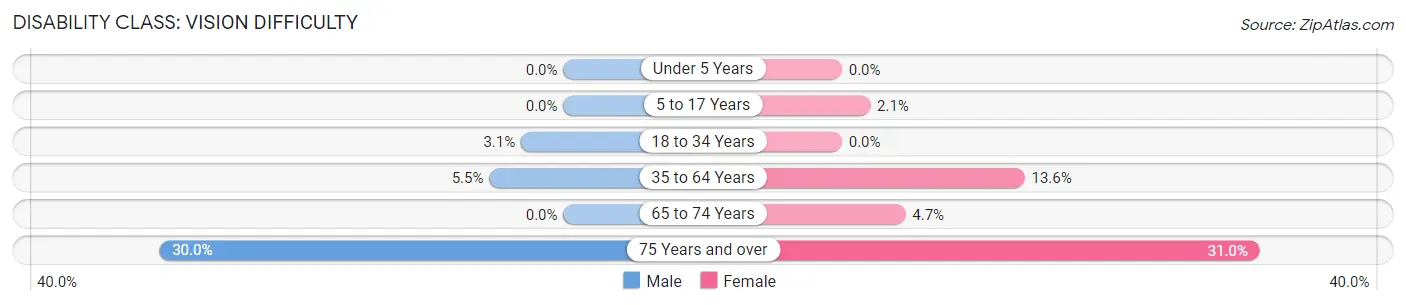
| Age Bracket | Male | Female |
| Under 5 Years | 0 (0.0%) | 0 (0.0%) |
| 5 to 17 Years | 0 (0.0%) | 5 (2.1%) |
| 18 to 34 Years | 5 (3.1%) | 0 (0.0%) |
| 35 to 64 Years | 26 (5.5%) | 70 (13.6%) |
| 65 to 74 Years | 0 (0.0%) | 6 (4.7%) |
| 75 Years and over | 12 (30.0%) | 54 (31.0%) |
Disability Class: Cognitive Difficulty
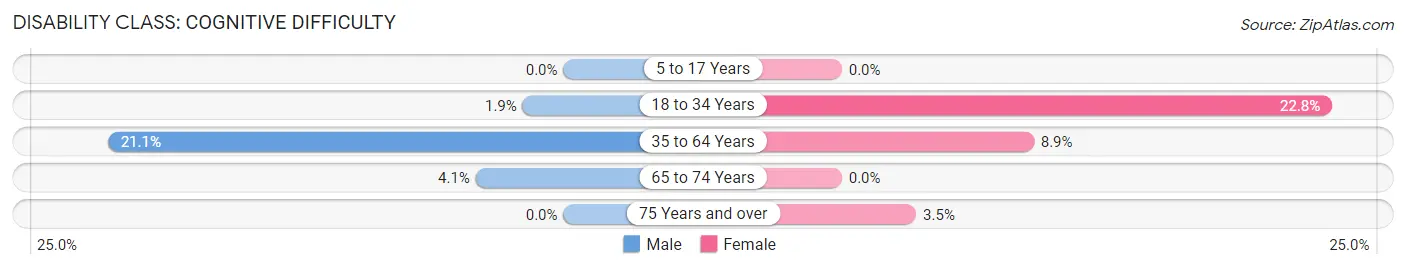
| Age Bracket | Male | Female |
| 5 to 17 Years | 0 (0.0%) | 0 (0.0%) |
| 18 to 34 Years | 3 (1.9%) | 58 (22.8%) |
| 35 to 64 Years | 100 (21.1%) | 46 (8.9%) |
| 65 to 74 Years | 10 (4.1%) | 0 (0.0%) |
| 75 Years and over | 0 (0.0%) | 6 (3.5%) |
Disability Class: Ambulatory Difficulty
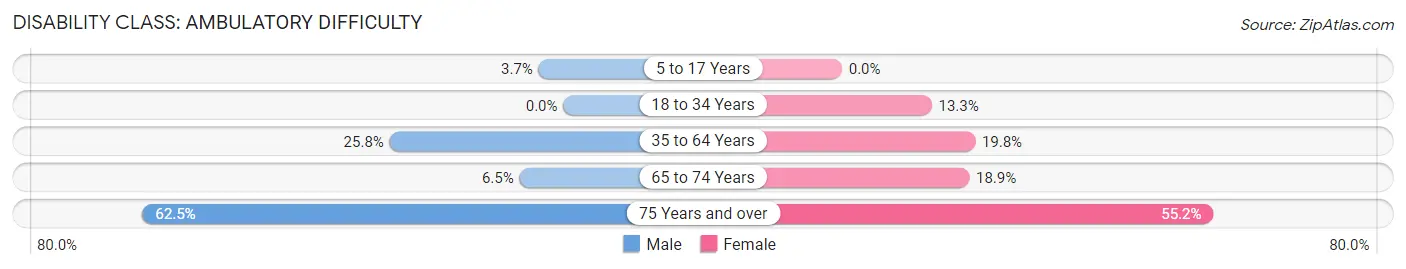
| Age Bracket | Male | Female |
| 5 to 17 Years | 6 (3.7%) | 0 (0.0%) |
| 18 to 34 Years | 0 (0.0%) | 34 (13.3%) |
| 35 to 64 Years | 122 (25.8%) | 102 (19.8%) |
| 65 to 74 Years | 16 (6.5%) | 24 (18.9%) |
| 75 Years and over | 25 (62.5%) | 96 (55.2%) |
Disability Class: Self-Care Difficulty
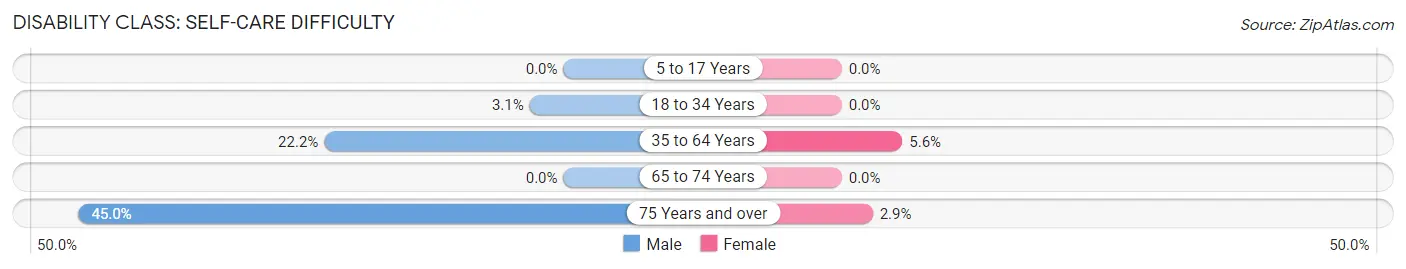
| Age Bracket | Male | Female |
| 5 to 17 Years | 0 (0.0%) | 0 (0.0%) |
| 18 to 34 Years | 5 (3.1%) | 0 (0.0%) |
| 35 to 64 Years | 105 (22.2%) | 29 (5.6%) |
| 65 to 74 Years | 0 (0.0%) | 0 (0.0%) |
| 75 Years and over | 18 (45.0%) | 5 (2.9%) |
Technology Access in Richwood
Computing Device Access in Richwood
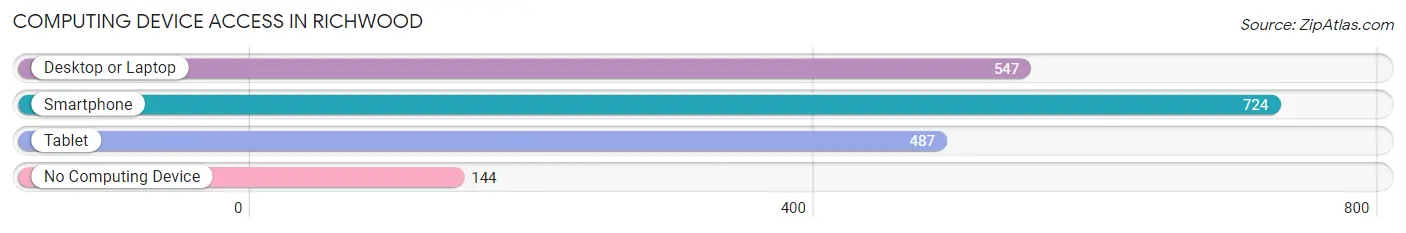
| Device Type | # Households | % Households |
| Desktop or Laptop | 547 | 55.9% |
| Smartphone | 724 | 74.0% |
| Tablet | 487 | 49.8% |
| No Computing Device | 144 | 14.7% |
| Total | 978 | 100.0% |
Internet Access in Richwood
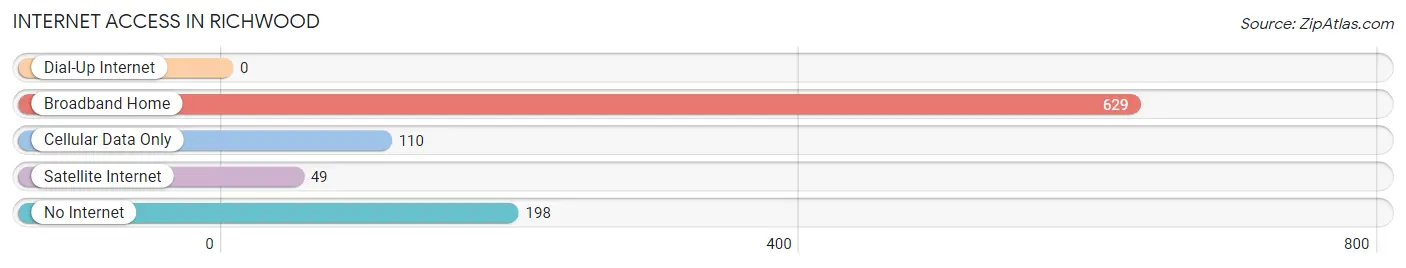
| Internet Type | # Households | % Households |
| Dial-Up Internet | 0 | 0.0% |
| Broadband Home | 629 | 64.3% |
| Cellular Data Only | 110 | 11.3% |
| Satellite Internet | 49 | 5.0% |
| No Internet | 198 | 20.3% |
| Total | 978 | 100.0% |
Richwood Summary
Richwood, West Virginia is a small town located in Nicholas County, in the Appalachian Mountains of West Virginia. It is situated at the confluence of the Cherry and Williams Rivers, and is the county seat of Nicholas County. Richwood has a population of 2,477 people, according to the 2010 census.
History
Richwood was founded in 1883 by the West Virginia Central and Pittsburgh Railway. The town was named after the nearby Richwood Creek, which was named for the abundance of wild raspberries that grew along its banks. The town was incorporated in 1891, and was the first town in Nicholas County to be incorporated.
The town was originally a logging and coal mining town, and the first coal mine in the area was opened in 1884. The coal industry was the main source of employment for the town until the 1950s, when the coal industry began to decline. The town was also home to a number of sawmills, which provided lumber for the local area.
In the early 1900s, Richwood was a popular tourist destination, due to its proximity to the Monongahela National Forest. The town was home to a number of resorts, including the Richwood Hotel, which was built in 1910. The hotel was destroyed by fire in the 1950s, but the town still retains its resort atmosphere.
Geography
Richwood is located in the Appalachian Mountains of West Virginia, in Nicholas County. The town is situated at the confluence of the Cherry and Williams Rivers. The town is surrounded by the Monongahela National Forest, and is located near the Cranberry Glades Botanical Area.
The town has a total area of 1.2 square miles, all of which is land. The town is located at an elevation of 1,890 feet above sea level.
Economy
Richwood’s economy is largely based on tourism and outdoor recreation. The town is home to a number of resorts, including the Richwood Hotel, which was built in 1910. The town is also home to a number of outdoor recreation businesses, such as fishing and hunting guides, and outfitters.
The town is also home to a number of small businesses, including restaurants, retail stores, and service businesses. The town is also home to a number of manufacturing businesses, including a furniture factory and a woodworking shop.
Demographics
According to the 2010 census, Richwood has a population of 2,477 people. The town has a median household income of $25,972, and a median family income of $31,250. The town has a poverty rate of 24.3%, and a high school graduation rate of 79.3%.
The town is predominantly white, with 91.3% of the population identifying as white. The town also has a small African American population, with 4.2% of the population identifying as African American. The town also has a small Hispanic population, with 1.2% of the population identifying as Hispanic or Latino.
Conclusion
Richwood, West Virginia is a small town located in the Appalachian Mountains of West Virginia. The town was founded in 1883, and was originally a logging and coal mining town. The town is now largely based on tourism and outdoor recreation, and is home to a number of resorts and small businesses. The town has a population of 2,477 people, and is predominantly white, with 91.3% of the population identifying as white. The town has a median household income of $25,972, and a poverty rate of 24.3%.
Common Questions
What is Per Capita Income in Richwood?
Per Capita income in Richwood is $20,572.
What is the Median Family Income in Richwood?
Median Family Income in Richwood is $58,889.
What is the Median Household income in Richwood?
Median Household Income in Richwood is $30,962.
What is Income or Wage Gap in Richwood?
Income or Wage Gap in Richwood is 40.8%.
Women in Richwood earn 59.2 cents for every dollar earned by a man.
What is Inequality or Gini Index in Richwood?
Inequality or Gini Index in Richwood is 0.46.
What is the Total Population of Richwood?
Total Population of Richwood is 2,567.
What is the Total Male Population of Richwood?
Total Male Population of Richwood is 1,136.
What is the Total Female Population of Richwood?
Total Female Population of Richwood is 1,431.
What is the Ratio of Males per 100 Females in Richwood?
There are 79.39 Males per 100 Females in Richwood.
What is the Ratio of Females per 100 Males in Richwood?
There are 125.97 Females per 100 Males in Richwood.
What is the Median Population Age in Richwood?
Median Population Age in Richwood is 44.7 Years.
What is the Average Family Size in Richwood
Average Family Size in Richwood is 3.5 People.
What is the Average Household Size in Richwood
Average Household Size in Richwood is 2.5 People.
How Large is the Labor Force in Richwood?
There are 820 People in the Labor Forcein in Richwood.
What is the Percentage of People in the Labor Force in Richwood?
39.4% of People are in the Labor Force in Richwood.
What is the Unemployment Rate in Richwood?
Unemployment Rate in Richwood is 21.7%.