Prichard, WV Map & Demographics
Prichard Map
Prichard Overview
$32,898
PER CAPITA INCOME
$97,115
AVG FAMILY INCOME
$77,163
AVG HOUSEHOLD INCOME
0.37
INEQUALITY / GINI INDEX
450
TOTAL POPULATION
222
MALE POPULATION
228
FEMALE POPULATION
97.37
MALES / 100 FEMALES
102.70
FEMALES / 100 MALES
49.2
MEDIAN AGE
2.9
AVG FAMILY SIZE
2.4
AVG HOUSEHOLD SIZE
187
LABOR FORCE [ PEOPLE ]
44.3%
PERCENT IN LABOR FORCE
Prichard Zip Codes
Prichard Area Codes
Income in Prichard
Income Overview in Prichard
Per Capita Income in Prichard is $32,898, while median incomes of families and households are $97,115 and $77,163 respectively.
| Characteristic | Number | Measure |
| Per Capita Income | 450 | $32,898 |
| Median Family Income | 138 | $97,115 |
| Mean Family Income | 138 | $92,102 |
| Median Household Income | 191 | $77,163 |
| Mean Household Income | 191 | $78,326 |
| Income Deficit | 138 | $0 |
| Wage / Income Gap (%) | 450 | 0.00% |
| Wage / Income Gap ($) | 450 | 100.00¢ per $1 |
| Gini / Inequality Index | 450 | 0.37 |
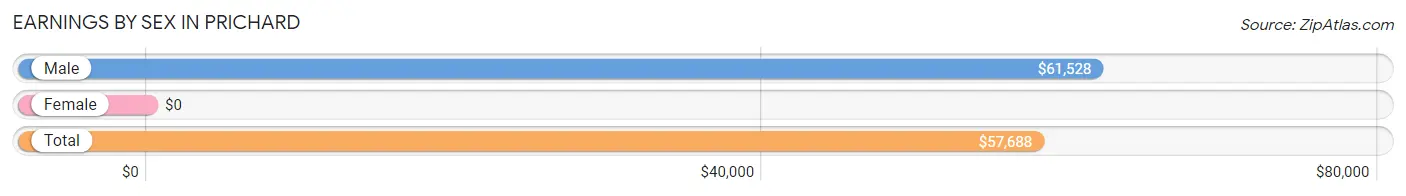
Earnings by Sex in Prichard
| Sex | Number | Average Earnings |
| Male | 109 (58.3%) | $61,528 |
| Female | 78 (41.7%) | $0 |
| Total | 187 (100.0%) | $57,688 |
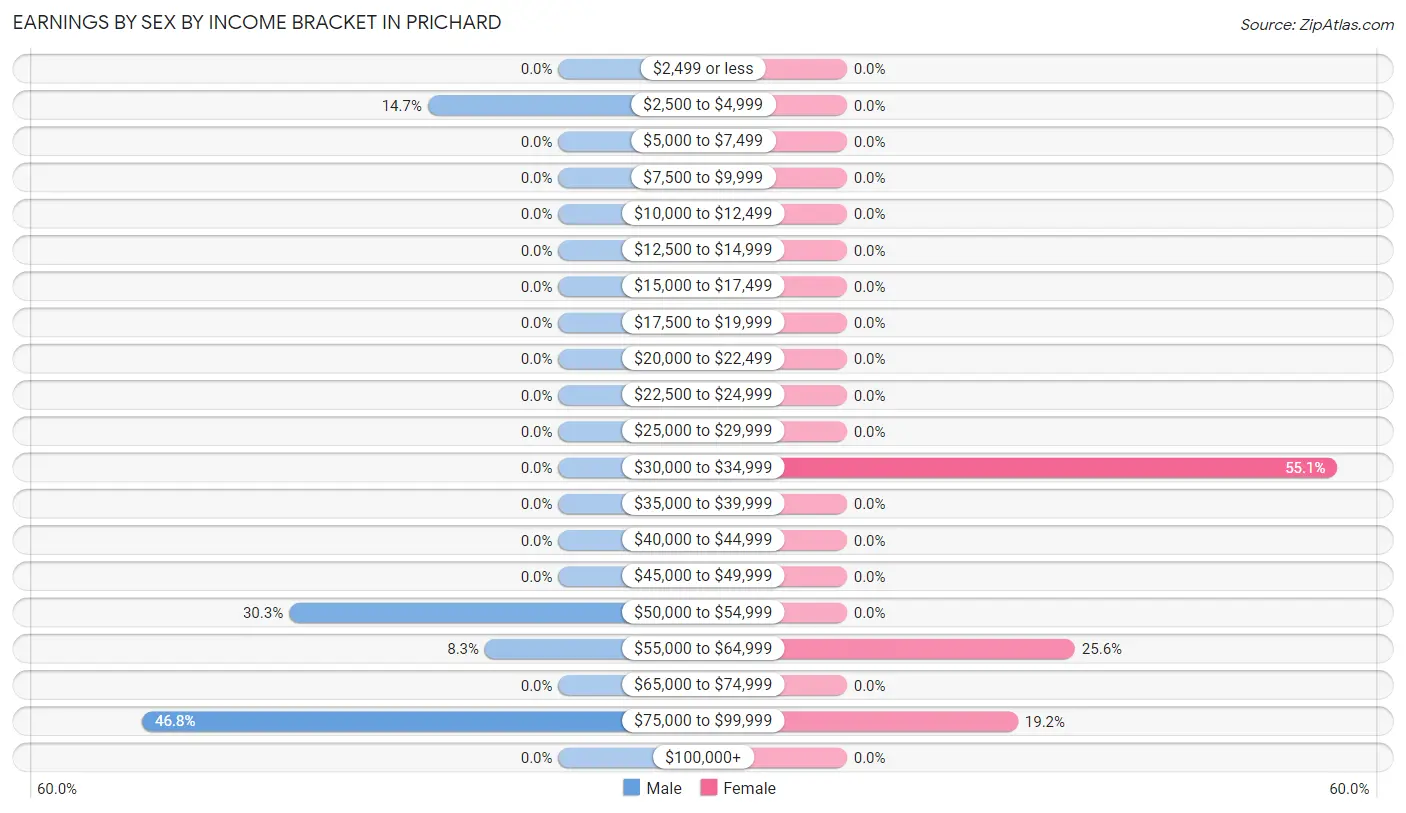
Earnings by Sex by Income Bracket in Prichard
The most common earnings brackets in Prichard are $75,000 to $99,999 for men (51 | 46.8%) and $30,000 to $34,999 for women (43 | 55.1%).
| Income | Male | Female |
| $2,499 or less | 0 (0.0%) | 0 (0.0%) |
| $2,500 to $4,999 | 16 (14.7%) | 0 (0.0%) |
| $5,000 to $7,499 | 0 (0.0%) | 0 (0.0%) |
| $7,500 to $9,999 | 0 (0.0%) | 0 (0.0%) |
| $10,000 to $12,499 | 0 (0.0%) | 0 (0.0%) |
| $12,500 to $14,999 | 0 (0.0%) | 0 (0.0%) |
| $15,000 to $17,499 | 0 (0.0%) | 0 (0.0%) |
| $17,500 to $19,999 | 0 (0.0%) | 0 (0.0%) |
| $20,000 to $22,499 | 0 (0.0%) | 0 (0.0%) |
| $22,500 to $24,999 | 0 (0.0%) | 0 (0.0%) |
| $25,000 to $29,999 | 0 (0.0%) | 0 (0.0%) |
| $30,000 to $34,999 | 0 (0.0%) | 43 (55.1%) |
| $35,000 to $39,999 | 0 (0.0%) | 0 (0.0%) |
| $40,000 to $44,999 | 0 (0.0%) | 0 (0.0%) |
| $45,000 to $49,999 | 0 (0.0%) | 0 (0.0%) |
| $50,000 to $54,999 | 33 (30.3%) | 0 (0.0%) |
| $55,000 to $64,999 | 9 (8.3%) | 20 (25.6%) |
| $65,000 to $74,999 | 0 (0.0%) | 0 (0.0%) |
| $75,000 to $99,999 | 51 (46.8%) | 15 (19.2%) |
| $100,000+ | 0 (0.0%) | 0 (0.0%) |
| Total | 109 (100.0%) | 78 (100.0%) |
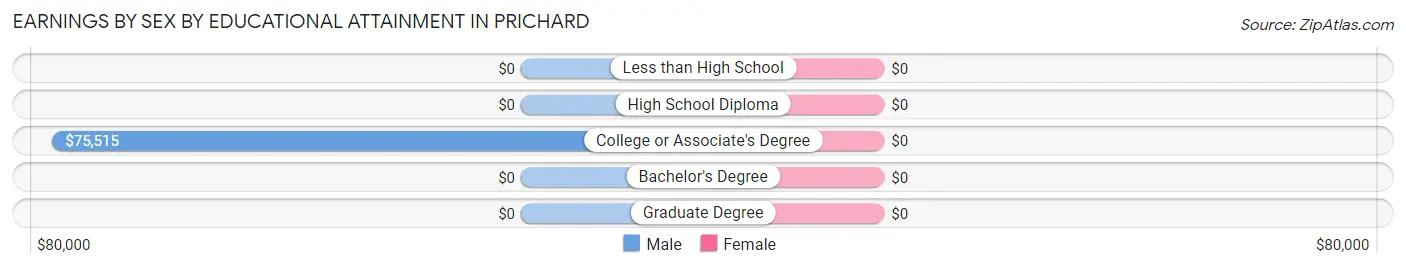
Earnings by Sex by Educational Attainment in Prichard
| Educational Attainment | Male Income | Female Income |
| Less than High School | - | - |
| High School Diploma | - | - |
| College or Associate's Degree | $75,515 | $0 |
| Bachelor's Degree | - | - |
| Graduate Degree | - | - |
| Total | $75,662 | $0 |
Family Income in Prichard
Family Income Brackets in Prichard
According to the Prichard family income data, there are 37 families falling into the $10,000 to $14,999 income range, which is the most common income bracket and makes up 26.8% of all families.
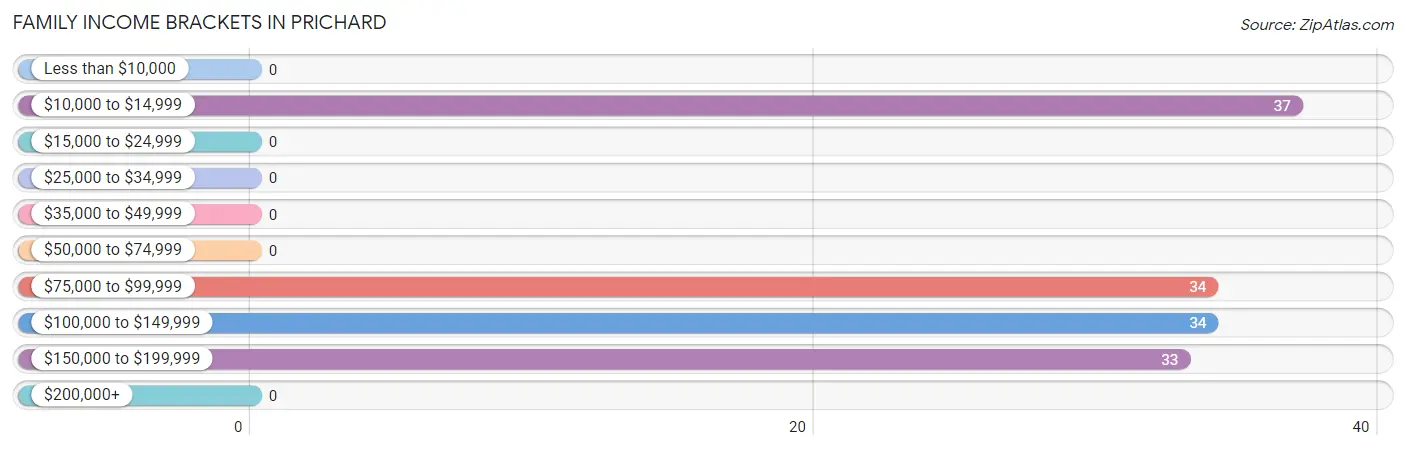
| Income Bracket | # Families | % Families |
| Less than $10,000 | 0 | 0.0% |
| $10,000 to $14,999 | 37 | 26.8% |
| $15,000 to $24,999 | 0 | 0.0% |
| $25,000 to $34,999 | 0 | 0.0% |
| $35,000 to $49,999 | 0 | 0.0% |
| $50,000 to $74,999 | 0 | 0.0% |
| $75,000 to $99,999 | 34 | 24.6% |
| $100,000 to $149,999 | 34 | 24.6% |
| $150,000 to $199,999 | 33 | 23.9% |
| $200,000+ | 0 | 0.0% |
Family Income by Famaliy Size in Prichard
2-person families (106 | 76.8%) account for the highest median family income in Prichard with $115,326 per family, while 2-person families (106 | 76.8%) have the highest median income of $57,663 per family member.
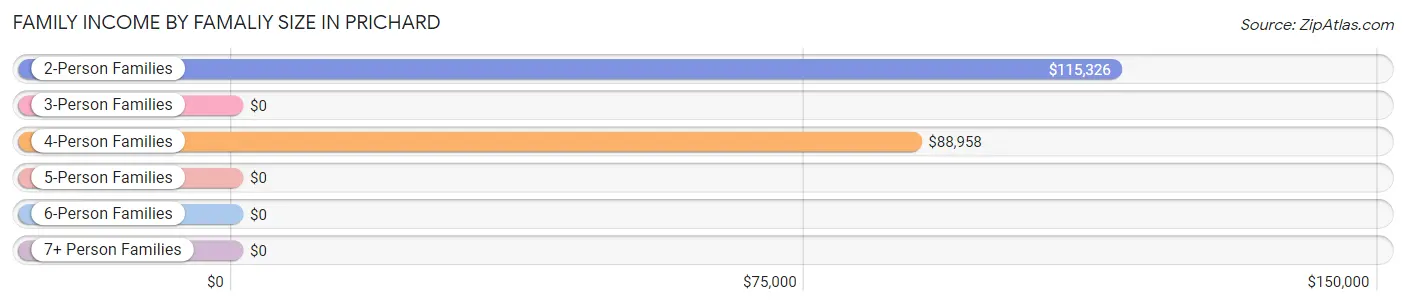
| Income Bracket | # Families | Median Income |
| 2-Person Families | 106 (76.8%) | $115,326 |
| 3-Person Families | 0 (0.0%) | $0 |
| 4-Person Families | 32 (23.2%) | $88,958 |
| 5-Person Families | 0 (0.0%) | $0 |
| 6-Person Families | 0 (0.0%) | $0 |
| 7+ Person Families | 0 (0.0%) | $0 |
| Total | 138 (100.0%) | $97,115 |
Family Income by Number of Earners in Prichard
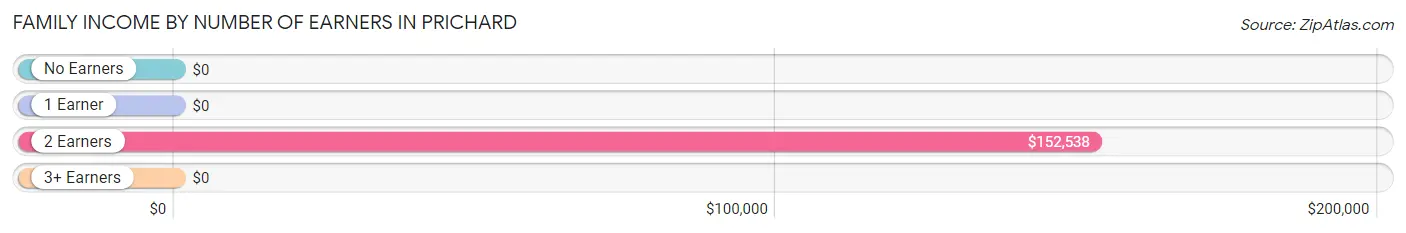
| Number of Earners | # Families | Median Income |
| No Earners | 50 (36.2%) | $0 |
| 1 Earner | 23 (16.7%) | $0 |
| 2 Earners | 65 (47.1%) | $152,538 |
| 3+ Earners | 0 (0.0%) | $0 |
| Total | 138 (100.0%) | $97,115 |
Household Income in Prichard
Household Income Brackets in Prichard
With 51 households falling in the category, the $75,000 to $99,999 income range is the most frequent in Prichard, accounting for 26.7% of all households.
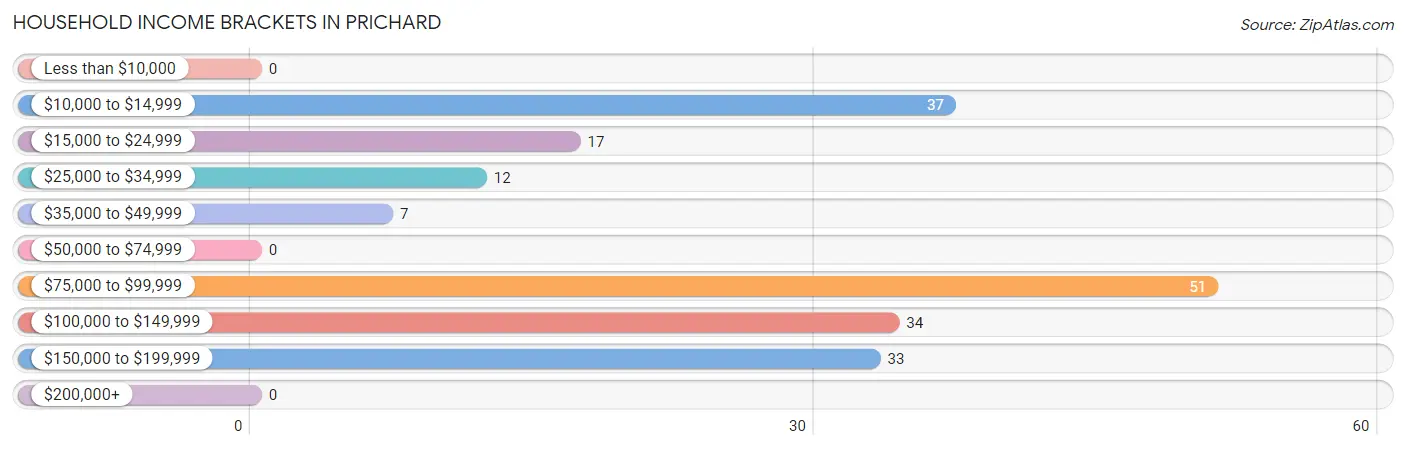
| Income Bracket | # Households | % Households |
| Less than $10,000 | 0 | 0.0% |
| $10,000 to $14,999 | 37 | 19.4% |
| $15,000 to $24,999 | 17 | 8.9% |
| $25,000 to $34,999 | 12 | 6.3% |
| $35,000 to $49,999 | 7 | 3.7% |
| $50,000 to $74,999 | 0 | 0.0% |
| $75,000 to $99,999 | 51 | 26.7% |
| $100,000 to $149,999 | 34 | 17.8% |
| $150,000 to $199,999 | 33 | 17.3% |
| $200,000+ | 0 | 0.0% |
Household Income by Householder Age in Prichard
| Income Bracket | # Households | Median Income |
| 15 to 24 Years | 0 (0.0%) | $0 |
| 25 to 44 Years | 35 (18.3%) | $0 |
| 45 to 64 Years | 99 (51.8%) | $0 |
| 65+ Years | 57 (29.8%) | $0 |
| Total | 191 (100.0%) | $77,163 |
Poverty in Prichard
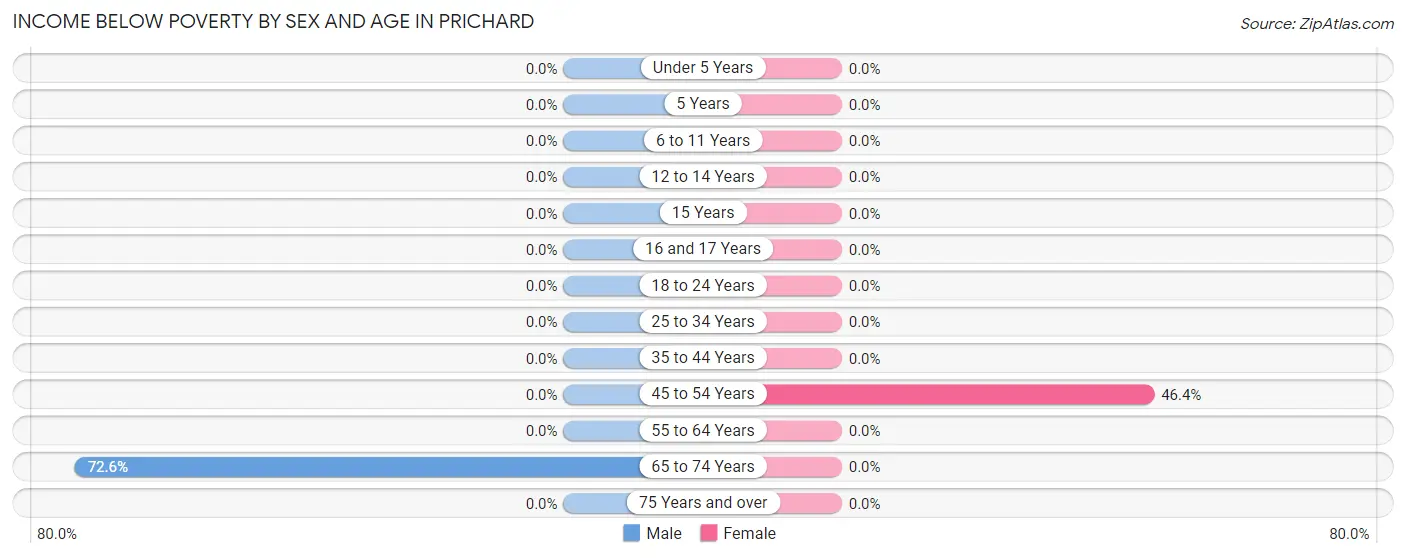
Income Below Poverty by Sex and Age in Prichard
With 16.7% poverty level for males and 19.7% for females among the residents of Prichard, 65 to 74 year old males and 45 to 54 year old females are the most vulnerable to poverty, with 37 males (72.6%) and 45 females (46.4%) in their respective age groups living below the poverty level.
| Age Bracket | Male | Female |
| Under 5 Years | 0 (0.0%) | 0 (0.0%) |
| 5 Years | 0 (0.0%) | 0 (0.0%) |
| 6 to 11 Years | 0 (0.0%) | 0 (0.0%) |
| 12 to 14 Years | 0 (0.0%) | 0 (0.0%) |
| 15 Years | 0 (0.0%) | 0 (0.0%) |
| 16 and 17 Years | 0 (0.0%) | 0 (0.0%) |
| 18 to 24 Years | 0 (0.0%) | 0 (0.0%) |
| 25 to 34 Years | 0 (0.0%) | 0 (0.0%) |
| 35 to 44 Years | 0 (0.0%) | 0 (0.0%) |
| 45 to 54 Years | 0 (0.0%) | 45 (46.4%) |
| 55 to 64 Years | 0 (0.0%) | 0 (0.0%) |
| 65 to 74 Years | 37 (72.6%) | 0 (0.0%) |
| 75 Years and over | 0 (0.0%) | 0 (0.0%) |
| Total | 37 (16.7%) | 45 (19.7%) |
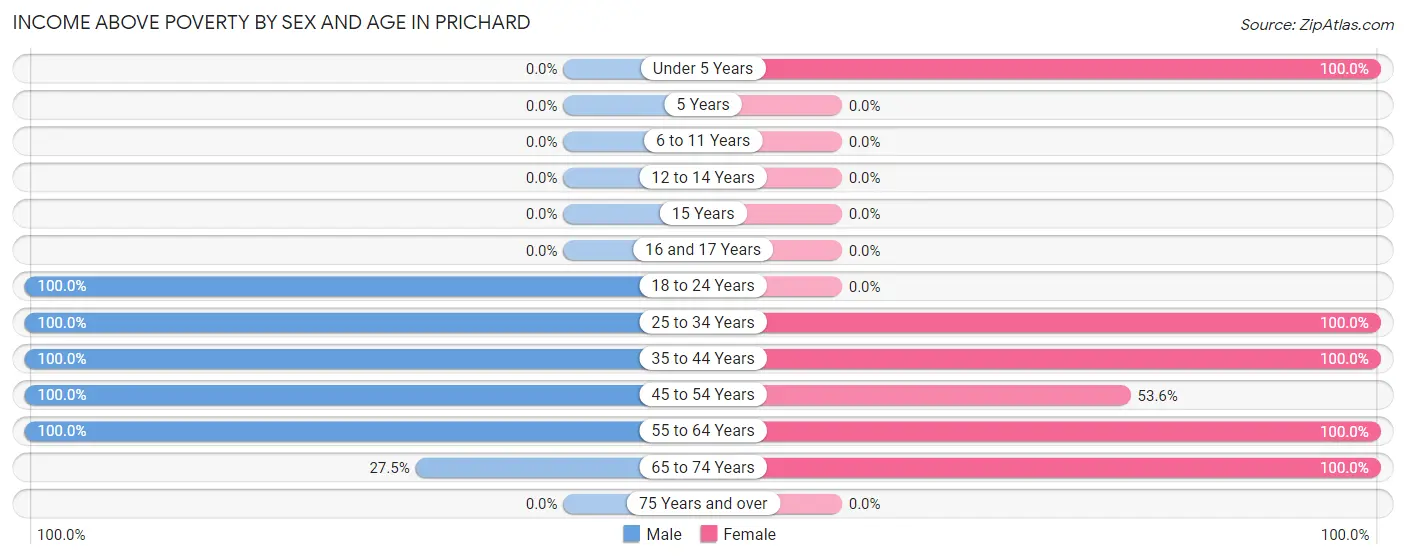
Income Above Poverty by Sex and Age in Prichard
According to the poverty statistics in Prichard, males aged 18 to 24 years and females aged under 5 years are the age groups that are most secure financially, with 100.0% of males and 100.0% of females in these age groups living above the poverty line.
| Age Bracket | Male | Female |
| Under 5 Years | 0 (0.0%) | 28 (100.0%) |
| 5 Years | 0 (0.0%) | 0 (0.0%) |
| 6 to 11 Years | 0 (0.0%) | 0 (0.0%) |
| 12 to 14 Years | 0 (0.0%) | 0 (0.0%) |
| 15 Years | 0 (0.0%) | 0 (0.0%) |
| 16 and 17 Years | 0 (0.0%) | 0 (0.0%) |
| 18 to 24 Years | 66 (100.0%) | 0 (0.0%) |
| 25 to 34 Years | 12 (100.0%) | 15 (100.0%) |
| 35 to 44 Years | 23 (100.0%) | 31 (100.0%) |
| 45 to 54 Years | 61 (100.0%) | 52 (53.6%) |
| 55 to 64 Years | 9 (100.0%) | 37 (100.0%) |
| 65 to 74 Years | 14 (27.5%) | 20 (100.0%) |
| 75 Years and over | 0 (0.0%) | 0 (0.0%) |
| Total | 185 (83.3%) | 183 (80.3%) |
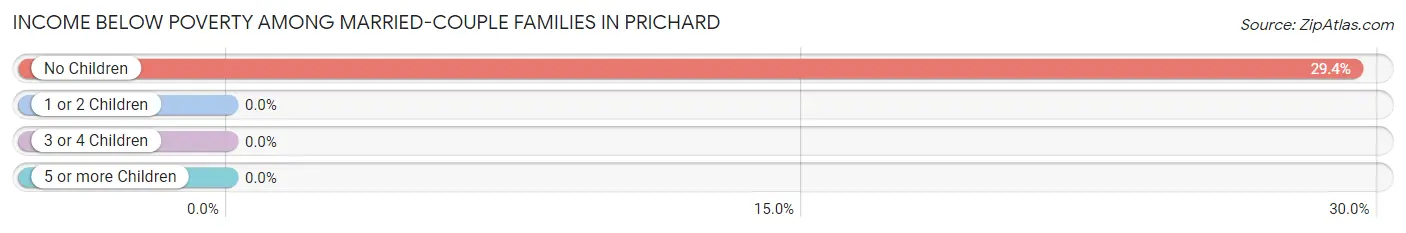
Income Below Poverty Among Married-Couple Families in Prichard
The poverty statistics for married-couple families in Prichard show that 26.8% or 37 of the total 138 families live below the poverty line. Families with no children have the highest poverty rate of 29.4%, comprising of 37 families. On the other hand, families with 1 or 2 children have the lowest poverty rate of 0.0%, which includes 0 families.
| Children | Above Poverty | Below Poverty |
| No Children | 89 (70.6%) | 37 (29.4%) |
| 1 or 2 Children | 12 (100.0%) | 0 (0.0%) |
| 3 or 4 Children | 0 (0.0%) | 0 (0.0%) |
| 5 or more Children | 0 (0.0%) | 0 (0.0%) |
| Total | 101 (73.2%) | 37 (26.8%) |
Income Below Poverty Among Single-Parent Households in Prichard
| Children | Single Father | Single Mother |
| No Children | 0 (0.0%) | 0 (0.0%) |
| 1 or 2 Children | 0 (0.0%) | 0 (0.0%) |
| 3 or 4 Children | 0 (0.0%) | 0 (0.0%) |
| 5 or more Children | 0 (0.0%) | 0 (0.0%) |
| Total | 0 (0.0%) | 0 (0.0%) |
Income Below Poverty Among Married-Couple vs Single-Parent Households in Prichard
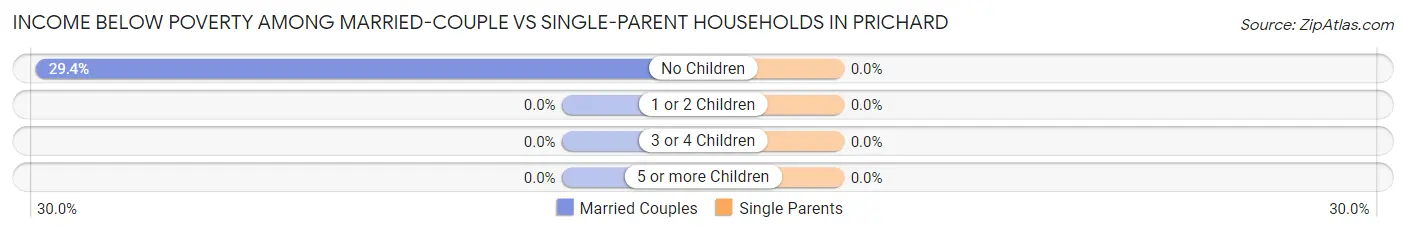
| Children | Married-Couple Families | Single-Parent Households |
| No Children | 37 (29.4%) | 0 (0.0%) |
| 1 or 2 Children | 0 (0.0%) | 0 (0.0%) |
| 3 or 4 Children | 0 (0.0%) | 0 (0.0%) |
| 5 or more Children | 0 (0.0%) | 0 (0.0%) |
| Total | 37 (26.8%) | 0 (0.0%) |
Race in Prichard
The most populous races in Prichard are , and White / Caucasian (450 | 100.0%).
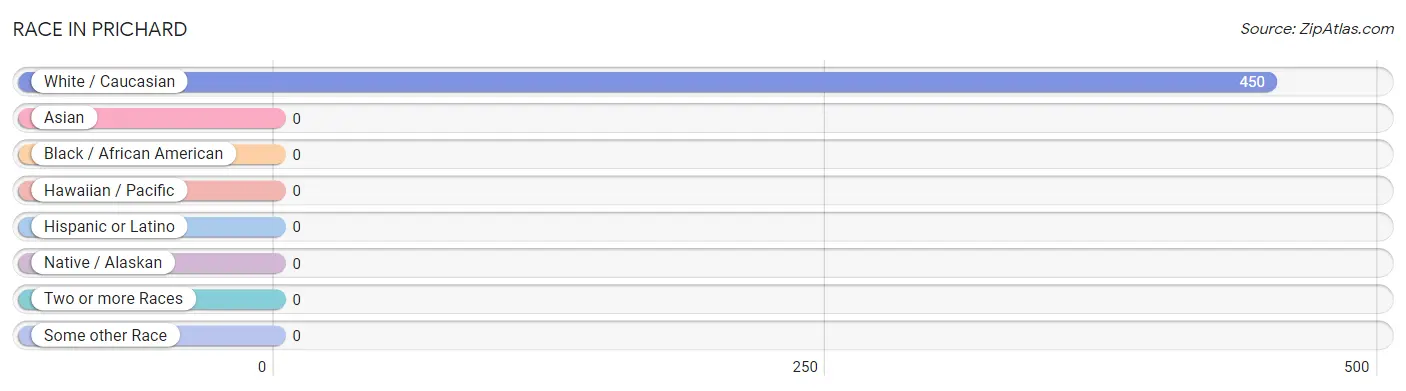
| Race | # Population | % Population |
| Asian | 0 | 0.0% |
| Black / African American | 0 | 0.0% |
| Hawaiian / Pacific | 0 | 0.0% |
| Hispanic or Latino | 0 | 0.0% |
| Native / Alaskan | 0 | 0.0% |
| White / Caucasian | 450 | 100.0% |
| Two or more Races | 0 | 0.0% |
| Some other Race | 0 | 0.0% |
| Total | 450 | 100.0% |
Ancestry in Prichard
The most populous ancestries reported in Prichard are Irish (86 | 19.1%), American (40 | 8.9%), Italian (29 | 6.4%), English (24 | 5.3%), and Polish (15 | 3.3%), together accounting for 43.1% of all Prichard residents.
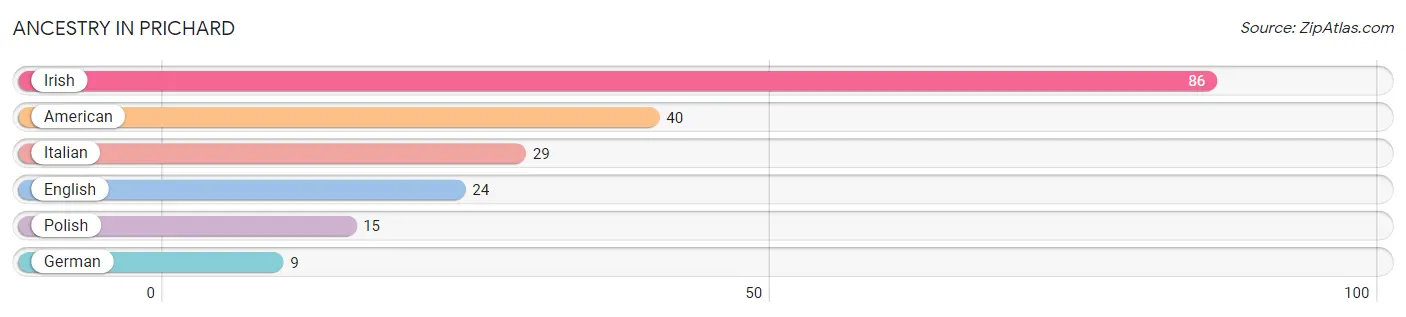
| Ancestry | # Population | % Population |
| American | 40 | 8.9% |
| English | 24 | 5.3% |
| German | 9 | 2.0% |
| Irish | 86 | 19.1% |
| Italian | 29 | 6.4% |
| Polish | 15 | 3.3% | View All 6 Rows |
Immigrants in Prichard

| Immigration Origin | # Population | % Population | View All 0 Rows |
Sex and Age in Prichard
Sex and Age in Prichard
The most populous age groups in Prichard are 20 to 24 Years (66 | 29.7%) for men and 45 to 49 Years (77 | 33.8%) for women.
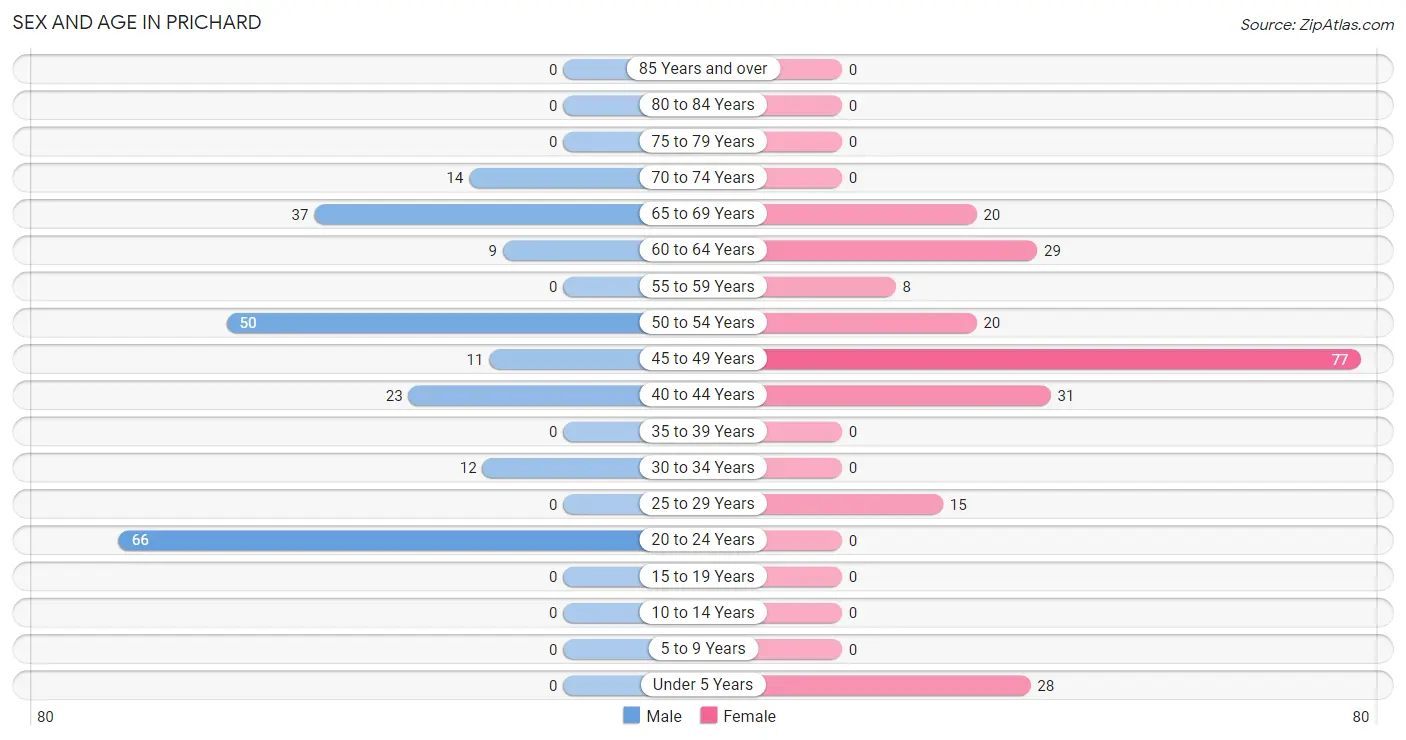
| Age Bracket | Male | Female |
| Under 5 Years | 0 (0.0%) | 28 (12.3%) |
| 5 to 9 Years | 0 (0.0%) | 0 (0.0%) |
| 10 to 14 Years | 0 (0.0%) | 0 (0.0%) |
| 15 to 19 Years | 0 (0.0%) | 0 (0.0%) |
| 20 to 24 Years | 66 (29.7%) | 0 (0.0%) |
| 25 to 29 Years | 0 (0.0%) | 15 (6.6%) |
| 30 to 34 Years | 12 (5.4%) | 0 (0.0%) |
| 35 to 39 Years | 0 (0.0%) | 0 (0.0%) |
| 40 to 44 Years | 23 (10.4%) | 31 (13.6%) |
| 45 to 49 Years | 11 (5.0%) | 77 (33.8%) |
| 50 to 54 Years | 50 (22.5%) | 20 (8.8%) |
| 55 to 59 Years | 0 (0.0%) | 8 (3.5%) |
| 60 to 64 Years | 9 (4.1%) | 29 (12.7%) |
| 65 to 69 Years | 37 (16.7%) | 20 (8.8%) |
| 70 to 74 Years | 14 (6.3%) | 0 (0.0%) |
| 75 to 79 Years | 0 (0.0%) | 0 (0.0%) |
| 80 to 84 Years | 0 (0.0%) | 0 (0.0%) |
| 85 Years and over | 0 (0.0%) | 0 (0.0%) |
| Total | 222 (100.0%) | 228 (100.0%) |
Families and Households in Prichard
Median Family Size in Prichard
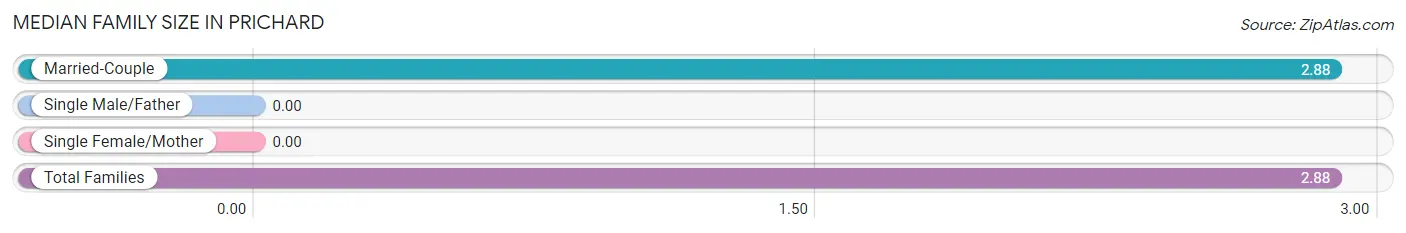
| Family Type | # Families | Family Size |
| Married-Couple | 138 (100.0%) | 2.88 |
| Single Male/Father | 0 (0.0%) | - |
| Single Female/Mother | 0 (0.0%) | - |
| Total Families | 138 (100.0%) | 2.88 |
Median Household Size in Prichard
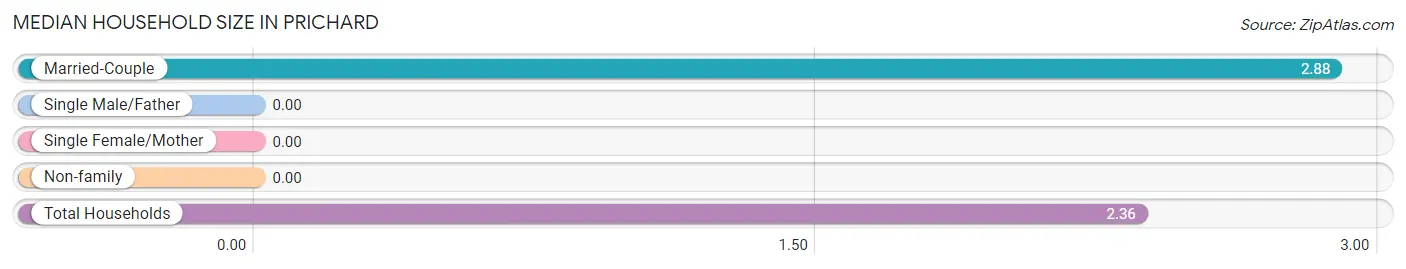
| Household Type | # Households | Household Size |
| Married-Couple | 138 (72.3%) | 2.88 |
| Single Male/Father | 0 (0.0%) | - |
| Single Female/Mother | 0 (0.0%) | - |
| Non-family | 53 (27.8%) | - |
| Total Households | 191 (100.0%) | 2.36 |
Household Size by Marriage Status in Prichard
Out of a total of 191 households in Prichard, 138 (72.3%) are family households, while 53 (27.8%) are nonfamily households. The most numerous type of family households are 2-person households, comprising 106, and the most common type of nonfamily households are 1-person households, comprising 53.
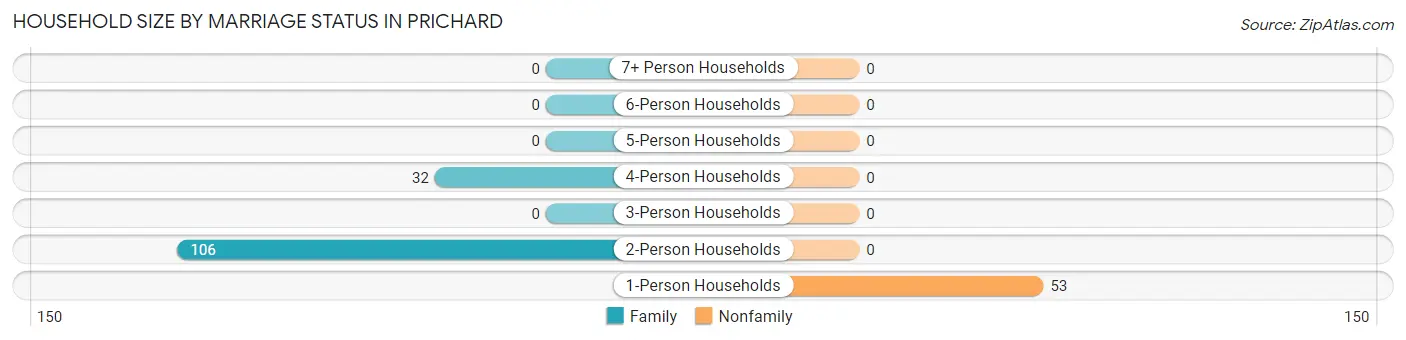
| Household Size | Family Households | Nonfamily Households |
| 1-Person Households | - | 53 (27.8%) |
| 2-Person Households | 106 (55.5%) | 0 (0.0%) |
| 3-Person Households | 0 (0.0%) | 0 (0.0%) |
| 4-Person Households | 32 (16.8%) | 0 (0.0%) |
| 5-Person Households | 0 (0.0%) | 0 (0.0%) |
| 6-Person Households | 0 (0.0%) | 0 (0.0%) |
| 7+ Person Households | 0 (0.0%) | 0 (0.0%) |
| Total | 138 (72.3%) | 53 (27.8%) |
Female Fertility in Prichard
Fertility by Age in Prichard
| Age Bracket | Women with Births | Births / 1,000 Women |
| 15 to 19 years | 0 (0.0%) | 0.0 |
| 20 to 34 years | 0 (0.0%) | 0.0 |
| 35 to 50 years | 0 (0.0%) | 0.0 |
| Total | 0 (0.0%) | 0.0 |
Fertility by Age by Marriage Status in Prichard
| Age Bracket | Married | Unmarried |
| 15 to 19 years | 0 (0.0%) | 0 (0.0%) |
| 20 to 34 years | 0 (0.0%) | 0 (0.0%) |
| 35 to 50 years | 0 (0.0%) | 0 (0.0%) |
| Total | 0 (0.0%) | 0 (0.0%) |
Fertility by Education in Prichard
| Educational Attainment | Women with Births | Births / 1,000 Women |
| Less than High School | 0 (0.0%) | 0.0 |
| High School Diploma | 0 (0.0%) | 0.0 |
| College or Associate's Degree | 0 (0.0%) | 0.0 |
| Bachelor's Degree | 0 (0.0%) | 0.0 |
| Graduate Degree | 0 (0.0%) | 0.0 |
| Total | 0 (0.0%) | 0.0 |
Fertility by Education by Marriage Status in Prichard
| Educational Attainment | Married | Unmarried |
| Less than High School | 0 (0.0%) | 0 (0.0%) |
| High School Diploma | 0 (0.0%) | 0 (0.0%) |
| College or Associate's Degree | 0 (0.0%) | 0 (0.0%) |
| Bachelor's Degree | 0 (0.0%) | 0 (0.0%) |
| Graduate Degree | 0 (0.0%) | 0 (0.0%) |
| Total | 0 (0.0%) | 0 (0.0%) |
Employment Characteristics in Prichard
Employment by Class of Employer in Prichard
Among the 187 employed individuals in Prichard, private company employees (154 | 82.4%), and federal government employees (33 | 17.6%) make up the most common classes of employment.
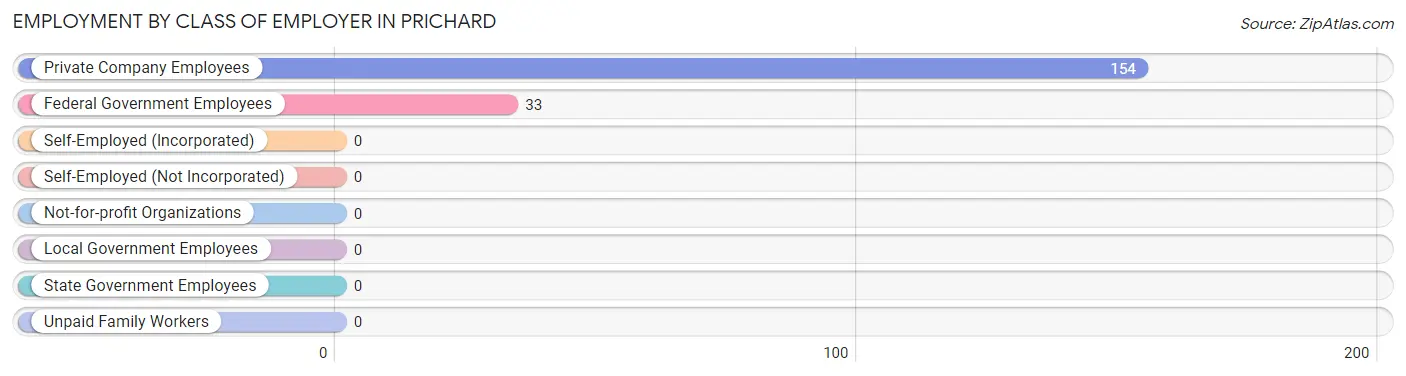
| Employer Class | # Employees | % Employees |
| Private Company Employees | 154 | 82.4% |
| Self-Employed (Incorporated) | 0 | 0.0% |
| Self-Employed (Not Incorporated) | 0 | 0.0% |
| Not-for-profit Organizations | 0 | 0.0% |
| Local Government Employees | 0 | 0.0% |
| State Government Employees | 0 | 0.0% |
| Federal Government Employees | 33 | 17.6% |
| Unpaid Family Workers | 0 | 0.0% |
| Total | 187 | 100.0% |
Employment Status by Age in Prichard
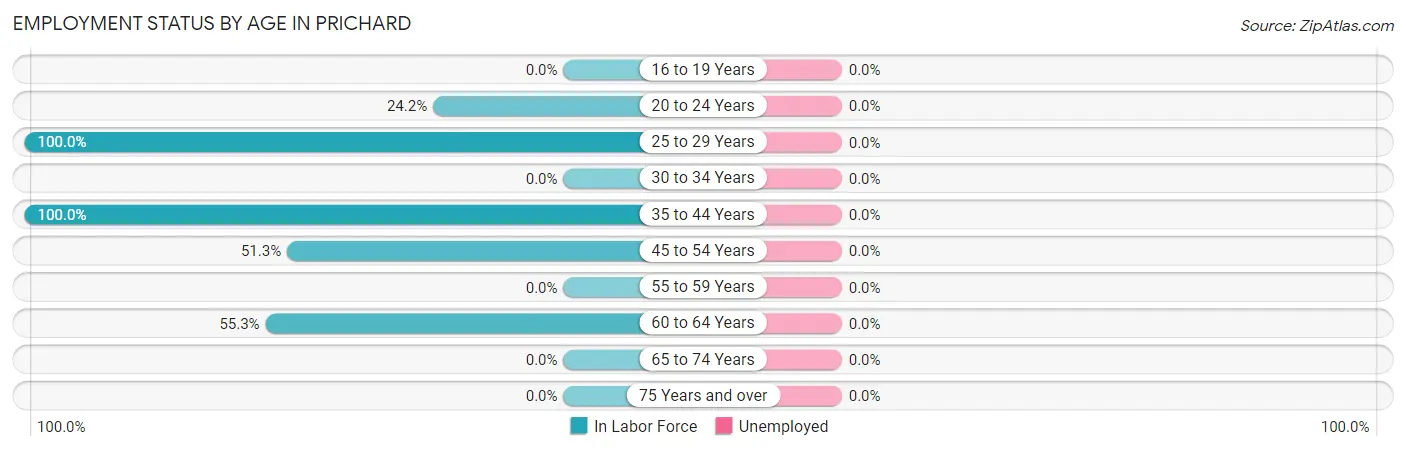
| Age Bracket | In Labor Force | Unemployed |
| 16 to 19 Years | 0 (0.0%) | 0 (0.0%) |
| 20 to 24 Years | 16 (24.2%) | 0 (0.0%) |
| 25 to 29 Years | 15 (100.0%) | 0 (0.0%) |
| 30 to 34 Years | 0 (0.0%) | 0 (0.0%) |
| 35 to 44 Years | 54 (100.0%) | 0 (0.0%) |
| 45 to 54 Years | 81 (51.3%) | 0 (0.0%) |
| 55 to 59 Years | 0 (0.0%) | 0 (0.0%) |
| 60 to 64 Years | 21 (55.3%) | 0 (0.0%) |
| 65 to 74 Years | 0 (0.0%) | 0 (0.0%) |
| 75 Years and over | 0 (0.0%) | 0 (0.0%) |
| Total | 187 (44.3%) | 0 (0.0%) |
Employment Status by Educational Attainment in Prichard
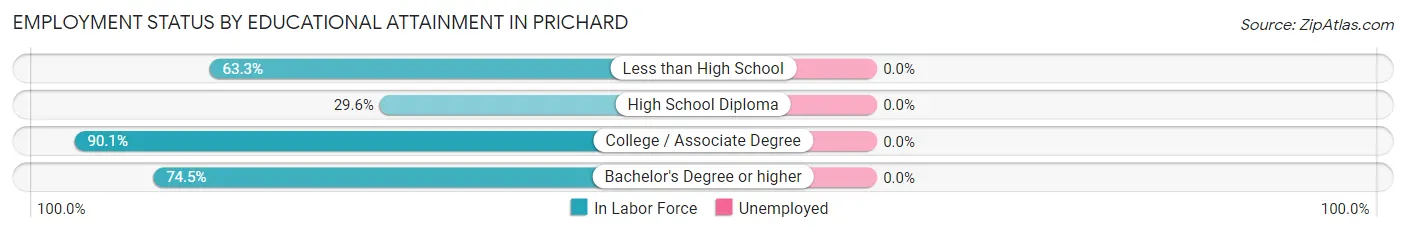
| Educational Attainment | In Labor Force | Unemployed |
| Less than High School | 31 (63.3%) | 0 (0.0%) |
| High School Diploma | 32 (29.6%) | 0 (0.0%) |
| College / Associate Degree | 73 (90.1%) | 0 (0.0%) |
| Bachelor's Degree or higher | 35 (74.5%) | 0 (0.0%) |
| Total | 171 (60.0%) | 0 (0.0%) |
Employment Occupations by Sex in Prichard
Management, Business, Science and Arts Occupations
The most common Management, Business, Science and Arts occupations in Prichard are Health Diagnosing & Treating (35 | 18.7%), Health Technologists (35 | 18.7%), and Management (31 | 16.6%).
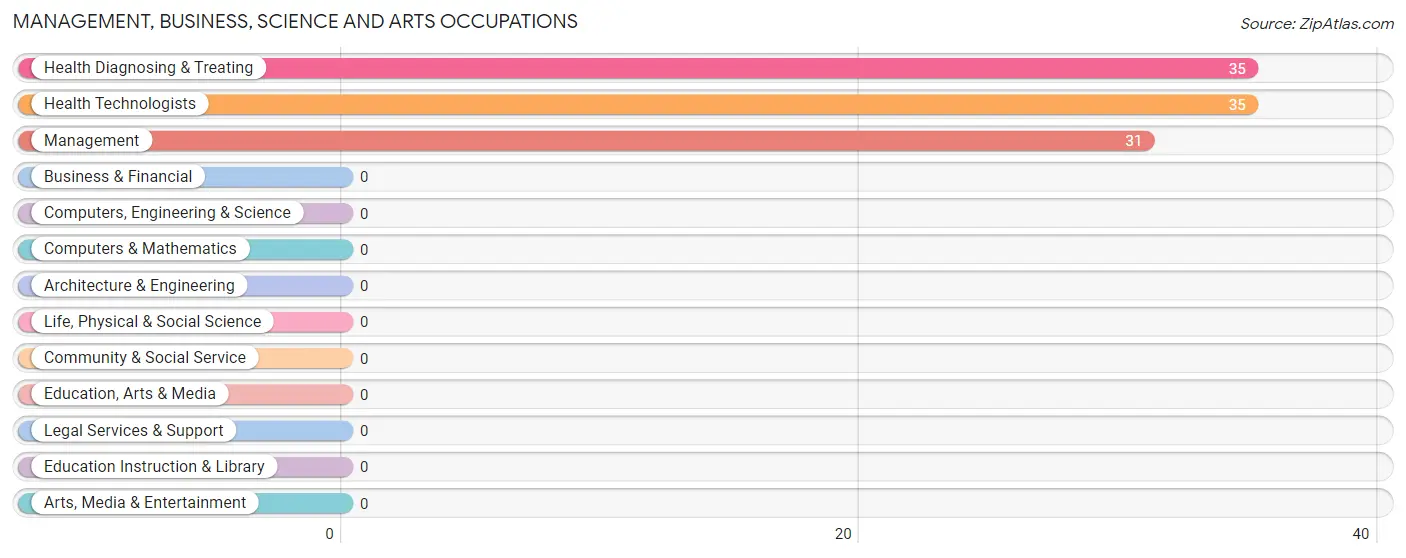
Management, Business, Science and Arts Occupations by Sex
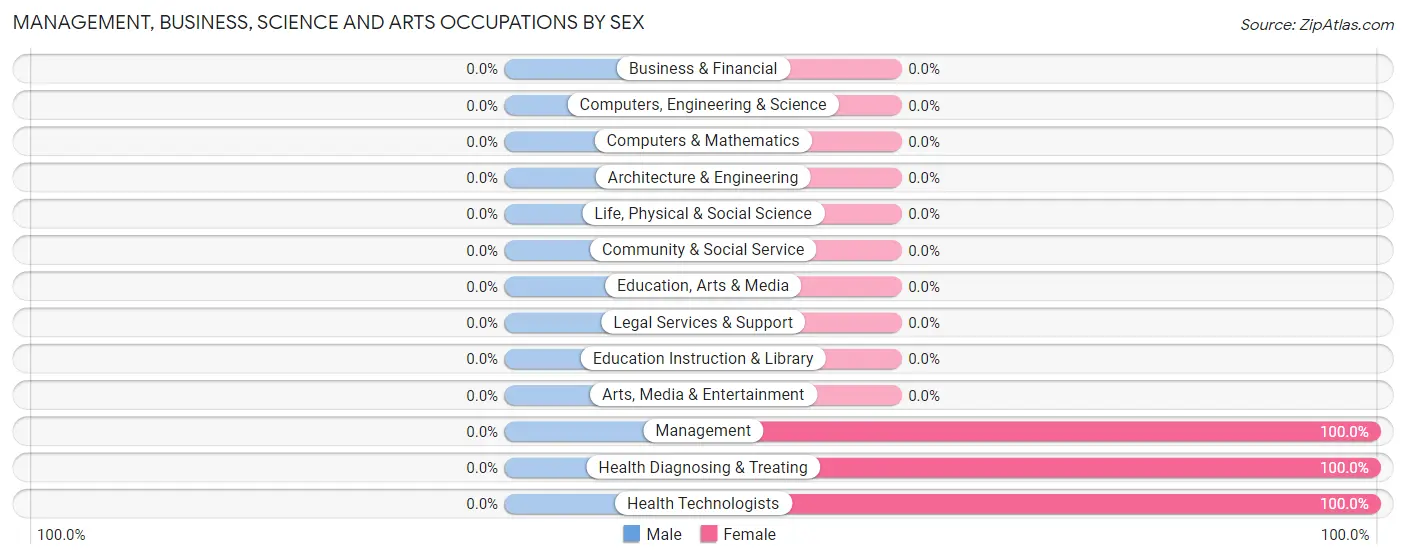
| Occupation | Male | Female |
| Management | 0 (0.0%) | 31 (100.0%) |
| Business & Financial | 0 (0.0%) | 0 (0.0%) |
| Computers, Engineering & Science | 0 (0.0%) | 0 (0.0%) |
| Computers & Mathematics | 0 (0.0%) | 0 (0.0%) |
| Architecture & Engineering | 0 (0.0%) | 0 (0.0%) |
| Life, Physical & Social Science | 0 (0.0%) | 0 (0.0%) |
| Community & Social Service | 0 (0.0%) | 0 (0.0%) |
| Education, Arts & Media | 0 (0.0%) | 0 (0.0%) |
| Legal Services & Support | 0 (0.0%) | 0 (0.0%) |
| Education Instruction & Library | 0 (0.0%) | 0 (0.0%) |
| Arts, Media & Entertainment | 0 (0.0%) | 0 (0.0%) |
| Health Diagnosing & Treating | 0 (0.0%) | 35 (100.0%) |
| Health Technologists | 0 (0.0%) | 35 (100.0%) |
| Total (Category) | 0 (0.0%) | 66 (100.0%) |
| Total (Overall) | 109 (58.3%) | 78 (41.7%) |
Services Occupations
The most common Services occupations in Prichard are Security & Protection (33 | 17.6%), Firefighting & Prevention (33 | 17.6%), and Food Preparation & Serving (16 | 8.6%).
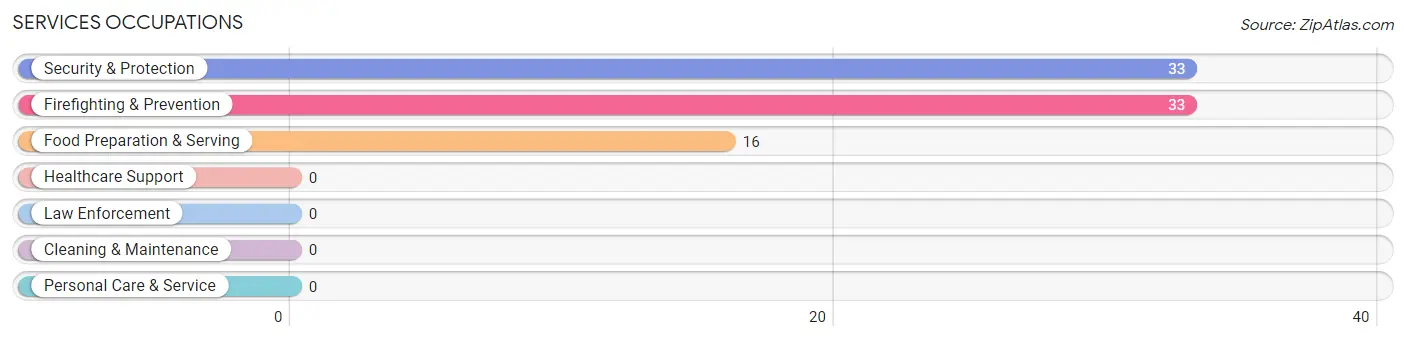
Services Occupations by Sex
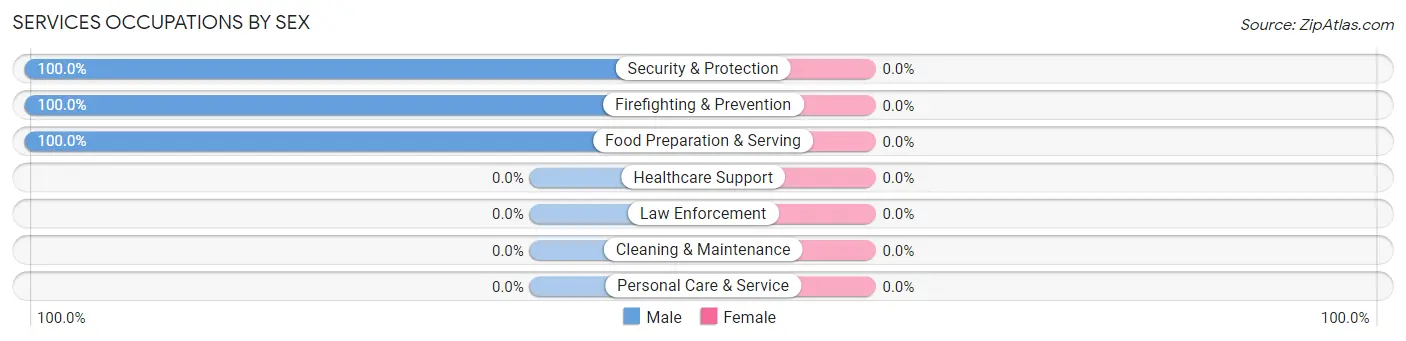
| Occupation | Male | Female |
| Healthcare Support | 0 (0.0%) | 0 (0.0%) |
| Security & Protection | 33 (100.0%) | 0 (0.0%) |
| Firefighting & Prevention | 33 (100.0%) | 0 (0.0%) |
| Law Enforcement | 0 (0.0%) | 0 (0.0%) |
| Food Preparation & Serving | 16 (100.0%) | 0 (0.0%) |
| Cleaning & Maintenance | 0 (0.0%) | 0 (0.0%) |
| Personal Care & Service | 0 (0.0%) | 0 (0.0%) |
| Total (Category) | 49 (100.0%) | 0 (0.0%) |
| Total (Overall) | 109 (58.3%) | 78 (41.7%) |
Sales and Office Occupations
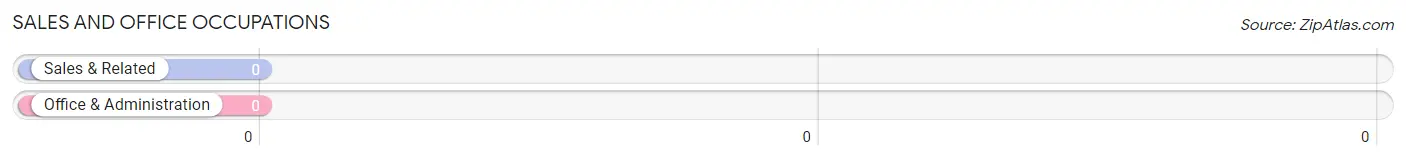
Sales and Office Occupations by Sex
| Occupation | Male | Female |
| Sales & Related | 0 (0.0%) | 0 (0.0%) |
| Office & Administration | 0 (0.0%) | 0 (0.0%) |
| Total (Category) | 0 (0.0%) | 0 (0.0%) |
| Total (Overall) | 109 (58.3%) | 78 (41.7%) |
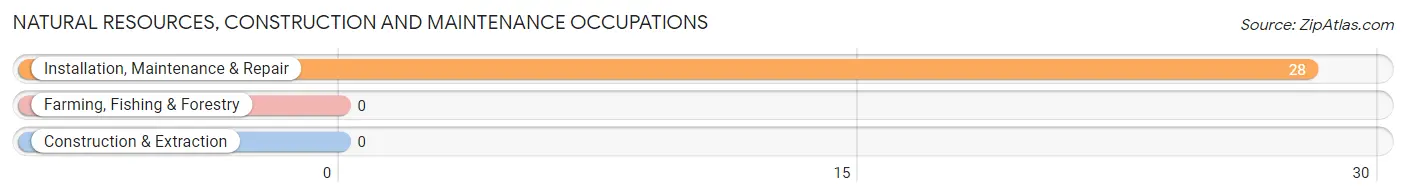
Natural Resources, Construction and Maintenance Occupations
The most common Natural Resources, Construction and Maintenance occupations in Prichard are , and Installation, Maintenance & Repair (28 | 15.0%).
Natural Resources, Construction and Maintenance Occupations by Sex
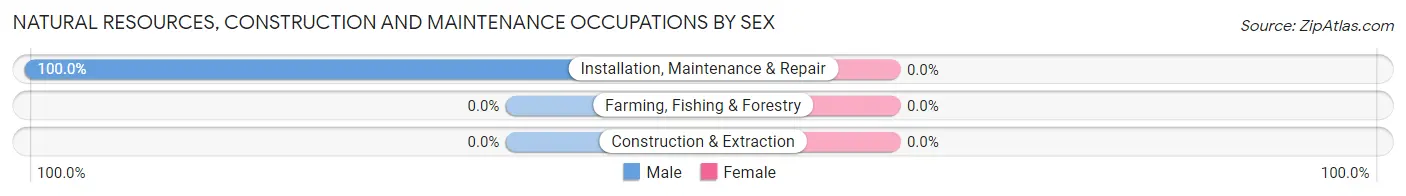
| Occupation | Male | Female |
| Farming, Fishing & Forestry | 0 (0.0%) | 0 (0.0%) |
| Construction & Extraction | 0 (0.0%) | 0 (0.0%) |
| Installation, Maintenance & Repair | 28 (100.0%) | 0 (0.0%) |
| Total (Category) | 28 (100.0%) | 0 (0.0%) |
| Total (Overall) | 109 (58.3%) | 78 (41.7%) |
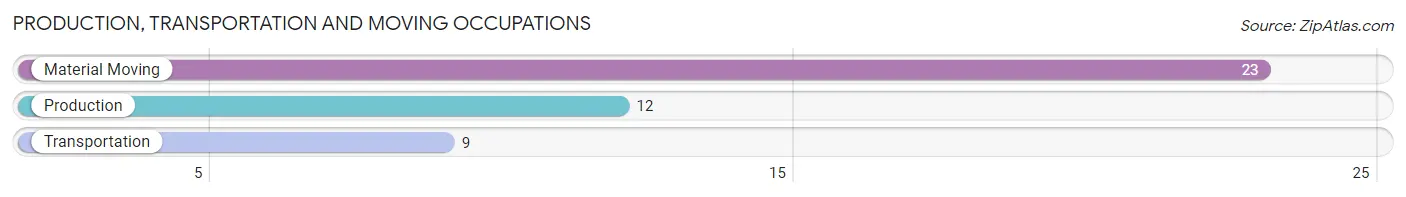
Production, Transportation and Moving Occupations
The most common Production, Transportation and Moving occupations in Prichard are Material Moving (23 | 12.3%), Production (12 | 6.4%), and Transportation (9 | 4.8%).
Production, Transportation and Moving Occupations by Sex
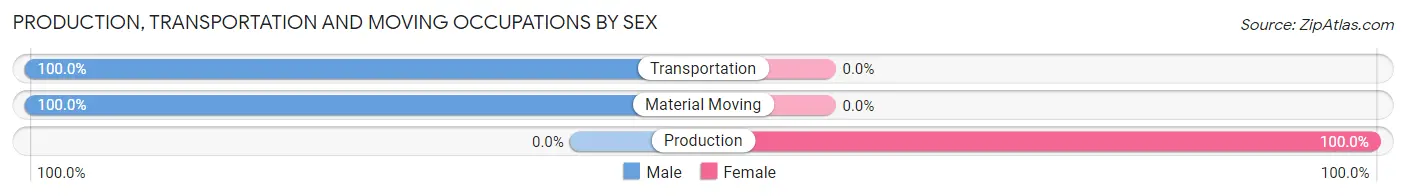
| Occupation | Male | Female |
| Production | 0 (0.0%) | 12 (100.0%) |
| Transportation | 9 (100.0%) | 0 (0.0%) |
| Material Moving | 23 (100.0%) | 0 (0.0%) |
| Total (Category) | 32 (72.7%) | 12 (27.3%) |
| Total (Overall) | 109 (58.3%) | 78 (41.7%) |
Employment Industries by Sex in Prichard
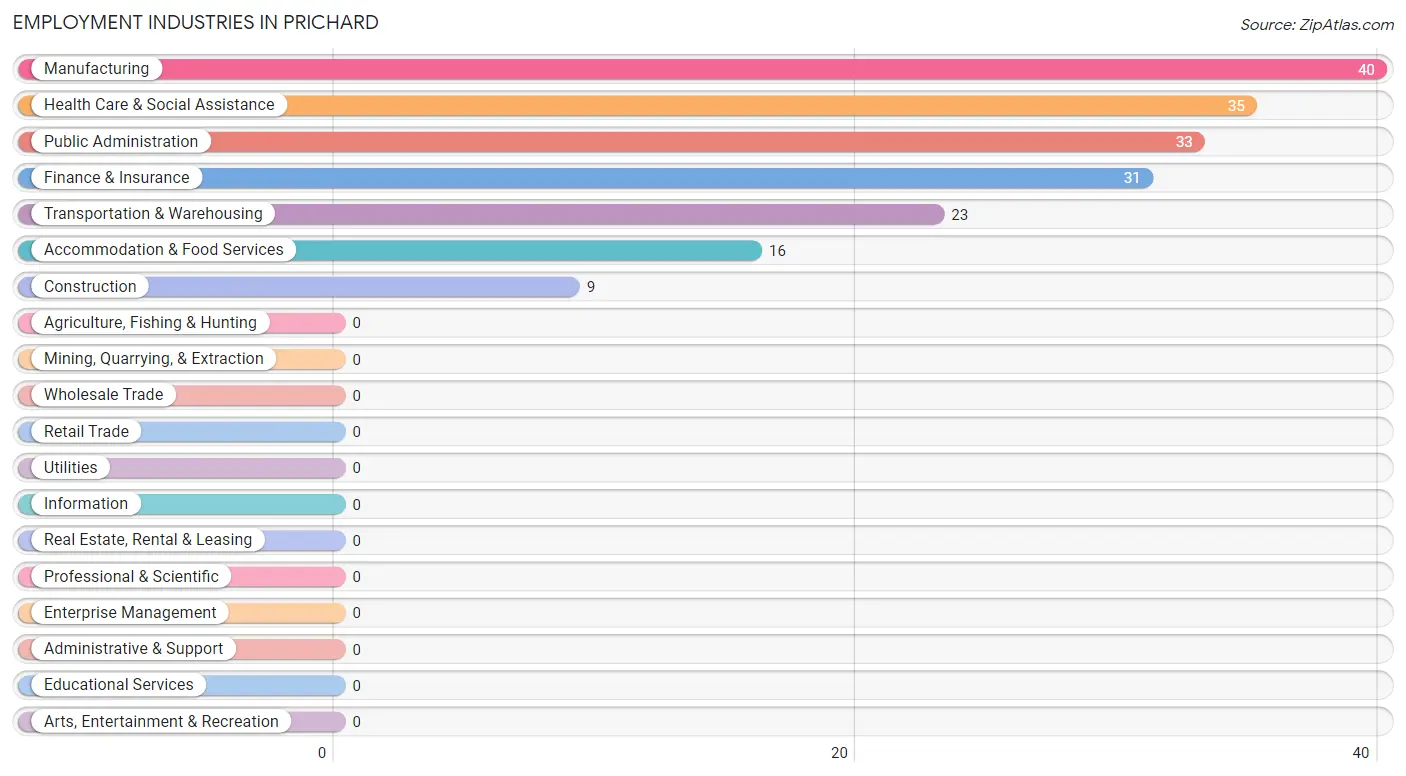
Employment Industries in Prichard
The major employment industries in Prichard include Manufacturing (40 | 21.4%), Health Care & Social Assistance (35 | 18.7%), Public Administration (33 | 17.6%), Finance & Insurance (31 | 16.6%), and Transportation & Warehousing (23 | 12.3%).
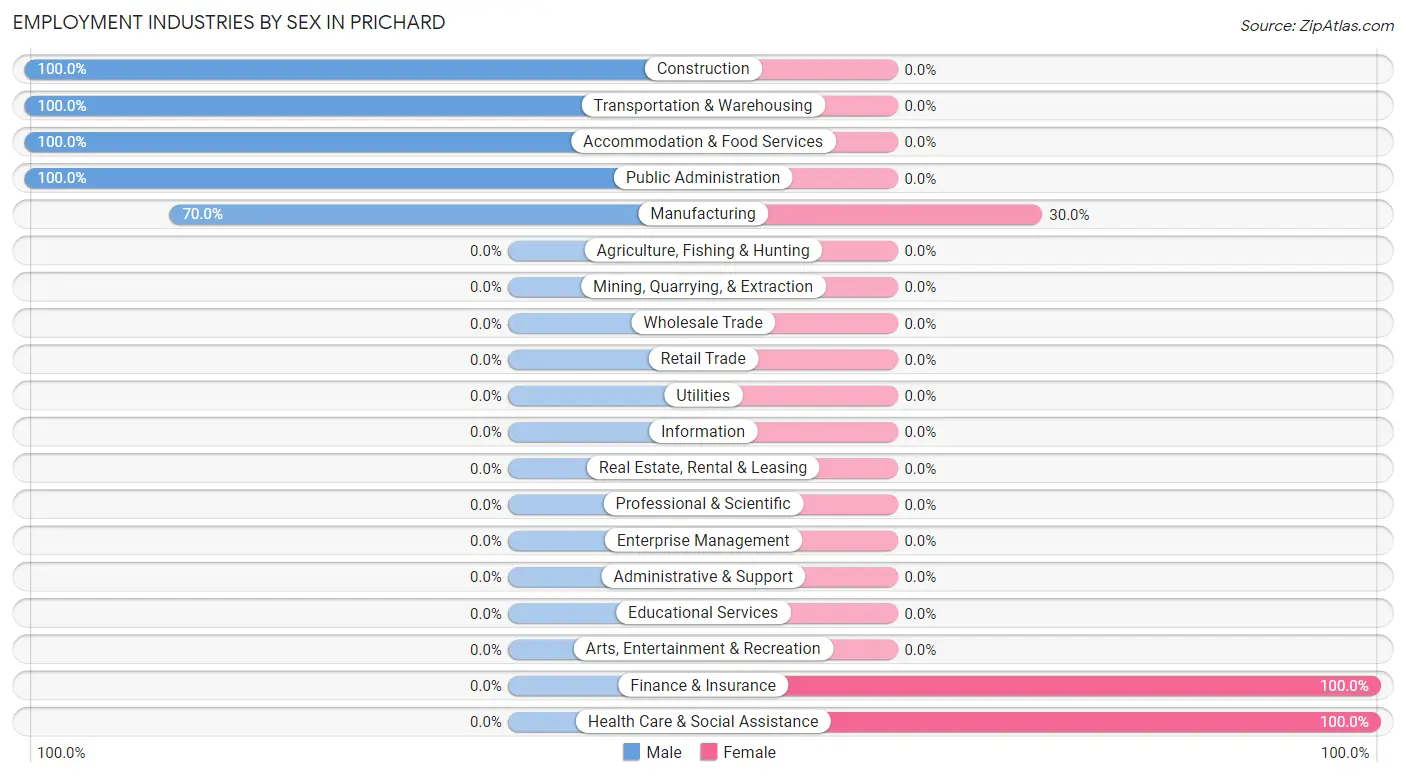
Employment Industries by Sex in Prichard
The Prichard industries that see more men than women are Construction (100.0%), Transportation & Warehousing (100.0%), and Accommodation & Food Services (100.0%), whereas the industries that tend to have a higher number of women are Finance & Insurance (100.0%), Health Care & Social Assistance (100.0%), and Manufacturing (30.0%).
| Industry | Male | Female |
| Agriculture, Fishing & Hunting | 0 (0.0%) | 0 (0.0%) |
| Mining, Quarrying, & Extraction | 0 (0.0%) | 0 (0.0%) |
| Construction | 9 (100.0%) | 0 (0.0%) |
| Manufacturing | 28 (70.0%) | 12 (30.0%) |
| Wholesale Trade | 0 (0.0%) | 0 (0.0%) |
| Retail Trade | 0 (0.0%) | 0 (0.0%) |
| Transportation & Warehousing | 23 (100.0%) | 0 (0.0%) |
| Utilities | 0 (0.0%) | 0 (0.0%) |
| Information | 0 (0.0%) | 0 (0.0%) |
| Finance & Insurance | 0 (0.0%) | 31 (100.0%) |
| Real Estate, Rental & Leasing | 0 (0.0%) | 0 (0.0%) |
| Professional & Scientific | 0 (0.0%) | 0 (0.0%) |
| Enterprise Management | 0 (0.0%) | 0 (0.0%) |
| Administrative & Support | 0 (0.0%) | 0 (0.0%) |
| Educational Services | 0 (0.0%) | 0 (0.0%) |
| Health Care & Social Assistance | 0 (0.0%) | 35 (100.0%) |
| Arts, Entertainment & Recreation | 0 (0.0%) | 0 (0.0%) |
| Accommodation & Food Services | 16 (100.0%) | 0 (0.0%) |
| Public Administration | 33 (100.0%) | 0 (0.0%) |
| Total | 109 (58.3%) | 78 (41.7%) |
Education in Prichard
School Enrollment in Prichard
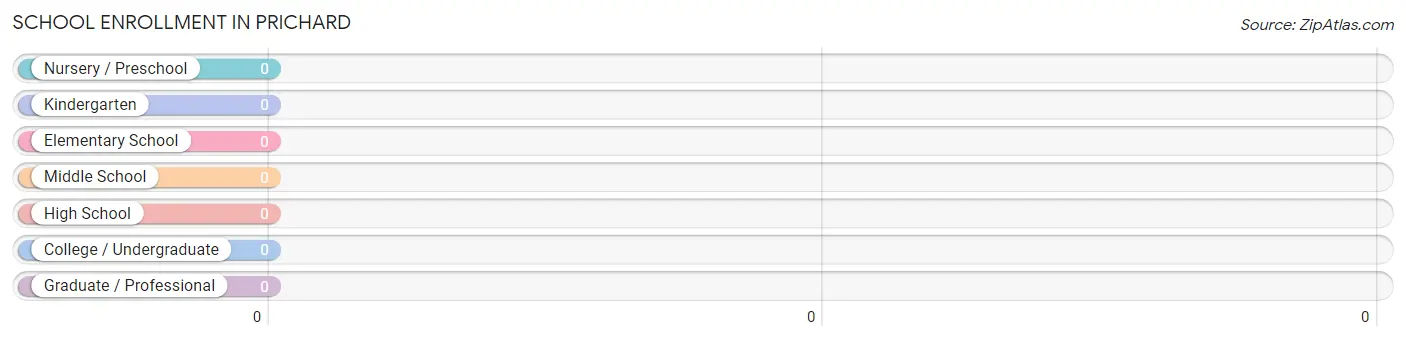
| School Level | # Students | % Students |
| Nursery / Preschool | 0 | 0.0% |
| Kindergarten | 0 | 0.0% |
| Elementary School | 0 | 0.0% |
| Middle School | 0 | 0.0% |
| High School | 0 | 0.0% |
| College / Undergraduate | 0 | 0.0% |
| Graduate / Professional | 0 | 0.0% |
| Total | 0 | 0.0% |
School Enrollment by Age by Funding Source in Prichard
| Age Bracket | Public School | Private School |
| 3 to 4 Year Olds | 0 (0.0%) | 0 (0.0%) |
| 5 to 9 Year Old | 0 (0.0%) | 0 (0.0%) |
| 10 to 14 Year Olds | 0 (0.0%) | 0 (0.0%) |
| 15 to 17 Year Olds | 0 (0.0%) | 0 (0.0%) |
| 18 to 19 Year Olds | 0 (0.0%) | 0 (0.0%) |
| 20 to 24 Year Olds | 0 (0.0%) | 0 (0.0%) |
| 25 to 34 Year Olds | 0 (0.0%) | 0 (0.0%) |
| 35 Years and over | 0 (0.0%) | 0 (0.0%) |
| Total | 0 (0.0%) | 0 (0.0%) |
Educational Attainment by Field of Study in Prichard
Science & technology (47 | 79.7%), and education (12 | 20.3%) are the most common fields of study among 59 individuals in Prichard who have obtained a bachelor's degree or higher.
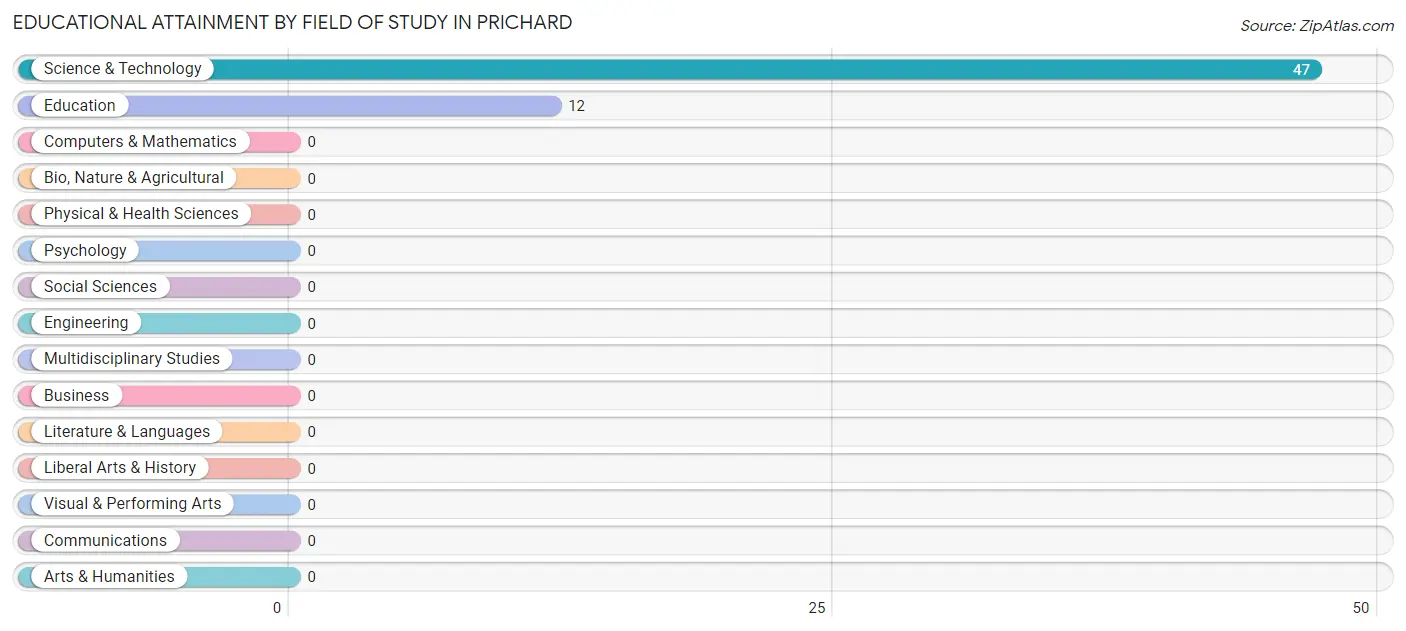
| Field of Study | # Graduates | % Graduates |
| Computers & Mathematics | 0 | 0.0% |
| Bio, Nature & Agricultural | 0 | 0.0% |
| Physical & Health Sciences | 0 | 0.0% |
| Psychology | 0 | 0.0% |
| Social Sciences | 0 | 0.0% |
| Engineering | 0 | 0.0% |
| Multidisciplinary Studies | 0 | 0.0% |
| Science & Technology | 47 | 79.7% |
| Business | 0 | 0.0% |
| Education | 12 | 20.3% |
| Literature & Languages | 0 | 0.0% |
| Liberal Arts & History | 0 | 0.0% |
| Visual & Performing Arts | 0 | 0.0% |
| Communications | 0 | 0.0% |
| Arts & Humanities | 0 | 0.0% |
| Total | 59 | 100.0% |
Transportation & Commute in Prichard
Vehicle Availability by Sex in Prichard
The most prevalent vehicle ownership categories in Prichard are males with 2 vehicles (48, accounting for 44.0%) and females with 2 vehicles (31, making up 61.5%).
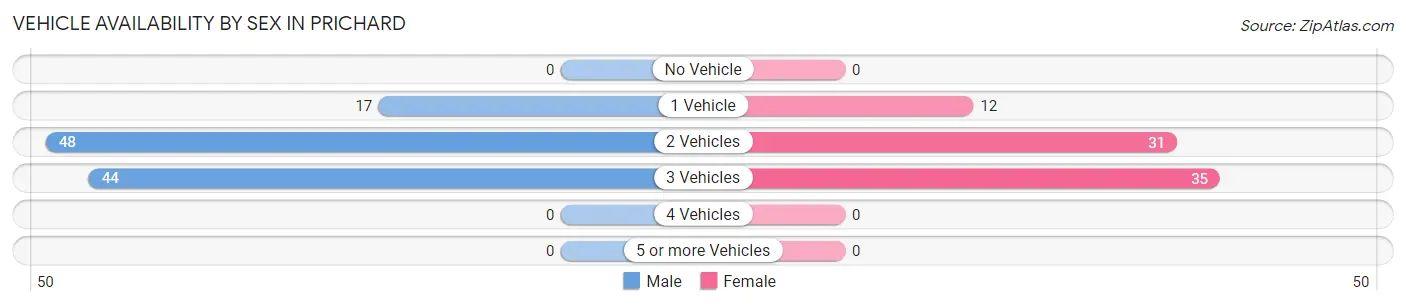
| Vehicles Available | Male | Female |
| No Vehicle | 0 (0.0%) | 0 (0.0%) |
| 1 Vehicle | 17 (15.6%) | 12 (15.4%) |
| 2 Vehicles | 48 (44.0%) | 31 (39.7%) |
| 3 Vehicles | 44 (40.4%) | 35 (44.9%) |
| 4 Vehicles | 0 (0.0%) | 0 (0.0%) |
| 5 or more Vehicles | 0 (0.0%) | 0 (0.0%) |
| Total | 109 (100.0%) | 78 (100.0%) |
Commute Time in Prichard
The most frequently occuring commute durations in Prichard are 30 to 34 minutes (46 commuters, 24.6%), 15 to 19 minutes (33 commuters, 17.6%), and 45 to 59 minutes (31 commuters, 16.6%).
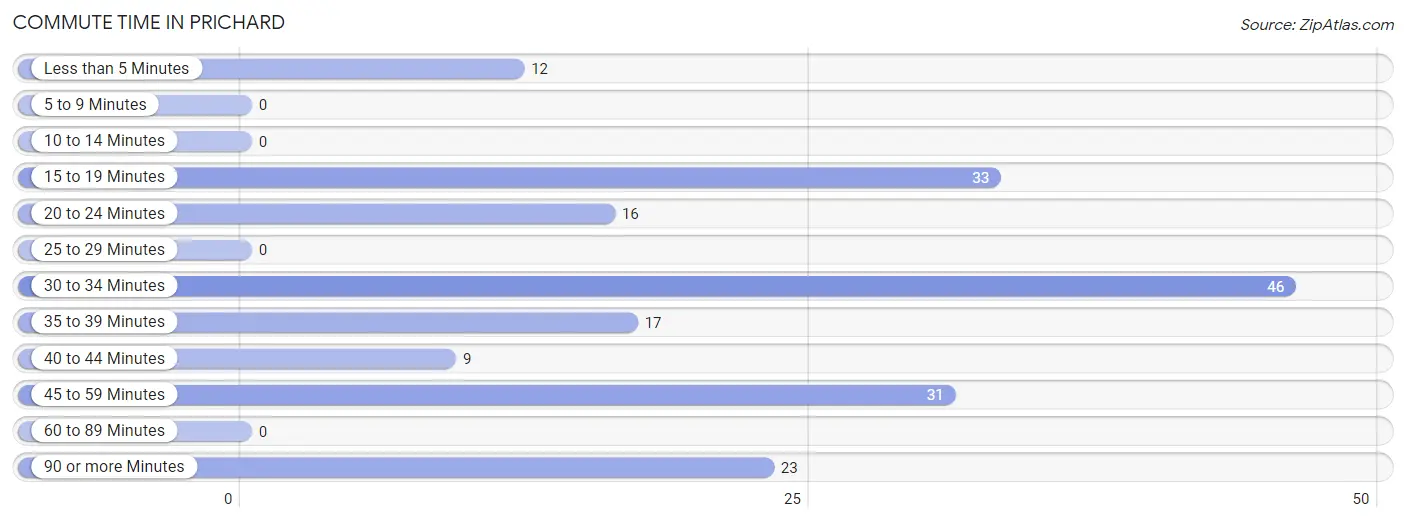
| Commute Time | # Commuters | % Commuters |
| Less than 5 Minutes | 12 | 6.4% |
| 5 to 9 Minutes | 0 | 0.0% |
| 10 to 14 Minutes | 0 | 0.0% |
| 15 to 19 Minutes | 33 | 17.6% |
| 20 to 24 Minutes | 16 | 8.6% |
| 25 to 29 Minutes | 0 | 0.0% |
| 30 to 34 Minutes | 46 | 24.6% |
| 35 to 39 Minutes | 17 | 9.1% |
| 40 to 44 Minutes | 9 | 4.8% |
| 45 to 59 Minutes | 31 | 16.6% |
| 60 to 89 Minutes | 0 | 0.0% |
| 90 or more Minutes | 23 | 12.3% |
Commute Time by Sex in Prichard
The most common commute times in Prichard are 15 to 19 minutes (33 commuters, 30.3%) for males and 30 to 34 minutes (46 commuters, 59.0%) for females.
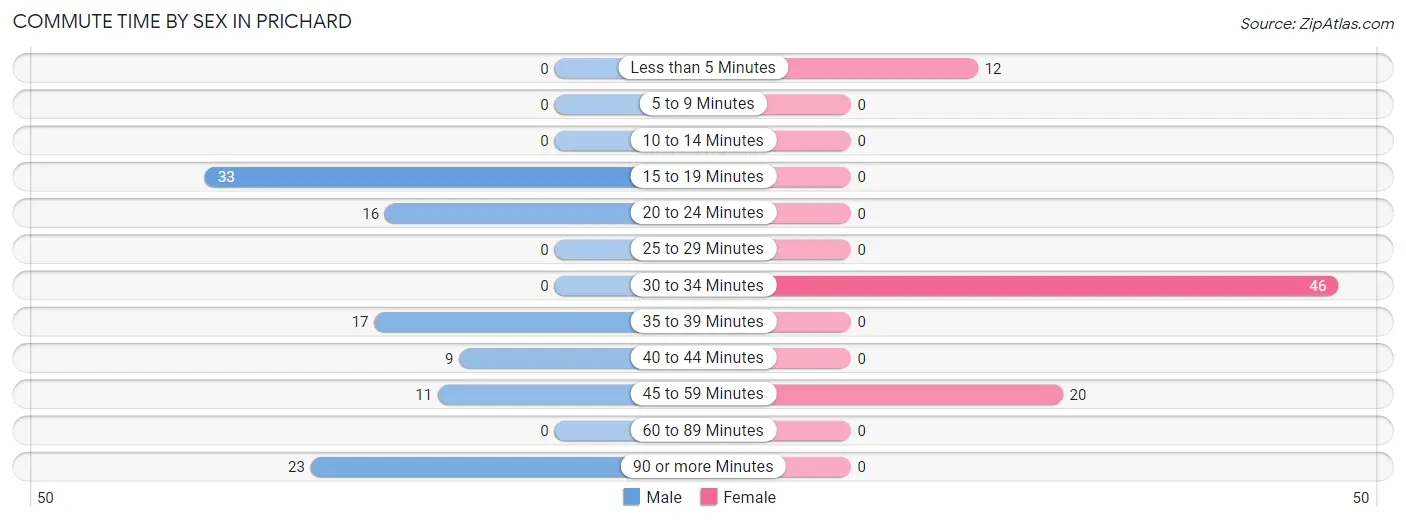
| Commute Time | Male | Female |
| Less than 5 Minutes | 0 (0.0%) | 12 (15.4%) |
| 5 to 9 Minutes | 0 (0.0%) | 0 (0.0%) |
| 10 to 14 Minutes | 0 (0.0%) | 0 (0.0%) |
| 15 to 19 Minutes | 33 (30.3%) | 0 (0.0%) |
| 20 to 24 Minutes | 16 (14.7%) | 0 (0.0%) |
| 25 to 29 Minutes | 0 (0.0%) | 0 (0.0%) |
| 30 to 34 Minutes | 0 (0.0%) | 46 (59.0%) |
| 35 to 39 Minutes | 17 (15.6%) | 0 (0.0%) |
| 40 to 44 Minutes | 9 (8.3%) | 0 (0.0%) |
| 45 to 59 Minutes | 11 (10.1%) | 20 (25.6%) |
| 60 to 89 Minutes | 0 (0.0%) | 0 (0.0%) |
| 90 or more Minutes | 23 (21.1%) | 0 (0.0%) |
Time of Departure to Work by Sex in Prichard
The most frequent times of departure to work in Prichard are 4:00 PM to 11:59 PM (44, 40.4%) for males and 7:30 AM to 7:59 AM (31, 39.7%) for females.
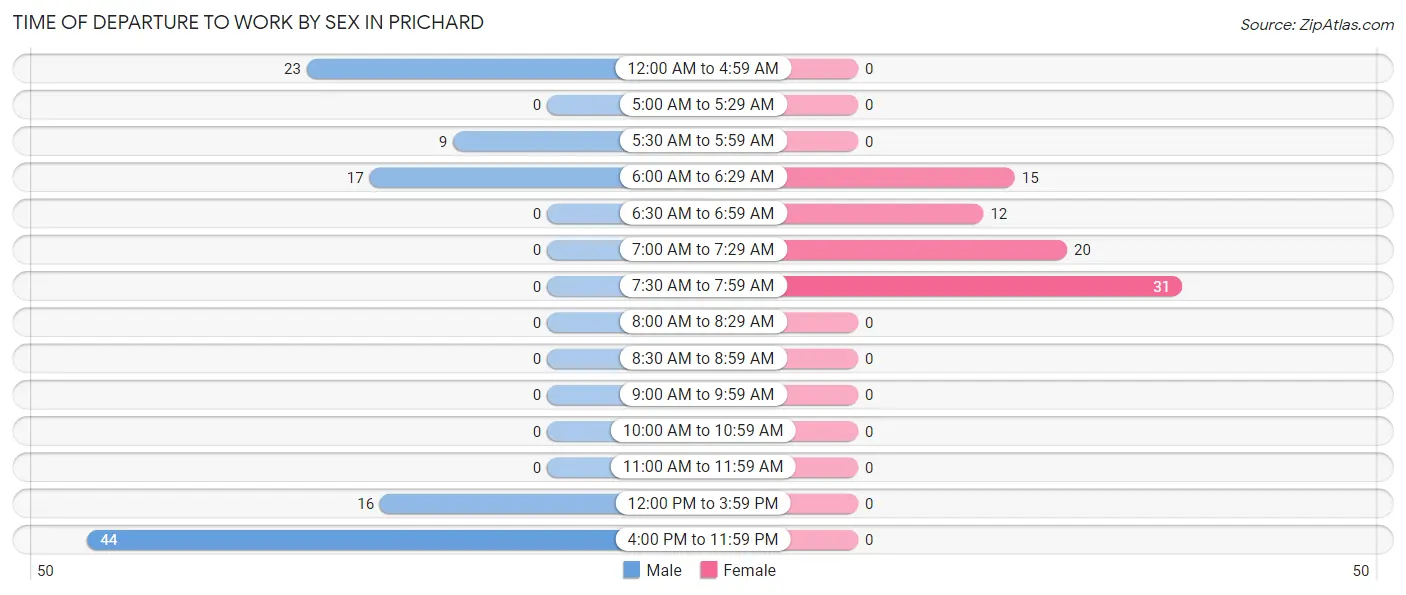
| Time of Departure | Male | Female |
| 12:00 AM to 4:59 AM | 23 (21.1%) | 0 (0.0%) |
| 5:00 AM to 5:29 AM | 0 (0.0%) | 0 (0.0%) |
| 5:30 AM to 5:59 AM | 9 (8.3%) | 0 (0.0%) |
| 6:00 AM to 6:29 AM | 17 (15.6%) | 15 (19.2%) |
| 6:30 AM to 6:59 AM | 0 (0.0%) | 12 (15.4%) |
| 7:00 AM to 7:29 AM | 0 (0.0%) | 20 (25.6%) |
| 7:30 AM to 7:59 AM | 0 (0.0%) | 31 (39.7%) |
| 8:00 AM to 8:29 AM | 0 (0.0%) | 0 (0.0%) |
| 8:30 AM to 8:59 AM | 0 (0.0%) | 0 (0.0%) |
| 9:00 AM to 9:59 AM | 0 (0.0%) | 0 (0.0%) |
| 10:00 AM to 10:59 AM | 0 (0.0%) | 0 (0.0%) |
| 11:00 AM to 11:59 AM | 0 (0.0%) | 0 (0.0%) |
| 12:00 PM to 3:59 PM | 16 (14.7%) | 0 (0.0%) |
| 4:00 PM to 11:59 PM | 44 (40.4%) | 0 (0.0%) |
| Total | 109 (100.0%) | 78 (100.0%) |
Housing Occupancy in Prichard
Occupancy by Ownership in Prichard
Of the total 191 dwellings in Prichard, owner-occupied units account for 124 (64.9%), while renter-occupied units make up 67 (35.1%).
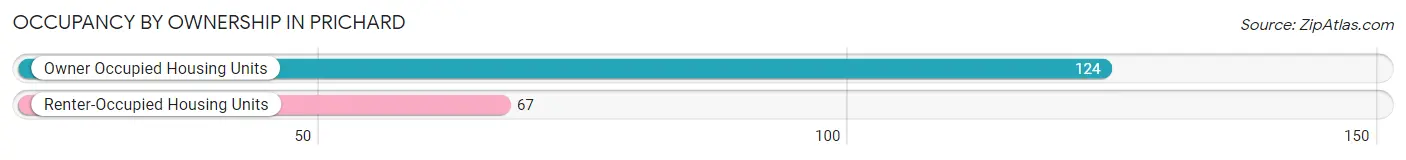
| Occupancy | # Housing Units | % Housing Units |
| Owner Occupied Housing Units | 124 | 64.9% |
| Renter-Occupied Housing Units | 67 | 35.1% |
| Total Occupied Housing Units | 191 | 100.0% |
Occupancy by Household Size in Prichard
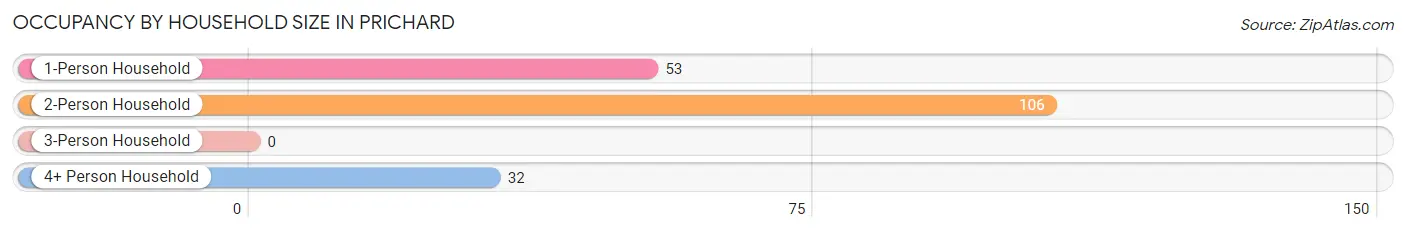
| Household Size | # Housing Units | % Housing Units |
| 1-Person Household | 53 | 27.8% |
| 2-Person Household | 106 | 55.5% |
| 3-Person Household | 0 | 0.0% |
| 4+ Person Household | 32 | 16.8% |
| Total Housing Units | 191 | 100.0% |
Occupancy by Ownership by Household Size in Prichard
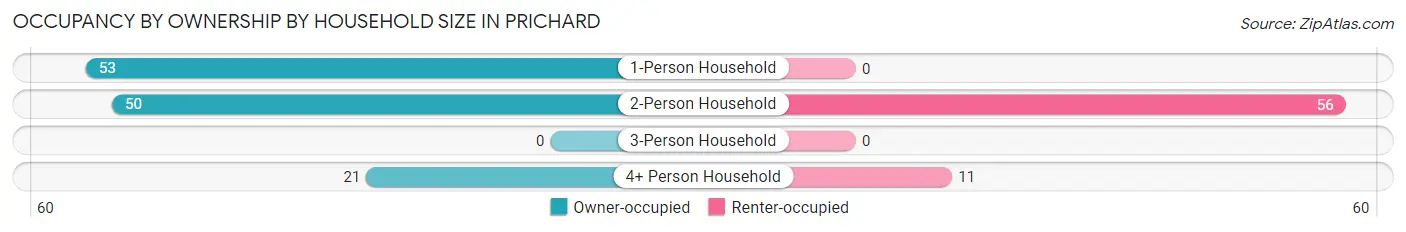
| Household Size | Owner-occupied | Renter-occupied |
| 1-Person Household | 53 (100.0%) | 0 (0.0%) |
| 2-Person Household | 50 (47.2%) | 56 (52.8%) |
| 3-Person Household | 0 (0.0%) | 0 (0.0%) |
| 4+ Person Household | 21 (65.6%) | 11 (34.4%) |
| Total Housing Units | 124 (64.9%) | 67 (35.1%) |
Occupancy by Educational Attainment in Prichard
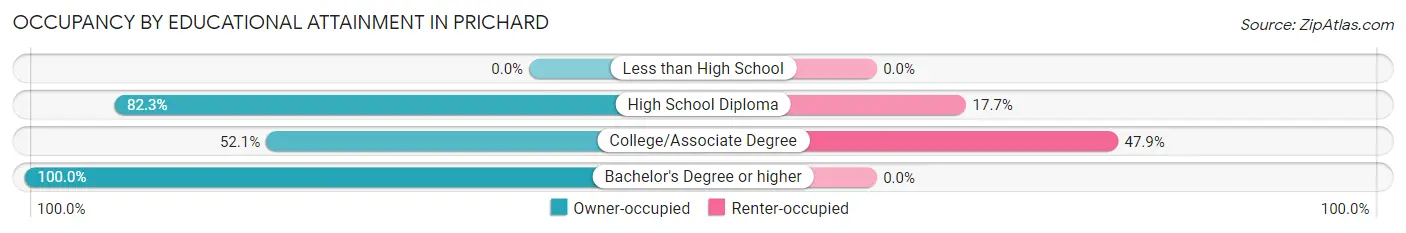
| Household Size | Owner-occupied | Renter-occupied |
| Less than High School | 0 (0.0%) | 0 (0.0%) |
| High School Diploma | 51 (82.3%) | 11 (17.7%) |
| College/Associate Degree | 61 (52.1%) | 56 (47.9%) |
| Bachelor's Degree or higher | 12 (100.0%) | 0 (0.0%) |
Occupancy by Age of Householder in Prichard
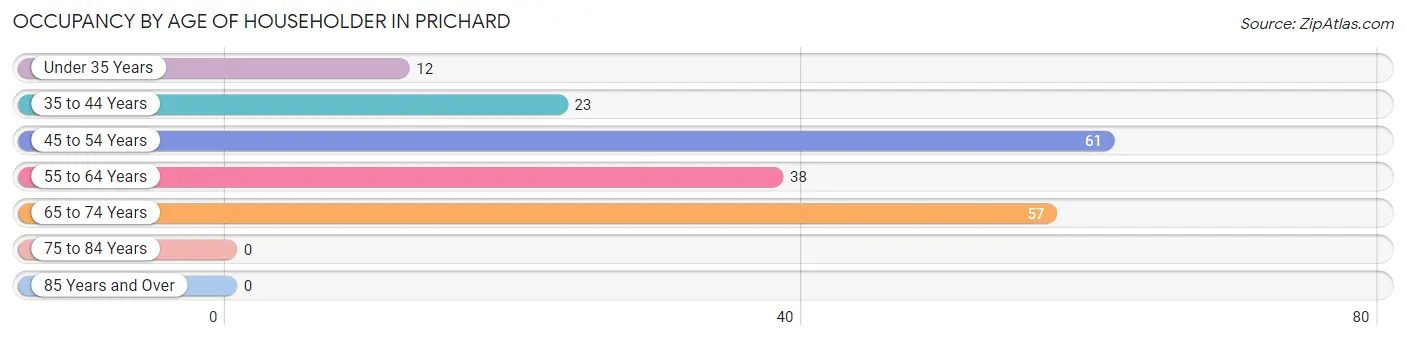
| Age Bracket | # Households | % Households |
| Under 35 Years | 12 | 6.3% |
| 35 to 44 Years | 23 | 12.0% |
| 45 to 54 Years | 61 | 31.9% |
| 55 to 64 Years | 38 | 19.9% |
| 65 to 74 Years | 57 | 29.8% |
| 75 to 84 Years | 0 | 0.0% |
| 85 Years and Over | 0 | 0.0% |
| Total | 191 | 100.0% |
Housing Finances in Prichard
Median Income by Occupancy in Prichard
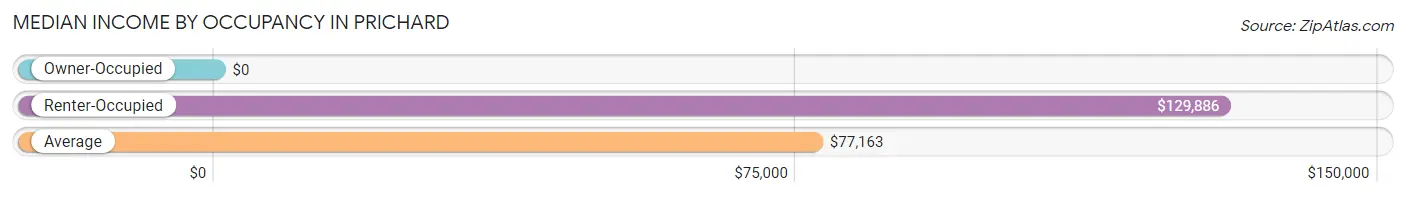
| Occupancy Type | # Households | Median Income |
| Owner-Occupied | 124 (64.9%) | $0 |
| Renter-Occupied | 67 (35.1%) | $129,886 |
| Average | 191 (100.0%) | $77,163 |
Occupancy by Householder Income Bracket in Prichard
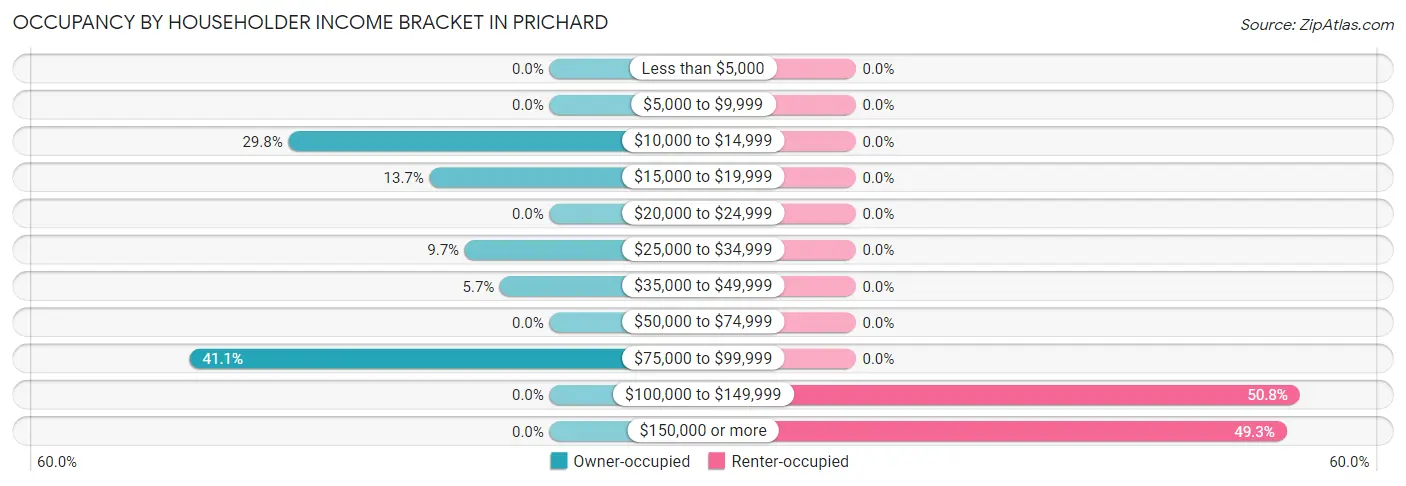
| Income Bracket | Owner-occupied | Renter-occupied |
| Less than $5,000 | 0 (0.0%) | 0 (0.0%) |
| $5,000 to $9,999 | 0 (0.0%) | 0 (0.0%) |
| $10,000 to $14,999 | 37 (29.8%) | 0 (0.0%) |
| $15,000 to $19,999 | 17 (13.7%) | 0 (0.0%) |
| $20,000 to $24,999 | 0 (0.0%) | 0 (0.0%) |
| $25,000 to $34,999 | 12 (9.7%) | 0 (0.0%) |
| $35,000 to $49,999 | 7 (5.7%) | 0 (0.0%) |
| $50,000 to $74,999 | 0 (0.0%) | 0 (0.0%) |
| $75,000 to $99,999 | 51 (41.1%) | 0 (0.0%) |
| $100,000 to $149,999 | 0 (0.0%) | 34 (50.7%) |
| $150,000 or more | 0 (0.0%) | 33 (49.2%) |
| Total | 124 (100.0%) | 67 (100.0%) |
Monthly Housing Cost Tiers in Prichard
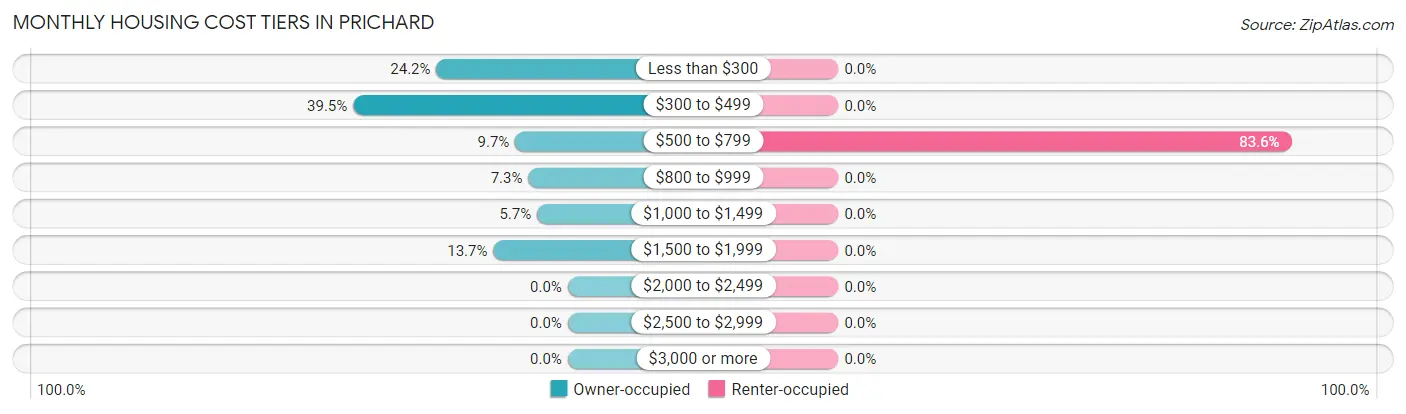
| Monthly Cost | Owner-occupied | Renter-occupied |
| Less than $300 | 30 (24.2%) | 0 (0.0%) |
| $300 to $499 | 49 (39.5%) | 0 (0.0%) |
| $500 to $799 | 12 (9.7%) | 56 (83.6%) |
| $800 to $999 | 9 (7.3%) | 0 (0.0%) |
| $1,000 to $1,499 | 7 (5.7%) | 0 (0.0%) |
| $1,500 to $1,999 | 17 (13.7%) | 0 (0.0%) |
| $2,000 to $2,499 | 0 (0.0%) | 0 (0.0%) |
| $2,500 to $2,999 | 0 (0.0%) | 0 (0.0%) |
| $3,000 or more | 0 (0.0%) | 0 (0.0%) |
| Total | 124 (100.0%) | 67 (100.0%) |
Physical Housing Characteristics in Prichard
Housing Structures in Prichard
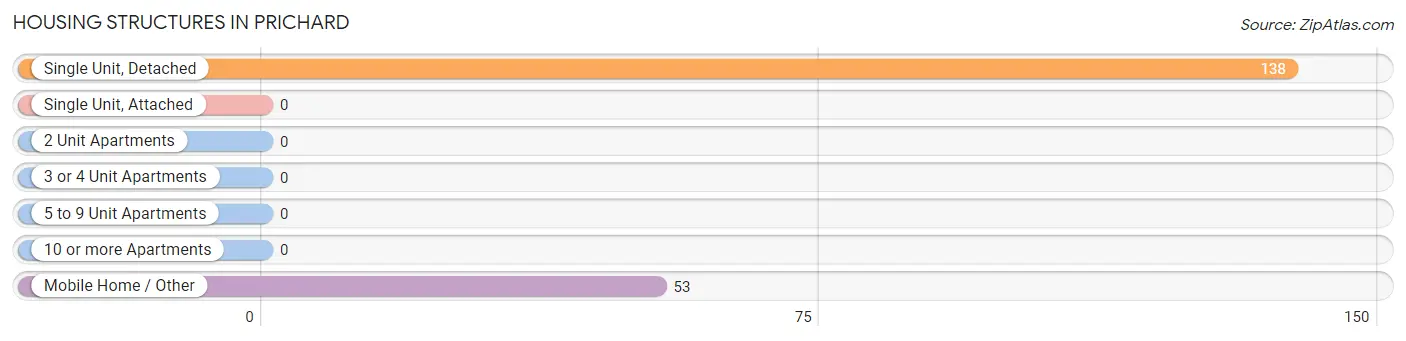
| Structure Type | # Housing Units | % Housing Units |
| Single Unit, Detached | 138 | 72.3% |
| Single Unit, Attached | 0 | 0.0% |
| 2 Unit Apartments | 0 | 0.0% |
| 3 or 4 Unit Apartments | 0 | 0.0% |
| 5 to 9 Unit Apartments | 0 | 0.0% |
| 10 or more Apartments | 0 | 0.0% |
| Mobile Home / Other | 53 | 27.8% |
| Total | 191 | 100.0% |
Housing Structures by Occupancy in Prichard
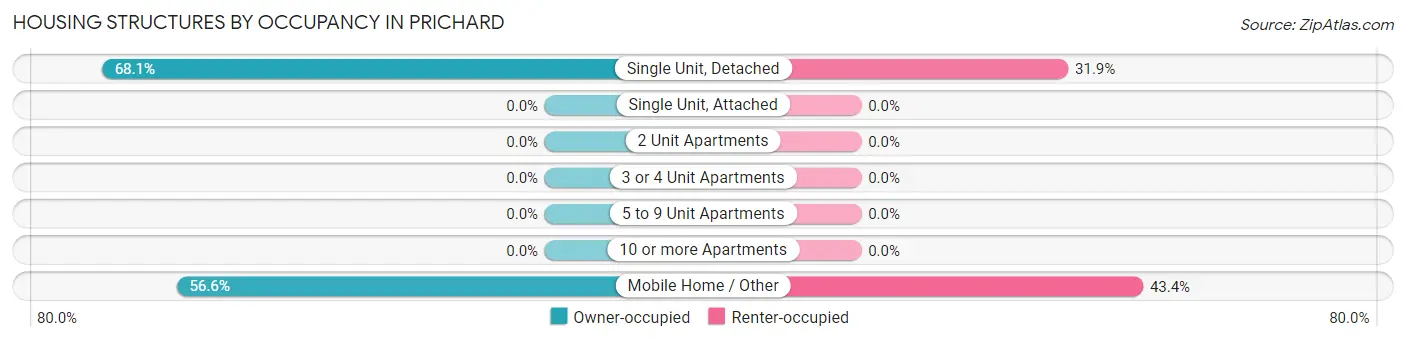
| Structure Type | Owner-occupied | Renter-occupied |
| Single Unit, Detached | 94 (68.1%) | 44 (31.9%) |
| Single Unit, Attached | 0 (0.0%) | 0 (0.0%) |
| 2 Unit Apartments | 0 (0.0%) | 0 (0.0%) |
| 3 or 4 Unit Apartments | 0 (0.0%) | 0 (0.0%) |
| 5 to 9 Unit Apartments | 0 (0.0%) | 0 (0.0%) |
| 10 or more Apartments | 0 (0.0%) | 0 (0.0%) |
| Mobile Home / Other | 30 (56.6%) | 23 (43.4%) |
| Total | 124 (64.9%) | 67 (35.1%) |
Housing Structures by Number of Rooms in Prichard
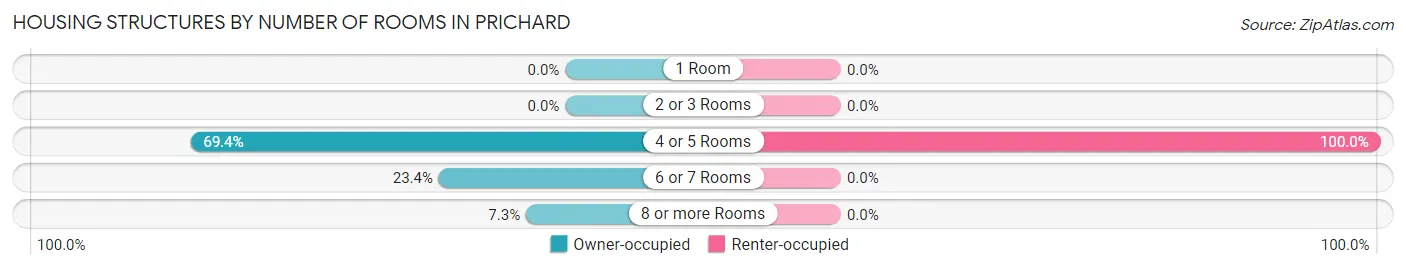
| Number of Rooms | Owner-occupied | Renter-occupied |
| 1 Room | 0 (0.0%) | 0 (0.0%) |
| 2 or 3 Rooms | 0 (0.0%) | 0 (0.0%) |
| 4 or 5 Rooms | 86 (69.4%) | 67 (100.0%) |
| 6 or 7 Rooms | 29 (23.4%) | 0 (0.0%) |
| 8 or more Rooms | 9 (7.3%) | 0 (0.0%) |
| Total | 124 (100.0%) | 67 (100.0%) |
Housing Structure by Heating Type in Prichard
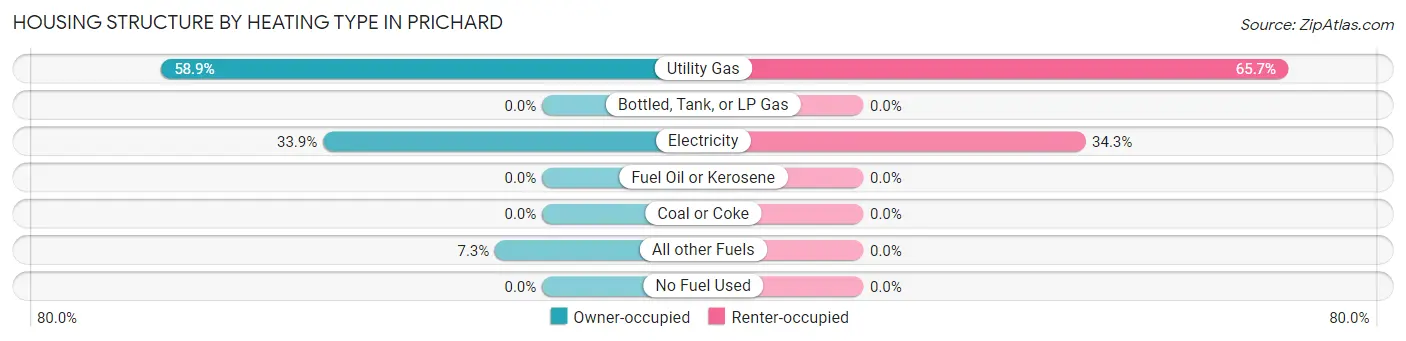
| Heating Type | Owner-occupied | Renter-occupied |
| Utility Gas | 73 (58.9%) | 44 (65.7%) |
| Bottled, Tank, or LP Gas | 0 (0.0%) | 0 (0.0%) |
| Electricity | 42 (33.9%) | 23 (34.3%) |
| Fuel Oil or Kerosene | 0 (0.0%) | 0 (0.0%) |
| Coal or Coke | 0 (0.0%) | 0 (0.0%) |
| All other Fuels | 9 (7.3%) | 0 (0.0%) |
| No Fuel Used | 0 (0.0%) | 0 (0.0%) |
| Total | 124 (100.0%) | 67 (100.0%) |
Household Vehicle Usage in Prichard
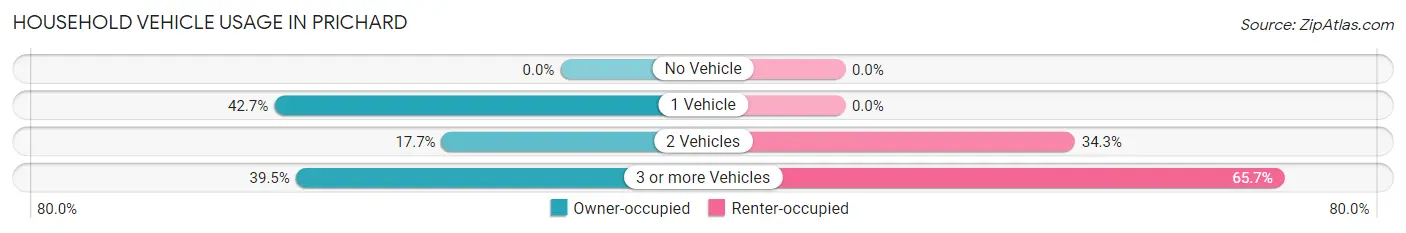
| Vehicles per Household | Owner-occupied | Renter-occupied |
| No Vehicle | 0 (0.0%) | 0 (0.0%) |
| 1 Vehicle | 53 (42.7%) | 0 (0.0%) |
| 2 Vehicles | 22 (17.7%) | 23 (34.3%) |
| 3 or more Vehicles | 49 (39.5%) | 44 (65.7%) |
| Total | 124 (100.0%) | 67 (100.0%) |
Real Estate & Mortgages in Prichard
Real Estate and Mortgage Overview in Prichard
| Characteristic | Without Mortgage | With Mortgage |
| Housing Units | 79 | 45 |
| Median Property Value | $87,900 | $0 |
| Median Household Income | $17,868 | $0 |
| Monthly Housing Costs | $360 | $0 |
| Real Estate Taxes | - | - |
Property Value by Mortgage Status in Prichard
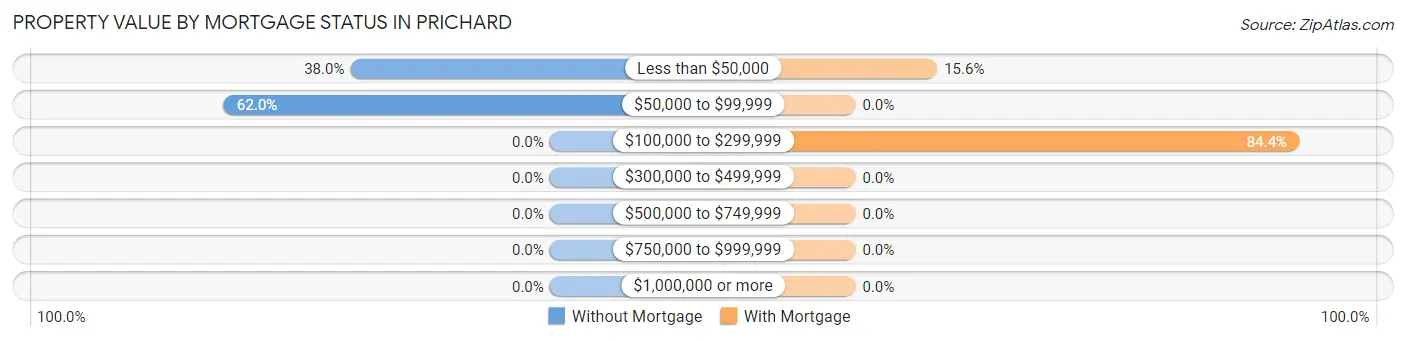
| Property Value | Without Mortgage | With Mortgage |
| Less than $50,000 | 30 (38.0%) | 7 (15.6%) |
| $50,000 to $99,999 | 49 (62.0%) | 0 (0.0%) |
| $100,000 to $299,999 | 0 (0.0%) | 38 (84.4%) |
| $300,000 to $499,999 | 0 (0.0%) | 0 (0.0%) |
| $500,000 to $749,999 | 0 (0.0%) | 0 (0.0%) |
| $750,000 to $999,999 | 0 (0.0%) | 0 (0.0%) |
| $1,000,000 or more | 0 (0.0%) | 0 (0.0%) |
| Total | 79 (100.0%) | 45 (100.0%) |
Household Income by Mortgage Status in Prichard
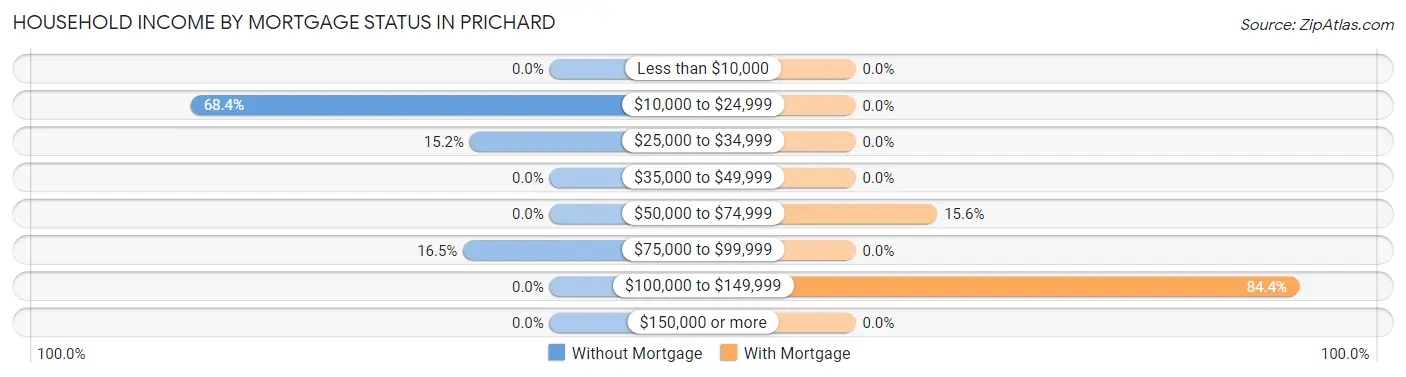
| Household Income | Without Mortgage | With Mortgage |
| Less than $10,000 | 0 (0.0%) | 0 (0.0%) |
| $10,000 to $24,999 | 54 (68.3%) | 0 (0.0%) |
| $25,000 to $34,999 | 12 (15.2%) | 0 (0.0%) |
| $35,000 to $49,999 | 0 (0.0%) | 0 (0.0%) |
| $50,000 to $74,999 | 0 (0.0%) | 7 (15.6%) |
| $75,000 to $99,999 | 13 (16.5%) | 0 (0.0%) |
| $100,000 to $149,999 | 0 (0.0%) | 38 (84.4%) |
| $150,000 or more | 0 (0.0%) | 0 (0.0%) |
| Total | 79 (100.0%) | 45 (100.0%) |
Property Value to Household Income Ratio in Prichard
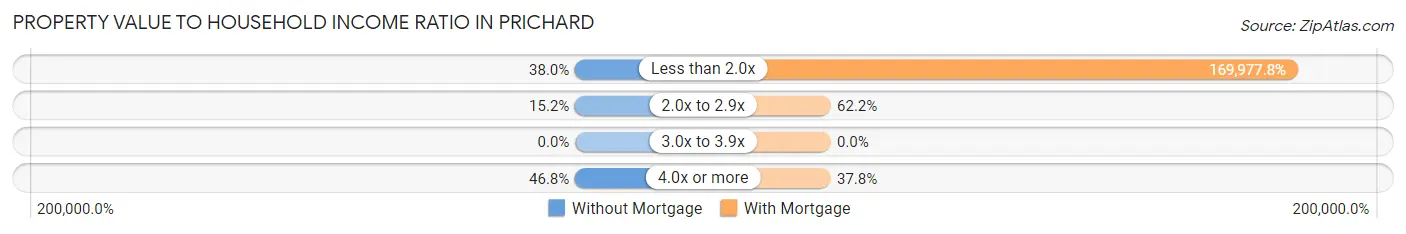
| Value-to-Income Ratio | Without Mortgage | With Mortgage |
| Less than 2.0x | 30 (38.0%) | 76,490 (169,977.8%) |
| 2.0x to 2.9x | 12 (15.2%) | 28 (62.2%) |
| 3.0x to 3.9x | 0 (0.0%) | 0 (0.0%) |
| 4.0x or more | 37 (46.8%) | 17 (37.8%) |
| Total | 79 (100.0%) | 45 (100.0%) |
Real Estate Taxes by Mortgage Status in Prichard
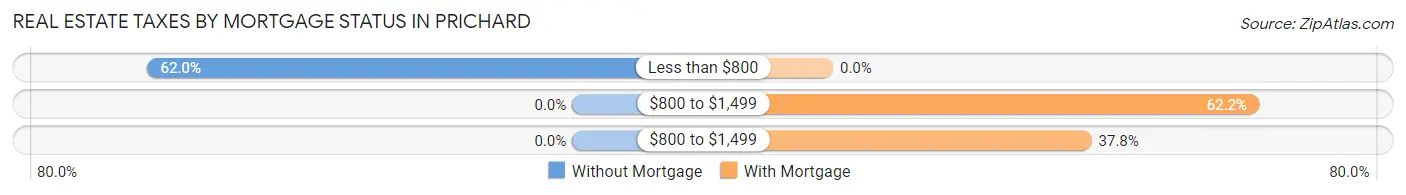
| Property Taxes | Without Mortgage | With Mortgage |
| Less than $800 | 49 (62.0%) | 0 (0.0%) |
| $800 to $1,499 | 0 (0.0%) | 28 (62.2%) |
| $800 to $1,499 | 0 (0.0%) | 17 (37.8%) |
| Total | 79 (100.0%) | 45 (100.0%) |
Health & Disability in Prichard
Health Insurance Coverage by Age in Prichard
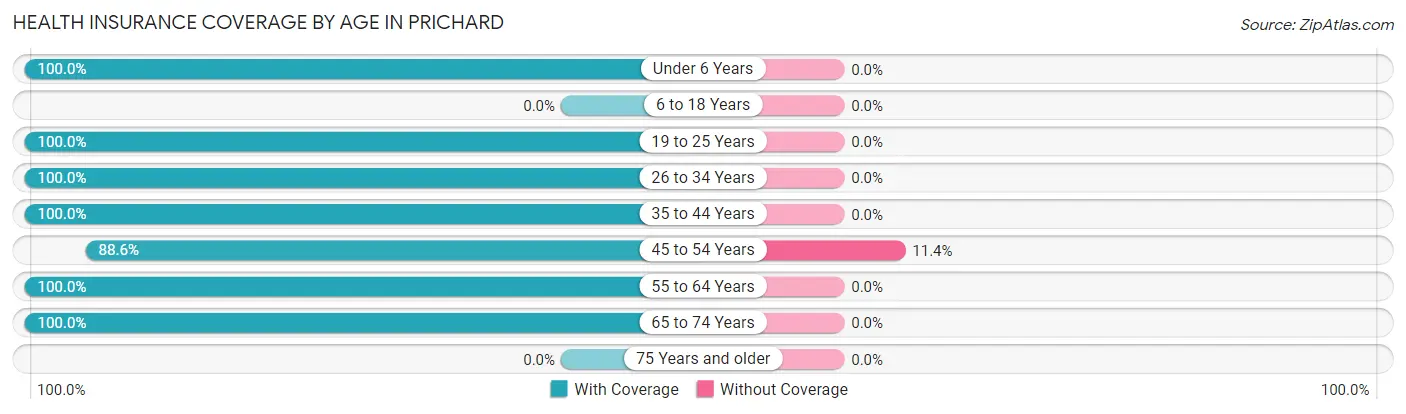
| Age Bracket | With Coverage | Without Coverage |
| Under 6 Years | 28 (100.0%) | 0 (0.0%) |
| 6 to 18 Years | 0 (0.0%) | 0 (0.0%) |
| 19 to 25 Years | 66 (100.0%) | 0 (0.0%) |
| 26 to 34 Years | 27 (100.0%) | 0 (0.0%) |
| 35 to 44 Years | 54 (100.0%) | 0 (0.0%) |
| 45 to 54 Years | 140 (88.6%) | 18 (11.4%) |
| 55 to 64 Years | 46 (100.0%) | 0 (0.0%) |
| 65 to 74 Years | 71 (100.0%) | 0 (0.0%) |
| 75 Years and older | 0 (0.0%) | 0 (0.0%) |
| Total | 432 (96.0%) | 18 (4.0%) |
Health Insurance Coverage by Citizenship Status in Prichard
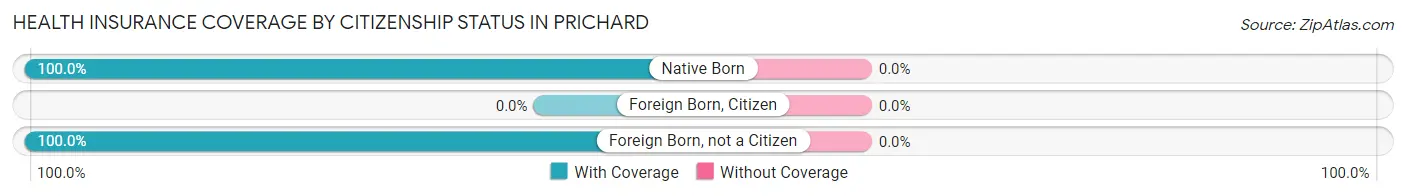
| Citizenship Status | With Coverage | Without Coverage |
| Native Born | 28 (100.0%) | 0 (0.0%) |
| Foreign Born, Citizen | 0 (0.0%) | 0 (0.0%) |
| Foreign Born, not a Citizen | 66 (100.0%) | 0 (0.0%) |
Health Insurance Coverage by Household Income in Prichard
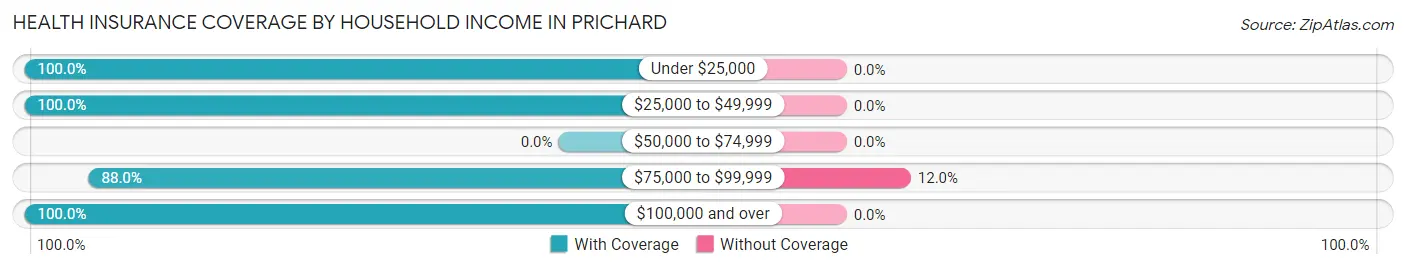
| Household Income | With Coverage | Without Coverage |
| Under $25,000 | 99 (100.0%) | 0 (0.0%) |
| $25,000 to $49,999 | 19 (100.0%) | 0 (0.0%) |
| $50,000 to $74,999 | 0 (0.0%) | 0 (0.0%) |
| $75,000 to $99,999 | 132 (88.0%) | 18 (12.0%) |
| $100,000 and over | 182 (100.0%) | 0 (0.0%) |
Public vs Private Health Insurance Coverage by Age in Prichard
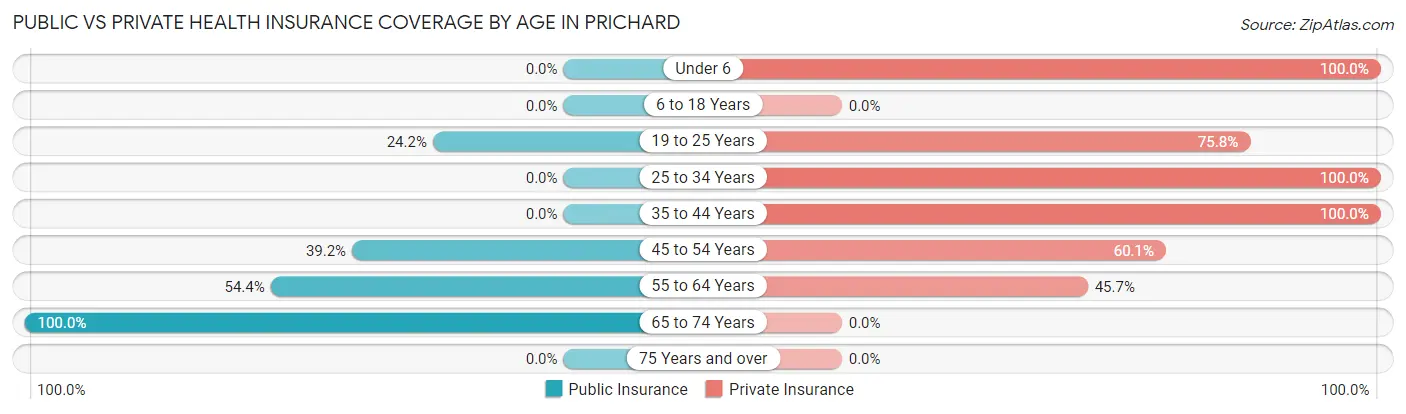
| Age Bracket | Public Insurance | Private Insurance |
| Under 6 | 0 (0.0%) | 28 (100.0%) |
| 6 to 18 Years | 0 (0.0%) | 0 (0.0%) |
| 19 to 25 Years | 16 (24.2%) | 50 (75.8%) |
| 25 to 34 Years | 0 (0.0%) | 27 (100.0%) |
| 35 to 44 Years | 0 (0.0%) | 54 (100.0%) |
| 45 to 54 Years | 62 (39.2%) | 95 (60.1%) |
| 55 to 64 Years | 25 (54.3%) | 21 (45.7%) |
| 65 to 74 Years | 71 (100.0%) | 0 (0.0%) |
| 75 Years and over | 0 (0.0%) | 0 (0.0%) |
| Total | 174 (38.7%) | 275 (61.1%) |
Disability Status by Sex by Age in Prichard
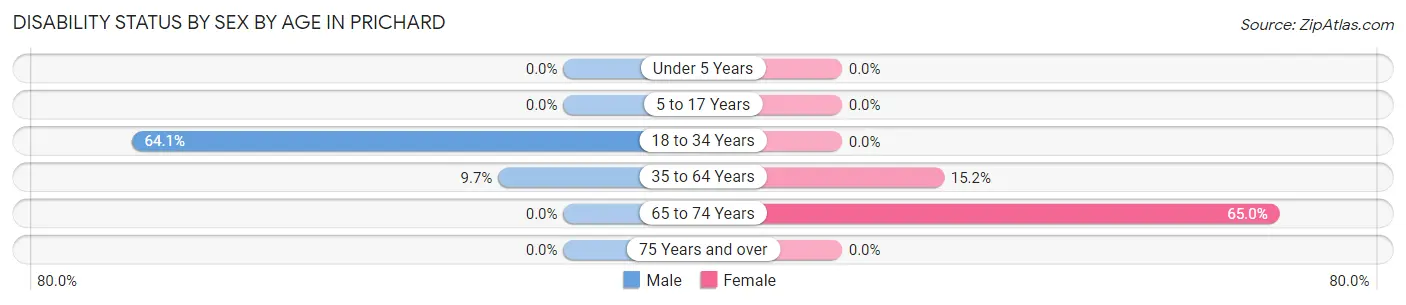
| Age Bracket | Male | Female |
| Under 5 Years | 0 (0.0%) | 0 (0.0%) |
| 5 to 17 Years | 0 (0.0%) | 0 (0.0%) |
| 18 to 34 Years | 50 (64.1%) | 0 (0.0%) |
| 35 to 64 Years | 9 (9.7%) | 25 (15.1%) |
| 65 to 74 Years | 0 (0.0%) | 13 (65.0%) |
| 75 Years and over | 0 (0.0%) | 0 (0.0%) |
Disability Class by Sex by Age in Prichard
Disability Class: Hearing Difficulty

| Age Bracket | Male | Female |
| Under 5 Years | 0 (0.0%) | 0 (0.0%) |
| 5 to 17 Years | 0 (0.0%) | 0 (0.0%) |
| 18 to 34 Years | 0 (0.0%) | 0 (0.0%) |
| 35 to 64 Years | 9 (9.7%) | 0 (0.0%) |
| 65 to 74 Years | 0 (0.0%) | 0 (0.0%) |
| 75 Years and over | 0 (0.0%) | 0 (0.0%) |
Disability Class: Vision Difficulty
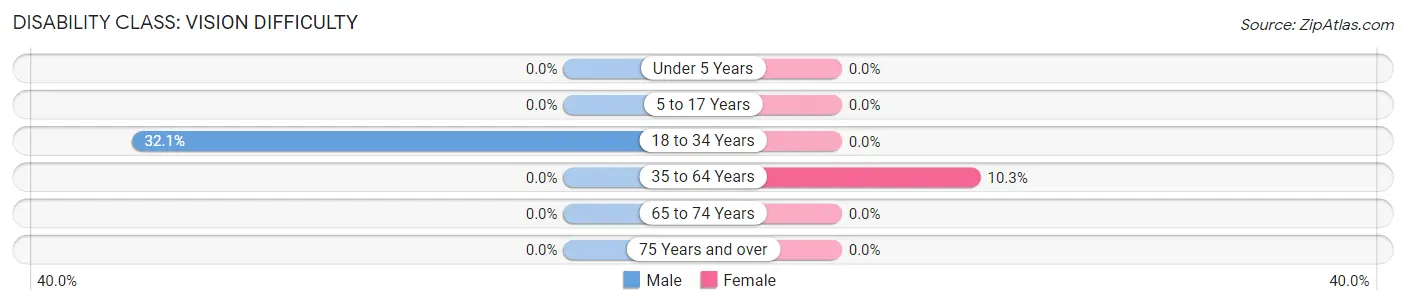
| Age Bracket | Male | Female |
| Under 5 Years | 0 (0.0%) | 0 (0.0%) |
| 5 to 17 Years | 0 (0.0%) | 0 (0.0%) |
| 18 to 34 Years | 25 (32.1%) | 0 (0.0%) |
| 35 to 64 Years | 0 (0.0%) | 17 (10.3%) |
| 65 to 74 Years | 0 (0.0%) | 0 (0.0%) |
| 75 Years and over | 0 (0.0%) | 0 (0.0%) |
Disability Class: Cognitive Difficulty
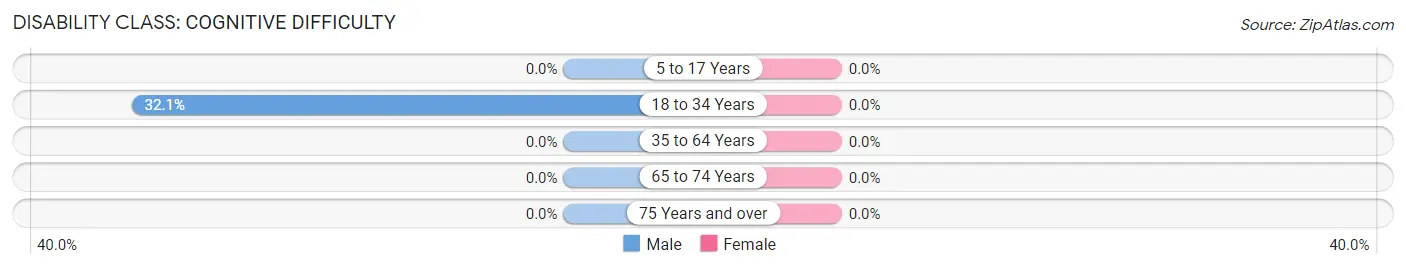
| Age Bracket | Male | Female |
| 5 to 17 Years | 0 (0.0%) | 0 (0.0%) |
| 18 to 34 Years | 25 (32.1%) | 0 (0.0%) |
| 35 to 64 Years | 0 (0.0%) | 0 (0.0%) |
| 65 to 74 Years | 0 (0.0%) | 0 (0.0%) |
| 75 Years and over | 0 (0.0%) | 0 (0.0%) |
Disability Class: Ambulatory Difficulty
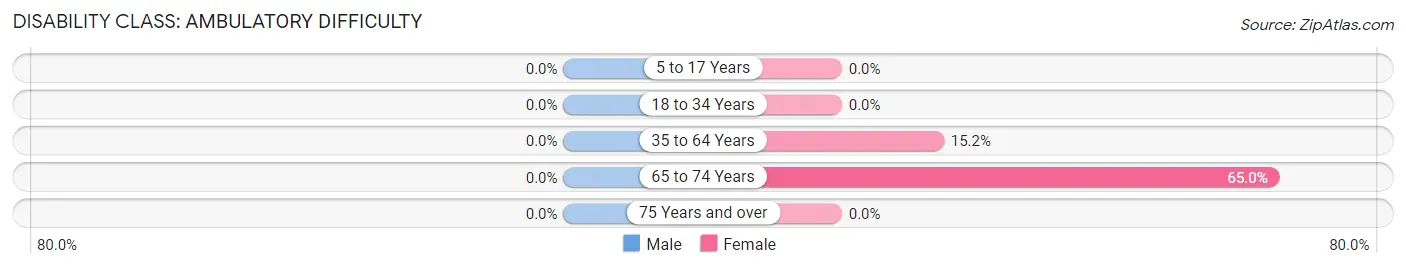
| Age Bracket | Male | Female |
| 5 to 17 Years | 0 (0.0%) | 0 (0.0%) |
| 18 to 34 Years | 0 (0.0%) | 0 (0.0%) |
| 35 to 64 Years | 0 (0.0%) | 25 (15.1%) |
| 65 to 74 Years | 0 (0.0%) | 13 (65.0%) |
| 75 Years and over | 0 (0.0%) | 0 (0.0%) |
Disability Class: Self-Care Difficulty
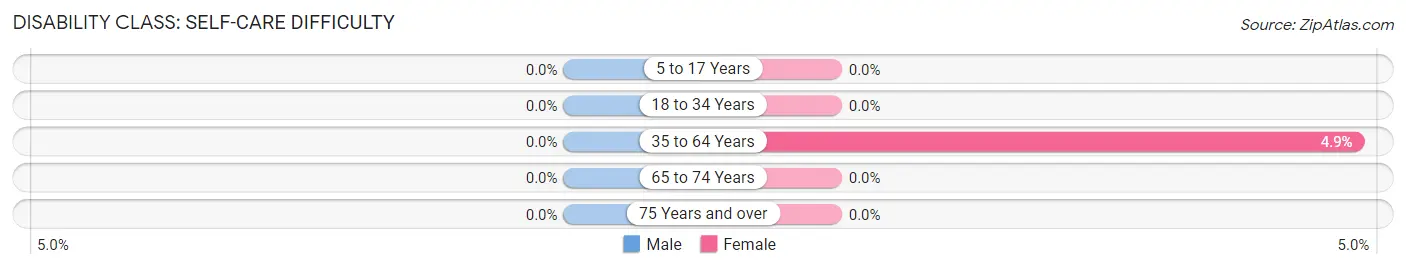
| Age Bracket | Male | Female |
| 5 to 17 Years | 0 (0.0%) | 0 (0.0%) |
| 18 to 34 Years | 0 (0.0%) | 0 (0.0%) |
| 35 to 64 Years | 0 (0.0%) | 8 (4.9%) |
| 65 to 74 Years | 0 (0.0%) | 0 (0.0%) |
| 75 Years and over | 0 (0.0%) | 0 (0.0%) |
Technology Access in Prichard
Computing Device Access in Prichard
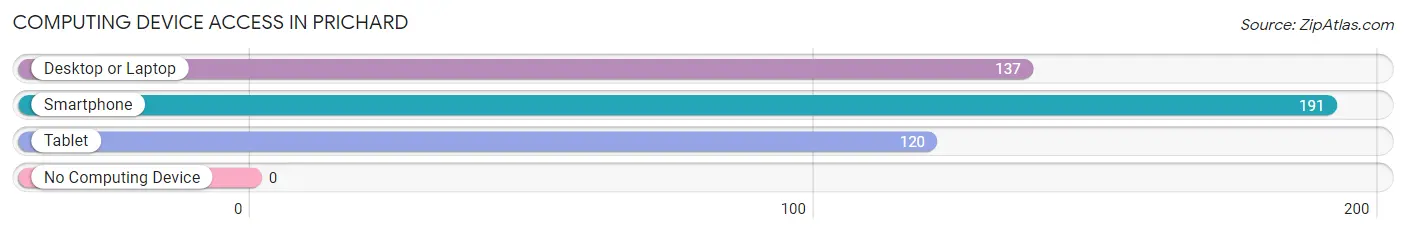
| Device Type | # Households | % Households |
| Desktop or Laptop | 137 | 71.7% |
| Smartphone | 191 | 100.0% |
| Tablet | 120 | 62.8% |
| No Computing Device | 0 | 0.0% |
| Total | 191 | 100.0% |
Internet Access in Prichard
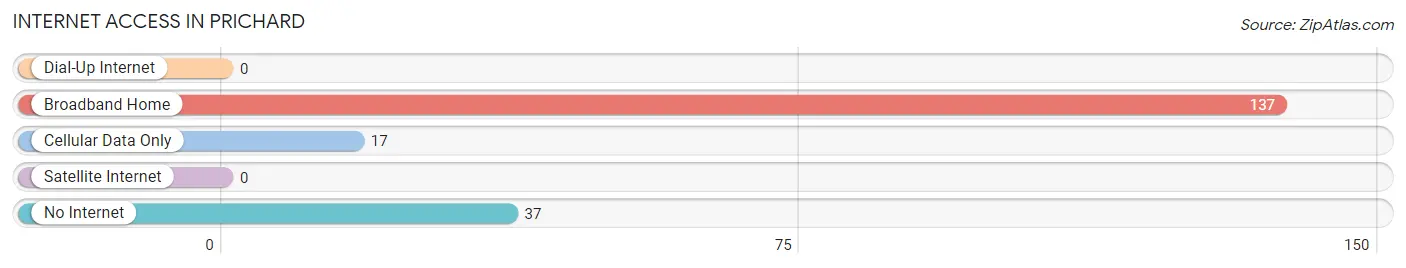
| Internet Type | # Households | % Households |
| Dial-Up Internet | 0 | 0.0% |
| Broadband Home | 137 | 71.7% |
| Cellular Data Only | 17 | 8.9% |
| Satellite Internet | 0 | 0.0% |
| No Internet | 37 | 19.4% |
| Total | 191 | 100.0% |
Prichard Summary
Prichard, West Virginia is a small town located in the southwestern part of the state, in Wayne County. It is situated on the banks of the Big Sandy River, and is home to a population of just over 1,000 people. The town was founded in 1891, and has a rich history of coal mining, logging, and farming.
Geography
Prichard is located in the Appalachian Mountains, and is surrounded by rolling hills and lush forests. The town is situated on the banks of the Big Sandy River, and is bordered by the towns of Fort Gay and Wayne. The town is located at an elevation of 890 feet, and has a total area of 0.7 square miles.
Economy
The economy of Prichard is largely based on the coal mining industry. The town is home to several coal mines, and the coal industry is the primary source of employment for the town’s residents. In addition to coal mining, the town is also home to several small businesses, including restaurants, convenience stores, and a few small manufacturing plants.
Demographics
As of the 2010 census, Prichard had a population of 1,072 people. The racial makeup of the town was 97.2% White, 0.9% African American, 0.2% Native American, 0.2% Asian, 0.1% Pacific Islander, and 1.4% from two or more races. The median household income was $25,938, and the median family income was $31,250. The per capita income was $14,945.
History
Prichard was founded in 1891, and was named after the Prichard family, who were early settlers in the area. The town was originally a small farming community, but the discovery of coal in the area in the early 1900s led to a boom in the coal mining industry. The town quickly grew, and by the 1920s, it was home to several coal mines and a bustling economy.
The town’s economy continued to thrive until the 1950s, when the coal industry began to decline. The town’s population began to decline as well, and by the 1970s, the town was in a state of decline. In recent years, the town has seen a resurgence in its economy, thanks to the growth of the tourism industry in the area.
Prichard is a small town with a rich history and a bright future. The town is home to a diverse population, and is a great place to live and work. With its close proximity to the Big Sandy River, the town is a popular destination for outdoor enthusiasts, and is a great place to explore the beauty of the Appalachian Mountains.
Common Questions
What is Per Capita Income in Prichard?
Per Capita income in Prichard is $32,898.
What is the Median Family Income in Prichard?
Median Family Income in Prichard is $97,115.
What is the Median Household income in Prichard?
Median Household Income in Prichard is $77,163.
What is Inequality or Gini Index in Prichard?
Inequality or Gini Index in Prichard is 0.37.
What is the Total Population of Prichard?
Total Population of Prichard is 450.
What is the Total Male Population of Prichard?
Total Male Population of Prichard is 222.
What is the Total Female Population of Prichard?
Total Female Population of Prichard is 228.
What is the Ratio of Males per 100 Females in Prichard?
There are 97.37 Males per 100 Females in Prichard.
What is the Ratio of Females per 100 Males in Prichard?
There are 102.70 Females per 100 Males in Prichard.
What is the Median Population Age in Prichard?
Median Population Age in Prichard is 49.2 Years.
What is the Average Family Size in Prichard
Average Family Size in Prichard is 2.9 People.
What is the Average Household Size in Prichard
Average Household Size in Prichard is 2.4 People.
How Large is the Labor Force in Prichard?
There are 187 People in the Labor Forcein in Prichard.
What is the Percentage of People in the Labor Force in Prichard?
44.3% of People are in the Labor Force in Prichard.