Pine Grove, WV Map & Demographics
Pine Grove Map
Pine Grove Overview
$31,772
PER CAPITA INCOME
$79,896
AVG FAMILY INCOME
$72,250
AVG HOUSEHOLD INCOME
84.5%
WAGE / INCOME GAP [ % ]
15.5¢/ $1
WAGE / INCOME GAP [ $ ]
0.37
INEQUALITY / GINI INDEX
214
TOTAL POPULATION
96
MALE POPULATION
118
FEMALE POPULATION
81.36
MALES / 100 FEMALES
122.92
FEMALES / 100 MALES
54.9
MEDIAN AGE
2.3
AVG FAMILY SIZE
1.9
AVG HOUSEHOLD SIZE
93
LABOR FORCE [ PEOPLE ]
48.4%
PERCENT IN LABOR FORCE
15.1%
UNEMPLOYMENT RATE
Pine Grove Zip Codes
Income in Pine Grove
Income Overview in Pine Grove
Per Capita Income in Pine Grove is $31,772, while median incomes of families and households are $79,896 and $72,250 respectively.
| Characteristic | Number | Measure |
| Per Capita Income | 214 | $31,772 |
| Median Family Income | 69 | $79,896 |
| Mean Family Income | 69 | $84,254 |
| Median Household Income | 115 | $72,250 |
| Mean Household Income | 115 | $62,813 |
| Income Deficit | 69 | $0 |
| Wage / Income Gap (%) | 214 | 84.49% |
| Wage / Income Gap ($) | 214 | 15.51¢ per $1 |
| Gini / Inequality Index | 214 | 0.37 |
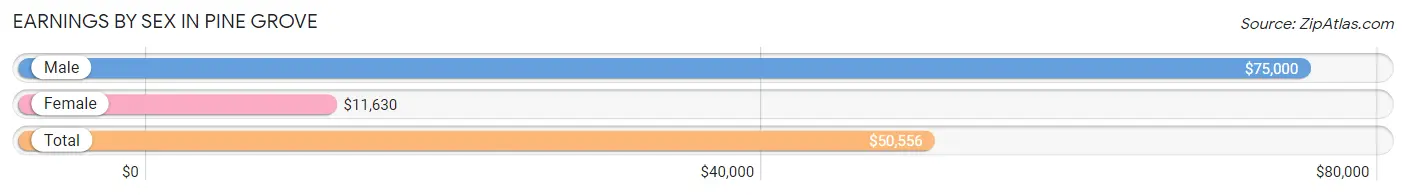
Earnings by Sex in Pine Grove
Average Earnings in Pine Grove are $50,556, $75,000 for men and $11,630 for women, a difference of 84.5%.
| Sex | Number | Average Earnings |
| Male | 60 (62.5%) | $75,000 |
| Female | 36 (37.5%) | $11,630 |
| Total | 96 (100.0%) | $50,556 |
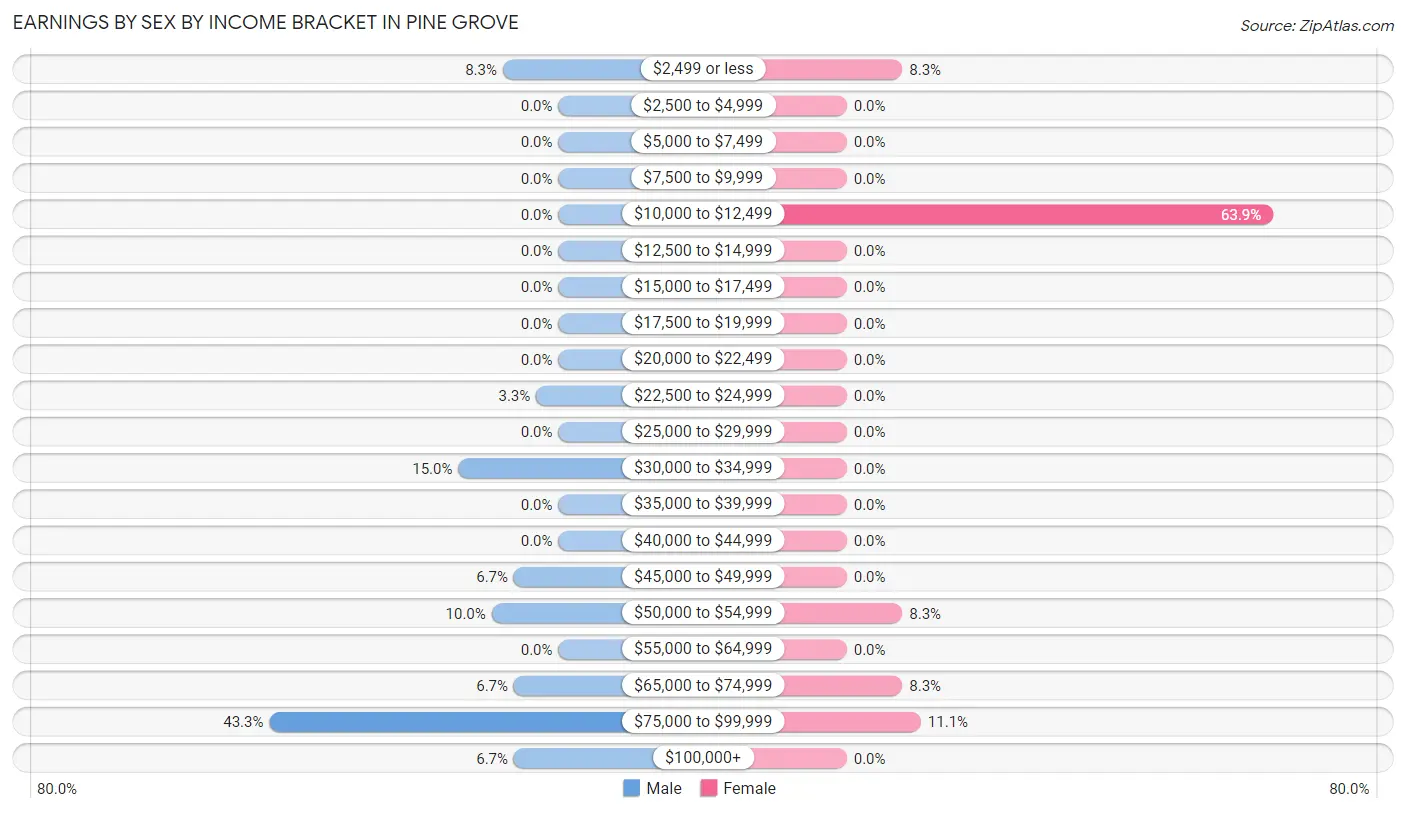
Earnings by Sex by Income Bracket in Pine Grove
The most common earnings brackets in Pine Grove are $75,000 to $99,999 for men (26 | 43.3%) and $10,000 to $12,499 for women (23 | 63.9%).
| Income | Male | Female |
| $2,499 or less | 5 (8.3%) | 3 (8.3%) |
| $2,500 to $4,999 | 0 (0.0%) | 0 (0.0%) |
| $5,000 to $7,499 | 0 (0.0%) | 0 (0.0%) |
| $7,500 to $9,999 | 0 (0.0%) | 0 (0.0%) |
| $10,000 to $12,499 | 0 (0.0%) | 23 (63.9%) |
| $12,500 to $14,999 | 0 (0.0%) | 0 (0.0%) |
| $15,000 to $17,499 | 0 (0.0%) | 0 (0.0%) |
| $17,500 to $19,999 | 0 (0.0%) | 0 (0.0%) |
| $20,000 to $22,499 | 0 (0.0%) | 0 (0.0%) |
| $22,500 to $24,999 | 2 (3.3%) | 0 (0.0%) |
| $25,000 to $29,999 | 0 (0.0%) | 0 (0.0%) |
| $30,000 to $34,999 | 9 (15.0%) | 0 (0.0%) |
| $35,000 to $39,999 | 0 (0.0%) | 0 (0.0%) |
| $40,000 to $44,999 | 0 (0.0%) | 0 (0.0%) |
| $45,000 to $49,999 | 4 (6.7%) | 0 (0.0%) |
| $50,000 to $54,999 | 6 (10.0%) | 3 (8.3%) |
| $55,000 to $64,999 | 0 (0.0%) | 0 (0.0%) |
| $65,000 to $74,999 | 4 (6.7%) | 3 (8.3%) |
| $75,000 to $99,999 | 26 (43.3%) | 4 (11.1%) |
| $100,000+ | 4 (6.7%) | 0 (0.0%) |
| Total | 60 (100.0%) | 36 (100.0%) |
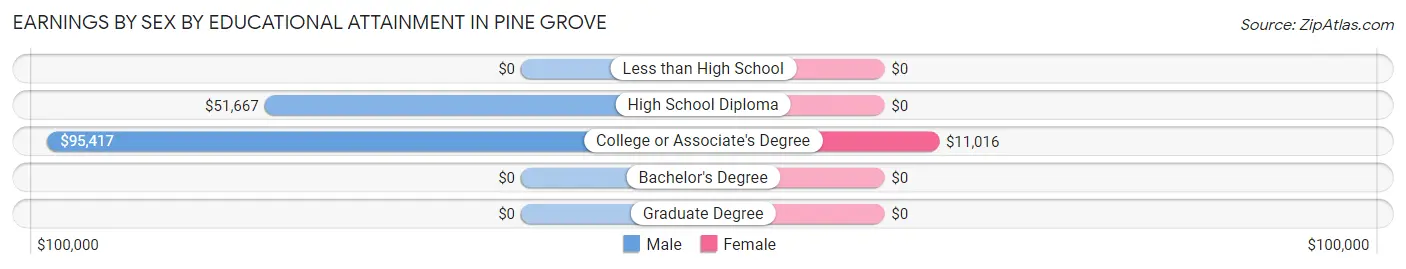
Earnings by Sex by Educational Attainment in Pine Grove
Average earnings in Pine Grove are $79,063 for men and $11,630 for women, a difference of 85.3%. Men with an educational attainment of college or associate's degree enjoy the highest average annual earnings of $95,417, while those with high school diploma education earn the least with $51,667. Women with an educational attainment of college or associate's degree earn the most with the average annual earnings of $11,016, while those with college or associate's degree education have the smallest earnings of $11,016.
| Educational Attainment | Male Income | Female Income |
| Less than High School | - | - |
| High School Diploma | $51,667 | $0 |
| College or Associate's Degree | $95,417 | $11,016 |
| Bachelor's Degree | - | - |
| Graduate Degree | - | - |
| Total | $79,063 | $11,630 |
Family Income in Pine Grove
Family Income Brackets in Pine Grove
According to the Pine Grove family income data, there are 28 families falling into the $100,000 to $149,999 income range, which is the most common income bracket and makes up 40.6% of all families.
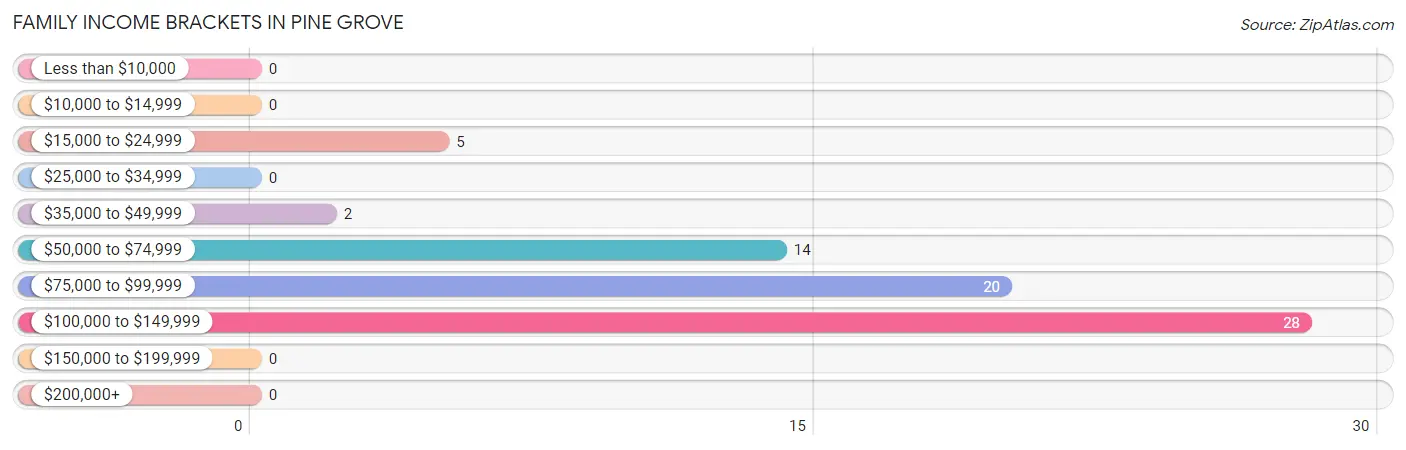
| Income Bracket | # Families | % Families |
| Less than $10,000 | 0 | 0.0% |
| $10,000 to $14,999 | 0 | 0.0% |
| $15,000 to $24,999 | 5 | 7.2% |
| $25,000 to $34,999 | 0 | 0.0% |
| $35,000 to $49,999 | 2 | 2.9% |
| $50,000 to $74,999 | 14 | 20.3% |
| $75,000 to $99,999 | 20 | 29.0% |
| $100,000 to $149,999 | 28 | 40.6% |
| $150,000 to $199,999 | 0 | 0.0% |
| $200,000+ | 0 | 0.0% |
Family Income by Famaliy Size in Pine Grove
3-person families (34 | 49.3%) account for the highest median family income in Pine Grove with $105,139 per family, while 2-person families (33 | 47.8%) have the highest median income of $36,125 per family member.
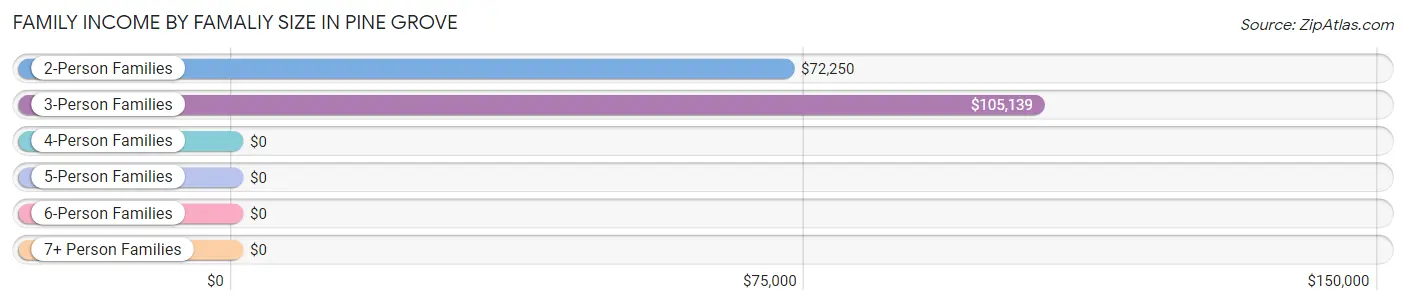
| Income Bracket | # Families | Median Income |
| 2-Person Families | 33 (47.8%) | $72,250 |
| 3-Person Families | 34 (49.3%) | $105,139 |
| 4-Person Families | 2 (2.9%) | $0 |
| 5-Person Families | 0 (0.0%) | $0 |
| 6-Person Families | 0 (0.0%) | $0 |
| 7+ Person Families | 0 (0.0%) | $0 |
| Total | 69 (100.0%) | $79,896 |
Family Income by Number of Earners in Pine Grove
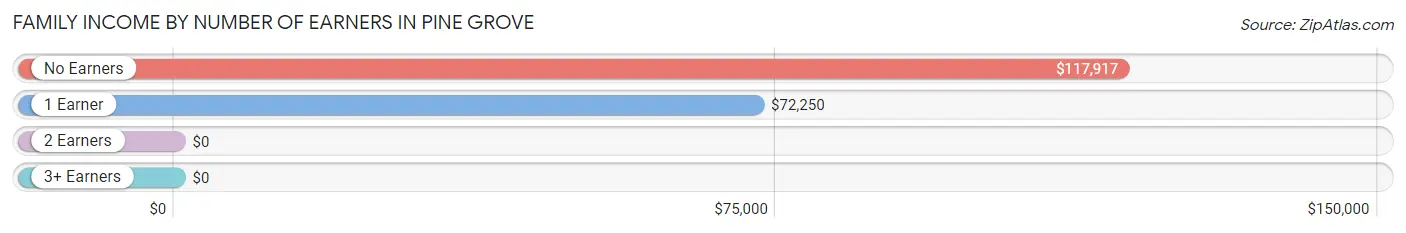
| Number of Earners | # Families | Median Income |
| No Earners | 10 (14.5%) | $117,917 |
| 1 Earner | 35 (50.7%) | $72,250 |
| 2 Earners | 22 (31.9%) | $0 |
| 3+ Earners | 2 (2.9%) | $0 |
| Total | 69 (100.0%) | $79,896 |
Household Income in Pine Grove
Household Income Brackets in Pine Grove
With 32 households falling in the category, the $100,000 to $149,999 income range is the most frequent in Pine Grove, accounting for 27.8% of all households.
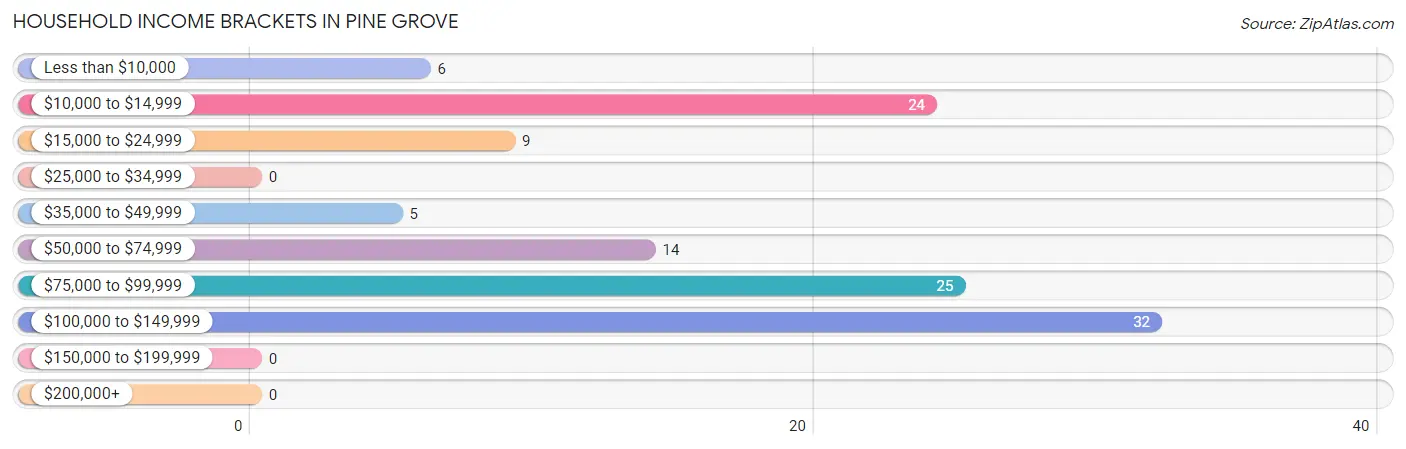
| Income Bracket | # Households | % Households |
| Less than $10,000 | 6 | 5.2% |
| $10,000 to $14,999 | 24 | 20.9% |
| $15,000 to $24,999 | 9 | 7.8% |
| $25,000 to $34,999 | 0 | 0.0% |
| $35,000 to $49,999 | 5 | 4.3% |
| $50,000 to $74,999 | 14 | 12.2% |
| $75,000 to $99,999 | 25 | 21.7% |
| $100,000 to $149,999 | 32 | 27.8% |
| $150,000 to $199,999 | 0 | 0.0% |
| $200,000+ | 0 | 0.0% |
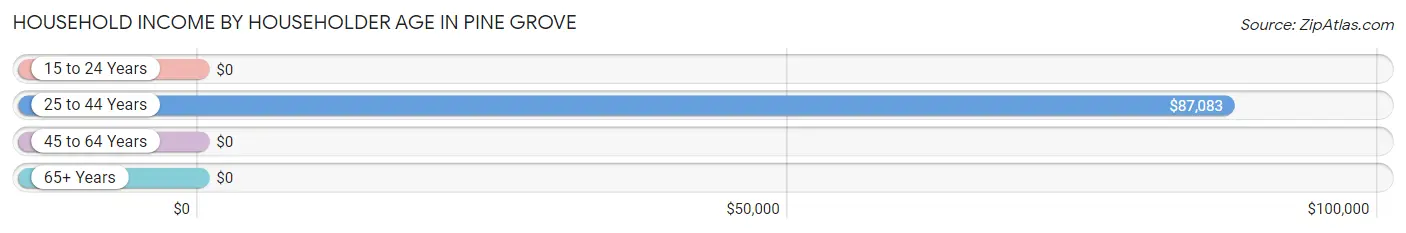
Household Income by Householder Age in Pine Grove
The median household income in Pine Grove is $72,250, with the highest median household income of $87,083 found in the 25 to 44 years age bracket for the primary householder. A total of 37 households (32.2%) fall into this category.
| Income Bracket | # Households | Median Income |
| 15 to 24 Years | 0 (0.0%) | $0 |
| 25 to 44 Years | 37 (32.2%) | $87,083 |
| 45 to 64 Years | 44 (38.3%) | $0 |
| 65+ Years | 34 (29.6%) | $0 |
| Total | 115 (100.0%) | $72,250 |
Poverty in Pine Grove
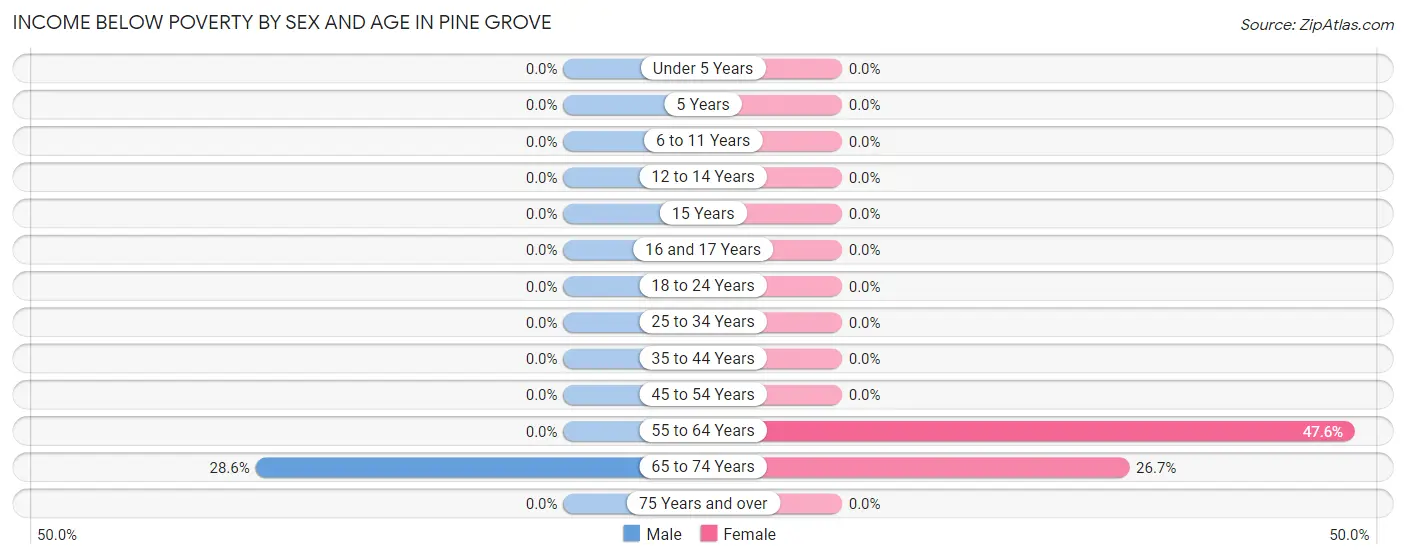
Income Below Poverty by Sex and Age in Pine Grove
With 6.2% poverty level for males and 20.3% for females among the residents of Pine Grove, 65 to 74 year old males and 55 to 64 year old females are the most vulnerable to poverty, with 6 males (28.6%) and 20 females (47.6%) in their respective age groups living below the poverty level.
| Age Bracket | Male | Female |
| Under 5 Years | 0 (0.0%) | 0 (0.0%) |
| 5 Years | 0 (0.0%) | 0 (0.0%) |
| 6 to 11 Years | 0 (0.0%) | 0 (0.0%) |
| 12 to 14 Years | 0 (0.0%) | 0 (0.0%) |
| 15 Years | 0 (0.0%) | 0 (0.0%) |
| 16 and 17 Years | 0 (0.0%) | 0 (0.0%) |
| 18 to 24 Years | 0 (0.0%) | 0 (0.0%) |
| 25 to 34 Years | 0 (0.0%) | 0 (0.0%) |
| 35 to 44 Years | 0 (0.0%) | 0 (0.0%) |
| 45 to 54 Years | 0 (0.0%) | 0 (0.0%) |
| 55 to 64 Years | 0 (0.0%) | 20 (47.6%) |
| 65 to 74 Years | 6 (28.6%) | 4 (26.7%) |
| 75 Years and over | 0 (0.0%) | 0 (0.0%) |
| Total | 6 (6.2%) | 24 (20.3%) |
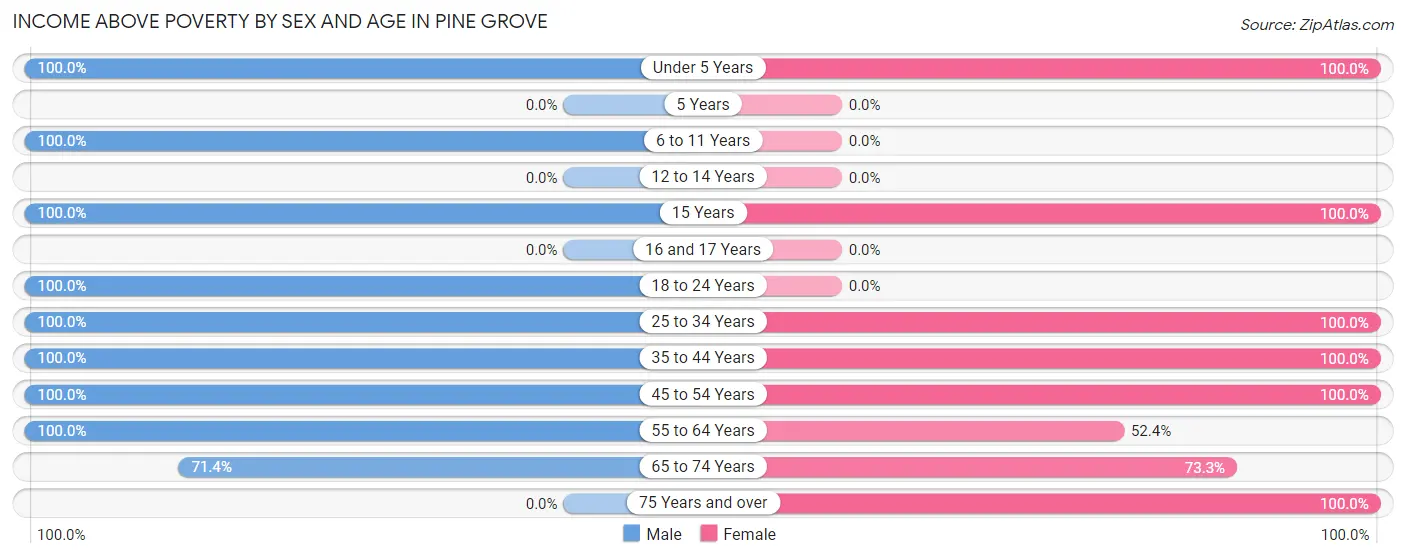
Income Above Poverty by Sex and Age in Pine Grove
According to the poverty statistics in Pine Grove, males aged under 5 years and females aged under 5 years are the age groups that are most secure financially, with 100.0% of males and 100.0% of females in these age groups living above the poverty line.
| Age Bracket | Male | Female |
| Under 5 Years | 4 (100.0%) | 8 (100.0%) |
| 5 Years | 0 (0.0%) | 0 (0.0%) |
| 6 to 11 Years | 4 (100.0%) | 0 (0.0%) |
| 12 to 14 Years | 0 (0.0%) | 0 (0.0%) |
| 15 Years | 3 (100.0%) | 3 (100.0%) |
| 16 and 17 Years | 0 (0.0%) | 0 (0.0%) |
| 18 to 24 Years | 5 (100.0%) | 0 (0.0%) |
| 25 to 34 Years | 24 (100.0%) | 26 (100.0%) |
| 35 to 44 Years | 2 (100.0%) | 8 (100.0%) |
| 45 to 54 Years | 9 (100.0%) | 12 (100.0%) |
| 55 to 64 Years | 24 (100.0%) | 22 (52.4%) |
| 65 to 74 Years | 15 (71.4%) | 11 (73.3%) |
| 75 Years and over | 0 (0.0%) | 4 (100.0%) |
| Total | 90 (93.8%) | 94 (79.7%) |
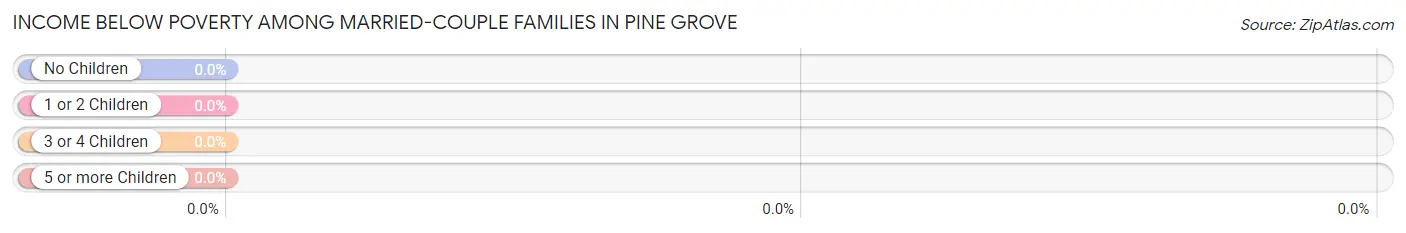
Income Below Poverty Among Married-Couple Families in Pine Grove
| Children | Above Poverty | Below Poverty |
| No Children | 35 (100.0%) | 0 (0.0%) |
| 1 or 2 Children | 32 (100.0%) | 0 (0.0%) |
| 3 or 4 Children | 0 (0.0%) | 0 (0.0%) |
| 5 or more Children | 0 (0.0%) | 0 (0.0%) |
| Total | 67 (100.0%) | 0 (0.0%) |
Income Below Poverty Among Single-Parent Households in Pine Grove
| Children | Single Father | Single Mother |
| No Children | 0 (0.0%) | 0 (0.0%) |
| 1 or 2 Children | 0 (0.0%) | 0 (0.0%) |
| 3 or 4 Children | 0 (0.0%) | 0 (0.0%) |
| 5 or more Children | 0 (0.0%) | 0 (0.0%) |
| Total | 0 (0.0%) | 0 (0.0%) |
Income Below Poverty Among Married-Couple vs Single-Parent Households in Pine Grove
| Children | Married-Couple Families | Single-Parent Households |
| No Children | 0 (0.0%) | 0 (0.0%) |
| 1 or 2 Children | 0 (0.0%) | 0 (0.0%) |
| 3 or 4 Children | 0 (0.0%) | 0 (0.0%) |
| 5 or more Children | 0 (0.0%) | 0 (0.0%) |
| Total | 0 (0.0%) | 0 (0.0%) |
Race in Pine Grove
The most populous races in Pine Grove are White / Caucasian (213 | 99.5%), and Two or more Races (1 | 0.5%).
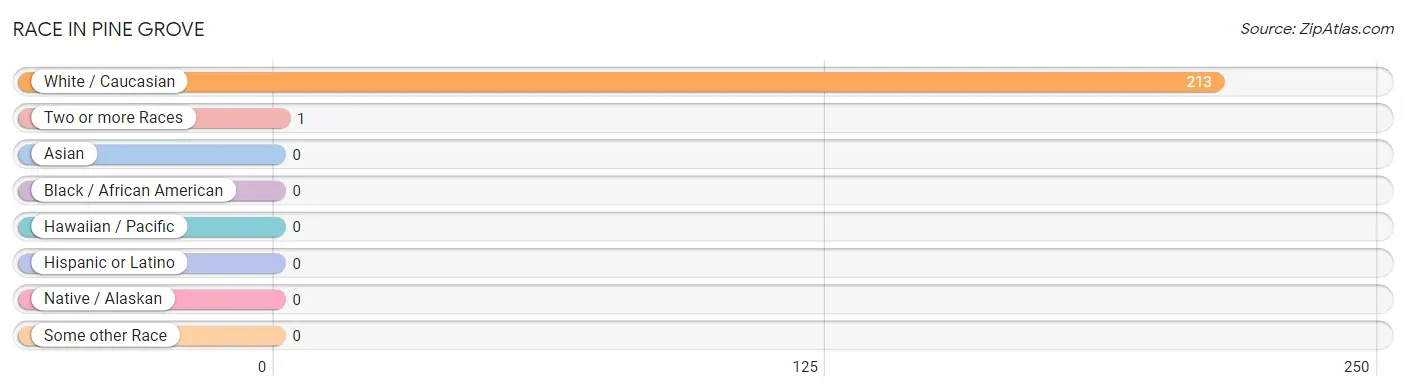
| Race | # Population | % Population |
| Asian | 0 | 0.0% |
| Black / African American | 0 | 0.0% |
| Hawaiian / Pacific | 0 | 0.0% |
| Hispanic or Latino | 0 | 0.0% |
| Native / Alaskan | 0 | 0.0% |
| White / Caucasian | 213 | 99.5% |
| Two or more Races | 1 | 0.5% |
| Some other Race | 0 | 0.0% |
| Total | 214 | 100.0% |
Ancestry in Pine Grove
The most populous ancestries reported in Pine Grove are Irish (39 | 18.2%), German (37 | 17.3%), Polish (31 | 14.5%), English (12 | 5.6%), and American (11 | 5.1%), together accounting for 60.8% of all Pine Grove residents.
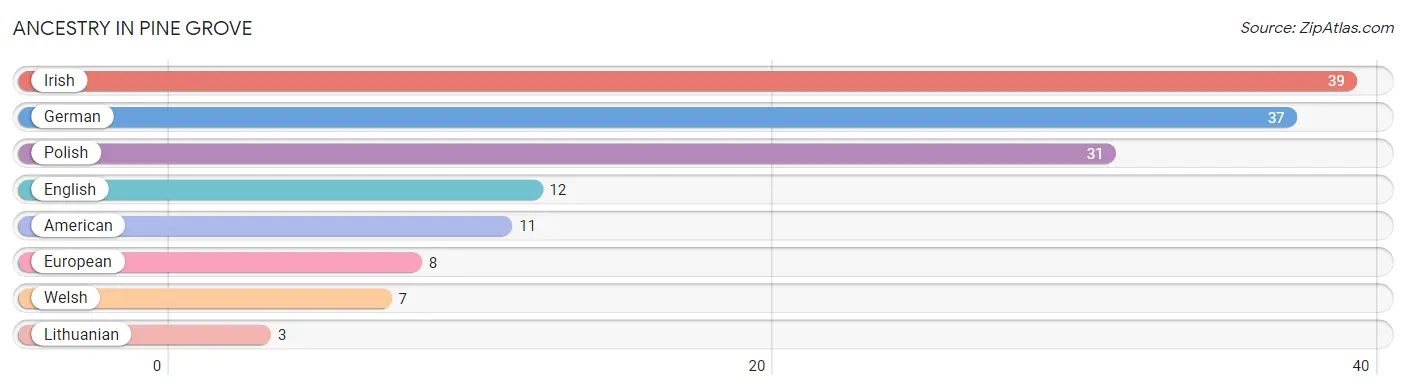
| Ancestry | # Population | % Population |
| American | 11 | 5.1% |
| English | 12 | 5.6% |
| European | 8 | 3.7% |
| German | 37 | 17.3% |
| Irish | 39 | 18.2% |
| Lithuanian | 3 | 1.4% |
| Polish | 31 | 14.5% |
| Welsh | 7 | 3.3% | View All 8 Rows |
Immigrants in Pine Grove

| Immigration Origin | # Population | % Population | View All 0 Rows |
Sex and Age in Pine Grove
Sex and Age in Pine Grove
The most populous age groups in Pine Grove are 30 to 34 Years (20 | 20.8%) for men and 55 to 59 Years (33 | 28.0%) for women.
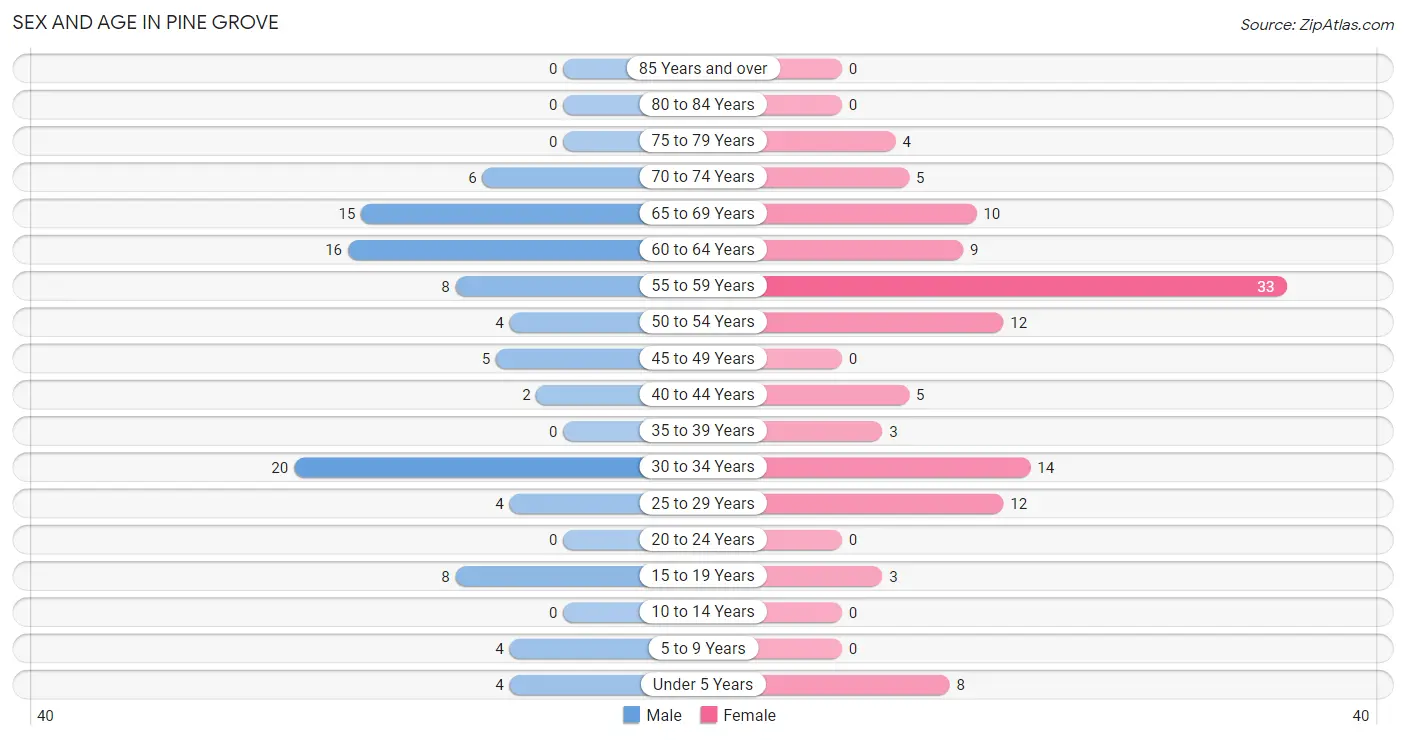
| Age Bracket | Male | Female |
| Under 5 Years | 4 (4.2%) | 8 (6.8%) |
| 5 to 9 Years | 4 (4.2%) | 0 (0.0%) |
| 10 to 14 Years | 0 (0.0%) | 0 (0.0%) |
| 15 to 19 Years | 8 (8.3%) | 3 (2.5%) |
| 20 to 24 Years | 0 (0.0%) | 0 (0.0%) |
| 25 to 29 Years | 4 (4.2%) | 12 (10.2%) |
| 30 to 34 Years | 20 (20.8%) | 14 (11.9%) |
| 35 to 39 Years | 0 (0.0%) | 3 (2.5%) |
| 40 to 44 Years | 2 (2.1%) | 5 (4.2%) |
| 45 to 49 Years | 5 (5.2%) | 0 (0.0%) |
| 50 to 54 Years | 4 (4.2%) | 12 (10.2%) |
| 55 to 59 Years | 8 (8.3%) | 33 (28.0%) |
| 60 to 64 Years | 16 (16.7%) | 9 (7.6%) |
| 65 to 69 Years | 15 (15.6%) | 10 (8.5%) |
| 70 to 74 Years | 6 (6.2%) | 5 (4.2%) |
| 75 to 79 Years | 0 (0.0%) | 4 (3.4%) |
| 80 to 84 Years | 0 (0.0%) | 0 (0.0%) |
| 85 Years and over | 0 (0.0%) | 0 (0.0%) |
| Total | 96 (100.0%) | 118 (100.0%) |
Families and Households in Pine Grove
Median Family Size in Pine Grove
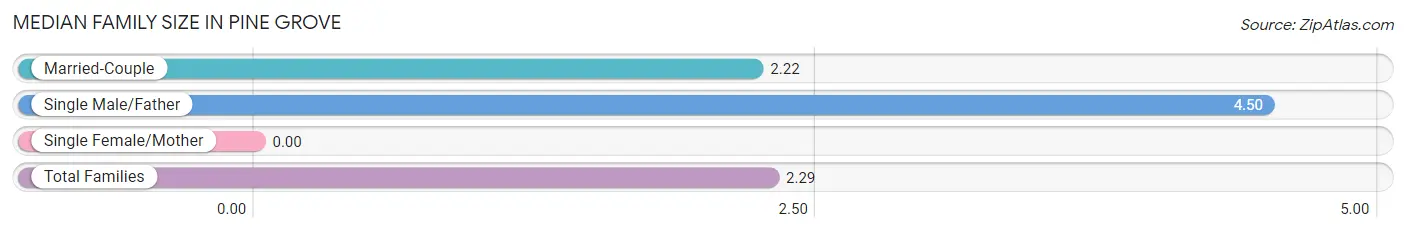
| Family Type | # Families | Family Size |
| Married-Couple | 67 (97.1%) | 2.22 |
| Single Male/Father | 2 (2.9%) | 4.50 |
| Single Female/Mother | 0 (0.0%) | - |
| Total Families | 69 (100.0%) | 2.29 |
Median Household Size in Pine Grove
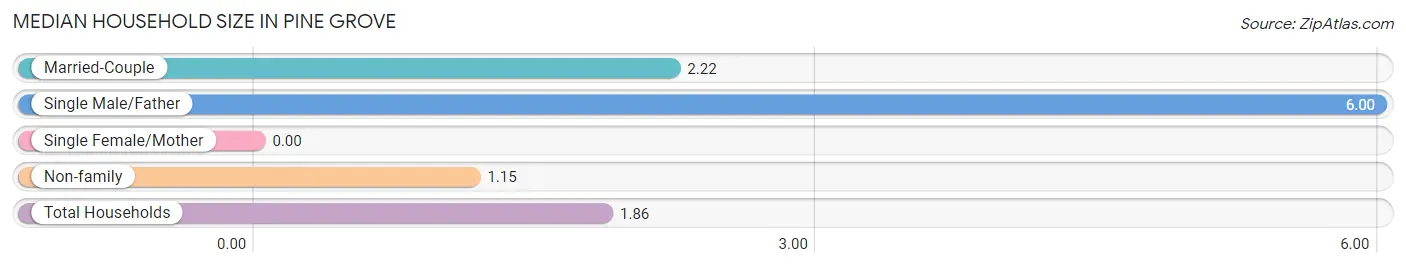
| Household Type | # Households | Household Size |
| Married-Couple | 67 (58.3%) | 2.22 |
| Single Male/Father | 2 (1.7%) | 6.00 |
| Single Female/Mother | 0 (0.0%) | - |
| Non-family | 46 (40.0%) | 1.15 |
| Total Households | 115 (100.0%) | 1.86 |
Household Size by Marriage Status in Pine Grove
Out of a total of 115 households in Pine Grove, 69 (60.0%) are family households, while 46 (40.0%) are nonfamily households. The most numerous type of family households are 2-person households, comprising 33, and the most common type of nonfamily households are 1-person households, comprising 43.
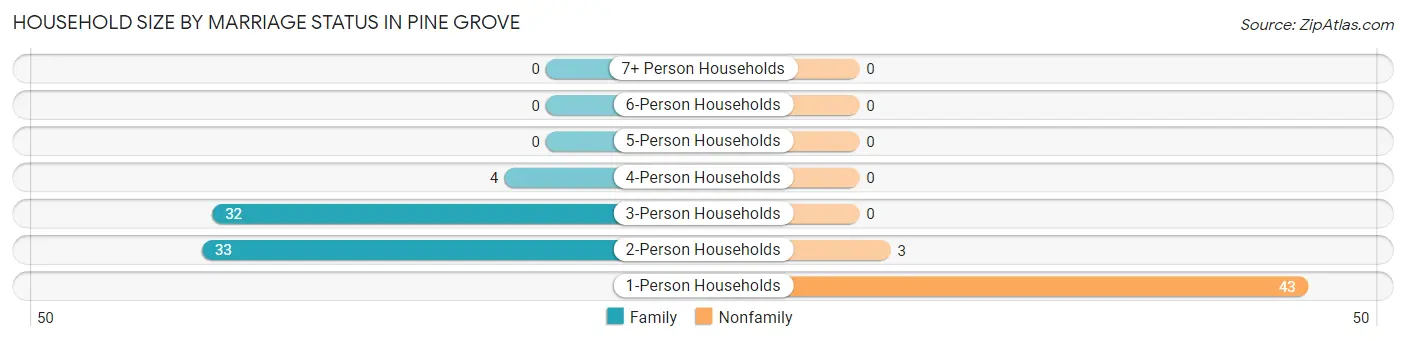
| Household Size | Family Households | Nonfamily Households |
| 1-Person Households | - | 43 (37.4%) |
| 2-Person Households | 33 (28.7%) | 3 (2.6%) |
| 3-Person Households | 32 (27.8%) | 0 (0.0%) |
| 4-Person Households | 4 (3.5%) | 0 (0.0%) |
| 5-Person Households | 0 (0.0%) | 0 (0.0%) |
| 6-Person Households | 0 (0.0%) | 0 (0.0%) |
| 7+ Person Households | 0 (0.0%) | 0 (0.0%) |
| Total | 69 (60.0%) | 46 (40.0%) |
Female Fertility in Pine Grove
Fertility by Age in Pine Grove
Average fertility rate in Pine Grove is 324.0 births per 1,000 women. Women in the age bracket of 20 to 34 years have the highest fertility rate with 462.0 births per 1,000 women. Women in the age bracket of 20 to 34 years acount for 100.0% of all women with births.
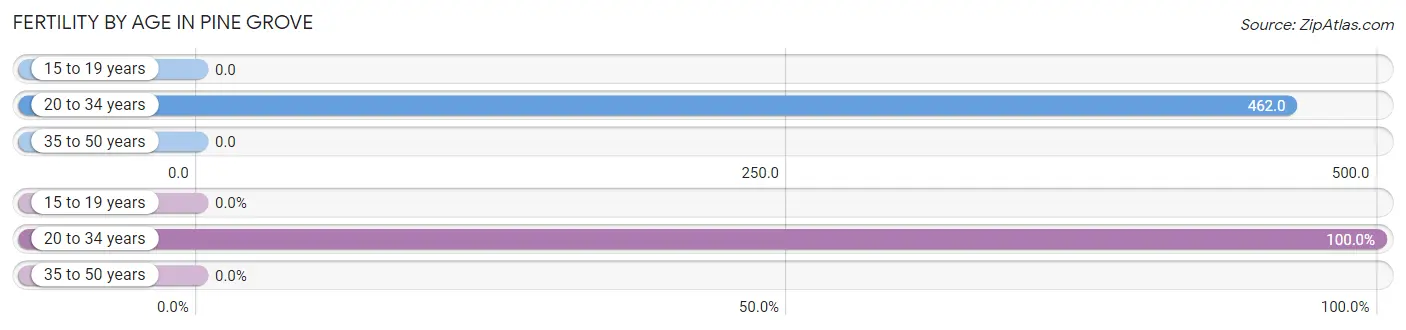
| Age Bracket | Women with Births | Births / 1,000 Women |
| 15 to 19 years | 0 (0.0%) | 0.0 |
| 20 to 34 years | 12 (100.0%) | 462.0 |
| 35 to 50 years | 0 (0.0%) | 0.0 |
| Total | 12 (100.0%) | 324.0 |
Fertility by Age by Marriage Status in Pine Grove
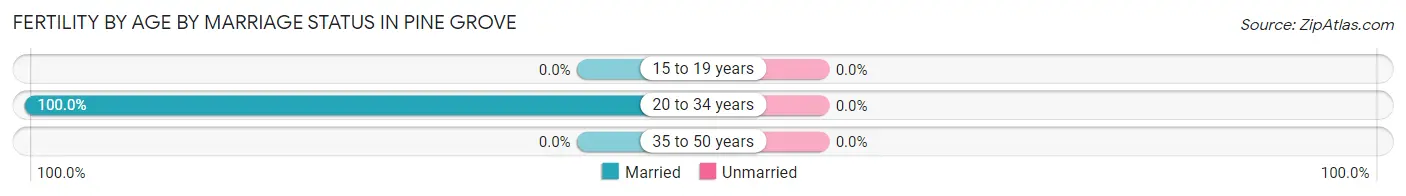
| Age Bracket | Married | Unmarried |
| 15 to 19 years | 0 (0.0%) | 0 (0.0%) |
| 20 to 34 years | 12 (100.0%) | 0 (0.0%) |
| 35 to 50 years | 0 (0.0%) | 0 (0.0%) |
| Total | 12 (100.0%) | 0 (0.0%) |
Fertility by Education in Pine Grove
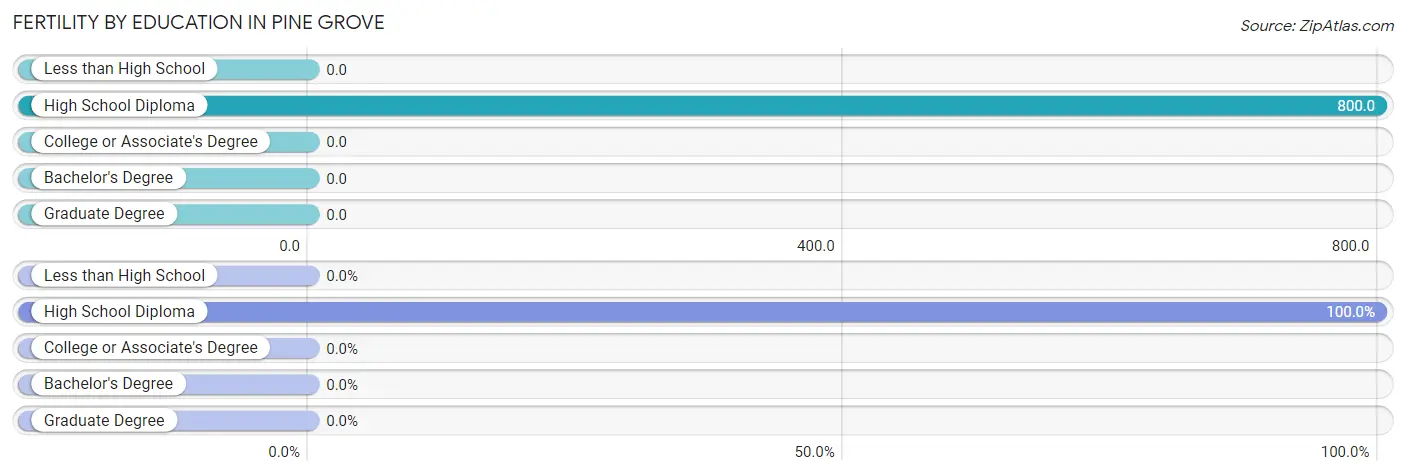
| Educational Attainment | Women with Births | Births / 1,000 Women |
| Less than High School | 0 (0.0%) | 0.0 |
| High School Diploma | 12 (100.0%) | 800.0 |
| College or Associate's Degree | 0 (0.0%) | 0.0 |
| Bachelor's Degree | 0 (0.0%) | 0.0 |
| Graduate Degree | 0 (0.0%) | 0.0 |
| Total | 12 (100.0%) | 324.0 |
Fertility by Education by Marriage Status in Pine Grove
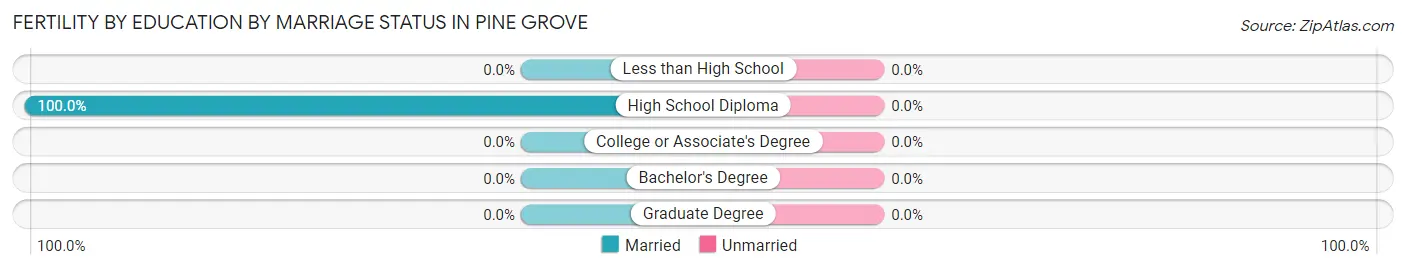
| Educational Attainment | Married | Unmarried |
| Less than High School | 0 (0.0%) | 0 (0.0%) |
| High School Diploma | 12 (100.0%) | 0 (0.0%) |
| College or Associate's Degree | 0 (0.0%) | 0 (0.0%) |
| Bachelor's Degree | 0 (0.0%) | 0 (0.0%) |
| Graduate Degree | 0 (0.0%) | 0 (0.0%) |
| Total | 12 (100.0%) | 0 (0.0%) |
Employment Characteristics in Pine Grove
Employment by Class of Employer in Pine Grove
Among the 79 employed individuals in Pine Grove, private company employees (52 | 65.8%), self-employed (not incorporated) (9 | 11.4%), and not-for-profit organizations (7 | 8.9%) make up the most common classes of employment.
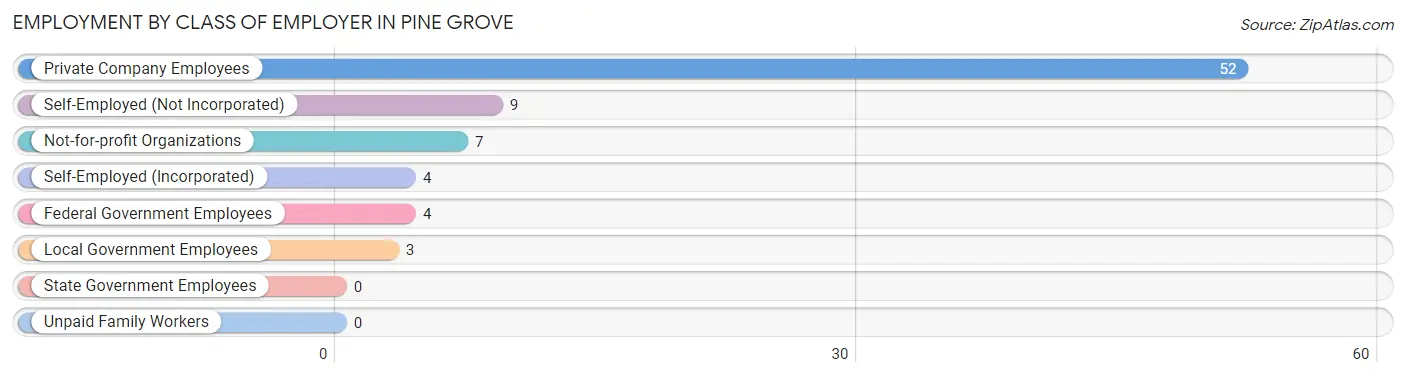
| Employer Class | # Employees | % Employees |
| Private Company Employees | 52 | 65.8% |
| Self-Employed (Incorporated) | 4 | 5.1% |
| Self-Employed (Not Incorporated) | 9 | 11.4% |
| Not-for-profit Organizations | 7 | 8.9% |
| Local Government Employees | 3 | 3.8% |
| State Government Employees | 0 | 0.0% |
| Federal Government Employees | 4 | 5.1% |
| Unpaid Family Workers | 0 | 0.0% |
| Total | 79 | 100.0% |
Employment Status by Age in Pine Grove
According to the labor force statistics for Pine Grove, out of the total population over 16 years of age (192), 48.4% or 93 individuals are in the labor force, with 15.1% or 14 of them unemployed. The age group with the highest labor force participation rate is 16 to 19 years, with 100.0% or 5 individuals in the labor force. Within the labor force, the 30 to 34 years age range has the highest percentage of unemployed individuals, with 41.2% or 14 of them being unemployed.
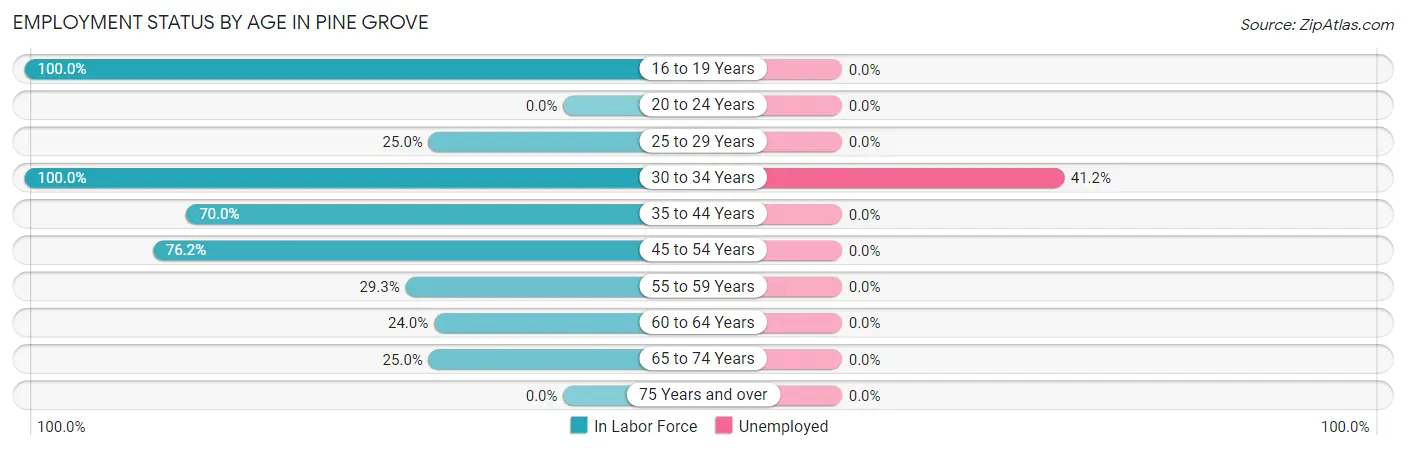
| Age Bracket | In Labor Force | Unemployed |
| 16 to 19 Years | 5 (100.0%) | 0 (0.0%) |
| 20 to 24 Years | 0 (0.0%) | 0 (0.0%) |
| 25 to 29 Years | 4 (25.0%) | 0 (0.0%) |
| 30 to 34 Years | 34 (100.0%) | 14 (41.2%) |
| 35 to 44 Years | 7 (70.0%) | 0 (0.0%) |
| 45 to 54 Years | 16 (76.2%) | 0 (0.0%) |
| 55 to 59 Years | 12 (29.3%) | 0 (0.0%) |
| 60 to 64 Years | 6 (24.0%) | 0 (0.0%) |
| 65 to 74 Years | 9 (25.0%) | 0 (0.0%) |
| 75 Years and over | 0 (0.0%) | 0 (0.0%) |
| Total | 93 (48.4%) | 14 (15.1%) |
Employment Status by Educational Attainment in Pine Grove
According to labor force statistics for Pine Grove, 53.7% of individuals (79) out of the total population between 25 and 64 years of age (147) are in the labor force, with 17.7% or 14 of them being unemployed. The group with the highest labor force participation rate are those with the educational attainment of college / associate degree, with 65.7% or 46 individuals in the labor force. Within the labor force, individuals with college / associate degree education have the highest percentage of unemployment, with 30.4% or 14 of them being unemployed.
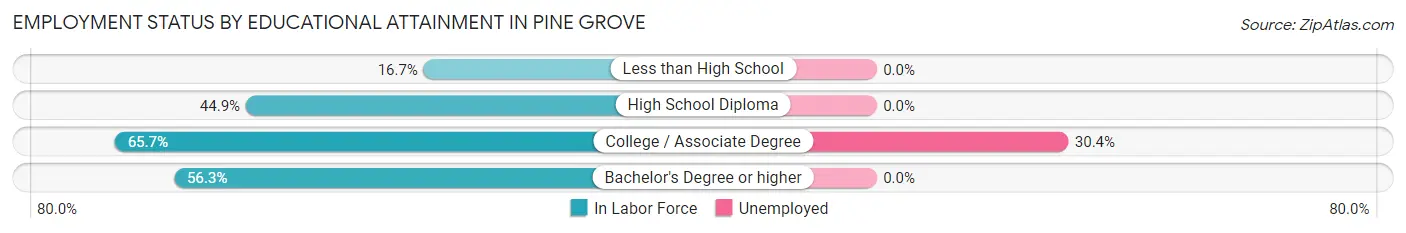
| Educational Attainment | In Labor Force | Unemployed |
| Less than High School | 2 (16.7%) | 0 (0.0%) |
| High School Diploma | 22 (44.9%) | 0 (0.0%) |
| College / Associate Degree | 46 (65.7%) | 21 (30.4%) |
| Bachelor's Degree or higher | 9 (56.3%) | 0 (0.0%) |
| Total | 79 (53.7%) | 26 (17.7%) |
Employment Occupations by Sex in Pine Grove
Management, Business, Science and Arts Occupations
The most common Management, Business, Science and Arts occupations in Pine Grove are Community & Social Service (12 | 15.2%), Management (9 | 11.4%), Arts, Media & Entertainment (5 | 6.3%), Education, Arts & Media (4 | 5.1%), and Education Instruction & Library (3 | 3.8%).
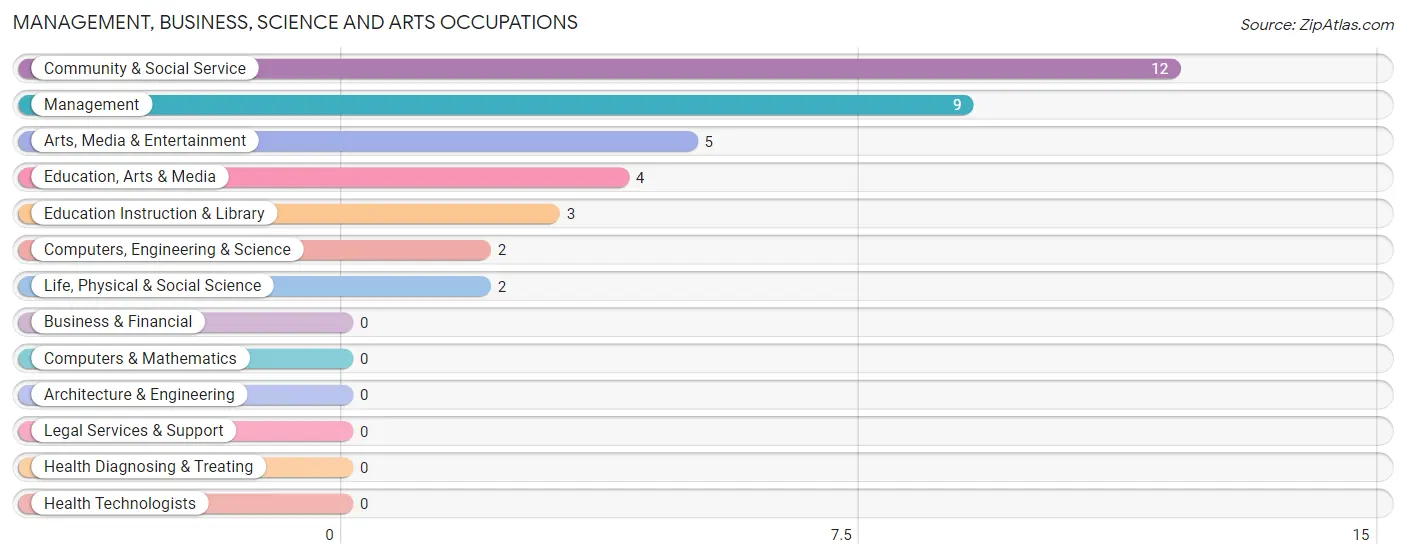
Management, Business, Science and Arts Occupations by Sex
Within the Management, Business, Science and Arts occupations in Pine Grove, the most male-oriented occupations are Computers, Engineering & Science (100.0%), Life, Physical & Social Science (100.0%), and Education, Arts & Media (100.0%), while the most female-oriented occupations are Education Instruction & Library (100.0%), Management (33.3%), and Community & Social Service (25.0%).
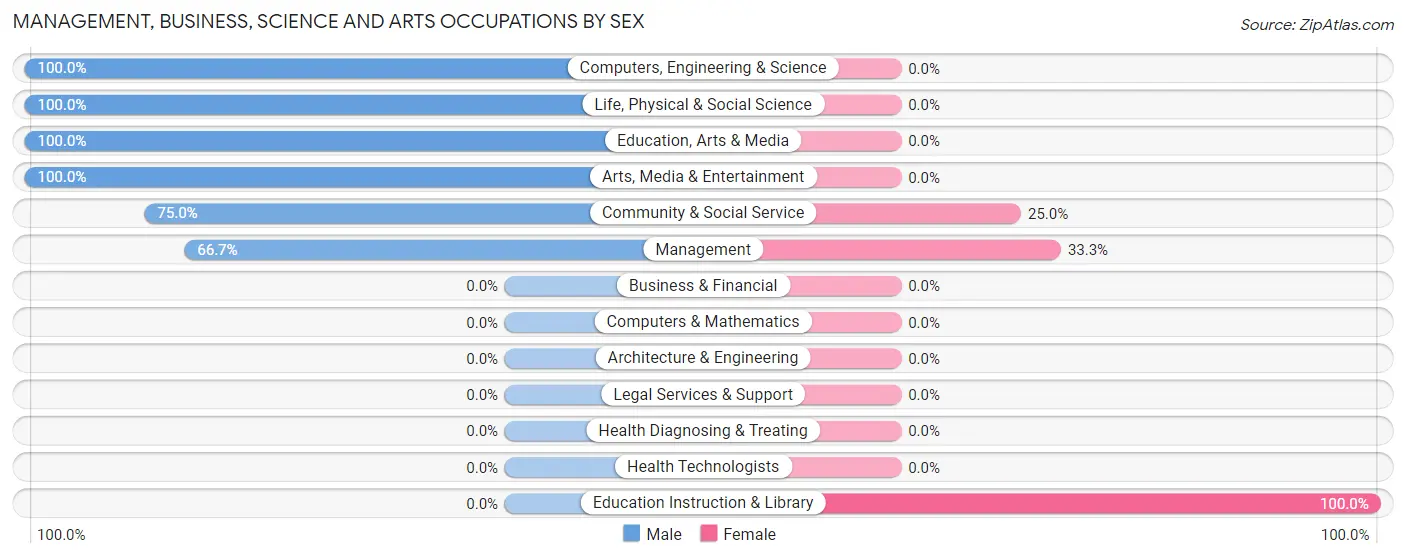
| Occupation | Male | Female |
| Management | 6 (66.7%) | 3 (33.3%) |
| Business & Financial | 0 (0.0%) | 0 (0.0%) |
| Computers, Engineering & Science | 2 (100.0%) | 0 (0.0%) |
| Computers & Mathematics | 0 (0.0%) | 0 (0.0%) |
| Architecture & Engineering | 0 (0.0%) | 0 (0.0%) |
| Life, Physical & Social Science | 2 (100.0%) | 0 (0.0%) |
| Community & Social Service | 9 (75.0%) | 3 (25.0%) |
| Education, Arts & Media | 4 (100.0%) | 0 (0.0%) |
| Legal Services & Support | 0 (0.0%) | 0 (0.0%) |
| Education Instruction & Library | 0 (0.0%) | 3 (100.0%) |
| Arts, Media & Entertainment | 5 (100.0%) | 0 (0.0%) |
| Health Diagnosing & Treating | 0 (0.0%) | 0 (0.0%) |
| Health Technologists | 0 (0.0%) | 0 (0.0%) |
| Total (Category) | 17 (73.9%) | 6 (26.1%) |
| Total (Overall) | 60 (75.9%) | 19 (24.0%) |
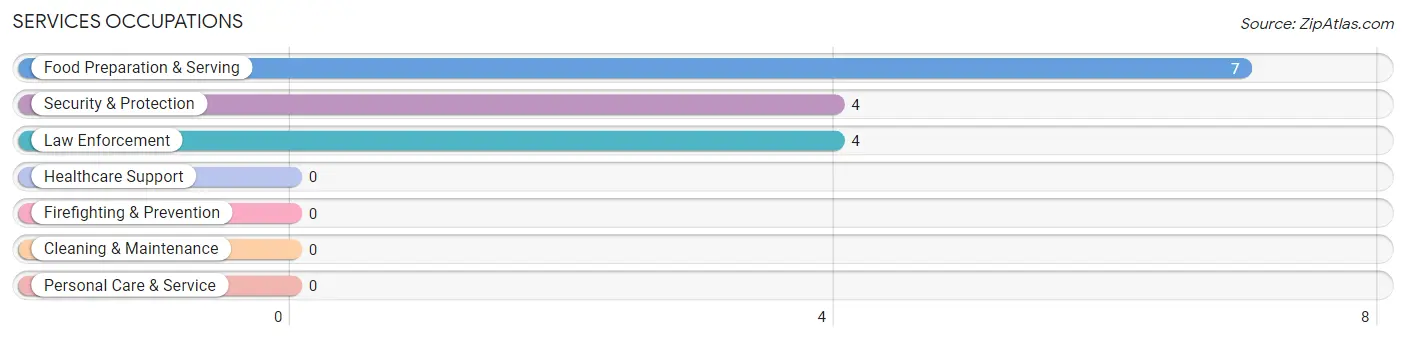
Services Occupations
The most common Services occupations in Pine Grove are Food Preparation & Serving (7 | 8.9%), Security & Protection (4 | 5.1%), and Law Enforcement (4 | 5.1%).
Services Occupations by Sex
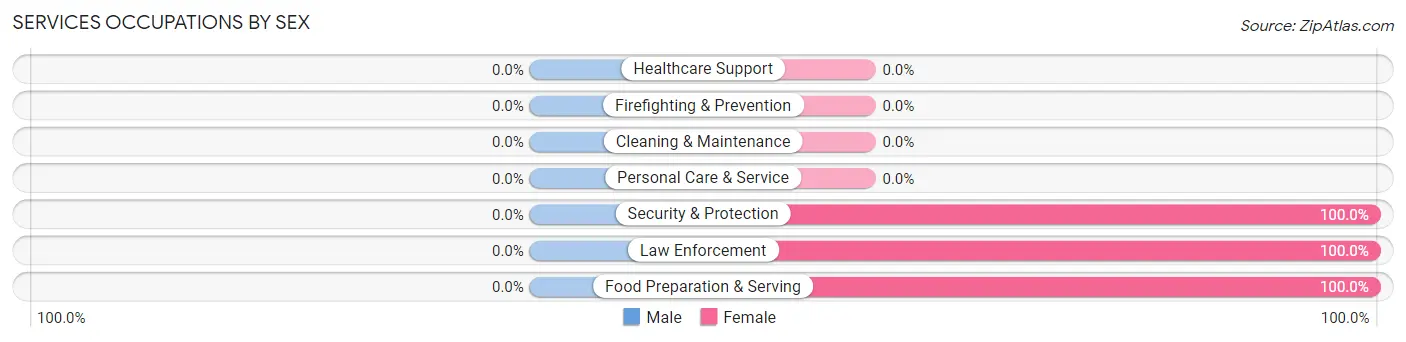
| Occupation | Male | Female |
| Healthcare Support | 0 (0.0%) | 0 (0.0%) |
| Security & Protection | 0 (0.0%) | 4 (100.0%) |
| Firefighting & Prevention | 0 (0.0%) | 0 (0.0%) |
| Law Enforcement | 0 (0.0%) | 4 (100.0%) |
| Food Preparation & Serving | 0 (0.0%) | 7 (100.0%) |
| Cleaning & Maintenance | 0 (0.0%) | 0 (0.0%) |
| Personal Care & Service | 0 (0.0%) | 0 (0.0%) |
| Total (Category) | 0 (0.0%) | 11 (100.0%) |
| Total (Overall) | 60 (75.9%) | 19 (24.0%) |
Sales and Office Occupations
The most common Sales and Office occupations in Pine Grove are Sales & Related (7 | 8.9%), and Office & Administration (4 | 5.1%).

Sales and Office Occupations by Sex

| Occupation | Male | Female |
| Sales & Related | 5 (71.4%) | 2 (28.6%) |
| Office & Administration | 4 (100.0%) | 0 (0.0%) |
| Total (Category) | 9 (81.8%) | 2 (18.2%) |
| Total (Overall) | 60 (75.9%) | 19 (24.0%) |
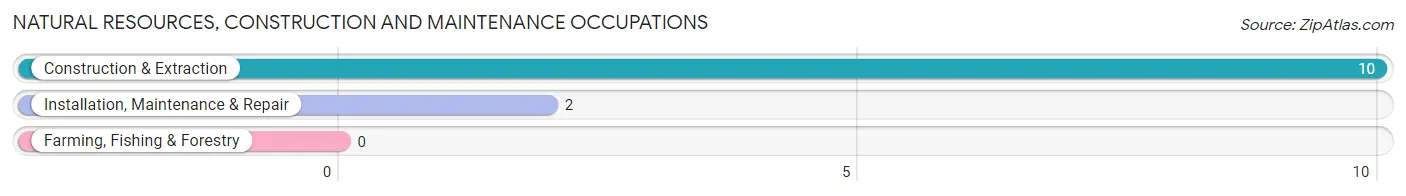
Natural Resources, Construction and Maintenance Occupations
The most common Natural Resources, Construction and Maintenance occupations in Pine Grove are Construction & Extraction (10 | 12.7%), and Installation, Maintenance & Repair (2 | 2.5%).
Natural Resources, Construction and Maintenance Occupations by Sex
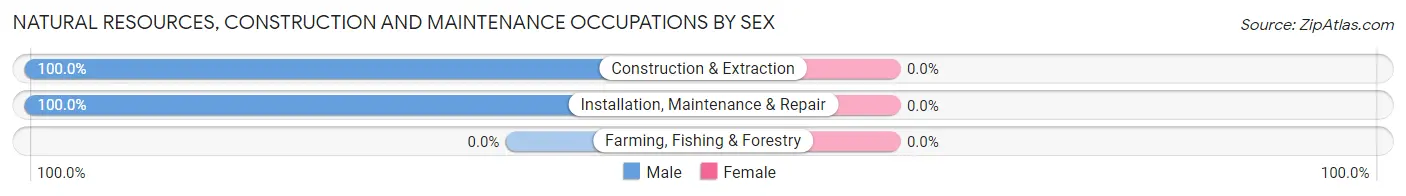
| Occupation | Male | Female |
| Farming, Fishing & Forestry | 0 (0.0%) | 0 (0.0%) |
| Construction & Extraction | 10 (100.0%) | 0 (0.0%) |
| Installation, Maintenance & Repair | 2 (100.0%) | 0 (0.0%) |
| Total (Category) | 12 (100.0%) | 0 (0.0%) |
| Total (Overall) | 60 (75.9%) | 19 (24.0%) |
Production, Transportation and Moving Occupations
The most common Production, Transportation and Moving occupations in Pine Grove are Production (18 | 22.8%), and Transportation (4 | 5.1%).
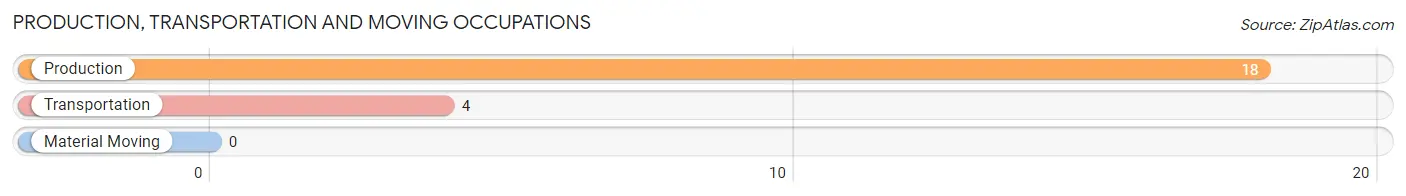
Production, Transportation and Moving Occupations by Sex
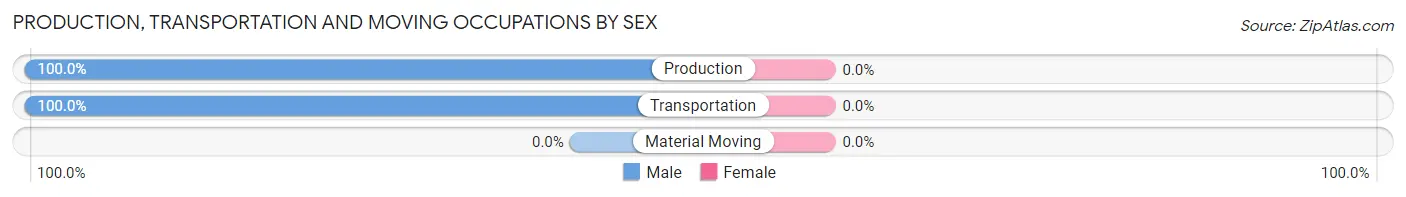
| Occupation | Male | Female |
| Production | 18 (100.0%) | 0 (0.0%) |
| Transportation | 4 (100.0%) | 0 (0.0%) |
| Material Moving | 0 (0.0%) | 0 (0.0%) |
| Total (Category) | 22 (100.0%) | 0 (0.0%) |
| Total (Overall) | 60 (75.9%) | 19 (24.0%) |
Employment Industries by Sex in Pine Grove
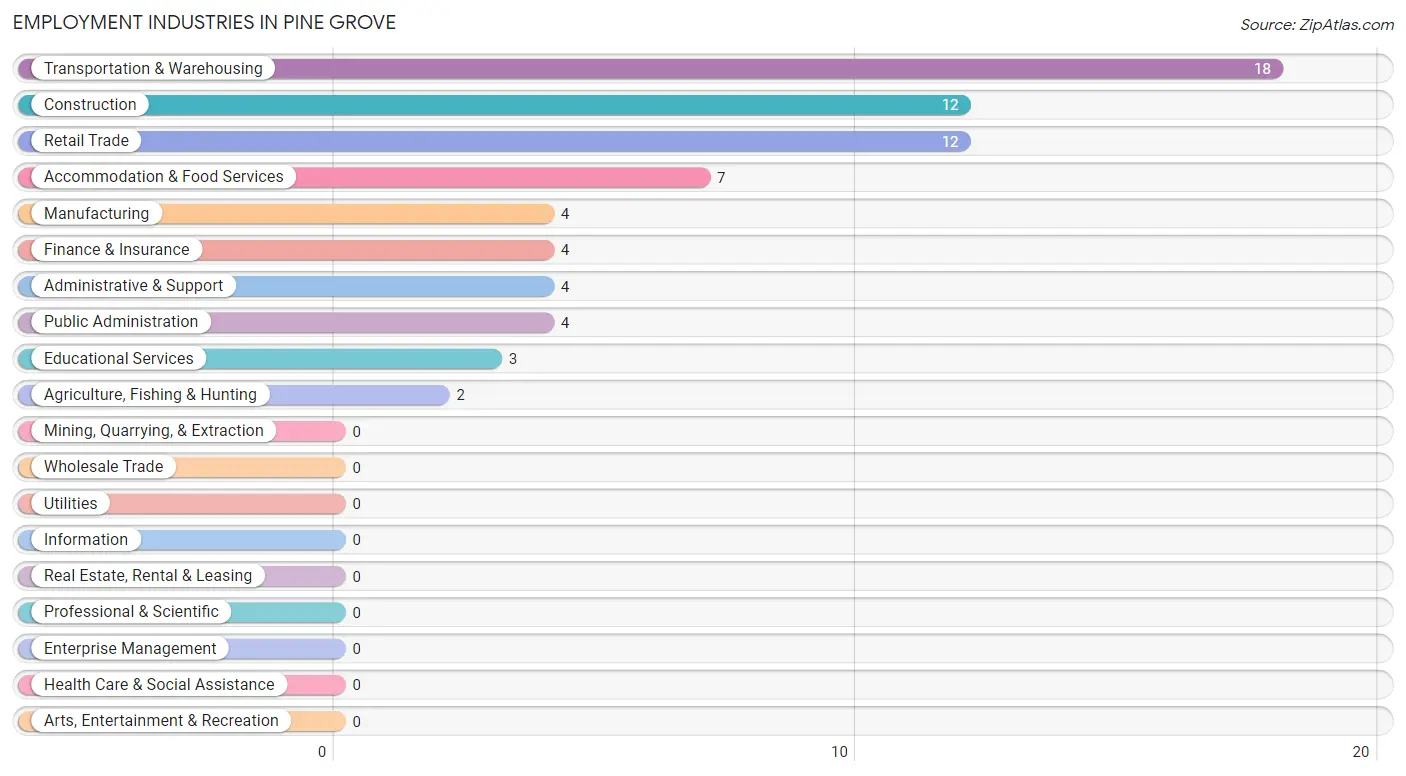
Employment Industries in Pine Grove
The major employment industries in Pine Grove include Transportation & Warehousing (18 | 22.8%), Construction (12 | 15.2%), Retail Trade (12 | 15.2%), Accommodation & Food Services (7 | 8.9%), and Manufacturing (4 | 5.1%).
Employment Industries by Sex in Pine Grove
The Pine Grove industries that see more men than women are Agriculture, Fishing & Hunting (100.0%), Construction (100.0%), and Manufacturing (100.0%), whereas the industries that tend to have a higher number of women are Educational Services (100.0%), Accommodation & Food Services (100.0%), and Public Administration (100.0%).
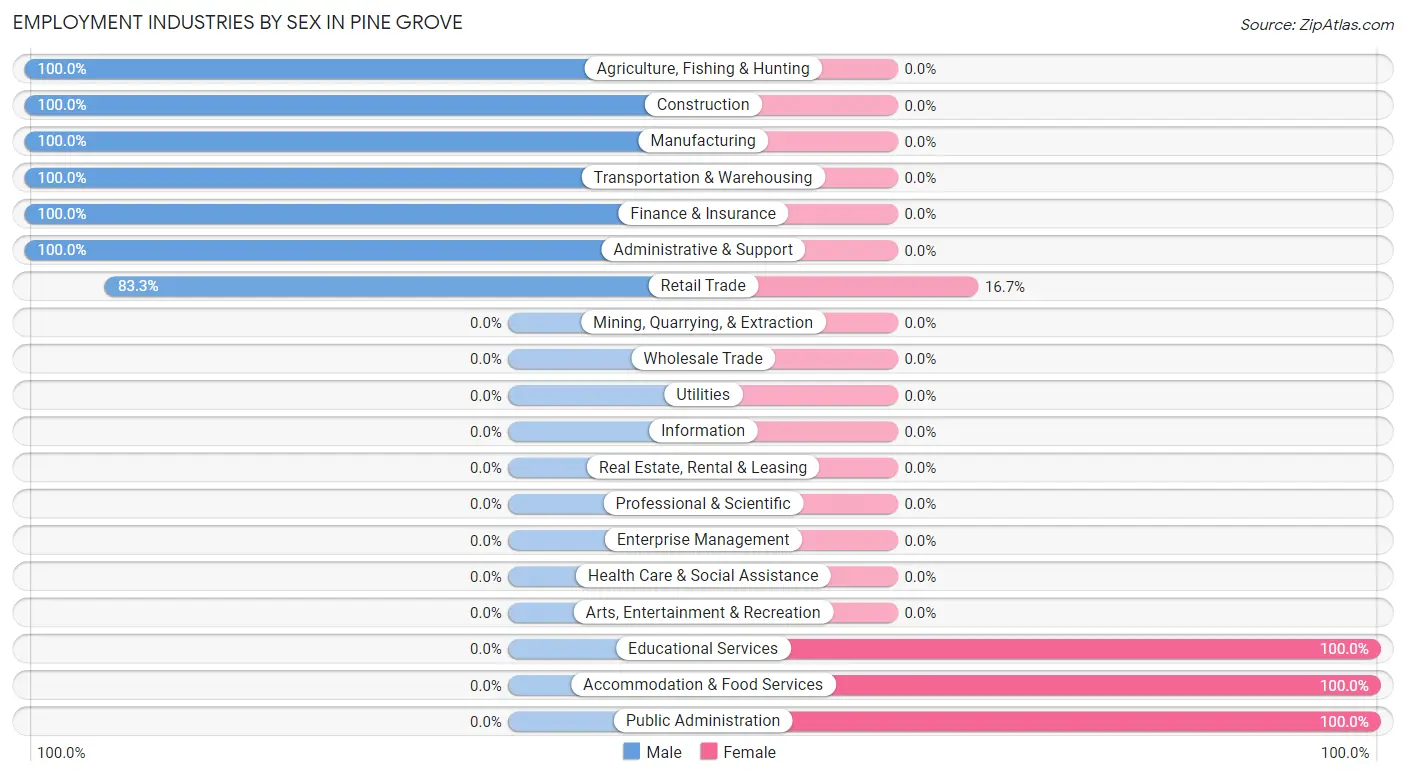
| Industry | Male | Female |
| Agriculture, Fishing & Hunting | 2 (100.0%) | 0 (0.0%) |
| Mining, Quarrying, & Extraction | 0 (0.0%) | 0 (0.0%) |
| Construction | 12 (100.0%) | 0 (0.0%) |
| Manufacturing | 4 (100.0%) | 0 (0.0%) |
| Wholesale Trade | 0 (0.0%) | 0 (0.0%) |
| Retail Trade | 10 (83.3%) | 2 (16.7%) |
| Transportation & Warehousing | 18 (100.0%) | 0 (0.0%) |
| Utilities | 0 (0.0%) | 0 (0.0%) |
| Information | 0 (0.0%) | 0 (0.0%) |
| Finance & Insurance | 4 (100.0%) | 0 (0.0%) |
| Real Estate, Rental & Leasing | 0 (0.0%) | 0 (0.0%) |
| Professional & Scientific | 0 (0.0%) | 0 (0.0%) |
| Enterprise Management | 0 (0.0%) | 0 (0.0%) |
| Administrative & Support | 4 (100.0%) | 0 (0.0%) |
| Educational Services | 0 (0.0%) | 3 (100.0%) |
| Health Care & Social Assistance | 0 (0.0%) | 0 (0.0%) |
| Arts, Entertainment & Recreation | 0 (0.0%) | 0 (0.0%) |
| Accommodation & Food Services | 0 (0.0%) | 7 (100.0%) |
| Public Administration | 0 (0.0%) | 4 (100.0%) |
| Total | 60 (75.9%) | 19 (24.0%) |
Education in Pine Grove
School Enrollment in Pine Grove
The most common levels of schooling among the 15 students in Pine Grove are high school (6 | 40.0%), college / undergraduate (5 | 33.3%), and kindergarten (4 | 26.7%).
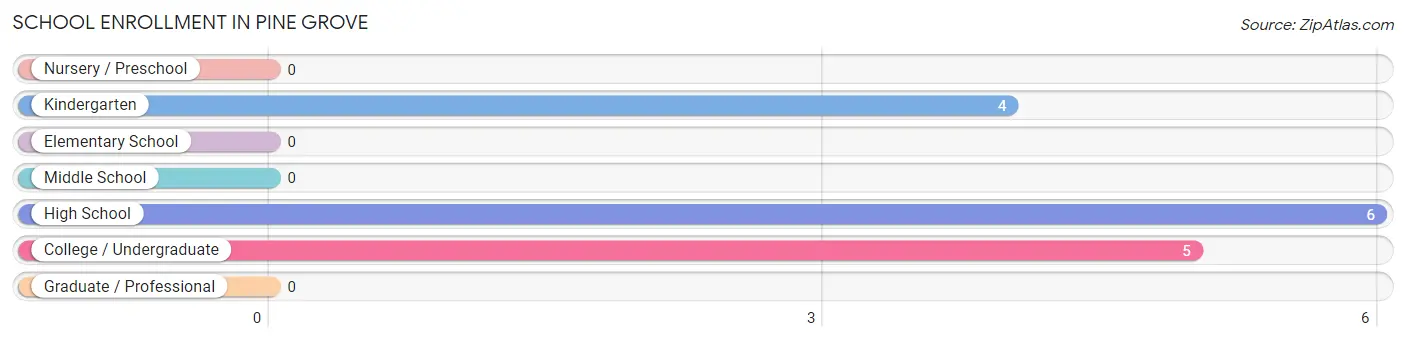
| School Level | # Students | % Students |
| Nursery / Preschool | 0 | 0.0% |
| Kindergarten | 4 | 26.7% |
| Elementary School | 0 | 0.0% |
| Middle School | 0 | 0.0% |
| High School | 6 | 40.0% |
| College / Undergraduate | 5 | 33.3% |
| Graduate / Professional | 0 | 0.0% |
| Total | 15 | 100.0% |
School Enrollment by Age by Funding Source in Pine Grove
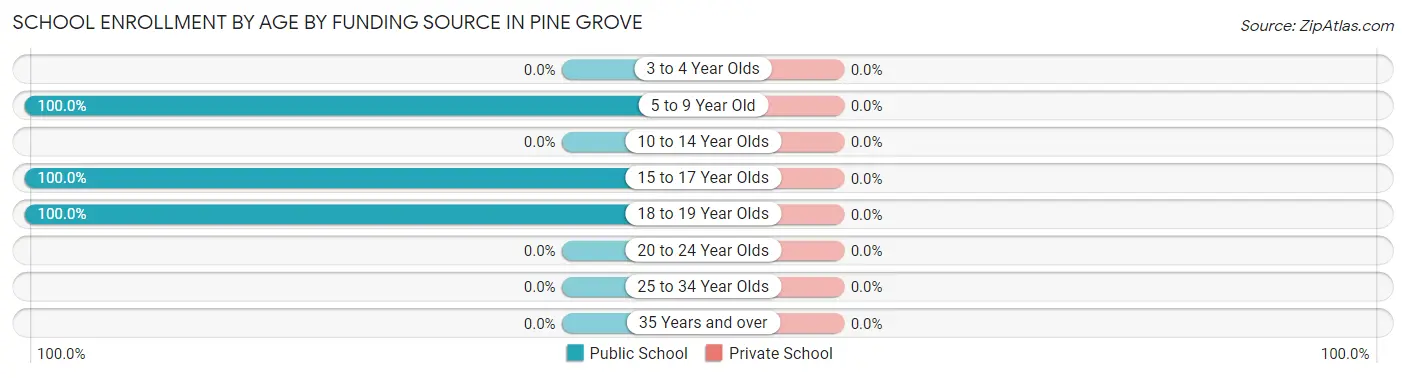
| Age Bracket | Public School | Private School |
| 3 to 4 Year Olds | 0 (0.0%) | 0 (0.0%) |
| 5 to 9 Year Old | 4 (100.0%) | 0 (0.0%) |
| 10 to 14 Year Olds | 0 (0.0%) | 0 (0.0%) |
| 15 to 17 Year Olds | 6 (100.0%) | 0 (0.0%) |
| 18 to 19 Year Olds | 5 (100.0%) | 0 (0.0%) |
| 20 to 24 Year Olds | 0 (0.0%) | 0 (0.0%) |
| 25 to 34 Year Olds | 0 (0.0%) | 0 (0.0%) |
| 35 Years and over | 0 (0.0%) | 0 (0.0%) |
| Total | 15 (100.0%) | 0 (0.0%) |
Educational Attainment by Field of Study in Pine Grove
Science & technology (6 | 25.0%), education (6 | 25.0%), visual & performing arts (5 | 20.8%), business (4 | 16.7%), and bio, nature & agricultural (2 | 8.3%) are the most common fields of study among 24 individuals in Pine Grove who have obtained a bachelor's degree or higher.
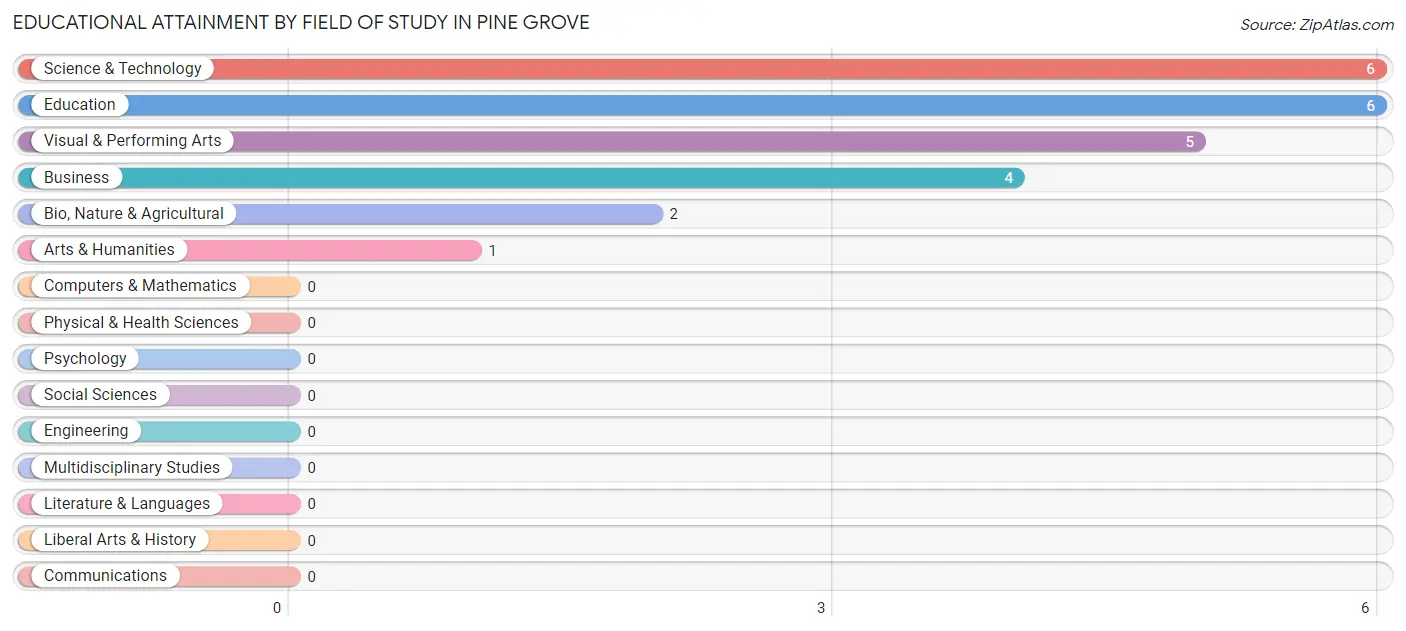
| Field of Study | # Graduates | % Graduates |
| Computers & Mathematics | 0 | 0.0% |
| Bio, Nature & Agricultural | 2 | 8.3% |
| Physical & Health Sciences | 0 | 0.0% |
| Psychology | 0 | 0.0% |
| Social Sciences | 0 | 0.0% |
| Engineering | 0 | 0.0% |
| Multidisciplinary Studies | 0 | 0.0% |
| Science & Technology | 6 | 25.0% |
| Business | 4 | 16.7% |
| Education | 6 | 25.0% |
| Literature & Languages | 0 | 0.0% |
| Liberal Arts & History | 0 | 0.0% |
| Visual & Performing Arts | 5 | 20.8% |
| Communications | 0 | 0.0% |
| Arts & Humanities | 1 | 4.2% |
| Total | 24 | 100.0% |
Transportation & Commute in Pine Grove
Vehicle Availability by Sex in Pine Grove
The most prevalent vehicle ownership categories in Pine Grove are males with 2 vehicles (45, accounting for 75.0%) and females with 2 vehicles (12, making up 236.8%).
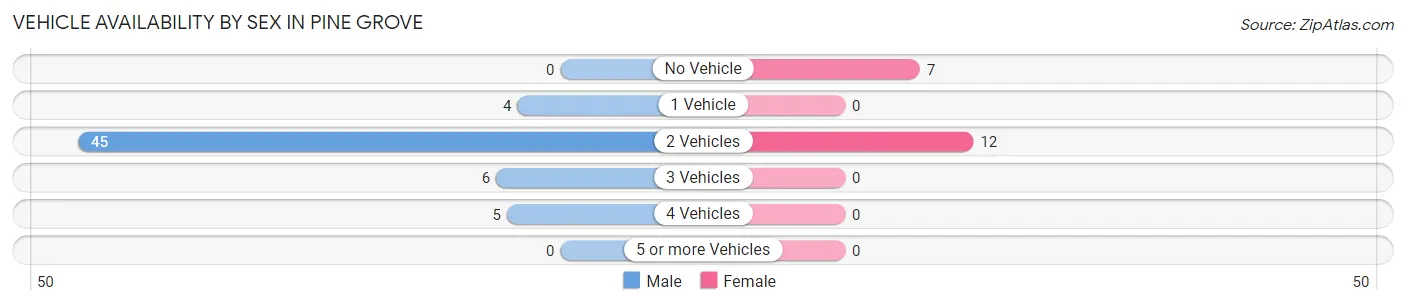
| Vehicles Available | Male | Female |
| No Vehicle | 0 (0.0%) | 7 (36.8%) |
| 1 Vehicle | 4 (6.7%) | 0 (0.0%) |
| 2 Vehicles | 45 (75.0%) | 12 (63.2%) |
| 3 Vehicles | 6 (10.0%) | 0 (0.0%) |
| 4 Vehicles | 5 (8.3%) | 0 (0.0%) |
| 5 or more Vehicles | 0 (0.0%) | 0 (0.0%) |
| Total | 60 (100.0%) | 19 (100.0%) |
Commute Time in Pine Grove
The most frequently occuring commute durations in Pine Grove are 60 to 89 minutes (31 commuters, 39.2%), 90 or more minutes (12 commuters, 15.2%), and 30 to 34 minutes (10 commuters, 12.7%).
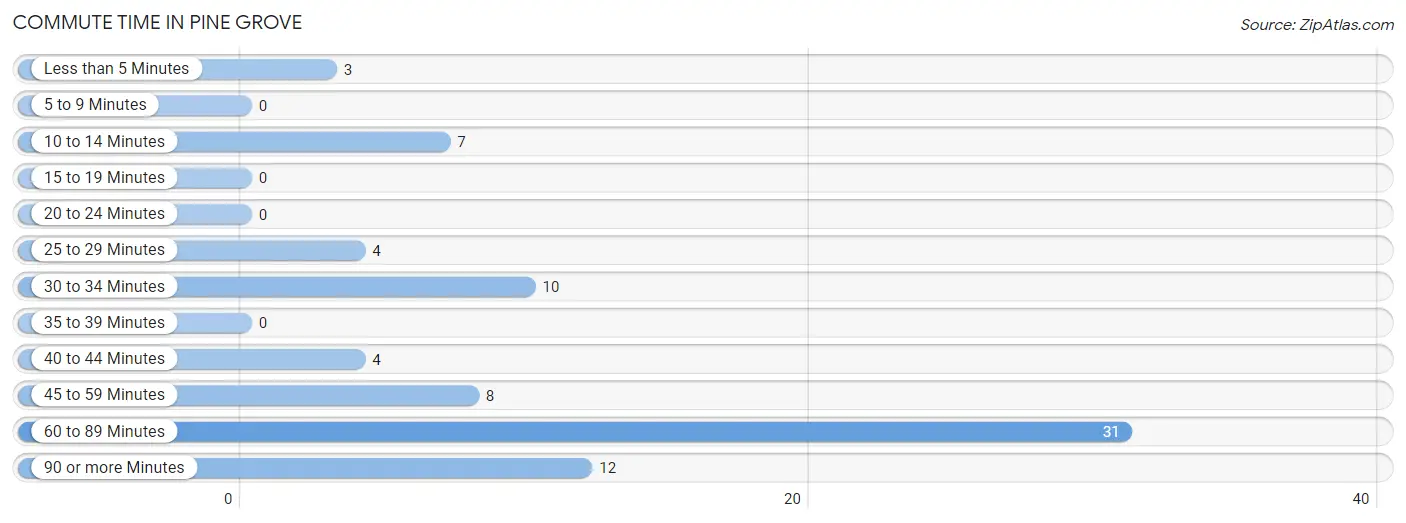
| Commute Time | # Commuters | % Commuters |
| Less than 5 Minutes | 3 | 3.8% |
| 5 to 9 Minutes | 0 | 0.0% |
| 10 to 14 Minutes | 7 | 8.9% |
| 15 to 19 Minutes | 0 | 0.0% |
| 20 to 24 Minutes | 0 | 0.0% |
| 25 to 29 Minutes | 4 | 5.1% |
| 30 to 34 Minutes | 10 | 12.7% |
| 35 to 39 Minutes | 0 | 0.0% |
| 40 to 44 Minutes | 4 | 5.1% |
| 45 to 59 Minutes | 8 | 10.1% |
| 60 to 89 Minutes | 31 | 39.2% |
| 90 or more Minutes | 12 | 15.2% |
Commute Time by Sex in Pine Grove
The most common commute times in Pine Grove are 60 to 89 minutes (27 commuters, 45.0%) for males and 10 to 14 minutes (7 commuters, 36.8%) for females.
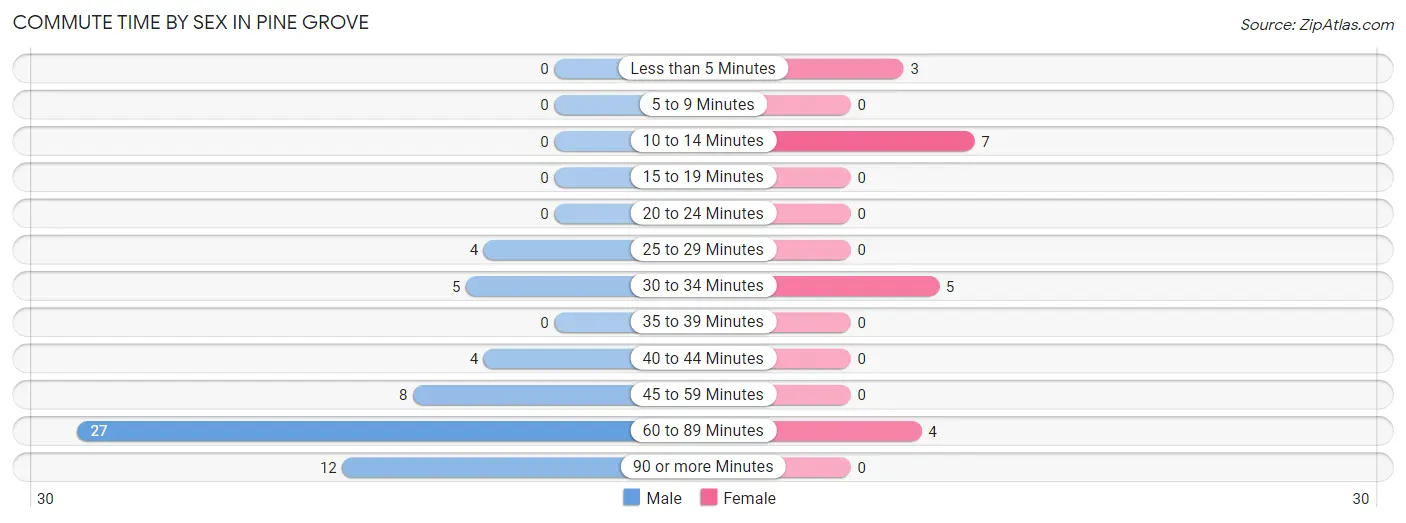
| Commute Time | Male | Female |
| Less than 5 Minutes | 0 (0.0%) | 3 (15.8%) |
| 5 to 9 Minutes | 0 (0.0%) | 0 (0.0%) |
| 10 to 14 Minutes | 0 (0.0%) | 7 (36.8%) |
| 15 to 19 Minutes | 0 (0.0%) | 0 (0.0%) |
| 20 to 24 Minutes | 0 (0.0%) | 0 (0.0%) |
| 25 to 29 Minutes | 4 (6.7%) | 0 (0.0%) |
| 30 to 34 Minutes | 5 (8.3%) | 5 (26.3%) |
| 35 to 39 Minutes | 0 (0.0%) | 0 (0.0%) |
| 40 to 44 Minutes | 4 (6.7%) | 0 (0.0%) |
| 45 to 59 Minutes | 8 (13.3%) | 0 (0.0%) |
| 60 to 89 Minutes | 27 (45.0%) | 4 (21.0%) |
| 90 or more Minutes | 12 (20.0%) | 0 (0.0%) |
Time of Departure to Work by Sex in Pine Grove
The most frequent times of departure to work in Pine Grove are 12:00 AM to 4:59 AM (22, 36.7%) for males and 8:30 AM to 8:59 AM (7, 36.8%) for females.
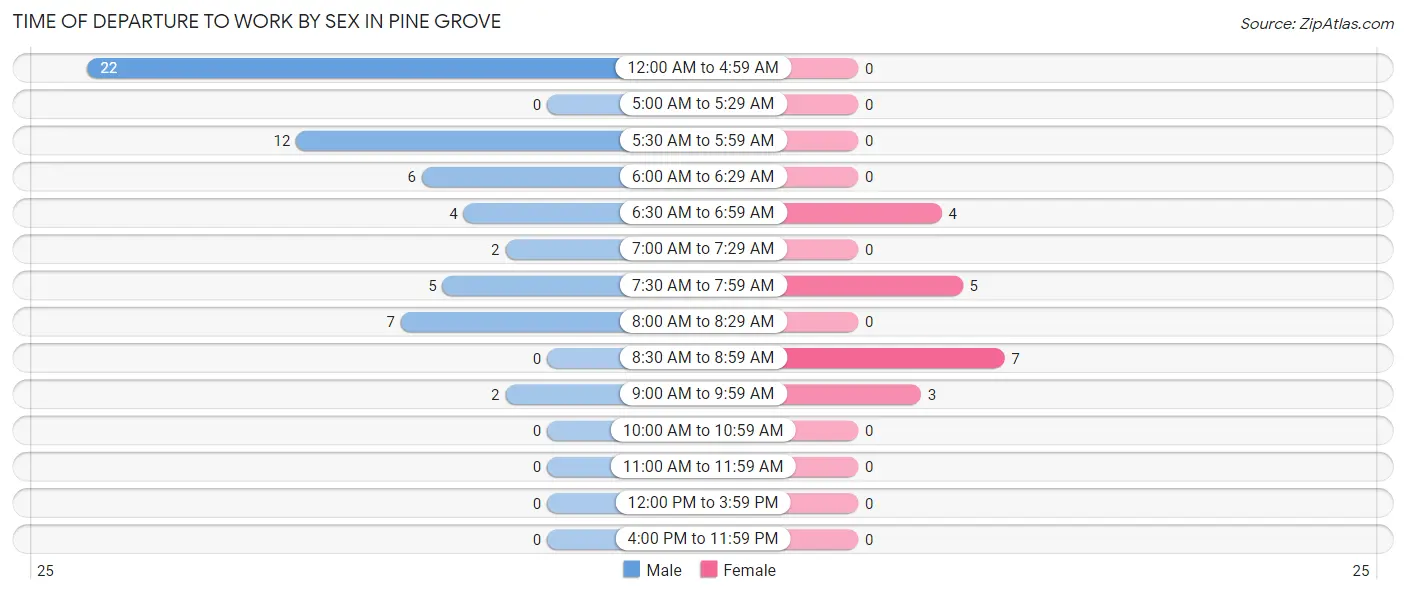
| Time of Departure | Male | Female |
| 12:00 AM to 4:59 AM | 22 (36.7%) | 0 (0.0%) |
| 5:00 AM to 5:29 AM | 0 (0.0%) | 0 (0.0%) |
| 5:30 AM to 5:59 AM | 12 (20.0%) | 0 (0.0%) |
| 6:00 AM to 6:29 AM | 6 (10.0%) | 0 (0.0%) |
| 6:30 AM to 6:59 AM | 4 (6.7%) | 4 (21.0%) |
| 7:00 AM to 7:29 AM | 2 (3.3%) | 0 (0.0%) |
| 7:30 AM to 7:59 AM | 5 (8.3%) | 5 (26.3%) |
| 8:00 AM to 8:29 AM | 7 (11.7%) | 0 (0.0%) |
| 8:30 AM to 8:59 AM | 0 (0.0%) | 7 (36.8%) |
| 9:00 AM to 9:59 AM | 2 (3.3%) | 3 (15.8%) |
| 10:00 AM to 10:59 AM | 0 (0.0%) | 0 (0.0%) |
| 11:00 AM to 11:59 AM | 0 (0.0%) | 0 (0.0%) |
| 12:00 PM to 3:59 PM | 0 (0.0%) | 0 (0.0%) |
| 4:00 PM to 11:59 PM | 0 (0.0%) | 0 (0.0%) |
| Total | 60 (100.0%) | 19 (100.0%) |
Housing Occupancy in Pine Grove
Occupancy by Ownership in Pine Grove
Of the total 115 dwellings in Pine Grove, owner-occupied units account for 69 (60.0%), while renter-occupied units make up 46 (40.0%).
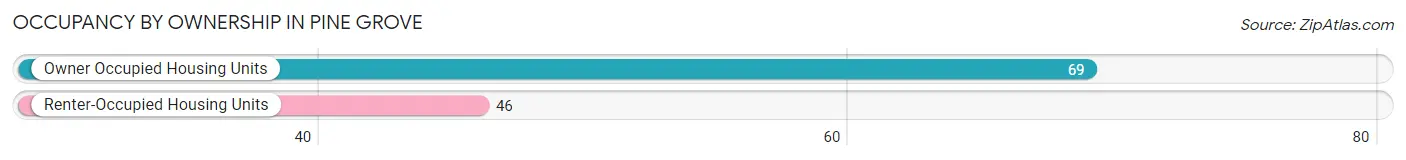
| Occupancy | # Housing Units | % Housing Units |
| Owner Occupied Housing Units | 69 | 60.0% |
| Renter-Occupied Housing Units | 46 | 40.0% |
| Total Occupied Housing Units | 115 | 100.0% |
Occupancy by Household Size in Pine Grove
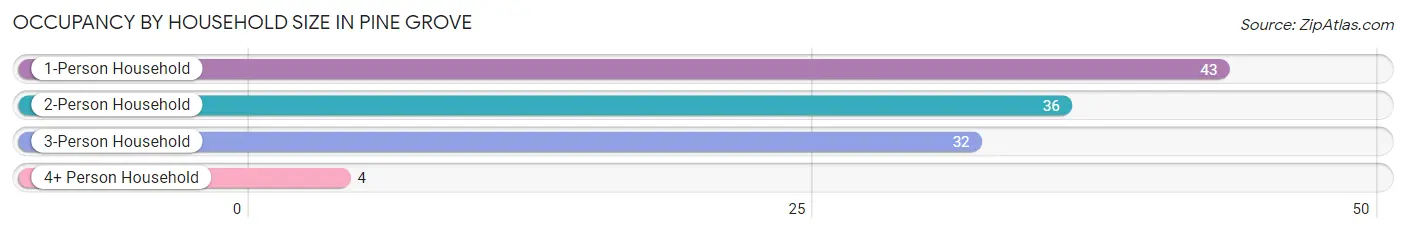
| Household Size | # Housing Units | % Housing Units |
| 1-Person Household | 43 | 37.4% |
| 2-Person Household | 36 | 31.3% |
| 3-Person Household | 32 | 27.8% |
| 4+ Person Household | 4 | 3.5% |
| Total Housing Units | 115 | 100.0% |
Occupancy by Ownership by Household Size in Pine Grove
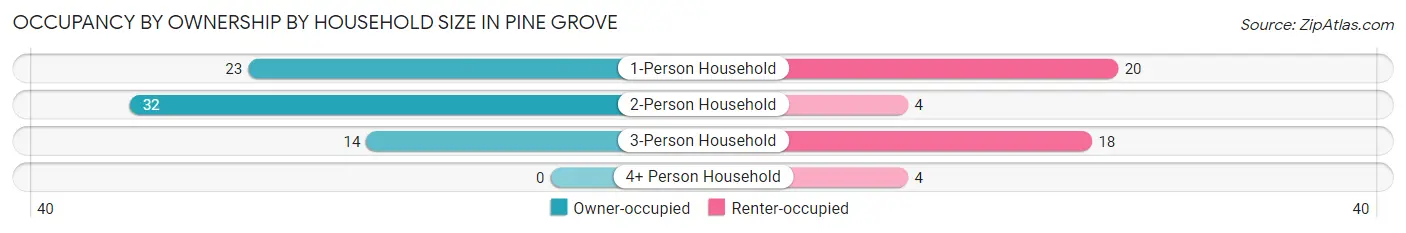
| Household Size | Owner-occupied | Renter-occupied |
| 1-Person Household | 23 (53.5%) | 20 (46.5%) |
| 2-Person Household | 32 (88.9%) | 4 (11.1%) |
| 3-Person Household | 14 (43.8%) | 18 (56.2%) |
| 4+ Person Household | 0 (0.0%) | 4 (100.0%) |
| Total Housing Units | 69 (60.0%) | 46 (40.0%) |
Occupancy by Educational Attainment in Pine Grove
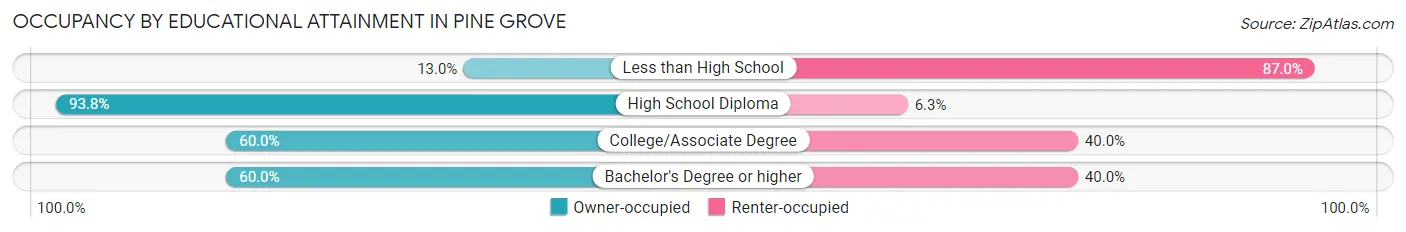
| Household Size | Owner-occupied | Renter-occupied |
| Less than High School | 3 (13.0%) | 20 (87.0%) |
| High School Diploma | 30 (93.8%) | 2 (6.2%) |
| College/Associate Degree | 30 (60.0%) | 20 (40.0%) |
| Bachelor's Degree or higher | 6 (60.0%) | 4 (40.0%) |
Occupancy by Age of Householder in Pine Grove
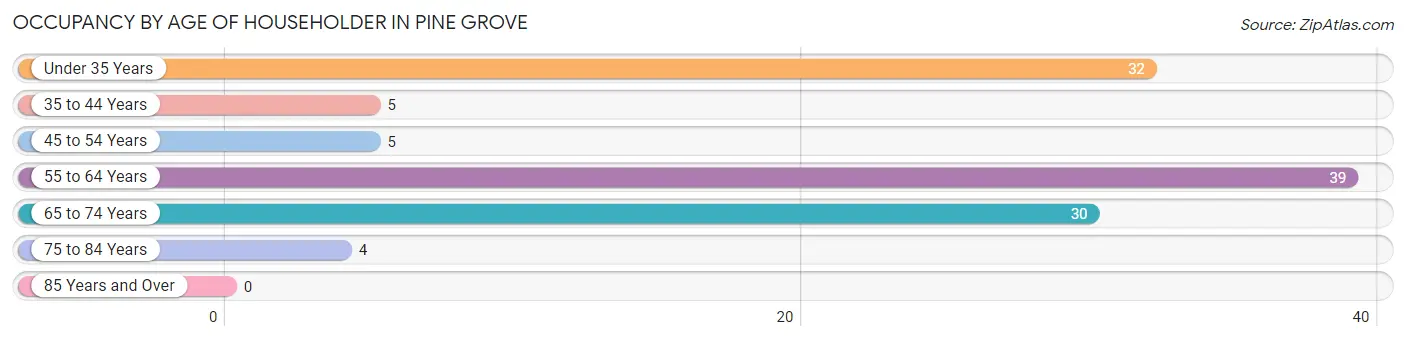
| Age Bracket | # Households | % Households |
| Under 35 Years | 32 | 27.8% |
| 35 to 44 Years | 5 | 4.3% |
| 45 to 54 Years | 5 | 4.3% |
| 55 to 64 Years | 39 | 33.9% |
| 65 to 74 Years | 30 | 26.1% |
| 75 to 84 Years | 4 | 3.5% |
| 85 Years and Over | 0 | 0.0% |
| Total | 115 | 100.0% |
Housing Finances in Pine Grove
Median Income by Occupancy in Pine Grove
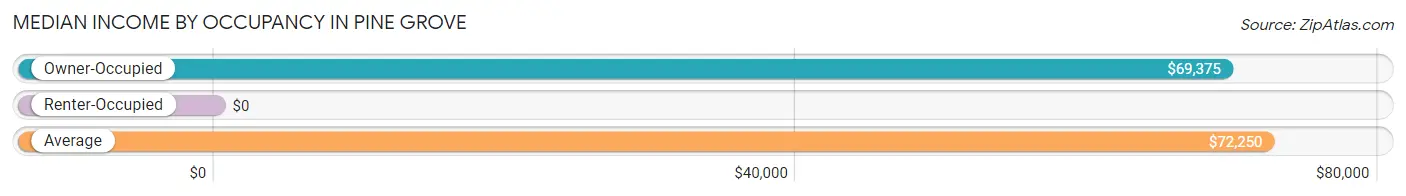
| Occupancy Type | # Households | Median Income |
| Owner-Occupied | 69 (60.0%) | $69,375 |
| Renter-Occupied | 46 (40.0%) | $0 |
| Average | 115 (100.0%) | $72,250 |
Occupancy by Householder Income Bracket in Pine Grove
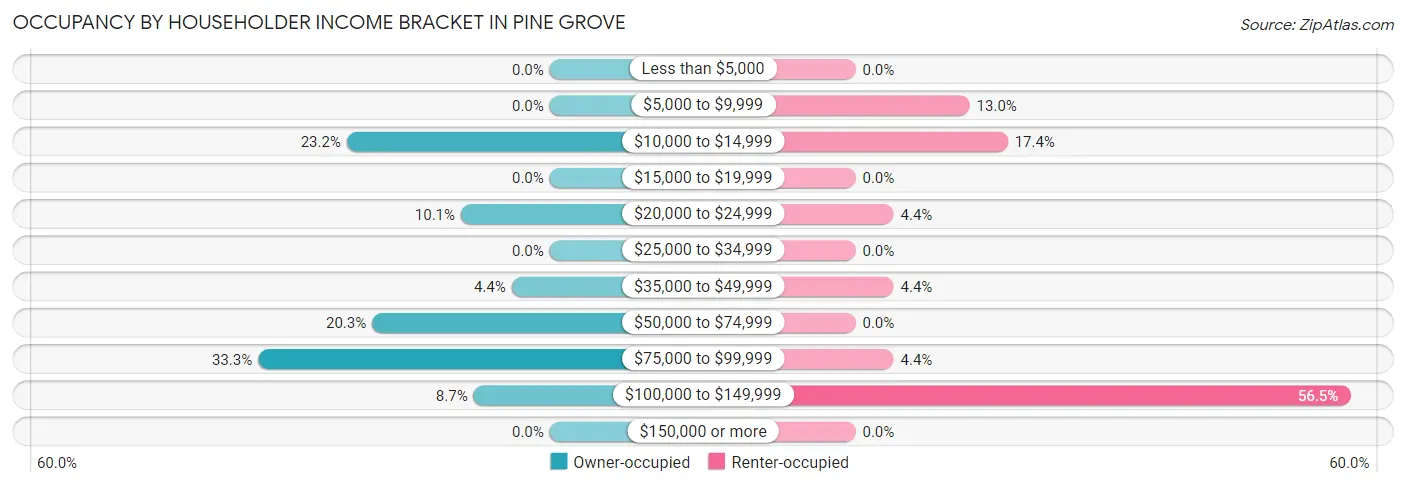
| Income Bracket | Owner-occupied | Renter-occupied |
| Less than $5,000 | 0 (0.0%) | 0 (0.0%) |
| $5,000 to $9,999 | 0 (0.0%) | 6 (13.0%) |
| $10,000 to $14,999 | 16 (23.2%) | 8 (17.4%) |
| $15,000 to $19,999 | 0 (0.0%) | 0 (0.0%) |
| $20,000 to $24,999 | 7 (10.1%) | 2 (4.3%) |
| $25,000 to $34,999 | 0 (0.0%) | 0 (0.0%) |
| $35,000 to $49,999 | 3 (4.3%) | 2 (4.3%) |
| $50,000 to $74,999 | 14 (20.3%) | 0 (0.0%) |
| $75,000 to $99,999 | 23 (33.3%) | 2 (4.3%) |
| $100,000 to $149,999 | 6 (8.7%) | 26 (56.5%) |
| $150,000 or more | 0 (0.0%) | 0 (0.0%) |
| Total | 69 (100.0%) | 46 (100.0%) |
Monthly Housing Cost Tiers in Pine Grove
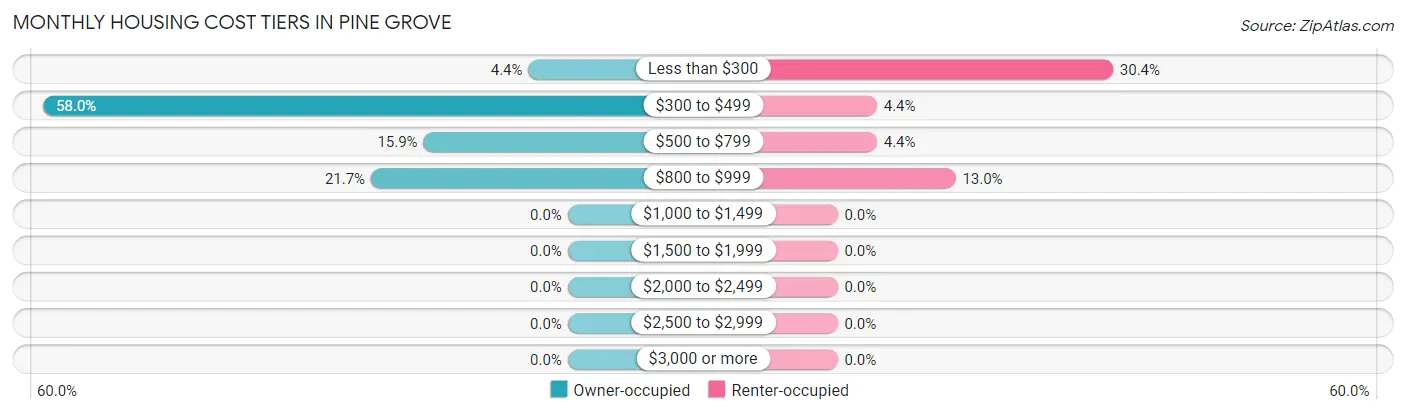
| Monthly Cost | Owner-occupied | Renter-occupied |
| Less than $300 | 3 (4.3%) | 14 (30.4%) |
| $300 to $499 | 40 (58.0%) | 2 (4.3%) |
| $500 to $799 | 11 (15.9%) | 2 (4.3%) |
| $800 to $999 | 15 (21.7%) | 6 (13.0%) |
| $1,000 to $1,499 | 0 (0.0%) | 0 (0.0%) |
| $1,500 to $1,999 | 0 (0.0%) | 0 (0.0%) |
| $2,000 to $2,499 | 0 (0.0%) | 0 (0.0%) |
| $2,500 to $2,999 | 0 (0.0%) | 0 (0.0%) |
| $3,000 or more | 0 (0.0%) | 0 (0.0%) |
| Total | 69 (100.0%) | 46 (100.0%) |
Physical Housing Characteristics in Pine Grove
Housing Structures in Pine Grove
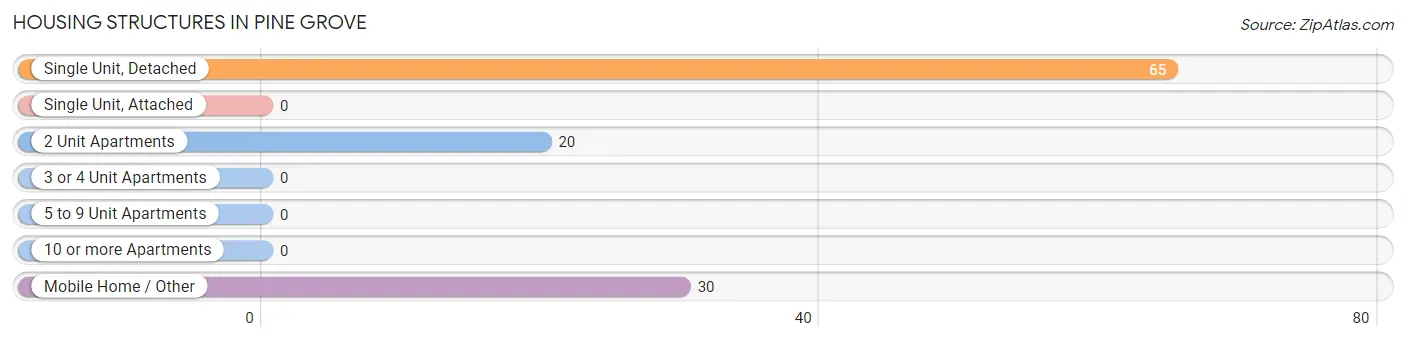
| Structure Type | # Housing Units | % Housing Units |
| Single Unit, Detached | 65 | 56.5% |
| Single Unit, Attached | 0 | 0.0% |
| 2 Unit Apartments | 20 | 17.4% |
| 3 or 4 Unit Apartments | 0 | 0.0% |
| 5 to 9 Unit Apartments | 0 | 0.0% |
| 10 or more Apartments | 0 | 0.0% |
| Mobile Home / Other | 30 | 26.1% |
| Total | 115 | 100.0% |
Housing Structures by Occupancy in Pine Grove
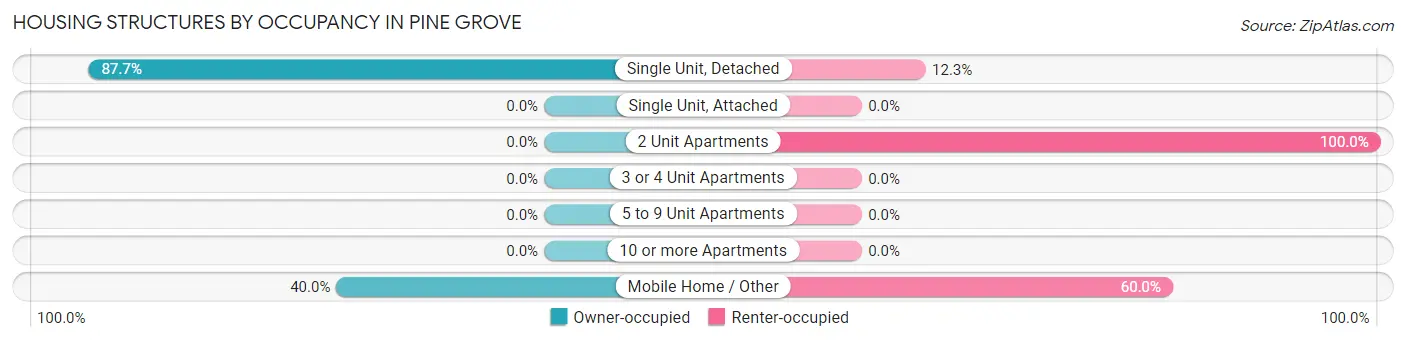
| Structure Type | Owner-occupied | Renter-occupied |
| Single Unit, Detached | 57 (87.7%) | 8 (12.3%) |
| Single Unit, Attached | 0 (0.0%) | 0 (0.0%) |
| 2 Unit Apartments | 0 (0.0%) | 20 (100.0%) |
| 3 or 4 Unit Apartments | 0 (0.0%) | 0 (0.0%) |
| 5 to 9 Unit Apartments | 0 (0.0%) | 0 (0.0%) |
| 10 or more Apartments | 0 (0.0%) | 0 (0.0%) |
| Mobile Home / Other | 12 (40.0%) | 18 (60.0%) |
| Total | 69 (60.0%) | 46 (40.0%) |
Housing Structures by Number of Rooms in Pine Grove
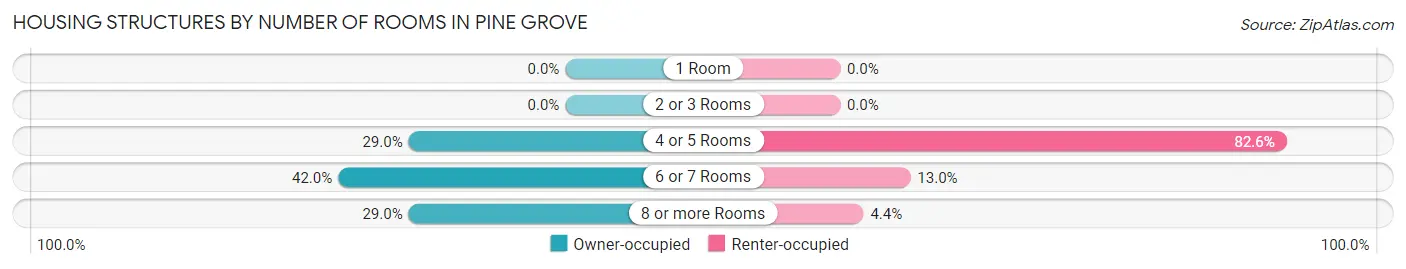
| Number of Rooms | Owner-occupied | Renter-occupied |
| 1 Room | 0 (0.0%) | 0 (0.0%) |
| 2 or 3 Rooms | 0 (0.0%) | 0 (0.0%) |
| 4 or 5 Rooms | 20 (29.0%) | 38 (82.6%) |
| 6 or 7 Rooms | 29 (42.0%) | 6 (13.0%) |
| 8 or more Rooms | 20 (29.0%) | 2 (4.3%) |
| Total | 69 (100.0%) | 46 (100.0%) |
Housing Structure by Heating Type in Pine Grove
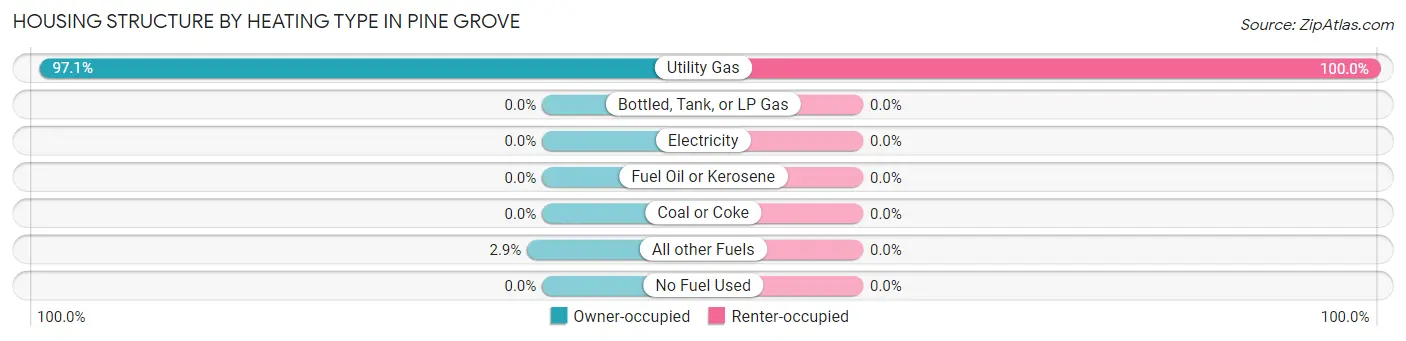
| Heating Type | Owner-occupied | Renter-occupied |
| Utility Gas | 67 (97.1%) | 46 (100.0%) |
| Bottled, Tank, or LP Gas | 0 (0.0%) | 0 (0.0%) |
| Electricity | 0 (0.0%) | 0 (0.0%) |
| Fuel Oil or Kerosene | 0 (0.0%) | 0 (0.0%) |
| Coal or Coke | 0 (0.0%) | 0 (0.0%) |
| All other Fuels | 2 (2.9%) | 0 (0.0%) |
| No Fuel Used | 0 (0.0%) | 0 (0.0%) |
| Total | 69 (100.0%) | 46 (100.0%) |
Household Vehicle Usage in Pine Grove
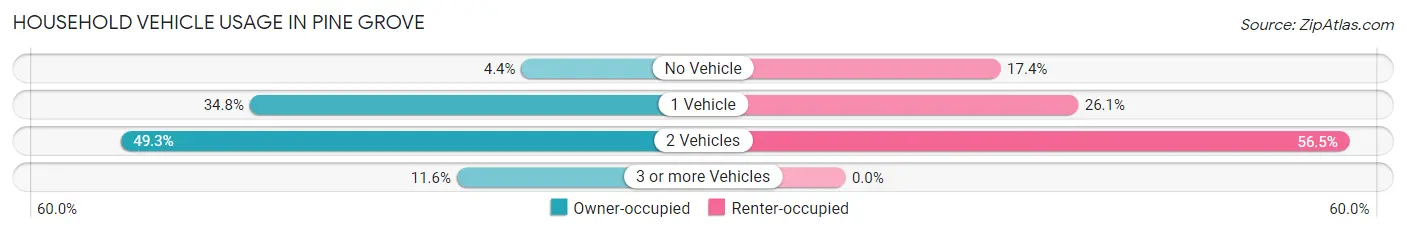
| Vehicles per Household | Owner-occupied | Renter-occupied |
| No Vehicle | 3 (4.3%) | 8 (17.4%) |
| 1 Vehicle | 24 (34.8%) | 12 (26.1%) |
| 2 Vehicles | 34 (49.3%) | 26 (56.5%) |
| 3 or more Vehicles | 8 (11.6%) | 0 (0.0%) |
| Total | 69 (100.0%) | 46 (100.0%) |
Real Estate & Mortgages in Pine Grove
Real Estate and Mortgage Overview in Pine Grove
| Characteristic | Without Mortgage | With Mortgage |
| Housing Units | 54 | 15 |
| Median Property Value | - | - |
| Median Household Income | - | - |
| Monthly Housing Costs | $386 | $0 |
| Real Estate Taxes | $487 | $0 |
Property Value by Mortgage Status in Pine Grove
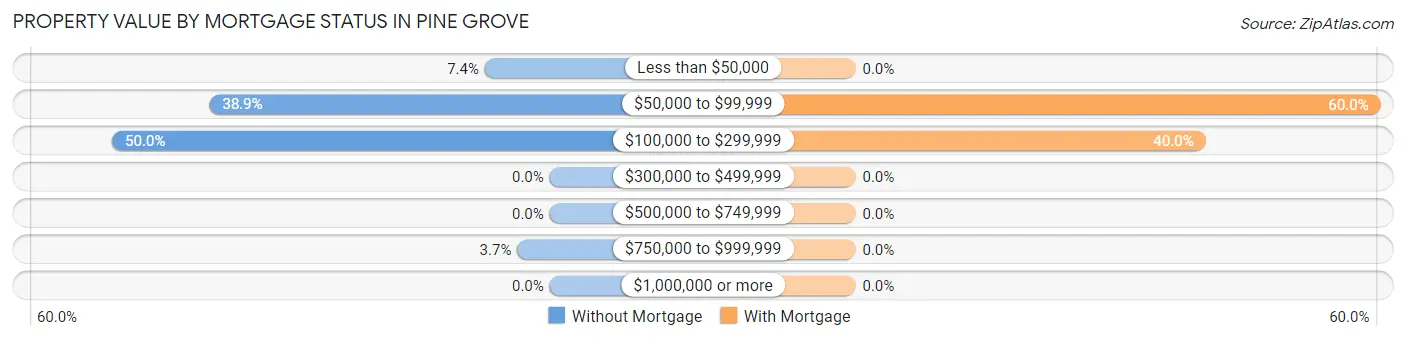
| Property Value | Without Mortgage | With Mortgage |
| Less than $50,000 | 4 (7.4%) | 0 (0.0%) |
| $50,000 to $99,999 | 21 (38.9%) | 9 (60.0%) |
| $100,000 to $299,999 | 27 (50.0%) | 6 (40.0%) |
| $300,000 to $499,999 | 0 (0.0%) | 0 (0.0%) |
| $500,000 to $749,999 | 0 (0.0%) | 0 (0.0%) |
| $750,000 to $999,999 | 2 (3.7%) | 0 (0.0%) |
| $1,000,000 or more | 0 (0.0%) | 0 (0.0%) |
| Total | 54 (100.0%) | 15 (100.0%) |
Household Income by Mortgage Status in Pine Grove
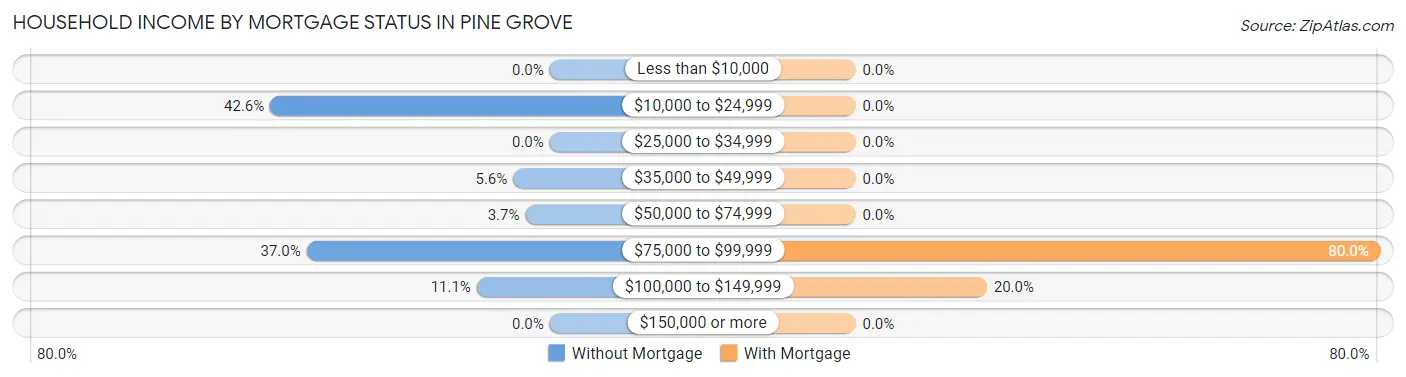
| Household Income | Without Mortgage | With Mortgage |
| Less than $10,000 | 0 (0.0%) | 0 (0.0%) |
| $10,000 to $24,999 | 23 (42.6%) | 0 (0.0%) |
| $25,000 to $34,999 | 0 (0.0%) | 0 (0.0%) |
| $35,000 to $49,999 | 3 (5.6%) | 0 (0.0%) |
| $50,000 to $74,999 | 2 (3.7%) | 0 (0.0%) |
| $75,000 to $99,999 | 20 (37.0%) | 12 (80.0%) |
| $100,000 to $149,999 | 6 (11.1%) | 3 (20.0%) |
| $150,000 or more | 0 (0.0%) | 0 (0.0%) |
| Total | 54 (100.0%) | 15 (100.0%) |
Property Value to Household Income Ratio in Pine Grove
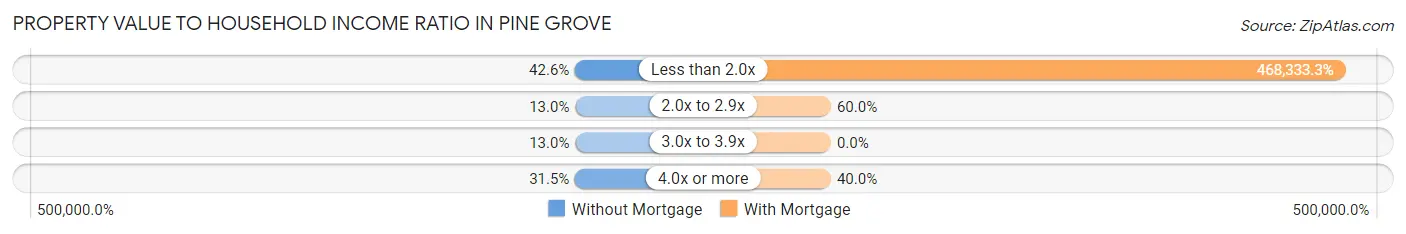
| Value-to-Income Ratio | Without Mortgage | With Mortgage |
| Less than 2.0x | 23 (42.6%) | 70,250 (468,333.3%) |
| 2.0x to 2.9x | 7 (13.0%) | 9 (60.0%) |
| 3.0x to 3.9x | 7 (13.0%) | 0 (0.0%) |
| 4.0x or more | 17 (31.5%) | 6 (40.0%) |
| Total | 54 (100.0%) | 15 (100.0%) |
Real Estate Taxes by Mortgage Status in Pine Grove
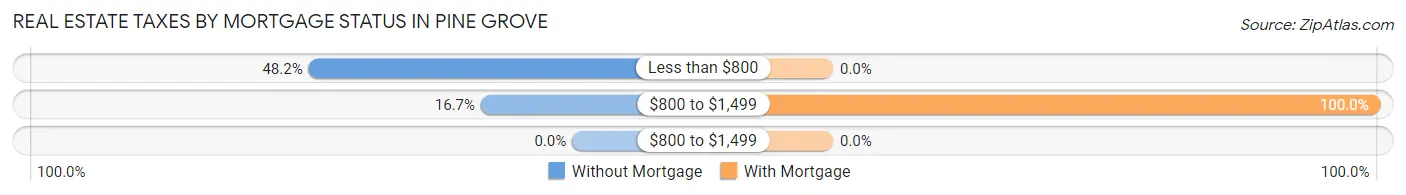
| Property Taxes | Without Mortgage | With Mortgage |
| Less than $800 | 26 (48.1%) | 0 (0.0%) |
| $800 to $1,499 | 9 (16.7%) | 15 (100.0%) |
| $800 to $1,499 | 0 (0.0%) | 0 (0.0%) |
| Total | 54 (100.0%) | 15 (100.0%) |
Health & Disability in Pine Grove
Health Insurance Coverage by Age in Pine Grove
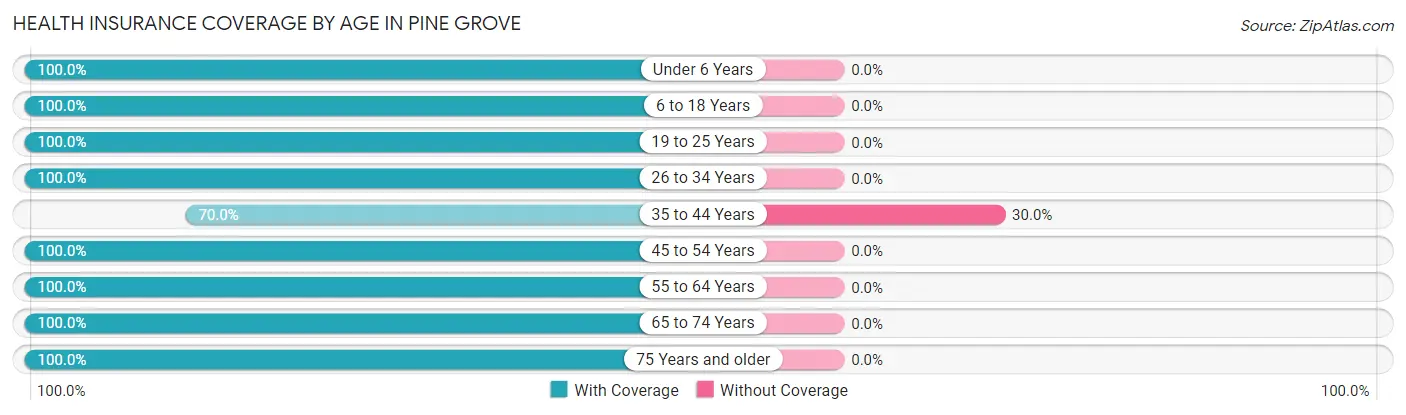
| Age Bracket | With Coverage | Without Coverage |
| Under 6 Years | 12 (100.0%) | 0 (0.0%) |
| 6 to 18 Years | 10 (100.0%) | 0 (0.0%) |
| 19 to 25 Years | 5 (100.0%) | 0 (0.0%) |
| 26 to 34 Years | 50 (100.0%) | 0 (0.0%) |
| 35 to 44 Years | 7 (70.0%) | 3 (30.0%) |
| 45 to 54 Years | 21 (100.0%) | 0 (0.0%) |
| 55 to 64 Years | 66 (100.0%) | 0 (0.0%) |
| 65 to 74 Years | 36 (100.0%) | 0 (0.0%) |
| 75 Years and older | 4 (100.0%) | 0 (0.0%) |
| Total | 211 (98.6%) | 3 (1.4%) |
Health Insurance Coverage by Citizenship Status in Pine Grove

| Citizenship Status | With Coverage | Without Coverage |
| Native Born | 12 (100.0%) | 0 (0.0%) |
| Foreign Born, Citizen | 10 (100.0%) | 0 (0.0%) |
| Foreign Born, not a Citizen | 5 (100.0%) | 0 (0.0%) |
Health Insurance Coverage by Household Income in Pine Grove
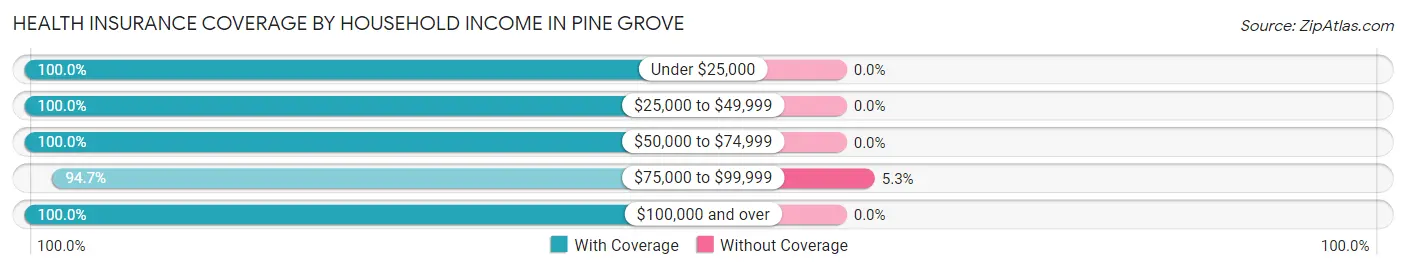
| Household Income | With Coverage | Without Coverage |
| Under $25,000 | 43 (100.0%) | 0 (0.0%) |
| $25,000 to $49,999 | 22 (100.0%) | 0 (0.0%) |
| $50,000 to $74,999 | 28 (100.0%) | 0 (0.0%) |
| $75,000 to $99,999 | 54 (94.7%) | 3 (5.3%) |
| $100,000 and over | 64 (100.0%) | 0 (0.0%) |
Public vs Private Health Insurance Coverage by Age in Pine Grove
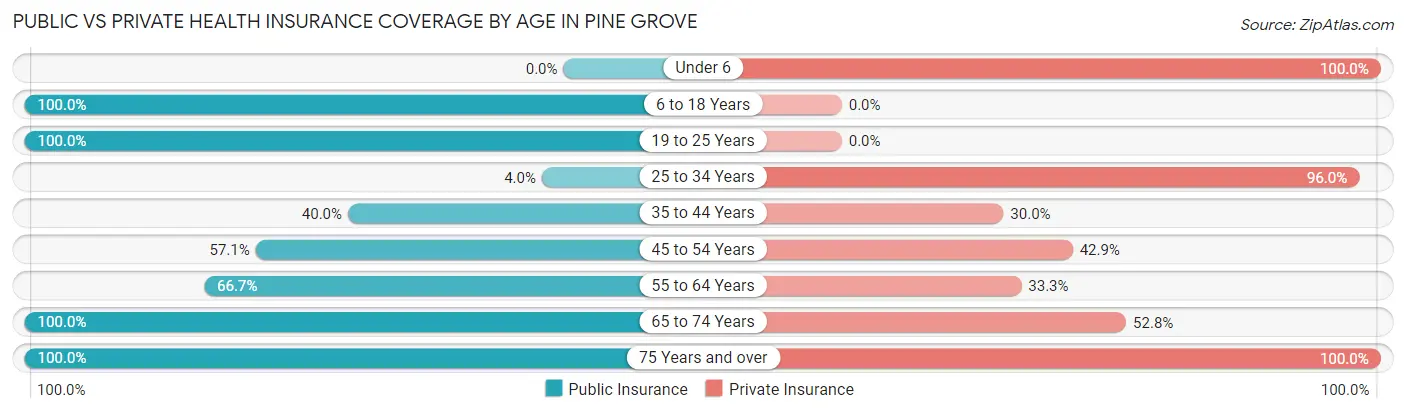
| Age Bracket | Public Insurance | Private Insurance |
| Under 6 | 0 (0.0%) | 12 (100.0%) |
| 6 to 18 Years | 10 (100.0%) | 0 (0.0%) |
| 19 to 25 Years | 5 (100.0%) | 0 (0.0%) |
| 25 to 34 Years | 2 (4.0%) | 48 (96.0%) |
| 35 to 44 Years | 4 (40.0%) | 3 (30.0%) |
| 45 to 54 Years | 12 (57.1%) | 9 (42.9%) |
| 55 to 64 Years | 44 (66.7%) | 22 (33.3%) |
| 65 to 74 Years | 36 (100.0%) | 19 (52.8%) |
| 75 Years and over | 4 (100.0%) | 4 (100.0%) |
| Total | 117 (54.7%) | 117 (54.7%) |
Disability Status by Sex by Age in Pine Grove
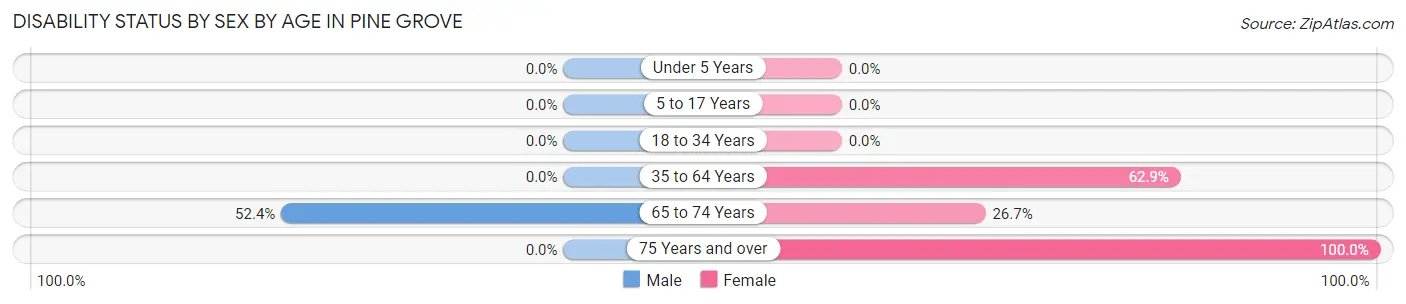
| Age Bracket | Male | Female |
| Under 5 Years | 0 (0.0%) | 0 (0.0%) |
| 5 to 17 Years | 0 (0.0%) | 0 (0.0%) |
| 18 to 34 Years | 0 (0.0%) | 0 (0.0%) |
| 35 to 64 Years | 0 (0.0%) | 39 (62.9%) |
| 65 to 74 Years | 11 (52.4%) | 4 (26.7%) |
| 75 Years and over | 0 (0.0%) | 4 (100.0%) |
Disability Class by Sex by Age in Pine Grove
Disability Class: Hearing Difficulty
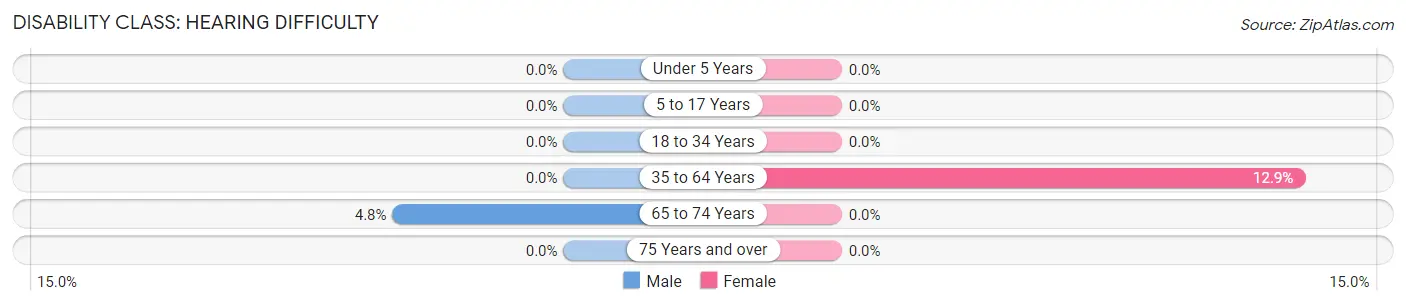
| Age Bracket | Male | Female |
| Under 5 Years | 0 (0.0%) | 0 (0.0%) |
| 5 to 17 Years | 0 (0.0%) | 0 (0.0%) |
| 18 to 34 Years | 0 (0.0%) | 0 (0.0%) |
| 35 to 64 Years | 0 (0.0%) | 8 (12.9%) |
| 65 to 74 Years | 1 (4.8%) | 0 (0.0%) |
| 75 Years and over | 0 (0.0%) | 0 (0.0%) |
Disability Class: Vision Difficulty
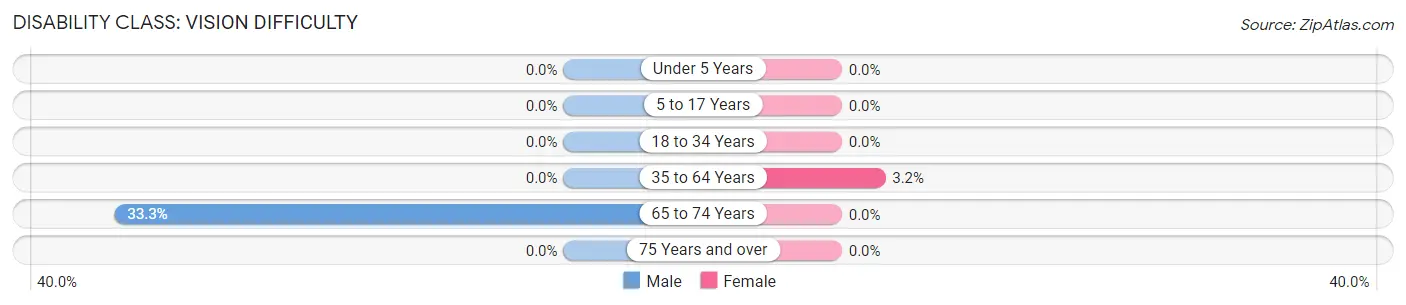
| Age Bracket | Male | Female |
| Under 5 Years | 0 (0.0%) | 0 (0.0%) |
| 5 to 17 Years | 0 (0.0%) | 0 (0.0%) |
| 18 to 34 Years | 0 (0.0%) | 0 (0.0%) |
| 35 to 64 Years | 0 (0.0%) | 2 (3.2%) |
| 65 to 74 Years | 7 (33.3%) | 0 (0.0%) |
| 75 Years and over | 0 (0.0%) | 0 (0.0%) |
Disability Class: Cognitive Difficulty
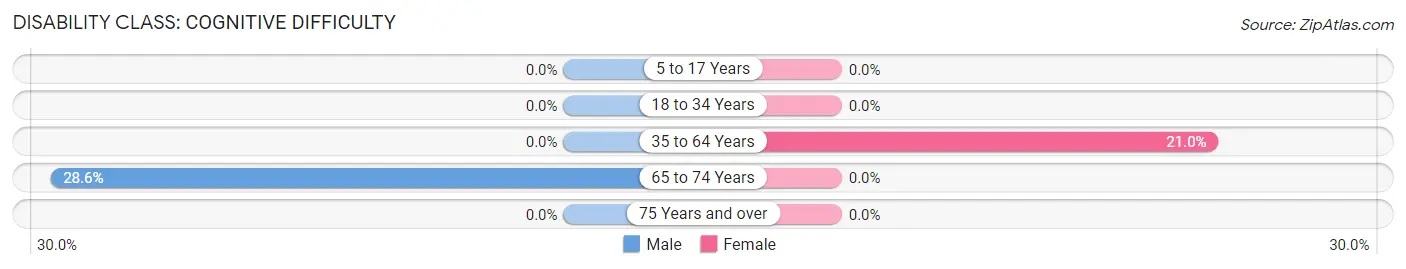
| Age Bracket | Male | Female |
| 5 to 17 Years | 0 (0.0%) | 0 (0.0%) |
| 18 to 34 Years | 0 (0.0%) | 0 (0.0%) |
| 35 to 64 Years | 0 (0.0%) | 13 (21.0%) |
| 65 to 74 Years | 6 (28.6%) | 0 (0.0%) |
| 75 Years and over | 0 (0.0%) | 0 (0.0%) |
Disability Class: Ambulatory Difficulty
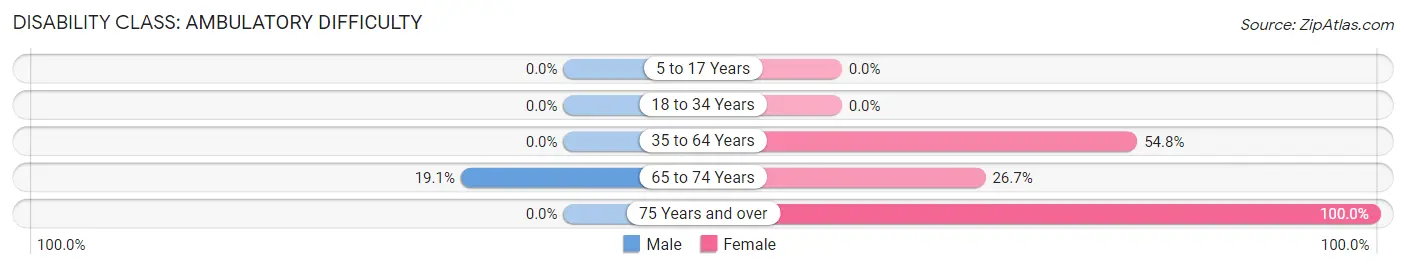
| Age Bracket | Male | Female |
| 5 to 17 Years | 0 (0.0%) | 0 (0.0%) |
| 18 to 34 Years | 0 (0.0%) | 0 (0.0%) |
| 35 to 64 Years | 0 (0.0%) | 34 (54.8%) |
| 65 to 74 Years | 4 (19.1%) | 4 (26.7%) |
| 75 Years and over | 0 (0.0%) | 4 (100.0%) |
Disability Class: Self-Care Difficulty
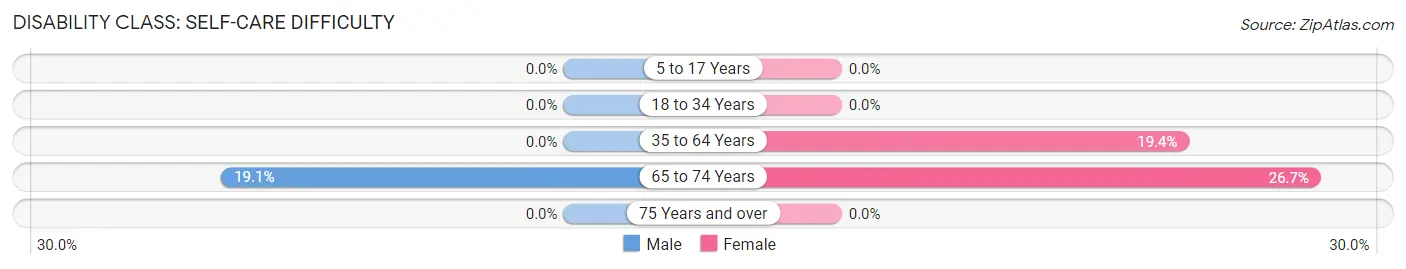
| Age Bracket | Male | Female |
| 5 to 17 Years | 0 (0.0%) | 0 (0.0%) |
| 18 to 34 Years | 0 (0.0%) | 0 (0.0%) |
| 35 to 64 Years | 0 (0.0%) | 12 (19.4%) |
| 65 to 74 Years | 4 (19.1%) | 4 (26.7%) |
| 75 Years and over | 0 (0.0%) | 0 (0.0%) |
Technology Access in Pine Grove
Computing Device Access in Pine Grove
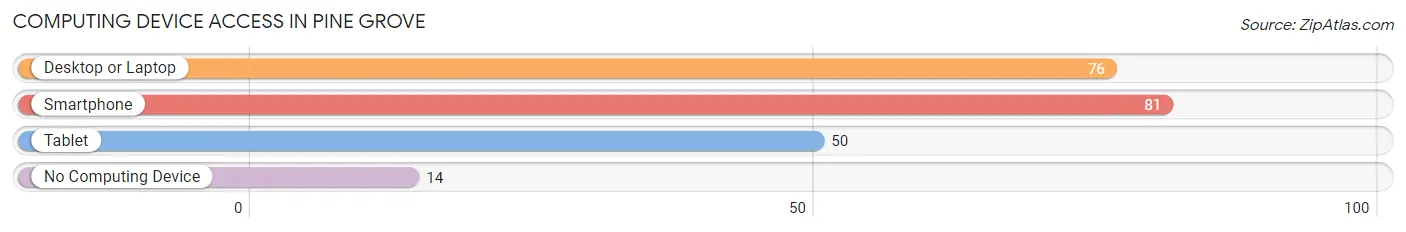
| Device Type | # Households | % Households |
| Desktop or Laptop | 76 | 66.1% |
| Smartphone | 81 | 70.4% |
| Tablet | 50 | 43.5% |
| No Computing Device | 14 | 12.2% |
| Total | 115 | 100.0% |
Internet Access in Pine Grove
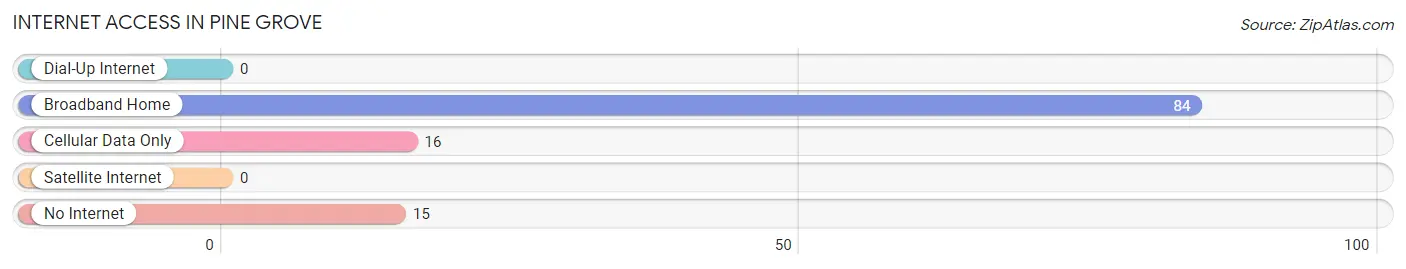
| Internet Type | # Households | % Households |
| Dial-Up Internet | 0 | 0.0% |
| Broadband Home | 84 | 73.0% |
| Cellular Data Only | 16 | 13.9% |
| Satellite Internet | 0 | 0.0% |
| No Internet | 15 | 13.0% |
| Total | 115 | 100.0% |
Pine Grove Summary
Pine Grove, West Virginia is a small town located in the northern part of the state, in Mineral County. It is situated along the North Branch of the Potomac River, and is surrounded by the Allegheny Mountains. The town has a population of approximately 1,000 people, and is known for its rural charm and small-town atmosphere.
History
Pine Grove was first settled in the late 1700s by a group of German immigrants. The town was originally known as “Pine Grove Settlement” and was located near the present-day town of Keyser. The settlement was later renamed “Pine Grove” in 1820, and the town was officially incorporated in 1872.
The town was an important stop on the Baltimore and Ohio Railroad, and was a popular destination for travelers. The railroad brought many new businesses to the area, including a hotel, a general store, and a post office. The town also had a school, a church, and a blacksmith shop.
In the late 1800s, the town began to decline as the railroad moved away from the area. The town’s population decreased, and many of the businesses closed. However, the town was revitalized in the early 1900s when the Chesapeake and Ohio Canal was built nearby. The canal brought new jobs and businesses to the area, and the town’s population began to grow again.
Geography
Pine Grove is located in the northern part of West Virginia, in Mineral County. The town is situated along the North Branch of the Potomac River, and is surrounded by the Allegheny Mountains. The town is located approximately 30 miles from Cumberland, Maryland, and is about a two-hour drive from Washington, D.C.
The town has a total area of 0.7 square miles, all of which is land. The town is located at an elevation of 1,845 feet above sea level. The climate in Pine Grove is classified as humid continental, with hot summers and cold winters.
Economy
The economy of Pine Grove is largely based on tourism and agriculture. The town is home to several small businesses, including a general store, a restaurant, and a bed and breakfast. The town also has a small airport, which is used for recreational flying.
Agriculture is an important part of the local economy, and the town is home to several farms. The farms produce a variety of crops, including corn, soybeans, and hay. The town also has several apple orchards, which produce apples for local consumption and for sale at farmers’ markets.
Demographics
As of the 2010 census, the population of Pine Grove was 1,000 people. The town has a median age of 44.7 years, and the median household income is $37,500. The town is predominantly white, with 95.2% of the population identifying as white. The town also has a small Hispanic population, with 2.2% of the population identifying as Hispanic or Latino.
Conclusion
Pine Grove, West Virginia is a small town located in the northern part of the state, in Mineral County. The town has a population of approximately 1,000 people, and is known for its rural charm and small-town atmosphere. The town’s economy is largely based on tourism and agriculture, and the town is home to several small businesses and farms. The town is predominantly white, with 95.2% of the population identifying as white. Pine Grove is a charming and peaceful town, and is a great place to visit or live.
Common Questions
What is Per Capita Income in Pine Grove?
Per Capita income in Pine Grove is $31,772.
What is the Median Family Income in Pine Grove?
Median Family Income in Pine Grove is $79,896.
What is the Median Household income in Pine Grove?
Median Household Income in Pine Grove is $72,250.
What is Income or Wage Gap in Pine Grove?
Income or Wage Gap in Pine Grove is 84.5%.
Women in Pine Grove earn 15.5 cents for every dollar earned by a man.
What is Inequality or Gini Index in Pine Grove?
Inequality or Gini Index in Pine Grove is 0.37.
What is the Total Population of Pine Grove?
Total Population of Pine Grove is 214.
What is the Total Male Population of Pine Grove?
Total Male Population of Pine Grove is 96.
What is the Total Female Population of Pine Grove?
Total Female Population of Pine Grove is 118.
What is the Ratio of Males per 100 Females in Pine Grove?
There are 81.36 Males per 100 Females in Pine Grove.
What is the Ratio of Females per 100 Males in Pine Grove?
There are 122.92 Females per 100 Males in Pine Grove.
What is the Median Population Age in Pine Grove?
Median Population Age in Pine Grove is 54.9 Years.
What is the Average Family Size in Pine Grove
Average Family Size in Pine Grove is 2.3 People.
What is the Average Household Size in Pine Grove
Average Household Size in Pine Grove is 1.9 People.
How Large is the Labor Force in Pine Grove?
There are 93 People in the Labor Forcein in Pine Grove.
What is the Percentage of People in the Labor Force in Pine Grove?
48.4% of People are in the Labor Force in Pine Grove.
What is the Unemployment Rate in Pine Grove?
Unemployment Rate in Pine Grove is 15.1%.