Pax, WV Map & Demographics
Pax Map
Pax Overview
$21,511
PER CAPITA INCOME
$58,438
AVG FAMILY INCOME
0.37
INEQUALITY / GINI INDEX
79
TOTAL POPULATION
46
MALE POPULATION
33
FEMALE POPULATION
139.39
MALES / 100 FEMALES
71.74
FEMALES / 100 MALES
57.6
MEDIAN AGE
2.4
AVG FAMILY SIZE
1.9
AVG HOUSEHOLD SIZE
25
LABOR FORCE [ PEOPLE ]
37.9%
PERCENT IN LABOR FORCE
Pax Zip Codes
Pax Area Codes
Income in Pax
Income Overview in Pax
| Characteristic | Number | Measure |
| Per Capita Income | 79 | $21,511 |
| Median Family Income | 28 | $58,438 |
| Mean Family Income | 28 | $47,275 |
| Median Household Income | 41 | $0 |
| Mean Household Income | 41 | $41,637 |
| Income Deficit | 28 | $0 |
| Wage / Income Gap (%) | 79 | 0.00% |
| Wage / Income Gap ($) | 79 | 100.00¢ per $1 |
| Gini / Inequality Index | 79 | 0.37 |
Earnings by Sex in Pax
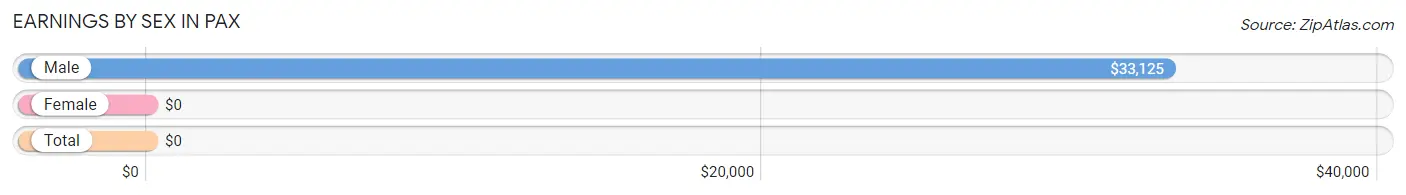
| Sex | Number | Average Earnings |
| Male | 25 (78.1%) | $33,125 |
| Female | 7 (21.9%) | $0 |
| Total | 32 (100.0%) | $0 |
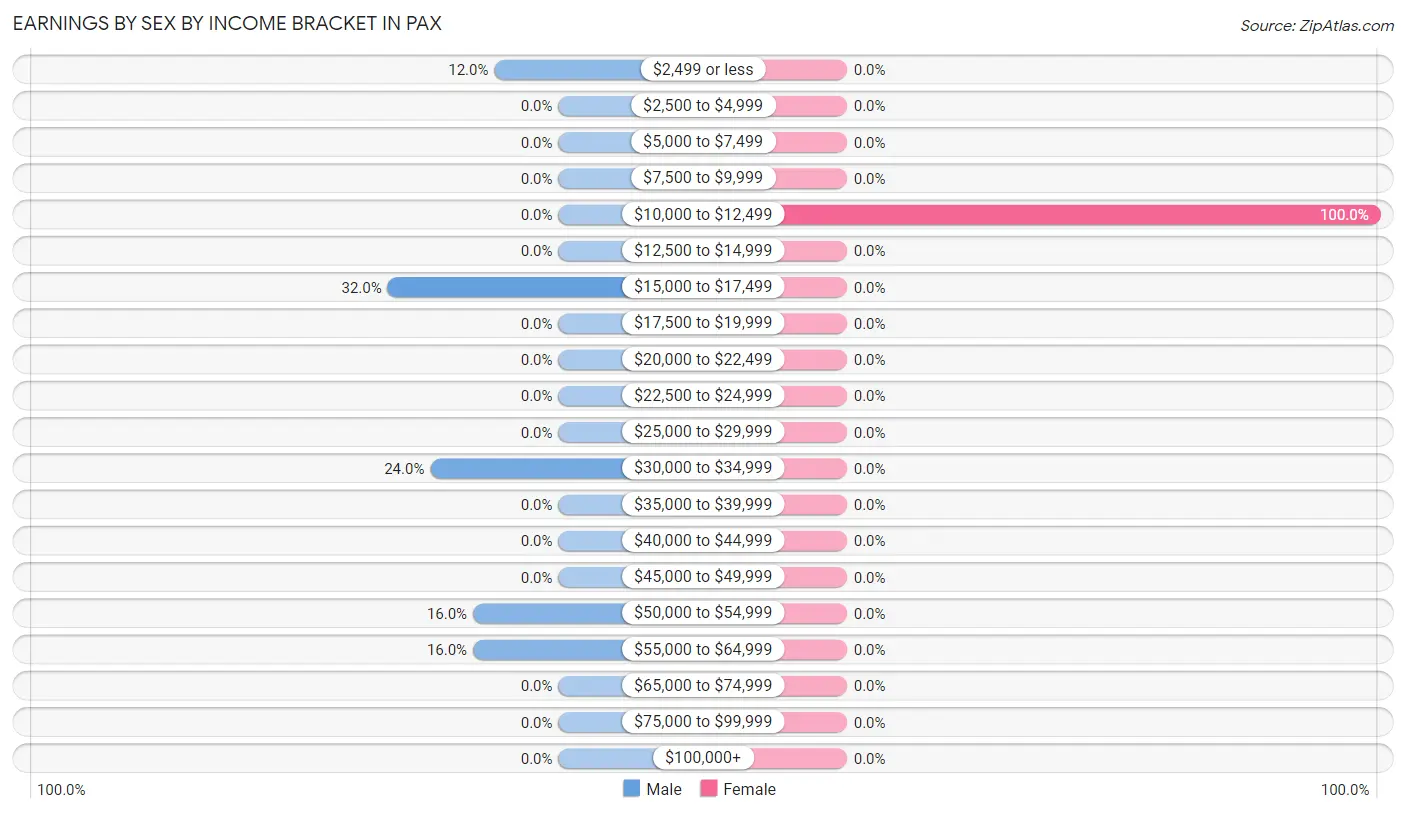
Earnings by Sex by Income Bracket in Pax
The most common earnings brackets in Pax are $15,000 to $17,499 for men (8 | 32.0%) and $10,000 to $12,499 for women (7 | 100.0%).
| Income | Male | Female |
| $2,499 or less | 3 (12.0%) | 0 (0.0%) |
| $2,500 to $4,999 | 0 (0.0%) | 0 (0.0%) |
| $5,000 to $7,499 | 0 (0.0%) | 0 (0.0%) |
| $7,500 to $9,999 | 0 (0.0%) | 0 (0.0%) |
| $10,000 to $12,499 | 0 (0.0%) | 7 (100.0%) |
| $12,500 to $14,999 | 0 (0.0%) | 0 (0.0%) |
| $15,000 to $17,499 | 8 (32.0%) | 0 (0.0%) |
| $17,500 to $19,999 | 0 (0.0%) | 0 (0.0%) |
| $20,000 to $22,499 | 0 (0.0%) | 0 (0.0%) |
| $22,500 to $24,999 | 0 (0.0%) | 0 (0.0%) |
| $25,000 to $29,999 | 0 (0.0%) | 0 (0.0%) |
| $30,000 to $34,999 | 6 (24.0%) | 0 (0.0%) |
| $35,000 to $39,999 | 0 (0.0%) | 0 (0.0%) |
| $40,000 to $44,999 | 0 (0.0%) | 0 (0.0%) |
| $45,000 to $49,999 | 0 (0.0%) | 0 (0.0%) |
| $50,000 to $54,999 | 4 (16.0%) | 0 (0.0%) |
| $55,000 to $64,999 | 4 (16.0%) | 0 (0.0%) |
| $65,000 to $74,999 | 0 (0.0%) | 0 (0.0%) |
| $75,000 to $99,999 | 0 (0.0%) | 0 (0.0%) |
| $100,000+ | 0 (0.0%) | 0 (0.0%) |
| Total | 25 (100.0%) | 7 (100.0%) |
Earnings by Sex by Educational Attainment in Pax
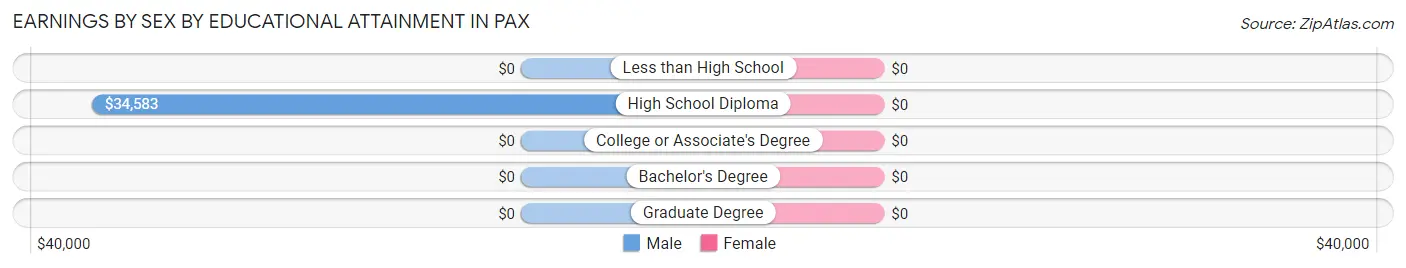
| Educational Attainment | Male Income | Female Income |
| Less than High School | - | - |
| High School Diploma | $34,583 | $0 |
| College or Associate's Degree | - | - |
| Bachelor's Degree | - | - |
| Graduate Degree | - | - |
| Total | $50,625 | $0 |
Family Income in Pax
Family Income Brackets in Pax
According to the Pax family income data, there are 10 families falling into the $50,000 to $74,999 income range, which is the most common income bracket and makes up 35.7% of all families.
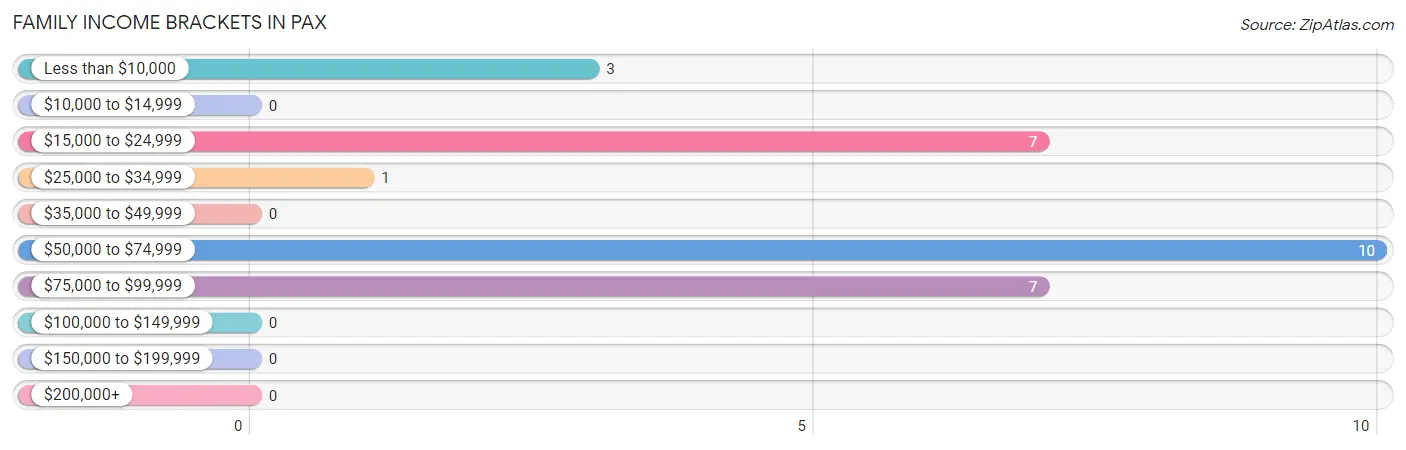
| Income Bracket | # Families | % Families |
| Less than $10,000 | 3 | 10.7% |
| $10,000 to $14,999 | 0 | 0.0% |
| $15,000 to $24,999 | 7 | 25.0% |
| $25,000 to $34,999 | 1 | 3.6% |
| $35,000 to $49,999 | 0 | 0.0% |
| $50,000 to $74,999 | 10 | 35.7% |
| $75,000 to $99,999 | 7 | 25.0% |
| $100,000 to $149,999 | 0 | 0.0% |
| $150,000 to $199,999 | 0 | 0.0% |
| $200,000+ | 0 | 0.0% |
Family Income by Famaliy Size in Pax
2-person families (25 | 89.3%) account for the highest median family income in Pax with $58,906 per family, while 2-person families (25 | 89.3%) have the highest median income of $29,453 per family member.
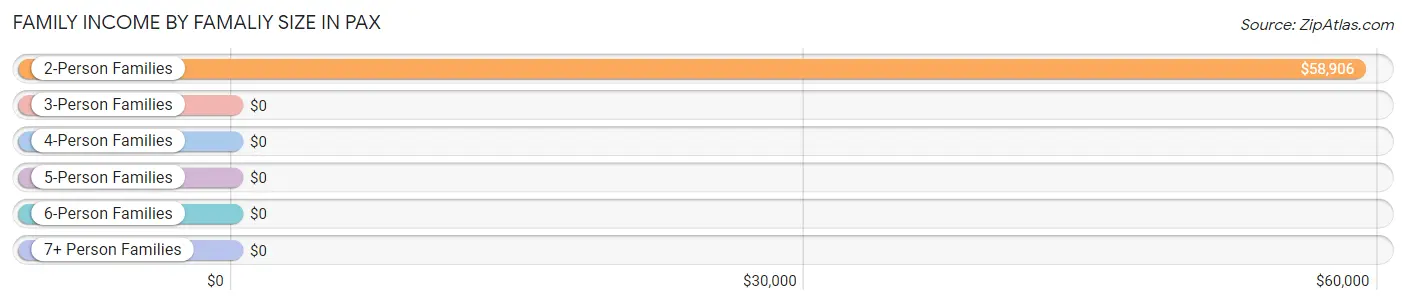
| Income Bracket | # Families | Median Income |
| 2-Person Families | 25 (89.3%) | $58,906 |
| 3-Person Families | 0 (0.0%) | $0 |
| 4-Person Families | 0 (0.0%) | $0 |
| 5-Person Families | 3 (10.7%) | $0 |
| 6-Person Families | 0 (0.0%) | $0 |
| 7+ Person Families | 0 (0.0%) | $0 |
| Total | 28 (100.0%) | $58,438 |
Family Income by Number of Earners in Pax
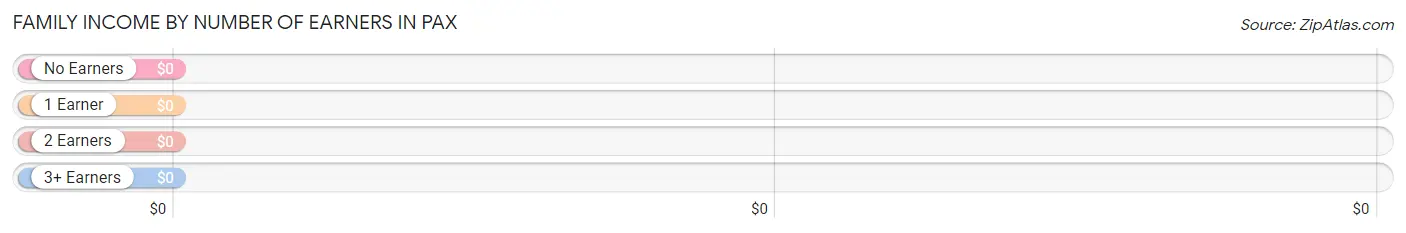
| Number of Earners | # Families | Median Income |
| No Earners | 18 (64.3%) | $0 |
| 1 Earner | 2 (7.1%) | $0 |
| 2 Earners | 8 (28.6%) | $0 |
| 3+ Earners | 0 (0.0%) | $0 |
| Total | 28 (100.0%) | $58,438 |
Household Income in Pax
Household Income Brackets in Pax
With 15 households falling in the category, the $15,000 to $24,999 income range is the most frequent in Pax, accounting for 36.6% of all households.
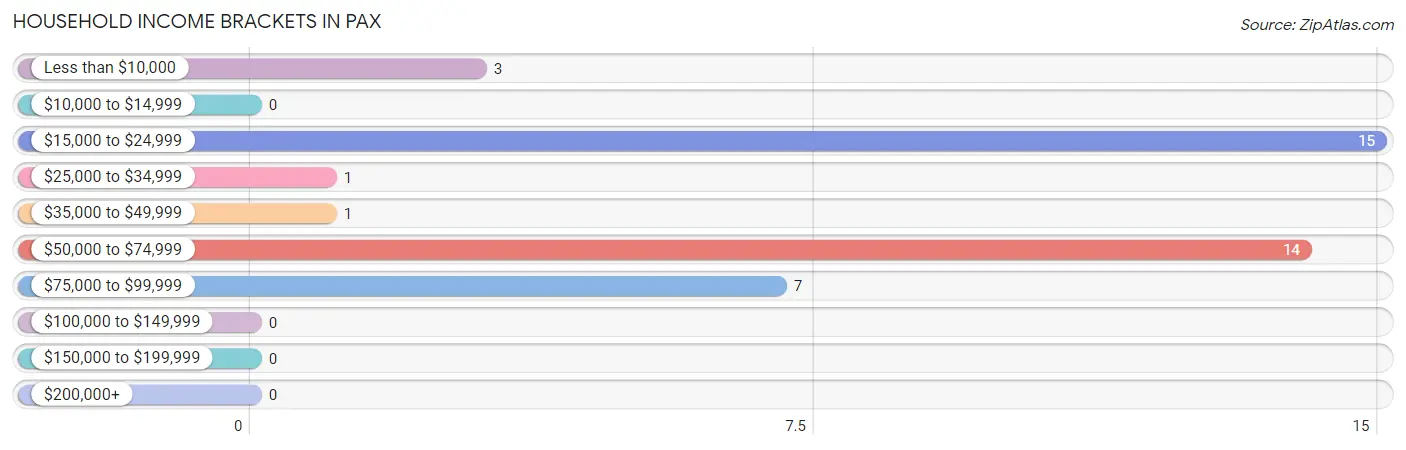
| Income Bracket | # Households | % Households |
| Less than $10,000 | 3 | 7.3% |
| $10,000 to $14,999 | 0 | 0.0% |
| $15,000 to $24,999 | 15 | 36.6% |
| $25,000 to $34,999 | 1 | 2.4% |
| $35,000 to $49,999 | 1 | 2.4% |
| $50,000 to $74,999 | 14 | 34.1% |
| $75,000 to $99,999 | 7 | 17.1% |
| $100,000 to $149,999 | 0 | 0.0% |
| $150,000 to $199,999 | 0 | 0.0% |
| $200,000+ | 0 | 0.0% |
Household Income by Householder Age in Pax
The median household income in Pax is $0, with the highest median household income of $58,542 found in the 45 to 64 years age bracket for the primary householder. A total of 21 households (51.2%) fall into this category. Meanwhile, the 15 to 24 years age bracket for the primary householder has the lowest median household income of $0, with 8 households (19.5%) in this group.
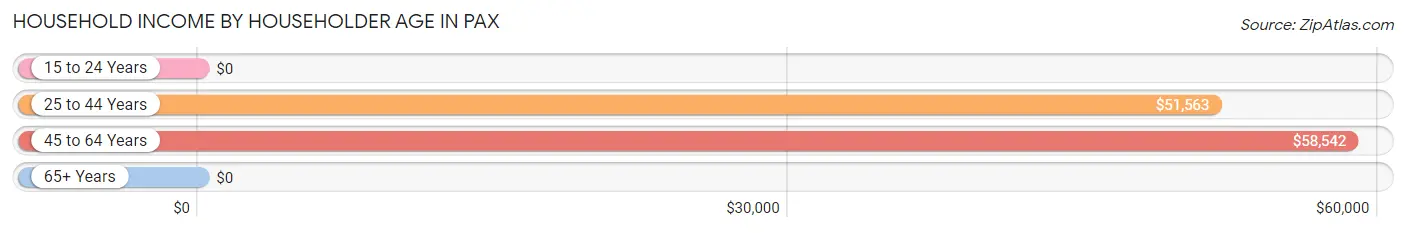
| Income Bracket | # Households | Median Income |
| 15 to 24 Years | 8 (19.5%) | $0 |
| 25 to 44 Years | 11 (26.8%) | $51,563 |
| 45 to 64 Years | 21 (51.2%) | $58,542 |
| 65+ Years | 1 (2.4%) | $0 |
| Total | 41 (100.0%) | $0 |
Poverty in Pax
Income Below Poverty by Sex and Age in Pax
With 19.6% poverty level for males and 51.5% for females among the residents of Pax, 12 to 14 year old males and under 5 year old females are the most vulnerable to poverty, with 2 males (100.0%) and 4 females (100.0%) in their respective age groups living below the poverty level.
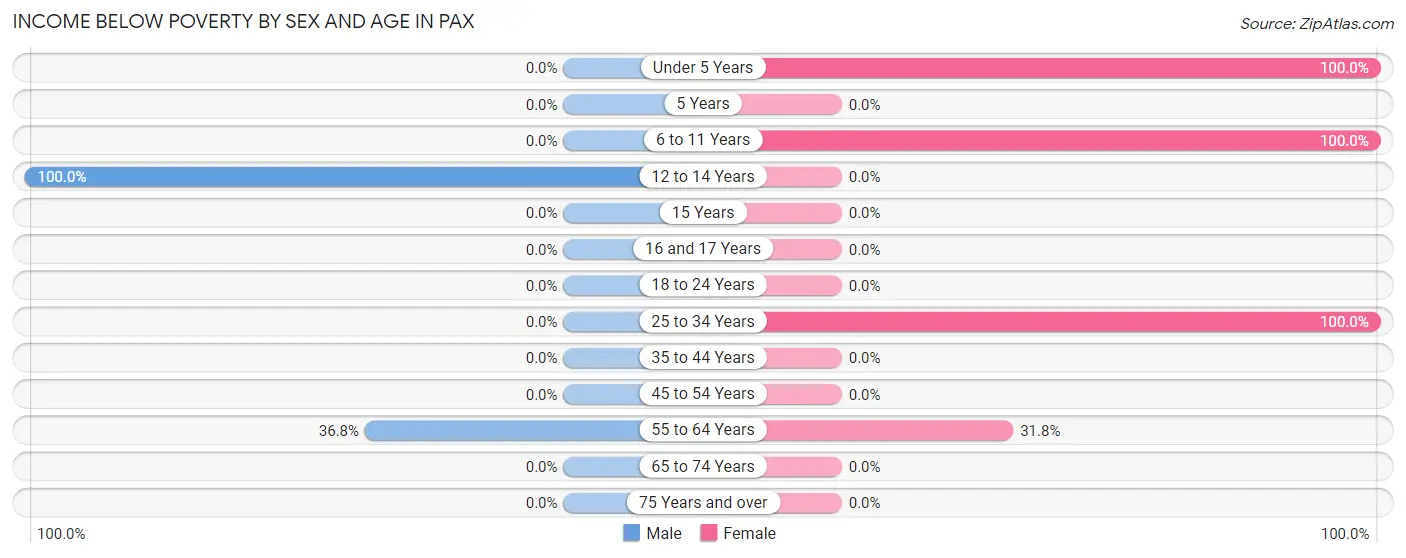
| Age Bracket | Male | Female |
| Under 5 Years | 0 (0.0%) | 4 (100.0%) |
| 5 Years | 0 (0.0%) | 0 (0.0%) |
| 6 to 11 Years | 0 (0.0%) | 3 (100.0%) |
| 12 to 14 Years | 2 (100.0%) | 0 (0.0%) |
| 15 Years | 0 (0.0%) | 0 (0.0%) |
| 16 and 17 Years | 0 (0.0%) | 0 (0.0%) |
| 18 to 24 Years | 0 (0.0%) | 0 (0.0%) |
| 25 to 34 Years | 0 (0.0%) | 3 (100.0%) |
| 35 to 44 Years | 0 (0.0%) | 0 (0.0%) |
| 45 to 54 Years | 0 (0.0%) | 0 (0.0%) |
| 55 to 64 Years | 7 (36.8%) | 7 (31.8%) |
| 65 to 74 Years | 0 (0.0%) | 0 (0.0%) |
| 75 Years and over | 0 (0.0%) | 0 (0.0%) |
| Total | 9 (19.6%) | 17 (51.5%) |
Income Above Poverty by Sex and Age in Pax
According to the poverty statistics in Pax, males aged 15 years and females aged 75 years and over are the age groups that are most secure financially, with 100.0% of males and 100.0% of females in these age groups living above the poverty line.
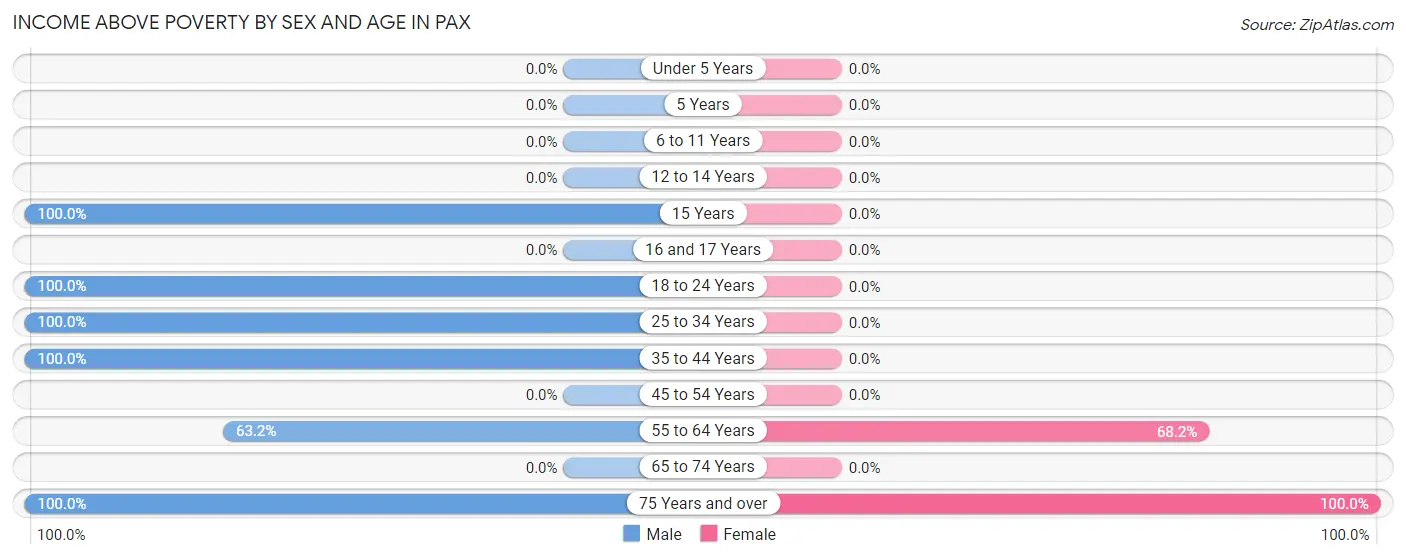
| Age Bracket | Male | Female |
| Under 5 Years | 0 (0.0%) | 0 (0.0%) |
| 5 Years | 0 (0.0%) | 0 (0.0%) |
| 6 to 11 Years | 0 (0.0%) | 0 (0.0%) |
| 12 to 14 Years | 0 (0.0%) | 0 (0.0%) |
| 15 Years | 4 (100.0%) | 0 (0.0%) |
| 16 and 17 Years | 0 (0.0%) | 0 (0.0%) |
| 18 to 24 Years | 11 (100.0%) | 0 (0.0%) |
| 25 to 34 Years | 4 (100.0%) | 0 (0.0%) |
| 35 to 44 Years | 4 (100.0%) | 0 (0.0%) |
| 45 to 54 Years | 0 (0.0%) | 0 (0.0%) |
| 55 to 64 Years | 12 (63.2%) | 15 (68.2%) |
| 65 to 74 Years | 0 (0.0%) | 0 (0.0%) |
| 75 Years and over | 2 (100.0%) | 1 (100.0%) |
| Total | 37 (80.4%) | 16 (48.5%) |
Income Below Poverty Among Married-Couple Families in Pax
The poverty statistics for married-couple families in Pax show that 33.3% or 7 of the total 21 families live below the poverty line. Families with no children have the highest poverty rate of 33.3%, comprising of 7 families. On the other hand, families with no children have the lowest poverty rate of 33.3%, which includes 7 families.
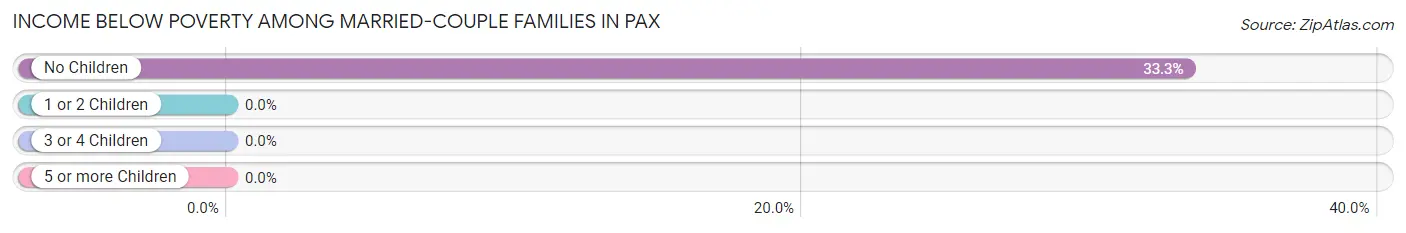
| Children | Above Poverty | Below Poverty |
| No Children | 14 (66.7%) | 7 (33.3%) |
| 1 or 2 Children | 0 (0.0%) | 0 (0.0%) |
| 3 or 4 Children | 0 (0.0%) | 0 (0.0%) |
| 5 or more Children | 0 (0.0%) | 0 (0.0%) |
| Total | 14 (66.7%) | 7 (33.3%) |
Income Below Poverty Among Single-Parent Households in Pax
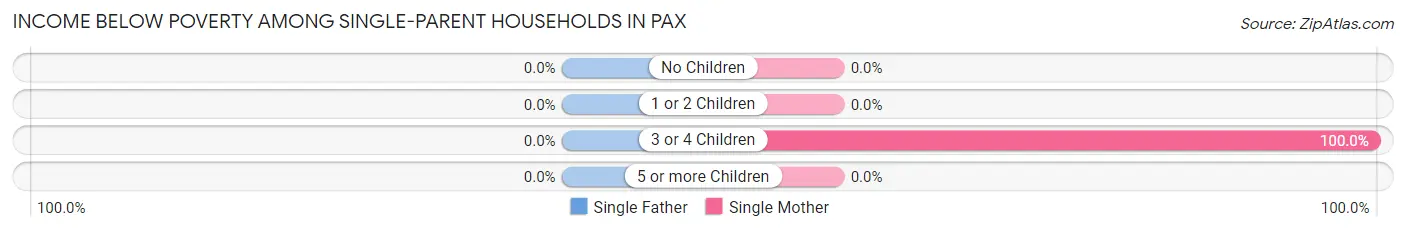
| Children | Single Father | Single Mother |
| No Children | 0 (0.0%) | 0 (0.0%) |
| 1 or 2 Children | 0 (0.0%) | 0 (0.0%) |
| 3 or 4 Children | 0 (0.0%) | 3 (100.0%) |
| 5 or more Children | 0 (0.0%) | 0 (0.0%) |
| Total | 0 (0.0%) | 3 (100.0%) |
Income Below Poverty Among Married-Couple vs Single-Parent Households in Pax
The poverty data for Pax shows that 7 of the married-couple family households (33.3%) and 3 of the single-parent households (42.9%) are living below the poverty level. Within the married-couple family households, those with no children have the highest poverty rate, with 7 households (33.3%) falling below the poverty line. Among the single-parent households, those with 3 or 4 children have the highest poverty rate, with 3 household (100.0%) living below poverty.
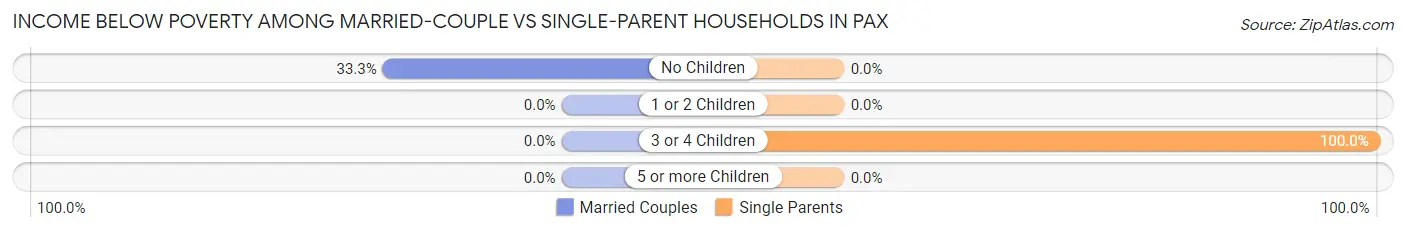
| Children | Married-Couple Families | Single-Parent Households |
| No Children | 7 (33.3%) | 0 (0.0%) |
| 1 or 2 Children | 0 (0.0%) | 0 (0.0%) |
| 3 or 4 Children | 0 (0.0%) | 3 (100.0%) |
| 5 or more Children | 0 (0.0%) | 0 (0.0%) |
| Total | 7 (33.3%) | 3 (42.9%) |
Race in Pax
The most populous races in Pax are , and White / Caucasian (79 | 100.0%).
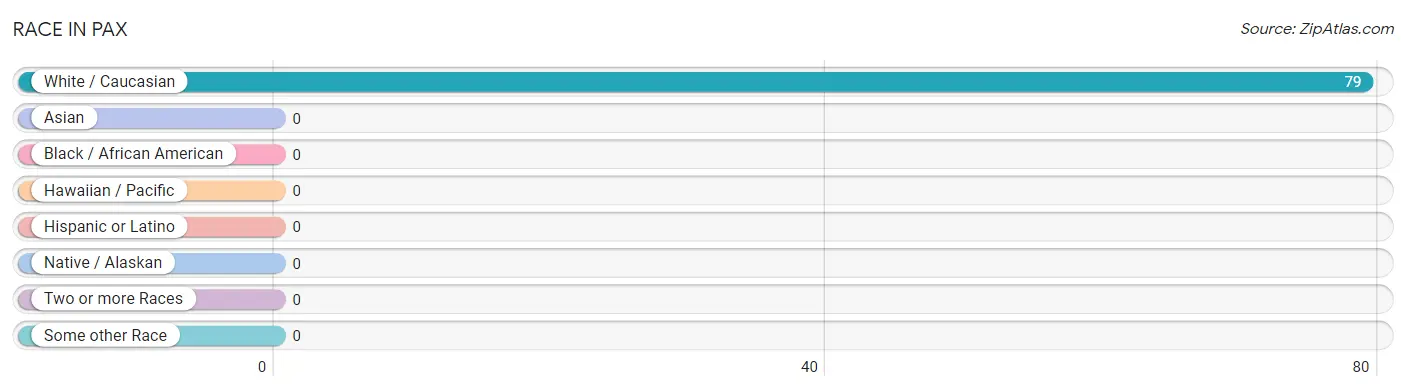
| Race | # Population | % Population |
| Asian | 0 | 0.0% |
| Black / African American | 0 | 0.0% |
| Hawaiian / Pacific | 0 | 0.0% |
| Hispanic or Latino | 0 | 0.0% |
| Native / Alaskan | 0 | 0.0% |
| White / Caucasian | 79 | 100.0% |
| Two or more Races | 0 | 0.0% |
| Some other Race | 0 | 0.0% |
| Total | 79 | 100.0% |
Ancestry in Pax
The most populous ancestries reported in Pax are Irish (14 | 17.7%), English (9 | 11.4%), Austrian (7 | 8.9%), Canadian (7 | 8.9%), and German (7 | 8.9%), together accounting for 55.7% of all Pax residents.
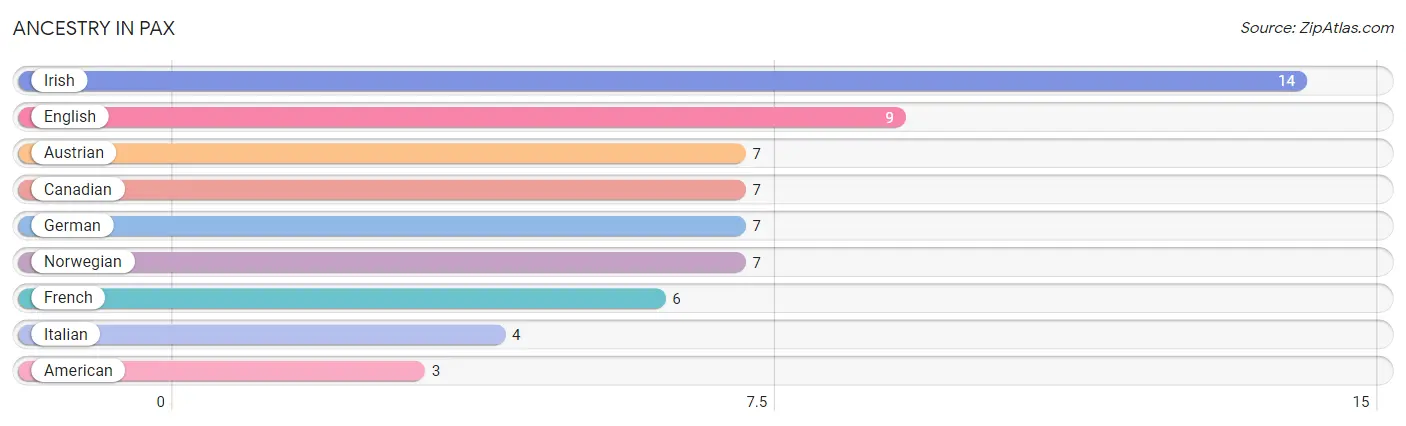
| Ancestry | # Population | % Population |
| American | 3 | 3.8% |
| Austrian | 7 | 8.9% |
| Canadian | 7 | 8.9% |
| English | 9 | 11.4% |
| French | 6 | 7.6% |
| German | 7 | 8.9% |
| Irish | 14 | 17.7% |
| Italian | 4 | 5.1% |
| Norwegian | 7 | 8.9% | View All 9 Rows |
Immigrants in Pax

| Immigration Origin | # Population | % Population | View All 0 Rows |
Sex and Age in Pax
Sex and Age in Pax
The most populous age groups in Pax are 60 to 64 Years (19 | 41.3%) for men and 60 to 64 Years (15 | 45.5%) for women.
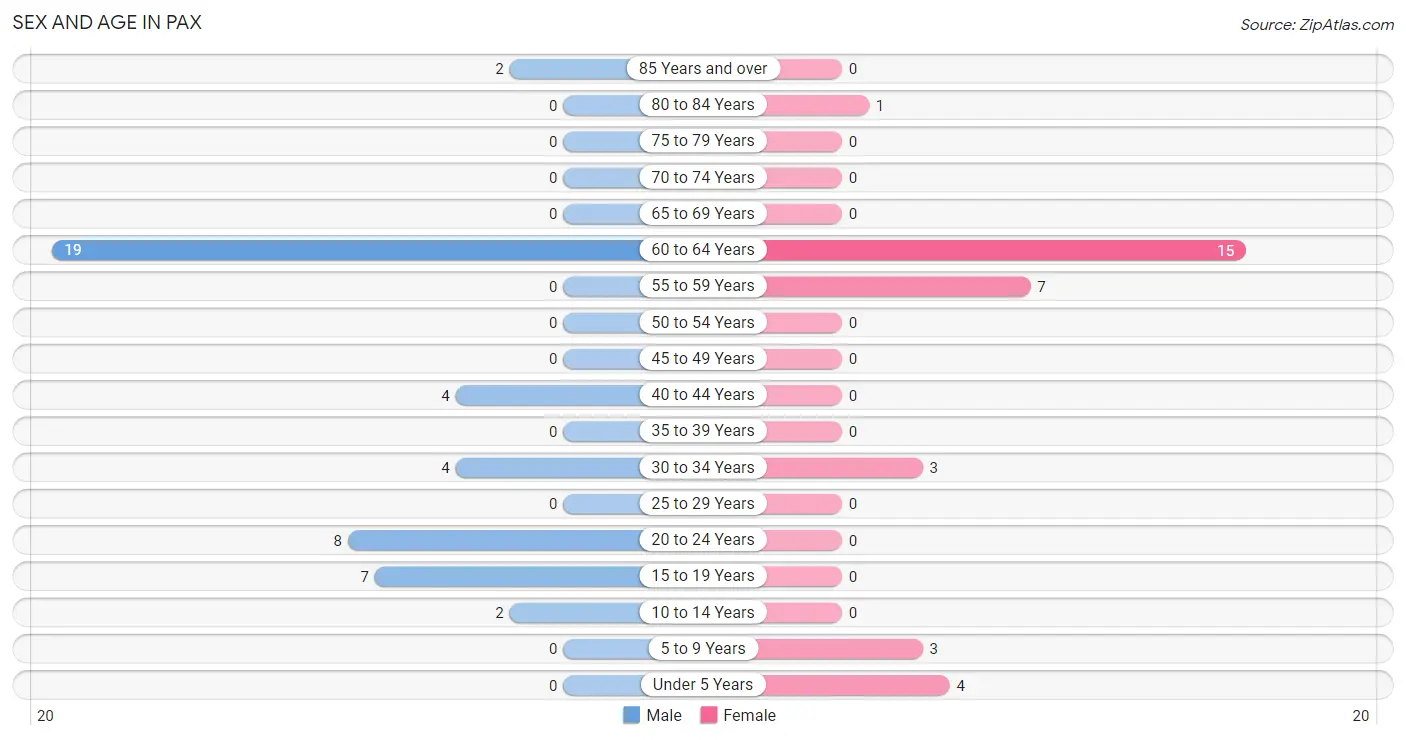
| Age Bracket | Male | Female |
| Under 5 Years | 0 (0.0%) | 4 (12.1%) |
| 5 to 9 Years | 0 (0.0%) | 3 (9.1%) |
| 10 to 14 Years | 2 (4.3%) | 0 (0.0%) |
| 15 to 19 Years | 7 (15.2%) | 0 (0.0%) |
| 20 to 24 Years | 8 (17.4%) | 0 (0.0%) |
| 25 to 29 Years | 0 (0.0%) | 0 (0.0%) |
| 30 to 34 Years | 4 (8.7%) | 3 (9.1%) |
| 35 to 39 Years | 0 (0.0%) | 0 (0.0%) |
| 40 to 44 Years | 4 (8.7%) | 0 (0.0%) |
| 45 to 49 Years | 0 (0.0%) | 0 (0.0%) |
| 50 to 54 Years | 0 (0.0%) | 0 (0.0%) |
| 55 to 59 Years | 0 (0.0%) | 7 (21.2%) |
| 60 to 64 Years | 19 (41.3%) | 15 (45.5%) |
| 65 to 69 Years | 0 (0.0%) | 0 (0.0%) |
| 70 to 74 Years | 0 (0.0%) | 0 (0.0%) |
| 75 to 79 Years | 0 (0.0%) | 0 (0.0%) |
| 80 to 84 Years | 0 (0.0%) | 1 (3.0%) |
| 85 Years and over | 2 (4.3%) | 0 (0.0%) |
| Total | 46 (100.0%) | 33 (100.0%) |
Families and Households in Pax
Median Family Size in Pax
The median family size in Pax is 2.36 persons per family, with single female/mother families (3 | 10.7%) accounting for the largest median family size of 4 persons per family. On the other hand, married-couple families (21 | 75.0%) represent the smallest median family size with 2.05 persons per family.
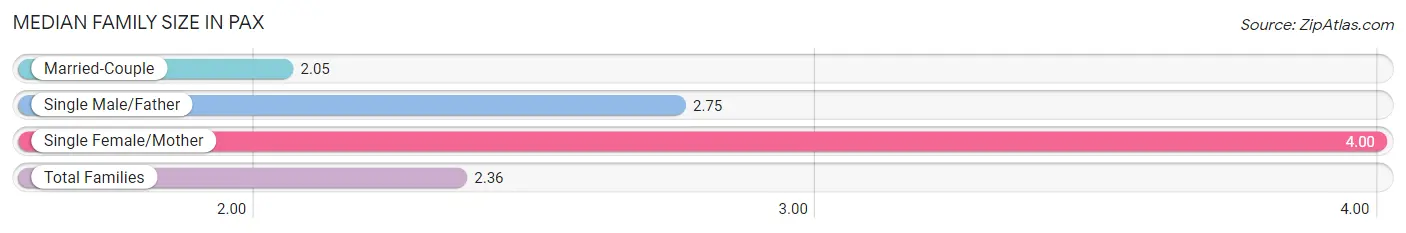
| Family Type | # Families | Family Size |
| Married-Couple | 21 (75.0%) | 2.05 |
| Single Male/Father | 4 (14.3%) | 2.75 |
| Single Female/Mother | 3 (10.7%) | 4.00 |
| Total Families | 28 (100.0%) | 2.36 |
Median Household Size in Pax
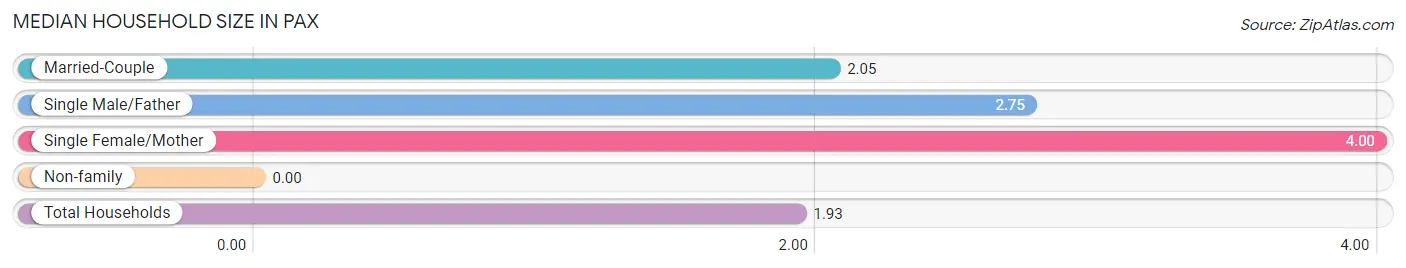
| Household Type | # Households | Household Size |
| Married-Couple | 21 (51.2%) | 2.05 |
| Single Male/Father | 4 (9.8%) | 2.75 |
| Single Female/Mother | 3 (7.3%) | 4.00 |
| Non-family | 13 (31.7%) | - |
| Total Households | 41 (100.0%) | 1.93 |
Household Size by Marriage Status in Pax
Out of a total of 41 households in Pax, 28 (68.3%) are family households, while 13 (31.7%) are nonfamily households. The most numerous type of family households are 2-person households, comprising 25, and the most common type of nonfamily households are 1-person households, comprising 13.
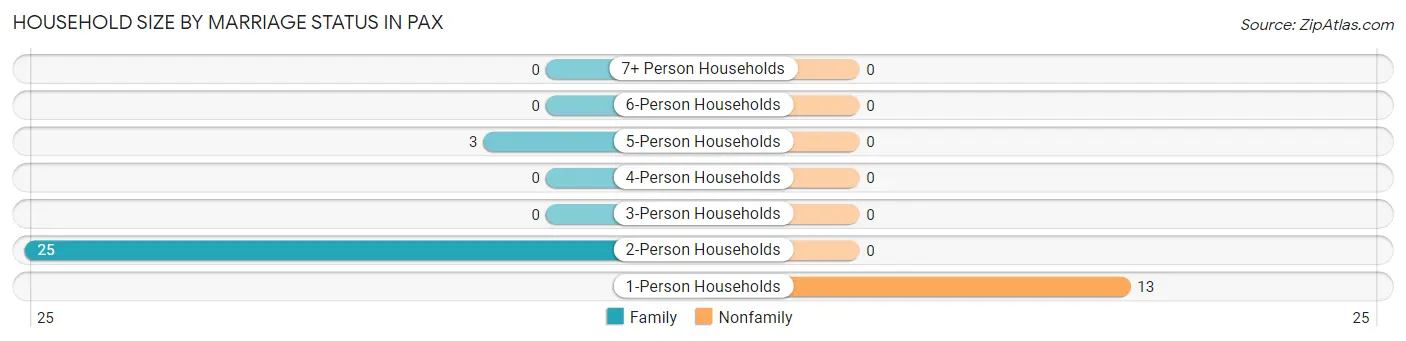
| Household Size | Family Households | Nonfamily Households |
| 1-Person Households | - | 13 (31.7%) |
| 2-Person Households | 25 (61.0%) | 0 (0.0%) |
| 3-Person Households | 0 (0.0%) | 0 (0.0%) |
| 4-Person Households | 0 (0.0%) | 0 (0.0%) |
| 5-Person Households | 3 (7.3%) | 0 (0.0%) |
| 6-Person Households | 0 (0.0%) | 0 (0.0%) |
| 7+ Person Households | 0 (0.0%) | 0 (0.0%) |
| Total | 28 (68.3%) | 13 (31.7%) |
Female Fertility in Pax
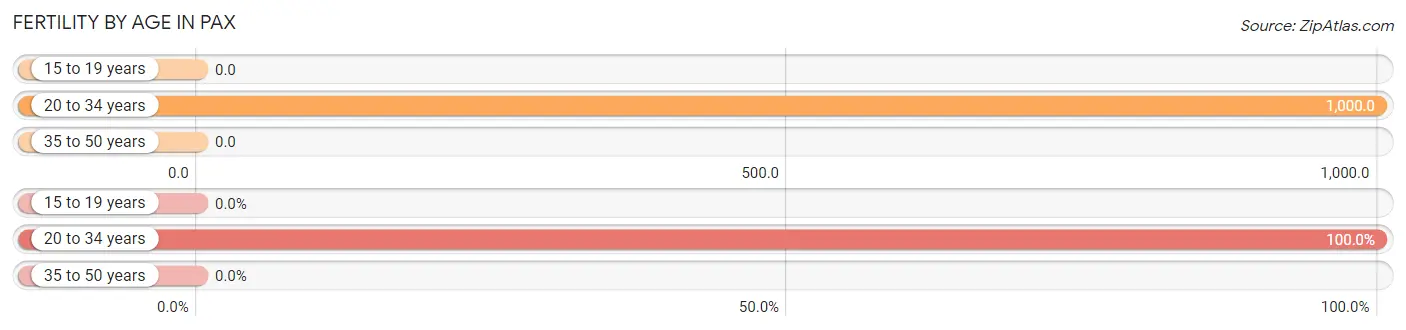
Fertility by Age in Pax
Average fertility rate in Pax is 1,000.0 births per 1,000 women. Women in the age bracket of 20 to 34 years have the highest fertility rate with 1,000.0 births per 1,000 women. Women in the age bracket of 20 to 34 years acount for 100.0% of all women with births.
| Age Bracket | Women with Births | Births / 1,000 Women |
| 15 to 19 years | 0 (0.0%) | 0.0 |
| 20 to 34 years | 3 (100.0%) | 1,000.0 |
| 35 to 50 years | 0 (0.0%) | 0.0 |
| Total | 3 (100.0%) | 1,000.0 |
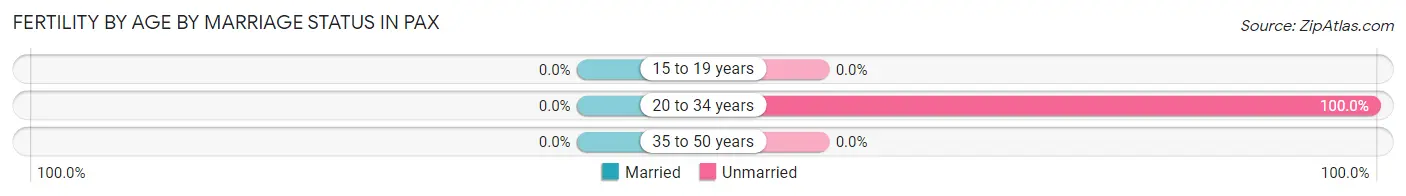
Fertility by Age by Marriage Status in Pax
| Age Bracket | Married | Unmarried |
| 15 to 19 years | 0 (0.0%) | 0 (0.0%) |
| 20 to 34 years | 0 (0.0%) | 3 (100.0%) |
| 35 to 50 years | 0 (0.0%) | 0 (0.0%) |
| Total | 0 (0.0%) | 3 (100.0%) |
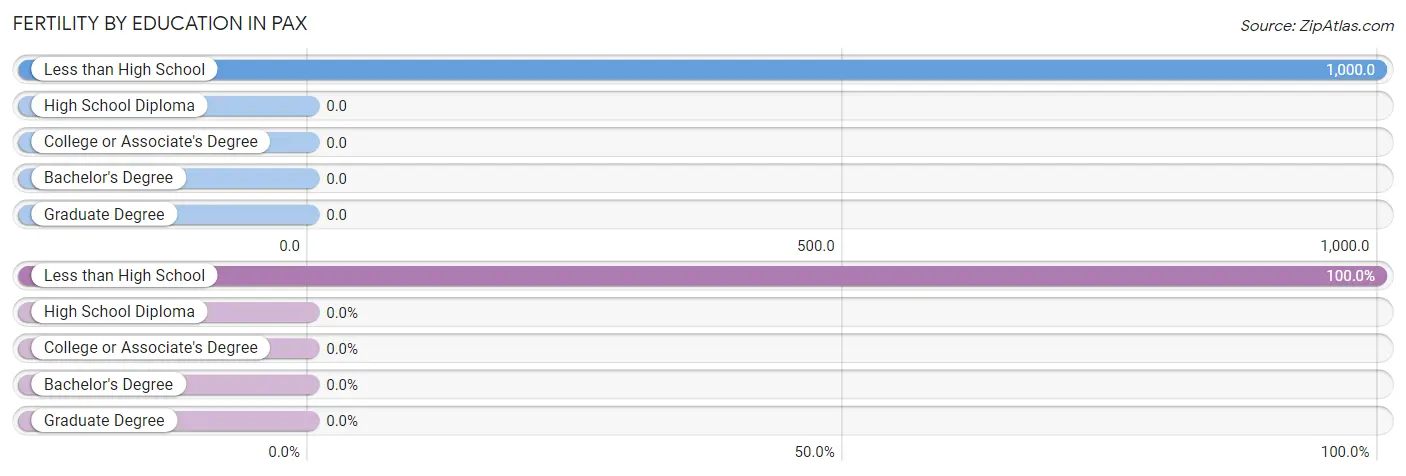
Fertility by Education in Pax
| Educational Attainment | Women with Births | Births / 1,000 Women |
| Less than High School | 3 (100.0%) | 1,000.0 |
| High School Diploma | 0 (0.0%) | 0.0 |
| College or Associate's Degree | 0 (0.0%) | 0.0 |
| Bachelor's Degree | 0 (0.0%) | 0.0 |
| Graduate Degree | 0 (0.0%) | 0.0 |
| Total | 3 (100.0%) | 1,000.0 |
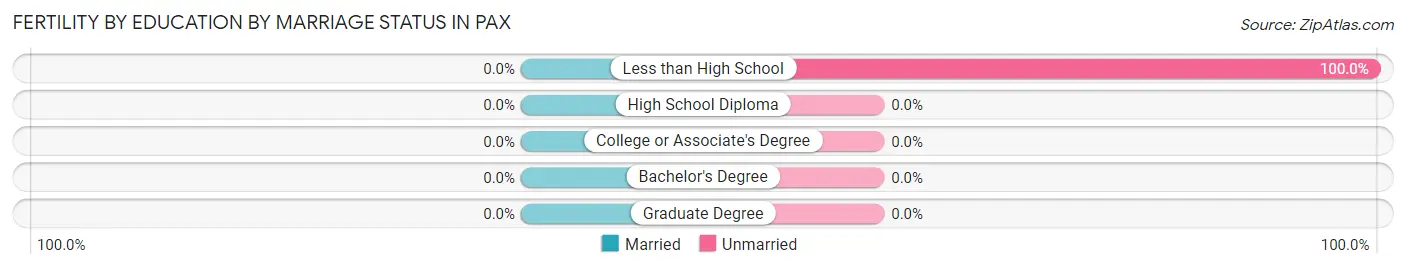
Fertility by Education by Marriage Status in Pax
| Educational Attainment | Married | Unmarried |
| Less than High School | 0 (0.0%) | 3 (100.0%) |
| High School Diploma | 0 (0.0%) | 0 (0.0%) |
| College or Associate's Degree | 0 (0.0%) | 0 (0.0%) |
| Bachelor's Degree | 0 (0.0%) | 0 (0.0%) |
| Graduate Degree | 0 (0.0%) | 0 (0.0%) |
| Total | 0 (0.0%) | 3 (100.0%) |
Employment Characteristics in Pax
Employment by Class of Employer in Pax
Among the 25 employed individuals in Pax, , and private company employees (25 | 100.0%) make up the most common classes of employment.
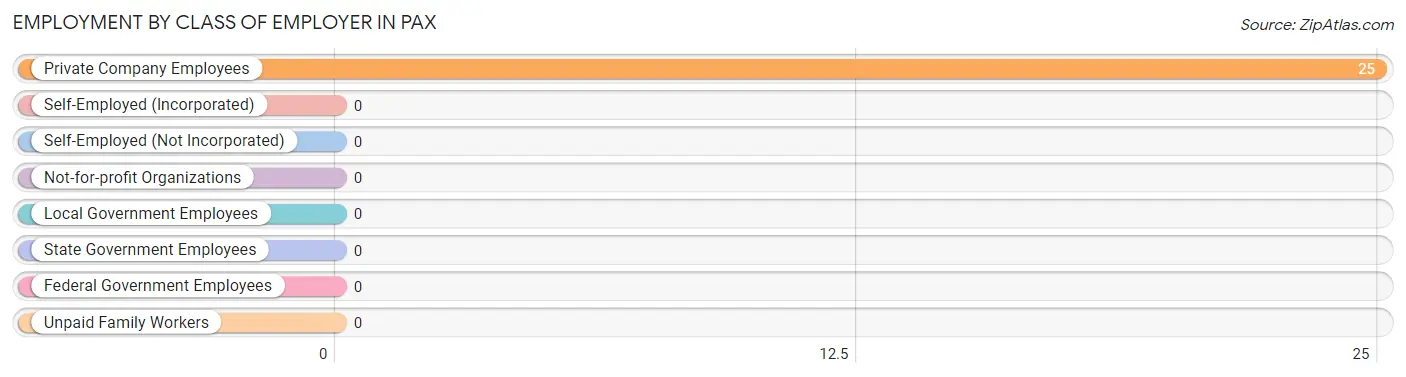
| Employer Class | # Employees | % Employees |
| Private Company Employees | 25 | 100.0% |
| Self-Employed (Incorporated) | 0 | 0.0% |
| Self-Employed (Not Incorporated) | 0 | 0.0% |
| Not-for-profit Organizations | 0 | 0.0% |
| Local Government Employees | 0 | 0.0% |
| State Government Employees | 0 | 0.0% |
| Federal Government Employees | 0 | 0.0% |
| Unpaid Family Workers | 0 | 0.0% |
| Total | 25 | 100.0% |
Employment Status by Age in Pax
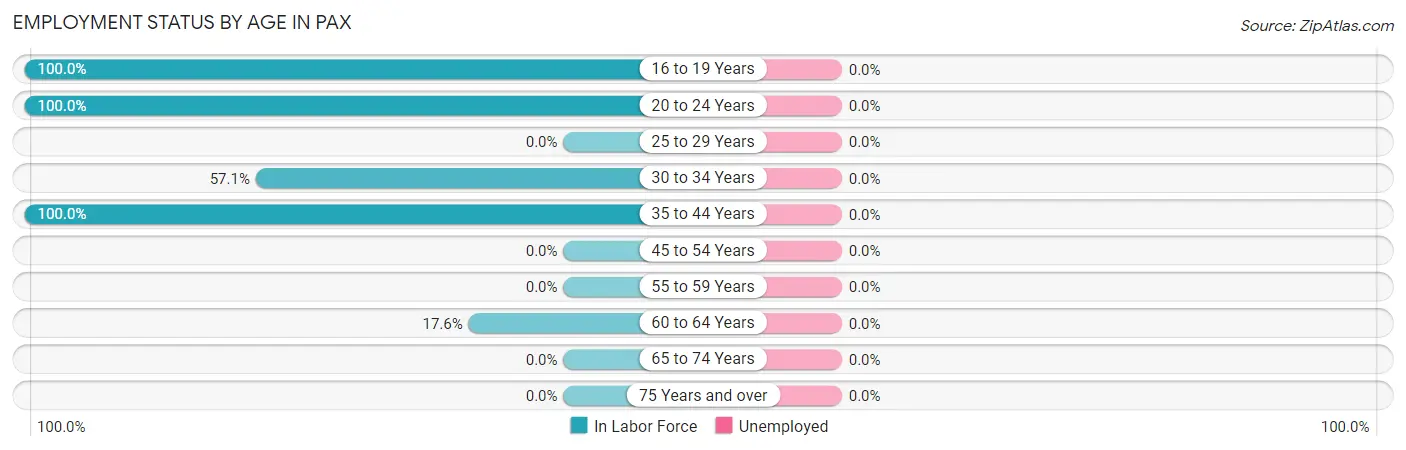
| Age Bracket | In Labor Force | Unemployed |
| 16 to 19 Years | 3 (100.0%) | 0 (0.0%) |
| 20 to 24 Years | 8 (100.0%) | 0 (0.0%) |
| 25 to 29 Years | 0 (0.0%) | 0 (0.0%) |
| 30 to 34 Years | 4 (57.1%) | 0 (0.0%) |
| 35 to 44 Years | 4 (100.0%) | 0 (0.0%) |
| 45 to 54 Years | 0 (0.0%) | 0 (0.0%) |
| 55 to 59 Years | 0 (0.0%) | 0 (0.0%) |
| 60 to 64 Years | 6 (17.6%) | 0 (0.0%) |
| 65 to 74 Years | 0 (0.0%) | 0 (0.0%) |
| 75 Years and over | 0 (0.0%) | 0 (0.0%) |
| Total | 25 (37.9%) | 0 (0.0%) |
Employment Status by Educational Attainment in Pax
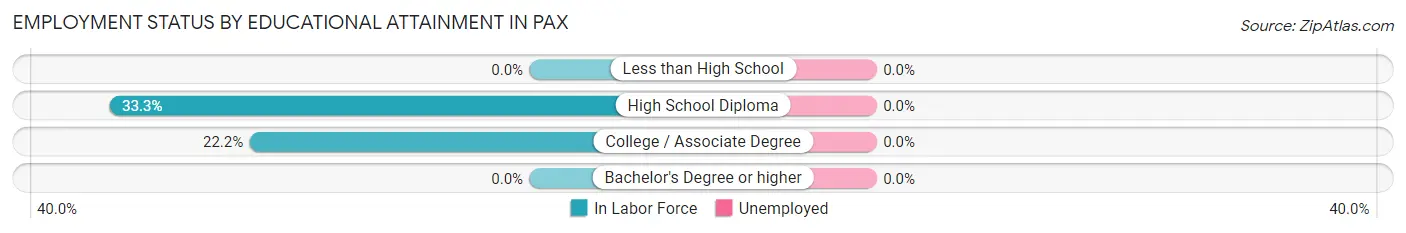
| Educational Attainment | In Labor Force | Unemployed |
| Less than High School | 0 (0.0%) | 0 (0.0%) |
| High School Diploma | 10 (33.3%) | 0 (0.0%) |
| College / Associate Degree | 4 (22.2%) | 0 (0.0%) |
| Bachelor's Degree or higher | 0 (0.0%) | 0 (0.0%) |
| Total | 14 (26.9%) | 0 (0.0%) |
Employment Occupations by Sex in Pax
Management, Business, Science and Arts Occupations
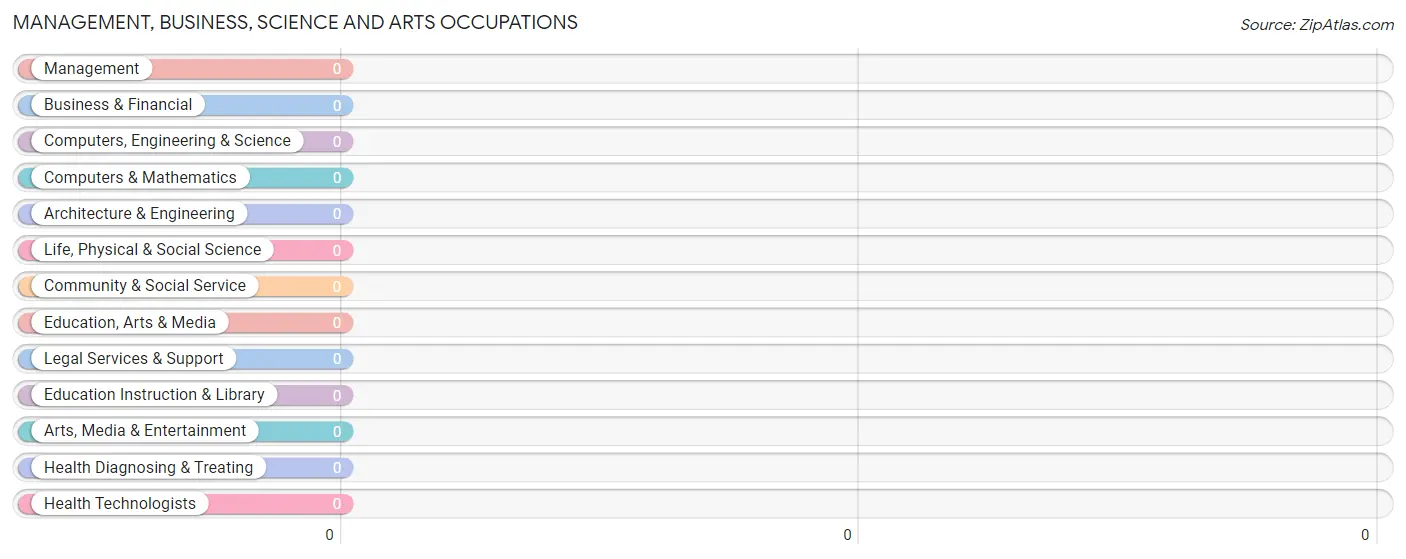
Management, Business, Science and Arts Occupations by Sex
| Occupation | Male | Female |
| Management | 0 (0.0%) | 0 (0.0%) |
| Business & Financial | 0 (0.0%) | 0 (0.0%) |
| Computers, Engineering & Science | 0 (0.0%) | 0 (0.0%) |
| Computers & Mathematics | 0 (0.0%) | 0 (0.0%) |
| Architecture & Engineering | 0 (0.0%) | 0 (0.0%) |
| Life, Physical & Social Science | 0 (0.0%) | 0 (0.0%) |
| Community & Social Service | 0 (0.0%) | 0 (0.0%) |
| Education, Arts & Media | 0 (0.0%) | 0 (0.0%) |
| Legal Services & Support | 0 (0.0%) | 0 (0.0%) |
| Education Instruction & Library | 0 (0.0%) | 0 (0.0%) |
| Arts, Media & Entertainment | 0 (0.0%) | 0 (0.0%) |
| Health Diagnosing & Treating | 0 (0.0%) | 0 (0.0%) |
| Health Technologists | 0 (0.0%) | 0 (0.0%) |
| Total (Category) | 0 (0.0%) | 0 (0.0%) |
| Total (Overall) | 25 (100.0%) | 0 (0.0%) |
Services Occupations
The most common Services occupations in Pax are , and Food Preparation & Serving (4 | 16.0%).
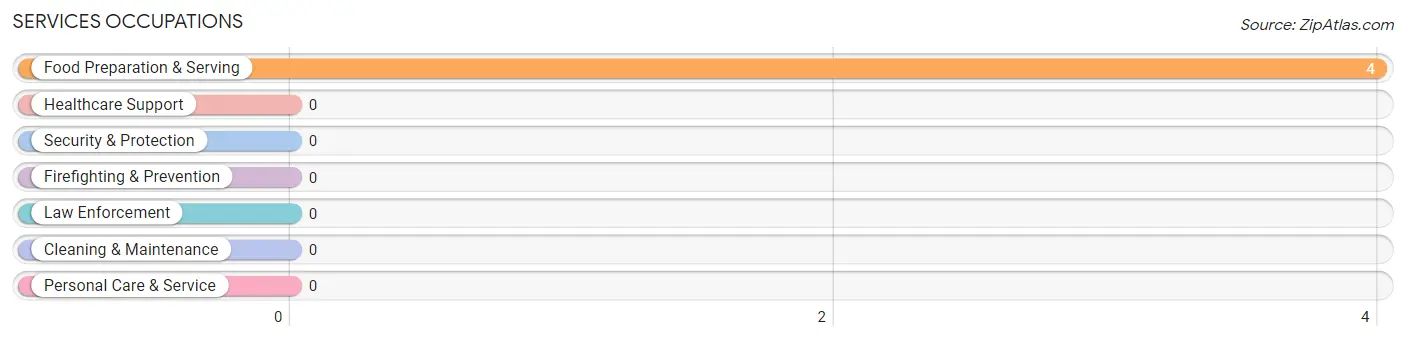
Services Occupations by Sex
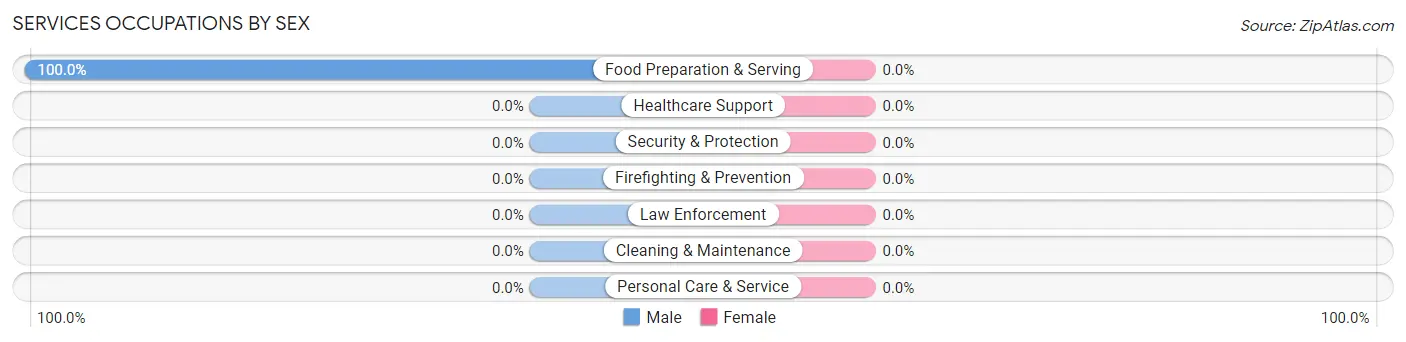
| Occupation | Male | Female |
| Healthcare Support | 0 (0.0%) | 0 (0.0%) |
| Security & Protection | 0 (0.0%) | 0 (0.0%) |
| Firefighting & Prevention | 0 (0.0%) | 0 (0.0%) |
| Law Enforcement | 0 (0.0%) | 0 (0.0%) |
| Food Preparation & Serving | 4 (100.0%) | 0 (0.0%) |
| Cleaning & Maintenance | 0 (0.0%) | 0 (0.0%) |
| Personal Care & Service | 0 (0.0%) | 0 (0.0%) |
| Total (Category) | 4 (100.0%) | 0 (0.0%) |
| Total (Overall) | 25 (100.0%) | 0 (0.0%) |
Sales and Office Occupations
The most common Sales and Office occupations in Pax are , and Sales & Related (15 | 60.0%).
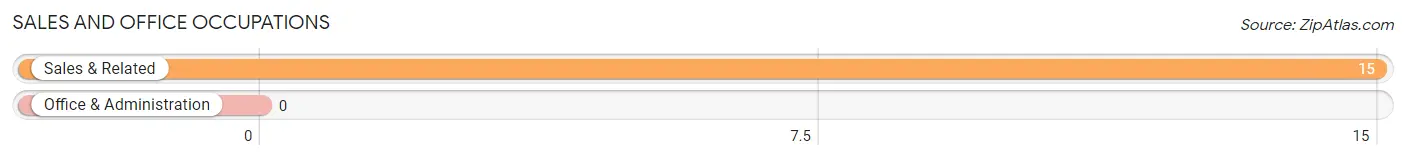
Sales and Office Occupations by Sex

| Occupation | Male | Female |
| Sales & Related | 15 (100.0%) | 0 (0.0%) |
| Office & Administration | 0 (0.0%) | 0 (0.0%) |
| Total (Category) | 15 (100.0%) | 0 (0.0%) |
| Total (Overall) | 25 (100.0%) | 0 (0.0%) |
Natural Resources, Construction and Maintenance Occupations
Natural Resources, Construction and Maintenance Occupations by Sex
| Occupation | Male | Female |
| Farming, Fishing & Forestry | 0 (0.0%) | 0 (0.0%) |
| Construction & Extraction | 0 (0.0%) | 0 (0.0%) |
| Installation, Maintenance & Repair | 0 (0.0%) | 0 (0.0%) |
| Total (Category) | 0 (0.0%) | 0 (0.0%) |
| Total (Overall) | 25 (100.0%) | 0 (0.0%) |
Production, Transportation and Moving Occupations
The most common Production, Transportation and Moving occupations in Pax are , and Production (6 | 24.0%).
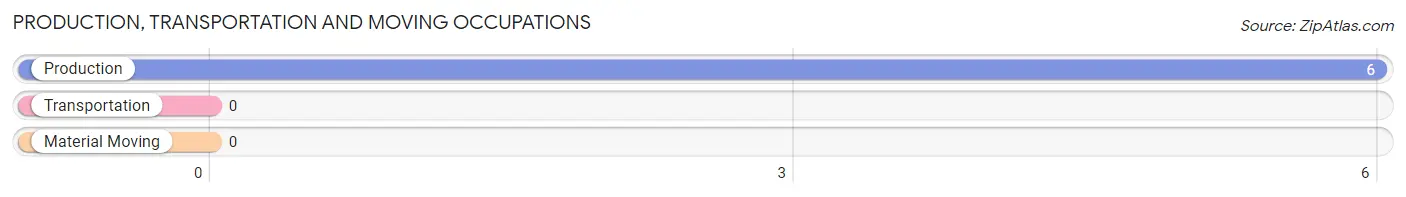
Production, Transportation and Moving Occupations by Sex
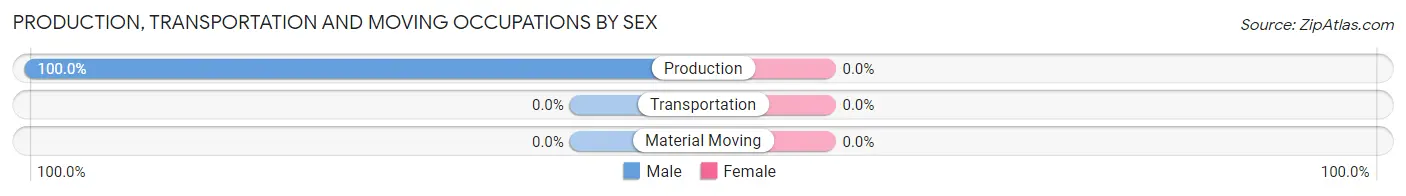
| Occupation | Male | Female |
| Production | 6 (100.0%) | 0 (0.0%) |
| Transportation | 0 (0.0%) | 0 (0.0%) |
| Material Moving | 0 (0.0%) | 0 (0.0%) |
| Total (Category) | 6 (100.0%) | 0 (0.0%) |
| Total (Overall) | 25 (100.0%) | 0 (0.0%) |
Employment Industries by Sex in Pax
Employment Industries in Pax
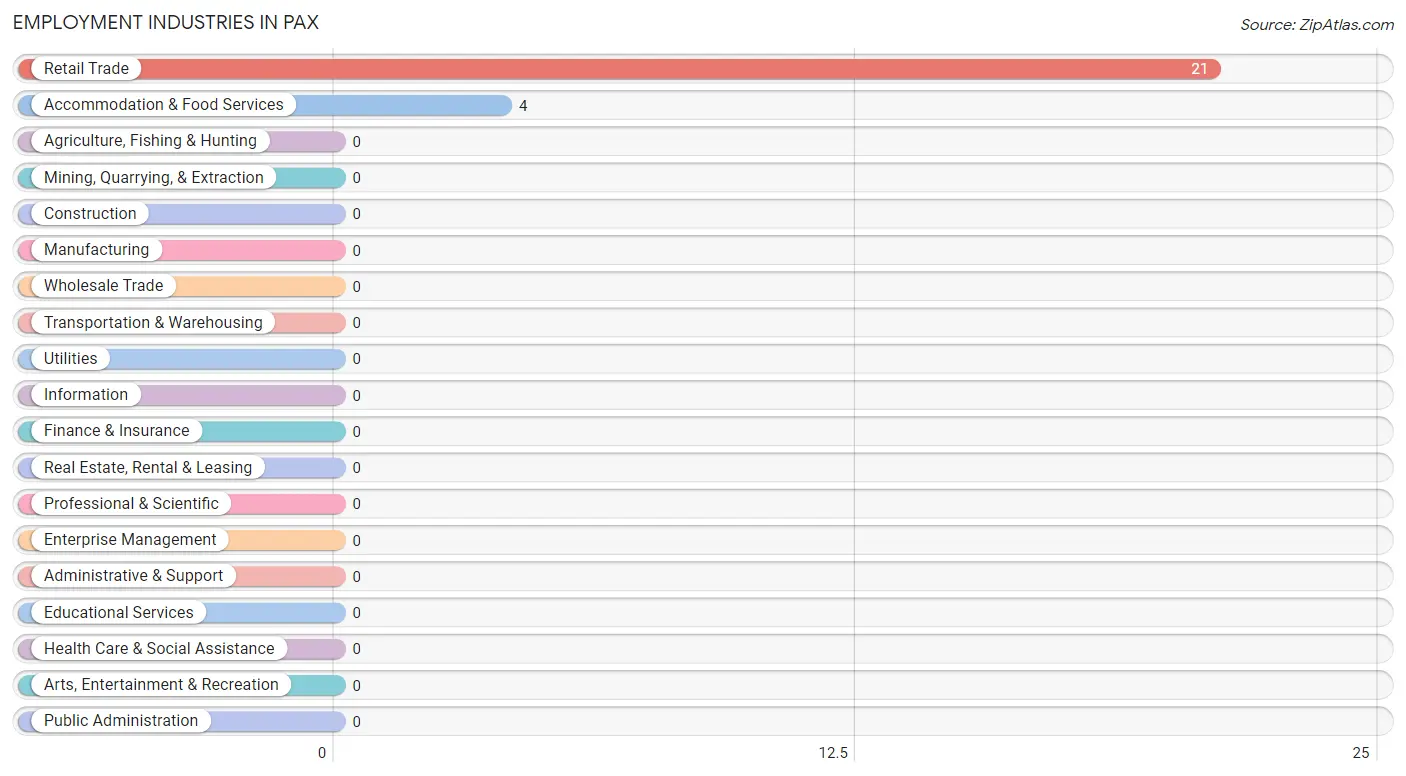
The major employment industries in Pax include Retail Trade (21 | 84.0%), and Accommodation & Food Services (4 | 16.0%).
Employment Industries by Sex in Pax
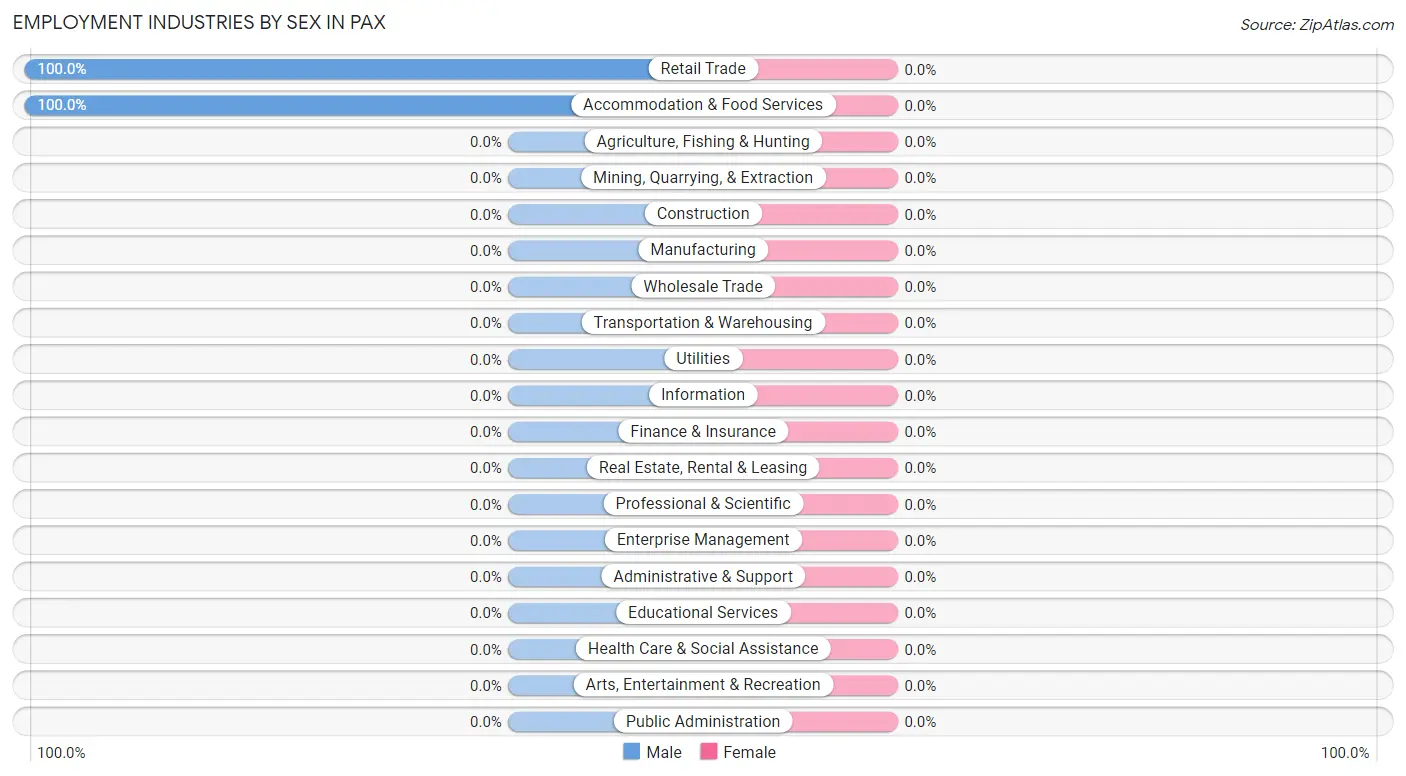
| Industry | Male | Female |
| Agriculture, Fishing & Hunting | 0 (0.0%) | 0 (0.0%) |
| Mining, Quarrying, & Extraction | 0 (0.0%) | 0 (0.0%) |
| Construction | 0 (0.0%) | 0 (0.0%) |
| Manufacturing | 0 (0.0%) | 0 (0.0%) |
| Wholesale Trade | 0 (0.0%) | 0 (0.0%) |
| Retail Trade | 21 (100.0%) | 0 (0.0%) |
| Transportation & Warehousing | 0 (0.0%) | 0 (0.0%) |
| Utilities | 0 (0.0%) | 0 (0.0%) |
| Information | 0 (0.0%) | 0 (0.0%) |
| Finance & Insurance | 0 (0.0%) | 0 (0.0%) |
| Real Estate, Rental & Leasing | 0 (0.0%) | 0 (0.0%) |
| Professional & Scientific | 0 (0.0%) | 0 (0.0%) |
| Enterprise Management | 0 (0.0%) | 0 (0.0%) |
| Administrative & Support | 0 (0.0%) | 0 (0.0%) |
| Educational Services | 0 (0.0%) | 0 (0.0%) |
| Health Care & Social Assistance | 0 (0.0%) | 0 (0.0%) |
| Arts, Entertainment & Recreation | 0 (0.0%) | 0 (0.0%) |
| Accommodation & Food Services | 4 (100.0%) | 0 (0.0%) |
| Public Administration | 0 (0.0%) | 0 (0.0%) |
| Total | 25 (100.0%) | 0 (0.0%) |
Education in Pax
School Enrollment in Pax
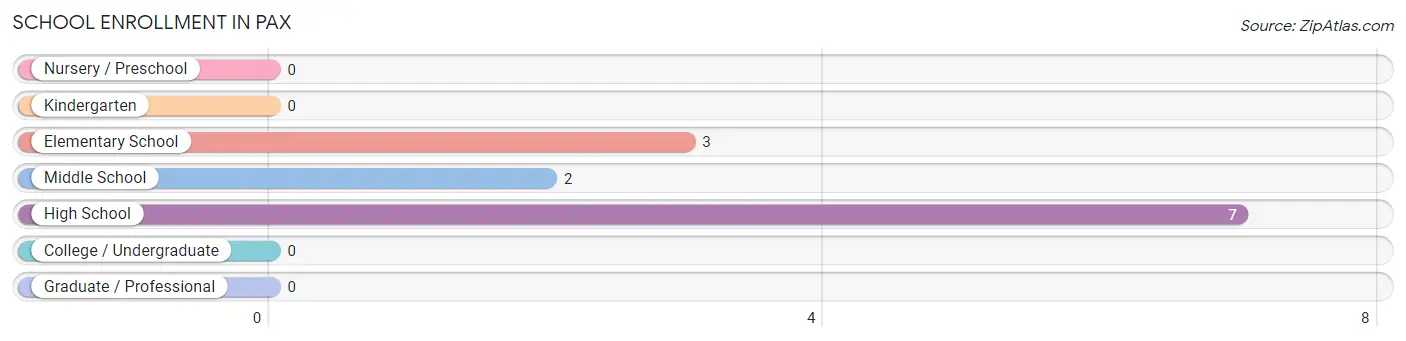
The most common levels of schooling among the 12 students in Pax are high school (7 | 58.3%), elementary school (3 | 25.0%), and middle school (2 | 16.7%).
| School Level | # Students | % Students |
| Nursery / Preschool | 0 | 0.0% |
| Kindergarten | 0 | 0.0% |
| Elementary School | 3 | 25.0% |
| Middle School | 2 | 16.7% |
| High School | 7 | 58.3% |
| College / Undergraduate | 0 | 0.0% |
| Graduate / Professional | 0 | 0.0% |
| Total | 12 | 100.0% |
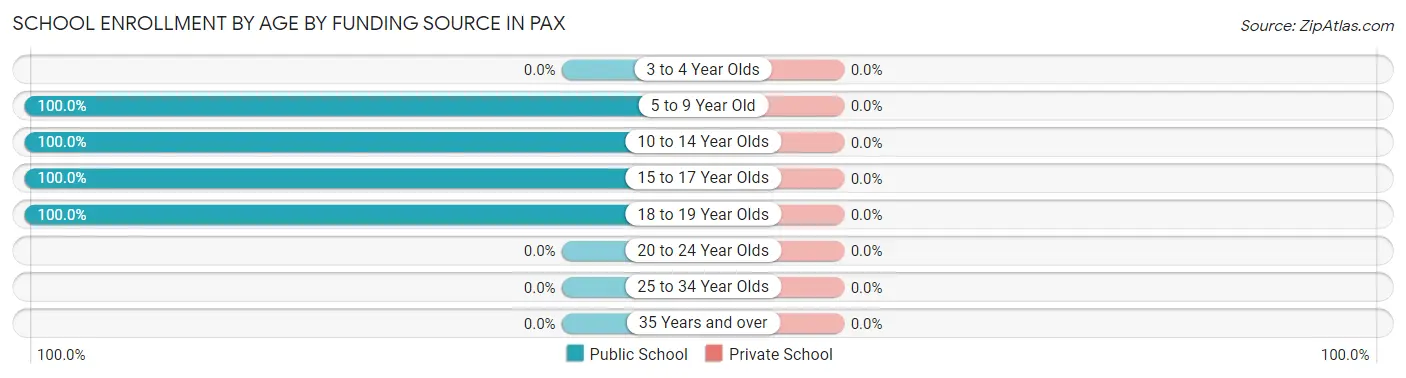
School Enrollment by Age by Funding Source in Pax
| Age Bracket | Public School | Private School |
| 3 to 4 Year Olds | 0 (0.0%) | 0 (0.0%) |
| 5 to 9 Year Old | 3 (100.0%) | 0 (0.0%) |
| 10 to 14 Year Olds | 2 (100.0%) | 0 (0.0%) |
| 15 to 17 Year Olds | 4 (100.0%) | 0 (0.0%) |
| 18 to 19 Year Olds | 3 (100.0%) | 0 (0.0%) |
| 20 to 24 Year Olds | 0 (0.0%) | 0 (0.0%) |
| 25 to 34 Year Olds | 0 (0.0%) | 0 (0.0%) |
| 35 Years and over | 0 (0.0%) | 0 (0.0%) |
| Total | 12 (100.0%) | 0 (0.0%) |
Educational Attainment by Field of Study in Pax
| Field of Study | # Graduates | % Graduates |
| Computers & Mathematics | 0 | 0.0% |
| Bio, Nature & Agricultural | 0 | 0.0% |
| Physical & Health Sciences | 0 | 0.0% |
| Psychology | 0 | 0.0% |
| Social Sciences | 0 | 0.0% |
| Engineering | 0 | 0.0% |
| Multidisciplinary Studies | 0 | 0.0% |
| Science & Technology | 0 | 0.0% |
| Business | 0 | 0.0% |
| Education | 0 | 0.0% |
| Literature & Languages | 0 | 0.0% |
| Liberal Arts & History | 0 | 0.0% |
| Visual & Performing Arts | 0 | 0.0% |
| Communications | 0 | 0.0% |
| Arts & Humanities | 0 | 0.0% |
| Total | 0 | 0.0% |
Transportation & Commute in Pax
Vehicle Availability by Sex in Pax
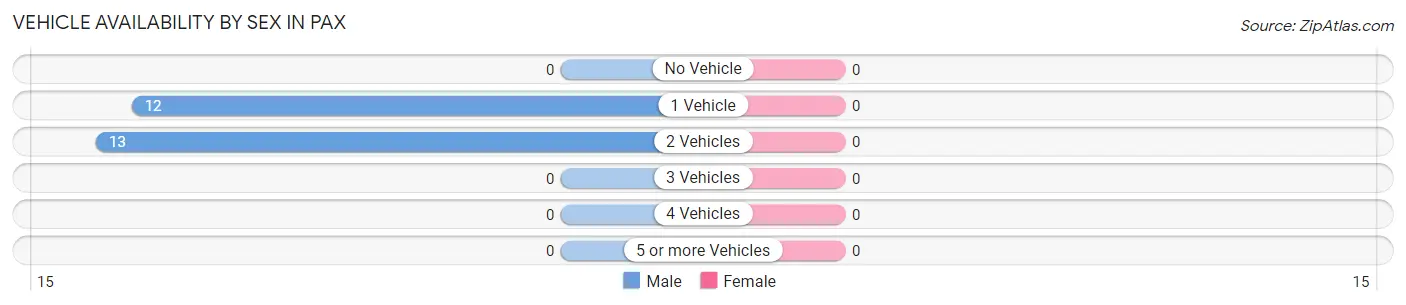
| Vehicles Available | Male | Female |
| No Vehicle | 0 (0.0%) | 0 (0.0%) |
| 1 Vehicle | 12 (48.0%) | 0 (0.0%) |
| 2 Vehicles | 13 (52.0%) | 0 (0.0%) |
| 3 Vehicles | 0 (0.0%) | 0 (0.0%) |
| 4 Vehicles | 0 (0.0%) | 0 (0.0%) |
| 5 or more Vehicles | 0 (0.0%) | 0 (0.0%) |
| Total | 25 (100.0%) | 0 (0.0%) |
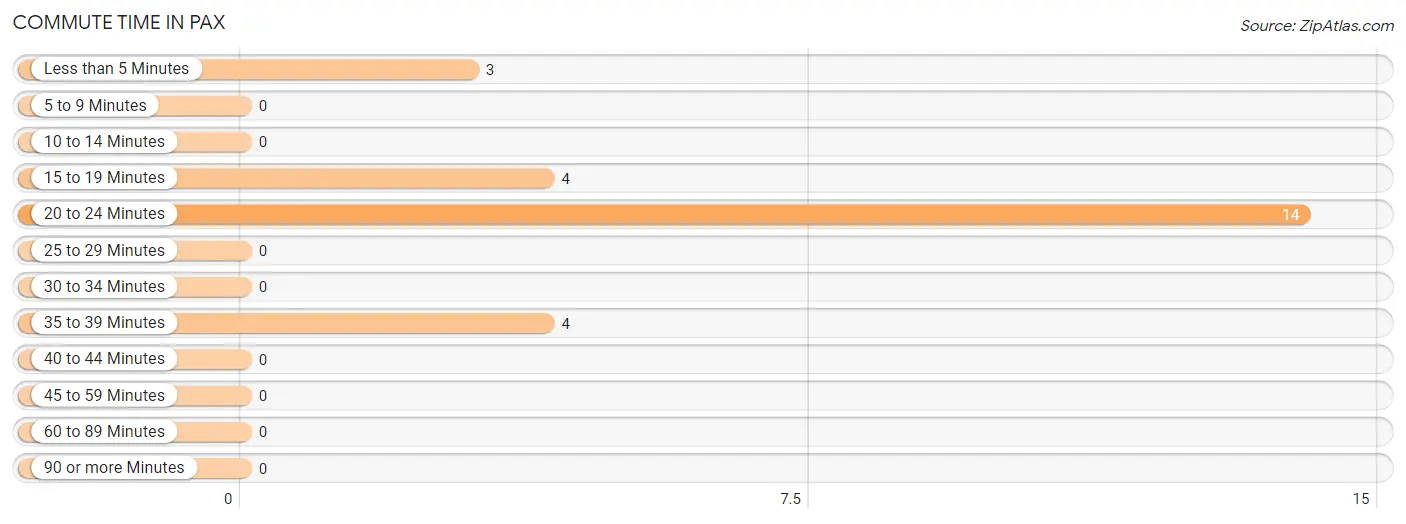
Commute Time in Pax
The most frequently occuring commute durations in Pax are 20 to 24 minutes (14 commuters, 56.0%), 15 to 19 minutes (4 commuters, 16.0%), and 35 to 39 minutes (4 commuters, 16.0%).
| Commute Time | # Commuters | % Commuters |
| Less than 5 Minutes | 3 | 12.0% |
| 5 to 9 Minutes | 0 | 0.0% |
| 10 to 14 Minutes | 0 | 0.0% |
| 15 to 19 Minutes | 4 | 16.0% |
| 20 to 24 Minutes | 14 | 56.0% |
| 25 to 29 Minutes | 0 | 0.0% |
| 30 to 34 Minutes | 0 | 0.0% |
| 35 to 39 Minutes | 4 | 16.0% |
| 40 to 44 Minutes | 0 | 0.0% |
| 45 to 59 Minutes | 0 | 0.0% |
| 60 to 89 Minutes | 0 | 0.0% |
| 90 or more Minutes | 0 | 0.0% |
Commute Time by Sex in Pax
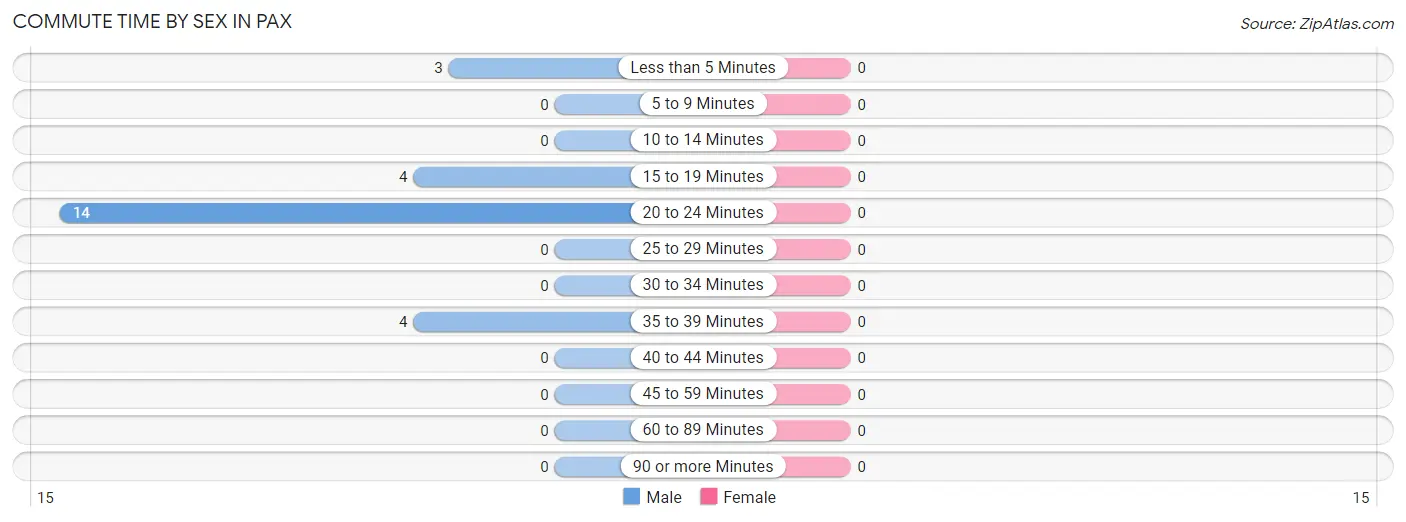
| Commute Time | Male | Female |
| Less than 5 Minutes | 3 (12.0%) | 0 (0.0%) |
| 5 to 9 Minutes | 0 (0.0%) | 0 (0.0%) |
| 10 to 14 Minutes | 0 (0.0%) | 0 (0.0%) |
| 15 to 19 Minutes | 4 (16.0%) | 0 (0.0%) |
| 20 to 24 Minutes | 14 (56.0%) | 0 (0.0%) |
| 25 to 29 Minutes | 0 (0.0%) | 0 (0.0%) |
| 30 to 34 Minutes | 0 (0.0%) | 0 (0.0%) |
| 35 to 39 Minutes | 4 (16.0%) | 0 (0.0%) |
| 40 to 44 Minutes | 0 (0.0%) | 0 (0.0%) |
| 45 to 59 Minutes | 0 (0.0%) | 0 (0.0%) |
| 60 to 89 Minutes | 0 (0.0%) | 0 (0.0%) |
| 90 or more Minutes | 0 (0.0%) | 0 (0.0%) |
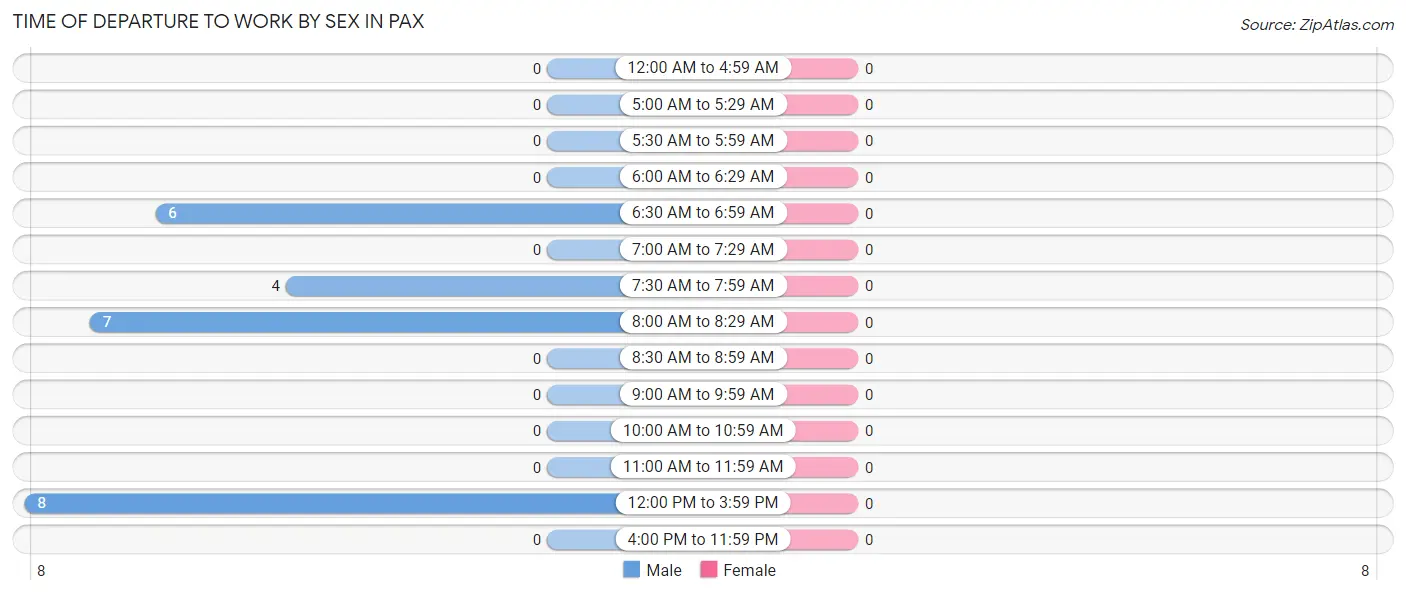
Time of Departure to Work by Sex in Pax
| Time of Departure | Male | Female |
| 12:00 AM to 4:59 AM | 0 (0.0%) | 0 (0.0%) |
| 5:00 AM to 5:29 AM | 0 (0.0%) | 0 (0.0%) |
| 5:30 AM to 5:59 AM | 0 (0.0%) | 0 (0.0%) |
| 6:00 AM to 6:29 AM | 0 (0.0%) | 0 (0.0%) |
| 6:30 AM to 6:59 AM | 6 (24.0%) | 0 (0.0%) |
| 7:00 AM to 7:29 AM | 0 (0.0%) | 0 (0.0%) |
| 7:30 AM to 7:59 AM | 4 (16.0%) | 0 (0.0%) |
| 8:00 AM to 8:29 AM | 7 (28.0%) | 0 (0.0%) |
| 8:30 AM to 8:59 AM | 0 (0.0%) | 0 (0.0%) |
| 9:00 AM to 9:59 AM | 0 (0.0%) | 0 (0.0%) |
| 10:00 AM to 10:59 AM | 0 (0.0%) | 0 (0.0%) |
| 11:00 AM to 11:59 AM | 0 (0.0%) | 0 (0.0%) |
| 12:00 PM to 3:59 PM | 8 (32.0%) | 0 (0.0%) |
| 4:00 PM to 11:59 PM | 0 (0.0%) | 0 (0.0%) |
| Total | 25 (100.0%) | 0 (0.0%) |
Housing Occupancy in Pax
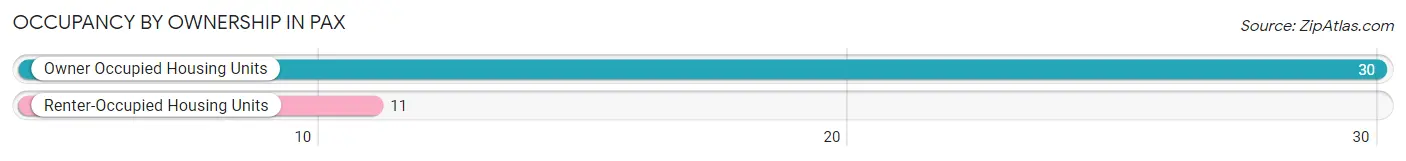
Occupancy by Ownership in Pax
Of the total 41 dwellings in Pax, owner-occupied units account for 30 (73.2%), while renter-occupied units make up 11 (26.8%).
| Occupancy | # Housing Units | % Housing Units |
| Owner Occupied Housing Units | 30 | 73.2% |
| Renter-Occupied Housing Units | 11 | 26.8% |
| Total Occupied Housing Units | 41 | 100.0% |
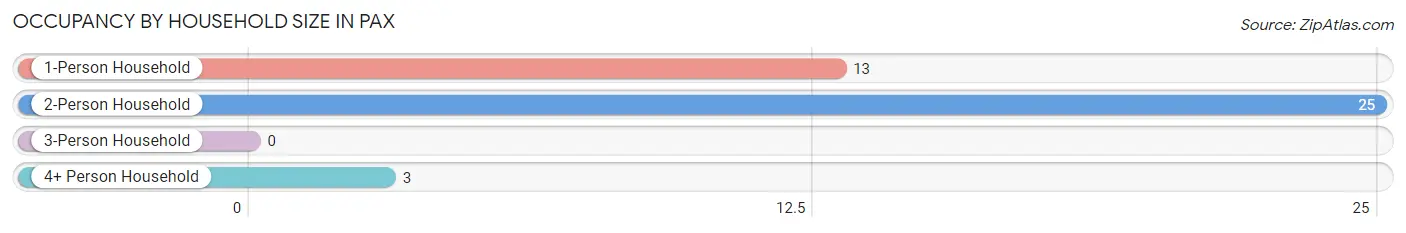
Occupancy by Household Size in Pax
| Household Size | # Housing Units | % Housing Units |
| 1-Person Household | 13 | 31.7% |
| 2-Person Household | 25 | 61.0% |
| 3-Person Household | 0 | 0.0% |
| 4+ Person Household | 3 | 7.3% |
| Total Housing Units | 41 | 100.0% |
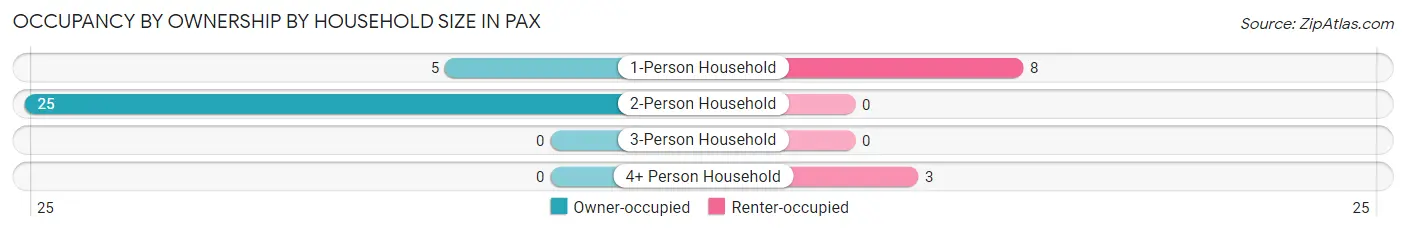
Occupancy by Ownership by Household Size in Pax
| Household Size | Owner-occupied | Renter-occupied |
| 1-Person Household | 5 (38.5%) | 8 (61.5%) |
| 2-Person Household | 25 (100.0%) | 0 (0.0%) |
| 3-Person Household | 0 (0.0%) | 0 (0.0%) |
| 4+ Person Household | 0 (0.0%) | 3 (100.0%) |
| Total Housing Units | 30 (73.2%) | 11 (26.8%) |
Occupancy by Educational Attainment in Pax
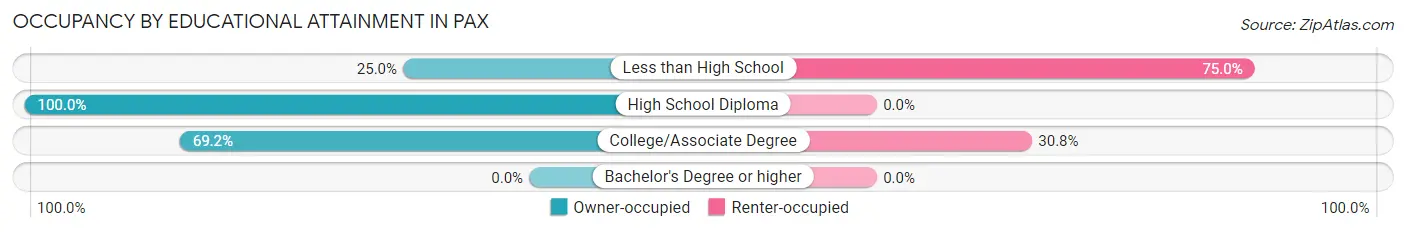
| Household Size | Owner-occupied | Renter-occupied |
| Less than High School | 1 (25.0%) | 3 (75.0%) |
| High School Diploma | 11 (100.0%) | 0 (0.0%) |
| College/Associate Degree | 18 (69.2%) | 8 (30.8%) |
| Bachelor's Degree or higher | 0 (0.0%) | 0 (0.0%) |
Occupancy by Age of Householder in Pax
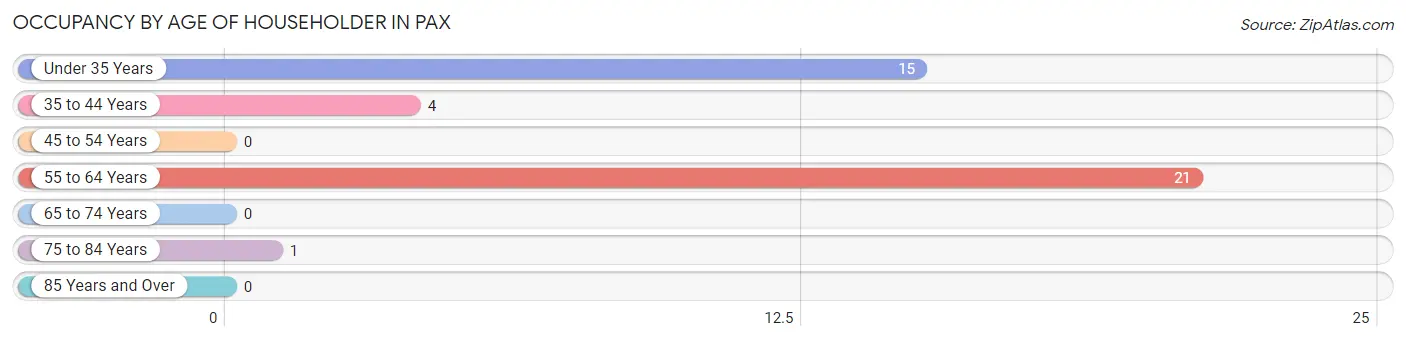
| Age Bracket | # Households | % Households |
| Under 35 Years | 15 | 36.6% |
| 35 to 44 Years | 4 | 9.8% |
| 45 to 54 Years | 0 | 0.0% |
| 55 to 64 Years | 21 | 51.2% |
| 65 to 74 Years | 0 | 0.0% |
| 75 to 84 Years | 1 | 2.4% |
| 85 Years and Over | 0 | 0.0% |
| Total | 41 | 100.0% |
Housing Finances in Pax
Median Income by Occupancy in Pax
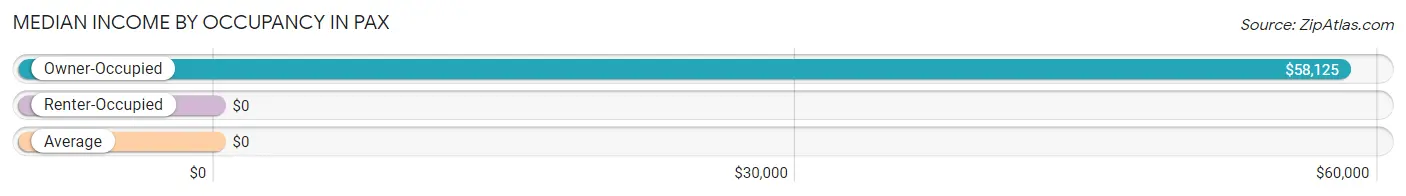
| Occupancy Type | # Households | Median Income |
| Owner-Occupied | 30 (73.2%) | $58,125 |
| Renter-Occupied | 11 (26.8%) | $0 |
| Average | 41 (100.0%) | $0 |
Occupancy by Householder Income Bracket in Pax
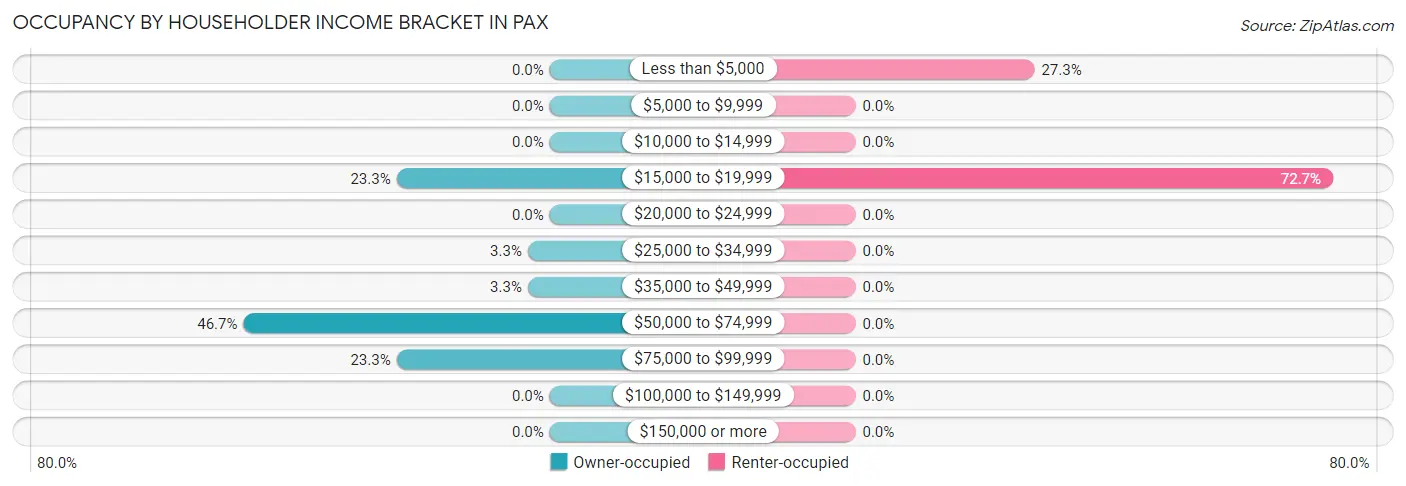
| Income Bracket | Owner-occupied | Renter-occupied |
| Less than $5,000 | 0 (0.0%) | 3 (27.3%) |
| $5,000 to $9,999 | 0 (0.0%) | 0 (0.0%) |
| $10,000 to $14,999 | 0 (0.0%) | 0 (0.0%) |
| $15,000 to $19,999 | 7 (23.3%) | 8 (72.7%) |
| $20,000 to $24,999 | 0 (0.0%) | 0 (0.0%) |
| $25,000 to $34,999 | 1 (3.3%) | 0 (0.0%) |
| $35,000 to $49,999 | 1 (3.3%) | 0 (0.0%) |
| $50,000 to $74,999 | 14 (46.7%) | 0 (0.0%) |
| $75,000 to $99,999 | 7 (23.3%) | 0 (0.0%) |
| $100,000 to $149,999 | 0 (0.0%) | 0 (0.0%) |
| $150,000 or more | 0 (0.0%) | 0 (0.0%) |
| Total | 30 (100.0%) | 11 (100.0%) |
Monthly Housing Cost Tiers in Pax
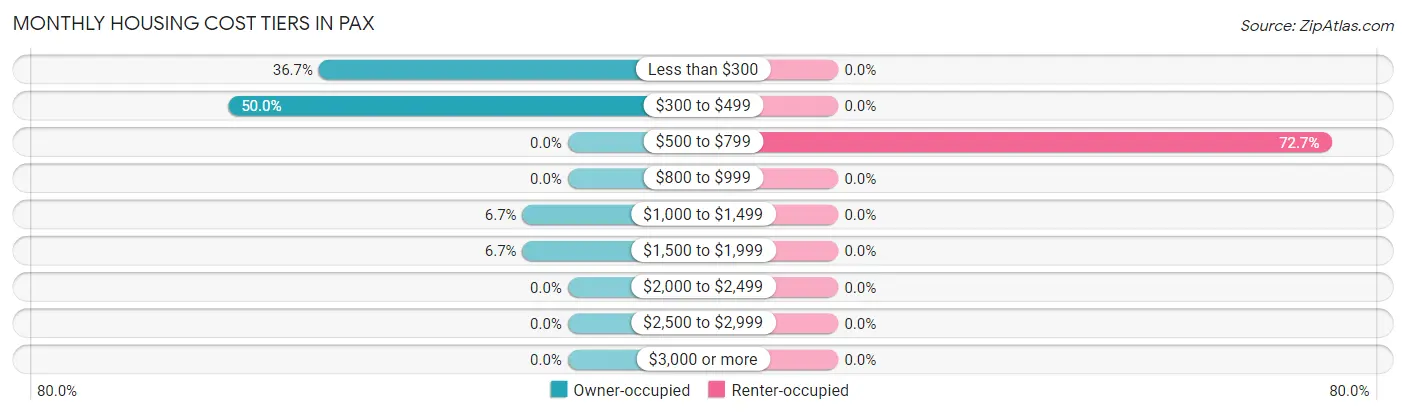
| Monthly Cost | Owner-occupied | Renter-occupied |
| Less than $300 | 11 (36.7%) | 0 (0.0%) |
| $300 to $499 | 15 (50.0%) | 0 (0.0%) |
| $500 to $799 | 0 (0.0%) | 8 (72.7%) |
| $800 to $999 | 0 (0.0%) | 0 (0.0%) |
| $1,000 to $1,499 | 2 (6.7%) | 0 (0.0%) |
| $1,500 to $1,999 | 2 (6.7%) | 0 (0.0%) |
| $2,000 to $2,499 | 0 (0.0%) | 0 (0.0%) |
| $2,500 to $2,999 | 0 (0.0%) | 0 (0.0%) |
| $3,000 or more | 0 (0.0%) | 0 (0.0%) |
| Total | 30 (100.0%) | 11 (100.0%) |
Physical Housing Characteristics in Pax
Housing Structures in Pax
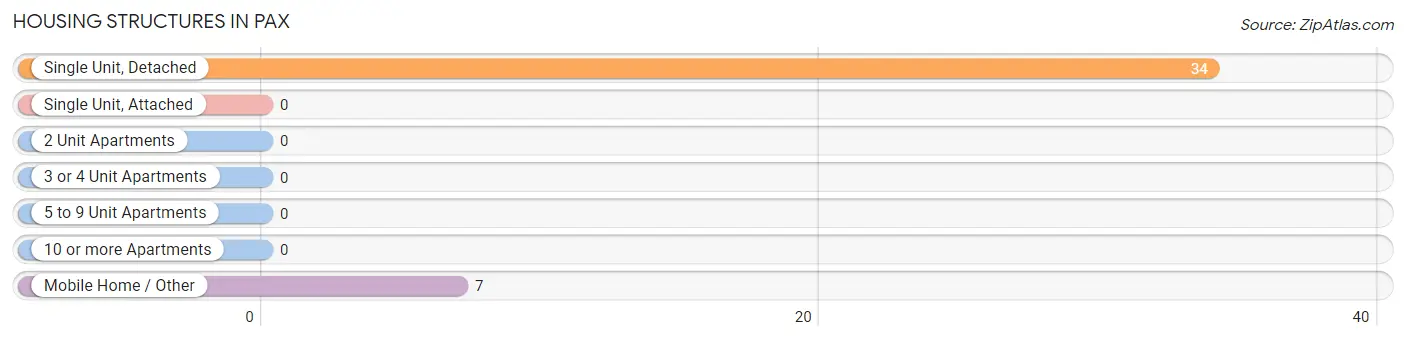
| Structure Type | # Housing Units | % Housing Units |
| Single Unit, Detached | 34 | 82.9% |
| Single Unit, Attached | 0 | 0.0% |
| 2 Unit Apartments | 0 | 0.0% |
| 3 or 4 Unit Apartments | 0 | 0.0% |
| 5 to 9 Unit Apartments | 0 | 0.0% |
| 10 or more Apartments | 0 | 0.0% |
| Mobile Home / Other | 7 | 17.1% |
| Total | 41 | 100.0% |
Housing Structures by Occupancy in Pax
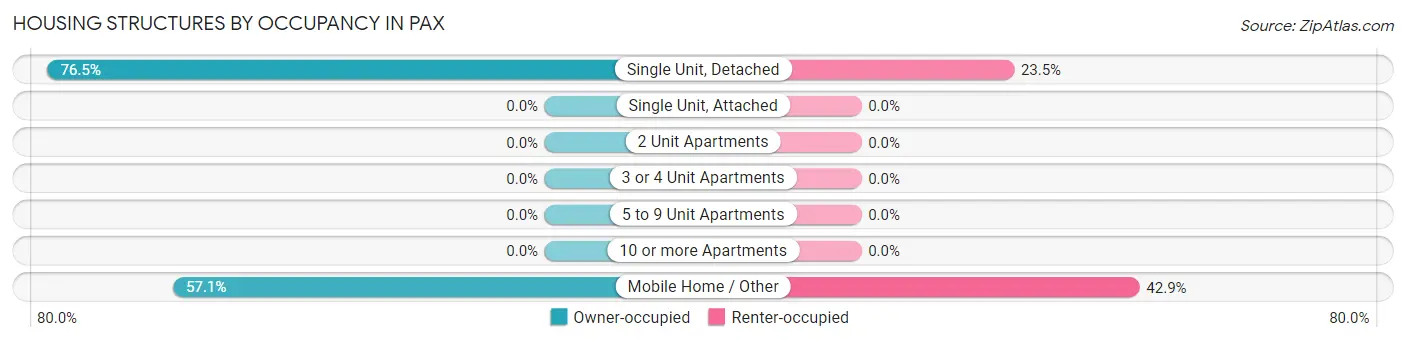
| Structure Type | Owner-occupied | Renter-occupied |
| Single Unit, Detached | 26 (76.5%) | 8 (23.5%) |
| Single Unit, Attached | 0 (0.0%) | 0 (0.0%) |
| 2 Unit Apartments | 0 (0.0%) | 0 (0.0%) |
| 3 or 4 Unit Apartments | 0 (0.0%) | 0 (0.0%) |
| 5 to 9 Unit Apartments | 0 (0.0%) | 0 (0.0%) |
| 10 or more Apartments | 0 (0.0%) | 0 (0.0%) |
| Mobile Home / Other | 4 (57.1%) | 3 (42.9%) |
| Total | 30 (73.2%) | 11 (26.8%) |
Housing Structures by Number of Rooms in Pax
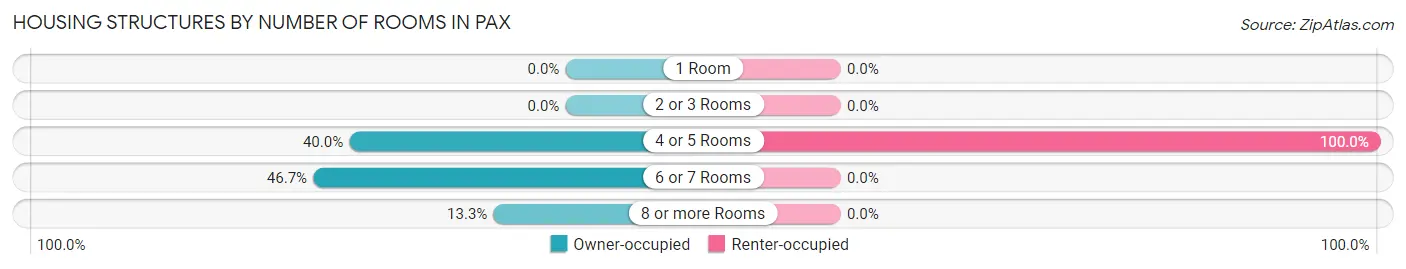
| Number of Rooms | Owner-occupied | Renter-occupied |
| 1 Room | 0 (0.0%) | 0 (0.0%) |
| 2 or 3 Rooms | 0 (0.0%) | 0 (0.0%) |
| 4 or 5 Rooms | 12 (40.0%) | 11 (100.0%) |
| 6 or 7 Rooms | 14 (46.7%) | 0 (0.0%) |
| 8 or more Rooms | 4 (13.3%) | 0 (0.0%) |
| Total | 30 (100.0%) | 11 (100.0%) |
Housing Structure by Heating Type in Pax
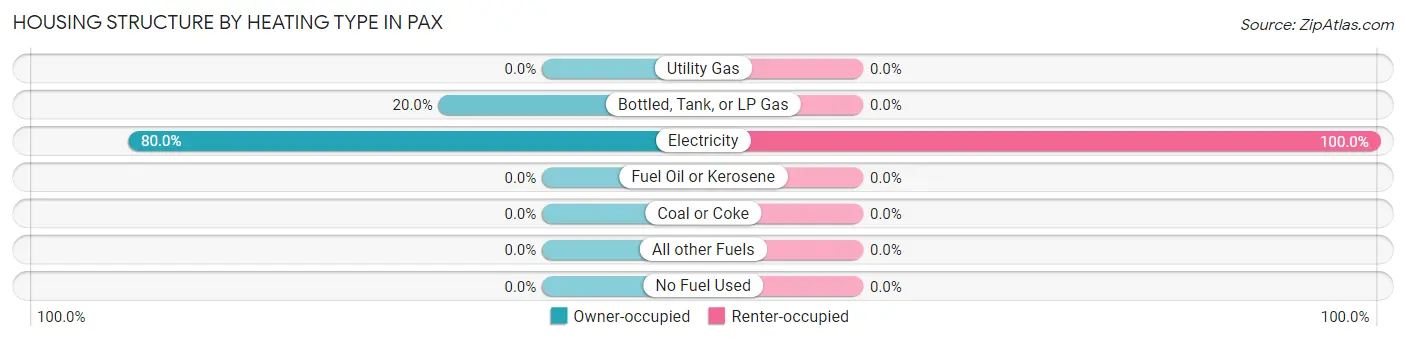
| Heating Type | Owner-occupied | Renter-occupied |
| Utility Gas | 0 (0.0%) | 0 (0.0%) |
| Bottled, Tank, or LP Gas | 6 (20.0%) | 0 (0.0%) |
| Electricity | 24 (80.0%) | 11 (100.0%) |
| Fuel Oil or Kerosene | 0 (0.0%) | 0 (0.0%) |
| Coal or Coke | 0 (0.0%) | 0 (0.0%) |
| All other Fuels | 0 (0.0%) | 0 (0.0%) |
| No Fuel Used | 0 (0.0%) | 0 (0.0%) |
| Total | 30 (100.0%) | 11 (100.0%) |
Household Vehicle Usage in Pax
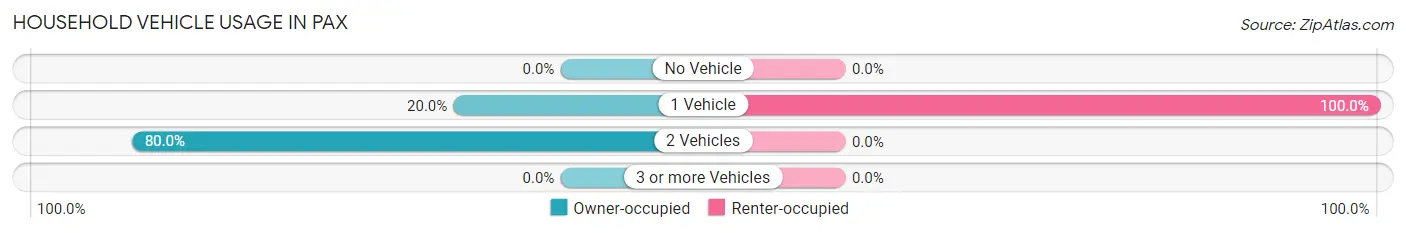
| Vehicles per Household | Owner-occupied | Renter-occupied |
| No Vehicle | 0 (0.0%) | 0 (0.0%) |
| 1 Vehicle | 6 (20.0%) | 11 (100.0%) |
| 2 Vehicles | 24 (80.0%) | 0 (0.0%) |
| 3 or more Vehicles | 0 (0.0%) | 0 (0.0%) |
| Total | 30 (100.0%) | 11 (100.0%) |
Real Estate & Mortgages in Pax
Real Estate and Mortgage Overview in Pax
| Characteristic | Without Mortgage | With Mortgage |
| Housing Units | 26 | 4 |
| Median Property Value | $51,400 | $0 |
| Median Household Income | $55,000 | $0 |
| Monthly Housing Costs | $407 | $0 |
| Real Estate Taxes | $350 | $0 |
Property Value by Mortgage Status in Pax
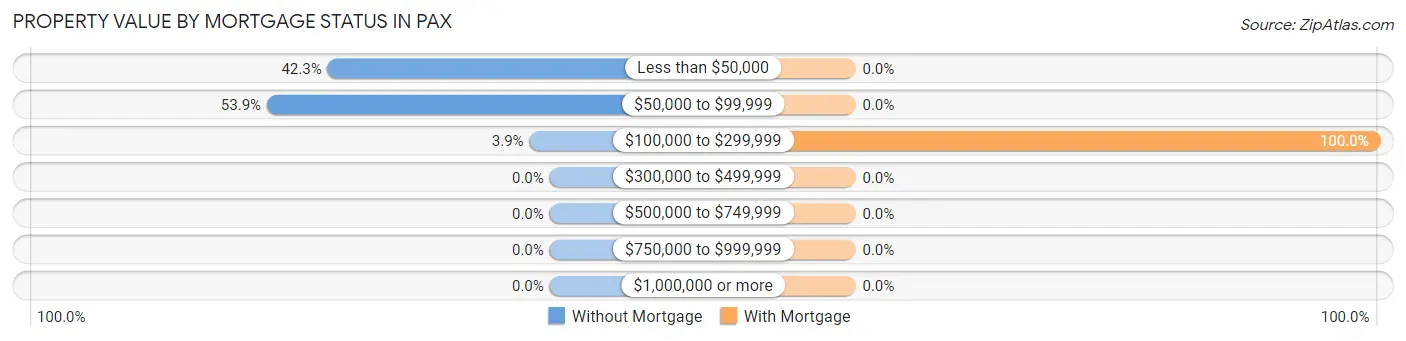
| Property Value | Without Mortgage | With Mortgage |
| Less than $50,000 | 11 (42.3%) | 0 (0.0%) |
| $50,000 to $99,999 | 14 (53.8%) | 0 (0.0%) |
| $100,000 to $299,999 | 1 (3.8%) | 4 (100.0%) |
| $300,000 to $499,999 | 0 (0.0%) | 0 (0.0%) |
| $500,000 to $749,999 | 0 (0.0%) | 0 (0.0%) |
| $750,000 to $999,999 | 0 (0.0%) | 0 (0.0%) |
| $1,000,000 or more | 0 (0.0%) | 0 (0.0%) |
| Total | 26 (100.0%) | 4 (100.0%) |
Household Income by Mortgage Status in Pax
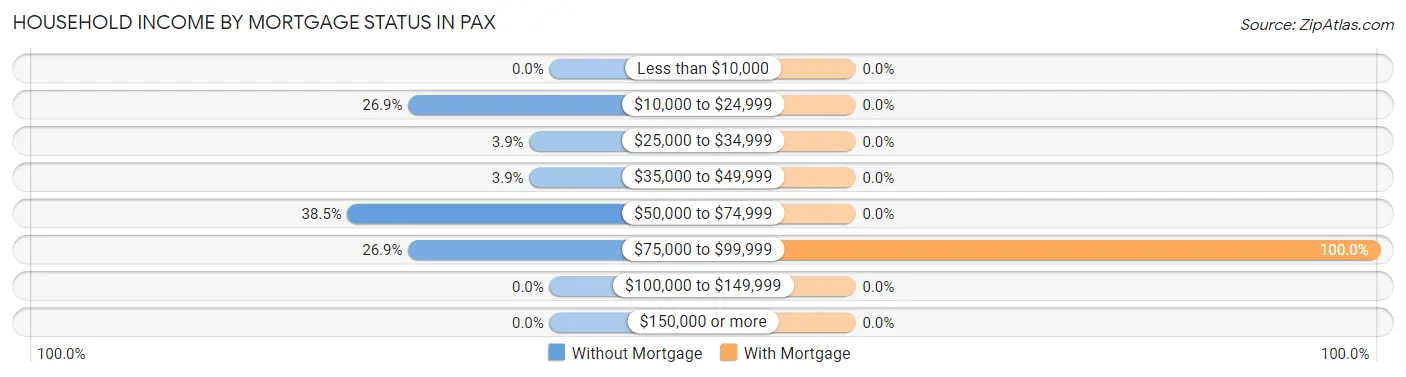
| Household Income | Without Mortgage | With Mortgage |
| Less than $10,000 | 0 (0.0%) | 0 (0.0%) |
| $10,000 to $24,999 | 7 (26.9%) | 0 (0.0%) |
| $25,000 to $34,999 | 1 (3.8%) | 0 (0.0%) |
| $35,000 to $49,999 | 1 (3.8%) | 0 (0.0%) |
| $50,000 to $74,999 | 10 (38.5%) | 0 (0.0%) |
| $75,000 to $99,999 | 7 (26.9%) | 4 (100.0%) |
| $100,000 to $149,999 | 0 (0.0%) | 0 (0.0%) |
| $150,000 or more | 0 (0.0%) | 0 (0.0%) |
| Total | 26 (100.0%) | 4 (100.0%) |
Property Value to Household Income Ratio in Pax
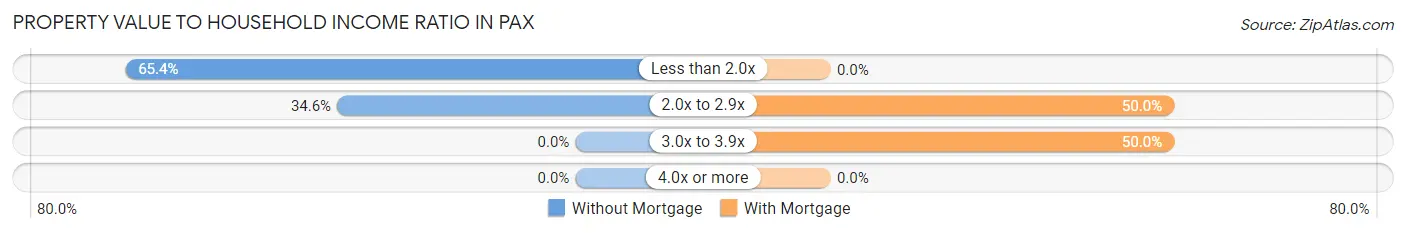
| Value-to-Income Ratio | Without Mortgage | With Mortgage |
| Less than 2.0x | 17 (65.4%) | 0 (0.0%) |
| 2.0x to 2.9x | 9 (34.6%) | 2 (50.0%) |
| 3.0x to 3.9x | 0 (0.0%) | 2 (50.0%) |
| 4.0x or more | 0 (0.0%) | 0 (0.0%) |
| Total | 26 (100.0%) | 4 (100.0%) |
Real Estate Taxes by Mortgage Status in Pax
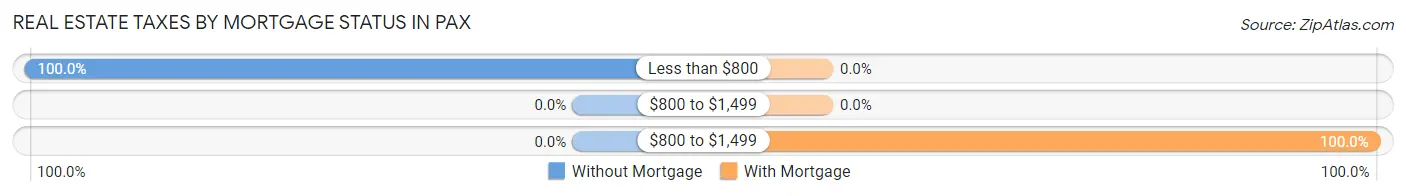
| Property Taxes | Without Mortgage | With Mortgage |
| Less than $800 | 26 (100.0%) | 0 (0.0%) |
| $800 to $1,499 | 0 (0.0%) | 0 (0.0%) |
| $800 to $1,499 | 0 (0.0%) | 4 (100.0%) |
| Total | 26 (100.0%) | 4 (100.0%) |
Health & Disability in Pax
Health Insurance Coverage by Age in Pax
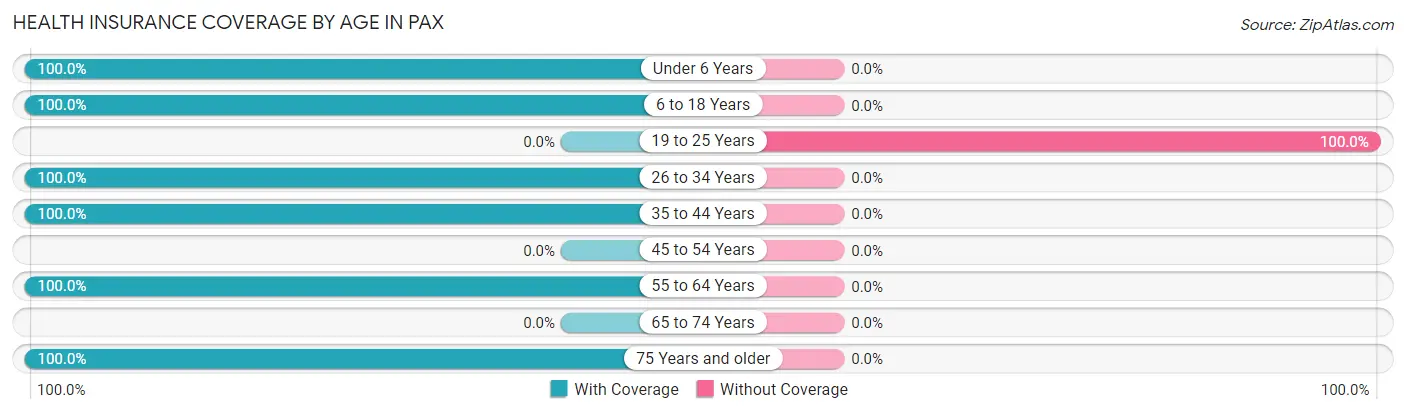
| Age Bracket | With Coverage | Without Coverage |
| Under 6 Years | 4 (100.0%) | 0 (0.0%) |
| 6 to 18 Years | 12 (100.0%) | 0 (0.0%) |
| 19 to 25 Years | 0 (0.0%) | 8 (100.0%) |
| 26 to 34 Years | 7 (100.0%) | 0 (0.0%) |
| 35 to 44 Years | 4 (100.0%) | 0 (0.0%) |
| 45 to 54 Years | 0 (0.0%) | 0 (0.0%) |
| 55 to 64 Years | 41 (100.0%) | 0 (0.0%) |
| 65 to 74 Years | 0 (0.0%) | 0 (0.0%) |
| 75 Years and older | 3 (100.0%) | 0 (0.0%) |
| Total | 71 (89.9%) | 8 (10.1%) |
Health Insurance Coverage by Citizenship Status in Pax
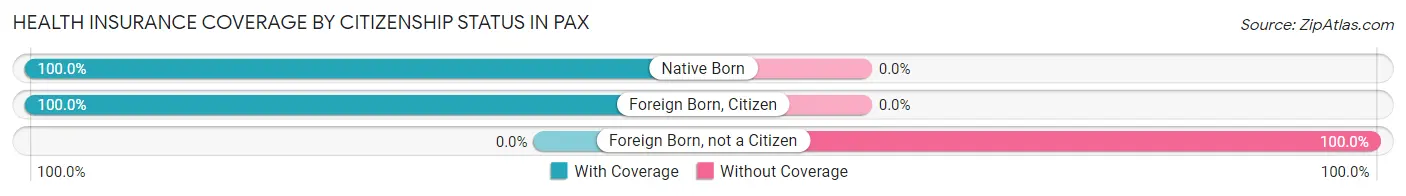
| Citizenship Status | With Coverage | Without Coverage |
| Native Born | 4 (100.0%) | 0 (0.0%) |
| Foreign Born, Citizen | 12 (100.0%) | 0 (0.0%) |
| Foreign Born, not a Citizen | 0 (0.0%) | 8 (100.0%) |
Health Insurance Coverage by Household Income in Pax
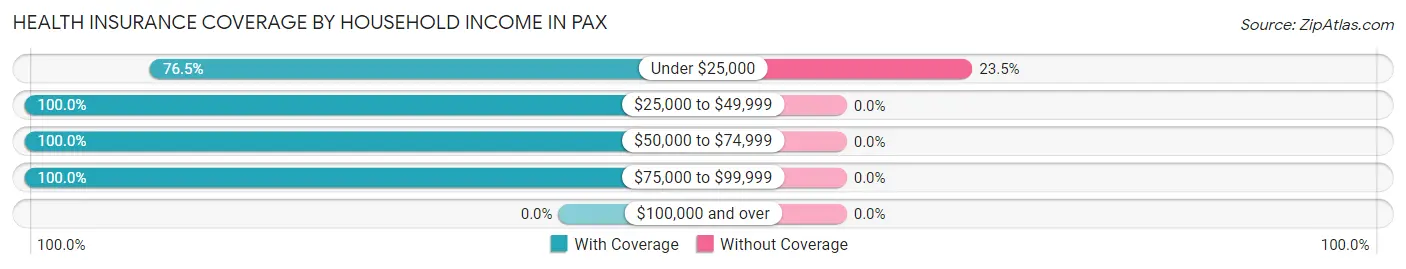
| Household Income | With Coverage | Without Coverage |
| Under $25,000 | 26 (76.5%) | 8 (23.5%) |
| $25,000 to $49,999 | 4 (100.0%) | 0 (0.0%) |
| $50,000 to $74,999 | 28 (100.0%) | 0 (0.0%) |
| $75,000 to $99,999 | 13 (100.0%) | 0 (0.0%) |
| $100,000 and over | 0 (0.0%) | 0 (0.0%) |
Public vs Private Health Insurance Coverage by Age in Pax
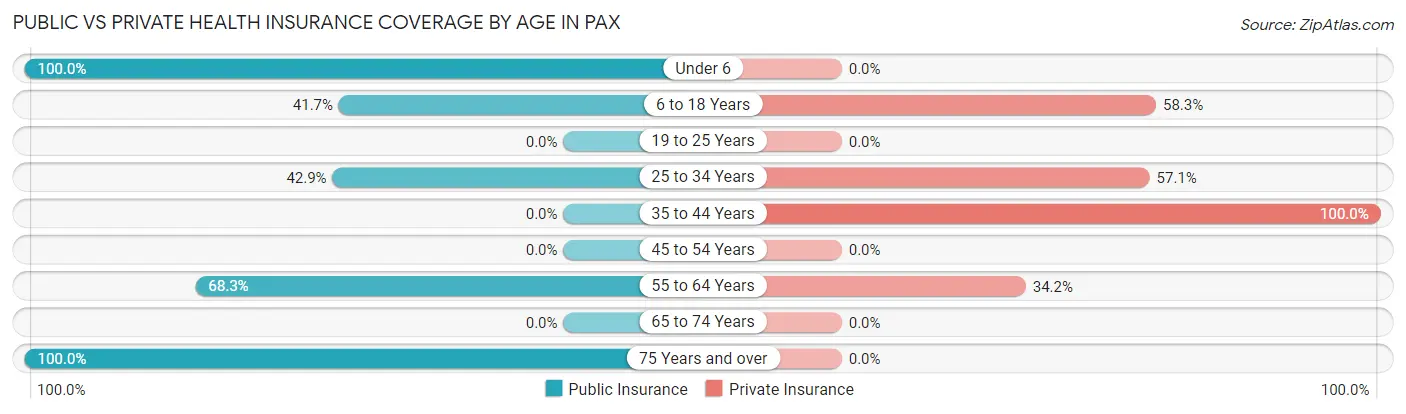
| Age Bracket | Public Insurance | Private Insurance |
| Under 6 | 4 (100.0%) | 0 (0.0%) |
| 6 to 18 Years | 5 (41.7%) | 7 (58.3%) |
| 19 to 25 Years | 0 (0.0%) | 0 (0.0%) |
| 25 to 34 Years | 3 (42.9%) | 4 (57.1%) |
| 35 to 44 Years | 0 (0.0%) | 4 (100.0%) |
| 45 to 54 Years | 0 (0.0%) | 0 (0.0%) |
| 55 to 64 Years | 28 (68.3%) | 14 (34.2%) |
| 65 to 74 Years | 0 (0.0%) | 0 (0.0%) |
| 75 Years and over | 3 (100.0%) | 0 (0.0%) |
| Total | 43 (54.4%) | 29 (36.7%) |
Disability Status by Sex by Age in Pax
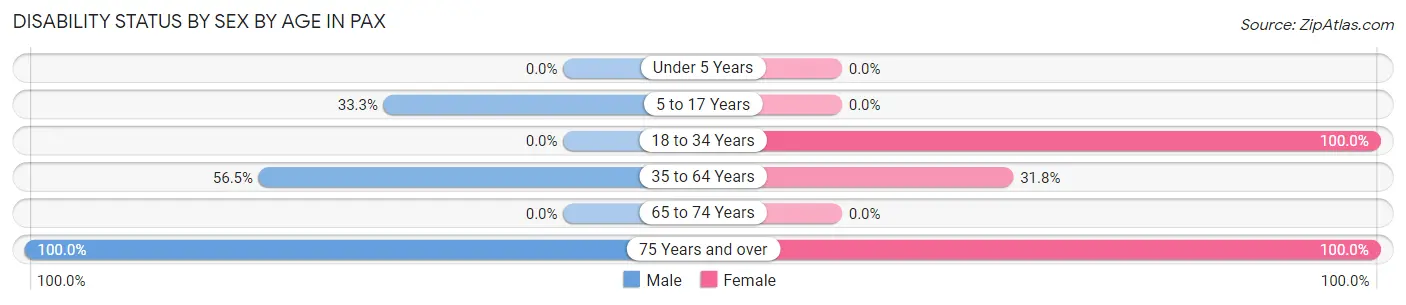
| Age Bracket | Male | Female |
| Under 5 Years | 0 (0.0%) | 0 (0.0%) |
| 5 to 17 Years | 2 (33.3%) | 0 (0.0%) |
| 18 to 34 Years | 0 (0.0%) | 3 (100.0%) |
| 35 to 64 Years | 13 (56.5%) | 7 (31.8%) |
| 65 to 74 Years | 0 (0.0%) | 0 (0.0%) |
| 75 Years and over | 2 (100.0%) | 1 (100.0%) |
Disability Class by Sex by Age in Pax
Disability Class: Hearing Difficulty
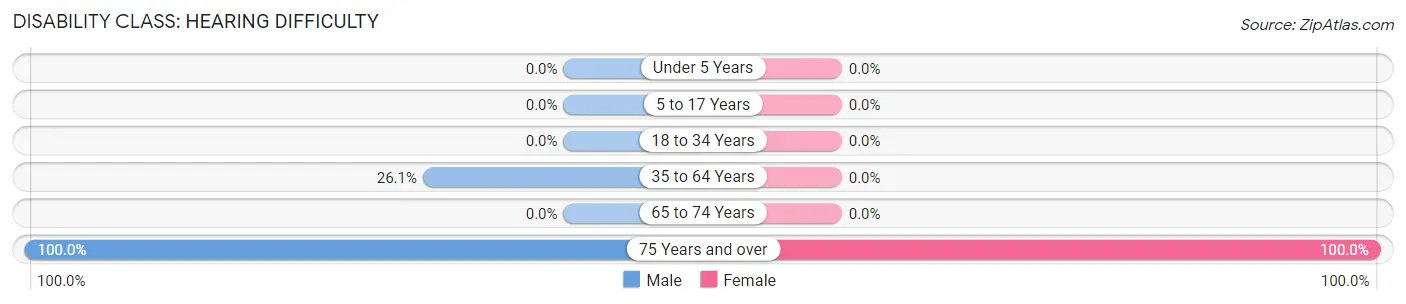
| Age Bracket | Male | Female |
| Under 5 Years | 0 (0.0%) | 0 (0.0%) |
| 5 to 17 Years | 0 (0.0%) | 0 (0.0%) |
| 18 to 34 Years | 0 (0.0%) | 0 (0.0%) |
| 35 to 64 Years | 6 (26.1%) | 0 (0.0%) |
| 65 to 74 Years | 0 (0.0%) | 0 (0.0%) |
| 75 Years and over | 2 (100.0%) | 1 (100.0%) |
Disability Class: Vision Difficulty
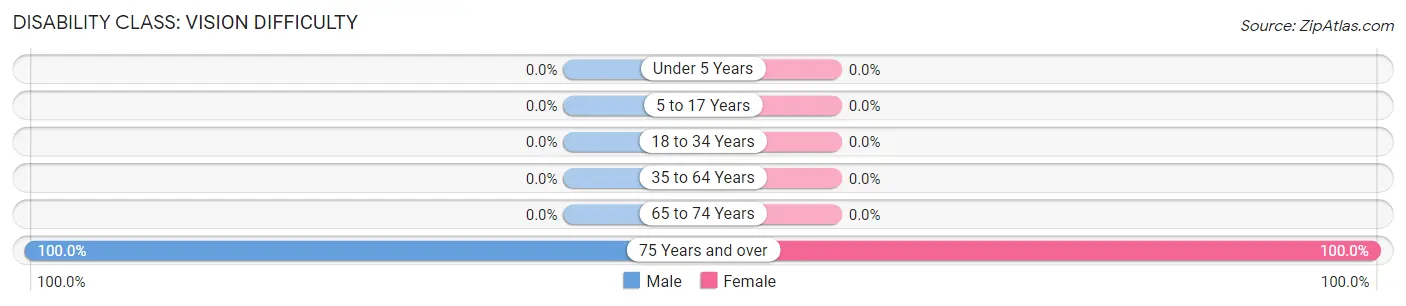
| Age Bracket | Male | Female |
| Under 5 Years | 0 (0.0%) | 0 (0.0%) |
| 5 to 17 Years | 0 (0.0%) | 0 (0.0%) |
| 18 to 34 Years | 0 (0.0%) | 0 (0.0%) |
| 35 to 64 Years | 0 (0.0%) | 0 (0.0%) |
| 65 to 74 Years | 0 (0.0%) | 0 (0.0%) |
| 75 Years and over | 2 (100.0%) | 1 (100.0%) |
Disability Class: Cognitive Difficulty
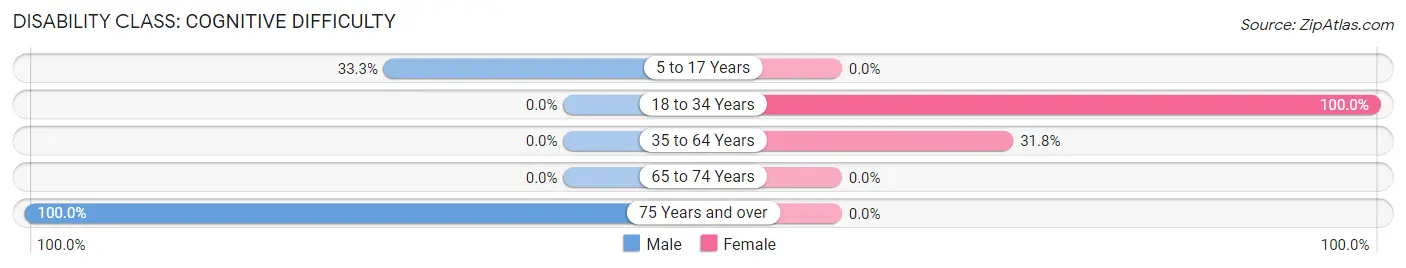
| Age Bracket | Male | Female |
| 5 to 17 Years | 2 (33.3%) | 0 (0.0%) |
| 18 to 34 Years | 0 (0.0%) | 3 (100.0%) |
| 35 to 64 Years | 0 (0.0%) | 7 (31.8%) |
| 65 to 74 Years | 0 (0.0%) | 0 (0.0%) |
| 75 Years and over | 2 (100.0%) | 0 (0.0%) |
Disability Class: Ambulatory Difficulty
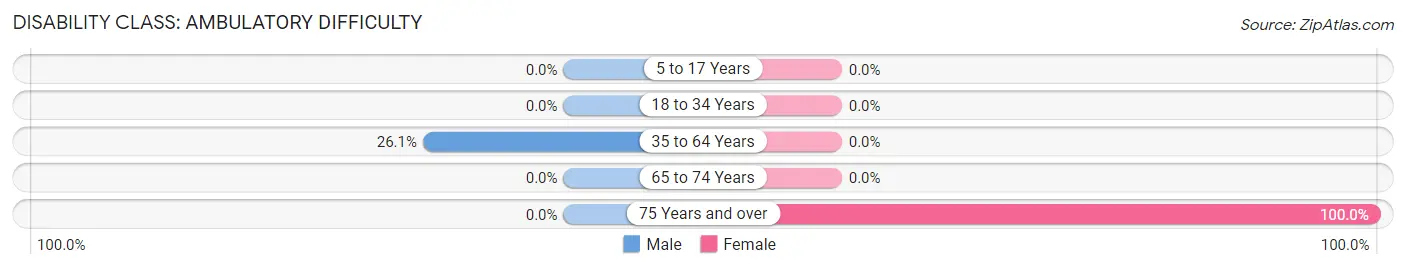
| Age Bracket | Male | Female |
| 5 to 17 Years | 0 (0.0%) | 0 (0.0%) |
| 18 to 34 Years | 0 (0.0%) | 0 (0.0%) |
| 35 to 64 Years | 6 (26.1%) | 0 (0.0%) |
| 65 to 74 Years | 0 (0.0%) | 0 (0.0%) |
| 75 Years and over | 0 (0.0%) | 1 (100.0%) |
Disability Class: Self-Care Difficulty
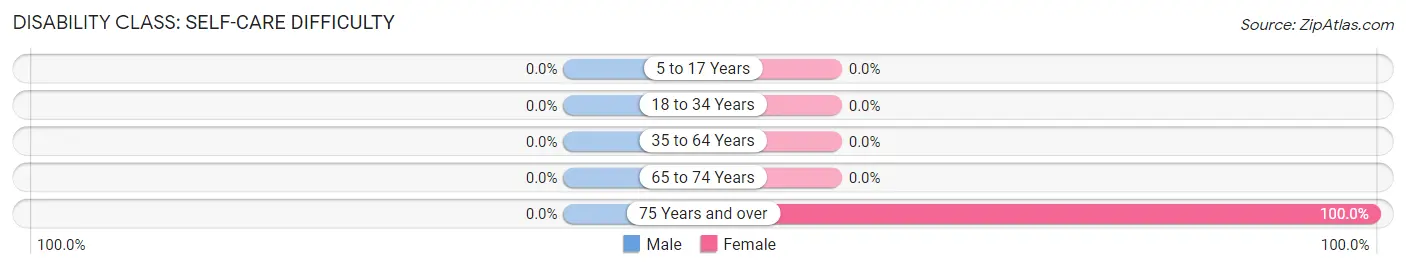
| Age Bracket | Male | Female |
| 5 to 17 Years | 0 (0.0%) | 0 (0.0%) |
| 18 to 34 Years | 0 (0.0%) | 0 (0.0%) |
| 35 to 64 Years | 0 (0.0%) | 0 (0.0%) |
| 65 to 74 Years | 0 (0.0%) | 0 (0.0%) |
| 75 Years and over | 0 (0.0%) | 1 (100.0%) |
Technology Access in Pax
Computing Device Access in Pax
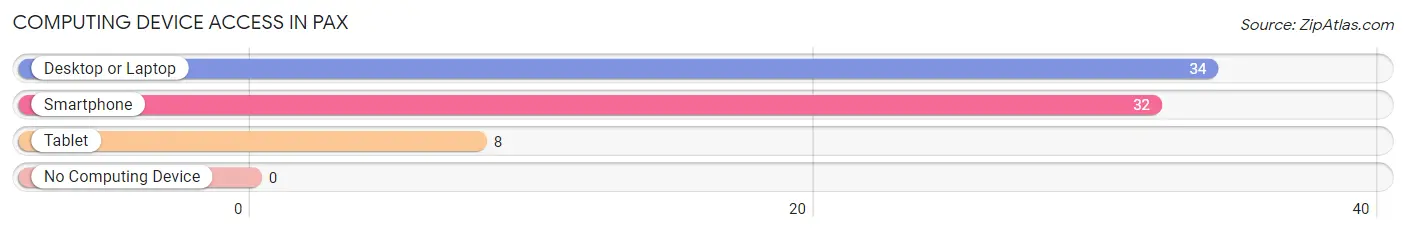
| Device Type | # Households | % Households |
| Desktop or Laptop | 34 | 82.9% |
| Smartphone | 32 | 78.0% |
| Tablet | 8 | 19.5% |
| No Computing Device | 0 | 0.0% |
| Total | 41 | 100.0% |
Internet Access in Pax
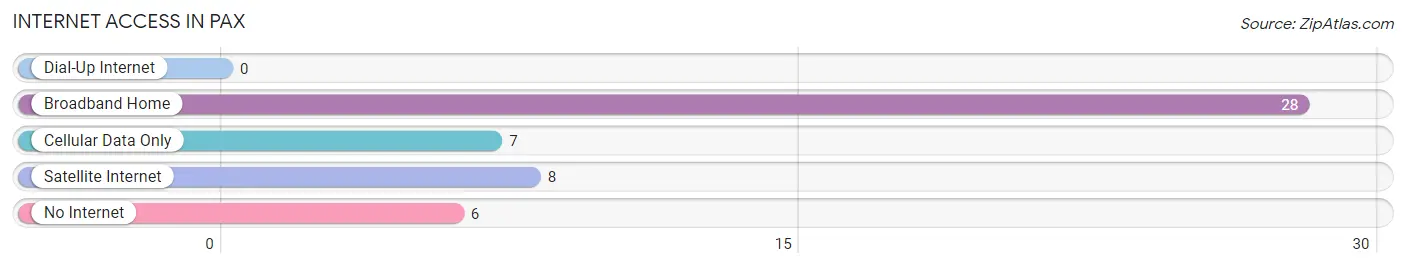
| Internet Type | # Households | % Households |
| Dial-Up Internet | 0 | 0.0% |
| Broadband Home | 28 | 68.3% |
| Cellular Data Only | 7 | 17.1% |
| Satellite Internet | 8 | 19.5% |
| No Internet | 6 | 14.6% |
| Total | 41 | 100.0% |
Pax Summary
Pax is an unincorporated community located in Fayette County, West Virginia. It is situated in the Appalachian Mountains, approximately 10 miles south of the city of Beckley. The community is located along the banks of the New River, and is surrounded by the beautiful New River Gorge National Park.
History
Pax was first settled in the late 1700s by a group of settlers from Pennsylvania. The community was originally known as “Paxville”, and was named after the Latin word for “peace”. The settlers were attracted to the area due to its abundance of natural resources, including timber, coal, and iron ore.
In the early 1800s, Pax became a major hub for the coal and iron ore industries. The community was home to several coal mines, as well as a number of iron ore furnaces. The Pax Iron Works was established in 1845, and was one of the largest iron ore furnaces in the region.
The Pax Iron Works was destroyed by a fire in 1871, and the community began to decline. The coal and iron ore industries eventually moved away, and Pax became a small, rural community.
Geography
Pax is located in the Appalachian Mountains of West Virginia. The community is situated along the banks of the New River, and is surrounded by the New River Gorge National Park. The area is known for its rugged terrain and beautiful scenery.
The climate in Pax is humid subtropical, with hot summers and cold winters. The average annual temperature is around 54 degrees Fahrenheit, and the average annual precipitation is around 43 inches.
Economy
The economy of Pax is largely based on tourism. The community is located in the heart of the New River Gorge National Park, and is a popular destination for outdoor enthusiasts. The area is known for its hiking trails, whitewater rafting, and rock climbing.
The community is also home to several small businesses, including restaurants, shops, and lodging. The Pax Iron Works is now a museum, and is a popular tourist attraction.
Demographics
As of the 2010 census, the population of Pax was 1,072. The racial makeup of the community was 97.3% White, 0.9% African American, 0.2% Native American, 0.2% Asian, and 1.4% from other races.
The median household income in Pax was $30,938, and the median family income was $37,813. The per capita income was $17,845. Approximately 17.3% of the population was below the poverty line.
Common Questions
What is Per Capita Income in Pax?
Per Capita income in Pax is $21,511.
What is the Median Family Income in Pax?
Median Family Income in Pax is $58,438.
What is Inequality or Gini Index in Pax?
Inequality or Gini Index in Pax is 0.37.
What is the Total Population of Pax?
Total Population of Pax is 79.
What is the Total Male Population of Pax?
Total Male Population of Pax is 46.
What is the Total Female Population of Pax?
Total Female Population of Pax is 33.
What is the Ratio of Males per 100 Females in Pax?
There are 139.39 Males per 100 Females in Pax.
What is the Ratio of Females per 100 Males in Pax?
There are 71.74 Females per 100 Males in Pax.
What is the Median Population Age in Pax?
Median Population Age in Pax is 57.6 Years.
What is the Average Family Size in Pax
Average Family Size in Pax is 2.4 People.
What is the Average Household Size in Pax
Average Household Size in Pax is 1.9 People.
How Large is the Labor Force in Pax?
There are 25 People in the Labor Forcein in Pax.
What is the Percentage of People in the Labor Force in Pax?
37.9% of People are in the Labor Force in Pax.