Oceana, WV Map & Demographics
Oceana Map
Oceana Overview
$34,881
PER CAPITA INCOME
$58,676
AVG FAMILY INCOME
$37,083
AVG HOUSEHOLD INCOME
0.60
INEQUALITY / GINI INDEX
1,232
TOTAL POPULATION
568
MALE POPULATION
664
FEMALE POPULATION
85.54
MALES / 100 FEMALES
116.90
FEMALES / 100 MALES
47.8
MEDIAN AGE
3.5
AVG FAMILY SIZE
2.4
AVG HOUSEHOLD SIZE
480
LABOR FORCE [ PEOPLE ]
41.1%
PERCENT IN LABOR FORCE
7.5%
UNEMPLOYMENT RATE
Oceana Zip Codes
Income in Oceana
Income Overview in Oceana
Per Capita Income in Oceana is $34,881, while median incomes of families and households are $58,676 and $37,083 respectively.
| Characteristic | Number | Measure |
| Per Capita Income | 1,232 | $34,881 |
| Median Family Income | 260 | $58,676 |
| Mean Family Income | 260 | $59,242 |
| Median Household Income | 510 | $37,083 |
| Mean Household Income | 510 | $74,253 |
| Income Deficit | 260 | $0 |
| Wage / Income Gap (%) | 1,232 | 0.00% |
| Wage / Income Gap ($) | 1,232 | 100.00¢ per $1 |
| Gini / Inequality Index | 1,232 | 0.60 |
Earnings by Sex in Oceana
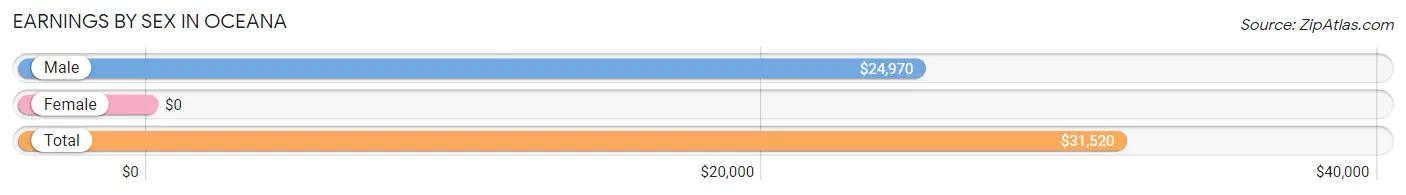
| Sex | Number | Average Earnings |
| Male | 227 (48.8%) | $24,970 |
| Female | 238 (51.2%) | $0 |
| Total | 465 (100.0%) | $31,520 |
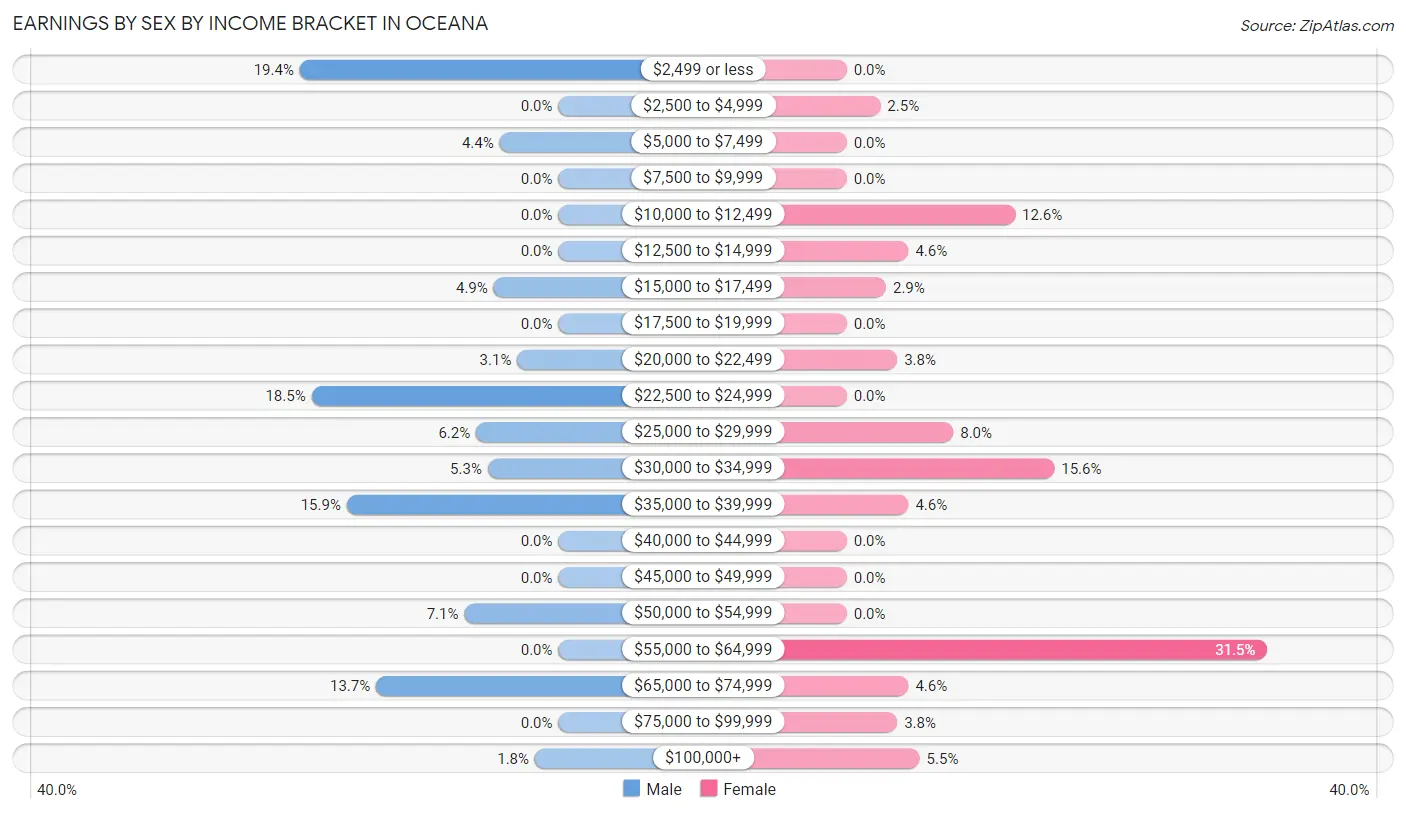
Earnings by Sex by Income Bracket in Oceana
The most common earnings brackets in Oceana are $2,499 or less for men (44 | 19.4%) and $55,000 to $64,999 for women (75 | 31.5%).
| Income | Male | Female |
| $2,499 or less | 44 (19.4%) | 0 (0.0%) |
| $2,500 to $4,999 | 0 (0.0%) | 6 (2.5%) |
| $5,000 to $7,499 | 10 (4.4%) | 0 (0.0%) |
| $7,500 to $9,999 | 0 (0.0%) | 0 (0.0%) |
| $10,000 to $12,499 | 0 (0.0%) | 30 (12.6%) |
| $12,500 to $14,999 | 0 (0.0%) | 11 (4.6%) |
| $15,000 to $17,499 | 11 (4.9%) | 7 (2.9%) |
| $17,500 to $19,999 | 0 (0.0%) | 0 (0.0%) |
| $20,000 to $22,499 | 7 (3.1%) | 9 (3.8%) |
| $22,500 to $24,999 | 42 (18.5%) | 0 (0.0%) |
| $25,000 to $29,999 | 14 (6.2%) | 19 (8.0%) |
| $30,000 to $34,999 | 12 (5.3%) | 37 (15.5%) |
| $35,000 to $39,999 | 36 (15.9%) | 11 (4.6%) |
| $40,000 to $44,999 | 0 (0.0%) | 0 (0.0%) |
| $45,000 to $49,999 | 0 (0.0%) | 0 (0.0%) |
| $50,000 to $54,999 | 16 (7.0%) | 0 (0.0%) |
| $55,000 to $64,999 | 0 (0.0%) | 75 (31.5%) |
| $65,000 to $74,999 | 31 (13.7%) | 11 (4.6%) |
| $75,000 to $99,999 | 0 (0.0%) | 9 (3.8%) |
| $100,000+ | 4 (1.8%) | 13 (5.5%) |
| Total | 227 (100.0%) | 238 (100.0%) |
Earnings by Sex by Educational Attainment in Oceana
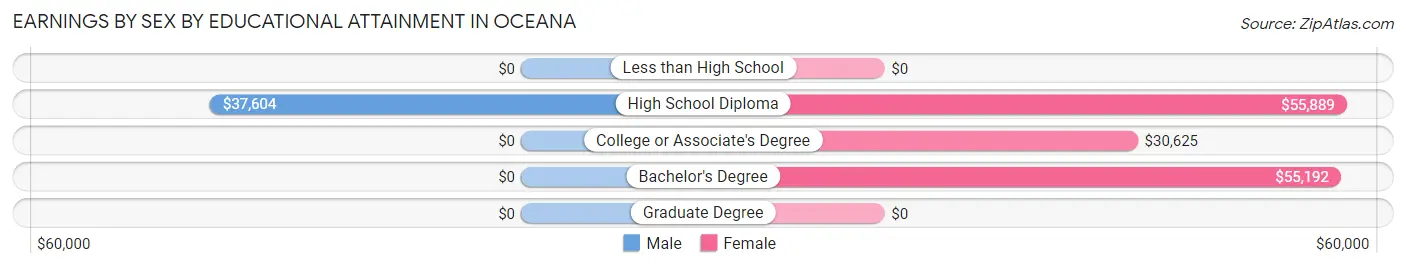
| Educational Attainment | Male Income | Female Income |
| Less than High School | - | - |
| High School Diploma | $37,604 | $55,889 |
| College or Associate's Degree | - | - |
| Bachelor's Degree | - | - |
| Graduate Degree | - | - |
| Total | $37,951 | $0 |
Family Income in Oceana
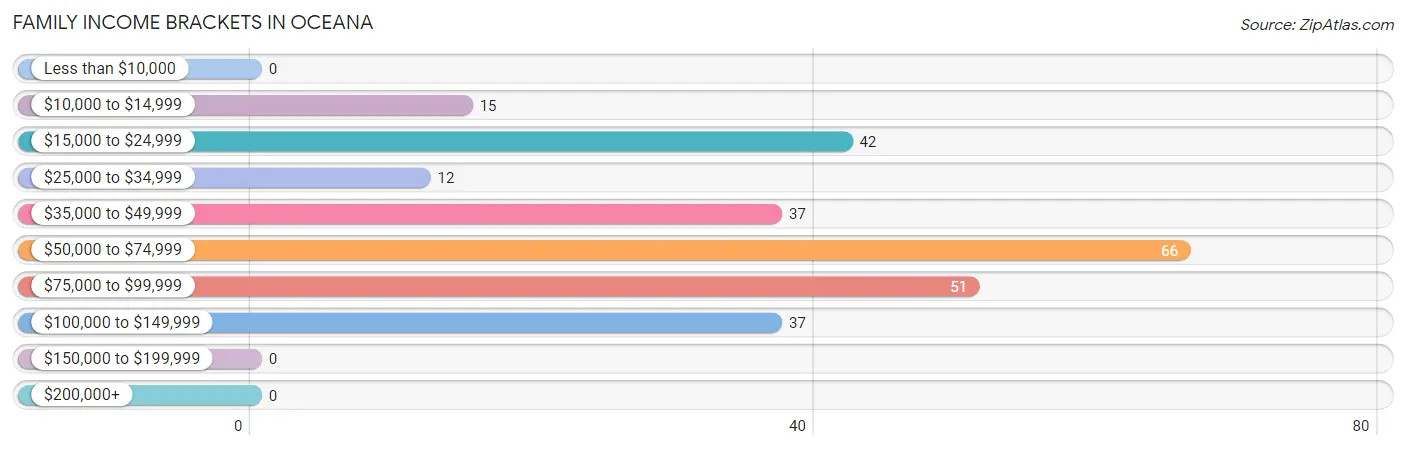
Family Income Brackets in Oceana
According to the Oceana family income data, there are 66 families falling into the $50,000 to $74,999 income range, which is the most common income bracket and makes up 25.4% of all families.
| Income Bracket | # Families | % Families |
| Less than $10,000 | 0 | 0.0% |
| $10,000 to $14,999 | 15 | 5.8% |
| $15,000 to $24,999 | 42 | 16.2% |
| $25,000 to $34,999 | 12 | 4.6% |
| $35,000 to $49,999 | 37 | 14.2% |
| $50,000 to $74,999 | 66 | 25.4% |
| $75,000 to $99,999 | 51 | 19.6% |
| $100,000 to $149,999 | 37 | 14.2% |
| $150,000 to $199,999 | 0 | 0.0% |
| $200,000+ | 0 | 0.0% |
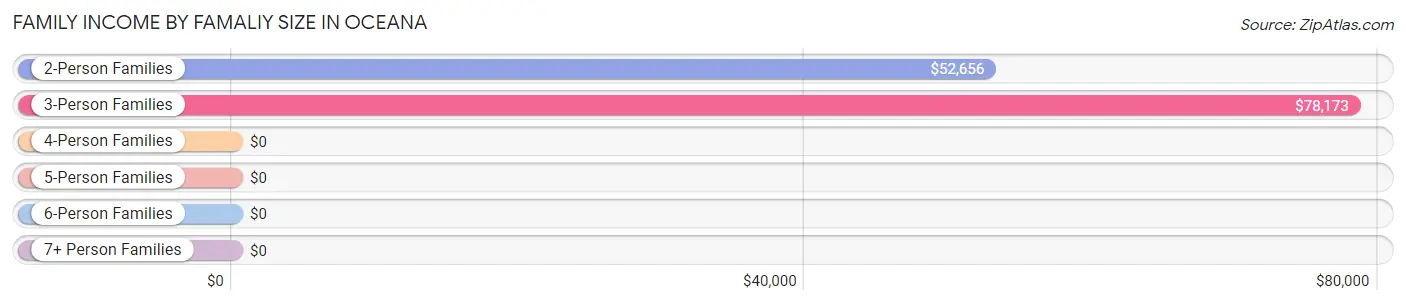
Family Income by Famaliy Size in Oceana
3-person families (29 | 11.2%) account for the highest median family income in Oceana with $78,173 per family, while 2-person families (195 | 75.0%) have the highest median income of $26,328 per family member.
| Income Bracket | # Families | Median Income |
| 2-Person Families | 195 (75.0%) | $52,656 |
| 3-Person Families | 29 (11.2%) | $78,173 |
| 4-Person Families | 27 (10.4%) | $0 |
| 5-Person Families | 9 (3.5%) | $0 |
| 6-Person Families | 0 (0.0%) | $0 |
| 7+ Person Families | 0 (0.0%) | $0 |
| Total | 260 (100.0%) | $58,676 |
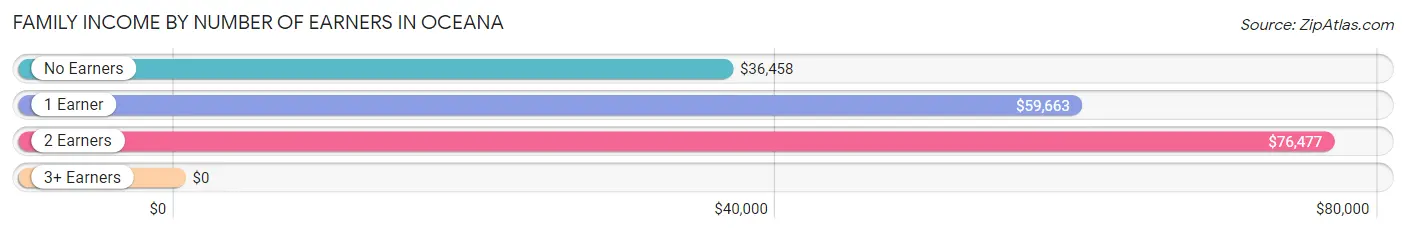
Family Income by Number of Earners in Oceana
| Number of Earners | # Families | Median Income |
| No Earners | 121 (46.5%) | $36,458 |
| 1 Earner | 53 (20.4%) | $59,663 |
| 2 Earners | 59 (22.7%) | $76,477 |
| 3+ Earners | 27 (10.4%) | $0 |
| Total | 260 (100.0%) | $58,676 |
Household Income in Oceana
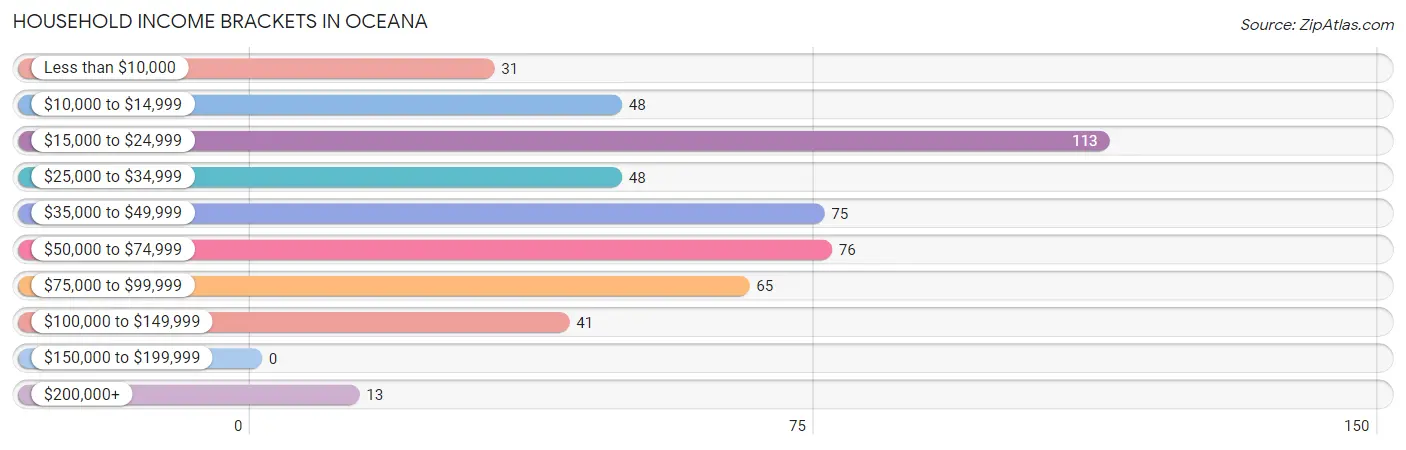
Household Income Brackets in Oceana
With 113 households falling in the category, the $15,000 to $24,999 income range is the most frequent in Oceana, accounting for 22.2% of all households.
| Income Bracket | # Households | % Households |
| Less than $10,000 | 31 | 6.1% |
| $10,000 to $14,999 | 48 | 9.4% |
| $15,000 to $24,999 | 113 | 22.2% |
| $25,000 to $34,999 | 48 | 9.4% |
| $35,000 to $49,999 | 75 | 14.7% |
| $50,000 to $74,999 | 76 | 14.9% |
| $75,000 to $99,999 | 65 | 12.7% |
| $100,000 to $149,999 | 41 | 8.0% |
| $150,000 to $199,999 | 0 | 0.0% |
| $200,000+ | 13 | 2.5% |
Household Income by Householder Age in Oceana
The median household income in Oceana is $37,083, with the highest median household income of $61,313 found in the 45 to 64 years age bracket for the primary householder. A total of 217 households (42.5%) fall into this category. Meanwhile, the 15 to 24 years age bracket for the primary householder has the lowest median household income of $0, with 4 households (0.8%) in this group.
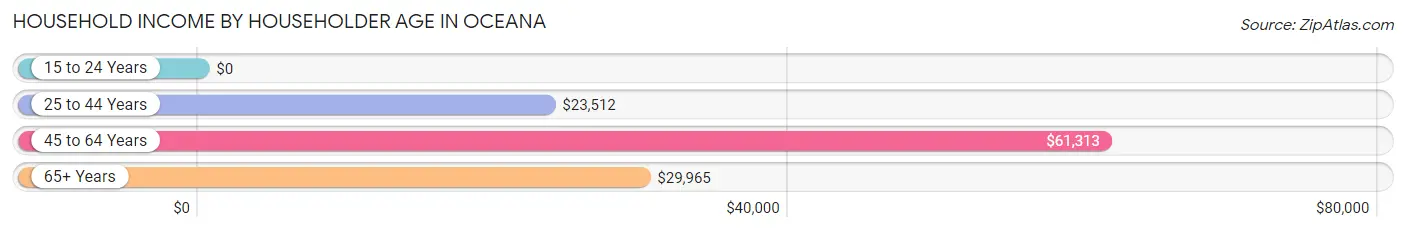
| Income Bracket | # Households | Median Income |
| 15 to 24 Years | 4 (0.8%) | $0 |
| 25 to 44 Years | 78 (15.3%) | $23,512 |
| 45 to 64 Years | 217 (42.5%) | $61,313 |
| 65+ Years | 211 (41.4%) | $29,965 |
| Total | 510 (100.0%) | $37,083 |
Poverty in Oceana
Income Below Poverty by Sex and Age in Oceana
With 25.2% poverty level for males and 31.5% for females among the residents of Oceana, 35 to 44 year old males and 6 to 11 year old females are the most vulnerable to poverty, with 30 males (61.2%) and 44 females (100.0%) in their respective age groups living below the poverty level.
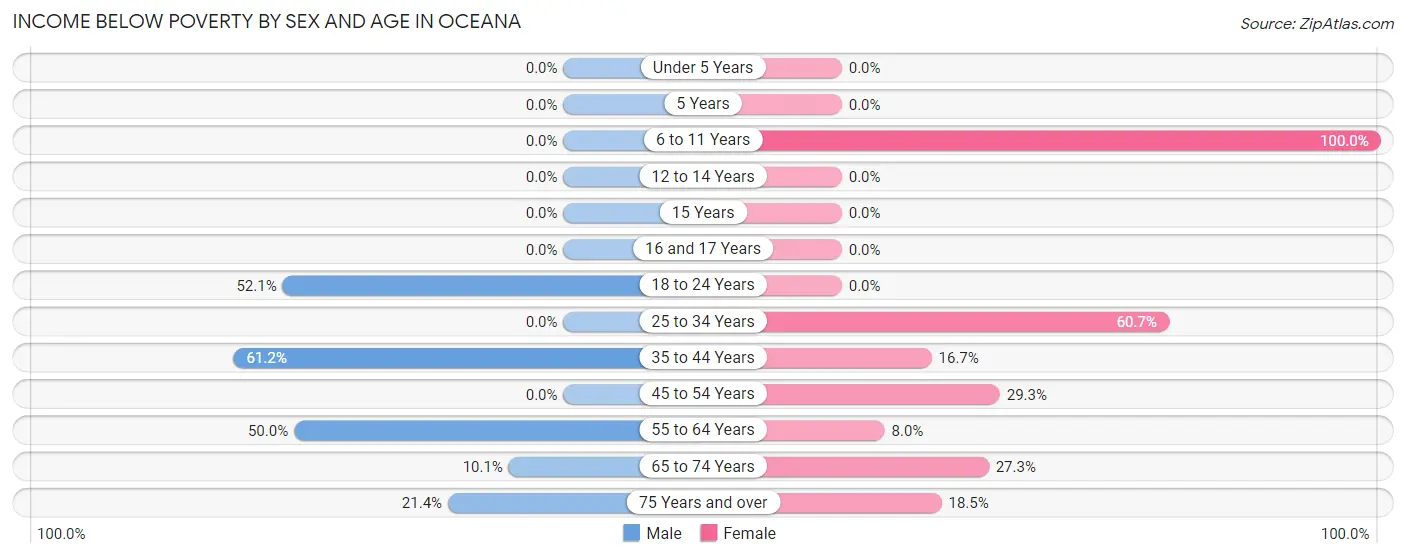
| Age Bracket | Male | Female |
| Under 5 Years | 0 (0.0%) | 0 (0.0%) |
| 5 Years | 0 (0.0%) | 0 (0.0%) |
| 6 to 11 Years | 0 (0.0%) | 44 (100.0%) |
| 12 to 14 Years | 0 (0.0%) | 0 (0.0%) |
| 15 Years | 0 (0.0%) | 0 (0.0%) |
| 16 and 17 Years | 0 (0.0%) | 0 (0.0%) |
| 18 to 24 Years | 49 (52.1%) | 0 (0.0%) |
| 25 to 34 Years | 0 (0.0%) | 71 (60.7%) |
| 35 to 44 Years | 30 (61.2%) | 22 (16.7%) |
| 45 to 54 Years | 0 (0.0%) | 22 (29.3%) |
| 55 to 64 Years | 39 (50.0%) | 7 (8.0%) |
| 65 to 74 Years | 7 (10.1%) | 33 (27.3%) |
| 75 Years and over | 18 (21.4%) | 10 (18.5%) |
| Total | 143 (25.2%) | 209 (31.5%) |
Income Above Poverty by Sex and Age in Oceana
According to the poverty statistics in Oceana, males aged 6 to 11 years and females aged 5 years are the age groups that are most secure financially, with 100.0% of males and 100.0% of females in these age groups living above the poverty line.
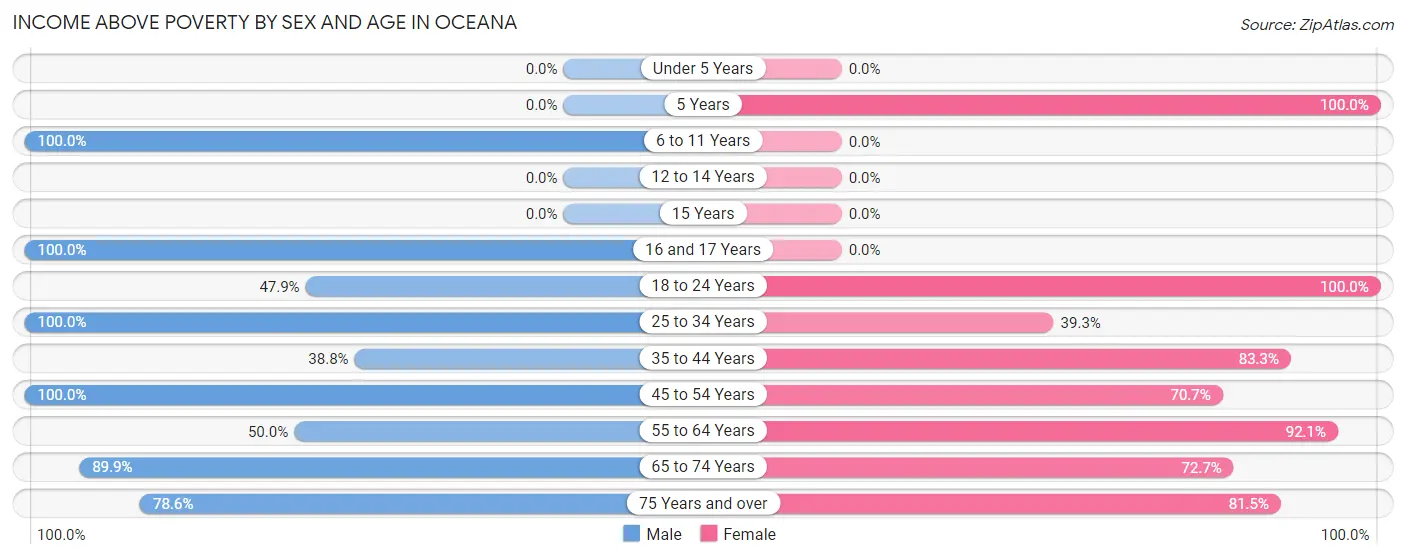
| Age Bracket | Male | Female |
| Under 5 Years | 0 (0.0%) | 0 (0.0%) |
| 5 Years | 0 (0.0%) | 11 (100.0%) |
| 6 to 11 Years | 8 (100.0%) | 0 (0.0%) |
| 12 to 14 Years | 0 (0.0%) | 0 (0.0%) |
| 15 Years | 0 (0.0%) | 0 (0.0%) |
| 16 and 17 Years | 21 (100.0%) | 0 (0.0%) |
| 18 to 24 Years | 45 (47.9%) | 22 (100.0%) |
| 25 to 34 Years | 78 (100.0%) | 46 (39.3%) |
| 35 to 44 Years | 19 (38.8%) | 110 (83.3%) |
| 45 to 54 Years | 87 (100.0%) | 53 (70.7%) |
| 55 to 64 Years | 39 (50.0%) | 81 (92.0%) |
| 65 to 74 Years | 62 (89.9%) | 88 (72.7%) |
| 75 Years and over | 66 (78.6%) | 44 (81.5%) |
| Total | 425 (74.8%) | 455 (68.5%) |
Income Below Poverty Among Married-Couple Families in Oceana
The poverty statistics for married-couple families in Oceana show that 18.0% or 37 of the total 205 families live below the poverty line. Families with 1 or 2 children have the highest poverty rate of 100.0%, comprising of 9 families. On the other hand, families with no children have the lowest poverty rate of 14.3%, which includes 28 families.
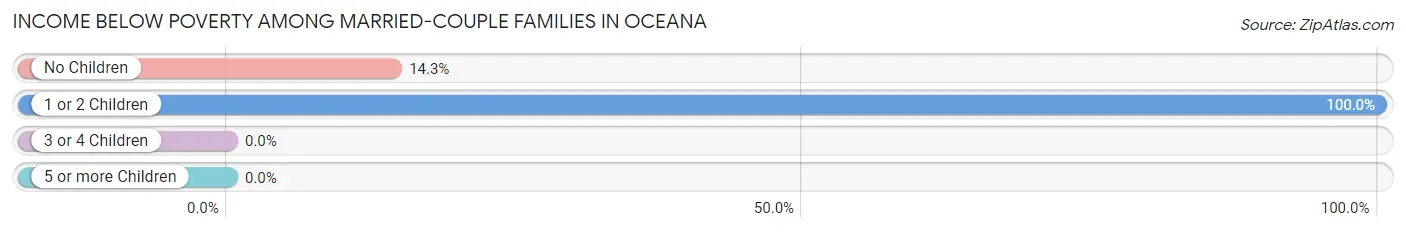
| Children | Above Poverty | Below Poverty |
| No Children | 168 (85.7%) | 28 (14.3%) |
| 1 or 2 Children | 0 (0.0%) | 9 (100.0%) |
| 3 or 4 Children | 0 (0.0%) | 0 (0.0%) |
| 5 or more Children | 0 (0.0%) | 0 (0.0%) |
| Total | 168 (82.0%) | 37 (18.0%) |
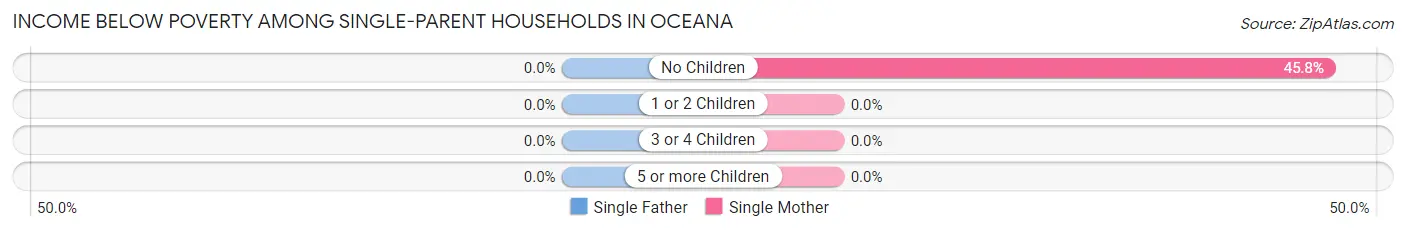
Income Below Poverty Among Single-Parent Households in Oceana
| Children | Single Father | Single Mother |
| No Children | 0 (0.0%) | 11 (45.8%) |
| 1 or 2 Children | 0 (0.0%) | 0 (0.0%) |
| 3 or 4 Children | 0 (0.0%) | 0 (0.0%) |
| 5 or more Children | 0 (0.0%) | 0 (0.0%) |
| Total | 0 (0.0%) | 11 (27.5%) |
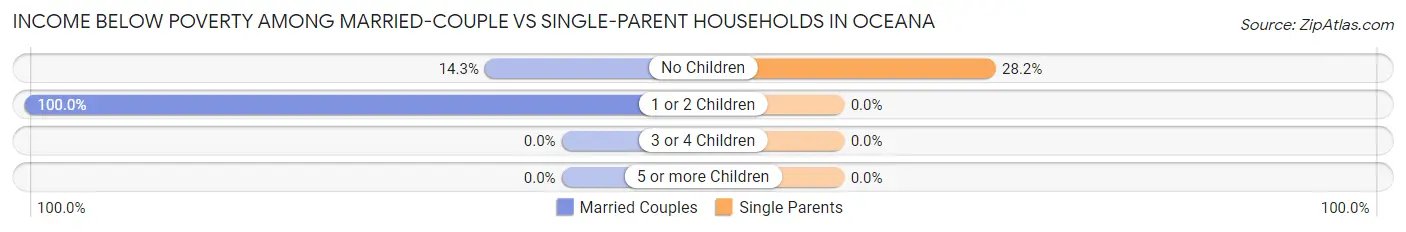
Income Below Poverty Among Married-Couple vs Single-Parent Households in Oceana
The poverty data for Oceana shows that 37 of the married-couple family households (18.0%) and 11 of the single-parent households (20.0%) are living below the poverty level. Within the married-couple family households, those with 1 or 2 children have the highest poverty rate, with 9 households (100.0%) falling below the poverty line. Among the single-parent households, those with no children have the highest poverty rate, with 11 household (28.2%) living below poverty.
| Children | Married-Couple Families | Single-Parent Households |
| No Children | 28 (14.3%) | 11 (28.2%) |
| 1 or 2 Children | 9 (100.0%) | 0 (0.0%) |
| 3 or 4 Children | 0 (0.0%) | 0 (0.0%) |
| 5 or more Children | 0 (0.0%) | 0 (0.0%) |
| Total | 37 (18.0%) | 11 (20.0%) |
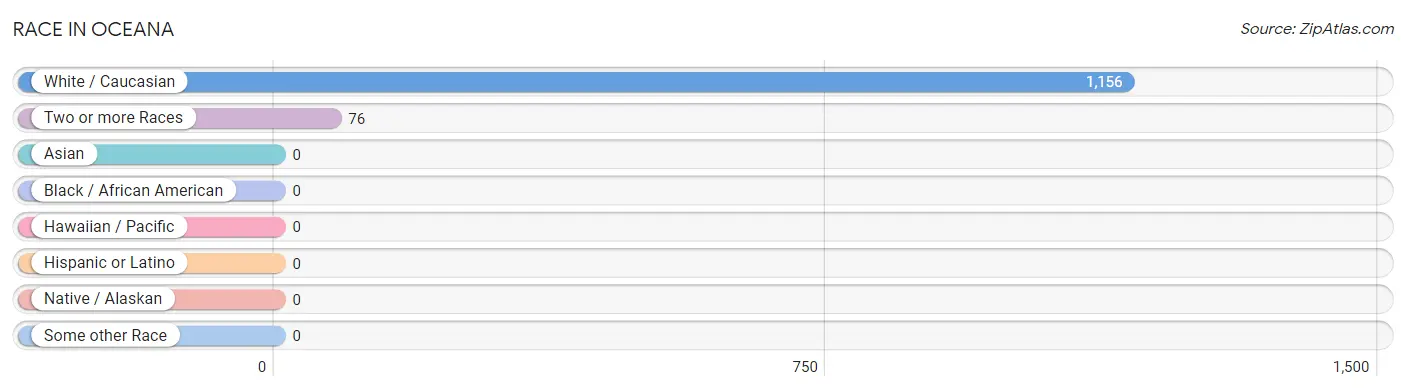
Race in Oceana
The most populous races in Oceana are White / Caucasian (1,156 | 93.8%), and Two or more Races (76 | 6.2%).
| Race | # Population | % Population |
| Asian | 0 | 0.0% |
| Black / African American | 0 | 0.0% |
| Hawaiian / Pacific | 0 | 0.0% |
| Hispanic or Latino | 0 | 0.0% |
| Native / Alaskan | 0 | 0.0% |
| White / Caucasian | 1,156 | 93.8% |
| Two or more Races | 76 | 6.2% |
| Some other Race | 0 | 0.0% |
| Total | 1,232 | 100.0% |
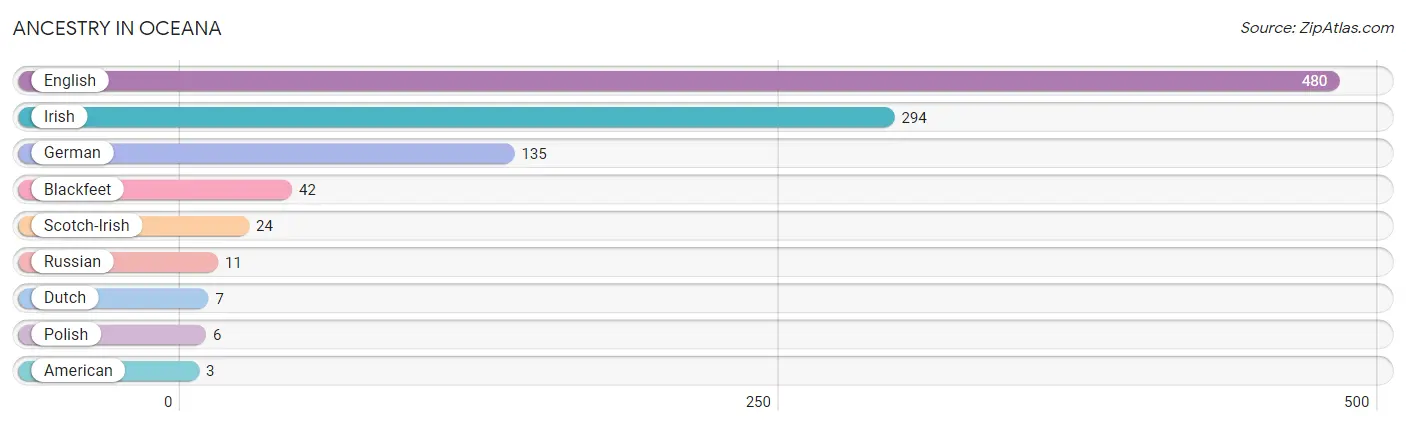
Ancestry in Oceana
The most populous ancestries reported in Oceana are English (480 | 39.0%), Irish (294 | 23.9%), German (135 | 11.0%), Blackfeet (42 | 3.4%), and Scotch-Irish (24 | 1.9%), together accounting for 79.1% of all Oceana residents.
| Ancestry | # Population | % Population |
| American | 3 | 0.2% |
| Blackfeet | 42 | 3.4% |
| Dutch | 7 | 0.6% |
| English | 480 | 39.0% |
| German | 135 | 11.0% |
| Irish | 294 | 23.9% |
| Polish | 6 | 0.5% |
| Russian | 11 | 0.9% |
| Scotch-Irish | 24 | 1.9% | View All 9 Rows |
Immigrants in Oceana

| Immigration Origin | # Population | % Population | View All 0 Rows |
Sex and Age in Oceana
Sex and Age in Oceana
The most populous age groups in Oceana are 20 to 24 Years (79 | 13.9%) for men and 35 to 39 Years (116 | 17.5%) for women.
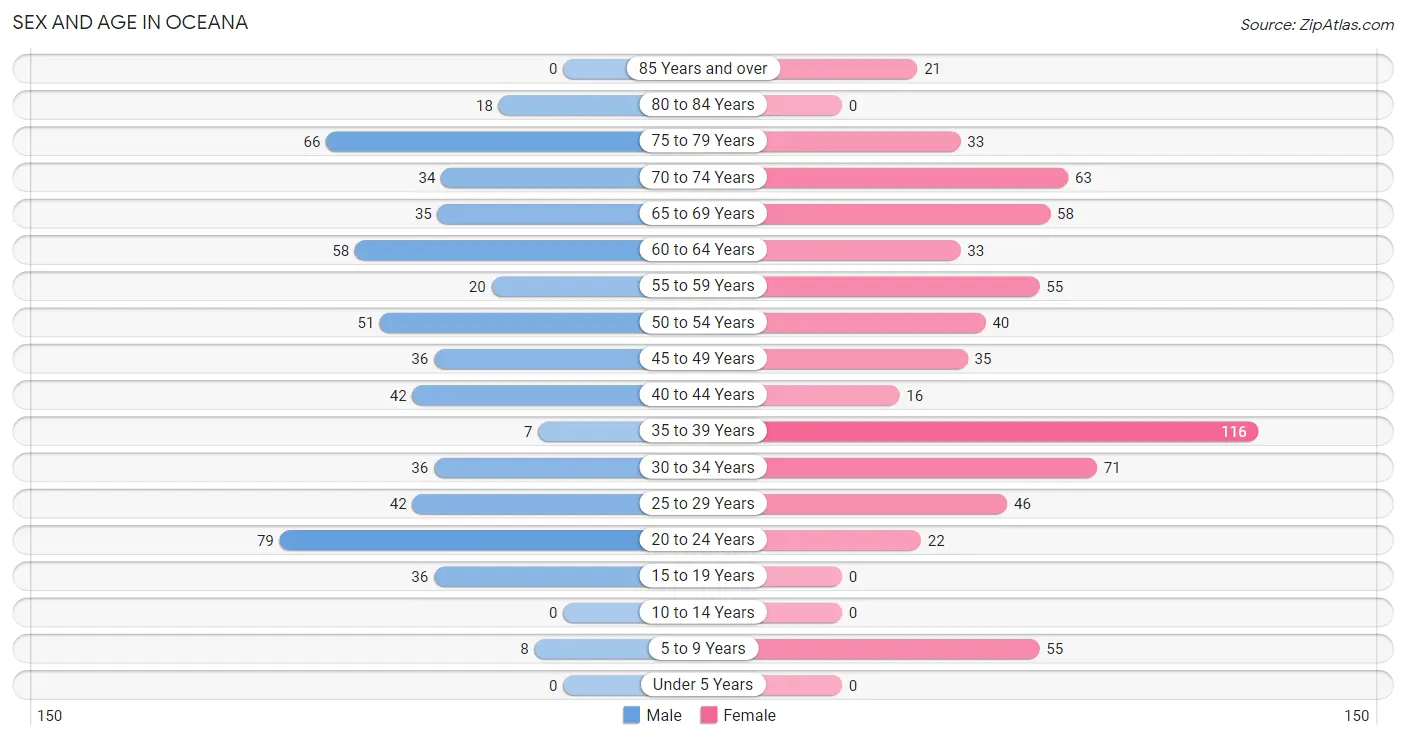
| Age Bracket | Male | Female |
| Under 5 Years | 0 (0.0%) | 0 (0.0%) |
| 5 to 9 Years | 8 (1.4%) | 55 (8.3%) |
| 10 to 14 Years | 0 (0.0%) | 0 (0.0%) |
| 15 to 19 Years | 36 (6.3%) | 0 (0.0%) |
| 20 to 24 Years | 79 (13.9%) | 22 (3.3%) |
| 25 to 29 Years | 42 (7.4%) | 46 (6.9%) |
| 30 to 34 Years | 36 (6.3%) | 71 (10.7%) |
| 35 to 39 Years | 7 (1.2%) | 116 (17.5%) |
| 40 to 44 Years | 42 (7.4%) | 16 (2.4%) |
| 45 to 49 Years | 36 (6.3%) | 35 (5.3%) |
| 50 to 54 Years | 51 (9.0%) | 40 (6.0%) |
| 55 to 59 Years | 20 (3.5%) | 55 (8.3%) |
| 60 to 64 Years | 58 (10.2%) | 33 (5.0%) |
| 65 to 69 Years | 35 (6.2%) | 58 (8.7%) |
| 70 to 74 Years | 34 (6.0%) | 63 (9.5%) |
| 75 to 79 Years | 66 (11.6%) | 33 (5.0%) |
| 80 to 84 Years | 18 (3.2%) | 0 (0.0%) |
| 85 Years and over | 0 (0.0%) | 21 (3.2%) |
| Total | 568 (100.0%) | 664 (100.0%) |
Families and Households in Oceana
Median Family Size in Oceana
The median family size in Oceana is 3.52 persons per family, with married-couple families (205 | 78.8%) accounting for the largest median family size of 3.63 persons per family. On the other hand, single male/father families (15 | 5.8%) represent the smallest median family size with 2.80 persons per family.
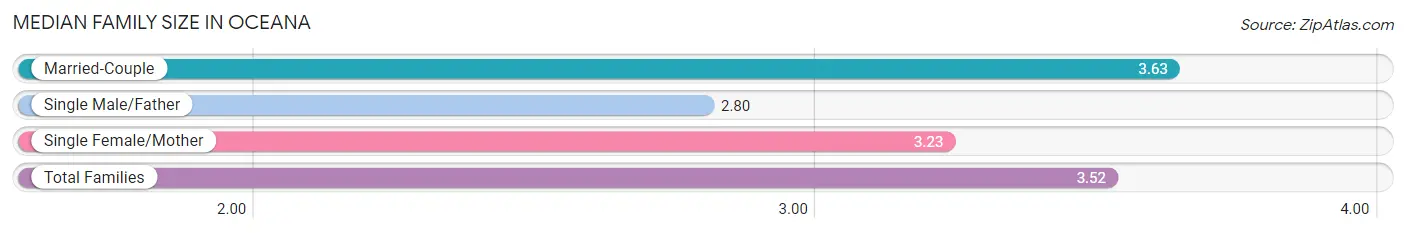
| Family Type | # Families | Family Size |
| Married-Couple | 205 (78.8%) | 3.63 |
| Single Male/Father | 15 (5.8%) | 2.80 |
| Single Female/Mother | 40 (15.4%) | 3.23 |
| Total Families | 260 (100.0%) | 3.52 |
Median Household Size in Oceana
The median household size in Oceana is 2.42 persons per household, with married-couple households (205 | 40.2%) accounting for the largest median household size of 3.63 persons per household. non-family households (250 | 49.0%) represent the smallest median household size with 1.24 persons per household.
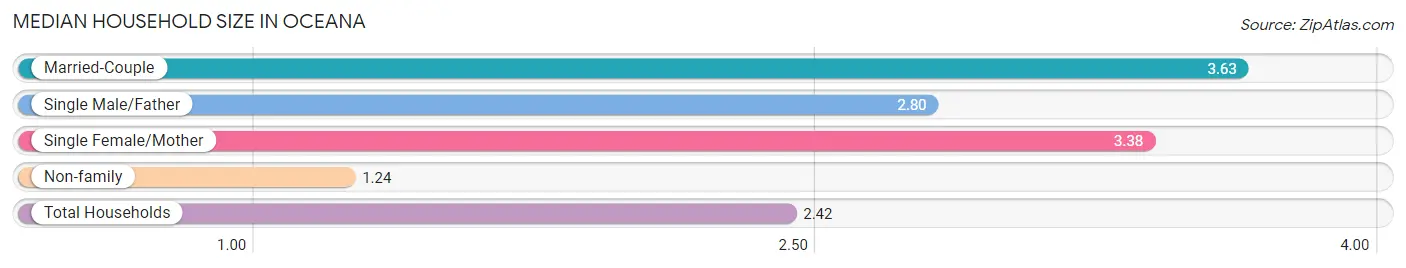
| Household Type | # Households | Household Size |
| Married-Couple | 205 (40.2%) | 3.63 |
| Single Male/Father | 15 (2.9%) | 2.80 |
| Single Female/Mother | 40 (7.8%) | 3.38 |
| Non-family | 250 (49.0%) | 1.24 |
| Total Households | 510 (100.0%) | 2.42 |
Household Size by Marriage Status in Oceana
Out of a total of 510 households in Oceana, 260 (51.0%) are family households, while 250 (49.0%) are nonfamily households. The most numerous type of family households are 2-person households, comprising 187, and the most common type of nonfamily households are 1-person households, comprising 236.
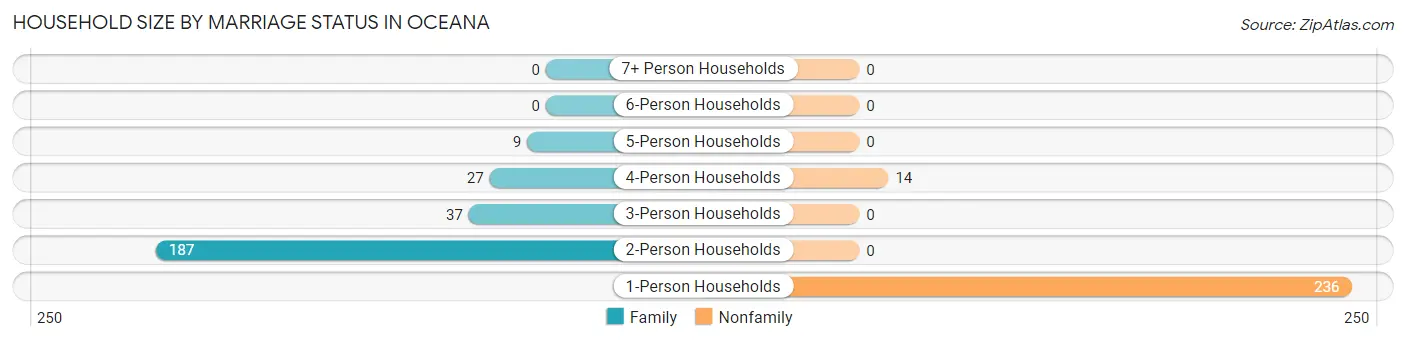
| Household Size | Family Households | Nonfamily Households |
| 1-Person Households | - | 236 (46.3%) |
| 2-Person Households | 187 (36.7%) | 0 (0.0%) |
| 3-Person Households | 37 (7.2%) | 0 (0.0%) |
| 4-Person Households | 27 (5.3%) | 14 (2.8%) |
| 5-Person Households | 9 (1.8%) | 0 (0.0%) |
| 6-Person Households | 0 (0.0%) | 0 (0.0%) |
| 7+ Person Households | 0 (0.0%) | 0 (0.0%) |
| Total | 260 (51.0%) | 250 (49.0%) |
Female Fertility in Oceana
Fertility by Age in Oceana
Average fertility rate in Oceana is 29.0 births per 1,000 women. Women in the age bracket of 20 to 34 years have the highest fertility rate with 65.0 births per 1,000 women. Women in the age bracket of 20 to 34 years acount for 100.0% of all women with births.
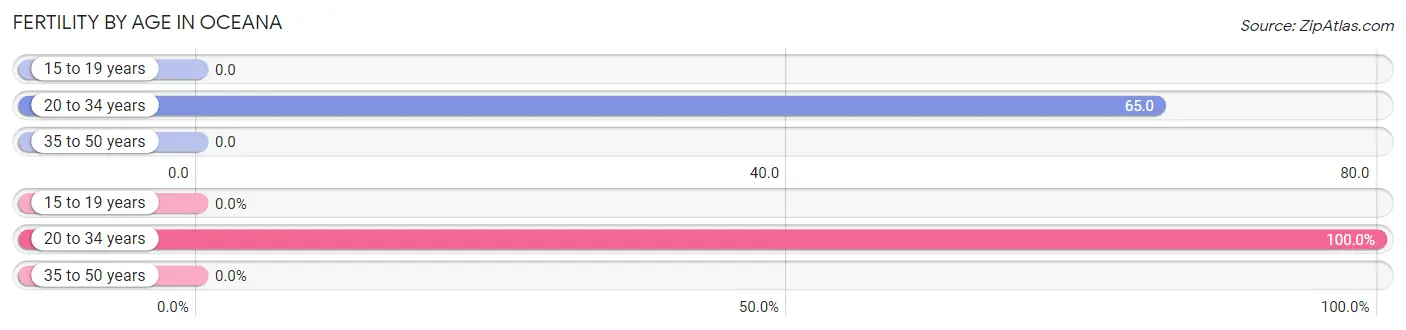
| Age Bracket | Women with Births | Births / 1,000 Women |
| 15 to 19 years | 0 (0.0%) | 0.0 |
| 20 to 34 years | 9 (100.0%) | 65.0 |
| 35 to 50 years | 0 (0.0%) | 0.0 |
| Total | 9 (100.0%) | 29.0 |
Fertility by Age by Marriage Status in Oceana
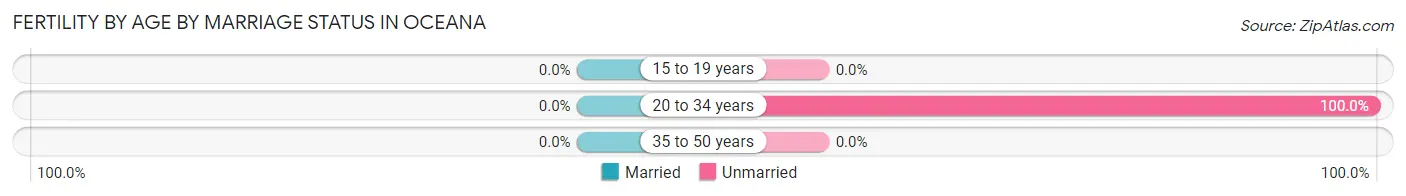
| Age Bracket | Married | Unmarried |
| 15 to 19 years | 0 (0.0%) | 0 (0.0%) |
| 20 to 34 years | 0 (0.0%) | 9 (100.0%) |
| 35 to 50 years | 0 (0.0%) | 0 (0.0%) |
| Total | 0 (0.0%) | 9 (100.0%) |
Fertility by Education in Oceana
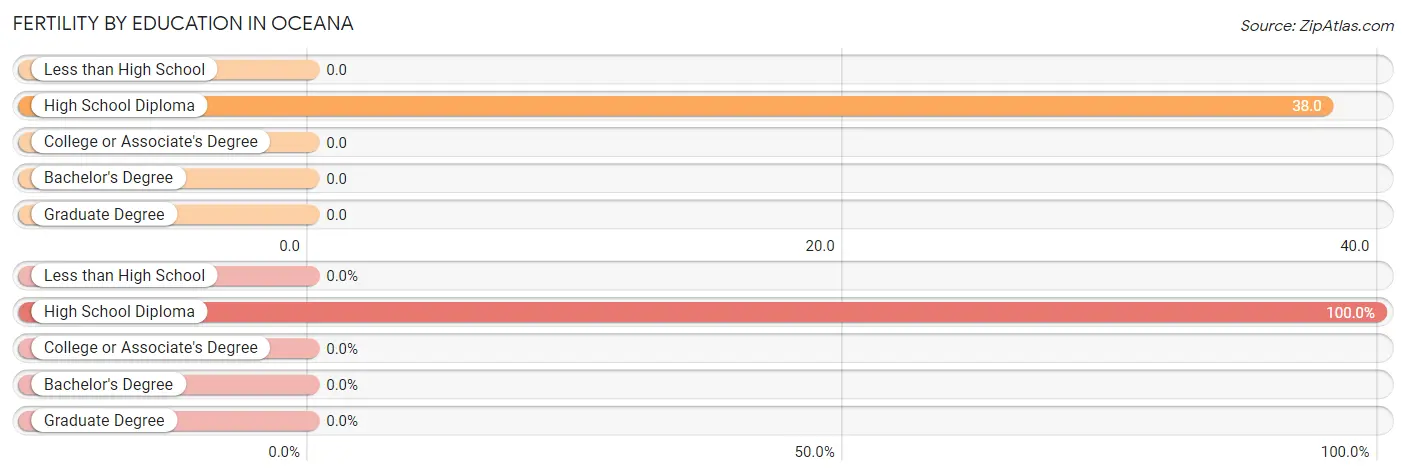
| Educational Attainment | Women with Births | Births / 1,000 Women |
| Less than High School | 0 (0.0%) | 0.0 |
| High School Diploma | 9 (100.0%) | 38.0 |
| College or Associate's Degree | 0 (0.0%) | 0.0 |
| Bachelor's Degree | 0 (0.0%) | 0.0 |
| Graduate Degree | 0 (0.0%) | 0.0 |
| Total | 9 (100.0%) | 29.0 |
Fertility by Education by Marriage Status in Oceana
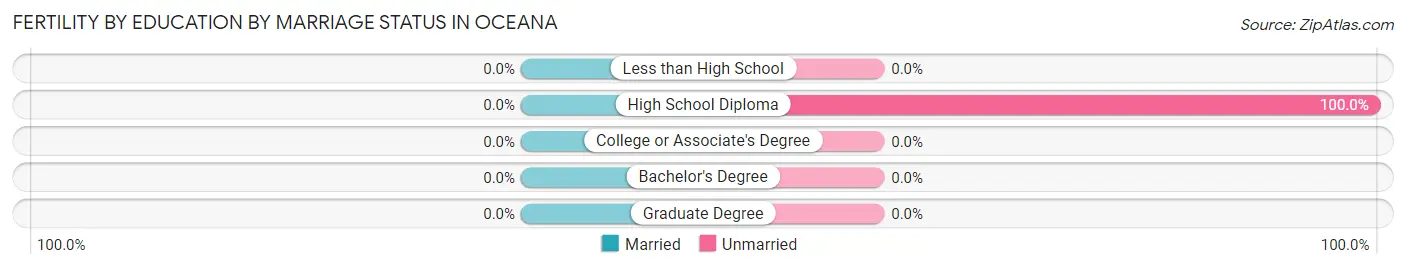
| Educational Attainment | Married | Unmarried |
| Less than High School | 0 (0.0%) | 0 (0.0%) |
| High School Diploma | 0 (0.0%) | 9 (100.0%) |
| College or Associate's Degree | 0 (0.0%) | 0 (0.0%) |
| Bachelor's Degree | 0 (0.0%) | 0 (0.0%) |
| Graduate Degree | 0 (0.0%) | 0 (0.0%) |
| Total | 0 (0.0%) | 9 (100.0%) |
Employment Characteristics in Oceana
Employment by Class of Employer in Oceana
Among the 432 employed individuals in Oceana, private company employees (271 | 62.7%), not-for-profit organizations (55 | 12.7%), and state government employees (45 | 10.4%) make up the most common classes of employment.
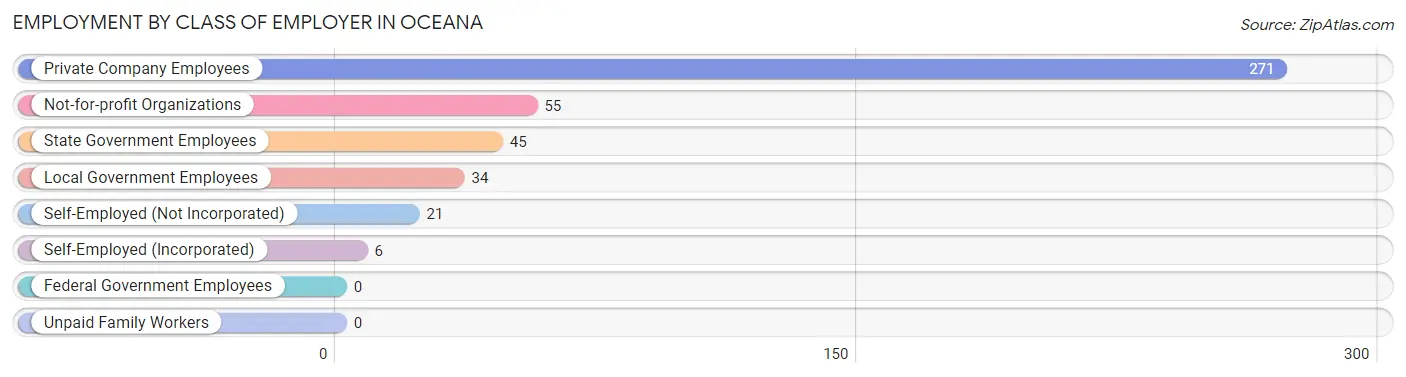
| Employer Class | # Employees | % Employees |
| Private Company Employees | 271 | 62.7% |
| Self-Employed (Incorporated) | 6 | 1.4% |
| Self-Employed (Not Incorporated) | 21 | 4.9% |
| Not-for-profit Organizations | 55 | 12.7% |
| Local Government Employees | 34 | 7.9% |
| State Government Employees | 45 | 10.4% |
| Federal Government Employees | 0 | 0.0% |
| Unpaid Family Workers | 0 | 0.0% |
| Total | 432 | 100.0% |
Employment Status by Age in Oceana
According to the labor force statistics for Oceana, out of the total population over 16 years of age (1,169), 41.1% or 480 individuals are in the labor force, with 7.5% or 36 of them unemployed. The age group with the highest labor force participation rate is 25 to 29 years, with 94.3% or 83 individuals in the labor force. Within the labor force, the 25 to 29 years age range has the highest percentage of unemployed individuals, with 25.3% or 21 of them being unemployed.
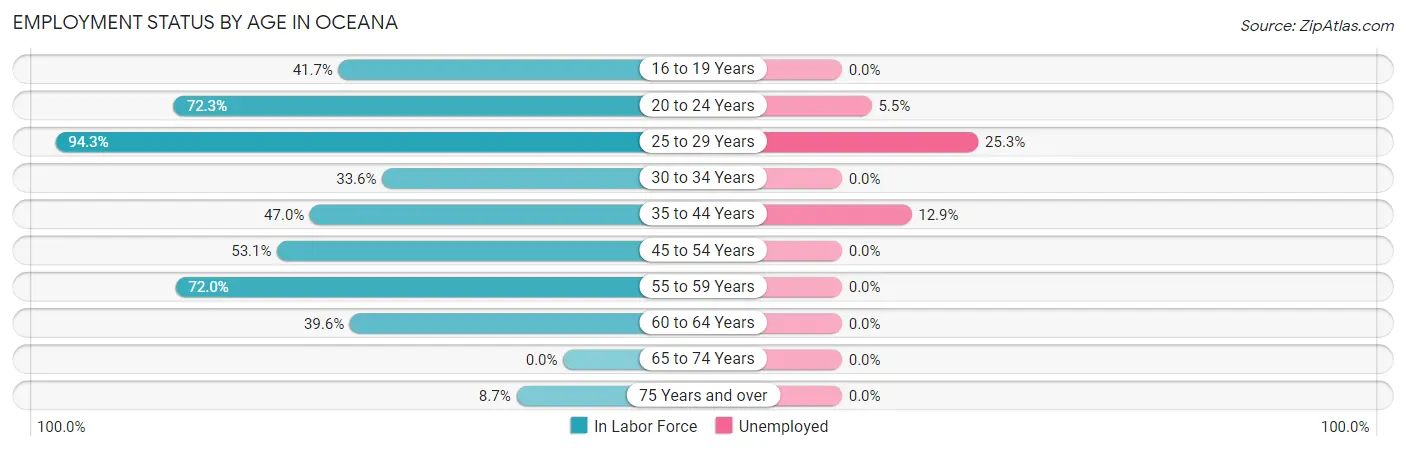
| Age Bracket | In Labor Force | Unemployed |
| 16 to 19 Years | 15 (41.7%) | 0 (0.0%) |
| 20 to 24 Years | 73 (72.3%) | 4 (5.5%) |
| 25 to 29 Years | 83 (94.3%) | 21 (25.3%) |
| 30 to 34 Years | 36 (33.6%) | 0 (0.0%) |
| 35 to 44 Years | 85 (47.0%) | 11 (12.9%) |
| 45 to 54 Years | 86 (53.1%) | 0 (0.0%) |
| 55 to 59 Years | 54 (72.0%) | 0 (0.0%) |
| 60 to 64 Years | 36 (39.6%) | 0 (0.0%) |
| 65 to 74 Years | 0 (0.0%) | 0 (0.0%) |
| 75 Years and over | 12 (8.7%) | 0 (0.0%) |
| Total | 480 (41.1%) | 36 (7.5%) |
Employment Status by Educational Attainment in Oceana
According to labor force statistics for Oceana, 54.0% of individuals (380) out of the total population between 25 and 64 years of age (704) are in the labor force, with 8.4% or 32 of them being unemployed. The group with the highest labor force participation rate are those with the educational attainment of bachelor's degree or higher, with 100.0% or 44 individuals in the labor force. Within the labor force, individuals with bachelor's degree or higher education have the highest percentage of unemployment, with 47.7% or 21 of them being unemployed.
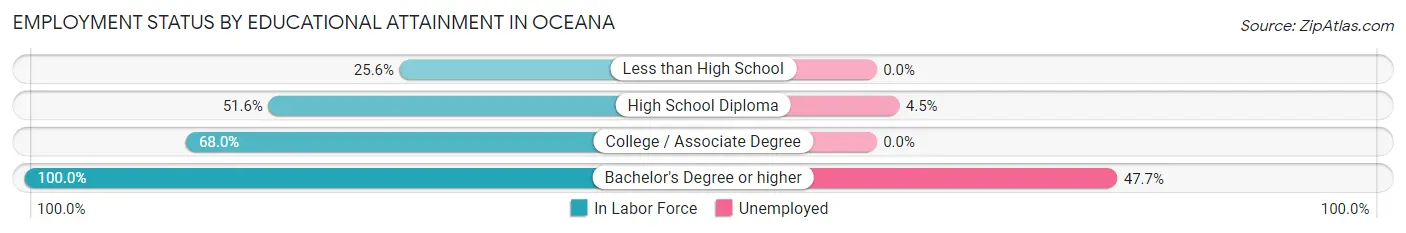
| Educational Attainment | In Labor Force | Unemployed |
| Less than High School | 21 (25.6%) | 0 (0.0%) |
| High School Diploma | 245 (51.6%) | 21 (4.5%) |
| College / Associate Degree | 70 (68.0%) | 0 (0.0%) |
| Bachelor's Degree or higher | 44 (100.0%) | 21 (47.7%) |
| Total | 380 (54.0%) | 59 (8.4%) |
Employment Occupations by Sex in Oceana
Management, Business, Science and Arts Occupations
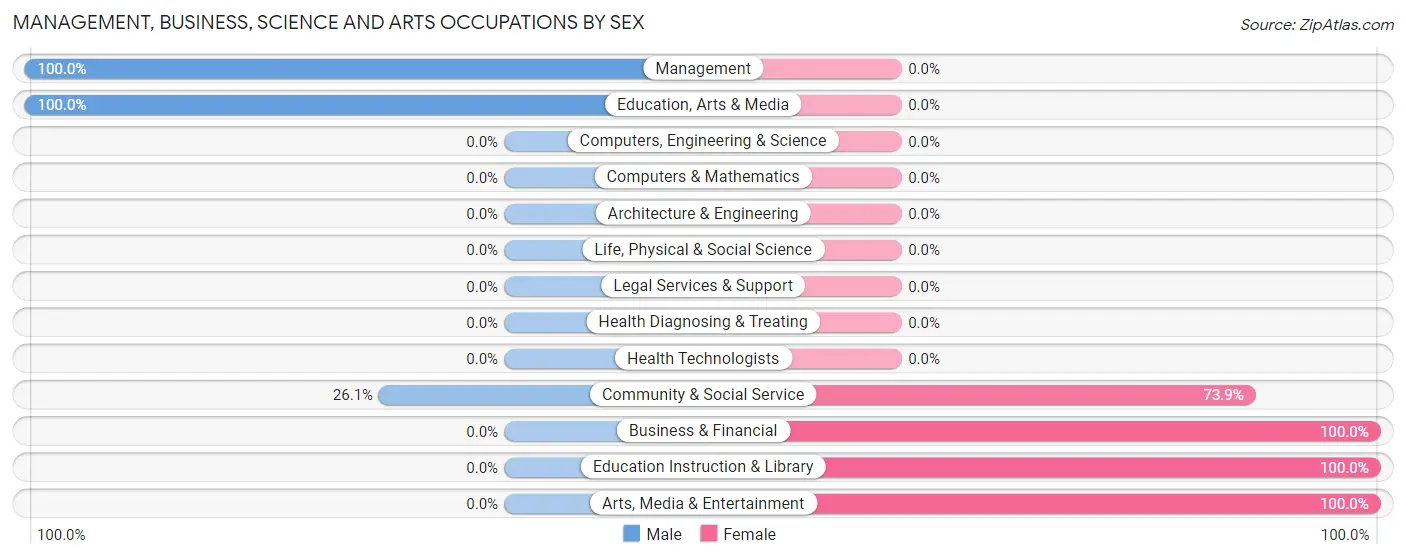
The most common Management, Business, Science and Arts occupations in Oceana are Community & Social Service (46 | 10.4%), Education Instruction & Library (23 | 5.2%), Management (16 | 3.6%), Education, Arts & Media (12 | 2.7%), and Arts, Media & Entertainment (11 | 2.5%).
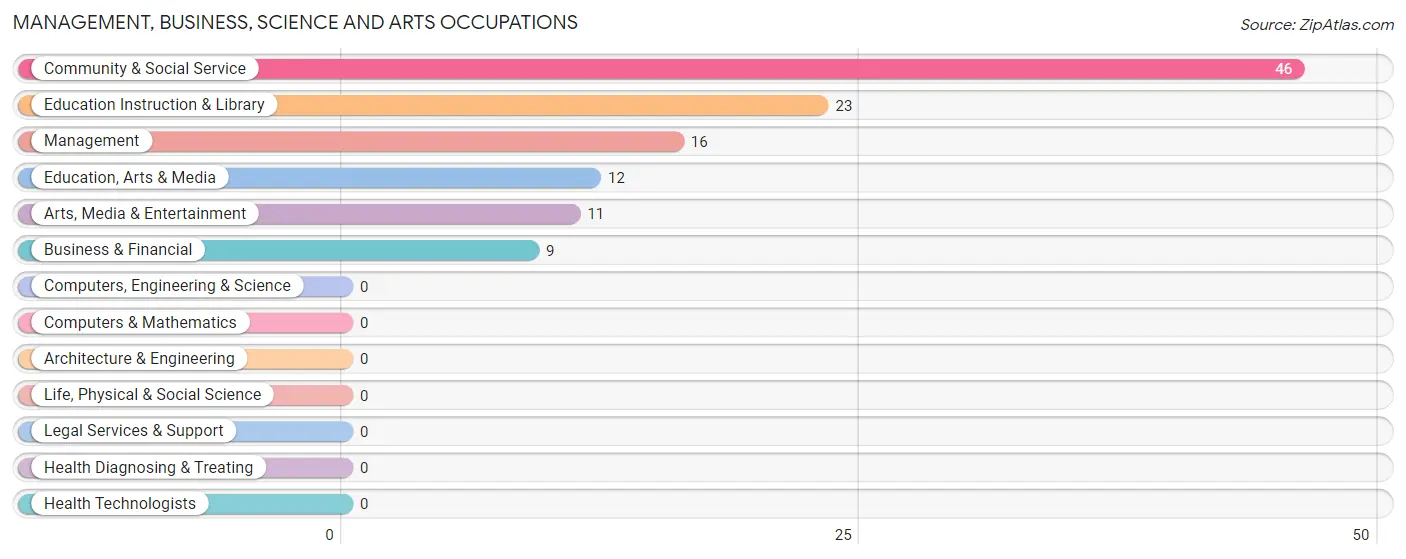
Management, Business, Science and Arts Occupations by Sex
Within the Management, Business, Science and Arts occupations in Oceana, the most male-oriented occupations are Management (100.0%), Education, Arts & Media (100.0%), and Community & Social Service (26.1%), while the most female-oriented occupations are Business & Financial (100.0%), Education Instruction & Library (100.0%), and Arts, Media & Entertainment (100.0%).
| Occupation | Male | Female |
| Management | 16 (100.0%) | 0 (0.0%) |
| Business & Financial | 0 (0.0%) | 9 (100.0%) |
| Computers, Engineering & Science | 0 (0.0%) | 0 (0.0%) |
| Computers & Mathematics | 0 (0.0%) | 0 (0.0%) |
| Architecture & Engineering | 0 (0.0%) | 0 (0.0%) |
| Life, Physical & Social Science | 0 (0.0%) | 0 (0.0%) |
| Community & Social Service | 12 (26.1%) | 34 (73.9%) |
| Education, Arts & Media | 12 (100.0%) | 0 (0.0%) |
| Legal Services & Support | 0 (0.0%) | 0 (0.0%) |
| Education Instruction & Library | 0 (0.0%) | 23 (100.0%) |
| Arts, Media & Entertainment | 0 (0.0%) | 11 (100.0%) |
| Health Diagnosing & Treating | 0 (0.0%) | 0 (0.0%) |
| Health Technologists | 0 (0.0%) | 0 (0.0%) |
| Total (Category) | 28 (39.4%) | 43 (60.6%) |
| Total (Overall) | 227 (51.1%) | 217 (48.9%) |
Services Occupations
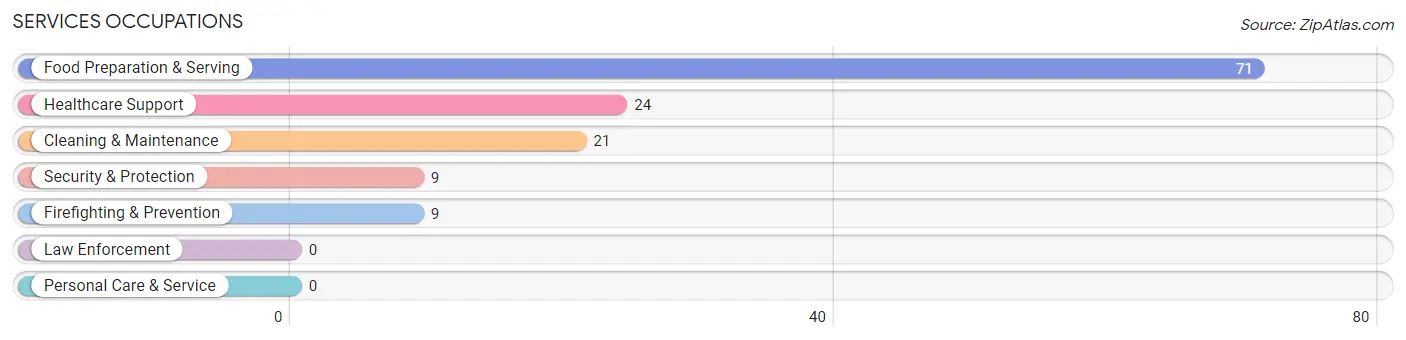
The most common Services occupations in Oceana are Food Preparation & Serving (71 | 16.0%), Healthcare Support (24 | 5.4%), Cleaning & Maintenance (21 | 4.7%), Security & Protection (9 | 2.0%), and Firefighting & Prevention (9 | 2.0%).
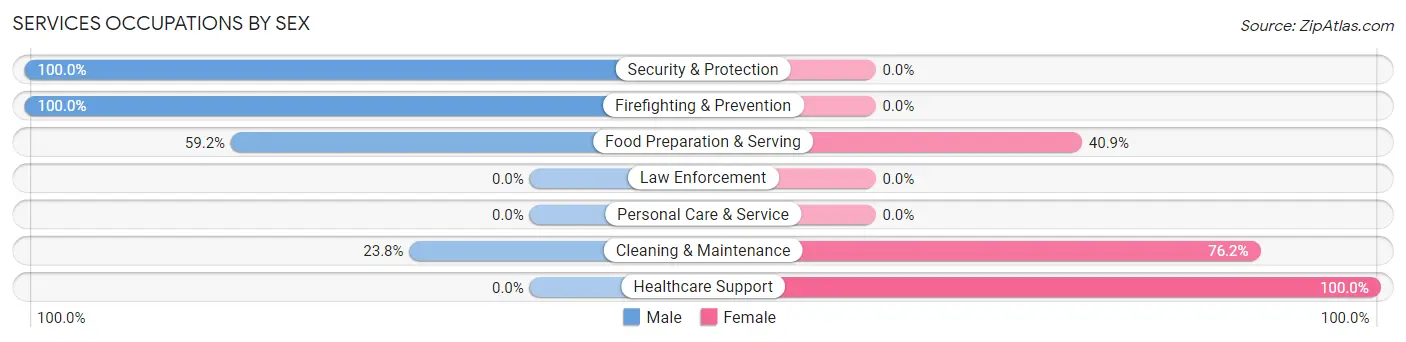
Services Occupations by Sex
Within the Services occupations in Oceana, the most male-oriented occupations are Security & Protection (100.0%), Firefighting & Prevention (100.0%), and Food Preparation & Serving (59.2%), while the most female-oriented occupations are Healthcare Support (100.0%), Cleaning & Maintenance (76.2%), and Food Preparation & Serving (40.8%).
| Occupation | Male | Female |
| Healthcare Support | 0 (0.0%) | 24 (100.0%) |
| Security & Protection | 9 (100.0%) | 0 (0.0%) |
| Firefighting & Prevention | 9 (100.0%) | 0 (0.0%) |
| Law Enforcement | 0 (0.0%) | 0 (0.0%) |
| Food Preparation & Serving | 42 (59.2%) | 29 (40.8%) |
| Cleaning & Maintenance | 5 (23.8%) | 16 (76.2%) |
| Personal Care & Service | 0 (0.0%) | 0 (0.0%) |
| Total (Category) | 56 (44.8%) | 69 (55.2%) |
| Total (Overall) | 227 (51.1%) | 217 (48.9%) |
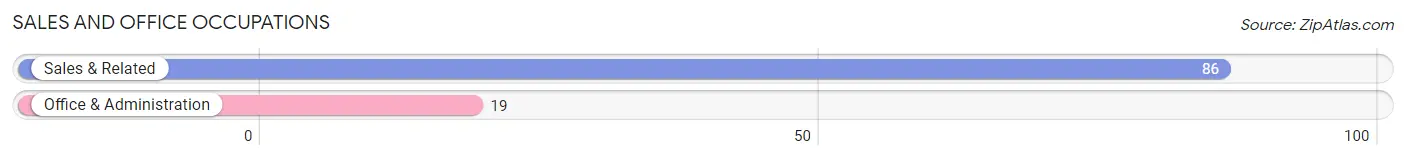
Sales and Office Occupations
The most common Sales and Office occupations in Oceana are Sales & Related (86 | 19.4%), and Office & Administration (19 | 4.3%).
Sales and Office Occupations by Sex
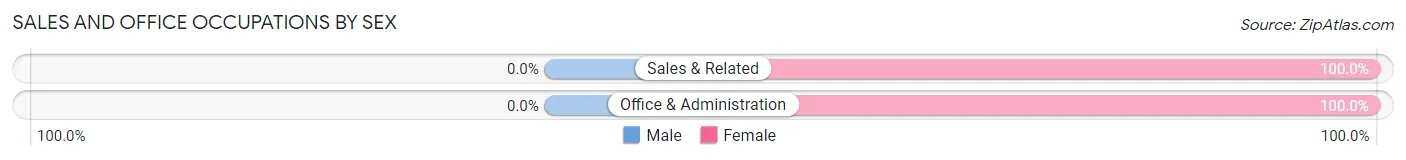
| Occupation | Male | Female |
| Sales & Related | 0 (0.0%) | 86 (100.0%) |
| Office & Administration | 0 (0.0%) | 19 (100.0%) |
| Total (Category) | 0 (0.0%) | 105 (100.0%) |
| Total (Overall) | 227 (51.1%) | 217 (48.9%) |
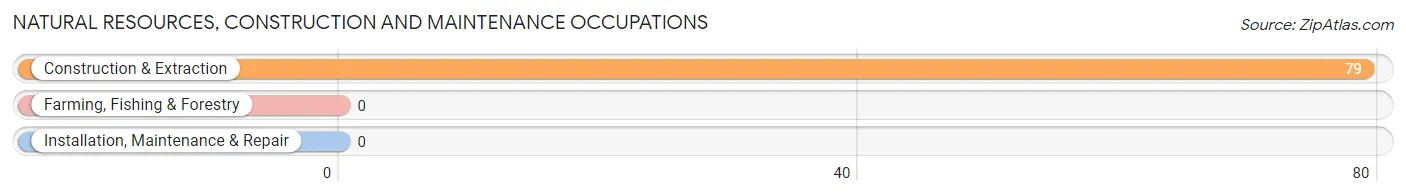
Natural Resources, Construction and Maintenance Occupations
The most common Natural Resources, Construction and Maintenance occupations in Oceana are , and Construction & Extraction (79 | 17.8%).
Natural Resources, Construction and Maintenance Occupations by Sex
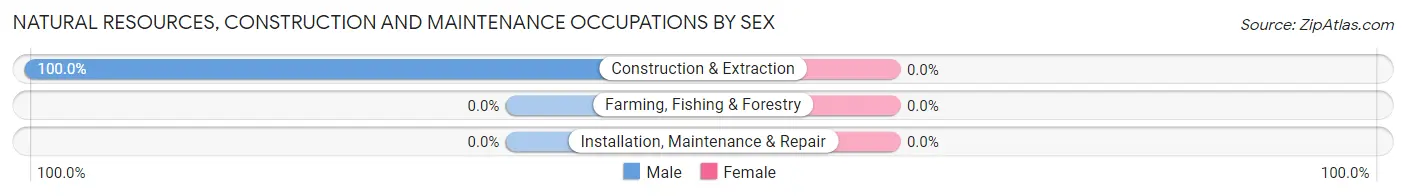
| Occupation | Male | Female |
| Farming, Fishing & Forestry | 0 (0.0%) | 0 (0.0%) |
| Construction & Extraction | 79 (100.0%) | 0 (0.0%) |
| Installation, Maintenance & Repair | 0 (0.0%) | 0 (0.0%) |
| Total (Category) | 79 (100.0%) | 0 (0.0%) |
| Total (Overall) | 227 (51.1%) | 217 (48.9%) |
Production, Transportation and Moving Occupations
The most common Production, Transportation and Moving occupations in Oceana are Material Moving (50 | 11.3%), Transportation (10 | 2.2%), and Production (4 | 0.9%).
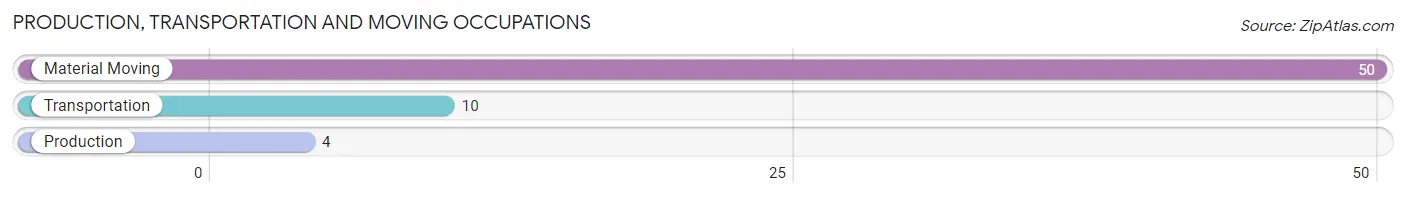
Production, Transportation and Moving Occupations by Sex
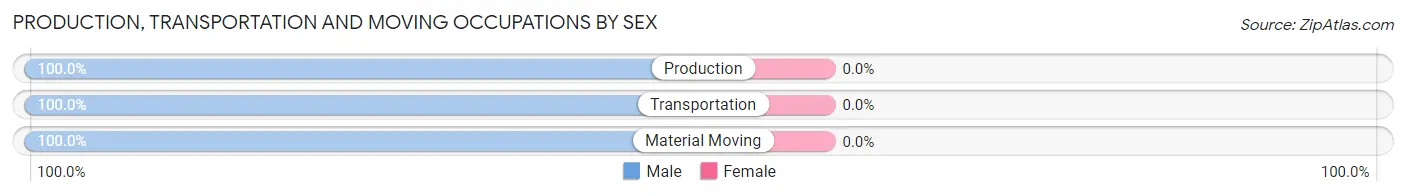
| Occupation | Male | Female |
| Production | 4 (100.0%) | 0 (0.0%) |
| Transportation | 10 (100.0%) | 0 (0.0%) |
| Material Moving | 50 (100.0%) | 0 (0.0%) |
| Total (Category) | 64 (100.0%) | 0 (0.0%) |
| Total (Overall) | 227 (51.1%) | 217 (48.9%) |
Employment Industries by Sex in Oceana
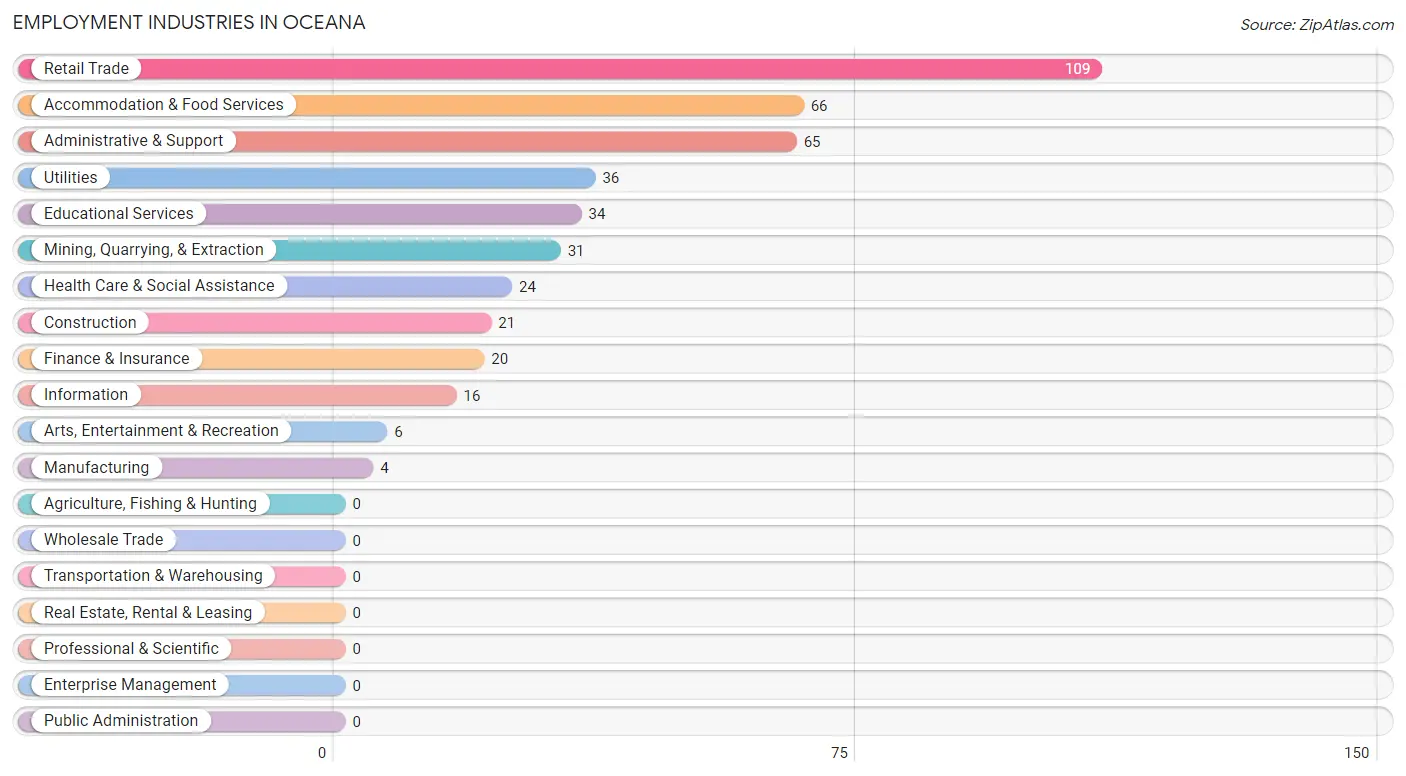
Employment Industries in Oceana
The major employment industries in Oceana include Retail Trade (109 | 24.5%), Accommodation & Food Services (66 | 14.9%), Administrative & Support (65 | 14.6%), Utilities (36 | 8.1%), and Educational Services (34 | 7.7%).
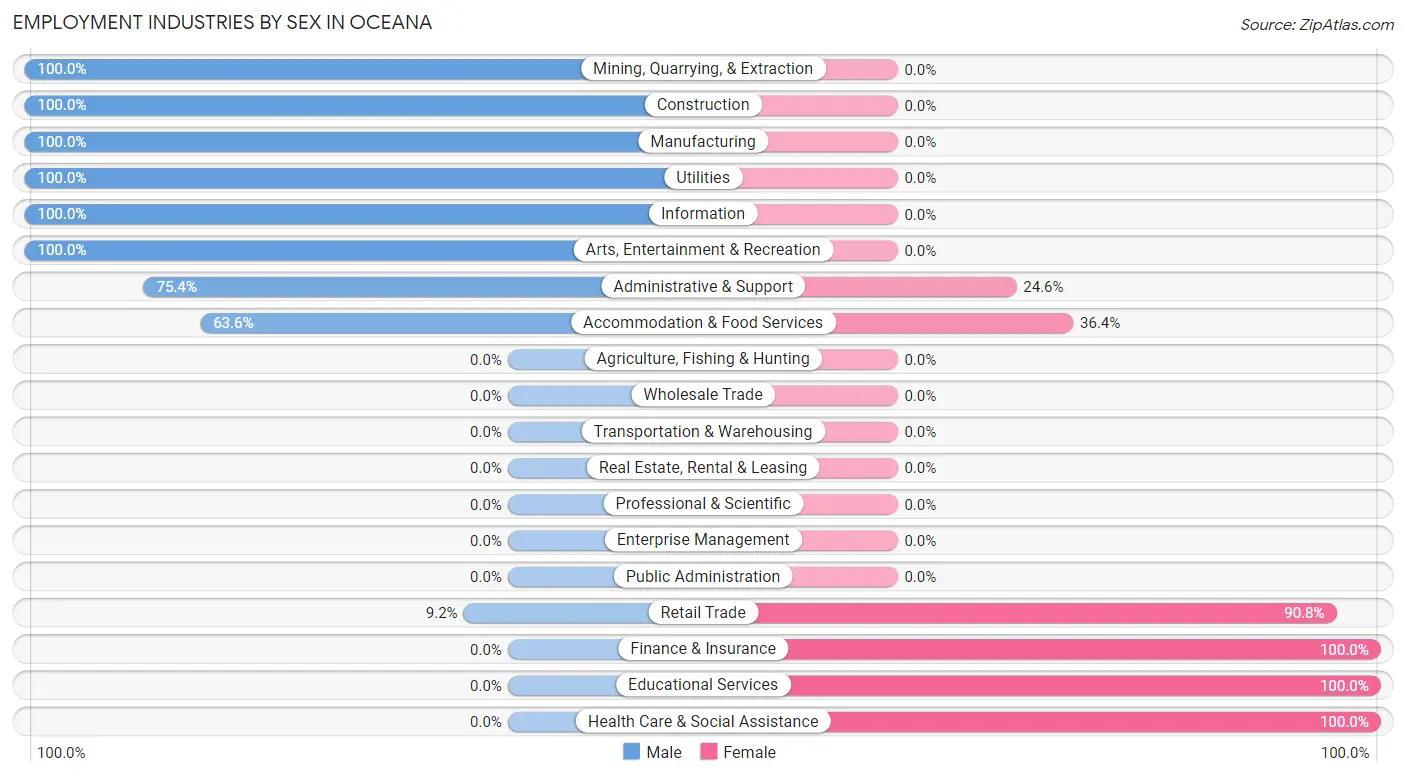
Employment Industries by Sex in Oceana
The Oceana industries that see more men than women are Mining, Quarrying, & Extraction (100.0%), Construction (100.0%), and Manufacturing (100.0%), whereas the industries that tend to have a higher number of women are Finance & Insurance (100.0%), Educational Services (100.0%), and Health Care & Social Assistance (100.0%).
| Industry | Male | Female |
| Agriculture, Fishing & Hunting | 0 (0.0%) | 0 (0.0%) |
| Mining, Quarrying, & Extraction | 31 (100.0%) | 0 (0.0%) |
| Construction | 21 (100.0%) | 0 (0.0%) |
| Manufacturing | 4 (100.0%) | 0 (0.0%) |
| Wholesale Trade | 0 (0.0%) | 0 (0.0%) |
| Retail Trade | 10 (9.2%) | 99 (90.8%) |
| Transportation & Warehousing | 0 (0.0%) | 0 (0.0%) |
| Utilities | 36 (100.0%) | 0 (0.0%) |
| Information | 16 (100.0%) | 0 (0.0%) |
| Finance & Insurance | 0 (0.0%) | 20 (100.0%) |
| Real Estate, Rental & Leasing | 0 (0.0%) | 0 (0.0%) |
| Professional & Scientific | 0 (0.0%) | 0 (0.0%) |
| Enterprise Management | 0 (0.0%) | 0 (0.0%) |
| Administrative & Support | 49 (75.4%) | 16 (24.6%) |
| Educational Services | 0 (0.0%) | 34 (100.0%) |
| Health Care & Social Assistance | 0 (0.0%) | 24 (100.0%) |
| Arts, Entertainment & Recreation | 6 (100.0%) | 0 (0.0%) |
| Accommodation & Food Services | 42 (63.6%) | 24 (36.4%) |
| Public Administration | 0 (0.0%) | 0 (0.0%) |
| Total | 227 (51.1%) | 217 (48.9%) |
Education in Oceana
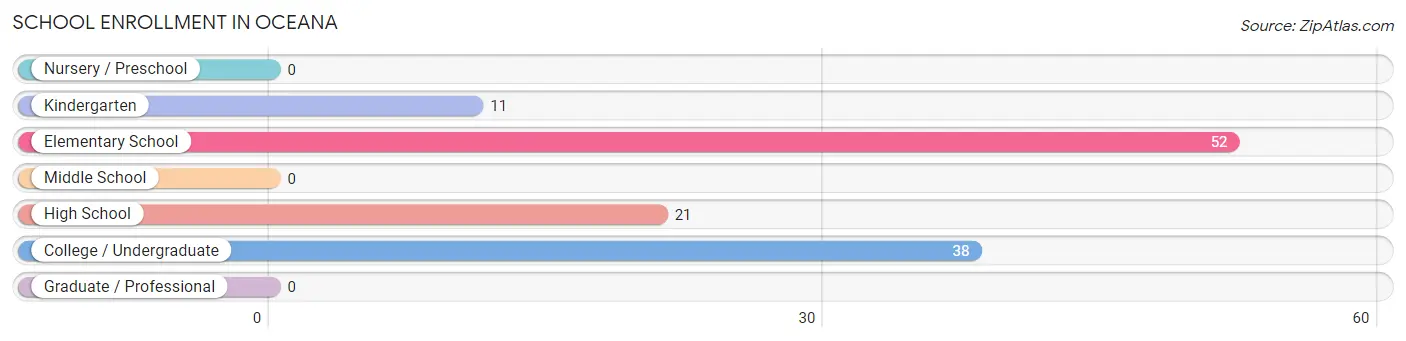
School Enrollment in Oceana
The most common levels of schooling among the 122 students in Oceana are elementary school (52 | 42.6%), college / undergraduate (38 | 31.1%), and high school (21 | 17.2%).
| School Level | # Students | % Students |
| Nursery / Preschool | 0 | 0.0% |
| Kindergarten | 11 | 9.0% |
| Elementary School | 52 | 42.6% |
| Middle School | 0 | 0.0% |
| High School | 21 | 17.2% |
| College / Undergraduate | 38 | 31.1% |
| Graduate / Professional | 0 | 0.0% |
| Total | 122 | 100.0% |
School Enrollment by Age by Funding Source in Oceana
Out of a total of 122 students who are enrolled in schools in Oceana, 28 (23.0%) attend a private institution, while the remaining 94 (77.0%) are enrolled in public schools. The age group of 20 to 24 year olds has the highest likelihood of being enrolled in private schools, with 28 (100.0% in the age bracket) enrolled. Conversely, the age group of 5 to 9 year old has the lowest likelihood of being enrolled in a private school, with 63 (100.0% in the age bracket) attending a public institution.
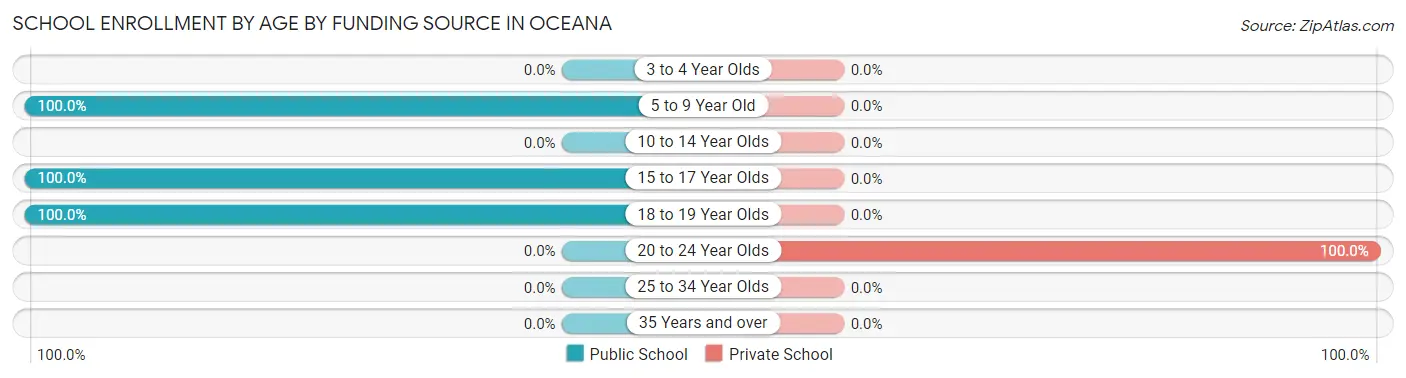
| Age Bracket | Public School | Private School |
| 3 to 4 Year Olds | 0 (0.0%) | 0 (0.0%) |
| 5 to 9 Year Old | 63 (100.0%) | 0 (0.0%) |
| 10 to 14 Year Olds | 0 (0.0%) | 0 (0.0%) |
| 15 to 17 Year Olds | 21 (100.0%) | 0 (0.0%) |
| 18 to 19 Year Olds | 10 (100.0%) | 0 (0.0%) |
| 20 to 24 Year Olds | 0 (0.0%) | 28 (100.0%) |
| 25 to 34 Year Olds | 0 (0.0%) | 0 (0.0%) |
| 35 Years and over | 0 (0.0%) | 0 (0.0%) |
| Total | 94 (77.0%) | 28 (23.0%) |
Educational Attainment by Field of Study in Oceana
Education (40 | 48.8%), business (21 | 25.6%), engineering (14 | 17.1%), and liberal arts & history (7 | 8.5%) are the most common fields of study among 82 individuals in Oceana who have obtained a bachelor's degree or higher.
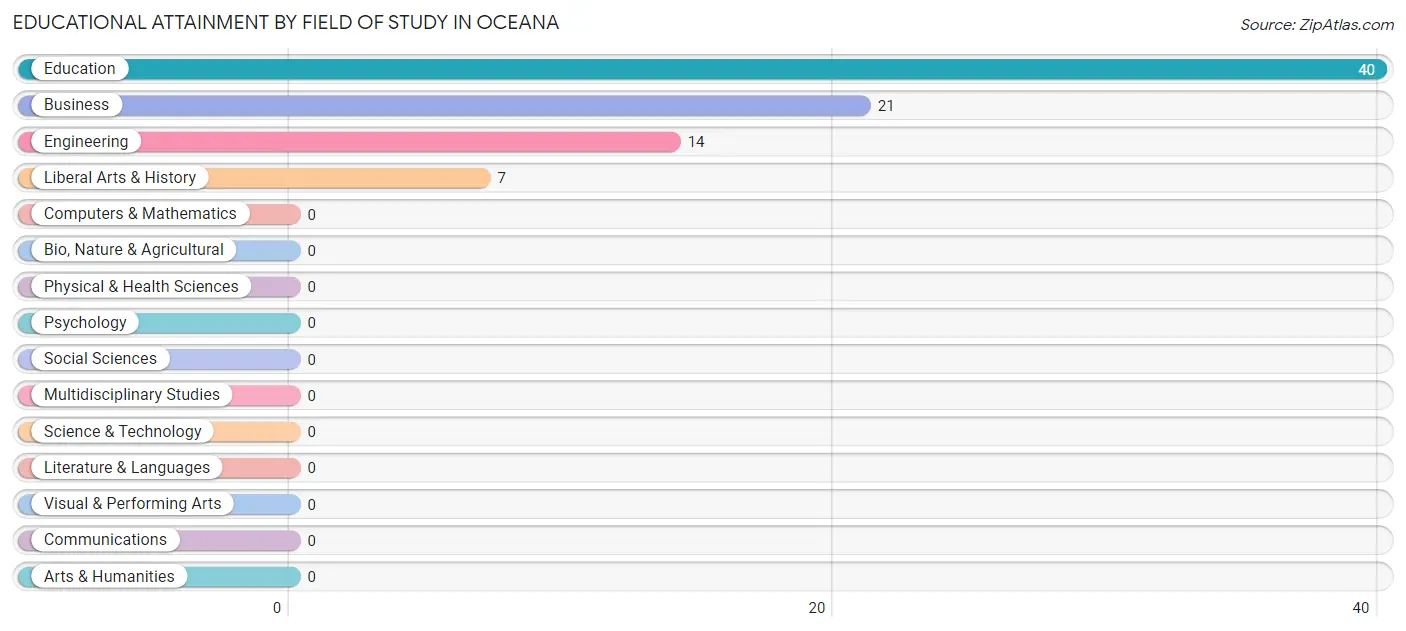
| Field of Study | # Graduates | % Graduates |
| Computers & Mathematics | 0 | 0.0% |
| Bio, Nature & Agricultural | 0 | 0.0% |
| Physical & Health Sciences | 0 | 0.0% |
| Psychology | 0 | 0.0% |
| Social Sciences | 0 | 0.0% |
| Engineering | 14 | 17.1% |
| Multidisciplinary Studies | 0 | 0.0% |
| Science & Technology | 0 | 0.0% |
| Business | 21 | 25.6% |
| Education | 40 | 48.8% |
| Literature & Languages | 0 | 0.0% |
| Liberal Arts & History | 7 | 8.5% |
| Visual & Performing Arts | 0 | 0.0% |
| Communications | 0 | 0.0% |
| Arts & Humanities | 0 | 0.0% |
| Total | 82 | 100.0% |
Transportation & Commute in Oceana
Vehicle Availability by Sex in Oceana
The most prevalent vehicle ownership categories in Oceana are males with 1 vehicle (72, accounting for 33.5%) and females with 1 vehicle (50, making up 33.2%).
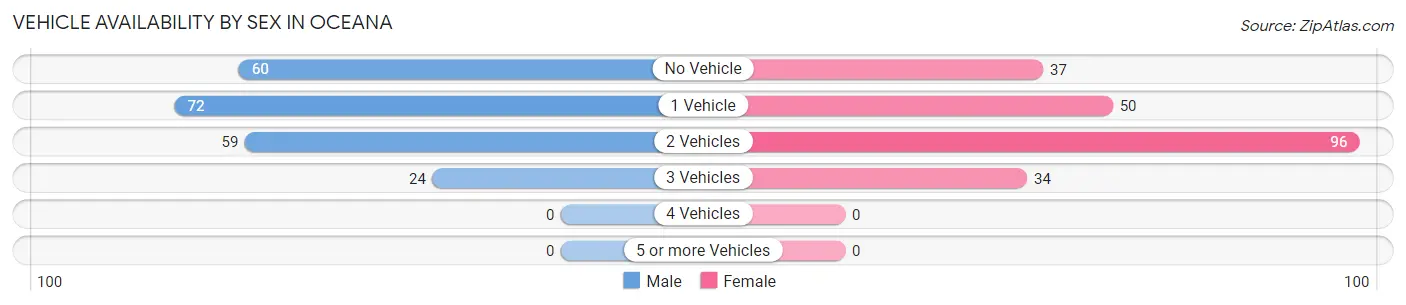
| Vehicles Available | Male | Female |
| No Vehicle | 60 (27.9%) | 37 (17.1%) |
| 1 Vehicle | 72 (33.5%) | 50 (23.0%) |
| 2 Vehicles | 59 (27.4%) | 96 (44.2%) |
| 3 Vehicles | 24 (11.2%) | 34 (15.7%) |
| 4 Vehicles | 0 (0.0%) | 0 (0.0%) |
| 5 or more Vehicles | 0 (0.0%) | 0 (0.0%) |
| Total | 215 (100.0%) | 217 (100.0%) |
Commute Time in Oceana
The most frequently occuring commute durations in Oceana are 5 to 9 minutes (115 commuters, 27.0%), 10 to 14 minutes (94 commuters, 22.1%), and 15 to 19 minutes (46 commuters, 10.8%).
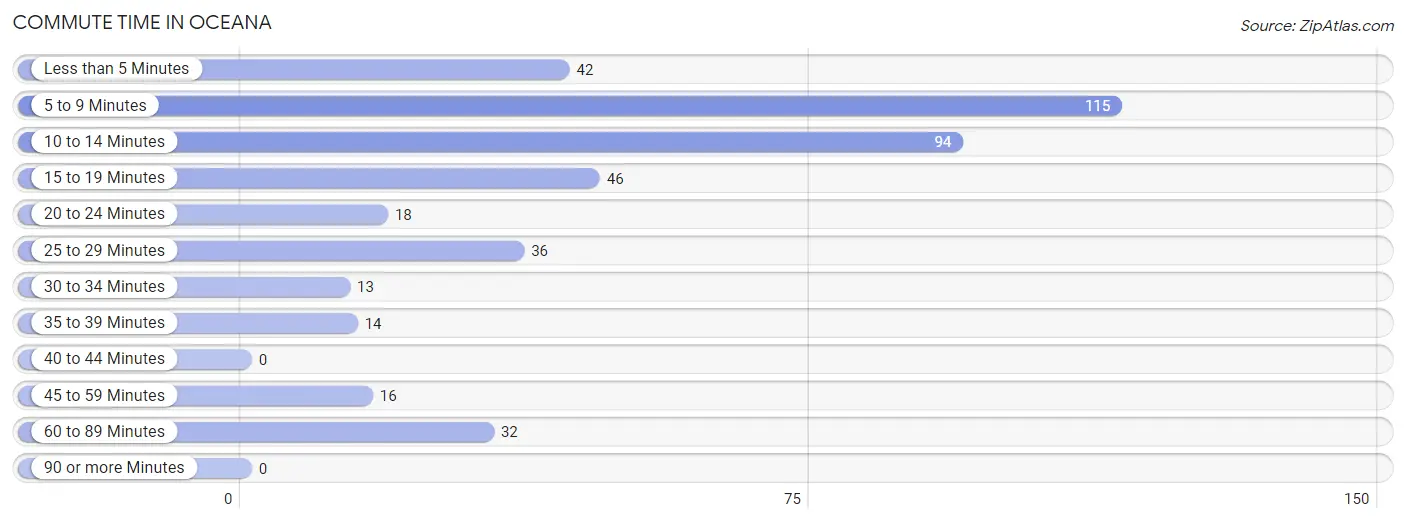
| Commute Time | # Commuters | % Commuters |
| Less than 5 Minutes | 42 | 9.9% |
| 5 to 9 Minutes | 115 | 27.0% |
| 10 to 14 Minutes | 94 | 22.1% |
| 15 to 19 Minutes | 46 | 10.8% |
| 20 to 24 Minutes | 18 | 4.2% |
| 25 to 29 Minutes | 36 | 8.5% |
| 30 to 34 Minutes | 13 | 3.0% |
| 35 to 39 Minutes | 14 | 3.3% |
| 40 to 44 Minutes | 0 | 0.0% |
| 45 to 59 Minutes | 16 | 3.8% |
| 60 to 89 Minutes | 32 | 7.5% |
| 90 or more Minutes | 0 | 0.0% |
Commute Time by Sex in Oceana
The most common commute times in Oceana are 10 to 14 minutes (49 commuters, 23.4%) for males and 5 to 9 minutes (73 commuters, 33.6%) for females.
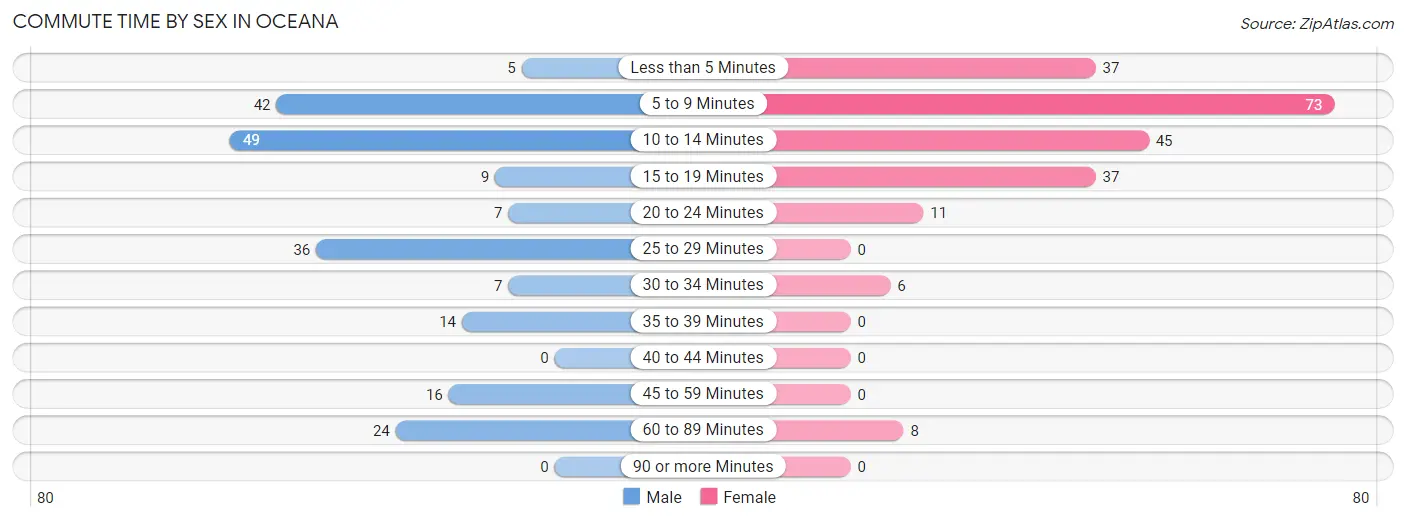
| Commute Time | Male | Female |
| Less than 5 Minutes | 5 (2.4%) | 37 (17.1%) |
| 5 to 9 Minutes | 42 (20.1%) | 73 (33.6%) |
| 10 to 14 Minutes | 49 (23.4%) | 45 (20.7%) |
| 15 to 19 Minutes | 9 (4.3%) | 37 (17.1%) |
| 20 to 24 Minutes | 7 (3.4%) | 11 (5.1%) |
| 25 to 29 Minutes | 36 (17.2%) | 0 (0.0%) |
| 30 to 34 Minutes | 7 (3.4%) | 6 (2.8%) |
| 35 to 39 Minutes | 14 (6.7%) | 0 (0.0%) |
| 40 to 44 Minutes | 0 (0.0%) | 0 (0.0%) |
| 45 to 59 Minutes | 16 (7.7%) | 0 (0.0%) |
| 60 to 89 Minutes | 24 (11.5%) | 8 (3.7%) |
| 90 or more Minutes | 0 (0.0%) | 0 (0.0%) |
Time of Departure to Work by Sex in Oceana
The most frequent times of departure to work in Oceana are 12:00 AM to 4:59 AM (73, 34.9%) for males and 8:00 AM to 8:29 AM (97, 44.7%) for females.
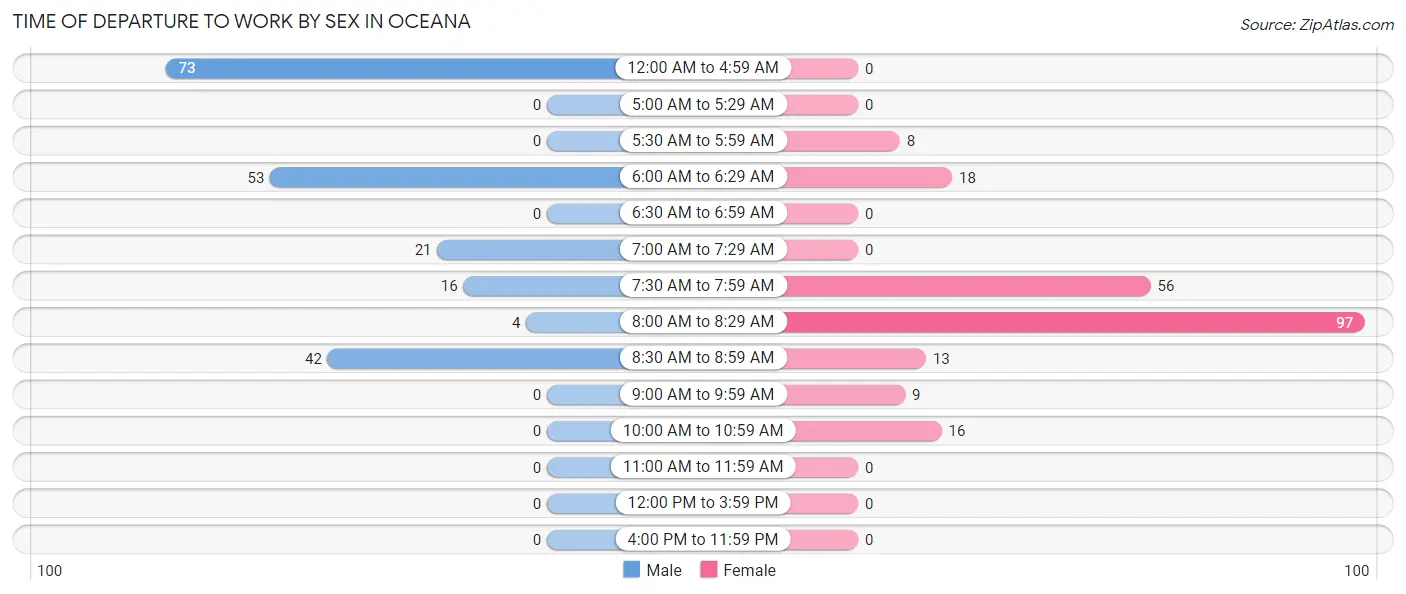
| Time of Departure | Male | Female |
| 12:00 AM to 4:59 AM | 73 (34.9%) | 0 (0.0%) |
| 5:00 AM to 5:29 AM | 0 (0.0%) | 0 (0.0%) |
| 5:30 AM to 5:59 AM | 0 (0.0%) | 8 (3.7%) |
| 6:00 AM to 6:29 AM | 53 (25.4%) | 18 (8.3%) |
| 6:30 AM to 6:59 AM | 0 (0.0%) | 0 (0.0%) |
| 7:00 AM to 7:29 AM | 21 (10.1%) | 0 (0.0%) |
| 7:30 AM to 7:59 AM | 16 (7.7%) | 56 (25.8%) |
| 8:00 AM to 8:29 AM | 4 (1.9%) | 97 (44.7%) |
| 8:30 AM to 8:59 AM | 42 (20.1%) | 13 (6.0%) |
| 9:00 AM to 9:59 AM | 0 (0.0%) | 9 (4.2%) |
| 10:00 AM to 10:59 AM | 0 (0.0%) | 16 (7.4%) |
| 11:00 AM to 11:59 AM | 0 (0.0%) | 0 (0.0%) |
| 12:00 PM to 3:59 PM | 0 (0.0%) | 0 (0.0%) |
| 4:00 PM to 11:59 PM | 0 (0.0%) | 0 (0.0%) |
| Total | 209 (100.0%) | 217 (100.0%) |
Housing Occupancy in Oceana
Occupancy by Ownership in Oceana
Of the total 510 dwellings in Oceana, owner-occupied units account for 369 (72.4%), while renter-occupied units make up 141 (27.7%).
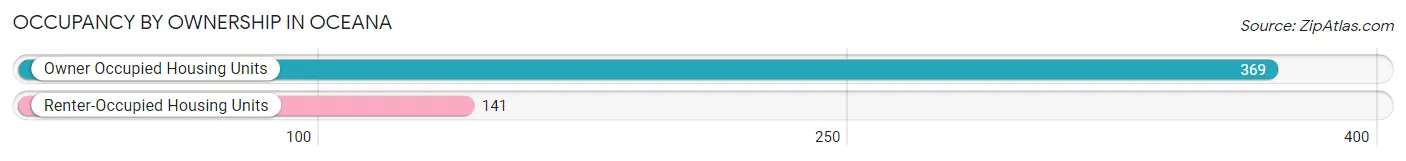
| Occupancy | # Housing Units | % Housing Units |
| Owner Occupied Housing Units | 369 | 72.4% |
| Renter-Occupied Housing Units | 141 | 27.7% |
| Total Occupied Housing Units | 510 | 100.0% |
Occupancy by Household Size in Oceana
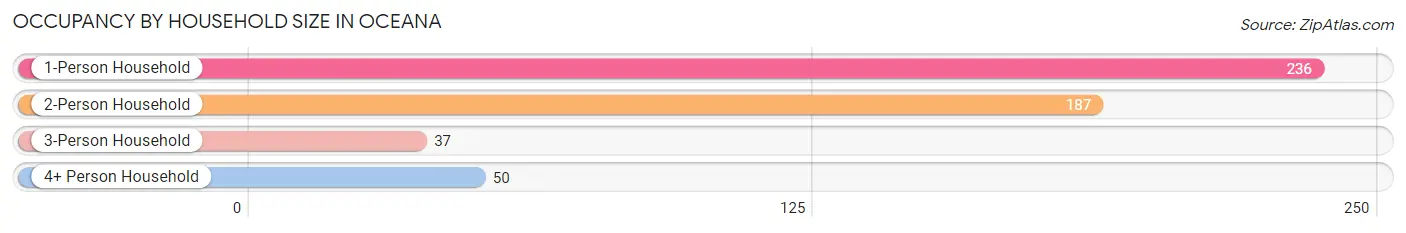
| Household Size | # Housing Units | % Housing Units |
| 1-Person Household | 236 | 46.3% |
| 2-Person Household | 187 | 36.7% |
| 3-Person Household | 37 | 7.2% |
| 4+ Person Household | 50 | 9.8% |
| Total Housing Units | 510 | 100.0% |
Occupancy by Ownership by Household Size in Oceana
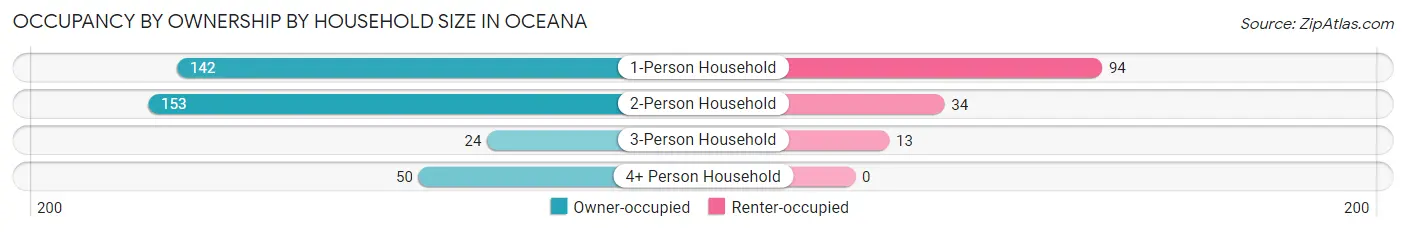
| Household Size | Owner-occupied | Renter-occupied |
| 1-Person Household | 142 (60.2%) | 94 (39.8%) |
| 2-Person Household | 153 (81.8%) | 34 (18.2%) |
| 3-Person Household | 24 (64.9%) | 13 (35.1%) |
| 4+ Person Household | 50 (100.0%) | 0 (0.0%) |
| Total Housing Units | 369 (72.4%) | 141 (27.7%) |
Occupancy by Educational Attainment in Oceana
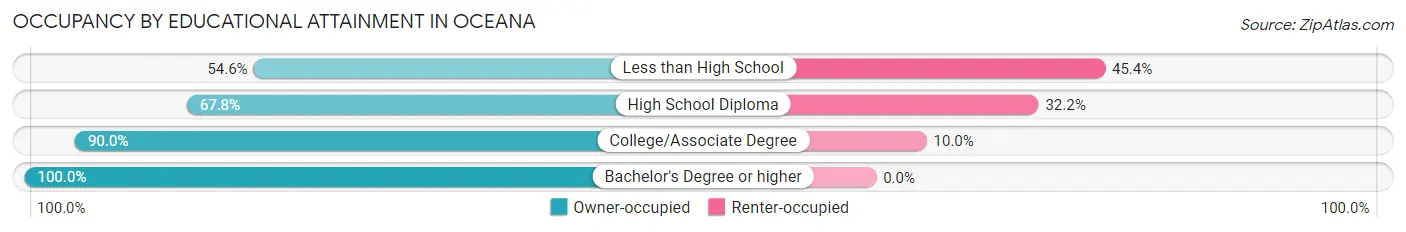
| Household Size | Owner-occupied | Renter-occupied |
| Less than High School | 59 (54.6%) | 49 (45.4%) |
| High School Diploma | 177 (67.8%) | 84 (32.2%) |
| College/Associate Degree | 72 (90.0%) | 8 (10.0%) |
| Bachelor's Degree or higher | 61 (100.0%) | 0 (0.0%) |
Occupancy by Age of Householder in Oceana
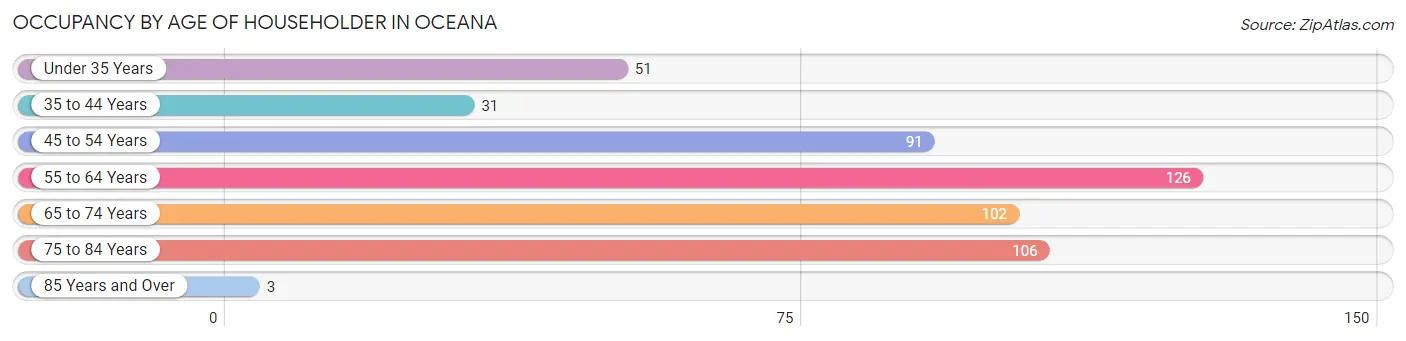
| Age Bracket | # Households | % Households |
| Under 35 Years | 51 | 10.0% |
| 35 to 44 Years | 31 | 6.1% |
| 45 to 54 Years | 91 | 17.8% |
| 55 to 64 Years | 126 | 24.7% |
| 65 to 74 Years | 102 | 20.0% |
| 75 to 84 Years | 106 | 20.8% |
| 85 Years and Over | 3 | 0.6% |
| Total | 510 | 100.0% |
Housing Finances in Oceana
Median Income by Occupancy in Oceana
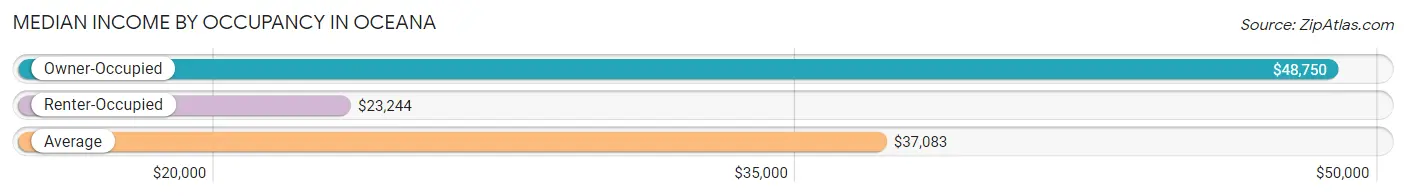
| Occupancy Type | # Households | Median Income |
| Owner-Occupied | 369 (72.4%) | $48,750 |
| Renter-Occupied | 141 (27.7%) | $23,244 |
| Average | 510 (100.0%) | $37,083 |
Occupancy by Householder Income Bracket in Oceana
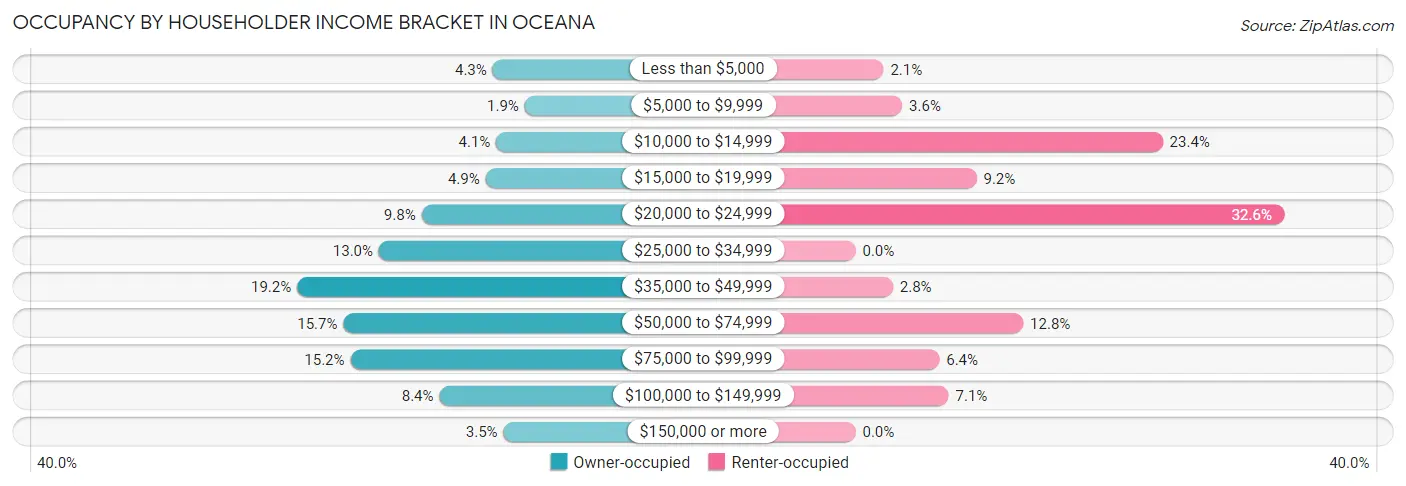
| Income Bracket | Owner-occupied | Renter-occupied |
| Less than $5,000 | 16 (4.3%) | 3 (2.1%) |
| $5,000 to $9,999 | 7 (1.9%) | 5 (3.5%) |
| $10,000 to $14,999 | 15 (4.1%) | 33 (23.4%) |
| $15,000 to $19,999 | 18 (4.9%) | 13 (9.2%) |
| $20,000 to $24,999 | 36 (9.8%) | 46 (32.6%) |
| $25,000 to $34,999 | 48 (13.0%) | 0 (0.0%) |
| $35,000 to $49,999 | 71 (19.2%) | 4 (2.8%) |
| $50,000 to $74,999 | 58 (15.7%) | 18 (12.8%) |
| $75,000 to $99,999 | 56 (15.2%) | 9 (6.4%) |
| $100,000 to $149,999 | 31 (8.4%) | 10 (7.1%) |
| $150,000 or more | 13 (3.5%) | 0 (0.0%) |
| Total | 369 (100.0%) | 141 (100.0%) |
Monthly Housing Cost Tiers in Oceana
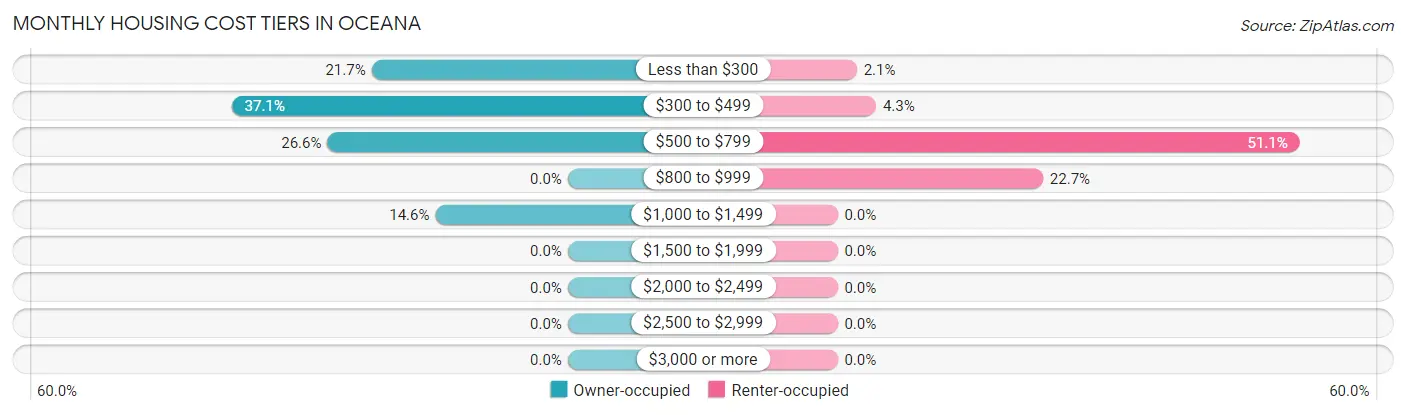
| Monthly Cost | Owner-occupied | Renter-occupied |
| Less than $300 | 80 (21.7%) | 3 (2.1%) |
| $300 to $499 | 137 (37.1%) | 6 (4.3%) |
| $500 to $799 | 98 (26.6%) | 72 (51.1%) |
| $800 to $999 | 0 (0.0%) | 32 (22.7%) |
| $1,000 to $1,499 | 54 (14.6%) | 0 (0.0%) |
| $1,500 to $1,999 | 0 (0.0%) | 0 (0.0%) |
| $2,000 to $2,499 | 0 (0.0%) | 0 (0.0%) |
| $2,500 to $2,999 | 0 (0.0%) | 0 (0.0%) |
| $3,000 or more | 0 (0.0%) | 0 (0.0%) |
| Total | 369 (100.0%) | 141 (100.0%) |
Physical Housing Characteristics in Oceana
Housing Structures in Oceana
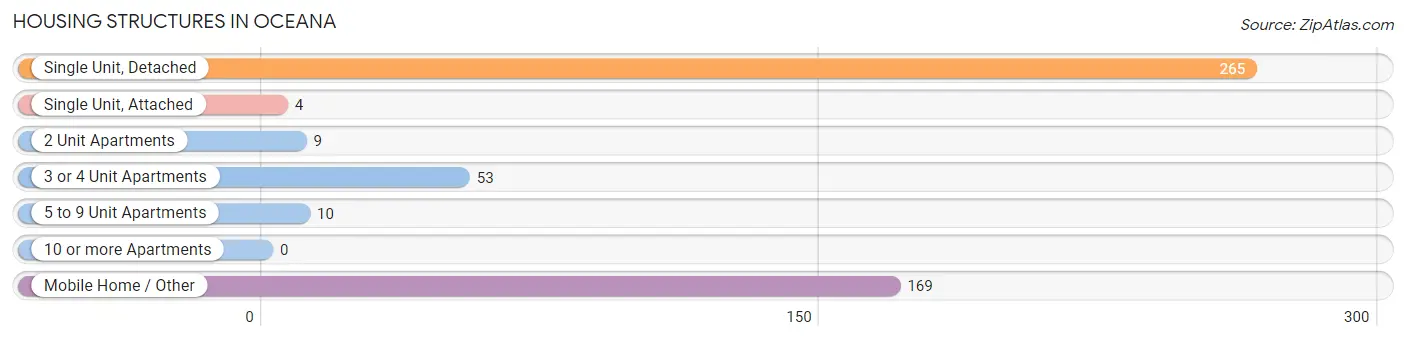
| Structure Type | # Housing Units | % Housing Units |
| Single Unit, Detached | 265 | 52.0% |
| Single Unit, Attached | 4 | 0.8% |
| 2 Unit Apartments | 9 | 1.8% |
| 3 or 4 Unit Apartments | 53 | 10.4% |
| 5 to 9 Unit Apartments | 10 | 2.0% |
| 10 or more Apartments | 0 | 0.0% |
| Mobile Home / Other | 169 | 33.1% |
| Total | 510 | 100.0% |
Housing Structures by Occupancy in Oceana
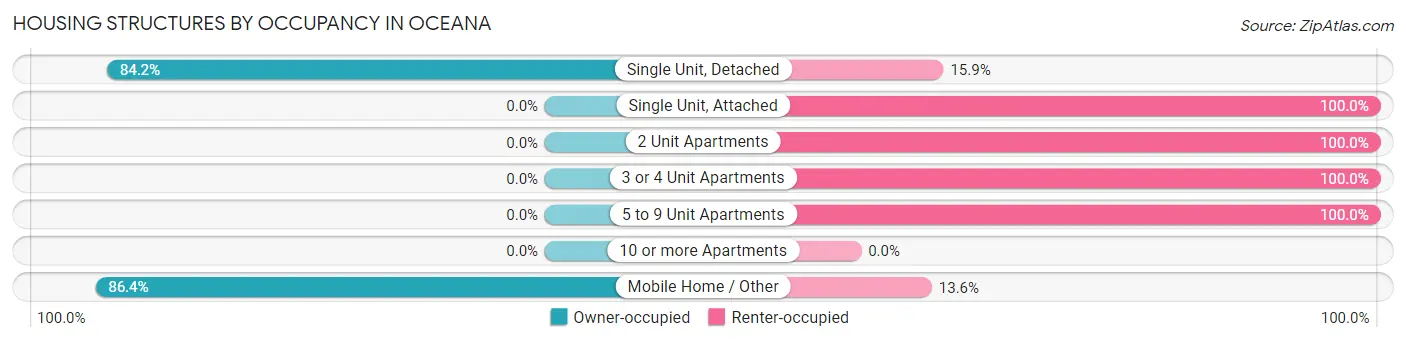
| Structure Type | Owner-occupied | Renter-occupied |
| Single Unit, Detached | 223 (84.2%) | 42 (15.9%) |
| Single Unit, Attached | 0 (0.0%) | 4 (100.0%) |
| 2 Unit Apartments | 0 (0.0%) | 9 (100.0%) |
| 3 or 4 Unit Apartments | 0 (0.0%) | 53 (100.0%) |
| 5 to 9 Unit Apartments | 0 (0.0%) | 10 (100.0%) |
| 10 or more Apartments | 0 (0.0%) | 0 (0.0%) |
| Mobile Home / Other | 146 (86.4%) | 23 (13.6%) |
| Total | 369 (72.4%) | 141 (27.7%) |
Housing Structures by Number of Rooms in Oceana
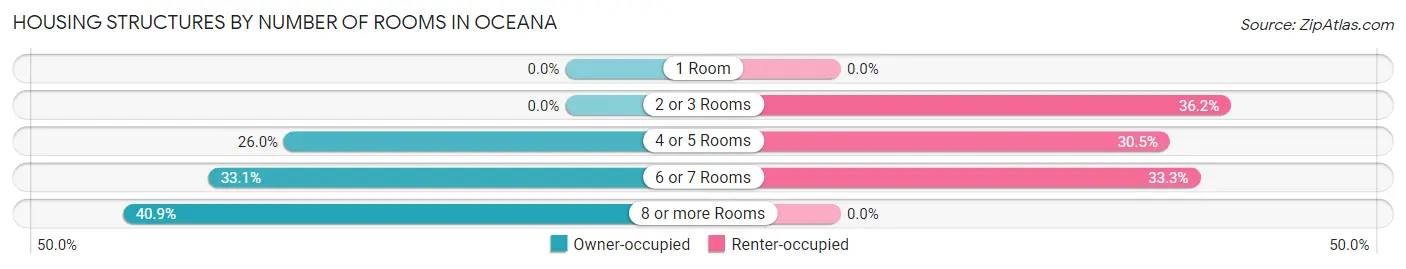
| Number of Rooms | Owner-occupied | Renter-occupied |
| 1 Room | 0 (0.0%) | 0 (0.0%) |
| 2 or 3 Rooms | 0 (0.0%) | 51 (36.2%) |
| 4 or 5 Rooms | 96 (26.0%) | 43 (30.5%) |
| 6 or 7 Rooms | 122 (33.1%) | 47 (33.3%) |
| 8 or more Rooms | 151 (40.9%) | 0 (0.0%) |
| Total | 369 (100.0%) | 141 (100.0%) |
Housing Structure by Heating Type in Oceana
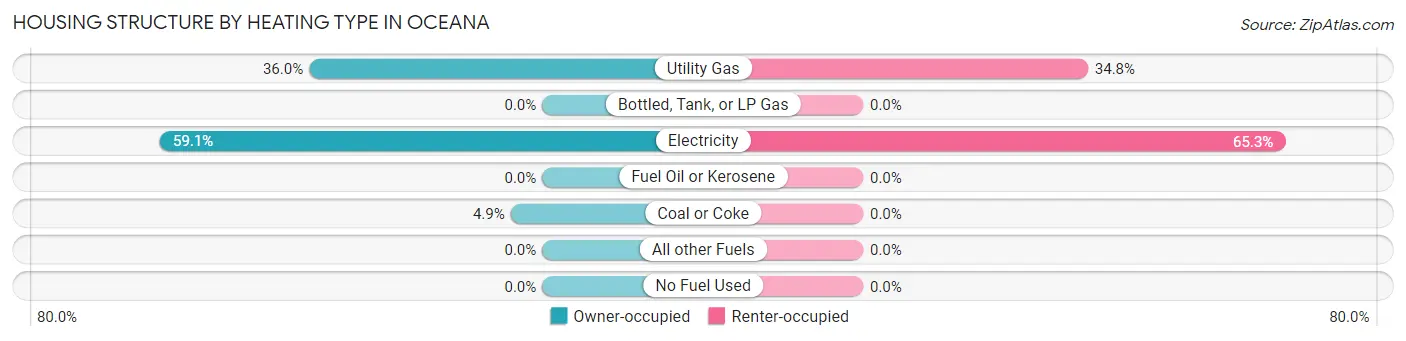
| Heating Type | Owner-occupied | Renter-occupied |
| Utility Gas | 133 (36.0%) | 49 (34.7%) |
| Bottled, Tank, or LP Gas | 0 (0.0%) | 0 (0.0%) |
| Electricity | 218 (59.1%) | 92 (65.2%) |
| Fuel Oil or Kerosene | 0 (0.0%) | 0 (0.0%) |
| Coal or Coke | 18 (4.9%) | 0 (0.0%) |
| All other Fuels | 0 (0.0%) | 0 (0.0%) |
| No Fuel Used | 0 (0.0%) | 0 (0.0%) |
| Total | 369 (100.0%) | 141 (100.0%) |
Household Vehicle Usage in Oceana
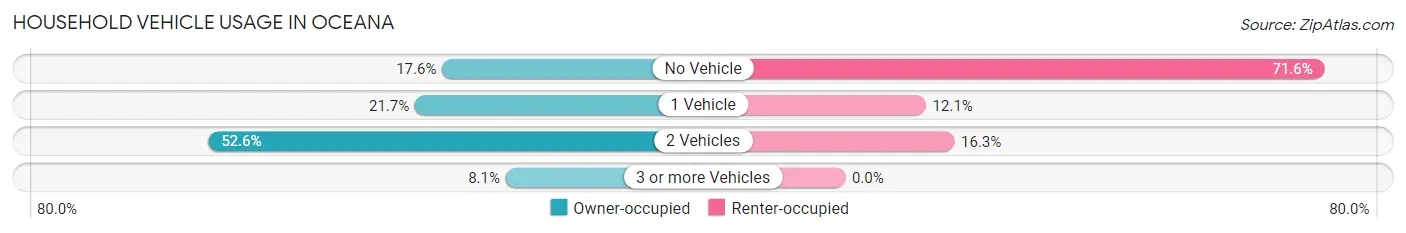
| Vehicles per Household | Owner-occupied | Renter-occupied |
| No Vehicle | 65 (17.6%) | 101 (71.6%) |
| 1 Vehicle | 80 (21.7%) | 17 (12.1%) |
| 2 Vehicles | 194 (52.6%) | 23 (16.3%) |
| 3 or more Vehicles | 30 (8.1%) | 0 (0.0%) |
| Total | 369 (100.0%) | 141 (100.0%) |
Real Estate & Mortgages in Oceana
Real Estate and Mortgage Overview in Oceana
| Characteristic | Without Mortgage | With Mortgage |
| Housing Units | 292 | 77 |
| Median Property Value | $50,000 | $0 |
| Median Household Income | $37,222 | $0 |
| Monthly Housing Costs | $363 | $0 |
| Real Estate Taxes | $252 | $0 |
Property Value by Mortgage Status in Oceana
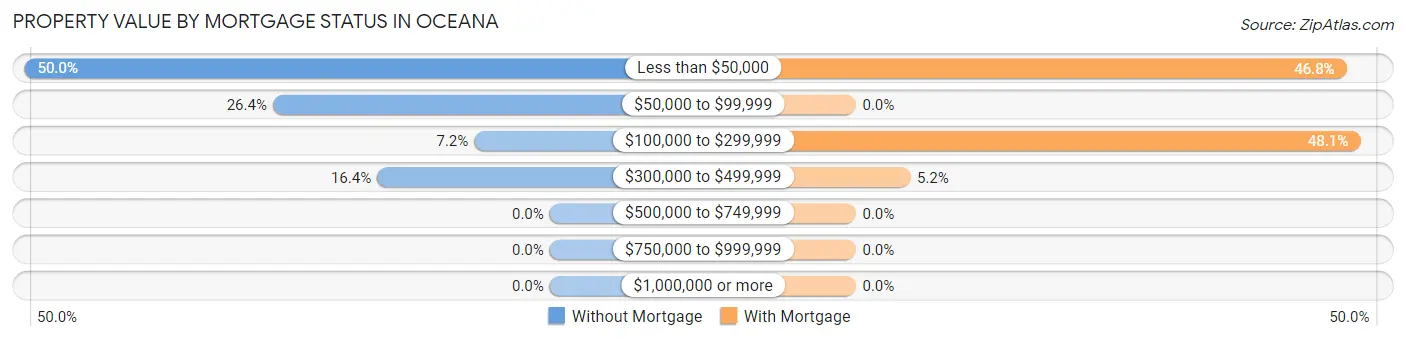
| Property Value | Without Mortgage | With Mortgage |
| Less than $50,000 | 146 (50.0%) | 36 (46.8%) |
| $50,000 to $99,999 | 77 (26.4%) | 0 (0.0%) |
| $100,000 to $299,999 | 21 (7.2%) | 37 (48.0%) |
| $300,000 to $499,999 | 48 (16.4%) | 4 (5.2%) |
| $500,000 to $749,999 | 0 (0.0%) | 0 (0.0%) |
| $750,000 to $999,999 | 0 (0.0%) | 0 (0.0%) |
| $1,000,000 or more | 0 (0.0%) | 0 (0.0%) |
| Total | 292 (100.0%) | 77 (100.0%) |
Household Income by Mortgage Status in Oceana
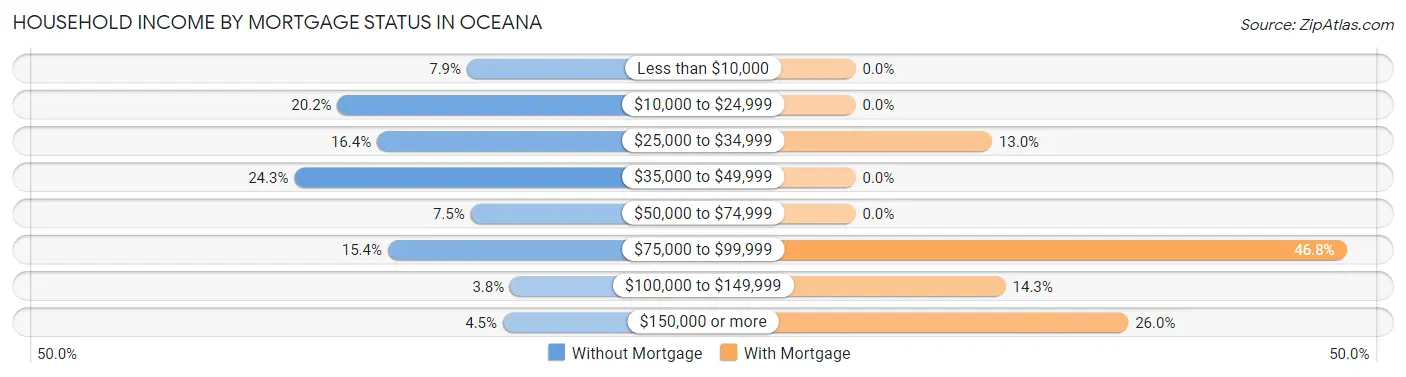
| Household Income | Without Mortgage | With Mortgage |
| Less than $10,000 | 23 (7.9%) | 0 (0.0%) |
| $10,000 to $24,999 | 59 (20.2%) | 0 (0.0%) |
| $25,000 to $34,999 | 48 (16.4%) | 10 (13.0%) |
| $35,000 to $49,999 | 71 (24.3%) | 0 (0.0%) |
| $50,000 to $74,999 | 22 (7.5%) | 0 (0.0%) |
| $75,000 to $99,999 | 45 (15.4%) | 36 (46.8%) |
| $100,000 to $149,999 | 11 (3.8%) | 11 (14.3%) |
| $150,000 or more | 13 (4.4%) | 20 (26.0%) |
| Total | 292 (100.0%) | 77 (100.0%) |
Property Value to Household Income Ratio in Oceana
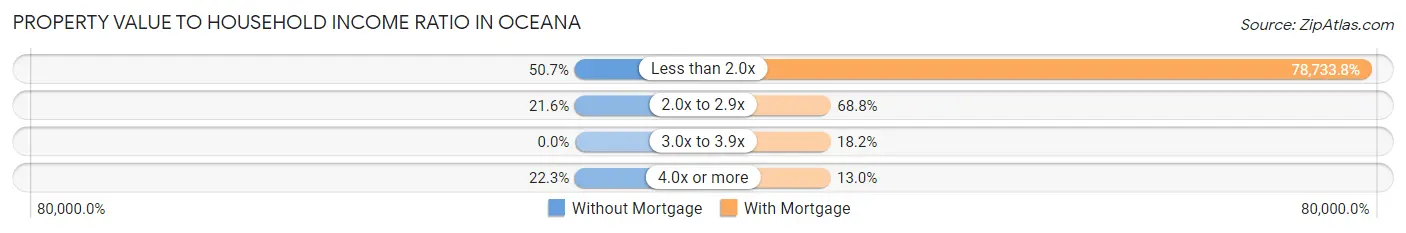
| Value-to-Income Ratio | Without Mortgage | With Mortgage |
| Less than 2.0x | 148 (50.7%) | 60,625 (78,733.8%) |
| 2.0x to 2.9x | 63 (21.6%) | 53 (68.8%) |
| 3.0x to 3.9x | 0 (0.0%) | 14 (18.2%) |
| 4.0x or more | 65 (22.3%) | 10 (13.0%) |
| Total | 292 (100.0%) | 77 (100.0%) |
Real Estate Taxes by Mortgage Status in Oceana
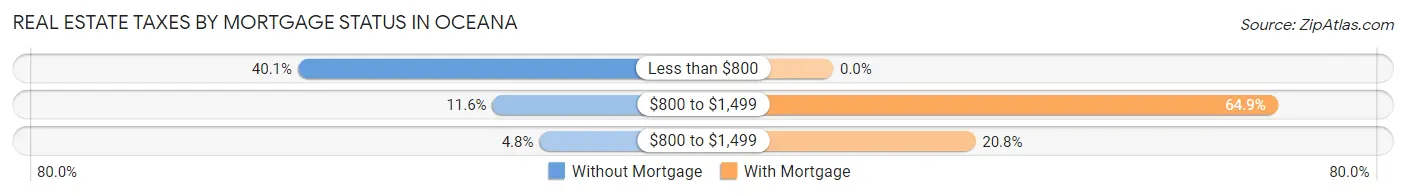
| Property Taxes | Without Mortgage | With Mortgage |
| Less than $800 | 117 (40.1%) | 0 (0.0%) |
| $800 to $1,499 | 34 (11.6%) | 50 (64.9%) |
| $800 to $1,499 | 14 (4.8%) | 16 (20.8%) |
| Total | 292 (100.0%) | 77 (100.0%) |
Health & Disability in Oceana
Health Insurance Coverage by Age in Oceana
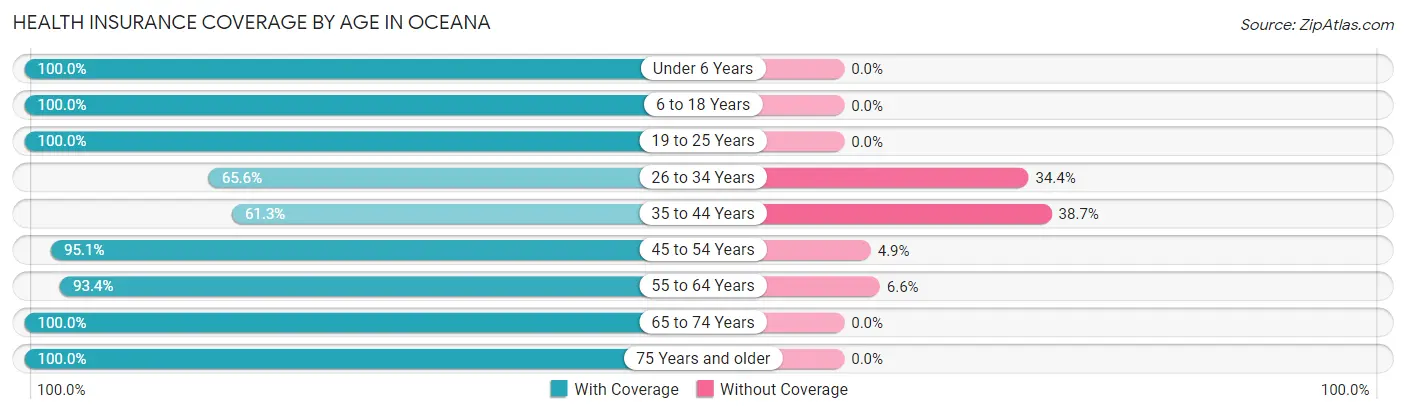
| Age Bracket | With Coverage | Without Coverage |
| Under 6 Years | 11 (100.0%) | 0 (0.0%) |
| 6 to 18 Years | 78 (100.0%) | 0 (0.0%) |
| 19 to 25 Years | 111 (100.0%) | 0 (0.0%) |
| 26 to 34 Years | 128 (65.6%) | 67 (34.4%) |
| 35 to 44 Years | 111 (61.3%) | 70 (38.7%) |
| 45 to 54 Years | 154 (95.1%) | 8 (4.9%) |
| 55 to 64 Years | 155 (93.4%) | 11 (6.6%) |
| 65 to 74 Years | 190 (100.0%) | 0 (0.0%) |
| 75 Years and older | 138 (100.0%) | 0 (0.0%) |
| Total | 1,076 (87.3%) | 156 (12.7%) |
Health Insurance Coverage by Citizenship Status in Oceana
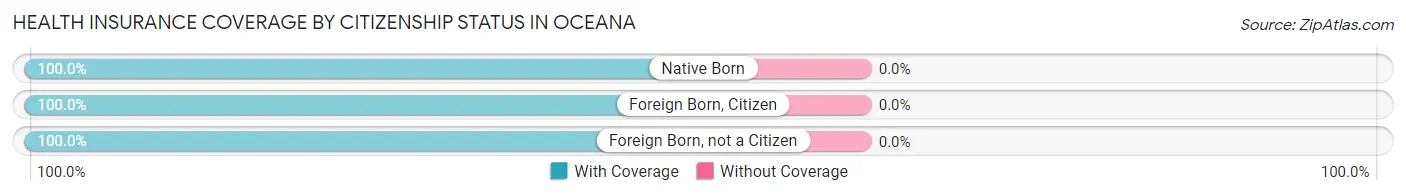
| Citizenship Status | With Coverage | Without Coverage |
| Native Born | 11 (100.0%) | 0 (0.0%) |
| Foreign Born, Citizen | 78 (100.0%) | 0 (0.0%) |
| Foreign Born, not a Citizen | 111 (100.0%) | 0 (0.0%) |
Health Insurance Coverage by Household Income in Oceana
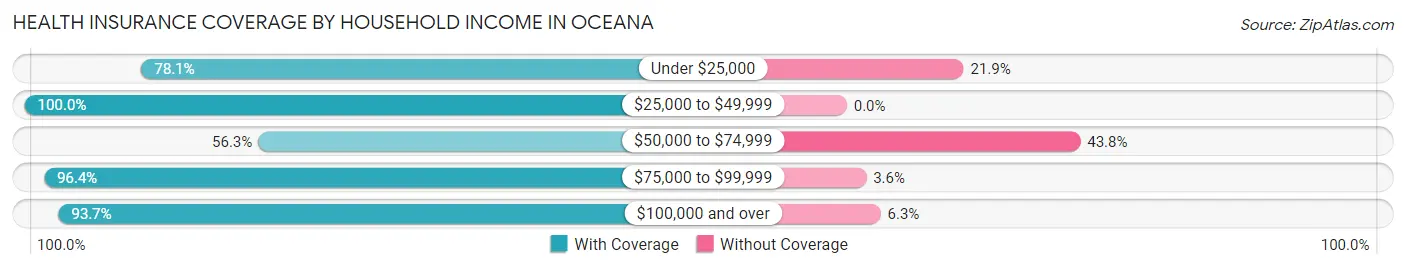
| Household Income | With Coverage | Without Coverage |
| Under $25,000 | 200 (78.1%) | 56 (21.9%) |
| $25,000 to $49,999 | 331 (100.0%) | 0 (0.0%) |
| $50,000 to $74,999 | 99 (56.2%) | 77 (43.8%) |
| $75,000 to $99,999 | 239 (96.4%) | 9 (3.6%) |
| $100,000 and over | 207 (93.7%) | 14 (6.3%) |
Public vs Private Health Insurance Coverage by Age in Oceana
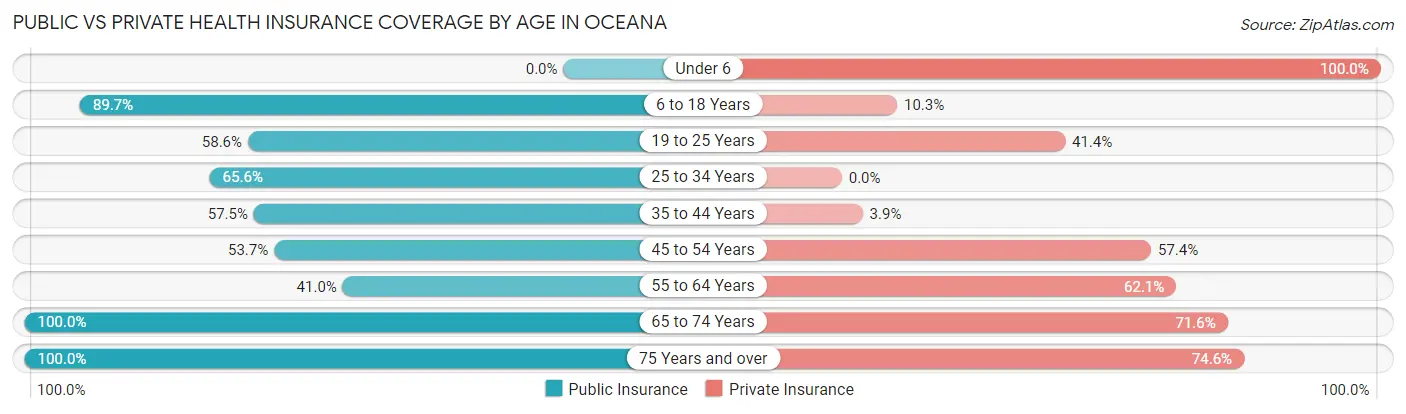
| Age Bracket | Public Insurance | Private Insurance |
| Under 6 | 0 (0.0%) | 11 (100.0%) |
| 6 to 18 Years | 70 (89.7%) | 8 (10.3%) |
| 19 to 25 Years | 65 (58.6%) | 46 (41.4%) |
| 25 to 34 Years | 128 (65.6%) | 0 (0.0%) |
| 35 to 44 Years | 104 (57.5%) | 7 (3.9%) |
| 45 to 54 Years | 87 (53.7%) | 93 (57.4%) |
| 55 to 64 Years | 68 (41.0%) | 103 (62.1%) |
| 65 to 74 Years | 190 (100.0%) | 136 (71.6%) |
| 75 Years and over | 138 (100.0%) | 103 (74.6%) |
| Total | 850 (69.0%) | 507 (41.1%) |
Disability Status by Sex by Age in Oceana
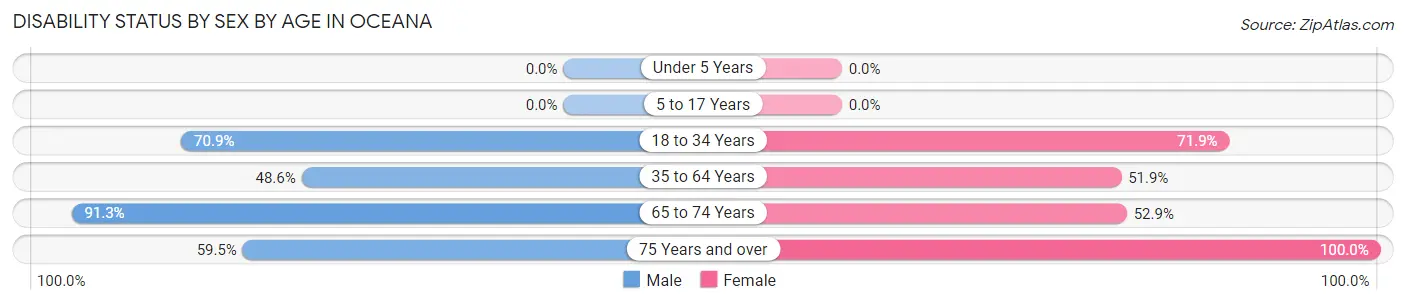
| Age Bracket | Male | Female |
| Under 5 Years | 0 (0.0%) | 0 (0.0%) |
| 5 to 17 Years | 0 (0.0%) | 0 (0.0%) |
| 18 to 34 Years | 122 (70.9%) | 100 (71.9%) |
| 35 to 64 Years | 104 (48.6%) | 153 (51.9%) |
| 65 to 74 Years | 63 (91.3%) | 64 (52.9%) |
| 75 Years and over | 50 (59.5%) | 54 (100.0%) |
Disability Class by Sex by Age in Oceana
Disability Class: Hearing Difficulty
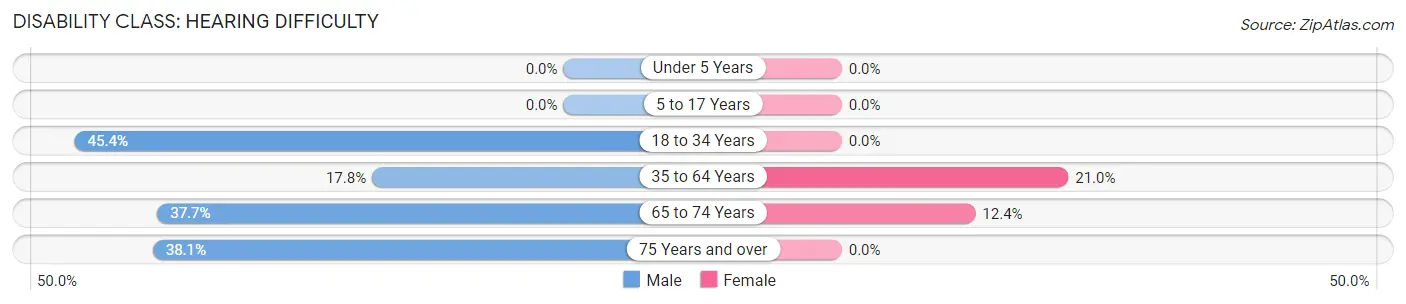
| Age Bracket | Male | Female |
| Under 5 Years | 0 (0.0%) | 0 (0.0%) |
| 5 to 17 Years | 0 (0.0%) | 0 (0.0%) |
| 18 to 34 Years | 78 (45.4%) | 0 (0.0%) |
| 35 to 64 Years | 38 (17.8%) | 62 (21.0%) |
| 65 to 74 Years | 26 (37.7%) | 15 (12.4%) |
| 75 Years and over | 32 (38.1%) | 0 (0.0%) |
Disability Class: Vision Difficulty
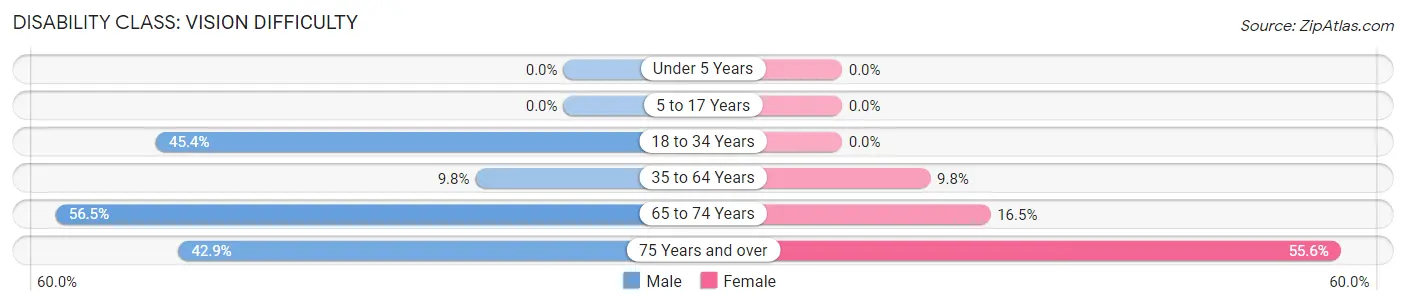
| Age Bracket | Male | Female |
| Under 5 Years | 0 (0.0%) | 0 (0.0%) |
| 5 to 17 Years | 0 (0.0%) | 0 (0.0%) |
| 18 to 34 Years | 78 (45.4%) | 0 (0.0%) |
| 35 to 64 Years | 21 (9.8%) | 29 (9.8%) |
| 65 to 74 Years | 39 (56.5%) | 20 (16.5%) |
| 75 Years and over | 36 (42.9%) | 30 (55.6%) |
Disability Class: Cognitive Difficulty
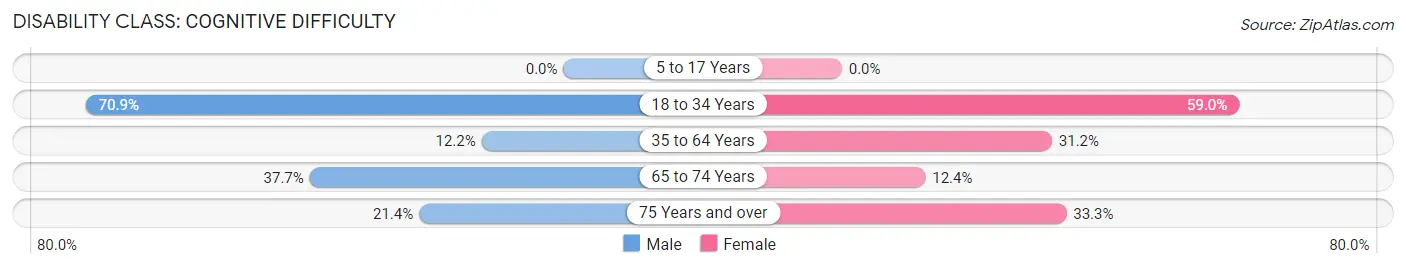
| Age Bracket | Male | Female |
| 5 to 17 Years | 0 (0.0%) | 0 (0.0%) |
| 18 to 34 Years | 122 (70.9%) | 82 (59.0%) |
| 35 to 64 Years | 26 (12.1%) | 92 (31.2%) |
| 65 to 74 Years | 26 (37.7%) | 15 (12.4%) |
| 75 Years and over | 18 (21.4%) | 18 (33.3%) |
Disability Class: Ambulatory Difficulty
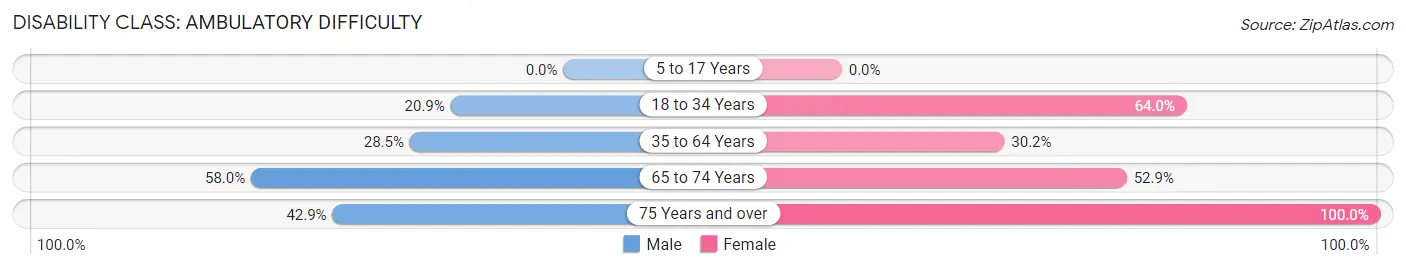
| Age Bracket | Male | Female |
| 5 to 17 Years | 0 (0.0%) | 0 (0.0%) |
| 18 to 34 Years | 36 (20.9%) | 89 (64.0%) |
| 35 to 64 Years | 61 (28.5%) | 89 (30.2%) |
| 65 to 74 Years | 40 (58.0%) | 64 (52.9%) |
| 75 Years and over | 36 (42.9%) | 54 (100.0%) |
Disability Class: Self-Care Difficulty
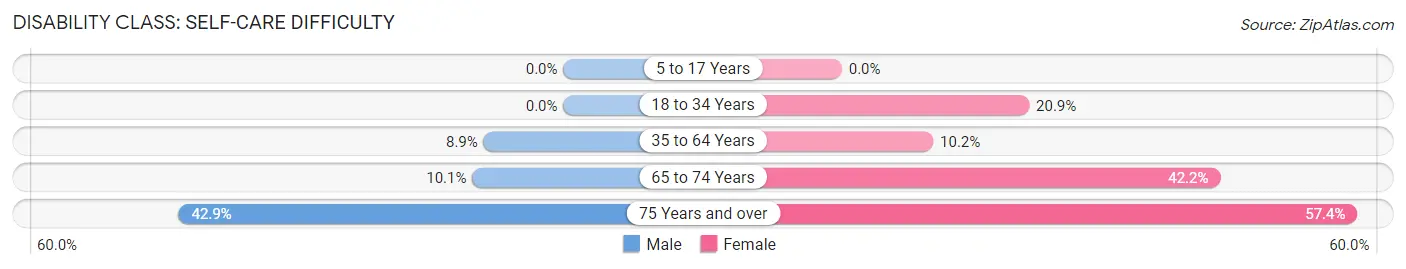
| Age Bracket | Male | Female |
| 5 to 17 Years | 0 (0.0%) | 0 (0.0%) |
| 18 to 34 Years | 0 (0.0%) | 29 (20.9%) |
| 35 to 64 Years | 19 (8.9%) | 30 (10.2%) |
| 65 to 74 Years | 7 (10.1%) | 51 (42.1%) |
| 75 Years and over | 36 (42.9%) | 31 (57.4%) |
Technology Access in Oceana
Computing Device Access in Oceana
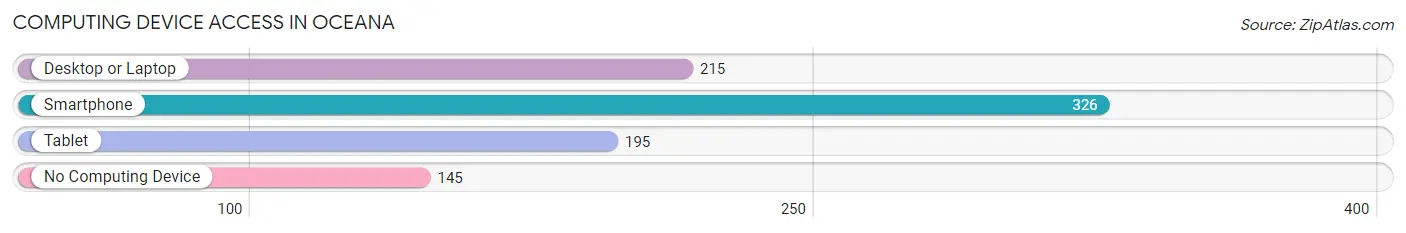
| Device Type | # Households | % Households |
| Desktop or Laptop | 215 | 42.2% |
| Smartphone | 326 | 63.9% |
| Tablet | 195 | 38.2% |
| No Computing Device | 145 | 28.4% |
| Total | 510 | 100.0% |
Internet Access in Oceana
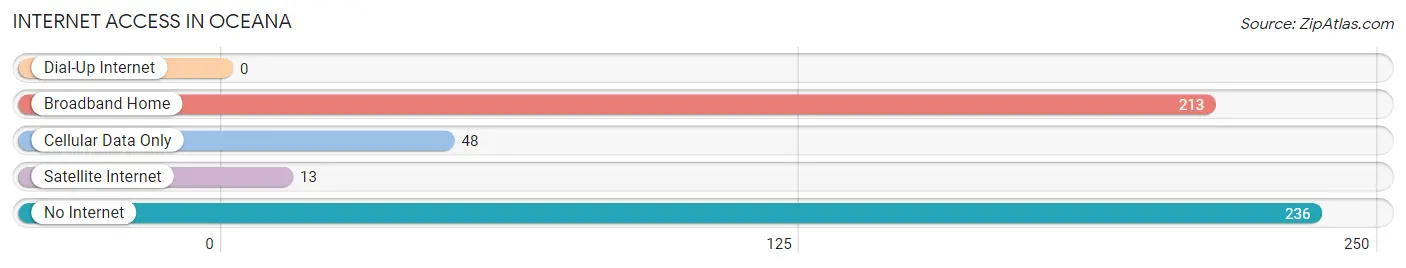
| Internet Type | # Households | % Households |
| Dial-Up Internet | 0 | 0.0% |
| Broadband Home | 213 | 41.8% |
| Cellular Data Only | 48 | 9.4% |
| Satellite Internet | 13 | 2.5% |
| No Internet | 236 | 46.3% |
| Total | 510 | 100.0% |
Oceana Summary
Oceana is a small town located in Wyoming County, West Virginia. It is situated in the Appalachian Mountains and is part of the Coal Country region of the state. The town has a population of approximately 1,500 people and is the county seat of Wyoming County.
Geography
Oceana is located in the Appalachian Mountains of West Virginia. The town is situated in the Coal Country region of the state, which is known for its coal mining industry. The town is located at an elevation of 1,890 feet and is surrounded by mountains and hills. The town is located near the headwaters of the Guyandotte River, which flows through the town and is a tributary of the Big Sandy River.
The town is located in a temperate climate, with hot summers and cold winters. The average annual temperature is around 50 degrees Fahrenheit. The town receives an average of 40 inches of precipitation per year, with most of it falling in the form of snow during the winter months.
Economy
The economy of Oceana is largely based on the coal mining industry. The town is home to several coal mines, which provide jobs for many of the town's residents. The town is also home to several small businesses, including restaurants, stores, and other services.
The town is also home to a number of tourist attractions, including the Oceana Coal Mine Museum, which showcases the history of the coal mining industry in the area. The town is also home to the Oceana Wildlife Refuge, which is a popular destination for birdwatchers and nature lovers.
Demographics
As of the 2010 census, the population of Oceana was 1,500. The town is predominantly white, with 95.3% of the population identifying as white. The town also has a small African American population, with 2.7% of the population identifying as African American. The town also has a small Hispanic population, with 1.3% of the population identifying as Hispanic or Latino.
The median household income in Oceana is $30,000, which is lower than the national average. The town also has a higher poverty rate than the national average, with 22.3% of the population living below the poverty line.
History
Oceana was founded in 1891 by the Oceana Coal Company. The town was named after the company and was intended to be a company town for the coal miners who worked in the area. The town quickly grew and by the early 1900s, it had become the largest town in Wyoming County.
The town was a major center of the coal mining industry in the area and was home to several coal mines. The town was also home to several other businesses, including stores, restaurants, and other services.
The town was also home to a number of churches, including the First Baptist Church, which was founded in 1891. The town was also home to a number of schools, including the Oceana High School, which was founded in 1910.
The town was also home to a number of cultural and recreational activities, including the Oceana Opera House, which was built in 1910 and hosted a variety of performances. The town was also home to a number of parks, including the Oceana City Park, which was established in 1912.
The town was also home to a number of notable residents, including the author and poet, Mary Noailles Murfree, who was born in Oceana in 1876. The town was also home to the artist, John Steuart Curry, who was born in Oceana in 1897.
The town was also home to a number of notable events, including the Oceana Coal Strike of 1912, which was a major labor dispute between the coal miners and the coal companies. The strike lasted for several months and resulted in the formation of the United Mine Workers of America.
The town was also home to a number of other notable events, including the Oceana Riot of 1921, which was a major race riot that occurred in the town. The riot resulted in several deaths and injuries and was a major event in the history of the town.
The town was also home to a number of other notable events, including the Oceana Flood of 1924, which was a major flood that occurred in the town. The flood resulted in several deaths and caused extensive damage to the town.
The town was also home to a number of other notable events, including the Oceana Tornado of 1929, which was a major tornado that occurred in the town. The tornado resulted in several deaths and caused extensive damage to the town.
The town was also home to a number of other notable events, including the Oceana Mine Disaster of 1932, which was a major mining disaster that occurred in the town. The disaster resulted in several deaths and caused extensive damage to the town.
The town was also home to a number of other notable events, including the Oceana Fire of 1936, which was a major fire that occurred in the town. The fire resulted in several deaths and caused extensive damage to the town.
The town was also home to a number of other notable events, including the Oceana Flood of 1937, which was a major flood that occurred in the town. The flood resulted in several deaths and caused extensive damage to the town.
The town was also home to a number of other notable events, including the Oceana Riot of 1943, which was a major race riot that occurred in the town. The riot resulted in several deaths and injuries and was a major event in the history of the town.
Common Questions
What is Per Capita Income in Oceana?
Per Capita income in Oceana is $34,881.
What is the Median Family Income in Oceana?
Median Family Income in Oceana is $58,676.
What is the Median Household income in Oceana?
Median Household Income in Oceana is $37,083.
What is Inequality or Gini Index in Oceana?
Inequality or Gini Index in Oceana is 0.60.
What is the Total Population of Oceana?
Total Population of Oceana is 1,232.
What is the Total Male Population of Oceana?
Total Male Population of Oceana is 568.
What is the Total Female Population of Oceana?
Total Female Population of Oceana is 664.
What is the Ratio of Males per 100 Females in Oceana?
There are 85.54 Males per 100 Females in Oceana.
What is the Ratio of Females per 100 Males in Oceana?
There are 116.90 Females per 100 Males in Oceana.
What is the Median Population Age in Oceana?
Median Population Age in Oceana is 47.8 Years.
What is the Average Family Size in Oceana
Average Family Size in Oceana is 3.5 People.
What is the Average Household Size in Oceana
Average Household Size in Oceana is 2.4 People.
How Large is the Labor Force in Oceana?
There are 480 People in the Labor Forcein in Oceana.
What is the Percentage of People in the Labor Force in Oceana?
41.1% of People are in the Labor Force in Oceana.
What is the Unemployment Rate in Oceana?
Unemployment Rate in Oceana is 7.5%.