Montrose, WV Map & Demographics
Montrose Map
Montrose Overview
$21,093
PER CAPITA INCOME
$94,063
AVG FAMILY INCOME
$70,833
AVG HOUSEHOLD INCOME
0.31
INEQUALITY / GINI INDEX
314
TOTAL POPULATION
216
MALE POPULATION
98
FEMALE POPULATION
220.41
MALES / 100 FEMALES
45.37
FEMALES / 100 MALES
24.1
MEDIAN AGE
3.8
AVG FAMILY SIZE
3.3
AVG HOUSEHOLD SIZE
78
LABOR FORCE [ PEOPLE ]
42.4%
PERCENT IN LABOR FORCE
Montrose Zip Codes
Montrose Area Codes
Income in Montrose
Income Overview in Montrose
Per Capita Income in Montrose is $21,093, while median incomes of families and households are $94,063 and $70,833 respectively.
| Characteristic | Number | Measure |
| Per Capita Income | 314 | $21,093 |
| Median Family Income | 75 | $94,063 |
| Mean Family Income | 75 | $81,837 |
| Median Household Income | 94 | $70,833 |
| Mean Household Income | 94 | $71,518 |
| Income Deficit | 75 | $0 |
| Wage / Income Gap (%) | 314 | 0.00% |
| Wage / Income Gap ($) | 314 | 100.00¢ per $1 |
| Gini / Inequality Index | 314 | 0.31 |
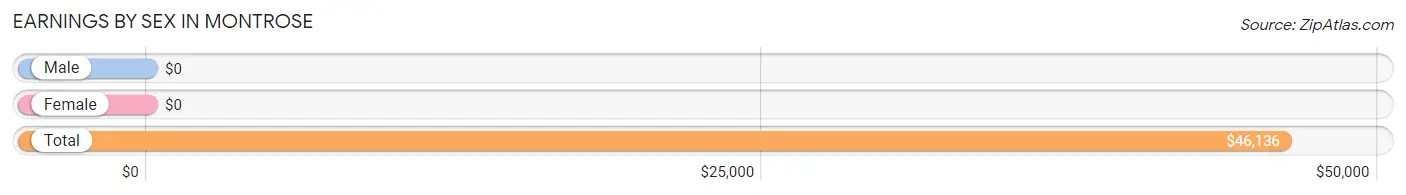
Earnings by Sex in Montrose
| Sex | Number | Average Earnings |
| Male | 54 (55.1%) | $0 |
| Female | 44 (44.9%) | $0 |
| Total | 98 (100.0%) | $46,136 |
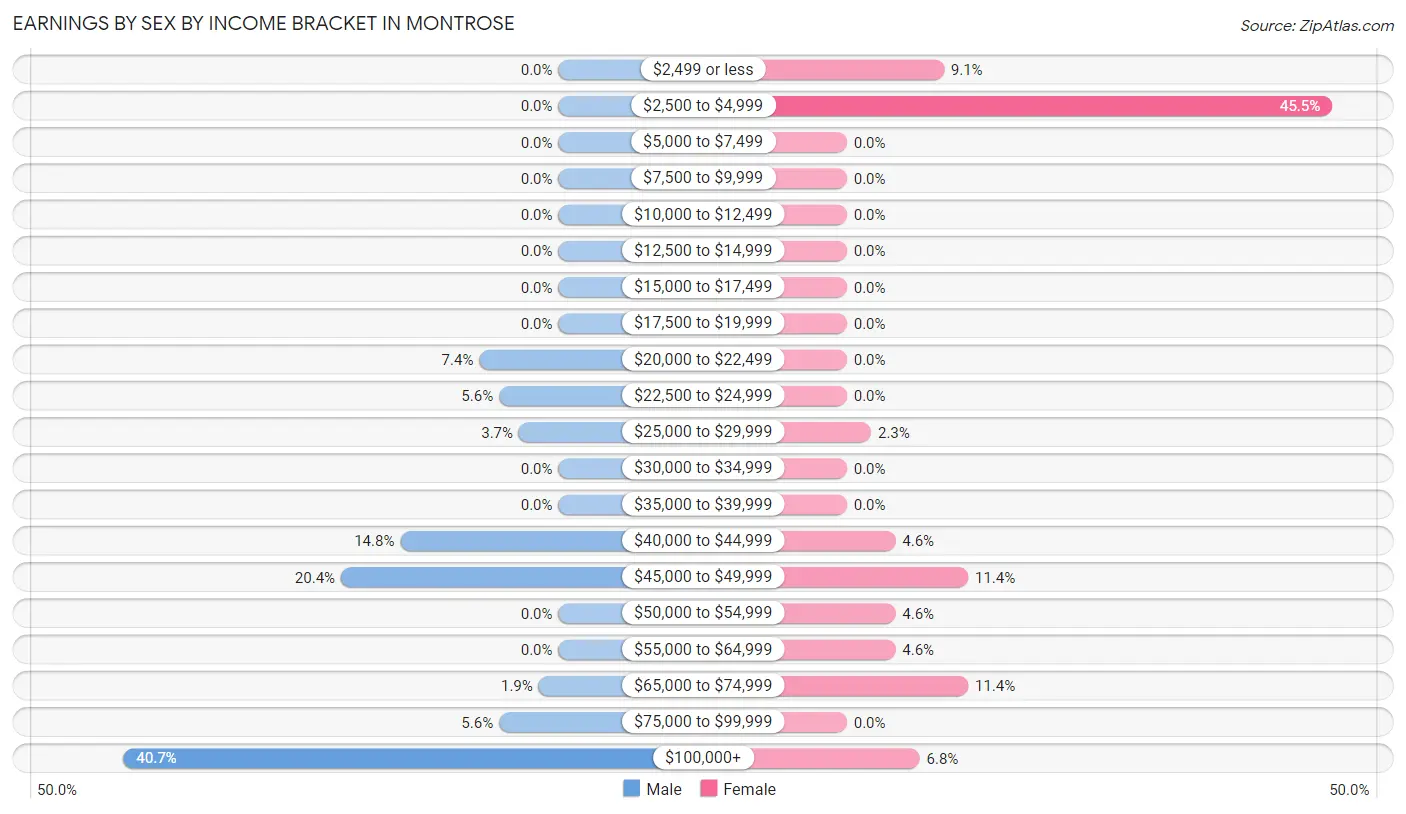
Earnings by Sex by Income Bracket in Montrose
The most common earnings brackets in Montrose are $100,000+ for men (22 | 40.7%) and $2,500 to $4,999 for women (20 | 45.5%).
| Income | Male | Female |
| $2,499 or less | 0 (0.0%) | 4 (9.1%) |
| $2,500 to $4,999 | 0 (0.0%) | 20 (45.5%) |
| $5,000 to $7,499 | 0 (0.0%) | 0 (0.0%) |
| $7,500 to $9,999 | 0 (0.0%) | 0 (0.0%) |
| $10,000 to $12,499 | 0 (0.0%) | 0 (0.0%) |
| $12,500 to $14,999 | 0 (0.0%) | 0 (0.0%) |
| $15,000 to $17,499 | 0 (0.0%) | 0 (0.0%) |
| $17,500 to $19,999 | 0 (0.0%) | 0 (0.0%) |
| $20,000 to $22,499 | 4 (7.4%) | 0 (0.0%) |
| $22,500 to $24,999 | 3 (5.6%) | 0 (0.0%) |
| $25,000 to $29,999 | 2 (3.7%) | 1 (2.3%) |
| $30,000 to $34,999 | 0 (0.0%) | 0 (0.0%) |
| $35,000 to $39,999 | 0 (0.0%) | 0 (0.0%) |
| $40,000 to $44,999 | 8 (14.8%) | 2 (4.5%) |
| $45,000 to $49,999 | 11 (20.4%) | 5 (11.4%) |
| $50,000 to $54,999 | 0 (0.0%) | 2 (4.5%) |
| $55,000 to $64,999 | 0 (0.0%) | 2 (4.5%) |
| $65,000 to $74,999 | 1 (1.8%) | 5 (11.4%) |
| $75,000 to $99,999 | 3 (5.6%) | 0 (0.0%) |
| $100,000+ | 22 (40.7%) | 3 (6.8%) |
| Total | 54 (100.0%) | 44 (100.0%) |
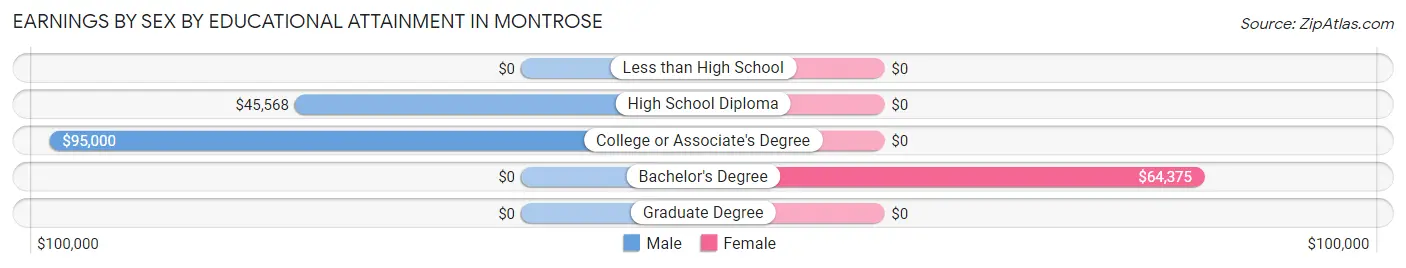
Earnings by Sex by Educational Attainment in Montrose
Average earnings in Montrose are $45,114 for men and $58,750 for women, a difference of 23.2%. Men with an educational attainment of college or associate's degree enjoy the highest average annual earnings of $95,000, while those with high school diploma education earn the least with $45,568. Women with an educational attainment of bachelor's degree earn the most with the average annual earnings of $64,375, while those with bachelor's degree education have the smallest earnings of $64,375.
| Educational Attainment | Male Income | Female Income |
| Less than High School | - | - |
| High School Diploma | $45,568 | $0 |
| College or Associate's Degree | $95,000 | $0 |
| Bachelor's Degree | - | - |
| Graduate Degree | - | - |
| Total | $45,114 | $58,750 |
Family Income in Montrose
Family Income Brackets in Montrose
According to the Montrose family income data, there are 34 families falling into the $100,000 to $149,999 income range, which is the most common income bracket and makes up 45.3% of all families.
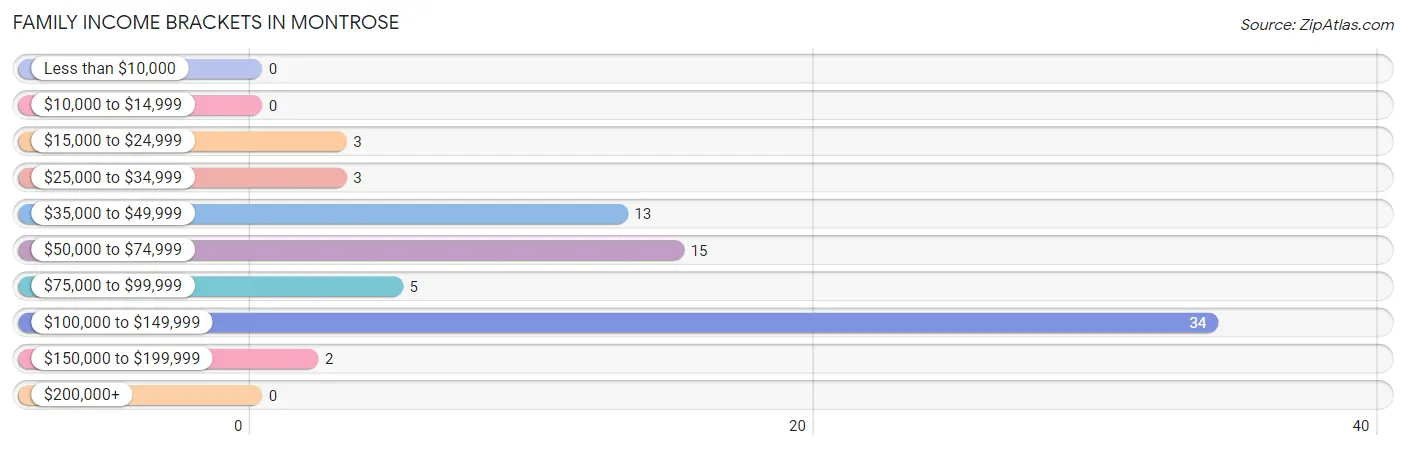
| Income Bracket | # Families | % Families |
| Less than $10,000 | 0 | 0.0% |
| $10,000 to $14,999 | 0 | 0.0% |
| $15,000 to $24,999 | 3 | 4.0% |
| $25,000 to $34,999 | 3 | 4.0% |
| $35,000 to $49,999 | 13 | 17.3% |
| $50,000 to $74,999 | 15 | 20.0% |
| $75,000 to $99,999 | 5 | 6.7% |
| $100,000 to $149,999 | 34 | 45.3% |
| $150,000 to $199,999 | 2 | 2.7% |
| $200,000+ | 0 | 0.0% |
Family Income by Famaliy Size in Montrose
3-person families (25 | 33.3%) account for the highest median family income in Montrose with $105,938 per family, while 3-person families (25 | 33.3%) have the highest median income of $35,313 per family member.
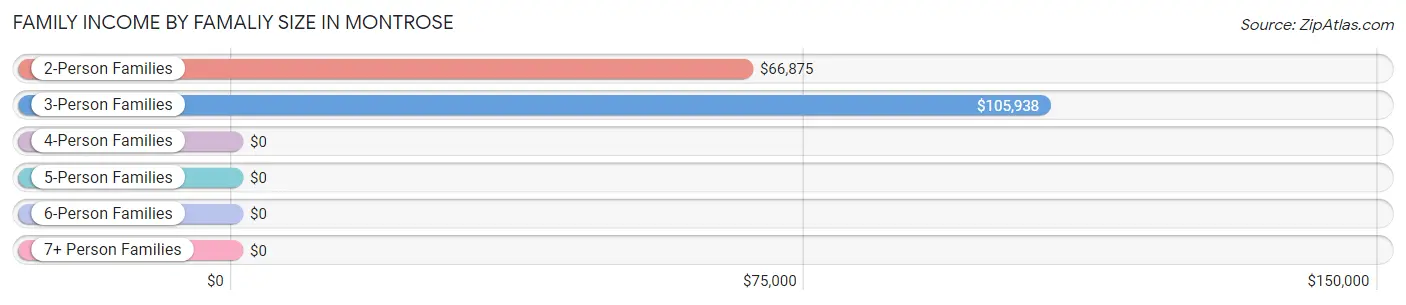
| Income Bracket | # Families | Median Income |
| 2-Person Families | 46 (61.3%) | $66,875 |
| 3-Person Families | 25 (33.3%) | $105,938 |
| 4-Person Families | 4 (5.3%) | $0 |
| 5-Person Families | 0 (0.0%) | $0 |
| 6-Person Families | 0 (0.0%) | $0 |
| 7+ Person Families | 0 (0.0%) | $0 |
| Total | 75 (100.0%) | $94,063 |
Family Income by Number of Earners in Montrose
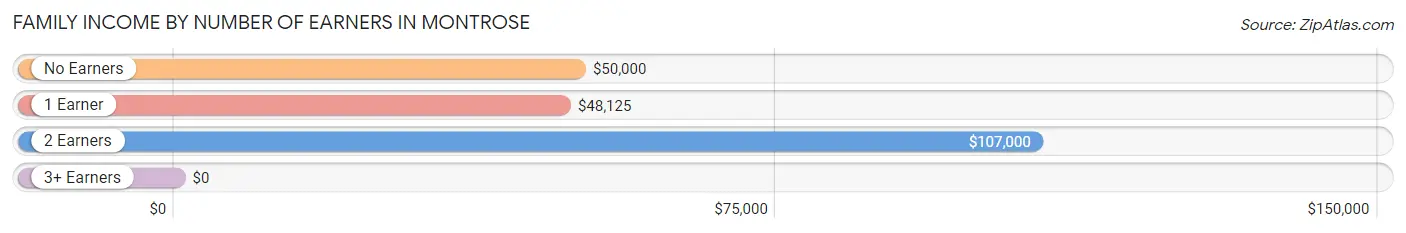
| Number of Earners | # Families | Median Income |
| No Earners | 26 (34.7%) | $50,000 |
| 1 Earner | 9 (12.0%) | $48,125 |
| 2 Earners | 40 (53.3%) | $107,000 |
| 3+ Earners | 0 (0.0%) | $0 |
| Total | 75 (100.0%) | $94,063 |
Household Income in Montrose
Household Income Brackets in Montrose
With 34 households falling in the category, the $100,000 to $149,999 income range is the most frequent in Montrose, accounting for 36.2% of all households.
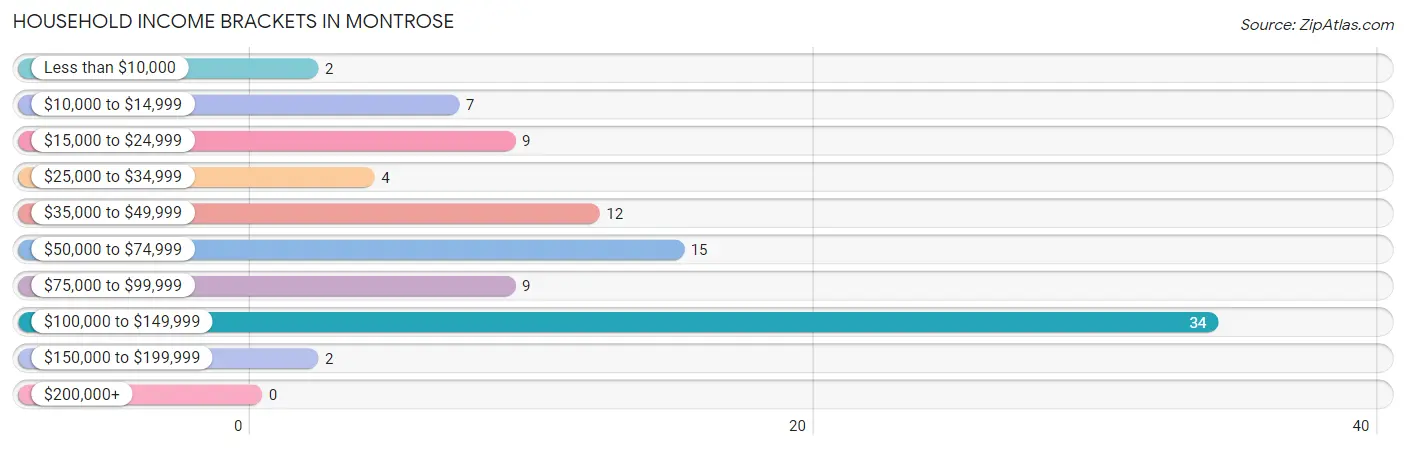
| Income Bracket | # Households | % Households |
| Less than $10,000 | 2 | 2.1% |
| $10,000 to $14,999 | 7 | 7.4% |
| $15,000 to $24,999 | 9 | 9.6% |
| $25,000 to $34,999 | 4 | 4.3% |
| $35,000 to $49,999 | 12 | 12.8% |
| $50,000 to $74,999 | 15 | 16.0% |
| $75,000 to $99,999 | 9 | 9.6% |
| $100,000 to $149,999 | 34 | 36.2% |
| $150,000 to $199,999 | 2 | 2.1% |
| $200,000+ | 0 | 0.0% |
Household Income by Householder Age in Montrose
The median household income in Montrose is $70,833, with the highest median household income of $93,750 found in the 25 to 44 years age bracket for the primary householder. A total of 11 households (11.7%) fall into this category. Meanwhile, the 15 to 24 years age bracket for the primary householder has the lowest median household income of $0, with 20 households (21.3%) in this group.
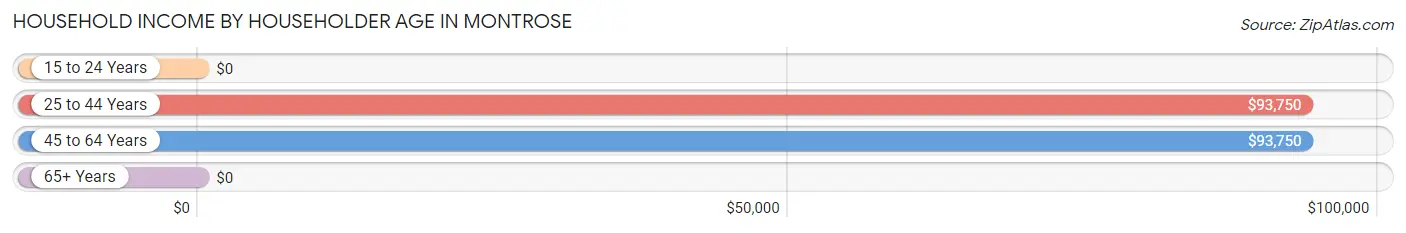
| Income Bracket | # Households | Median Income |
| 15 to 24 Years | 20 (21.3%) | $0 |
| 25 to 44 Years | 11 (11.7%) | $93,750 |
| 45 to 64 Years | 29 (30.8%) | $93,750 |
| 65+ Years | 34 (36.2%) | $0 |
| Total | 94 (100.0%) | $70,833 |
Poverty in Montrose
Income Below Poverty by Sex and Age in Montrose
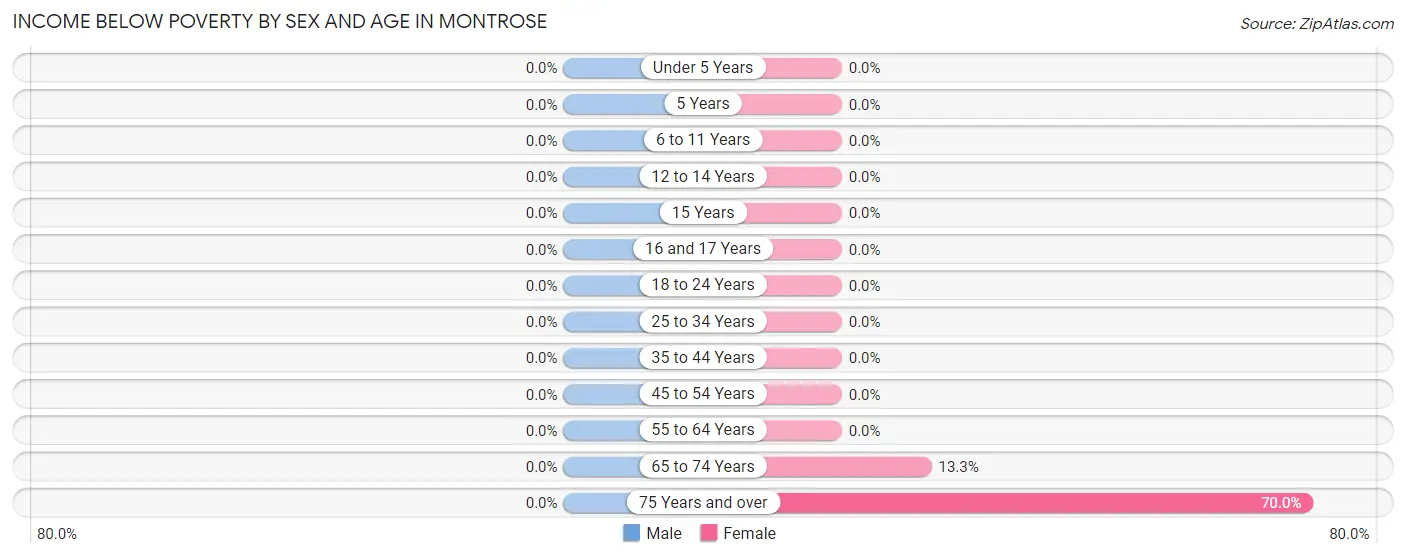
| Age Bracket | Male | Female |
| Under 5 Years | 0 (0.0%) | 0 (0.0%) |
| 5 Years | 0 (0.0%) | 0 (0.0%) |
| 6 to 11 Years | 0 (0.0%) | 0 (0.0%) |
| 12 to 14 Years | 0 (0.0%) | 0 (0.0%) |
| 15 Years | 0 (0.0%) | 0 (0.0%) |
| 16 and 17 Years | 0 (0.0%) | 0 (0.0%) |
| 18 to 24 Years | 0 (0.0%) | 0 (0.0%) |
| 25 to 34 Years | 0 (0.0%) | 0 (0.0%) |
| 35 to 44 Years | 0 (0.0%) | 0 (0.0%) |
| 45 to 54 Years | 0 (0.0%) | 0 (0.0%) |
| 55 to 64 Years | 0 (0.0%) | 0 (0.0%) |
| 65 to 74 Years | 0 (0.0%) | 2 (13.3%) |
| 75 Years and over | 0 (0.0%) | 7 (70.0%) |
| Total | 0 (0.0%) | 9 (9.2%) |
Income Above Poverty by Sex and Age in Montrose
According to the poverty statistics in Montrose, males aged under 5 years and females aged 6 to 11 years are the age groups that are most secure financially, with 100.0% of males and 100.0% of females in these age groups living above the poverty line.
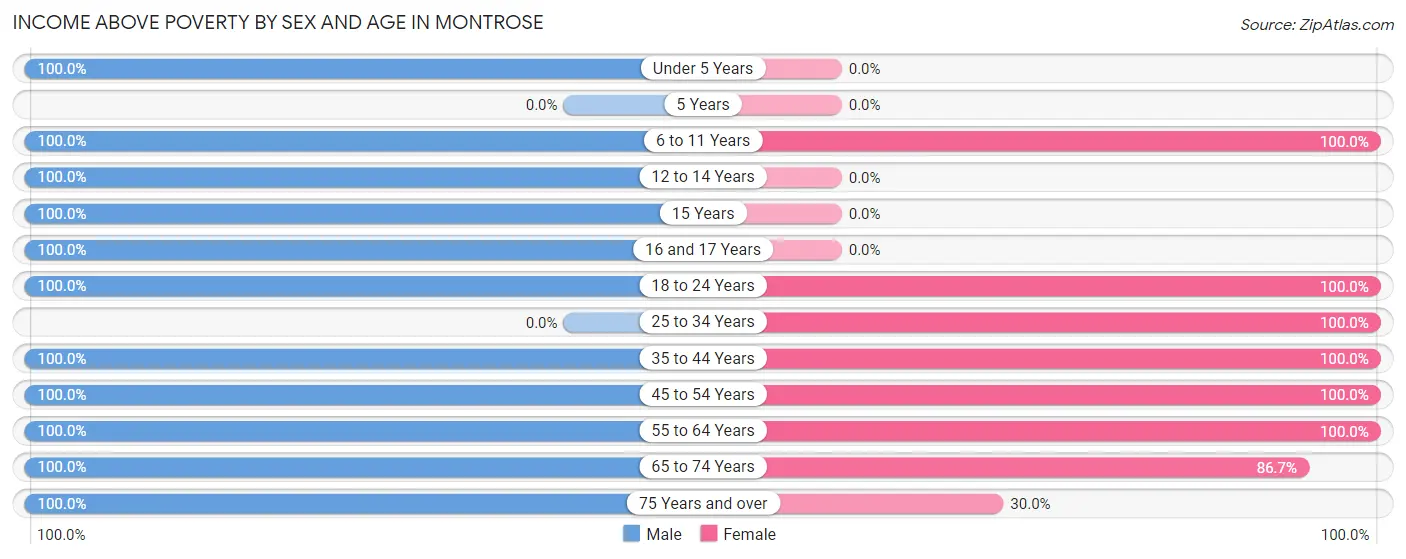
| Age Bracket | Male | Female |
| Under 5 Years | 119 (100.0%) | 0 (0.0%) |
| 5 Years | 0 (0.0%) | 0 (0.0%) |
| 6 to 11 Years | 1 (100.0%) | 6 (100.0%) |
| 12 to 14 Years | 2 (100.0%) | 0 (0.0%) |
| 15 Years | 2 (100.0%) | 0 (0.0%) |
| 16 and 17 Years | 2 (100.0%) | 0 (0.0%) |
| 18 to 24 Years | 19 (100.0%) | 24 (100.0%) |
| 25 to 34 Years | 0 (0.0%) | 7 (100.0%) |
| 35 to 44 Years | 16 (100.0%) | 14 (100.0%) |
| 45 to 54 Years | 11 (100.0%) | 4 (100.0%) |
| 55 to 64 Years | 24 (100.0%) | 18 (100.0%) |
| 65 to 74 Years | 12 (100.0%) | 13 (86.7%) |
| 75 Years and over | 8 (100.0%) | 3 (30.0%) |
| Total | 216 (100.0%) | 89 (90.8%) |
Income Below Poverty Among Married-Couple Families in Montrose
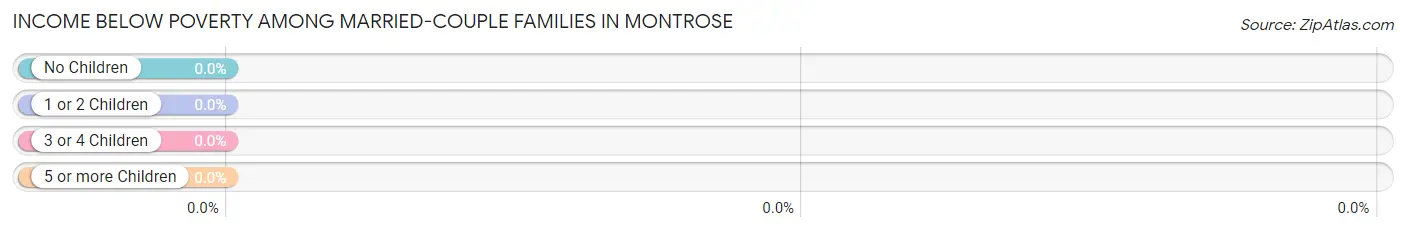
| Children | Above Poverty | Below Poverty |
| No Children | 32 (100.0%) | 0 (0.0%) |
| 1 or 2 Children | 24 (100.0%) | 0 (0.0%) |
| 3 or 4 Children | 0 (0.0%) | 0 (0.0%) |
| 5 or more Children | 0 (0.0%) | 0 (0.0%) |
| Total | 56 (100.0%) | 0 (0.0%) |
Income Below Poverty Among Single-Parent Households in Montrose
| Children | Single Father | Single Mother |
| No Children | 0 (0.0%) | 0 (0.0%) |
| 1 or 2 Children | 0 (0.0%) | 0 (0.0%) |
| 3 or 4 Children | 0 (0.0%) | 0 (0.0%) |
| 5 or more Children | 0 (0.0%) | 0 (0.0%) |
| Total | 0 (0.0%) | 0 (0.0%) |
Income Below Poverty Among Married-Couple vs Single-Parent Households in Montrose
| Children | Married-Couple Families | Single-Parent Households |
| No Children | 0 (0.0%) | 0 (0.0%) |
| 1 or 2 Children | 0 (0.0%) | 0 (0.0%) |
| 3 or 4 Children | 0 (0.0%) | 0 (0.0%) |
| 5 or more Children | 0 (0.0%) | 0 (0.0%) |
| Total | 0 (0.0%) | 0 (0.0%) |
Race in Montrose
The most populous races in Montrose are , and White / Caucasian (314 | 100.0%).
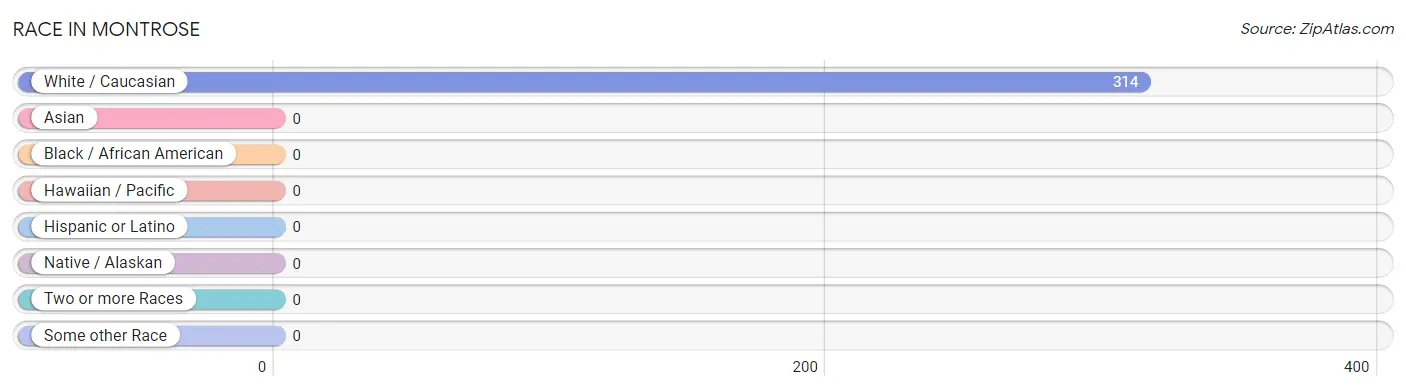
| Race | # Population | % Population |
| Asian | 0 | 0.0% |
| Black / African American | 0 | 0.0% |
| Hawaiian / Pacific | 0 | 0.0% |
| Hispanic or Latino | 0 | 0.0% |
| Native / Alaskan | 0 | 0.0% |
| White / Caucasian | 314 | 100.0% |
| Two or more Races | 0 | 0.0% |
| Some other Race | 0 | 0.0% |
| Total | 314 | 100.0% |
Ancestry in Montrose
The most populous ancestries reported in Montrose are German (49 | 15.6%), Irish (38 | 12.1%), English (16 | 5.1%), Dutch (14 | 4.5%), and Scottish (11 | 3.5%), together accounting for 40.8% of all Montrose residents.
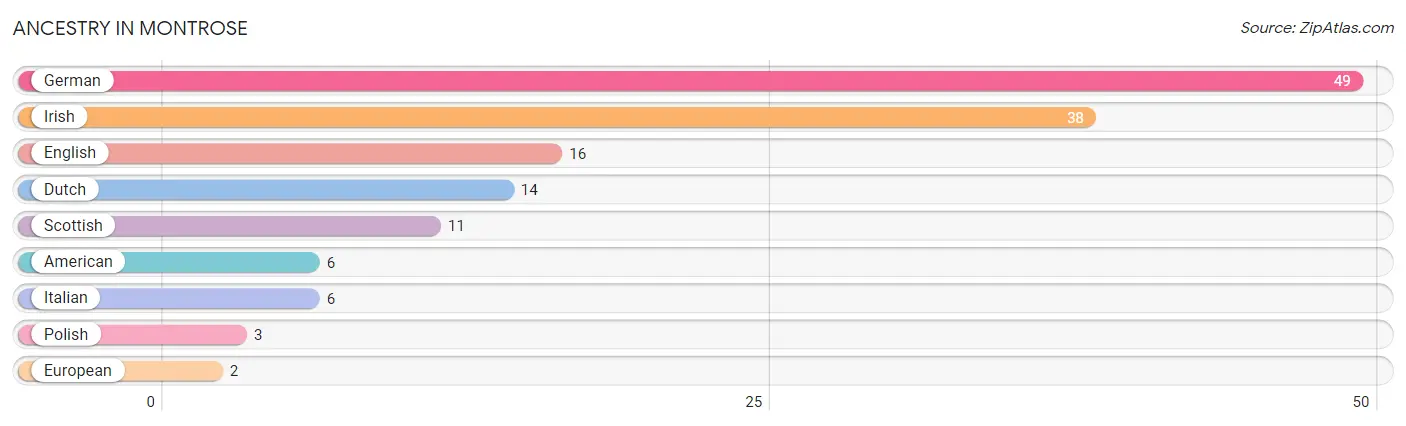
| Ancestry | # Population | % Population |
| American | 6 | 1.9% |
| Dutch | 14 | 4.5% |
| English | 16 | 5.1% |
| European | 2 | 0.6% |
| German | 49 | 15.6% |
| Irish | 38 | 12.1% |
| Italian | 6 | 1.9% |
| Polish | 3 | 1.0% |
| Scottish | 11 | 3.5% | View All 9 Rows |
Immigrants in Montrose

| Immigration Origin | # Population | % Population | View All 0 Rows |
Sex and Age in Montrose
Sex and Age in Montrose
The most populous age groups in Montrose are Under 5 Years (119 | 55.1%) for men and 20 to 24 Years (20 | 20.4%) for women.
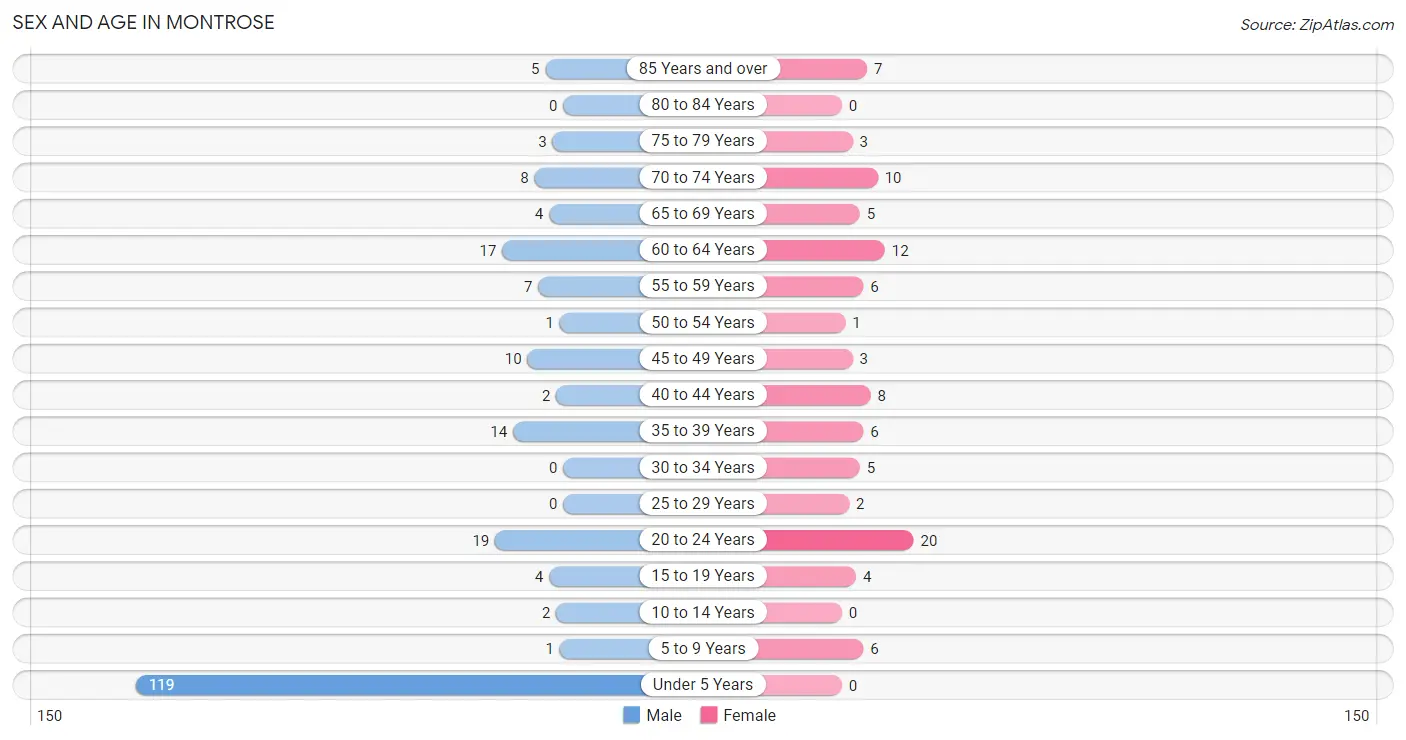
| Age Bracket | Male | Female |
| Under 5 Years | 119 (55.1%) | 0 (0.0%) |
| 5 to 9 Years | 1 (0.5%) | 6 (6.1%) |
| 10 to 14 Years | 2 (0.9%) | 0 (0.0%) |
| 15 to 19 Years | 4 (1.8%) | 4 (4.1%) |
| 20 to 24 Years | 19 (8.8%) | 20 (20.4%) |
| 25 to 29 Years | 0 (0.0%) | 2 (2.0%) |
| 30 to 34 Years | 0 (0.0%) | 5 (5.1%) |
| 35 to 39 Years | 14 (6.5%) | 6 (6.1%) |
| 40 to 44 Years | 2 (0.9%) | 8 (8.2%) |
| 45 to 49 Years | 10 (4.6%) | 3 (3.1%) |
| 50 to 54 Years | 1 (0.5%) | 1 (1.0%) |
| 55 to 59 Years | 7 (3.2%) | 6 (6.1%) |
| 60 to 64 Years | 17 (7.9%) | 12 (12.2%) |
| 65 to 69 Years | 4 (1.8%) | 5 (5.1%) |
| 70 to 74 Years | 8 (3.7%) | 10 (10.2%) |
| 75 to 79 Years | 3 (1.4%) | 3 (3.1%) |
| 80 to 84 Years | 0 (0.0%) | 0 (0.0%) |
| 85 Years and over | 5 (2.3%) | 7 (7.1%) |
| Total | 216 (100.0%) | 98 (100.0%) |
Families and Households in Montrose
Median Family Size in Montrose
The median family size in Montrose is 3.84 persons per family, with married-couple families (56 | 74.7%) accounting for the largest median family size of 4.29 persons per family. On the other hand, single male/father families (3 | 4.0%) represent the smallest median family size with 2.33 persons per family.
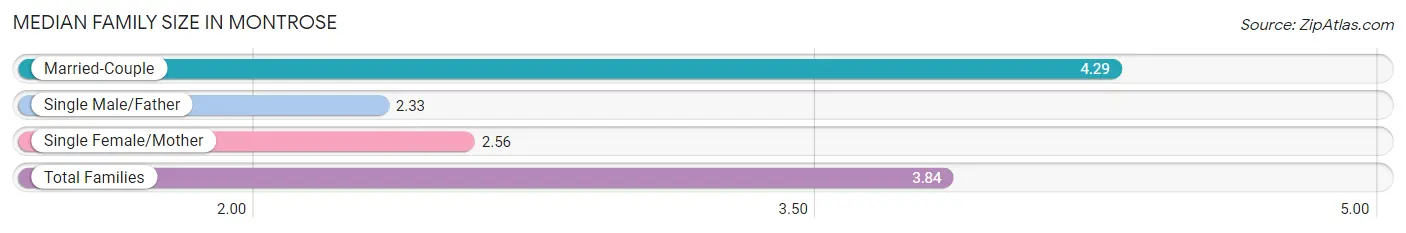
| Family Type | # Families | Family Size |
| Married-Couple | 56 (74.7%) | 4.29 |
| Single Male/Father | 3 (4.0%) | 2.33 |
| Single Female/Mother | 16 (21.3%) | 2.56 |
| Total Families | 75 (100.0%) | 3.84 |
Median Household Size in Montrose
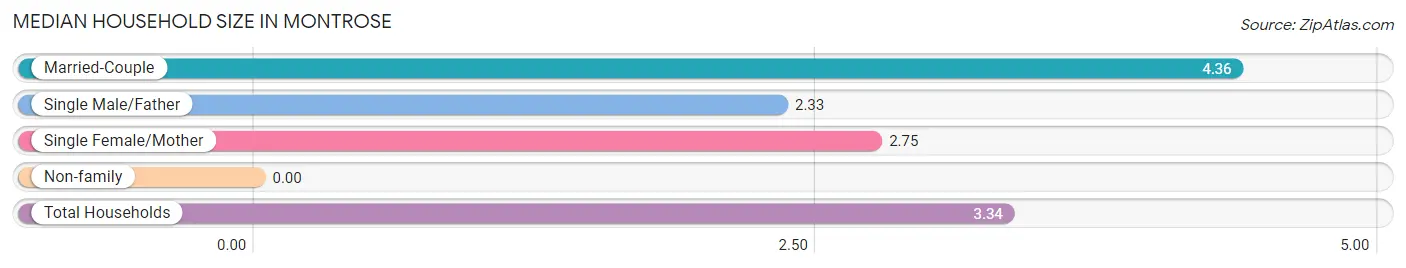
| Household Type | # Households | Household Size |
| Married-Couple | 56 (59.6%) | 4.36 |
| Single Male/Father | 3 (3.2%) | 2.33 |
| Single Female/Mother | 16 (17.0%) | 2.75 |
| Non-family | 19 (20.2%) | - |
| Total Households | 94 (100.0%) | 3.34 |
Household Size by Marriage Status in Montrose
Out of a total of 94 households in Montrose, 75 (79.8%) are family households, while 19 (20.2%) are nonfamily households. The most numerous type of family households are 2-person households, comprising 42, and the most common type of nonfamily households are 1-person households, comprising 19.
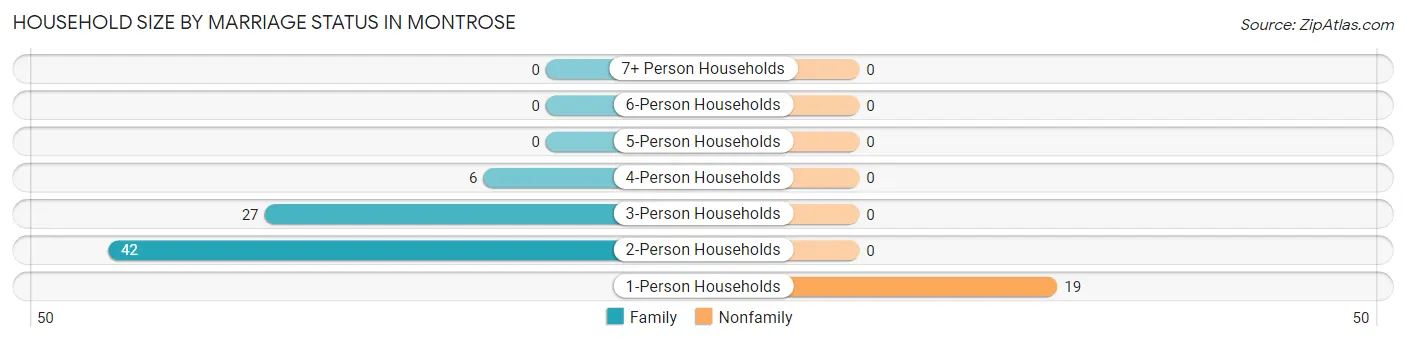
| Household Size | Family Households | Nonfamily Households |
| 1-Person Households | - | 19 (20.2%) |
| 2-Person Households | 42 (44.7%) | 0 (0.0%) |
| 3-Person Households | 27 (28.7%) | 0 (0.0%) |
| 4-Person Households | 6 (6.4%) | 0 (0.0%) |
| 5-Person Households | 0 (0.0%) | 0 (0.0%) |
| 6-Person Households | 0 (0.0%) | 0 (0.0%) |
| 7+ Person Households | 0 (0.0%) | 0 (0.0%) |
| Total | 75 (79.8%) | 19 (20.2%) |
Female Fertility in Montrose
Fertility by Age in Montrose
Average fertility rate in Montrose is 417.0 births per 1,000 women. Women in the age bracket of 20 to 34 years have the highest fertility rate with 741.0 births per 1,000 women. Women in the age bracket of 20 to 34 years acount for 100.0% of all women with births.
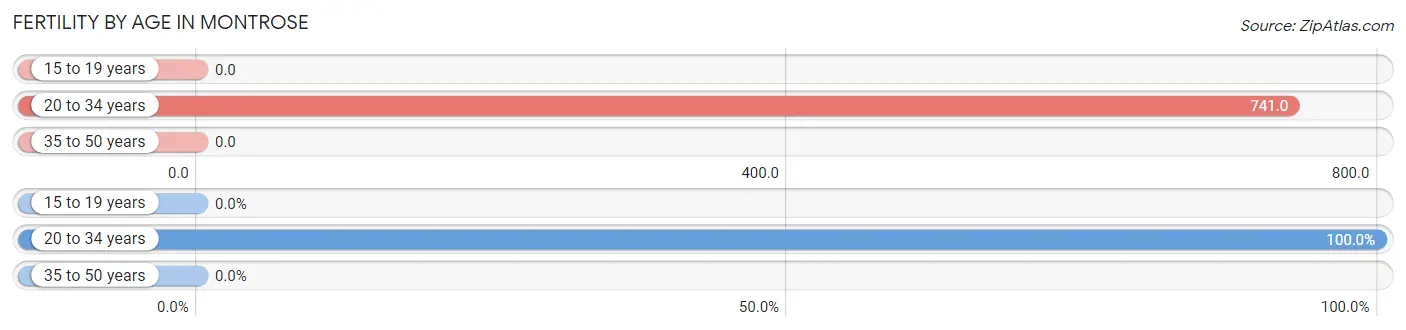
| Age Bracket | Women with Births | Births / 1,000 Women |
| 15 to 19 years | 0 (0.0%) | 0.0 |
| 20 to 34 years | 20 (100.0%) | 741.0 |
| 35 to 50 years | 0 (0.0%) | 0.0 |
| Total | 20 (100.0%) | 417.0 |
Fertility by Age by Marriage Status in Montrose
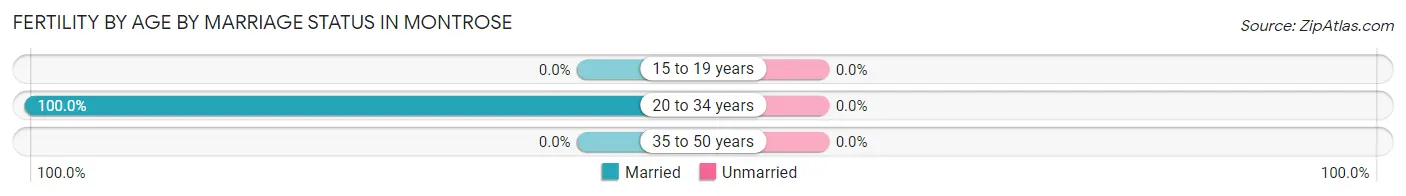
| Age Bracket | Married | Unmarried |
| 15 to 19 years | 0 (0.0%) | 0 (0.0%) |
| 20 to 34 years | 20 (100.0%) | 0 (0.0%) |
| 35 to 50 years | 0 (0.0%) | 0 (0.0%) |
| Total | 20 (100.0%) | 0 (0.0%) |
Fertility by Education in Montrose
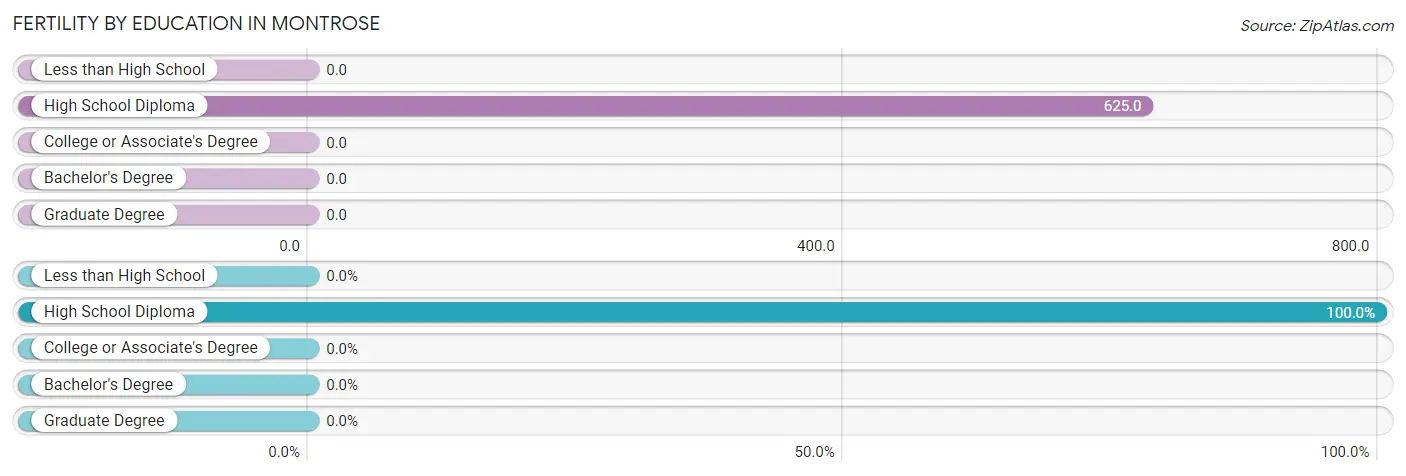
| Educational Attainment | Women with Births | Births / 1,000 Women |
| Less than High School | 0 (0.0%) | 0.0 |
| High School Diploma | 20 (100.0%) | 625.0 |
| College or Associate's Degree | 0 (0.0%) | 0.0 |
| Bachelor's Degree | 0 (0.0%) | 0.0 |
| Graduate Degree | 0 (0.0%) | 0.0 |
| Total | 20 (100.0%) | 417.0 |
Fertility by Education by Marriage Status in Montrose
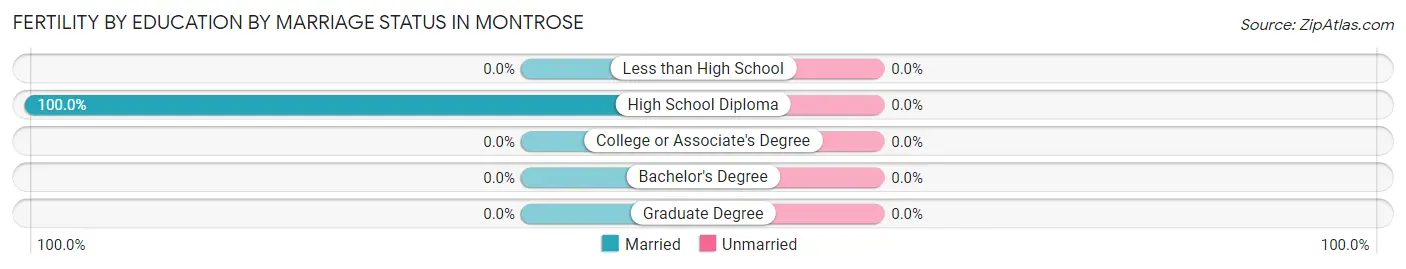
| Educational Attainment | Married | Unmarried |
| Less than High School | 0 (0.0%) | 0 (0.0%) |
| High School Diploma | 20 (100.0%) | 0 (0.0%) |
| College or Associate's Degree | 0 (0.0%) | 0 (0.0%) |
| Bachelor's Degree | 0 (0.0%) | 0 (0.0%) |
| Graduate Degree | 0 (0.0%) | 0 (0.0%) |
| Total | 20 (100.0%) | 0 (0.0%) |
Employment Characteristics in Montrose
Employment by Class of Employer in Montrose
Among the 78 employed individuals in Montrose, private company employees (43 | 55.1%), federal government employees (19 | 24.4%), and not-for-profit organizations (8 | 10.3%) make up the most common classes of employment.
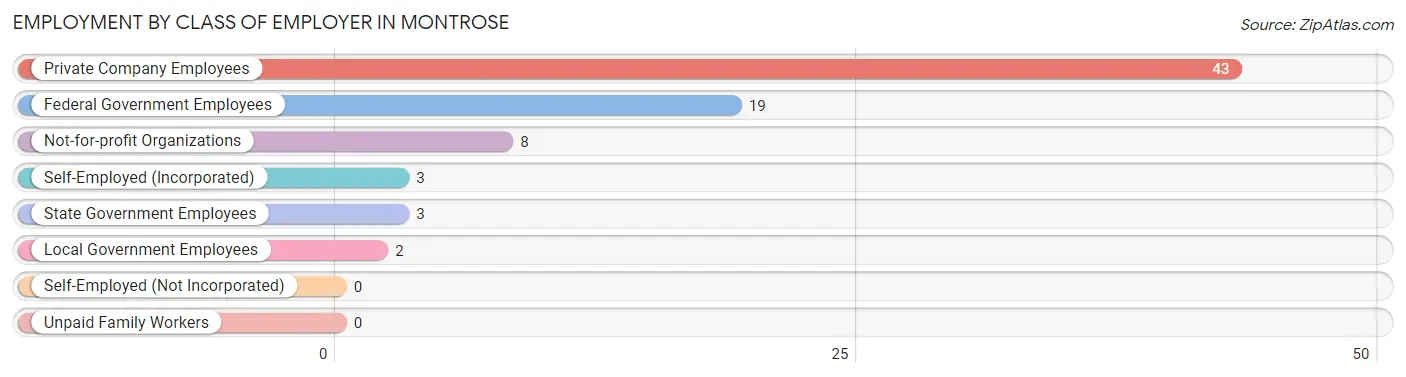
| Employer Class | # Employees | % Employees |
| Private Company Employees | 43 | 55.1% |
| Self-Employed (Incorporated) | 3 | 3.8% |
| Self-Employed (Not Incorporated) | 0 | 0.0% |
| Not-for-profit Organizations | 8 | 10.3% |
| Local Government Employees | 2 | 2.6% |
| State Government Employees | 3 | 3.8% |
| Federal Government Employees | 19 | 24.4% |
| Unpaid Family Workers | 0 | 0.0% |
| Total | 78 | 100.0% |
Employment Status by Age in Montrose
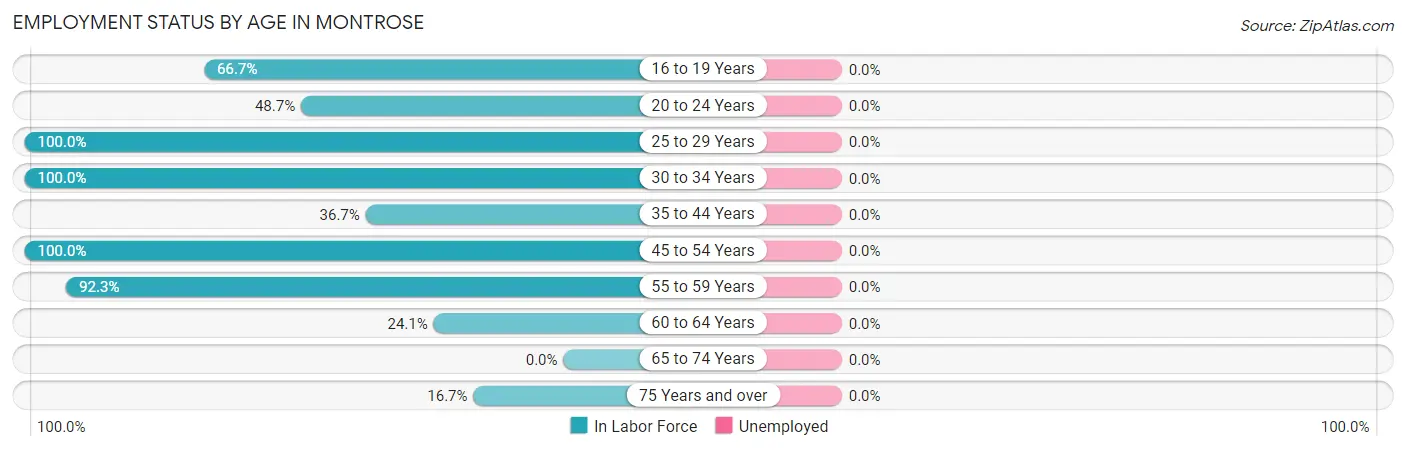
| Age Bracket | In Labor Force | Unemployed |
| 16 to 19 Years | 4 (66.7%) | 0 (0.0%) |
| 20 to 24 Years | 19 (48.7%) | 0 (0.0%) |
| 25 to 29 Years | 2 (100.0%) | 0 (0.0%) |
| 30 to 34 Years | 5 (100.0%) | 0 (0.0%) |
| 35 to 44 Years | 11 (36.7%) | 0 (0.0%) |
| 45 to 54 Years | 15 (100.0%) | 0 (0.0%) |
| 55 to 59 Years | 12 (92.3%) | 0 (0.0%) |
| 60 to 64 Years | 7 (24.1%) | 0 (0.0%) |
| 65 to 74 Years | 0 (0.0%) | 0 (0.0%) |
| 75 Years and over | 3 (16.7%) | 0 (0.0%) |
| Total | 78 (42.4%) | 0 (0.0%) |
Employment Status by Educational Attainment in Montrose
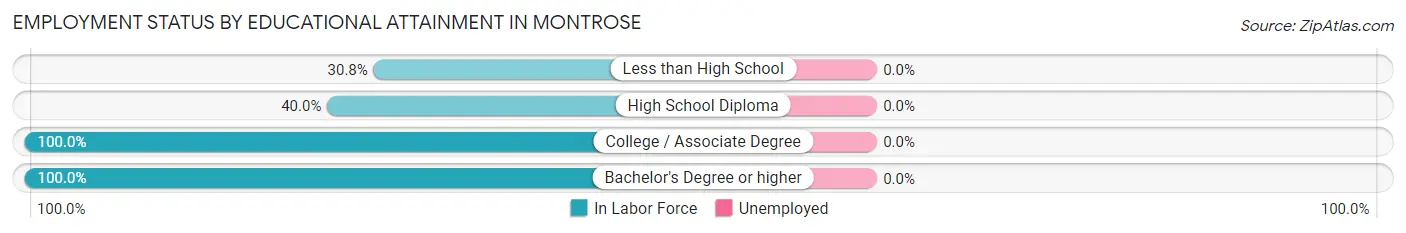
| Educational Attainment | In Labor Force | Unemployed |
| Less than High School | 4 (30.8%) | 0 (0.0%) |
| High School Diploma | 22 (40.0%) | 0 (0.0%) |
| College / Associate Degree | 8 (100.0%) | 0 (0.0%) |
| Bachelor's Degree or higher | 18 (100.0%) | 0 (0.0%) |
| Total | 52 (55.3%) | 0 (0.0%) |
Employment Occupations by Sex in Montrose
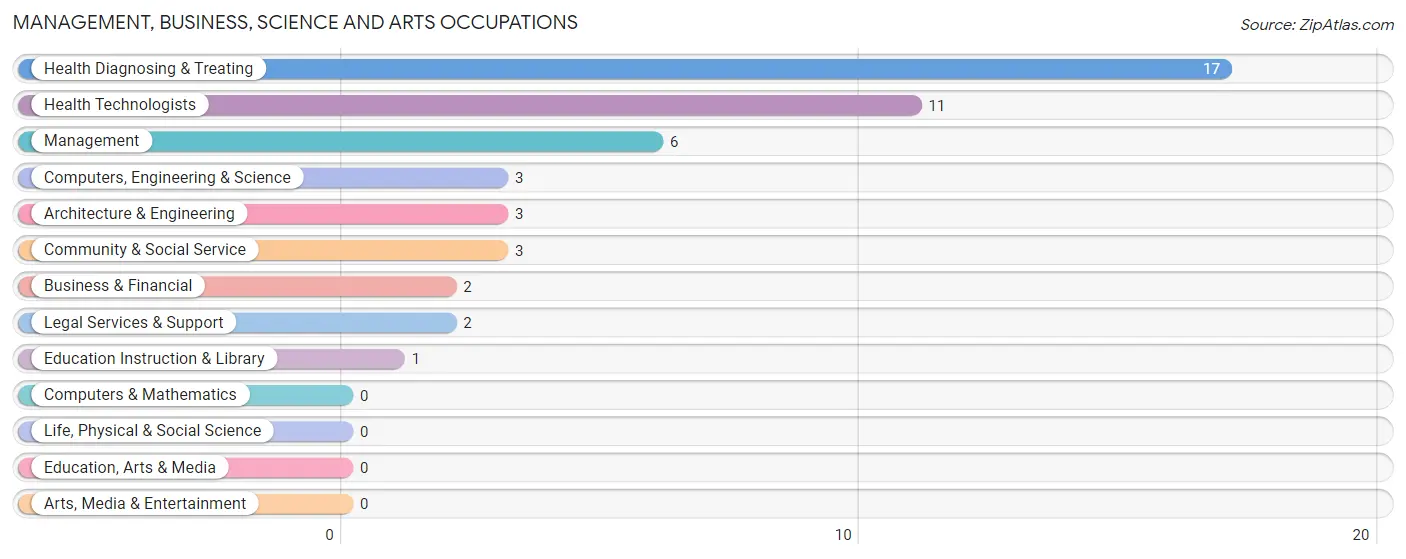
Management, Business, Science and Arts Occupations
The most common Management, Business, Science and Arts occupations in Montrose are Health Diagnosing & Treating (17 | 28.8%), Health Technologists (11 | 18.6%), Management (6 | 10.2%), Computers, Engineering & Science (3 | 5.1%), and Architecture & Engineering (3 | 5.1%).
Management, Business, Science and Arts Occupations by Sex
Within the Management, Business, Science and Arts occupations in Montrose, the most male-oriented occupations are Business & Financial (100.0%), Computers, Engineering & Science (100.0%), and Architecture & Engineering (100.0%), while the most female-oriented occupations are Legal Services & Support (100.0%), Health Diagnosing & Treating (100.0%), and Health Technologists (100.0%).
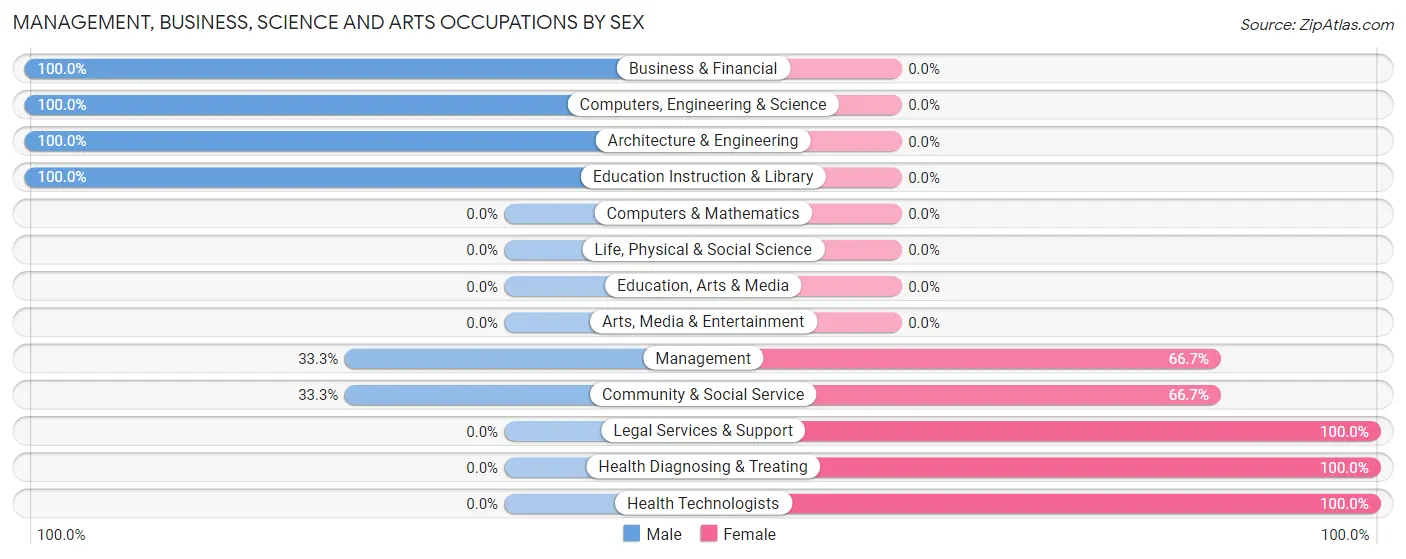
| Occupation | Male | Female |
| Management | 2 (33.3%) | 4 (66.7%) |
| Business & Financial | 2 (100.0%) | 0 (0.0%) |
| Computers, Engineering & Science | 3 (100.0%) | 0 (0.0%) |
| Computers & Mathematics | 0 (0.0%) | 0 (0.0%) |
| Architecture & Engineering | 3 (100.0%) | 0 (0.0%) |
| Life, Physical & Social Science | 0 (0.0%) | 0 (0.0%) |
| Community & Social Service | 1 (33.3%) | 2 (66.7%) |
| Education, Arts & Media | 0 (0.0%) | 0 (0.0%) |
| Legal Services & Support | 0 (0.0%) | 2 (100.0%) |
| Education Instruction & Library | 1 (100.0%) | 0 (0.0%) |
| Arts, Media & Entertainment | 0 (0.0%) | 0 (0.0%) |
| Health Diagnosing & Treating | 0 (0.0%) | 17 (100.0%) |
| Health Technologists | 0 (0.0%) | 11 (100.0%) |
| Total (Category) | 8 (25.8%) | 23 (74.2%) |
| Total (Overall) | 35 (59.3%) | 24 (40.7%) |
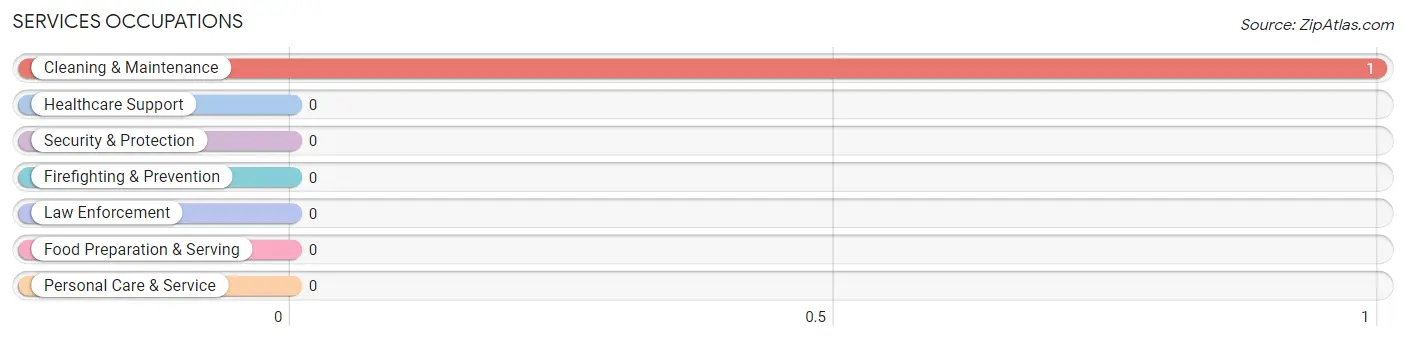
Services Occupations
The most common Services occupations in Montrose are , and Cleaning & Maintenance (1 | 1.7%).
Services Occupations by Sex
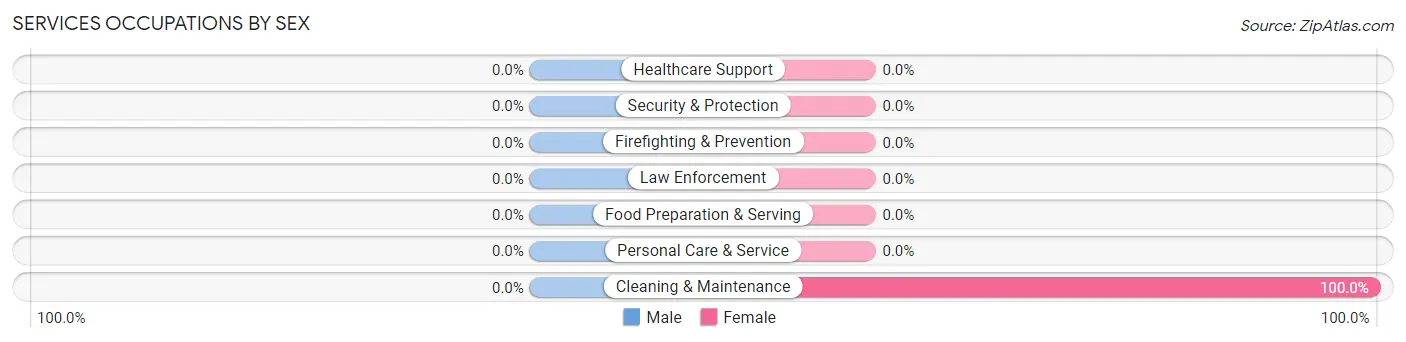
| Occupation | Male | Female |
| Healthcare Support | 0 (0.0%) | 0 (0.0%) |
| Security & Protection | 0 (0.0%) | 0 (0.0%) |
| Firefighting & Prevention | 0 (0.0%) | 0 (0.0%) |
| Law Enforcement | 0 (0.0%) | 0 (0.0%) |
| Food Preparation & Serving | 0 (0.0%) | 0 (0.0%) |
| Cleaning & Maintenance | 0 (0.0%) | 1 (100.0%) |
| Personal Care & Service | 0 (0.0%) | 0 (0.0%) |
| Total (Category) | 0 (0.0%) | 1 (100.0%) |
| Total (Overall) | 35 (59.3%) | 24 (40.7%) |
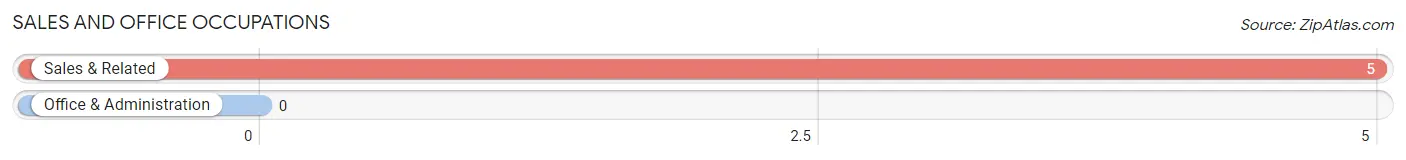
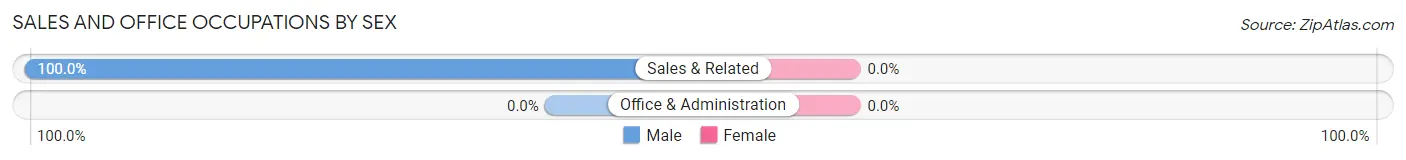
Sales and Office Occupations
The most common Sales and Office occupations in Montrose are , and Sales & Related (5 | 8.5%).
Sales and Office Occupations by Sex
| Occupation | Male | Female |
| Sales & Related | 5 (100.0%) | 0 (0.0%) |
| Office & Administration | 0 (0.0%) | 0 (0.0%) |
| Total (Category) | 5 (100.0%) | 0 (0.0%) |
| Total (Overall) | 35 (59.3%) | 24 (40.7%) |
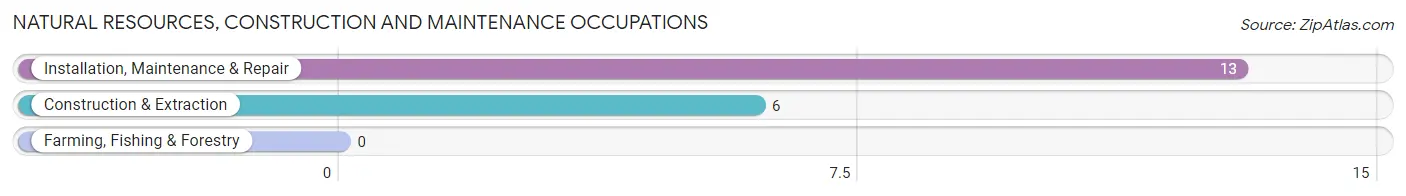
Natural Resources, Construction and Maintenance Occupations
The most common Natural Resources, Construction and Maintenance occupations in Montrose are Installation, Maintenance & Repair (13 | 22.0%), and Construction & Extraction (6 | 10.2%).
Natural Resources, Construction and Maintenance Occupations by Sex
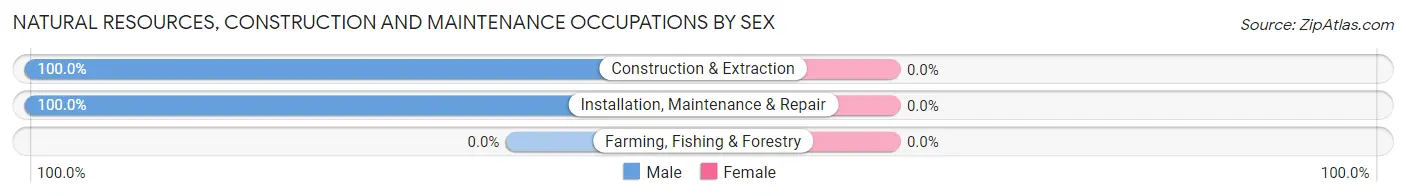
| Occupation | Male | Female |
| Farming, Fishing & Forestry | 0 (0.0%) | 0 (0.0%) |
| Construction & Extraction | 6 (100.0%) | 0 (0.0%) |
| Installation, Maintenance & Repair | 13 (100.0%) | 0 (0.0%) |
| Total (Category) | 19 (100.0%) | 0 (0.0%) |
| Total (Overall) | 35 (59.3%) | 24 (40.7%) |
Production, Transportation and Moving Occupations
The most common Production, Transportation and Moving occupations in Montrose are Production (2 | 3.4%), and Transportation (1 | 1.7%).
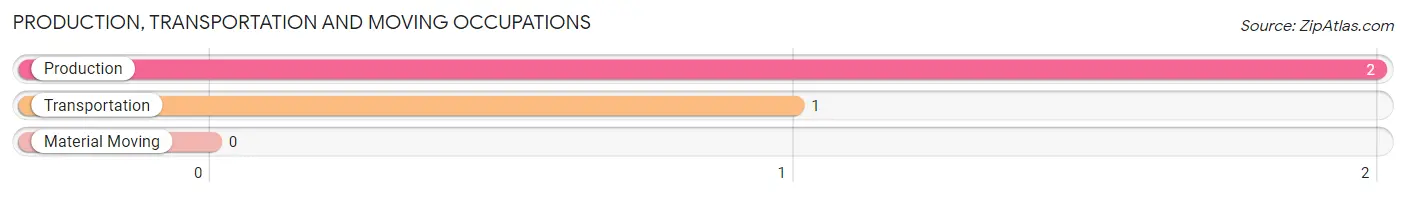
Production, Transportation and Moving Occupations by Sex
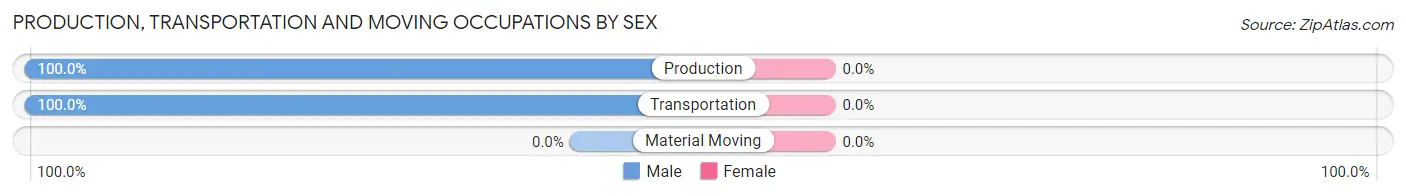
| Occupation | Male | Female |
| Production | 2 (100.0%) | 0 (0.0%) |
| Transportation | 1 (100.0%) | 0 (0.0%) |
| Material Moving | 0 (0.0%) | 0 (0.0%) |
| Total (Category) | 3 (100.0%) | 0 (0.0%) |
| Total (Overall) | 35 (59.3%) | 24 (40.7%) |
Employment Industries by Sex in Montrose
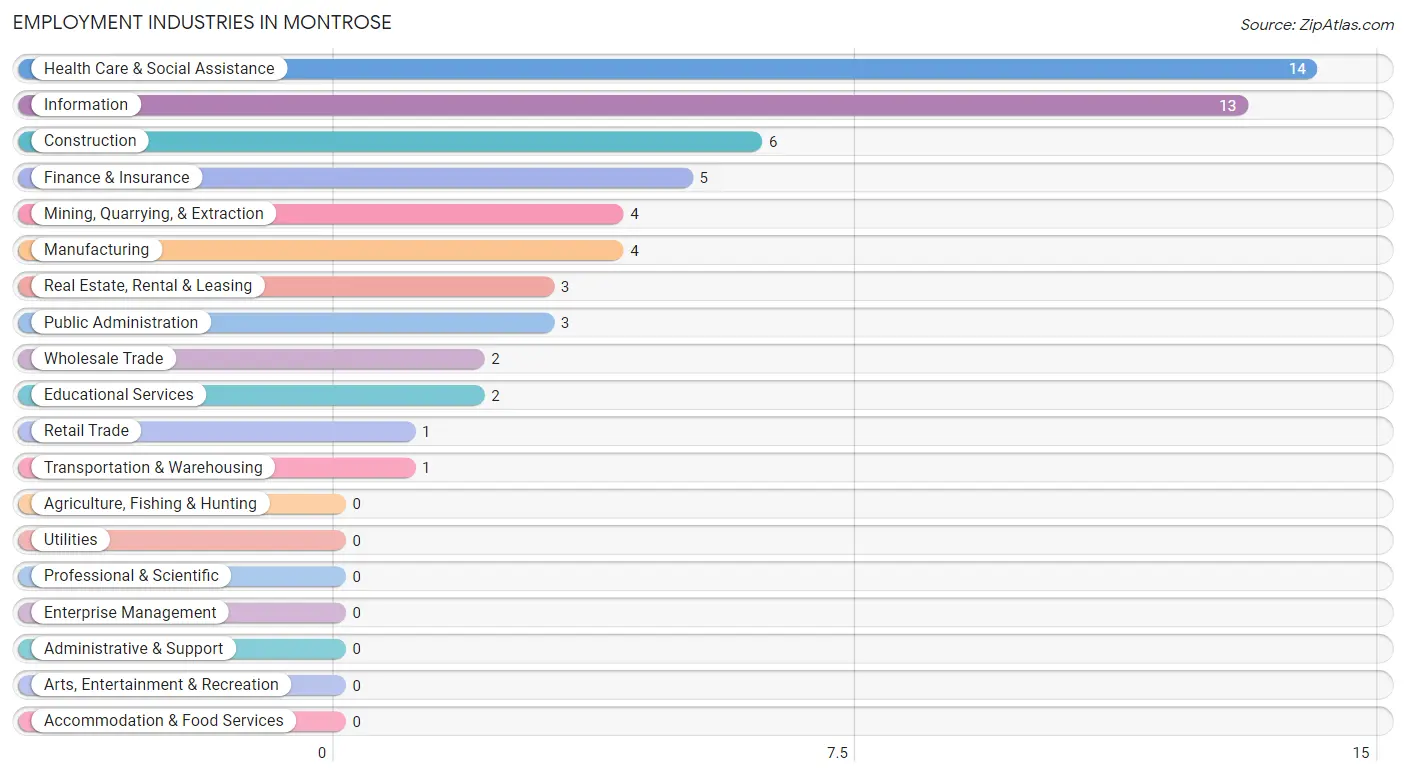
Employment Industries in Montrose
The major employment industries in Montrose include Health Care & Social Assistance (14 | 23.7%), Information (13 | 22.0%), Construction (6 | 10.2%), Finance & Insurance (5 | 8.5%), and Mining, Quarrying, & Extraction (4 | 6.8%).
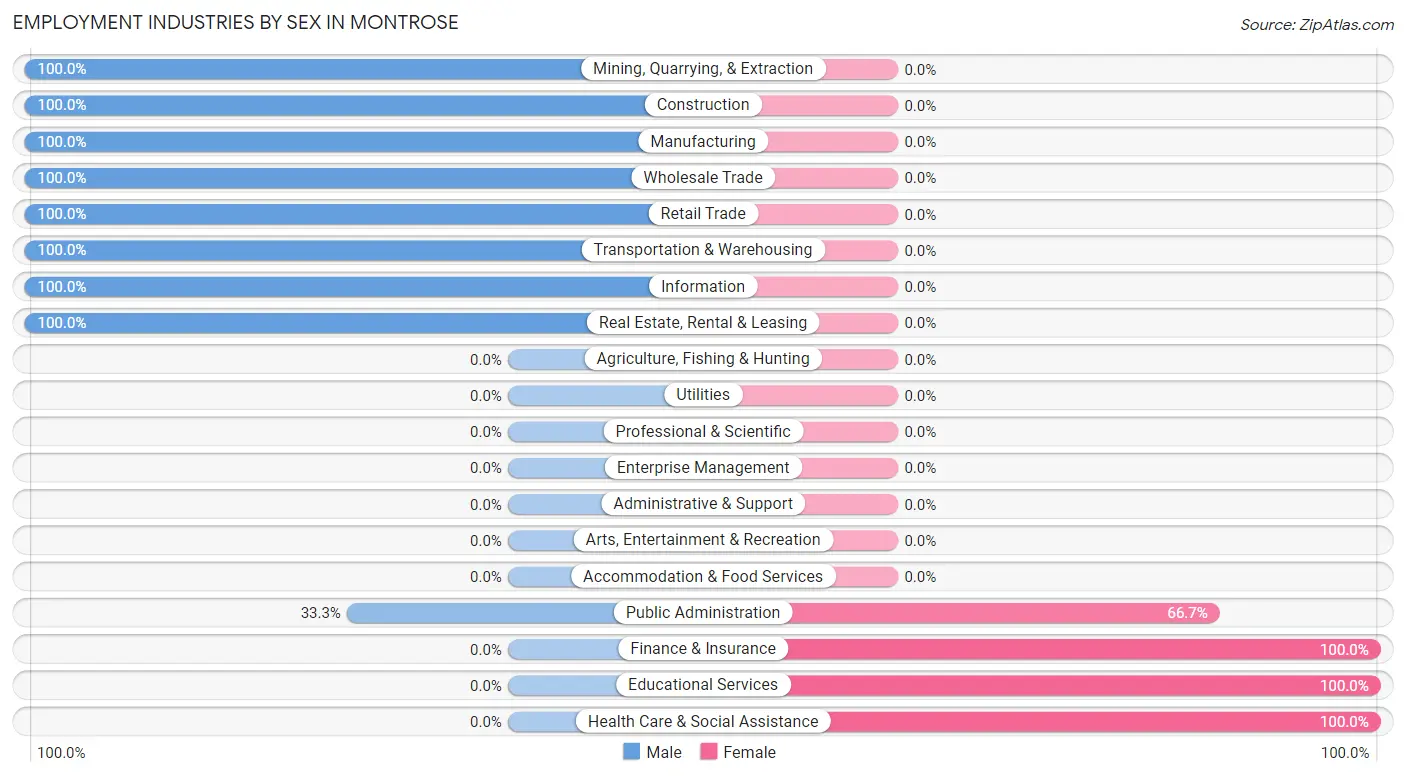
Employment Industries by Sex in Montrose
The Montrose industries that see more men than women are Mining, Quarrying, & Extraction (100.0%), Construction (100.0%), and Manufacturing (100.0%), whereas the industries that tend to have a higher number of women are Finance & Insurance (100.0%), Educational Services (100.0%), and Health Care & Social Assistance (100.0%).
| Industry | Male | Female |
| Agriculture, Fishing & Hunting | 0 (0.0%) | 0 (0.0%) |
| Mining, Quarrying, & Extraction | 4 (100.0%) | 0 (0.0%) |
| Construction | 6 (100.0%) | 0 (0.0%) |
| Manufacturing | 4 (100.0%) | 0 (0.0%) |
| Wholesale Trade | 2 (100.0%) | 0 (0.0%) |
| Retail Trade | 1 (100.0%) | 0 (0.0%) |
| Transportation & Warehousing | 1 (100.0%) | 0 (0.0%) |
| Utilities | 0 (0.0%) | 0 (0.0%) |
| Information | 13 (100.0%) | 0 (0.0%) |
| Finance & Insurance | 0 (0.0%) | 5 (100.0%) |
| Real Estate, Rental & Leasing | 3 (100.0%) | 0 (0.0%) |
| Professional & Scientific | 0 (0.0%) | 0 (0.0%) |
| Enterprise Management | 0 (0.0%) | 0 (0.0%) |
| Administrative & Support | 0 (0.0%) | 0 (0.0%) |
| Educational Services | 0 (0.0%) | 2 (100.0%) |
| Health Care & Social Assistance | 0 (0.0%) | 14 (100.0%) |
| Arts, Entertainment & Recreation | 0 (0.0%) | 0 (0.0%) |
| Accommodation & Food Services | 0 (0.0%) | 0 (0.0%) |
| Public Administration | 1 (33.3%) | 2 (66.7%) |
| Total | 35 (59.3%) | 24 (40.7%) |
Education in Montrose
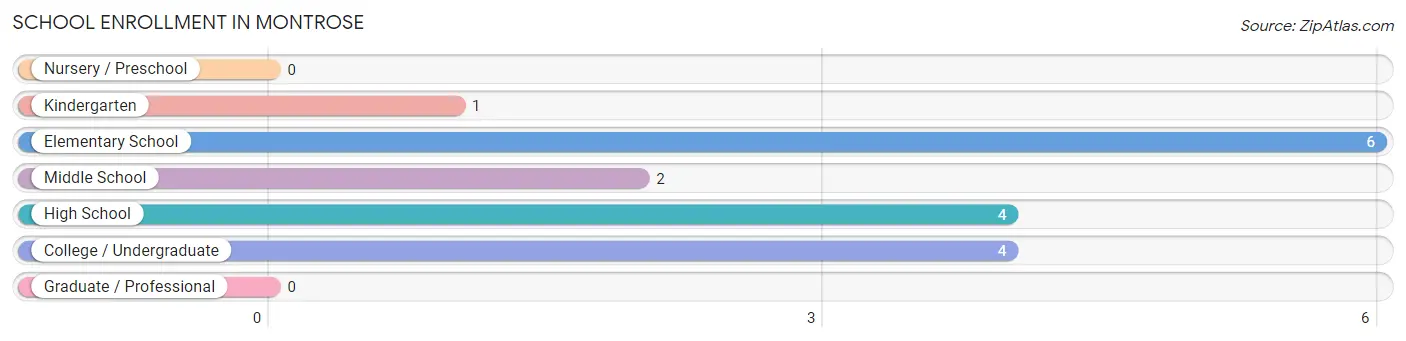
School Enrollment in Montrose
The most common levels of schooling among the 17 students in Montrose are elementary school (6 | 35.3%), high school (4 | 23.5%), and college / undergraduate (4 | 23.5%).
| School Level | # Students | % Students |
| Nursery / Preschool | 0 | 0.0% |
| Kindergarten | 1 | 5.9% |
| Elementary School | 6 | 35.3% |
| Middle School | 2 | 11.8% |
| High School | 4 | 23.5% |
| College / Undergraduate | 4 | 23.5% |
| Graduate / Professional | 0 | 0.0% |
| Total | 17 | 100.0% |
School Enrollment by Age by Funding Source in Montrose
Out of a total of 17 students who are enrolled in schools in Montrose, 4 (23.5%) attend a private institution, while the remaining 13 (76.5%) are enrolled in public schools. The age group of 15 to 17 year olds has the highest likelihood of being enrolled in private schools, with 2 (50.0% in the age bracket) enrolled. Conversely, the age group of 10 to 14 year olds has the lowest likelihood of being enrolled in a private school, with 2 (100.0% in the age bracket) attending a public institution.
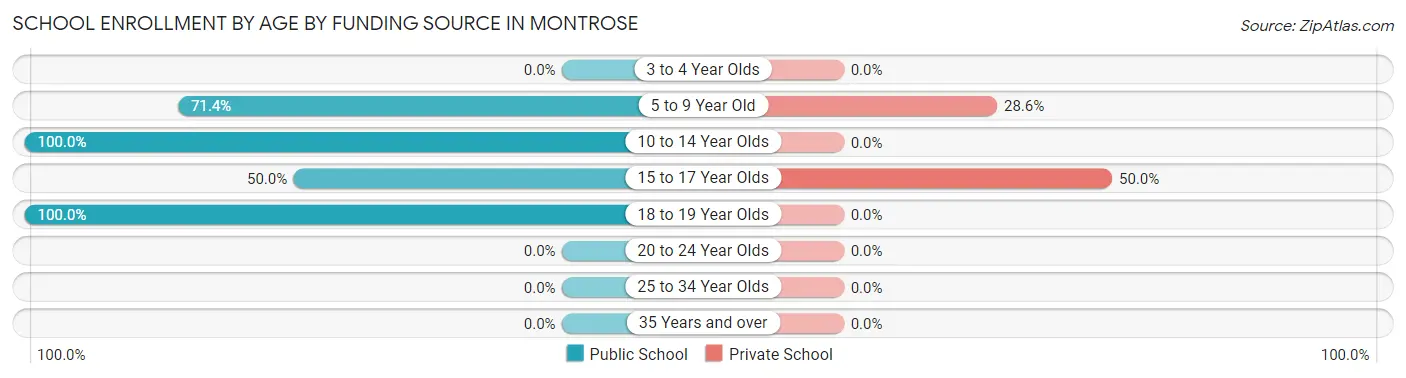
| Age Bracket | Public School | Private School |
| 3 to 4 Year Olds | 0 (0.0%) | 0 (0.0%) |
| 5 to 9 Year Old | 5 (71.4%) | 2 (28.6%) |
| 10 to 14 Year Olds | 2 (100.0%) | 0 (0.0%) |
| 15 to 17 Year Olds | 2 (50.0%) | 2 (50.0%) |
| 18 to 19 Year Olds | 4 (100.0%) | 0 (0.0%) |
| 20 to 24 Year Olds | 0 (0.0%) | 0 (0.0%) |
| 25 to 34 Year Olds | 0 (0.0%) | 0 (0.0%) |
| 35 Years and over | 0 (0.0%) | 0 (0.0%) |
| Total | 13 (76.5%) | 4 (23.5%) |
Educational Attainment by Field of Study in Montrose
Science & technology (13 | 59.1%), education (3 | 13.6%), social sciences (2 | 9.1%), business (2 | 9.1%), and communications (2 | 9.1%) are the most common fields of study among 22 individuals in Montrose who have obtained a bachelor's degree or higher.
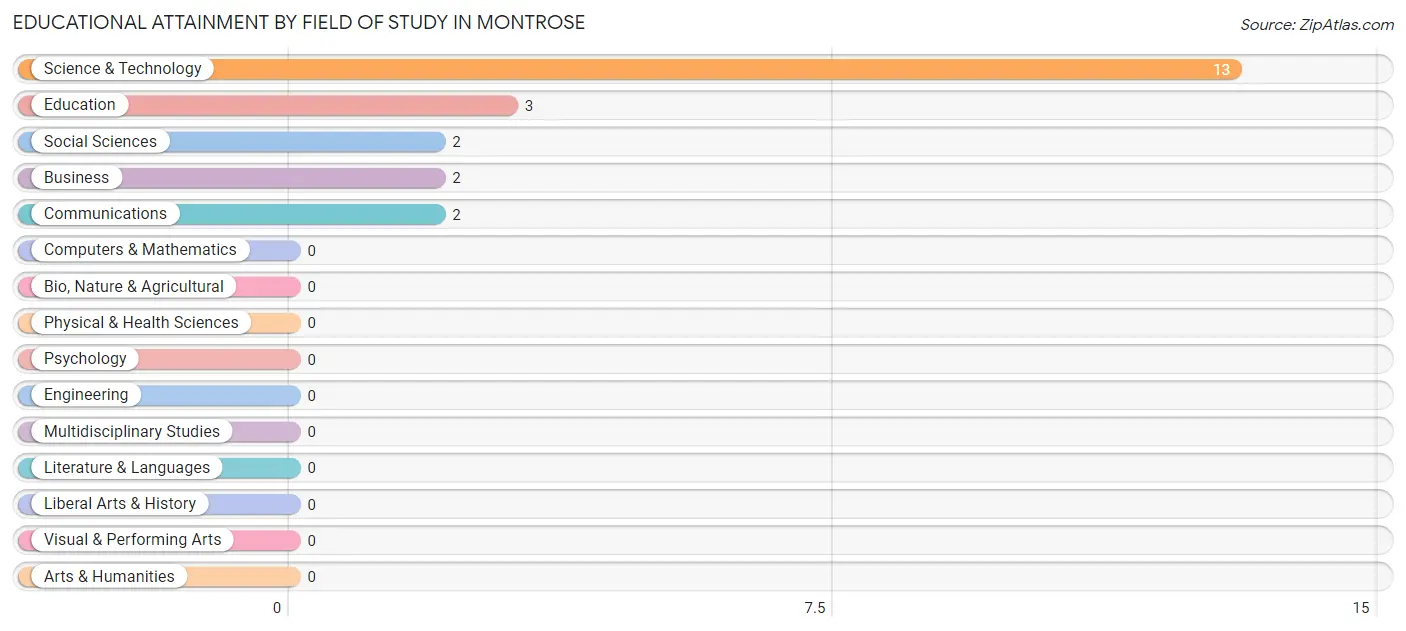
| Field of Study | # Graduates | % Graduates |
| Computers & Mathematics | 0 | 0.0% |
| Bio, Nature & Agricultural | 0 | 0.0% |
| Physical & Health Sciences | 0 | 0.0% |
| Psychology | 0 | 0.0% |
| Social Sciences | 2 | 9.1% |
| Engineering | 0 | 0.0% |
| Multidisciplinary Studies | 0 | 0.0% |
| Science & Technology | 13 | 59.1% |
| Business | 2 | 9.1% |
| Education | 3 | 13.6% |
| Literature & Languages | 0 | 0.0% |
| Liberal Arts & History | 0 | 0.0% |
| Visual & Performing Arts | 0 | 0.0% |
| Communications | 2 | 9.1% |
| Arts & Humanities | 0 | 0.0% |
| Total | 22 | 100.0% |
Transportation & Commute in Montrose
Vehicle Availability by Sex in Montrose
The most prevalent vehicle ownership categories in Montrose are males with 2 vehicles (42, accounting for 77.8%) and females with 2 vehicles (19, making up 175.0%).
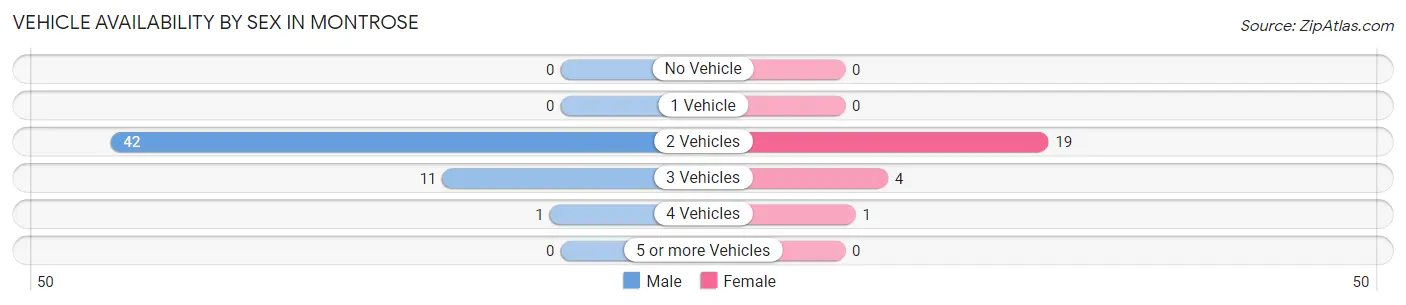
| Vehicles Available | Male | Female |
| No Vehicle | 0 (0.0%) | 0 (0.0%) |
| 1 Vehicle | 0 (0.0%) | 0 (0.0%) |
| 2 Vehicles | 42 (77.8%) | 19 (79.2%) |
| 3 Vehicles | 11 (20.4%) | 4 (16.7%) |
| 4 Vehicles | 1 (1.8%) | 1 (4.2%) |
| 5 or more Vehicles | 0 (0.0%) | 0 (0.0%) |
| Total | 54 (100.0%) | 24 (100.0%) |
Commute Time in Montrose
The most frequently occuring commute durations in Montrose are 30 to 34 minutes (37 commuters, 52.1%), 20 to 24 minutes (19 commuters, 26.8%), and 5 to 9 minutes (4 commuters, 5.6%).
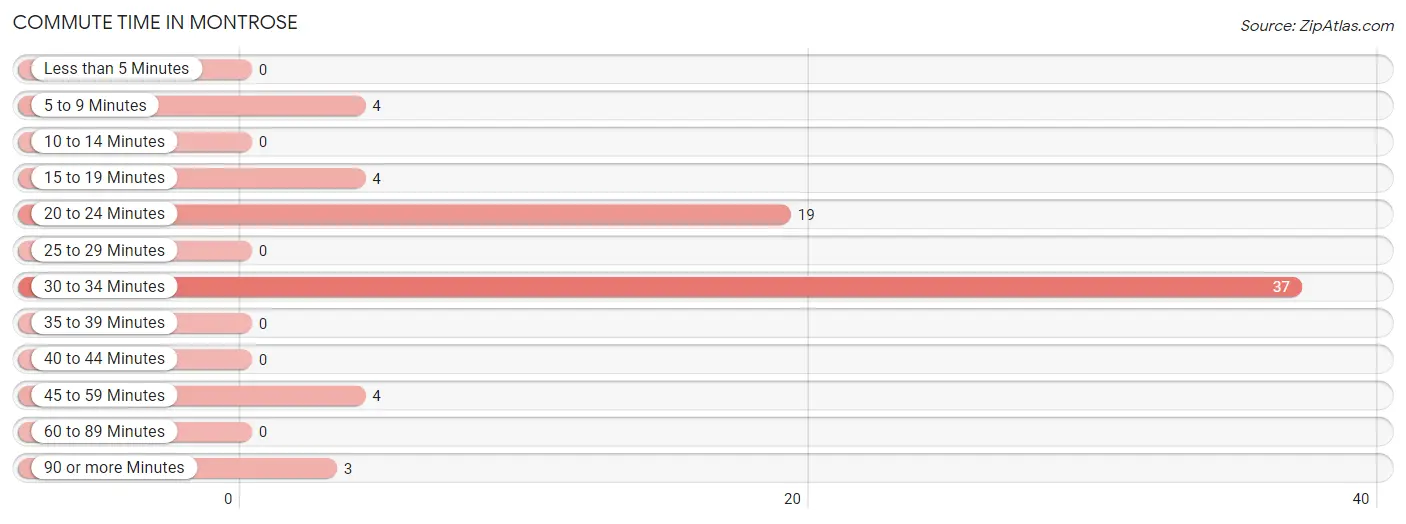
| Commute Time | # Commuters | % Commuters |
| Less than 5 Minutes | 0 | 0.0% |
| 5 to 9 Minutes | 4 | 5.6% |
| 10 to 14 Minutes | 0 | 0.0% |
| 15 to 19 Minutes | 4 | 5.6% |
| 20 to 24 Minutes | 19 | 26.8% |
| 25 to 29 Minutes | 0 | 0.0% |
| 30 to 34 Minutes | 37 | 52.1% |
| 35 to 39 Minutes | 0 | 0.0% |
| 40 to 44 Minutes | 0 | 0.0% |
| 45 to 59 Minutes | 4 | 5.6% |
| 60 to 89 Minutes | 0 | 0.0% |
| 90 or more Minutes | 3 | 4.2% |
Commute Time by Sex in Montrose
The most common commute times in Montrose are 30 to 34 minutes (30 commuters, 60.0%) for males and 20 to 24 minutes (8 commuters, 38.1%) for females.
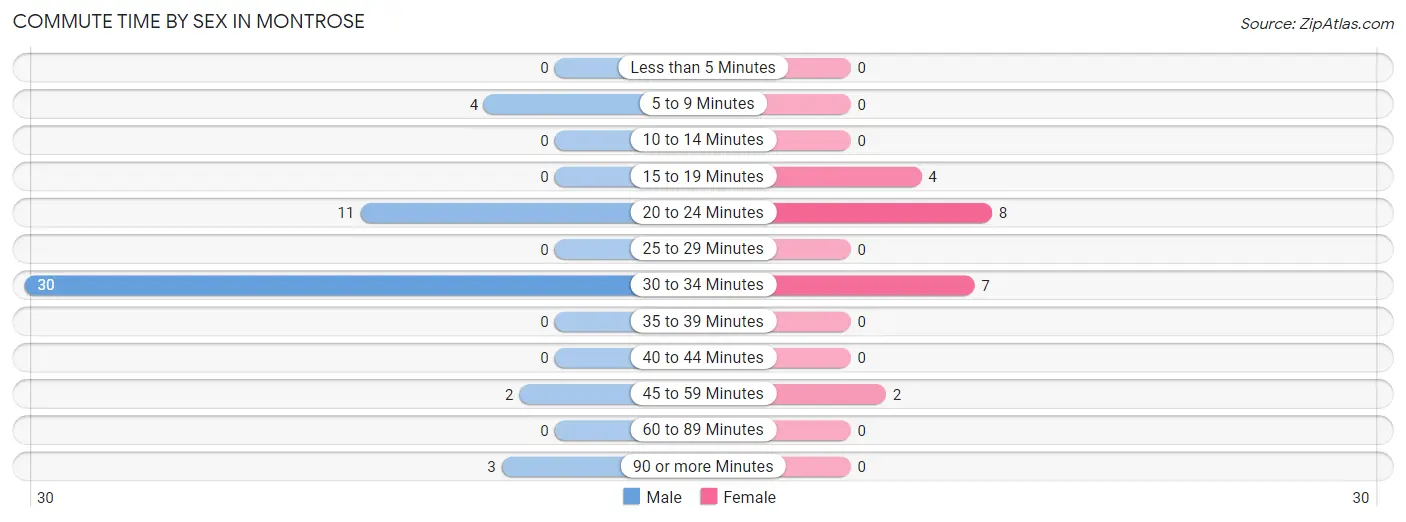
| Commute Time | Male | Female |
| Less than 5 Minutes | 0 (0.0%) | 0 (0.0%) |
| 5 to 9 Minutes | 4 (8.0%) | 0 (0.0%) |
| 10 to 14 Minutes | 0 (0.0%) | 0 (0.0%) |
| 15 to 19 Minutes | 0 (0.0%) | 4 (19.1%) |
| 20 to 24 Minutes | 11 (22.0%) | 8 (38.1%) |
| 25 to 29 Minutes | 0 (0.0%) | 0 (0.0%) |
| 30 to 34 Minutes | 30 (60.0%) | 7 (33.3%) |
| 35 to 39 Minutes | 0 (0.0%) | 0 (0.0%) |
| 40 to 44 Minutes | 0 (0.0%) | 0 (0.0%) |
| 45 to 59 Minutes | 2 (4.0%) | 2 (9.5%) |
| 60 to 89 Minutes | 0 (0.0%) | 0 (0.0%) |
| 90 or more Minutes | 3 (6.0%) | 0 (0.0%) |
Time of Departure to Work by Sex in Montrose
The most frequent times of departure to work in Montrose are 6:00 AM to 6:29 AM (24, 48.0%) for males and 4:00 PM to 11:59 PM (7, 33.3%) for females.
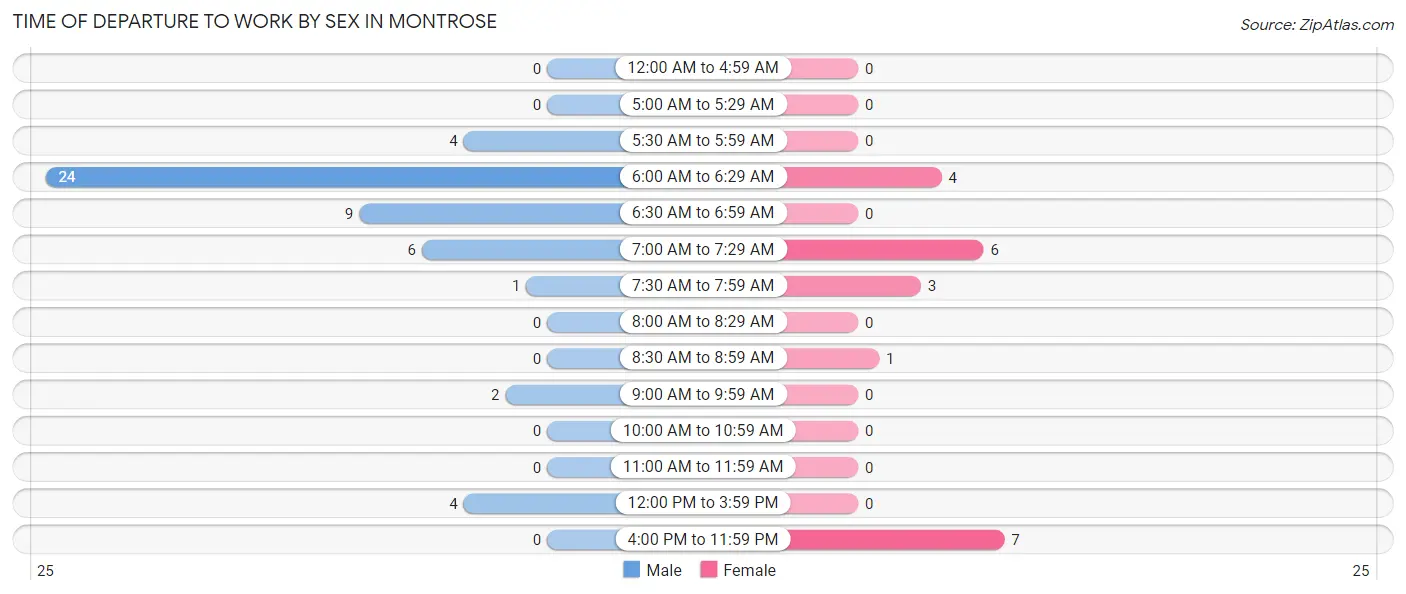
| Time of Departure | Male | Female |
| 12:00 AM to 4:59 AM | 0 (0.0%) | 0 (0.0%) |
| 5:00 AM to 5:29 AM | 0 (0.0%) | 0 (0.0%) |
| 5:30 AM to 5:59 AM | 4 (8.0%) | 0 (0.0%) |
| 6:00 AM to 6:29 AM | 24 (48.0%) | 4 (19.1%) |
| 6:30 AM to 6:59 AM | 9 (18.0%) | 0 (0.0%) |
| 7:00 AM to 7:29 AM | 6 (12.0%) | 6 (28.6%) |
| 7:30 AM to 7:59 AM | 1 (2.0%) | 3 (14.3%) |
| 8:00 AM to 8:29 AM | 0 (0.0%) | 0 (0.0%) |
| 8:30 AM to 8:59 AM | 0 (0.0%) | 1 (4.8%) |
| 9:00 AM to 9:59 AM | 2 (4.0%) | 0 (0.0%) |
| 10:00 AM to 10:59 AM | 0 (0.0%) | 0 (0.0%) |
| 11:00 AM to 11:59 AM | 0 (0.0%) | 0 (0.0%) |
| 12:00 PM to 3:59 PM | 4 (8.0%) | 0 (0.0%) |
| 4:00 PM to 11:59 PM | 0 (0.0%) | 7 (33.3%) |
| Total | 50 (100.0%) | 21 (100.0%) |
Housing Occupancy in Montrose
Occupancy by Ownership in Montrose
Of the total 94 dwellings in Montrose, owner-occupied units account for 74 (78.7%), while renter-occupied units make up 20 (21.3%).
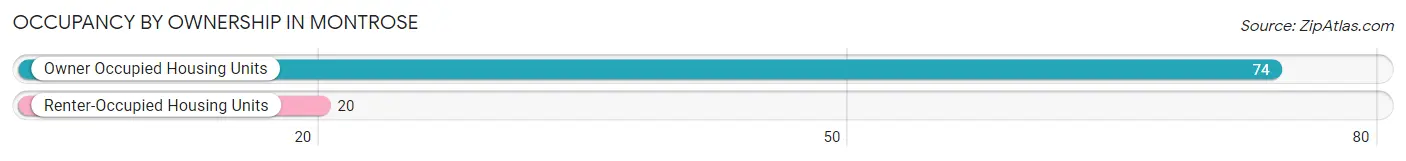
| Occupancy | # Housing Units | % Housing Units |
| Owner Occupied Housing Units | 74 | 78.7% |
| Renter-Occupied Housing Units | 20 | 21.3% |
| Total Occupied Housing Units | 94 | 100.0% |
Occupancy by Household Size in Montrose
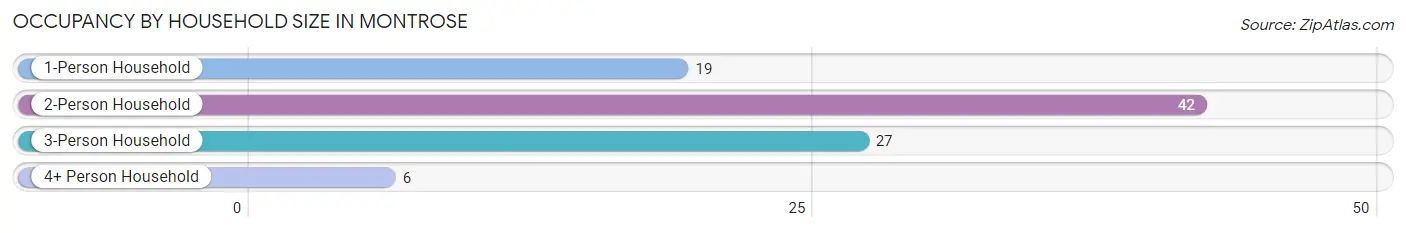
| Household Size | # Housing Units | % Housing Units |
| 1-Person Household | 19 | 20.2% |
| 2-Person Household | 42 | 44.7% |
| 3-Person Household | 27 | 28.7% |
| 4+ Person Household | 6 | 6.4% |
| Total Housing Units | 94 | 100.0% |
Occupancy by Ownership by Household Size in Montrose
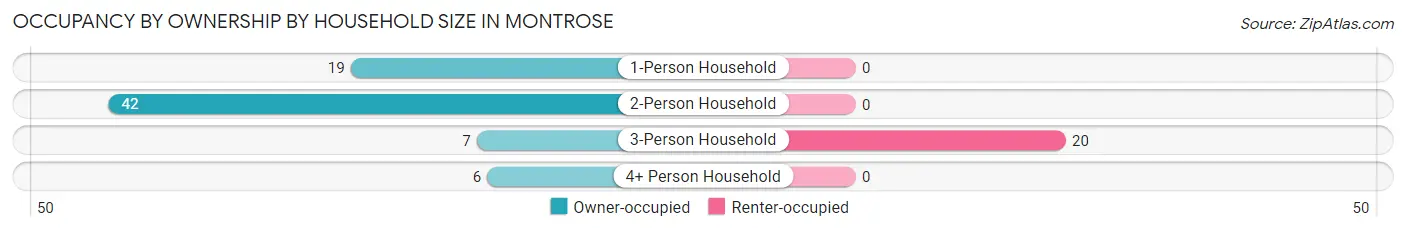
| Household Size | Owner-occupied | Renter-occupied |
| 1-Person Household | 19 (100.0%) | 0 (0.0%) |
| 2-Person Household | 42 (100.0%) | 0 (0.0%) |
| 3-Person Household | 7 (25.9%) | 20 (74.1%) |
| 4+ Person Household | 6 (100.0%) | 0 (0.0%) |
| Total Housing Units | 74 (78.7%) | 20 (21.3%) |
Occupancy by Educational Attainment in Montrose
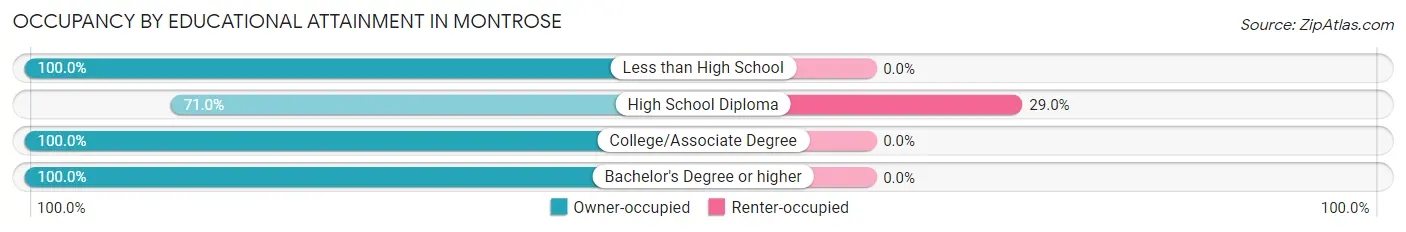
| Household Size | Owner-occupied | Renter-occupied |
| Less than High School | 3 (100.0%) | 0 (0.0%) |
| High School Diploma | 49 (71.0%) | 20 (29.0%) |
| College/Associate Degree | 8 (100.0%) | 0 (0.0%) |
| Bachelor's Degree or higher | 14 (100.0%) | 0 (0.0%) |
Occupancy by Age of Householder in Montrose
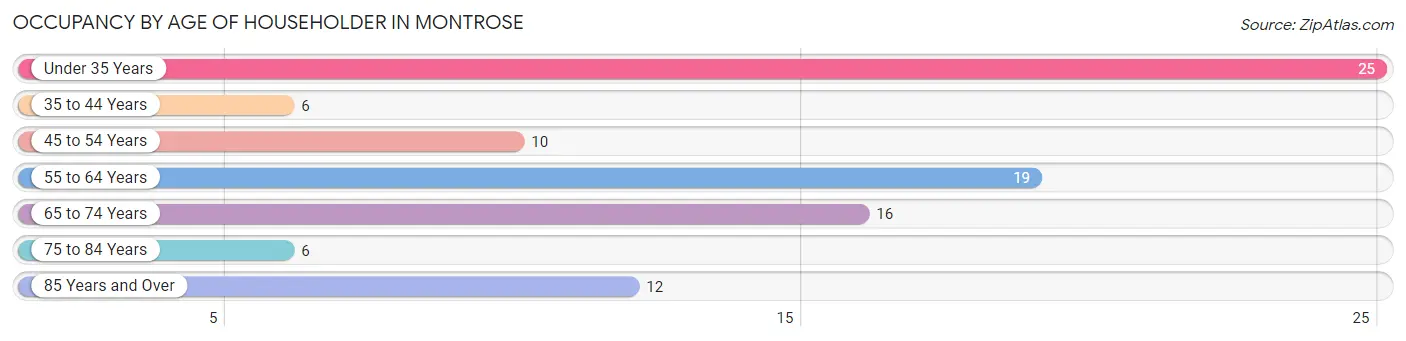
| Age Bracket | # Households | % Households |
| Under 35 Years | 25 | 26.6% |
| 35 to 44 Years | 6 | 6.4% |
| 45 to 54 Years | 10 | 10.6% |
| 55 to 64 Years | 19 | 20.2% |
| 65 to 74 Years | 16 | 17.0% |
| 75 to 84 Years | 6 | 6.4% |
| 85 Years and Over | 12 | 12.8% |
| Total | 94 | 100.0% |
Housing Finances in Montrose
Median Income by Occupancy in Montrose
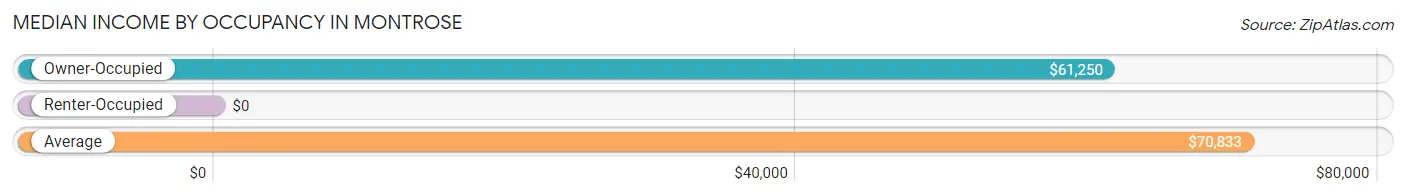
| Occupancy Type | # Households | Median Income |
| Owner-Occupied | 74 (78.7%) | $61,250 |
| Renter-Occupied | 20 (21.3%) | $0 |
| Average | 94 (100.0%) | $70,833 |
Occupancy by Householder Income Bracket in Montrose
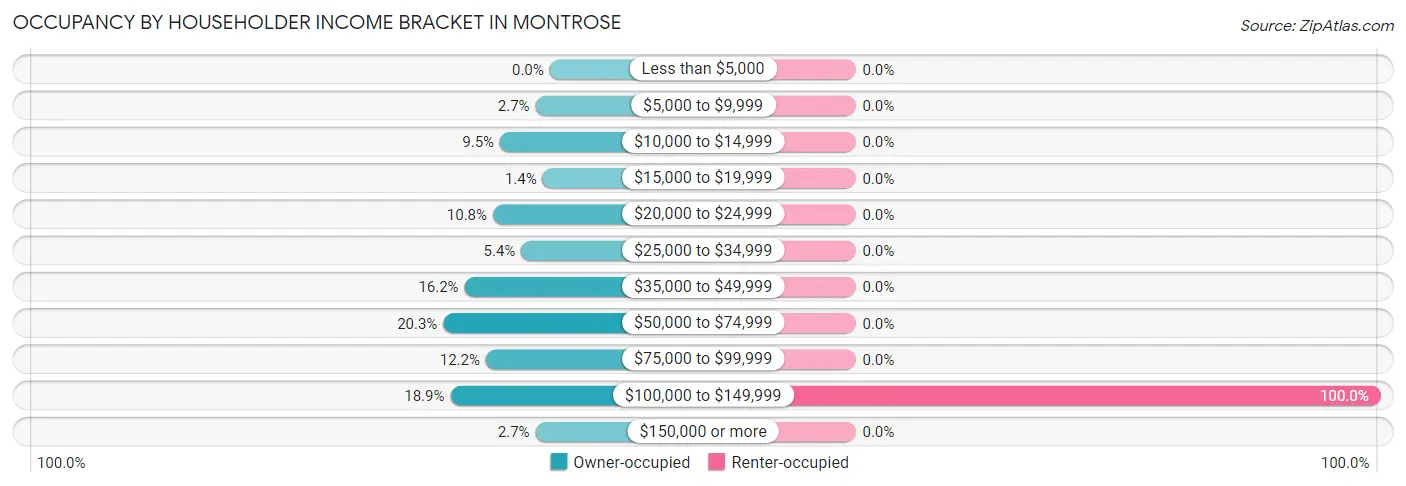
| Income Bracket | Owner-occupied | Renter-occupied |
| Less than $5,000 | 0 (0.0%) | 0 (0.0%) |
| $5,000 to $9,999 | 2 (2.7%) | 0 (0.0%) |
| $10,000 to $14,999 | 7 (9.5%) | 0 (0.0%) |
| $15,000 to $19,999 | 1 (1.3%) | 0 (0.0%) |
| $20,000 to $24,999 | 8 (10.8%) | 0 (0.0%) |
| $25,000 to $34,999 | 4 (5.4%) | 0 (0.0%) |
| $35,000 to $49,999 | 12 (16.2%) | 0 (0.0%) |
| $50,000 to $74,999 | 15 (20.3%) | 0 (0.0%) |
| $75,000 to $99,999 | 9 (12.2%) | 0 (0.0%) |
| $100,000 to $149,999 | 14 (18.9%) | 20 (100.0%) |
| $150,000 or more | 2 (2.7%) | 0 (0.0%) |
| Total | 74 (100.0%) | 20 (100.0%) |
Monthly Housing Cost Tiers in Montrose
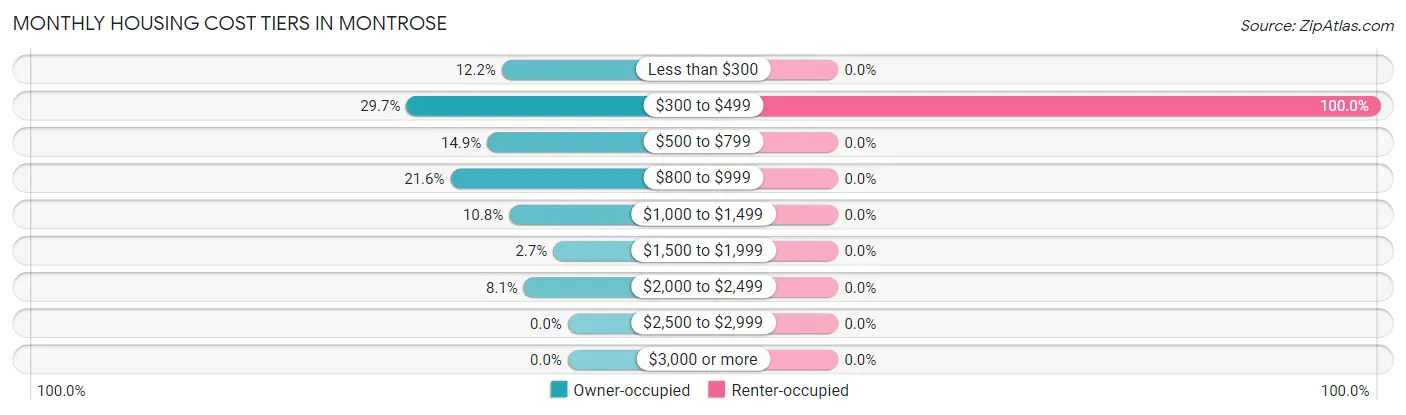
| Monthly Cost | Owner-occupied | Renter-occupied |
| Less than $300 | 9 (12.2%) | 0 (0.0%) |
| $300 to $499 | 22 (29.7%) | 20 (100.0%) |
| $500 to $799 | 11 (14.9%) | 0 (0.0%) |
| $800 to $999 | 16 (21.6%) | 0 (0.0%) |
| $1,000 to $1,499 | 8 (10.8%) | 0 (0.0%) |
| $1,500 to $1,999 | 2 (2.7%) | 0 (0.0%) |
| $2,000 to $2,499 | 6 (8.1%) | 0 (0.0%) |
| $2,500 to $2,999 | 0 (0.0%) | 0 (0.0%) |
| $3,000 or more | 0 (0.0%) | 0 (0.0%) |
| Total | 74 (100.0%) | 20 (100.0%) |
Physical Housing Characteristics in Montrose
Housing Structures in Montrose
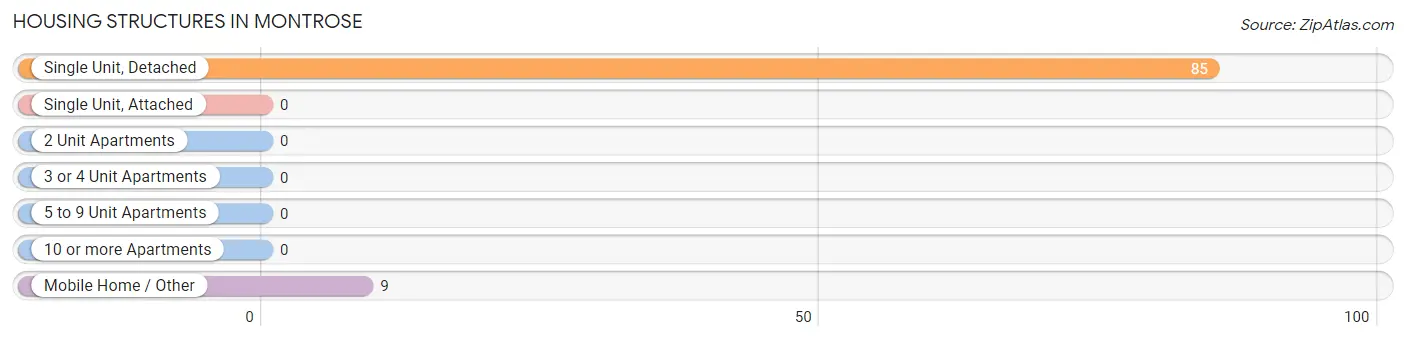
| Structure Type | # Housing Units | % Housing Units |
| Single Unit, Detached | 85 | 90.4% |
| Single Unit, Attached | 0 | 0.0% |
| 2 Unit Apartments | 0 | 0.0% |
| 3 or 4 Unit Apartments | 0 | 0.0% |
| 5 to 9 Unit Apartments | 0 | 0.0% |
| 10 or more Apartments | 0 | 0.0% |
| Mobile Home / Other | 9 | 9.6% |
| Total | 94 | 100.0% |
Housing Structures by Occupancy in Montrose
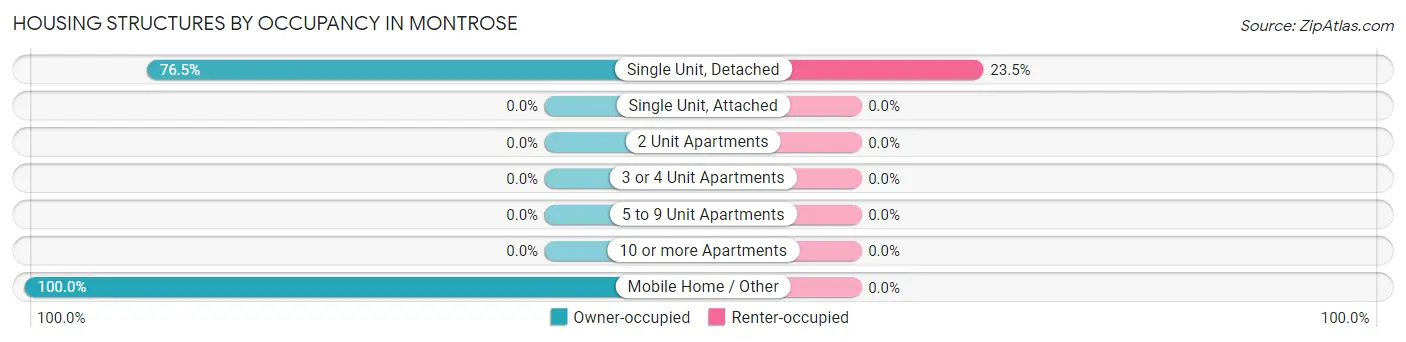
| Structure Type | Owner-occupied | Renter-occupied |
| Single Unit, Detached | 65 (76.5%) | 20 (23.5%) |
| Single Unit, Attached | 0 (0.0%) | 0 (0.0%) |
| 2 Unit Apartments | 0 (0.0%) | 0 (0.0%) |
| 3 or 4 Unit Apartments | 0 (0.0%) | 0 (0.0%) |
| 5 to 9 Unit Apartments | 0 (0.0%) | 0 (0.0%) |
| 10 or more Apartments | 0 (0.0%) | 0 (0.0%) |
| Mobile Home / Other | 9 (100.0%) | 0 (0.0%) |
| Total | 74 (78.7%) | 20 (21.3%) |
Housing Structures by Number of Rooms in Montrose
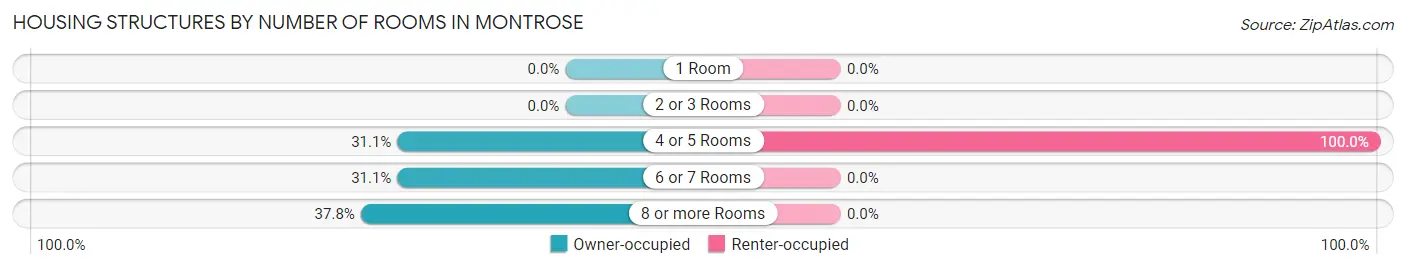
| Number of Rooms | Owner-occupied | Renter-occupied |
| 1 Room | 0 (0.0%) | 0 (0.0%) |
| 2 or 3 Rooms | 0 (0.0%) | 0 (0.0%) |
| 4 or 5 Rooms | 23 (31.1%) | 20 (100.0%) |
| 6 or 7 Rooms | 23 (31.1%) | 0 (0.0%) |
| 8 or more Rooms | 28 (37.8%) | 0 (0.0%) |
| Total | 74 (100.0%) | 20 (100.0%) |
Housing Structure by Heating Type in Montrose
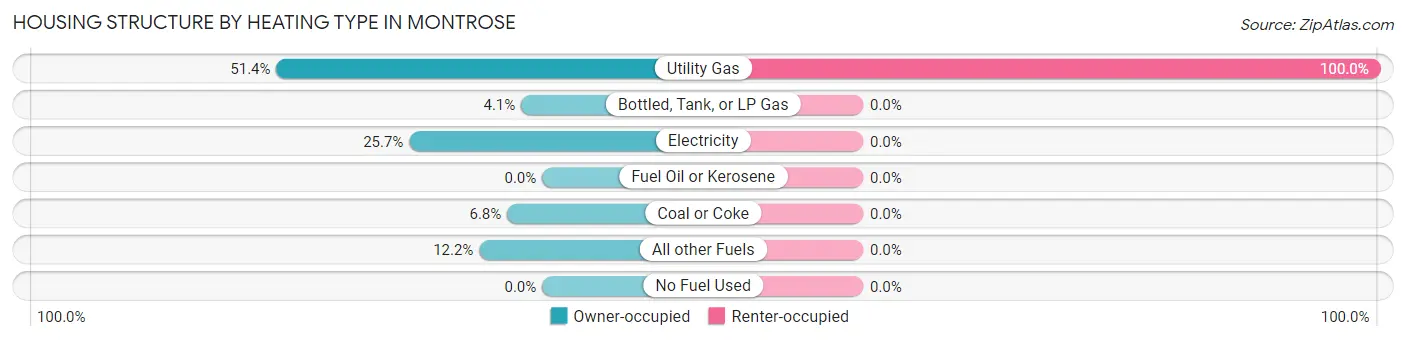
| Heating Type | Owner-occupied | Renter-occupied |
| Utility Gas | 38 (51.3%) | 20 (100.0%) |
| Bottled, Tank, or LP Gas | 3 (4.1%) | 0 (0.0%) |
| Electricity | 19 (25.7%) | 0 (0.0%) |
| Fuel Oil or Kerosene | 0 (0.0%) | 0 (0.0%) |
| Coal or Coke | 5 (6.8%) | 0 (0.0%) |
| All other Fuels | 9 (12.2%) | 0 (0.0%) |
| No Fuel Used | 0 (0.0%) | 0 (0.0%) |
| Total | 74 (100.0%) | 20 (100.0%) |
Household Vehicle Usage in Montrose
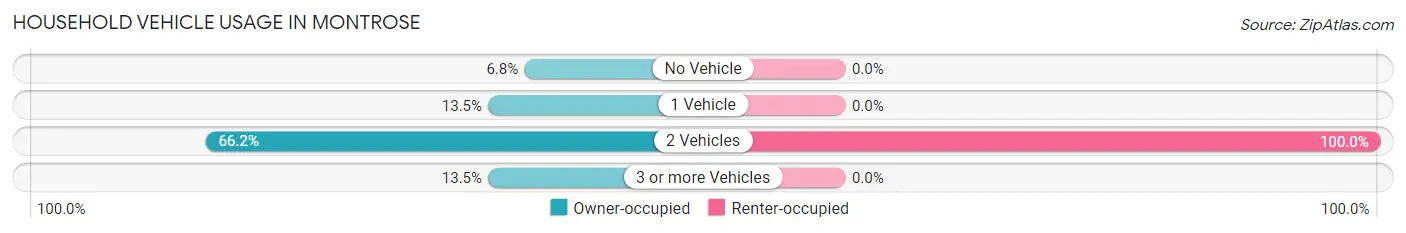
| Vehicles per Household | Owner-occupied | Renter-occupied |
| No Vehicle | 5 (6.8%) | 0 (0.0%) |
| 1 Vehicle | 10 (13.5%) | 0 (0.0%) |
| 2 Vehicles | 49 (66.2%) | 20 (100.0%) |
| 3 or more Vehicles | 10 (13.5%) | 0 (0.0%) |
| Total | 74 (100.0%) | 20 (100.0%) |
Real Estate & Mortgages in Montrose
Real Estate and Mortgage Overview in Montrose
| Characteristic | Without Mortgage | With Mortgage |
| Housing Units | 36 | 38 |
| Median Property Value | $175,000 | $177,500 |
| Median Household Income | - | - |
| Monthly Housing Costs | $350 | $0 |
| Real Estate Taxes | $625 | $0 |
Property Value by Mortgage Status in Montrose
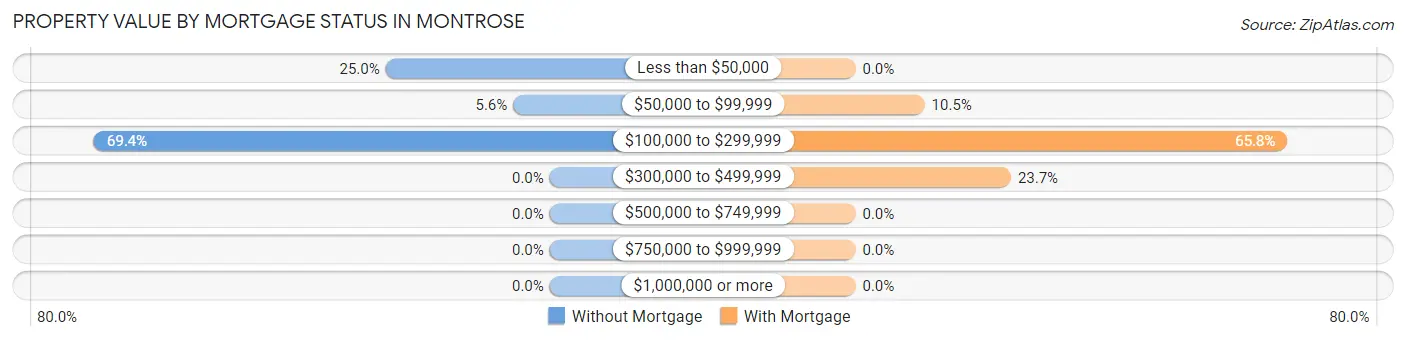
| Property Value | Without Mortgage | With Mortgage |
| Less than $50,000 | 9 (25.0%) | 0 (0.0%) |
| $50,000 to $99,999 | 2 (5.6%) | 4 (10.5%) |
| $100,000 to $299,999 | 25 (69.4%) | 25 (65.8%) |
| $300,000 to $499,999 | 0 (0.0%) | 9 (23.7%) |
| $500,000 to $749,999 | 0 (0.0%) | 0 (0.0%) |
| $750,000 to $999,999 | 0 (0.0%) | 0 (0.0%) |
| $1,000,000 or more | 0 (0.0%) | 0 (0.0%) |
| Total | 36 (100.0%) | 38 (100.0%) |
Household Income by Mortgage Status in Montrose
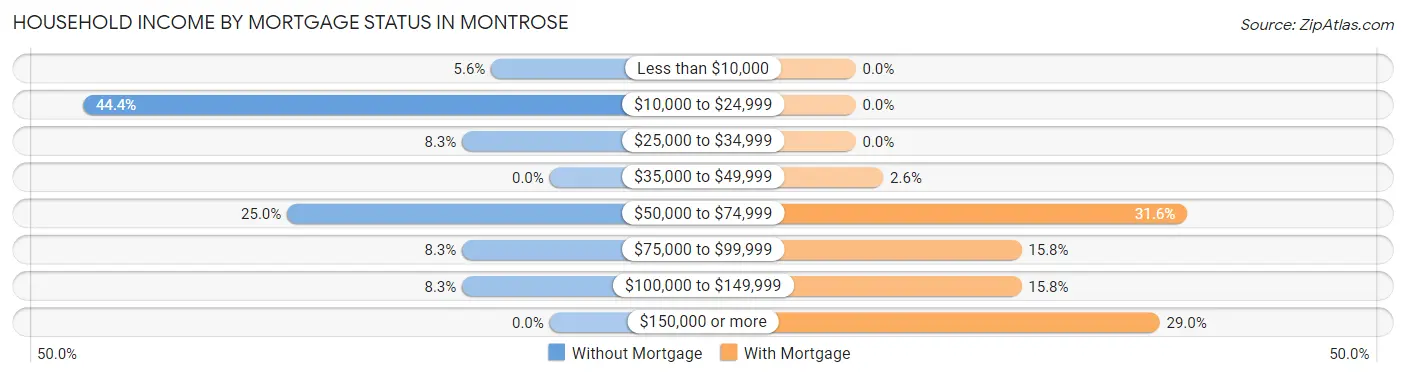
| Household Income | Without Mortgage | With Mortgage |
| Less than $10,000 | 2 (5.6%) | 0 (0.0%) |
| $10,000 to $24,999 | 16 (44.4%) | 0 (0.0%) |
| $25,000 to $34,999 | 3 (8.3%) | 0 (0.0%) |
| $35,000 to $49,999 | 0 (0.0%) | 1 (2.6%) |
| $50,000 to $74,999 | 9 (25.0%) | 12 (31.6%) |
| $75,000 to $99,999 | 3 (8.3%) | 6 (15.8%) |
| $100,000 to $149,999 | 3 (8.3%) | 6 (15.8%) |
| $150,000 or more | 0 (0.0%) | 11 (28.9%) |
| Total | 36 (100.0%) | 38 (100.0%) |
Property Value to Household Income Ratio in Montrose
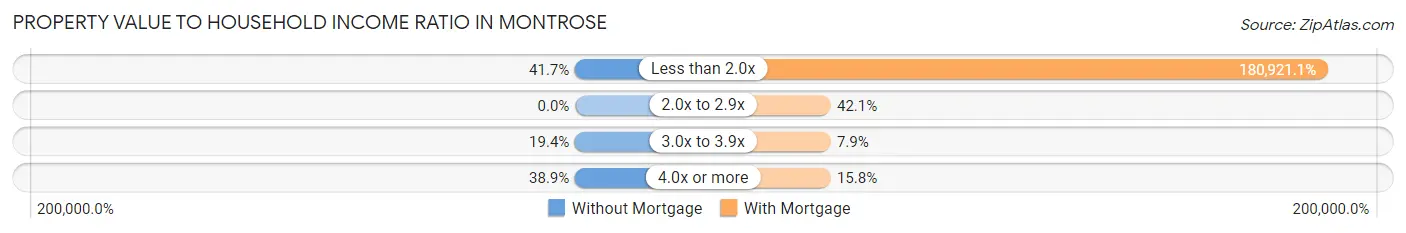
| Value-to-Income Ratio | Without Mortgage | With Mortgage |
| Less than 2.0x | 15 (41.7%) | 68,750 (180,921.0%) |
| 2.0x to 2.9x | 0 (0.0%) | 16 (42.1%) |
| 3.0x to 3.9x | 7 (19.4%) | 3 (7.9%) |
| 4.0x or more | 14 (38.9%) | 6 (15.8%) |
| Total | 36 (100.0%) | 38 (100.0%) |
Real Estate Taxes by Mortgage Status in Montrose
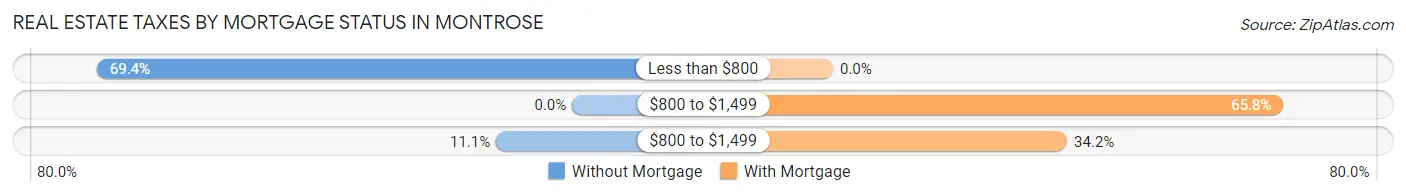
| Property Taxes | Without Mortgage | With Mortgage |
| Less than $800 | 25 (69.4%) | 0 (0.0%) |
| $800 to $1,499 | 0 (0.0%) | 25 (65.8%) |
| $800 to $1,499 | 4 (11.1%) | 13 (34.2%) |
| Total | 36 (100.0%) | 38 (100.0%) |
Health & Disability in Montrose
Health Insurance Coverage by Age in Montrose
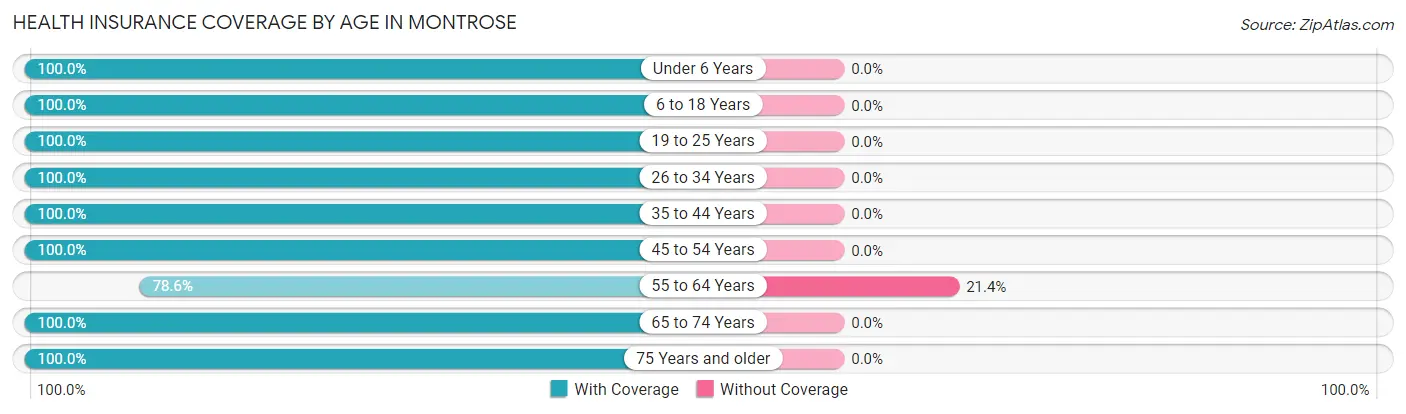
| Age Bracket | With Coverage | Without Coverage |
| Under 6 Years | 119 (100.0%) | 0 (0.0%) |
| 6 to 18 Years | 13 (100.0%) | 0 (0.0%) |
| 19 to 25 Years | 24 (100.0%) | 0 (0.0%) |
| 26 to 34 Years | 7 (100.0%) | 0 (0.0%) |
| 35 to 44 Years | 30 (100.0%) | 0 (0.0%) |
| 45 to 54 Years | 15 (100.0%) | 0 (0.0%) |
| 55 to 64 Years | 33 (78.6%) | 9 (21.4%) |
| 65 to 74 Years | 27 (100.0%) | 0 (0.0%) |
| 75 Years and older | 18 (100.0%) | 0 (0.0%) |
| Total | 286 (97.0%) | 9 (3.0%) |
Health Insurance Coverage by Citizenship Status in Montrose
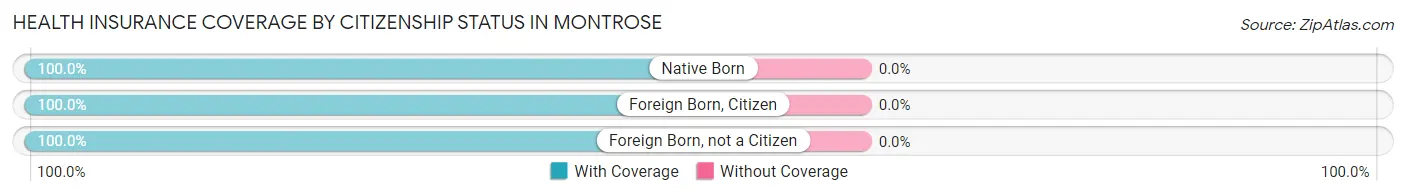
| Citizenship Status | With Coverage | Without Coverage |
| Native Born | 119 (100.0%) | 0 (0.0%) |
| Foreign Born, Citizen | 13 (100.0%) | 0 (0.0%) |
| Foreign Born, not a Citizen | 24 (100.0%) | 0 (0.0%) |
Health Insurance Coverage by Household Income in Montrose
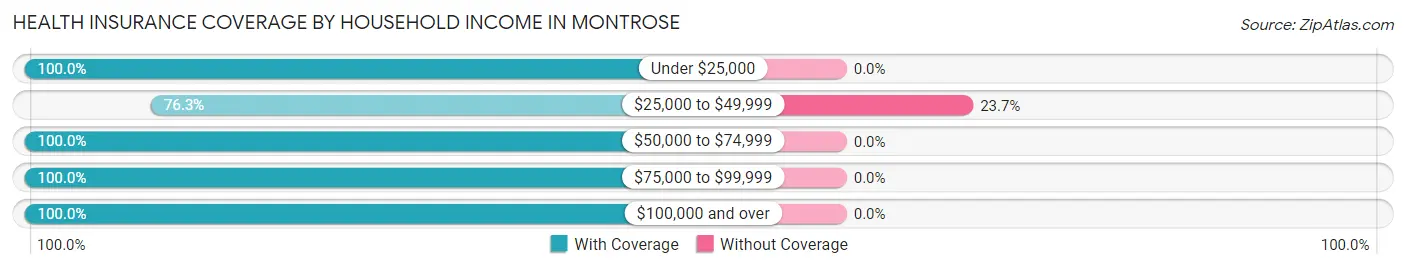
| Household Income | With Coverage | Without Coverage |
| Under $25,000 | 22 (100.0%) | 0 (0.0%) |
| $25,000 to $49,999 | 29 (76.3%) | 9 (23.7%) |
| $50,000 to $74,999 | 39 (100.0%) | 0 (0.0%) |
| $75,000 to $99,999 | 23 (100.0%) | 0 (0.0%) |
| $100,000 and over | 173 (100.0%) | 0 (0.0%) |
Public vs Private Health Insurance Coverage by Age in Montrose
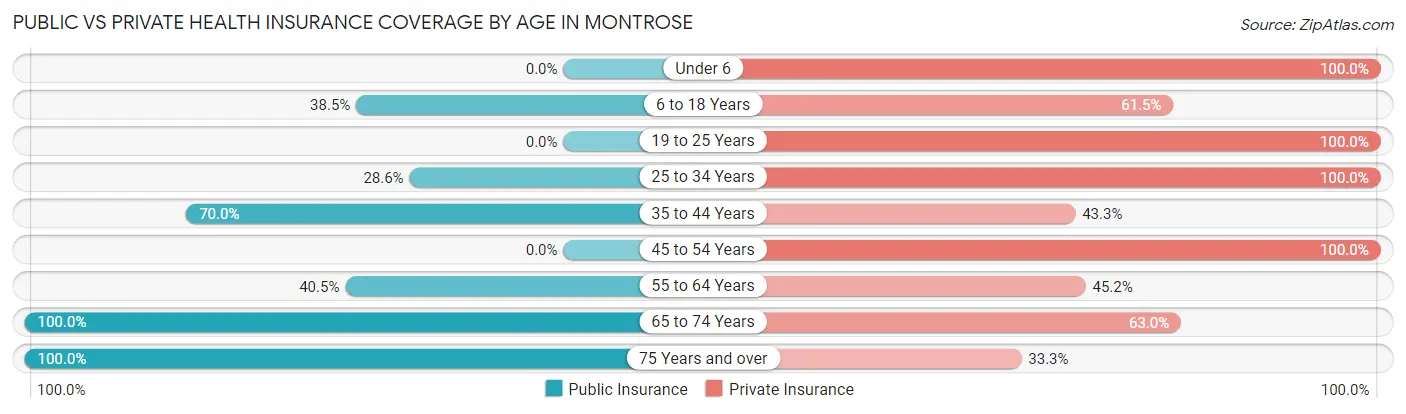
| Age Bracket | Public Insurance | Private Insurance |
| Under 6 | 0 (0.0%) | 119 (100.0%) |
| 6 to 18 Years | 5 (38.5%) | 8 (61.5%) |
| 19 to 25 Years | 0 (0.0%) | 24 (100.0%) |
| 25 to 34 Years | 2 (28.6%) | 7 (100.0%) |
| 35 to 44 Years | 21 (70.0%) | 13 (43.3%) |
| 45 to 54 Years | 0 (0.0%) | 15 (100.0%) |
| 55 to 64 Years | 17 (40.5%) | 19 (45.2%) |
| 65 to 74 Years | 27 (100.0%) | 17 (63.0%) |
| 75 Years and over | 18 (100.0%) | 6 (33.3%) |
| Total | 90 (30.5%) | 228 (77.3%) |
Disability Status by Sex by Age in Montrose
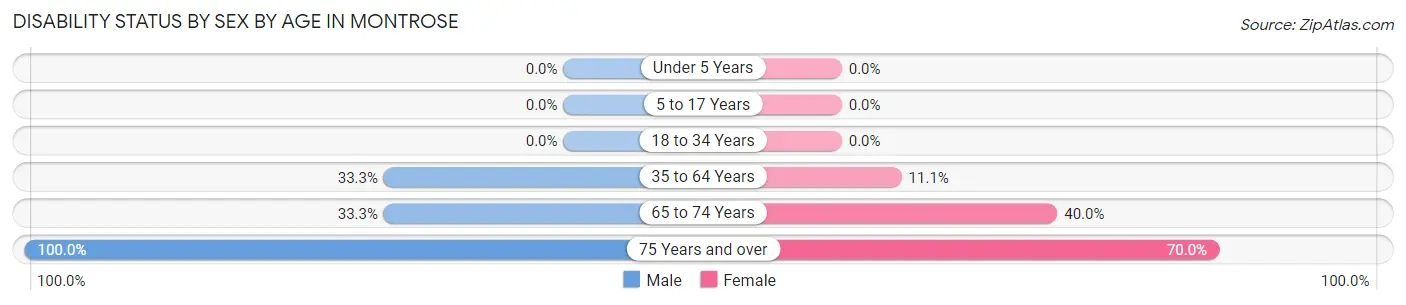
| Age Bracket | Male | Female |
| Under 5 Years | 0 (0.0%) | 0 (0.0%) |
| 5 to 17 Years | 0 (0.0%) | 0 (0.0%) |
| 18 to 34 Years | 0 (0.0%) | 0 (0.0%) |
| 35 to 64 Years | 17 (33.3%) | 4 (11.1%) |
| 65 to 74 Years | 4 (33.3%) | 6 (40.0%) |
| 75 Years and over | 8 (100.0%) | 7 (70.0%) |
Disability Class by Sex by Age in Montrose
Disability Class: Hearing Difficulty
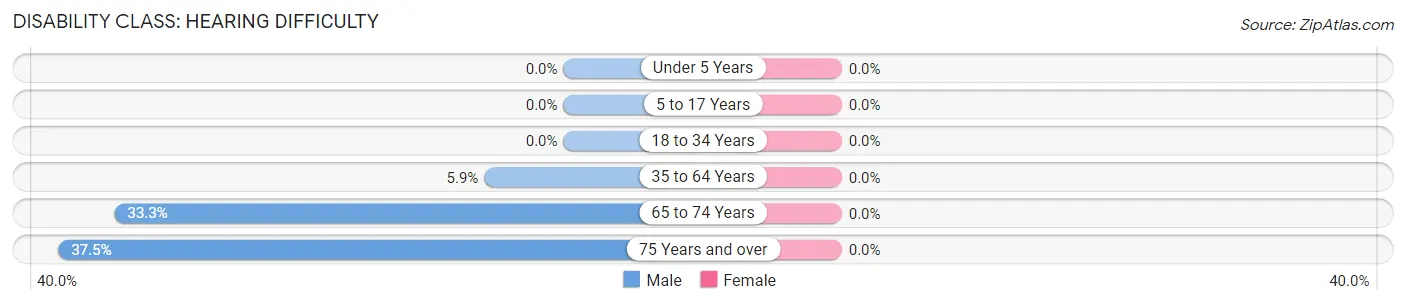
| Age Bracket | Male | Female |
| Under 5 Years | 0 (0.0%) | 0 (0.0%) |
| 5 to 17 Years | 0 (0.0%) | 0 (0.0%) |
| 18 to 34 Years | 0 (0.0%) | 0 (0.0%) |
| 35 to 64 Years | 3 (5.9%) | 0 (0.0%) |
| 65 to 74 Years | 4 (33.3%) | 0 (0.0%) |
| 75 Years and over | 3 (37.5%) | 0 (0.0%) |
Disability Class: Vision Difficulty
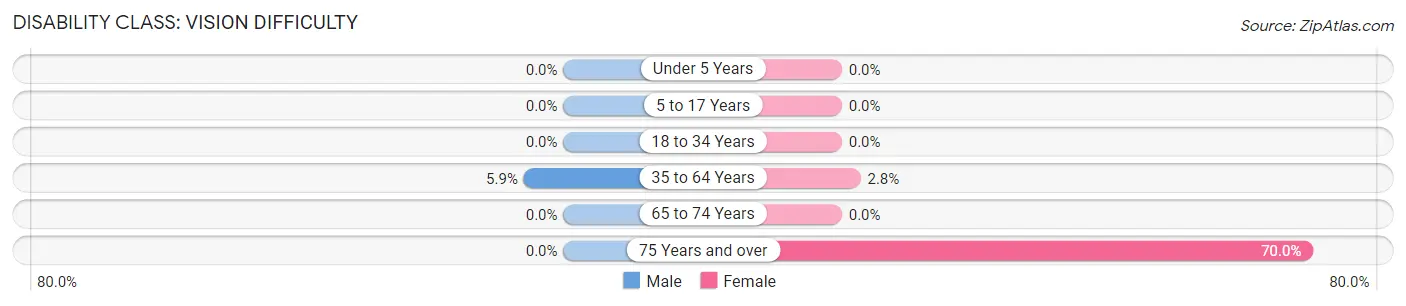
| Age Bracket | Male | Female |
| Under 5 Years | 0 (0.0%) | 0 (0.0%) |
| 5 to 17 Years | 0 (0.0%) | 0 (0.0%) |
| 18 to 34 Years | 0 (0.0%) | 0 (0.0%) |
| 35 to 64 Years | 3 (5.9%) | 1 (2.8%) |
| 65 to 74 Years | 0 (0.0%) | 0 (0.0%) |
| 75 Years and over | 0 (0.0%) | 7 (70.0%) |
Disability Class: Cognitive Difficulty
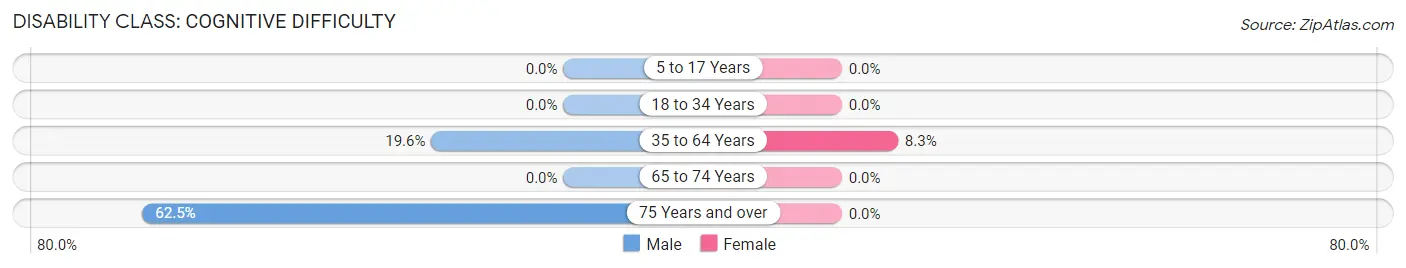
| Age Bracket | Male | Female |
| 5 to 17 Years | 0 (0.0%) | 0 (0.0%) |
| 18 to 34 Years | 0 (0.0%) | 0 (0.0%) |
| 35 to 64 Years | 10 (19.6%) | 3 (8.3%) |
| 65 to 74 Years | 0 (0.0%) | 0 (0.0%) |
| 75 Years and over | 5 (62.5%) | 0 (0.0%) |
Disability Class: Ambulatory Difficulty
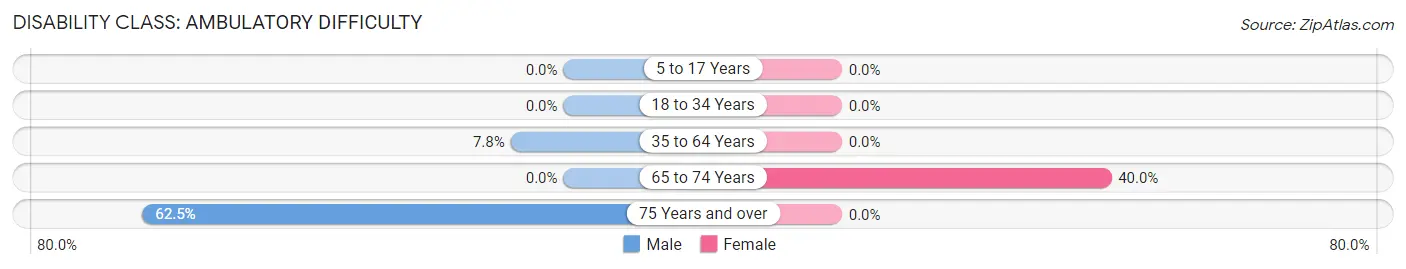
| Age Bracket | Male | Female |
| 5 to 17 Years | 0 (0.0%) | 0 (0.0%) |
| 18 to 34 Years | 0 (0.0%) | 0 (0.0%) |
| 35 to 64 Years | 4 (7.8%) | 0 (0.0%) |
| 65 to 74 Years | 0 (0.0%) | 6 (40.0%) |
| 75 Years and over | 5 (62.5%) | 0 (0.0%) |
Disability Class: Self-Care Difficulty
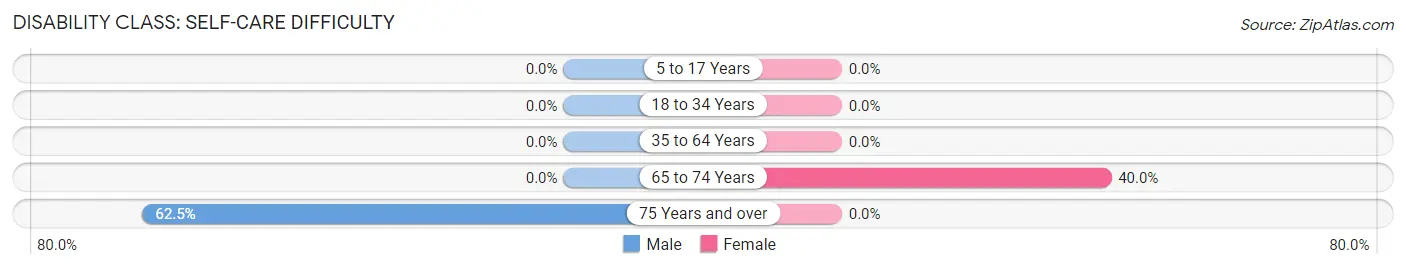
| Age Bracket | Male | Female |
| 5 to 17 Years | 0 (0.0%) | 0 (0.0%) |
| 18 to 34 Years | 0 (0.0%) | 0 (0.0%) |
| 35 to 64 Years | 0 (0.0%) | 0 (0.0%) |
| 65 to 74 Years | 0 (0.0%) | 6 (40.0%) |
| 75 Years and over | 5 (62.5%) | 0 (0.0%) |
Technology Access in Montrose
Computing Device Access in Montrose
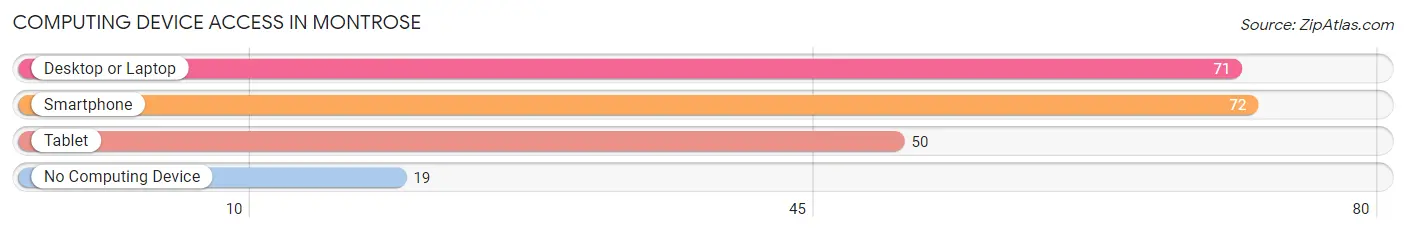
| Device Type | # Households | % Households |
| Desktop or Laptop | 71 | 75.5% |
| Smartphone | 72 | 76.6% |
| Tablet | 50 | 53.2% |
| No Computing Device | 19 | 20.2% |
| Total | 94 | 100.0% |
Internet Access in Montrose
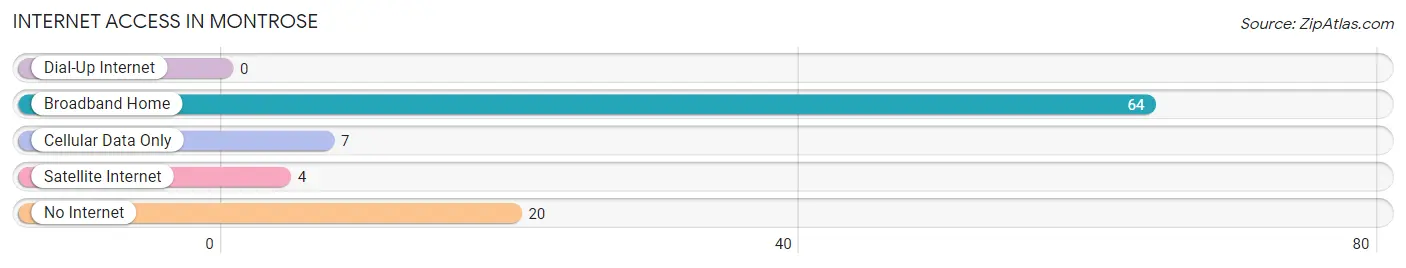
| Internet Type | # Households | % Households |
| Dial-Up Internet | 0 | 0.0% |
| Broadband Home | 64 | 68.1% |
| Cellular Data Only | 7 | 7.4% |
| Satellite Internet | 4 | 4.3% |
| No Internet | 20 | 21.3% |
| Total | 94 | 100.0% |
Montrose Summary
Montrose is a small unincorporated community located in Tucker County, West Virginia. It is situated in the Appalachian Mountains, approximately two miles south of the Maryland border. The community is located along the North Branch of the Potomac River, and is surrounded by the Monongahela National Forest.
History
Montrose was first settled in the late 1700s by a group of German immigrants. The town was originally known as “Mountain Rose”, and was later shortened to “Montrose”. The town was officially incorporated in 1883.
In the late 1800s, Montrose was a thriving logging and coal mining town. The town was home to several sawmills, a gristmill, and a tannery. The town also had a post office, a general store, and a hotel.
In the early 1900s, the town began to decline as the logging and coal mining industries moved away. The town’s population decreased, and many of the businesses closed.
Geography
Montrose is located in the Appalachian Mountains of West Virginia. The town is situated along the North Branch of the Potomac River, and is surrounded by the Monongahela National Forest. The town is located approximately two miles south of the Maryland border.
The town is located at an elevation of 2,400 feet, and has a total area of 0.3 square miles. The town is located in a temperate climate, with average temperatures ranging from the low 30s in the winter to the mid-70s in the summer.
Economy
Montrose’s economy is largely based on tourism. The town is home to several bed and breakfasts, as well as a few restaurants and shops. The town is also home to a small winery, which produces a variety of wines.
The town is also home to a few small businesses, including a lumber mill, a sawmill, and a general store. The town is also home to a few small farms, which produce a variety of fruits and vegetables.
Demographics
As of the 2010 census, the population of Montrose was 545. The town is predominantly white, with 95.3% of the population identifying as white. The median household income in the town is $35,000, and the median age is 44.
Conclusion
Montrose is a small unincorporated community located in Tucker County, West Virginia. It is situated in the Appalachian Mountains, and is surrounded by the Monongahela National Forest. The town was first settled in the late 1700s, and was officially incorporated in 1883. The town’s economy is largely based on tourism, and the population is predominantly white.
Common Questions
What is Per Capita Income in Montrose?
Per Capita income in Montrose is $21,093.
What is the Median Family Income in Montrose?
Median Family Income in Montrose is $94,063.
What is the Median Household income in Montrose?
Median Household Income in Montrose is $70,833.
What is Inequality or Gini Index in Montrose?
Inequality or Gini Index in Montrose is 0.31.
What is the Total Population of Montrose?
Total Population of Montrose is 314.
What is the Total Male Population of Montrose?
Total Male Population of Montrose is 216.
What is the Total Female Population of Montrose?
Total Female Population of Montrose is 98.
What is the Ratio of Males per 100 Females in Montrose?
There are 220.41 Males per 100 Females in Montrose.
What is the Ratio of Females per 100 Males in Montrose?
There are 45.37 Females per 100 Males in Montrose.
What is the Median Population Age in Montrose?
Median Population Age in Montrose is 24.1 Years.
What is the Average Family Size in Montrose
Average Family Size in Montrose is 3.8 People.
What is the Average Household Size in Montrose
Average Household Size in Montrose is 3.3 People.
How Large is the Labor Force in Montrose?
There are 78 People in the Labor Forcein in Montrose.
What is the Percentage of People in the Labor Force in Montrose?
42.4% of People are in the Labor Force in Montrose.