Marlinton, WV Map & Demographics
Marlinton Map

Marlinton Overview
$21,156
PER CAPITA INCOME
$56,250
AVG FAMILY INCOME
$39,643
AVG HOUSEHOLD INCOME
34.1%
WAGE / INCOME GAP [ % ]
65.9¢/ $1
WAGE / INCOME GAP [ $ ]
0.41
INEQUALITY / GINI INDEX
1,139
TOTAL POPULATION
522
MALE POPULATION
617
FEMALE POPULATION
84.60
MALES / 100 FEMALES
118.20
FEMALES / 100 MALES
47.2
MEDIAN AGE
4.3
AVG FAMILY SIZE
2.8
AVG HOUSEHOLD SIZE
409
LABOR FORCE [ PEOPLE ]
42.3%
PERCENT IN LABOR FORCE
11.2%
UNEMPLOYMENT RATE
Marlinton Zip Codes
Income in Marlinton
Income Overview in Marlinton
Per Capita Income in Marlinton is $21,156, while median incomes of families and households are $56,250 and $39,643 respectively.
| Characteristic | Number | Measure |
| Per Capita Income | 1,139 | $21,156 |
| Median Family Income | 166 | $56,250 |
| Mean Family Income | 166 | $64,157 |
| Median Household Income | 378 | $39,643 |
| Mean Household Income | 378 | $48,564 |
| Income Deficit | 166 | $0 |
| Wage / Income Gap (%) | 1,139 | 34.09% |
| Wage / Income Gap ($) | 1,139 | 65.91¢ per $1 |
| Gini / Inequality Index | 1,139 | 0.41 |
Earnings by Sex in Marlinton
Average Earnings in Marlinton are $15,962, $14,156 for men and $21,477 for women, a difference of 34.1%.
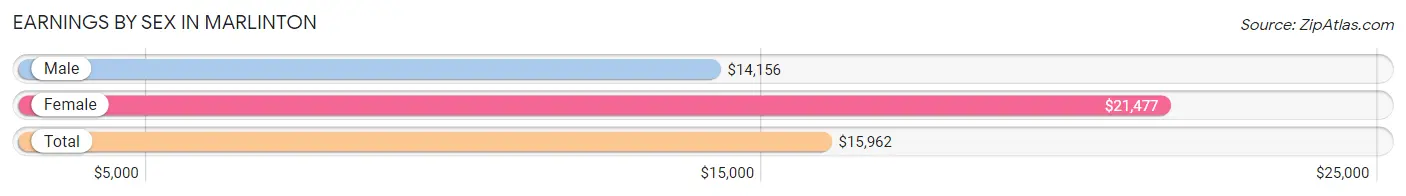
| Sex | Number | Average Earnings |
| Male | 225 (46.5%) | $14,156 |
| Female | 259 (53.5%) | $21,477 |
| Total | 484 (100.0%) | $15,962 |
Earnings by Sex by Income Bracket in Marlinton
The most common earnings brackets in Marlinton are $2,499 or less for men (54 | 24.0%) and $12,500 to $14,999 for women (38 | 14.7%).
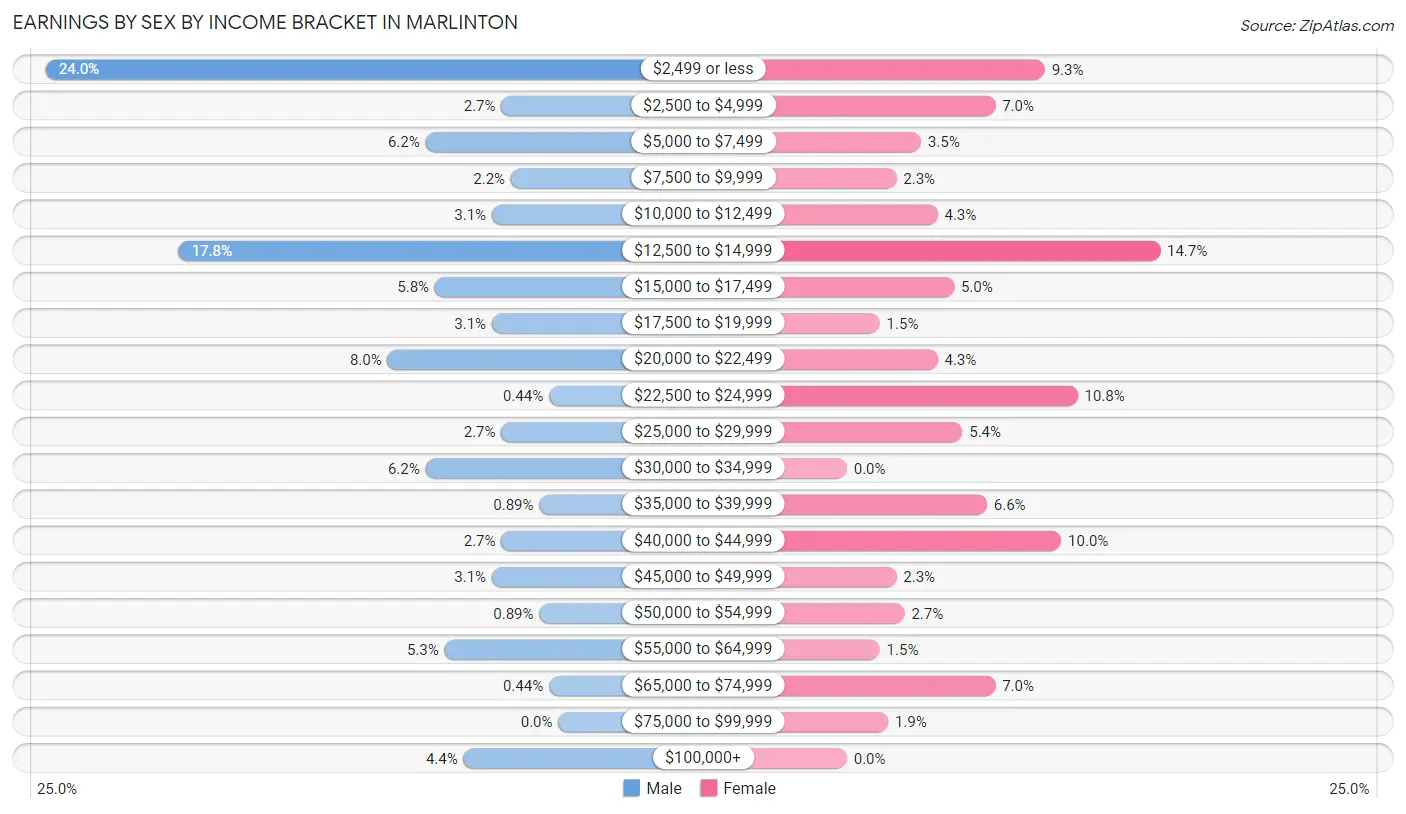
| Income | Male | Female |
| $2,499 or less | 54 (24.0%) | 24 (9.3%) |
| $2,500 to $4,999 | 6 (2.7%) | 18 (7.0%) |
| $5,000 to $7,499 | 14 (6.2%) | 9 (3.5%) |
| $7,500 to $9,999 | 5 (2.2%) | 6 (2.3%) |
| $10,000 to $12,499 | 7 (3.1%) | 11 (4.3%) |
| $12,500 to $14,999 | 40 (17.8%) | 38 (14.7%) |
| $15,000 to $17,499 | 13 (5.8%) | 13 (5.0%) |
| $17,500 to $19,999 | 7 (3.1%) | 4 (1.5%) |
| $20,000 to $22,499 | 18 (8.0%) | 11 (4.3%) |
| $22,500 to $24,999 | 1 (0.4%) | 28 (10.8%) |
| $25,000 to $29,999 | 6 (2.7%) | 14 (5.4%) |
| $30,000 to $34,999 | 14 (6.2%) | 0 (0.0%) |
| $35,000 to $39,999 | 2 (0.9%) | 17 (6.6%) |
| $40,000 to $44,999 | 6 (2.7%) | 26 (10.0%) |
| $45,000 to $49,999 | 7 (3.1%) | 6 (2.3%) |
| $50,000 to $54,999 | 2 (0.9%) | 7 (2.7%) |
| $55,000 to $64,999 | 12 (5.3%) | 4 (1.5%) |
| $65,000 to $74,999 | 1 (0.4%) | 18 (7.0%) |
| $75,000 to $99,999 | 0 (0.0%) | 5 (1.9%) |
| $100,000+ | 10 (4.4%) | 0 (0.0%) |
| Total | 225 (100.0%) | 259 (100.0%) |
Earnings by Sex by Educational Attainment in Marlinton
Average earnings in Marlinton are $21,389 for men and $25,357 for women, a difference of 15.7%. Men with an educational attainment of bachelor's degree enjoy the highest average annual earnings of $26,250, while those with college or associate's degree education earn the least with $21,827. Women with an educational attainment of graduate degree earn the most with the average annual earnings of $68,036, while those with college or associate's degree education have the smallest earnings of $22,900.
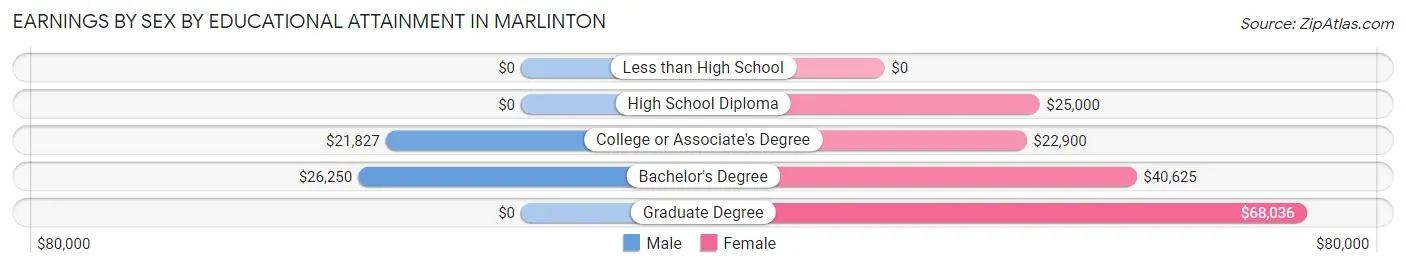
| Educational Attainment | Male Income | Female Income |
| Less than High School | - | - |
| High School Diploma | - | - |
| College or Associate's Degree | $21,827 | $22,900 |
| Bachelor's Degree | $26,250 | $40,625 |
| Graduate Degree | - | - |
| Total | $21,389 | $25,357 |
Family Income in Marlinton
Family Income Brackets in Marlinton
According to the Marlinton family income data, there are 39 families falling into the $50,000 to $74,999 income range, which is the most common income bracket and makes up 23.5% of all families.
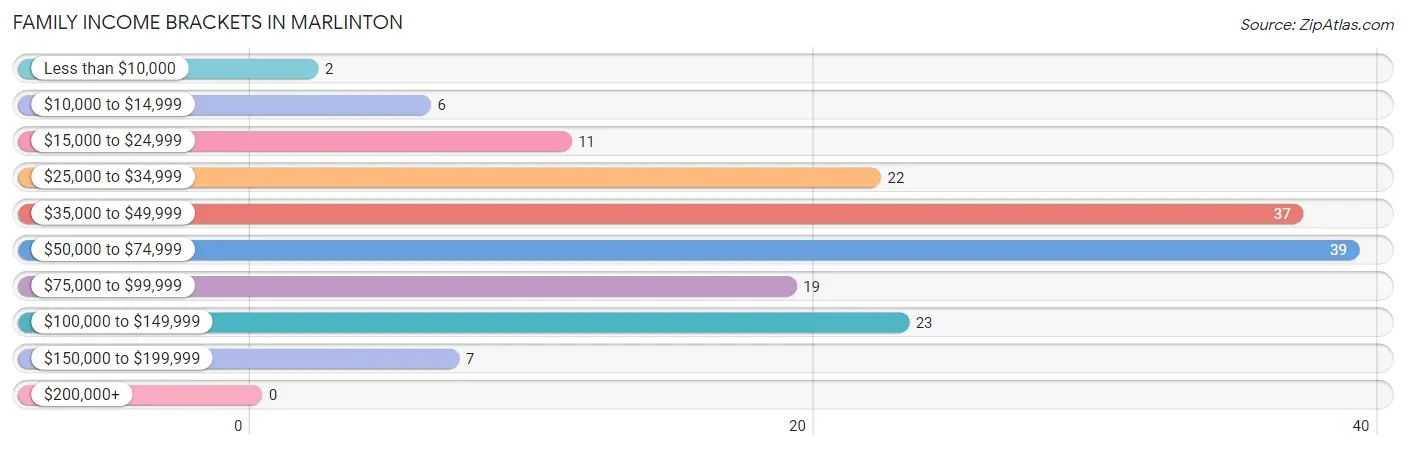
| Income Bracket | # Families | % Families |
| Less than $10,000 | 2 | 1.2% |
| $10,000 to $14,999 | 6 | 3.6% |
| $15,000 to $24,999 | 11 | 6.6% |
| $25,000 to $34,999 | 22 | 13.3% |
| $35,000 to $49,999 | 37 | 22.3% |
| $50,000 to $74,999 | 39 | 23.5% |
| $75,000 to $99,999 | 19 | 11.4% |
| $100,000 to $149,999 | 23 | 13.9% |
| $150,000 to $199,999 | 7 | 4.2% |
| $200,000+ | 0 | 0.0% |
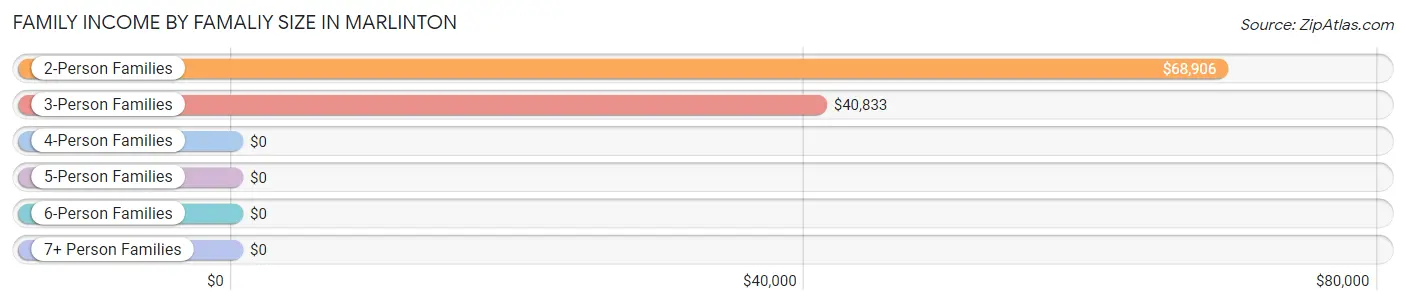
Family Income by Famaliy Size in Marlinton
2-person families (87 | 52.4%) account for the highest median family income in Marlinton with $68,906 per family, while 2-person families (87 | 52.4%) have the highest median income of $34,453 per family member.
| Income Bracket | # Families | Median Income |
| 2-Person Families | 87 (52.4%) | $68,906 |
| 3-Person Families | 44 (26.5%) | $40,833 |
| 4-Person Families | 20 (12.0%) | $0 |
| 5-Person Families | 6 (3.6%) | $0 |
| 6-Person Families | 9 (5.4%) | $0 |
| 7+ Person Families | 0 (0.0%) | $0 |
| Total | 166 (100.0%) | $56,250 |
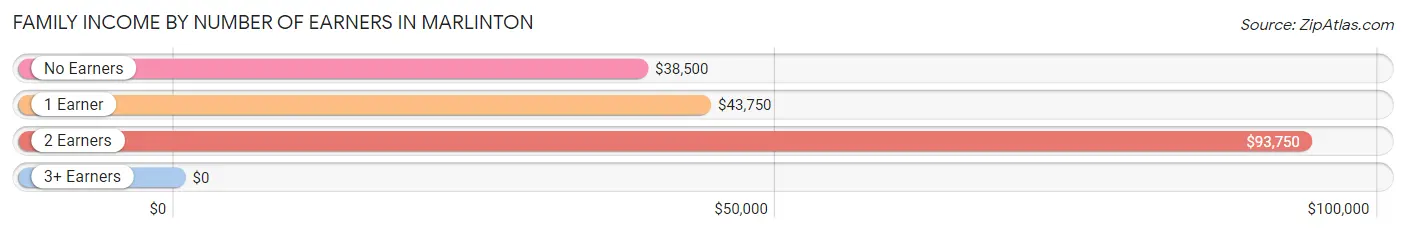
Family Income by Number of Earners in Marlinton
| Number of Earners | # Families | Median Income |
| No Earners | 34 (20.5%) | $38,500 |
| 1 Earner | 77 (46.4%) | $43,750 |
| 2 Earners | 40 (24.1%) | $93,750 |
| 3+ Earners | 15 (9.0%) | $0 |
| Total | 166 (100.0%) | $56,250 |
Household Income in Marlinton
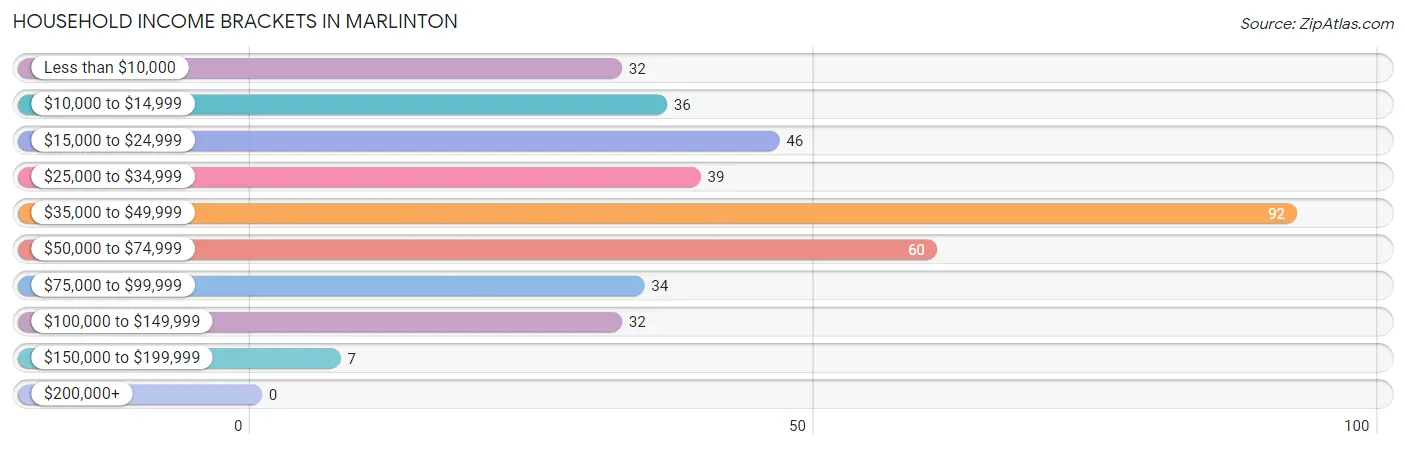
Household Income Brackets in Marlinton
With 92 households falling in the category, the $35,000 to $49,999 income range is the most frequent in Marlinton, accounting for 24.3% of all households.
| Income Bracket | # Households | % Households |
| Less than $10,000 | 32 | 8.5% |
| $10,000 to $14,999 | 36 | 9.5% |
| $15,000 to $24,999 | 46 | 12.2% |
| $25,000 to $34,999 | 39 | 10.3% |
| $35,000 to $49,999 | 92 | 24.3% |
| $50,000 to $74,999 | 60 | 15.9% |
| $75,000 to $99,999 | 34 | 9.0% |
| $100,000 to $149,999 | 32 | 8.5% |
| $150,000 to $199,999 | 7 | 1.9% |
| $200,000+ | 0 | 0.0% |
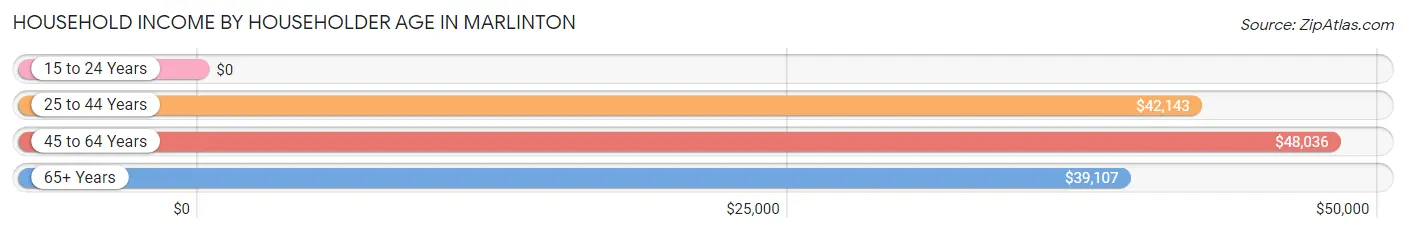
Household Income by Householder Age in Marlinton
The median household income in Marlinton is $39,643, with the highest median household income of $48,036 found in the 45 to 64 years age bracket for the primary householder. A total of 155 households (41.0%) fall into this category. Meanwhile, the 15 to 24 years age bracket for the primary householder has the lowest median household income of $0, with 15 households (4.0%) in this group.
| Income Bracket | # Households | Median Income |
| 15 to 24 Years | 15 (4.0%) | $0 |
| 25 to 44 Years | 64 (16.9%) | $42,143 |
| 45 to 64 Years | 155 (41.0%) | $48,036 |
| 65+ Years | 144 (38.1%) | $39,107 |
| Total | 378 (100.0%) | $39,643 |
Poverty in Marlinton
Income Below Poverty by Sex and Age in Marlinton
With 24.7% poverty level for males and 40.8% for females among the residents of Marlinton, 6 to 11 year old males and 12 to 14 year old females are the most vulnerable to poverty, with 14 males (56.0%) and 54 females (100.0%) in their respective age groups living below the poverty level.
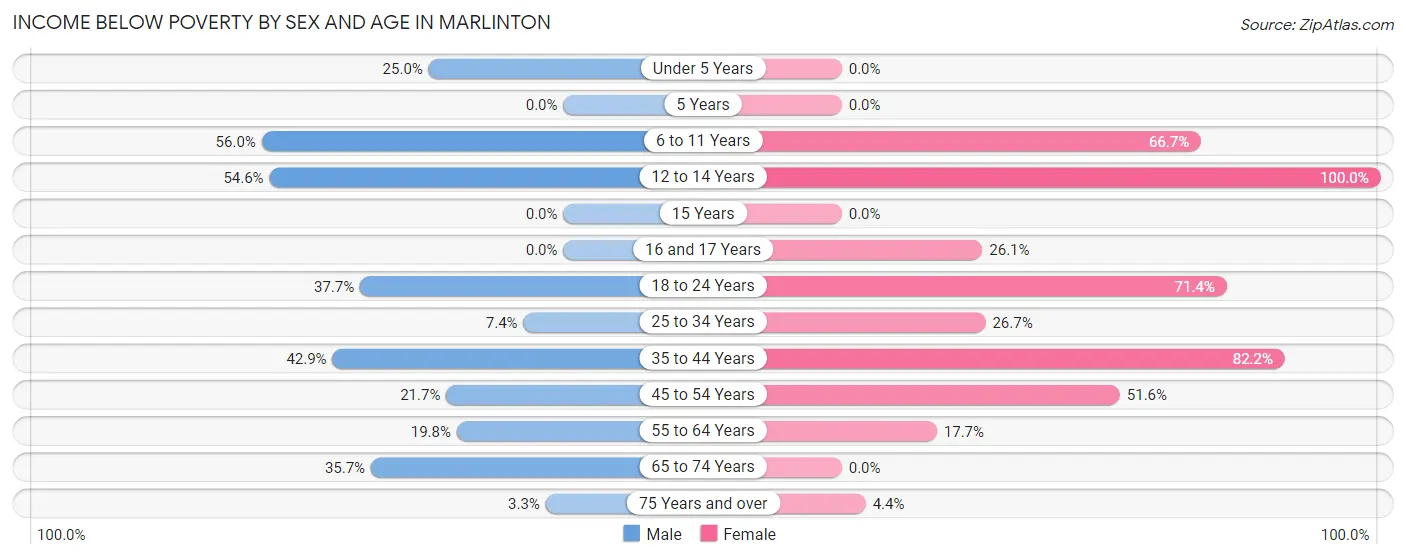
| Age Bracket | Male | Female |
| Under 5 Years | 3 (25.0%) | 0 (0.0%) |
| 5 Years | 0 (0.0%) | 0 (0.0%) |
| 6 to 11 Years | 14 (56.0%) | 20 (66.7%) |
| 12 to 14 Years | 6 (54.5%) | 54 (100.0%) |
| 15 Years | 0 (0.0%) | 0 (0.0%) |
| 16 and 17 Years | 0 (0.0%) | 12 (26.1%) |
| 18 to 24 Years | 40 (37.7%) | 45 (71.4%) |
| 25 to 34 Years | 2 (7.4%) | 16 (26.7%) |
| 35 to 44 Years | 9 (42.9%) | 37 (82.2%) |
| 45 to 54 Years | 10 (21.7%) | 32 (51.6%) |
| 55 to 64 Years | 18 (19.8%) | 15 (17.6%) |
| 65 to 74 Years | 15 (35.7%) | 0 (0.0%) |
| 75 Years and over | 2 (3.3%) | 2 (4.4%) |
| Total | 119 (24.7%) | 233 (40.8%) |
Income Above Poverty by Sex and Age in Marlinton
According to the poverty statistics in Marlinton, males aged 5 years and females aged 5 years are the age groups that are most secure financially, with 100.0% of males and 100.0% of females in these age groups living above the poverty line.
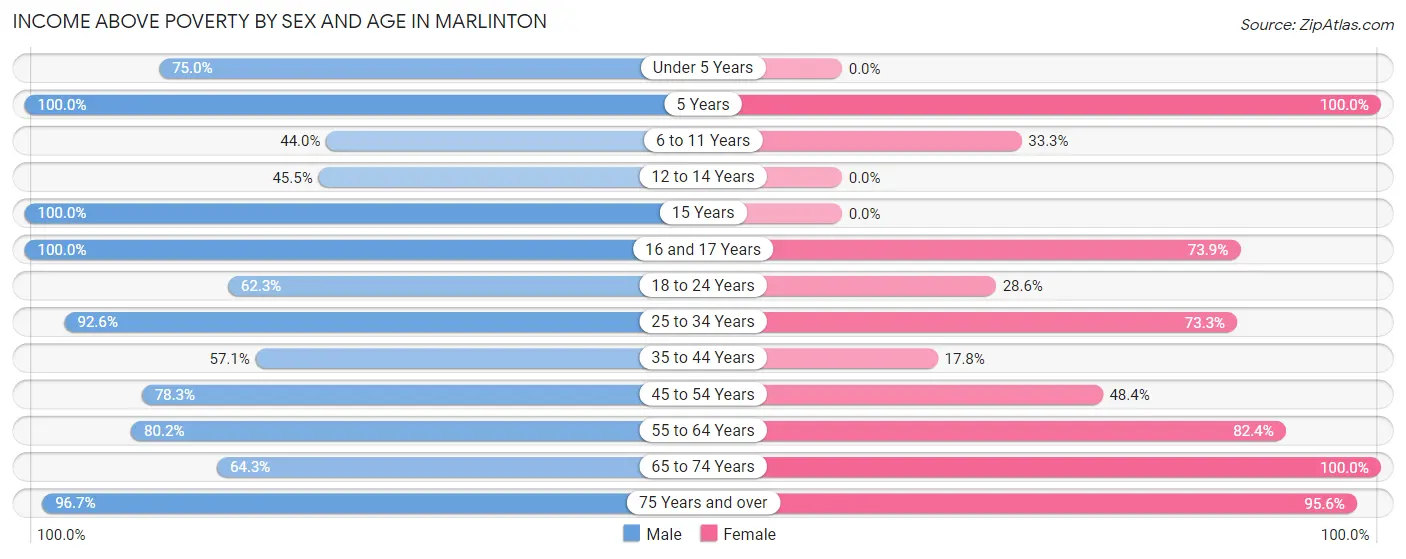
| Age Bracket | Male | Female |
| Under 5 Years | 9 (75.0%) | 0 (0.0%) |
| 5 Years | 13 (100.0%) | 5 (100.0%) |
| 6 to 11 Years | 11 (44.0%) | 10 (33.3%) |
| 12 to 14 Years | 5 (45.5%) | 0 (0.0%) |
| 15 Years | 11 (100.0%) | 0 (0.0%) |
| 16 and 17 Years | 15 (100.0%) | 34 (73.9%) |
| 18 to 24 Years | 66 (62.3%) | 18 (28.6%) |
| 25 to 34 Years | 25 (92.6%) | 44 (73.3%) |
| 35 to 44 Years | 12 (57.1%) | 8 (17.8%) |
| 45 to 54 Years | 36 (78.3%) | 30 (48.4%) |
| 55 to 64 Years | 73 (80.2%) | 70 (82.4%) |
| 65 to 74 Years | 27 (64.3%) | 76 (100.0%) |
| 75 Years and over | 59 (96.7%) | 43 (95.6%) |
| Total | 362 (75.3%) | 338 (59.2%) |
Income Below Poverty Among Married-Couple Families in Marlinton
The poverty statistics for married-couple families in Marlinton show that 3.3% or 4 of the total 121 families live below the poverty line. Families with 1 or 2 children have the highest poverty rate of 7.1%, comprising of 2 families. On the other hand, families with 3 or 4 children have the lowest poverty rate of 0.0%, which includes 0 families.
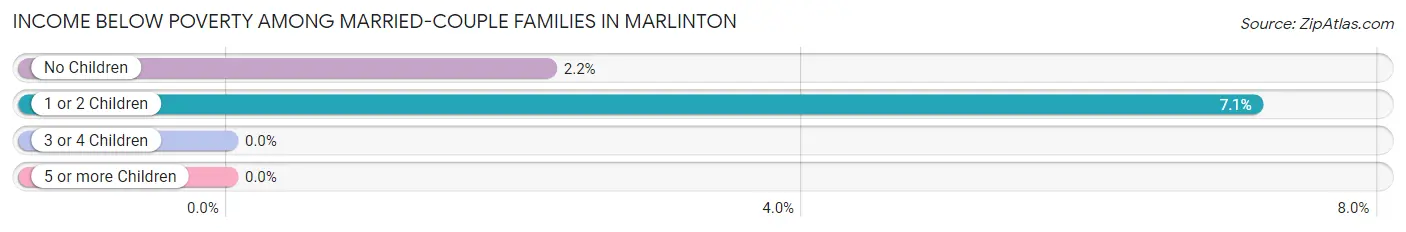
| Children | Above Poverty | Below Poverty |
| No Children | 88 (97.8%) | 2 (2.2%) |
| 1 or 2 Children | 26 (92.9%) | 2 (7.1%) |
| 3 or 4 Children | 3 (100.0%) | 0 (0.0%) |
| 5 or more Children | 0 (0.0%) | 0 (0.0%) |
| Total | 117 (96.7%) | 4 (3.3%) |
Income Below Poverty Among Single-Parent Households in Marlinton
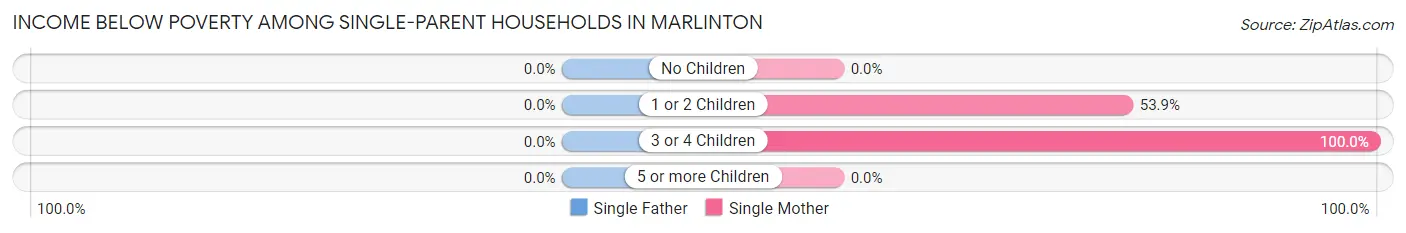
| Children | Single Father | Single Mother |
| No Children | 0 (0.0%) | 0 (0.0%) |
| 1 or 2 Children | 0 (0.0%) | 7 (53.8%) |
| 3 or 4 Children | 0 (0.0%) | 13 (100.0%) |
| 5 or more Children | 0 (0.0%) | 0 (0.0%) |
| Total | 0 (0.0%) | 20 (51.3%) |
Income Below Poverty Among Married-Couple vs Single-Parent Households in Marlinton
The poverty data for Marlinton shows that 4 of the married-couple family households (3.3%) and 20 of the single-parent households (44.4%) are living below the poverty level. Within the married-couple family households, those with 1 or 2 children have the highest poverty rate, with 2 households (7.1%) falling below the poverty line. Among the single-parent households, those with 3 or 4 children have the highest poverty rate, with 13 household (100.0%) living below poverty.
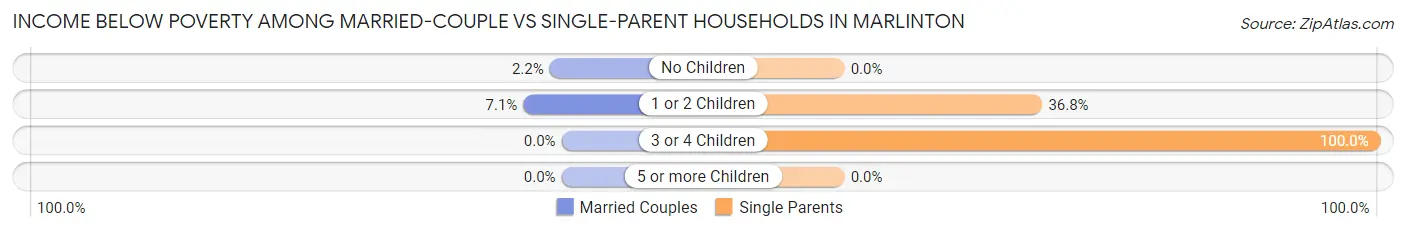
| Children | Married-Couple Families | Single-Parent Households |
| No Children | 2 (2.2%) | 0 (0.0%) |
| 1 or 2 Children | 2 (7.1%) | 7 (36.8%) |
| 3 or 4 Children | 0 (0.0%) | 13 (100.0%) |
| 5 or more Children | 0 (0.0%) | 0 (0.0%) |
| Total | 4 (3.3%) | 20 (44.4%) |
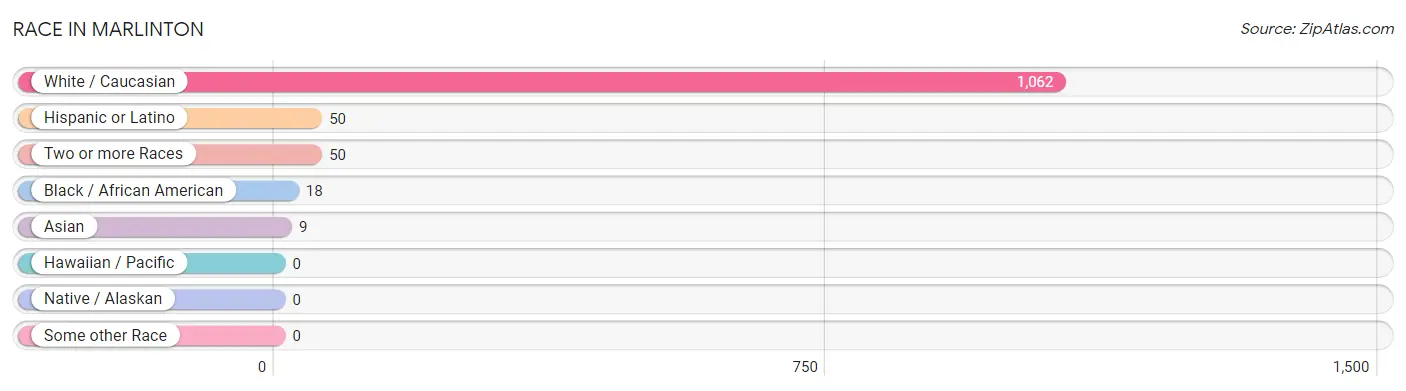
Race in Marlinton
The most populous races in Marlinton are White / Caucasian (1,062 | 93.2%), Hispanic or Latino (50 | 4.4%), and Two or more Races (50 | 4.4%).
| Race | # Population | % Population |
| Asian | 9 | 0.8% |
| Black / African American | 18 | 1.6% |
| Hawaiian / Pacific | 0 | 0.0% |
| Hispanic or Latino | 50 | 4.4% |
| Native / Alaskan | 0 | 0.0% |
| White / Caucasian | 1,062 | 93.2% |
| Two or more Races | 50 | 4.4% |
| Some other Race | 0 | 0.0% |
| Total | 1,139 | 100.0% |
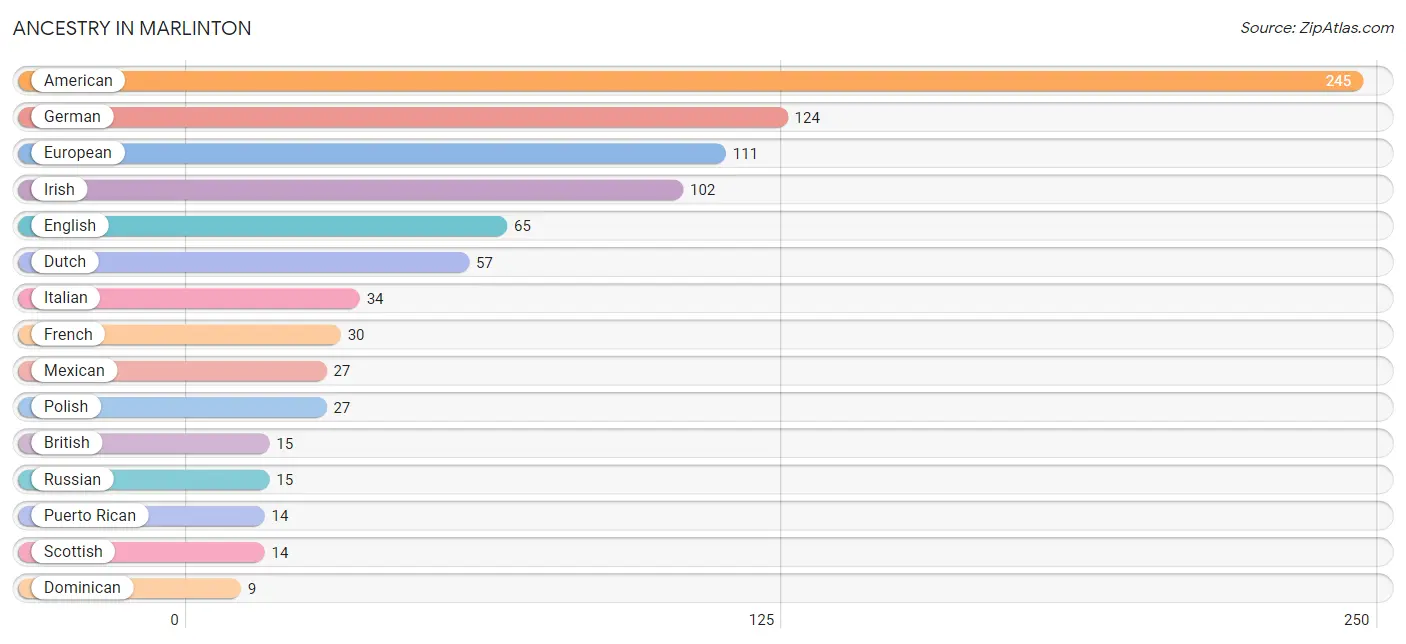
Ancestry in Marlinton
The most populous ancestries reported in Marlinton are American (245 | 21.5%), German (124 | 10.9%), European (111 | 9.8%), Irish (102 | 9.0%), and English (65 | 5.7%), together accounting for 56.8% of all Marlinton residents.
| Ancestry | # Population | % Population |
| American | 245 | 21.5% |
| Arab | 3 | 0.3% |
| British | 15 | 1.3% |
| Canadian | 2 | 0.2% |
| Croatian | 2 | 0.2% |
| Danish | 6 | 0.5% |
| Dominican | 9 | 0.8% |
| Dutch | 57 | 5.0% |
| English | 65 | 5.7% |
| European | 111 | 9.8% |
| French | 30 | 2.6% |
| French Canadian | 7 | 0.6% |
| German | 124 | 10.9% |
| Irish | 102 | 9.0% |
| Italian | 34 | 3.0% |
| Lebanese | 3 | 0.3% |
| Mexican | 27 | 2.4% |
| Norwegian | 6 | 0.5% |
| Polish | 27 | 2.4% |
| Puerto Rican | 14 | 1.2% |
| Russian | 15 | 1.3% |
| Scotch-Irish | 8 | 0.7% |
| Scottish | 14 | 1.2% |
| Swiss | 7 | 0.6% |
| Thai | 9 | 0.8% | View All 25 Rows |
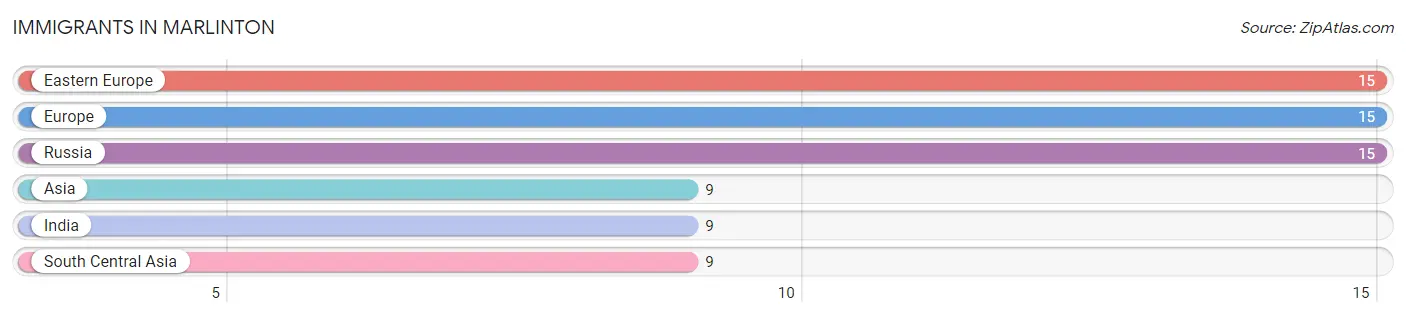
Immigrants in Marlinton
The most numerous immigrant groups reported in Marlinton came from Eastern Europe (15 | 1.3%), Europe (15 | 1.3%), Russia (15 | 1.3%), Asia (9 | 0.8%), and India (9 | 0.8%), together accounting for 5.5% of all Marlinton residents.
| Immigration Origin | # Population | % Population |
| Asia | 9 | 0.8% |
| Eastern Europe | 15 | 1.3% |
| Europe | 15 | 1.3% |
| India | 9 | 0.8% |
| Russia | 15 | 1.3% |
| South Central Asia | 9 | 0.8% | View All 6 Rows |
Sex and Age in Marlinton
Sex and Age in Marlinton
The most populous age groups in Marlinton are 15 to 19 Years (78 | 14.9%) for men and 15 to 19 Years (97 | 15.7%) for women.
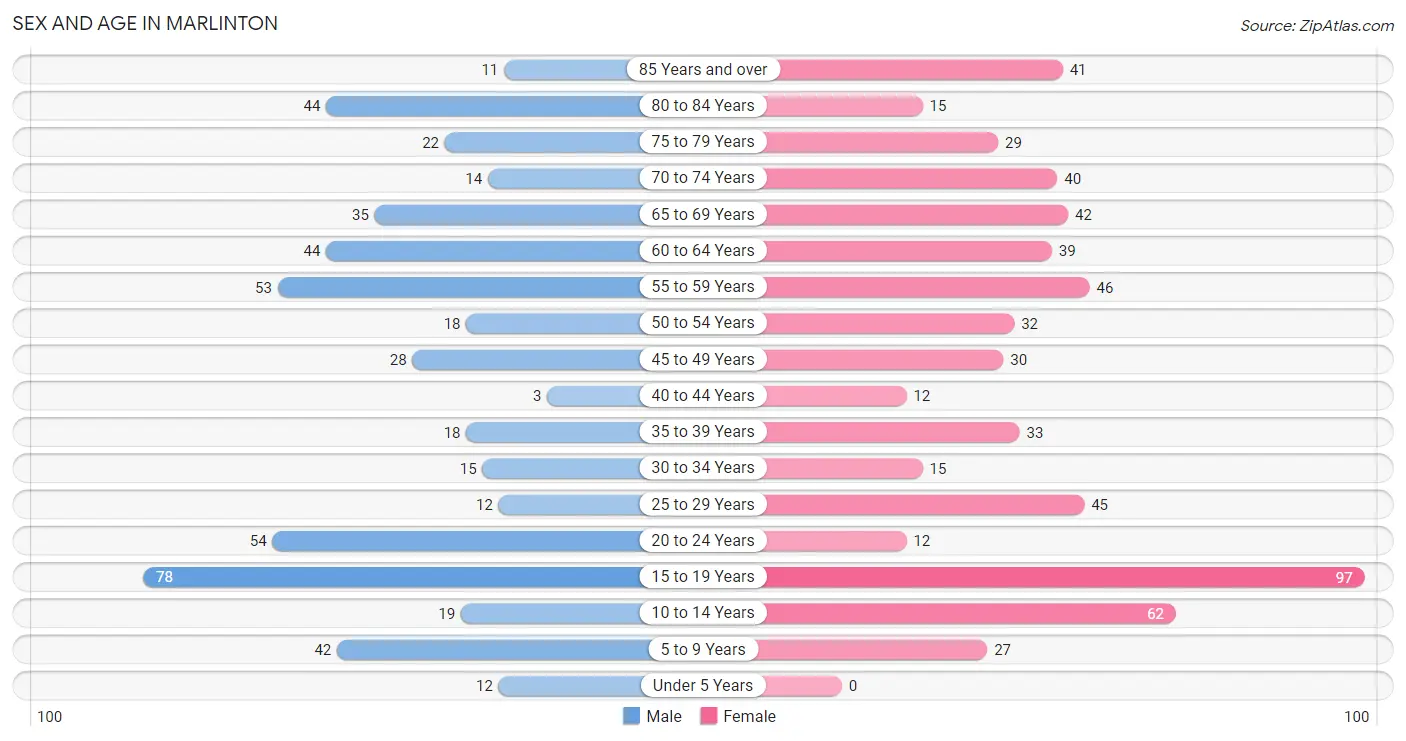
| Age Bracket | Male | Female |
| Under 5 Years | 12 (2.3%) | 0 (0.0%) |
| 5 to 9 Years | 42 (8.1%) | 27 (4.4%) |
| 10 to 14 Years | 19 (3.6%) | 62 (10.1%) |
| 15 to 19 Years | 78 (14.9%) | 97 (15.7%) |
| 20 to 24 Years | 54 (10.3%) | 12 (1.9%) |
| 25 to 29 Years | 12 (2.3%) | 45 (7.3%) |
| 30 to 34 Years | 15 (2.9%) | 15 (2.4%) |
| 35 to 39 Years | 18 (3.5%) | 33 (5.3%) |
| 40 to 44 Years | 3 (0.6%) | 12 (1.9%) |
| 45 to 49 Years | 28 (5.4%) | 30 (4.9%) |
| 50 to 54 Years | 18 (3.5%) | 32 (5.2%) |
| 55 to 59 Years | 53 (10.2%) | 46 (7.5%) |
| 60 to 64 Years | 44 (8.4%) | 39 (6.3%) |
| 65 to 69 Years | 35 (6.7%) | 42 (6.8%) |
| 70 to 74 Years | 14 (2.7%) | 40 (6.5%) |
| 75 to 79 Years | 22 (4.2%) | 29 (4.7%) |
| 80 to 84 Years | 44 (8.4%) | 15 (2.4%) |
| 85 Years and over | 11 (2.1%) | 41 (6.7%) |
| Total | 522 (100.0%) | 617 (100.0%) |
Families and Households in Marlinton
Median Family Size in Marlinton
The median family size in Marlinton is 4.28 persons per family, with single male/father families (6 | 3.6%) accounting for the largest median family size of 12.17 persons per family. On the other hand, married-couple families (121 | 72.9%) represent the smallest median family size with 3.24 persons per family.
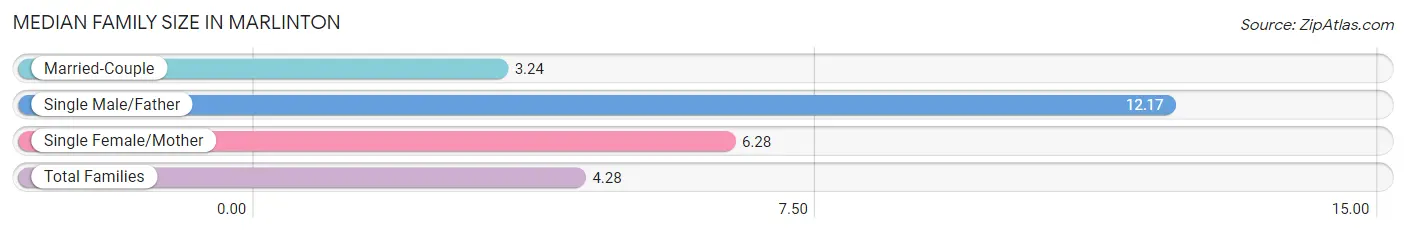
| Family Type | # Families | Family Size |
| Married-Couple | 121 (72.9%) | 3.24 |
| Single Male/Father | 6 (3.6%) | 12.17 |
| Single Female/Mother | 39 (23.5%) | 6.28 |
| Total Families | 166 (100.0%) | 4.28 |
Median Household Size in Marlinton
The median household size in Marlinton is 2.81 persons per household, with single male/father households (6 | 1.6%) accounting for the largest median household size of 15.67 persons per household. non-family households (212 | 56.1%) represent the smallest median household size with 1.24 persons per household.
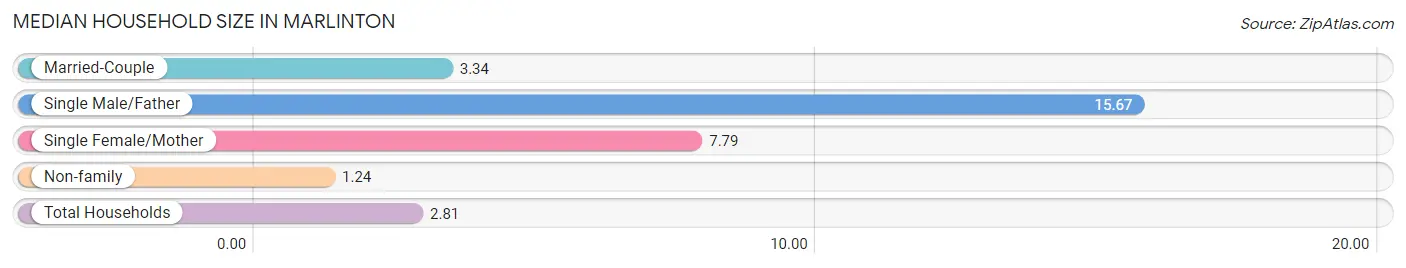
| Household Type | # Households | Household Size |
| Married-Couple | 121 (32.0%) | 3.34 |
| Single Male/Father | 6 (1.6%) | 15.67 |
| Single Female/Mother | 39 (10.3%) | 7.79 |
| Non-family | 212 (56.1%) | 1.24 |
| Total Households | 378 (100.0%) | 2.81 |
Household Size by Marriage Status in Marlinton
Out of a total of 378 households in Marlinton, 166 (43.9%) are family households, while 212 (56.1%) are nonfamily households. The most numerous type of family households are 2-person households, comprising 76, and the most common type of nonfamily households are 1-person households, comprising 167.
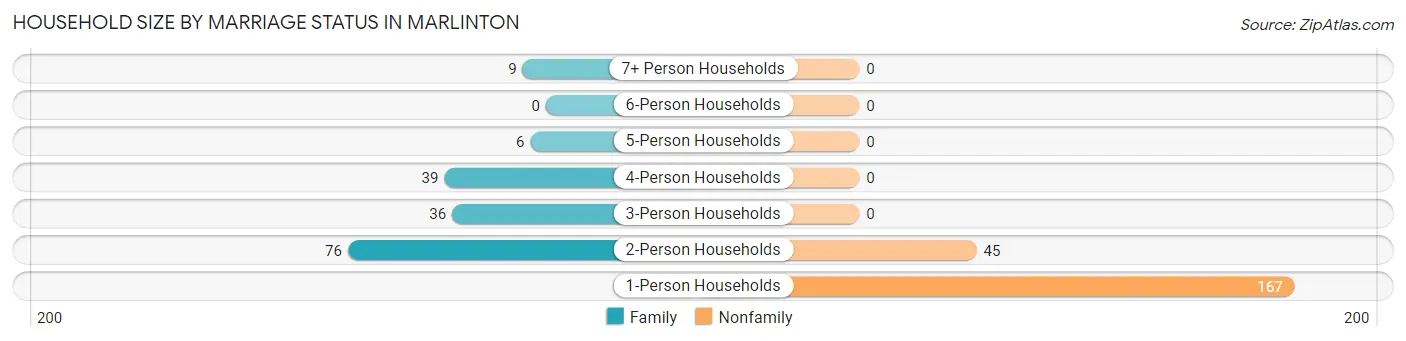
| Household Size | Family Households | Nonfamily Households |
| 1-Person Households | - | 167 (44.2%) |
| 2-Person Households | 76 (20.1%) | 45 (11.9%) |
| 3-Person Households | 36 (9.5%) | 0 (0.0%) |
| 4-Person Households | 39 (10.3%) | 0 (0.0%) |
| 5-Person Households | 6 (1.6%) | 0 (0.0%) |
| 6-Person Households | 0 (0.0%) | 0 (0.0%) |
| 7+ Person Households | 9 (2.4%) | 0 (0.0%) |
| Total | 166 (43.9%) | 212 (56.1%) |
Female Fertility in Marlinton
Fertility by Age in Marlinton
Average fertility rate in Marlinton is 15.0 births per 1,000 women. Women in the age bracket of 20 to 34 years have the highest fertility rate with 56.0 births per 1,000 women. Women in the age bracket of 20 to 34 years acount for 100.0% of all women with births.
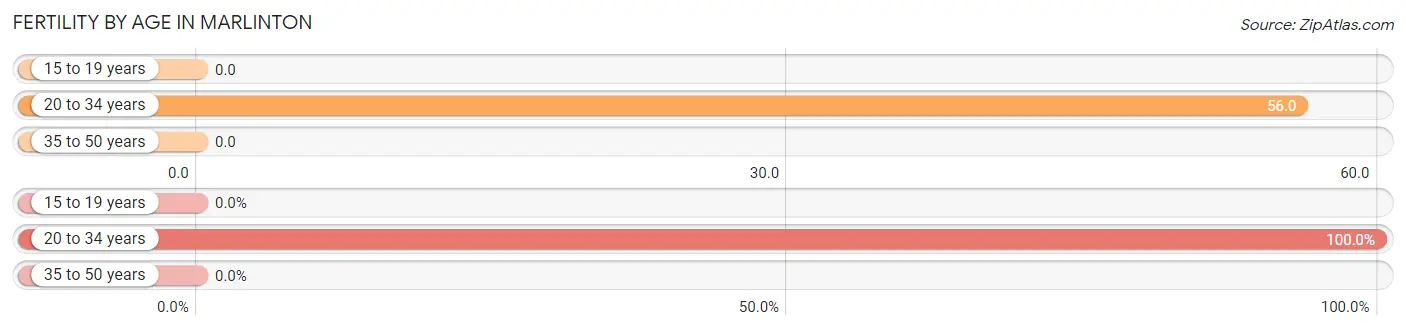
| Age Bracket | Women with Births | Births / 1,000 Women |
| 15 to 19 years | 0 (0.0%) | 0.0 |
| 20 to 34 years | 4 (100.0%) | 56.0 |
| 35 to 50 years | 0 (0.0%) | 0.0 |
| Total | 4 (100.0%) | 15.0 |
Fertility by Age by Marriage Status in Marlinton
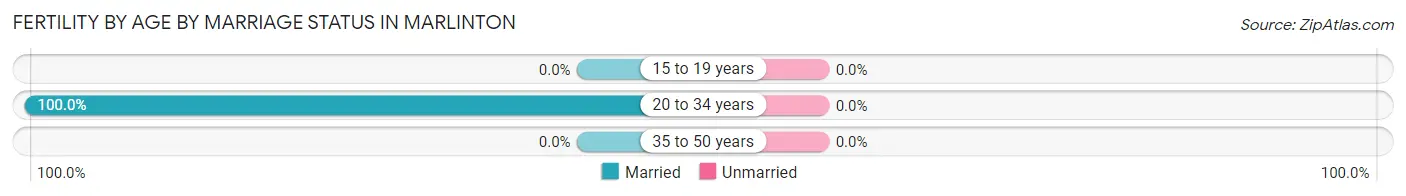
| Age Bracket | Married | Unmarried |
| 15 to 19 years | 0 (0.0%) | 0 (0.0%) |
| 20 to 34 years | 4 (100.0%) | 0 (0.0%) |
| 35 to 50 years | 0 (0.0%) | 0 (0.0%) |
| Total | 4 (100.0%) | 0 (0.0%) |
Fertility by Education in Marlinton
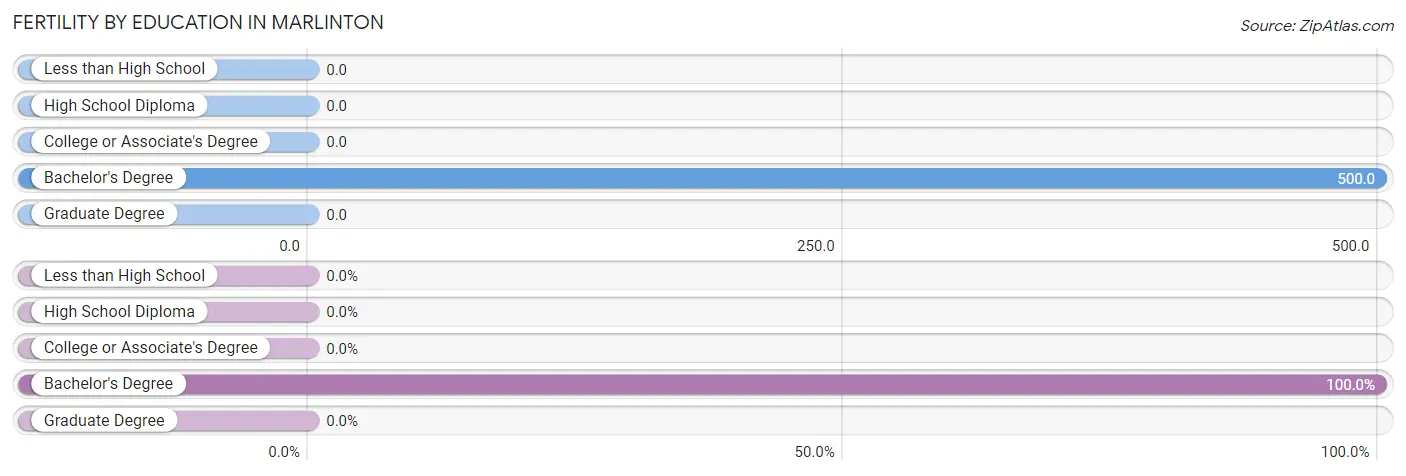
| Educational Attainment | Women with Births | Births / 1,000 Women |
| Less than High School | 0 (0.0%) | 0.0 |
| High School Diploma | 0 (0.0%) | 0.0 |
| College or Associate's Degree | 0 (0.0%) | 0.0 |
| Bachelor's Degree | 4 (100.0%) | 500.0 |
| Graduate Degree | 0 (0.0%) | 0.0 |
| Total | 4 (100.0%) | 15.0 |
Fertility by Education by Marriage Status in Marlinton
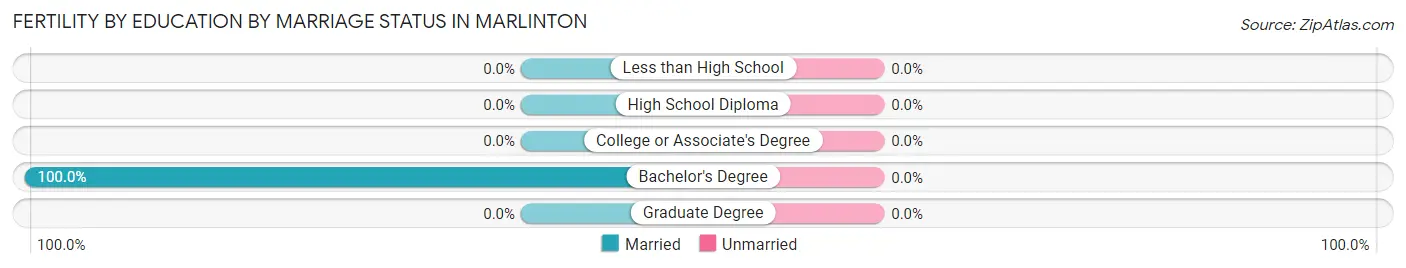
| Educational Attainment | Married | Unmarried |
| Less than High School | 0 (0.0%) | 0 (0.0%) |
| High School Diploma | 0 (0.0%) | 0 (0.0%) |
| College or Associate's Degree | 0 (0.0%) | 0 (0.0%) |
| Bachelor's Degree | 4 (100.0%) | 0 (0.0%) |
| Graduate Degree | 0 (0.0%) | 0 (0.0%) |
| Total | 4 (100.0%) | 0 (0.0%) |
Employment Characteristics in Marlinton
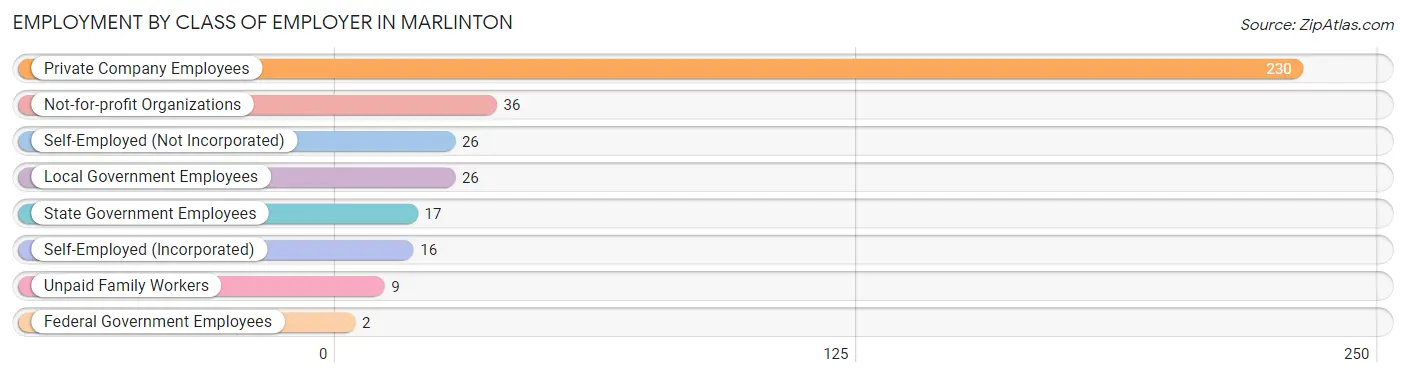
Employment by Class of Employer in Marlinton
Among the 362 employed individuals in Marlinton, private company employees (230 | 63.5%), not-for-profit organizations (36 | 9.9%), and self-employed (not incorporated) (26 | 7.2%) make up the most common classes of employment.
| Employer Class | # Employees | % Employees |
| Private Company Employees | 230 | 63.5% |
| Self-Employed (Incorporated) | 16 | 4.4% |
| Self-Employed (Not Incorporated) | 26 | 7.2% |
| Not-for-profit Organizations | 36 | 9.9% |
| Local Government Employees | 26 | 7.2% |
| State Government Employees | 17 | 4.7% |
| Federal Government Employees | 2 | 0.5% |
| Unpaid Family Workers | 9 | 2.5% |
| Total | 362 | 100.0% |
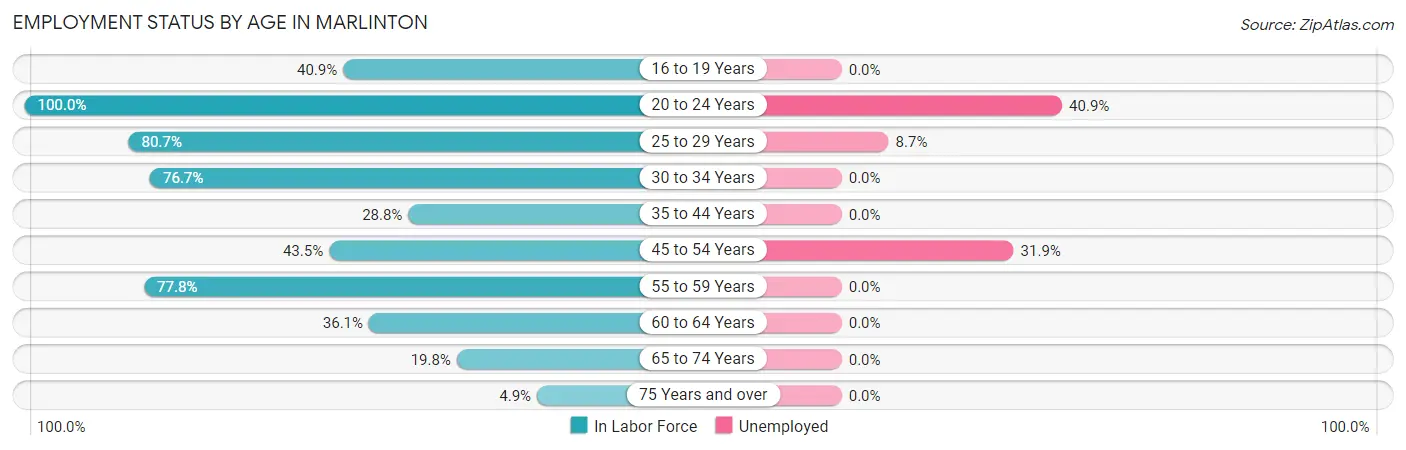
Employment Status by Age in Marlinton
According to the labor force statistics for Marlinton, out of the total population over 16 years of age (966), 42.3% or 409 individuals are in the labor force, with 11.2% or 46 of them unemployed. The age group with the highest labor force participation rate is 20 to 24 years, with 100.0% or 66 individuals in the labor force. Within the labor force, the 20 to 24 years age range has the highest percentage of unemployed individuals, with 40.9% or 27 of them being unemployed.
| Age Bracket | In Labor Force | Unemployed |
| 16 to 19 Years | 67 (40.9%) | 0 (0.0%) |
| 20 to 24 Years | 66 (100.0%) | 27 (40.9%) |
| 25 to 29 Years | 46 (80.7%) | 4 (8.7%) |
| 30 to 34 Years | 23 (76.7%) | 0 (0.0%) |
| 35 to 44 Years | 19 (28.8%) | 0 (0.0%) |
| 45 to 54 Years | 47 (43.5%) | 15 (31.9%) |
| 55 to 59 Years | 77 (77.8%) | 0 (0.0%) |
| 60 to 64 Years | 30 (36.1%) | 0 (0.0%) |
| 65 to 74 Years | 26 (19.8%) | 0 (0.0%) |
| 75 Years and over | 8 (4.9%) | 0 (0.0%) |
| Total | 409 (42.3%) | 46 (11.2%) |
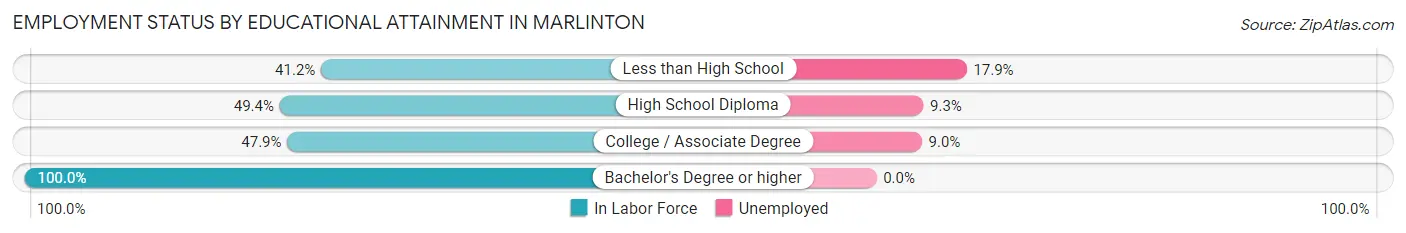
Employment Status by Educational Attainment in Marlinton
According to labor force statistics for Marlinton, 54.6% of individuals (242) out of the total population between 25 and 64 years of age (443) are in the labor force, with 7.9% or 19 of them being unemployed. The group with the highest labor force participation rate are those with the educational attainment of bachelor's degree or higher, with 100.0% or 61 individuals in the labor force. Within the labor force, individuals with less than high school education have the highest percentage of unemployment, with 17.9% or 5 of them being unemployed.
| Educational Attainment | In Labor Force | Unemployed |
| Less than High School | 28 (41.2%) | 12 (17.9%) |
| High School Diploma | 86 (49.4%) | 16 (9.3%) |
| College / Associate Degree | 67 (47.9%) | 13 (9.0%) |
| Bachelor's Degree or higher | 61 (100.0%) | 0 (0.0%) |
| Total | 242 (54.6%) | 35 (7.9%) |
Employment Occupations by Sex in Marlinton
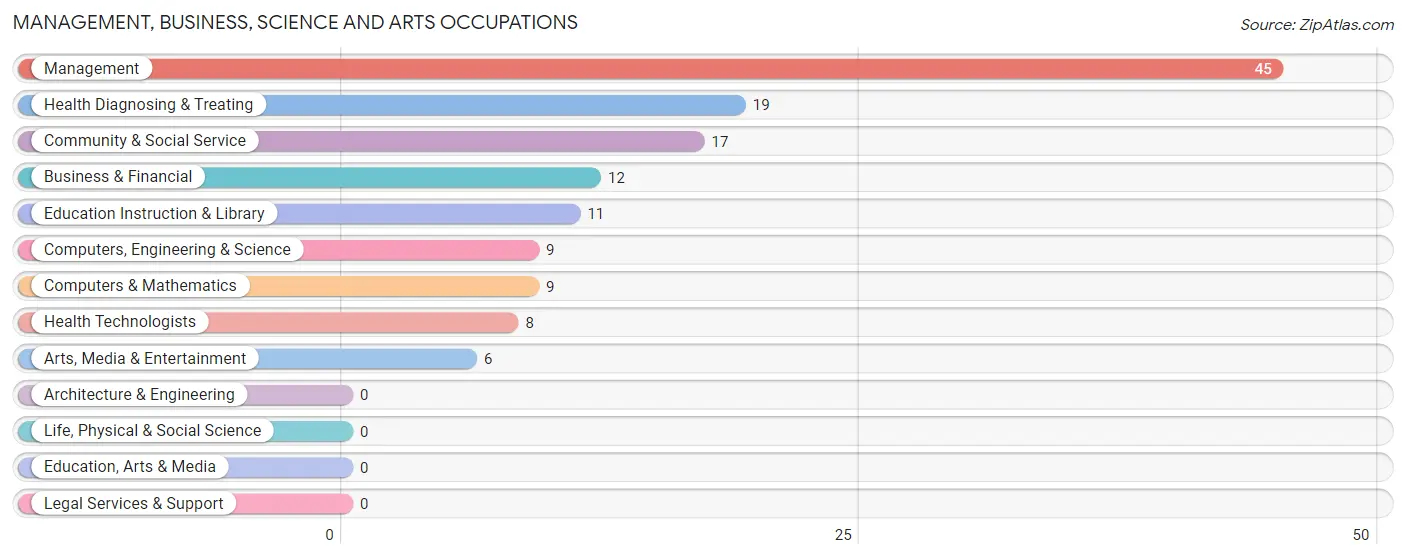
Management, Business, Science and Arts Occupations
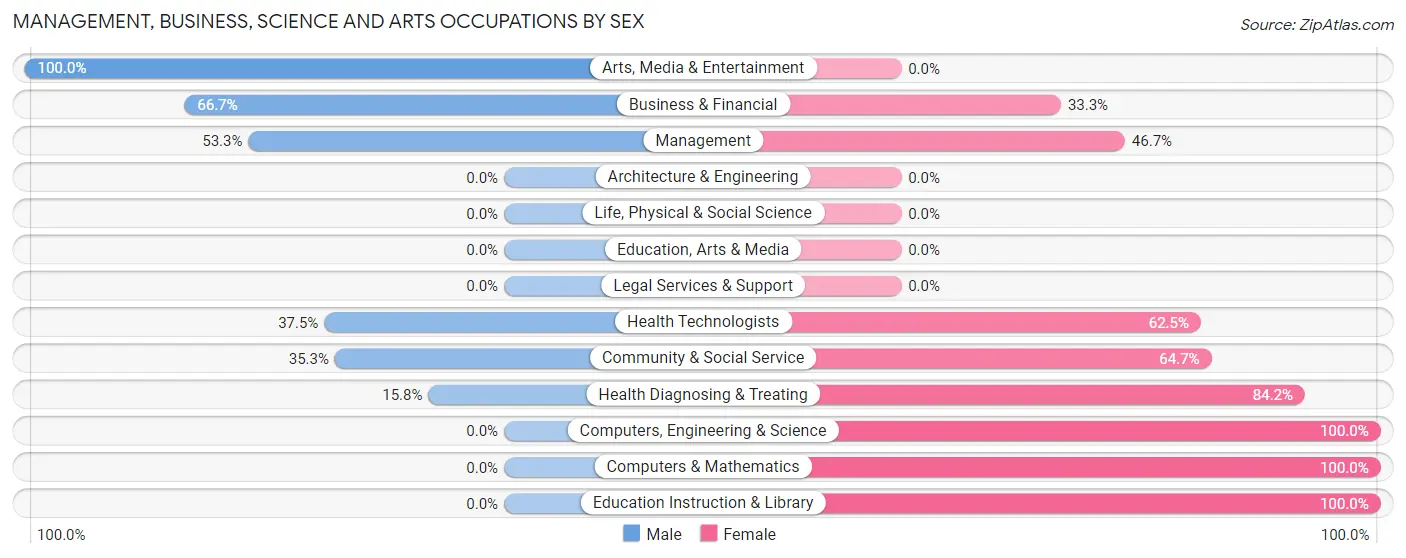
The most common Management, Business, Science and Arts occupations in Marlinton are Management (45 | 12.4%), Health Diagnosing & Treating (19 | 5.2%), Community & Social Service (17 | 4.7%), Business & Financial (12 | 3.3%), and Education Instruction & Library (11 | 3.0%).
Management, Business, Science and Arts Occupations by Sex
Within the Management, Business, Science and Arts occupations in Marlinton, the most male-oriented occupations are Arts, Media & Entertainment (100.0%), Business & Financial (66.7%), and Management (53.3%), while the most female-oriented occupations are Computers, Engineering & Science (100.0%), Computers & Mathematics (100.0%), and Education Instruction & Library (100.0%).
| Occupation | Male | Female |
| Management | 24 (53.3%) | 21 (46.7%) |
| Business & Financial | 8 (66.7%) | 4 (33.3%) |
| Computers, Engineering & Science | 0 (0.0%) | 9 (100.0%) |
| Computers & Mathematics | 0 (0.0%) | 9 (100.0%) |
| Architecture & Engineering | 0 (0.0%) | 0 (0.0%) |
| Life, Physical & Social Science | 0 (0.0%) | 0 (0.0%) |
| Community & Social Service | 6 (35.3%) | 11 (64.7%) |
| Education, Arts & Media | 0 (0.0%) | 0 (0.0%) |
| Legal Services & Support | 0 (0.0%) | 0 (0.0%) |
| Education Instruction & Library | 0 (0.0%) | 11 (100.0%) |
| Arts, Media & Entertainment | 6 (100.0%) | 0 (0.0%) |
| Health Diagnosing & Treating | 3 (15.8%) | 16 (84.2%) |
| Health Technologists | 3 (37.5%) | 5 (62.5%) |
| Total (Category) | 41 (40.2%) | 61 (59.8%) |
| Total (Overall) | 184 (50.7%) | 179 (49.3%) |
Services Occupations
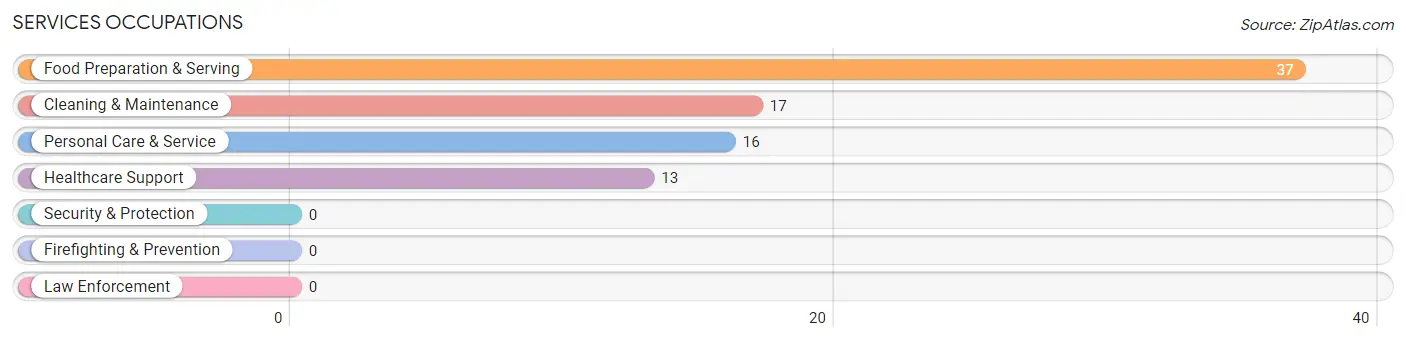
The most common Services occupations in Marlinton are Food Preparation & Serving (37 | 10.2%), Cleaning & Maintenance (17 | 4.7%), Personal Care & Service (16 | 4.4%), and Healthcare Support (13 | 3.6%).
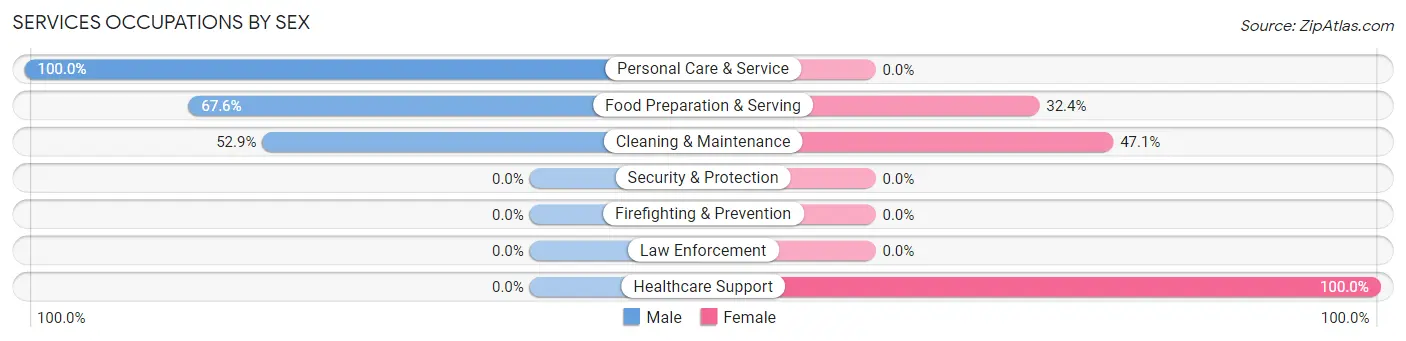
Services Occupations by Sex
Within the Services occupations in Marlinton, the most male-oriented occupations are Personal Care & Service (100.0%), Food Preparation & Serving (67.6%), and Cleaning & Maintenance (52.9%), while the most female-oriented occupations are Healthcare Support (100.0%), Cleaning & Maintenance (47.1%), and Food Preparation & Serving (32.4%).
| Occupation | Male | Female |
| Healthcare Support | 0 (0.0%) | 13 (100.0%) |
| Security & Protection | 0 (0.0%) | 0 (0.0%) |
| Firefighting & Prevention | 0 (0.0%) | 0 (0.0%) |
| Law Enforcement | 0 (0.0%) | 0 (0.0%) |
| Food Preparation & Serving | 25 (67.6%) | 12 (32.4%) |
| Cleaning & Maintenance | 9 (52.9%) | 8 (47.1%) |
| Personal Care & Service | 16 (100.0%) | 0 (0.0%) |
| Total (Category) | 50 (60.2%) | 33 (39.8%) |
| Total (Overall) | 184 (50.7%) | 179 (49.3%) |
Sales and Office Occupations
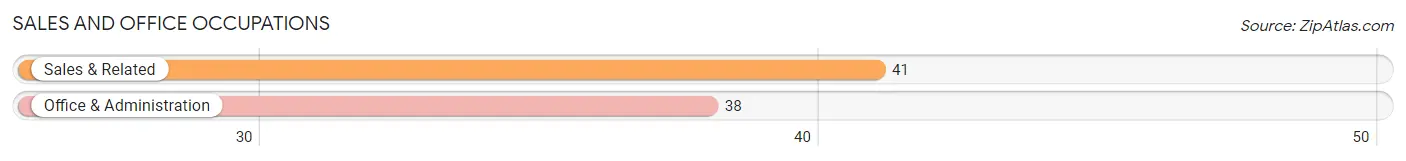
The most common Sales and Office occupations in Marlinton are Sales & Related (41 | 11.3%), and Office & Administration (38 | 10.5%).
Sales and Office Occupations by Sex
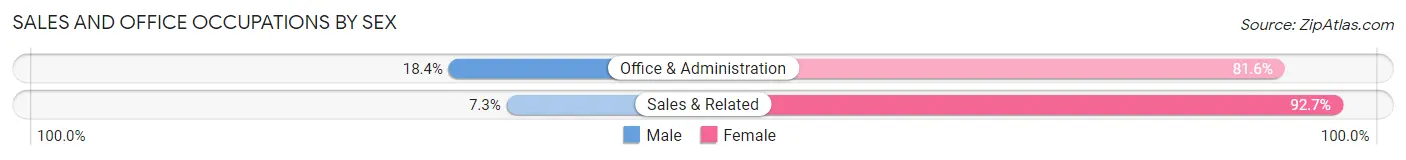
| Occupation | Male | Female |
| Sales & Related | 3 (7.3%) | 38 (92.7%) |
| Office & Administration | 7 (18.4%) | 31 (81.6%) |
| Total (Category) | 10 (12.7%) | 69 (87.3%) |
| Total (Overall) | 184 (50.7%) | 179 (49.3%) |
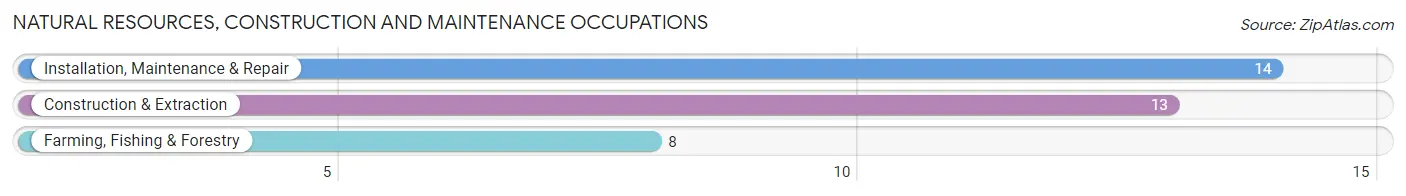
Natural Resources, Construction and Maintenance Occupations
The most common Natural Resources, Construction and Maintenance occupations in Marlinton are Installation, Maintenance & Repair (14 | 3.9%), Construction & Extraction (13 | 3.6%), and Farming, Fishing & Forestry (8 | 2.2%).
Natural Resources, Construction and Maintenance Occupations by Sex
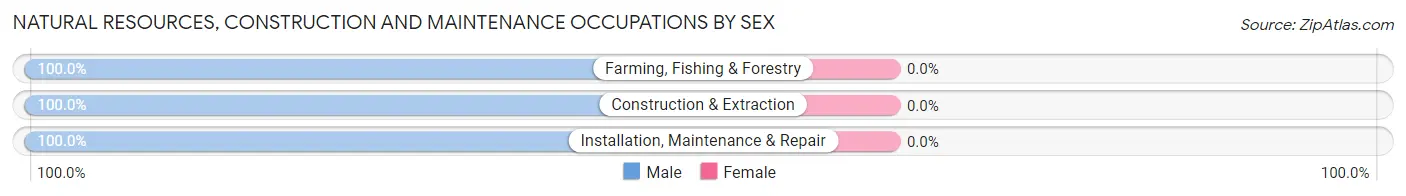
| Occupation | Male | Female |
| Farming, Fishing & Forestry | 8 (100.0%) | 0 (0.0%) |
| Construction & Extraction | 13 (100.0%) | 0 (0.0%) |
| Installation, Maintenance & Repair | 14 (100.0%) | 0 (0.0%) |
| Total (Category) | 35 (100.0%) | 0 (0.0%) |
| Total (Overall) | 184 (50.7%) | 179 (49.3%) |
Production, Transportation and Moving Occupations
The most common Production, Transportation and Moving occupations in Marlinton are Material Moving (39 | 10.7%), Production (20 | 5.5%), and Transportation (5 | 1.4%).
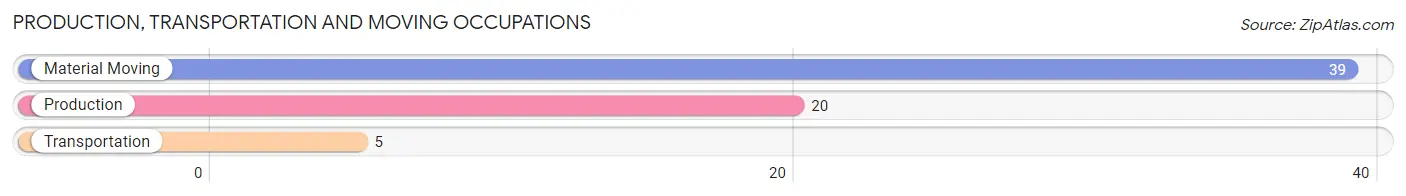
Production, Transportation and Moving Occupations by Sex
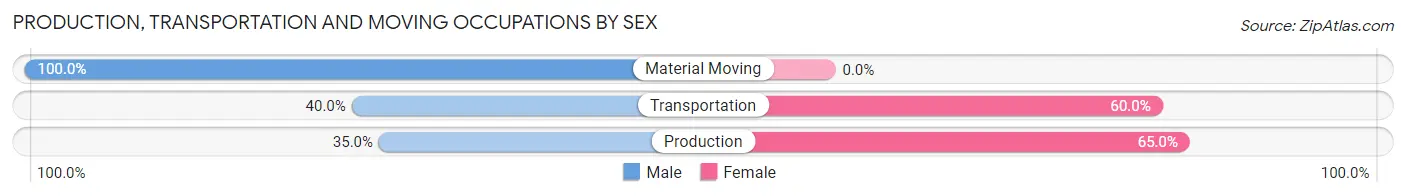
| Occupation | Male | Female |
| Production | 7 (35.0%) | 13 (65.0%) |
| Transportation | 2 (40.0%) | 3 (60.0%) |
| Material Moving | 39 (100.0%) | 0 (0.0%) |
| Total (Category) | 48 (75.0%) | 16 (25.0%) |
| Total (Overall) | 184 (50.7%) | 179 (49.3%) |
Employment Industries by Sex in Marlinton
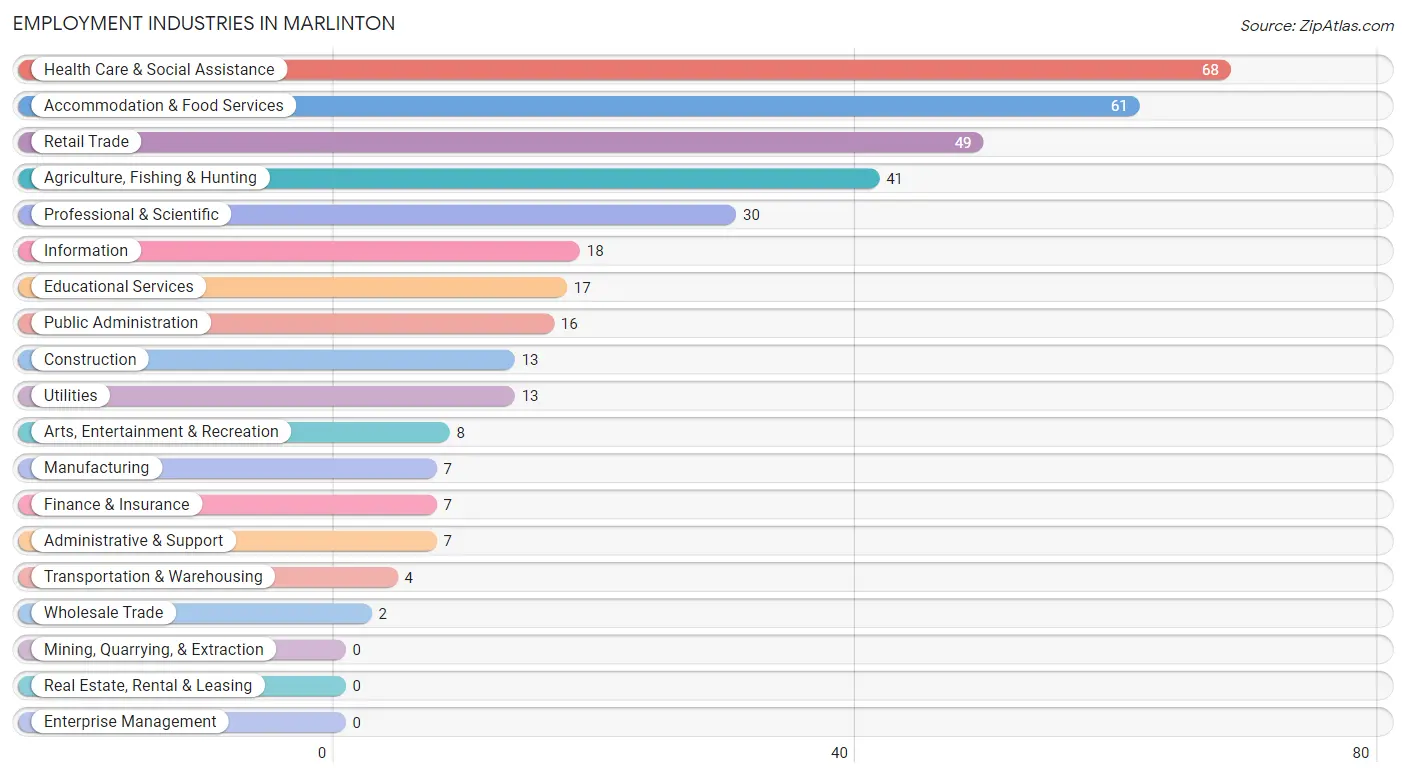
Employment Industries in Marlinton
The major employment industries in Marlinton include Health Care & Social Assistance (68 | 18.7%), Accommodation & Food Services (61 | 16.8%), Retail Trade (49 | 13.5%), Agriculture, Fishing & Hunting (41 | 11.3%), and Professional & Scientific (30 | 8.3%).
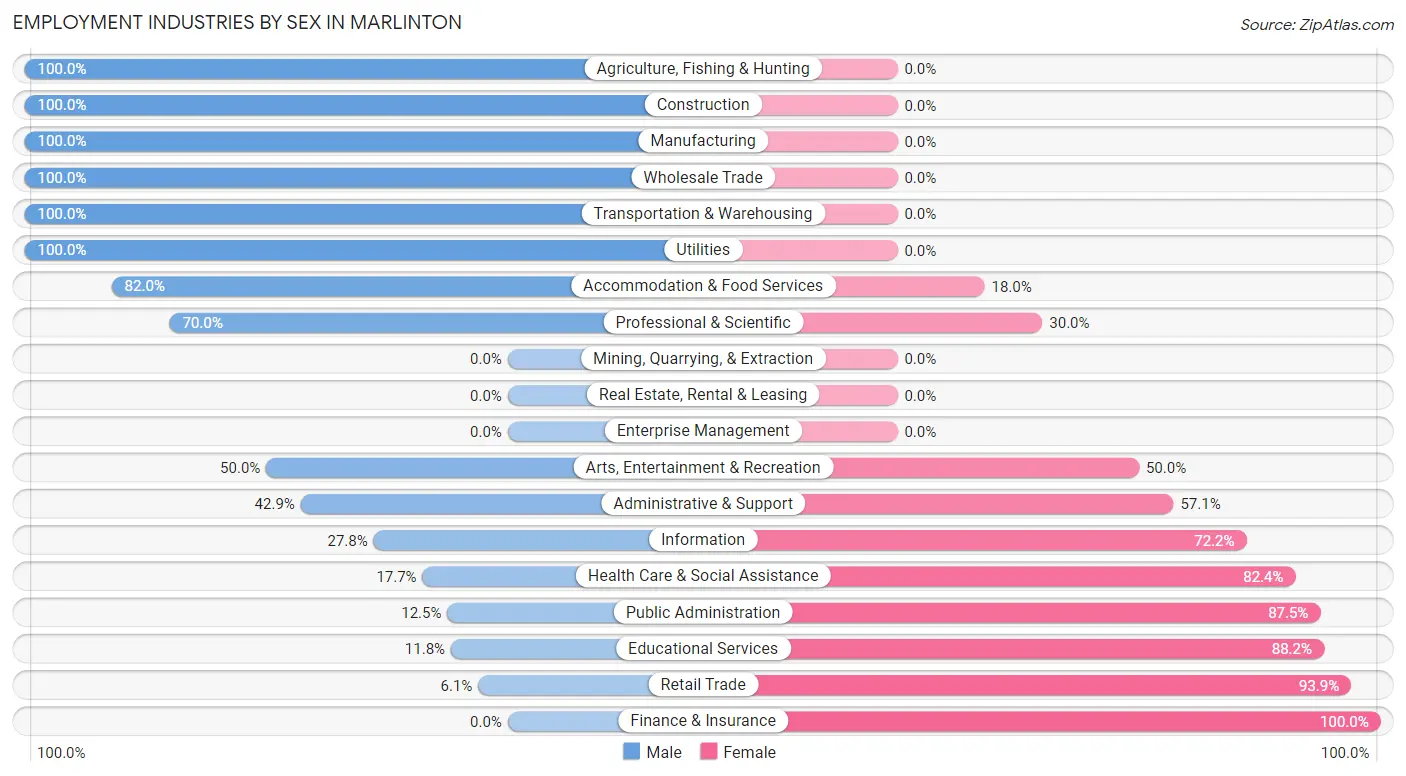
Employment Industries by Sex in Marlinton
The Marlinton industries that see more men than women are Agriculture, Fishing & Hunting (100.0%), Construction (100.0%), and Manufacturing (100.0%), whereas the industries that tend to have a higher number of women are Finance & Insurance (100.0%), Retail Trade (93.9%), and Educational Services (88.2%).
| Industry | Male | Female |
| Agriculture, Fishing & Hunting | 41 (100.0%) | 0 (0.0%) |
| Mining, Quarrying, & Extraction | 0 (0.0%) | 0 (0.0%) |
| Construction | 13 (100.0%) | 0 (0.0%) |
| Manufacturing | 7 (100.0%) | 0 (0.0%) |
| Wholesale Trade | 2 (100.0%) | 0 (0.0%) |
| Retail Trade | 3 (6.1%) | 46 (93.9%) |
| Transportation & Warehousing | 4 (100.0%) | 0 (0.0%) |
| Utilities | 13 (100.0%) | 0 (0.0%) |
| Information | 5 (27.8%) | 13 (72.2%) |
| Finance & Insurance | 0 (0.0%) | 7 (100.0%) |
| Real Estate, Rental & Leasing | 0 (0.0%) | 0 (0.0%) |
| Professional & Scientific | 21 (70.0%) | 9 (30.0%) |
| Enterprise Management | 0 (0.0%) | 0 (0.0%) |
| Administrative & Support | 3 (42.9%) | 4 (57.1%) |
| Educational Services | 2 (11.8%) | 15 (88.2%) |
| Health Care & Social Assistance | 12 (17.6%) | 56 (82.4%) |
| Arts, Entertainment & Recreation | 4 (50.0%) | 4 (50.0%) |
| Accommodation & Food Services | 50 (82.0%) | 11 (18.0%) |
| Public Administration | 2 (12.5%) | 14 (87.5%) |
| Total | 184 (50.7%) | 179 (49.3%) |
Education in Marlinton
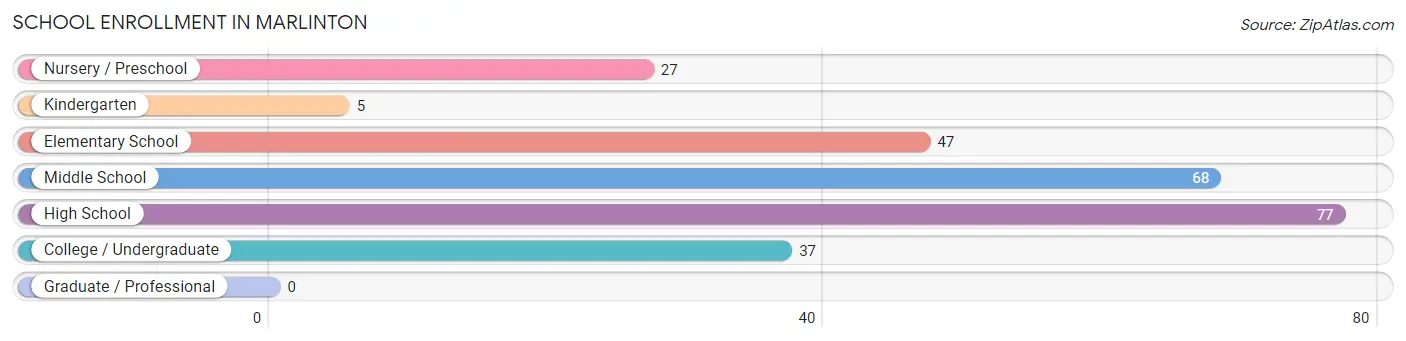
School Enrollment in Marlinton
The most common levels of schooling among the 261 students in Marlinton are high school (77 | 29.5%), middle school (68 | 26.1%), and elementary school (47 | 18.0%).
| School Level | # Students | % Students |
| Nursery / Preschool | 27 | 10.3% |
| Kindergarten | 5 | 1.9% |
| Elementary School | 47 | 18.0% |
| Middle School | 68 | 26.1% |
| High School | 77 | 29.5% |
| College / Undergraduate | 37 | 14.2% |
| Graduate / Professional | 0 | 0.0% |
| Total | 261 | 100.0% |
School Enrollment by Age by Funding Source in Marlinton
Out of a total of 261 students who are enrolled in schools in Marlinton, 15 (5.7%) attend a private institution, while the remaining 246 (94.3%) are enrolled in public schools. The age group of 5 to 9 year old has the highest likelihood of being enrolled in private schools, with 15 (24.6% in the age bracket) enrolled. Conversely, the age group of 3 to 4 year olds has the lowest likelihood of being enrolled in a private school, with 10 (100.0% in the age bracket) attending a public institution.
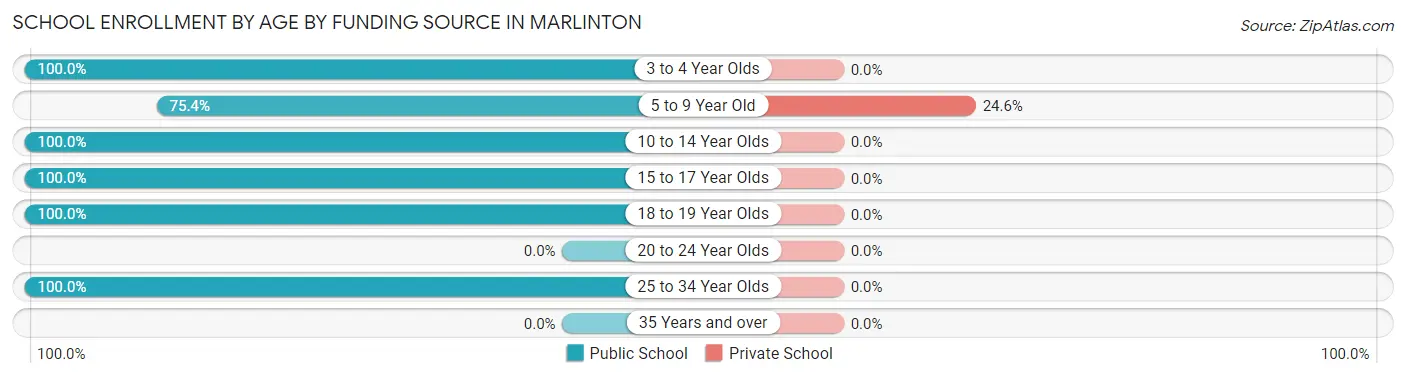
| Age Bracket | Public School | Private School |
| 3 to 4 Year Olds | 10 (100.0%) | 0 (0.0%) |
| 5 to 9 Year Old | 46 (75.4%) | 15 (24.6%) |
| 10 to 14 Year Olds | 81 (100.0%) | 0 (0.0%) |
| 15 to 17 Year Olds | 72 (100.0%) | 0 (0.0%) |
| 18 to 19 Year Olds | 25 (100.0%) | 0 (0.0%) |
| 20 to 24 Year Olds | 0 (0.0%) | 0 (0.0%) |
| 25 to 34 Year Olds | 12 (100.0%) | 0 (0.0%) |
| 35 Years and over | 0 (0.0%) | 0 (0.0%) |
| Total | 246 (94.3%) | 15 (5.7%) |
Educational Attainment by Field of Study in Marlinton
Science & technology (39 | 30.9%), business (30 | 23.8%), education (13 | 10.3%), communications (13 | 10.3%), and social sciences (10 | 7.9%) are the most common fields of study among 126 individuals in Marlinton who have obtained a bachelor's degree or higher.
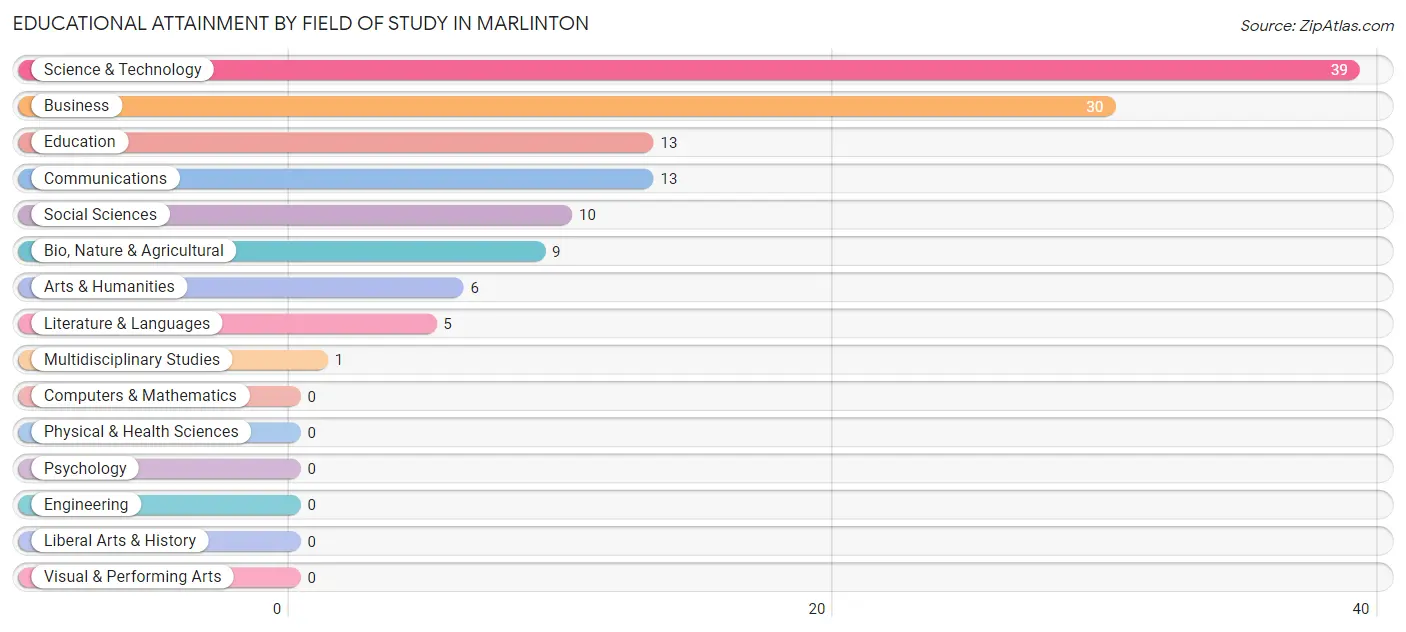
| Field of Study | # Graduates | % Graduates |
| Computers & Mathematics | 0 | 0.0% |
| Bio, Nature & Agricultural | 9 | 7.1% |
| Physical & Health Sciences | 0 | 0.0% |
| Psychology | 0 | 0.0% |
| Social Sciences | 10 | 7.9% |
| Engineering | 0 | 0.0% |
| Multidisciplinary Studies | 1 | 0.8% |
| Science & Technology | 39 | 30.9% |
| Business | 30 | 23.8% |
| Education | 13 | 10.3% |
| Literature & Languages | 5 | 4.0% |
| Liberal Arts & History | 0 | 0.0% |
| Visual & Performing Arts | 0 | 0.0% |
| Communications | 13 | 10.3% |
| Arts & Humanities | 6 | 4.8% |
| Total | 126 | 100.0% |
Transportation & Commute in Marlinton
Vehicle Availability by Sex in Marlinton
The most prevalent vehicle ownership categories in Marlinton are males with 2 vehicles (93, accounting for 50.8%) and females with 2 vehicles (89, making up 52.0%).
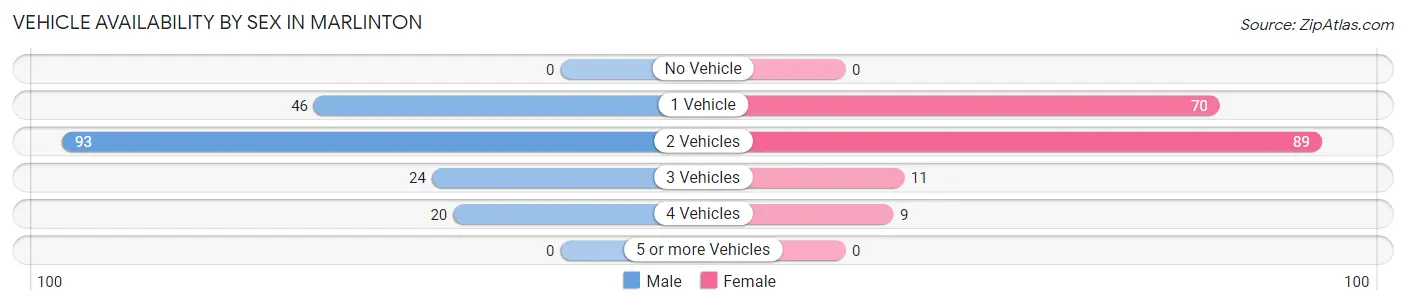
| Vehicles Available | Male | Female |
| No Vehicle | 0 (0.0%) | 0 (0.0%) |
| 1 Vehicle | 46 (25.1%) | 70 (39.1%) |
| 2 Vehicles | 93 (50.8%) | 89 (49.7%) |
| 3 Vehicles | 24 (13.1%) | 11 (6.1%) |
| 4 Vehicles | 20 (10.9%) | 9 (5.0%) |
| 5 or more Vehicles | 0 (0.0%) | 0 (0.0%) |
| Total | 183 (100.0%) | 179 (100.0%) |
Commute Time in Marlinton
The most frequently occuring commute durations in Marlinton are 5 to 9 minutes (92 commuters, 26.1%), 10 to 14 minutes (65 commuters, 18.4%), and less than 5 minutes (54 commuters, 15.3%).
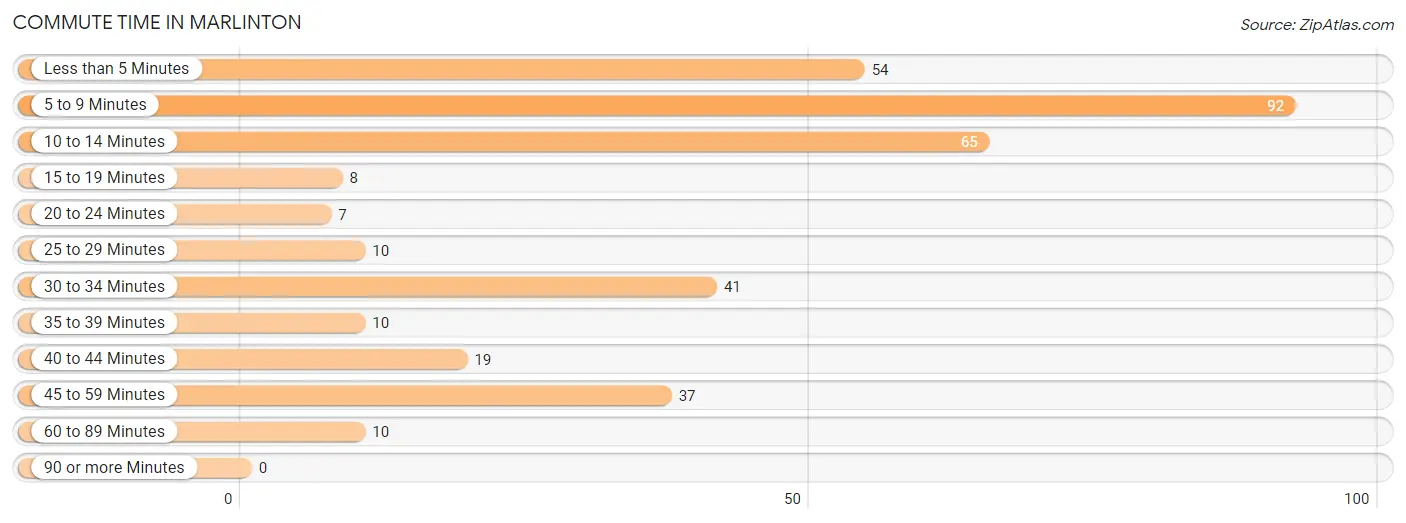
| Commute Time | # Commuters | % Commuters |
| Less than 5 Minutes | 54 | 15.3% |
| 5 to 9 Minutes | 92 | 26.1% |
| 10 to 14 Minutes | 65 | 18.4% |
| 15 to 19 Minutes | 8 | 2.3% |
| 20 to 24 Minutes | 7 | 2.0% |
| 25 to 29 Minutes | 10 | 2.8% |
| 30 to 34 Minutes | 41 | 11.6% |
| 35 to 39 Minutes | 10 | 2.8% |
| 40 to 44 Minutes | 19 | 5.4% |
| 45 to 59 Minutes | 37 | 10.5% |
| 60 to 89 Minutes | 10 | 2.8% |
| 90 or more Minutes | 0 | 0.0% |
Commute Time by Sex in Marlinton
The most common commute times in Marlinton are 10 to 14 minutes (39 commuters, 21.9%) for males and 5 to 9 minutes (77 commuters, 44.0%) for females.
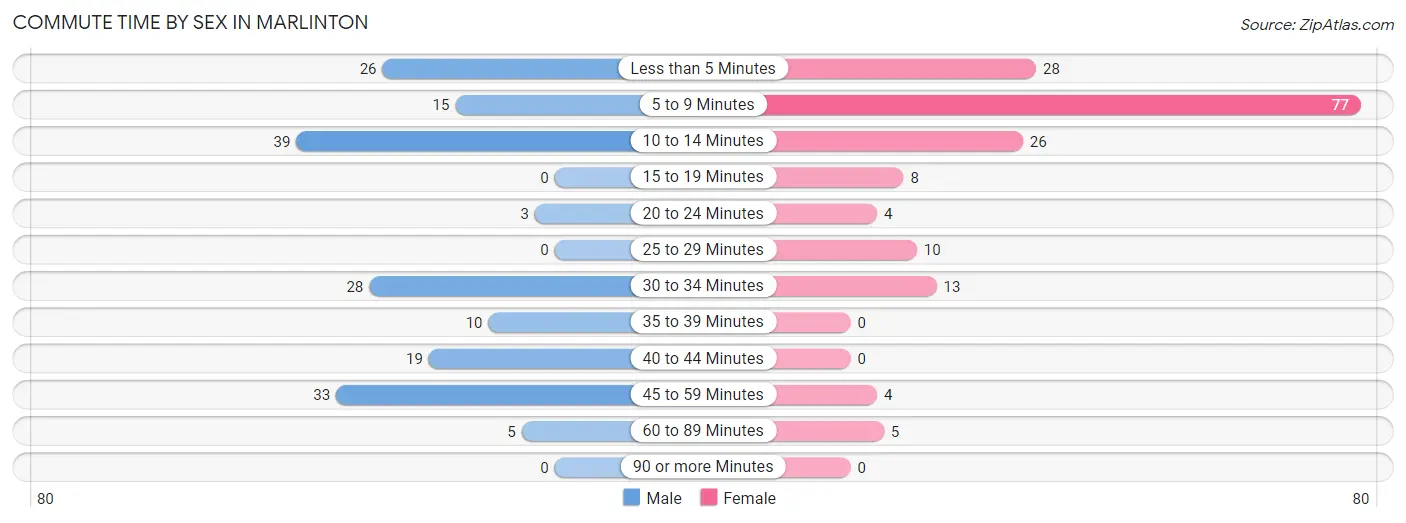
| Commute Time | Male | Female |
| Less than 5 Minutes | 26 (14.6%) | 28 (16.0%) |
| 5 to 9 Minutes | 15 (8.4%) | 77 (44.0%) |
| 10 to 14 Minutes | 39 (21.9%) | 26 (14.9%) |
| 15 to 19 Minutes | 0 (0.0%) | 8 (4.6%) |
| 20 to 24 Minutes | 3 (1.7%) | 4 (2.3%) |
| 25 to 29 Minutes | 0 (0.0%) | 10 (5.7%) |
| 30 to 34 Minutes | 28 (15.7%) | 13 (7.4%) |
| 35 to 39 Minutes | 10 (5.6%) | 0 (0.0%) |
| 40 to 44 Minutes | 19 (10.7%) | 0 (0.0%) |
| 45 to 59 Minutes | 33 (18.5%) | 4 (2.3%) |
| 60 to 89 Minutes | 5 (2.8%) | 5 (2.9%) |
| 90 or more Minutes | 0 (0.0%) | 0 (0.0%) |
Time of Departure to Work by Sex in Marlinton
The most frequent times of departure to work in Marlinton are 8:00 AM to 8:29 AM (34, 19.1%) for males and 4:00 PM to 11:59 PM (34, 19.4%) for females.
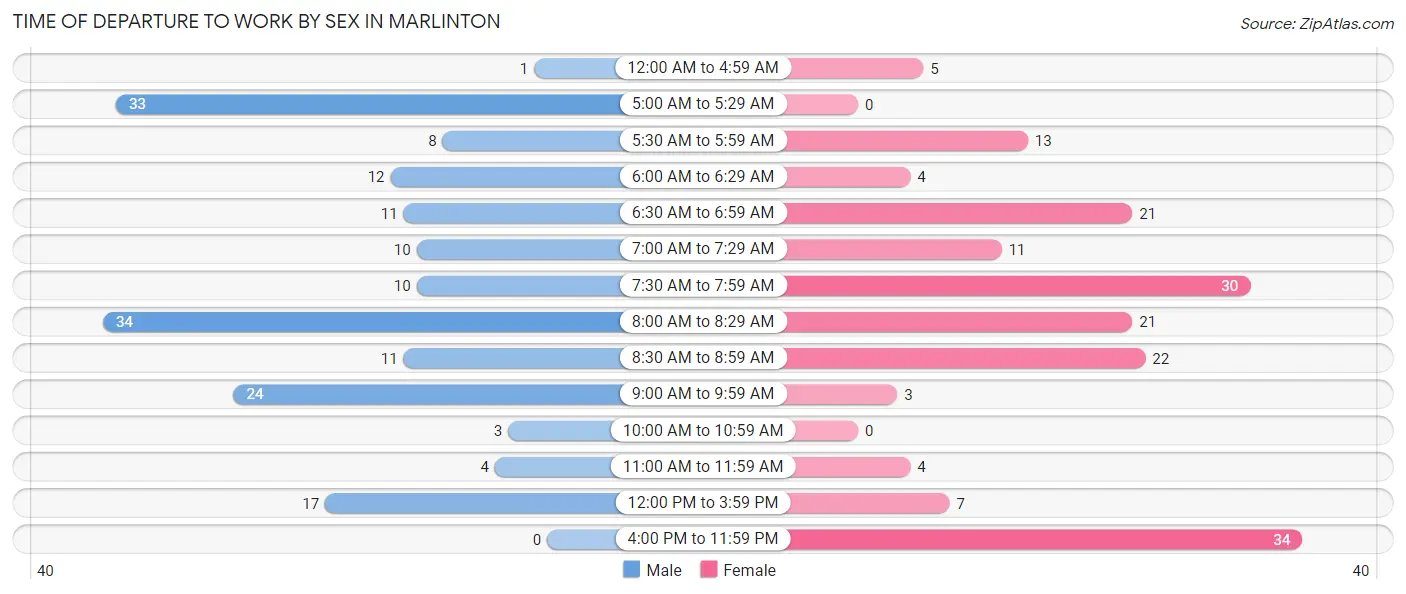
| Time of Departure | Male | Female |
| 12:00 AM to 4:59 AM | 1 (0.6%) | 5 (2.9%) |
| 5:00 AM to 5:29 AM | 33 (18.5%) | 0 (0.0%) |
| 5:30 AM to 5:59 AM | 8 (4.5%) | 13 (7.4%) |
| 6:00 AM to 6:29 AM | 12 (6.7%) | 4 (2.3%) |
| 6:30 AM to 6:59 AM | 11 (6.2%) | 21 (12.0%) |
| 7:00 AM to 7:29 AM | 10 (5.6%) | 11 (6.3%) |
| 7:30 AM to 7:59 AM | 10 (5.6%) | 30 (17.1%) |
| 8:00 AM to 8:29 AM | 34 (19.1%) | 21 (12.0%) |
| 8:30 AM to 8:59 AM | 11 (6.2%) | 22 (12.6%) |
| 9:00 AM to 9:59 AM | 24 (13.5%) | 3 (1.7%) |
| 10:00 AM to 10:59 AM | 3 (1.7%) | 0 (0.0%) |
| 11:00 AM to 11:59 AM | 4 (2.2%) | 4 (2.3%) |
| 12:00 PM to 3:59 PM | 17 (9.6%) | 7 (4.0%) |
| 4:00 PM to 11:59 PM | 0 (0.0%) | 34 (19.4%) |
| Total | 178 (100.0%) | 175 (100.0%) |
Housing Occupancy in Marlinton
Occupancy by Ownership in Marlinton
Of the total 378 dwellings in Marlinton, owner-occupied units account for 263 (69.6%), while renter-occupied units make up 115 (30.4%).
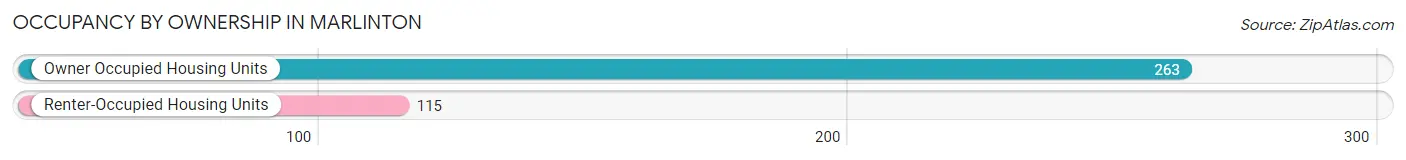
| Occupancy | # Housing Units | % Housing Units |
| Owner Occupied Housing Units | 263 | 69.6% |
| Renter-Occupied Housing Units | 115 | 30.4% |
| Total Occupied Housing Units | 378 | 100.0% |
Occupancy by Household Size in Marlinton
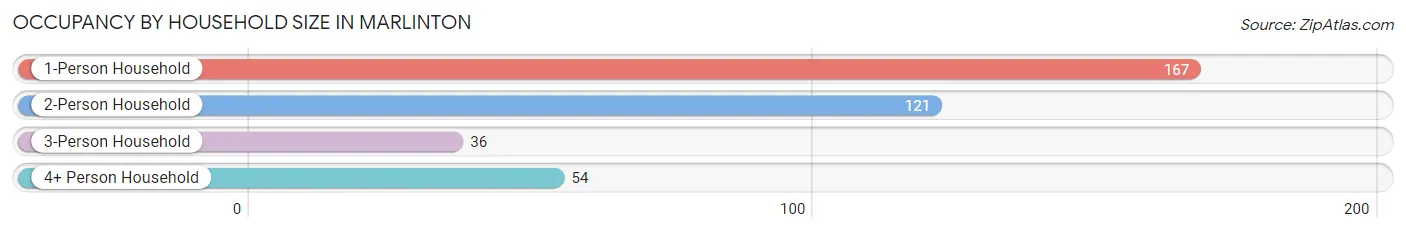
| Household Size | # Housing Units | % Housing Units |
| 1-Person Household | 167 | 44.2% |
| 2-Person Household | 121 | 32.0% |
| 3-Person Household | 36 | 9.5% |
| 4+ Person Household | 54 | 14.3% |
| Total Housing Units | 378 | 100.0% |
Occupancy by Ownership by Household Size in Marlinton
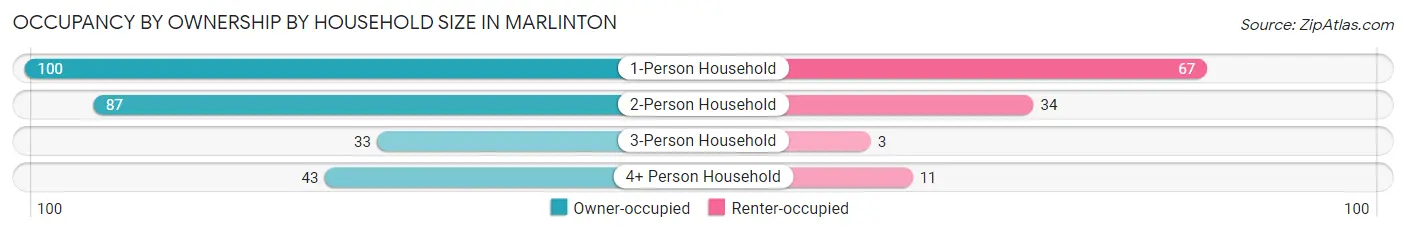
| Household Size | Owner-occupied | Renter-occupied |
| 1-Person Household | 100 (59.9%) | 67 (40.1%) |
| 2-Person Household | 87 (71.9%) | 34 (28.1%) |
| 3-Person Household | 33 (91.7%) | 3 (8.3%) |
| 4+ Person Household | 43 (79.6%) | 11 (20.4%) |
| Total Housing Units | 263 (69.6%) | 115 (30.4%) |
Occupancy by Educational Attainment in Marlinton
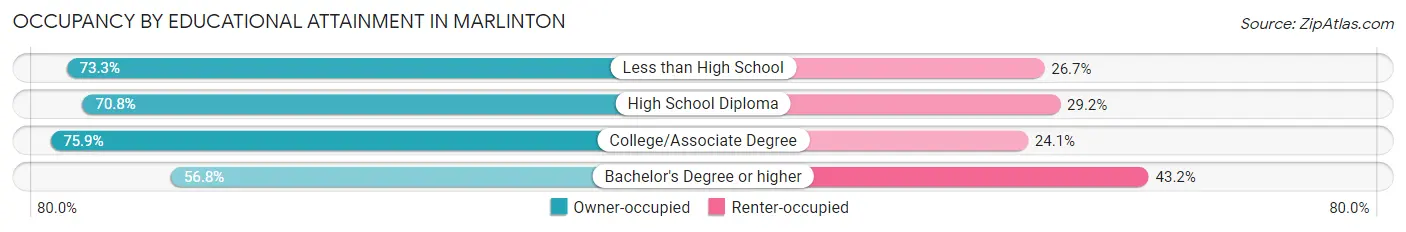
| Household Size | Owner-occupied | Renter-occupied |
| Less than High School | 33 (73.3%) | 12 (26.7%) |
| High School Diploma | 102 (70.8%) | 42 (29.2%) |
| College/Associate Degree | 82 (75.9%) | 26 (24.1%) |
| Bachelor's Degree or higher | 46 (56.8%) | 35 (43.2%) |
Occupancy by Age of Householder in Marlinton
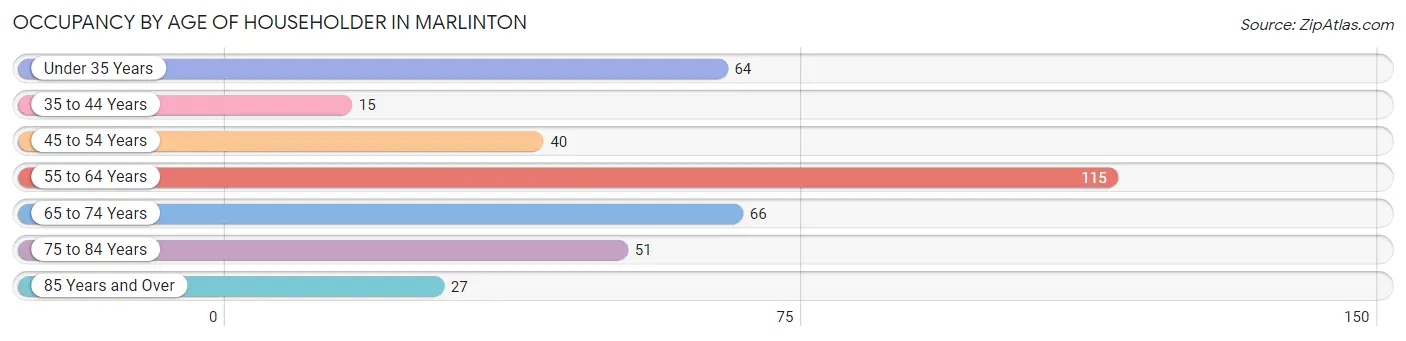
| Age Bracket | # Households | % Households |
| Under 35 Years | 64 | 16.9% |
| 35 to 44 Years | 15 | 4.0% |
| 45 to 54 Years | 40 | 10.6% |
| 55 to 64 Years | 115 | 30.4% |
| 65 to 74 Years | 66 | 17.5% |
| 75 to 84 Years | 51 | 13.5% |
| 85 Years and Over | 27 | 7.1% |
| Total | 378 | 100.0% |
Housing Finances in Marlinton
Median Income by Occupancy in Marlinton
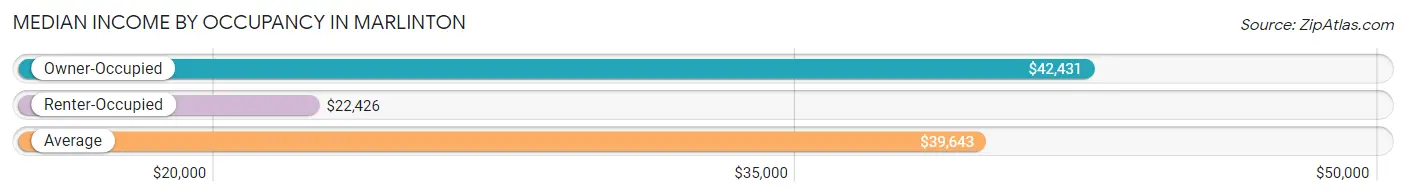
| Occupancy Type | # Households | Median Income |
| Owner-Occupied | 263 (69.6%) | $42,431 |
| Renter-Occupied | 115 (30.4%) | $22,426 |
| Average | 378 (100.0%) | $39,643 |
Occupancy by Householder Income Bracket in Marlinton
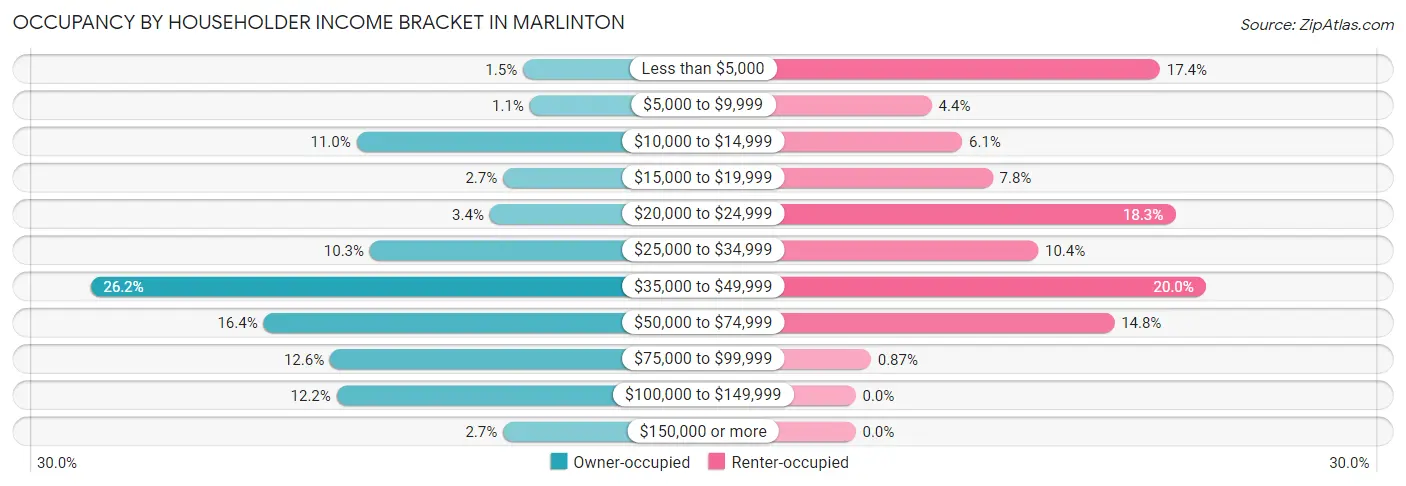
| Income Bracket | Owner-occupied | Renter-occupied |
| Less than $5,000 | 4 (1.5%) | 20 (17.4%) |
| $5,000 to $9,999 | 3 (1.1%) | 5 (4.3%) |
| $10,000 to $14,999 | 29 (11.0%) | 7 (6.1%) |
| $15,000 to $19,999 | 7 (2.7%) | 9 (7.8%) |
| $20,000 to $24,999 | 9 (3.4%) | 21 (18.3%) |
| $25,000 to $34,999 | 27 (10.3%) | 12 (10.4%) |
| $35,000 to $49,999 | 69 (26.2%) | 23 (20.0%) |
| $50,000 to $74,999 | 43 (16.4%) | 17 (14.8%) |
| $75,000 to $99,999 | 33 (12.6%) | 1 (0.9%) |
| $100,000 to $149,999 | 32 (12.2%) | 0 (0.0%) |
| $150,000 or more | 7 (2.7%) | 0 (0.0%) |
| Total | 263 (100.0%) | 115 (100.0%) |
Monthly Housing Cost Tiers in Marlinton
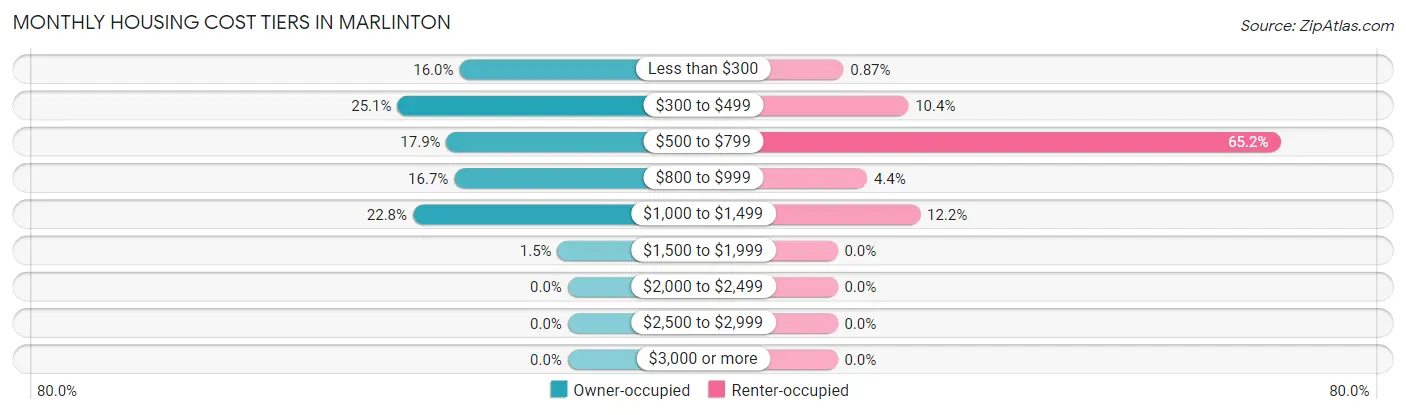
| Monthly Cost | Owner-occupied | Renter-occupied |
| Less than $300 | 42 (16.0%) | 1 (0.9%) |
| $300 to $499 | 66 (25.1%) | 12 (10.4%) |
| $500 to $799 | 47 (17.9%) | 75 (65.2%) |
| $800 to $999 | 44 (16.7%) | 5 (4.3%) |
| $1,000 to $1,499 | 60 (22.8%) | 14 (12.2%) |
| $1,500 to $1,999 | 4 (1.5%) | 0 (0.0%) |
| $2,000 to $2,499 | 0 (0.0%) | 0 (0.0%) |
| $2,500 to $2,999 | 0 (0.0%) | 0 (0.0%) |
| $3,000 or more | 0 (0.0%) | 0 (0.0%) |
| Total | 263 (100.0%) | 115 (100.0%) |
Physical Housing Characteristics in Marlinton
Housing Structures in Marlinton
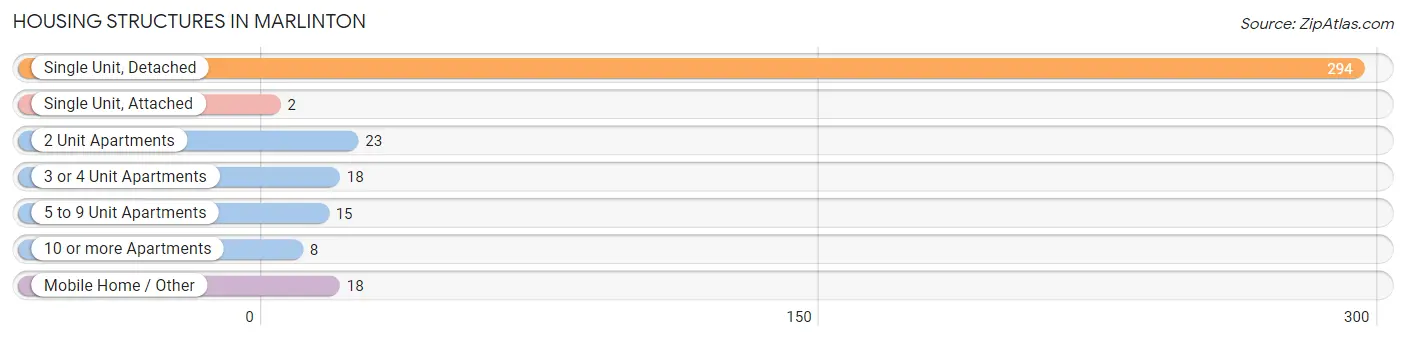
| Structure Type | # Housing Units | % Housing Units |
| Single Unit, Detached | 294 | 77.8% |
| Single Unit, Attached | 2 | 0.5% |
| 2 Unit Apartments | 23 | 6.1% |
| 3 or 4 Unit Apartments | 18 | 4.8% |
| 5 to 9 Unit Apartments | 15 | 4.0% |
| 10 or more Apartments | 8 | 2.1% |
| Mobile Home / Other | 18 | 4.8% |
| Total | 378 | 100.0% |
Housing Structures by Occupancy in Marlinton
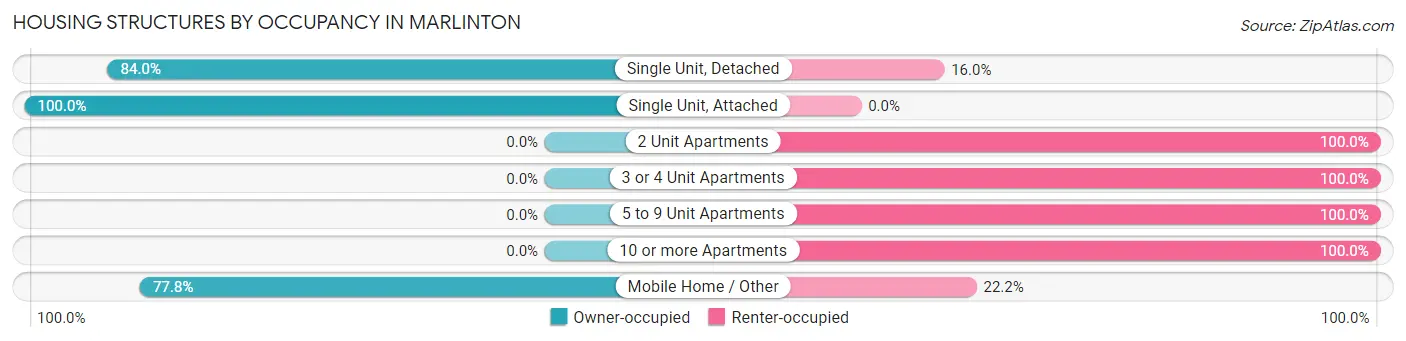
| Structure Type | Owner-occupied | Renter-occupied |
| Single Unit, Detached | 247 (84.0%) | 47 (16.0%) |
| Single Unit, Attached | 2 (100.0%) | 0 (0.0%) |
| 2 Unit Apartments | 0 (0.0%) | 23 (100.0%) |
| 3 or 4 Unit Apartments | 0 (0.0%) | 18 (100.0%) |
| 5 to 9 Unit Apartments | 0 (0.0%) | 15 (100.0%) |
| 10 or more Apartments | 0 (0.0%) | 8 (100.0%) |
| Mobile Home / Other | 14 (77.8%) | 4 (22.2%) |
| Total | 263 (69.6%) | 115 (30.4%) |
Housing Structures by Number of Rooms in Marlinton
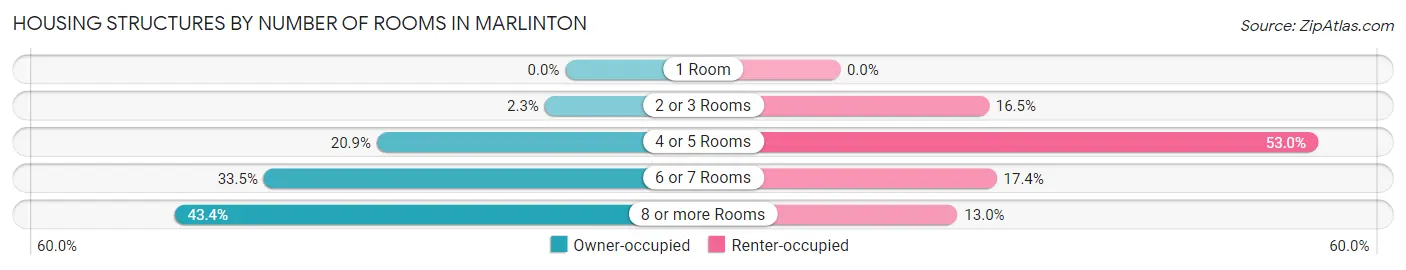
| Number of Rooms | Owner-occupied | Renter-occupied |
| 1 Room | 0 (0.0%) | 0 (0.0%) |
| 2 or 3 Rooms | 6 (2.3%) | 19 (16.5%) |
| 4 or 5 Rooms | 55 (20.9%) | 61 (53.0%) |
| 6 or 7 Rooms | 88 (33.5%) | 20 (17.4%) |
| 8 or more Rooms | 114 (43.3%) | 15 (13.0%) |
| Total | 263 (100.0%) | 115 (100.0%) |
Housing Structure by Heating Type in Marlinton
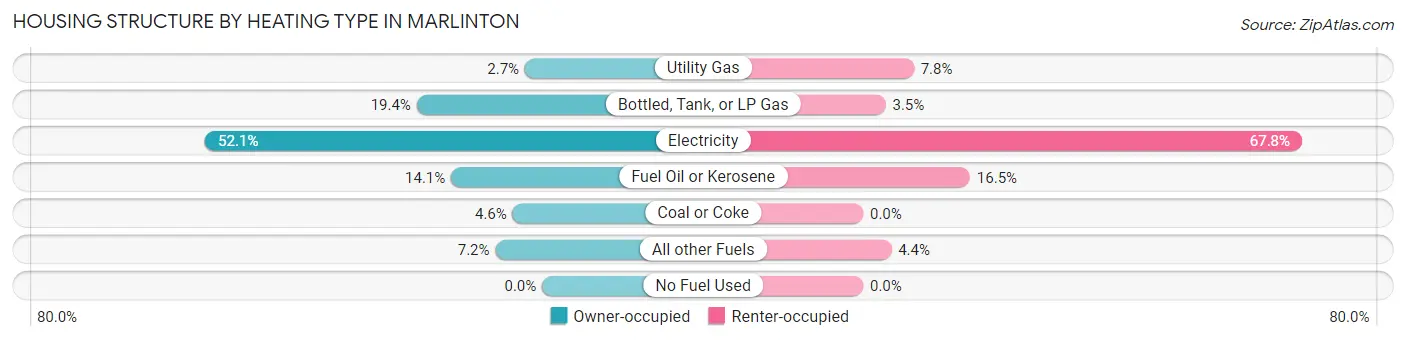
| Heating Type | Owner-occupied | Renter-occupied |
| Utility Gas | 7 (2.7%) | 9 (7.8%) |
| Bottled, Tank, or LP Gas | 51 (19.4%) | 4 (3.5%) |
| Electricity | 137 (52.1%) | 78 (67.8%) |
| Fuel Oil or Kerosene | 37 (14.1%) | 19 (16.5%) |
| Coal or Coke | 12 (4.6%) | 0 (0.0%) |
| All other Fuels | 19 (7.2%) | 5 (4.3%) |
| No Fuel Used | 0 (0.0%) | 0 (0.0%) |
| Total | 263 (100.0%) | 115 (100.0%) |
Household Vehicle Usage in Marlinton
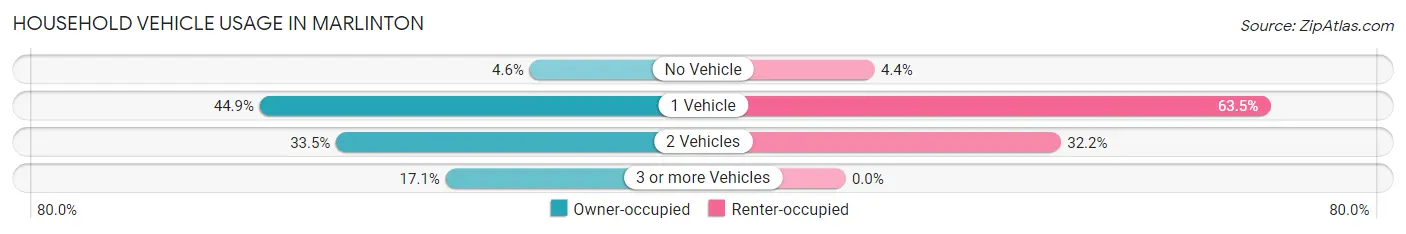
| Vehicles per Household | Owner-occupied | Renter-occupied |
| No Vehicle | 12 (4.6%) | 5 (4.3%) |
| 1 Vehicle | 118 (44.9%) | 73 (63.5%) |
| 2 Vehicles | 88 (33.5%) | 37 (32.2%) |
| 3 or more Vehicles | 45 (17.1%) | 0 (0.0%) |
| Total | 263 (100.0%) | 115 (100.0%) |
Real Estate & Mortgages in Marlinton
Real Estate and Mortgage Overview in Marlinton
| Characteristic | Without Mortgage | With Mortgage |
| Housing Units | 169 | 94 |
| Median Property Value | $71,700 | $86,400 |
| Median Household Income | $39,844 | $7 |
| Monthly Housing Costs | $402 | $0 |
| Real Estate Taxes | $261 | $2 |
Property Value by Mortgage Status in Marlinton
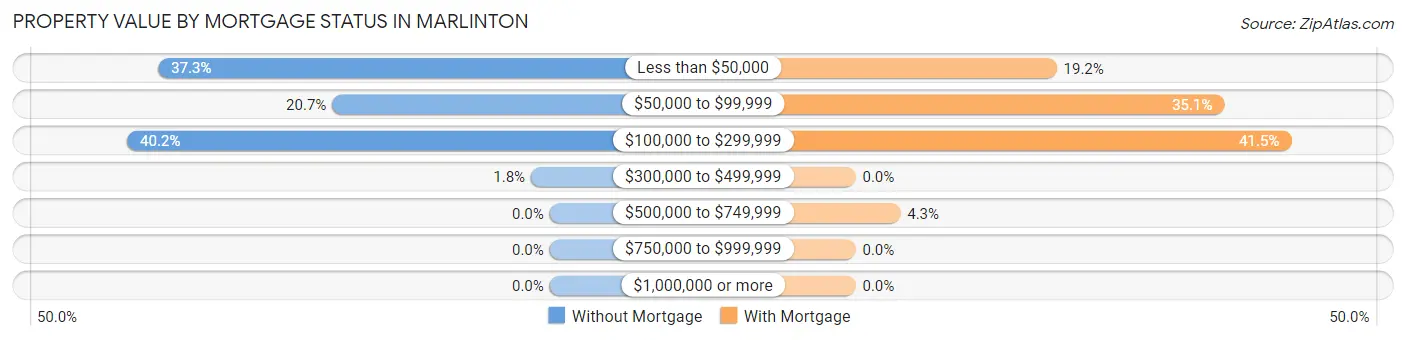
| Property Value | Without Mortgage | With Mortgage |
| Less than $50,000 | 63 (37.3%) | 18 (19.2%) |
| $50,000 to $99,999 | 35 (20.7%) | 33 (35.1%) |
| $100,000 to $299,999 | 68 (40.2%) | 39 (41.5%) |
| $300,000 to $499,999 | 3 (1.8%) | 0 (0.0%) |
| $500,000 to $749,999 | 0 (0.0%) | 4 (4.3%) |
| $750,000 to $999,999 | 0 (0.0%) | 0 (0.0%) |
| $1,000,000 or more | 0 (0.0%) | 0 (0.0%) |
| Total | 169 (100.0%) | 94 (100.0%) |
Household Income by Mortgage Status in Marlinton
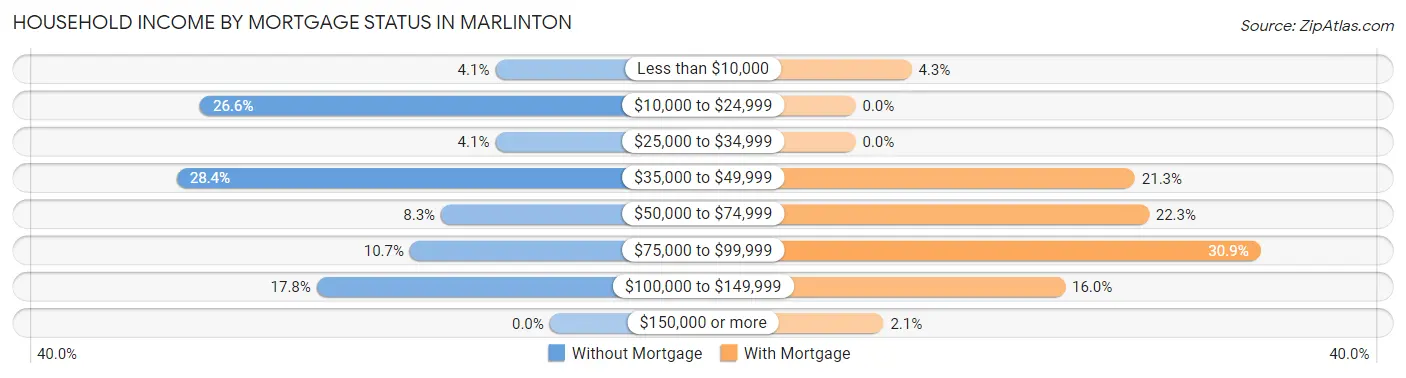
| Household Income | Without Mortgage | With Mortgage |
| Less than $10,000 | 7 (4.1%) | 4 (4.3%) |
| $10,000 to $24,999 | 45 (26.6%) | 0 (0.0%) |
| $25,000 to $34,999 | 7 (4.1%) | 0 (0.0%) |
| $35,000 to $49,999 | 48 (28.4%) | 20 (21.3%) |
| $50,000 to $74,999 | 14 (8.3%) | 21 (22.3%) |
| $75,000 to $99,999 | 18 (10.6%) | 29 (30.8%) |
| $100,000 to $149,999 | 30 (17.7%) | 15 (16.0%) |
| $150,000 or more | 0 (0.0%) | 2 (2.1%) |
| Total | 169 (100.0%) | 94 (100.0%) |
Property Value to Household Income Ratio in Marlinton
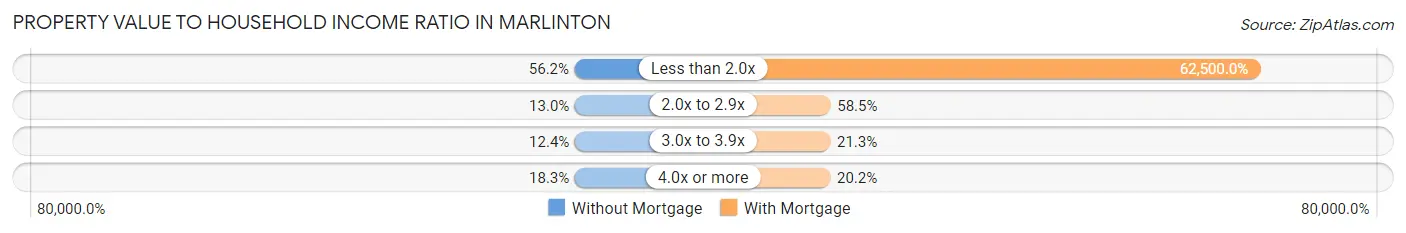
| Value-to-Income Ratio | Without Mortgage | With Mortgage |
| Less than 2.0x | 95 (56.2%) | 58,750 (62,500.0%) |
| 2.0x to 2.9x | 22 (13.0%) | 55 (58.5%) |
| 3.0x to 3.9x | 21 (12.4%) | 20 (21.3%) |
| 4.0x or more | 31 (18.3%) | 19 (20.2%) |
| Total | 169 (100.0%) | 94 (100.0%) |
Real Estate Taxes by Mortgage Status in Marlinton
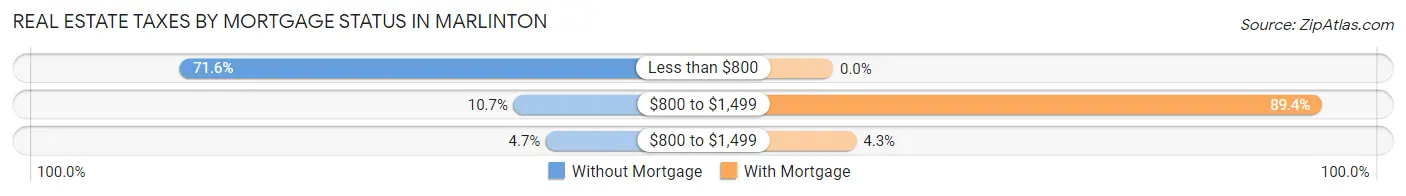
| Property Taxes | Without Mortgage | With Mortgage |
| Less than $800 | 121 (71.6%) | 0 (0.0%) |
| $800 to $1,499 | 18 (10.6%) | 84 (89.4%) |
| $800 to $1,499 | 8 (4.7%) | 4 (4.3%) |
| Total | 169 (100.0%) | 94 (100.0%) |
Health & Disability in Marlinton
Health Insurance Coverage by Age in Marlinton
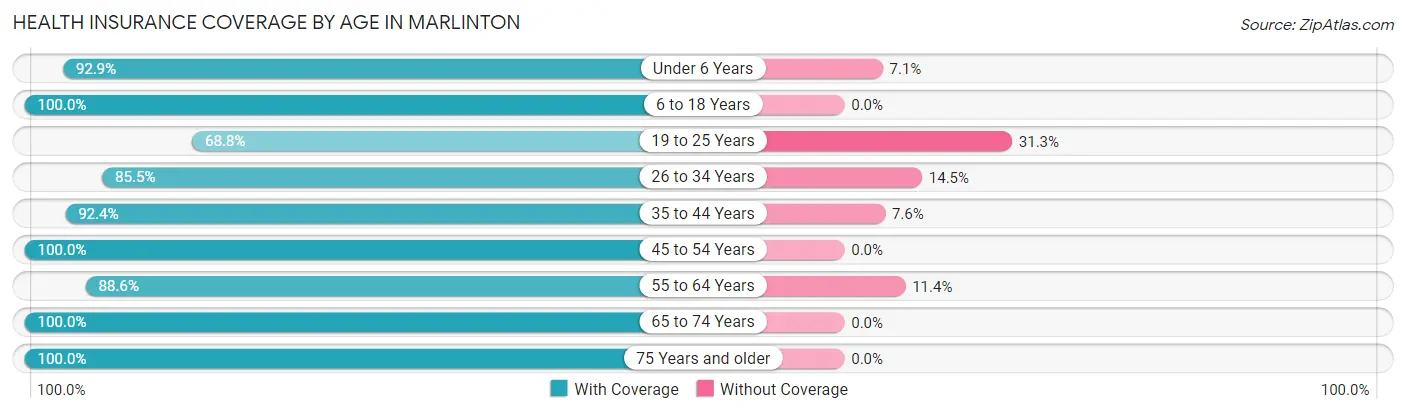
| Age Bracket | With Coverage | Without Coverage |
| Under 6 Years | 39 (92.9%) | 3 (7.1%) |
| 6 to 18 Years | 244 (100.0%) | 0 (0.0%) |
| 19 to 25 Years | 88 (68.8%) | 40 (31.2%) |
| 26 to 34 Years | 65 (85.5%) | 11 (14.5%) |
| 35 to 44 Years | 61 (92.4%) | 5 (7.6%) |
| 45 to 54 Years | 108 (100.0%) | 0 (0.0%) |
| 55 to 64 Years | 156 (88.6%) | 20 (11.4%) |
| 65 to 74 Years | 118 (100.0%) | 0 (0.0%) |
| 75 Years and older | 106 (100.0%) | 0 (0.0%) |
| Total | 985 (92.6%) | 79 (7.4%) |
Health Insurance Coverage by Citizenship Status in Marlinton
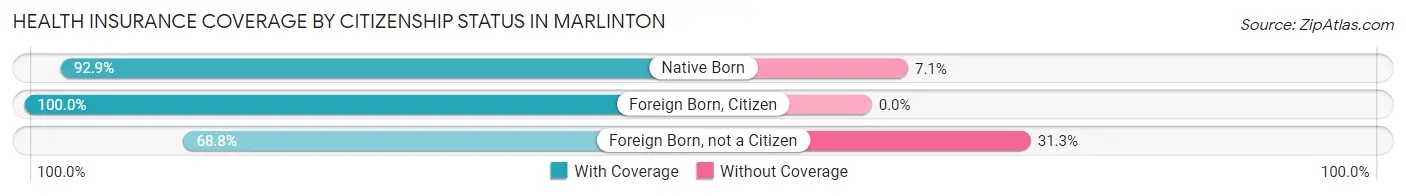
| Citizenship Status | With Coverage | Without Coverage |
| Native Born | 39 (92.9%) | 3 (7.1%) |
| Foreign Born, Citizen | 244 (100.0%) | 0 (0.0%) |
| Foreign Born, not a Citizen | 88 (68.8%) | 40 (31.2%) |
Health Insurance Coverage by Household Income in Marlinton
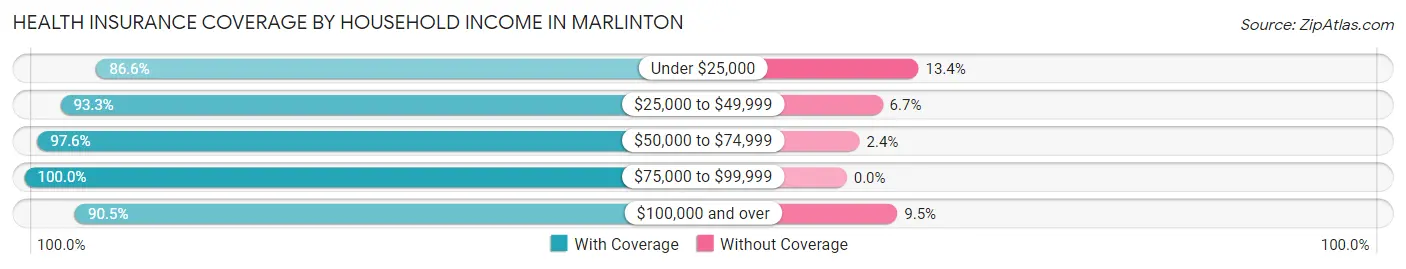
| Household Income | With Coverage | Without Coverage |
| Under $25,000 | 161 (86.6%) | 25 (13.4%) |
| $25,000 to $49,999 | 347 (93.3%) | 25 (6.7%) |
| $50,000 to $74,999 | 163 (97.6%) | 4 (2.4%) |
| $75,000 to $99,999 | 75 (100.0%) | 0 (0.0%) |
| $100,000 and over | 239 (90.5%) | 25 (9.5%) |
Public vs Private Health Insurance Coverage by Age in Marlinton
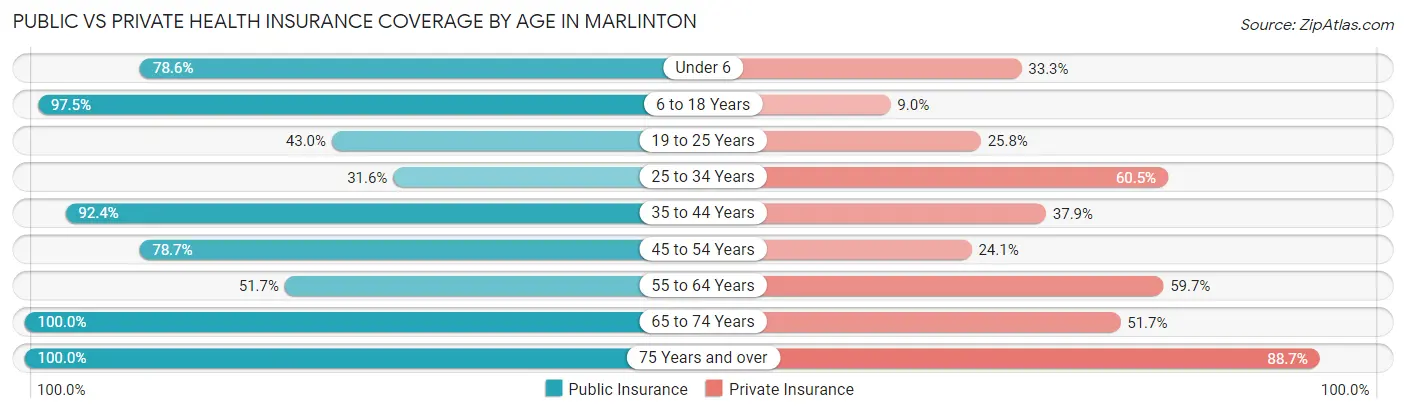
| Age Bracket | Public Insurance | Private Insurance |
| Under 6 | 33 (78.6%) | 14 (33.3%) |
| 6 to 18 Years | 238 (97.5%) | 22 (9.0%) |
| 19 to 25 Years | 55 (43.0%) | 33 (25.8%) |
| 25 to 34 Years | 24 (31.6%) | 46 (60.5%) |
| 35 to 44 Years | 61 (92.4%) | 25 (37.9%) |
| 45 to 54 Years | 85 (78.7%) | 26 (24.1%) |
| 55 to 64 Years | 91 (51.7%) | 105 (59.7%) |
| 65 to 74 Years | 118 (100.0%) | 61 (51.7%) |
| 75 Years and over | 106 (100.0%) | 94 (88.7%) |
| Total | 811 (76.2%) | 426 (40.0%) |
Disability Status by Sex by Age in Marlinton
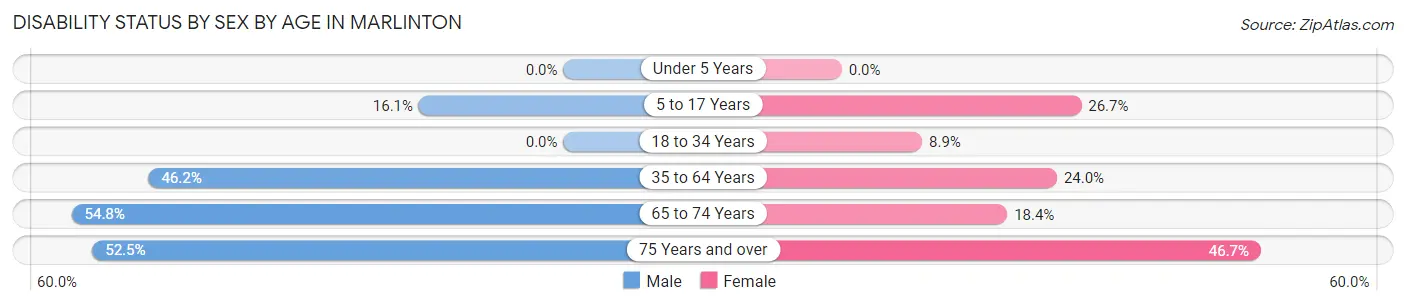
| Age Bracket | Male | Female |
| Under 5 Years | 0 (0.0%) | 0 (0.0%) |
| 5 to 17 Years | 14 (16.1%) | 36 (26.7%) |
| 18 to 34 Years | 0 (0.0%) | 11 (8.9%) |
| 35 to 64 Years | 73 (46.2%) | 46 (24.0%) |
| 65 to 74 Years | 23 (54.8%) | 14 (18.4%) |
| 75 Years and over | 32 (52.5%) | 21 (46.7%) |
Disability Class by Sex by Age in Marlinton
Disability Class: Hearing Difficulty
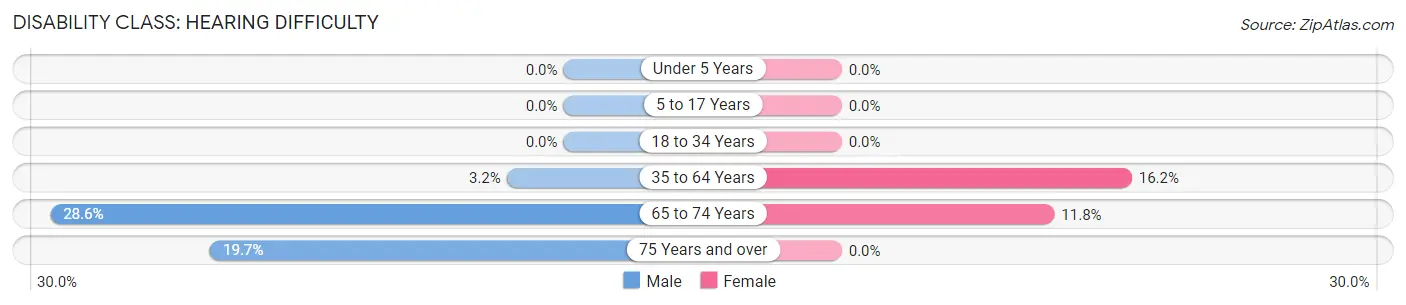
| Age Bracket | Male | Female |
| Under 5 Years | 0 (0.0%) | 0 (0.0%) |
| 5 to 17 Years | 0 (0.0%) | 0 (0.0%) |
| 18 to 34 Years | 0 (0.0%) | 0 (0.0%) |
| 35 to 64 Years | 5 (3.2%) | 31 (16.2%) |
| 65 to 74 Years | 12 (28.6%) | 9 (11.8%) |
| 75 Years and over | 12 (19.7%) | 0 (0.0%) |
Disability Class: Vision Difficulty
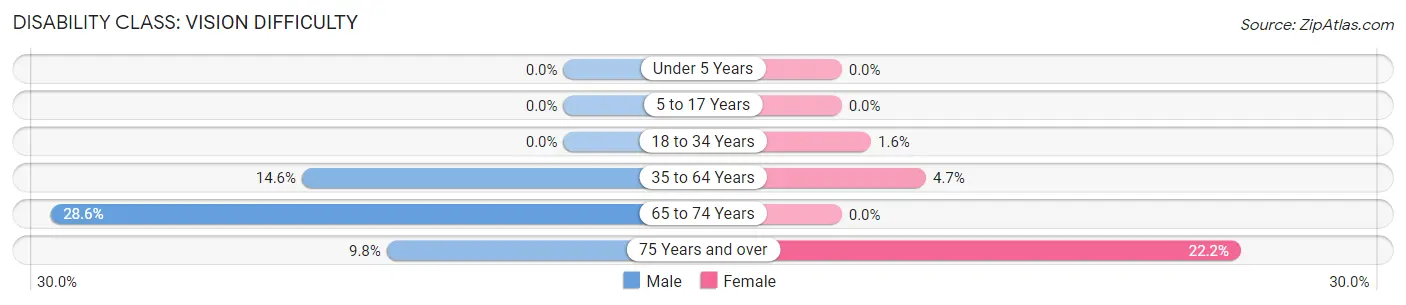
| Age Bracket | Male | Female |
| Under 5 Years | 0 (0.0%) | 0 (0.0%) |
| 5 to 17 Years | 0 (0.0%) | 0 (0.0%) |
| 18 to 34 Years | 0 (0.0%) | 2 (1.6%) |
| 35 to 64 Years | 23 (14.6%) | 9 (4.7%) |
| 65 to 74 Years | 12 (28.6%) | 0 (0.0%) |
| 75 Years and over | 6 (9.8%) | 10 (22.2%) |
Disability Class: Cognitive Difficulty
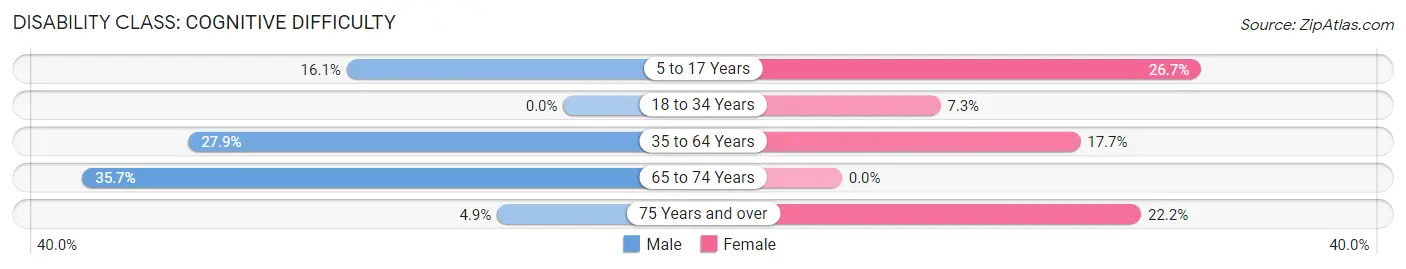
| Age Bracket | Male | Female |
| 5 to 17 Years | 14 (16.1%) | 36 (26.7%) |
| 18 to 34 Years | 0 (0.0%) | 9 (7.3%) |
| 35 to 64 Years | 44 (27.9%) | 34 (17.7%) |
| 65 to 74 Years | 15 (35.7%) | 0 (0.0%) |
| 75 Years and over | 3 (4.9%) | 10 (22.2%) |
Disability Class: Ambulatory Difficulty
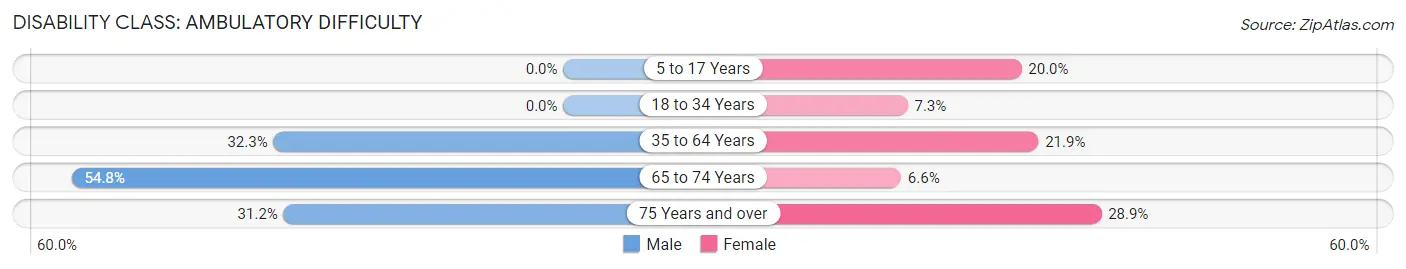
| Age Bracket | Male | Female |
| 5 to 17 Years | 0 (0.0%) | 27 (20.0%) |
| 18 to 34 Years | 0 (0.0%) | 9 (7.3%) |
| 35 to 64 Years | 51 (32.3%) | 42 (21.9%) |
| 65 to 74 Years | 23 (54.8%) | 5 (6.6%) |
| 75 Years and over | 19 (31.1%) | 13 (28.9%) |
Disability Class: Self-Care Difficulty
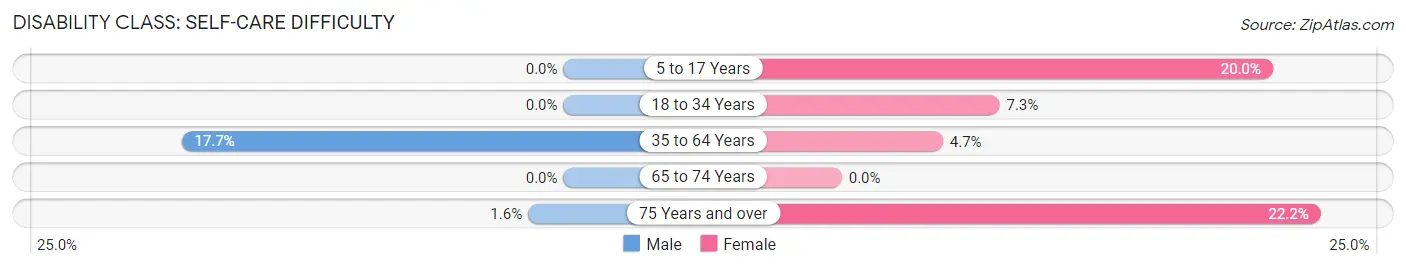
| Age Bracket | Male | Female |
| 5 to 17 Years | 0 (0.0%) | 27 (20.0%) |
| 18 to 34 Years | 0 (0.0%) | 9 (7.3%) |
| 35 to 64 Years | 28 (17.7%) | 9 (4.7%) |
| 65 to 74 Years | 0 (0.0%) | 0 (0.0%) |
| 75 Years and over | 1 (1.6%) | 10 (22.2%) |
Technology Access in Marlinton
Computing Device Access in Marlinton
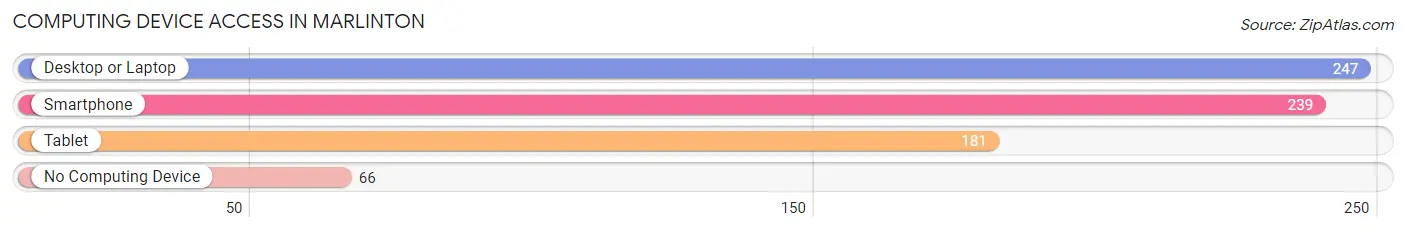
| Device Type | # Households | % Households |
| Desktop or Laptop | 247 | 65.3% |
| Smartphone | 239 | 63.2% |
| Tablet | 181 | 47.9% |
| No Computing Device | 66 | 17.5% |
| Total | 378 | 100.0% |
Internet Access in Marlinton
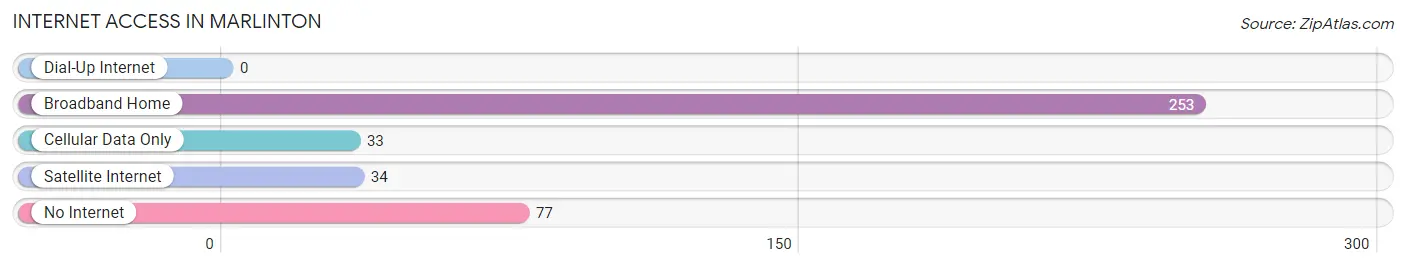
| Internet Type | # Households | % Households |
| Dial-Up Internet | 0 | 0.0% |
| Broadband Home | 253 | 66.9% |
| Cellular Data Only | 33 | 8.7% |
| Satellite Internet | 34 | 9.0% |
| No Internet | 77 | 20.4% |
| Total | 378 | 100.0% |
Marlinton Summary
Marlinton is a town located in Pocahontas County, West Virginia, United States. The population was 1,054 at the 2010 census. It is the county seat of Pocahontas County. Marlinton is located in the Allegheny Mountains of West Virginia, along the Greenbrier River.
History
Marlinton was founded in 1818 by William P. McNeel, who named the town after his father-in-law, Marlin McNeel. The town was incorporated in 1832. Marlinton was the site of the first court house in Pocahontas County, which was built in 1821. The town was also the site of the first post office in the county, which was established in 1822.
Marlinton was an important stop on the Staunton-Parkersburg Turnpike, which was the first major road to cross the Allegheny Mountains. The turnpike was completed in 1838 and connected the Shenandoah Valley to the Ohio River Valley. The turnpike was an important route for settlers and travelers heading west.
Marlinton was also an important stop on the Chesapeake and Ohio Railway, which was completed in 1873. The railroad connected the town to the rest of the country and helped to spur economic growth in the area.
Geography
Marlinton is located at 38°14'25" North, 80°14'17" West (38.240278, -80.237917). According to the United States Census Bureau, the town has a total area of 0.7 square miles (1.8 km2), all of it land.
The town is located in the Allegheny Mountains of West Virginia, along the Greenbrier River. The town is surrounded by the Monongahela National Forest.
Economy
Marlinton is the county seat of Pocahontas County and is the center of government and commerce for the county. The town is home to several businesses, including a bank, a grocery store, a hardware store, a pharmacy, and several restaurants.
The town is also home to the Pocahontas County Historical Society and Museum, which is located in the old courthouse. The museum houses artifacts and documents related to the history of the county.
The town is also home to the Pocahontas County Arts Council, which promotes the arts in the county. The council hosts several events throughout the year, including the annual Marlinton Arts Festival.
Demographics
As of the census of 2010, there were 1,054 people, 441 households, and 270 families residing in the town. The population density was 1,521.4 people per square mile (586.3/km2). There were 498 housing units at an average density of 714.3 per square mile (275.7/km2). The racial makeup of the town was 97.2% White, 0.2% African American, 0.2% Native American, 0.2% Asian, 0.2% from other races, and 1.9% from two or more races. Hispanic or Latino of any race were 0.7% of the population.
There were 441 households, out of which 28.2% had children under the age of 18 living with them, 44.2% were married couples living together, 13.2% had a female householder with no husband present, and 37.3% were non-families. 32.2% of all households were made up of individuals, and 14.3% had someone living alone who was 65 years of age or older. The average household size was 2.30 and the average family size was 2.88.
In the town, the population was spread out, with 23.2% under the age of 18, 8.2% from 18 to 24, 25.2% from 25 to 44, 25.2% from 45 to 64, and 18.2% who were 65 years of age or older. The median age was 40 years. For every 100 females, there were 87.2 males. For every 100 females age 18 and over, there were 83.2 males.
The median income for a household in the town was $25,000, and the median income for a family was $30,000. Males had a median income of $25,000 versus $20,000 for females. The per capita income for the town was $14,000. About 17.2% of families and 20.2% of the population were below the poverty line, including 28.2% of those under age 18 and 16.2% of those age 65 or over.
Common Questions
What is Per Capita Income in Marlinton?
Per Capita income in Marlinton is $21,156.
What is the Median Family Income in Marlinton?
Median Family Income in Marlinton is $56,250.
What is the Median Household income in Marlinton?
Median Household Income in Marlinton is $39,643.
What is Income or Wage Gap in Marlinton?
Income or Wage Gap in Marlinton is 34.1%.
Women in Marlinton earn 65.9 cents for every dollar earned by a man.
What is Inequality or Gini Index in Marlinton?
Inequality or Gini Index in Marlinton is 0.41.
What is the Total Population of Marlinton?
Total Population of Marlinton is 1,139.
What is the Total Male Population of Marlinton?
Total Male Population of Marlinton is 522.
What is the Total Female Population of Marlinton?
Total Female Population of Marlinton is 617.
What is the Ratio of Males per 100 Females in Marlinton?
There are 84.60 Males per 100 Females in Marlinton.
What is the Ratio of Females per 100 Males in Marlinton?
There are 118.20 Females per 100 Males in Marlinton.
What is the Median Population Age in Marlinton?
Median Population Age in Marlinton is 47.2 Years.
What is the Average Family Size in Marlinton
Average Family Size in Marlinton is 4.3 People.
What is the Average Household Size in Marlinton
Average Household Size in Marlinton is 2.8 People.
How Large is the Labor Force in Marlinton?
There are 409 People in the Labor Forcein in Marlinton.
What is the Percentage of People in the Labor Force in Marlinton?
42.3% of People are in the Labor Force in Marlinton.
What is the Unemployment Rate in Marlinton?
Unemployment Rate in Marlinton is 11.2%.