Lumberport, WV Map & Demographics
Lumberport Map
Lumberport Overview
$36,983
PER CAPITA INCOME
$71,000
AVG FAMILY INCOME
$53,594
AVG HOUSEHOLD INCOME
54.2%
WAGE / INCOME GAP [ % ]
45.8¢/ $1
WAGE / INCOME GAP [ $ ]
0.42
INEQUALITY / GINI INDEX
783
TOTAL POPULATION
536
MALE POPULATION
247
FEMALE POPULATION
217.00
MALES / 100 FEMALES
46.08
FEMALES / 100 MALES
51.1
MEDIAN AGE
5.2
AVG FAMILY SIZE
4.0
AVG HOUSEHOLD SIZE
470
LABOR FORCE [ PEOPLE ]
65.8%
PERCENT IN LABOR FORCE
Lumberport Zip Codes
Lumberport Area Codes
Income in Lumberport
Income Overview in Lumberport
Per Capita Income in Lumberport is $36,983, while median incomes of families and households are $71,000 and $53,594 respectively.
| Characteristic | Number | Measure |
| Per Capita Income | 783 | $36,983 |
| Median Family Income | 128 | $71,000 |
| Mean Family Income | 128 | $80,277 |
| Median Household Income | 195 | $53,594 |
| Mean Household Income | 195 | $64,629 |
| Income Deficit | 128 | $0 |
| Wage / Income Gap (%) | 783 | 54.15% |
| Wage / Income Gap ($) | 783 | 45.85¢ per $1 |
| Gini / Inequality Index | 783 | 0.42 |
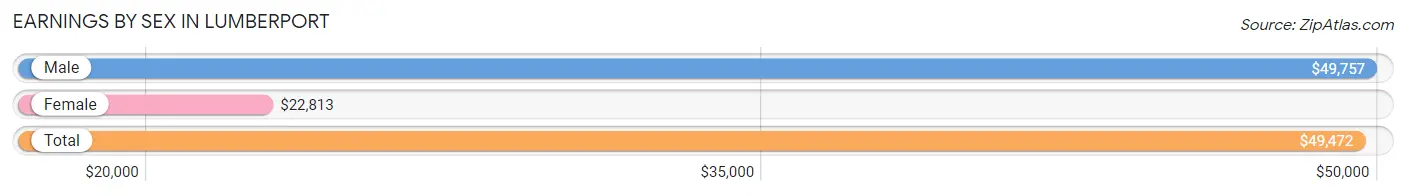
Earnings by Sex in Lumberport
Average Earnings in Lumberport are $49,472, $49,757 for men and $22,813 for women, a difference of 54.1%.
| Sex | Number | Average Earnings |
| Male | 419 (89.1%) | $49,757 |
| Female | 51 (10.8%) | $22,813 |
| Total | 470 (100.0%) | $49,472 |
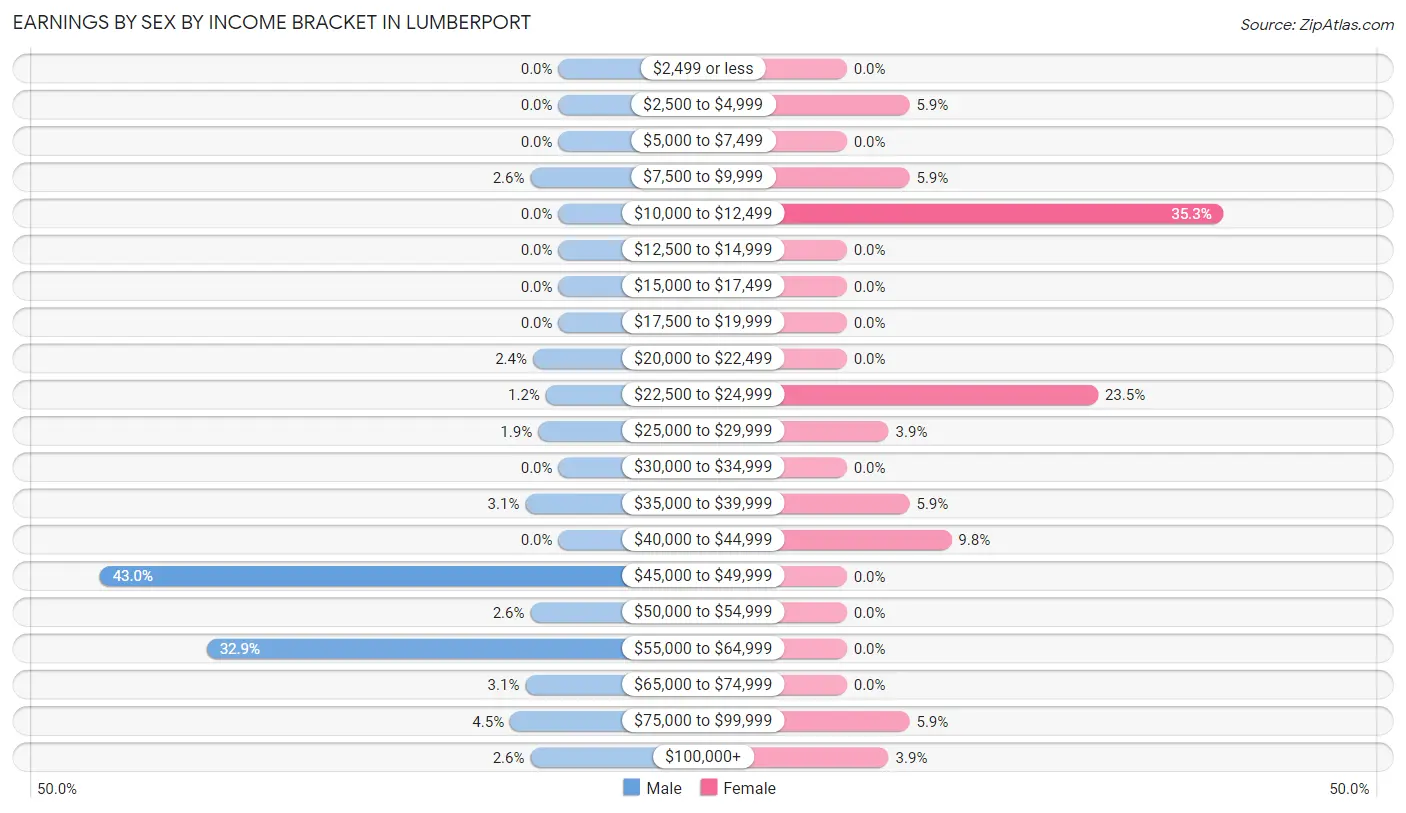
Earnings by Sex by Income Bracket in Lumberport
The most common earnings brackets in Lumberport are $45,000 to $49,999 for men (180 | 43.0%) and $10,000 to $12,499 for women (18 | 35.3%).
| Income | Male | Female |
| $2,499 or less | 0 (0.0%) | 0 (0.0%) |
| $2,500 to $4,999 | 0 (0.0%) | 3 (5.9%) |
| $5,000 to $7,499 | 0 (0.0%) | 0 (0.0%) |
| $7,500 to $9,999 | 11 (2.6%) | 3 (5.9%) |
| $10,000 to $12,499 | 0 (0.0%) | 18 (35.3%) |
| $12,500 to $14,999 | 0 (0.0%) | 0 (0.0%) |
| $15,000 to $17,499 | 0 (0.0%) | 0 (0.0%) |
| $17,500 to $19,999 | 0 (0.0%) | 0 (0.0%) |
| $20,000 to $22,499 | 10 (2.4%) | 0 (0.0%) |
| $22,500 to $24,999 | 5 (1.2%) | 12 (23.5%) |
| $25,000 to $29,999 | 8 (1.9%) | 2 (3.9%) |
| $30,000 to $34,999 | 0 (0.0%) | 0 (0.0%) |
| $35,000 to $39,999 | 13 (3.1%) | 3 (5.9%) |
| $40,000 to $44,999 | 0 (0.0%) | 5 (9.8%) |
| $45,000 to $49,999 | 180 (43.0%) | 0 (0.0%) |
| $50,000 to $54,999 | 11 (2.6%) | 0 (0.0%) |
| $55,000 to $64,999 | 138 (32.9%) | 0 (0.0%) |
| $65,000 to $74,999 | 13 (3.1%) | 0 (0.0%) |
| $75,000 to $99,999 | 19 (4.5%) | 3 (5.9%) |
| $100,000+ | 11 (2.6%) | 2 (3.9%) |
| Total | 419 (100.0%) | 51 (100.0%) |
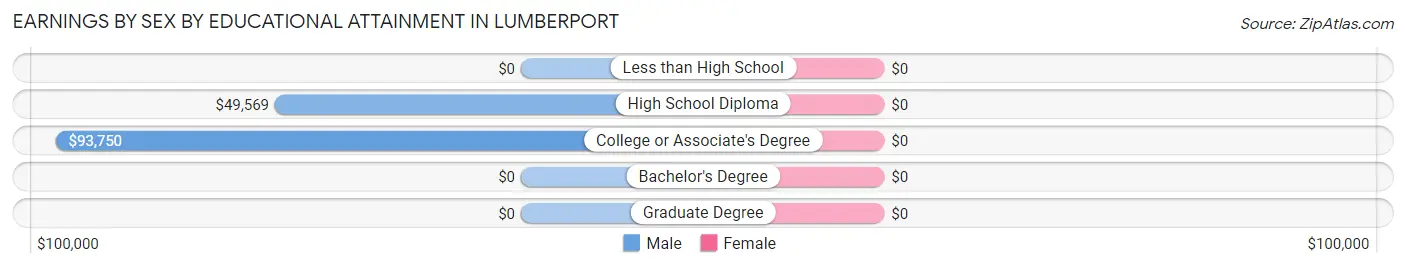
Earnings by Sex by Educational Attainment in Lumberport
| Educational Attainment | Male Income | Female Income |
| Less than High School | - | - |
| High School Diploma | $49,569 | $0 |
| College or Associate's Degree | $93,750 | $0 |
| Bachelor's Degree | - | - |
| Graduate Degree | - | - |
| Total | $49,799 | $23,958 |
Family Income in Lumberport
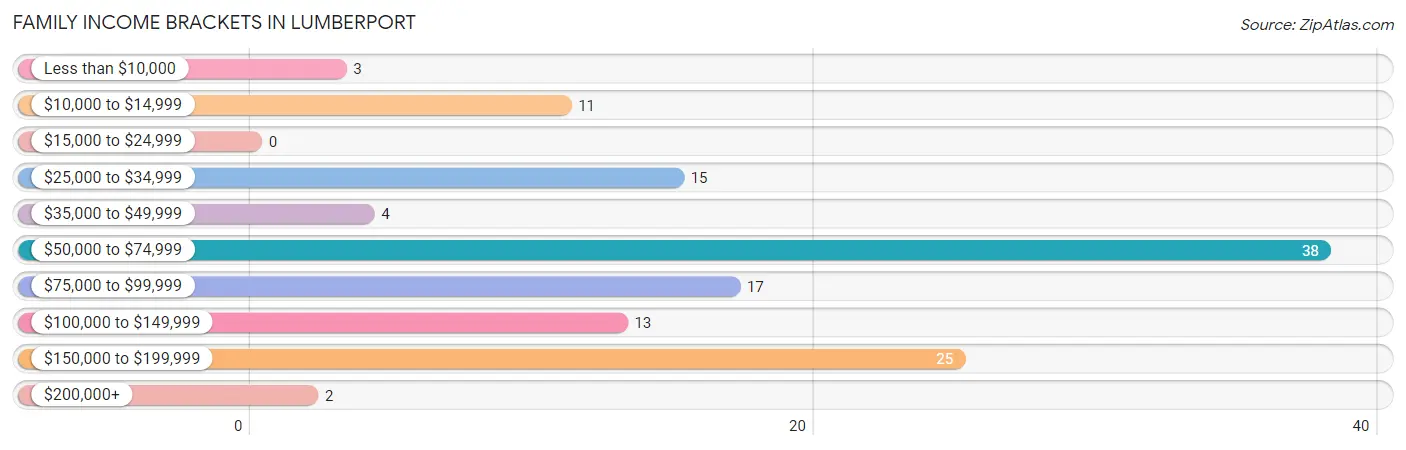
Family Income Brackets in Lumberport
According to the Lumberport family income data, there are 38 families falling into the $50,000 to $74,999 income range, which is the most common income bracket and makes up 29.7% of all families.
| Income Bracket | # Families | % Families |
| Less than $10,000 | 3 | 2.3% |
| $10,000 to $14,999 | 11 | 8.6% |
| $15,000 to $24,999 | 0 | 0.0% |
| $25,000 to $34,999 | 15 | 11.7% |
| $35,000 to $49,999 | 4 | 3.1% |
| $50,000 to $74,999 | 38 | 29.7% |
| $75,000 to $99,999 | 17 | 13.3% |
| $100,000 to $149,999 | 13 | 10.2% |
| $150,000 to $199,999 | 25 | 19.5% |
| $200,000+ | 2 | 1.6% |
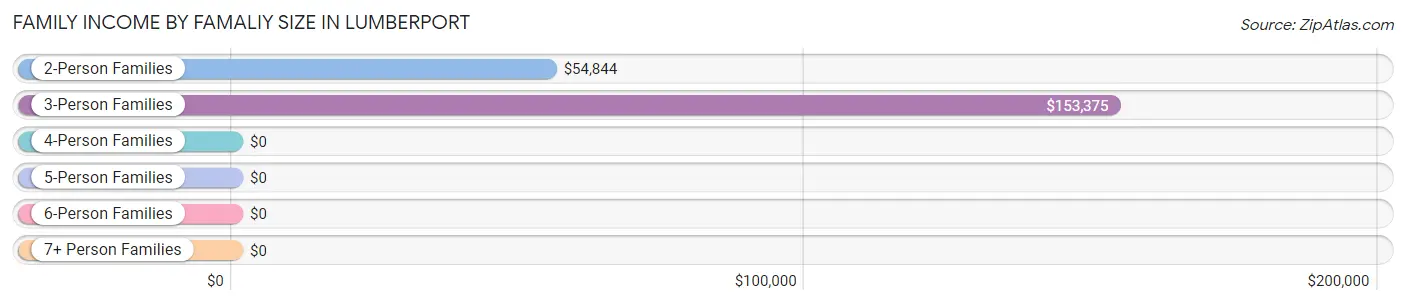
Family Income by Famaliy Size in Lumberport
3-person families (36 | 28.1%) account for the highest median family income in Lumberport with $153,375 per family, while 3-person families (36 | 28.1%) have the highest median income of $51,125 per family member.
| Income Bracket | # Families | Median Income |
| 2-Person Families | 77 (60.2%) | $54,844 |
| 3-Person Families | 36 (28.1%) | $153,375 |
| 4-Person Families | 2 (1.6%) | $0 |
| 5-Person Families | 0 (0.0%) | $0 |
| 6-Person Families | 13 (10.2%) | $0 |
| 7+ Person Families | 0 (0.0%) | $0 |
| Total | 128 (100.0%) | $71,000 |
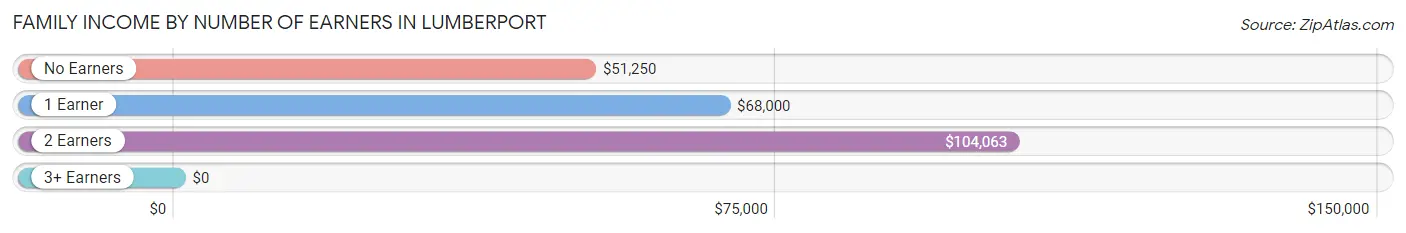
Family Income by Number of Earners in Lumberport
| Number of Earners | # Families | Median Income |
| No Earners | 44 (34.4%) | $51,250 |
| 1 Earner | 24 (18.8%) | $68,000 |
| 2 Earners | 58 (45.3%) | $104,063 |
| 3+ Earners | 2 (1.6%) | $0 |
| Total | 128 (100.0%) | $71,000 |
Household Income in Lumberport
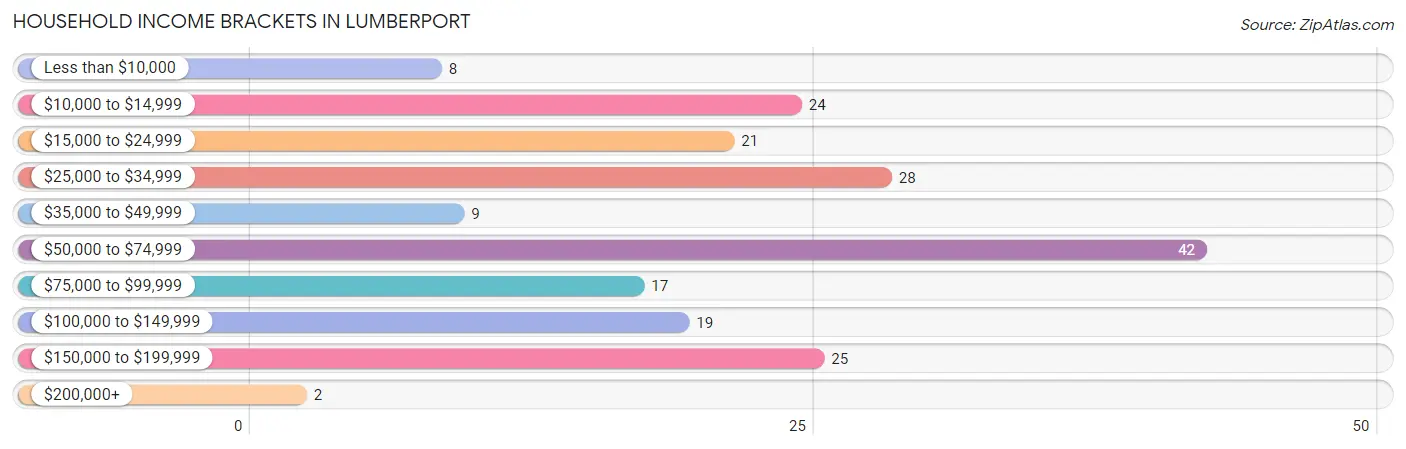
Household Income Brackets in Lumberport
With 42 households falling in the category, the $50,000 to $74,999 income range is the most frequent in Lumberport, accounting for 21.5% of all households. In contrast, only 2 households (1.0%) fall into the $200,000+ income bracket, making it the least populous group.
| Income Bracket | # Households | % Households |
| Less than $10,000 | 8 | 4.1% |
| $10,000 to $14,999 | 24 | 12.3% |
| $15,000 to $24,999 | 21 | 10.8% |
| $25,000 to $34,999 | 28 | 14.4% |
| $35,000 to $49,999 | 9 | 4.6% |
| $50,000 to $74,999 | 42 | 21.5% |
| $75,000 to $99,999 | 17 | 8.7% |
| $100,000 to $149,999 | 19 | 9.7% |
| $150,000 to $199,999 | 25 | 12.8% |
| $200,000+ | 2 | 1.0% |
Household Income by Householder Age in Lumberport
The median household income in Lumberport is $53,594, with the highest median household income of $73,125 found in the 25 to 44 years age bracket for the primary householder. A total of 32 households (16.4%) fall into this category. Meanwhile, the 15 to 24 years age bracket for the primary householder has the lowest median household income of $0, with 12 households (6.1%) in this group.
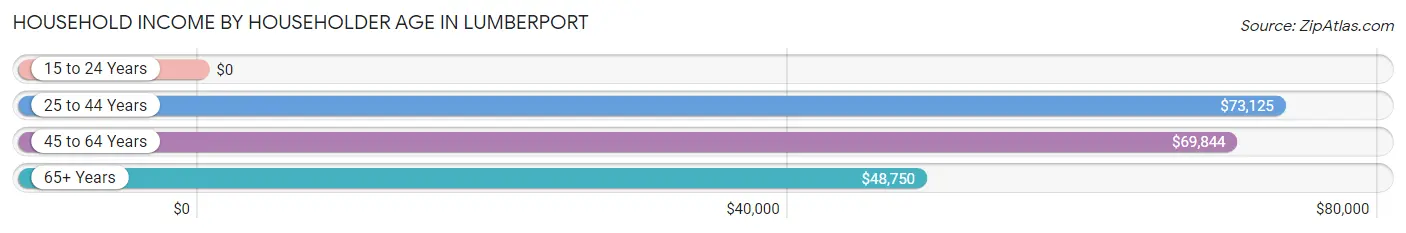
| Income Bracket | # Households | Median Income |
| 15 to 24 Years | 12 (6.1%) | $0 |
| 25 to 44 Years | 32 (16.4%) | $73,125 |
| 45 to 64 Years | 45 (23.1%) | $69,844 |
| 65+ Years | 106 (54.4%) | $48,750 |
| Total | 195 (100.0%) | $53,594 |
Poverty in Lumberport
Income Below Poverty by Sex and Age in Lumberport
With 9.2% poverty level for males and 14.4% for females among the residents of Lumberport, 25 to 34 year old males and 16 and 17 year old females are the most vulnerable to poverty, with 18 males (34.6%) and 2 females (100.0%) in their respective age groups living below the poverty level.
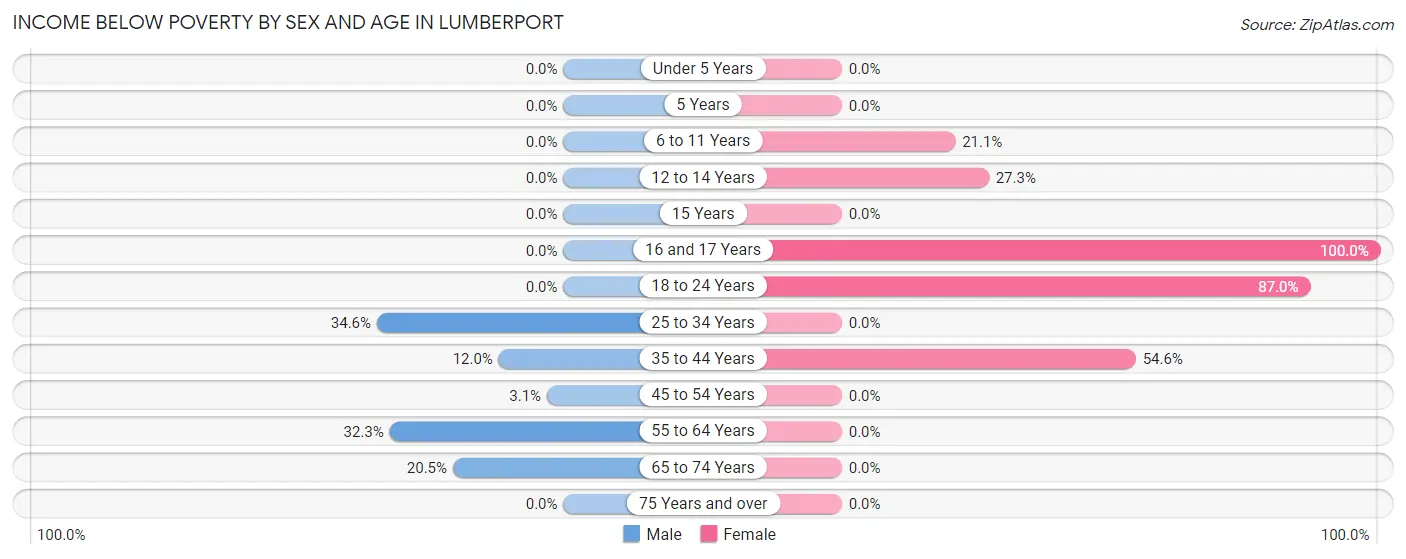
| Age Bracket | Male | Female |
| Under 5 Years | 0 (0.0%) | 0 (0.0%) |
| 5 Years | 0 (0.0%) | 0 (0.0%) |
| 6 to 11 Years | 0 (0.0%) | 4 (21.0%) |
| 12 to 14 Years | 0 (0.0%) | 3 (27.3%) |
| 15 Years | 0 (0.0%) | 0 (0.0%) |
| 16 and 17 Years | 0 (0.0%) | 2 (100.0%) |
| 18 to 24 Years | 0 (0.0%) | 20 (87.0%) |
| 25 to 34 Years | 18 (34.6%) | 0 (0.0%) |
| 35 to 44 Years | 3 (12.0%) | 6 (54.5%) |
| 45 to 54 Years | 10 (3.0%) | 0 (0.0%) |
| 55 to 64 Years | 10 (32.3%) | 0 (0.0%) |
| 65 to 74 Years | 8 (20.5%) | 0 (0.0%) |
| 75 Years and over | 0 (0.0%) | 0 (0.0%) |
| Total | 49 (9.2%) | 35 (14.4%) |
Income Above Poverty by Sex and Age in Lumberport
According to the poverty statistics in Lumberport, males aged 6 to 11 years and females aged under 5 years are the age groups that are most secure financially, with 100.0% of males and 100.0% of females in these age groups living above the poverty line.
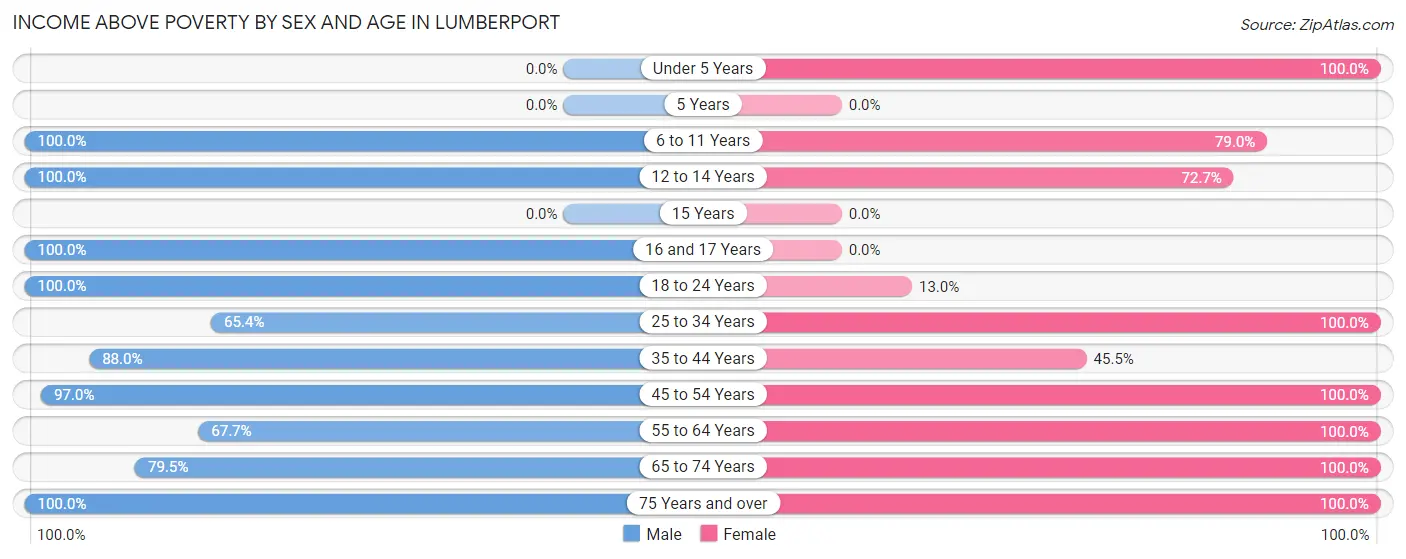
| Age Bracket | Male | Female |
| Under 5 Years | 0 (0.0%) | 23 (100.0%) |
| 5 Years | 0 (0.0%) | 0 (0.0%) |
| 6 to 11 Years | 6 (100.0%) | 15 (78.9%) |
| 12 to 14 Years | 3 (100.0%) | 8 (72.7%) |
| 15 Years | 0 (0.0%) | 0 (0.0%) |
| 16 and 17 Years | 2 (100.0%) | 0 (0.0%) |
| 18 to 24 Years | 14 (100.0%) | 3 (13.0%) |
| 25 to 34 Years | 34 (65.4%) | 28 (100.0%) |
| 35 to 44 Years | 22 (88.0%) | 5 (45.5%) |
| 45 to 54 Years | 318 (97.0%) | 22 (100.0%) |
| 55 to 64 Years | 21 (67.7%) | 14 (100.0%) |
| 65 to 74 Years | 31 (79.5%) | 34 (100.0%) |
| 75 Years and over | 33 (100.0%) | 56 (100.0%) |
| Total | 484 (90.8%) | 208 (85.6%) |
Income Below Poverty Among Married-Couple Families in Lumberport
The poverty statistics for married-couple families in Lumberport show that 4.2% or 3 of the total 71 families live below the poverty line. Families with 1 or 2 children have the highest poverty rate of 37.5%, comprising of 3 families. On the other hand, families with no children have the lowest poverty rate of 0.0%, which includes 0 families.
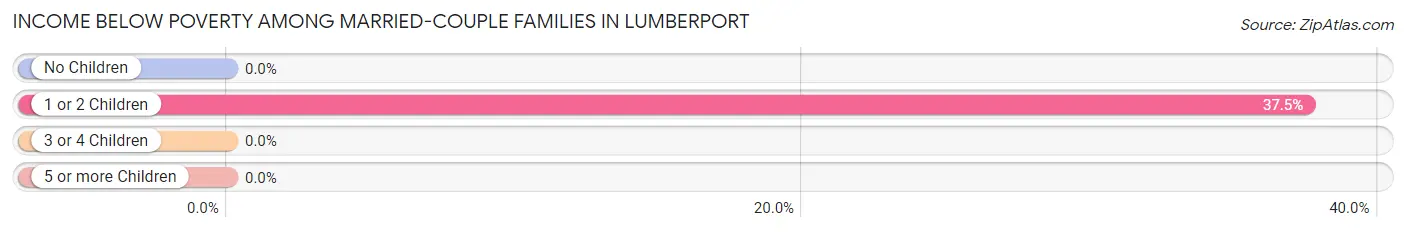
| Children | Above Poverty | Below Poverty |
| No Children | 63 (100.0%) | 0 (0.0%) |
| 1 or 2 Children | 5 (62.5%) | 3 (37.5%) |
| 3 or 4 Children | 0 (0.0%) | 0 (0.0%) |
| 5 or more Children | 0 (0.0%) | 0 (0.0%) |
| Total | 68 (95.8%) | 3 (4.2%) |
Income Below Poverty Among Single-Parent Households in Lumberport
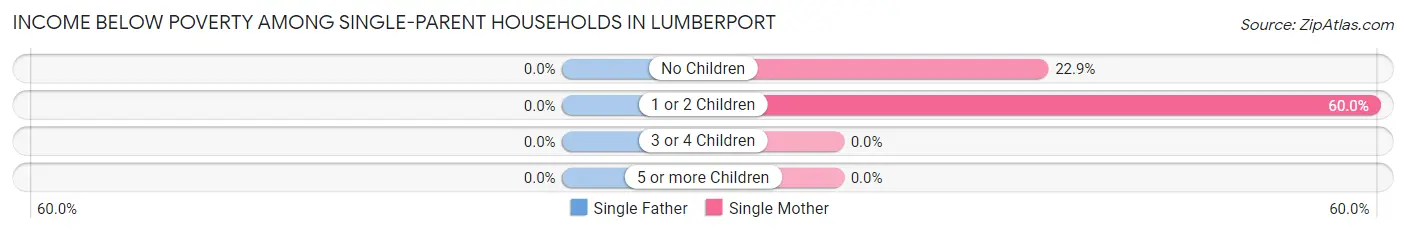
| Children | Single Father | Single Mother |
| No Children | 0 (0.0%) | 8 (22.9%) |
| 1 or 2 Children | 0 (0.0%) | 3 (60.0%) |
| 3 or 4 Children | 0 (0.0%) | 0 (0.0%) |
| 5 or more Children | 0 (0.0%) | 0 (0.0%) |
| Total | 0 (0.0%) | 11 (20.7%) |
Income Below Poverty Among Married-Couple vs Single-Parent Households in Lumberport
The poverty data for Lumberport shows that 3 of the married-couple family households (4.2%) and 11 of the single-parent households (19.3%) are living below the poverty level. Within the married-couple family households, those with 1 or 2 children have the highest poverty rate, with 3 households (37.5%) falling below the poverty line. Among the single-parent households, those with 1 or 2 children have the highest poverty rate, with 3 household (42.9%) living below poverty.
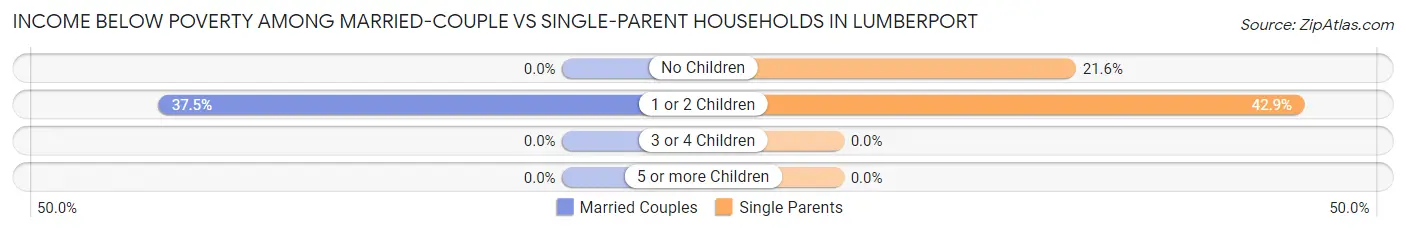
| Children | Married-Couple Families | Single-Parent Households |
| No Children | 0 (0.0%) | 8 (21.6%) |
| 1 or 2 Children | 3 (37.5%) | 3 (42.9%) |
| 3 or 4 Children | 0 (0.0%) | 0 (0.0%) |
| 5 or more Children | 0 (0.0%) | 0 (0.0%) |
| Total | 3 (4.2%) | 11 (19.3%) |
Race in Lumberport
The most populous races in Lumberport are White / Caucasian (757 | 96.7%), and Two or more Races (26 | 3.3%).
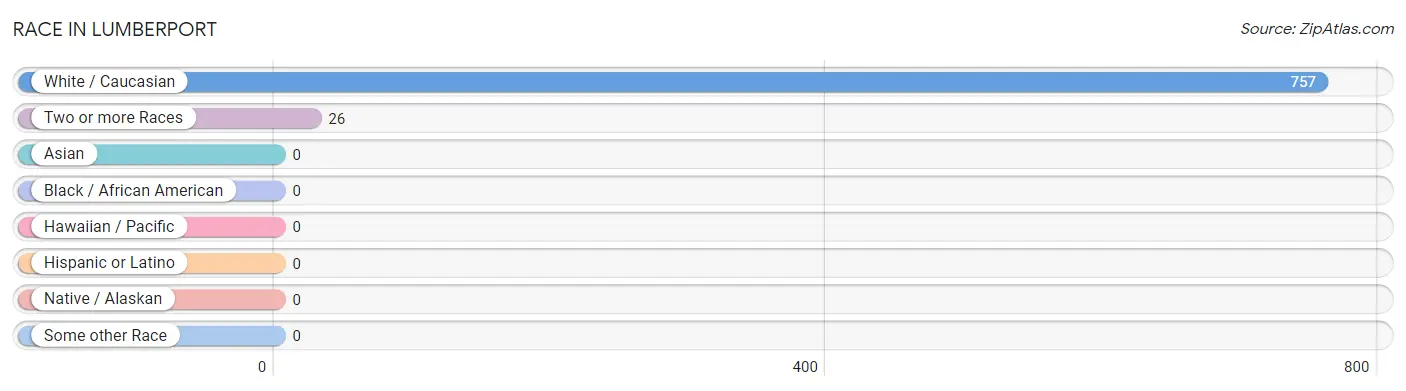
| Race | # Population | % Population |
| Asian | 0 | 0.0% |
| Black / African American | 0 | 0.0% |
| Hawaiian / Pacific | 0 | 0.0% |
| Hispanic or Latino | 0 | 0.0% |
| Native / Alaskan | 0 | 0.0% |
| White / Caucasian | 757 | 96.7% |
| Two or more Races | 26 | 3.3% |
| Some other Race | 0 | 0.0% |
| Total | 783 | 100.0% |
Ancestry in Lumberport
The most populous ancestries reported in Lumberport are Irish (418 | 53.4%), German (109 | 13.9%), Italian (34 | 4.3%), Welsh (28 | 3.6%), and English (27 | 3.5%), together accounting for 78.7% of all Lumberport residents.
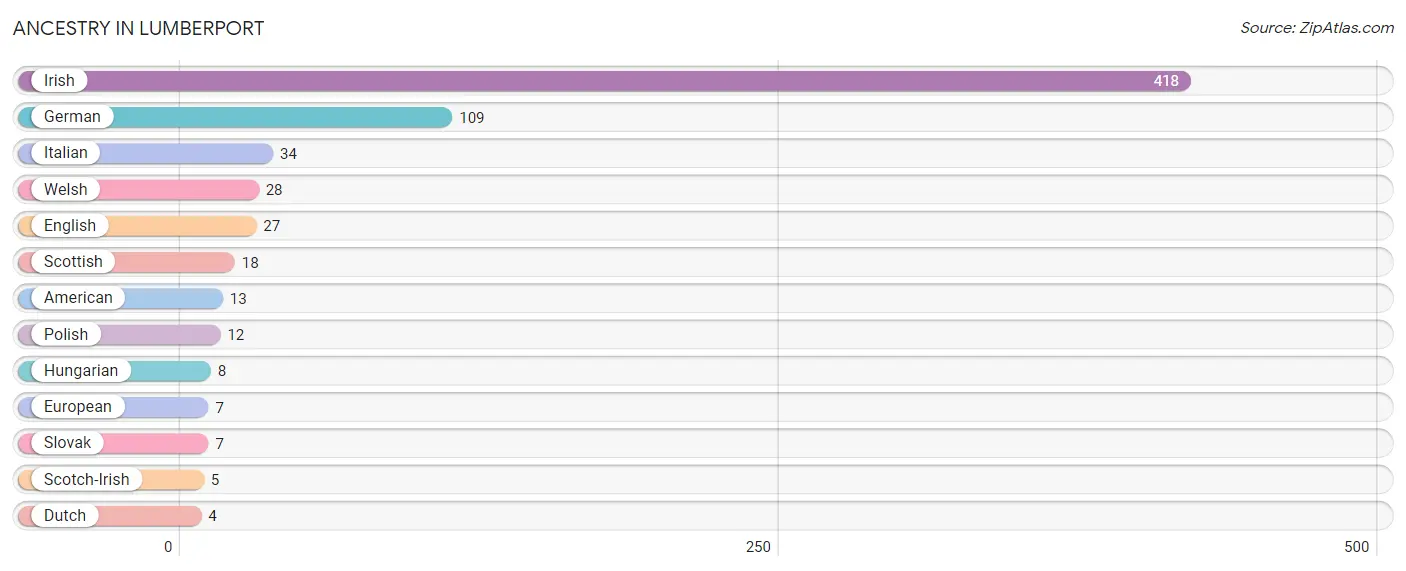
| Ancestry | # Population | % Population |
| American | 13 | 1.7% |
| Dutch | 4 | 0.5% |
| English | 27 | 3.5% |
| European | 7 | 0.9% |
| German | 109 | 13.9% |
| Hungarian | 8 | 1.0% |
| Irish | 418 | 53.4% |
| Italian | 34 | 4.3% |
| Polish | 12 | 1.5% |
| Scotch-Irish | 5 | 0.6% |
| Scottish | 18 | 2.3% |
| Slovak | 7 | 0.9% |
| Welsh | 28 | 3.6% | View All 13 Rows |
Immigrants in Lumberport

| Immigration Origin | # Population | % Population | View All 0 Rows |
Sex and Age in Lumberport
Sex and Age in Lumberport
The most populous age groups in Lumberport are 50 to 54 Years (189 | 35.3%) for men and 75 to 79 Years (51 | 20.6%) for women.
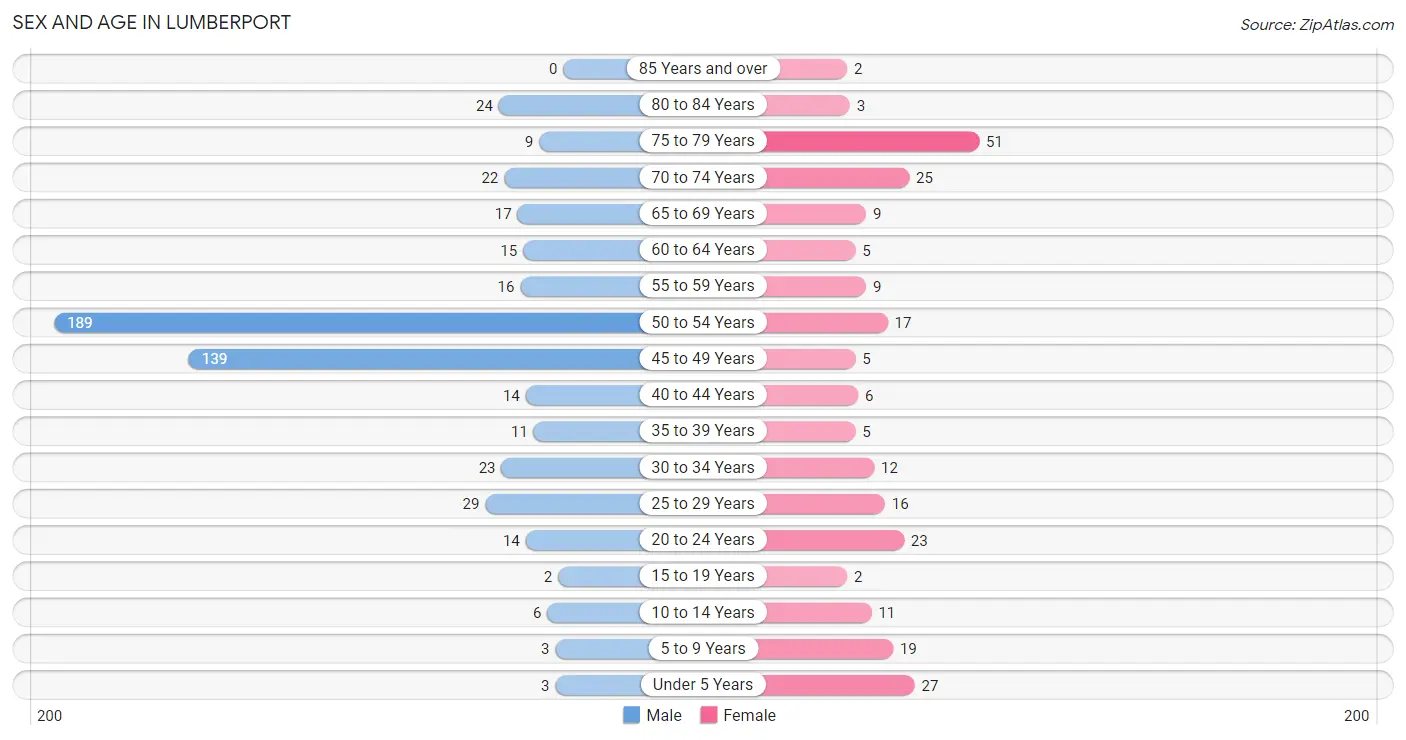
| Age Bracket | Male | Female |
| Under 5 Years | 3 (0.6%) | 27 (10.9%) |
| 5 to 9 Years | 3 (0.6%) | 19 (7.7%) |
| 10 to 14 Years | 6 (1.1%) | 11 (4.4%) |
| 15 to 19 Years | 2 (0.4%) | 2 (0.8%) |
| 20 to 24 Years | 14 (2.6%) | 23 (9.3%) |
| 25 to 29 Years | 29 (5.4%) | 16 (6.5%) |
| 30 to 34 Years | 23 (4.3%) | 12 (4.9%) |
| 35 to 39 Years | 11 (2.1%) | 5 (2.0%) |
| 40 to 44 Years | 14 (2.6%) | 6 (2.4%) |
| 45 to 49 Years | 139 (25.9%) | 5 (2.0%) |
| 50 to 54 Years | 189 (35.3%) | 17 (6.9%) |
| 55 to 59 Years | 16 (3.0%) | 9 (3.6%) |
| 60 to 64 Years | 15 (2.8%) | 5 (2.0%) |
| 65 to 69 Years | 17 (3.2%) | 9 (3.6%) |
| 70 to 74 Years | 22 (4.1%) | 25 (10.1%) |
| 75 to 79 Years | 9 (1.7%) | 51 (20.6%) |
| 80 to 84 Years | 24 (4.5%) | 3 (1.2%) |
| 85 Years and over | 0 (0.0%) | 2 (0.8%) |
| Total | 536 (100.0%) | 247 (100.0%) |
Families and Households in Lumberport
Median Family Size in Lumberport
The median family size in Lumberport is 5.23 persons per family, with single female/mother families (53 | 41.4%) accounting for the largest median family size of 9.45 persons per family. On the other hand, married-couple families (71 | 55.5%) represent the smallest median family size with 2.21 persons per family.
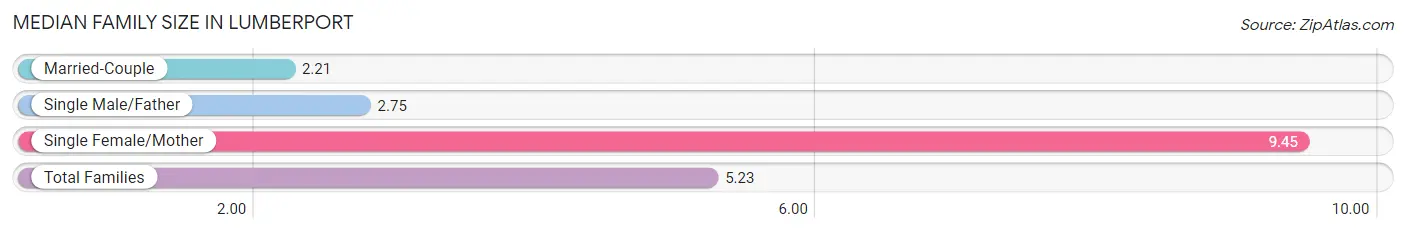
| Family Type | # Families | Family Size |
| Married-Couple | 71 (55.5%) | 2.21 |
| Single Male/Father | 4 (3.1%) | 2.75 |
| Single Female/Mother | 53 (41.4%) | 9.45 |
| Total Families | 128 (100.0%) | 5.23 |
Median Household Size in Lumberport
The median household size in Lumberport is 4.02 persons per household, with single female/mother households (53 | 27.2%) accounting for the largest median household size of 9.91 persons per household. non-family households (67 | 34.4%) represent the smallest median household size with 1.24 persons per household.
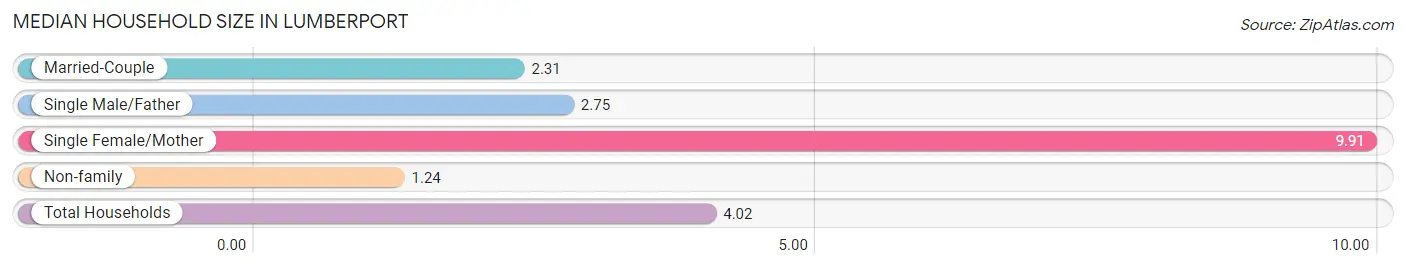
| Household Type | # Households | Household Size |
| Married-Couple | 71 (36.4%) | 2.31 |
| Single Male/Father | 4 (2.1%) | 2.75 |
| Single Female/Mother | 53 (27.2%) | 9.91 |
| Non-family | 67 (34.4%) | 1.24 |
| Total Households | 195 (100.0%) | 4.02 |
Household Size by Marriage Status in Lumberport
Out of a total of 195 households in Lumberport, 128 (65.6%) are family households, while 67 (34.4%) are nonfamily households. The most numerous type of family households are 2-person households, comprising 69, and the most common type of nonfamily households are 1-person households, comprising 57.
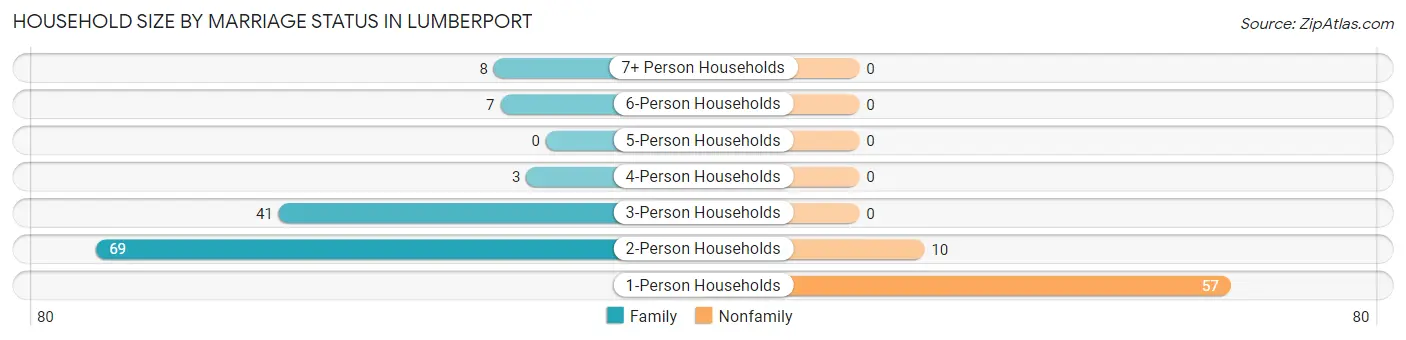
| Household Size | Family Households | Nonfamily Households |
| 1-Person Households | - | 57 (29.2%) |
| 2-Person Households | 69 (35.4%) | 10 (5.1%) |
| 3-Person Households | 41 (21.0%) | 0 (0.0%) |
| 4-Person Households | 3 (1.5%) | 0 (0.0%) |
| 5-Person Households | 0 (0.0%) | 0 (0.0%) |
| 6-Person Households | 7 (3.6%) | 0 (0.0%) |
| 7+ Person Households | 8 (4.1%) | 0 (0.0%) |
| Total | 128 (65.6%) | 67 (34.4%) |
Female Fertility in Lumberport
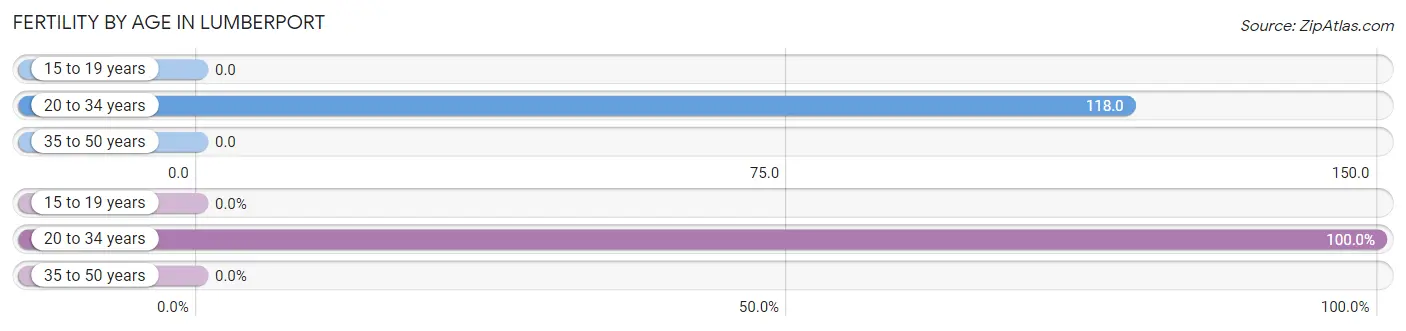
Fertility by Age in Lumberport
Average fertility rate in Lumberport is 85.0 births per 1,000 women. Women in the age bracket of 20 to 34 years have the highest fertility rate with 118.0 births per 1,000 women. Women in the age bracket of 20 to 34 years acount for 100.0% of all women with births.
| Age Bracket | Women with Births | Births / 1,000 Women |
| 15 to 19 years | 0 (0.0%) | 0.0 |
| 20 to 34 years | 6 (100.0%) | 118.0 |
| 35 to 50 years | 0 (0.0%) | 0.0 |
| Total | 6 (100.0%) | 85.0 |
Fertility by Age by Marriage Status in Lumberport
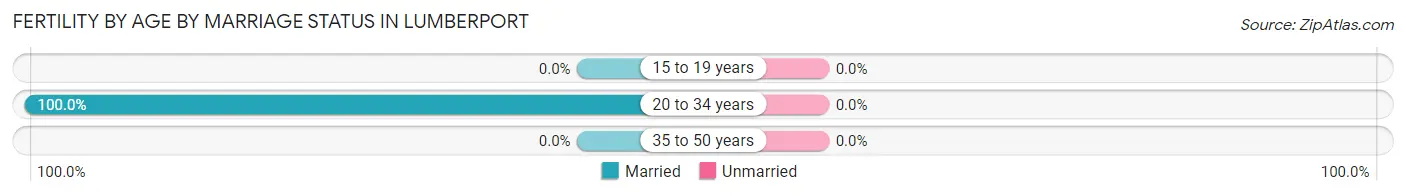
| Age Bracket | Married | Unmarried |
| 15 to 19 years | 0 (0.0%) | 0 (0.0%) |
| 20 to 34 years | 6 (100.0%) | 0 (0.0%) |
| 35 to 50 years | 0 (0.0%) | 0 (0.0%) |
| Total | 6 (100.0%) | 0 (0.0%) |
Fertility by Education in Lumberport
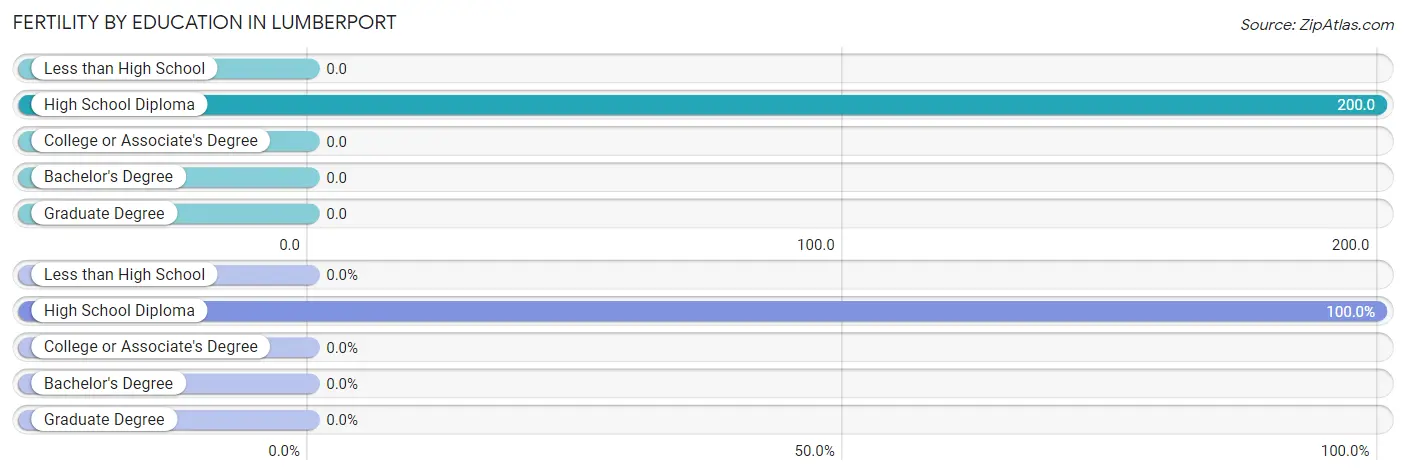
| Educational Attainment | Women with Births | Births / 1,000 Women |
| Less than High School | 0 (0.0%) | 0.0 |
| High School Diploma | 6 (100.0%) | 200.0 |
| College or Associate's Degree | 0 (0.0%) | 0.0 |
| Bachelor's Degree | 0 (0.0%) | 0.0 |
| Graduate Degree | 0 (0.0%) | 0.0 |
| Total | 6 (100.0%) | 85.0 |
Fertility by Education by Marriage Status in Lumberport
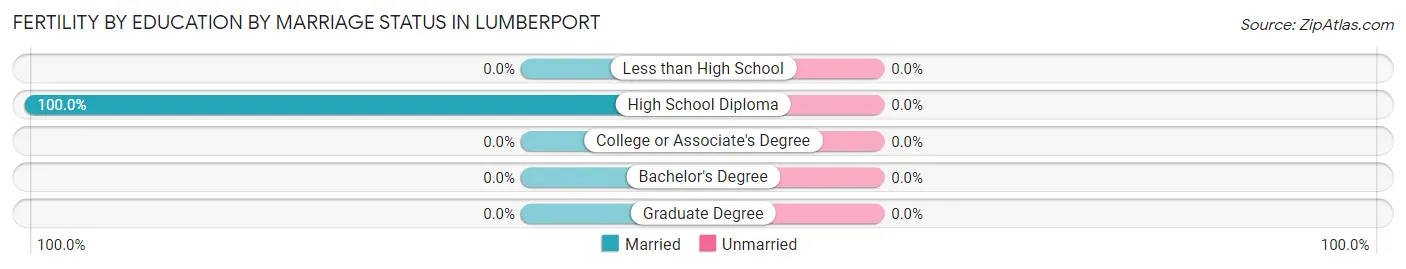
| Educational Attainment | Married | Unmarried |
| Less than High School | 0 (0.0%) | 0 (0.0%) |
| High School Diploma | 6 (100.0%) | 0 (0.0%) |
| College or Associate's Degree | 0 (0.0%) | 0 (0.0%) |
| Bachelor's Degree | 0 (0.0%) | 0 (0.0%) |
| Graduate Degree | 0 (0.0%) | 0 (0.0%) |
| Total | 6 (100.0%) | 0 (0.0%) |
Employment Characteristics in Lumberport
Employment by Class of Employer in Lumberport
Among the 467 employed individuals in Lumberport, private company employees (246 | 52.7%), local government employees (183 | 39.2%), and not-for-profit organizations (18 | 3.8%) make up the most common classes of employment.
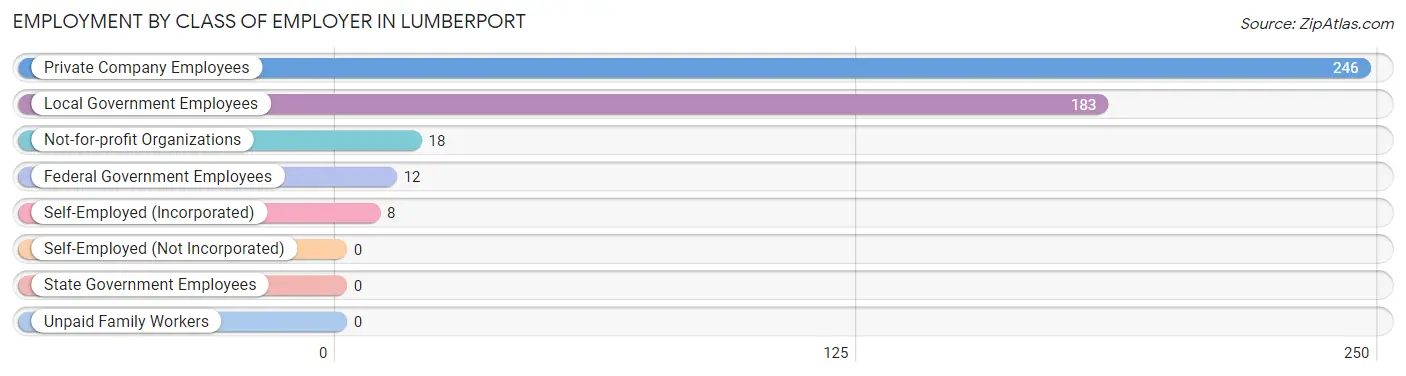
| Employer Class | # Employees | % Employees |
| Private Company Employees | 246 | 52.7% |
| Self-Employed (Incorporated) | 8 | 1.7% |
| Self-Employed (Not Incorporated) | 0 | 0.0% |
| Not-for-profit Organizations | 18 | 3.8% |
| Local Government Employees | 183 | 39.2% |
| State Government Employees | 0 | 0.0% |
| Federal Government Employees | 12 | 2.6% |
| Unpaid Family Workers | 0 | 0.0% |
| Total | 467 | 100.0% |
Employment Status by Age in Lumberport
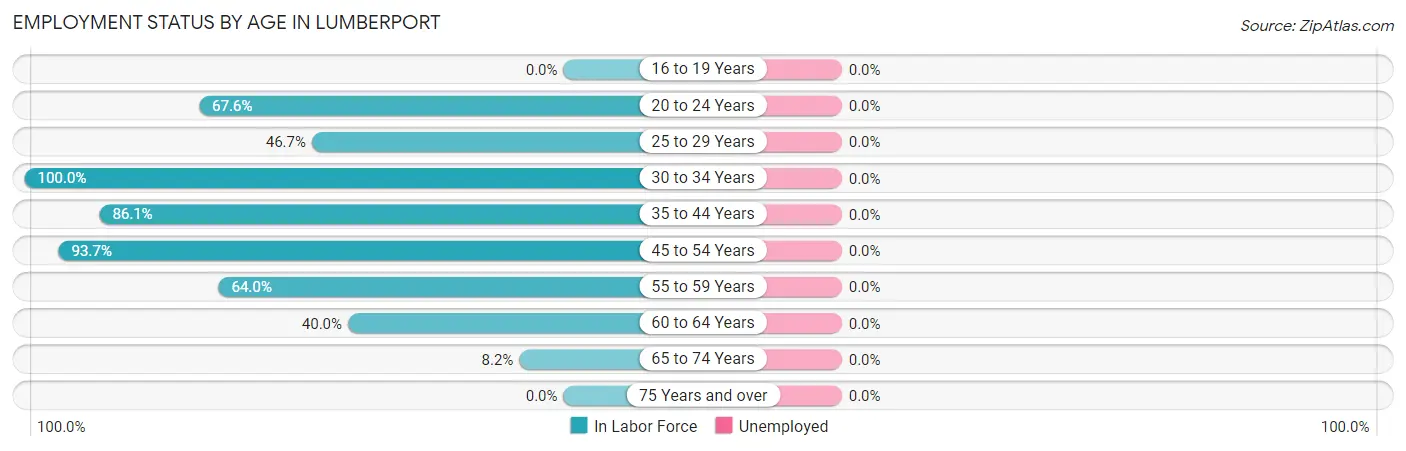
| Age Bracket | In Labor Force | Unemployed |
| 16 to 19 Years | 0 (0.0%) | 0 (0.0%) |
| 20 to 24 Years | 25 (67.6%) | 0 (0.0%) |
| 25 to 29 Years | 21 (46.7%) | 0 (0.0%) |
| 30 to 34 Years | 35 (100.0%) | 0 (0.0%) |
| 35 to 44 Years | 31 (86.1%) | 0 (0.0%) |
| 45 to 54 Years | 328 (93.7%) | 0 (0.0%) |
| 55 to 59 Years | 16 (64.0%) | 0 (0.0%) |
| 60 to 64 Years | 8 (40.0%) | 0 (0.0%) |
| 65 to 74 Years | 6 (8.2%) | 0 (0.0%) |
| 75 Years and over | 0 (0.0%) | 0 (0.0%) |
| Total | 470 (65.8%) | 0 (0.0%) |
Employment Status by Educational Attainment in Lumberport
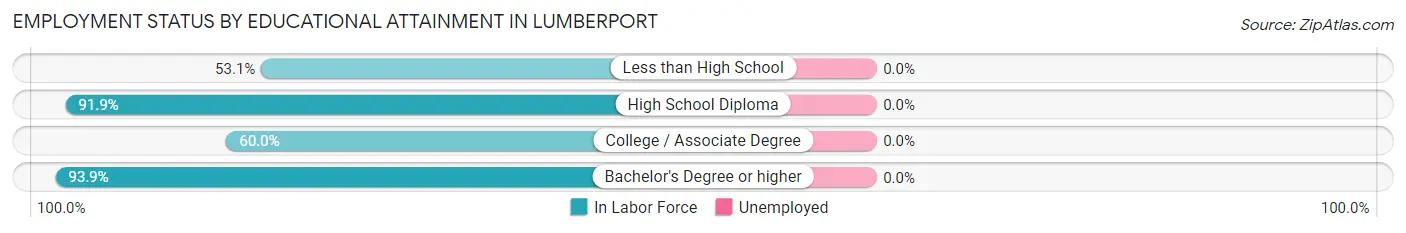
| Educational Attainment | In Labor Force | Unemployed |
| Less than High School | 34 (53.1%) | 0 (0.0%) |
| High School Diploma | 362 (91.9%) | 0 (0.0%) |
| College / Associate Degree | 12 (60.0%) | 0 (0.0%) |
| Bachelor's Degree or higher | 31 (93.9%) | 0 (0.0%) |
| Total | 439 (85.9%) | 0 (0.0%) |
Employment Occupations by Sex in Lumberport
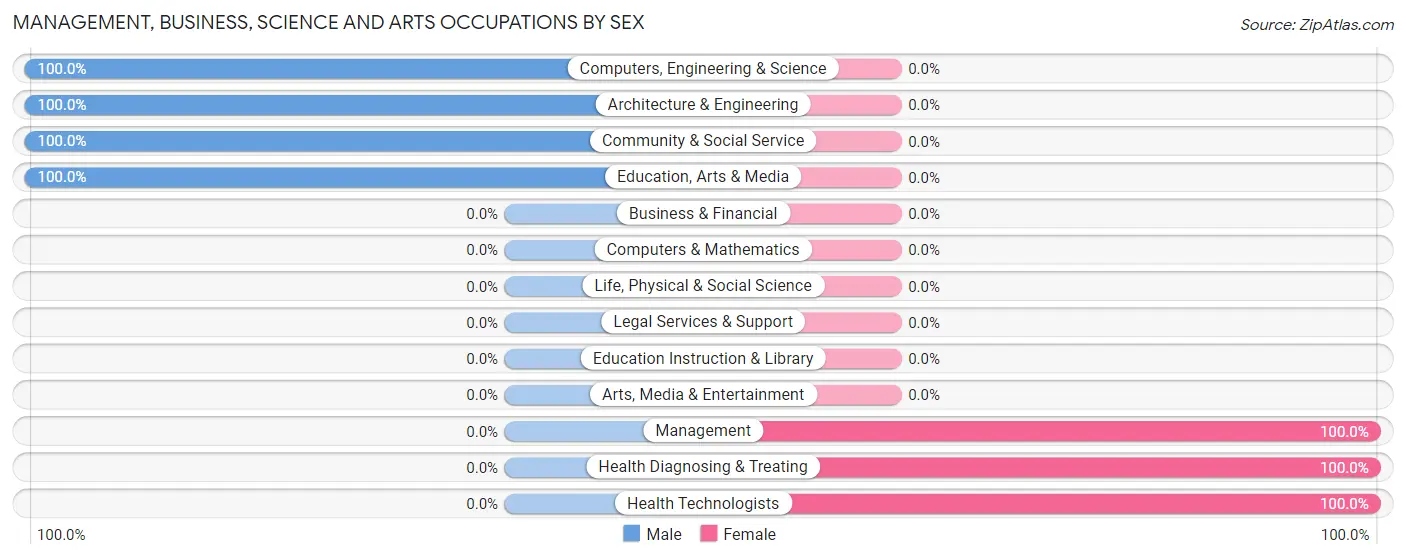
Management, Business, Science and Arts Occupations
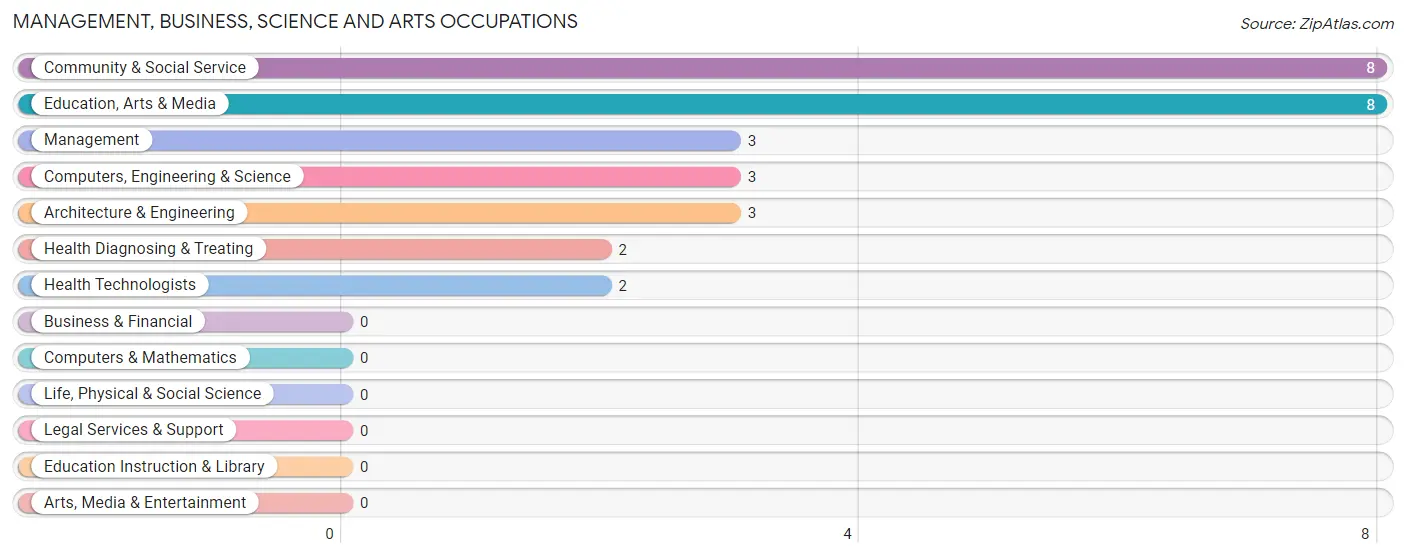
The most common Management, Business, Science and Arts occupations in Lumberport are Community & Social Service (8 | 1.7%), Education, Arts & Media (8 | 1.7%), Management (3 | 0.6%), Computers, Engineering & Science (3 | 0.6%), and Architecture & Engineering (3 | 0.6%).
Management, Business, Science and Arts Occupations by Sex
Within the Management, Business, Science and Arts occupations in Lumberport, the most male-oriented occupations are Computers, Engineering & Science (100.0%), Architecture & Engineering (100.0%), and Community & Social Service (100.0%), while the most female-oriented occupations are Management (100.0%), Health Diagnosing & Treating (100.0%), and Health Technologists (100.0%).
| Occupation | Male | Female |
| Management | 0 (0.0%) | 3 (100.0%) |
| Business & Financial | 0 (0.0%) | 0 (0.0%) |
| Computers, Engineering & Science | 3 (100.0%) | 0 (0.0%) |
| Computers & Mathematics | 0 (0.0%) | 0 (0.0%) |
| Architecture & Engineering | 3 (100.0%) | 0 (0.0%) |
| Life, Physical & Social Science | 0 (0.0%) | 0 (0.0%) |
| Community & Social Service | 8 (100.0%) | 0 (0.0%) |
| Education, Arts & Media | 8 (100.0%) | 0 (0.0%) |
| Legal Services & Support | 0 (0.0%) | 0 (0.0%) |
| Education Instruction & Library | 0 (0.0%) | 0 (0.0%) |
| Arts, Media & Entertainment | 0 (0.0%) | 0 (0.0%) |
| Health Diagnosing & Treating | 0 (0.0%) | 2 (100.0%) |
| Health Technologists | 0 (0.0%) | 2 (100.0%) |
| Total (Category) | 11 (68.8%) | 5 (31.2%) |
| Total (Overall) | 419 (89.1%) | 51 (10.8%) |
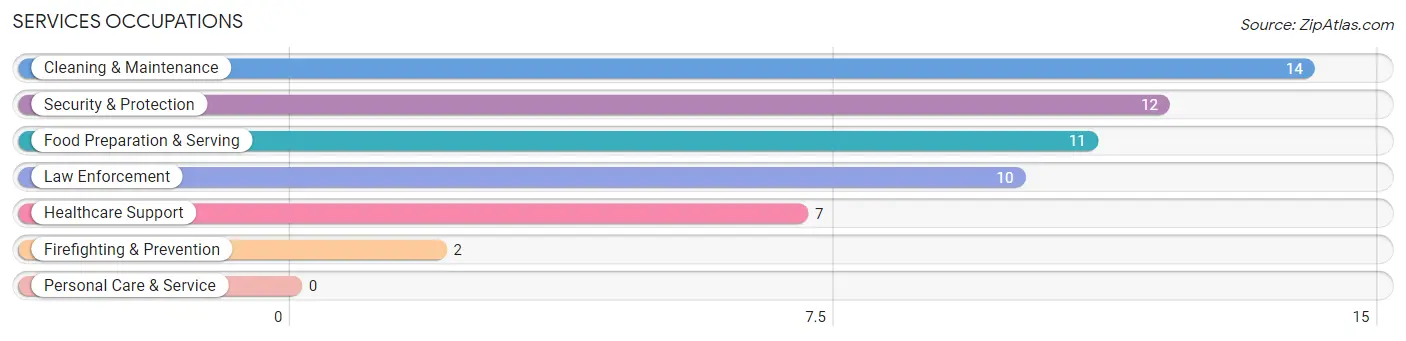
Services Occupations
The most common Services occupations in Lumberport are Cleaning & Maintenance (14 | 3.0%), Security & Protection (12 | 2.5%), Food Preparation & Serving (11 | 2.3%), Law Enforcement (10 | 2.1%), and Healthcare Support (7 | 1.5%).
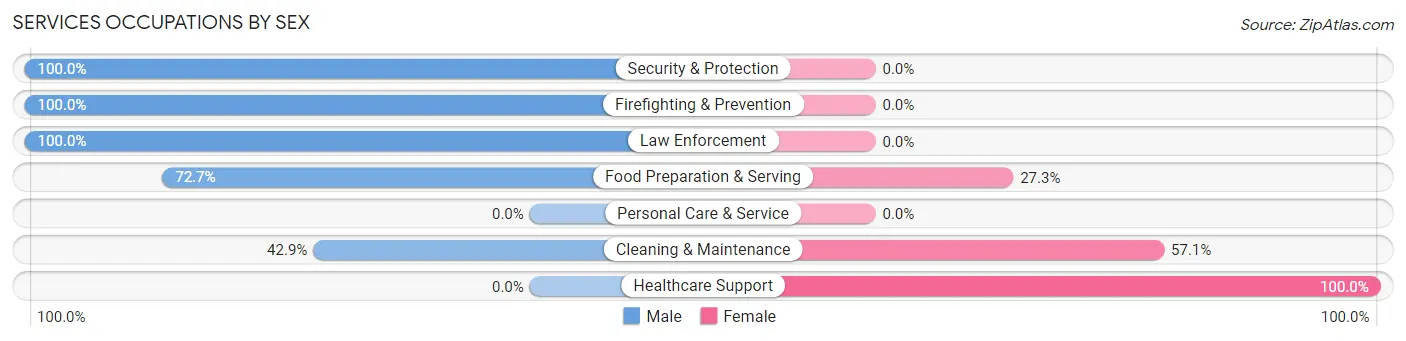
Services Occupations by Sex
Within the Services occupations in Lumberport, the most male-oriented occupations are Security & Protection (100.0%), Firefighting & Prevention (100.0%), and Law Enforcement (100.0%), while the most female-oriented occupations are Healthcare Support (100.0%), Cleaning & Maintenance (57.1%), and Food Preparation & Serving (27.3%).
| Occupation | Male | Female |
| Healthcare Support | 0 (0.0%) | 7 (100.0%) |
| Security & Protection | 12 (100.0%) | 0 (0.0%) |
| Firefighting & Prevention | 2 (100.0%) | 0 (0.0%) |
| Law Enforcement | 10 (100.0%) | 0 (0.0%) |
| Food Preparation & Serving | 8 (72.7%) | 3 (27.3%) |
| Cleaning & Maintenance | 6 (42.9%) | 8 (57.1%) |
| Personal Care & Service | 0 (0.0%) | 0 (0.0%) |
| Total (Category) | 26 (59.1%) | 18 (40.9%) |
| Total (Overall) | 419 (89.1%) | 51 (10.8%) |
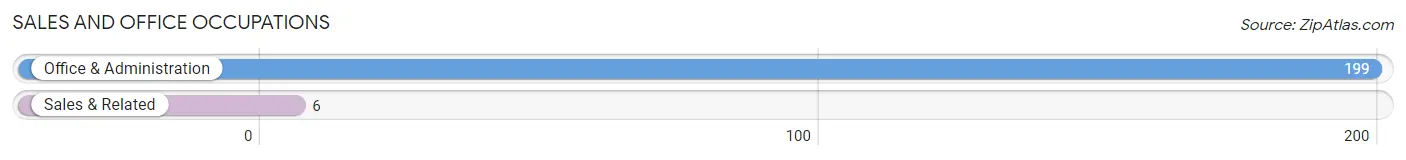
Sales and Office Occupations
The most common Sales and Office occupations in Lumberport are Office & Administration (199 | 42.3%), and Sales & Related (6 | 1.3%).
Sales and Office Occupations by Sex

| Occupation | Male | Female |
| Sales & Related | 3 (50.0%) | 3 (50.0%) |
| Office & Administration | 184 (92.5%) | 15 (7.5%) |
| Total (Category) | 187 (91.2%) | 18 (8.8%) |
| Total (Overall) | 419 (89.1%) | 51 (10.8%) |
Natural Resources, Construction and Maintenance Occupations
The most common Natural Resources, Construction and Maintenance occupations in Lumberport are Construction & Extraction (153 | 32.6%), and Installation, Maintenance & Repair (2 | 0.4%).
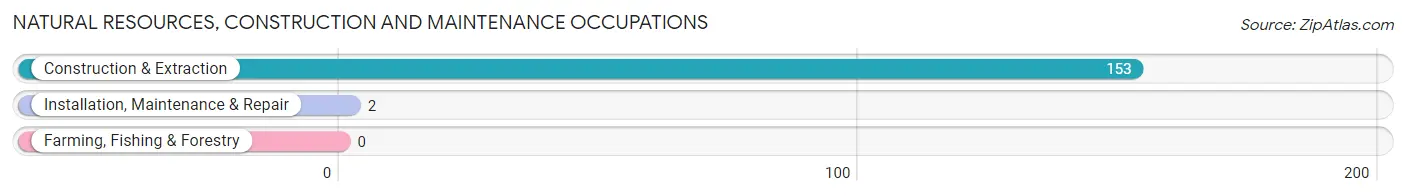
Natural Resources, Construction and Maintenance Occupations by Sex

| Occupation | Male | Female |
| Farming, Fishing & Forestry | 0 (0.0%) | 0 (0.0%) |
| Construction & Extraction | 153 (100.0%) | 0 (0.0%) |
| Installation, Maintenance & Repair | 2 (100.0%) | 0 (0.0%) |
| Total (Category) | 155 (100.0%) | 0 (0.0%) |
| Total (Overall) | 419 (89.1%) | 51 (10.8%) |
Production, Transportation and Moving Occupations
The most common Production, Transportation and Moving occupations in Lumberport are Material Moving (31 | 6.6%), Transportation (17 | 3.6%), and Production (2 | 0.4%).
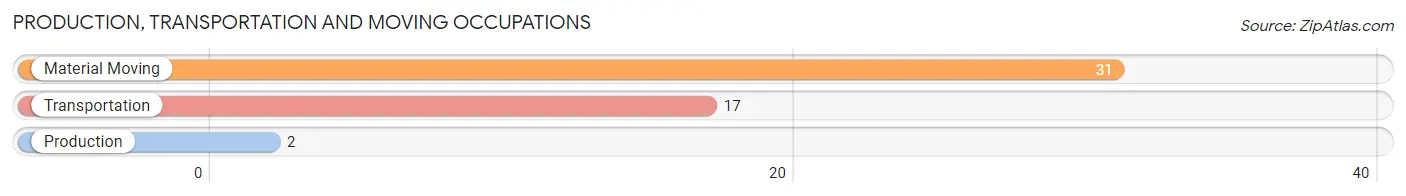
Production, Transportation and Moving Occupations by Sex
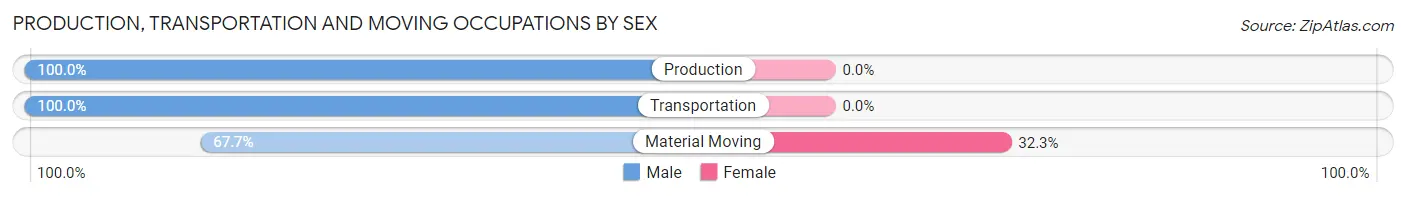
| Occupation | Male | Female |
| Production | 2 (100.0%) | 0 (0.0%) |
| Transportation | 17 (100.0%) | 0 (0.0%) |
| Material Moving | 21 (67.7%) | 10 (32.3%) |
| Total (Category) | 40 (80.0%) | 10 (20.0%) |
| Total (Overall) | 419 (89.1%) | 51 (10.8%) |
Employment Industries by Sex in Lumberport
Employment Industries in Lumberport
The major employment industries in Lumberport include Public Administration (192 | 40.8%), Construction (145 | 30.8%), Retail Trade (26 | 5.5%), Mining, Quarrying, & Extraction (19 | 4.0%), and Accommodation & Food Services (19 | 4.0%).
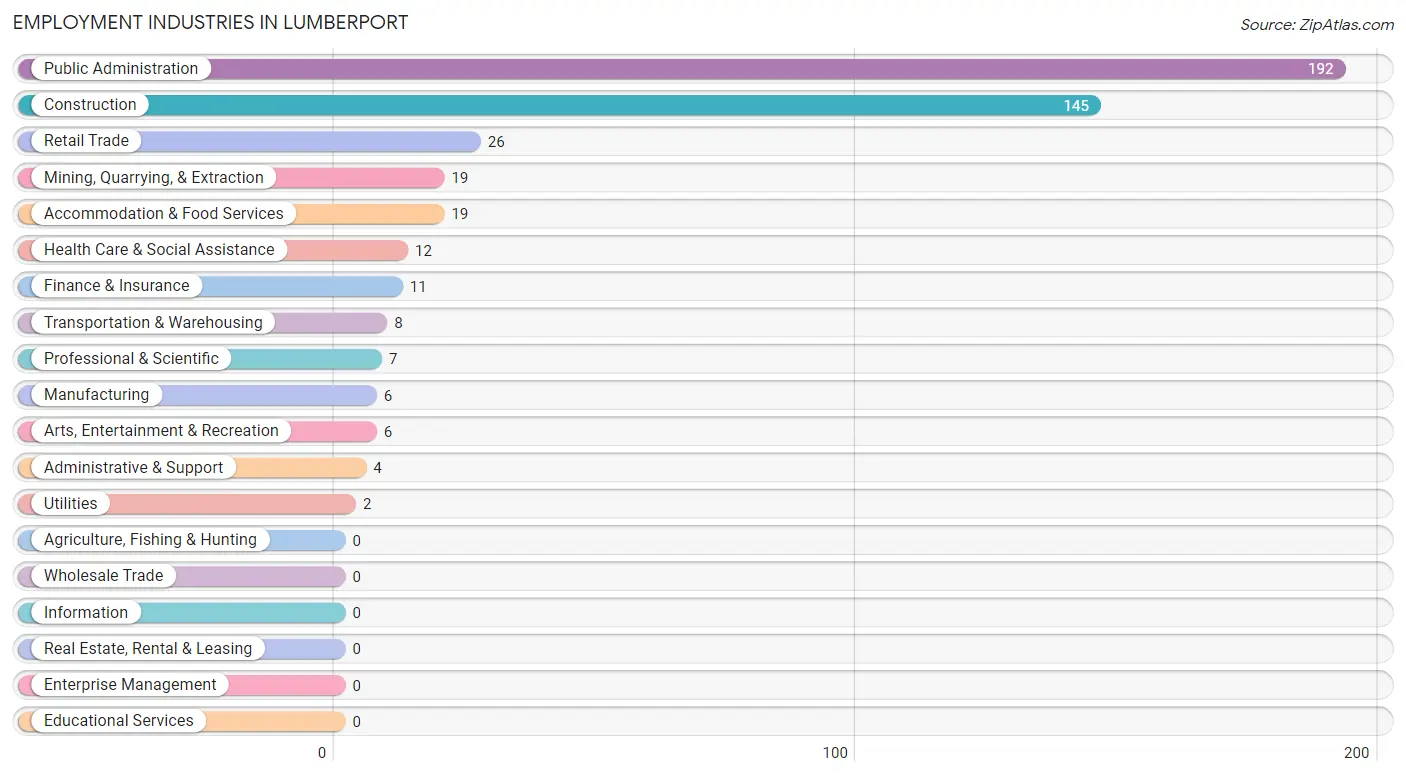
Employment Industries by Sex in Lumberport
The Lumberport industries that see more men than women are Mining, Quarrying, & Extraction (100.0%), Construction (100.0%), and Transportation & Warehousing (100.0%), whereas the industries that tend to have a higher number of women are Finance & Insurance (100.0%), Health Care & Social Assistance (100.0%), and Manufacturing (66.7%).
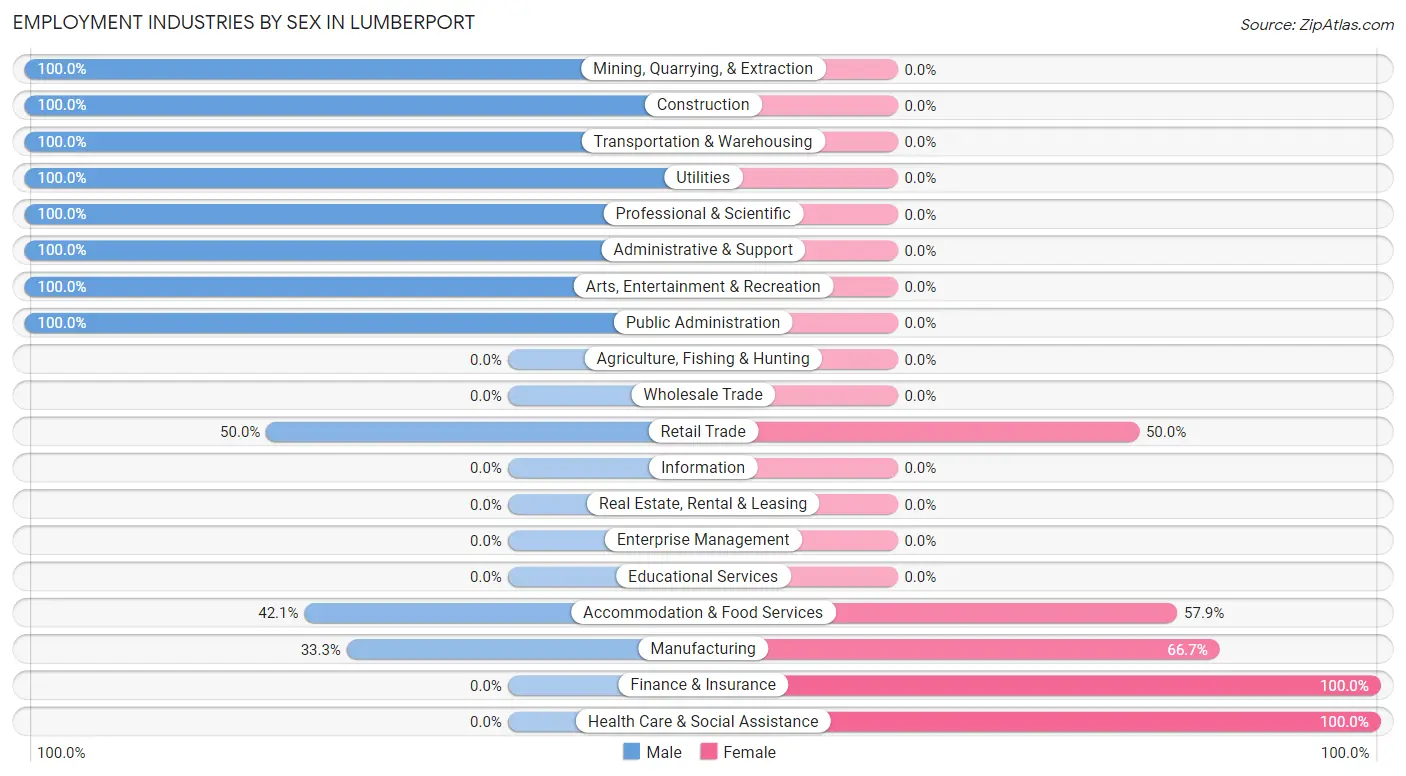
| Industry | Male | Female |
| Agriculture, Fishing & Hunting | 0 (0.0%) | 0 (0.0%) |
| Mining, Quarrying, & Extraction | 19 (100.0%) | 0 (0.0%) |
| Construction | 145 (100.0%) | 0 (0.0%) |
| Manufacturing | 2 (33.3%) | 4 (66.7%) |
| Wholesale Trade | 0 (0.0%) | 0 (0.0%) |
| Retail Trade | 13 (50.0%) | 13 (50.0%) |
| Transportation & Warehousing | 8 (100.0%) | 0 (0.0%) |
| Utilities | 2 (100.0%) | 0 (0.0%) |
| Information | 0 (0.0%) | 0 (0.0%) |
| Finance & Insurance | 0 (0.0%) | 11 (100.0%) |
| Real Estate, Rental & Leasing | 0 (0.0%) | 0 (0.0%) |
| Professional & Scientific | 7 (100.0%) | 0 (0.0%) |
| Enterprise Management | 0 (0.0%) | 0 (0.0%) |
| Administrative & Support | 4 (100.0%) | 0 (0.0%) |
| Educational Services | 0 (0.0%) | 0 (0.0%) |
| Health Care & Social Assistance | 0 (0.0%) | 12 (100.0%) |
| Arts, Entertainment & Recreation | 6 (100.0%) | 0 (0.0%) |
| Accommodation & Food Services | 8 (42.1%) | 11 (57.9%) |
| Public Administration | 192 (100.0%) | 0 (0.0%) |
| Total | 419 (89.1%) | 51 (10.8%) |
Education in Lumberport
School Enrollment in Lumberport
The most common levels of schooling among the 50 students in Lumberport are middle school (17 | 34.0%), elementary school (11 | 22.0%), and college / undergraduate (11 | 22.0%).
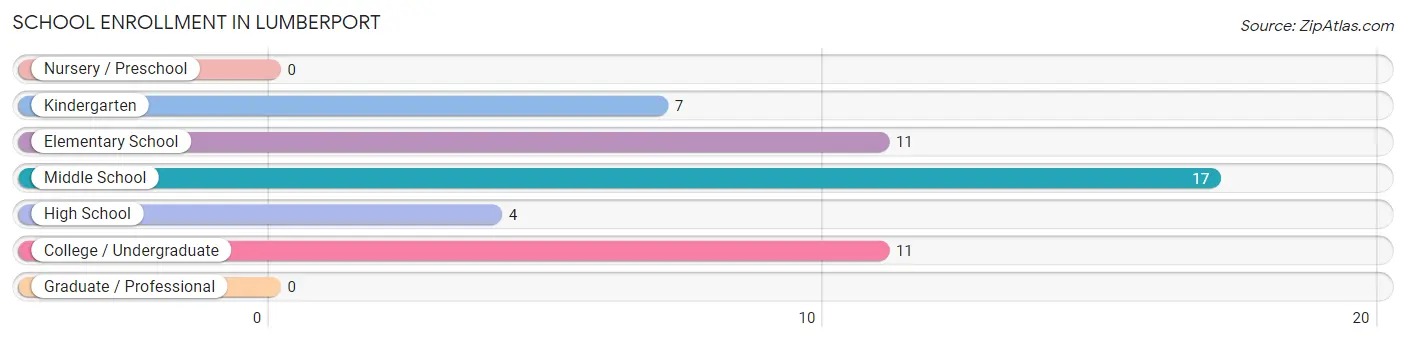
| School Level | # Students | % Students |
| Nursery / Preschool | 0 | 0.0% |
| Kindergarten | 7 | 14.0% |
| Elementary School | 11 | 22.0% |
| Middle School | 17 | 34.0% |
| High School | 4 | 8.0% |
| College / Undergraduate | 11 | 22.0% |
| Graduate / Professional | 0 | 0.0% |
| Total | 50 | 100.0% |
School Enrollment by Age by Funding Source in Lumberport
Out of a total of 50 students who are enrolled in schools in Lumberport, 4 (8.0%) attend a private institution, while the remaining 46 (92.0%) are enrolled in public schools. The age group of 25 to 34 year olds has the highest likelihood of being enrolled in private schools, with 4 (100.0% in the age bracket) enrolled. Conversely, the age group of 5 to 9 year old has the lowest likelihood of being enrolled in a private school, with 18 (100.0% in the age bracket) attending a public institution.
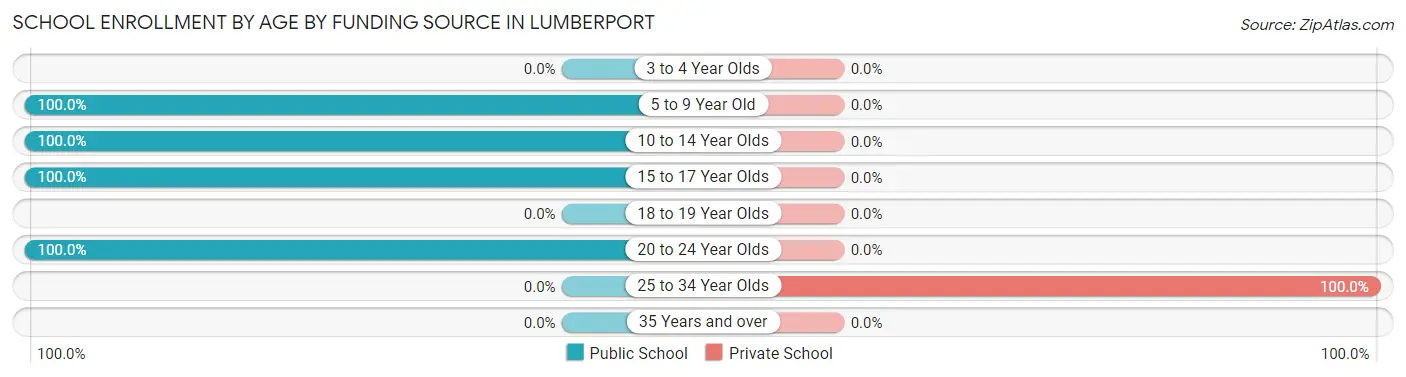
| Age Bracket | Public School | Private School |
| 3 to 4 Year Olds | 0 (0.0%) | 0 (0.0%) |
| 5 to 9 Year Old | 18 (100.0%) | 0 (0.0%) |
| 10 to 14 Year Olds | 17 (100.0%) | 0 (0.0%) |
| 15 to 17 Year Olds | 4 (100.0%) | 0 (0.0%) |
| 18 to 19 Year Olds | 0 (0.0%) | 0 (0.0%) |
| 20 to 24 Year Olds | 7 (100.0%) | 0 (0.0%) |
| 25 to 34 Year Olds | 0 (0.0%) | 4 (100.0%) |
| 35 Years and over | 0 (0.0%) | 0 (0.0%) |
| Total | 46 (92.0%) | 4 (8.0%) |
Educational Attainment by Field of Study in Lumberport
Business (18 | 45.0%), science & technology (9 | 22.5%), liberal arts & history (7 | 17.5%), engineering (3 | 7.5%), and education (2 | 5.0%) are the most common fields of study among 40 individuals in Lumberport who have obtained a bachelor's degree or higher.
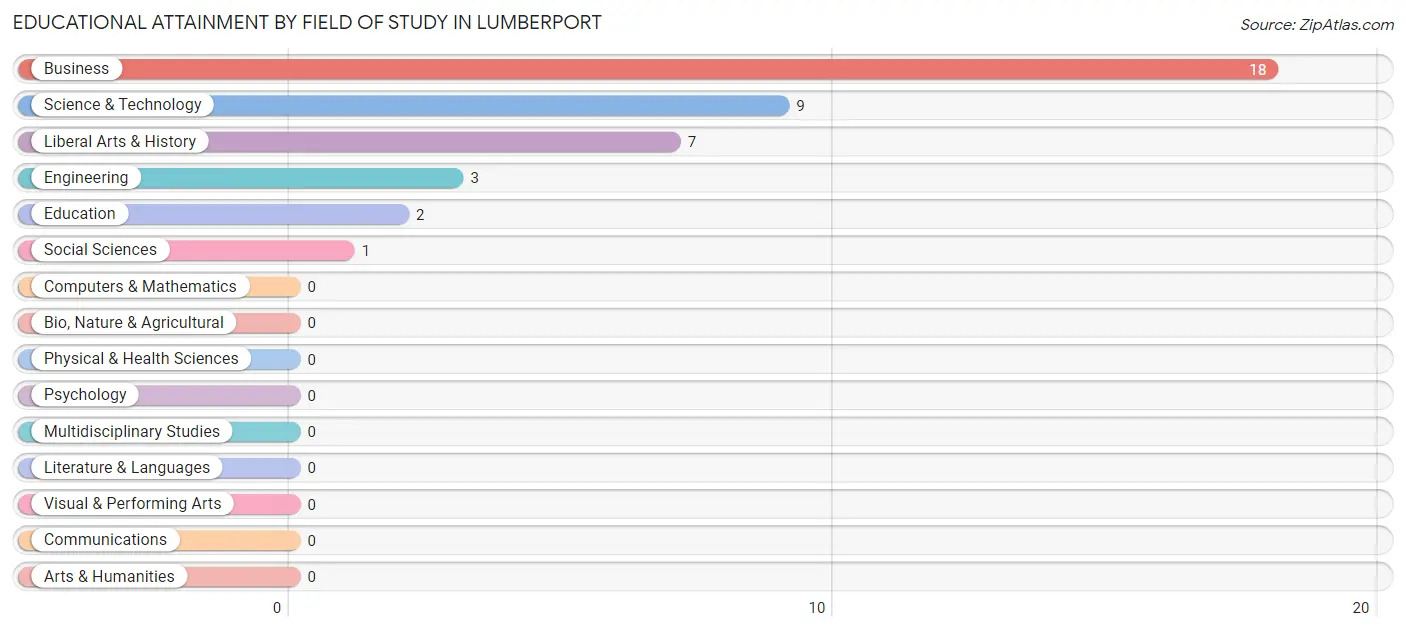
| Field of Study | # Graduates | % Graduates |
| Computers & Mathematics | 0 | 0.0% |
| Bio, Nature & Agricultural | 0 | 0.0% |
| Physical & Health Sciences | 0 | 0.0% |
| Psychology | 0 | 0.0% |
| Social Sciences | 1 | 2.5% |
| Engineering | 3 | 7.5% |
| Multidisciplinary Studies | 0 | 0.0% |
| Science & Technology | 9 | 22.5% |
| Business | 18 | 45.0% |
| Education | 2 | 5.0% |
| Literature & Languages | 0 | 0.0% |
| Liberal Arts & History | 7 | 17.5% |
| Visual & Performing Arts | 0 | 0.0% |
| Communications | 0 | 0.0% |
| Arts & Humanities | 0 | 0.0% |
| Total | 40 | 100.0% |
Transportation & Commute in Lumberport
Vehicle Availability by Sex in Lumberport
The most prevalent vehicle ownership categories in Lumberport are males with 3 vehicles (319, accounting for 76.7%) and females with 3 vehicles (3, making up 625.5%).
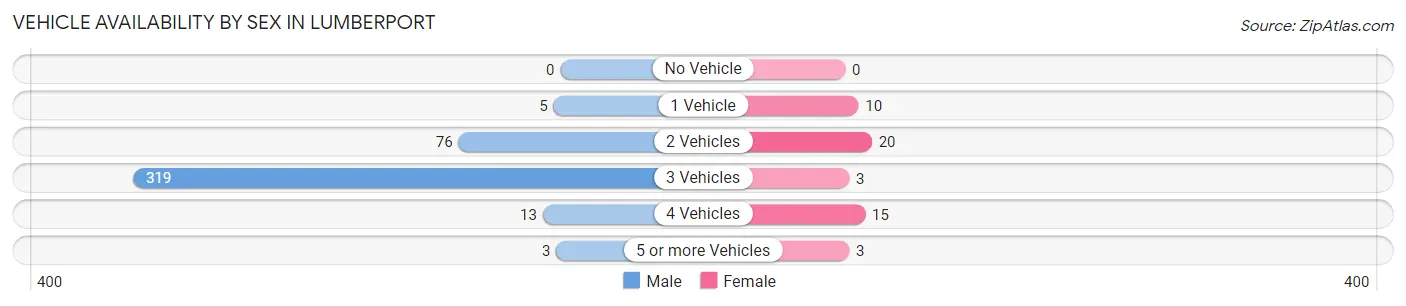
| Vehicles Available | Male | Female |
| No Vehicle | 0 (0.0%) | 0 (0.0%) |
| 1 Vehicle | 5 (1.2%) | 10 (19.6%) |
| 2 Vehicles | 76 (18.3%) | 20 (39.2%) |
| 3 Vehicles | 319 (76.7%) | 3 (5.9%) |
| 4 Vehicles | 13 (3.1%) | 15 (29.4%) |
| 5 or more Vehicles | 3 (0.7%) | 3 (5.9%) |
| Total | 416 (100.0%) | 51 (100.0%) |
Commute Time in Lumberport
The most frequently occuring commute durations in Lumberport are 30 to 34 minutes (314 commuters, 69.3%), 20 to 24 minutes (67 commuters, 14.8%), and 15 to 19 minutes (27 commuters, 6.0%).
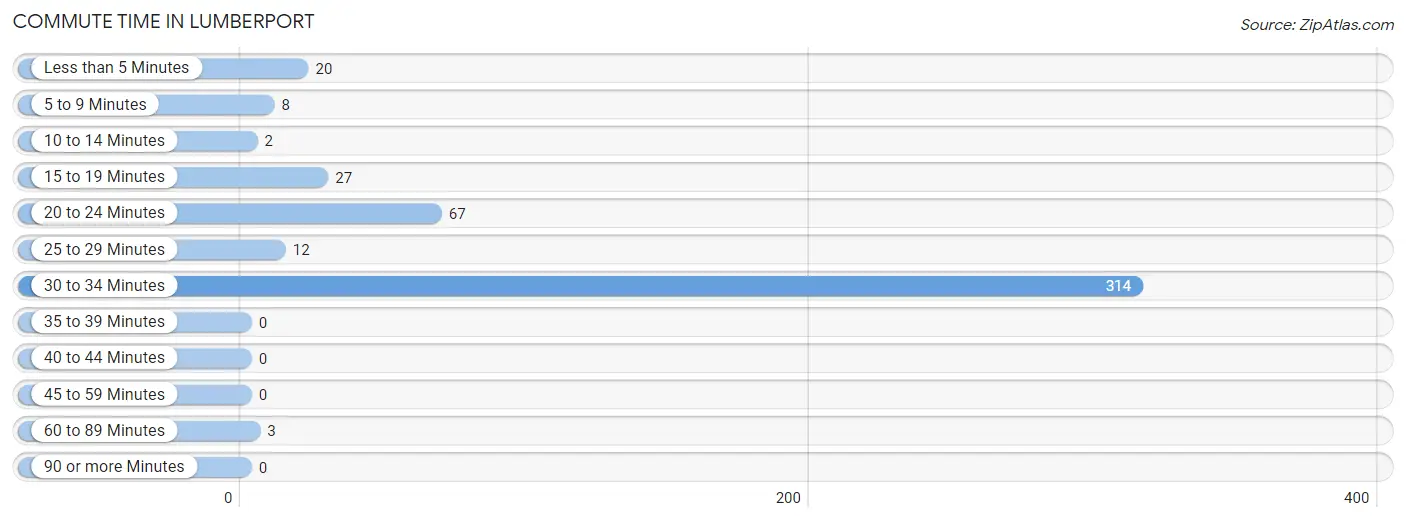
| Commute Time | # Commuters | % Commuters |
| Less than 5 Minutes | 20 | 4.4% |
| 5 to 9 Minutes | 8 | 1.8% |
| 10 to 14 Minutes | 2 | 0.4% |
| 15 to 19 Minutes | 27 | 6.0% |
| 20 to 24 Minutes | 67 | 14.8% |
| 25 to 29 Minutes | 12 | 2.6% |
| 30 to 34 Minutes | 314 | 69.3% |
| 35 to 39 Minutes | 0 | 0.0% |
| 40 to 44 Minutes | 0 | 0.0% |
| 45 to 59 Minutes | 0 | 0.0% |
| 60 to 89 Minutes | 3 | 0.7% |
| 90 or more Minutes | 0 | 0.0% |
Commute Time by Sex in Lumberport
The most common commute times in Lumberport are 30 to 34 minutes (314 commuters, 77.5%) for males and 20 to 24 minutes (27 commuters, 56.2%) for females.
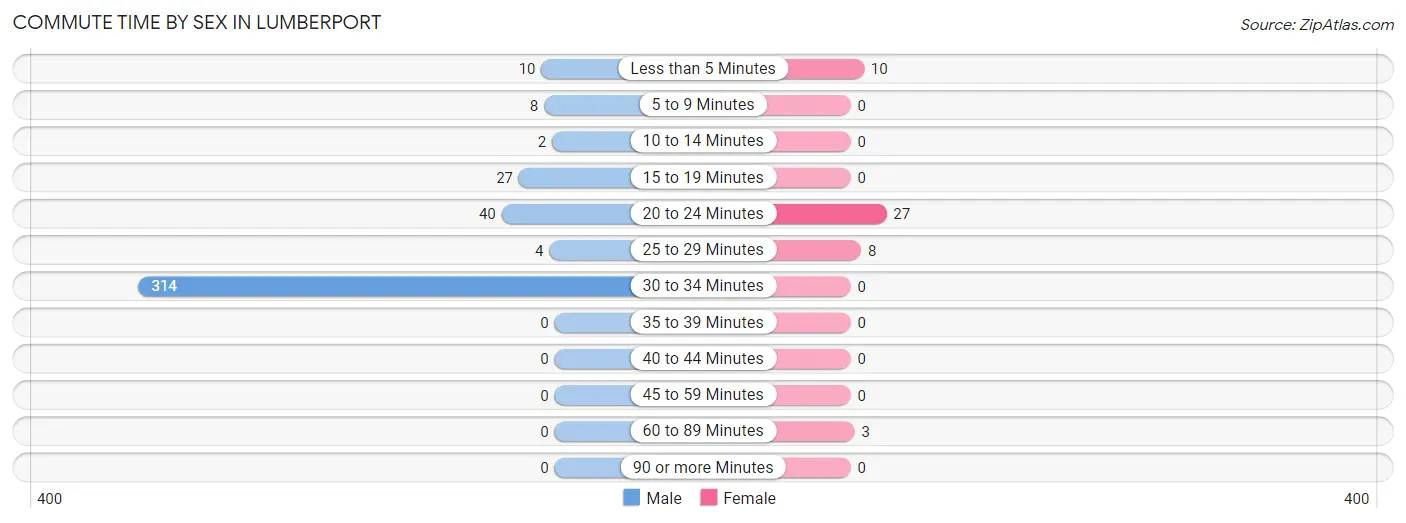
| Commute Time | Male | Female |
| Less than 5 Minutes | 10 (2.5%) | 10 (20.8%) |
| 5 to 9 Minutes | 8 (2.0%) | 0 (0.0%) |
| 10 to 14 Minutes | 2 (0.5%) | 0 (0.0%) |
| 15 to 19 Minutes | 27 (6.7%) | 0 (0.0%) |
| 20 to 24 Minutes | 40 (9.9%) | 27 (56.2%) |
| 25 to 29 Minutes | 4 (1.0%) | 8 (16.7%) |
| 30 to 34 Minutes | 314 (77.5%) | 0 (0.0%) |
| 35 to 39 Minutes | 0 (0.0%) | 0 (0.0%) |
| 40 to 44 Minutes | 0 (0.0%) | 0 (0.0%) |
| 45 to 59 Minutes | 0 (0.0%) | 0 (0.0%) |
| 60 to 89 Minutes | 0 (0.0%) | 3 (6.2%) |
| 90 or more Minutes | 0 (0.0%) | 0 (0.0%) |
Time of Departure to Work by Sex in Lumberport
The most frequent times of departure to work in Lumberport are 7:00 AM to 7:29 AM (191, 47.2%) for males and 8:00 AM to 8:29 AM (16, 33.3%) for females.
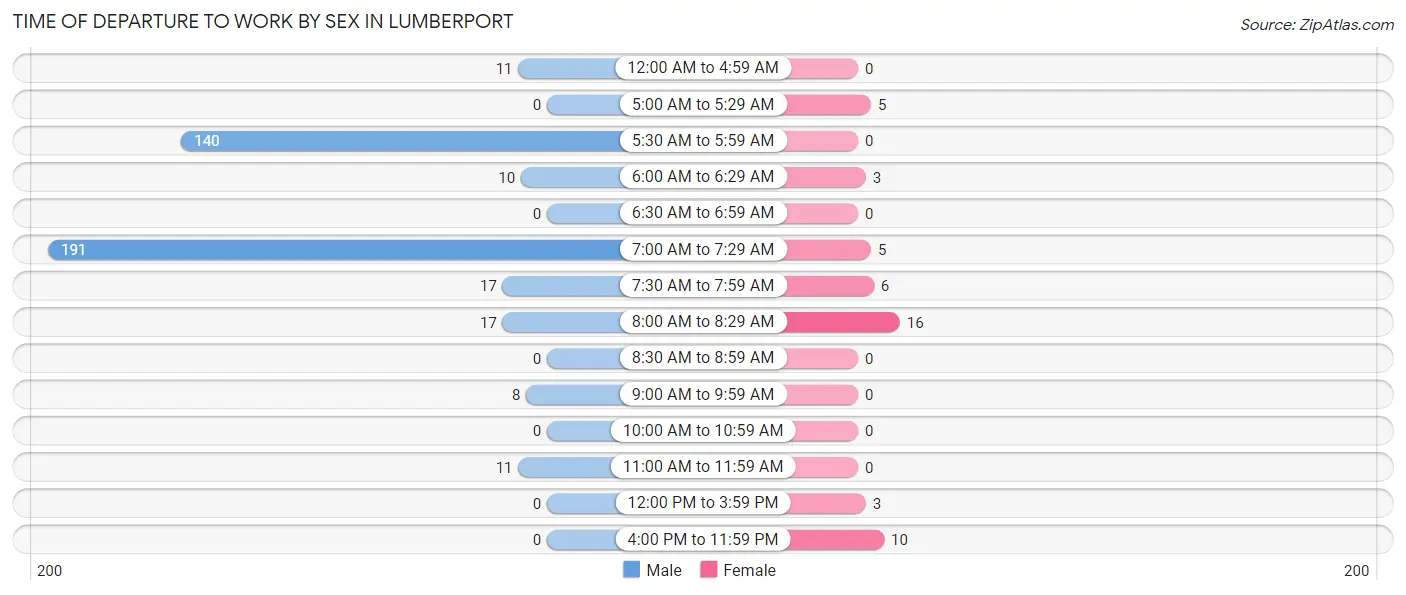
| Time of Departure | Male | Female |
| 12:00 AM to 4:59 AM | 11 (2.7%) | 0 (0.0%) |
| 5:00 AM to 5:29 AM | 0 (0.0%) | 5 (10.4%) |
| 5:30 AM to 5:59 AM | 140 (34.6%) | 0 (0.0%) |
| 6:00 AM to 6:29 AM | 10 (2.5%) | 3 (6.2%) |
| 6:30 AM to 6:59 AM | 0 (0.0%) | 0 (0.0%) |
| 7:00 AM to 7:29 AM | 191 (47.2%) | 5 (10.4%) |
| 7:30 AM to 7:59 AM | 17 (4.2%) | 6 (12.5%) |
| 8:00 AM to 8:29 AM | 17 (4.2%) | 16 (33.3%) |
| 8:30 AM to 8:59 AM | 0 (0.0%) | 0 (0.0%) |
| 9:00 AM to 9:59 AM | 8 (2.0%) | 0 (0.0%) |
| 10:00 AM to 10:59 AM | 0 (0.0%) | 0 (0.0%) |
| 11:00 AM to 11:59 AM | 11 (2.7%) | 0 (0.0%) |
| 12:00 PM to 3:59 PM | 0 (0.0%) | 3 (6.2%) |
| 4:00 PM to 11:59 PM | 0 (0.0%) | 10 (20.8%) |
| Total | 405 (100.0%) | 48 (100.0%) |
Housing Occupancy in Lumberport
Occupancy by Ownership in Lumberport
Of the total 195 dwellings in Lumberport, owner-occupied units account for 166 (85.1%), while renter-occupied units make up 29 (14.9%).
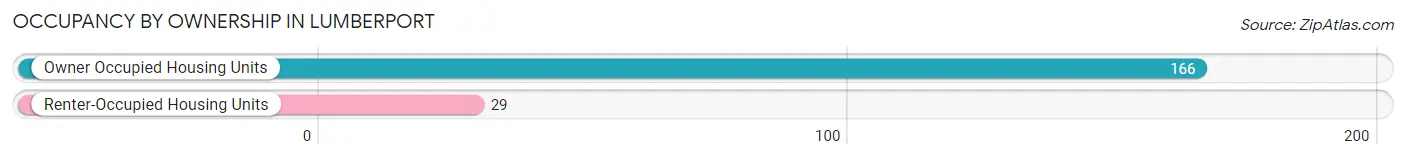
| Occupancy | # Housing Units | % Housing Units |
| Owner Occupied Housing Units | 166 | 85.1% |
| Renter-Occupied Housing Units | 29 | 14.9% |
| Total Occupied Housing Units | 195 | 100.0% |
Occupancy by Household Size in Lumberport
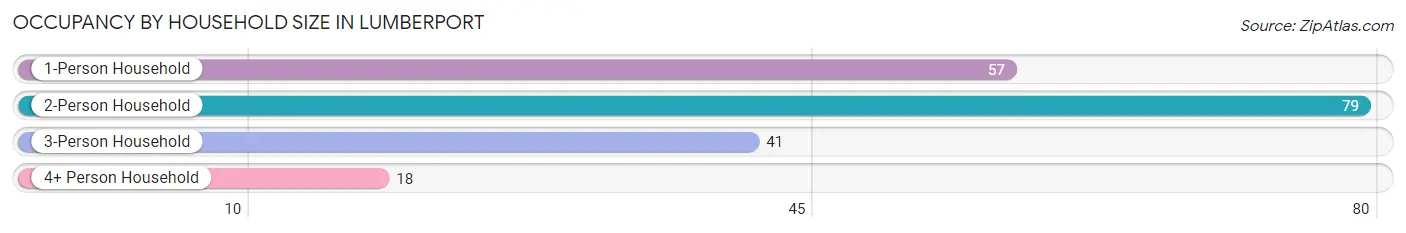
| Household Size | # Housing Units | % Housing Units |
| 1-Person Household | 57 | 29.2% |
| 2-Person Household | 79 | 40.5% |
| 3-Person Household | 41 | 21.0% |
| 4+ Person Household | 18 | 9.2% |
| Total Housing Units | 195 | 100.0% |
Occupancy by Ownership by Household Size in Lumberport
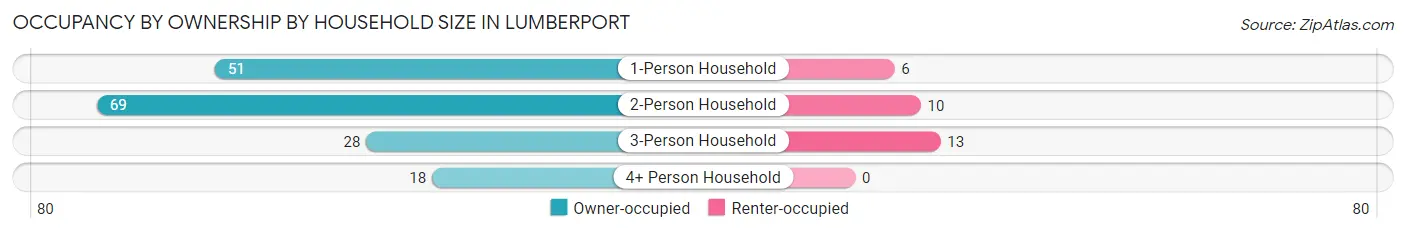
| Household Size | Owner-occupied | Renter-occupied |
| 1-Person Household | 51 (89.5%) | 6 (10.5%) |
| 2-Person Household | 69 (87.3%) | 10 (12.7%) |
| 3-Person Household | 28 (68.3%) | 13 (31.7%) |
| 4+ Person Household | 18 (100.0%) | 0 (0.0%) |
| Total Housing Units | 166 (85.1%) | 29 (14.9%) |
Occupancy by Educational Attainment in Lumberport
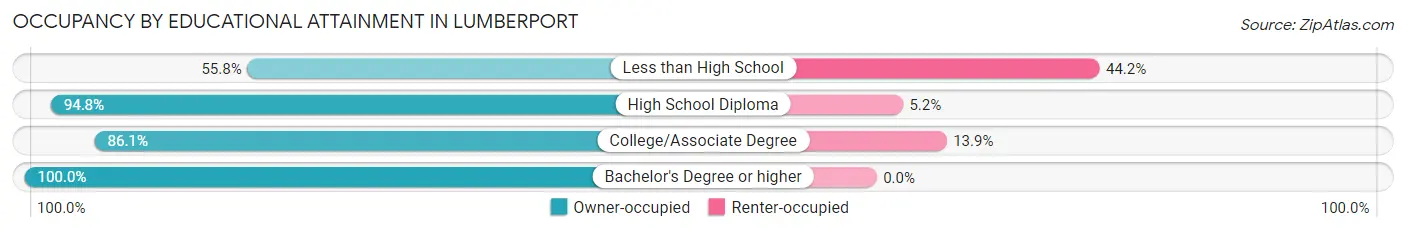
| Household Size | Owner-occupied | Renter-occupied |
| Less than High School | 24 (55.8%) | 19 (44.2%) |
| High School Diploma | 91 (94.8%) | 5 (5.2%) |
| College/Associate Degree | 31 (86.1%) | 5 (13.9%) |
| Bachelor's Degree or higher | 20 (100.0%) | 0 (0.0%) |
Occupancy by Age of Householder in Lumberport
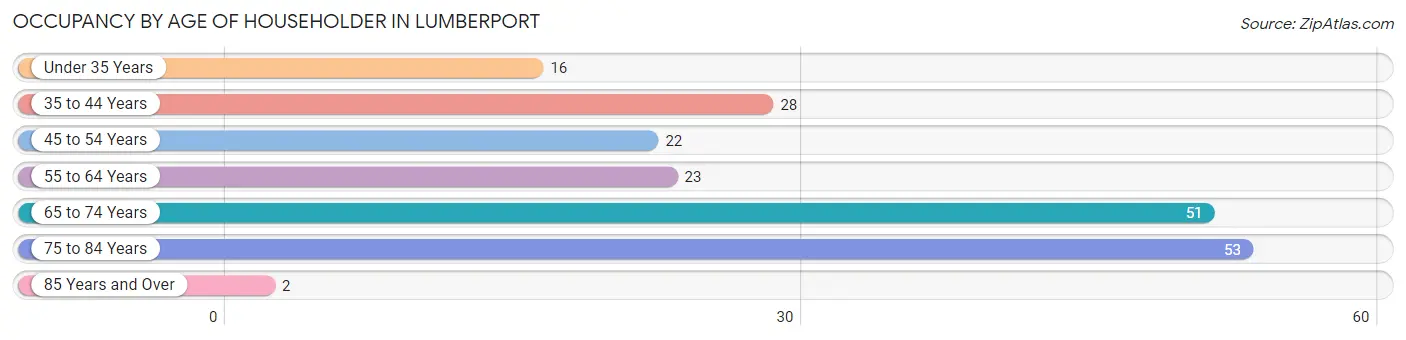
| Age Bracket | # Households | % Households |
| Under 35 Years | 16 | 8.2% |
| 35 to 44 Years | 28 | 14.4% |
| 45 to 54 Years | 22 | 11.3% |
| 55 to 64 Years | 23 | 11.8% |
| 65 to 74 Years | 51 | 26.2% |
| 75 to 84 Years | 53 | 27.2% |
| 85 Years and Over | 2 | 1.0% |
| Total | 195 | 100.0% |
Housing Finances in Lumberport
Median Income by Occupancy in Lumberport
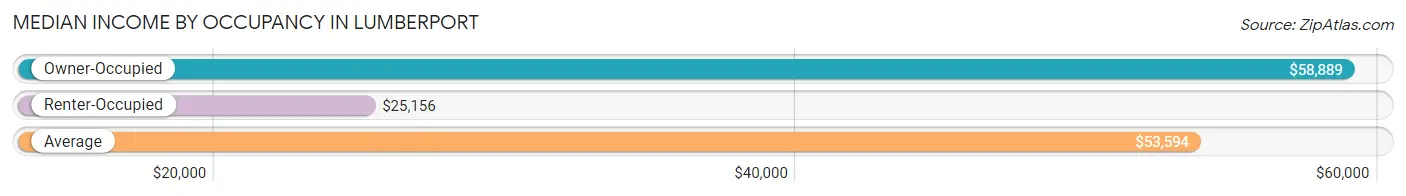
| Occupancy Type | # Households | Median Income |
| Owner-Occupied | 166 (85.1%) | $58,889 |
| Renter-Occupied | 29 (14.9%) | $25,156 |
| Average | 195 (100.0%) | $53,594 |
Occupancy by Householder Income Bracket in Lumberport
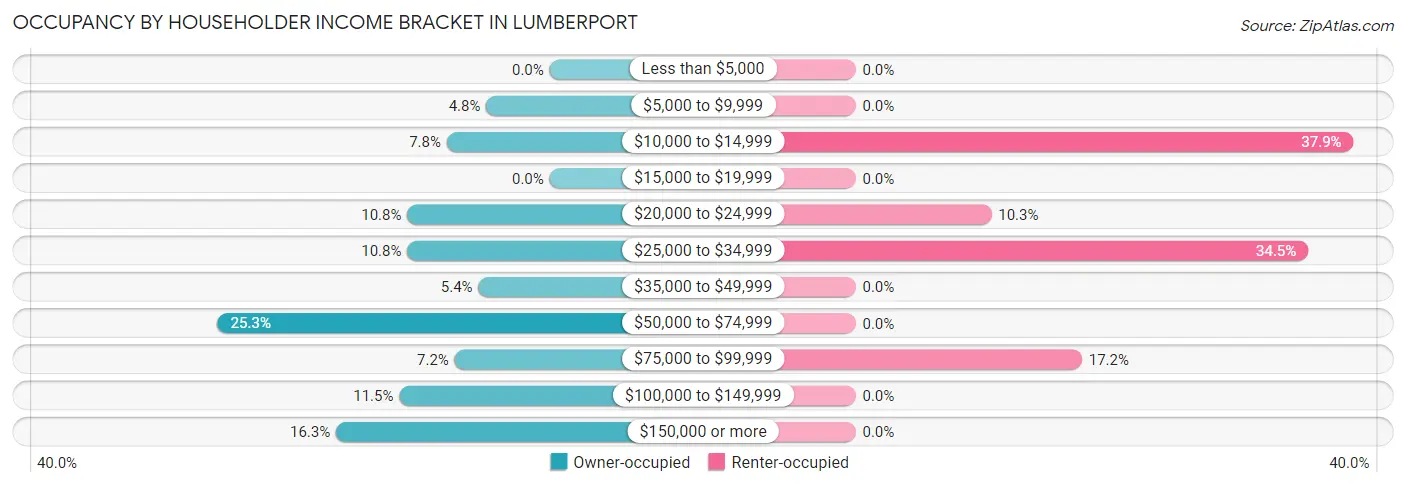
| Income Bracket | Owner-occupied | Renter-occupied |
| Less than $5,000 | 0 (0.0%) | 0 (0.0%) |
| $5,000 to $9,999 | 8 (4.8%) | 0 (0.0%) |
| $10,000 to $14,999 | 13 (7.8%) | 11 (37.9%) |
| $15,000 to $19,999 | 0 (0.0%) | 0 (0.0%) |
| $20,000 to $24,999 | 18 (10.8%) | 3 (10.3%) |
| $25,000 to $34,999 | 18 (10.8%) | 10 (34.5%) |
| $35,000 to $49,999 | 9 (5.4%) | 0 (0.0%) |
| $50,000 to $74,999 | 42 (25.3%) | 0 (0.0%) |
| $75,000 to $99,999 | 12 (7.2%) | 5 (17.2%) |
| $100,000 to $149,999 | 19 (11.5%) | 0 (0.0%) |
| $150,000 or more | 27 (16.3%) | 0 (0.0%) |
| Total | 166 (100.0%) | 29 (100.0%) |
Monthly Housing Cost Tiers in Lumberport
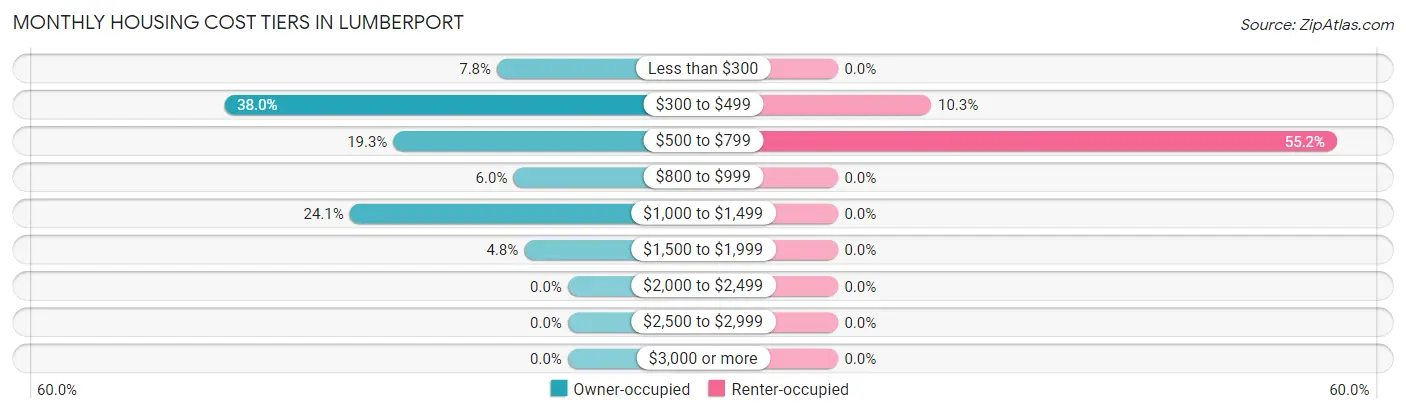
| Monthly Cost | Owner-occupied | Renter-occupied |
| Less than $300 | 13 (7.8%) | 0 (0.0%) |
| $300 to $499 | 63 (38.0%) | 3 (10.3%) |
| $500 to $799 | 32 (19.3%) | 16 (55.2%) |
| $800 to $999 | 10 (6.0%) | 0 (0.0%) |
| $1,000 to $1,499 | 40 (24.1%) | 0 (0.0%) |
| $1,500 to $1,999 | 8 (4.8%) | 0 (0.0%) |
| $2,000 to $2,499 | 0 (0.0%) | 0 (0.0%) |
| $2,500 to $2,999 | 0 (0.0%) | 0 (0.0%) |
| $3,000 or more | 0 (0.0%) | 0 (0.0%) |
| Total | 166 (100.0%) | 29 (100.0%) |
Physical Housing Characteristics in Lumberport
Housing Structures in Lumberport
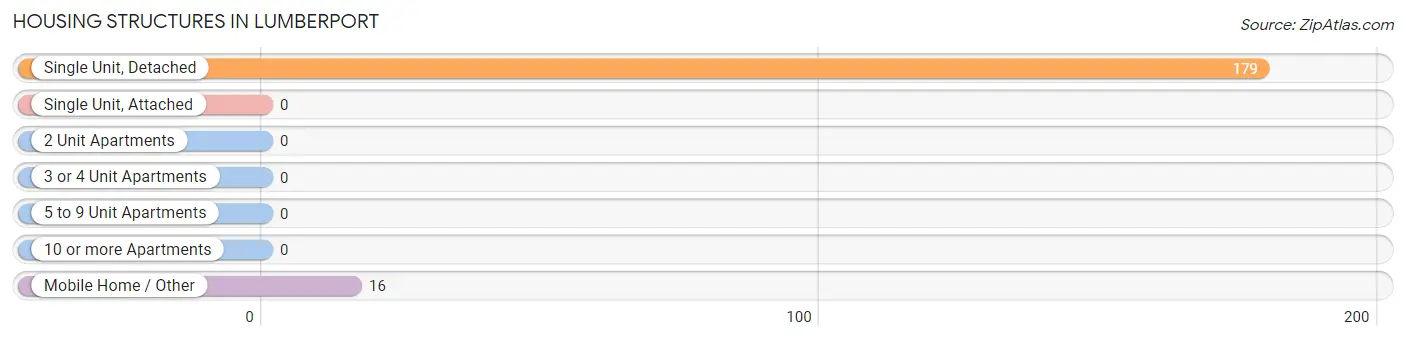
| Structure Type | # Housing Units | % Housing Units |
| Single Unit, Detached | 179 | 91.8% |
| Single Unit, Attached | 0 | 0.0% |
| 2 Unit Apartments | 0 | 0.0% |
| 3 or 4 Unit Apartments | 0 | 0.0% |
| 5 to 9 Unit Apartments | 0 | 0.0% |
| 10 or more Apartments | 0 | 0.0% |
| Mobile Home / Other | 16 | 8.2% |
| Total | 195 | 100.0% |
Housing Structures by Occupancy in Lumberport
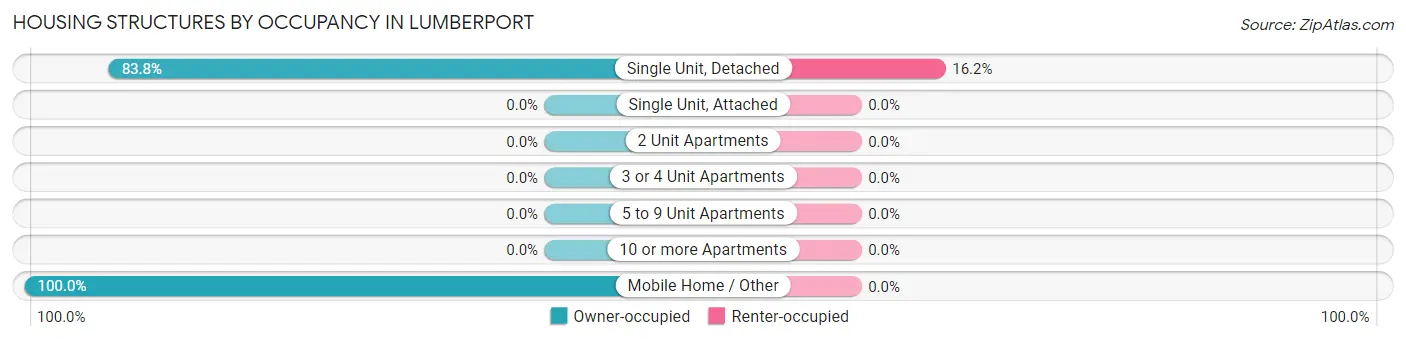
| Structure Type | Owner-occupied | Renter-occupied |
| Single Unit, Detached | 150 (83.8%) | 29 (16.2%) |
| Single Unit, Attached | 0 (0.0%) | 0 (0.0%) |
| 2 Unit Apartments | 0 (0.0%) | 0 (0.0%) |
| 3 or 4 Unit Apartments | 0 (0.0%) | 0 (0.0%) |
| 5 to 9 Unit Apartments | 0 (0.0%) | 0 (0.0%) |
| 10 or more Apartments | 0 (0.0%) | 0 (0.0%) |
| Mobile Home / Other | 16 (100.0%) | 0 (0.0%) |
| Total | 166 (85.1%) | 29 (14.9%) |
Housing Structures by Number of Rooms in Lumberport
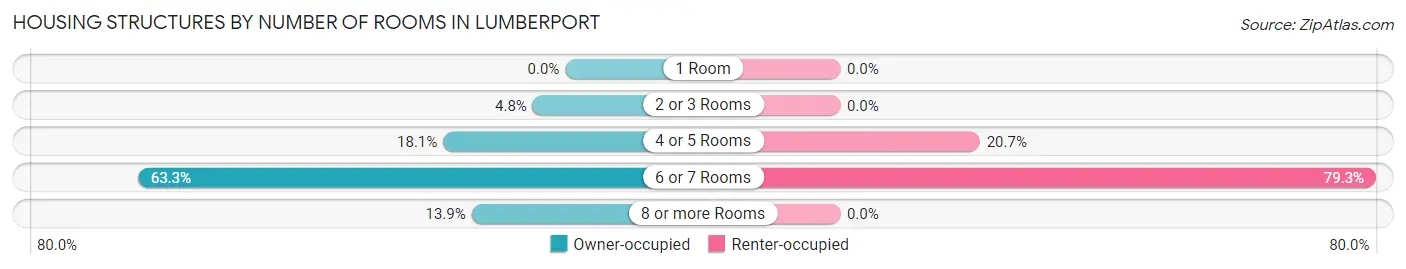
| Number of Rooms | Owner-occupied | Renter-occupied |
| 1 Room | 0 (0.0%) | 0 (0.0%) |
| 2 or 3 Rooms | 8 (4.8%) | 0 (0.0%) |
| 4 or 5 Rooms | 30 (18.1%) | 6 (20.7%) |
| 6 or 7 Rooms | 105 (63.2%) | 23 (79.3%) |
| 8 or more Rooms | 23 (13.9%) | 0 (0.0%) |
| Total | 166 (100.0%) | 29 (100.0%) |
Housing Structure by Heating Type in Lumberport
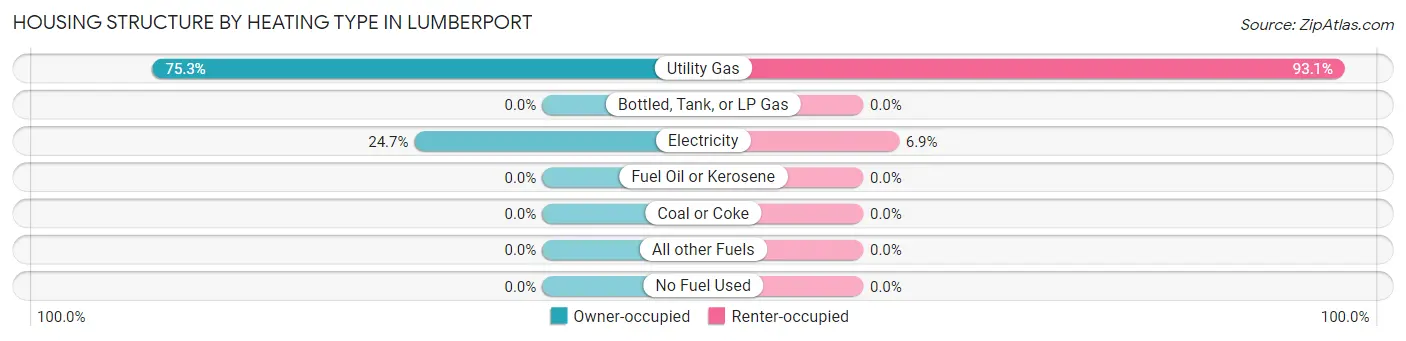
| Heating Type | Owner-occupied | Renter-occupied |
| Utility Gas | 125 (75.3%) | 27 (93.1%) |
| Bottled, Tank, or LP Gas | 0 (0.0%) | 0 (0.0%) |
| Electricity | 41 (24.7%) | 2 (6.9%) |
| Fuel Oil or Kerosene | 0 (0.0%) | 0 (0.0%) |
| Coal or Coke | 0 (0.0%) | 0 (0.0%) |
| All other Fuels | 0 (0.0%) | 0 (0.0%) |
| No Fuel Used | 0 (0.0%) | 0 (0.0%) |
| Total | 166 (100.0%) | 29 (100.0%) |
Household Vehicle Usage in Lumberport
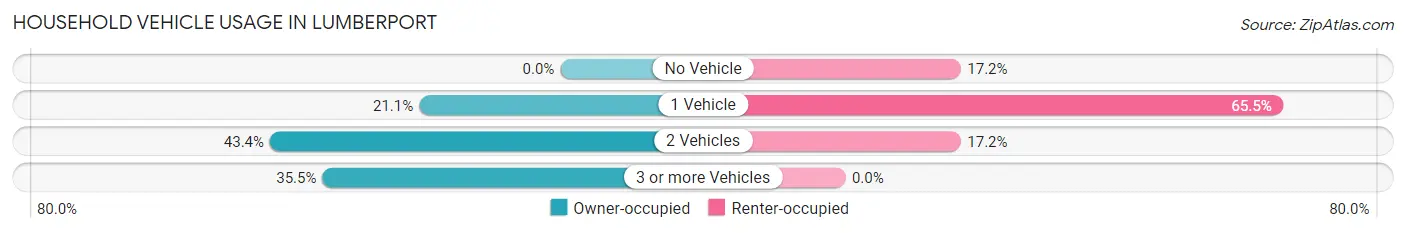
| Vehicles per Household | Owner-occupied | Renter-occupied |
| No Vehicle | 0 (0.0%) | 5 (17.2%) |
| 1 Vehicle | 35 (21.1%) | 19 (65.5%) |
| 2 Vehicles | 72 (43.4%) | 5 (17.2%) |
| 3 or more Vehicles | 59 (35.5%) | 0 (0.0%) |
| Total | 166 (100.0%) | 29 (100.0%) |
Real Estate & Mortgages in Lumberport
Real Estate and Mortgage Overview in Lumberport
| Characteristic | Without Mortgage | With Mortgage |
| Housing Units | 101 | 65 |
| Median Property Value | $120,600 | $113,500 |
| Median Household Income | $35,536 | $25 |
| Monthly Housing Costs | $402 | $0 |
| Real Estate Taxes | $540 | $0 |
Property Value by Mortgage Status in Lumberport
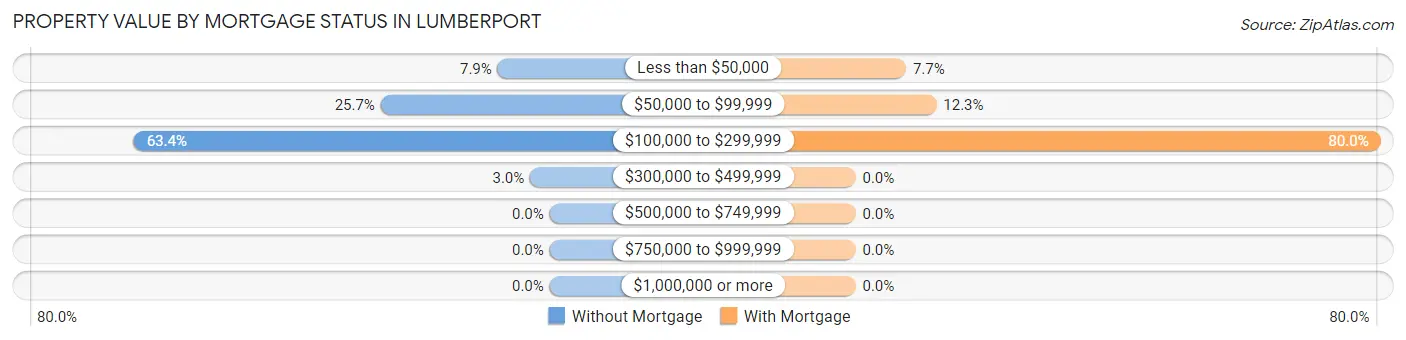
| Property Value | Without Mortgage | With Mortgage |
| Less than $50,000 | 8 (7.9%) | 5 (7.7%) |
| $50,000 to $99,999 | 26 (25.7%) | 8 (12.3%) |
| $100,000 to $299,999 | 64 (63.4%) | 52 (80.0%) |
| $300,000 to $499,999 | 3 (3.0%) | 0 (0.0%) |
| $500,000 to $749,999 | 0 (0.0%) | 0 (0.0%) |
| $750,000 to $999,999 | 0 (0.0%) | 0 (0.0%) |
| $1,000,000 or more | 0 (0.0%) | 0 (0.0%) |
| Total | 101 (100.0%) | 65 (100.0%) |
Household Income by Mortgage Status in Lumberport
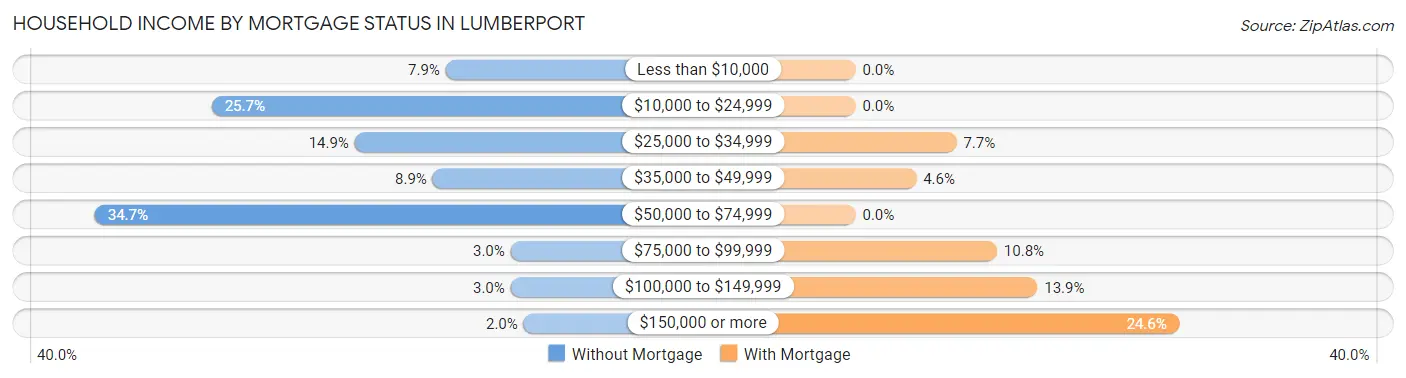
| Household Income | Without Mortgage | With Mortgage |
| Less than $10,000 | 8 (7.9%) | 0 (0.0%) |
| $10,000 to $24,999 | 26 (25.7%) | 0 (0.0%) |
| $25,000 to $34,999 | 15 (14.8%) | 5 (7.7%) |
| $35,000 to $49,999 | 9 (8.9%) | 3 (4.6%) |
| $50,000 to $74,999 | 35 (34.6%) | 0 (0.0%) |
| $75,000 to $99,999 | 3 (3.0%) | 7 (10.8%) |
| $100,000 to $149,999 | 3 (3.0%) | 9 (13.9%) |
| $150,000 or more | 2 (2.0%) | 16 (24.6%) |
| Total | 101 (100.0%) | 65 (100.0%) |
Property Value to Household Income Ratio in Lumberport
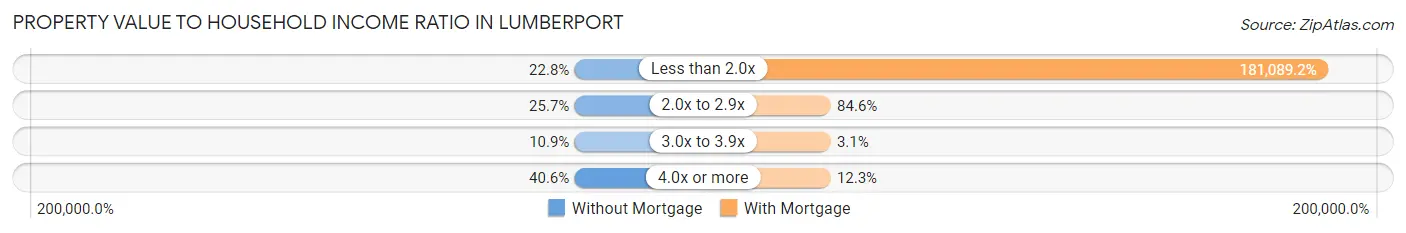
| Value-to-Income Ratio | Without Mortgage | With Mortgage |
| Less than 2.0x | 23 (22.8%) | 117,708 (181,089.2%) |
| 2.0x to 2.9x | 26 (25.7%) | 55 (84.6%) |
| 3.0x to 3.9x | 11 (10.9%) | 2 (3.1%) |
| 4.0x or more | 41 (40.6%) | 8 (12.3%) |
| Total | 101 (100.0%) | 65 (100.0%) |
Real Estate Taxes by Mortgage Status in Lumberport
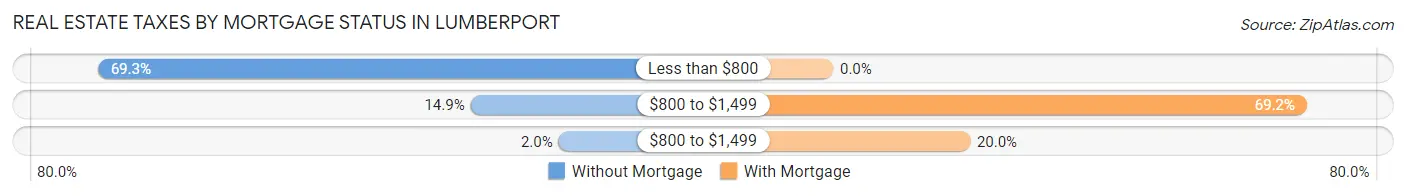
| Property Taxes | Without Mortgage | With Mortgage |
| Less than $800 | 70 (69.3%) | 0 (0.0%) |
| $800 to $1,499 | 15 (14.8%) | 45 (69.2%) |
| $800 to $1,499 | 2 (2.0%) | 13 (20.0%) |
| Total | 101 (100.0%) | 65 (100.0%) |
Health & Disability in Lumberport
Health Insurance Coverage by Age in Lumberport
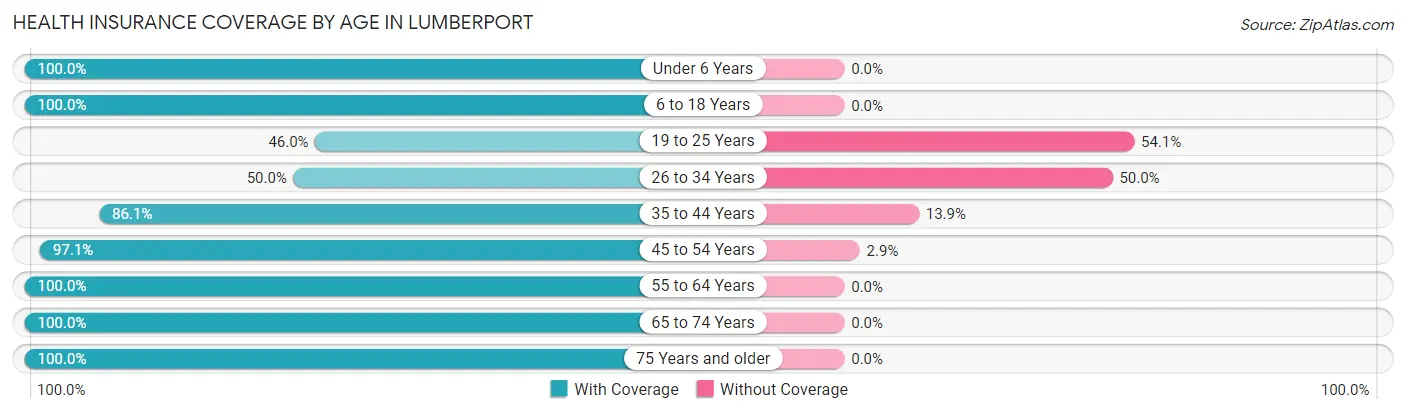
| Age Bracket | With Coverage | Without Coverage |
| Under 6 Years | 30 (100.0%) | 0 (0.0%) |
| 6 to 18 Years | 43 (100.0%) | 0 (0.0%) |
| 19 to 25 Years | 17 (46.0%) | 20 (54.0%) |
| 26 to 34 Years | 40 (50.0%) | 40 (50.0%) |
| 35 to 44 Years | 31 (86.1%) | 5 (13.9%) |
| 45 to 54 Years | 340 (97.1%) | 10 (2.9%) |
| 55 to 64 Years | 45 (100.0%) | 0 (0.0%) |
| 65 to 74 Years | 73 (100.0%) | 0 (0.0%) |
| 75 Years and older | 89 (100.0%) | 0 (0.0%) |
| Total | 708 (90.4%) | 75 (9.6%) |
Health Insurance Coverage by Citizenship Status in Lumberport

| Citizenship Status | With Coverage | Without Coverage |
| Native Born | 30 (100.0%) | 0 (0.0%) |
| Foreign Born, Citizen | 43 (100.0%) | 0 (0.0%) |
| Foreign Born, not a Citizen | 17 (46.0%) | 20 (54.0%) |
Health Insurance Coverage by Household Income in Lumberport
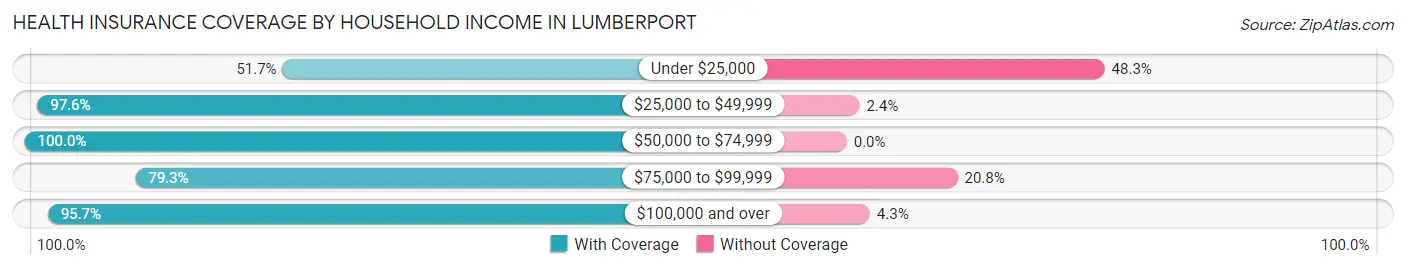
| Household Income | With Coverage | Without Coverage |
| Under $25,000 | 46 (51.7%) | 43 (48.3%) |
| $25,000 to $49,999 | 82 (97.6%) | 2 (2.4%) |
| $50,000 to $74,999 | 118 (100.0%) | 0 (0.0%) |
| $75,000 to $99,999 | 42 (79.2%) | 11 (20.7%) |
| $100,000 and over | 420 (95.7%) | 19 (4.3%) |
Public vs Private Health Insurance Coverage by Age in Lumberport
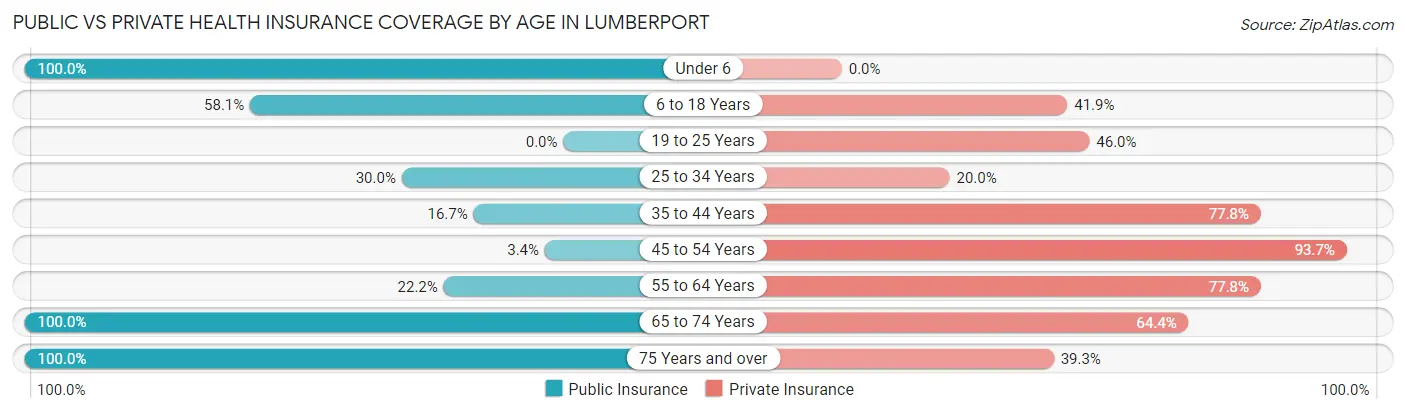
| Age Bracket | Public Insurance | Private Insurance |
| Under 6 | 30 (100.0%) | 0 (0.0%) |
| 6 to 18 Years | 25 (58.1%) | 18 (41.9%) |
| 19 to 25 Years | 0 (0.0%) | 17 (46.0%) |
| 25 to 34 Years | 24 (30.0%) | 16 (20.0%) |
| 35 to 44 Years | 6 (16.7%) | 28 (77.8%) |
| 45 to 54 Years | 12 (3.4%) | 328 (93.7%) |
| 55 to 64 Years | 10 (22.2%) | 35 (77.8%) |
| 65 to 74 Years | 73 (100.0%) | 47 (64.4%) |
| 75 Years and over | 89 (100.0%) | 35 (39.3%) |
| Total | 269 (34.4%) | 524 (66.9%) |
Disability Status by Sex by Age in Lumberport
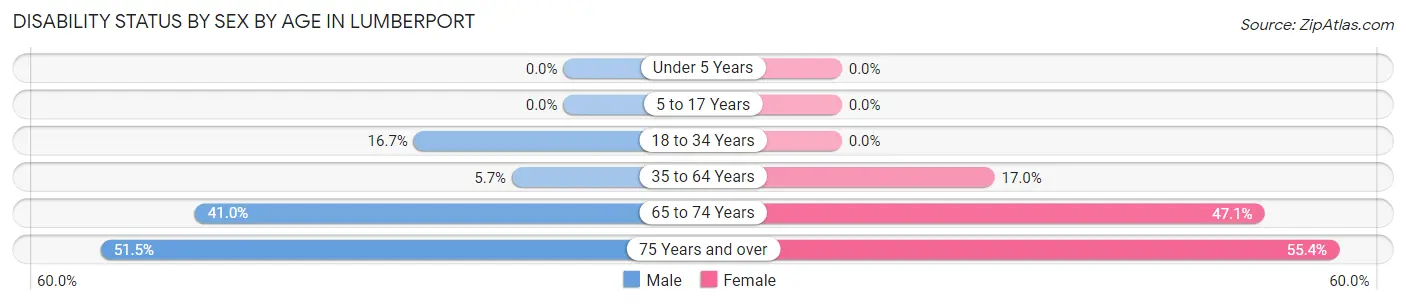
| Age Bracket | Male | Female |
| Under 5 Years | 0 (0.0%) | 0 (0.0%) |
| 5 to 17 Years | 0 (0.0%) | 0 (0.0%) |
| 18 to 34 Years | 11 (16.7%) | 0 (0.0%) |
| 35 to 64 Years | 22 (5.7%) | 8 (17.0%) |
| 65 to 74 Years | 16 (41.0%) | 16 (47.1%) |
| 75 Years and over | 17 (51.5%) | 31 (55.4%) |
Disability Class by Sex by Age in Lumberport
Disability Class: Hearing Difficulty
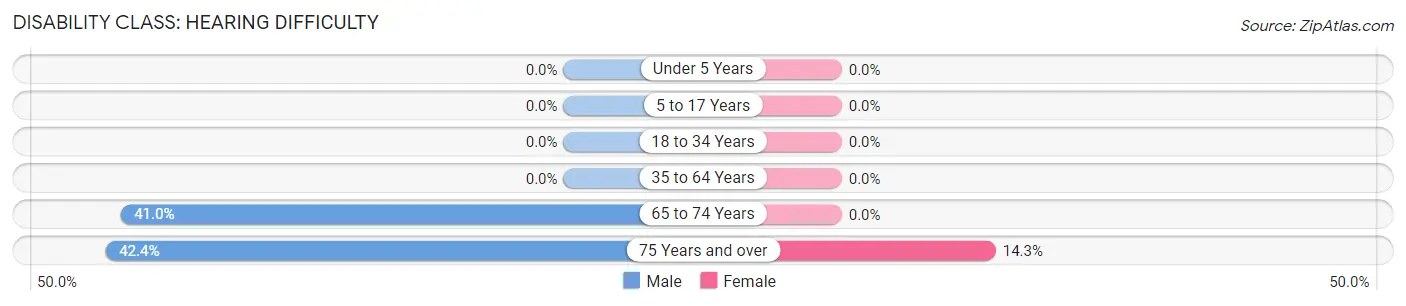
| Age Bracket | Male | Female |
| Under 5 Years | 0 (0.0%) | 0 (0.0%) |
| 5 to 17 Years | 0 (0.0%) | 0 (0.0%) |
| 18 to 34 Years | 0 (0.0%) | 0 (0.0%) |
| 35 to 64 Years | 0 (0.0%) | 0 (0.0%) |
| 65 to 74 Years | 16 (41.0%) | 0 (0.0%) |
| 75 Years and over | 14 (42.4%) | 8 (14.3%) |
Disability Class: Vision Difficulty
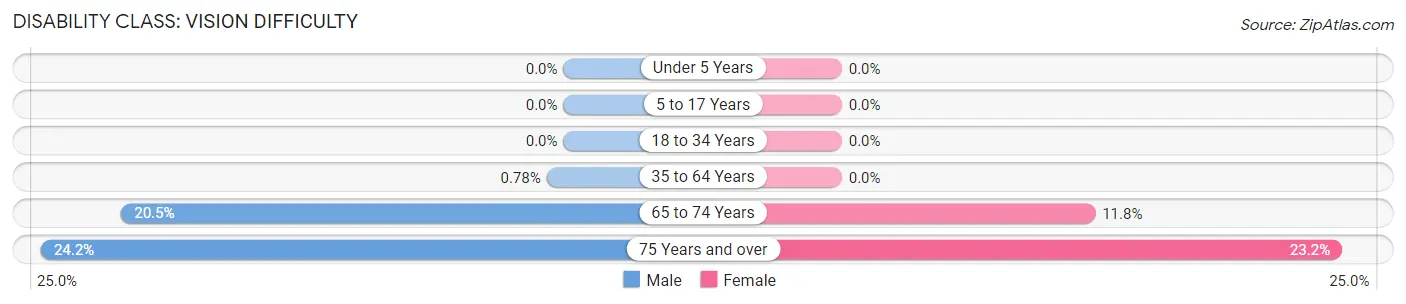
| Age Bracket | Male | Female |
| Under 5 Years | 0 (0.0%) | 0 (0.0%) |
| 5 to 17 Years | 0 (0.0%) | 0 (0.0%) |
| 18 to 34 Years | 0 (0.0%) | 0 (0.0%) |
| 35 to 64 Years | 3 (0.8%) | 0 (0.0%) |
| 65 to 74 Years | 8 (20.5%) | 4 (11.8%) |
| 75 Years and over | 8 (24.2%) | 13 (23.2%) |
Disability Class: Cognitive Difficulty
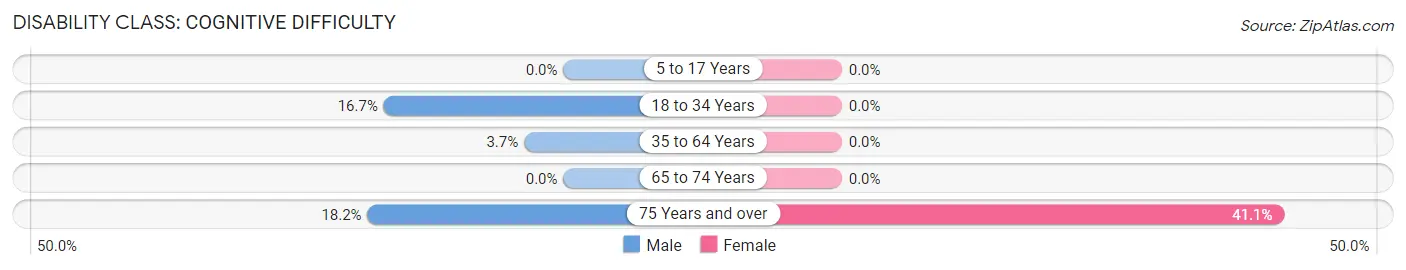
| Age Bracket | Male | Female |
| 5 to 17 Years | 0 (0.0%) | 0 (0.0%) |
| 18 to 34 Years | 11 (16.7%) | 0 (0.0%) |
| 35 to 64 Years | 14 (3.6%) | 0 (0.0%) |
| 65 to 74 Years | 0 (0.0%) | 0 (0.0%) |
| 75 Years and over | 6 (18.2%) | 23 (41.1%) |
Disability Class: Ambulatory Difficulty
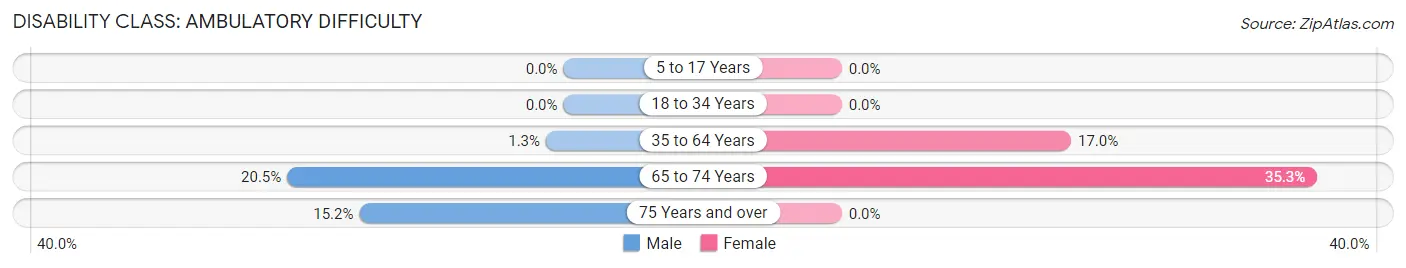
| Age Bracket | Male | Female |
| 5 to 17 Years | 0 (0.0%) | 0 (0.0%) |
| 18 to 34 Years | 0 (0.0%) | 0 (0.0%) |
| 35 to 64 Years | 5 (1.3%) | 8 (17.0%) |
| 65 to 74 Years | 8 (20.5%) | 12 (35.3%) |
| 75 Years and over | 5 (15.1%) | 0 (0.0%) |
Disability Class: Self-Care Difficulty
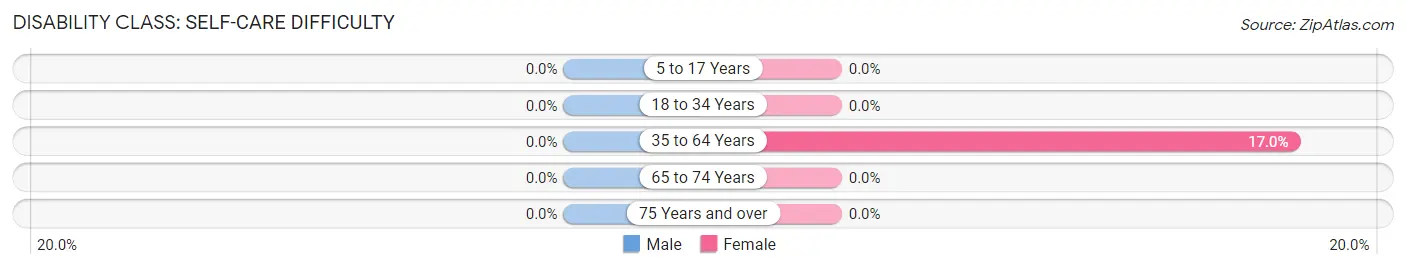
| Age Bracket | Male | Female |
| 5 to 17 Years | 0 (0.0%) | 0 (0.0%) |
| 18 to 34 Years | 0 (0.0%) | 0 (0.0%) |
| 35 to 64 Years | 0 (0.0%) | 8 (17.0%) |
| 65 to 74 Years | 0 (0.0%) | 0 (0.0%) |
| 75 Years and over | 0 (0.0%) | 0 (0.0%) |
Technology Access in Lumberport
Computing Device Access in Lumberport
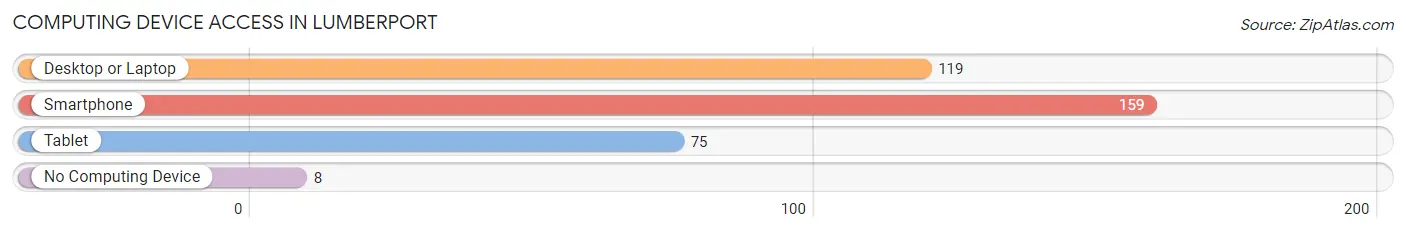
| Device Type | # Households | % Households |
| Desktop or Laptop | 119 | 61.0% |
| Smartphone | 159 | 81.5% |
| Tablet | 75 | 38.5% |
| No Computing Device | 8 | 4.1% |
| Total | 195 | 100.0% |
Internet Access in Lumberport
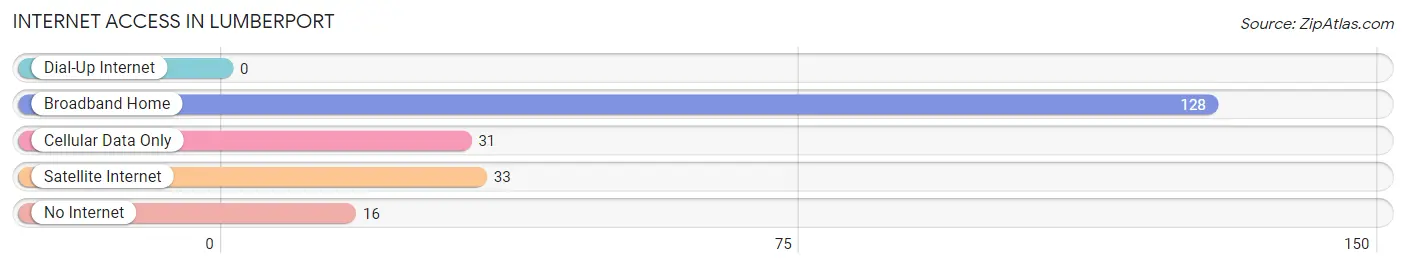
| Internet Type | # Households | % Households |
| Dial-Up Internet | 0 | 0.0% |
| Broadband Home | 128 | 65.6% |
| Cellular Data Only | 31 | 15.9% |
| Satellite Internet | 33 | 16.9% |
| No Internet | 16 | 8.2% |
| Total | 195 | 100.0% |
Lumberport Summary
Lumberport is a small town located in Harrison County, West Virginia. It is situated along the West Fork River, and is part of the Clarksburg, WV Metropolitan Statistical Area. The town has a population of approximately 1,000 people, and is known for its small-town charm and friendly atmosphere.
Geography
Lumberport is located in the northern part of Harrison County, West Virginia. It is situated along the West Fork River, and is part of the Clarksburg, WV Metropolitan Statistical Area. The town is located at an elevation of 890 feet above sea level. The town is surrounded by rolling hills and forests, and is located near the Monongahela National Forest.
The climate in Lumberport is humid continental, with hot summers and cold winters. The average annual temperature is around 50 degrees Fahrenheit, and the average annual precipitation is around 40 inches.
Economy
The economy of Lumberport is largely based on agriculture and tourism. The town is home to several small farms, and the surrounding area is known for its production of apples, peaches, and other fruits and vegetables. The town is also home to several small businesses, including a grocery store, a hardware store, and a few restaurants.
Tourism is also an important part of the local economy. The town is home to several historic sites, including the Lumberport Covered Bridge, which was built in 1876. The town is also home to several parks and recreational areas, including the Lumberport Recreation Area, which offers camping, fishing, and hiking opportunities.
Demographics
As of the 2010 census, the population of Lumberport was 1,000 people. The racial makeup of the town was 97.2% White, 0.7% African American, 0.2% Native American, 0.2% Asian, 0.2% from other races, and 1.7% from two or more races. The median household income was $30,000, and the median family income was $35,000.
Conclusion
Lumberport is a small town located in Harrison County, West Virginia. It is situated along the West Fork River, and is part of the Clarksburg, WV Metropolitan Statistical Area. The town has a population of approximately 1,000 people, and is known for its small-town charm and friendly atmosphere. The economy of Lumberport is largely based on agriculture and tourism, and the town is home to several small businesses and historic sites. The population of Lumberport is predominantly White, with a median household income of $30,000 and a median family income of $35,000.
Common Questions
What is Per Capita Income in Lumberport?
Per Capita income in Lumberport is $36,983.
What is the Median Family Income in Lumberport?
Median Family Income in Lumberport is $71,000.
What is the Median Household income in Lumberport?
Median Household Income in Lumberport is $53,594.
What is Income or Wage Gap in Lumberport?
Income or Wage Gap in Lumberport is 54.2%.
Women in Lumberport earn 45.8 cents for every dollar earned by a man.
What is Inequality or Gini Index in Lumberport?
Inequality or Gini Index in Lumberport is 0.42.
What is the Total Population of Lumberport?
Total Population of Lumberport is 783.
What is the Total Male Population of Lumberport?
Total Male Population of Lumberport is 536.
What is the Total Female Population of Lumberport?
Total Female Population of Lumberport is 247.
What is the Ratio of Males per 100 Females in Lumberport?
There are 217.00 Males per 100 Females in Lumberport.
What is the Ratio of Females per 100 Males in Lumberport?
There are 46.08 Females per 100 Males in Lumberport.
What is the Median Population Age in Lumberport?
Median Population Age in Lumberport is 51.1 Years.
What is the Average Family Size in Lumberport
Average Family Size in Lumberport is 5.2 People.
What is the Average Household Size in Lumberport
Average Household Size in Lumberport is 4.0 People.
How Large is the Labor Force in Lumberport?
There are 470 People in the Labor Forcein in Lumberport.
What is the Percentage of People in the Labor Force in Lumberport?
65.8% of People are in the Labor Force in Lumberport.