Lubeck, WV Map & Demographics
Lubeck Map
Lubeck Overview
$37,011
PER CAPITA INCOME
$73,000
AVG FAMILY INCOME
$67,282
AVG HOUSEHOLD INCOME
48.8%
WAGE / INCOME GAP [ % ]
51.2¢/ $1
WAGE / INCOME GAP [ $ ]
0.31
INEQUALITY / GINI INDEX
1,290
TOTAL POPULATION
699
MALE POPULATION
591
FEMALE POPULATION
118.27
MALES / 100 FEMALES
84.55
FEMALES / 100 MALES
52.3
MEDIAN AGE
2.3
AVG FAMILY SIZE
2.1
AVG HOUSEHOLD SIZE
439
LABOR FORCE [ PEOPLE ]
41.8%
PERCENT IN LABOR FORCE
11.8%
UNEMPLOYMENT RATE
Income in Lubeck
Income Overview in Lubeck
Per Capita Income in Lubeck is $37,011, while median incomes of families and households are $73,000 and $67,282 respectively.
| Characteristic | Number | Measure |
| Per Capita Income | 1,290 | $37,011 |
| Median Family Income | 462 | $73,000 |
| Mean Family Income | 462 | $84,288 |
| Median Household Income | 610 | $67,282 |
| Mean Household Income | 610 | $77,778 |
| Income Deficit | 462 | $0 |
| Wage / Income Gap (%) | 1,290 | 48.80% |
| Wage / Income Gap ($) | 1,290 | 51.20¢ per $1 |
| Gini / Inequality Index | 1,290 | 0.31 |
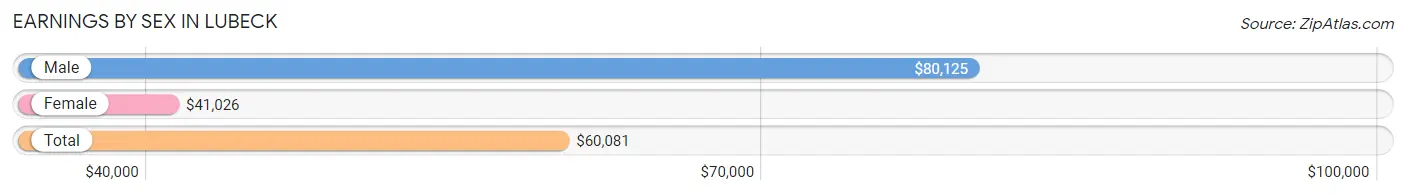
Earnings by Sex in Lubeck
Average Earnings in Lubeck are $60,081, $80,125 for men and $41,026 for women, a difference of 48.8%.
| Sex | Number | Average Earnings |
| Male | 261 (55.8%) | $80,125 |
| Female | 207 (44.2%) | $41,026 |
| Total | 468 (100.0%) | $60,081 |
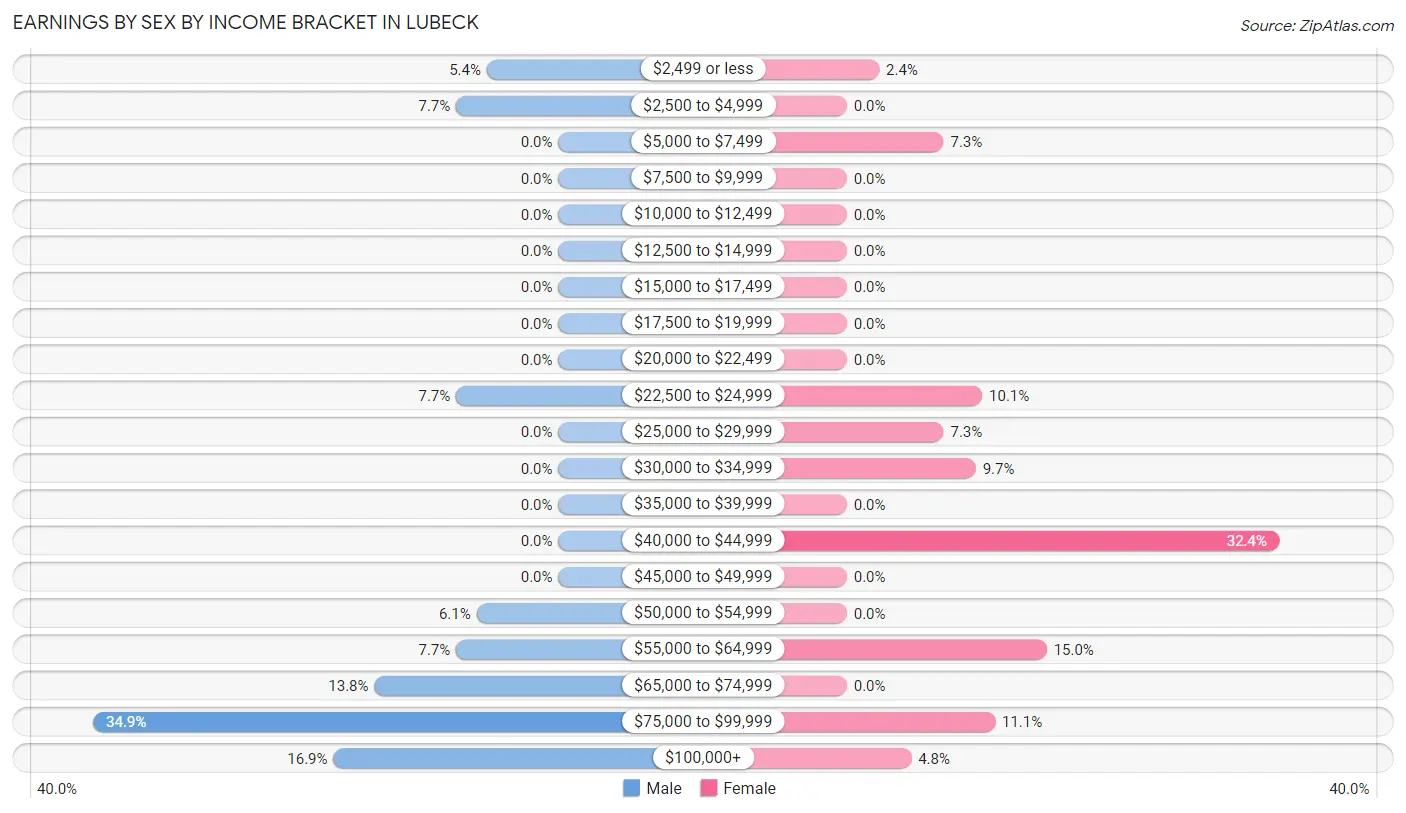
Earnings by Sex by Income Bracket in Lubeck
The most common earnings brackets in Lubeck are $75,000 to $99,999 for men (91 | 34.9%) and $40,000 to $44,999 for women (67 | 32.4%).
| Income | Male | Female |
| $2,499 or less | 14 (5.4%) | 5 (2.4%) |
| $2,500 to $4,999 | 20 (7.7%) | 0 (0.0%) |
| $5,000 to $7,499 | 0 (0.0%) | 15 (7.2%) |
| $7,500 to $9,999 | 0 (0.0%) | 0 (0.0%) |
| $10,000 to $12,499 | 0 (0.0%) | 0 (0.0%) |
| $12,500 to $14,999 | 0 (0.0%) | 0 (0.0%) |
| $15,000 to $17,499 | 0 (0.0%) | 0 (0.0%) |
| $17,500 to $19,999 | 0 (0.0%) | 0 (0.0%) |
| $20,000 to $22,499 | 0 (0.0%) | 0 (0.0%) |
| $22,500 to $24,999 | 20 (7.7%) | 21 (10.1%) |
| $25,000 to $29,999 | 0 (0.0%) | 15 (7.2%) |
| $30,000 to $34,999 | 0 (0.0%) | 20 (9.7%) |
| $35,000 to $39,999 | 0 (0.0%) | 0 (0.0%) |
| $40,000 to $44,999 | 0 (0.0%) | 67 (32.4%) |
| $45,000 to $49,999 | 0 (0.0%) | 0 (0.0%) |
| $50,000 to $54,999 | 16 (6.1%) | 0 (0.0%) |
| $55,000 to $64,999 | 20 (7.7%) | 31 (15.0%) |
| $65,000 to $74,999 | 36 (13.8%) | 0 (0.0%) |
| $75,000 to $99,999 | 91 (34.9%) | 23 (11.1%) |
| $100,000+ | 44 (16.9%) | 10 (4.8%) |
| Total | 261 (100.0%) | 207 (100.0%) |
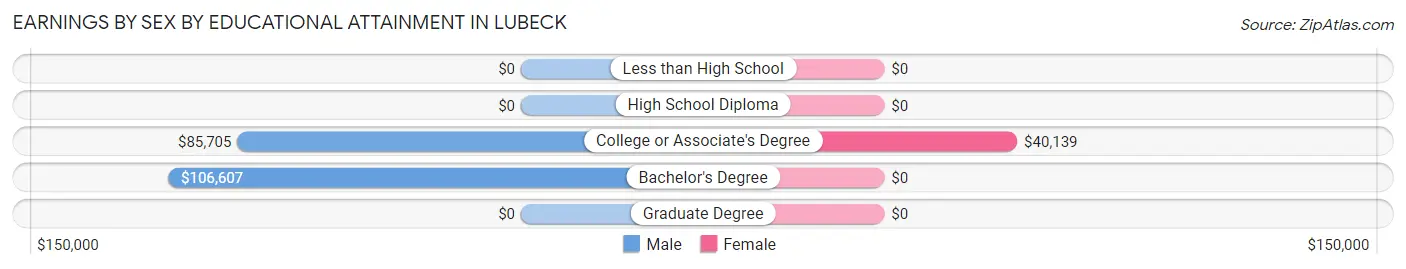
Earnings by Sex by Educational Attainment in Lubeck
Average earnings in Lubeck are $80,125 for men and $41,399 for women, a difference of 48.3%. Men with an educational attainment of bachelor's degree enjoy the highest average annual earnings of $106,607, while those with college or associate's degree education earn the least with $85,705. Women with an educational attainment of college or associate's degree earn the most with the average annual earnings of $40,139, while those with college or associate's degree education have the smallest earnings of $40,139.
| Educational Attainment | Male Income | Female Income |
| Less than High School | - | - |
| High School Diploma | - | - |
| College or Associate's Degree | $85,705 | $40,139 |
| Bachelor's Degree | $106,607 | $0 |
| Graduate Degree | - | - |
| Total | $80,125 | $41,399 |
Family Income in Lubeck
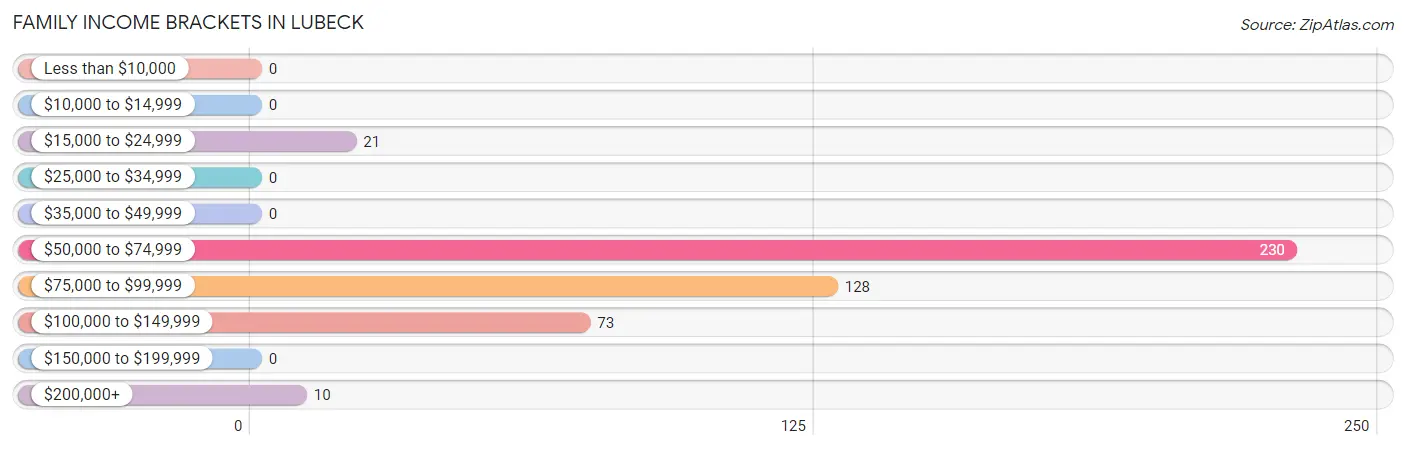
Family Income Brackets in Lubeck
According to the Lubeck family income data, there are 230 families falling into the $50,000 to $74,999 income range, which is the most common income bracket and makes up 49.8% of all families.
| Income Bracket | # Families | % Families |
| Less than $10,000 | 0 | 0.0% |
| $10,000 to $14,999 | 0 | 0.0% |
| $15,000 to $24,999 | 21 | 4.5% |
| $25,000 to $34,999 | 0 | 0.0% |
| $35,000 to $49,999 | 0 | 0.0% |
| $50,000 to $74,999 | 230 | 49.8% |
| $75,000 to $99,999 | 128 | 27.7% |
| $100,000 to $149,999 | 73 | 15.8% |
| $150,000 to $199,999 | 0 | 0.0% |
| $200,000+ | 10 | 2.2% |
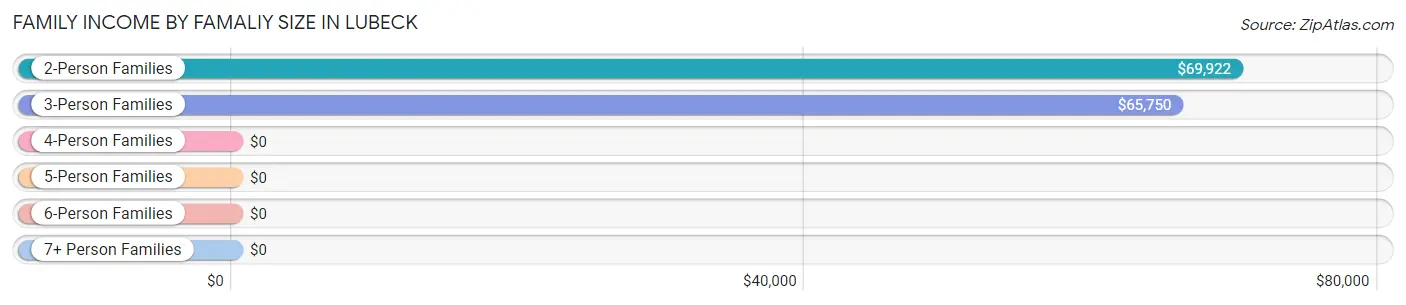
Family Income by Famaliy Size in Lubeck
2-person families (349 | 75.5%) account for the highest median family income in Lubeck with $69,922 per family, while 2-person families (349 | 75.5%) have the highest median income of $34,961 per family member.
| Income Bracket | # Families | Median Income |
| 2-Person Families | 349 (75.5%) | $69,922 |
| 3-Person Families | 74 (16.0%) | $65,750 |
| 4-Person Families | 39 (8.4%) | $0 |
| 5-Person Families | 0 (0.0%) | $0 |
| 6-Person Families | 0 (0.0%) | $0 |
| 7+ Person Families | 0 (0.0%) | $0 |
| Total | 462 (100.0%) | $73,000 |
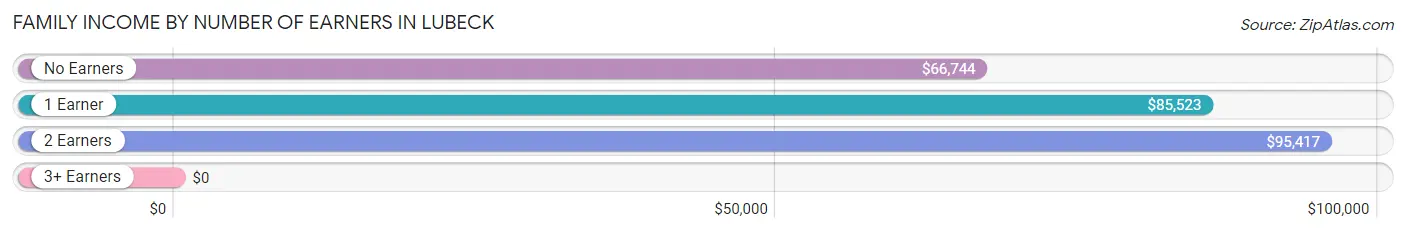
Family Income by Number of Earners in Lubeck
| Number of Earners | # Families | Median Income |
| No Earners | 198 (42.9%) | $66,744 |
| 1 Earner | 177 (38.3%) | $85,523 |
| 2 Earners | 83 (18.0%) | $95,417 |
| 3+ Earners | 4 (0.9%) | $0 |
| Total | 462 (100.0%) | $73,000 |
Household Income in Lubeck
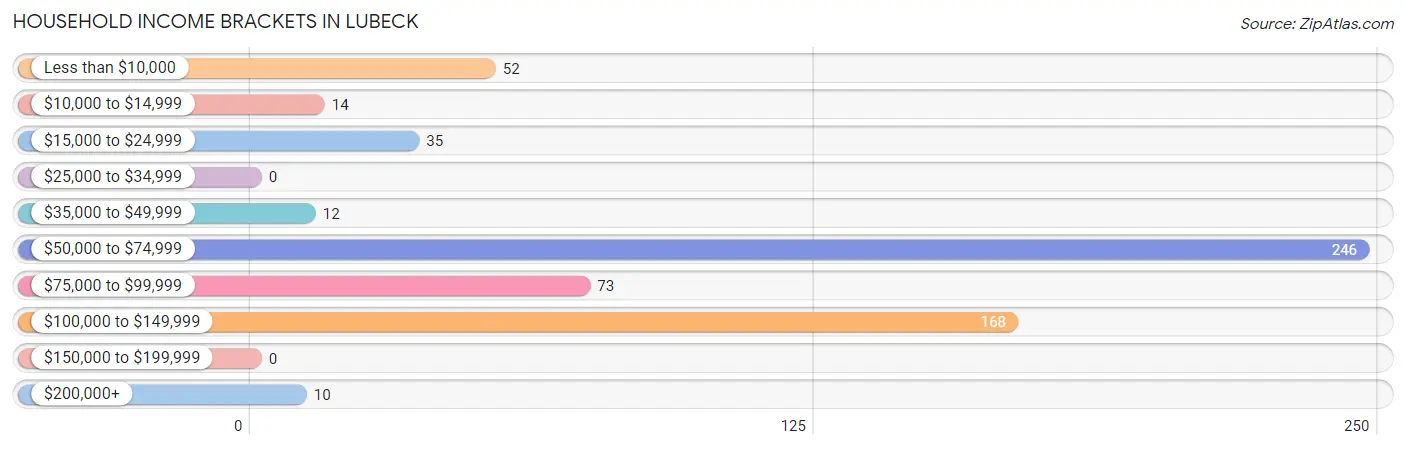
Household Income Brackets in Lubeck
With 246 households falling in the category, the $50,000 to $74,999 income range is the most frequent in Lubeck, accounting for 40.3% of all households.
| Income Bracket | # Households | % Households |
| Less than $10,000 | 52 | 8.5% |
| $10,000 to $14,999 | 14 | 2.3% |
| $15,000 to $24,999 | 35 | 5.7% |
| $25,000 to $34,999 | 0 | 0.0% |
| $35,000 to $49,999 | 12 | 2.0% |
| $50,000 to $74,999 | 246 | 40.3% |
| $75,000 to $99,999 | 73 | 12.0% |
| $100,000 to $149,999 | 168 | 27.5% |
| $150,000 to $199,999 | 0 | 0.0% |
| $200,000+ | 10 | 1.6% |
Household Income by Householder Age in Lubeck
The median household income in Lubeck is $67,282, with the highest median household income of $114,500 found in the 45 to 64 years age bracket for the primary householder. A total of 96 households (15.7%) fall into this category.
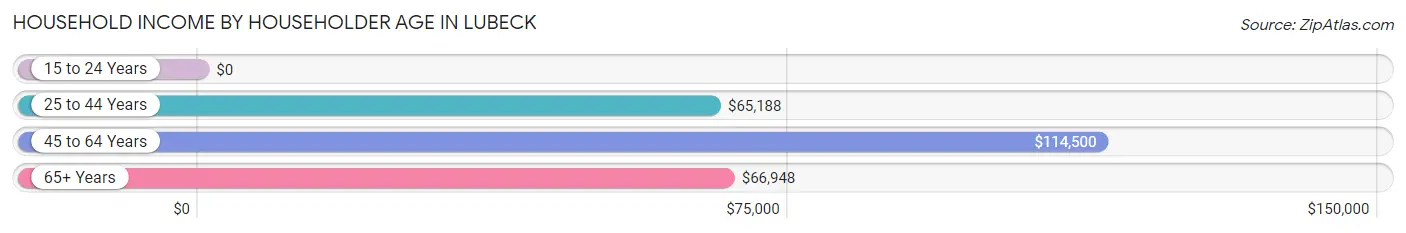
| Income Bracket | # Households | Median Income |
| 15 to 24 Years | 0 (0.0%) | $0 |
| 25 to 44 Years | 215 (35.2%) | $65,188 |
| 45 to 64 Years | 96 (15.7%) | $114,500 |
| 65+ Years | 299 (49.0%) | $66,948 |
| Total | 610 (100.0%) | $67,282 |
Poverty in Lubeck
Income Below Poverty by Sex and Age in Lubeck
With 7.4% poverty level for males and 2.4% for females among the residents of Lubeck, 35 to 44 year old males and 75 year old and over females are the most vulnerable to poverty, with 38 males (65.5%) and 14 females (8.4%) in their respective age groups living below the poverty level.
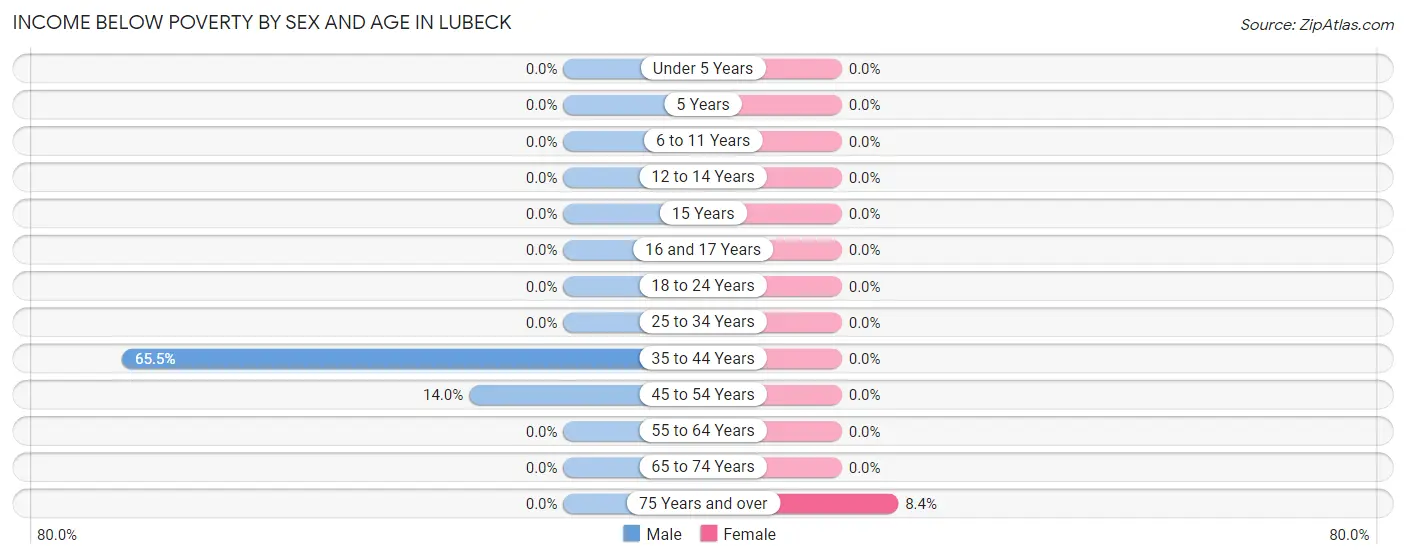
| Age Bracket | Male | Female |
| Under 5 Years | 0 (0.0%) | 0 (0.0%) |
| 5 Years | 0 (0.0%) | 0 (0.0%) |
| 6 to 11 Years | 0 (0.0%) | 0 (0.0%) |
| 12 to 14 Years | 0 (0.0%) | 0 (0.0%) |
| 15 Years | 0 (0.0%) | 0 (0.0%) |
| 16 and 17 Years | 0 (0.0%) | 0 (0.0%) |
| 18 to 24 Years | 0 (0.0%) | 0 (0.0%) |
| 25 to 34 Years | 0 (0.0%) | 0 (0.0%) |
| 35 to 44 Years | 38 (65.5%) | 0 (0.0%) |
| 45 to 54 Years | 14 (14.0%) | 0 (0.0%) |
| 55 to 64 Years | 0 (0.0%) | 0 (0.0%) |
| 65 to 74 Years | 0 (0.0%) | 0 (0.0%) |
| 75 Years and over | 0 (0.0%) | 14 (8.4%) |
| Total | 52 (7.4%) | 14 (2.4%) |
Income Above Poverty by Sex and Age in Lubeck
According to the poverty statistics in Lubeck, males aged under 5 years and females aged under 5 years are the age groups that are most secure financially, with 100.0% of males and 100.0% of females in these age groups living above the poverty line.
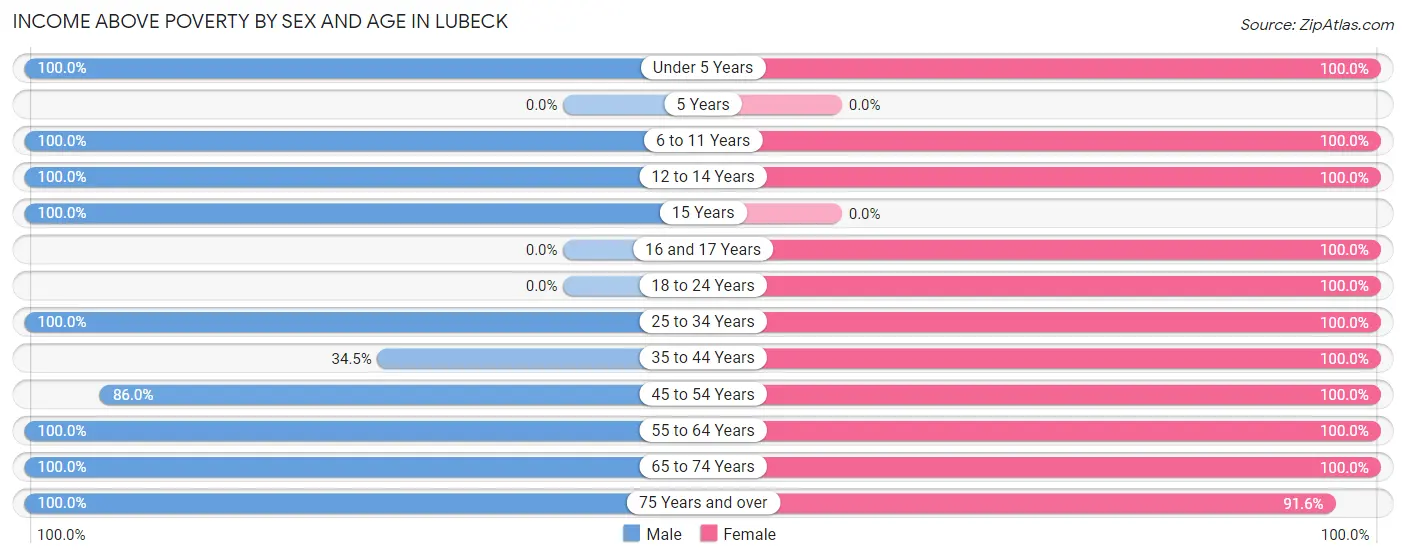
| Age Bracket | Male | Female |
| Under 5 Years | 75 (100.0%) | 29 (100.0%) |
| 5 Years | 0 (0.0%) | 0 (0.0%) |
| 6 to 11 Years | 29 (100.0%) | 27 (100.0%) |
| 12 to 14 Years | 29 (100.0%) | 32 (100.0%) |
| 15 Years | 19 (100.0%) | 0 (0.0%) |
| 16 and 17 Years | 0 (0.0%) | 19 (100.0%) |
| 18 to 24 Years | 0 (0.0%) | 15 (100.0%) |
| 25 to 34 Years | 81 (100.0%) | 85 (100.0%) |
| 35 to 44 Years | 20 (34.5%) | 79 (100.0%) |
| 45 to 54 Years | 86 (86.0%) | 25 (100.0%) |
| 55 to 64 Years | 44 (100.0%) | 45 (100.0%) |
| 65 to 74 Years | 68 (100.0%) | 68 (100.0%) |
| 75 Years and over | 196 (100.0%) | 153 (91.6%) |
| Total | 647 (92.6%) | 577 (97.6%) |
Income Below Poverty Among Married-Couple Families in Lubeck
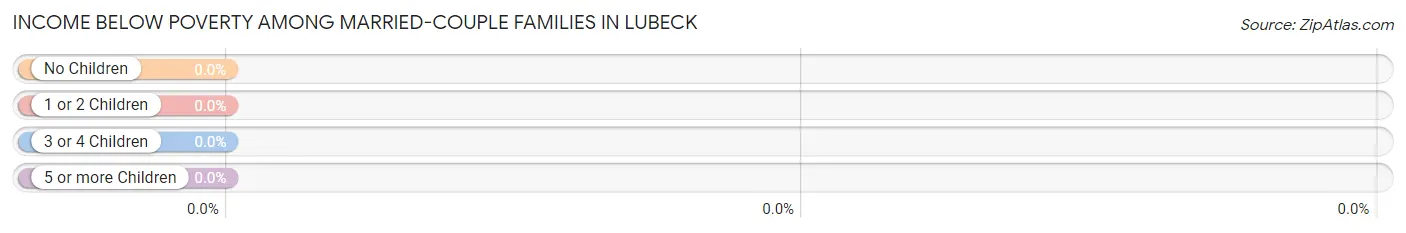
| Children | Above Poverty | Below Poverty |
| No Children | 256 (100.0%) | 0 (0.0%) |
| 1 or 2 Children | 72 (100.0%) | 0 (0.0%) |
| 3 or 4 Children | 0 (0.0%) | 0 (0.0%) |
| 5 or more Children | 0 (0.0%) | 0 (0.0%) |
| Total | 328 (100.0%) | 0 (0.0%) |
Income Below Poverty Among Single-Parent Households in Lubeck
| Children | Single Father | Single Mother |
| No Children | 0 (0.0%) | 0 (0.0%) |
| 1 or 2 Children | 0 (0.0%) | 0 (0.0%) |
| 3 or 4 Children | 0 (0.0%) | 0 (0.0%) |
| 5 or more Children | 0 (0.0%) | 0 (0.0%) |
| Total | 0 (0.0%) | 0 (0.0%) |
Income Below Poverty Among Married-Couple vs Single-Parent Households in Lubeck
| Children | Married-Couple Families | Single-Parent Households |
| No Children | 0 (0.0%) | 0 (0.0%) |
| 1 or 2 Children | 0 (0.0%) | 0 (0.0%) |
| 3 or 4 Children | 0 (0.0%) | 0 (0.0%) |
| 5 or more Children | 0 (0.0%) | 0 (0.0%) |
| Total | 0 (0.0%) | 0 (0.0%) |
Race in Lubeck
The most populous races in Lubeck are , and White / Caucasian (1,290 | 100.0%).
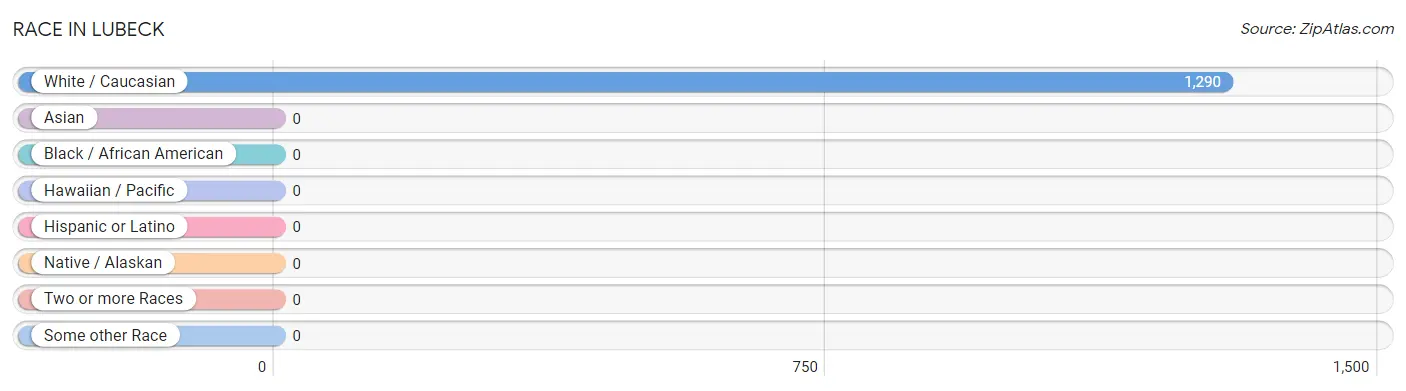
| Race | # Population | % Population |
| Asian | 0 | 0.0% |
| Black / African American | 0 | 0.0% |
| Hawaiian / Pacific | 0 | 0.0% |
| Hispanic or Latino | 0 | 0.0% |
| Native / Alaskan | 0 | 0.0% |
| White / Caucasian | 1,290 | 100.0% |
| Two or more Races | 0 | 0.0% |
| Some other Race | 0 | 0.0% |
| Total | 1,290 | 100.0% |
Ancestry in Lubeck
The most populous ancestries reported in Lubeck are Irish (439 | 34.0%), English (186 | 14.4%), German (114 | 8.8%), American (87 | 6.7%), and Italian (56 | 4.3%), together accounting for 68.4% of all Lubeck residents.
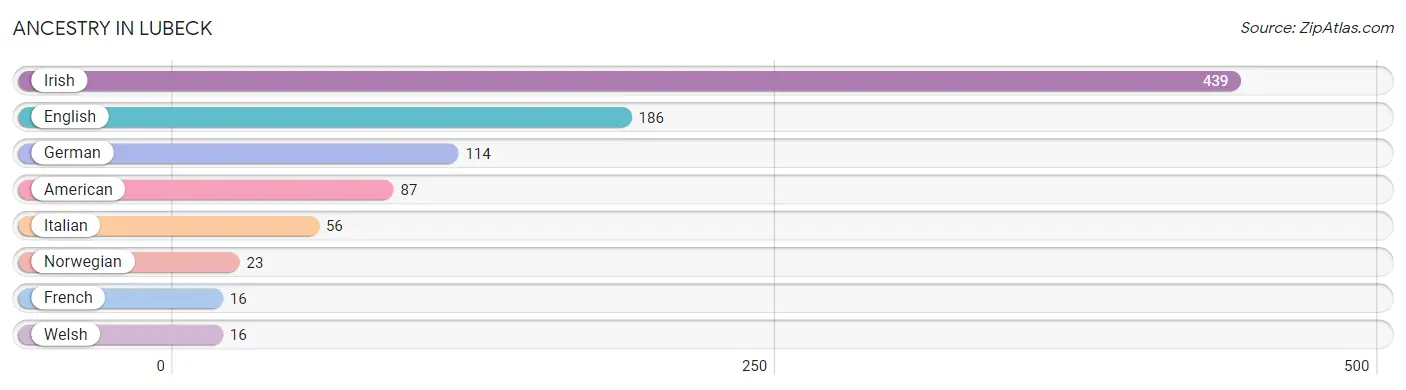
| Ancestry | # Population | % Population |
| American | 87 | 6.7% |
| English | 186 | 14.4% |
| French | 16 | 1.2% |
| German | 114 | 8.8% |
| Irish | 439 | 34.0% |
| Italian | 56 | 4.3% |
| Norwegian | 23 | 1.8% |
| Welsh | 16 | 1.2% | View All 8 Rows |
Immigrants in Lubeck

| Immigration Origin | # Population | % Population | View All 0 Rows |
Sex and Age in Lubeck
Sex and Age in Lubeck
The most populous age groups in Lubeck are 80 to 84 Years (142 | 20.3%) for men and 80 to 84 Years (115 | 19.5%) for women.
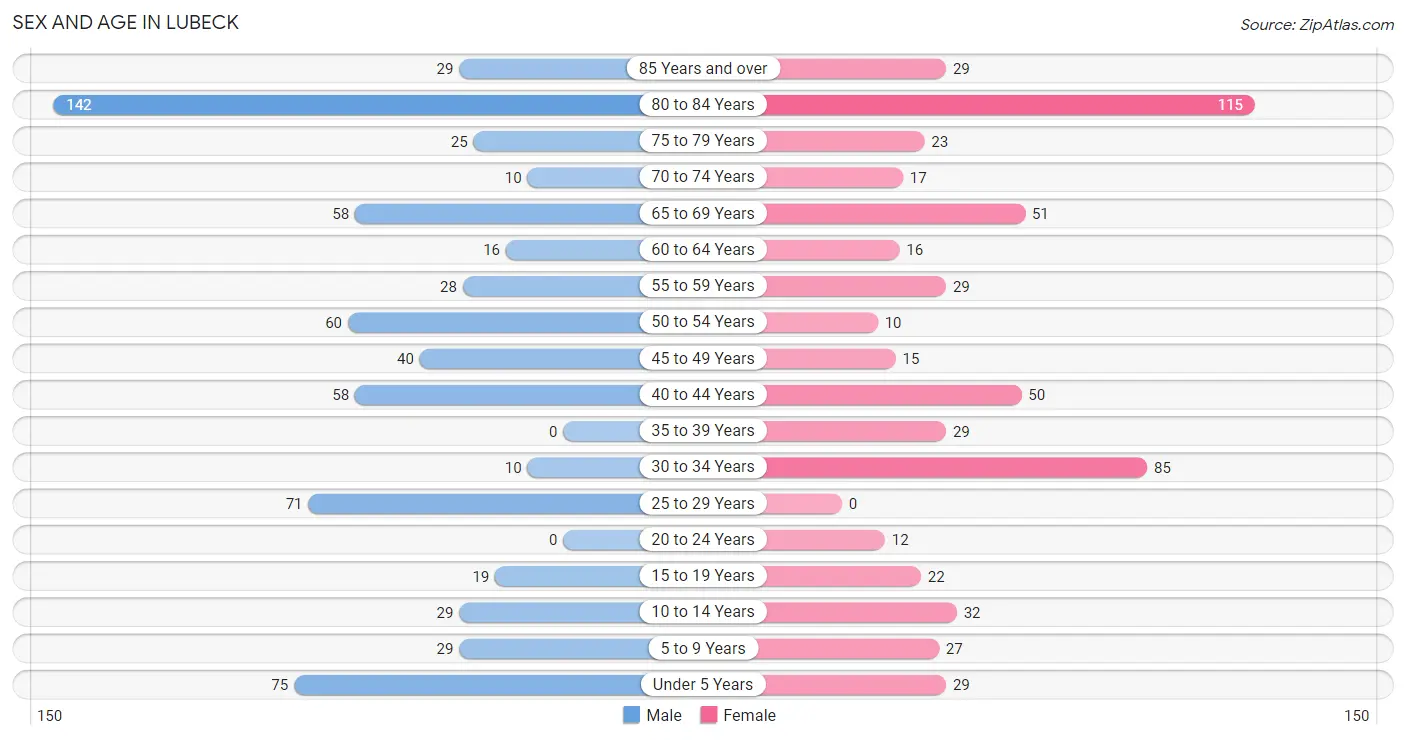
| Age Bracket | Male | Female |
| Under 5 Years | 75 (10.7%) | 29 (4.9%) |
| 5 to 9 Years | 29 (4.2%) | 27 (4.6%) |
| 10 to 14 Years | 29 (4.2%) | 32 (5.4%) |
| 15 to 19 Years | 19 (2.7%) | 22 (3.7%) |
| 20 to 24 Years | 0 (0.0%) | 12 (2.0%) |
| 25 to 29 Years | 71 (10.2%) | 0 (0.0%) |
| 30 to 34 Years | 10 (1.4%) | 85 (14.4%) |
| 35 to 39 Years | 0 (0.0%) | 29 (4.9%) |
| 40 to 44 Years | 58 (8.3%) | 50 (8.5%) |
| 45 to 49 Years | 40 (5.7%) | 15 (2.5%) |
| 50 to 54 Years | 60 (8.6%) | 10 (1.7%) |
| 55 to 59 Years | 28 (4.0%) | 29 (4.9%) |
| 60 to 64 Years | 16 (2.3%) | 16 (2.7%) |
| 65 to 69 Years | 58 (8.3%) | 51 (8.6%) |
| 70 to 74 Years | 10 (1.4%) | 17 (2.9%) |
| 75 to 79 Years | 25 (3.6%) | 23 (3.9%) |
| 80 to 84 Years | 142 (20.3%) | 115 (19.5%) |
| 85 Years and over | 29 (4.2%) | 29 (4.9%) |
| Total | 699 (100.0%) | 591 (100.0%) |
Families and Households in Lubeck
Median Family Size in Lubeck
The median family size in Lubeck is 2.32 persons per family, with single female/mother families (69 | 14.9%) accounting for the largest median family size of 2.55 persons per family. On the other hand, single male/father families (65 | 14.1%) represent the smallest median family size with 2.14 persons per family.
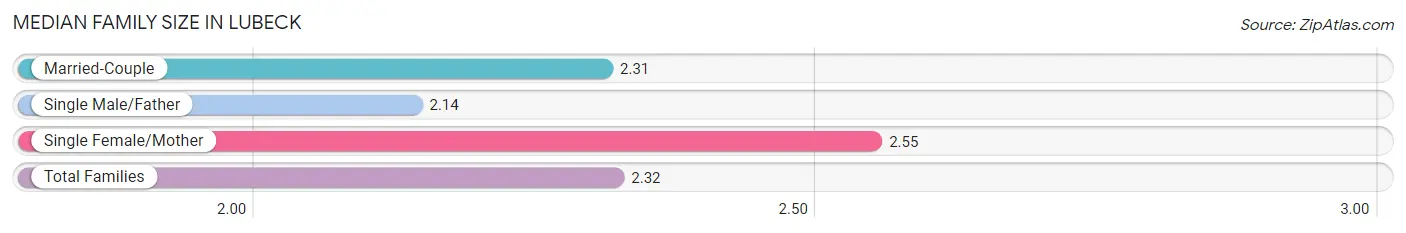
| Family Type | # Families | Family Size |
| Married-Couple | 328 (71.0%) | 2.31 |
| Single Male/Father | 65 (14.1%) | 2.14 |
| Single Female/Mother | 69 (14.9%) | 2.55 |
| Total Families | 462 (100.0%) | 2.32 |
Median Household Size in Lubeck
The median household size in Lubeck is 2.11 persons per household, with single male/father households (65 | 10.7%) accounting for the largest median household size of 2.97 persons per household. non-family households (148 | 24.3%) represent the smallest median household size with 1.09 persons per household.
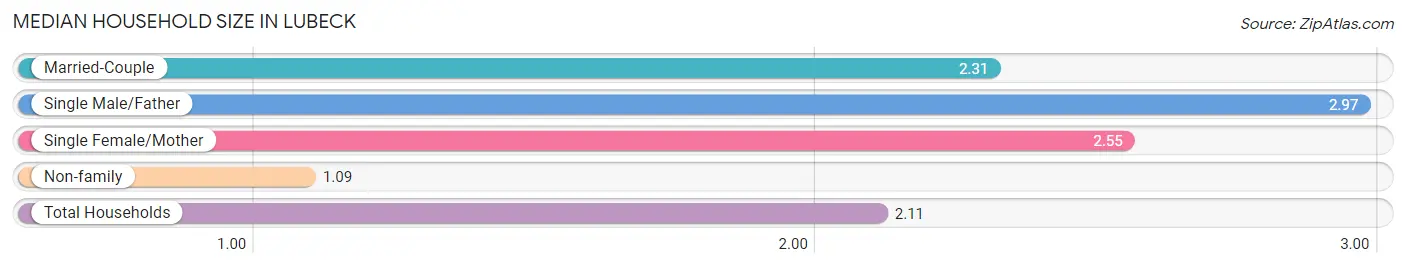
| Household Type | # Households | Household Size |
| Married-Couple | 328 (53.8%) | 2.31 |
| Single Male/Father | 65 (10.7%) | 2.97 |
| Single Female/Mother | 69 (11.3%) | 2.55 |
| Non-family | 148 (24.3%) | 1.09 |
| Total Households | 610 (100.0%) | 2.11 |
Household Size by Marriage Status in Lubeck
Out of a total of 610 households in Lubeck, 462 (75.7%) are family households, while 148 (24.3%) are nonfamily households. The most numerous type of family households are 2-person households, comprising 294, and the most common type of nonfamily households are 1-person households, comprising 131.
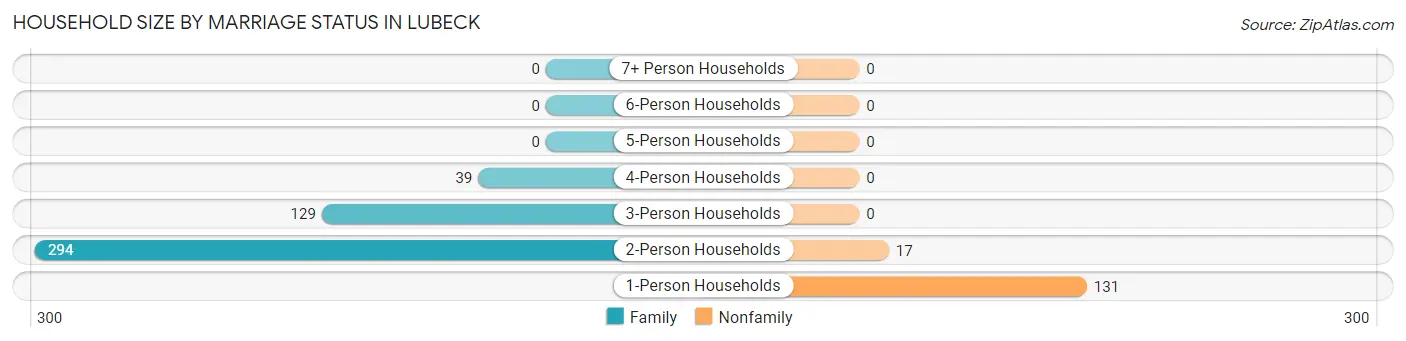
| Household Size | Family Households | Nonfamily Households |
| 1-Person Households | - | 131 (21.5%) |
| 2-Person Households | 294 (48.2%) | 17 (2.8%) |
| 3-Person Households | 129 (21.1%) | 0 (0.0%) |
| 4-Person Households | 39 (6.4%) | 0 (0.0%) |
| 5-Person Households | 0 (0.0%) | 0 (0.0%) |
| 6-Person Households | 0 (0.0%) | 0 (0.0%) |
| 7+ Person Households | 0 (0.0%) | 0 (0.0%) |
| Total | 462 (75.7%) | 148 (24.3%) |
Female Fertility in Lubeck
Fertility by Age in Lubeck
Average fertility rate in Lubeck is 254.0 births per 1,000 women. Women in the age bracket of 20 to 34 years have the highest fertility rate with 557.0 births per 1,000 women. Women in the age bracket of 20 to 34 years acount for 100.0% of all women with births.
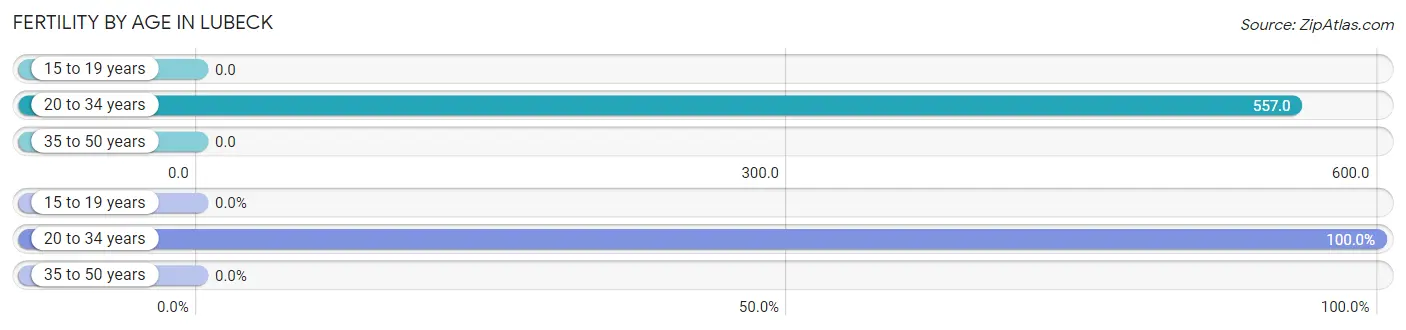
| Age Bracket | Women with Births | Births / 1,000 Women |
| 15 to 19 years | 0 (0.0%) | 0.0 |
| 20 to 34 years | 54 (100.0%) | 557.0 |
| 35 to 50 years | 0 (0.0%) | 0.0 |
| Total | 54 (100.0%) | 254.0 |
Fertility by Age by Marriage Status in Lubeck
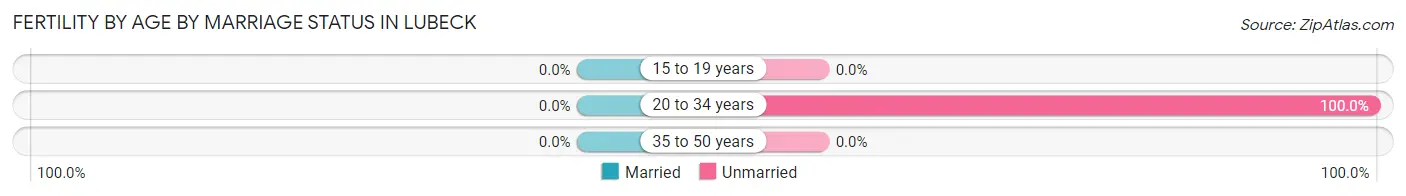
| Age Bracket | Married | Unmarried |
| 15 to 19 years | 0 (0.0%) | 0 (0.0%) |
| 20 to 34 years | 0 (0.0%) | 54 (100.0%) |
| 35 to 50 years | 0 (0.0%) | 0 (0.0%) |
| Total | 0 (0.0%) | 54 (100.0%) |
Fertility by Education in Lubeck
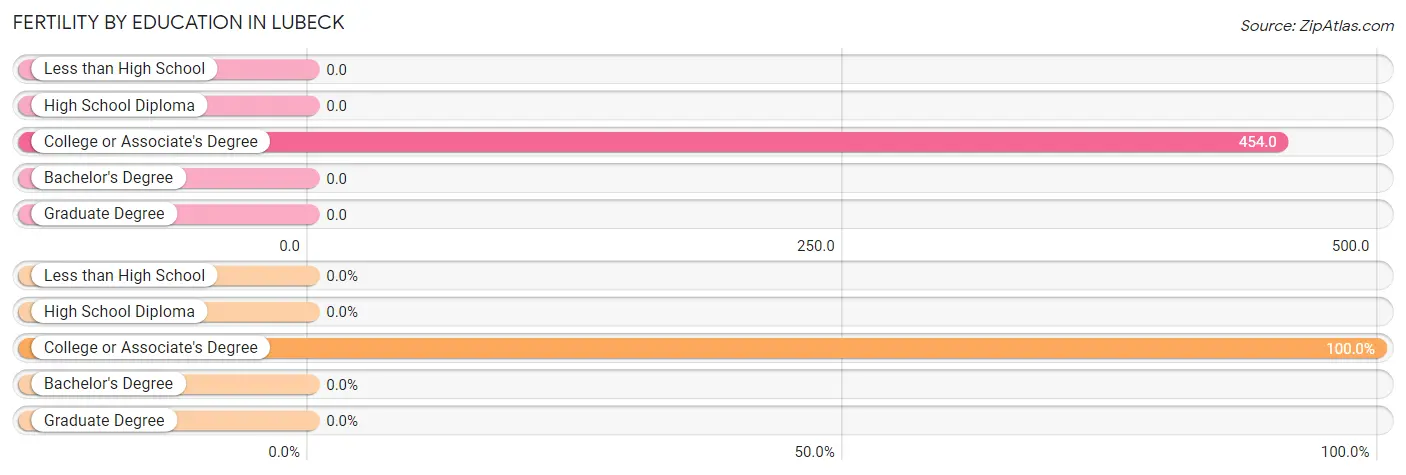
| Educational Attainment | Women with Births | Births / 1,000 Women |
| Less than High School | 0 (0.0%) | 0.0 |
| High School Diploma | 0 (0.0%) | 0.0 |
| College or Associate's Degree | 54 (100.0%) | 454.0 |
| Bachelor's Degree | 0 (0.0%) | 0.0 |
| Graduate Degree | 0 (0.0%) | 0.0 |
| Total | 54 (100.0%) | 254.0 |
Fertility by Education by Marriage Status in Lubeck
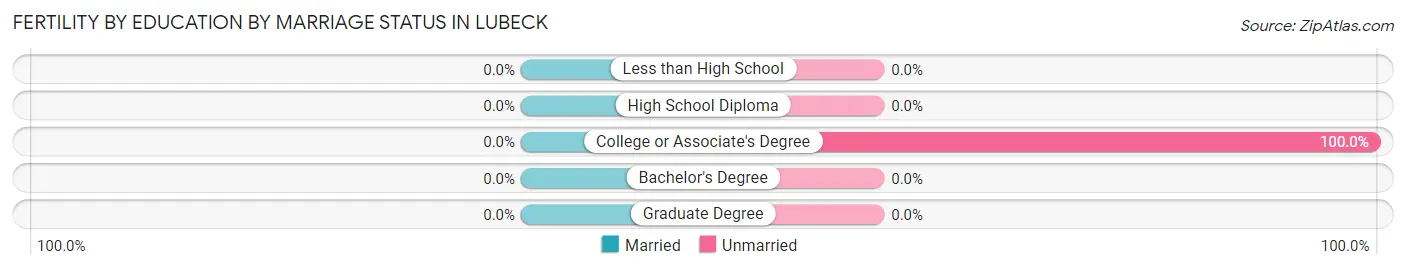
| Educational Attainment | Married | Unmarried |
| Less than High School | 0 (0.0%) | 0 (0.0%) |
| High School Diploma | 0 (0.0%) | 0 (0.0%) |
| College or Associate's Degree | 0 (0.0%) | 54 (100.0%) |
| Bachelor's Degree | 0 (0.0%) | 0 (0.0%) |
| Graduate Degree | 0 (0.0%) | 0 (0.0%) |
| Total | 0 (0.0%) | 54 (100.0%) |
Employment Characteristics in Lubeck
Employment by Class of Employer in Lubeck
Among the 387 employed individuals in Lubeck, private company employees (315 | 81.4%), local government employees (52 | 13.4%), and state government employees (10 | 2.6%) make up the most common classes of employment.
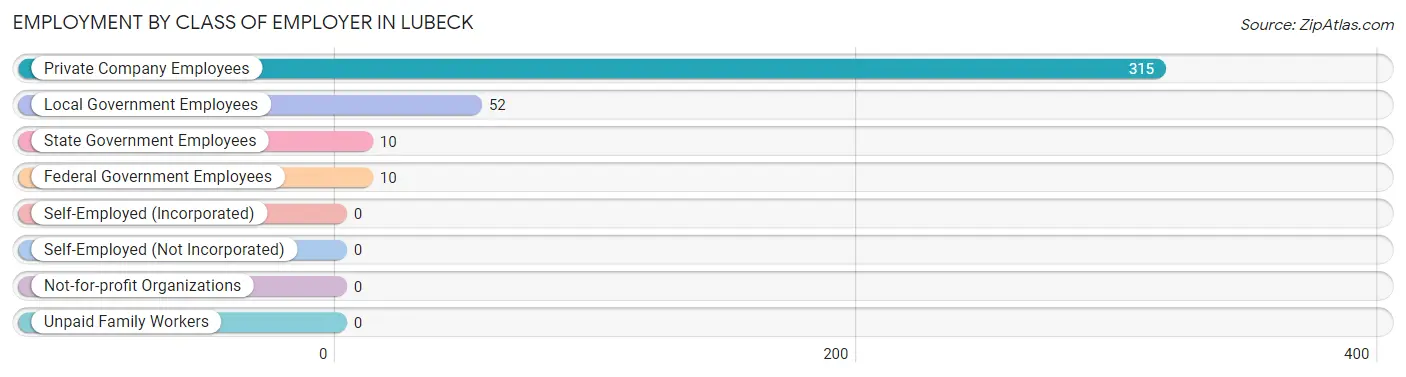
| Employer Class | # Employees | % Employees |
| Private Company Employees | 315 | 81.4% |
| Self-Employed (Incorporated) | 0 | 0.0% |
| Self-Employed (Not Incorporated) | 0 | 0.0% |
| Not-for-profit Organizations | 0 | 0.0% |
| Local Government Employees | 52 | 13.4% |
| State Government Employees | 10 | 2.6% |
| Federal Government Employees | 10 | 2.6% |
| Unpaid Family Workers | 0 | 0.0% |
| Total | 387 | 100.0% |
Employment Status by Age in Lubeck
According to the labor force statistics for Lubeck, out of the total population over 16 years of age (1,050), 41.8% or 439 individuals are in the labor force, with 11.8% or 52 of them unemployed. The age group with the highest labor force participation rate is 20 to 24 years, with 100.0% or 12 individuals in the labor force. Within the labor force, the 35 to 44 years age range has the highest percentage of unemployed individuals, with 33.9% or 38 of them being unemployed.
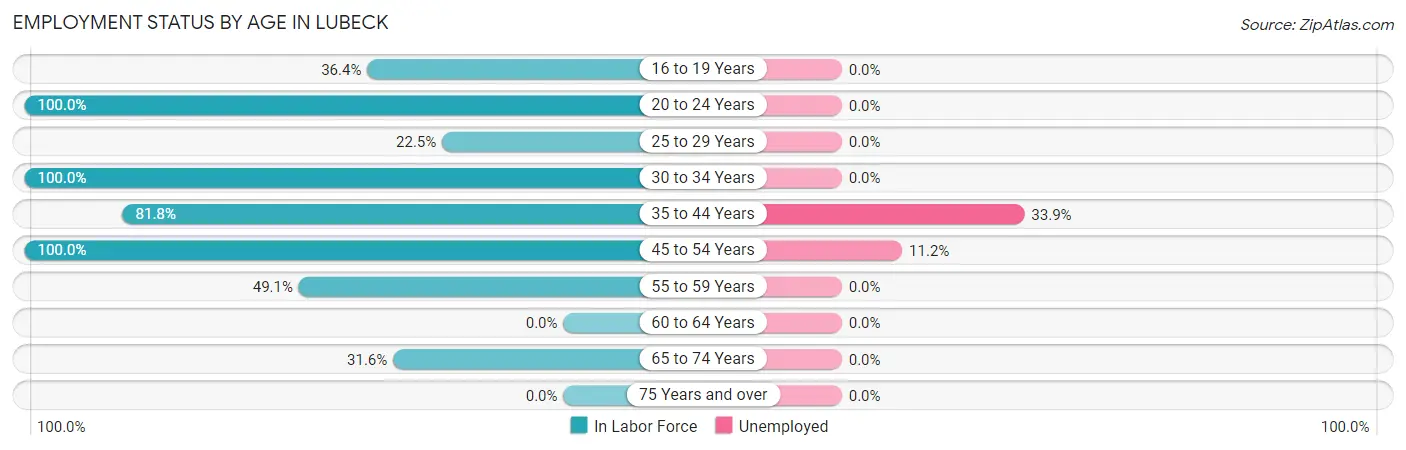
| Age Bracket | In Labor Force | Unemployed |
| 16 to 19 Years | 8 (36.4%) | 0 (0.0%) |
| 20 to 24 Years | 12 (100.0%) | 0 (0.0%) |
| 25 to 29 Years | 16 (22.5%) | 0 (0.0%) |
| 30 to 34 Years | 95 (100.0%) | 0 (0.0%) |
| 35 to 44 Years | 112 (81.8%) | 38 (33.9%) |
| 45 to 54 Years | 125 (100.0%) | 14 (11.2%) |
| 55 to 59 Years | 28 (49.1%) | 0 (0.0%) |
| 60 to 64 Years | 0 (0.0%) | 0 (0.0%) |
| 65 to 74 Years | 43 (31.6%) | 0 (0.0%) |
| 75 Years and over | 0 (0.0%) | 0 (0.0%) |
| Total | 439 (41.8%) | 52 (11.8%) |
Employment Status by Educational Attainment in Lubeck
According to labor force statistics for Lubeck, 72.7% of individuals (376) out of the total population between 25 and 64 years of age (517) are in the labor force, with 13.8% or 52 of them being unemployed. The group with the highest labor force participation rate are those with the educational attainment of less than high school, with 100.0% or 18 individuals in the labor force. Within the labor force, individuals with less than high school education have the highest percentage of unemployment, with 77.8% or 14 of them being unemployed.
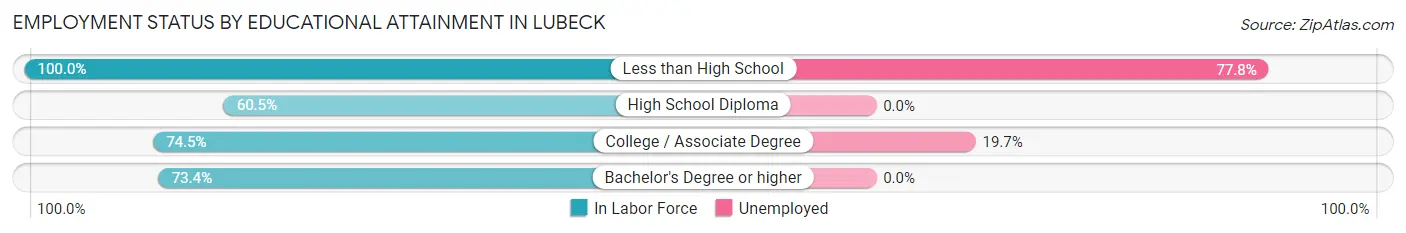
| Educational Attainment | In Labor Force | Unemployed |
| Less than High School | 18 (100.0%) | 14 (77.8%) |
| High School Diploma | 52 (60.5%) | 0 (0.0%) |
| College / Associate Degree | 193 (74.5%) | 51 (19.7%) |
| Bachelor's Degree or higher | 113 (73.4%) | 0 (0.0%) |
| Total | 376 (72.7%) | 71 (13.8%) |
Employment Occupations by Sex in Lubeck
Management, Business, Science and Arts Occupations
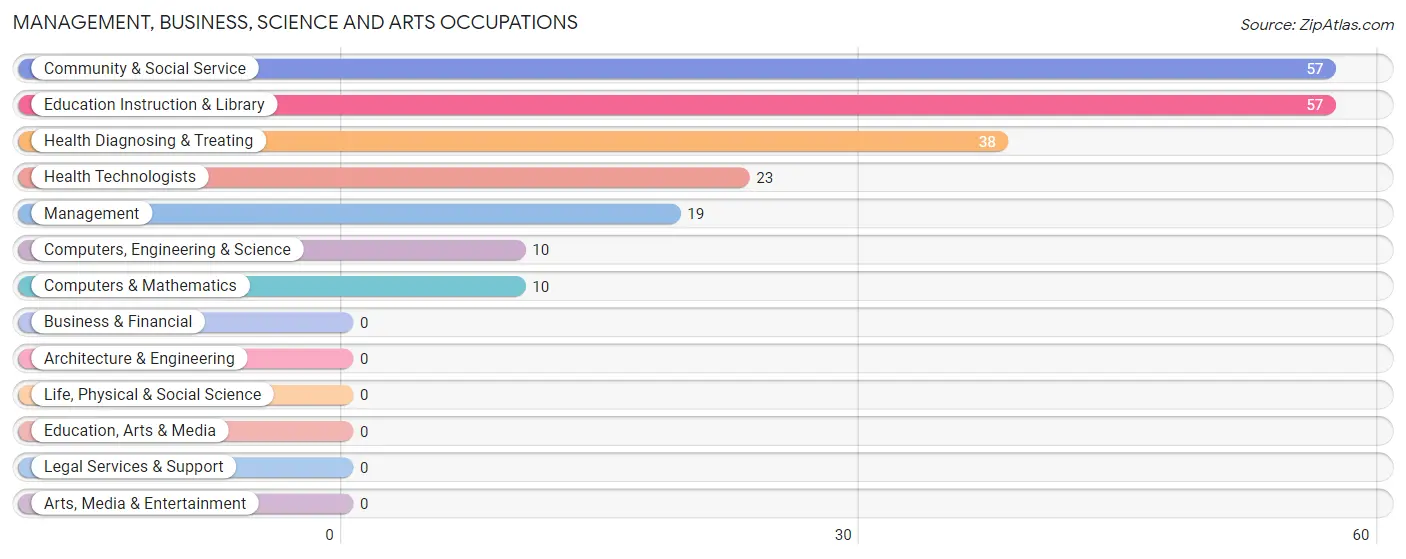
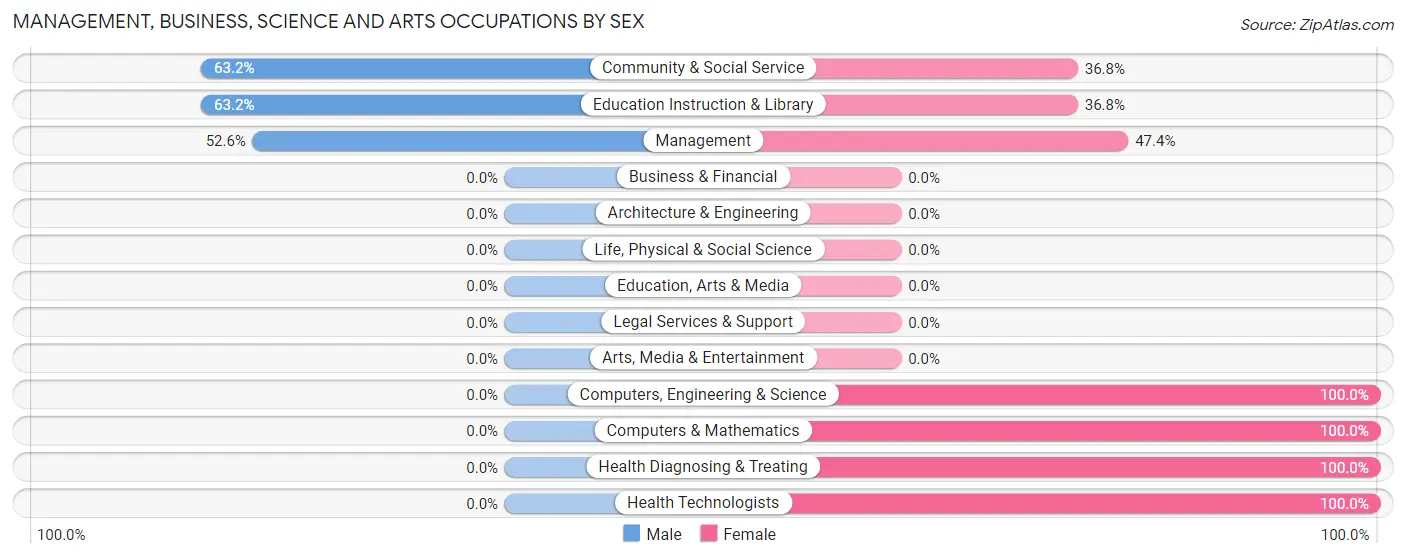
The most common Management, Business, Science and Arts occupations in Lubeck are Community & Social Service (57 | 14.7%), Education Instruction & Library (57 | 14.7%), Health Diagnosing & Treating (38 | 9.8%), Health Technologists (23 | 5.9%), and Management (19 | 4.9%).
Management, Business, Science and Arts Occupations by Sex
Within the Management, Business, Science and Arts occupations in Lubeck, the most male-oriented occupations are Community & Social Service (63.2%), Education Instruction & Library (63.2%), and Management (52.6%), while the most female-oriented occupations are Computers, Engineering & Science (100.0%), Computers & Mathematics (100.0%), and Health Diagnosing & Treating (100.0%).
| Occupation | Male | Female |
| Management | 10 (52.6%) | 9 (47.4%) |
| Business & Financial | 0 (0.0%) | 0 (0.0%) |
| Computers, Engineering & Science | 0 (0.0%) | 10 (100.0%) |
| Computers & Mathematics | 0 (0.0%) | 10 (100.0%) |
| Architecture & Engineering | 0 (0.0%) | 0 (0.0%) |
| Life, Physical & Social Science | 0 (0.0%) | 0 (0.0%) |
| Community & Social Service | 36 (63.2%) | 21 (36.8%) |
| Education, Arts & Media | 0 (0.0%) | 0 (0.0%) |
| Legal Services & Support | 0 (0.0%) | 0 (0.0%) |
| Education Instruction & Library | 36 (63.2%) | 21 (36.8%) |
| Arts, Media & Entertainment | 0 (0.0%) | 0 (0.0%) |
| Health Diagnosing & Treating | 0 (0.0%) | 38 (100.0%) |
| Health Technologists | 0 (0.0%) | 23 (100.0%) |
| Total (Category) | 46 (37.1%) | 78 (62.9%) |
| Total (Overall) | 180 (46.5%) | 207 (53.5%) |
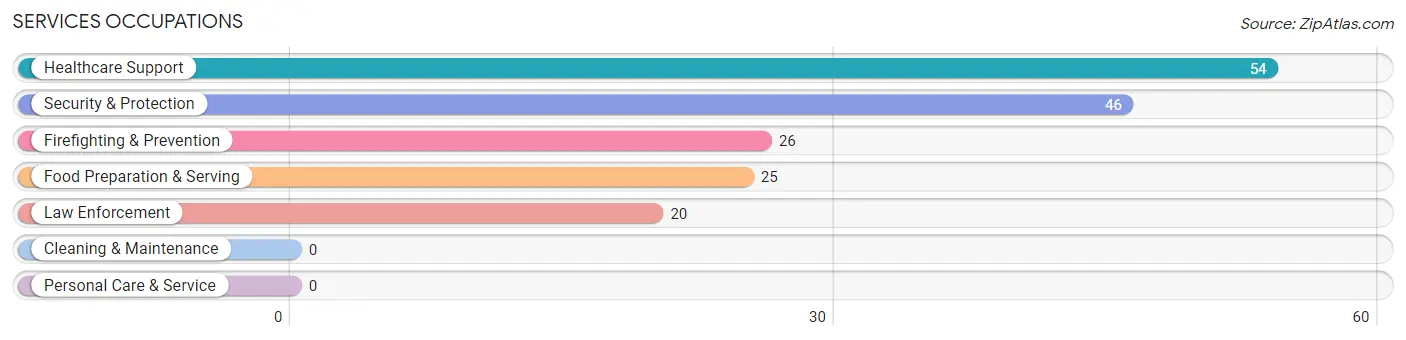
Services Occupations
The most common Services occupations in Lubeck are Healthcare Support (54 | 14.0%), Security & Protection (46 | 11.9%), Firefighting & Prevention (26 | 6.7%), Food Preparation & Serving (25 | 6.5%), and Law Enforcement (20 | 5.2%).
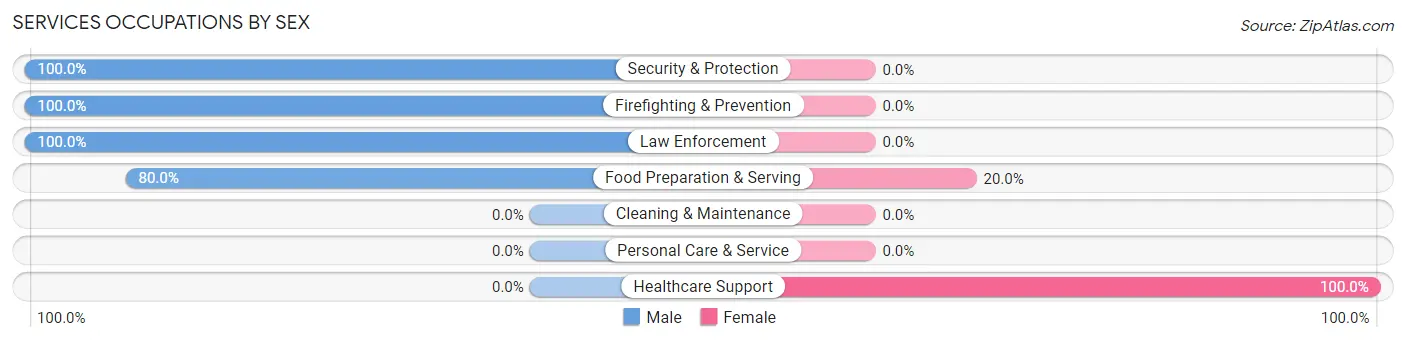
Services Occupations by Sex
Within the Services occupations in Lubeck, the most male-oriented occupations are Security & Protection (100.0%), Firefighting & Prevention (100.0%), and Law Enforcement (100.0%), while the most female-oriented occupations are Healthcare Support (100.0%), and Food Preparation & Serving (20.0%).
| Occupation | Male | Female |
| Healthcare Support | 0 (0.0%) | 54 (100.0%) |
| Security & Protection | 46 (100.0%) | 0 (0.0%) |
| Firefighting & Prevention | 26 (100.0%) | 0 (0.0%) |
| Law Enforcement | 20 (100.0%) | 0 (0.0%) |
| Food Preparation & Serving | 20 (80.0%) | 5 (20.0%) |
| Cleaning & Maintenance | 0 (0.0%) | 0 (0.0%) |
| Personal Care & Service | 0 (0.0%) | 0 (0.0%) |
| Total (Category) | 66 (52.8%) | 59 (47.2%) |
| Total (Overall) | 180 (46.5%) | 207 (53.5%) |
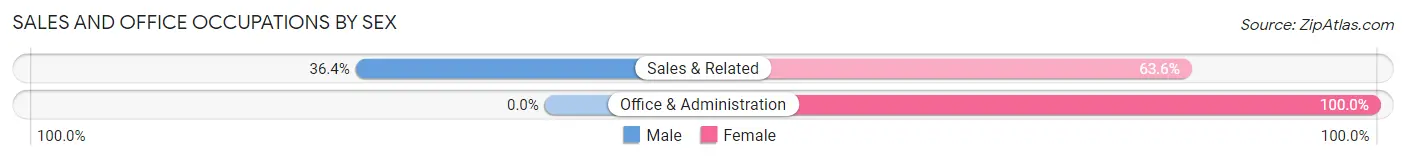
Sales and Office Occupations
The most common Sales and Office occupations in Lubeck are Office & Administration (51 | 13.2%), and Sales & Related (11 | 2.8%).

Sales and Office Occupations by Sex
| Occupation | Male | Female |
| Sales & Related | 4 (36.4%) | 7 (63.6%) |
| Office & Administration | 0 (0.0%) | 51 (100.0%) |
| Total (Category) | 4 (6.5%) | 58 (93.5%) |
| Total (Overall) | 180 (46.5%) | 207 (53.5%) |
Natural Resources, Construction and Maintenance Occupations
The most common Natural Resources, Construction and Maintenance occupations in Lubeck are , and Installation, Maintenance & Repair (14 | 3.6%).
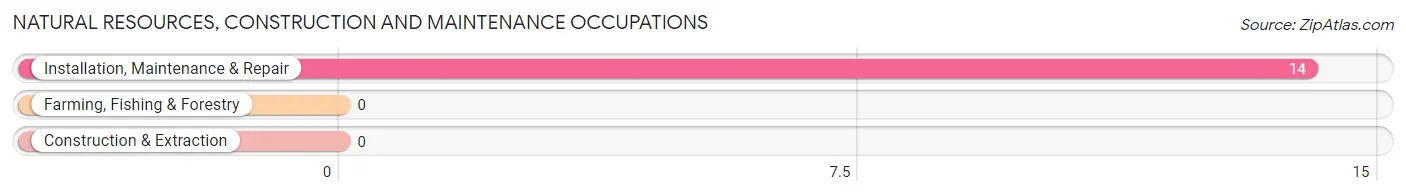
Natural Resources, Construction and Maintenance Occupations by Sex
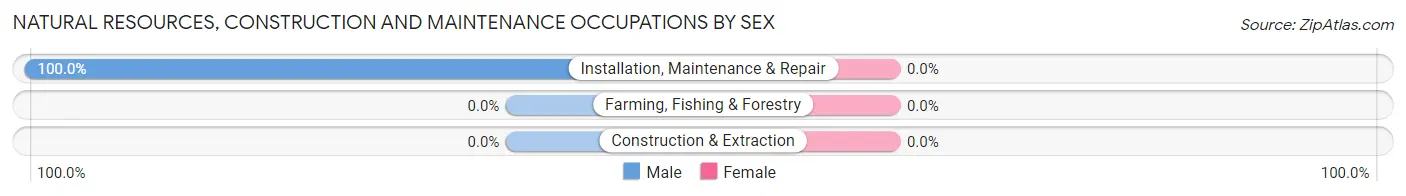
| Occupation | Male | Female |
| Farming, Fishing & Forestry | 0 (0.0%) | 0 (0.0%) |
| Construction & Extraction | 0 (0.0%) | 0 (0.0%) |
| Installation, Maintenance & Repair | 14 (100.0%) | 0 (0.0%) |
| Total (Category) | 14 (100.0%) | 0 (0.0%) |
| Total (Overall) | 180 (46.5%) | 207 (53.5%) |
Production, Transportation and Moving Occupations
The most common Production, Transportation and Moving occupations in Lubeck are Production (28 | 7.2%), Transportation (22 | 5.7%), and Material Moving (12 | 3.1%).
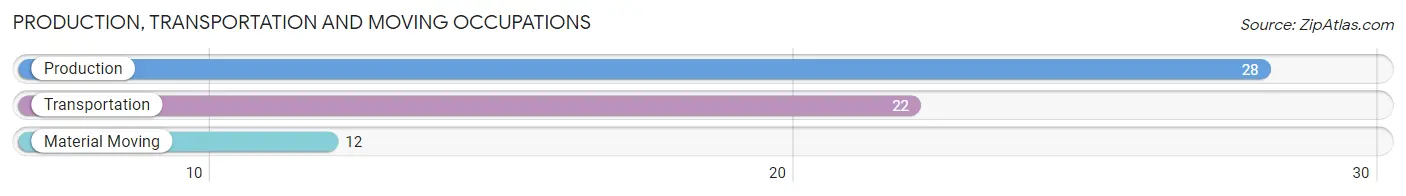
Production, Transportation and Moving Occupations by Sex
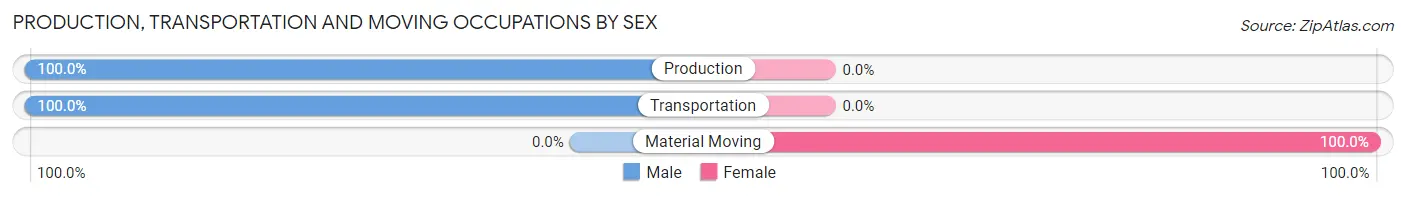
| Occupation | Male | Female |
| Production | 28 (100.0%) | 0 (0.0%) |
| Transportation | 22 (100.0%) | 0 (0.0%) |
| Material Moving | 0 (0.0%) | 12 (100.0%) |
| Total (Category) | 50 (80.6%) | 12 (19.4%) |
| Total (Overall) | 180 (46.5%) | 207 (53.5%) |
Employment Industries by Sex in Lubeck
Employment Industries in Lubeck
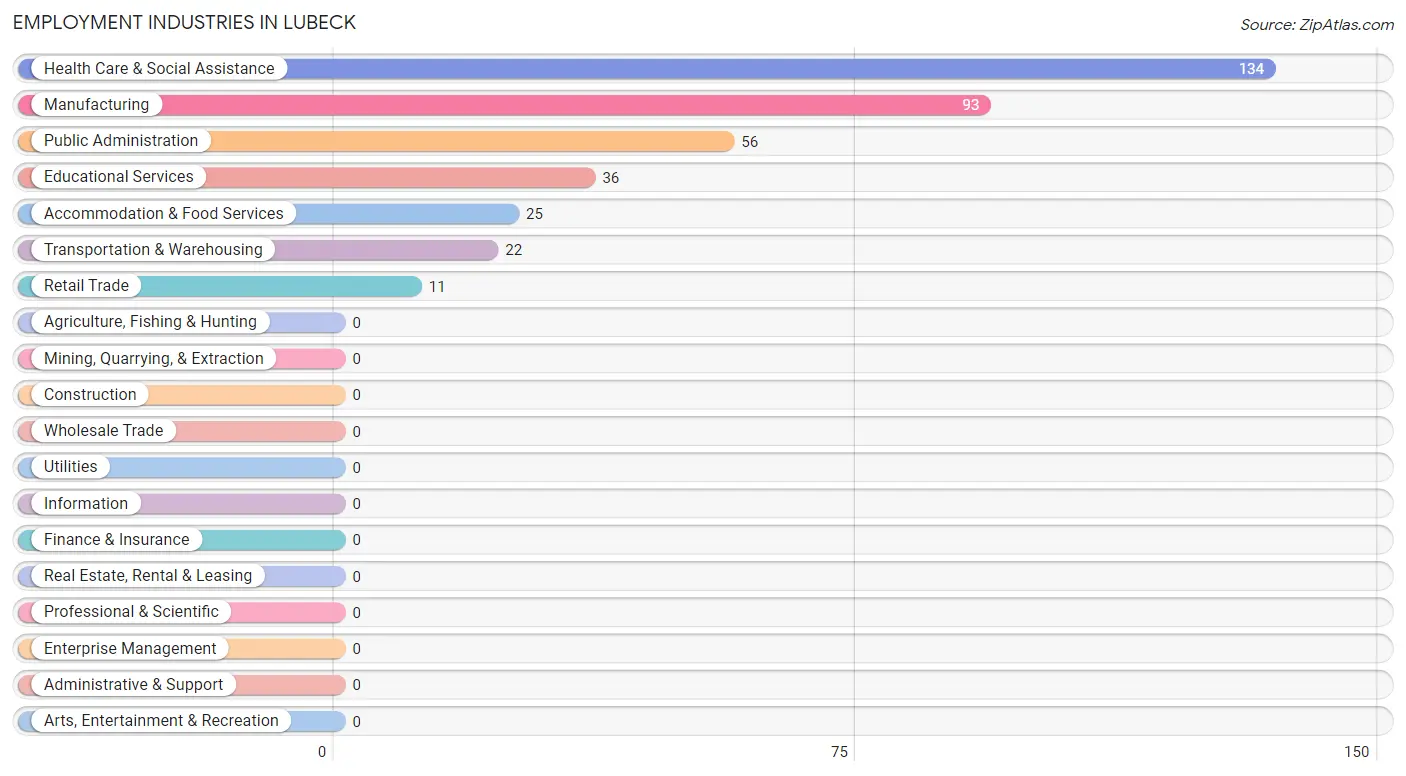
The major employment industries in Lubeck include Health Care & Social Assistance (134 | 34.6%), Manufacturing (93 | 24.0%), Public Administration (56 | 14.5%), Educational Services (36 | 9.3%), and Accommodation & Food Services (25 | 6.5%).
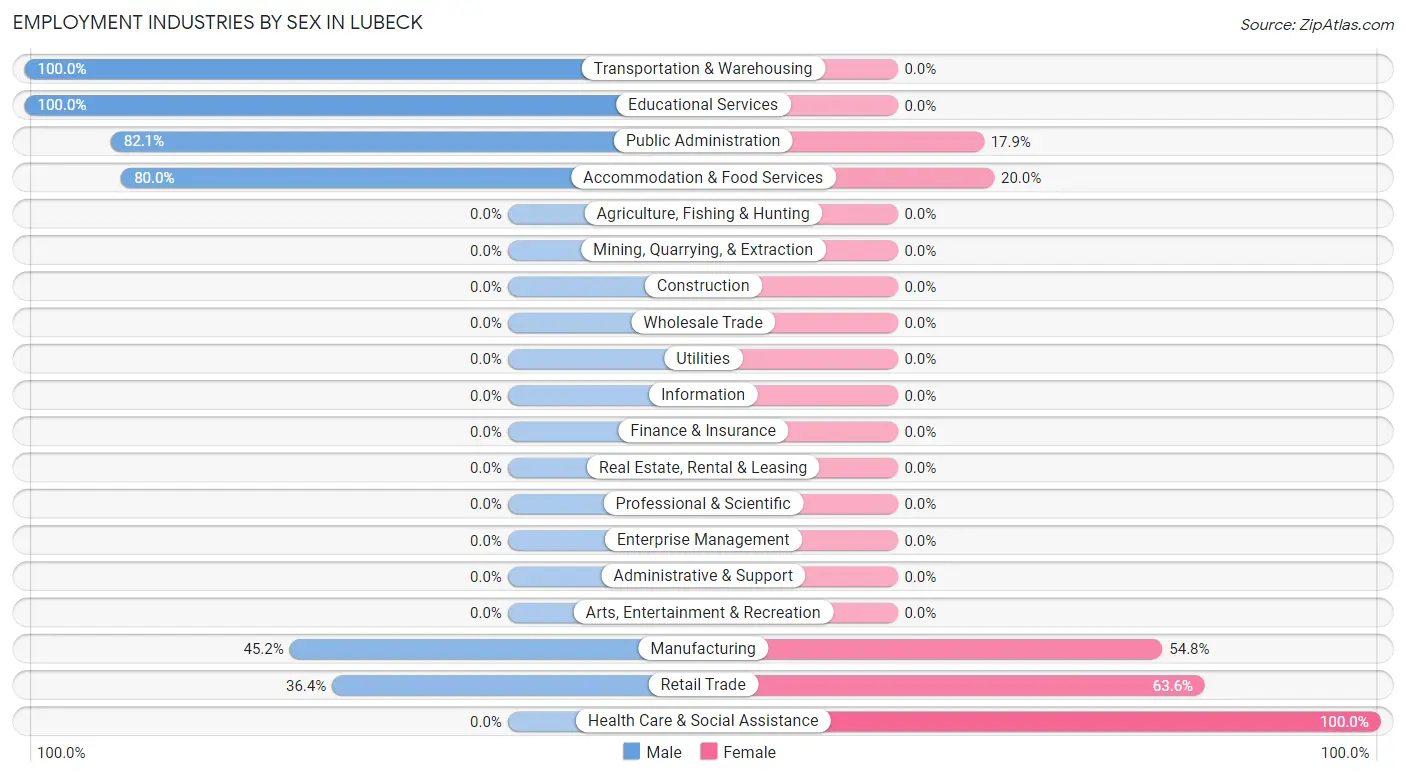
Employment Industries by Sex in Lubeck
The Lubeck industries that see more men than women are Transportation & Warehousing (100.0%), Educational Services (100.0%), and Public Administration (82.1%), whereas the industries that tend to have a higher number of women are Health Care & Social Assistance (100.0%), Retail Trade (63.6%), and Manufacturing (54.8%).
| Industry | Male | Female |
| Agriculture, Fishing & Hunting | 0 (0.0%) | 0 (0.0%) |
| Mining, Quarrying, & Extraction | 0 (0.0%) | 0 (0.0%) |
| Construction | 0 (0.0%) | 0 (0.0%) |
| Manufacturing | 42 (45.2%) | 51 (54.8%) |
| Wholesale Trade | 0 (0.0%) | 0 (0.0%) |
| Retail Trade | 4 (36.4%) | 7 (63.6%) |
| Transportation & Warehousing | 22 (100.0%) | 0 (0.0%) |
| Utilities | 0 (0.0%) | 0 (0.0%) |
| Information | 0 (0.0%) | 0 (0.0%) |
| Finance & Insurance | 0 (0.0%) | 0 (0.0%) |
| Real Estate, Rental & Leasing | 0 (0.0%) | 0 (0.0%) |
| Professional & Scientific | 0 (0.0%) | 0 (0.0%) |
| Enterprise Management | 0 (0.0%) | 0 (0.0%) |
| Administrative & Support | 0 (0.0%) | 0 (0.0%) |
| Educational Services | 36 (100.0%) | 0 (0.0%) |
| Health Care & Social Assistance | 0 (0.0%) | 134 (100.0%) |
| Arts, Entertainment & Recreation | 0 (0.0%) | 0 (0.0%) |
| Accommodation & Food Services | 20 (80.0%) | 5 (20.0%) |
| Public Administration | 46 (82.1%) | 10 (17.9%) |
| Total | 180 (46.5%) | 207 (53.5%) |
Education in Lubeck
School Enrollment in Lubeck
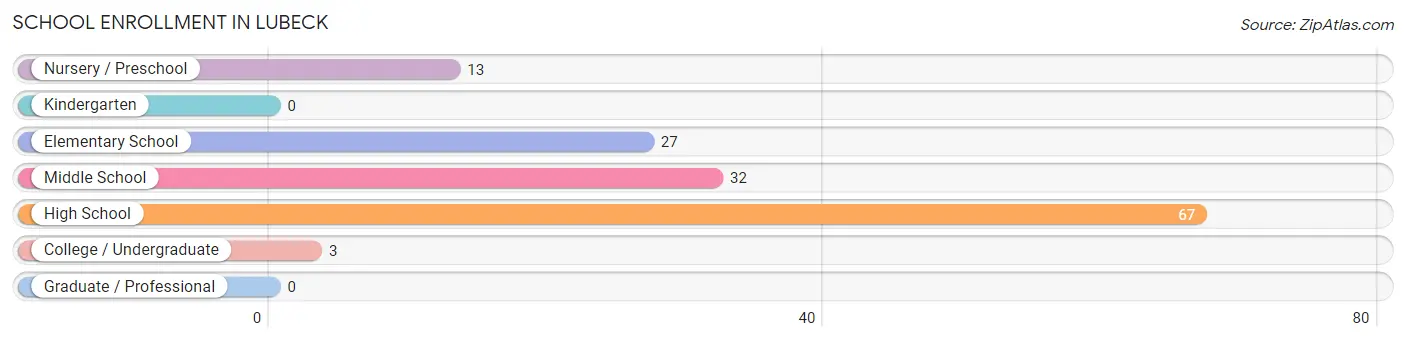
The most common levels of schooling among the 142 students in Lubeck are high school (67 | 47.2%), middle school (32 | 22.5%), and elementary school (27 | 19.0%).
| School Level | # Students | % Students |
| Nursery / Preschool | 13 | 9.1% |
| Kindergarten | 0 | 0.0% |
| Elementary School | 27 | 19.0% |
| Middle School | 32 | 22.5% |
| High School | 67 | 47.2% |
| College / Undergraduate | 3 | 2.1% |
| Graduate / Professional | 0 | 0.0% |
| Total | 142 | 100.0% |
School Enrollment by Age by Funding Source in Lubeck
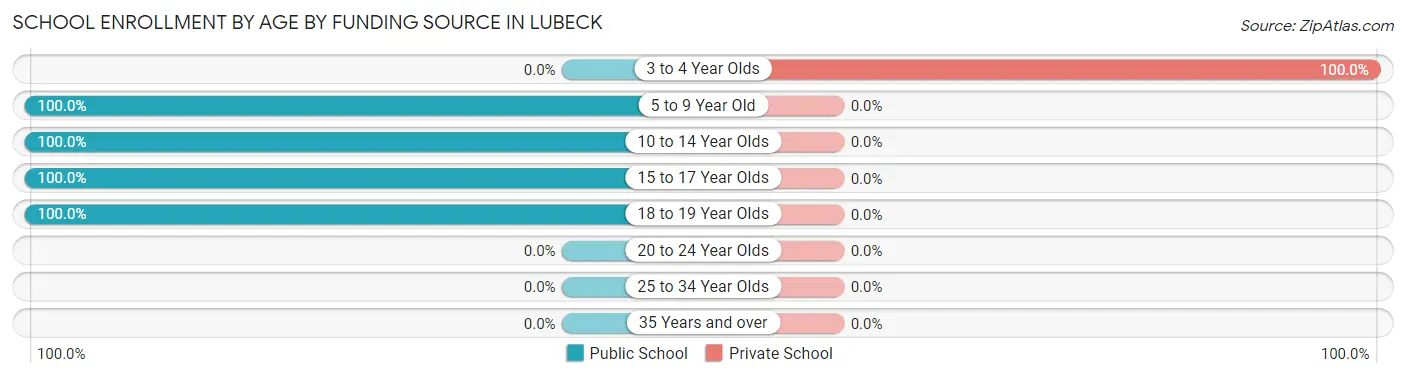
Out of a total of 142 students who are enrolled in schools in Lubeck, 13 (9.2%) attend a private institution, while the remaining 129 (90.8%) are enrolled in public schools. The age group of 3 to 4 year olds has the highest likelihood of being enrolled in private schools, with 13 (100.0% in the age bracket) enrolled. Conversely, the age group of 5 to 9 year old has the lowest likelihood of being enrolled in a private school, with 27 (100.0% in the age bracket) attending a public institution.
| Age Bracket | Public School | Private School |
| 3 to 4 Year Olds | 0 (0.0%) | 13 (100.0%) |
| 5 to 9 Year Old | 27 (100.0%) | 0 (0.0%) |
| 10 to 14 Year Olds | 61 (100.0%) | 0 (0.0%) |
| 15 to 17 Year Olds | 38 (100.0%) | 0 (0.0%) |
| 18 to 19 Year Olds | 3 (100.0%) | 0 (0.0%) |
| 20 to 24 Year Olds | 0 (0.0%) | 0 (0.0%) |
| 25 to 34 Year Olds | 0 (0.0%) | 0 (0.0%) |
| 35 Years and over | 0 (0.0%) | 0 (0.0%) |
| Total | 129 (90.8%) | 13 (9.2%) |
Educational Attainment by Field of Study in Lubeck
Business (159 | 50.6%), education (61 | 19.4%), social sciences (31 | 9.9%), bio, nature & agricultural (28 | 8.9%), and science & technology (23 | 7.3%) are the most common fields of study among 314 individuals in Lubeck who have obtained a bachelor's degree or higher.
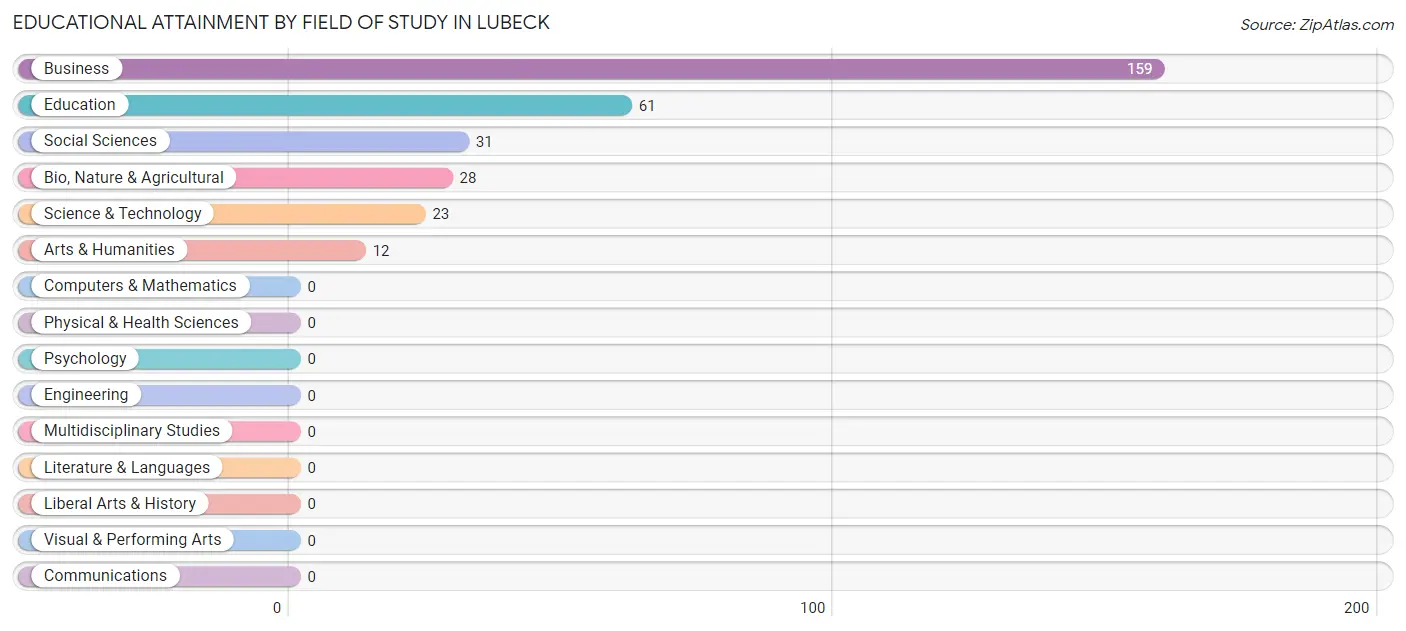
| Field of Study | # Graduates | % Graduates |
| Computers & Mathematics | 0 | 0.0% |
| Bio, Nature & Agricultural | 28 | 8.9% |
| Physical & Health Sciences | 0 | 0.0% |
| Psychology | 0 | 0.0% |
| Social Sciences | 31 | 9.9% |
| Engineering | 0 | 0.0% |
| Multidisciplinary Studies | 0 | 0.0% |
| Science & Technology | 23 | 7.3% |
| Business | 159 | 50.6% |
| Education | 61 | 19.4% |
| Literature & Languages | 0 | 0.0% |
| Liberal Arts & History | 0 | 0.0% |
| Visual & Performing Arts | 0 | 0.0% |
| Communications | 0 | 0.0% |
| Arts & Humanities | 12 | 3.8% |
| Total | 314 | 100.0% |
Transportation & Commute in Lubeck
Vehicle Availability by Sex in Lubeck
The most prevalent vehicle ownership categories in Lubeck are males with 2 vehicles (72, accounting for 40.0%) and females with 2 vehicles (110, making up 34.8%).
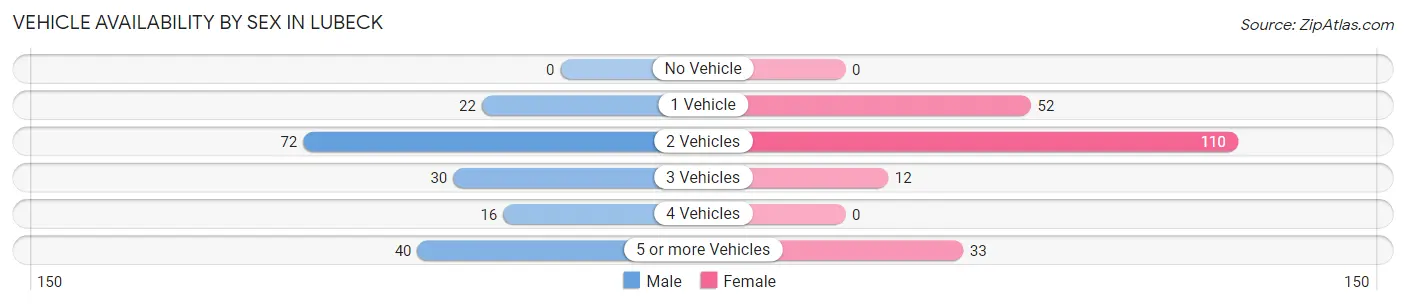
| Vehicles Available | Male | Female |
| No Vehicle | 0 (0.0%) | 0 (0.0%) |
| 1 Vehicle | 22 (12.2%) | 52 (25.1%) |
| 2 Vehicles | 72 (40.0%) | 110 (53.1%) |
| 3 Vehicles | 30 (16.7%) | 12 (5.8%) |
| 4 Vehicles | 16 (8.9%) | 0 (0.0%) |
| 5 or more Vehicles | 40 (22.2%) | 33 (15.9%) |
| Total | 180 (100.0%) | 207 (100.0%) |
Commute Time in Lubeck
The most frequently occuring commute durations in Lubeck are 15 to 19 minutes (180 commuters, 48.9%), 5 to 9 minutes (52 commuters, 14.1%), and 20 to 24 minutes (42 commuters, 11.4%).
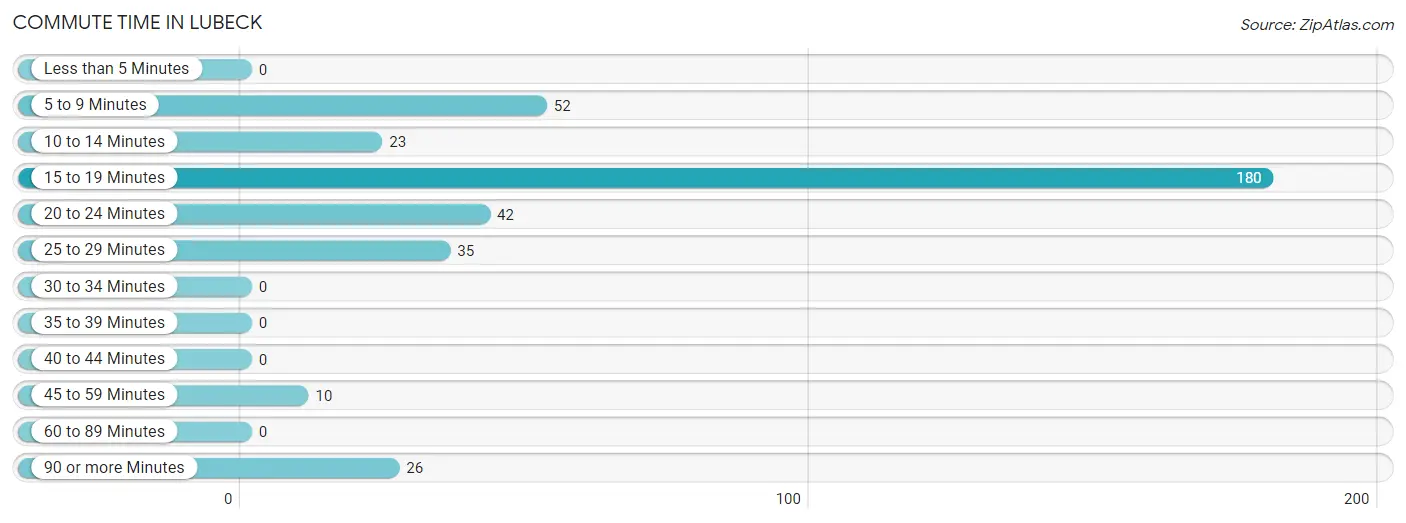
| Commute Time | # Commuters | % Commuters |
| Less than 5 Minutes | 0 | 0.0% |
| 5 to 9 Minutes | 52 | 14.1% |
| 10 to 14 Minutes | 23 | 6.2% |
| 15 to 19 Minutes | 180 | 48.9% |
| 20 to 24 Minutes | 42 | 11.4% |
| 25 to 29 Minutes | 35 | 9.5% |
| 30 to 34 Minutes | 0 | 0.0% |
| 35 to 39 Minutes | 0 | 0.0% |
| 40 to 44 Minutes | 0 | 0.0% |
| 45 to 59 Minutes | 10 | 2.7% |
| 60 to 89 Minutes | 0 | 0.0% |
| 90 or more Minutes | 26 | 7.1% |
Commute Time by Sex in Lubeck
The most common commute times in Lubeck are 15 to 19 minutes (114 commuters, 63.3%) for males and 15 to 19 minutes (66 commuters, 35.1%) for females.
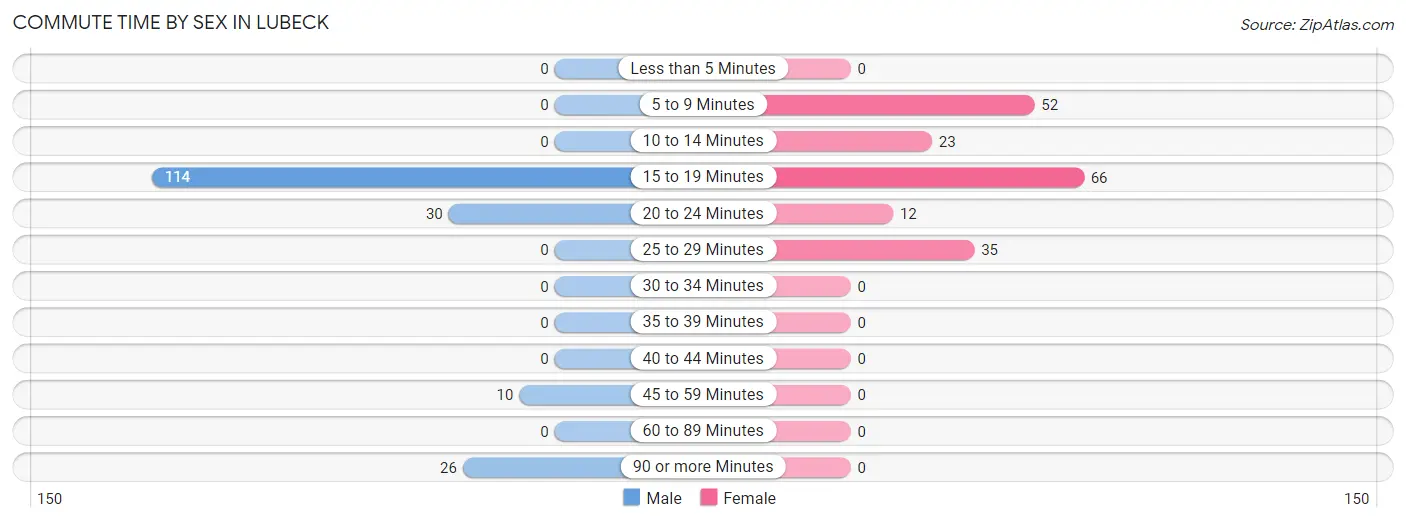
| Commute Time | Male | Female |
| Less than 5 Minutes | 0 (0.0%) | 0 (0.0%) |
| 5 to 9 Minutes | 0 (0.0%) | 52 (27.7%) |
| 10 to 14 Minutes | 0 (0.0%) | 23 (12.2%) |
| 15 to 19 Minutes | 114 (63.3%) | 66 (35.1%) |
| 20 to 24 Minutes | 30 (16.7%) | 12 (6.4%) |
| 25 to 29 Minutes | 0 (0.0%) | 35 (18.6%) |
| 30 to 34 Minutes | 0 (0.0%) | 0 (0.0%) |
| 35 to 39 Minutes | 0 (0.0%) | 0 (0.0%) |
| 40 to 44 Minutes | 0 (0.0%) | 0 (0.0%) |
| 45 to 59 Minutes | 10 (5.6%) | 0 (0.0%) |
| 60 to 89 Minutes | 0 (0.0%) | 0 (0.0%) |
| 90 or more Minutes | 26 (14.4%) | 0 (0.0%) |
Time of Departure to Work by Sex in Lubeck
The most frequent times of departure to work in Lubeck are 5:30 AM to 5:59 AM (58, 32.2%) for males and 7:00 AM to 7:29 AM (74, 39.4%) for females.
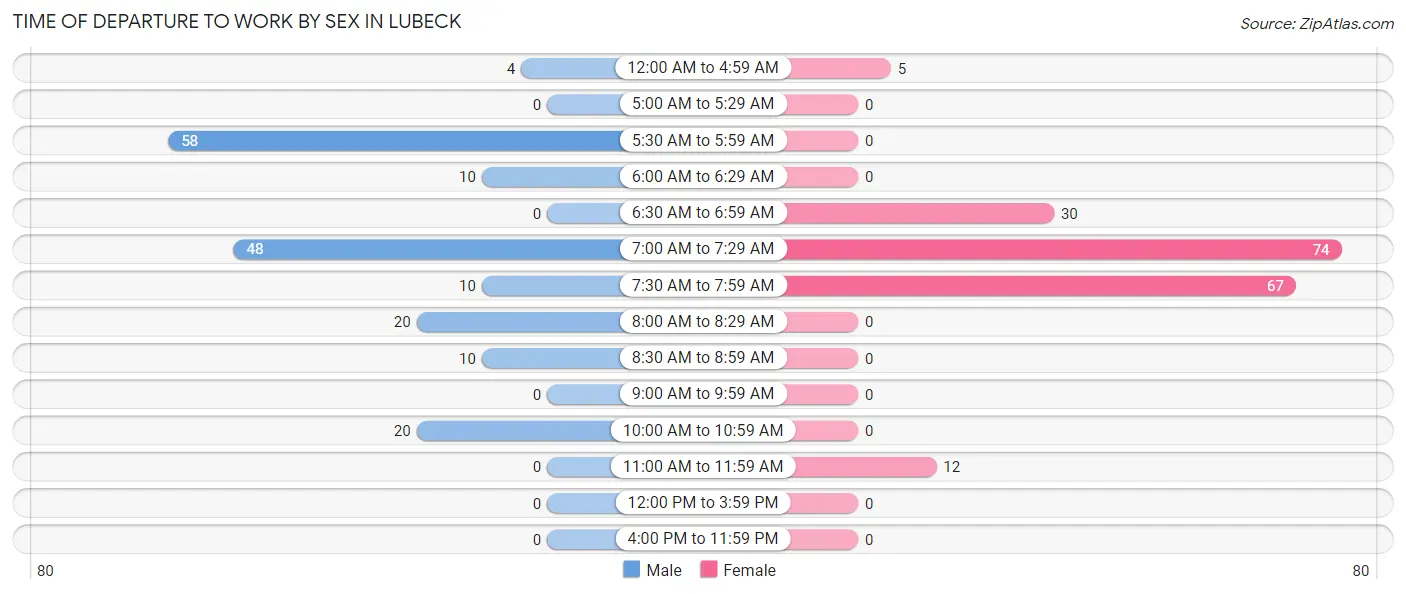
| Time of Departure | Male | Female |
| 12:00 AM to 4:59 AM | 4 (2.2%) | 5 (2.7%) |
| 5:00 AM to 5:29 AM | 0 (0.0%) | 0 (0.0%) |
| 5:30 AM to 5:59 AM | 58 (32.2%) | 0 (0.0%) |
| 6:00 AM to 6:29 AM | 10 (5.6%) | 0 (0.0%) |
| 6:30 AM to 6:59 AM | 0 (0.0%) | 30 (16.0%) |
| 7:00 AM to 7:29 AM | 48 (26.7%) | 74 (39.4%) |
| 7:30 AM to 7:59 AM | 10 (5.6%) | 67 (35.6%) |
| 8:00 AM to 8:29 AM | 20 (11.1%) | 0 (0.0%) |
| 8:30 AM to 8:59 AM | 10 (5.6%) | 0 (0.0%) |
| 9:00 AM to 9:59 AM | 0 (0.0%) | 0 (0.0%) |
| 10:00 AM to 10:59 AM | 20 (11.1%) | 0 (0.0%) |
| 11:00 AM to 11:59 AM | 0 (0.0%) | 12 (6.4%) |
| 12:00 PM to 3:59 PM | 0 (0.0%) | 0 (0.0%) |
| 4:00 PM to 11:59 PM | 0 (0.0%) | 0 (0.0%) |
| Total | 180 (100.0%) | 188 (100.0%) |
Housing Occupancy in Lubeck
Occupancy by Ownership in Lubeck
Of the total 610 dwellings in Lubeck, owner-occupied units account for 561 (92.0%), while renter-occupied units make up 49 (8.0%).
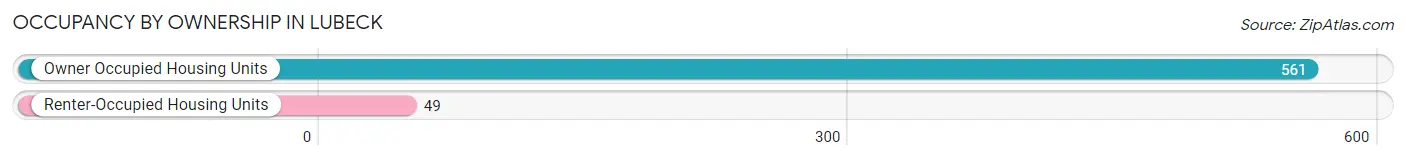
| Occupancy | # Housing Units | % Housing Units |
| Owner Occupied Housing Units | 561 | 92.0% |
| Renter-Occupied Housing Units | 49 | 8.0% |
| Total Occupied Housing Units | 610 | 100.0% |
Occupancy by Household Size in Lubeck
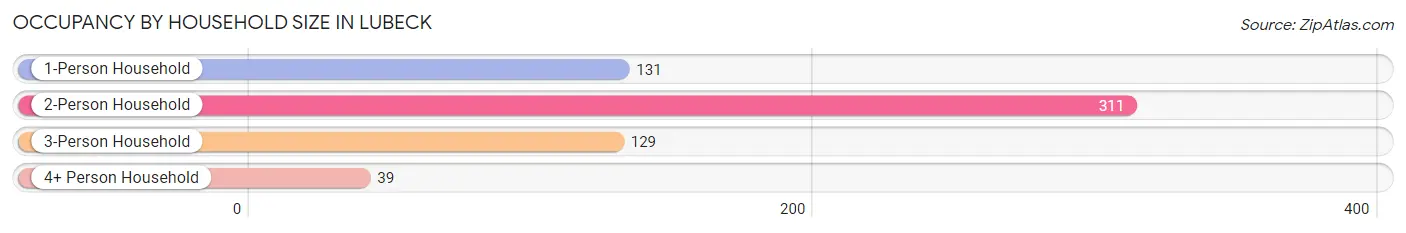
| Household Size | # Housing Units | % Housing Units |
| 1-Person Household | 131 | 21.5% |
| 2-Person Household | 311 | 51.0% |
| 3-Person Household | 129 | 21.1% |
| 4+ Person Household | 39 | 6.4% |
| Total Housing Units | 610 | 100.0% |
Occupancy by Ownership by Household Size in Lubeck
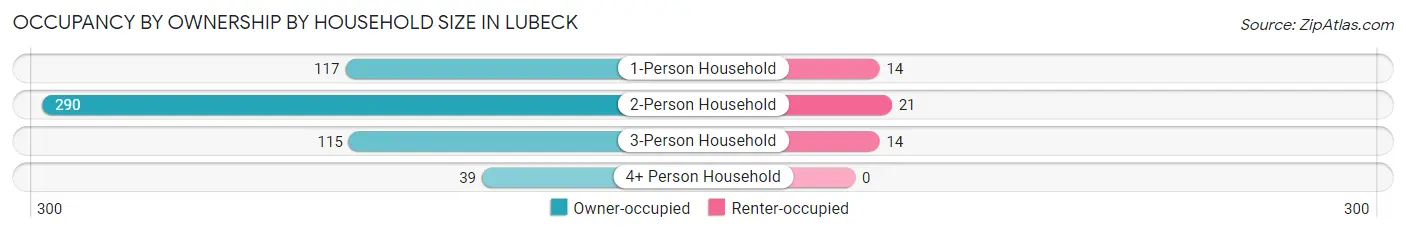
| Household Size | Owner-occupied | Renter-occupied |
| 1-Person Household | 117 (89.3%) | 14 (10.7%) |
| 2-Person Household | 290 (93.2%) | 21 (6.8%) |
| 3-Person Household | 115 (89.1%) | 14 (10.8%) |
| 4+ Person Household | 39 (100.0%) | 0 (0.0%) |
| Total Housing Units | 561 (92.0%) | 49 (8.0%) |
Occupancy by Educational Attainment in Lubeck
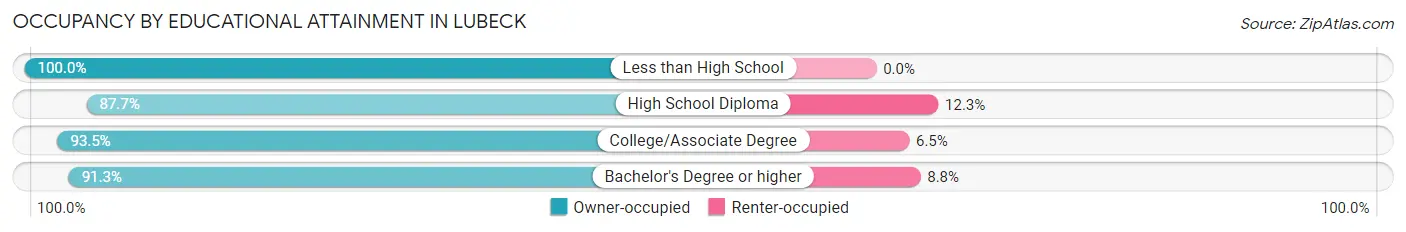
| Household Size | Owner-occupied | Renter-occupied |
| Less than High School | 14 (100.0%) | 0 (0.0%) |
| High School Diploma | 100 (87.7%) | 14 (12.3%) |
| College/Associate Degree | 301 (93.5%) | 21 (6.5%) |
| Bachelor's Degree or higher | 146 (91.2%) | 14 (8.7%) |
Occupancy by Age of Householder in Lubeck
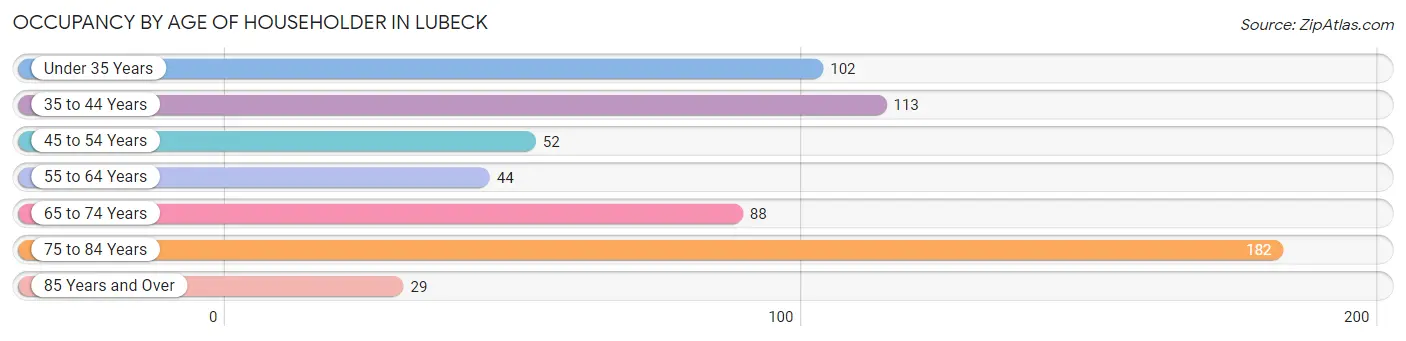
| Age Bracket | # Households | % Households |
| Under 35 Years | 102 | 16.7% |
| 35 to 44 Years | 113 | 18.5% |
| 45 to 54 Years | 52 | 8.5% |
| 55 to 64 Years | 44 | 7.2% |
| 65 to 74 Years | 88 | 14.4% |
| 75 to 84 Years | 182 | 29.8% |
| 85 Years and Over | 29 | 4.8% |
| Total | 610 | 100.0% |
Housing Finances in Lubeck
Median Income by Occupancy in Lubeck
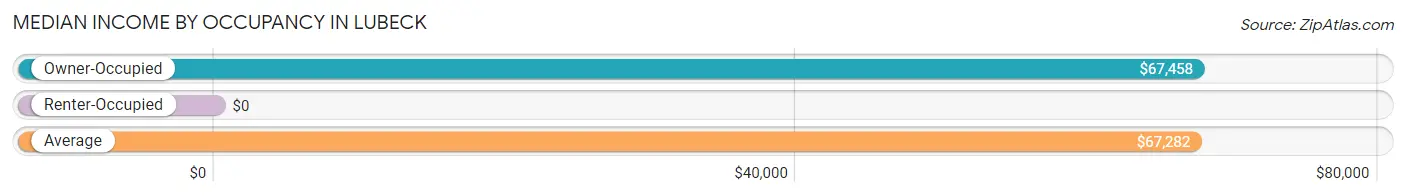
| Occupancy Type | # Households | Median Income |
| Owner-Occupied | 561 (92.0%) | $67,458 |
| Renter-Occupied | 49 (8.0%) | $0 |
| Average | 610 (100.0%) | $67,282 |
Occupancy by Householder Income Bracket in Lubeck
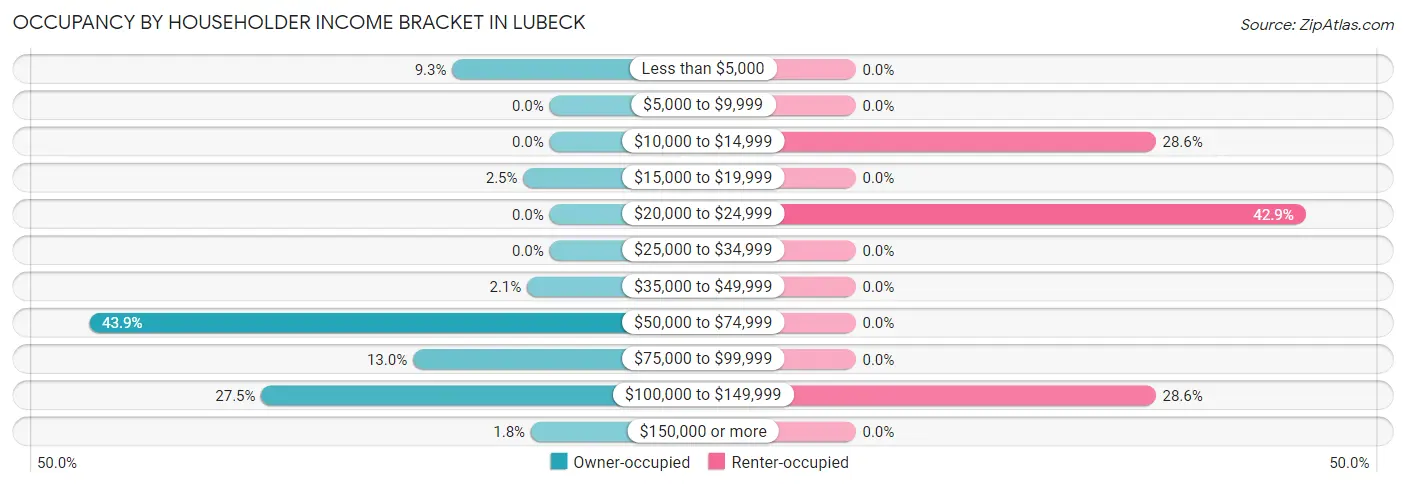
| Income Bracket | Owner-occupied | Renter-occupied |
| Less than $5,000 | 52 (9.3%) | 0 (0.0%) |
| $5,000 to $9,999 | 0 (0.0%) | 0 (0.0%) |
| $10,000 to $14,999 | 0 (0.0%) | 14 (28.6%) |
| $15,000 to $19,999 | 14 (2.5%) | 0 (0.0%) |
| $20,000 to $24,999 | 0 (0.0%) | 21 (42.9%) |
| $25,000 to $34,999 | 0 (0.0%) | 0 (0.0%) |
| $35,000 to $49,999 | 12 (2.1%) | 0 (0.0%) |
| $50,000 to $74,999 | 246 (43.9%) | 0 (0.0%) |
| $75,000 to $99,999 | 73 (13.0%) | 0 (0.0%) |
| $100,000 to $149,999 | 154 (27.5%) | 14 (28.6%) |
| $150,000 or more | 10 (1.8%) | 0 (0.0%) |
| Total | 561 (100.0%) | 49 (100.0%) |
Monthly Housing Cost Tiers in Lubeck
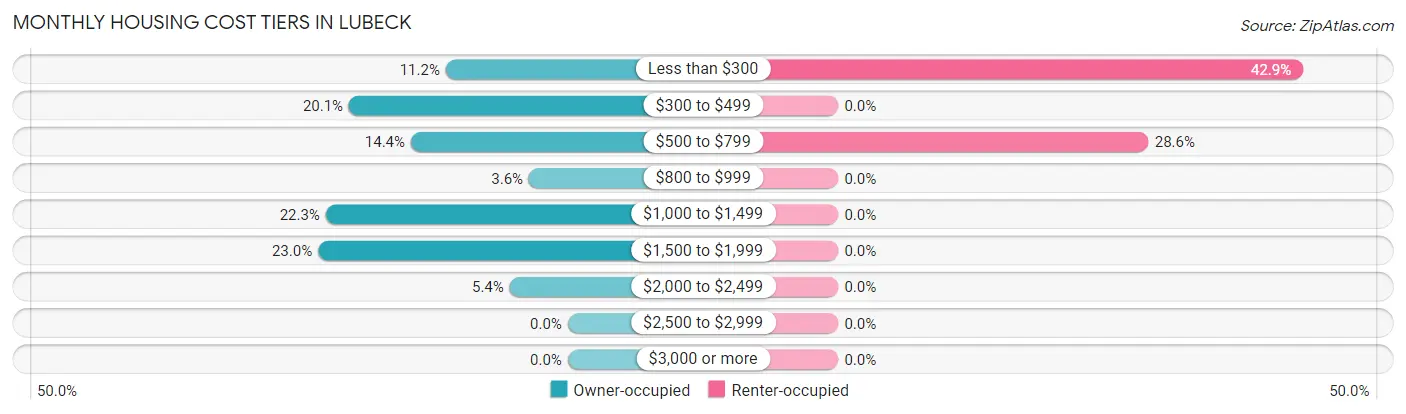
| Monthly Cost | Owner-occupied | Renter-occupied |
| Less than $300 | 63 (11.2%) | 21 (42.9%) |
| $300 to $499 | 113 (20.1%) | 0 (0.0%) |
| $500 to $799 | 81 (14.4%) | 14 (28.6%) |
| $800 to $999 | 20 (3.6%) | 0 (0.0%) |
| $1,000 to $1,499 | 125 (22.3%) | 0 (0.0%) |
| $1,500 to $1,999 | 129 (23.0%) | 0 (0.0%) |
| $2,000 to $2,499 | 30 (5.3%) | 0 (0.0%) |
| $2,500 to $2,999 | 0 (0.0%) | 0 (0.0%) |
| $3,000 or more | 0 (0.0%) | 0 (0.0%) |
| Total | 561 (100.0%) | 49 (100.0%) |
Physical Housing Characteristics in Lubeck
Housing Structures in Lubeck
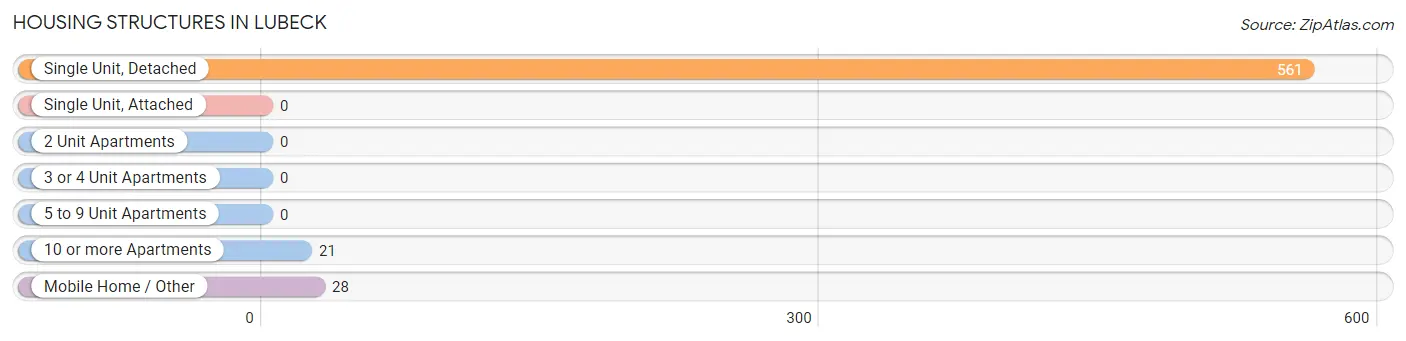
| Structure Type | # Housing Units | % Housing Units |
| Single Unit, Detached | 561 | 92.0% |
| Single Unit, Attached | 0 | 0.0% |
| 2 Unit Apartments | 0 | 0.0% |
| 3 or 4 Unit Apartments | 0 | 0.0% |
| 5 to 9 Unit Apartments | 0 | 0.0% |
| 10 or more Apartments | 21 | 3.4% |
| Mobile Home / Other | 28 | 4.6% |
| Total | 610 | 100.0% |
Housing Structures by Occupancy in Lubeck
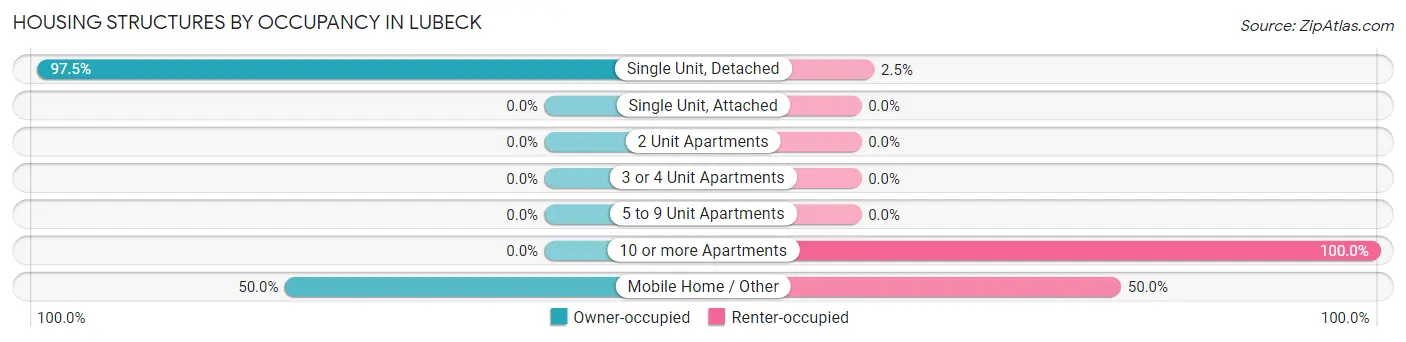
| Structure Type | Owner-occupied | Renter-occupied |
| Single Unit, Detached | 547 (97.5%) | 14 (2.5%) |
| Single Unit, Attached | 0 (0.0%) | 0 (0.0%) |
| 2 Unit Apartments | 0 (0.0%) | 0 (0.0%) |
| 3 or 4 Unit Apartments | 0 (0.0%) | 0 (0.0%) |
| 5 to 9 Unit Apartments | 0 (0.0%) | 0 (0.0%) |
| 10 or more Apartments | 0 (0.0%) | 21 (100.0%) |
| Mobile Home / Other | 14 (50.0%) | 14 (50.0%) |
| Total | 561 (92.0%) | 49 (8.0%) |
Housing Structures by Number of Rooms in Lubeck
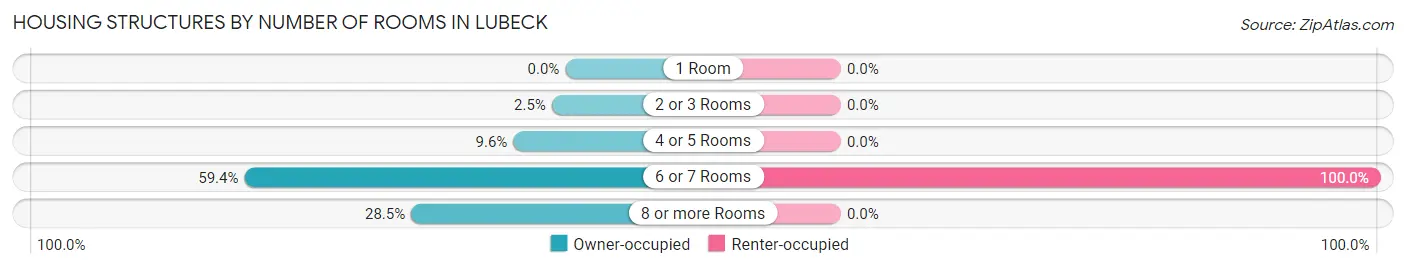
| Number of Rooms | Owner-occupied | Renter-occupied |
| 1 Room | 0 (0.0%) | 0 (0.0%) |
| 2 or 3 Rooms | 14 (2.5%) | 0 (0.0%) |
| 4 or 5 Rooms | 54 (9.6%) | 0 (0.0%) |
| 6 or 7 Rooms | 333 (59.4%) | 49 (100.0%) |
| 8 or more Rooms | 160 (28.5%) | 0 (0.0%) |
| Total | 561 (100.0%) | 49 (100.0%) |
Housing Structure by Heating Type in Lubeck
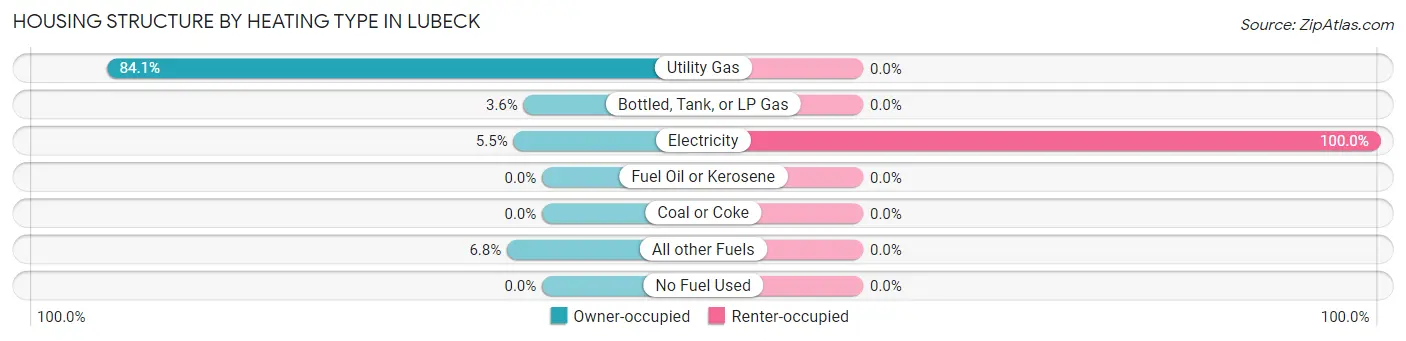
| Heating Type | Owner-occupied | Renter-occupied |
| Utility Gas | 472 (84.1%) | 0 (0.0%) |
| Bottled, Tank, or LP Gas | 20 (3.6%) | 0 (0.0%) |
| Electricity | 31 (5.5%) | 49 (100.0%) |
| Fuel Oil or Kerosene | 0 (0.0%) | 0 (0.0%) |
| Coal or Coke | 0 (0.0%) | 0 (0.0%) |
| All other Fuels | 38 (6.8%) | 0 (0.0%) |
| No Fuel Used | 0 (0.0%) | 0 (0.0%) |
| Total | 561 (100.0%) | 49 (100.0%) |
Household Vehicle Usage in Lubeck
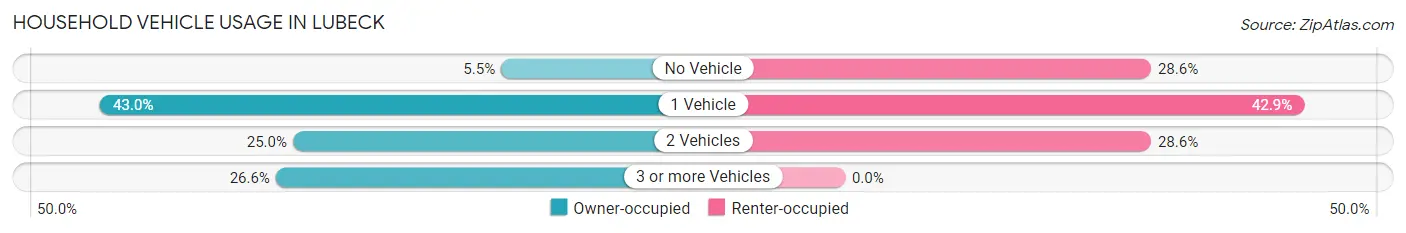
| Vehicles per Household | Owner-occupied | Renter-occupied |
| No Vehicle | 31 (5.5%) | 14 (28.6%) |
| 1 Vehicle | 241 (43.0%) | 21 (42.9%) |
| 2 Vehicles | 140 (25.0%) | 14 (28.6%) |
| 3 or more Vehicles | 149 (26.6%) | 0 (0.0%) |
| Total | 561 (100.0%) | 49 (100.0%) |
Real Estate & Mortgages in Lubeck
Real Estate and Mortgage Overview in Lubeck
| Characteristic | Without Mortgage | With Mortgage |
| Housing Units | 243 | 318 |
| Median Property Value | $193,800 | $222,500 |
| Median Household Income | $81,172 | $10 |
| Monthly Housing Costs | $334 | $0 |
| Real Estate Taxes | $762 | $59 |
Property Value by Mortgage Status in Lubeck
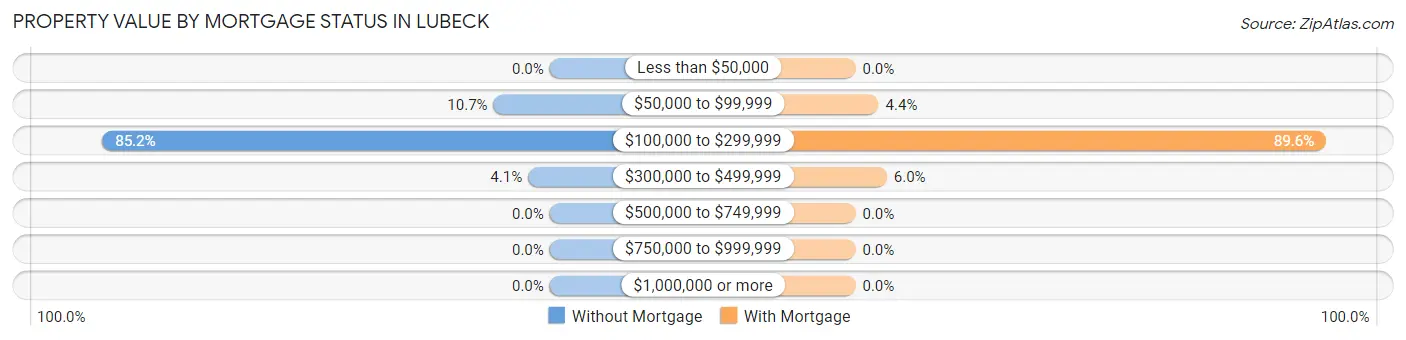
| Property Value | Without Mortgage | With Mortgage |
| Less than $50,000 | 0 (0.0%) | 0 (0.0%) |
| $50,000 to $99,999 | 26 (10.7%) | 14 (4.4%) |
| $100,000 to $299,999 | 207 (85.2%) | 285 (89.6%) |
| $300,000 to $499,999 | 10 (4.1%) | 19 (6.0%) |
| $500,000 to $749,999 | 0 (0.0%) | 0 (0.0%) |
| $750,000 to $999,999 | 0 (0.0%) | 0 (0.0%) |
| $1,000,000 or more | 0 (0.0%) | 0 (0.0%) |
| Total | 243 (100.0%) | 318 (100.0%) |
Household Income by Mortgage Status in Lubeck
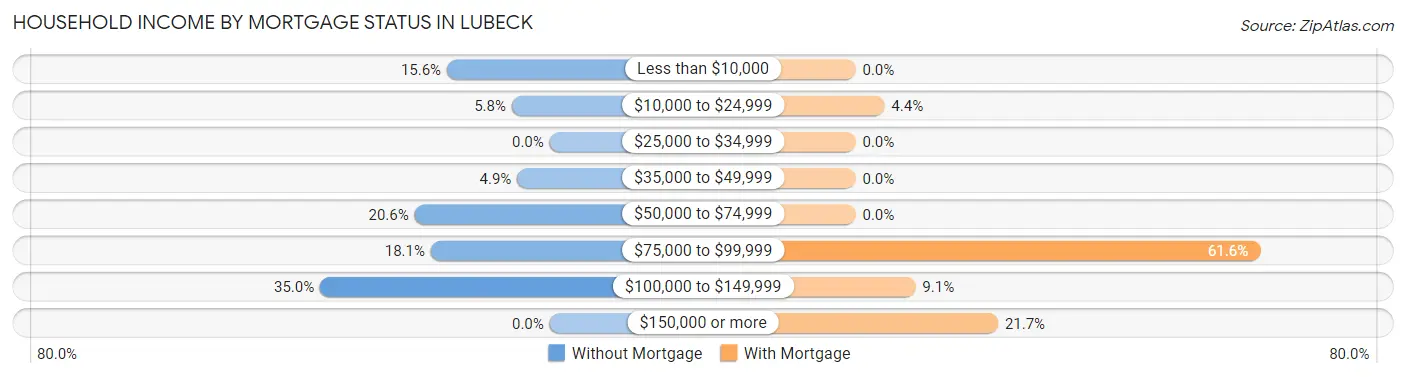
| Household Income | Without Mortgage | With Mortgage |
| Less than $10,000 | 38 (15.6%) | 0 (0.0%) |
| $10,000 to $24,999 | 14 (5.8%) | 14 (4.4%) |
| $25,000 to $34,999 | 0 (0.0%) | 0 (0.0%) |
| $35,000 to $49,999 | 12 (4.9%) | 0 (0.0%) |
| $50,000 to $74,999 | 50 (20.6%) | 0 (0.0%) |
| $75,000 to $99,999 | 44 (18.1%) | 196 (61.6%) |
| $100,000 to $149,999 | 85 (35.0%) | 29 (9.1%) |
| $150,000 or more | 0 (0.0%) | 69 (21.7%) |
| Total | 243 (100.0%) | 318 (100.0%) |
Property Value to Household Income Ratio in Lubeck
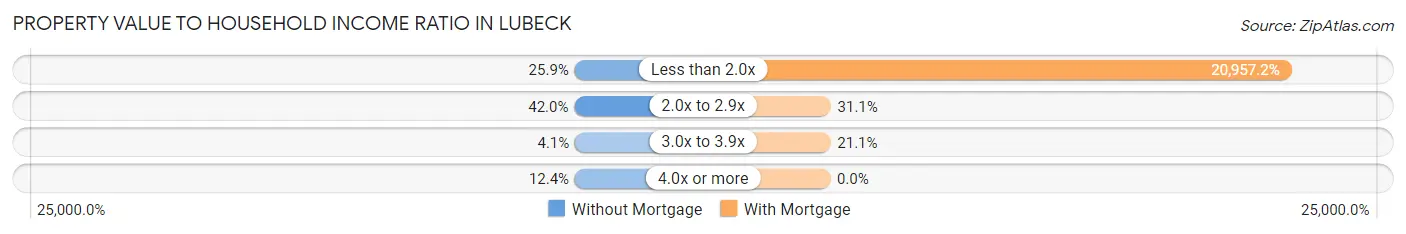
| Value-to-Income Ratio | Without Mortgage | With Mortgage |
| Less than 2.0x | 63 (25.9%) | 66,644 (20,957.2%) |
| 2.0x to 2.9x | 102 (42.0%) | 99 (31.1%) |
| 3.0x to 3.9x | 10 (4.1%) | 67 (21.1%) |
| 4.0x or more | 30 (12.3%) | 0 (0.0%) |
| Total | 243 (100.0%) | 318 (100.0%) |
Real Estate Taxes by Mortgage Status in Lubeck
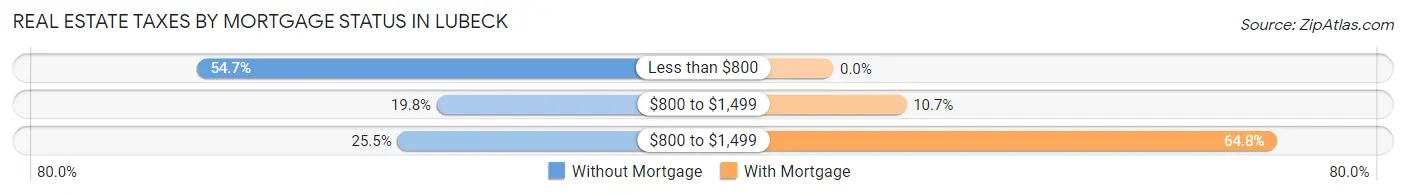
| Property Taxes | Without Mortgage | With Mortgage |
| Less than $800 | 133 (54.7%) | 0 (0.0%) |
| $800 to $1,499 | 48 (19.8%) | 34 (10.7%) |
| $800 to $1,499 | 62 (25.5%) | 206 (64.8%) |
| Total | 243 (100.0%) | 318 (100.0%) |
Health & Disability in Lubeck
Health Insurance Coverage by Age in Lubeck
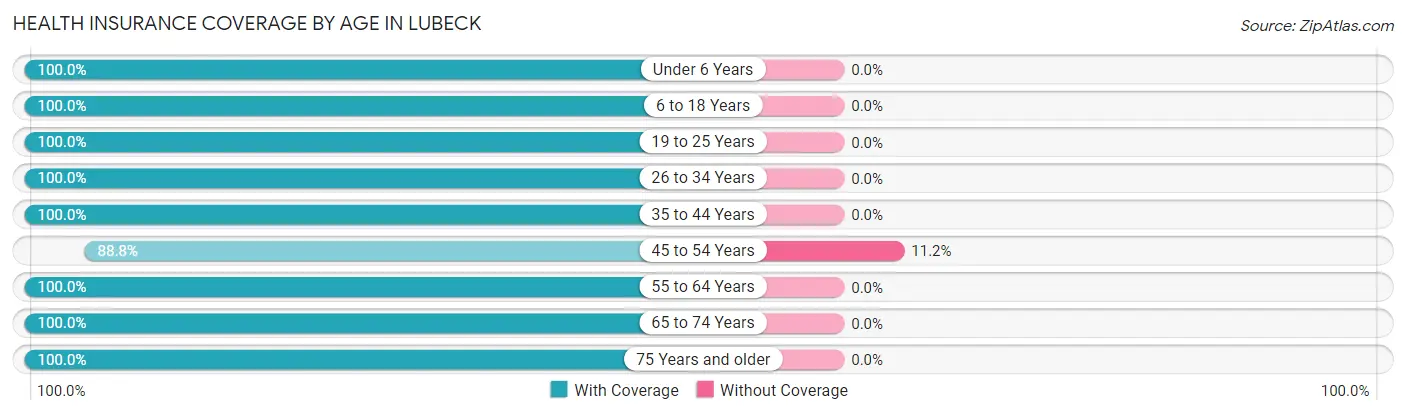
| Age Bracket | With Coverage | Without Coverage |
| Under 6 Years | 104 (100.0%) | 0 (0.0%) |
| 6 to 18 Years | 155 (100.0%) | 0 (0.0%) |
| 19 to 25 Years | 15 (100.0%) | 0 (0.0%) |
| 26 to 34 Years | 166 (100.0%) | 0 (0.0%) |
| 35 to 44 Years | 137 (100.0%) | 0 (0.0%) |
| 45 to 54 Years | 111 (88.8%) | 14 (11.2%) |
| 55 to 64 Years | 89 (100.0%) | 0 (0.0%) |
| 65 to 74 Years | 136 (100.0%) | 0 (0.0%) |
| 75 Years and older | 363 (100.0%) | 0 (0.0%) |
| Total | 1,276 (98.9%) | 14 (1.1%) |
Health Insurance Coverage by Citizenship Status in Lubeck
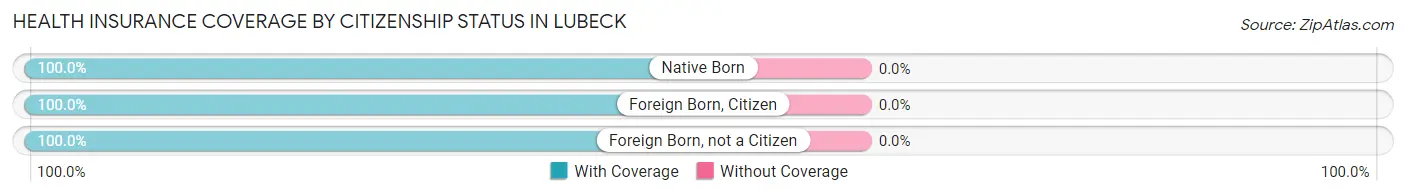
| Citizenship Status | With Coverage | Without Coverage |
| Native Born | 104 (100.0%) | 0 (0.0%) |
| Foreign Born, Citizen | 155 (100.0%) | 0 (0.0%) |
| Foreign Born, not a Citizen | 15 (100.0%) | 0 (0.0%) |
Health Insurance Coverage by Household Income in Lubeck
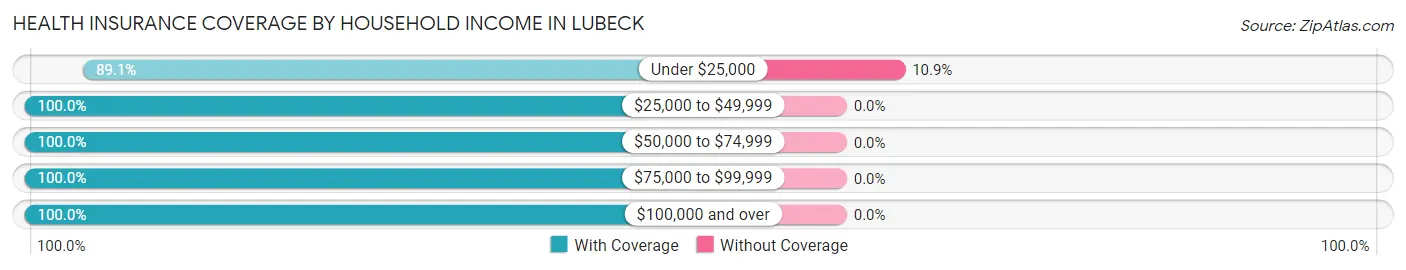
| Household Income | With Coverage | Without Coverage |
| Under $25,000 | 114 (89.1%) | 14 (10.9%) |
| $25,000 to $49,999 | 12 (100.0%) | 0 (0.0%) |
| $50,000 to $74,999 | 541 (100.0%) | 0 (0.0%) |
| $75,000 to $99,999 | 162 (100.0%) | 0 (0.0%) |
| $100,000 and over | 447 (100.0%) | 0 (0.0%) |
Public vs Private Health Insurance Coverage by Age in Lubeck
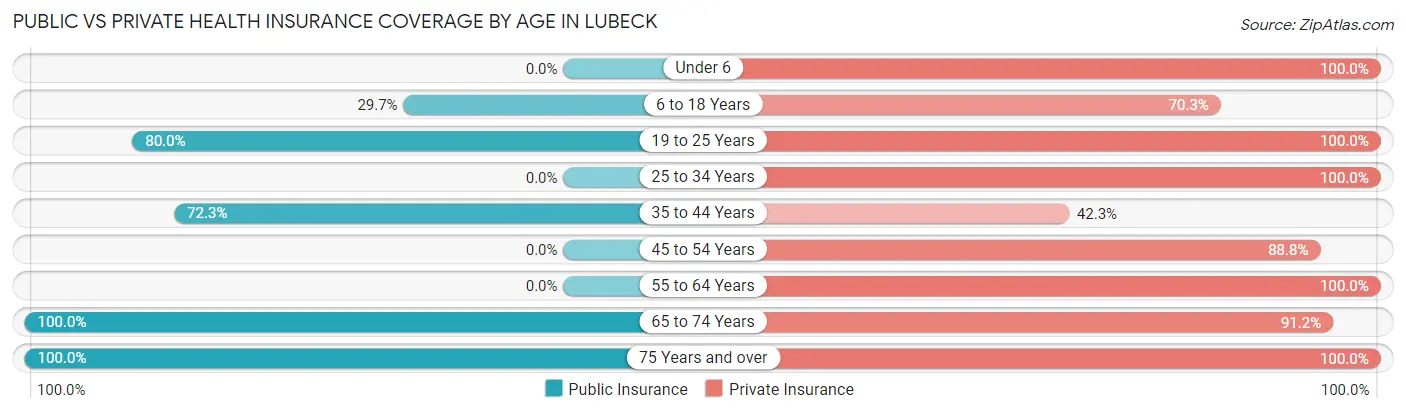
| Age Bracket | Public Insurance | Private Insurance |
| Under 6 | 0 (0.0%) | 104 (100.0%) |
| 6 to 18 Years | 46 (29.7%) | 109 (70.3%) |
| 19 to 25 Years | 12 (80.0%) | 15 (100.0%) |
| 25 to 34 Years | 0 (0.0%) | 166 (100.0%) |
| 35 to 44 Years | 99 (72.3%) | 58 (42.3%) |
| 45 to 54 Years | 0 (0.0%) | 111 (88.8%) |
| 55 to 64 Years | 0 (0.0%) | 89 (100.0%) |
| 65 to 74 Years | 136 (100.0%) | 124 (91.2%) |
| 75 Years and over | 363 (100.0%) | 363 (100.0%) |
| Total | 656 (50.8%) | 1,139 (88.3%) |
Disability Status by Sex by Age in Lubeck
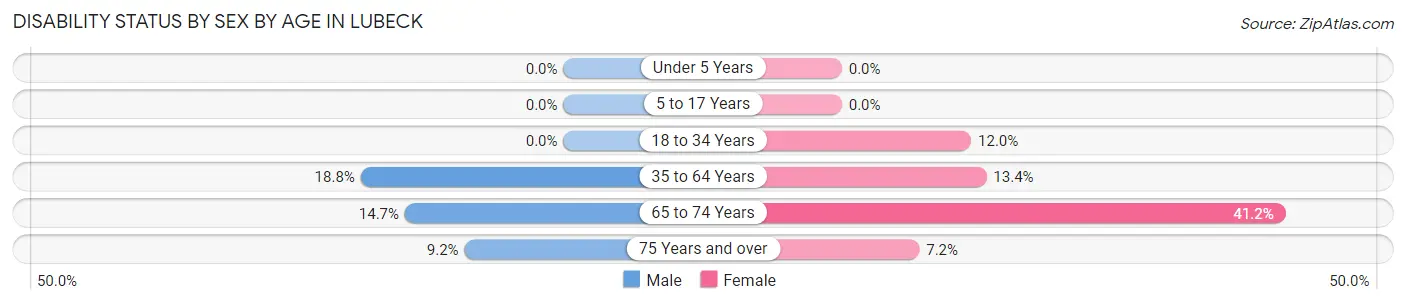
| Age Bracket | Male | Female |
| Under 5 Years | 0 (0.0%) | 0 (0.0%) |
| 5 to 17 Years | 0 (0.0%) | 0 (0.0%) |
| 18 to 34 Years | 0 (0.0%) | 12 (12.0%) |
| 35 to 64 Years | 38 (18.8%) | 20 (13.4%) |
| 65 to 74 Years | 10 (14.7%) | 28 (41.2%) |
| 75 Years and over | 18 (9.2%) | 12 (7.2%) |
Disability Class by Sex by Age in Lubeck
Disability Class: Hearing Difficulty
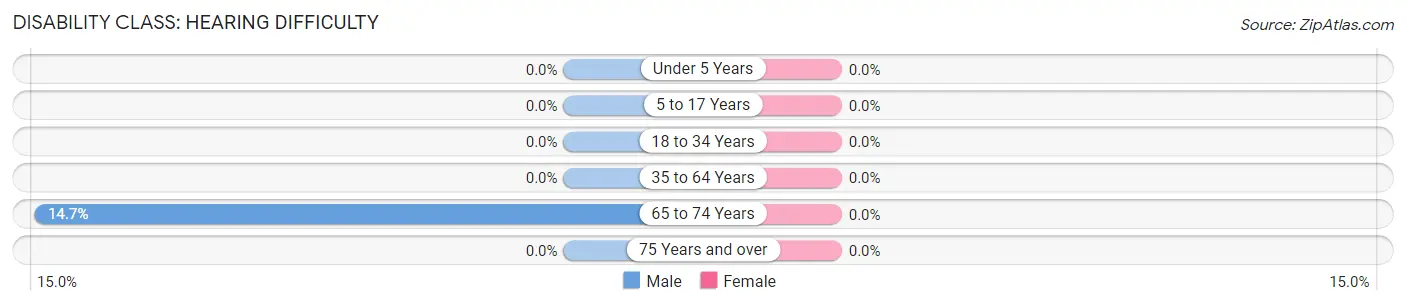
| Age Bracket | Male | Female |
| Under 5 Years | 0 (0.0%) | 0 (0.0%) |
| 5 to 17 Years | 0 (0.0%) | 0 (0.0%) |
| 18 to 34 Years | 0 (0.0%) | 0 (0.0%) |
| 35 to 64 Years | 0 (0.0%) | 0 (0.0%) |
| 65 to 74 Years | 10 (14.7%) | 0 (0.0%) |
| 75 Years and over | 0 (0.0%) | 0 (0.0%) |
Disability Class: Vision Difficulty
| Age Bracket | Male | Female |
| Under 5 Years | 0 (0.0%) | 0 (0.0%) |
| 5 to 17 Years | 0 (0.0%) | 0 (0.0%) |
| 18 to 34 Years | 0 (0.0%) | 0 (0.0%) |
| 35 to 64 Years | 0 (0.0%) | 0 (0.0%) |
| 65 to 74 Years | 0 (0.0%) | 0 (0.0%) |
| 75 Years and over | 0 (0.0%) | 0 (0.0%) |
Disability Class: Cognitive Difficulty
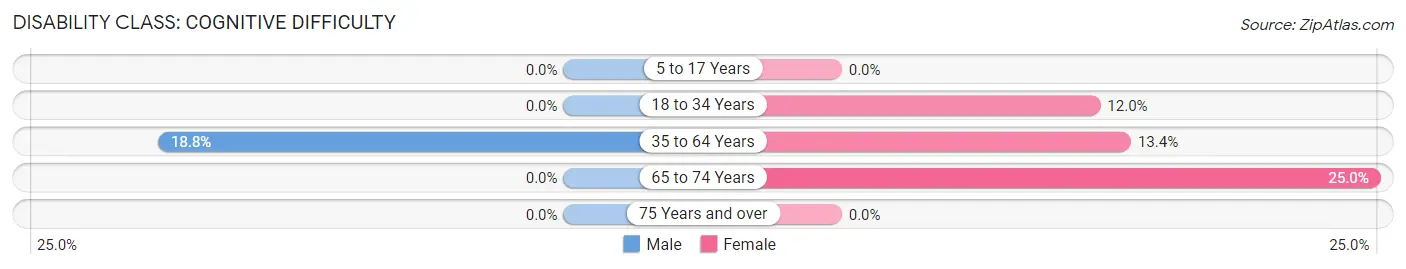
| Age Bracket | Male | Female |
| 5 to 17 Years | 0 (0.0%) | 0 (0.0%) |
| 18 to 34 Years | 0 (0.0%) | 12 (12.0%) |
| 35 to 64 Years | 38 (18.8%) | 20 (13.4%) |
| 65 to 74 Years | 0 (0.0%) | 17 (25.0%) |
| 75 Years and over | 0 (0.0%) | 0 (0.0%) |
Disability Class: Ambulatory Difficulty
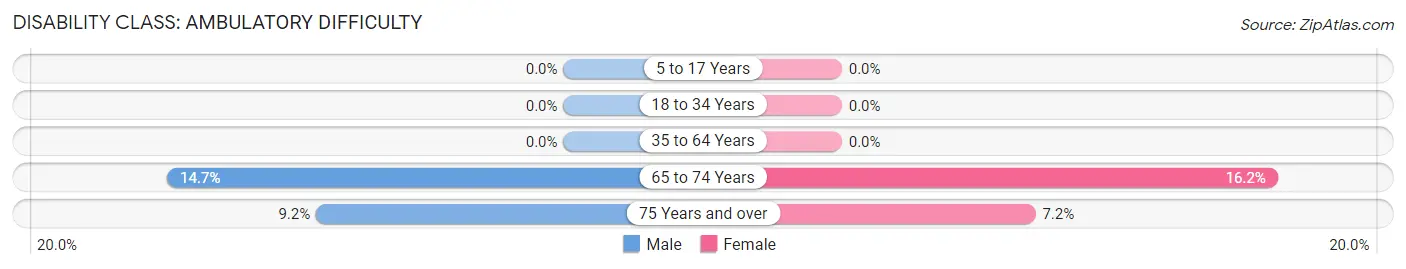
| Age Bracket | Male | Female |
| 5 to 17 Years | 0 (0.0%) | 0 (0.0%) |
| 18 to 34 Years | 0 (0.0%) | 0 (0.0%) |
| 35 to 64 Years | 0 (0.0%) | 0 (0.0%) |
| 65 to 74 Years | 10 (14.7%) | 11 (16.2%) |
| 75 Years and over | 18 (9.2%) | 12 (7.2%) |
Disability Class: Self-Care Difficulty
| Age Bracket | Male | Female |
| 5 to 17 Years | 0 (0.0%) | 0 (0.0%) |
| 18 to 34 Years | 0 (0.0%) | 0 (0.0%) |
| 35 to 64 Years | 0 (0.0%) | 0 (0.0%) |
| 65 to 74 Years | 0 (0.0%) | 0 (0.0%) |
| 75 Years and over | 0 (0.0%) | 0 (0.0%) |
Technology Access in Lubeck
Computing Device Access in Lubeck
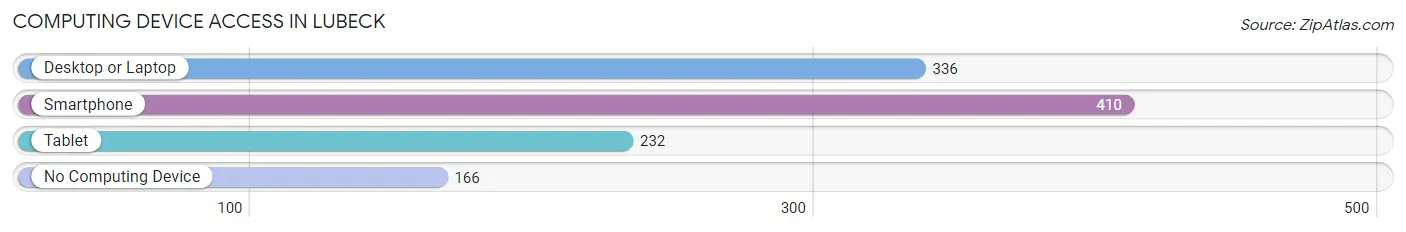
| Device Type | # Households | % Households |
| Desktop or Laptop | 336 | 55.1% |
| Smartphone | 410 | 67.2% |
| Tablet | 232 | 38.0% |
| No Computing Device | 166 | 27.2% |
| Total | 610 | 100.0% |
Internet Access in Lubeck
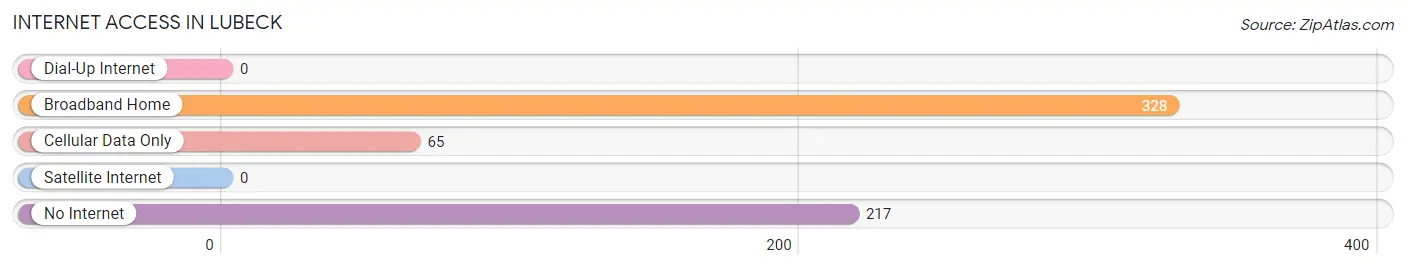
| Internet Type | # Households | % Households |
| Dial-Up Internet | 0 | 0.0% |
| Broadband Home | 328 | 53.8% |
| Cellular Data Only | 65 | 10.7% |
| Satellite Internet | 0 | 0.0% |
| No Internet | 217 | 35.6% |
| Total | 610 | 100.0% |
Lubeck Summary
Lubeck is a small town located in the northern part of West Virginia, in the United States. It is situated in the heart of the Appalachian Mountains, and is surrounded by lush forests and rolling hills. The town has a population of just over 1,000 people, and is part of the larger Lewis County.
History
Lubeck was founded in 1820 by a group of German immigrants who had settled in the area. The town was named after the city of Lübeck in Germany, and the settlers brought with them many of the customs and traditions of their homeland. The town quickly grew and prospered, and by the mid-1800s it had become a thriving community.
The town was an important stop on the Baltimore and Ohio Railroad, and it was also the site of a major Civil War battle in 1863. The Battle of Lubeck was a major victory for the Union forces, and it helped to secure the area for the Union.
Geography
Lubeck is located in the northern part of West Virginia, in the Appalachian Mountains. The town is situated in a valley, surrounded by rolling hills and lush forests. The town is located near the Potomac River, and is about an hour’s drive from Washington, D.C.
The climate in Lubeck is temperate, with hot summers and cold winters. The average temperature in the summer is around 75 degrees Fahrenheit, and in the winter it is around 35 degrees Fahrenheit. The town receives an average of 40 inches of rain per year, and snowfall is usually light.
Economy
The economy of Lubeck is largely based on agriculture and tourism. The town is home to several farms, and the surrounding area is known for its production of apples, peaches, and other fruits and vegetables. The town is also a popular tourist destination, and it is home to several historic sites, including the Battle of Lubeck Civil War site.
The town is also home to several small businesses, including restaurants, shops, and other services. The town is served by the Lewis County Airport, which provides air service to the surrounding area.
Demographics
As of the 2010 census, the population of Lubeck was 1,072. The town is predominantly white, with a small African American population. The median household income in the town is $37,000, and the median age is 44.
The town is served by the Lewis County School District, which includes two elementary schools, a middle school, and a high school. The town is also home to a branch of the West Virginia University Institute of Technology.
Conclusion
Lubeck is a small town located in the northern part of West Virginia, in the United States. It is situated in the heart of the Appalachian Mountains, and is surrounded by lush forests and rolling hills. The town has a population of just over 1,000 people, and is part of the larger Lewis County. The economy of Lubeck is largely based on agriculture and tourism, and the town is home to several small businesses. The town is served by the Lewis County School District, and is home to a branch of the West Virginia University Institute of Technology.
Common Questions
What is Per Capita Income in Lubeck?
Per Capita income in Lubeck is $37,011.
What is the Median Family Income in Lubeck?
Median Family Income in Lubeck is $73,000.
What is the Median Household income in Lubeck?
Median Household Income in Lubeck is $67,282.
What is Income or Wage Gap in Lubeck?
Income or Wage Gap in Lubeck is 48.8%.
Women in Lubeck earn 51.2 cents for every dollar earned by a man.
What is Inequality or Gini Index in Lubeck?
Inequality or Gini Index in Lubeck is 0.31.
What is the Total Population of Lubeck?
Total Population of Lubeck is 1,290.
What is the Total Male Population of Lubeck?
Total Male Population of Lubeck is 699.
What is the Total Female Population of Lubeck?
Total Female Population of Lubeck is 591.
What is the Ratio of Males per 100 Females in Lubeck?
There are 118.27 Males per 100 Females in Lubeck.
What is the Ratio of Females per 100 Males in Lubeck?
There are 84.55 Females per 100 Males in Lubeck.
What is the Median Population Age in Lubeck?
Median Population Age in Lubeck is 52.3 Years.
What is the Average Family Size in Lubeck
Average Family Size in Lubeck is 2.3 People.
What is the Average Household Size in Lubeck
Average Household Size in Lubeck is 2.1 People.
How Large is the Labor Force in Lubeck?
There are 439 People in the Labor Forcein in Lubeck.
What is the Percentage of People in the Labor Force in Lubeck?
41.8% of People are in the Labor Force in Lubeck.
What is the Unemployment Rate in Lubeck?
Unemployment Rate in Lubeck is 11.8%.