Leon, WV Map & Demographics
Leon Map
Leon Overview
$11,224
PER CAPITA INCOME
$32,024
AVG FAMILY INCOME
$32,083
AVG HOUSEHOLD INCOME
72.6%
WAGE / INCOME GAP [ % ]
27.4¢/ $1
WAGE / INCOME GAP [ $ ]
0.33
INEQUALITY / GINI INDEX
369
TOTAL POPULATION
152
MALE POPULATION
217
FEMALE POPULATION
70.05
MALES / 100 FEMALES
142.76
FEMALES / 100 MALES
14.8
MEDIAN AGE
3.4
AVG FAMILY SIZE
4.0
AVG HOUSEHOLD SIZE
94
LABOR FORCE [ PEOPLE ]
51.9%
PERCENT IN LABOR FORCE
Leon Zip Codes
Leon Area Codes
Income in Leon
Income Overview in Leon
Per Capita Income in Leon is $11,224, while median incomes of families and households are $32,024 and $32,083 respectively.
| Characteristic | Number | Measure |
| Per Capita Income | 369 | $11,224 |
| Median Family Income | 88 | $32,024 |
| Mean Family Income | 88 | $40,733 |
| Median Household Income | 93 | $32,083 |
| Mean Household Income | 93 | $41,981 |
| Income Deficit | 88 | $0 |
| Wage / Income Gap (%) | 369 | 72.58% |
| Wage / Income Gap ($) | 369 | 27.42¢ per $1 |
| Gini / Inequality Index | 369 | 0.33 |
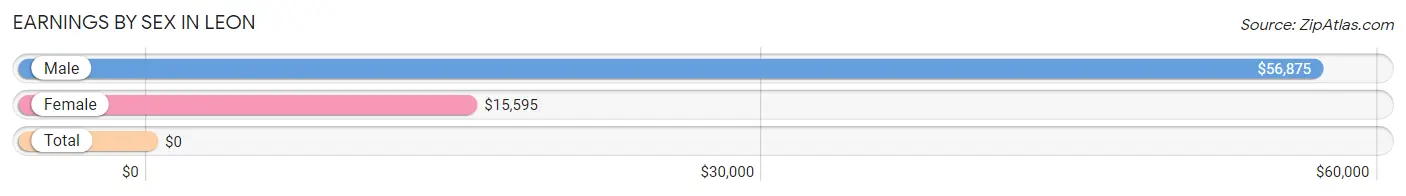
Earnings by Sex in Leon
| Sex | Number | Average Earnings |
| Male | 45 (38.5%) | $56,875 |
| Female | 72 (61.5%) | $15,595 |
| Total | 117 (100.0%) | $0 |
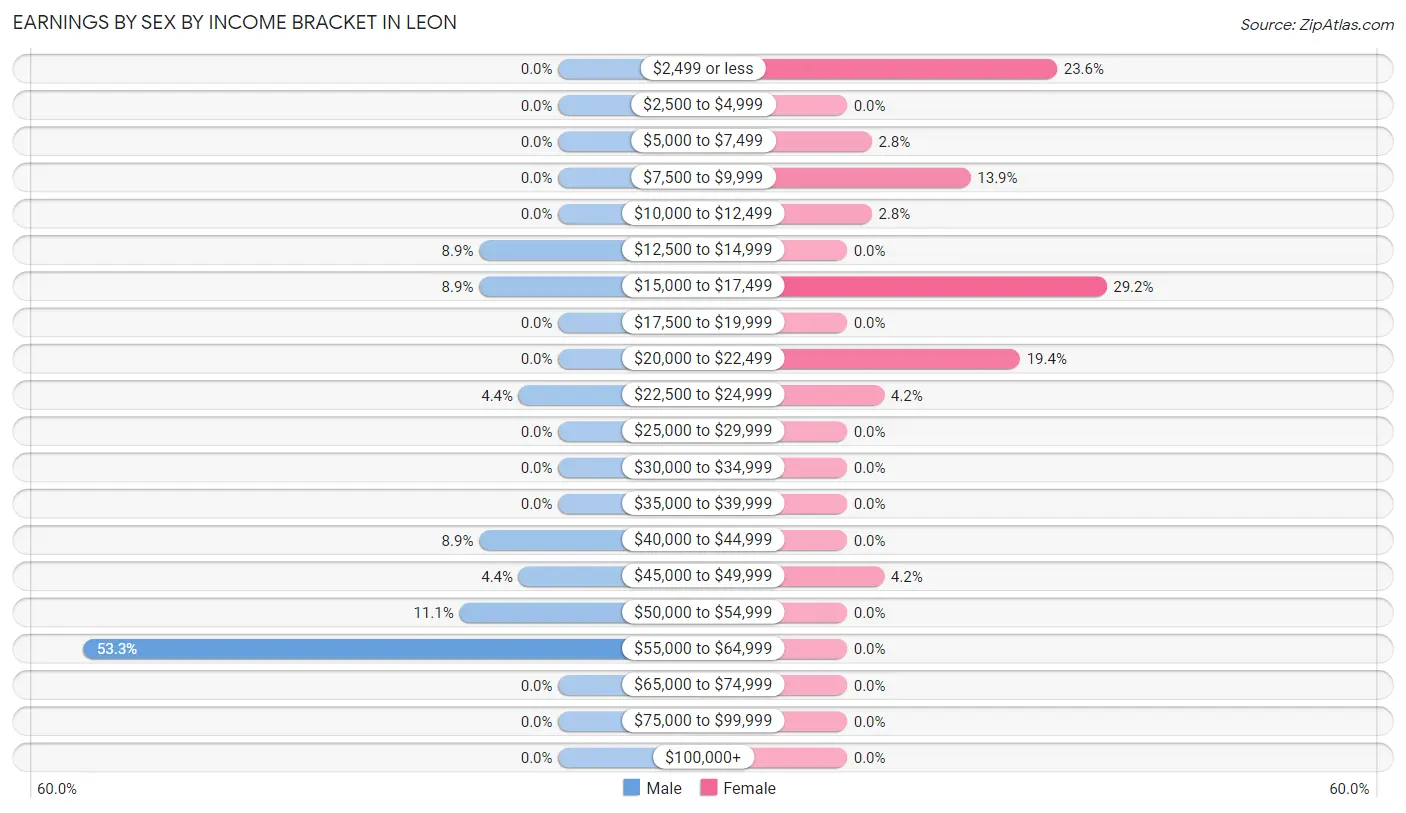
Earnings by Sex by Income Bracket in Leon
The most common earnings brackets in Leon are $55,000 to $64,999 for men (24 | 53.3%) and $15,000 to $17,499 for women (21 | 29.2%).
| Income | Male | Female |
| $2,499 or less | 0 (0.0%) | 17 (23.6%) |
| $2,500 to $4,999 | 0 (0.0%) | 0 (0.0%) |
| $5,000 to $7,499 | 0 (0.0%) | 2 (2.8%) |
| $7,500 to $9,999 | 0 (0.0%) | 10 (13.9%) |
| $10,000 to $12,499 | 0 (0.0%) | 2 (2.8%) |
| $12,500 to $14,999 | 4 (8.9%) | 0 (0.0%) |
| $15,000 to $17,499 | 4 (8.9%) | 21 (29.2%) |
| $17,500 to $19,999 | 0 (0.0%) | 0 (0.0%) |
| $20,000 to $22,499 | 0 (0.0%) | 14 (19.4%) |
| $22,500 to $24,999 | 2 (4.4%) | 3 (4.2%) |
| $25,000 to $29,999 | 0 (0.0%) | 0 (0.0%) |
| $30,000 to $34,999 | 0 (0.0%) | 0 (0.0%) |
| $35,000 to $39,999 | 0 (0.0%) | 0 (0.0%) |
| $40,000 to $44,999 | 4 (8.9%) | 0 (0.0%) |
| $45,000 to $49,999 | 2 (4.4%) | 3 (4.2%) |
| $50,000 to $54,999 | 5 (11.1%) | 0 (0.0%) |
| $55,000 to $64,999 | 24 (53.3%) | 0 (0.0%) |
| $65,000 to $74,999 | 0 (0.0%) | 0 (0.0%) |
| $75,000 to $99,999 | 0 (0.0%) | 0 (0.0%) |
| $100,000+ | 0 (0.0%) | 0 (0.0%) |
| Total | 45 (100.0%) | 72 (100.0%) |
Earnings by Sex by Educational Attainment in Leon
| Educational Attainment | Male Income | Female Income |
| Less than High School | - | - |
| High School Diploma | - | - |
| College or Associate's Degree | - | - |
| Bachelor's Degree | - | - |
| Graduate Degree | - | - |
| Total | $42,188 | $17,321 |
Family Income in Leon
Family Income Brackets in Leon
According to the Leon family income data, there are 27 families falling into the $25,000 to $34,999 income range, which is the most common income bracket and makes up 30.7% of all families.
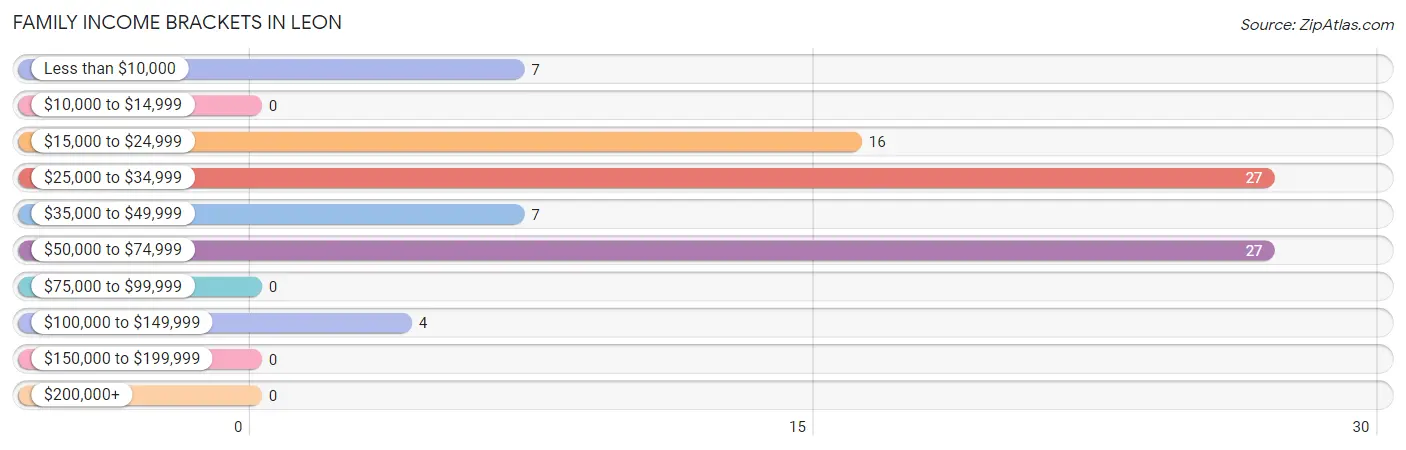
| Income Bracket | # Families | % Families |
| Less than $10,000 | 7 | 8.0% |
| $10,000 to $14,999 | 0 | 0.0% |
| $15,000 to $24,999 | 16 | 18.2% |
| $25,000 to $34,999 | 27 | 30.7% |
| $35,000 to $49,999 | 7 | 8.0% |
| $50,000 to $74,999 | 27 | 30.7% |
| $75,000 to $99,999 | 0 | 0.0% |
| $100,000 to $149,999 | 4 | 4.5% |
| $150,000 to $199,999 | 0 | 0.0% |
| $200,000+ | 0 | 0.0% |
Family Income by Famaliy Size in Leon
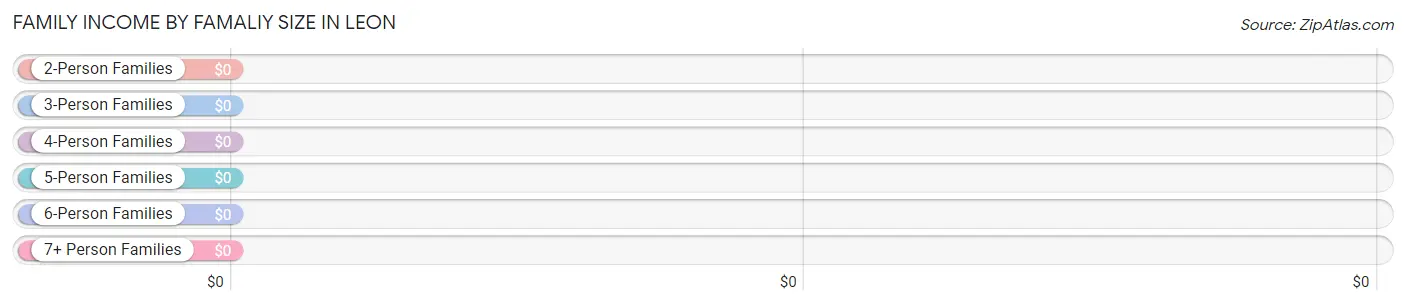
| Income Bracket | # Families | Median Income |
| 2-Person Families | 17 (19.3%) | $0 |
| 3-Person Families | 47 (53.4%) | $0 |
| 4-Person Families | 17 (19.3%) | $0 |
| 5-Person Families | 7 (8.0%) | $0 |
| 6-Person Families | 0 (0.0%) | $0 |
| 7+ Person Families | 0 (0.0%) | $0 |
| Total | 88 (100.0%) | $32,024 |
Family Income by Number of Earners in Leon
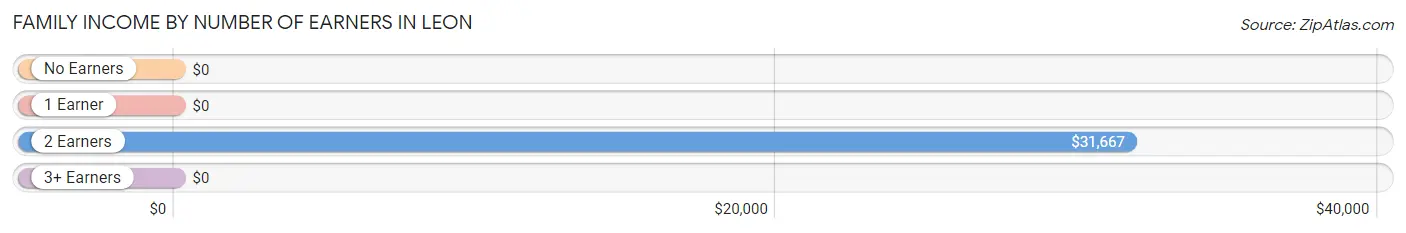
| Number of Earners | # Families | Median Income |
| No Earners | 17 (19.3%) | $0 |
| 1 Earner | 41 (46.6%) | $0 |
| 2 Earners | 28 (31.8%) | $31,667 |
| 3+ Earners | 2 (2.3%) | $0 |
| Total | 88 (100.0%) | $32,024 |
Household Income in Leon
Household Income Brackets in Leon
With 28 households falling in the category, the $50,000 to $74,999 income range is the most frequent in Leon, accounting for 30.1% of all households.
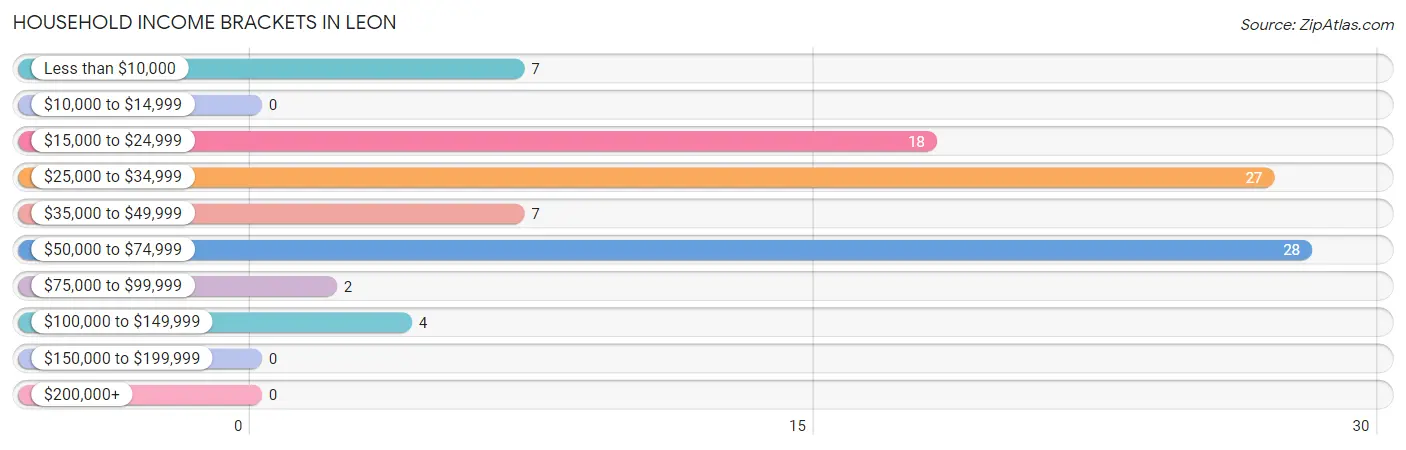
| Income Bracket | # Households | % Households |
| Less than $10,000 | 7 | 7.5% |
| $10,000 to $14,999 | 0 | 0.0% |
| $15,000 to $24,999 | 18 | 19.4% |
| $25,000 to $34,999 | 27 | 29.0% |
| $35,000 to $49,999 | 7 | 7.5% |
| $50,000 to $74,999 | 28 | 30.1% |
| $75,000 to $99,999 | 2 | 2.2% |
| $100,000 to $149,999 | 4 | 4.3% |
| $150,000 to $199,999 | 0 | 0.0% |
| $200,000+ | 0 | 0.0% |
Household Income by Householder Age in Leon
The median household income in Leon is $32,083, with the highest median household income of $38,438 found in the 65+ years age bracket for the primary householder. A total of 15 households (16.1%) fall into this category. Meanwhile, the 15 to 24 years age bracket for the primary householder has the lowest median household income of $0, with 22 households (23.7%) in this group.
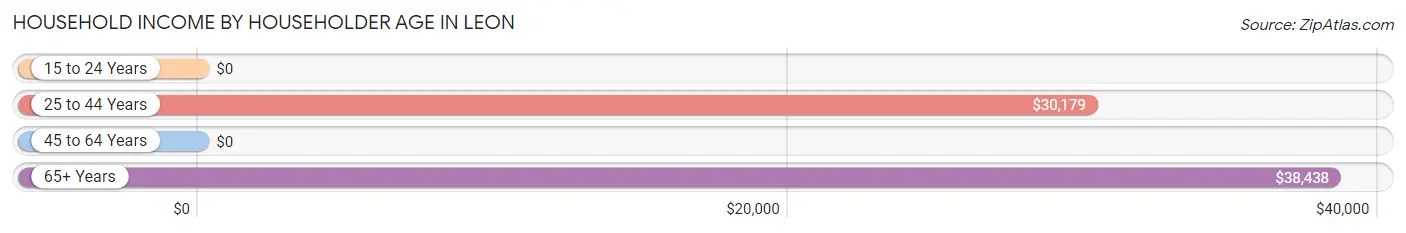
| Income Bracket | # Households | Median Income |
| 15 to 24 Years | 22 (23.7%) | $0 |
| 25 to 44 Years | 49 (52.7%) | $30,179 |
| 45 to 64 Years | 7 (7.5%) | $0 |
| 65+ Years | 15 (16.1%) | $38,438 |
| Total | 93 (100.0%) | $32,083 |
Poverty in Leon
Income Below Poverty by Sex and Age in Leon
With 40.8% poverty level for males and 26.6% for females among the residents of Leon, 6 to 11 year old males and 25 to 34 year old females are the most vulnerable to poverty, with 34 males (100.0%) and 7 females (53.8%) in their respective age groups living below the poverty level.
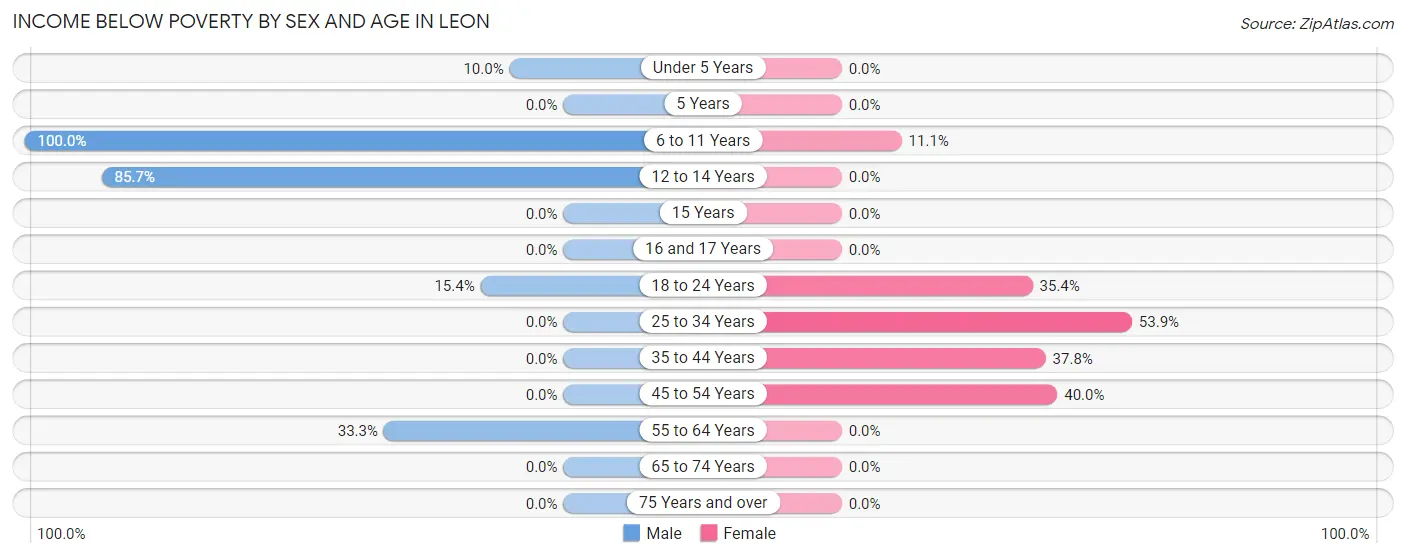
| Age Bracket | Male | Female |
| Under 5 Years | 3 (10.0%) | 0 (0.0%) |
| 5 Years | 0 (0.0%) | 0 (0.0%) |
| 6 to 11 Years | 34 (100.0%) | 6 (11.1%) |
| 12 to 14 Years | 18 (85.7%) | 0 (0.0%) |
| 15 Years | 0 (0.0%) | 0 (0.0%) |
| 16 and 17 Years | 0 (0.0%) | 0 (0.0%) |
| 18 to 24 Years | 4 (15.4%) | 17 (35.4%) |
| 25 to 34 Years | 0 (0.0%) | 7 (53.8%) |
| 35 to 44 Years | 0 (0.0%) | 14 (37.8%) |
| 45 to 54 Years | 0 (0.0%) | 2 (40.0%) |
| 55 to 64 Years | 3 (33.3%) | 0 (0.0%) |
| 65 to 74 Years | 0 (0.0%) | 0 (0.0%) |
| 75 Years and over | 0 (0.0%) | 0 (0.0%) |
| Total | 62 (40.8%) | 46 (26.6%) |
Income Above Poverty by Sex and Age in Leon
According to the poverty statistics in Leon, males aged 25 to 34 years and females aged under 5 years are the age groups that are most secure financially, with 100.0% of males and 100.0% of females in these age groups living above the poverty line.
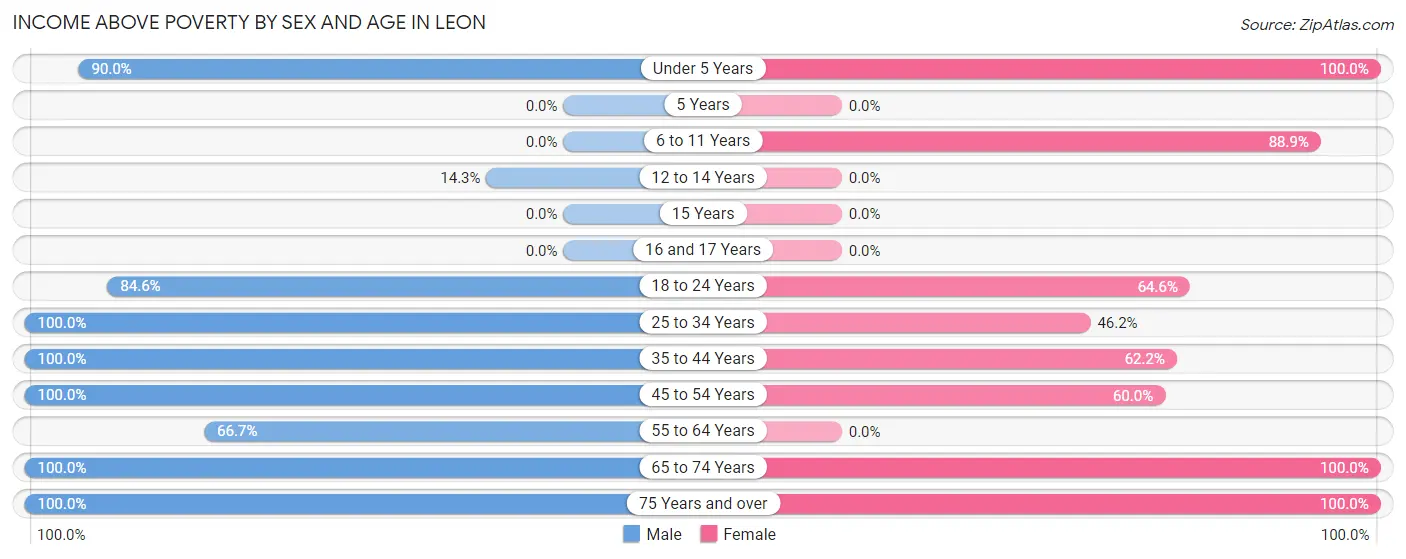
| Age Bracket | Male | Female |
| Under 5 Years | 27 (90.0%) | 5 (100.0%) |
| 5 Years | 0 (0.0%) | 0 (0.0%) |
| 6 to 11 Years | 0 (0.0%) | 48 (88.9%) |
| 12 to 14 Years | 3 (14.3%) | 0 (0.0%) |
| 15 Years | 0 (0.0%) | 0 (0.0%) |
| 16 and 17 Years | 0 (0.0%) | 0 (0.0%) |
| 18 to 24 Years | 22 (84.6%) | 31 (64.6%) |
| 25 to 34 Years | 9 (100.0%) | 6 (46.2%) |
| 35 to 44 Years | 2 (100.0%) | 23 (62.2%) |
| 45 to 54 Years | 4 (100.0%) | 3 (60.0%) |
| 55 to 64 Years | 6 (66.7%) | 0 (0.0%) |
| 65 to 74 Years | 14 (100.0%) | 7 (100.0%) |
| 75 Years and over | 3 (100.0%) | 4 (100.0%) |
| Total | 90 (59.2%) | 127 (73.4%) |
Income Below Poverty Among Married-Couple Families in Leon
The poverty statistics for married-couple families in Leon show that 4.5% or 2 of the total 44 families live below the poverty line. Families with 1 or 2 children have the highest poverty rate of 6.2%, comprising of 2 families. On the other hand, families with no children have the lowest poverty rate of 0.0%, which includes 0 families.
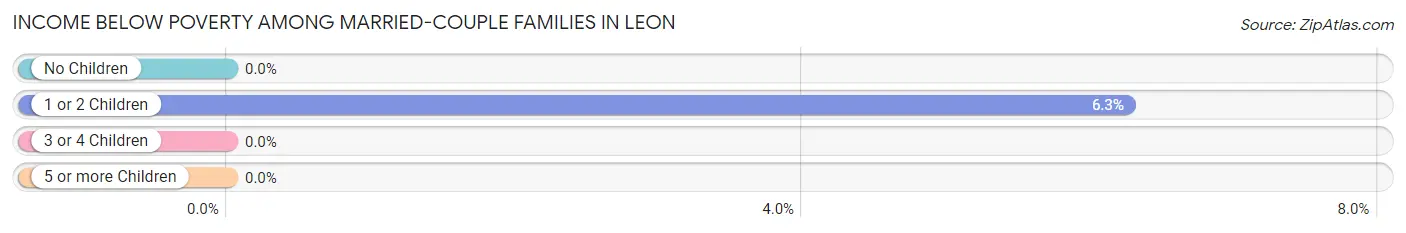
| Children | Above Poverty | Below Poverty |
| No Children | 12 (100.0%) | 0 (0.0%) |
| 1 or 2 Children | 30 (93.8%) | 2 (6.2%) |
| 3 or 4 Children | 0 (0.0%) | 0 (0.0%) |
| 5 or more Children | 0 (0.0%) | 0 (0.0%) |
| Total | 42 (95.5%) | 2 (4.5%) |
Income Below Poverty Among Single-Parent Households in Leon
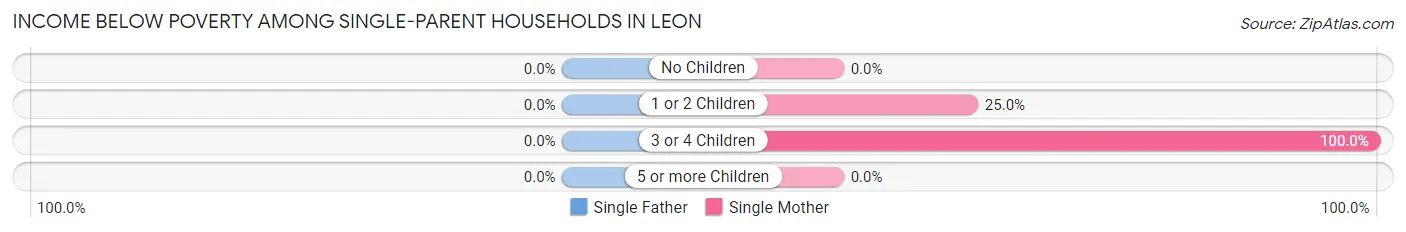
| Children | Single Father | Single Mother |
| No Children | 0 (0.0%) | 0 (0.0%) |
| 1 or 2 Children | 0 (0.0%) | 7 (25.0%) |
| 3 or 4 Children | 0 (0.0%) | 14 (100.0%) |
| 5 or more Children | 0 (0.0%) | 0 (0.0%) |
| Total | 0 (0.0%) | 21 (50.0%) |
Income Below Poverty Among Married-Couple vs Single-Parent Households in Leon
The poverty data for Leon shows that 2 of the married-couple family households (4.5%) and 21 of the single-parent households (47.7%) are living below the poverty level. Within the married-couple family households, those with 1 or 2 children have the highest poverty rate, with 2 households (6.2%) falling below the poverty line. Among the single-parent households, those with 3 or 4 children have the highest poverty rate, with 14 household (100.0%) living below poverty.
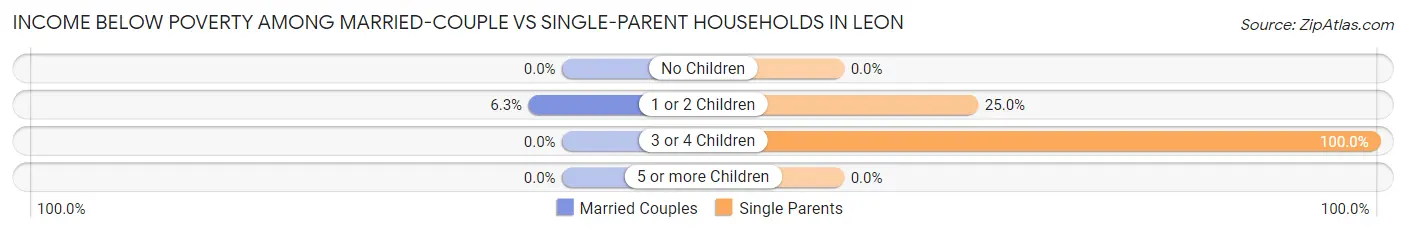
| Children | Married-Couple Families | Single-Parent Households |
| No Children | 0 (0.0%) | 0 (0.0%) |
| 1 or 2 Children | 2 (6.2%) | 7 (25.0%) |
| 3 or 4 Children | 0 (0.0%) | 14 (100.0%) |
| 5 or more Children | 0 (0.0%) | 0 (0.0%) |
| Total | 2 (4.5%) | 21 (47.7%) |
Race in Leon
The most populous races in Leon are , and White / Caucasian (369 | 100.0%).
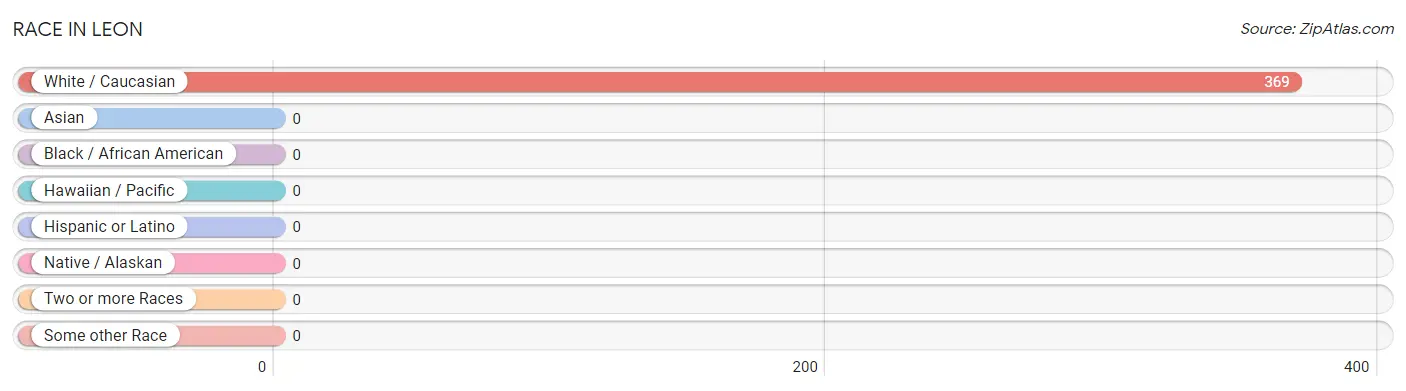
| Race | # Population | % Population |
| Asian | 0 | 0.0% |
| Black / African American | 0 | 0.0% |
| Hawaiian / Pacific | 0 | 0.0% |
| Hispanic or Latino | 0 | 0.0% |
| Native / Alaskan | 0 | 0.0% |
| White / Caucasian | 369 | 100.0% |
| Two or more Races | 0 | 0.0% |
| Some other Race | 0 | 0.0% |
| Total | 369 | 100.0% |
Ancestry in Leon
The most populous ancestries reported in Leon are American (118 | 32.0%), French Canadian (75 | 20.3%), German (44 | 11.9%), English (9 | 2.4%), and Irish (5 | 1.4%), together accounting for 68.0% of all Leon residents.
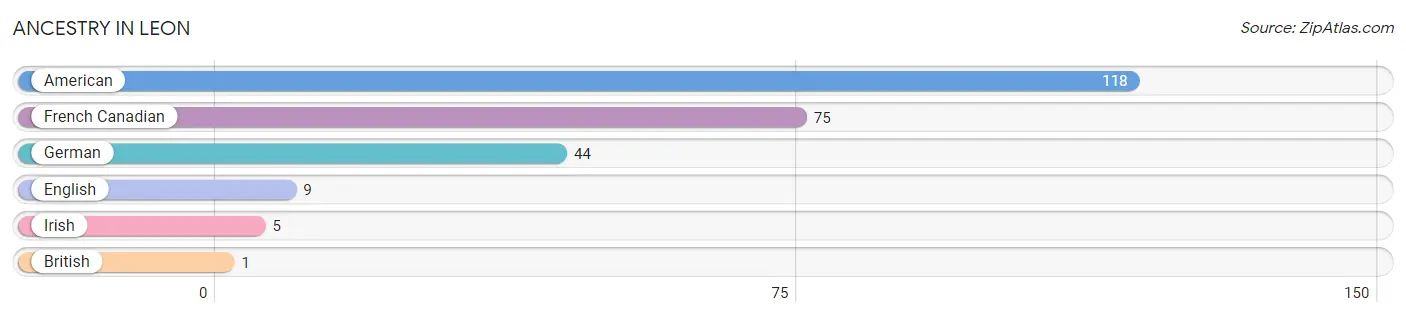
| Ancestry | # Population | % Population |
| American | 118 | 32.0% |
| British | 1 | 0.3% |
| English | 9 | 2.4% |
| French Canadian | 75 | 20.3% |
| German | 44 | 11.9% |
| Irish | 5 | 1.4% | View All 6 Rows |
Immigrants in Leon

| Immigration Origin | # Population | % Population | View All 0 Rows |
Sex and Age in Leon
Sex and Age in Leon
The most populous age groups in Leon are 10 to 14 Years (55 | 36.2%) for men and 5 to 9 Years (54 | 24.9%) for women.
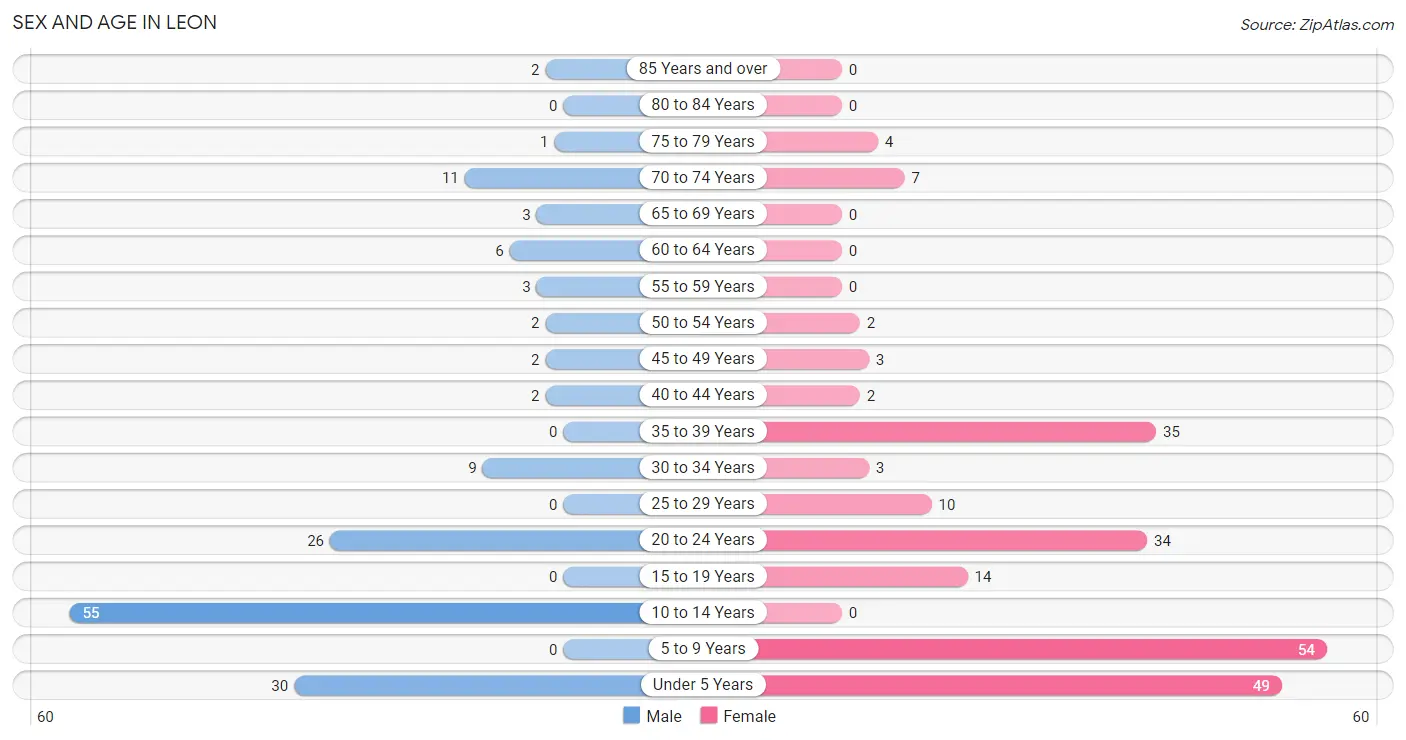
| Age Bracket | Male | Female |
| Under 5 Years | 30 (19.7%) | 49 (22.6%) |
| 5 to 9 Years | 0 (0.0%) | 54 (24.9%) |
| 10 to 14 Years | 55 (36.2%) | 0 (0.0%) |
| 15 to 19 Years | 0 (0.0%) | 14 (6.5%) |
| 20 to 24 Years | 26 (17.1%) | 34 (15.7%) |
| 25 to 29 Years | 0 (0.0%) | 10 (4.6%) |
| 30 to 34 Years | 9 (5.9%) | 3 (1.4%) |
| 35 to 39 Years | 0 (0.0%) | 35 (16.1%) |
| 40 to 44 Years | 2 (1.3%) | 2 (0.9%) |
| 45 to 49 Years | 2 (1.3%) | 3 (1.4%) |
| 50 to 54 Years | 2 (1.3%) | 2 (0.9%) |
| 55 to 59 Years | 3 (2.0%) | 0 (0.0%) |
| 60 to 64 Years | 6 (4.0%) | 0 (0.0%) |
| 65 to 69 Years | 3 (2.0%) | 0 (0.0%) |
| 70 to 74 Years | 11 (7.2%) | 7 (3.2%) |
| 75 to 79 Years | 1 (0.7%) | 4 (1.8%) |
| 80 to 84 Years | 0 (0.0%) | 0 (0.0%) |
| 85 Years and over | 2 (1.3%) | 0 (0.0%) |
| Total | 152 (100.0%) | 217 (100.0%) |
Families and Households in Leon
Median Family Size in Leon
The median family size in Leon is 3.44 persons per family, with single male/father families (2 | 2.3%) accounting for the largest median family size of 5 persons per family. On the other hand, married-couple families (44 | 50.0%) represent the smallest median family size with 3.23 persons per family.
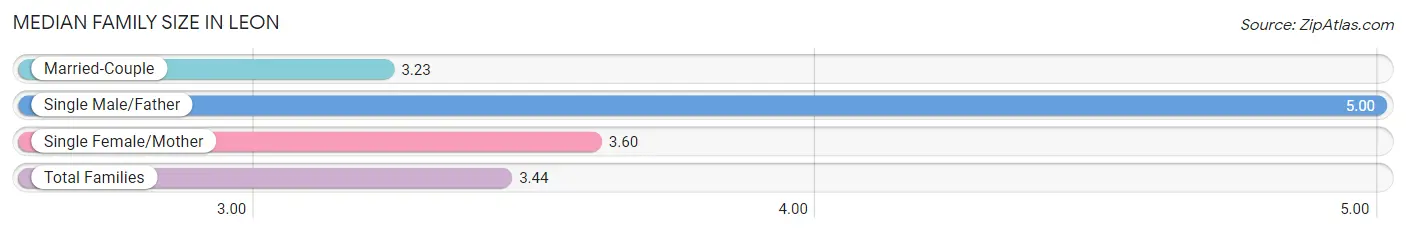
| Family Type | # Families | Family Size |
| Married-Couple | 44 (50.0%) | 3.23 |
| Single Male/Father | 2 (2.3%) | 5.00 |
| Single Female/Mother | 42 (47.7%) | 3.60 |
| Total Families | 88 (100.0%) | 3.44 |
Median Household Size in Leon
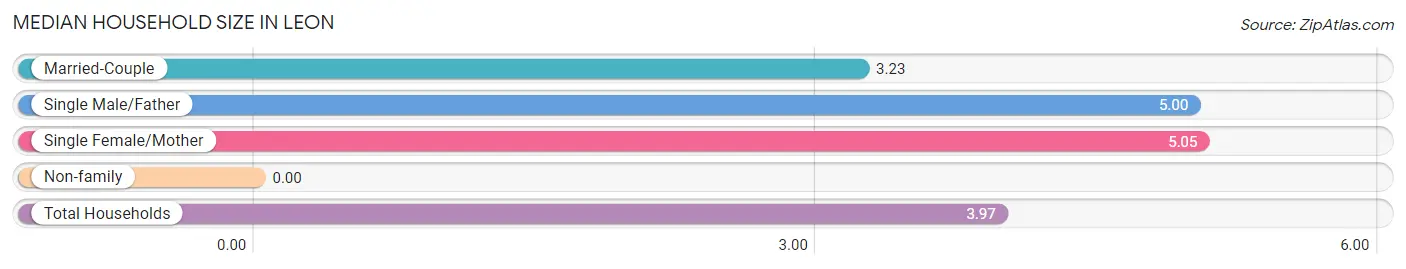
| Household Type | # Households | Household Size |
| Married-Couple | 44 (47.3%) | 3.23 |
| Single Male/Father | 2 (2.1%) | 5.00 |
| Single Female/Mother | 42 (45.2%) | 5.05 |
| Non-family | 5 (5.4%) | - |
| Total Households | 93 (100.0%) | 3.97 |
Household Size by Marriage Status in Leon
Out of a total of 93 households in Leon, 88 (94.6%) are family households, while 5 (5.4%) are nonfamily households. The most numerous type of family households are 3-person households, comprising 47, and the most common type of nonfamily households are 1-person households, comprising 5.
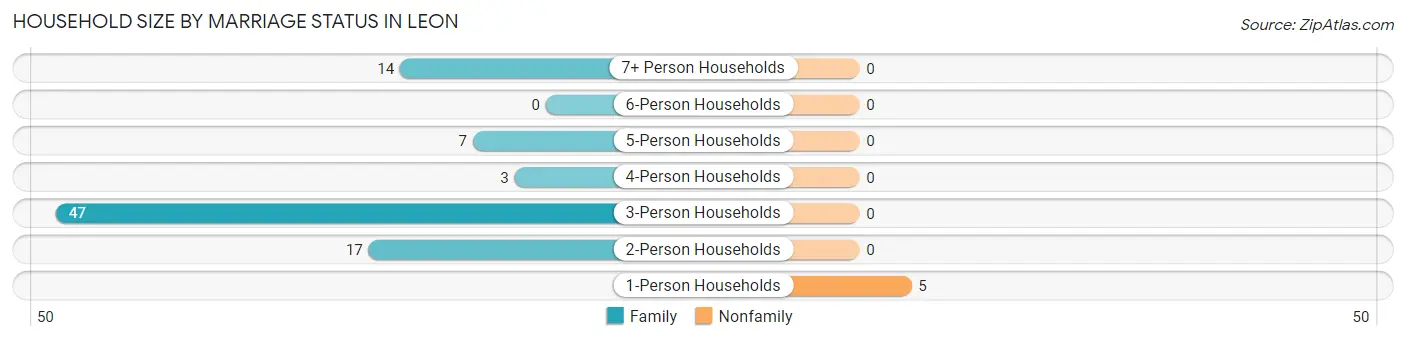
| Household Size | Family Households | Nonfamily Households |
| 1-Person Households | - | 5 (5.4%) |
| 2-Person Households | 17 (18.3%) | 0 (0.0%) |
| 3-Person Households | 47 (50.5%) | 0 (0.0%) |
| 4-Person Households | 3 (3.2%) | 0 (0.0%) |
| 5-Person Households | 7 (7.5%) | 0 (0.0%) |
| 6-Person Households | 0 (0.0%) | 0 (0.0%) |
| 7+ Person Households | 14 (15.0%) | 0 (0.0%) |
| Total | 88 (94.6%) | 5 (5.4%) |
Female Fertility in Leon
Fertility by Age in Leon
Average fertility rate in Leon is 366.0 births per 1,000 women. Women in the age bracket of 20 to 34 years have the highest fertility rate with 787.0 births per 1,000 women. Women in the age bracket of 20 to 34 years acount for 100.0% of all women with births.
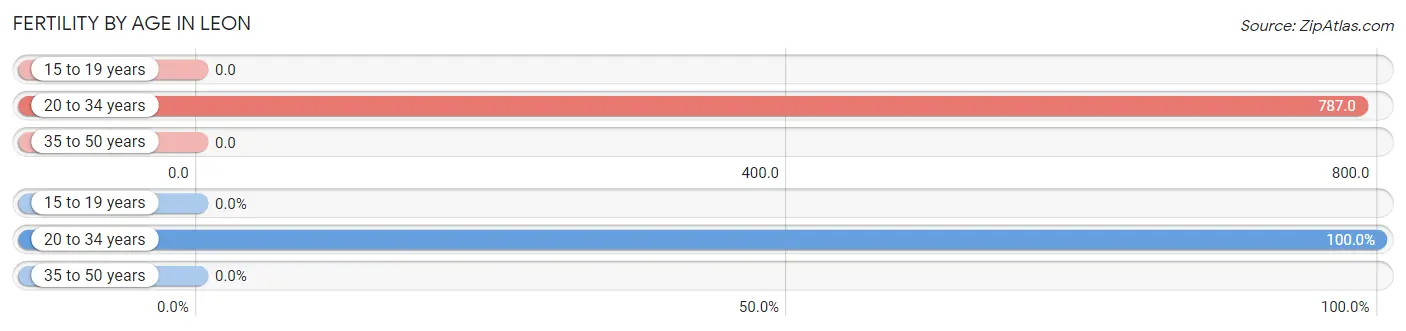
| Age Bracket | Women with Births | Births / 1,000 Women |
| 15 to 19 years | 0 (0.0%) | 0.0 |
| 20 to 34 years | 37 (100.0%) | 787.0 |
| 35 to 50 years | 0 (0.0%) | 0.0 |
| Total | 37 (100.0%) | 366.0 |
Fertility by Age by Marriage Status in Leon
54.1% of women with births (37) in Leon are married. The highest percentage of unmarried women with births falls into 20 to 34 years age bracket with 46.0% of them unmarried at the time of birth, while the lowest percentage of unmarried women with births belong to 20 to 34 years age bracket with 46.0% of them unmarried.
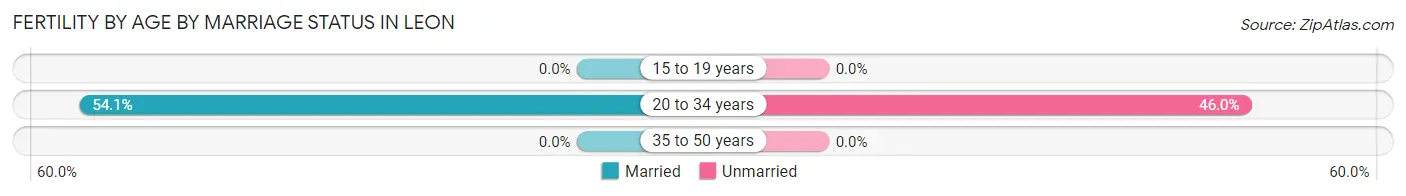
| Age Bracket | Married | Unmarried |
| 15 to 19 years | 0 (0.0%) | 0 (0.0%) |
| 20 to 34 years | 20 (54.0%) | 17 (46.0%) |
| 35 to 50 years | 0 (0.0%) | 0 (0.0%) |
| Total | 20 (54.0%) | 17 (46.0%) |
Fertility by Education in Leon
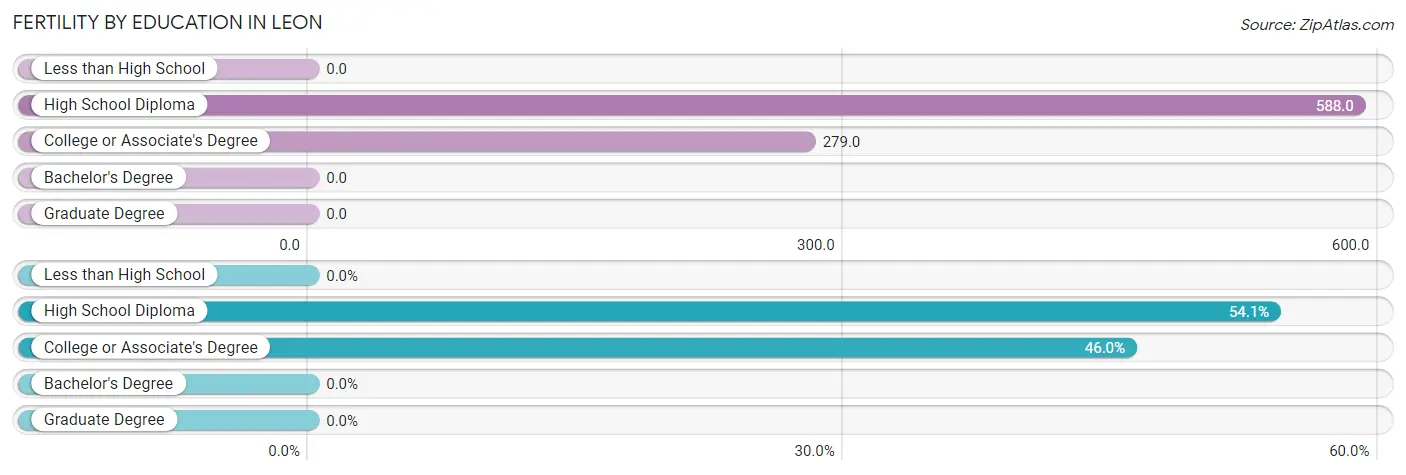
| Educational Attainment | Women with Births | Births / 1,000 Women |
| Less than High School | 0 (0.0%) | 0.0 |
| High School Diploma | 20 (54.0%) | 588.0 |
| College or Associate's Degree | 17 (46.0%) | 279.0 |
| Bachelor's Degree | 0 (0.0%) | 0.0 |
| Graduate Degree | 0 (0.0%) | 0.0 |
| Total | 37 (100.0%) | 366.0 |
Fertility by Education by Marriage Status in Leon
46.0% of women with births in Leon are unmarried. Women with the educational attainment of college or associate's degree are most likely to be married with 100.0% of them married at childbirth, while women with the educational attainment of high school diploma are least likely to be married with 85.0% of them unmarried at childbirth.
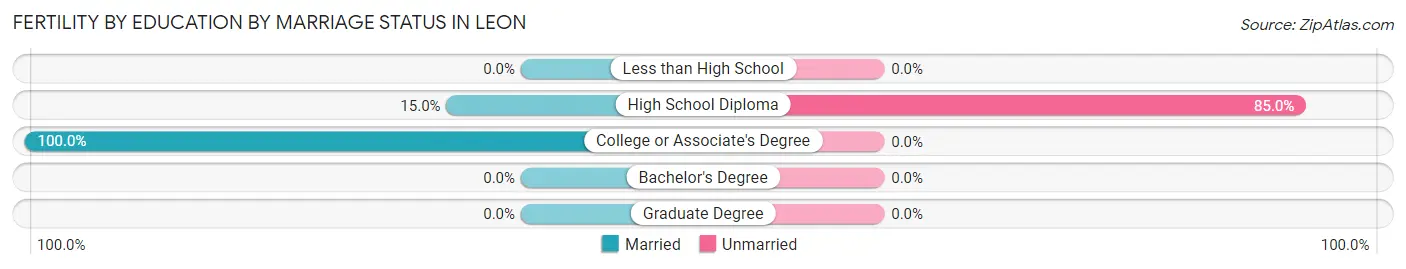
| Educational Attainment | Married | Unmarried |
| Less than High School | 0 (0.0%) | 0 (0.0%) |
| High School Diploma | 3 (15.0%) | 17 (85.0%) |
| College or Associate's Degree | 17 (100.0%) | 0 (0.0%) |
| Bachelor's Degree | 0 (0.0%) | 0 (0.0%) |
| Graduate Degree | 0 (0.0%) | 0 (0.0%) |
| Total | 20 (54.0%) | 17 (46.0%) |
Employment Characteristics in Leon
Employment by Class of Employer in Leon
Among the 94 employed individuals in Leon, private company employees (85 | 90.4%), local government employees (5 | 5.3%), and self-employed (not incorporated) (4 | 4.3%) make up the most common classes of employment.
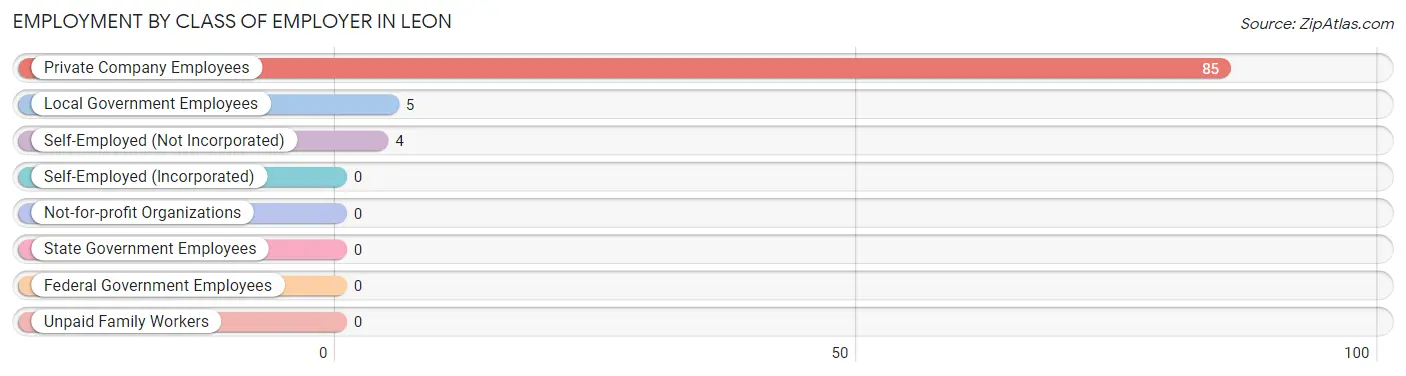
| Employer Class | # Employees | % Employees |
| Private Company Employees | 85 | 90.4% |
| Self-Employed (Incorporated) | 0 | 0.0% |
| Self-Employed (Not Incorporated) | 4 | 4.3% |
| Not-for-profit Organizations | 0 | 0.0% |
| Local Government Employees | 5 | 5.3% |
| State Government Employees | 0 | 0.0% |
| Federal Government Employees | 0 | 0.0% |
| Unpaid Family Workers | 0 | 0.0% |
| Total | 94 | 100.0% |
Employment Status by Age in Leon
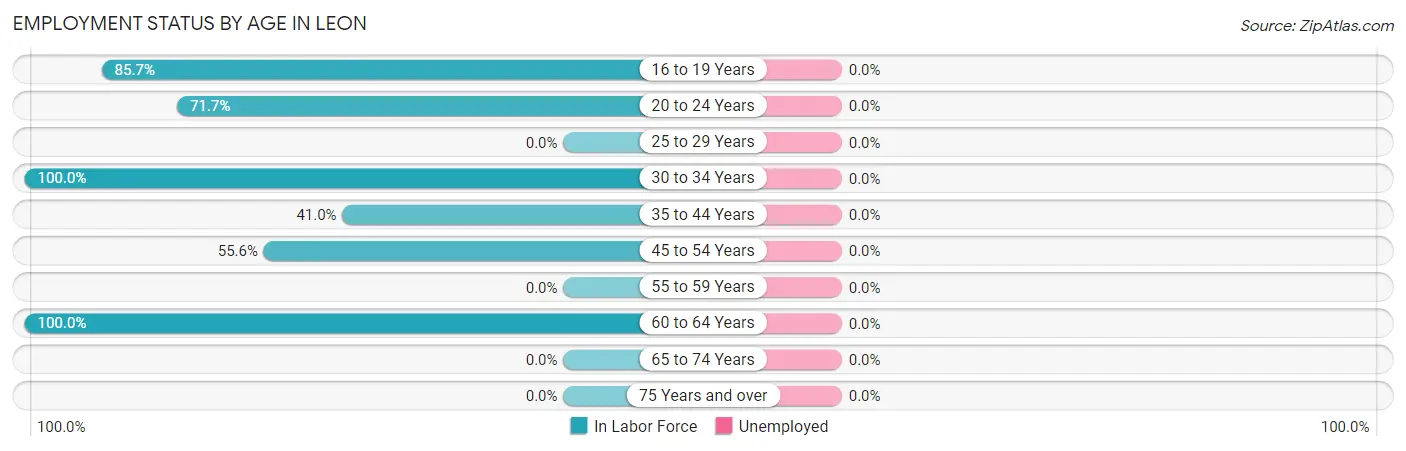
| Age Bracket | In Labor Force | Unemployed |
| 16 to 19 Years | 12 (85.7%) | 0 (0.0%) |
| 20 to 24 Years | 43 (71.7%) | 0 (0.0%) |
| 25 to 29 Years | 0 (0.0%) | 0 (0.0%) |
| 30 to 34 Years | 12 (100.0%) | 0 (0.0%) |
| 35 to 44 Years | 16 (41.0%) | 0 (0.0%) |
| 45 to 54 Years | 5 (55.6%) | 0 (0.0%) |
| 55 to 59 Years | 0 (0.0%) | 0 (0.0%) |
| 60 to 64 Years | 6 (100.0%) | 0 (0.0%) |
| 65 to 74 Years | 0 (0.0%) | 0 (0.0%) |
| 75 Years and over | 0 (0.0%) | 0 (0.0%) |
| Total | 94 (51.9%) | 0 (0.0%) |
Employment Status by Educational Attainment in Leon
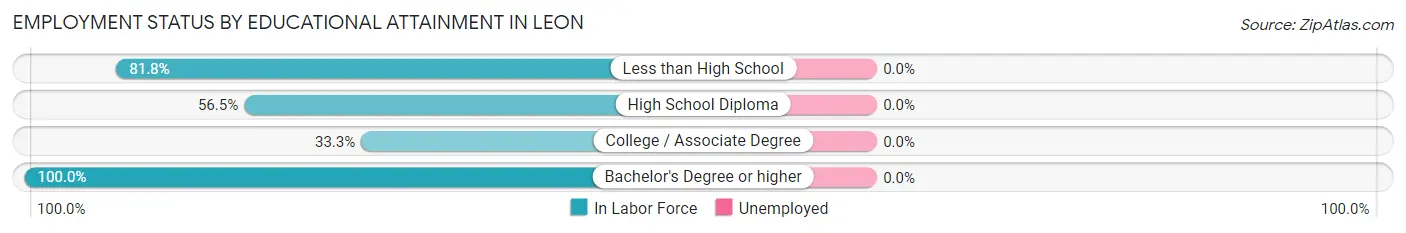
| Educational Attainment | In Labor Force | Unemployed |
| Less than High School | 9 (81.8%) | 0 (0.0%) |
| High School Diploma | 13 (56.5%) | 0 (0.0%) |
| College / Associate Degree | 14 (33.3%) | 0 (0.0%) |
| Bachelor's Degree or higher | 3 (100.0%) | 0 (0.0%) |
| Total | 39 (49.4%) | 0 (0.0%) |
Employment Occupations by Sex in Leon
Management, Business, Science and Arts Occupations
The most common Management, Business, Science and Arts occupations in Leon are Community & Social Service (17 | 18.1%), Legal Services & Support (14 | 14.9%), and Education, Arts & Media (3 | 3.2%).
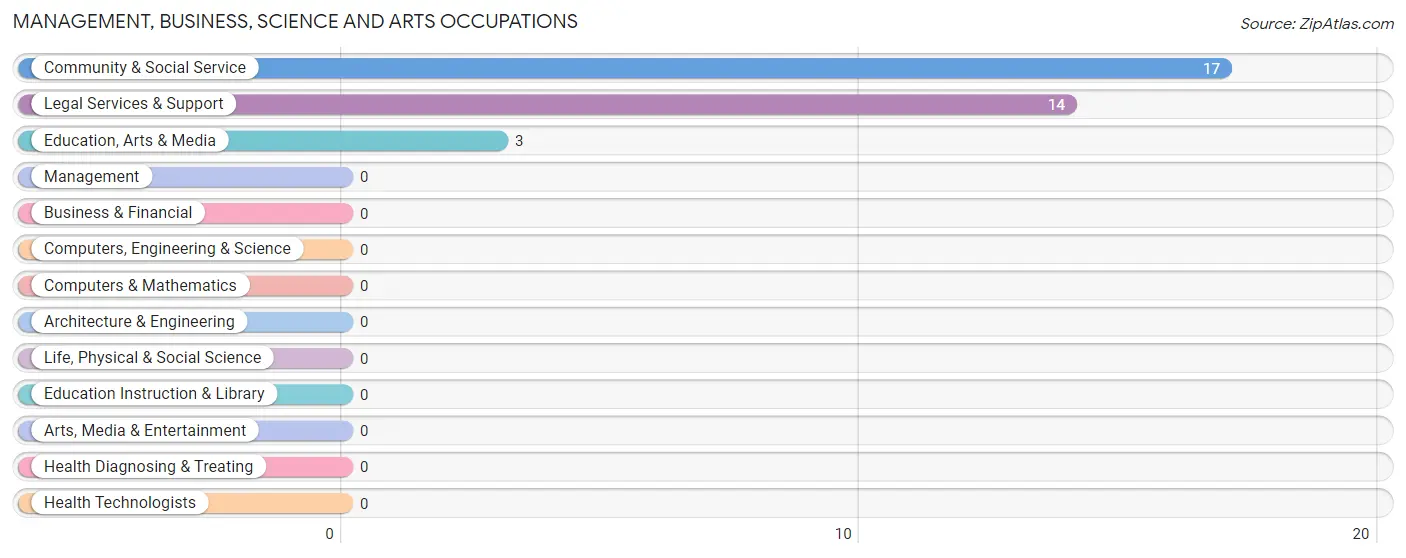
Management, Business, Science and Arts Occupations by Sex
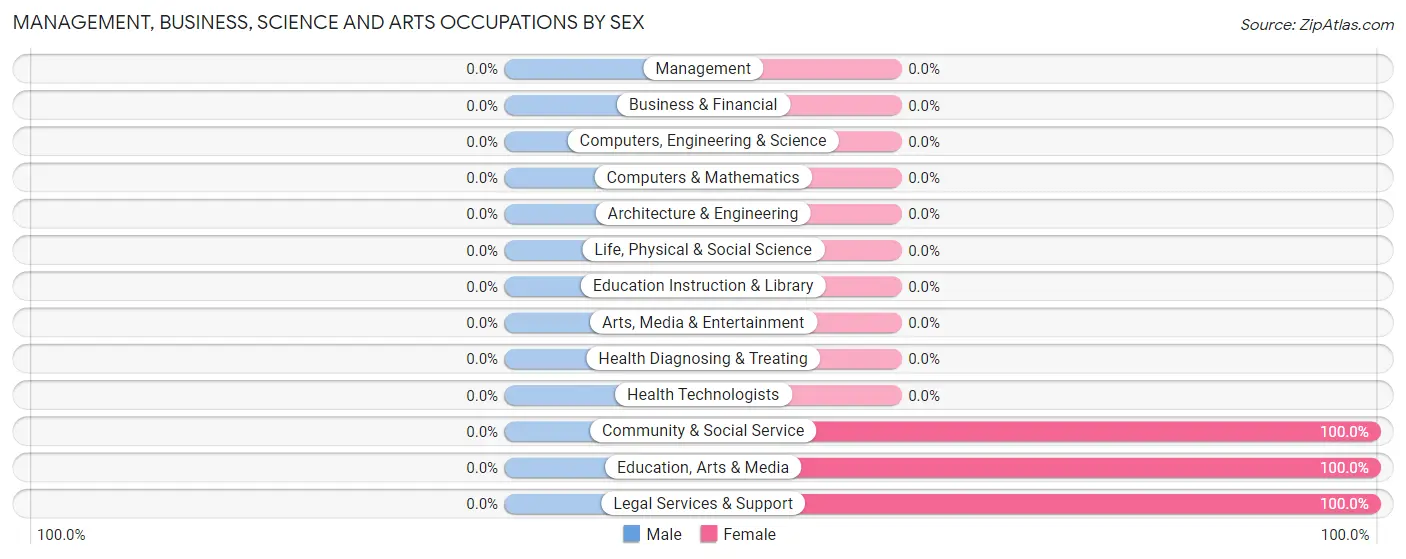
| Occupation | Male | Female |
| Management | 0 (0.0%) | 0 (0.0%) |
| Business & Financial | 0 (0.0%) | 0 (0.0%) |
| Computers, Engineering & Science | 0 (0.0%) | 0 (0.0%) |
| Computers & Mathematics | 0 (0.0%) | 0 (0.0%) |
| Architecture & Engineering | 0 (0.0%) | 0 (0.0%) |
| Life, Physical & Social Science | 0 (0.0%) | 0 (0.0%) |
| Community & Social Service | 0 (0.0%) | 17 (100.0%) |
| Education, Arts & Media | 0 (0.0%) | 3 (100.0%) |
| Legal Services & Support | 0 (0.0%) | 14 (100.0%) |
| Education Instruction & Library | 0 (0.0%) | 0 (0.0%) |
| Arts, Media & Entertainment | 0 (0.0%) | 0 (0.0%) |
| Health Diagnosing & Treating | 0 (0.0%) | 0 (0.0%) |
| Health Technologists | 0 (0.0%) | 0 (0.0%) |
| Total (Category) | 0 (0.0%) | 17 (100.0%) |
| Total (Overall) | 45 (47.9%) | 49 (52.1%) |
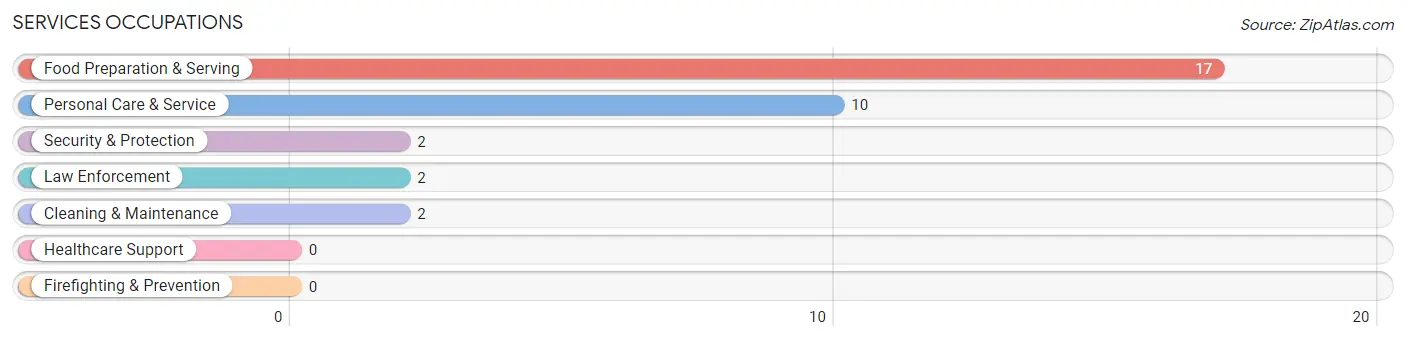
Services Occupations
The most common Services occupations in Leon are Food Preparation & Serving (17 | 18.1%), Personal Care & Service (10 | 10.6%), Security & Protection (2 | 2.1%), Law Enforcement (2 | 2.1%), and Cleaning & Maintenance (2 | 2.1%).
Services Occupations by Sex
Within the Services occupations in Leon, the most male-oriented occupations are Security & Protection (100.0%), Law Enforcement (100.0%), and Cleaning & Maintenance (100.0%), while the most female-oriented occupations are Food Preparation & Serving (100.0%), and Personal Care & Service (100.0%).
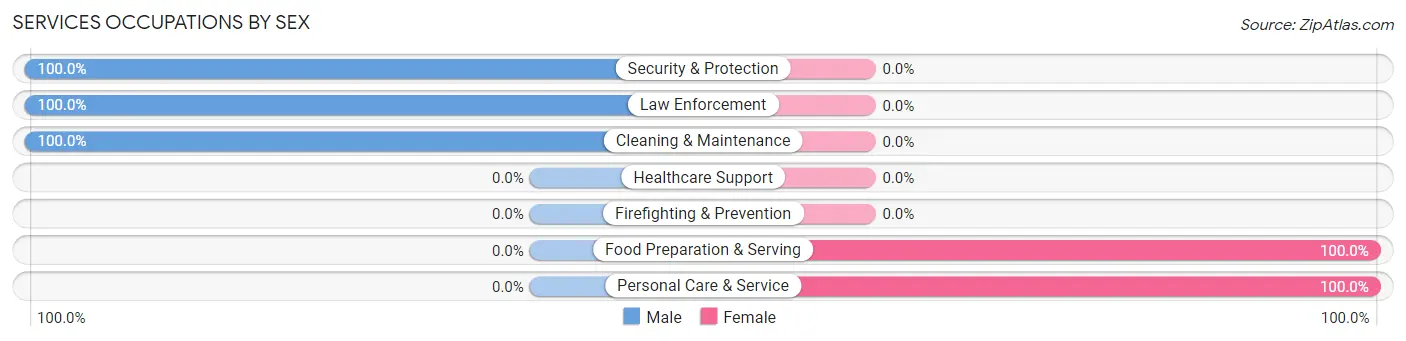
| Occupation | Male | Female |
| Healthcare Support | 0 (0.0%) | 0 (0.0%) |
| Security & Protection | 2 (100.0%) | 0 (0.0%) |
| Firefighting & Prevention | 0 (0.0%) | 0 (0.0%) |
| Law Enforcement | 2 (100.0%) | 0 (0.0%) |
| Food Preparation & Serving | 0 (0.0%) | 17 (100.0%) |
| Cleaning & Maintenance | 2 (100.0%) | 0 (0.0%) |
| Personal Care & Service | 0 (0.0%) | 10 (100.0%) |
| Total (Category) | 4 (12.9%) | 27 (87.1%) |
| Total (Overall) | 45 (47.9%) | 49 (52.1%) |
Sales and Office Occupations
The most common Sales and Office occupations in Leon are , and Sales & Related (3 | 3.2%).
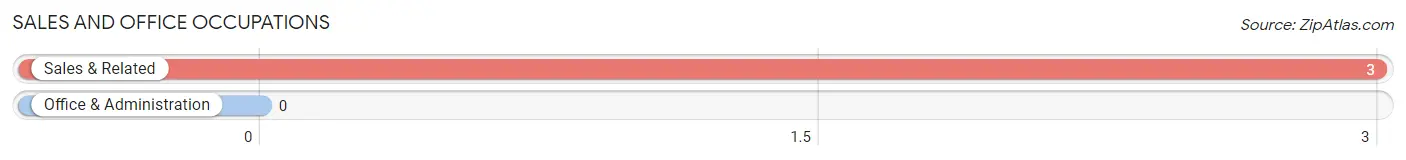
Sales and Office Occupations by Sex
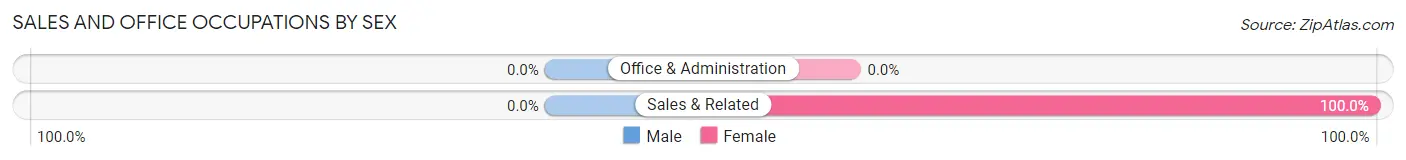
| Occupation | Male | Female |
| Sales & Related | 0 (0.0%) | 3 (100.0%) |
| Office & Administration | 0 (0.0%) | 0 (0.0%) |
| Total (Category) | 0 (0.0%) | 3 (100.0%) |
| Total (Overall) | 45 (47.9%) | 49 (52.1%) |
Natural Resources, Construction and Maintenance Occupations
The most common Natural Resources, Construction and Maintenance occupations in Leon are , and Construction & Extraction (4 | 4.3%).
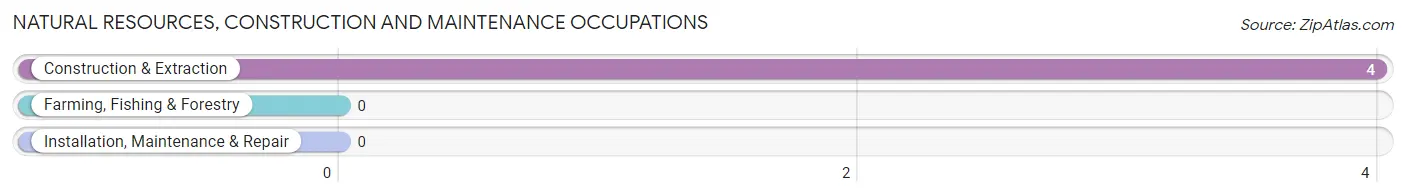
Natural Resources, Construction and Maintenance Occupations by Sex
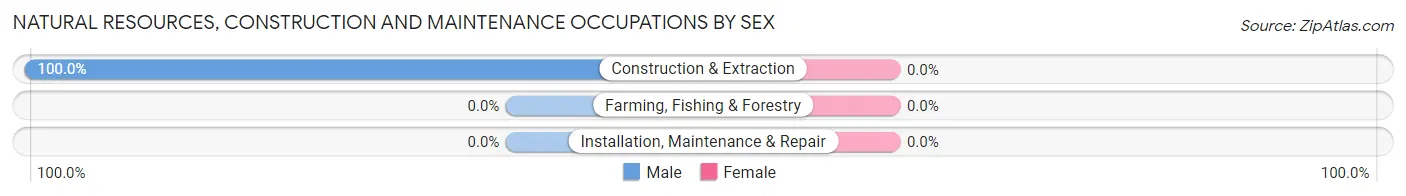
| Occupation | Male | Female |
| Farming, Fishing & Forestry | 0 (0.0%) | 0 (0.0%) |
| Construction & Extraction | 4 (100.0%) | 0 (0.0%) |
| Installation, Maintenance & Repair | 0 (0.0%) | 0 (0.0%) |
| Total (Category) | 4 (100.0%) | 0 (0.0%) |
| Total (Overall) | 45 (47.9%) | 49 (52.1%) |
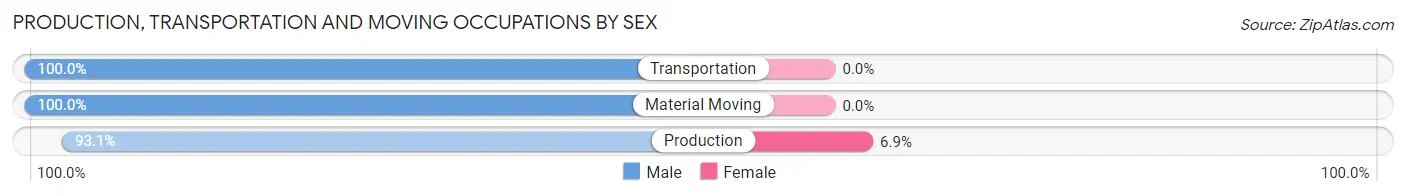
Production, Transportation and Moving Occupations
The most common Production, Transportation and Moving occupations in Leon are Production (29 | 30.8%), Transportation (6 | 6.4%), and Material Moving (4 | 4.3%).
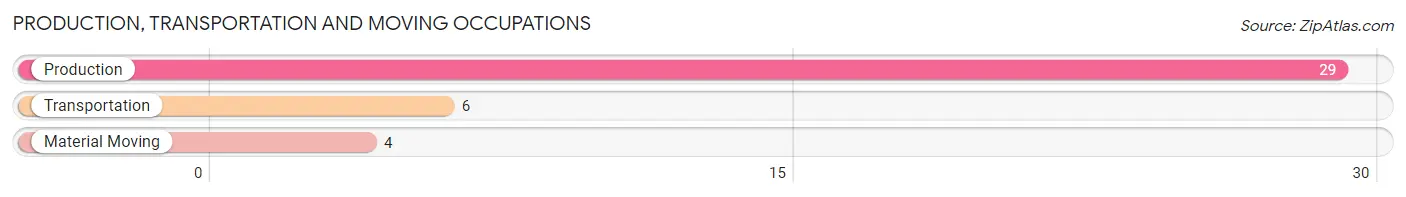
Production, Transportation and Moving Occupations by Sex
| Occupation | Male | Female |
| Production | 27 (93.1%) | 2 (6.9%) |
| Transportation | 6 (100.0%) | 0 (0.0%) |
| Material Moving | 4 (100.0%) | 0 (0.0%) |
| Total (Category) | 37 (94.9%) | 2 (5.1%) |
| Total (Overall) | 45 (47.9%) | 49 (52.1%) |
Employment Industries by Sex in Leon
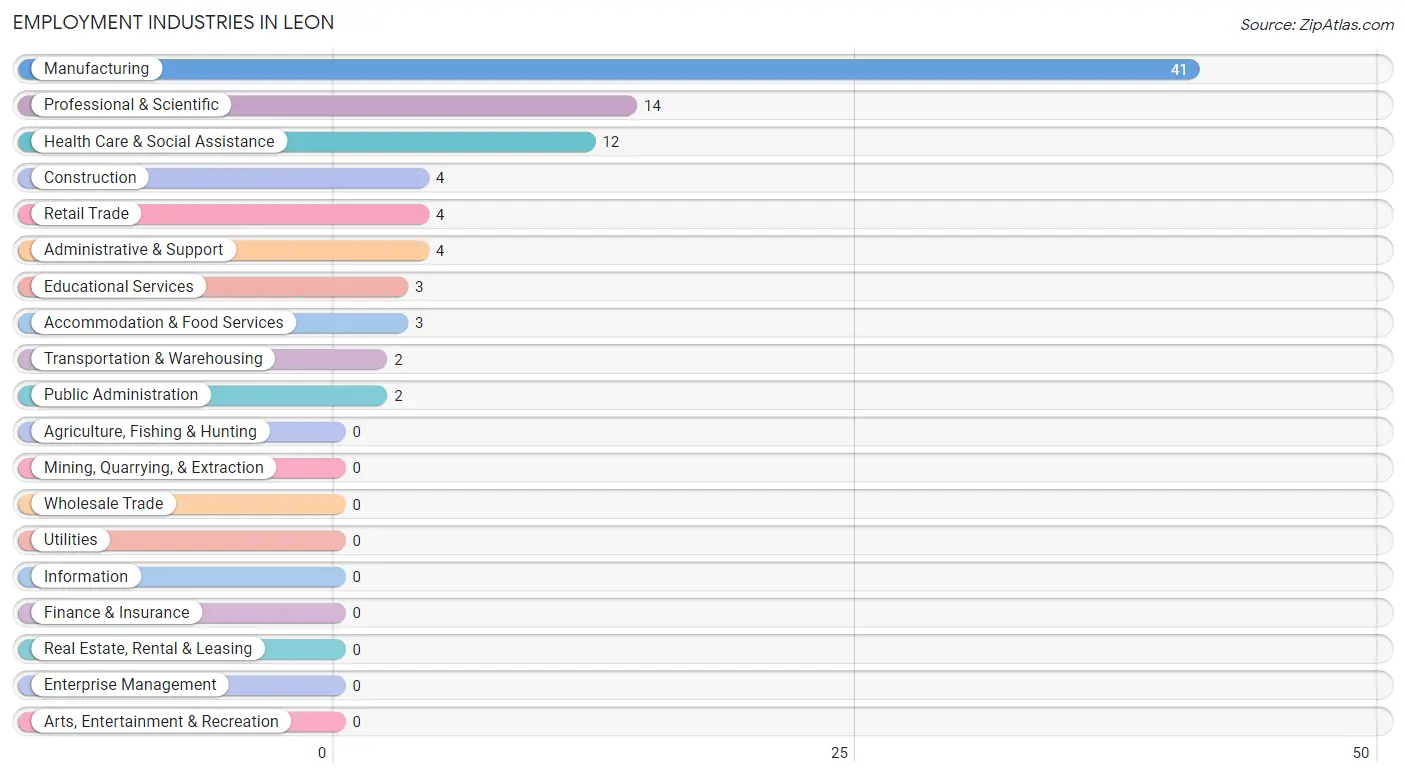
Employment Industries in Leon
The major employment industries in Leon include Manufacturing (41 | 43.6%), Professional & Scientific (14 | 14.9%), Health Care & Social Assistance (12 | 12.8%), Construction (4 | 4.3%), and Retail Trade (4 | 4.3%).
Employment Industries by Sex in Leon
The Leon industries that see more men than women are Construction (100.0%), Retail Trade (100.0%), and Transportation & Warehousing (100.0%), whereas the industries that tend to have a higher number of women are Professional & Scientific (100.0%), Educational Services (100.0%), and Accommodation & Food Services (100.0%).
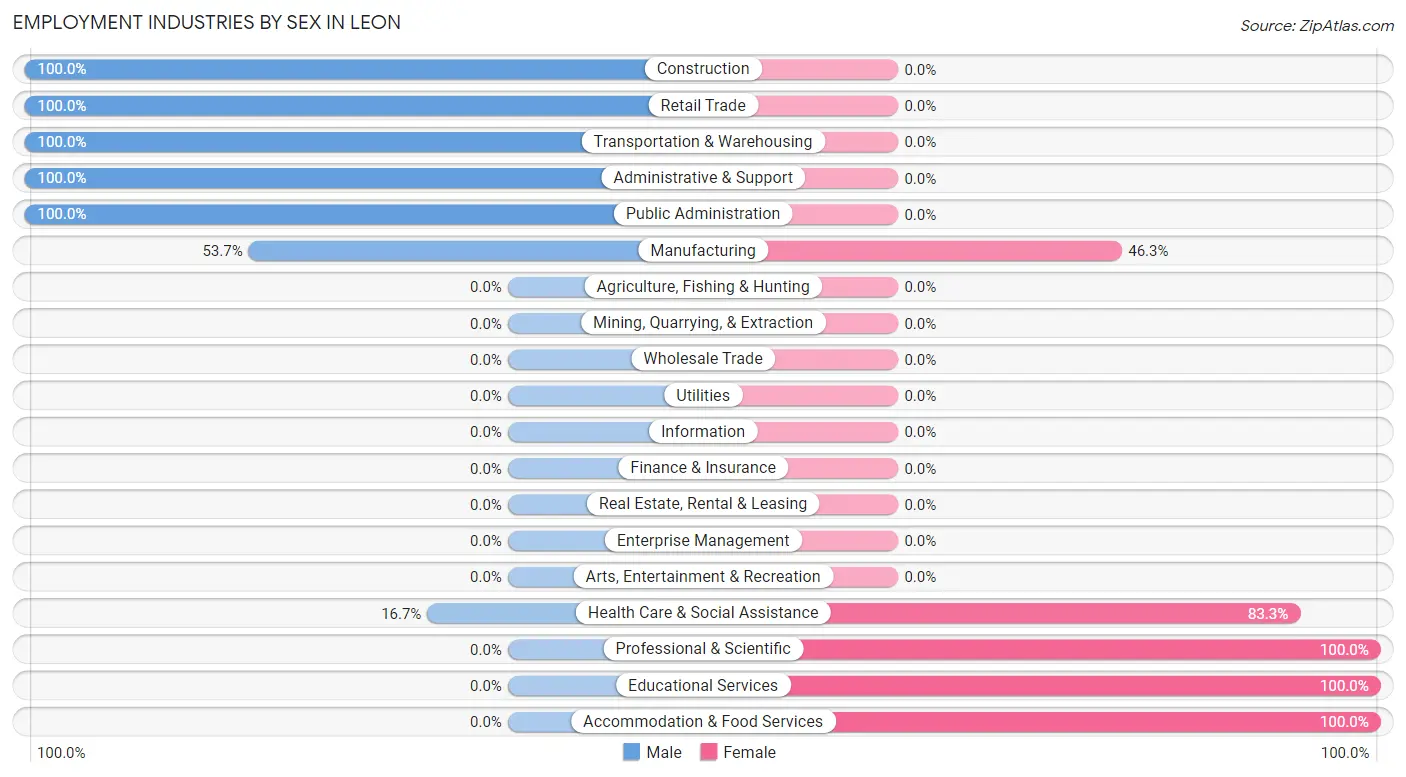
| Industry | Male | Female |
| Agriculture, Fishing & Hunting | 0 (0.0%) | 0 (0.0%) |
| Mining, Quarrying, & Extraction | 0 (0.0%) | 0 (0.0%) |
| Construction | 4 (100.0%) | 0 (0.0%) |
| Manufacturing | 22 (53.7%) | 19 (46.3%) |
| Wholesale Trade | 0 (0.0%) | 0 (0.0%) |
| Retail Trade | 4 (100.0%) | 0 (0.0%) |
| Transportation & Warehousing | 2 (100.0%) | 0 (0.0%) |
| Utilities | 0 (0.0%) | 0 (0.0%) |
| Information | 0 (0.0%) | 0 (0.0%) |
| Finance & Insurance | 0 (0.0%) | 0 (0.0%) |
| Real Estate, Rental & Leasing | 0 (0.0%) | 0 (0.0%) |
| Professional & Scientific | 0 (0.0%) | 14 (100.0%) |
| Enterprise Management | 0 (0.0%) | 0 (0.0%) |
| Administrative & Support | 4 (100.0%) | 0 (0.0%) |
| Educational Services | 0 (0.0%) | 3 (100.0%) |
| Health Care & Social Assistance | 2 (16.7%) | 10 (83.3%) |
| Arts, Entertainment & Recreation | 0 (0.0%) | 0 (0.0%) |
| Accommodation & Food Services | 0 (0.0%) | 3 (100.0%) |
| Public Administration | 2 (100.0%) | 0 (0.0%) |
| Total | 45 (47.9%) | 49 (52.1%) |
Education in Leon
School Enrollment in Leon
The most common levels of schooling among the 80 students in Leon are high school (28 | 35.0%), elementary school (27 | 33.8%), and middle school (20 | 25.0%).
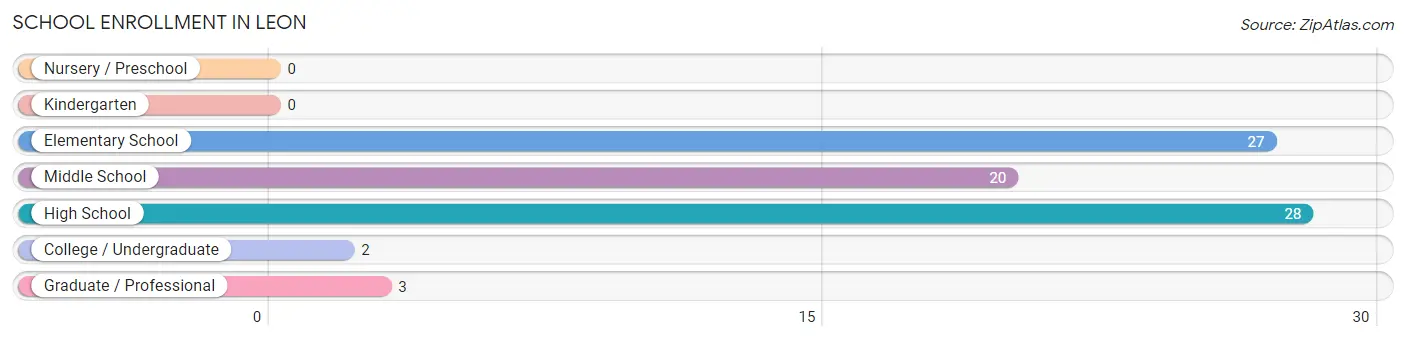
| School Level | # Students | % Students |
| Nursery / Preschool | 0 | 0.0% |
| Kindergarten | 0 | 0.0% |
| Elementary School | 27 | 33.8% |
| Middle School | 20 | 25.0% |
| High School | 28 | 35.0% |
| College / Undergraduate | 2 | 2.5% |
| Graduate / Professional | 3 | 3.7% |
| Total | 80 | 100.0% |
School Enrollment by Age by Funding Source in Leon
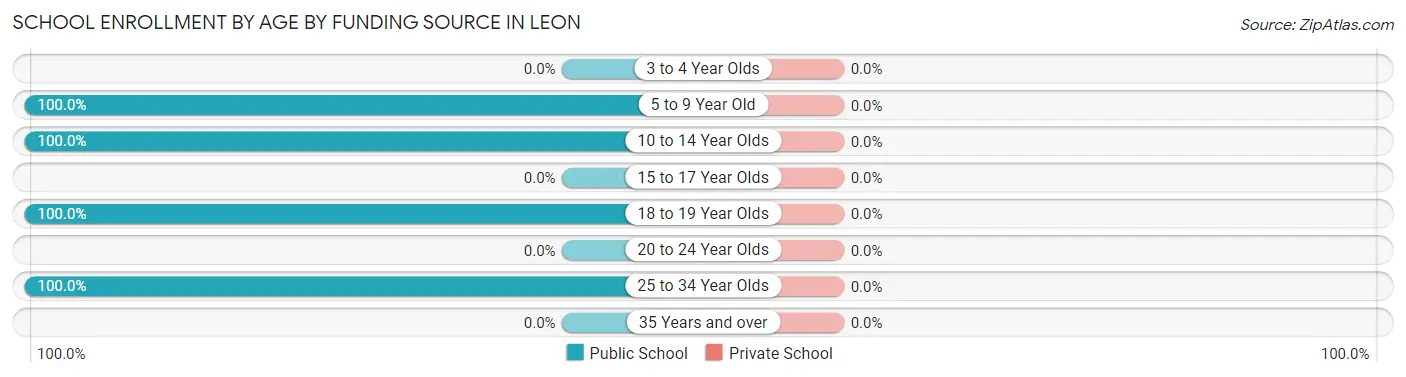
| Age Bracket | Public School | Private School |
| 3 to 4 Year Olds | 0 (0.0%) | 0 (0.0%) |
| 5 to 9 Year Old | 10 (100.0%) | 0 (0.0%) |
| 10 to 14 Year Olds | 55 (100.0%) | 0 (0.0%) |
| 15 to 17 Year Olds | 0 (0.0%) | 0 (0.0%) |
| 18 to 19 Year Olds | 12 (100.0%) | 0 (0.0%) |
| 20 to 24 Year Olds | 0 (0.0%) | 0 (0.0%) |
| 25 to 34 Year Olds | 3 (100.0%) | 0 (0.0%) |
| 35 Years and over | 0 (0.0%) | 0 (0.0%) |
| Total | 80 (100.0%) | 0 (0.0%) |
Educational Attainment by Field of Study in Leon
Education (3 | 50.0%), and arts & humanities (3 | 50.0%) are the most common fields of study among 6 individuals in Leon who have obtained a bachelor's degree or higher.
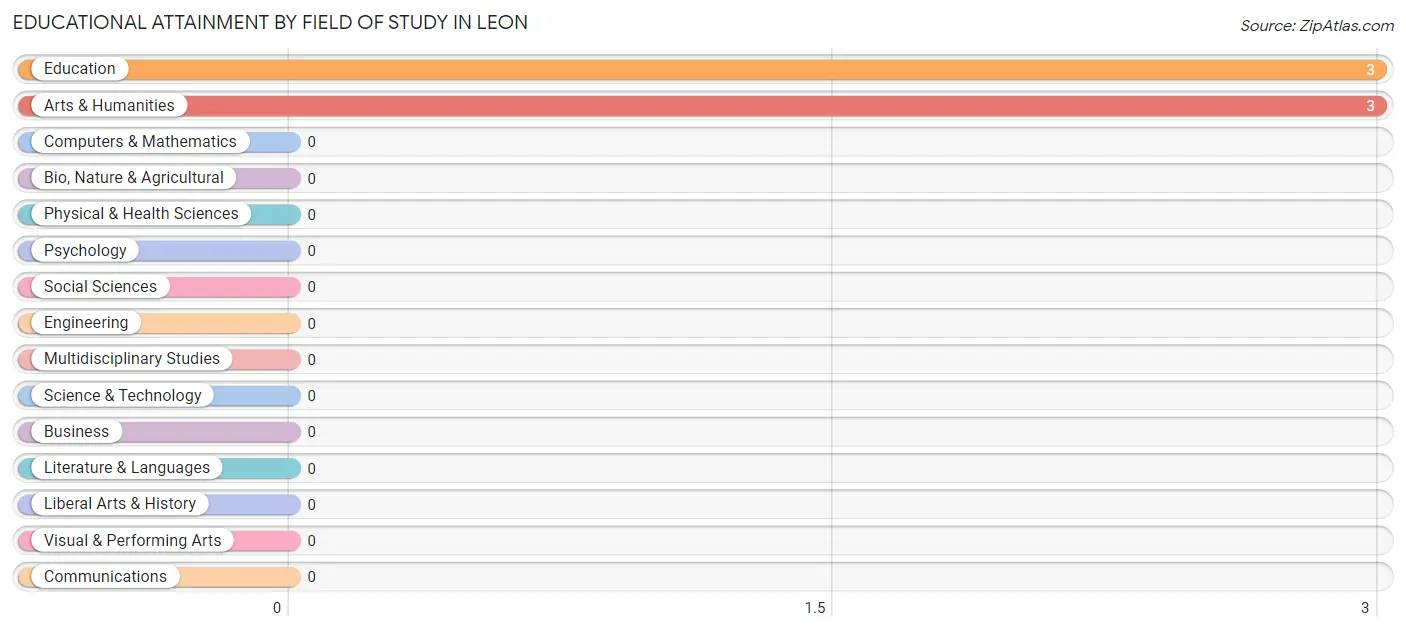
| Field of Study | # Graduates | % Graduates |
| Computers & Mathematics | 0 | 0.0% |
| Bio, Nature & Agricultural | 0 | 0.0% |
| Physical & Health Sciences | 0 | 0.0% |
| Psychology | 0 | 0.0% |
| Social Sciences | 0 | 0.0% |
| Engineering | 0 | 0.0% |
| Multidisciplinary Studies | 0 | 0.0% |
| Science & Technology | 0 | 0.0% |
| Business | 0 | 0.0% |
| Education | 3 | 50.0% |
| Literature & Languages | 0 | 0.0% |
| Liberal Arts & History | 0 | 0.0% |
| Visual & Performing Arts | 0 | 0.0% |
| Communications | 0 | 0.0% |
| Arts & Humanities | 3 | 50.0% |
| Total | 6 | 100.0% |
Transportation & Commute in Leon
Vehicle Availability by Sex in Leon
The most prevalent vehicle ownership categories in Leon are males with 1 vehicle (27, accounting for 60.0%) and females with 1 vehicle (31, making up 55.1%).
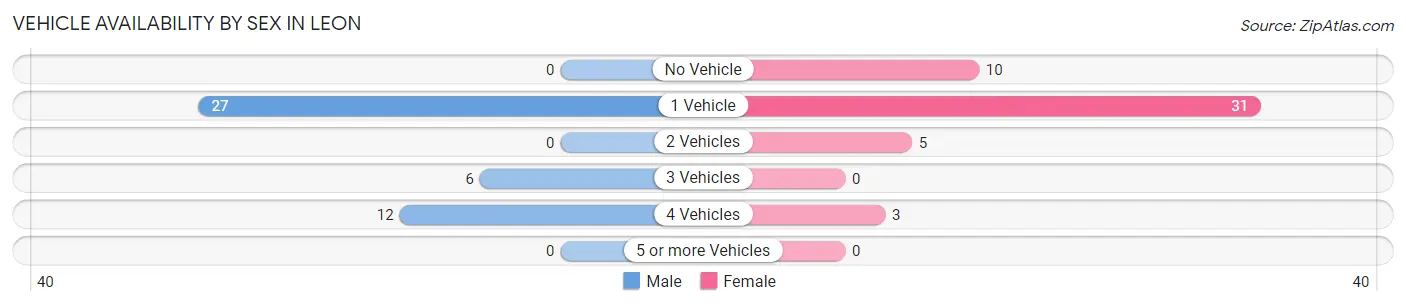
| Vehicles Available | Male | Female |
| No Vehicle | 0 (0.0%) | 10 (20.4%) |
| 1 Vehicle | 27 (60.0%) | 31 (63.3%) |
| 2 Vehicles | 0 (0.0%) | 5 (10.2%) |
| 3 Vehicles | 6 (13.3%) | 0 (0.0%) |
| 4 Vehicles | 12 (26.7%) | 3 (6.1%) |
| 5 or more Vehicles | 0 (0.0%) | 0 (0.0%) |
| Total | 45 (100.0%) | 49 (100.0%) |
Commute Time in Leon
The most frequently occuring commute durations in Leon are 15 to 19 minutes (27 commuters, 30.0%), 30 to 34 minutes (21 commuters, 23.3%), and 45 to 59 minutes (20 commuters, 22.2%).
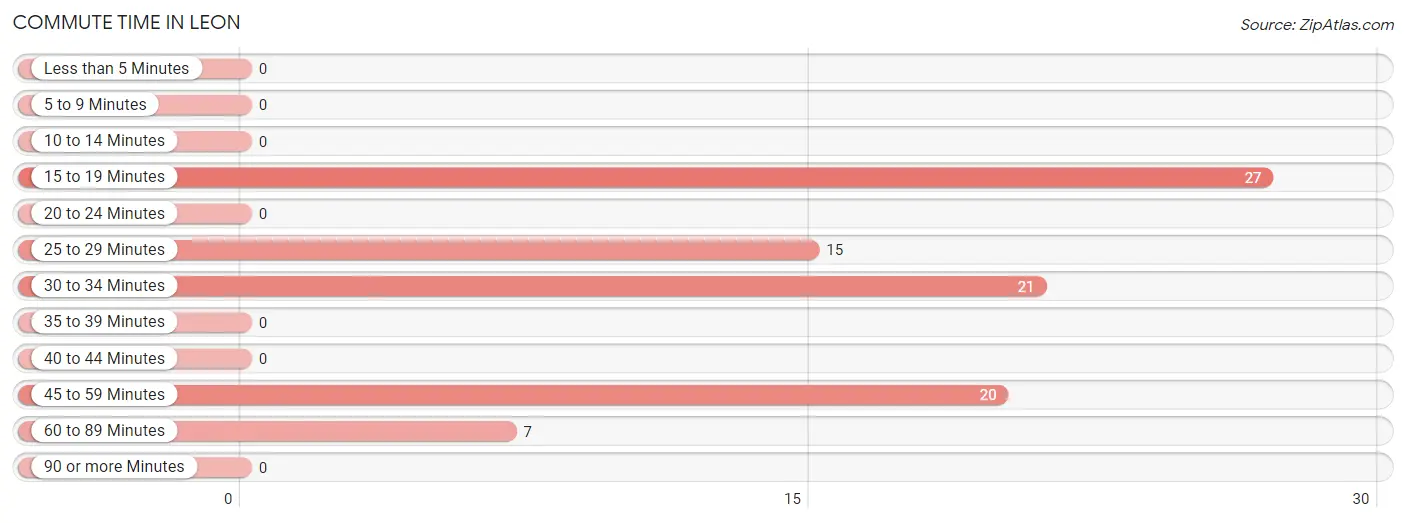
| Commute Time | # Commuters | % Commuters |
| Less than 5 Minutes | 0 | 0.0% |
| 5 to 9 Minutes | 0 | 0.0% |
| 10 to 14 Minutes | 0 | 0.0% |
| 15 to 19 Minutes | 27 | 30.0% |
| 20 to 24 Minutes | 0 | 0.0% |
| 25 to 29 Minutes | 15 | 16.7% |
| 30 to 34 Minutes | 21 | 23.3% |
| 35 to 39 Minutes | 0 | 0.0% |
| 40 to 44 Minutes | 0 | 0.0% |
| 45 to 59 Minutes | 20 | 22.2% |
| 60 to 89 Minutes | 7 | 7.8% |
| 90 or more Minutes | 0 | 0.0% |
Commute Time by Sex in Leon
The most common commute times in Leon are 15 to 19 minutes (22 commuters, 53.7%) for males and 30 to 34 minutes (17 commuters, 34.7%) for females.
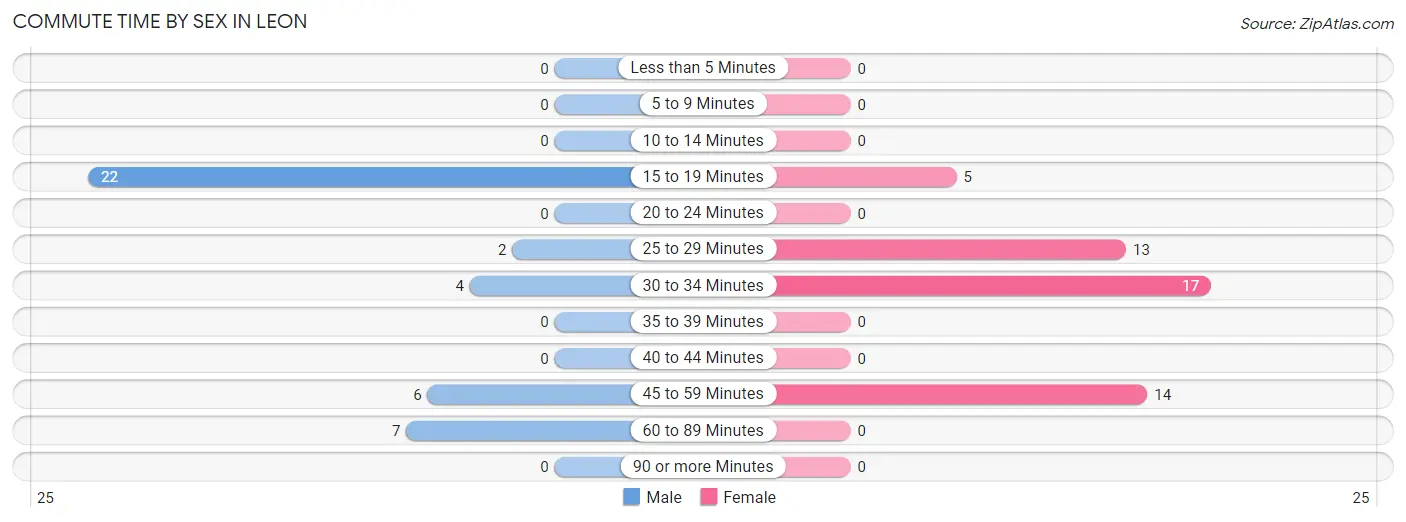
| Commute Time | Male | Female |
| Less than 5 Minutes | 0 (0.0%) | 0 (0.0%) |
| 5 to 9 Minutes | 0 (0.0%) | 0 (0.0%) |
| 10 to 14 Minutes | 0 (0.0%) | 0 (0.0%) |
| 15 to 19 Minutes | 22 (53.7%) | 5 (10.2%) |
| 20 to 24 Minutes | 0 (0.0%) | 0 (0.0%) |
| 25 to 29 Minutes | 2 (4.9%) | 13 (26.5%) |
| 30 to 34 Minutes | 4 (9.8%) | 17 (34.7%) |
| 35 to 39 Minutes | 0 (0.0%) | 0 (0.0%) |
| 40 to 44 Minutes | 0 (0.0%) | 0 (0.0%) |
| 45 to 59 Minutes | 6 (14.6%) | 14 (28.6%) |
| 60 to 89 Minutes | 7 (17.1%) | 0 (0.0%) |
| 90 or more Minutes | 0 (0.0%) | 0 (0.0%) |
Time of Departure to Work by Sex in Leon
The most frequent times of departure to work in Leon are 4:00 PM to 11:59 PM (22, 53.7%) for males and 4:00 PM to 11:59 PM (17, 34.7%) for females.
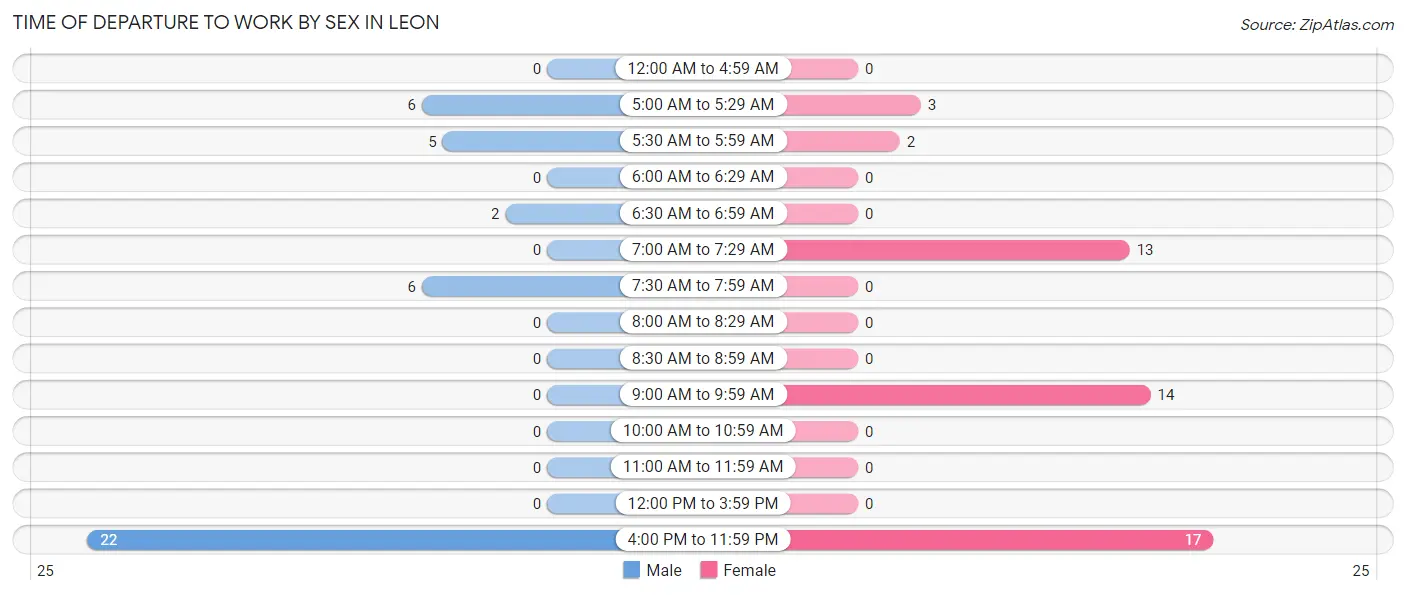
| Time of Departure | Male | Female |
| 12:00 AM to 4:59 AM | 0 (0.0%) | 0 (0.0%) |
| 5:00 AM to 5:29 AM | 6 (14.6%) | 3 (6.1%) |
| 5:30 AM to 5:59 AM | 5 (12.2%) | 2 (4.1%) |
| 6:00 AM to 6:29 AM | 0 (0.0%) | 0 (0.0%) |
| 6:30 AM to 6:59 AM | 2 (4.9%) | 0 (0.0%) |
| 7:00 AM to 7:29 AM | 0 (0.0%) | 13 (26.5%) |
| 7:30 AM to 7:59 AM | 6 (14.6%) | 0 (0.0%) |
| 8:00 AM to 8:29 AM | 0 (0.0%) | 0 (0.0%) |
| 8:30 AM to 8:59 AM | 0 (0.0%) | 0 (0.0%) |
| 9:00 AM to 9:59 AM | 0 (0.0%) | 14 (28.6%) |
| 10:00 AM to 10:59 AM | 0 (0.0%) | 0 (0.0%) |
| 11:00 AM to 11:59 AM | 0 (0.0%) | 0 (0.0%) |
| 12:00 PM to 3:59 PM | 0 (0.0%) | 0 (0.0%) |
| 4:00 PM to 11:59 PM | 22 (53.7%) | 17 (34.7%) |
| Total | 41 (100.0%) | 49 (100.0%) |
Housing Occupancy in Leon
Occupancy by Ownership in Leon
Of the total 93 dwellings in Leon, owner-occupied units account for 51 (54.8%), while renter-occupied units make up 42 (45.2%).
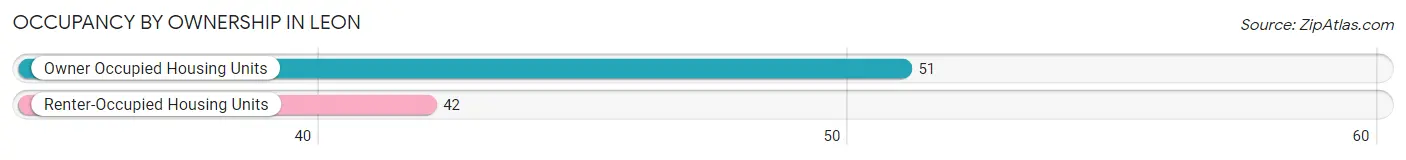
| Occupancy | # Housing Units | % Housing Units |
| Owner Occupied Housing Units | 51 | 54.8% |
| Renter-Occupied Housing Units | 42 | 45.2% |
| Total Occupied Housing Units | 93 | 100.0% |
Occupancy by Household Size in Leon
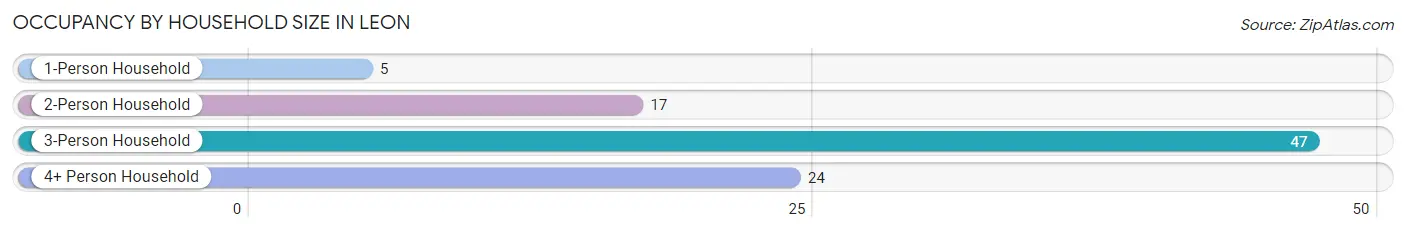
| Household Size | # Housing Units | % Housing Units |
| 1-Person Household | 5 | 5.4% |
| 2-Person Household | 17 | 18.3% |
| 3-Person Household | 47 | 50.5% |
| 4+ Person Household | 24 | 25.8% |
| Total Housing Units | 93 | 100.0% |
Occupancy by Ownership by Household Size in Leon
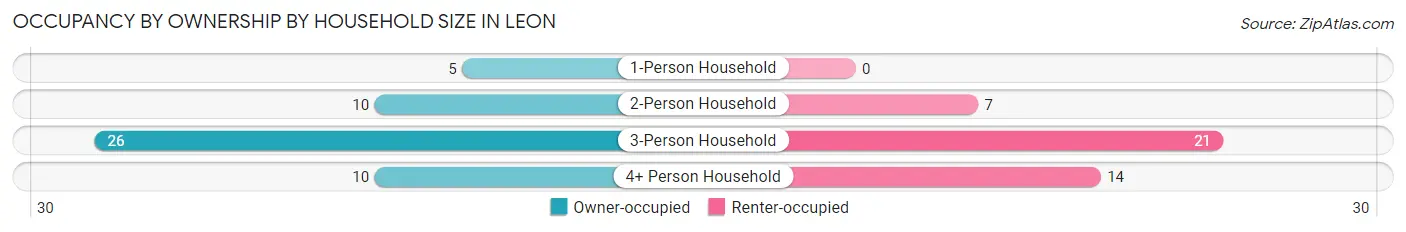
| Household Size | Owner-occupied | Renter-occupied |
| 1-Person Household | 5 (100.0%) | 0 (0.0%) |
| 2-Person Household | 10 (58.8%) | 7 (41.2%) |
| 3-Person Household | 26 (55.3%) | 21 (44.7%) |
| 4+ Person Household | 10 (41.7%) | 14 (58.3%) |
| Total Housing Units | 51 (54.8%) | 42 (45.2%) |
Occupancy by Educational Attainment in Leon
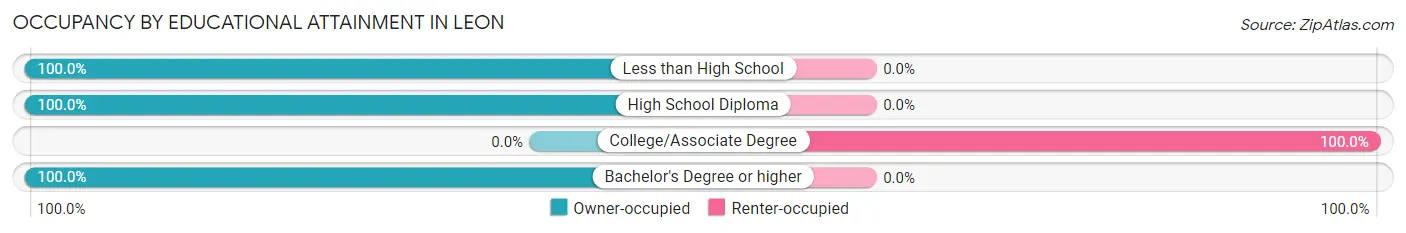
| Household Size | Owner-occupied | Renter-occupied |
| Less than High School | 11 (100.0%) | 0 (0.0%) |
| High School Diploma | 37 (100.0%) | 0 (0.0%) |
| College/Associate Degree | 0 (0.0%) | 42 (100.0%) |
| Bachelor's Degree or higher | 3 (100.0%) | 0 (0.0%) |
Occupancy by Age of Householder in Leon
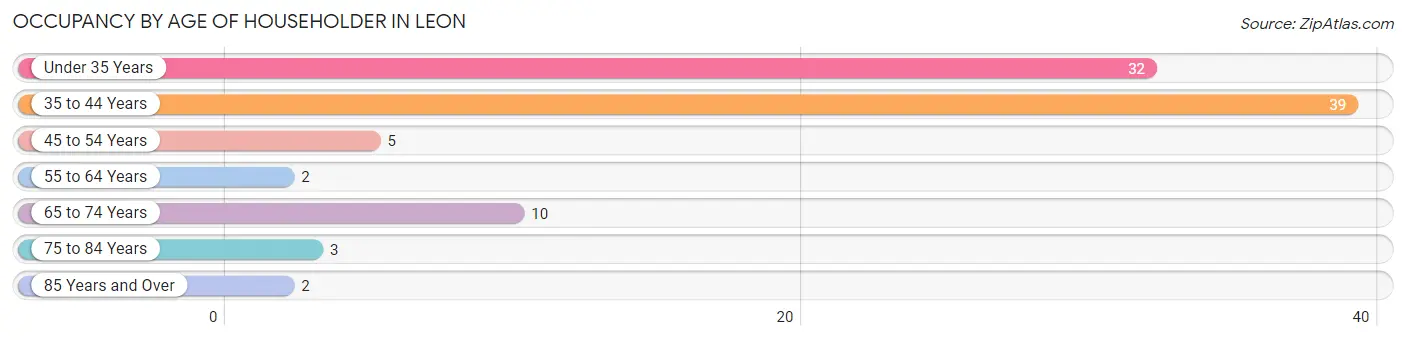
| Age Bracket | # Households | % Households |
| Under 35 Years | 32 | 34.4% |
| 35 to 44 Years | 39 | 41.9% |
| 45 to 54 Years | 5 | 5.4% |
| 55 to 64 Years | 2 | 2.1% |
| 65 to 74 Years | 10 | 10.7% |
| 75 to 84 Years | 3 | 3.2% |
| 85 Years and Over | 2 | 2.1% |
| Total | 93 | 100.0% |
Housing Finances in Leon
Median Income by Occupancy in Leon
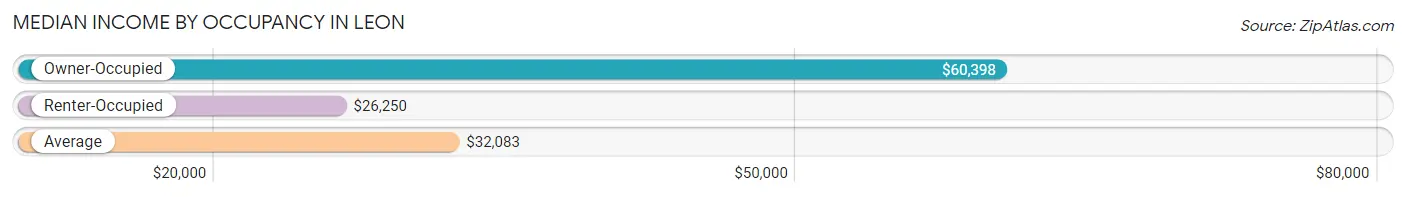
| Occupancy Type | # Households | Median Income |
| Owner-Occupied | 51 (54.8%) | $60,398 |
| Renter-Occupied | 42 (45.2%) | $26,250 |
| Average | 93 (100.0%) | $32,083 |
Occupancy by Householder Income Bracket in Leon
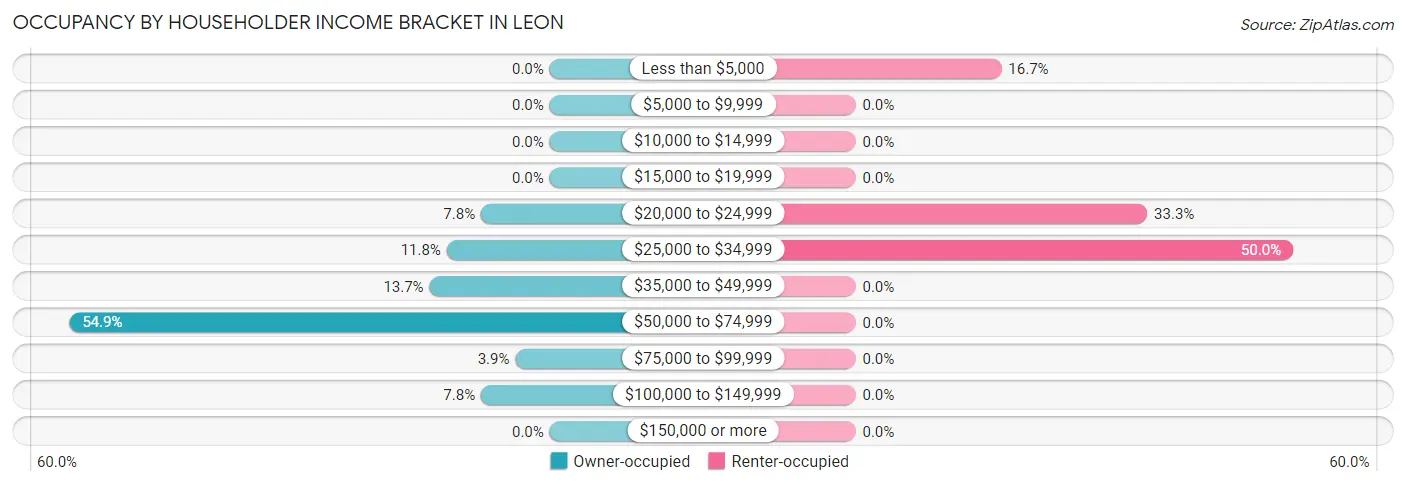
| Income Bracket | Owner-occupied | Renter-occupied |
| Less than $5,000 | 0 (0.0%) | 7 (16.7%) |
| $5,000 to $9,999 | 0 (0.0%) | 0 (0.0%) |
| $10,000 to $14,999 | 0 (0.0%) | 0 (0.0%) |
| $15,000 to $19,999 | 0 (0.0%) | 0 (0.0%) |
| $20,000 to $24,999 | 4 (7.8%) | 14 (33.3%) |
| $25,000 to $34,999 | 6 (11.8%) | 21 (50.0%) |
| $35,000 to $49,999 | 7 (13.7%) | 0 (0.0%) |
| $50,000 to $74,999 | 28 (54.9%) | 0 (0.0%) |
| $75,000 to $99,999 | 2 (3.9%) | 0 (0.0%) |
| $100,000 to $149,999 | 4 (7.8%) | 0 (0.0%) |
| $150,000 or more | 0 (0.0%) | 0 (0.0%) |
| Total | 51 (100.0%) | 42 (100.0%) |
Monthly Housing Cost Tiers in Leon
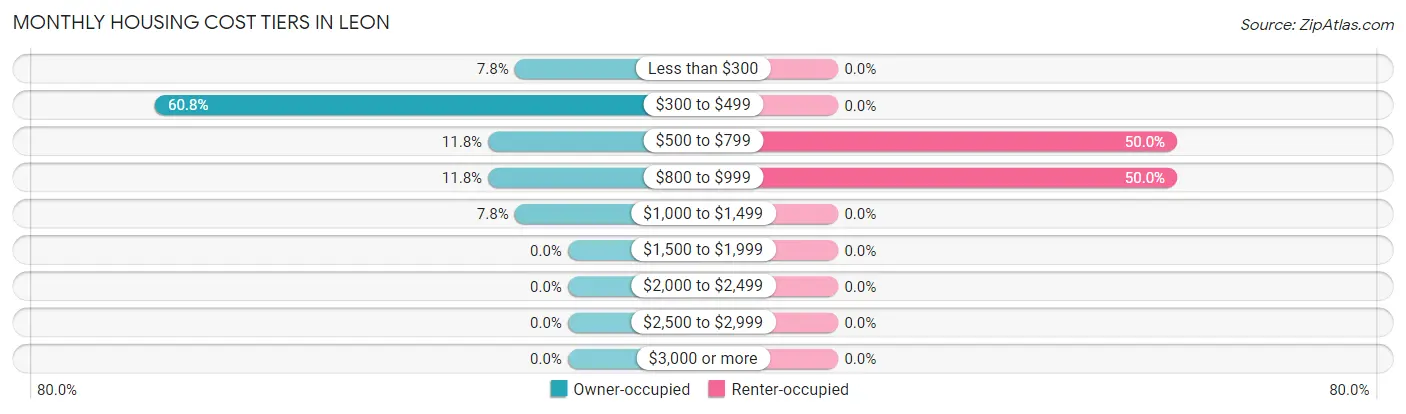
| Monthly Cost | Owner-occupied | Renter-occupied |
| Less than $300 | 4 (7.8%) | 0 (0.0%) |
| $300 to $499 | 31 (60.8%) | 0 (0.0%) |
| $500 to $799 | 6 (11.8%) | 21 (50.0%) |
| $800 to $999 | 6 (11.8%) | 21 (50.0%) |
| $1,000 to $1,499 | 4 (7.8%) | 0 (0.0%) |
| $1,500 to $1,999 | 0 (0.0%) | 0 (0.0%) |
| $2,000 to $2,499 | 0 (0.0%) | 0 (0.0%) |
| $2,500 to $2,999 | 0 (0.0%) | 0 (0.0%) |
| $3,000 or more | 0 (0.0%) | 0 (0.0%) |
| Total | 51 (100.0%) | 42 (100.0%) |
Physical Housing Characteristics in Leon
Housing Structures in Leon
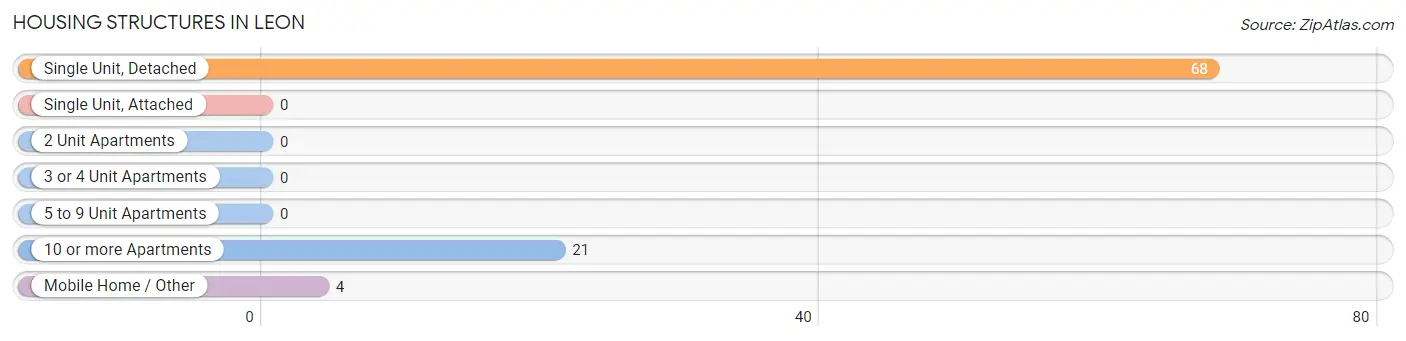
| Structure Type | # Housing Units | % Housing Units |
| Single Unit, Detached | 68 | 73.1% |
| Single Unit, Attached | 0 | 0.0% |
| 2 Unit Apartments | 0 | 0.0% |
| 3 or 4 Unit Apartments | 0 | 0.0% |
| 5 to 9 Unit Apartments | 0 | 0.0% |
| 10 or more Apartments | 21 | 22.6% |
| Mobile Home / Other | 4 | 4.3% |
| Total | 93 | 100.0% |
Housing Structures by Occupancy in Leon
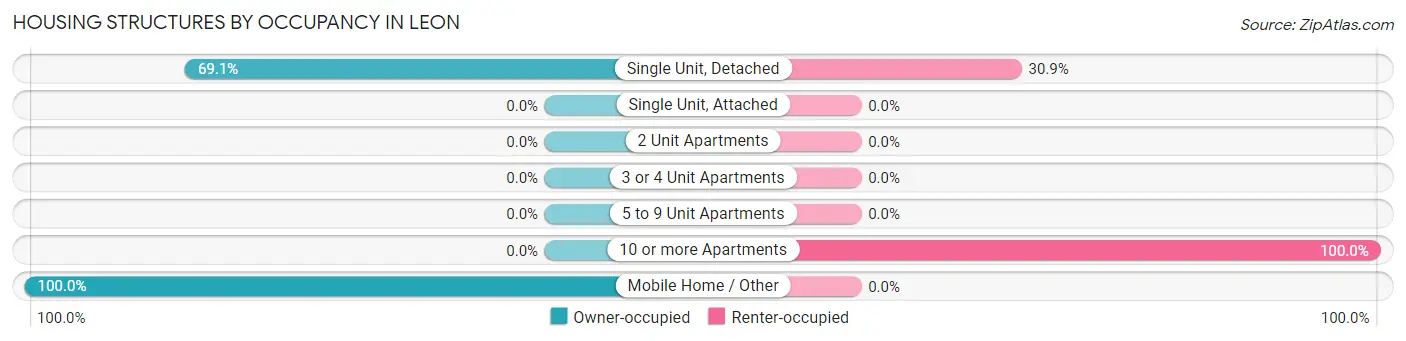
| Structure Type | Owner-occupied | Renter-occupied |
| Single Unit, Detached | 47 (69.1%) | 21 (30.9%) |
| Single Unit, Attached | 0 (0.0%) | 0 (0.0%) |
| 2 Unit Apartments | 0 (0.0%) | 0 (0.0%) |
| 3 or 4 Unit Apartments | 0 (0.0%) | 0 (0.0%) |
| 5 to 9 Unit Apartments | 0 (0.0%) | 0 (0.0%) |
| 10 or more Apartments | 0 (0.0%) | 21 (100.0%) |
| Mobile Home / Other | 4 (100.0%) | 0 (0.0%) |
| Total | 51 (54.8%) | 42 (45.2%) |
Housing Structures by Number of Rooms in Leon
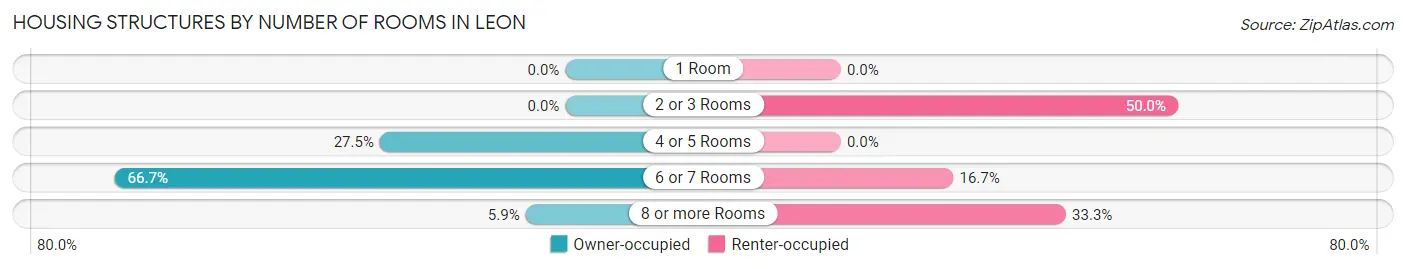
| Number of Rooms | Owner-occupied | Renter-occupied |
| 1 Room | 0 (0.0%) | 0 (0.0%) |
| 2 or 3 Rooms | 0 (0.0%) | 21 (50.0%) |
| 4 or 5 Rooms | 14 (27.5%) | 0 (0.0%) |
| 6 or 7 Rooms | 34 (66.7%) | 7 (16.7%) |
| 8 or more Rooms | 3 (5.9%) | 14 (33.3%) |
| Total | 51 (100.0%) | 42 (100.0%) |
Housing Structure by Heating Type in Leon
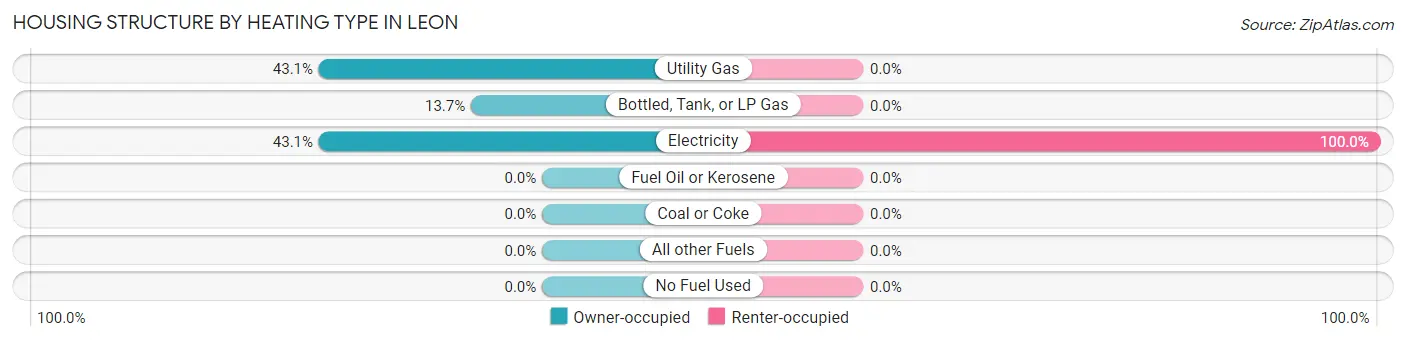
| Heating Type | Owner-occupied | Renter-occupied |
| Utility Gas | 22 (43.1%) | 0 (0.0%) |
| Bottled, Tank, or LP Gas | 7 (13.7%) | 0 (0.0%) |
| Electricity | 22 (43.1%) | 42 (100.0%) |
| Fuel Oil or Kerosene | 0 (0.0%) | 0 (0.0%) |
| Coal or Coke | 0 (0.0%) | 0 (0.0%) |
| All other Fuels | 0 (0.0%) | 0 (0.0%) |
| No Fuel Used | 0 (0.0%) | 0 (0.0%) |
| Total | 51 (100.0%) | 42 (100.0%) |
Household Vehicle Usage in Leon
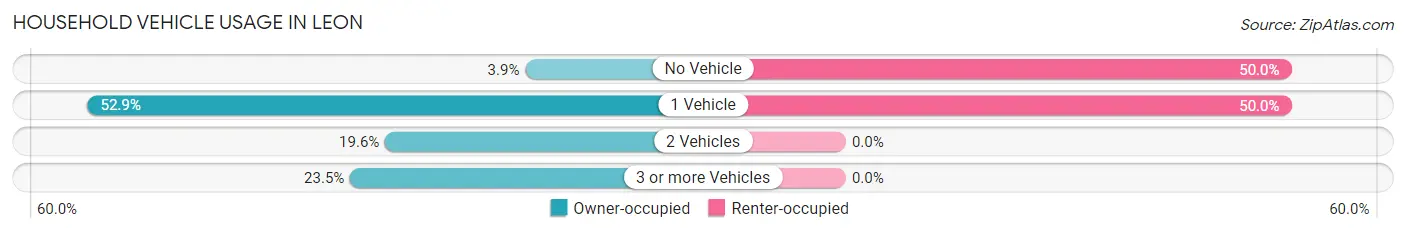
| Vehicles per Household | Owner-occupied | Renter-occupied |
| No Vehicle | 2 (3.9%) | 21 (50.0%) |
| 1 Vehicle | 27 (52.9%) | 21 (50.0%) |
| 2 Vehicles | 10 (19.6%) | 0 (0.0%) |
| 3 or more Vehicles | 12 (23.5%) | 0 (0.0%) |
| Total | 51 (100.0%) | 42 (100.0%) |
Real Estate & Mortgages in Leon
Real Estate and Mortgage Overview in Leon
| Characteristic | Without Mortgage | With Mortgage |
| Housing Units | 39 | 12 |
| Median Property Value | $114,200 | $0 |
| Median Household Income | $60,852 | $0 |
| Monthly Housing Costs | $385 | $0 |
| Real Estate Taxes | $1,094 | $0 |
Property Value by Mortgage Status in Leon
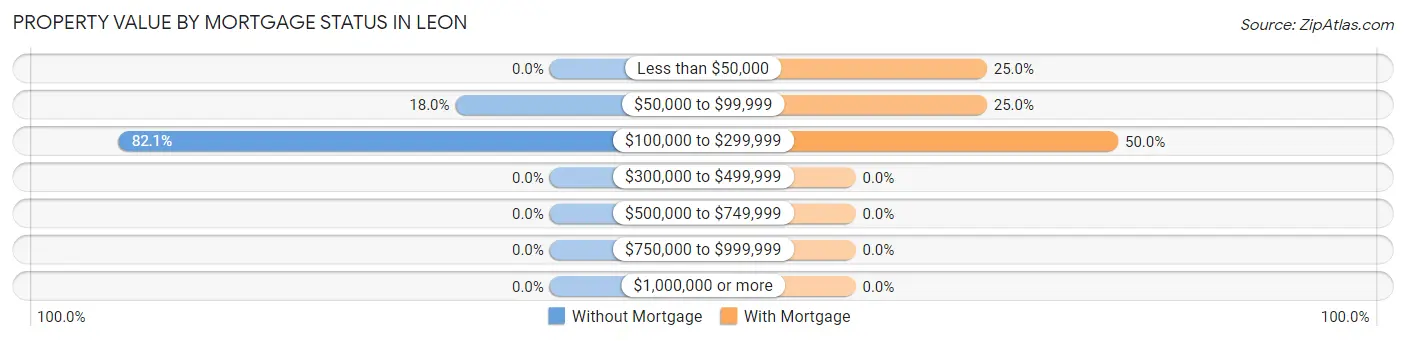
| Property Value | Without Mortgage | With Mortgage |
| Less than $50,000 | 0 (0.0%) | 3 (25.0%) |
| $50,000 to $99,999 | 7 (17.9%) | 3 (25.0%) |
| $100,000 to $299,999 | 32 (82.1%) | 6 (50.0%) |
| $300,000 to $499,999 | 0 (0.0%) | 0 (0.0%) |
| $500,000 to $749,999 | 0 (0.0%) | 0 (0.0%) |
| $750,000 to $999,999 | 0 (0.0%) | 0 (0.0%) |
| $1,000,000 or more | 0 (0.0%) | 0 (0.0%) |
| Total | 39 (100.0%) | 12 (100.0%) |
Household Income by Mortgage Status in Leon
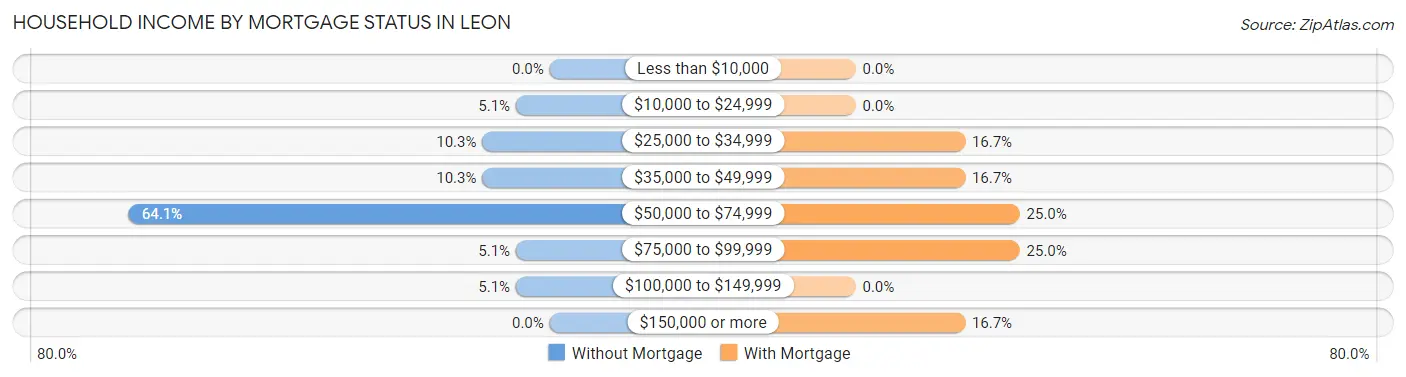
| Household Income | Without Mortgage | With Mortgage |
| Less than $10,000 | 0 (0.0%) | 0 (0.0%) |
| $10,000 to $24,999 | 2 (5.1%) | 0 (0.0%) |
| $25,000 to $34,999 | 4 (10.3%) | 2 (16.7%) |
| $35,000 to $49,999 | 4 (10.3%) | 2 (16.7%) |
| $50,000 to $74,999 | 25 (64.1%) | 3 (25.0%) |
| $75,000 to $99,999 | 2 (5.1%) | 3 (25.0%) |
| $100,000 to $149,999 | 2 (5.1%) | 0 (0.0%) |
| $150,000 or more | 0 (0.0%) | 2 (16.7%) |
| Total | 39 (100.0%) | 12 (100.0%) |
Property Value to Household Income Ratio in Leon
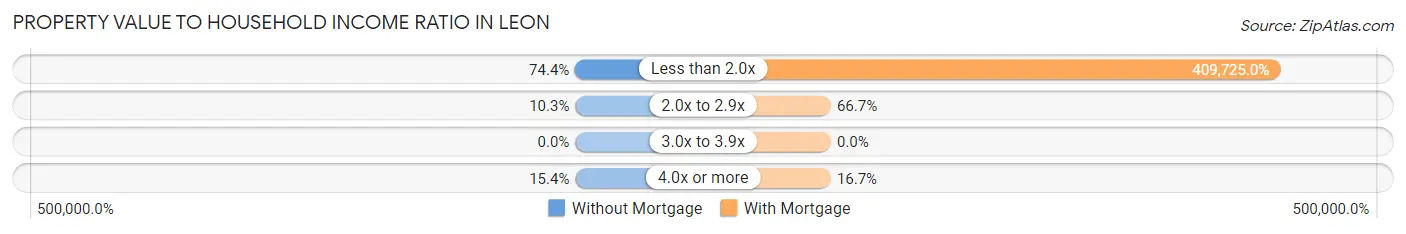
| Value-to-Income Ratio | Without Mortgage | With Mortgage |
| Less than 2.0x | 29 (74.4%) | 49,167 (409,725.0%) |
| 2.0x to 2.9x | 4 (10.3%) | 8 (66.7%) |
| 3.0x to 3.9x | 0 (0.0%) | 0 (0.0%) |
| 4.0x or more | 6 (15.4%) | 2 (16.7%) |
| Total | 39 (100.0%) | 12 (100.0%) |
Real Estate Taxes by Mortgage Status in Leon
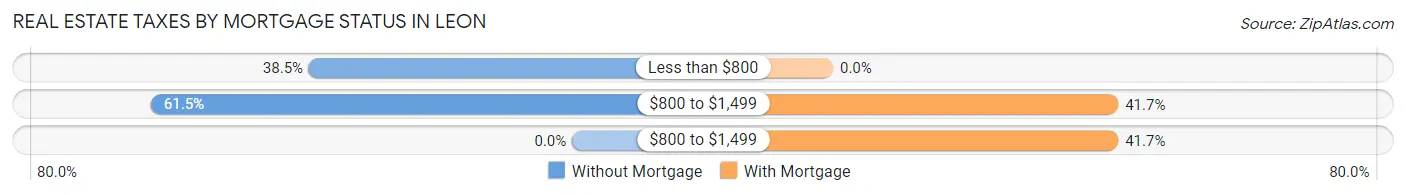
| Property Taxes | Without Mortgage | With Mortgage |
| Less than $800 | 15 (38.5%) | 0 (0.0%) |
| $800 to $1,499 | 24 (61.5%) | 5 (41.7%) |
| $800 to $1,499 | 0 (0.0%) | 5 (41.7%) |
| Total | 39 (100.0%) | 12 (100.0%) |
Health & Disability in Leon
Health Insurance Coverage by Age in Leon
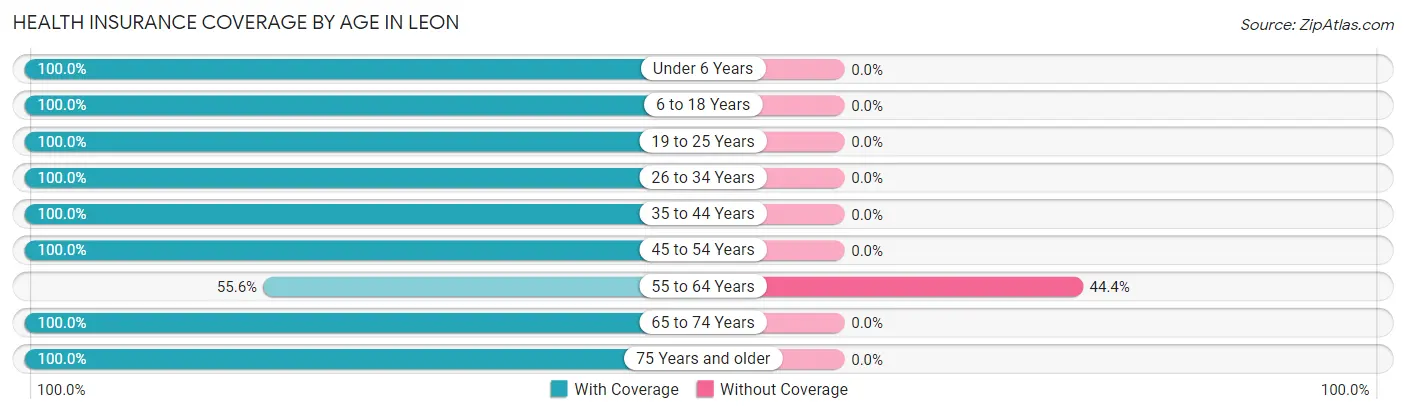
| Age Bracket | With Coverage | Without Coverage |
| Under 6 Years | 79 (100.0%) | 0 (0.0%) |
| 6 to 18 Years | 121 (100.0%) | 0 (0.0%) |
| 19 to 25 Years | 62 (100.0%) | 0 (0.0%) |
| 26 to 34 Years | 22 (100.0%) | 0 (0.0%) |
| 35 to 44 Years | 39 (100.0%) | 0 (0.0%) |
| 45 to 54 Years | 9 (100.0%) | 0 (0.0%) |
| 55 to 64 Years | 5 (55.6%) | 4 (44.4%) |
| 65 to 74 Years | 21 (100.0%) | 0 (0.0%) |
| 75 Years and older | 7 (100.0%) | 0 (0.0%) |
| Total | 365 (98.9%) | 4 (1.1%) |
Health Insurance Coverage by Citizenship Status in Leon
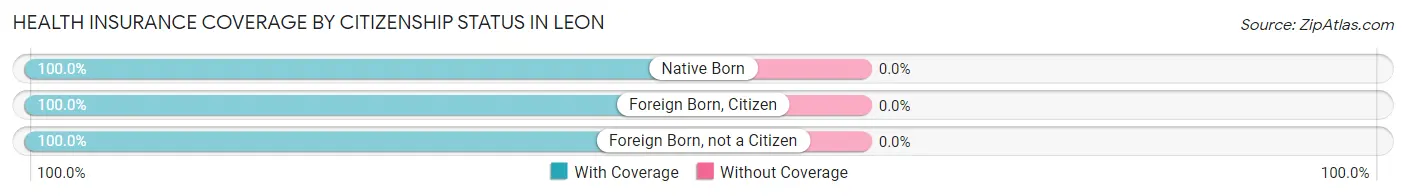
| Citizenship Status | With Coverage | Without Coverage |
| Native Born | 79 (100.0%) | 0 (0.0%) |
| Foreign Born, Citizen | 121 (100.0%) | 0 (0.0%) |
| Foreign Born, not a Citizen | 62 (100.0%) | 0 (0.0%) |
Health Insurance Coverage by Household Income in Leon
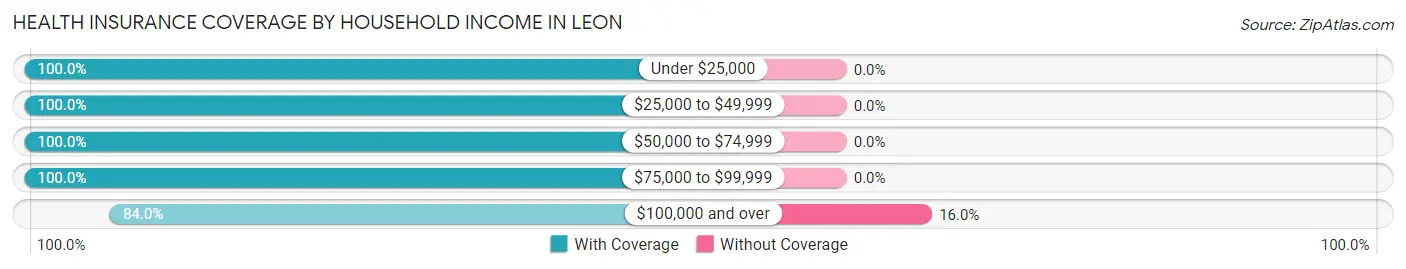
| Household Income | With Coverage | Without Coverage |
| Under $25,000 | 145 (100.0%) | 0 (0.0%) |
| $25,000 to $49,999 | 116 (100.0%) | 0 (0.0%) |
| $50,000 to $74,999 | 81 (100.0%) | 0 (0.0%) |
| $75,000 to $99,999 | 2 (100.0%) | 0 (0.0%) |
| $100,000 and over | 21 (84.0%) | 4 (16.0%) |
Public vs Private Health Insurance Coverage by Age in Leon
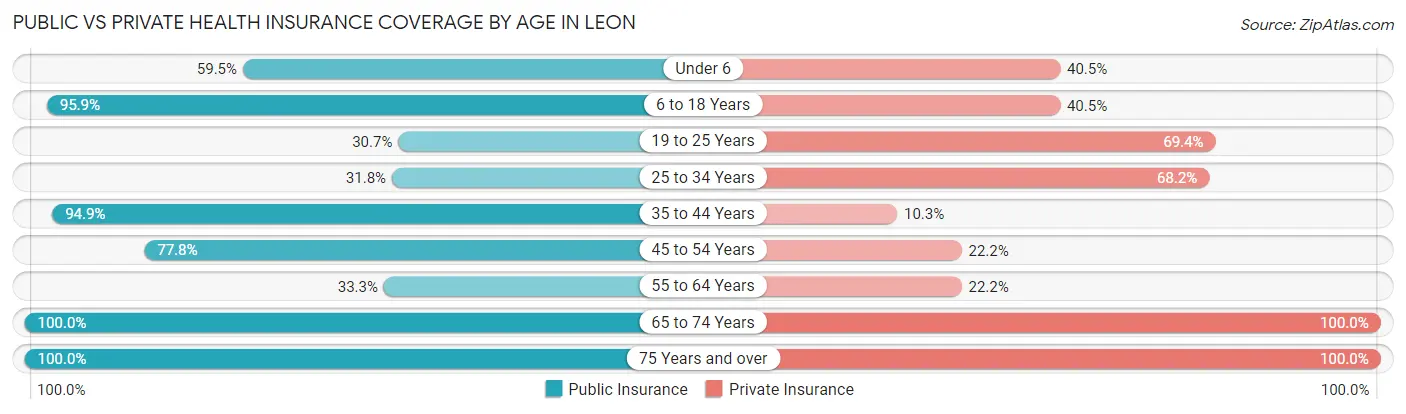
| Age Bracket | Public Insurance | Private Insurance |
| Under 6 | 47 (59.5%) | 32 (40.5%) |
| 6 to 18 Years | 116 (95.9%) | 49 (40.5%) |
| 19 to 25 Years | 19 (30.6%) | 43 (69.4%) |
| 25 to 34 Years | 7 (31.8%) | 15 (68.2%) |
| 35 to 44 Years | 37 (94.9%) | 4 (10.3%) |
| 45 to 54 Years | 7 (77.8%) | 2 (22.2%) |
| 55 to 64 Years | 3 (33.3%) | 2 (22.2%) |
| 65 to 74 Years | 21 (100.0%) | 21 (100.0%) |
| 75 Years and over | 7 (100.0%) | 7 (100.0%) |
| Total | 264 (71.5%) | 175 (47.4%) |
Disability Status by Sex by Age in Leon
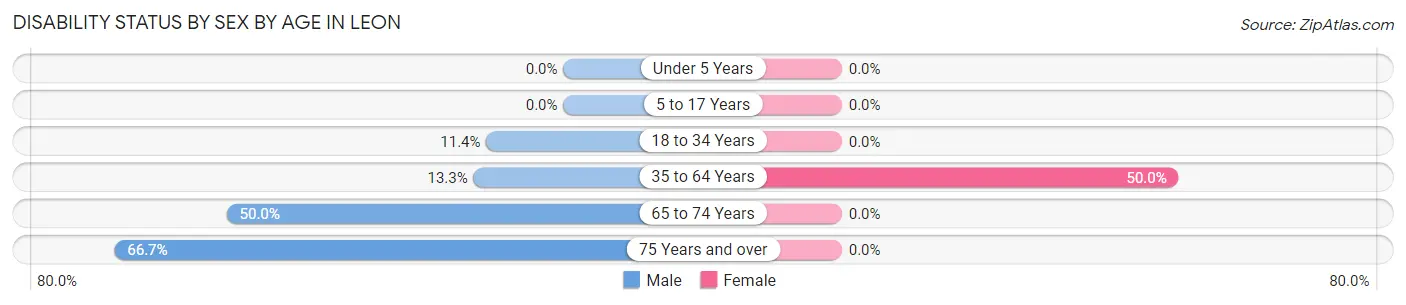
| Age Bracket | Male | Female |
| Under 5 Years | 0 (0.0%) | 0 (0.0%) |
| 5 to 17 Years | 0 (0.0%) | 0 (0.0%) |
| 18 to 34 Years | 4 (11.4%) | 0 (0.0%) |
| 35 to 64 Years | 2 (13.3%) | 21 (50.0%) |
| 65 to 74 Years | 7 (50.0%) | 0 (0.0%) |
| 75 Years and over | 2 (66.7%) | 0 (0.0%) |
Disability Class by Sex by Age in Leon
Disability Class: Hearing Difficulty
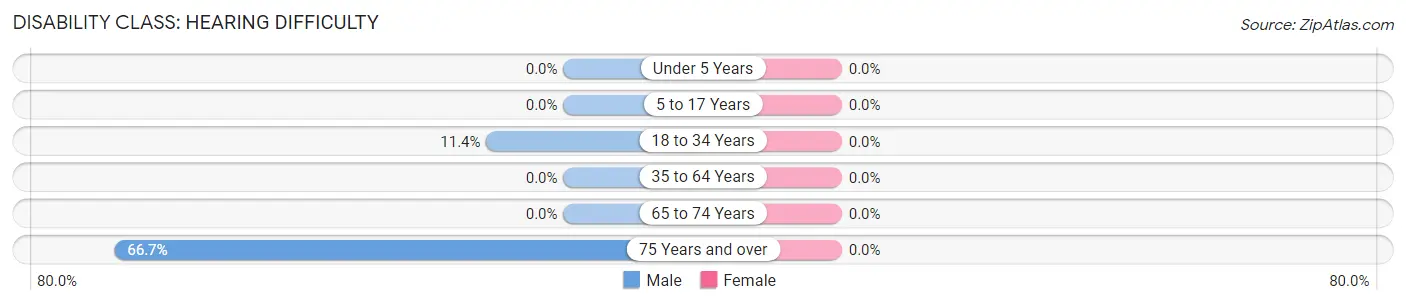
| Age Bracket | Male | Female |
| Under 5 Years | 0 (0.0%) | 0 (0.0%) |
| 5 to 17 Years | 0 (0.0%) | 0 (0.0%) |
| 18 to 34 Years | 4 (11.4%) | 0 (0.0%) |
| 35 to 64 Years | 0 (0.0%) | 0 (0.0%) |
| 65 to 74 Years | 0 (0.0%) | 0 (0.0%) |
| 75 Years and over | 2 (66.7%) | 0 (0.0%) |
Disability Class: Vision Difficulty
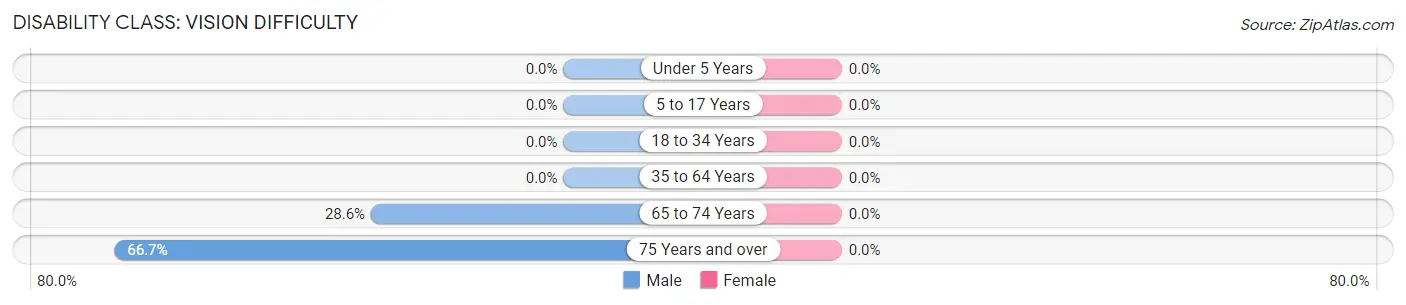
| Age Bracket | Male | Female |
| Under 5 Years | 0 (0.0%) | 0 (0.0%) |
| 5 to 17 Years | 0 (0.0%) | 0 (0.0%) |
| 18 to 34 Years | 0 (0.0%) | 0 (0.0%) |
| 35 to 64 Years | 0 (0.0%) | 0 (0.0%) |
| 65 to 74 Years | 4 (28.6%) | 0 (0.0%) |
| 75 Years and over | 2 (66.7%) | 0 (0.0%) |
Disability Class: Cognitive Difficulty
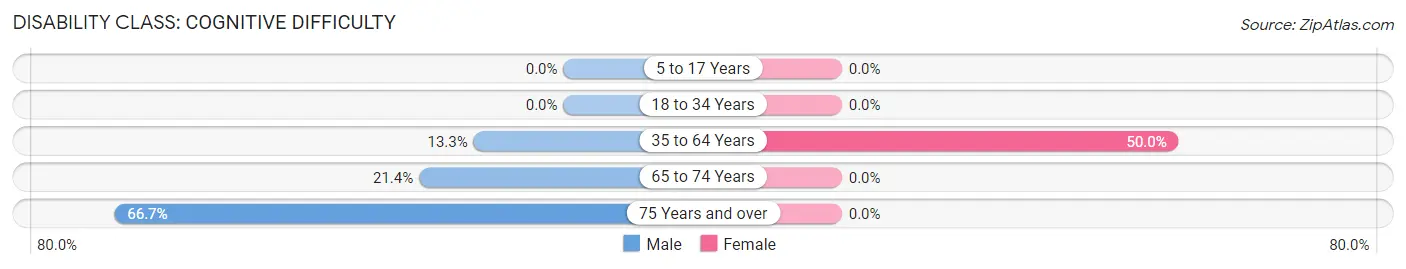
| Age Bracket | Male | Female |
| 5 to 17 Years | 0 (0.0%) | 0 (0.0%) |
| 18 to 34 Years | 0 (0.0%) | 0 (0.0%) |
| 35 to 64 Years | 2 (13.3%) | 21 (50.0%) |
| 65 to 74 Years | 3 (21.4%) | 0 (0.0%) |
| 75 Years and over | 2 (66.7%) | 0 (0.0%) |
Disability Class: Ambulatory Difficulty
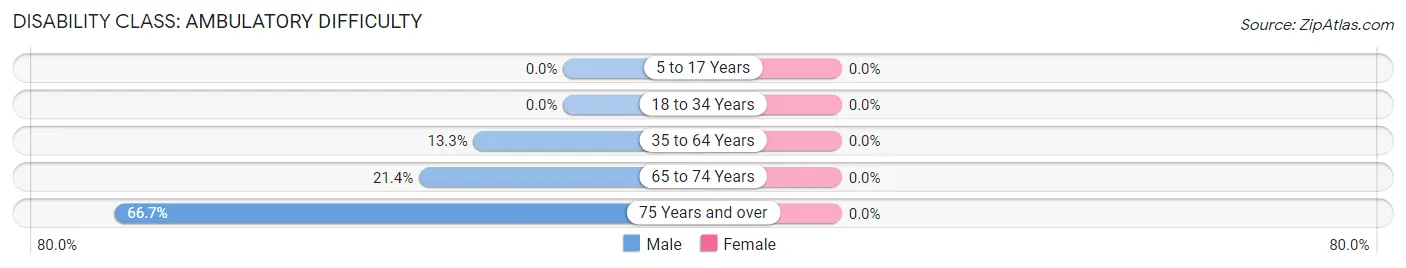
| Age Bracket | Male | Female |
| 5 to 17 Years | 0 (0.0%) | 0 (0.0%) |
| 18 to 34 Years | 0 (0.0%) | 0 (0.0%) |
| 35 to 64 Years | 2 (13.3%) | 0 (0.0%) |
| 65 to 74 Years | 3 (21.4%) | 0 (0.0%) |
| 75 Years and over | 2 (66.7%) | 0 (0.0%) |
Disability Class: Self-Care Difficulty
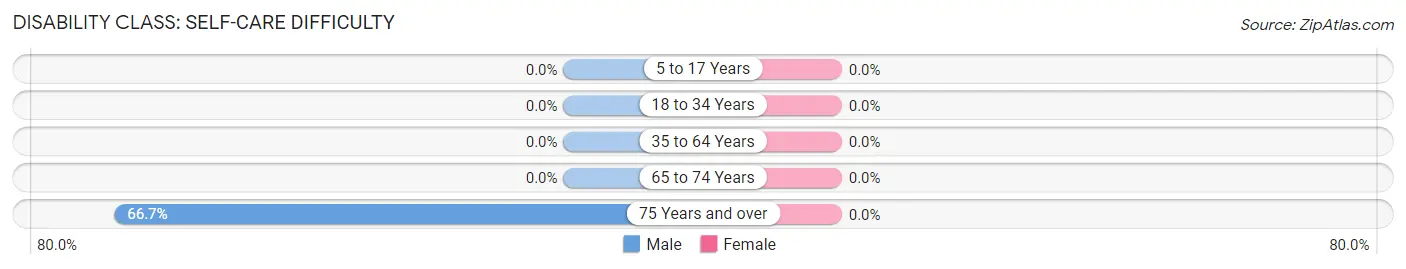
| Age Bracket | Male | Female |
| 5 to 17 Years | 0 (0.0%) | 0 (0.0%) |
| 18 to 34 Years | 0 (0.0%) | 0 (0.0%) |
| 35 to 64 Years | 0 (0.0%) | 0 (0.0%) |
| 65 to 74 Years | 0 (0.0%) | 0 (0.0%) |
| 75 Years and over | 2 (66.7%) | 0 (0.0%) |
Technology Access in Leon
Computing Device Access in Leon
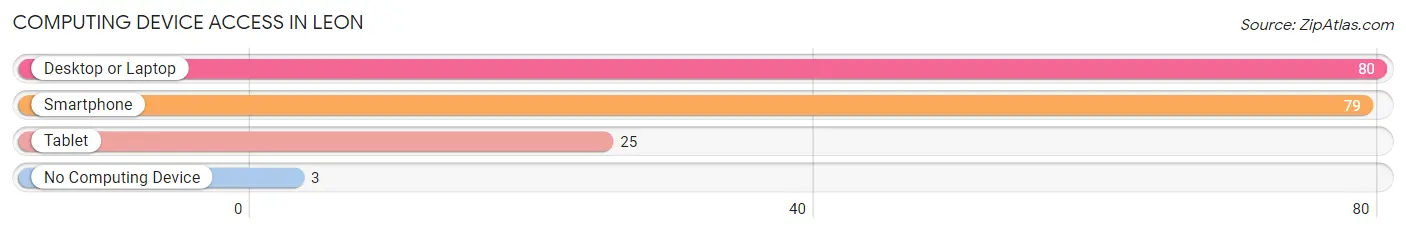
| Device Type | # Households | % Households |
| Desktop or Laptop | 80 | 86.0% |
| Smartphone | 79 | 85.0% |
| Tablet | 25 | 26.9% |
| No Computing Device | 3 | 3.2% |
| Total | 93 | 100.0% |
Internet Access in Leon
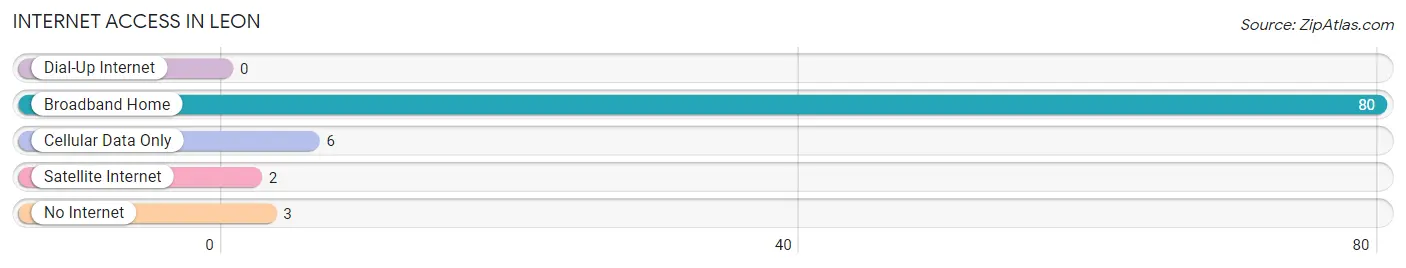
| Internet Type | # Households | % Households |
| Dial-Up Internet | 0 | 0.0% |
| Broadband Home | 80 | 86.0% |
| Cellular Data Only | 6 | 6.5% |
| Satellite Internet | 2 | 2.1% |
| No Internet | 3 | 3.2% |
| Total | 93 | 100.0% |
Leon Summary
Leon, West Virginia is a small town located in Mason County, West Virginia. It is situated on the banks of the Ohio River, and is part of the Point Pleasant Micropolitan Statistical Area. The town has a population of just over 500 people, and is known for its rural charm and small-town atmosphere.
History
The area that is now Leon was first settled in the late 1700s by a group of settlers from Pennsylvania. The town was originally known as “Mason’s Bottom”, and was later renamed “Leon” in honor of a local Revolutionary War hero, Colonel John Leon. The town was officially incorporated in 1891.
In the early 1900s, Leon was a thriving river town, with a bustling economy based on the river trade. The town was home to several businesses, including a sawmill, a gristmill, a general store, and a hotel. The town also had a ferry service that connected it to the nearby towns of Point Pleasant and Gallipolis.
In the mid-1900s, the economy of Leon began to decline as the river trade declined. The town’s businesses began to close, and the population began to dwindle. In the late 1900s, the town began to experience a resurgence, as new businesses began to open and the population began to grow.
Geography
Leon is located in the western part of Mason County, West Virginia. It is situated on the banks of the Ohio River, and is part of the Point Pleasant Micropolitan Statistical Area. The town is located approximately 25 miles south of Charleston, West Virginia, and is approximately 50 miles east of Cincinnati, Ohio.
The terrain of Leon is mostly flat, with some rolling hills. The town is located in a temperate climate zone, with hot summers and cold winters. The average annual temperature is around 50 degrees Fahrenheit.
Economy
The economy of Leon is largely based on agriculture and tourism. The town is home to several farms, which produce a variety of crops, including corn, soybeans, and hay. The town is also home to several tourist attractions, including the Leon Wildlife Refuge, the Leon Historical Museum, and the Leon Riverwalk.
The town is also home to several small businesses, including restaurants, retail stores, and service providers. The town is also home to a few manufacturing companies, which produce a variety of products, including furniture, clothing, and automotive parts.
Demographics
As of the 2010 census, the population of Leon was 514 people. The racial makeup of the town was 97.3% White, 0.6% African American, 0.2% Native American, 0.2% Asian, 0.4% from other races, and 1.3% from two or more races. The median household income was $35,625, and the median family income was $41,250.
The town is home to several churches, including the Leon United Methodist Church, the Leon Baptist Church, and the Leon Church of Christ. The town is also home to a public library, a post office, and a volunteer fire department.
Conclusion
Leon, West Virginia is a small town located in Mason County, West Virginia. It is situated on the banks of the Ohio River, and is part of the Point Pleasant Micropolitan Statistical Area. The town has a population of just over 500 people, and is known for its rural charm and small-town atmosphere. The economy of Leon is largely based on agriculture and tourism, and the town is home to several small businesses, churches, and other amenities.
Common Questions
What is Per Capita Income in Leon?
Per Capita income in Leon is $11,224.
What is the Median Family Income in Leon?
Median Family Income in Leon is $32,024.
What is the Median Household income in Leon?
Median Household Income in Leon is $32,083.
What is Income or Wage Gap in Leon?
Income or Wage Gap in Leon is 72.6%.
Women in Leon earn 27.4 cents for every dollar earned by a man.
What is Inequality or Gini Index in Leon?
Inequality or Gini Index in Leon is 0.33.
What is the Total Population of Leon?
Total Population of Leon is 369.
What is the Total Male Population of Leon?
Total Male Population of Leon is 152.
What is the Total Female Population of Leon?
Total Female Population of Leon is 217.
What is the Ratio of Males per 100 Females in Leon?
There are 70.05 Males per 100 Females in Leon.
What is the Ratio of Females per 100 Males in Leon?
There are 142.76 Females per 100 Males in Leon.
What is the Median Population Age in Leon?
Median Population Age in Leon is 14.8 Years.
What is the Average Family Size in Leon
Average Family Size in Leon is 3.4 People.
What is the Average Household Size in Leon
Average Household Size in Leon is 4.0 People.
How Large is the Labor Force in Leon?
There are 94 People in the Labor Forcein in Leon.
What is the Percentage of People in the Labor Force in Leon?
51.9% of People are in the Labor Force in Leon.