Lashmeet, WV Map & Demographics
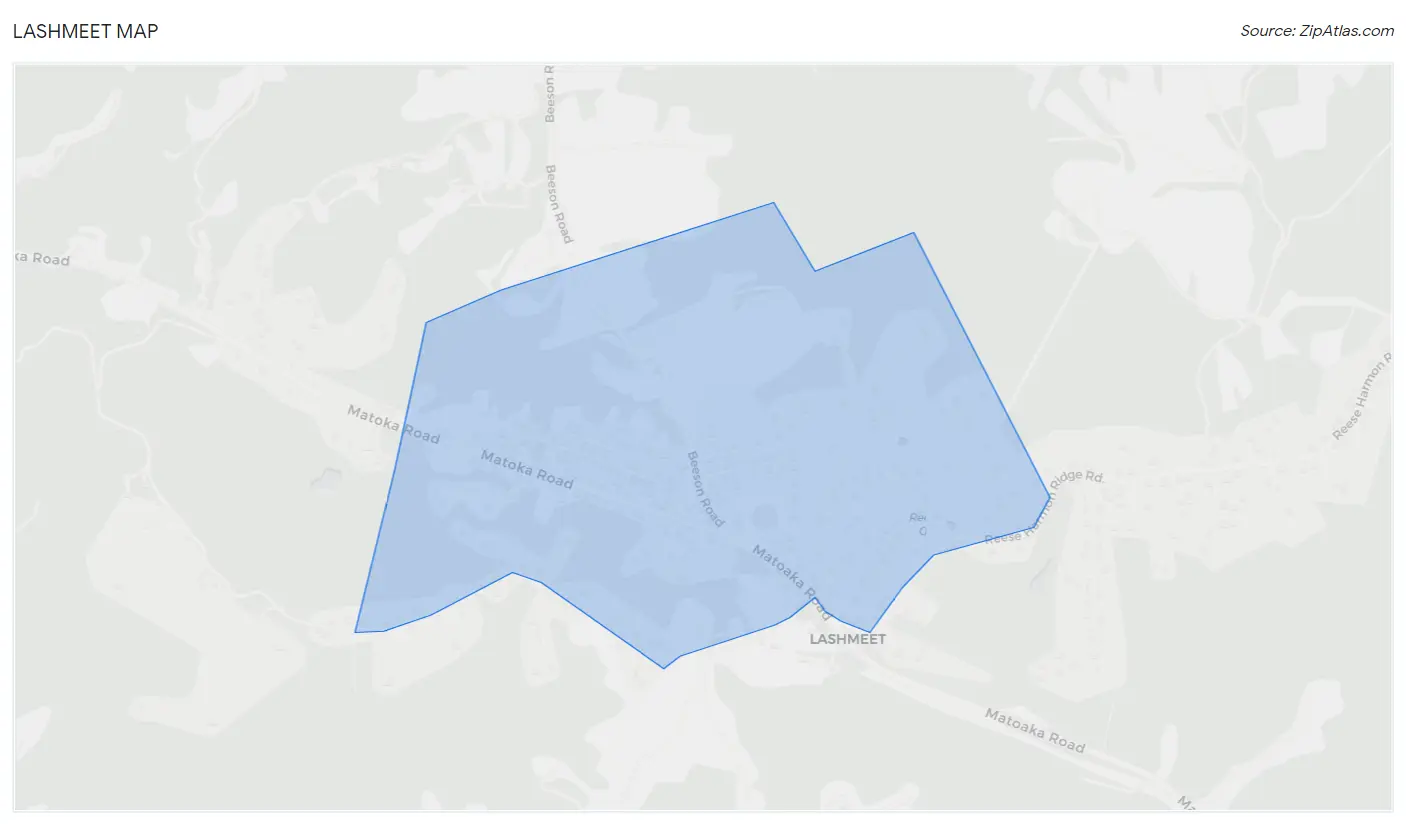
Lashmeet Map
Lashmeet Overview
$25,649
PER CAPITA INCOME
$43,701
AVG HOUSEHOLD INCOME
42.3%
WAGE / INCOME GAP [ % ]
57.7¢/ $1
WAGE / INCOME GAP [ $ ]
0.25
INEQUALITY / GINI INDEX
704
TOTAL POPULATION
296
MALE POPULATION
408
FEMALE POPULATION
72.55
MALES / 100 FEMALES
137.84
FEMALES / 100 MALES
61.1
MEDIAN AGE
2.8
AVG FAMILY SIZE
2.3
AVG HOUSEHOLD SIZE
295
LABOR FORCE [ PEOPLE ]
45.7%
PERCENT IN LABOR FORCE
Lashmeet Zip Codes
Lashmeet Area Codes
Income in Lashmeet
Income Overview in Lashmeet
| Characteristic | Number | Measure |
| Per Capita Income | 704 | $25,649 |
| Median Family Income | 176 | $0 |
| Mean Family Income | 176 | $58,680 |
| Median Household Income | 310 | $43,701 |
| Mean Household Income | 310 | $55,927 |
| Income Deficit | 176 | $0 |
| Wage / Income Gap (%) | 704 | 42.32% |
| Wage / Income Gap ($) | 704 | 57.68¢ per $1 |
| Gini / Inequality Index | 704 | 0.25 |
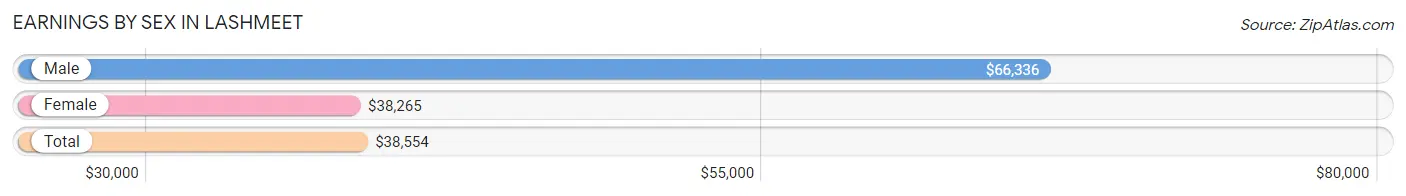
Earnings by Sex in Lashmeet
Average Earnings in Lashmeet are $38,554, $66,336 for men and $38,265 for women, a difference of 42.3%.
| Sex | Number | Average Earnings |
| Male | 71 (24.1%) | $66,336 |
| Female | 224 (75.9%) | $38,265 |
| Total | 295 (100.0%) | $38,554 |
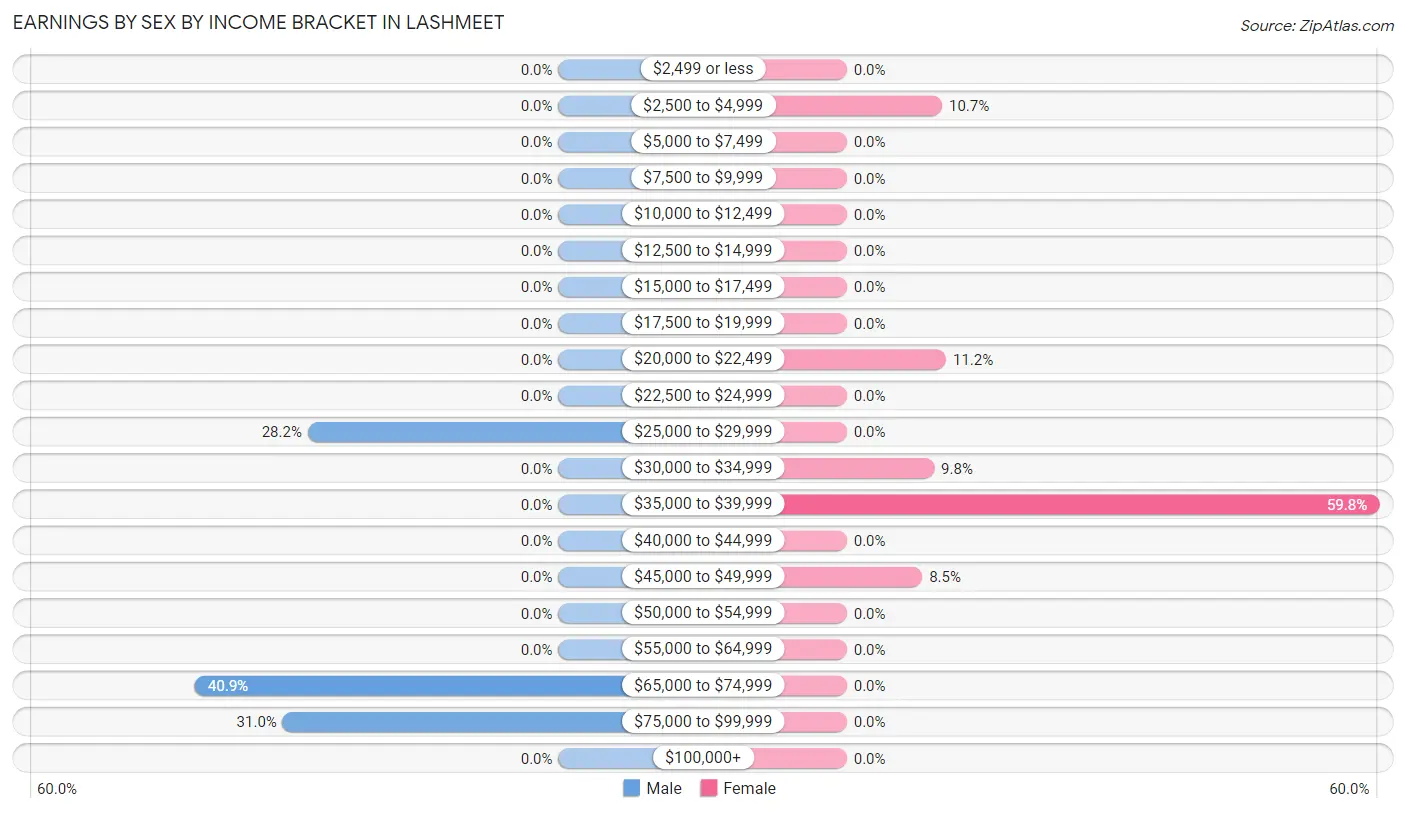
Earnings by Sex by Income Bracket in Lashmeet
The most common earnings brackets in Lashmeet are $65,000 to $74,999 for men (29 | 40.8%) and $35,000 to $39,999 for women (134 | 59.8%).
| Income | Male | Female |
| $2,499 or less | 0 (0.0%) | 0 (0.0%) |
| $2,500 to $4,999 | 0 (0.0%) | 24 (10.7%) |
| $5,000 to $7,499 | 0 (0.0%) | 0 (0.0%) |
| $7,500 to $9,999 | 0 (0.0%) | 0 (0.0%) |
| $10,000 to $12,499 | 0 (0.0%) | 0 (0.0%) |
| $12,500 to $14,999 | 0 (0.0%) | 0 (0.0%) |
| $15,000 to $17,499 | 0 (0.0%) | 0 (0.0%) |
| $17,500 to $19,999 | 0 (0.0%) | 0 (0.0%) |
| $20,000 to $22,499 | 0 (0.0%) | 25 (11.2%) |
| $22,500 to $24,999 | 0 (0.0%) | 0 (0.0%) |
| $25,000 to $29,999 | 20 (28.2%) | 0 (0.0%) |
| $30,000 to $34,999 | 0 (0.0%) | 22 (9.8%) |
| $35,000 to $39,999 | 0 (0.0%) | 134 (59.8%) |
| $40,000 to $44,999 | 0 (0.0%) | 0 (0.0%) |
| $45,000 to $49,999 | 0 (0.0%) | 19 (8.5%) |
| $50,000 to $54,999 | 0 (0.0%) | 0 (0.0%) |
| $55,000 to $64,999 | 0 (0.0%) | 0 (0.0%) |
| $65,000 to $74,999 | 29 (40.8%) | 0 (0.0%) |
| $75,000 to $99,999 | 22 (31.0%) | 0 (0.0%) |
| $100,000+ | 0 (0.0%) | 0 (0.0%) |
| Total | 71 (100.0%) | 224 (100.0%) |
Earnings by Sex by Educational Attainment in Lashmeet
| Educational Attainment | Male Income | Female Income |
| Less than High School | - | - |
| High School Diploma | - | - |
| College or Associate's Degree | - | - |
| Bachelor's Degree | - | - |
| Graduate Degree | - | - |
| Total | - | - |
Family Income in Lashmeet
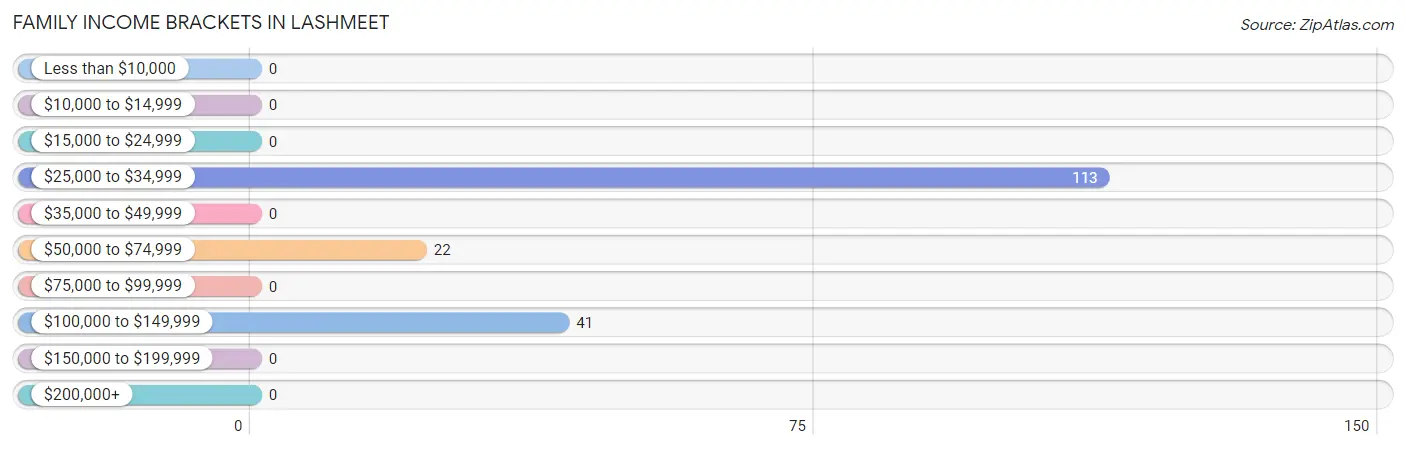
Family Income Brackets in Lashmeet
According to the Lashmeet family income data, there are 113 families falling into the $25,000 to $34,999 income range, which is the most common income bracket and makes up 64.2% of all families.
| Income Bracket | # Families | % Families |
| Less than $10,000 | 0 | 0.0% |
| $10,000 to $14,999 | 0 | 0.0% |
| $15,000 to $24,999 | 0 | 0.0% |
| $25,000 to $34,999 | 113 | 64.2% |
| $35,000 to $49,999 | 0 | 0.0% |
| $50,000 to $74,999 | 22 | 12.5% |
| $75,000 to $99,999 | 0 | 0.0% |
| $100,000 to $149,999 | 41 | 23.3% |
| $150,000 to $199,999 | 0 | 0.0% |
| $200,000+ | 0 | 0.0% |
Family Income by Famaliy Size in Lashmeet
| Income Bracket | # Families | Median Income |
| 2-Person Families | 92 (52.3%) | $0 |
| 3-Person Families | 19 (10.8%) | $0 |
| 4-Person Families | 65 (36.9%) | $0 |
| 5-Person Families | 0 (0.0%) | $0 |
| 6-Person Families | 0 (0.0%) | $0 |
| 7+ Person Families | 0 (0.0%) | $0 |
| Total | 176 (100.0%) | $0 |
Family Income by Number of Earners in Lashmeet
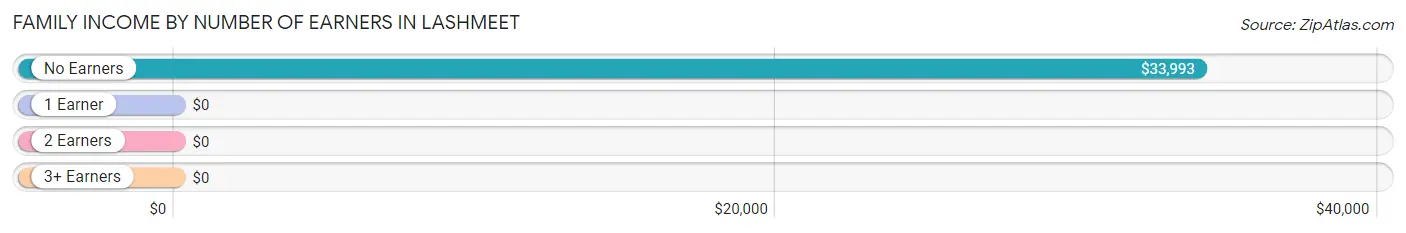
| Number of Earners | # Families | Median Income |
| No Earners | 135 (76.7%) | $33,993 |
| 1 Earner | 0 (0.0%) | $0 |
| 2 Earners | 0 (0.0%) | $0 |
| 3+ Earners | 41 (23.3%) | $0 |
| Total | 176 (100.0%) | $0 |
Household Income in Lashmeet
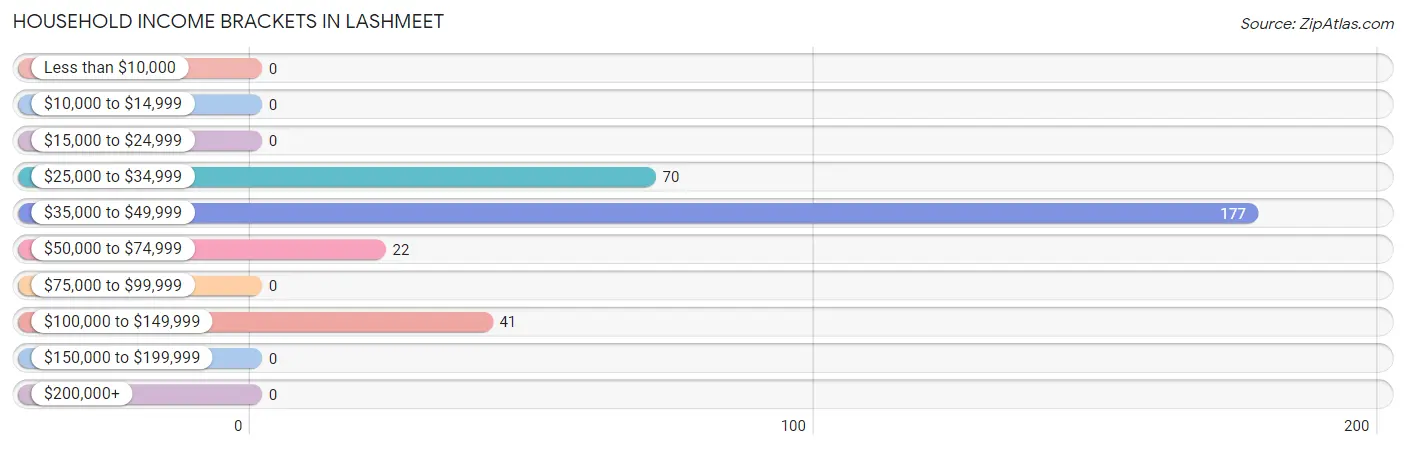
Household Income Brackets in Lashmeet
With 177 households falling in the category, the $35,000 to $49,999 income range is the most frequent in Lashmeet, accounting for 57.1% of all households.
| Income Bracket | # Households | % Households |
| Less than $10,000 | 0 | 0.0% |
| $10,000 to $14,999 | 0 | 0.0% |
| $15,000 to $24,999 | 0 | 0.0% |
| $25,000 to $34,999 | 70 | 22.6% |
| $35,000 to $49,999 | 177 | 57.1% |
| $50,000 to $74,999 | 22 | 7.1% |
| $75,000 to $99,999 | 0 | 0.0% |
| $100,000 to $149,999 | 41 | 13.2% |
| $150,000 to $199,999 | 0 | 0.0% |
| $200,000+ | 0 | 0.0% |
Household Income by Householder Age in Lashmeet
| Income Bracket | # Households | Median Income |
| 15 to 24 Years | 0 (0.0%) | $0 |
| 25 to 44 Years | 43 (13.9%) | $0 |
| 45 to 64 Years | 175 (56.5%) | $0 |
| 65+ Years | 92 (29.7%) | $0 |
| Total | 310 (100.0%) | $43,701 |
Poverty in Lashmeet
Income Below Poverty by Sex and Age in Lashmeet
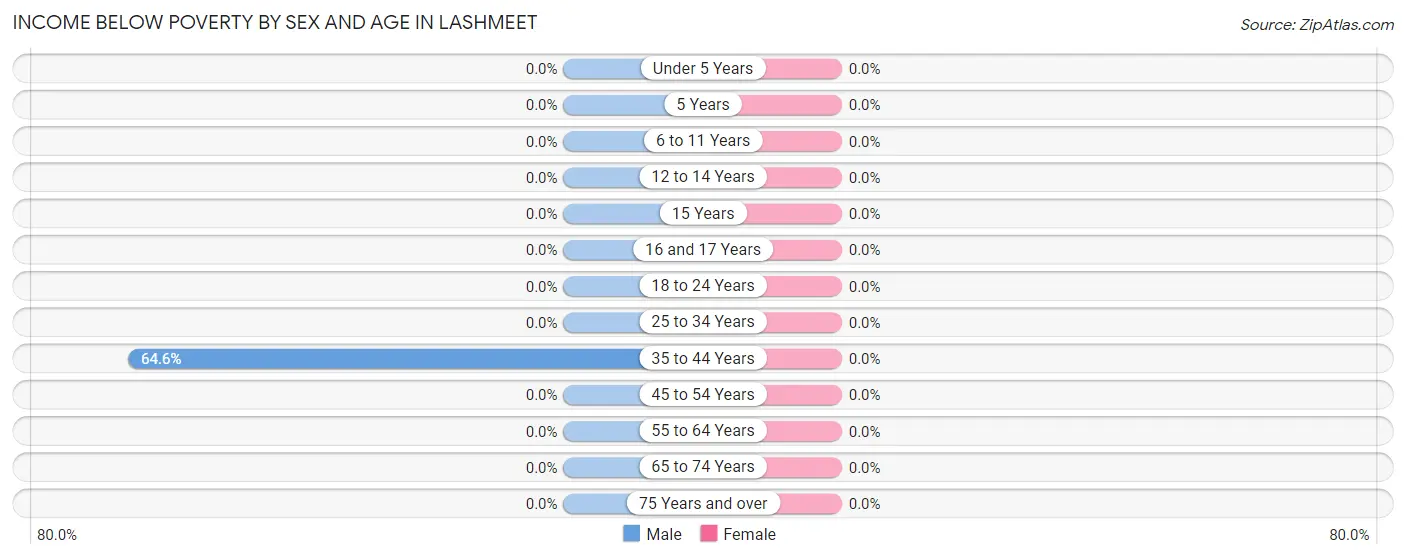
| Age Bracket | Male | Female |
| Under 5 Years | 0 (0.0%) | 0 (0.0%) |
| 5 Years | 0 (0.0%) | 0 (0.0%) |
| 6 to 11 Years | 0 (0.0%) | 0 (0.0%) |
| 12 to 14 Years | 0 (0.0%) | 0 (0.0%) |
| 15 Years | 0 (0.0%) | 0 (0.0%) |
| 16 and 17 Years | 0 (0.0%) | 0 (0.0%) |
| 18 to 24 Years | 0 (0.0%) | 0 (0.0%) |
| 25 to 34 Years | 0 (0.0%) | 0 (0.0%) |
| 35 to 44 Years | 53 (64.6%) | 0 (0.0%) |
| 45 to 54 Years | 0 (0.0%) | 0 (0.0%) |
| 55 to 64 Years | 0 (0.0%) | 0 (0.0%) |
| 65 to 74 Years | 0 (0.0%) | 0 (0.0%) |
| 75 Years and over | 0 (0.0%) | 0 (0.0%) |
| Total | 53 (17.9%) | 0 (0.0%) |
Income Above Poverty by Sex and Age in Lashmeet
According to the poverty statistics in Lashmeet, males aged 18 to 24 years and females aged 6 to 11 years are the age groups that are most secure financially, with 100.0% of males and 100.0% of females in these age groups living above the poverty line.
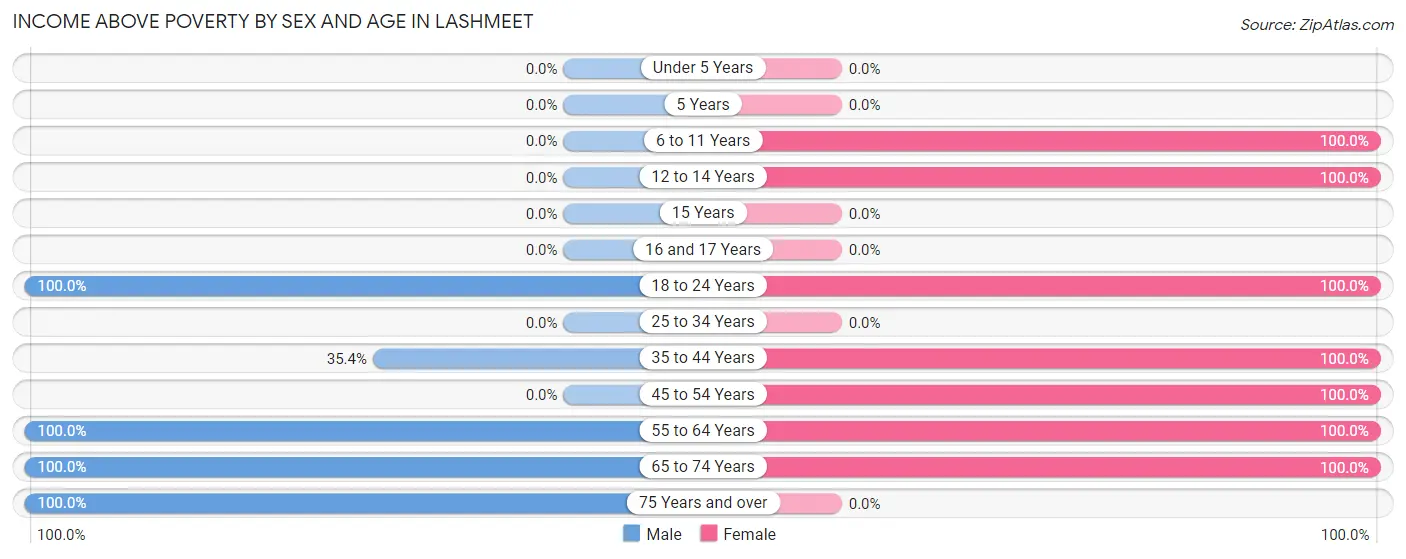
| Age Bracket | Male | Female |
| Under 5 Years | 0 (0.0%) | 0 (0.0%) |
| 5 Years | 0 (0.0%) | 0 (0.0%) |
| 6 to 11 Years | 0 (0.0%) | 20 (100.0%) |
| 12 to 14 Years | 0 (0.0%) | 38 (100.0%) |
| 15 Years | 0 (0.0%) | 0 (0.0%) |
| 16 and 17 Years | 0 (0.0%) | 0 (0.0%) |
| 18 to 24 Years | 50 (100.0%) | 49 (100.0%) |
| 25 to 34 Years | 0 (0.0%) | 0 (0.0%) |
| 35 to 44 Years | 29 (35.4%) | 43 (100.0%) |
| 45 to 54 Years | 0 (0.0%) | 22 (100.0%) |
| 55 to 64 Years | 22 (100.0%) | 153 (100.0%) |
| 65 to 74 Years | 72 (100.0%) | 83 (100.0%) |
| 75 Years and over | 70 (100.0%) | 0 (0.0%) |
| Total | 243 (82.1%) | 408 (100.0%) |
Income Below Poverty Among Married-Couple Families in Lashmeet
| Children | Above Poverty | Below Poverty |
| No Children | 111 (100.0%) | 0 (0.0%) |
| 1 or 2 Children | 22 (100.0%) | 0 (0.0%) |
| 3 or 4 Children | 0 (0.0%) | 0 (0.0%) |
| 5 or more Children | 0 (0.0%) | 0 (0.0%) |
| Total | 133 (100.0%) | 0 (0.0%) |
Income Below Poverty Among Single-Parent Households in Lashmeet
| Children | Single Father | Single Mother |
| No Children | 0 (0.0%) | 0 (0.0%) |
| 1 or 2 Children | 0 (0.0%) | 0 (0.0%) |
| 3 or 4 Children | 0 (0.0%) | 0 (0.0%) |
| 5 or more Children | 0 (0.0%) | 0 (0.0%) |
| Total | 0 (0.0%) | 0 (0.0%) |
Income Below Poverty Among Married-Couple vs Single-Parent Households in Lashmeet
| Children | Married-Couple Families | Single-Parent Households |
| No Children | 0 (0.0%) | 0 (0.0%) |
| 1 or 2 Children | 0 (0.0%) | 0 (0.0%) |
| 3 or 4 Children | 0 (0.0%) | 0 (0.0%) |
| 5 or more Children | 0 (0.0%) | 0 (0.0%) |
| Total | 0 (0.0%) | 0 (0.0%) |
Race in Lashmeet
The most populous races in Lashmeet are , and White / Caucasian (704 | 100.0%).
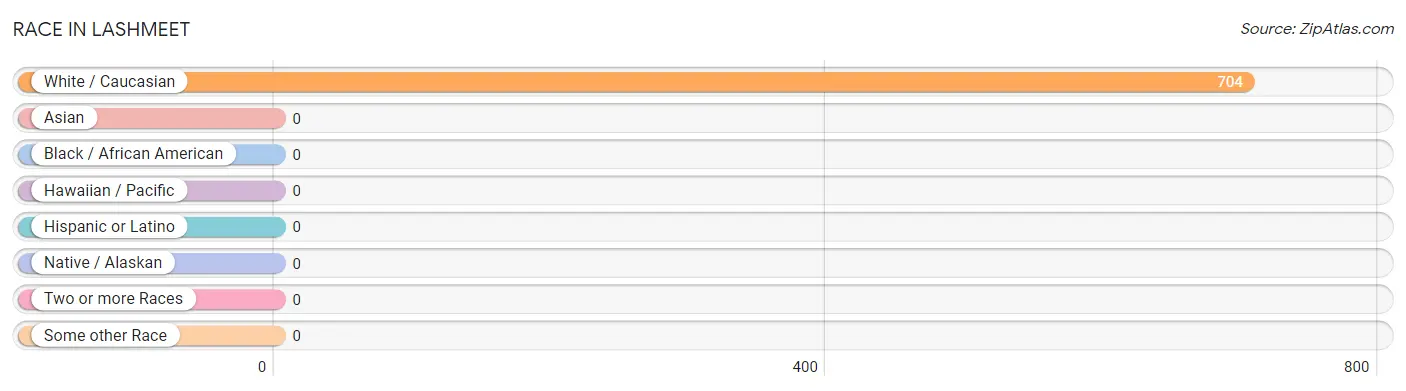
| Race | # Population | % Population |
| Asian | 0 | 0.0% |
| Black / African American | 0 | 0.0% |
| Hawaiian / Pacific | 0 | 0.0% |
| Hispanic or Latino | 0 | 0.0% |
| Native / Alaskan | 0 | 0.0% |
| White / Caucasian | 704 | 100.0% |
| Two or more Races | 0 | 0.0% |
| Some other Race | 0 | 0.0% |
| Total | 704 | 100.0% |
Ancestry in Lashmeet
The most populous ancestries reported in Lashmeet are English (134 | 19.0%), European (44 | 6.2%), Dutch (22 | 3.1%), and Scotch-Irish (22 | 3.1%), together accounting for 31.5% of all Lashmeet residents.
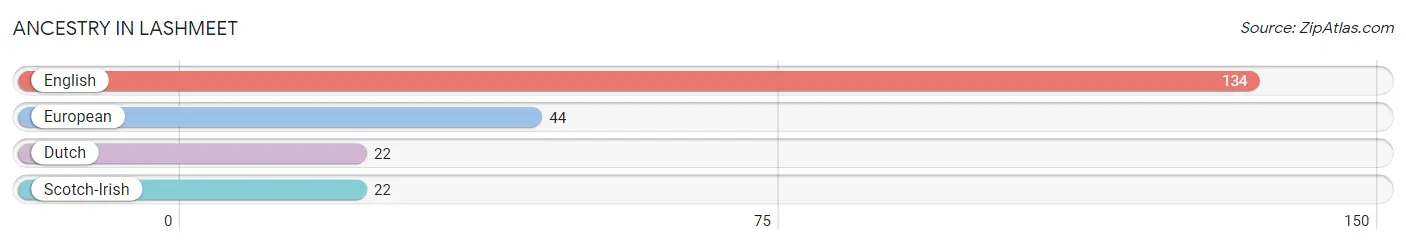
| Ancestry | # Population | % Population |
| Dutch | 22 | 3.1% |
| English | 134 | 19.0% |
| European | 44 | 6.2% |
| Scotch-Irish | 22 | 3.1% | View All 4 Rows |
Immigrants in Lashmeet

| Immigration Origin | # Population | % Population | View All 0 Rows |
Sex and Age in Lashmeet
Sex and Age in Lashmeet
The most populous age groups in Lashmeet are 65 to 69 Years (72 | 24.3%) for men and 60 to 64 Years (134 | 32.8%) for women.
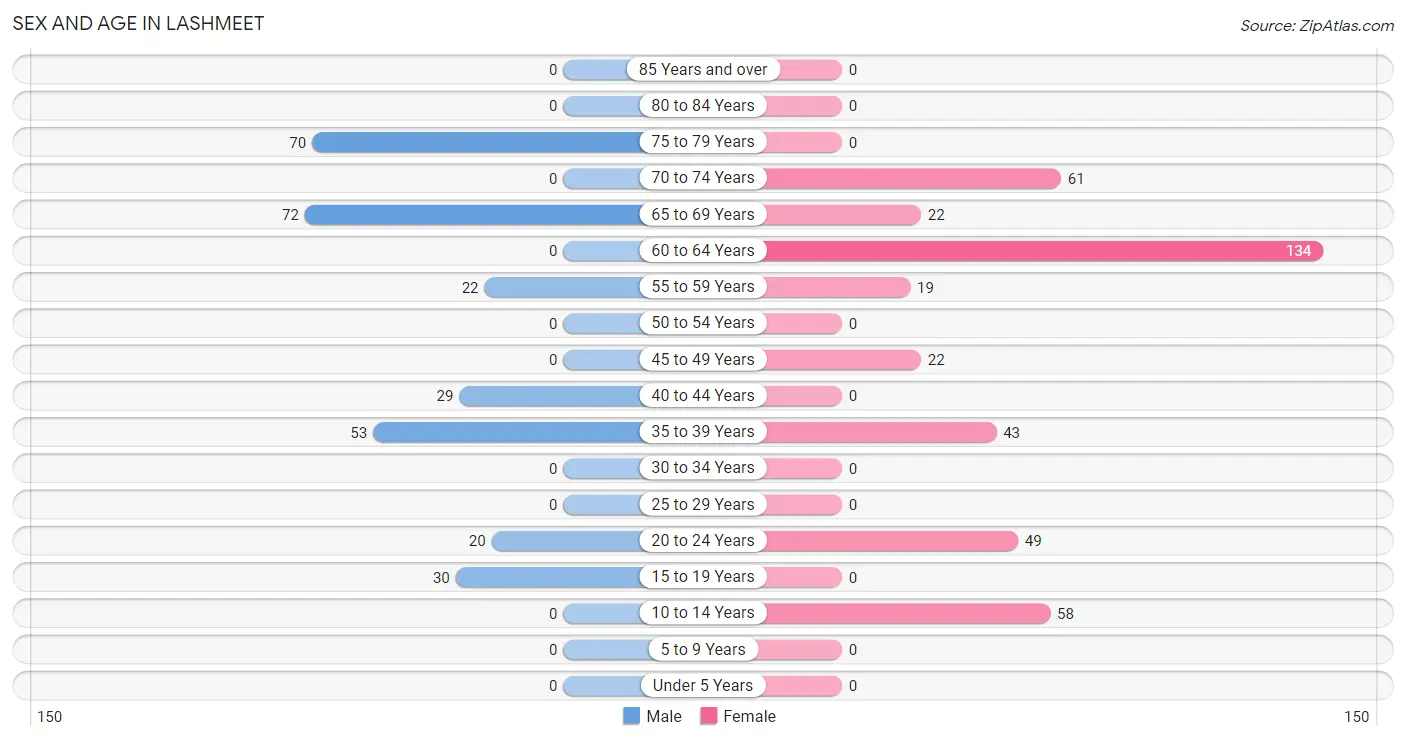
| Age Bracket | Male | Female |
| Under 5 Years | 0 (0.0%) | 0 (0.0%) |
| 5 to 9 Years | 0 (0.0%) | 0 (0.0%) |
| 10 to 14 Years | 0 (0.0%) | 58 (14.2%) |
| 15 to 19 Years | 30 (10.1%) | 0 (0.0%) |
| 20 to 24 Years | 20 (6.8%) | 49 (12.0%) |
| 25 to 29 Years | 0 (0.0%) | 0 (0.0%) |
| 30 to 34 Years | 0 (0.0%) | 0 (0.0%) |
| 35 to 39 Years | 53 (17.9%) | 43 (10.5%) |
| 40 to 44 Years | 29 (9.8%) | 0 (0.0%) |
| 45 to 49 Years | 0 (0.0%) | 22 (5.4%) |
| 50 to 54 Years | 0 (0.0%) | 0 (0.0%) |
| 55 to 59 Years | 22 (7.4%) | 19 (4.7%) |
| 60 to 64 Years | 0 (0.0%) | 134 (32.8%) |
| 65 to 69 Years | 72 (24.3%) | 22 (5.4%) |
| 70 to 74 Years | 0 (0.0%) | 61 (14.9%) |
| 75 to 79 Years | 70 (23.6%) | 0 (0.0%) |
| 80 to 84 Years | 0 (0.0%) | 0 (0.0%) |
| 85 Years and over | 0 (0.0%) | 0 (0.0%) |
| Total | 296 (100.0%) | 408 (100.0%) |
Families and Households in Lashmeet
Median Family Size in Lashmeet
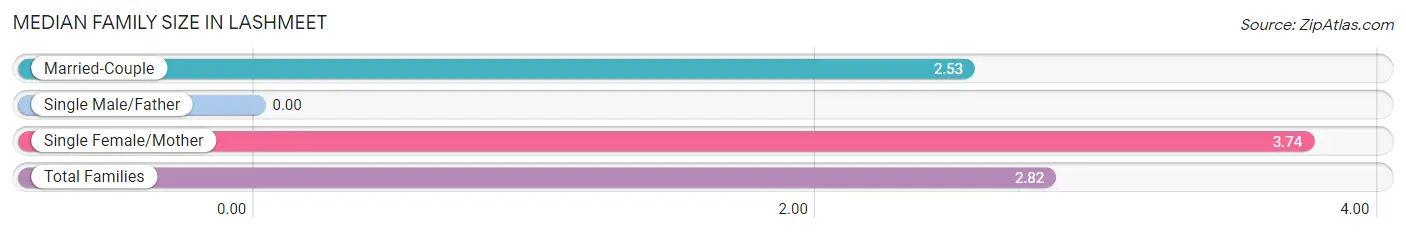
| Family Type | # Families | Family Size |
| Married-Couple | 133 (75.6%) | 2.53 |
| Single Male/Father | 0 (0.0%) | - |
| Single Female/Mother | 43 (24.4%) | 3.74 |
| Total Families | 176 (100.0%) | 2.82 |
Median Household Size in Lashmeet
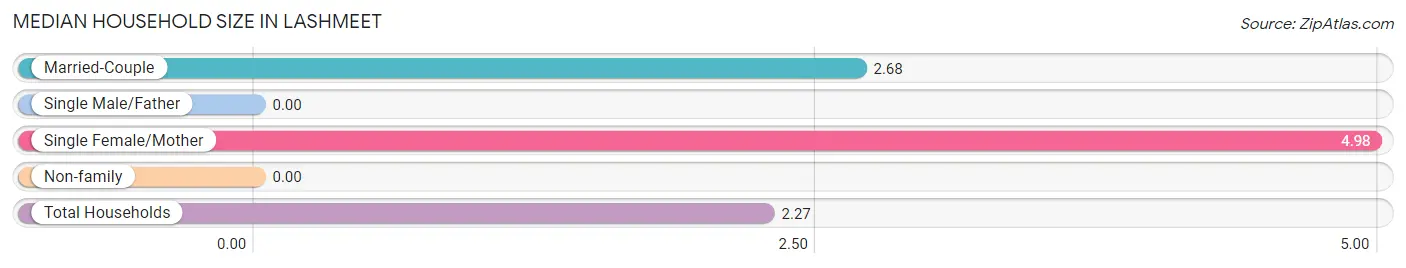
| Household Type | # Households | Household Size |
| Married-Couple | 133 (42.9%) | 2.68 |
| Single Male/Father | 0 (0.0%) | - |
| Single Female/Mother | 43 (13.9%) | 4.98 |
| Non-family | 134 (43.2%) | - |
| Total Households | 310 (100.0%) | 2.27 |
Household Size by Marriage Status in Lashmeet
Out of a total of 310 households in Lashmeet, 176 (56.8%) are family households, while 134 (43.2%) are nonfamily households. The most numerous type of family households are 2-person households, comprising 92, and the most common type of nonfamily households are 1-person households, comprising 134.
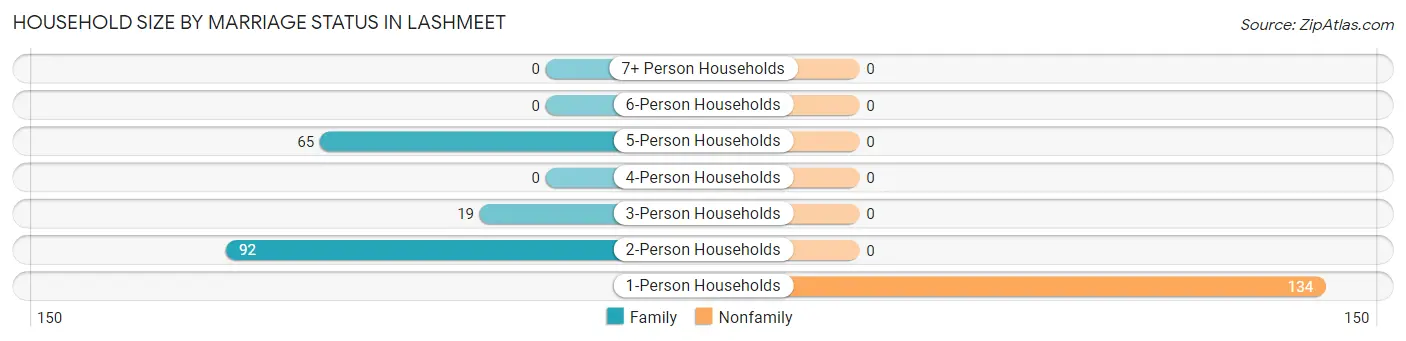
| Household Size | Family Households | Nonfamily Households |
| 1-Person Households | - | 134 (43.2%) |
| 2-Person Households | 92 (29.7%) | 0 (0.0%) |
| 3-Person Households | 19 (6.1%) | 0 (0.0%) |
| 4-Person Households | 0 (0.0%) | 0 (0.0%) |
| 5-Person Households | 65 (21.0%) | 0 (0.0%) |
| 6-Person Households | 0 (0.0%) | 0 (0.0%) |
| 7+ Person Households | 0 (0.0%) | 0 (0.0%) |
| Total | 176 (56.8%) | 134 (43.2%) |
Female Fertility in Lashmeet
Fertility by Age in Lashmeet
| Age Bracket | Women with Births | Births / 1,000 Women |
| 15 to 19 years | 0 (0.0%) | 0.0 |
| 20 to 34 years | 0 (0.0%) | 0.0 |
| 35 to 50 years | 0 (0.0%) | 0.0 |
| Total | 0 (0.0%) | 0.0 |
Fertility by Age by Marriage Status in Lashmeet
| Age Bracket | Married | Unmarried |
| 15 to 19 years | 0 (0.0%) | 0 (0.0%) |
| 20 to 34 years | 0 (0.0%) | 0 (0.0%) |
| 35 to 50 years | 0 (0.0%) | 0 (0.0%) |
| Total | 0 (0.0%) | 0 (0.0%) |
Fertility by Education in Lashmeet
| Educational Attainment | Women with Births | Births / 1,000 Women |
| Less than High School | 0 (0.0%) | 0.0 |
| High School Diploma | 0 (0.0%) | 0.0 |
| College or Associate's Degree | 0 (0.0%) | 0.0 |
| Bachelor's Degree | 0 (0.0%) | 0.0 |
| Graduate Degree | 0 (0.0%) | 0.0 |
| Total | 0 (0.0%) | 0.0 |
Fertility by Education by Marriage Status in Lashmeet
| Educational Attainment | Married | Unmarried |
| Less than High School | 0 (0.0%) | 0 (0.0%) |
| High School Diploma | 0 (0.0%) | 0 (0.0%) |
| College or Associate's Degree | 0 (0.0%) | 0 (0.0%) |
| Bachelor's Degree | 0 (0.0%) | 0 (0.0%) |
| Graduate Degree | 0 (0.0%) | 0 (0.0%) |
| Total | 0 (0.0%) | 0 (0.0%) |
Employment Characteristics in Lashmeet
Employment by Class of Employer in Lashmeet
Among the 295 employed individuals in Lashmeet, local government employees (153 | 51.9%), private company employees (95 | 32.2%), and not-for-profit organizations (25 | 8.5%) make up the most common classes of employment.
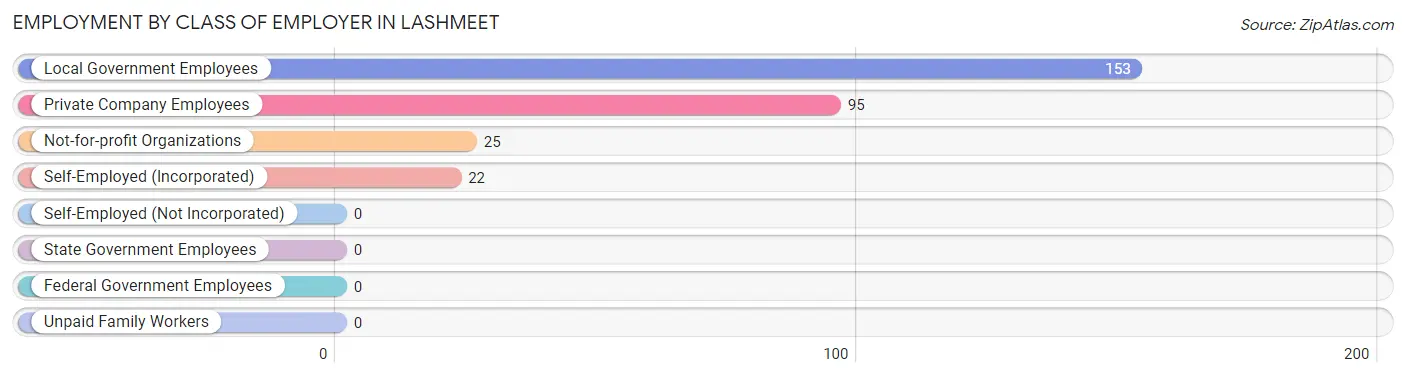
| Employer Class | # Employees | % Employees |
| Private Company Employees | 95 | 32.2% |
| Self-Employed (Incorporated) | 22 | 7.5% |
| Self-Employed (Not Incorporated) | 0 | 0.0% |
| Not-for-profit Organizations | 25 | 8.5% |
| Local Government Employees | 153 | 51.9% |
| State Government Employees | 0 | 0.0% |
| Federal Government Employees | 0 | 0.0% |
| Unpaid Family Workers | 0 | 0.0% |
| Total | 295 | 100.0% |
Employment Status by Age in Lashmeet
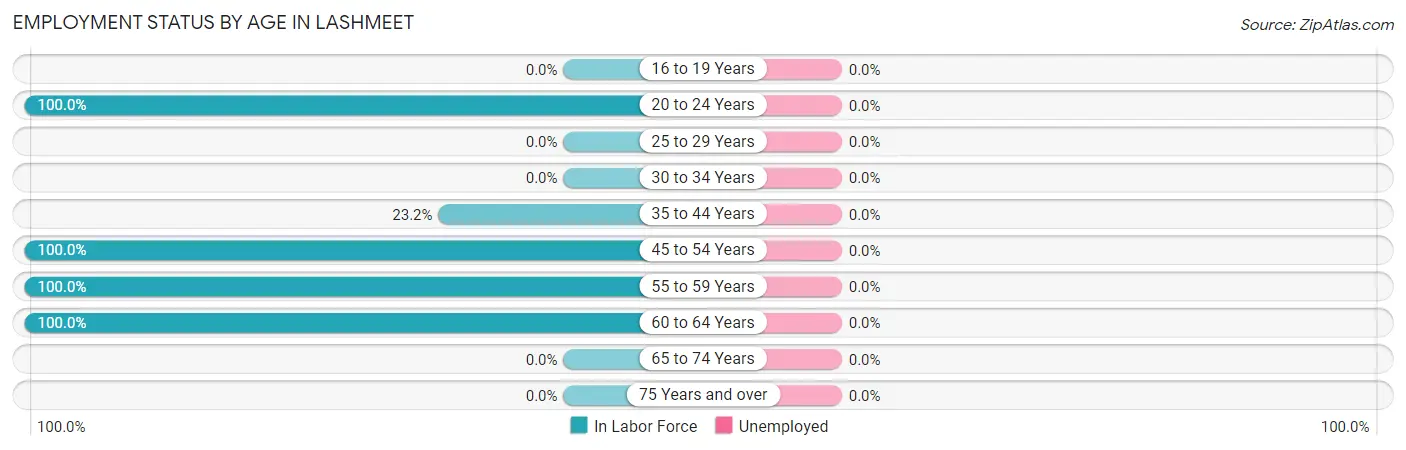
| Age Bracket | In Labor Force | Unemployed |
| 16 to 19 Years | 0 (0.0%) | 0 (0.0%) |
| 20 to 24 Years | 69 (100.0%) | 0 (0.0%) |
| 25 to 29 Years | 0 (0.0%) | 0 (0.0%) |
| 30 to 34 Years | 0 (0.0%) | 0 (0.0%) |
| 35 to 44 Years | 29 (23.2%) | 0 (0.0%) |
| 45 to 54 Years | 22 (100.0%) | 0 (0.0%) |
| 55 to 59 Years | 41 (100.0%) | 0 (0.0%) |
| 60 to 64 Years | 134 (100.0%) | 0 (0.0%) |
| 65 to 74 Years | 0 (0.0%) | 0 (0.0%) |
| 75 Years and over | 0 (0.0%) | 0 (0.0%) |
| Total | 295 (45.7%) | 0 (0.0%) |
Employment Status by Educational Attainment in Lashmeet
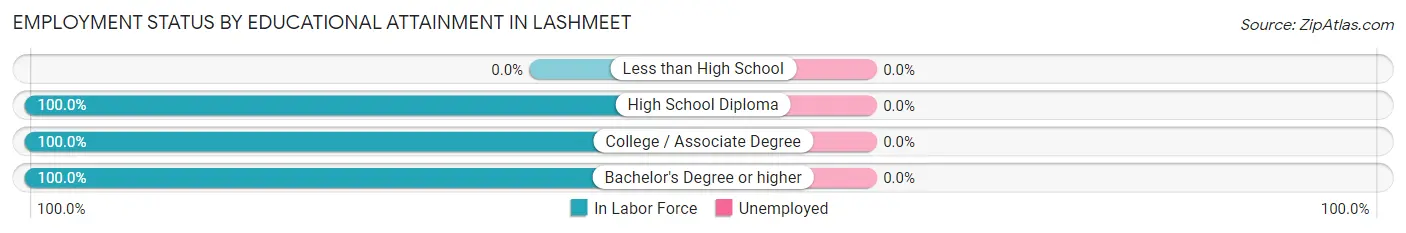
| Educational Attainment | In Labor Force | Unemployed |
| Less than High School | 0 (0.0%) | 0 (0.0%) |
| High School Diploma | 156 (100.0%) | 0 (0.0%) |
| College / Associate Degree | 51 (100.0%) | 0 (0.0%) |
| Bachelor's Degree or higher | 19 (100.0%) | 0 (0.0%) |
| Total | 226 (70.2%) | 0 (0.0%) |
Employment Occupations by Sex in Lashmeet
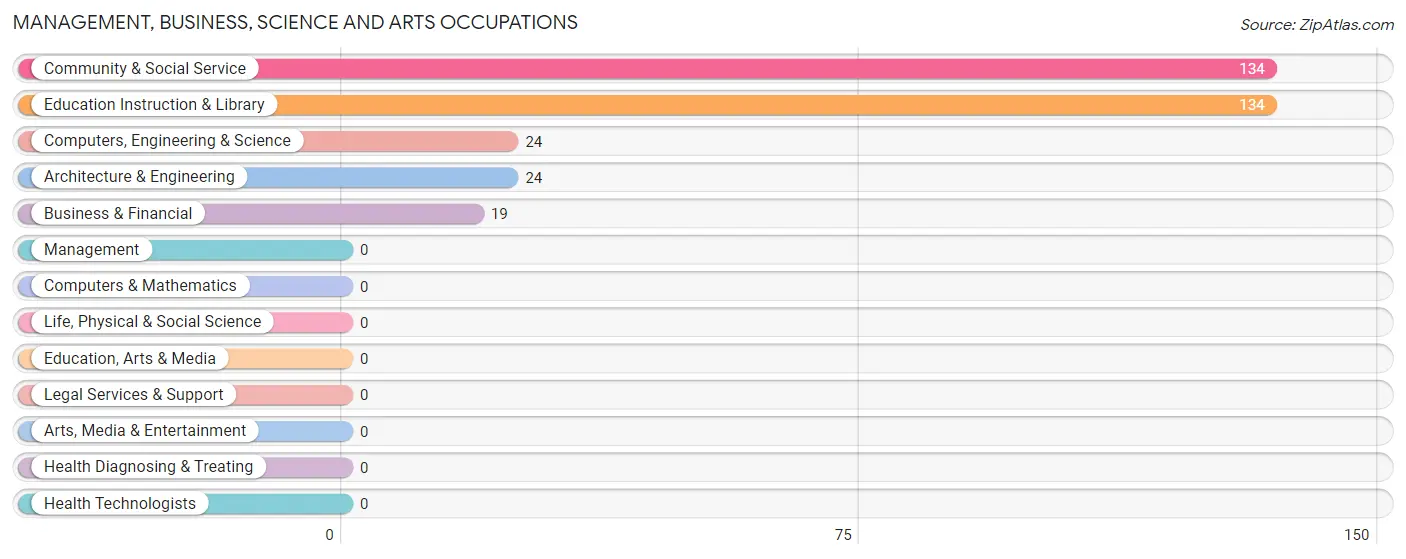
Management, Business, Science and Arts Occupations
The most common Management, Business, Science and Arts occupations in Lashmeet are Community & Social Service (134 | 45.4%), Education Instruction & Library (134 | 45.4%), Computers, Engineering & Science (24 | 8.1%), Architecture & Engineering (24 | 8.1%), and Business & Financial (19 | 6.4%).
Management, Business, Science and Arts Occupations by Sex
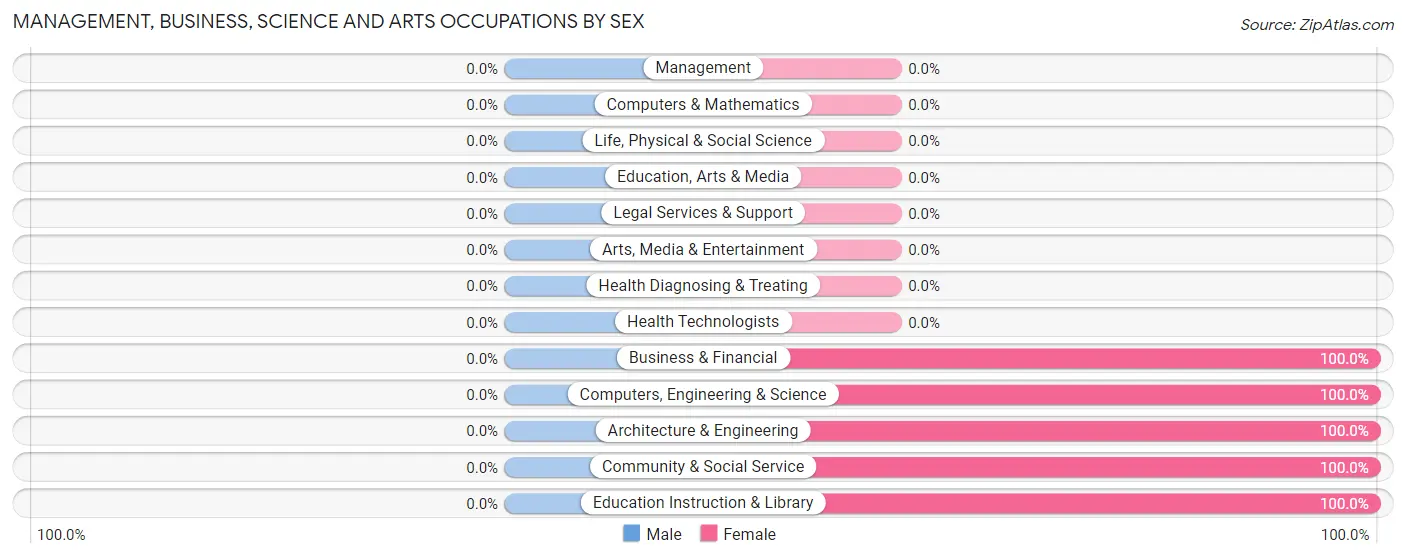
| Occupation | Male | Female |
| Management | 0 (0.0%) | 0 (0.0%) |
| Business & Financial | 0 (0.0%) | 19 (100.0%) |
| Computers, Engineering & Science | 0 (0.0%) | 24 (100.0%) |
| Computers & Mathematics | 0 (0.0%) | 0 (0.0%) |
| Architecture & Engineering | 0 (0.0%) | 24 (100.0%) |
| Life, Physical & Social Science | 0 (0.0%) | 0 (0.0%) |
| Community & Social Service | 0 (0.0%) | 134 (100.0%) |
| Education, Arts & Media | 0 (0.0%) | 0 (0.0%) |
| Legal Services & Support | 0 (0.0%) | 0 (0.0%) |
| Education Instruction & Library | 0 (0.0%) | 134 (100.0%) |
| Arts, Media & Entertainment | 0 (0.0%) | 0 (0.0%) |
| Health Diagnosing & Treating | 0 (0.0%) | 0 (0.0%) |
| Health Technologists | 0 (0.0%) | 0 (0.0%) |
| Total (Category) | 0 (0.0%) | 177 (100.0%) |
| Total (Overall) | 71 (24.1%) | 224 (75.9%) |
Services Occupations
The most common Services occupations in Lashmeet are , and Healthcare Support (25 | 8.5%).
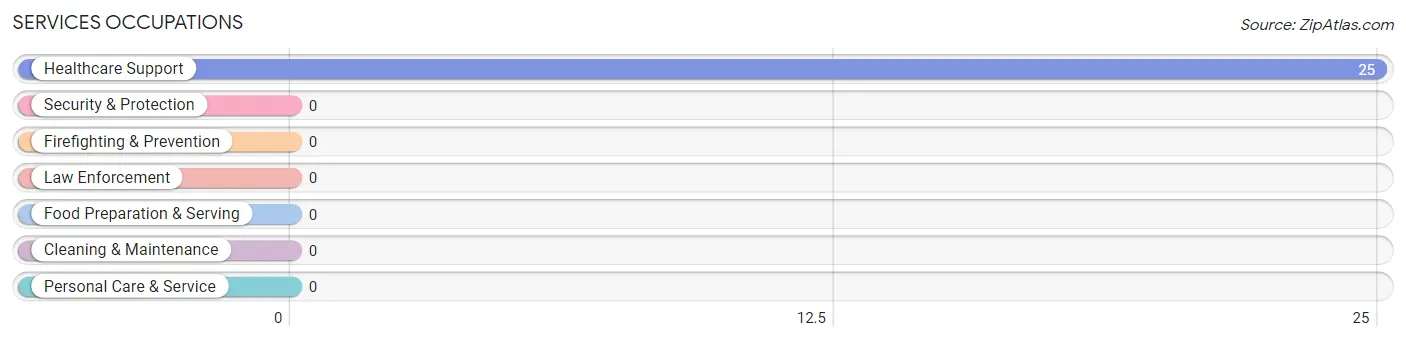
Services Occupations by Sex
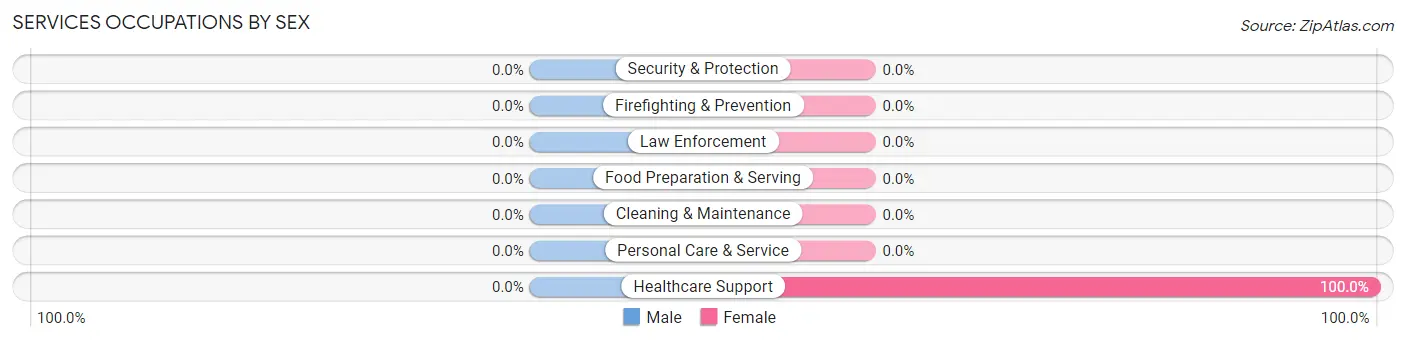
| Occupation | Male | Female |
| Healthcare Support | 0 (0.0%) | 25 (100.0%) |
| Security & Protection | 0 (0.0%) | 0 (0.0%) |
| Firefighting & Prevention | 0 (0.0%) | 0 (0.0%) |
| Law Enforcement | 0 (0.0%) | 0 (0.0%) |
| Food Preparation & Serving | 0 (0.0%) | 0 (0.0%) |
| Cleaning & Maintenance | 0 (0.0%) | 0 (0.0%) |
| Personal Care & Service | 0 (0.0%) | 0 (0.0%) |
| Total (Category) | 0 (0.0%) | 25 (100.0%) |
| Total (Overall) | 71 (24.1%) | 224 (75.9%) |
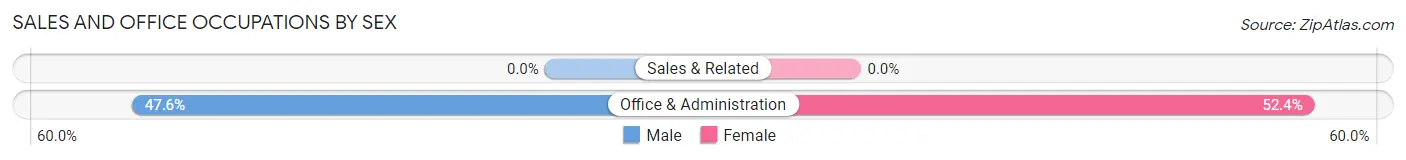
Sales and Office Occupations
The most common Sales and Office occupations in Lashmeet are , and Office & Administration (42 | 14.2%).
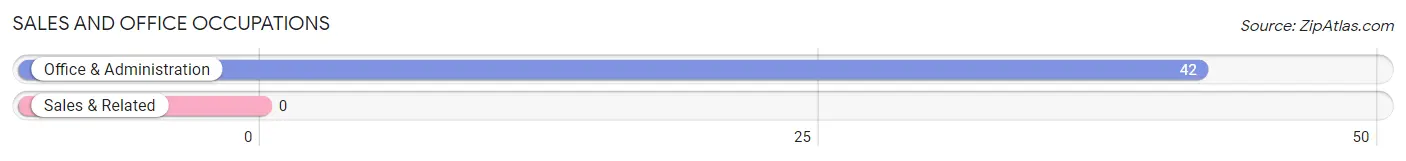
Sales and Office Occupations by Sex
| Occupation | Male | Female |
| Sales & Related | 0 (0.0%) | 0 (0.0%) |
| Office & Administration | 20 (47.6%) | 22 (52.4%) |
| Total (Category) | 20 (47.6%) | 22 (52.4%) |
| Total (Overall) | 71 (24.1%) | 224 (75.9%) |
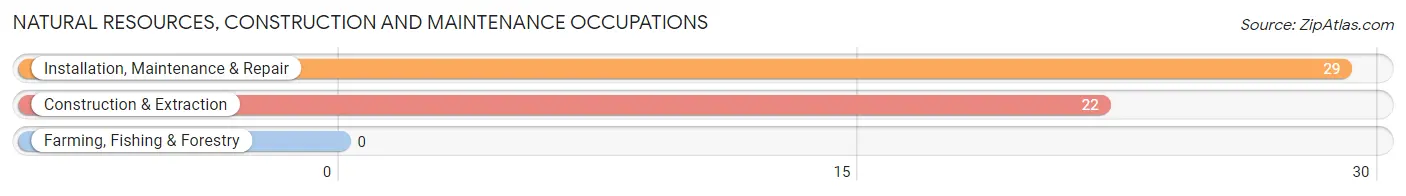
Natural Resources, Construction and Maintenance Occupations
The most common Natural Resources, Construction and Maintenance occupations in Lashmeet are Installation, Maintenance & Repair (29 | 9.8%), and Construction & Extraction (22 | 7.5%).
Natural Resources, Construction and Maintenance Occupations by Sex
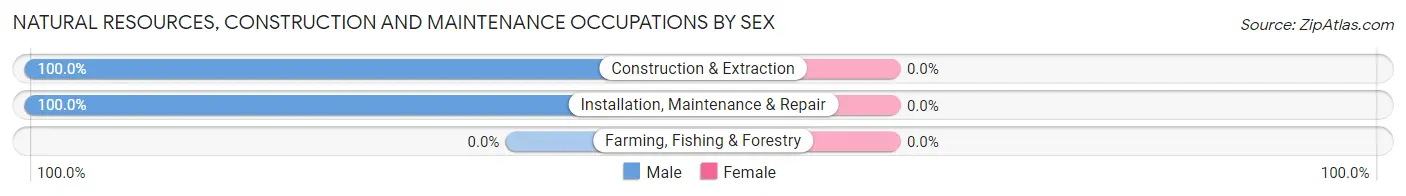
| Occupation | Male | Female |
| Farming, Fishing & Forestry | 0 (0.0%) | 0 (0.0%) |
| Construction & Extraction | 22 (100.0%) | 0 (0.0%) |
| Installation, Maintenance & Repair | 29 (100.0%) | 0 (0.0%) |
| Total (Category) | 51 (100.0%) | 0 (0.0%) |
| Total (Overall) | 71 (24.1%) | 224 (75.9%) |
Production, Transportation and Moving Occupations
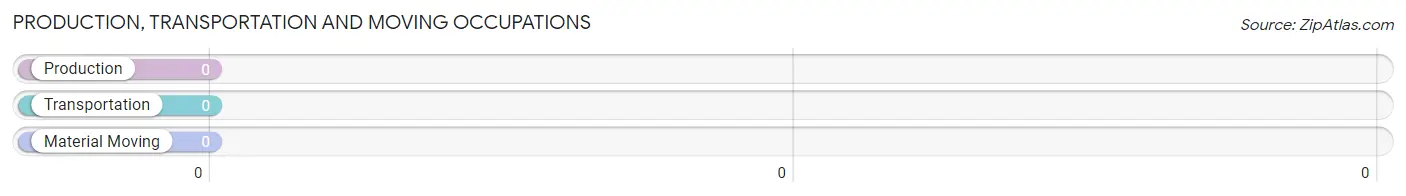
Production, Transportation and Moving Occupations by Sex
| Occupation | Male | Female |
| Production | 0 (0.0%) | 0 (0.0%) |
| Transportation | 0 (0.0%) | 0 (0.0%) |
| Material Moving | 0 (0.0%) | 0 (0.0%) |
| Total (Category) | 0 (0.0%) | 0 (0.0%) |
| Total (Overall) | 71 (24.1%) | 224 (75.9%) |
Employment Industries by Sex in Lashmeet
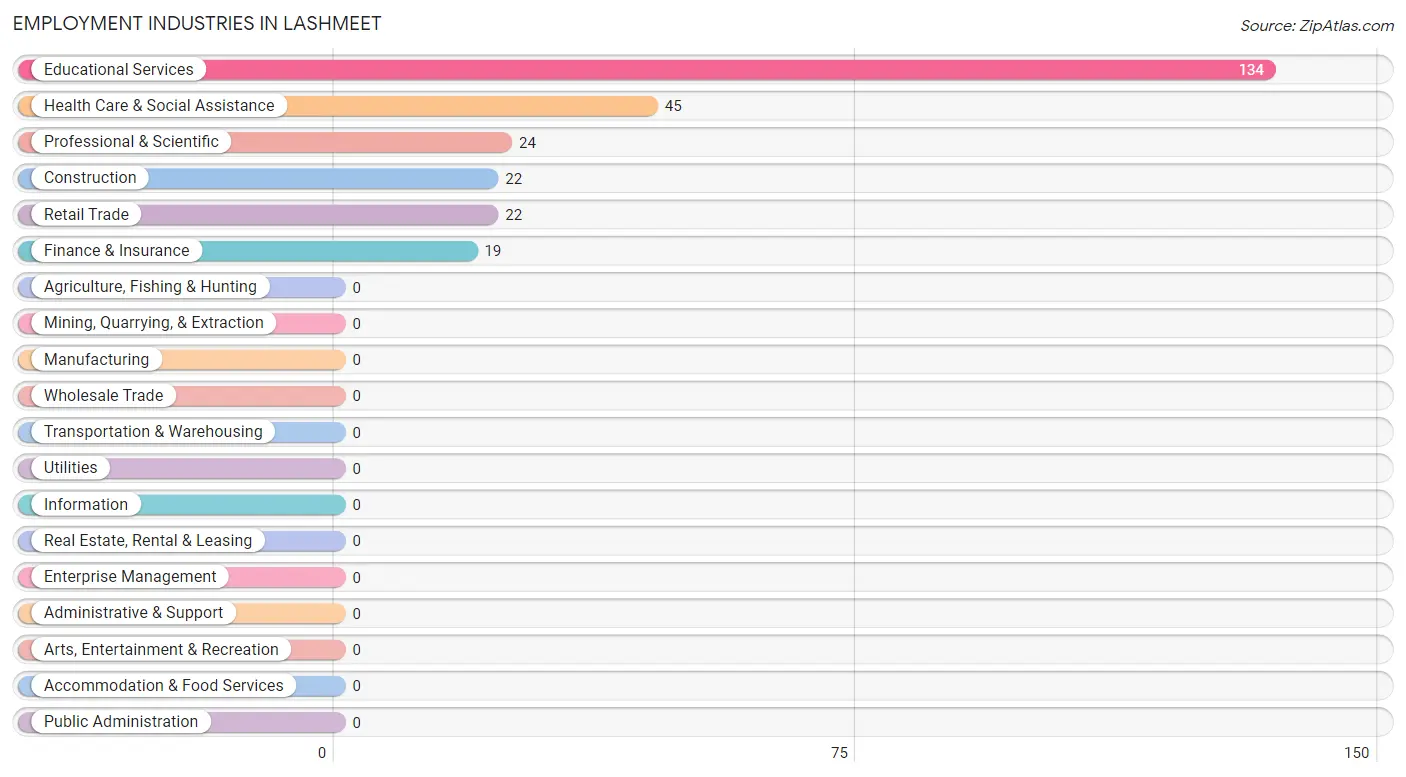
Employment Industries in Lashmeet
The major employment industries in Lashmeet include Educational Services (134 | 45.4%), Health Care & Social Assistance (45 | 15.2%), Professional & Scientific (24 | 8.1%), Construction (22 | 7.5%), and Retail Trade (22 | 7.5%).
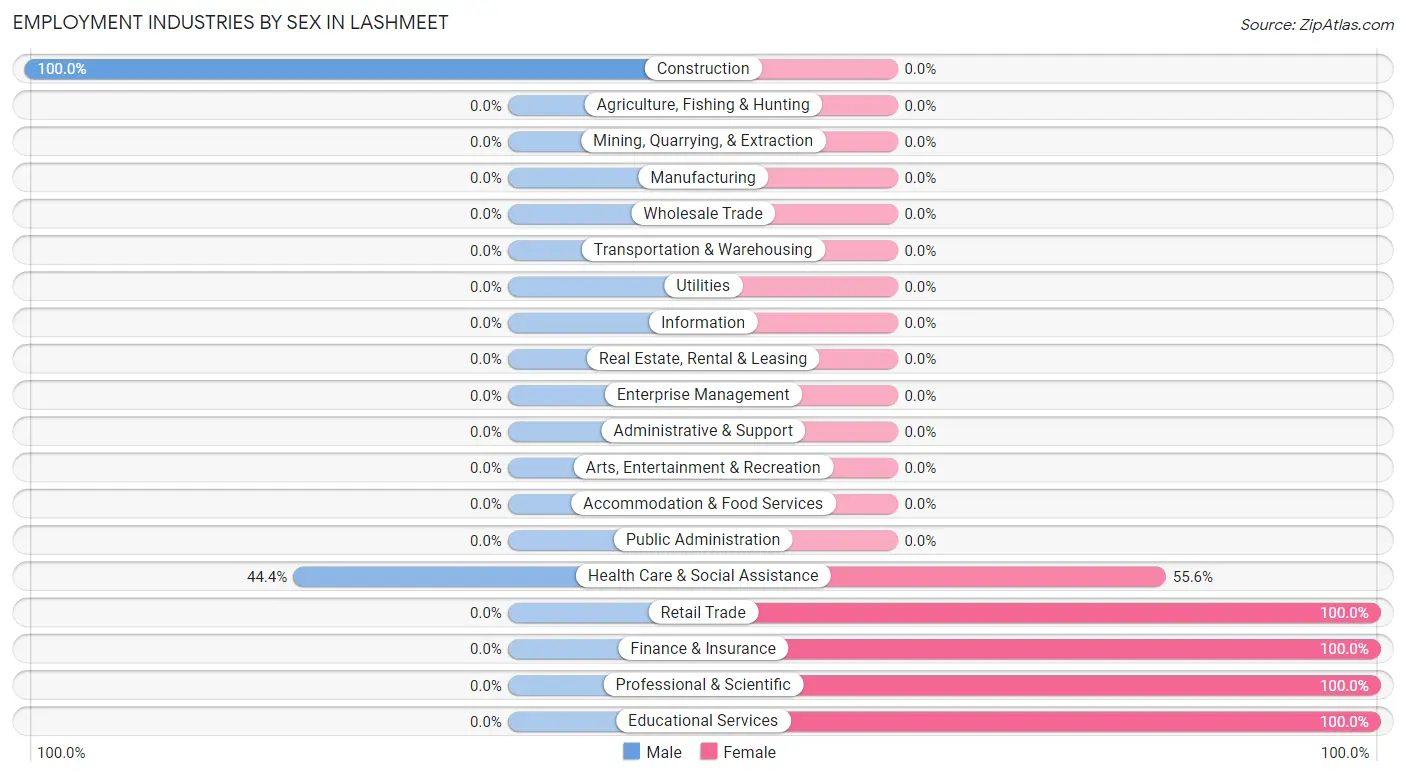
Employment Industries by Sex in Lashmeet
The Lashmeet industries that see more men than women are Construction (100.0%), and Health Care & Social Assistance (44.4%), whereas the industries that tend to have a higher number of women are Retail Trade (100.0%), Finance & Insurance (100.0%), and Professional & Scientific (100.0%).
| Industry | Male | Female |
| Agriculture, Fishing & Hunting | 0 (0.0%) | 0 (0.0%) |
| Mining, Quarrying, & Extraction | 0 (0.0%) | 0 (0.0%) |
| Construction | 22 (100.0%) | 0 (0.0%) |
| Manufacturing | 0 (0.0%) | 0 (0.0%) |
| Wholesale Trade | 0 (0.0%) | 0 (0.0%) |
| Retail Trade | 0 (0.0%) | 22 (100.0%) |
| Transportation & Warehousing | 0 (0.0%) | 0 (0.0%) |
| Utilities | 0 (0.0%) | 0 (0.0%) |
| Information | 0 (0.0%) | 0 (0.0%) |
| Finance & Insurance | 0 (0.0%) | 19 (100.0%) |
| Real Estate, Rental & Leasing | 0 (0.0%) | 0 (0.0%) |
| Professional & Scientific | 0 (0.0%) | 24 (100.0%) |
| Enterprise Management | 0 (0.0%) | 0 (0.0%) |
| Administrative & Support | 0 (0.0%) | 0 (0.0%) |
| Educational Services | 0 (0.0%) | 134 (100.0%) |
| Health Care & Social Assistance | 20 (44.4%) | 25 (55.6%) |
| Arts, Entertainment & Recreation | 0 (0.0%) | 0 (0.0%) |
| Accommodation & Food Services | 0 (0.0%) | 0 (0.0%) |
| Public Administration | 0 (0.0%) | 0 (0.0%) |
| Total | 71 (24.1%) | 224 (75.9%) |
Education in Lashmeet
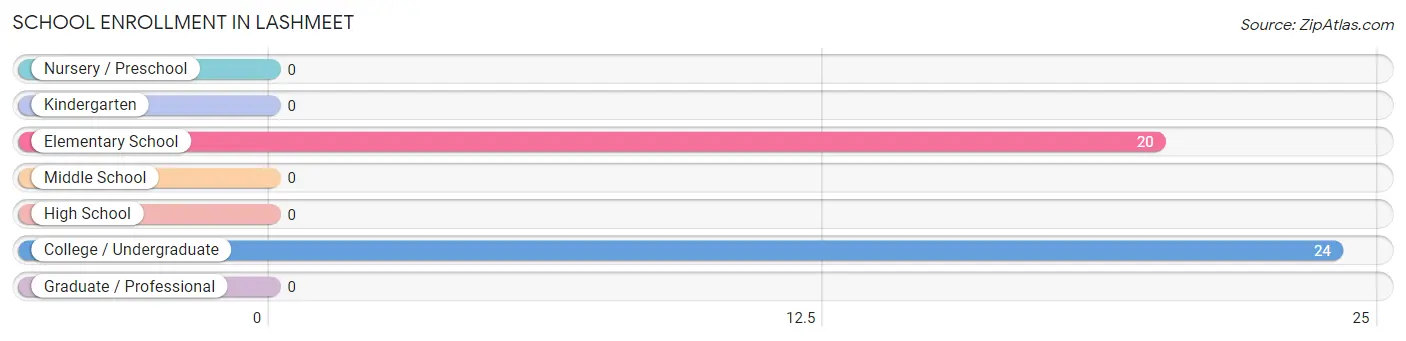
School Enrollment in Lashmeet
The most common levels of schooling among the 44 students in Lashmeet are college / undergraduate (24 | 54.5%), and elementary school (20 | 45.5%).
| School Level | # Students | % Students |
| Nursery / Preschool | 0 | 0.0% |
| Kindergarten | 0 | 0.0% |
| Elementary School | 20 | 45.5% |
| Middle School | 0 | 0.0% |
| High School | 0 | 0.0% |
| College / Undergraduate | 24 | 54.5% |
| Graduate / Professional | 0 | 0.0% |
| Total | 44 | 100.0% |
School Enrollment by Age by Funding Source in Lashmeet
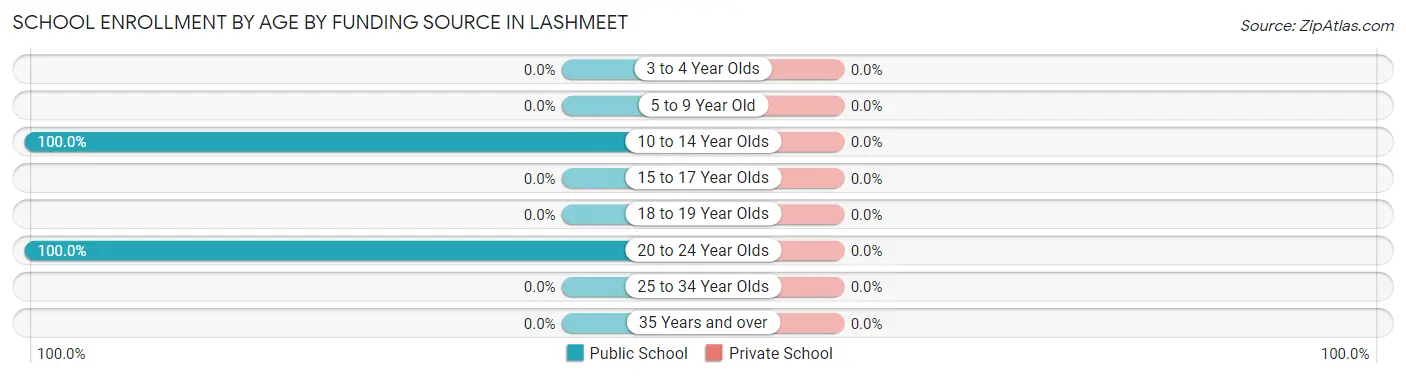
| Age Bracket | Public School | Private School |
| 3 to 4 Year Olds | 0 (0.0%) | 0 (0.0%) |
| 5 to 9 Year Old | 0 (0.0%) | 0 (0.0%) |
| 10 to 14 Year Olds | 20 (100.0%) | 0 (0.0%) |
| 15 to 17 Year Olds | 0 (0.0%) | 0 (0.0%) |
| 18 to 19 Year Olds | 0 (0.0%) | 0 (0.0%) |
| 20 to 24 Year Olds | 24 (100.0%) | 0 (0.0%) |
| 25 to 34 Year Olds | 0 (0.0%) | 0 (0.0%) |
| 35 Years and over | 0 (0.0%) | 0 (0.0%) |
| Total | 44 (100.0%) | 0 (0.0%) |
Educational Attainment by Field of Study in Lashmeet
, and business (41 | 100.0%) are the most common fields of study among 41 individuals in Lashmeet who have obtained a bachelor's degree or higher.
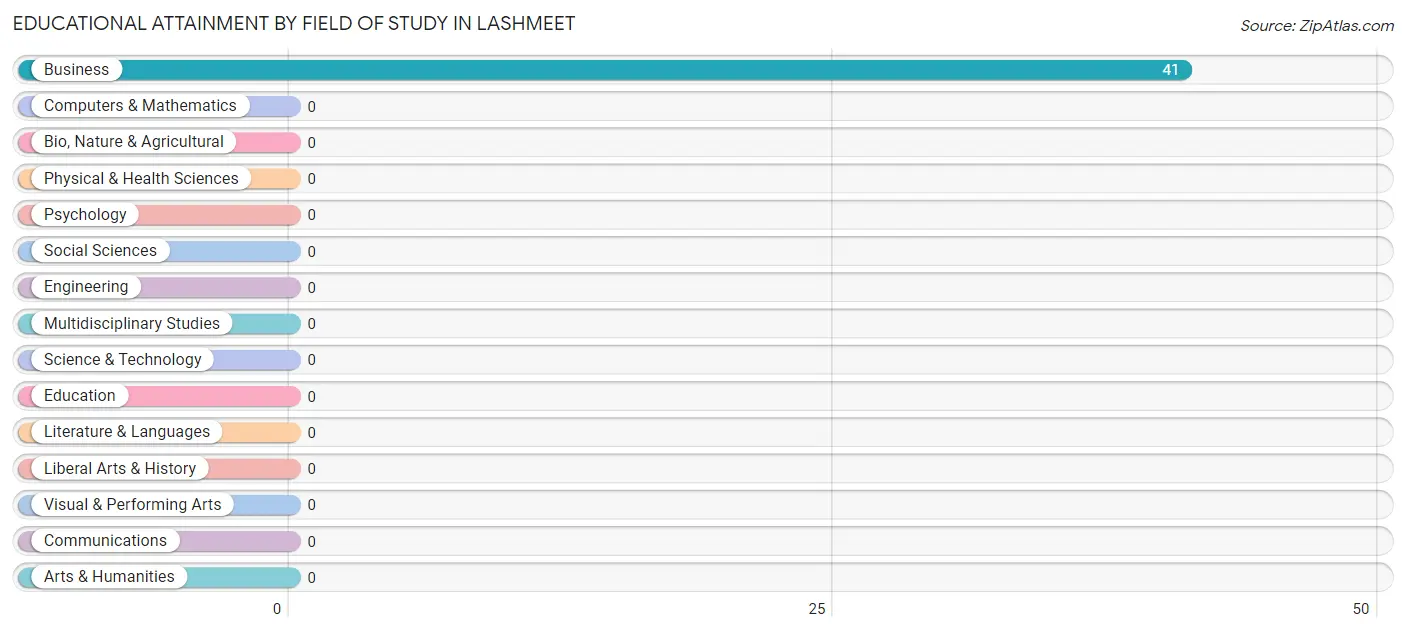
| Field of Study | # Graduates | % Graduates |
| Computers & Mathematics | 0 | 0.0% |
| Bio, Nature & Agricultural | 0 | 0.0% |
| Physical & Health Sciences | 0 | 0.0% |
| Psychology | 0 | 0.0% |
| Social Sciences | 0 | 0.0% |
| Engineering | 0 | 0.0% |
| Multidisciplinary Studies | 0 | 0.0% |
| Science & Technology | 0 | 0.0% |
| Business | 41 | 100.0% |
| Education | 0 | 0.0% |
| Literature & Languages | 0 | 0.0% |
| Liberal Arts & History | 0 | 0.0% |
| Visual & Performing Arts | 0 | 0.0% |
| Communications | 0 | 0.0% |
| Arts & Humanities | 0 | 0.0% |
| Total | 41 | 100.0% |
Transportation & Commute in Lashmeet
Vehicle Availability by Sex in Lashmeet
The most prevalent vehicle ownership categories in Lashmeet are males with 3 vehicles (71, accounting for 100.0%) and females with 3 vehicles (90, making up 31.7%).
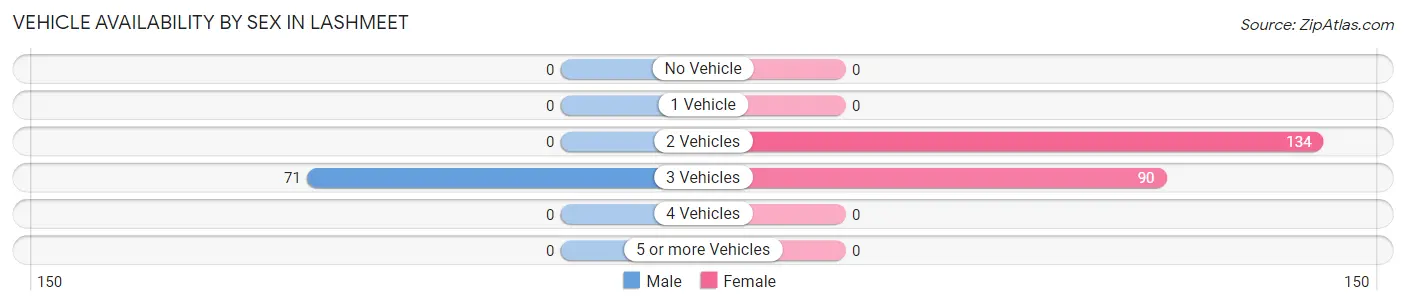
| Vehicles Available | Male | Female |
| No Vehicle | 0 (0.0%) | 0 (0.0%) |
| 1 Vehicle | 0 (0.0%) | 0 (0.0%) |
| 2 Vehicles | 0 (0.0%) | 134 (59.8%) |
| 3 Vehicles | 71 (100.0%) | 90 (40.2%) |
| 4 Vehicles | 0 (0.0%) | 0 (0.0%) |
| 5 or more Vehicles | 0 (0.0%) | 0 (0.0%) |
| Total | 71 (100.0%) | 224 (100.0%) |
Commute Time in Lashmeet
The most frequently occuring commute durations in Lashmeet are 15 to 19 minutes (134 commuters, 45.4%), 20 to 24 minutes (76 commuters, 25.8%), and 60 to 89 minutes (42 commuters, 14.2%).
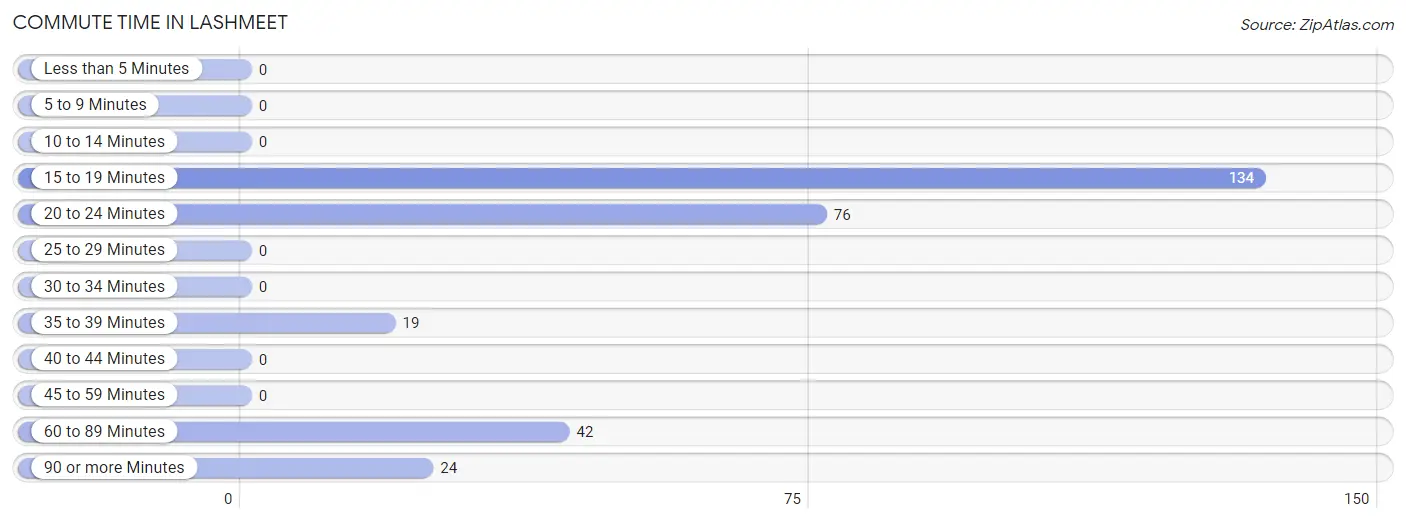
| Commute Time | # Commuters | % Commuters |
| Less than 5 Minutes | 0 | 0.0% |
| 5 to 9 Minutes | 0 | 0.0% |
| 10 to 14 Minutes | 0 | 0.0% |
| 15 to 19 Minutes | 134 | 45.4% |
| 20 to 24 Minutes | 76 | 25.8% |
| 25 to 29 Minutes | 0 | 0.0% |
| 30 to 34 Minutes | 0 | 0.0% |
| 35 to 39 Minutes | 19 | 6.4% |
| 40 to 44 Minutes | 0 | 0.0% |
| 45 to 59 Minutes | 0 | 0.0% |
| 60 to 89 Minutes | 42 | 14.2% |
| 90 or more Minutes | 24 | 8.1% |
Commute Time by Sex in Lashmeet
The most common commute times in Lashmeet are 60 to 89 minutes (42 commuters, 59.2%) for males and 15 to 19 minutes (134 commuters, 59.8%) for females.
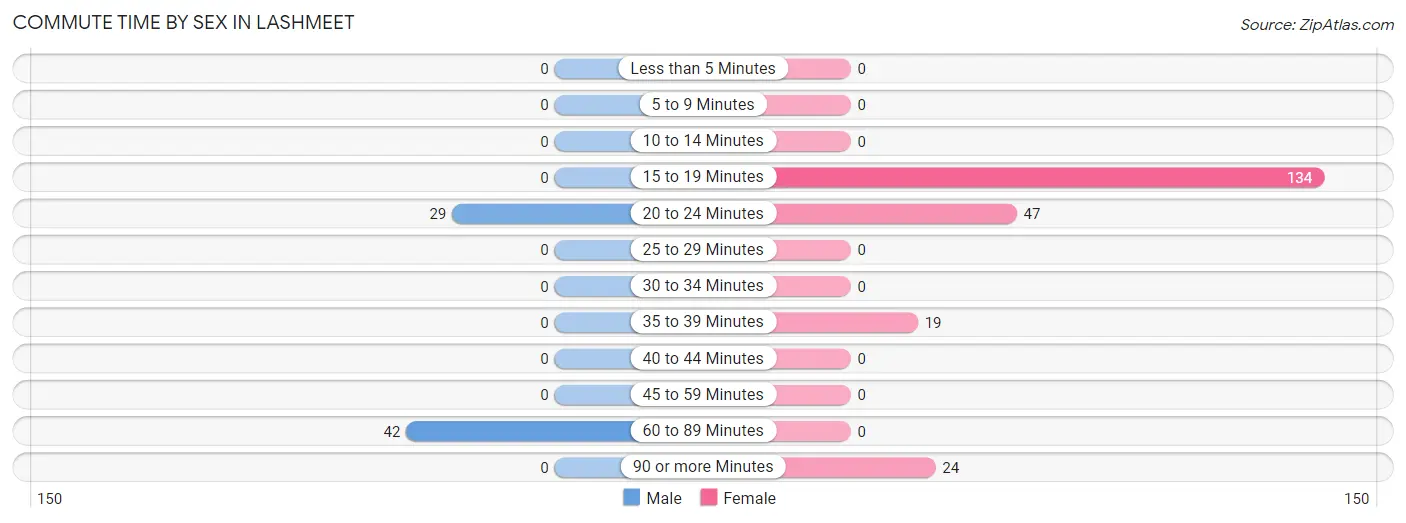
| Commute Time | Male | Female |
| Less than 5 Minutes | 0 (0.0%) | 0 (0.0%) |
| 5 to 9 Minutes | 0 (0.0%) | 0 (0.0%) |
| 10 to 14 Minutes | 0 (0.0%) | 0 (0.0%) |
| 15 to 19 Minutes | 0 (0.0%) | 134 (59.8%) |
| 20 to 24 Minutes | 29 (40.8%) | 47 (21.0%) |
| 25 to 29 Minutes | 0 (0.0%) | 0 (0.0%) |
| 30 to 34 Minutes | 0 (0.0%) | 0 (0.0%) |
| 35 to 39 Minutes | 0 (0.0%) | 19 (8.5%) |
| 40 to 44 Minutes | 0 (0.0%) | 0 (0.0%) |
| 45 to 59 Minutes | 0 (0.0%) | 0 (0.0%) |
| 60 to 89 Minutes | 42 (59.2%) | 0 (0.0%) |
| 90 or more Minutes | 0 (0.0%) | 24 (10.7%) |
Time of Departure to Work by Sex in Lashmeet
The most frequent times of departure to work in Lashmeet are 6:30 AM to 6:59 AM (29, 40.8%) for males and 7:00 AM to 7:29 AM (134, 59.8%) for females.
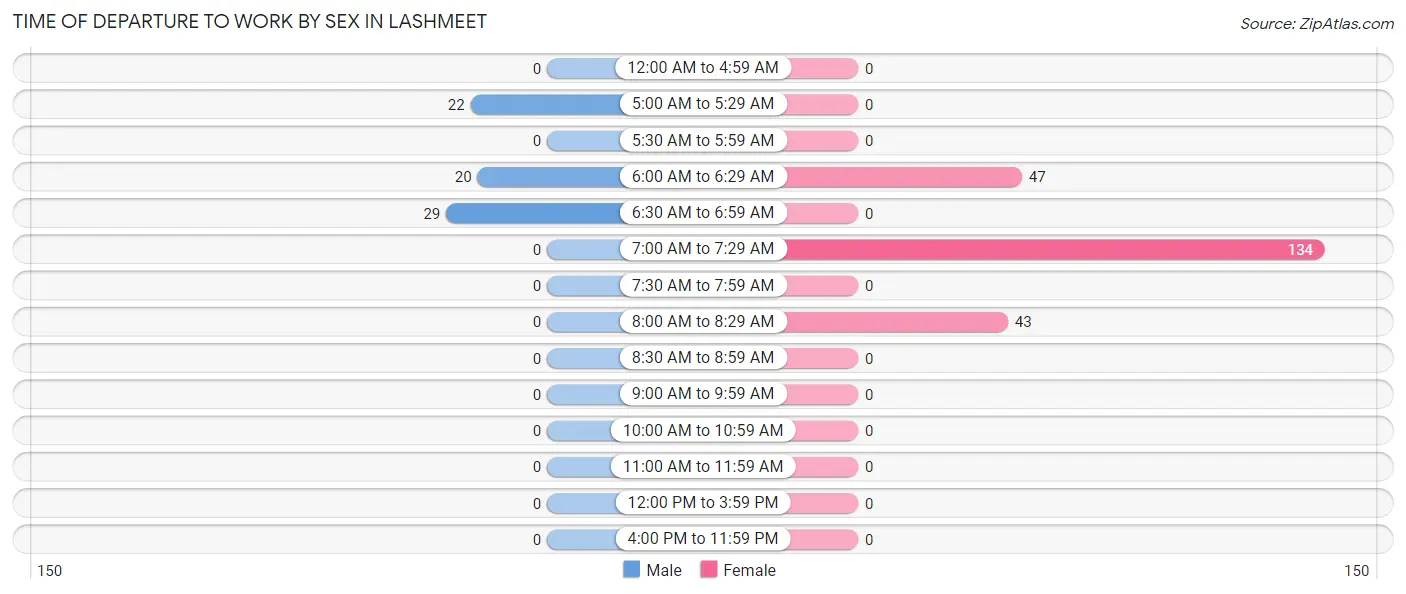
| Time of Departure | Male | Female |
| 12:00 AM to 4:59 AM | 0 (0.0%) | 0 (0.0%) |
| 5:00 AM to 5:29 AM | 22 (31.0%) | 0 (0.0%) |
| 5:30 AM to 5:59 AM | 0 (0.0%) | 0 (0.0%) |
| 6:00 AM to 6:29 AM | 20 (28.2%) | 47 (21.0%) |
| 6:30 AM to 6:59 AM | 29 (40.8%) | 0 (0.0%) |
| 7:00 AM to 7:29 AM | 0 (0.0%) | 134 (59.8%) |
| 7:30 AM to 7:59 AM | 0 (0.0%) | 0 (0.0%) |
| 8:00 AM to 8:29 AM | 0 (0.0%) | 43 (19.2%) |
| 8:30 AM to 8:59 AM | 0 (0.0%) | 0 (0.0%) |
| 9:00 AM to 9:59 AM | 0 (0.0%) | 0 (0.0%) |
| 10:00 AM to 10:59 AM | 0 (0.0%) | 0 (0.0%) |
| 11:00 AM to 11:59 AM | 0 (0.0%) | 0 (0.0%) |
| 12:00 PM to 3:59 PM | 0 (0.0%) | 0 (0.0%) |
| 4:00 PM to 11:59 PM | 0 (0.0%) | 0 (0.0%) |
| Total | 71 (100.0%) | 224 (100.0%) |
Housing Occupancy in Lashmeet
Occupancy by Ownership in Lashmeet
Of the total 310 dwellings in Lashmeet, owner-occupied units account for 267 (86.1%), while renter-occupied units make up 43 (13.9%).
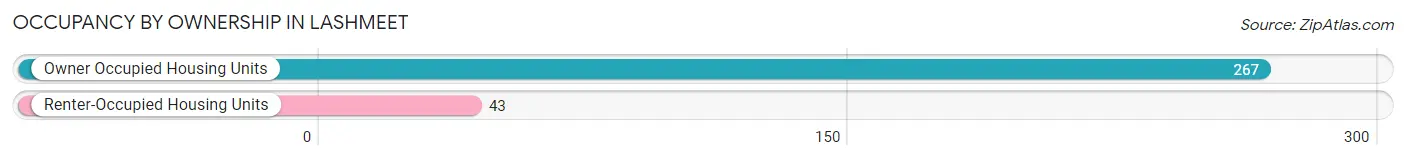
| Occupancy | # Housing Units | % Housing Units |
| Owner Occupied Housing Units | 267 | 86.1% |
| Renter-Occupied Housing Units | 43 | 13.9% |
| Total Occupied Housing Units | 310 | 100.0% |
Occupancy by Household Size in Lashmeet
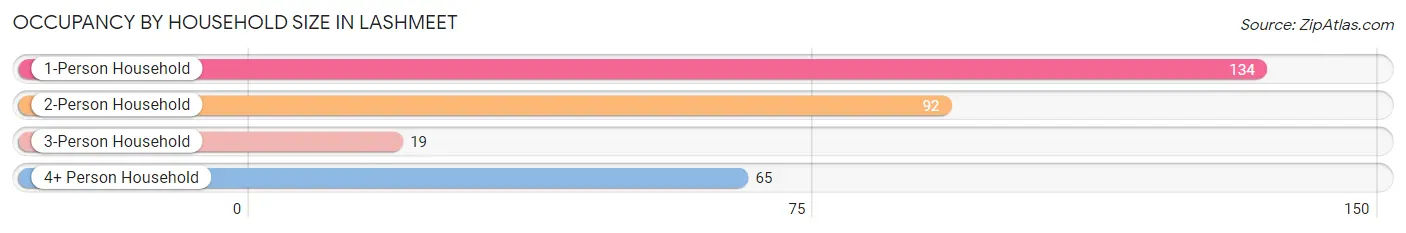
| Household Size | # Housing Units | % Housing Units |
| 1-Person Household | 134 | 43.2% |
| 2-Person Household | 92 | 29.7% |
| 3-Person Household | 19 | 6.1% |
| 4+ Person Household | 65 | 21.0% |
| Total Housing Units | 310 | 100.0% |
Occupancy by Ownership by Household Size in Lashmeet
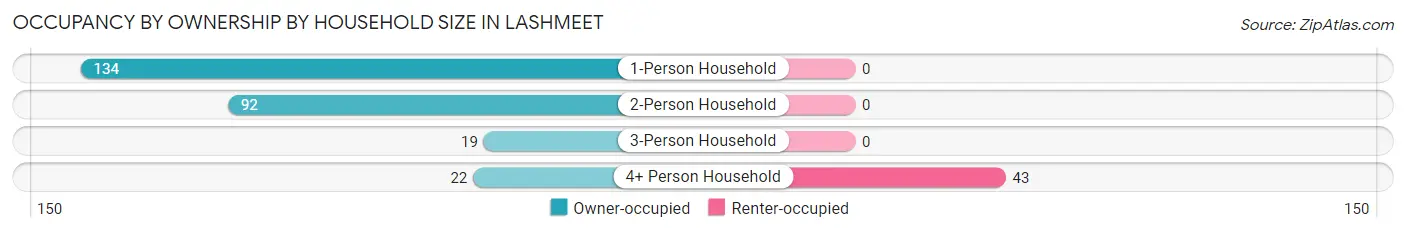
| Household Size | Owner-occupied | Renter-occupied |
| 1-Person Household | 134 (100.0%) | 0 (0.0%) |
| 2-Person Household | 92 (100.0%) | 0 (0.0%) |
| 3-Person Household | 19 (100.0%) | 0 (0.0%) |
| 4+ Person Household | 22 (33.9%) | 43 (66.1%) |
| Total Housing Units | 267 (86.1%) | 43 (13.9%) |
Occupancy by Educational Attainment in Lashmeet
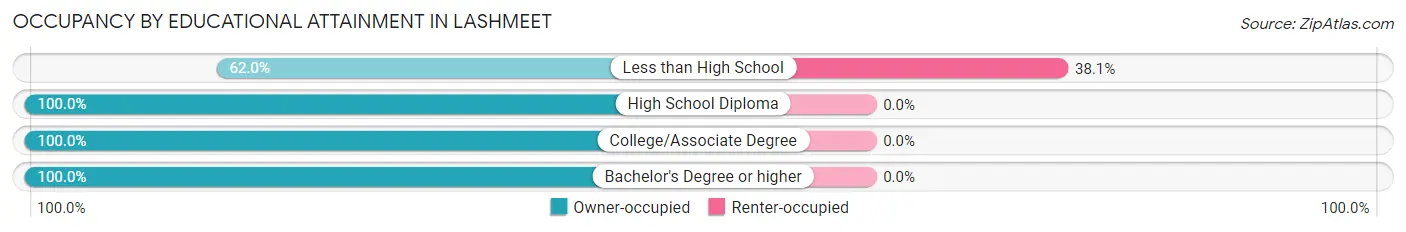
| Household Size | Owner-occupied | Renter-occupied |
| Less than High School | 70 (62.0%) | 43 (38.1%) |
| High School Diploma | 156 (100.0%) | 0 (0.0%) |
| College/Associate Degree | 22 (100.0%) | 0 (0.0%) |
| Bachelor's Degree or higher | 19 (100.0%) | 0 (0.0%) |
Occupancy by Age of Householder in Lashmeet
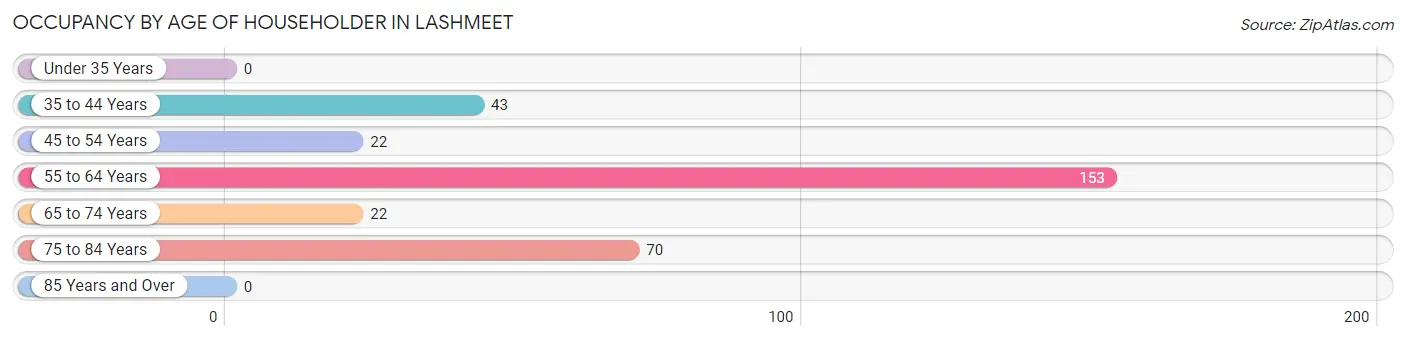
| Age Bracket | # Households | % Households |
| Under 35 Years | 0 | 0.0% |
| 35 to 44 Years | 43 | 13.9% |
| 45 to 54 Years | 22 | 7.1% |
| 55 to 64 Years | 153 | 49.3% |
| 65 to 74 Years | 22 | 7.1% |
| 75 to 84 Years | 70 | 22.6% |
| 85 Years and Over | 0 | 0.0% |
| Total | 310 | 100.0% |
Housing Finances in Lashmeet
Median Income by Occupancy in Lashmeet
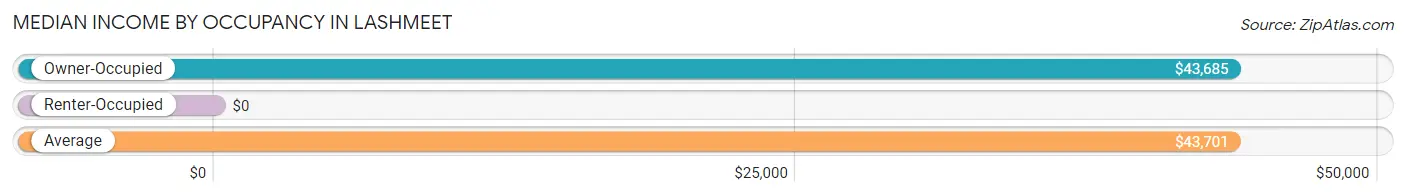
| Occupancy Type | # Households | Median Income |
| Owner-Occupied | 267 (86.1%) | $43,685 |
| Renter-Occupied | 43 (13.9%) | $0 |
| Average | 310 (100.0%) | $43,701 |
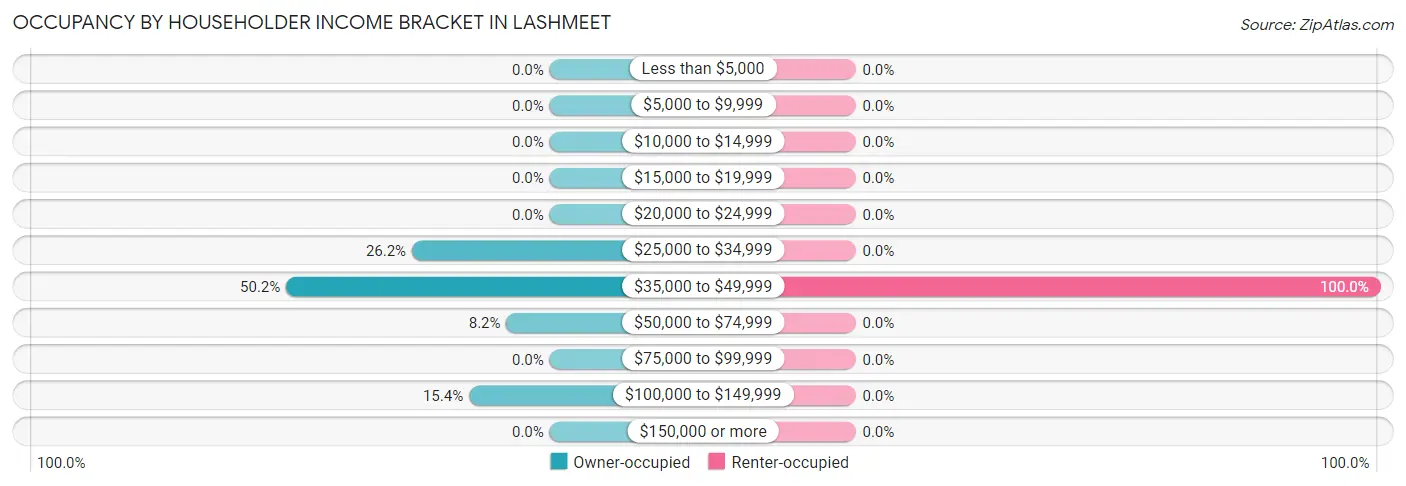
Occupancy by Householder Income Bracket in Lashmeet
| Income Bracket | Owner-occupied | Renter-occupied |
| Less than $5,000 | 0 (0.0%) | 0 (0.0%) |
| $5,000 to $9,999 | 0 (0.0%) | 0 (0.0%) |
| $10,000 to $14,999 | 0 (0.0%) | 0 (0.0%) |
| $15,000 to $19,999 | 0 (0.0%) | 0 (0.0%) |
| $20,000 to $24,999 | 0 (0.0%) | 0 (0.0%) |
| $25,000 to $34,999 | 70 (26.2%) | 0 (0.0%) |
| $35,000 to $49,999 | 134 (50.2%) | 43 (100.0%) |
| $50,000 to $74,999 | 22 (8.2%) | 0 (0.0%) |
| $75,000 to $99,999 | 0 (0.0%) | 0 (0.0%) |
| $100,000 to $149,999 | 41 (15.4%) | 0 (0.0%) |
| $150,000 or more | 0 (0.0%) | 0 (0.0%) |
| Total | 267 (100.0%) | 43 (100.0%) |
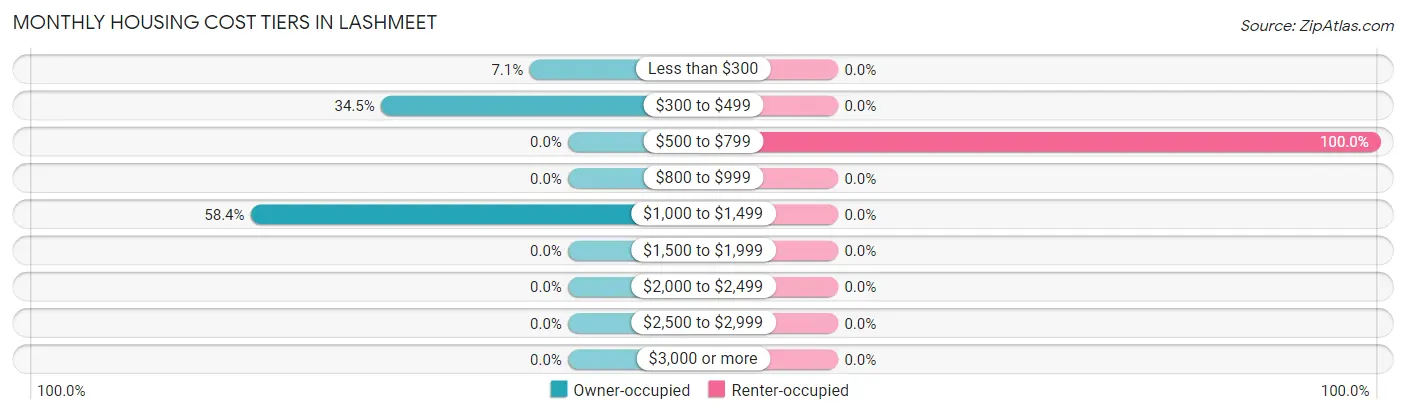
Monthly Housing Cost Tiers in Lashmeet
| Monthly Cost | Owner-occupied | Renter-occupied |
| Less than $300 | 19 (7.1%) | 0 (0.0%) |
| $300 to $499 | 92 (34.5%) | 0 (0.0%) |
| $500 to $799 | 0 (0.0%) | 43 (100.0%) |
| $800 to $999 | 0 (0.0%) | 0 (0.0%) |
| $1,000 to $1,499 | 156 (58.4%) | 0 (0.0%) |
| $1,500 to $1,999 | 0 (0.0%) | 0 (0.0%) |
| $2,000 to $2,499 | 0 (0.0%) | 0 (0.0%) |
| $2,500 to $2,999 | 0 (0.0%) | 0 (0.0%) |
| $3,000 or more | 0 (0.0%) | 0 (0.0%) |
| Total | 267 (100.0%) | 43 (100.0%) |
Physical Housing Characteristics in Lashmeet
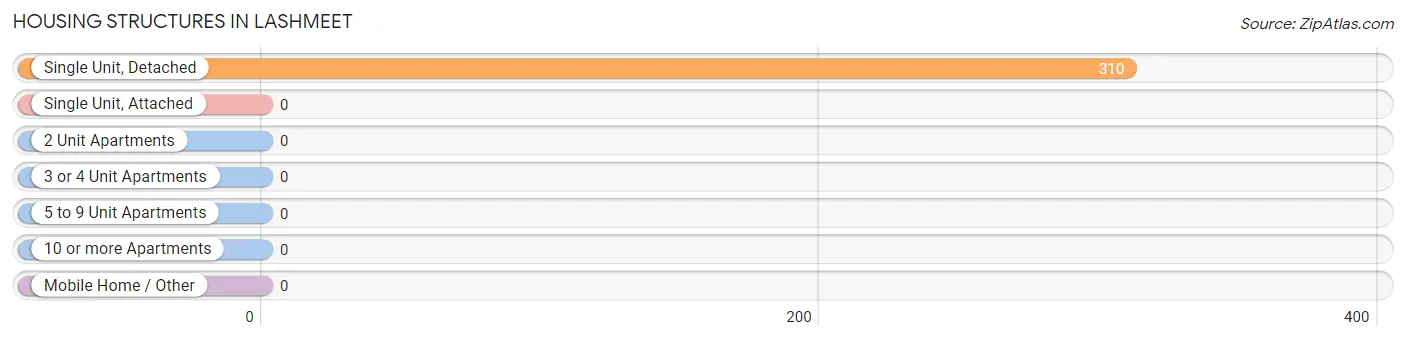
Housing Structures in Lashmeet
| Structure Type | # Housing Units | % Housing Units |
| Single Unit, Detached | 310 | 100.0% |
| Single Unit, Attached | 0 | 0.0% |
| 2 Unit Apartments | 0 | 0.0% |
| 3 or 4 Unit Apartments | 0 | 0.0% |
| 5 to 9 Unit Apartments | 0 | 0.0% |
| 10 or more Apartments | 0 | 0.0% |
| Mobile Home / Other | 0 | 0.0% |
| Total | 310 | 100.0% |
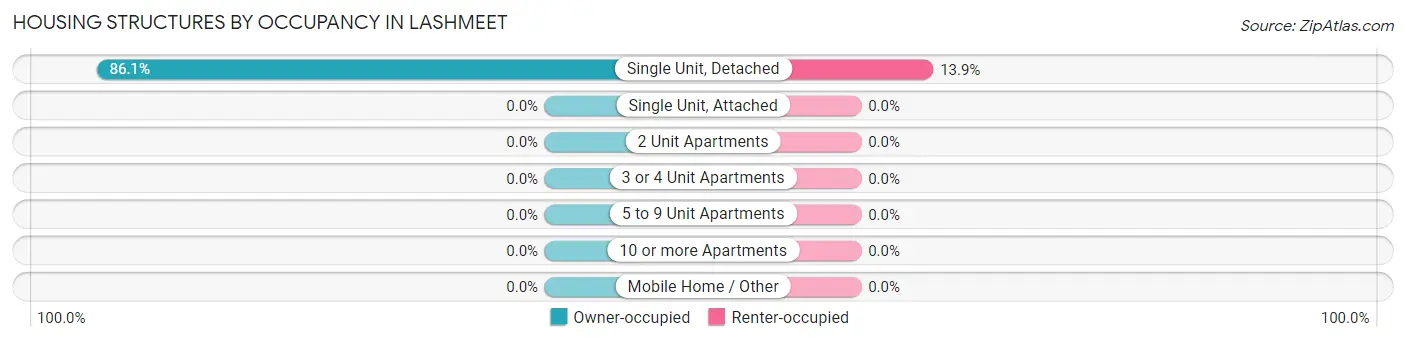
Housing Structures by Occupancy in Lashmeet
| Structure Type | Owner-occupied | Renter-occupied |
| Single Unit, Detached | 267 (86.1%) | 43 (13.9%) |
| Single Unit, Attached | 0 (0.0%) | 0 (0.0%) |
| 2 Unit Apartments | 0 (0.0%) | 0 (0.0%) |
| 3 or 4 Unit Apartments | 0 (0.0%) | 0 (0.0%) |
| 5 to 9 Unit Apartments | 0 (0.0%) | 0 (0.0%) |
| 10 or more Apartments | 0 (0.0%) | 0 (0.0%) |
| Mobile Home / Other | 0 (0.0%) | 0 (0.0%) |
| Total | 267 (86.1%) | 43 (13.9%) |
Housing Structures by Number of Rooms in Lashmeet
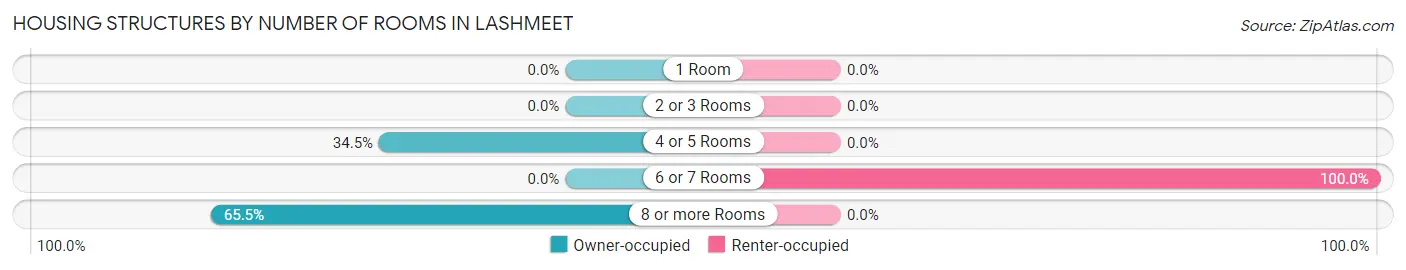
| Number of Rooms | Owner-occupied | Renter-occupied |
| 1 Room | 0 (0.0%) | 0 (0.0%) |
| 2 or 3 Rooms | 0 (0.0%) | 0 (0.0%) |
| 4 or 5 Rooms | 92 (34.5%) | 0 (0.0%) |
| 6 or 7 Rooms | 0 (0.0%) | 43 (100.0%) |
| 8 or more Rooms | 175 (65.5%) | 0 (0.0%) |
| Total | 267 (100.0%) | 43 (100.0%) |
Housing Structure by Heating Type in Lashmeet
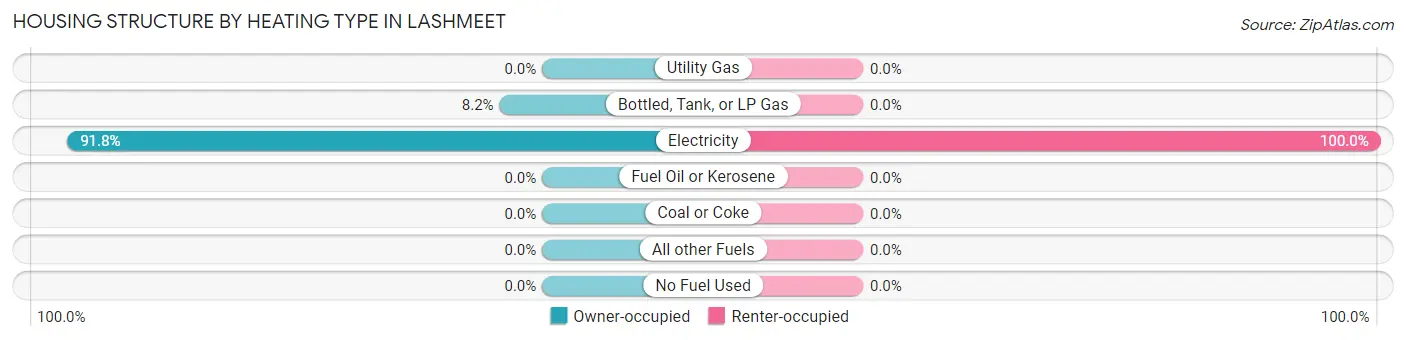
| Heating Type | Owner-occupied | Renter-occupied |
| Utility Gas | 0 (0.0%) | 0 (0.0%) |
| Bottled, Tank, or LP Gas | 22 (8.2%) | 0 (0.0%) |
| Electricity | 245 (91.8%) | 43 (100.0%) |
| Fuel Oil or Kerosene | 0 (0.0%) | 0 (0.0%) |
| Coal or Coke | 0 (0.0%) | 0 (0.0%) |
| All other Fuels | 0 (0.0%) | 0 (0.0%) |
| No Fuel Used | 0 (0.0%) | 0 (0.0%) |
| Total | 267 (100.0%) | 43 (100.0%) |
Household Vehicle Usage in Lashmeet
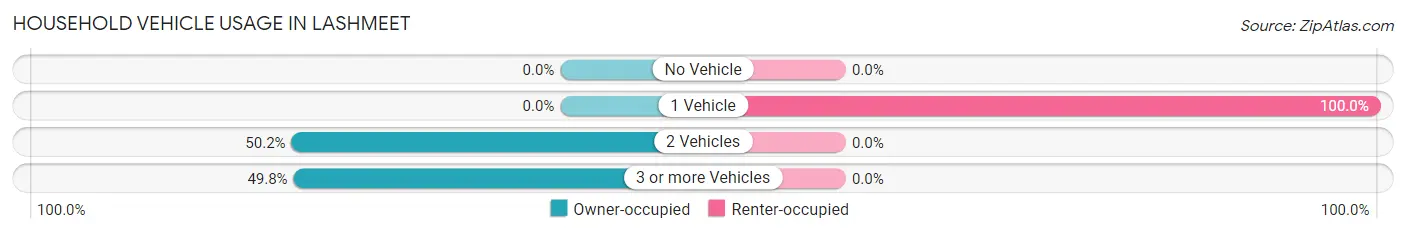
| Vehicles per Household | Owner-occupied | Renter-occupied |
| No Vehicle | 0 (0.0%) | 0 (0.0%) |
| 1 Vehicle | 0 (0.0%) | 43 (100.0%) |
| 2 Vehicles | 134 (50.2%) | 0 (0.0%) |
| 3 or more Vehicles | 133 (49.8%) | 0 (0.0%) |
| Total | 267 (100.0%) | 43 (100.0%) |
Real Estate & Mortgages in Lashmeet
Real Estate and Mortgage Overview in Lashmeet
| Characteristic | Without Mortgage | With Mortgage |
| Housing Units | 111 | 156 |
| Median Property Value | - | - |
| Median Household Income | $34,482 | $0 |
| Monthly Housing Costs | $440 | $0 |
| Real Estate Taxes | - | - |
Property Value by Mortgage Status in Lashmeet
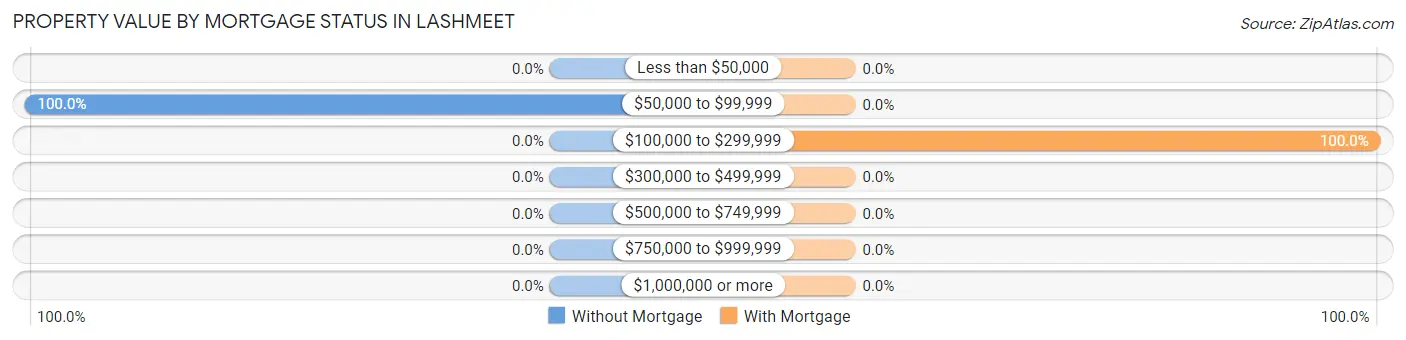
| Property Value | Without Mortgage | With Mortgage |
| Less than $50,000 | 0 (0.0%) | 0 (0.0%) |
| $50,000 to $99,999 | 111 (100.0%) | 0 (0.0%) |
| $100,000 to $299,999 | 0 (0.0%) | 156 (100.0%) |
| $300,000 to $499,999 | 0 (0.0%) | 0 (0.0%) |
| $500,000 to $749,999 | 0 (0.0%) | 0 (0.0%) |
| $750,000 to $999,999 | 0 (0.0%) | 0 (0.0%) |
| $1,000,000 or more | 0 (0.0%) | 0 (0.0%) |
| Total | 111 (100.0%) | 156 (100.0%) |
Household Income by Mortgage Status in Lashmeet
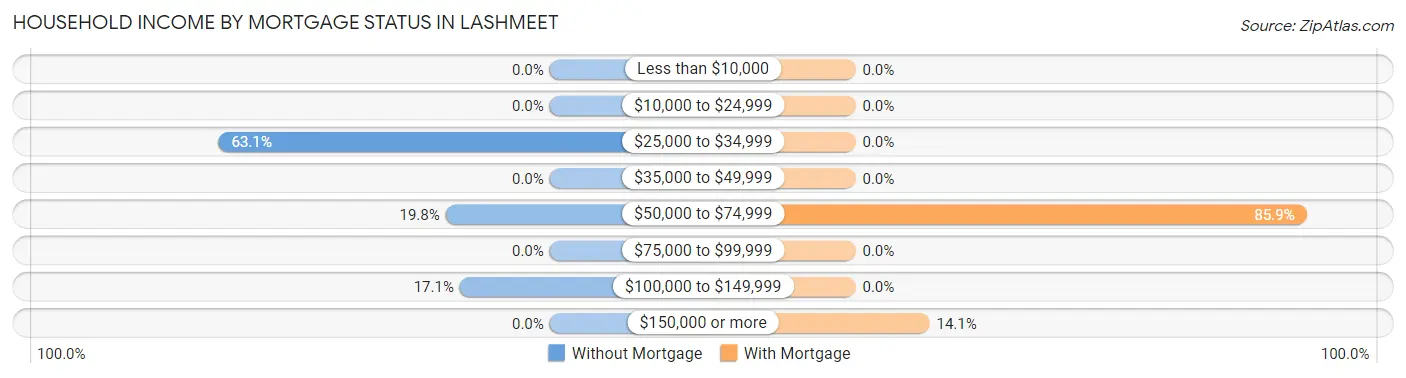
| Household Income | Without Mortgage | With Mortgage |
| Less than $10,000 | 0 (0.0%) | 0 (0.0%) |
| $10,000 to $24,999 | 0 (0.0%) | 0 (0.0%) |
| $25,000 to $34,999 | 70 (63.1%) | 0 (0.0%) |
| $35,000 to $49,999 | 0 (0.0%) | 0 (0.0%) |
| $50,000 to $74,999 | 22 (19.8%) | 134 (85.9%) |
| $75,000 to $99,999 | 0 (0.0%) | 0 (0.0%) |
| $100,000 to $149,999 | 19 (17.1%) | 0 (0.0%) |
| $150,000 or more | 0 (0.0%) | 22 (14.1%) |
| Total | 111 (100.0%) | 156 (100.0%) |
Property Value to Household Income Ratio in Lashmeet
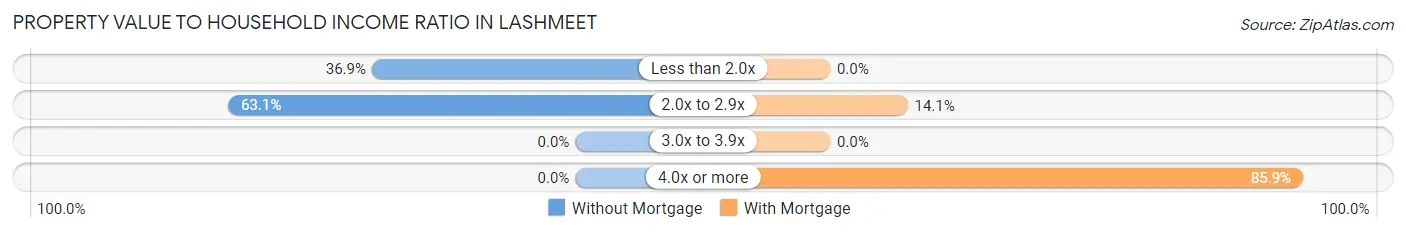
| Value-to-Income Ratio | Without Mortgage | With Mortgage |
| Less than 2.0x | 41 (36.9%) | 0 (0.0%) |
| 2.0x to 2.9x | 70 (63.1%) | 22 (14.1%) |
| 3.0x to 3.9x | 0 (0.0%) | 0 (0.0%) |
| 4.0x or more | 0 (0.0%) | 134 (85.9%) |
| Total | 111 (100.0%) | 156 (100.0%) |
Real Estate Taxes by Mortgage Status in Lashmeet
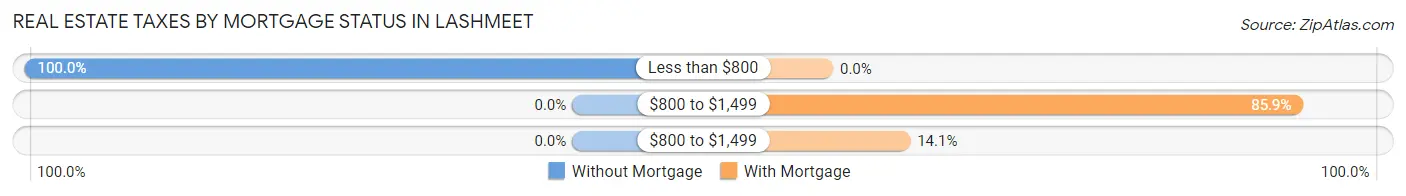
| Property Taxes | Without Mortgage | With Mortgage |
| Less than $800 | 111 (100.0%) | 0 (0.0%) |
| $800 to $1,499 | 0 (0.0%) | 134 (85.9%) |
| $800 to $1,499 | 0 (0.0%) | 22 (14.1%) |
| Total | 111 (100.0%) | 156 (100.0%) |
Health & Disability in Lashmeet
Health Insurance Coverage by Age in Lashmeet
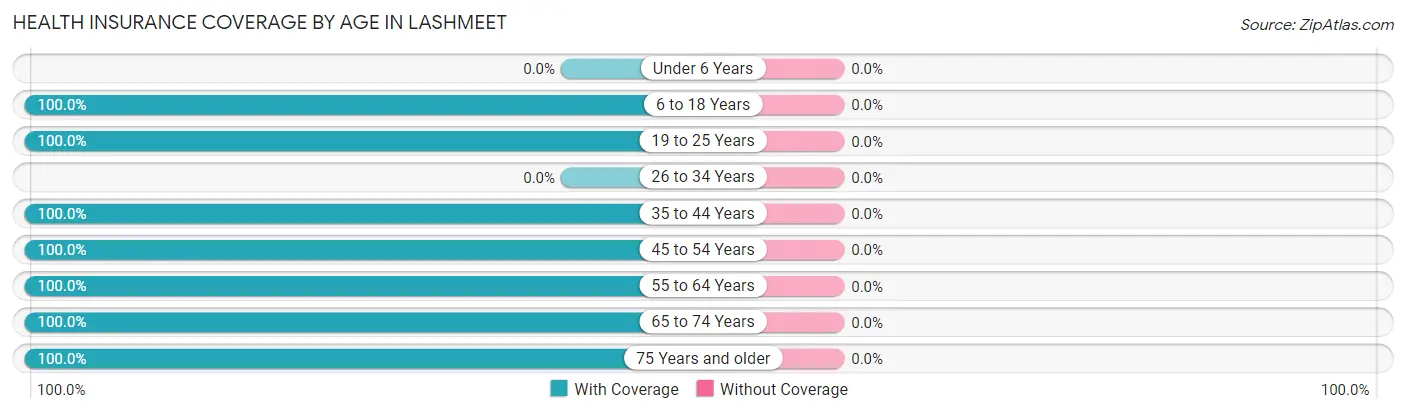
| Age Bracket | With Coverage | Without Coverage |
| Under 6 Years | 0 (0.0%) | 0 (0.0%) |
| 6 to 18 Years | 88 (100.0%) | 0 (0.0%) |
| 19 to 25 Years | 69 (100.0%) | 0 (0.0%) |
| 26 to 34 Years | 0 (0.0%) | 0 (0.0%) |
| 35 to 44 Years | 125 (100.0%) | 0 (0.0%) |
| 45 to 54 Years | 22 (100.0%) | 0 (0.0%) |
| 55 to 64 Years | 175 (100.0%) | 0 (0.0%) |
| 65 to 74 Years | 155 (100.0%) | 0 (0.0%) |
| 75 Years and older | 70 (100.0%) | 0 (0.0%) |
| Total | 704 (100.0%) | 0 (0.0%) |
Health Insurance Coverage by Citizenship Status in Lashmeet
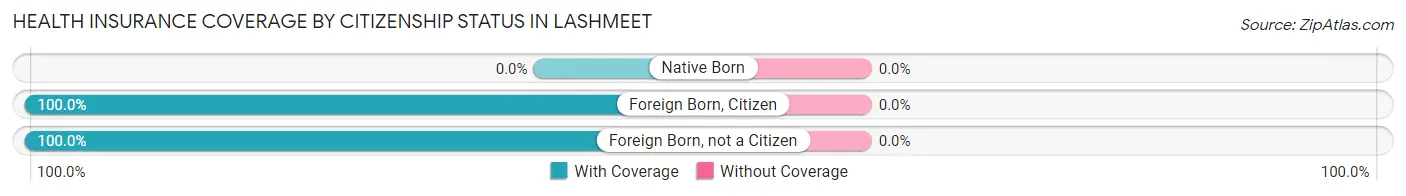
| Citizenship Status | With Coverage | Without Coverage |
| Native Born | 0 (0.0%) | 0 (0.0%) |
| Foreign Born, Citizen | 88 (100.0%) | 0 (0.0%) |
| Foreign Born, not a Citizen | 69 (100.0%) | 0 (0.0%) |
Health Insurance Coverage by Household Income in Lashmeet
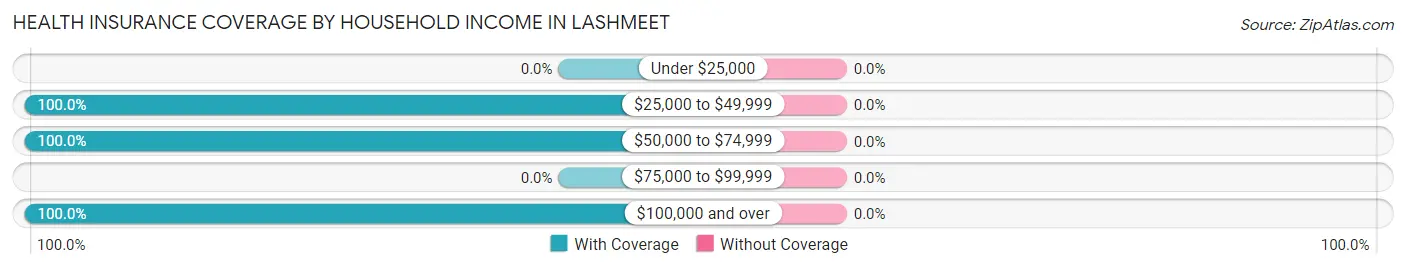
| Household Income | With Coverage | Without Coverage |
| Under $25,000 | 0 (0.0%) | 0 (0.0%) |
| $25,000 to $49,999 | 479 (100.0%) | 0 (0.0%) |
| $50,000 to $74,999 | 44 (100.0%) | 0 (0.0%) |
| $75,000 to $99,999 | 0 (0.0%) | 0 (0.0%) |
| $100,000 and over | 181 (100.0%) | 0 (0.0%) |
Public vs Private Health Insurance Coverage by Age in Lashmeet
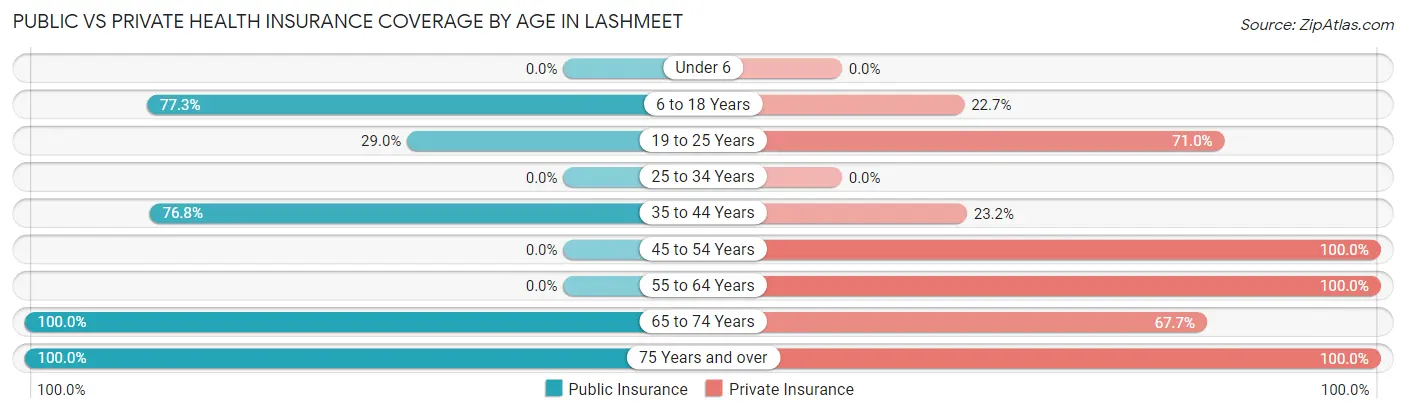
| Age Bracket | Public Insurance | Private Insurance |
| Under 6 | 0 (0.0%) | 0 (0.0%) |
| 6 to 18 Years | 68 (77.3%) | 20 (22.7%) |
| 19 to 25 Years | 20 (29.0%) | 49 (71.0%) |
| 25 to 34 Years | 0 (0.0%) | 0 (0.0%) |
| 35 to 44 Years | 96 (76.8%) | 29 (23.2%) |
| 45 to 54 Years | 0 (0.0%) | 22 (100.0%) |
| 55 to 64 Years | 0 (0.0%) | 175 (100.0%) |
| 65 to 74 Years | 155 (100.0%) | 105 (67.7%) |
| 75 Years and over | 70 (100.0%) | 70 (100.0%) |
| Total | 409 (58.1%) | 470 (66.8%) |
Disability Status by Sex by Age in Lashmeet
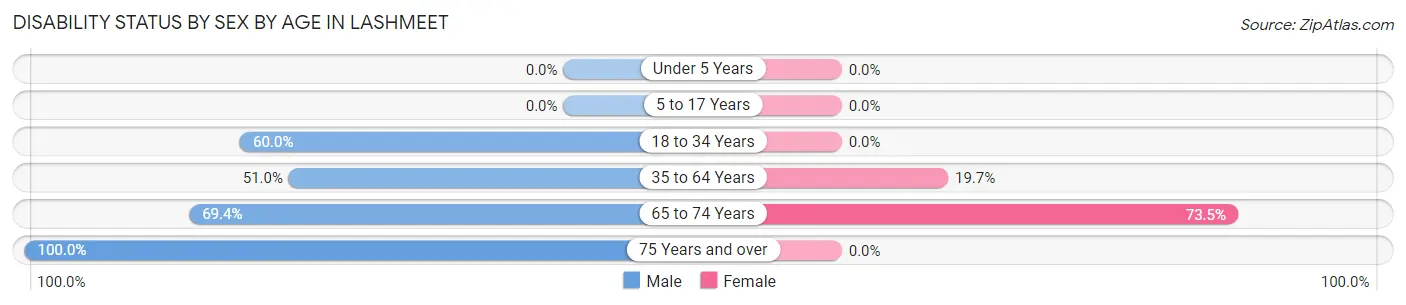
| Age Bracket | Male | Female |
| Under 5 Years | 0 (0.0%) | 0 (0.0%) |
| 5 to 17 Years | 0 (0.0%) | 0 (0.0%) |
| 18 to 34 Years | 30 (60.0%) | 0 (0.0%) |
| 35 to 64 Years | 53 (51.0%) | 43 (19.7%) |
| 65 to 74 Years | 50 (69.4%) | 61 (73.5%) |
| 75 Years and over | 70 (100.0%) | 0 (0.0%) |
Disability Class by Sex by Age in Lashmeet
Disability Class: Hearing Difficulty
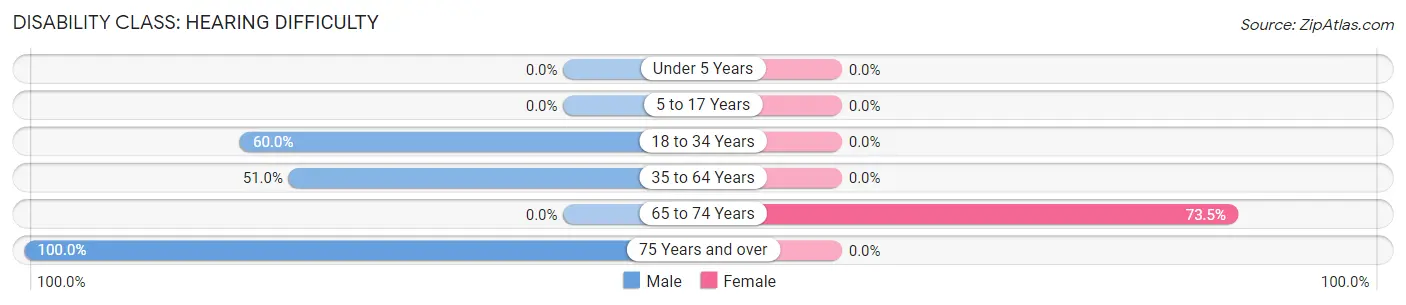
| Age Bracket | Male | Female |
| Under 5 Years | 0 (0.0%) | 0 (0.0%) |
| 5 to 17 Years | 0 (0.0%) | 0 (0.0%) |
| 18 to 34 Years | 30 (60.0%) | 0 (0.0%) |
| 35 to 64 Years | 53 (51.0%) | 0 (0.0%) |
| 65 to 74 Years | 0 (0.0%) | 61 (73.5%) |
| 75 Years and over | 70 (100.0%) | 0 (0.0%) |
Disability Class: Vision Difficulty
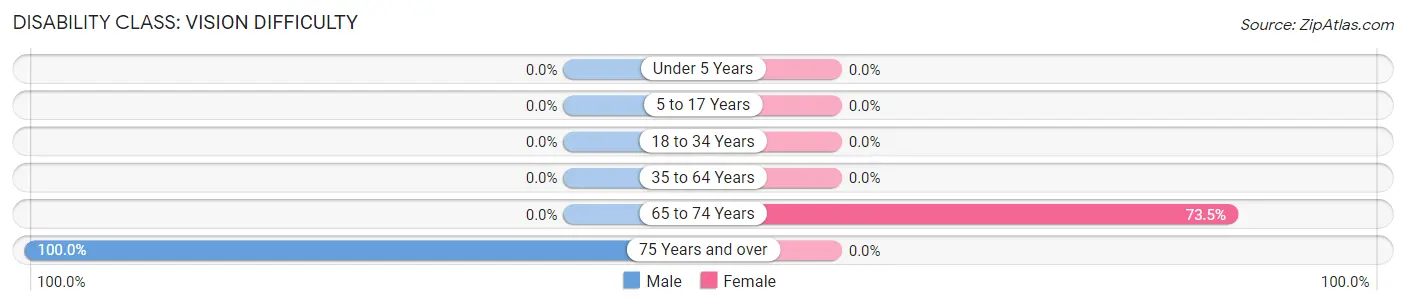
| Age Bracket | Male | Female |
| Under 5 Years | 0 (0.0%) | 0 (0.0%) |
| 5 to 17 Years | 0 (0.0%) | 0 (0.0%) |
| 18 to 34 Years | 0 (0.0%) | 0 (0.0%) |
| 35 to 64 Years | 0 (0.0%) | 0 (0.0%) |
| 65 to 74 Years | 0 (0.0%) | 61 (73.5%) |
| 75 Years and over | 70 (100.0%) | 0 (0.0%) |
Disability Class: Cognitive Difficulty
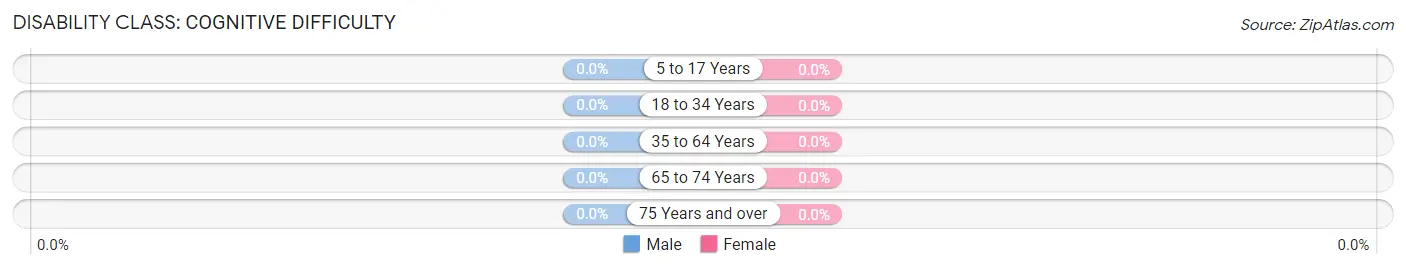
| Age Bracket | Male | Female |
| 5 to 17 Years | 0 (0.0%) | 0 (0.0%) |
| 18 to 34 Years | 0 (0.0%) | 0 (0.0%) |
| 35 to 64 Years | 0 (0.0%) | 0 (0.0%) |
| 65 to 74 Years | 0 (0.0%) | 0 (0.0%) |
| 75 Years and over | 0 (0.0%) | 0 (0.0%) |
Disability Class: Ambulatory Difficulty
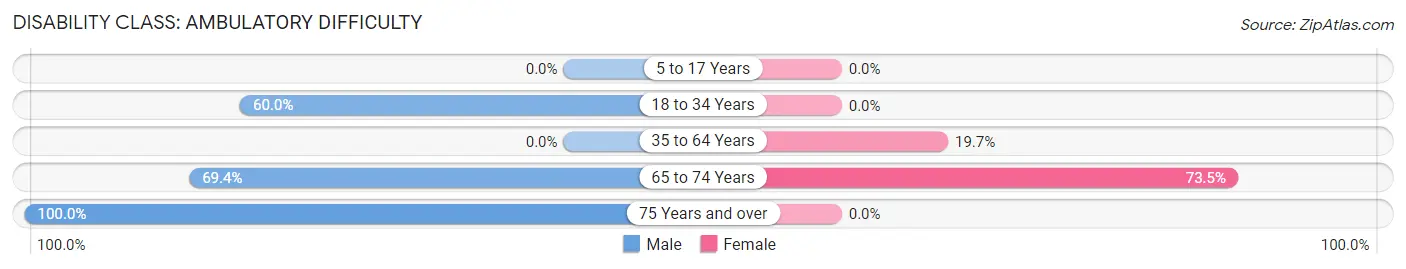
| Age Bracket | Male | Female |
| 5 to 17 Years | 0 (0.0%) | 0 (0.0%) |
| 18 to 34 Years | 30 (60.0%) | 0 (0.0%) |
| 35 to 64 Years | 0 (0.0%) | 43 (19.7%) |
| 65 to 74 Years | 50 (69.4%) | 61 (73.5%) |
| 75 Years and over | 70 (100.0%) | 0 (0.0%) |
Disability Class: Self-Care Difficulty

| Age Bracket | Male | Female |
| 5 to 17 Years | 0 (0.0%) | 0 (0.0%) |
| 18 to 34 Years | 0 (0.0%) | 0 (0.0%) |
| 35 to 64 Years | 0 (0.0%) | 0 (0.0%) |
| 65 to 74 Years | 0 (0.0%) | 0 (0.0%) |
| 75 Years and over | 0 (0.0%) | 0 (0.0%) |
Technology Access in Lashmeet
Computing Device Access in Lashmeet
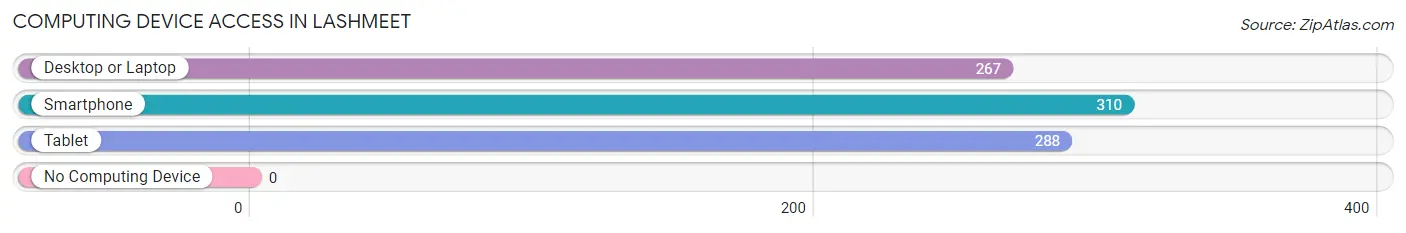
| Device Type | # Households | % Households |
| Desktop or Laptop | 267 | 86.1% |
| Smartphone | 310 | 100.0% |
| Tablet | 288 | 92.9% |
| No Computing Device | 0 | 0.0% |
| Total | 310 | 100.0% |
Internet Access in Lashmeet
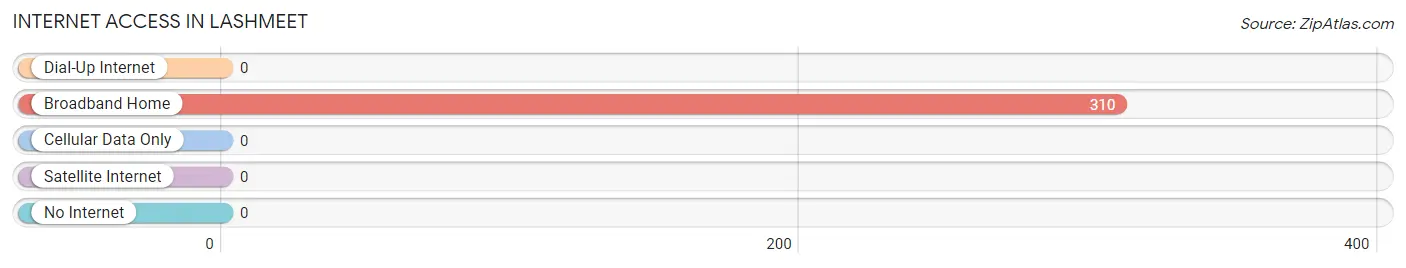
| Internet Type | # Households | % Households |
| Dial-Up Internet | 0 | 0.0% |
| Broadband Home | 310 | 100.0% |
| Cellular Data Only | 0 | 0.0% |
| Satellite Internet | 0 | 0.0% |
| No Internet | 0 | 0.0% |
| Total | 310 | 100.0% |
Lashmeet Summary
Lashmeet is a small unincorporated community located in Mercer County, West Virginia. It is situated along the Bluestone River, approximately five miles south of the county seat of Princeton. The population of Lashmeet was estimated to be around 200 people in 2000.
History
The area that is now Lashmeet was first settled in the late 1700s by a group of settlers from Virginia. The town was originally known as “Lashmeet’s Crossroads”, named after the intersection of two roads that ran through the area. The town was officially incorporated in 1891 and was named after the Lash family, who were among the first settlers in the area.
The town grew slowly over the years, but it was not until the early 1900s that it began to experience significant growth. This was due to the development of the coal industry in the area, which brought many new jobs and people to the area. The town also benefited from the construction of the Norfolk and Western Railway, which ran through the town and provided easy access to the rest of the state.
Geography
Lashmeet is located in the Appalachian Mountains of West Virginia. The town is situated along the Bluestone River, which is a tributary of the New River. The town is surrounded by rolling hills and mountains, and is located approximately five miles south of the county seat of Princeton.
The climate in Lashmeet is humid subtropical, with hot summers and mild winters. The average annual temperature is around 57 degrees Fahrenheit, and the average annual precipitation is around 43 inches.
Economy
The economy of Lashmeet is largely based on the coal industry. The town is home to several coal mines, and many of the residents are employed in the industry. The town also has a few small businesses, including a grocery store, a hardware store, and a few restaurants.
Demographics
As of the 2000 census, the population of Lashmeet was estimated to be around 200 people. The racial makeup of the town was 97.5% White, 0.5% African American, 0.5% Native American, and 1.5% from other races. The median household income was $25,000, and the median family income was $30,000.
Conclusion
Lashmeet is a small unincorporated community located in Mercer County, West Virginia. It is situated along the Bluestone River, approximately five miles south of the county seat of Princeton. The population of Lashmeet was estimated to be around 200 people in 2000. The economy of Lashmeet is largely based on the coal industry, and the town is home to several coal mines. The racial makeup of the town was 97.5% White, 0.5% African American, 0.5% Native American, and 1.5% from other races. The median household income was $25,000, and the median family income was $30,000.
Common Questions
What is Per Capita Income in Lashmeet?
Per Capita income in Lashmeet is $25,649.
What is the Median Household income in Lashmeet?
Median Household Income in Lashmeet is $43,701.
What is Income or Wage Gap in Lashmeet?
Income or Wage Gap in Lashmeet is 42.3%.
Women in Lashmeet earn 57.7 cents for every dollar earned by a man.
What is Inequality or Gini Index in Lashmeet?
Inequality or Gini Index in Lashmeet is 0.25.
What is the Total Population of Lashmeet?
Total Population of Lashmeet is 704.
What is the Total Male Population of Lashmeet?
Total Male Population of Lashmeet is 296.
What is the Total Female Population of Lashmeet?
Total Female Population of Lashmeet is 408.
What is the Ratio of Males per 100 Females in Lashmeet?
There are 72.55 Males per 100 Females in Lashmeet.
What is the Ratio of Females per 100 Males in Lashmeet?
There are 137.84 Females per 100 Males in Lashmeet.
What is the Median Population Age in Lashmeet?
Median Population Age in Lashmeet is 61.1 Years.
What is the Average Family Size in Lashmeet
Average Family Size in Lashmeet is 2.8 People.
What is the Average Household Size in Lashmeet
Average Household Size in Lashmeet is 2.3 People.
How Large is the Labor Force in Lashmeet?
There are 295 People in the Labor Forcein in Lashmeet.
What is the Percentage of People in the Labor Force in Lashmeet?
45.7% of People are in the Labor Force in Lashmeet.