Hundred, WV Map & Demographics
Hundred Map
Hundred Overview
$21,456
PER CAPITA INCOME
$48,375
AVG FAMILY INCOME
$41,216
AVG HOUSEHOLD INCOME
38.9%
WAGE / INCOME GAP [ % ]
61.1¢/ $1
WAGE / INCOME GAP [ $ ]
$6,350
FAMILY INCOME DEFICIT
0.38
INEQUALITY / GINI INDEX
379
TOTAL POPULATION
182
MALE POPULATION
197
FEMALE POPULATION
92.39
MALES / 100 FEMALES
108.24
FEMALES / 100 MALES
52.9
MEDIAN AGE
2.4
AVG FAMILY SIZE
2.0
AVG HOUSEHOLD SIZE
129
LABOR FORCE [ PEOPLE ]
39.7%
PERCENT IN LABOR FORCE
Hundred Zip Codes
Income in Hundred
Income Overview in Hundred
Per Capita Income in Hundred is $21,456, while median incomes of families and households are $48,375 and $41,216 respectively.
| Characteristic | Number | Measure |
| Per Capita Income | 379 | $21,456 |
| Median Family Income | 125 | $48,375 |
| Mean Family Income | 125 | $53,583 |
| Median Household Income | 188 | $41,216 |
| Mean Household Income | 188 | $41,714 |
| Income Deficit | 125 | $6,350 |
| Wage / Income Gap (%) | 379 | 38.92% |
| Wage / Income Gap ($) | 379 | 61.08¢ per $1 |
| Gini / Inequality Index | 379 | 0.38 |
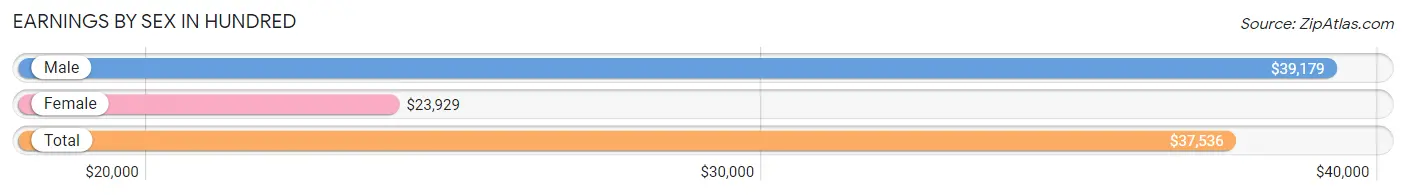
Earnings by Sex in Hundred
Average Earnings in Hundred are $37,536, $39,179 for men and $23,929 for women, a difference of 38.9%.
| Sex | Number | Average Earnings |
| Male | 53 (41.1%) | $39,179 |
| Female | 76 (58.9%) | $23,929 |
| Total | 129 (100.0%) | $37,536 |
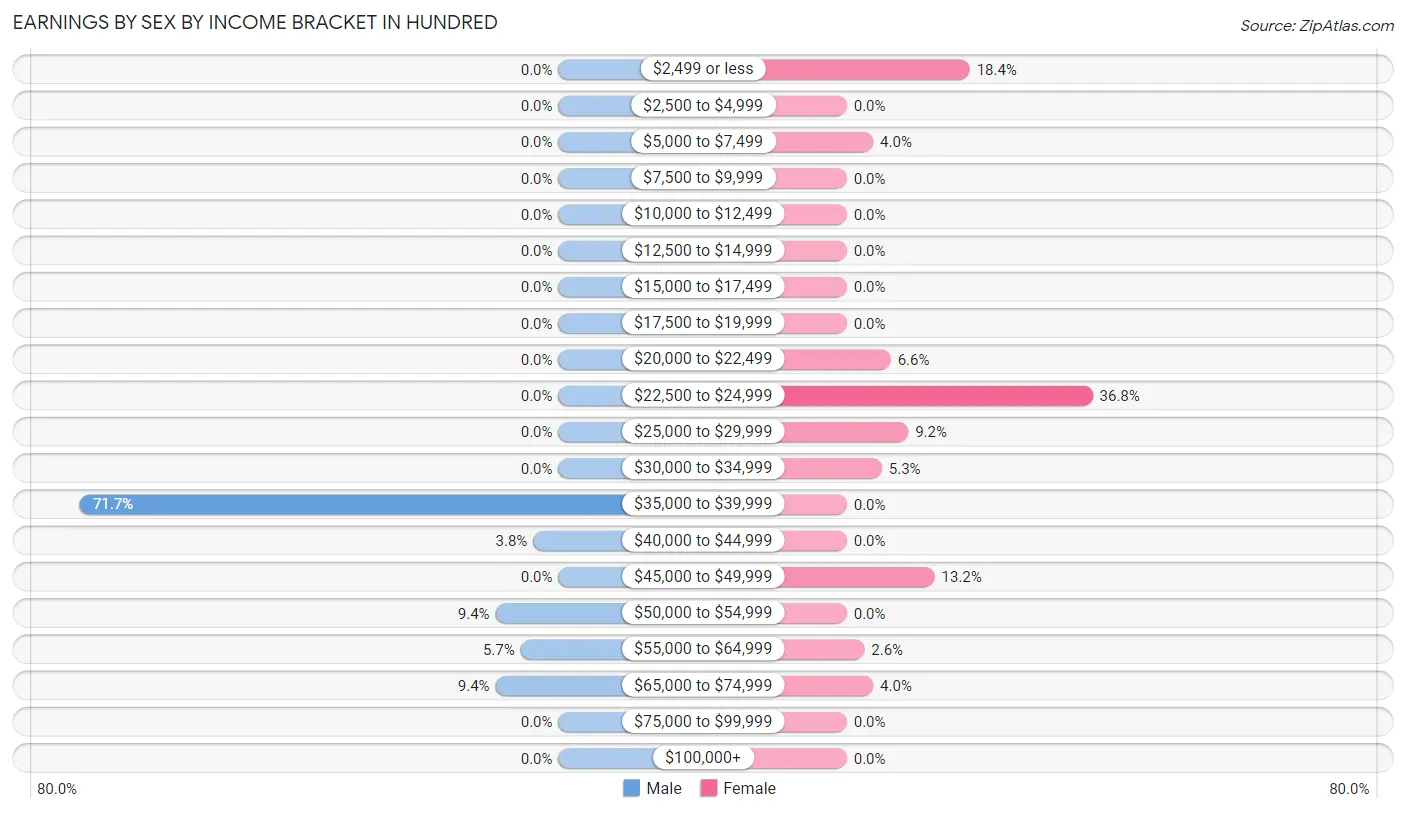
Earnings by Sex by Income Bracket in Hundred
The most common earnings brackets in Hundred are $35,000 to $39,999 for men (38 | 71.7%) and $22,500 to $24,999 for women (28 | 36.8%).
| Income | Male | Female |
| $2,499 or less | 0 (0.0%) | 14 (18.4%) |
| $2,500 to $4,999 | 0 (0.0%) | 0 (0.0%) |
| $5,000 to $7,499 | 0 (0.0%) | 3 (4.0%) |
| $7,500 to $9,999 | 0 (0.0%) | 0 (0.0%) |
| $10,000 to $12,499 | 0 (0.0%) | 0 (0.0%) |
| $12,500 to $14,999 | 0 (0.0%) | 0 (0.0%) |
| $15,000 to $17,499 | 0 (0.0%) | 0 (0.0%) |
| $17,500 to $19,999 | 0 (0.0%) | 0 (0.0%) |
| $20,000 to $22,499 | 0 (0.0%) | 5 (6.6%) |
| $22,500 to $24,999 | 0 (0.0%) | 28 (36.8%) |
| $25,000 to $29,999 | 0 (0.0%) | 7 (9.2%) |
| $30,000 to $34,999 | 0 (0.0%) | 4 (5.3%) |
| $35,000 to $39,999 | 38 (71.7%) | 0 (0.0%) |
| $40,000 to $44,999 | 2 (3.8%) | 0 (0.0%) |
| $45,000 to $49,999 | 0 (0.0%) | 10 (13.2%) |
| $50,000 to $54,999 | 5 (9.4%) | 0 (0.0%) |
| $55,000 to $64,999 | 3 (5.7%) | 2 (2.6%) |
| $65,000 to $74,999 | 5 (9.4%) | 3 (4.0%) |
| $75,000 to $99,999 | 0 (0.0%) | 0 (0.0%) |
| $100,000+ | 0 (0.0%) | 0 (0.0%) |
| Total | 53 (100.0%) | 76 (100.0%) |
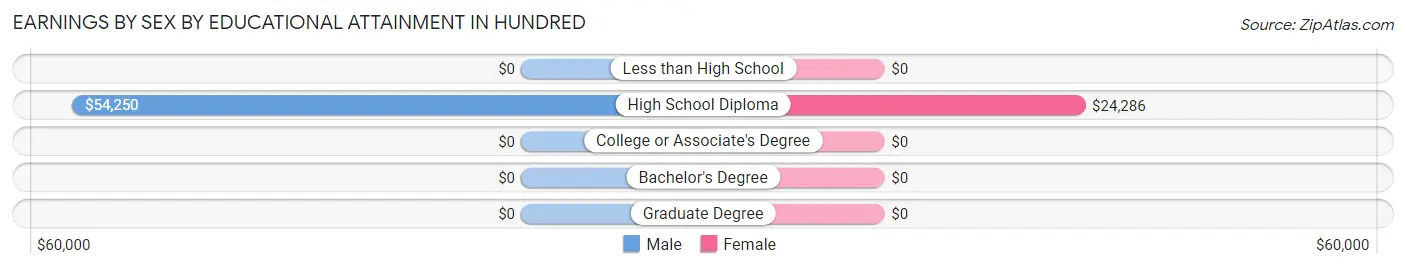
Earnings by Sex by Educational Attainment in Hundred
Average earnings in Hundred are $54,500 for men and $23,929 for women, a difference of 56.1%. Men with an educational attainment of high school diploma enjoy the highest average annual earnings of $54,250, while those with high school diploma education earn the least with $54,250. Women with an educational attainment of high school diploma earn the most with the average annual earnings of $24,286, while those with high school diploma education have the smallest earnings of $24,286.
| Educational Attainment | Male Income | Female Income |
| Less than High School | - | - |
| High School Diploma | $54,250 | $24,286 |
| College or Associate's Degree | - | - |
| Bachelor's Degree | - | - |
| Graduate Degree | - | - |
| Total | $54,500 | $23,929 |
Family Income in Hundred
Family Income Brackets in Hundred
According to the Hundred family income data, there are 52 families falling into the $35,000 to $49,999 income range, which is the most common income bracket and makes up 41.6% of all families.
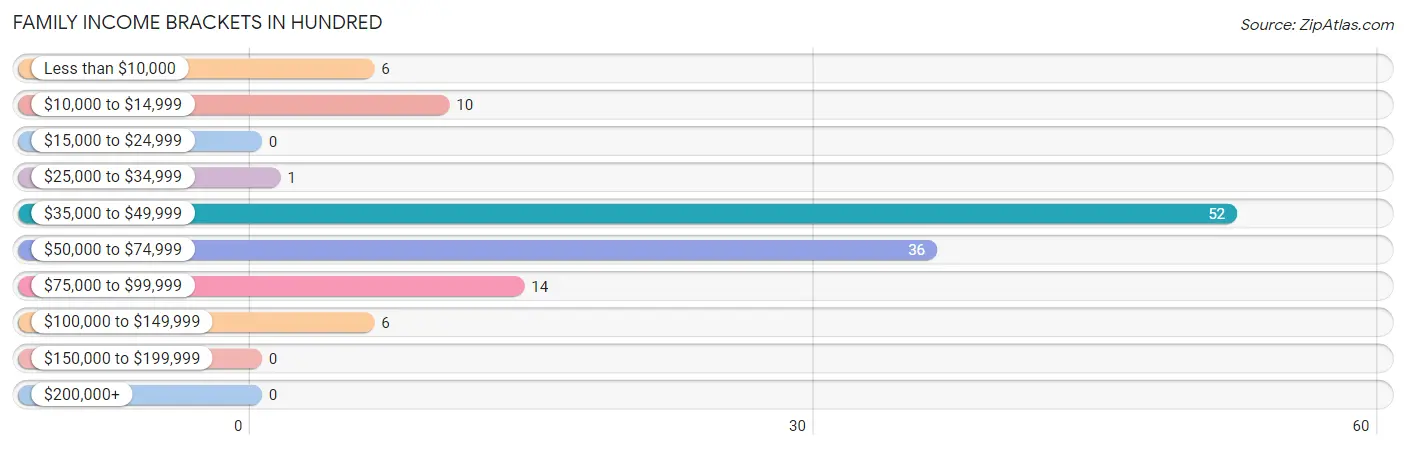
| Income Bracket | # Families | % Families |
| Less than $10,000 | 6 | 4.8% |
| $10,000 to $14,999 | 10 | 8.0% |
| $15,000 to $24,999 | 0 | 0.0% |
| $25,000 to $34,999 | 1 | 0.8% |
| $35,000 to $49,999 | 52 | 41.6% |
| $50,000 to $74,999 | 36 | 28.8% |
| $75,000 to $99,999 | 14 | 11.2% |
| $100,000 to $149,999 | 6 | 4.8% |
| $150,000 to $199,999 | 0 | 0.0% |
| $200,000+ | 0 | 0.0% |
Family Income by Famaliy Size in Hundred
2-person families (112 | 89.6%) account for the highest median family income in Hundred with $42,297 per family, while 2-person families (112 | 89.6%) have the highest median income of $21,148 per family member.
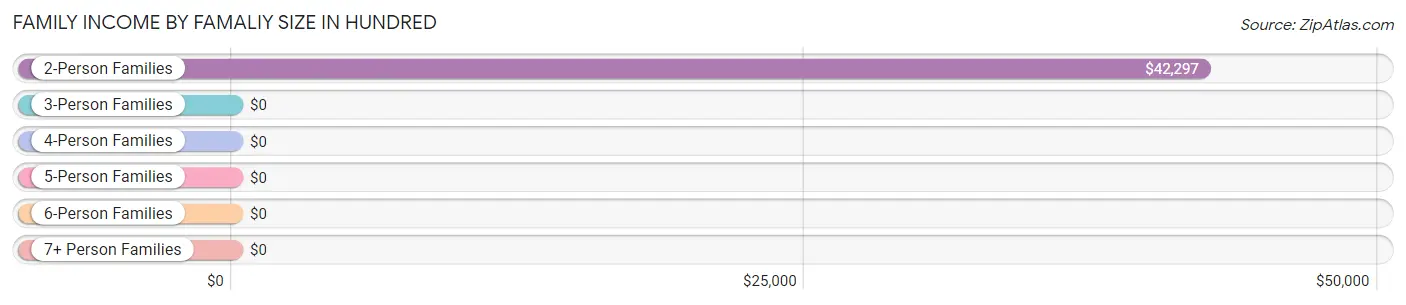
| Income Bracket | # Families | Median Income |
| 2-Person Families | 112 (89.6%) | $42,297 |
| 3-Person Families | 0 (0.0%) | $0 |
| 4-Person Families | 8 (6.4%) | $0 |
| 5-Person Families | 5 (4.0%) | $0 |
| 6-Person Families | 0 (0.0%) | $0 |
| 7+ Person Families | 0 (0.0%) | $0 |
| Total | 125 (100.0%) | $48,375 |
Family Income by Number of Earners in Hundred
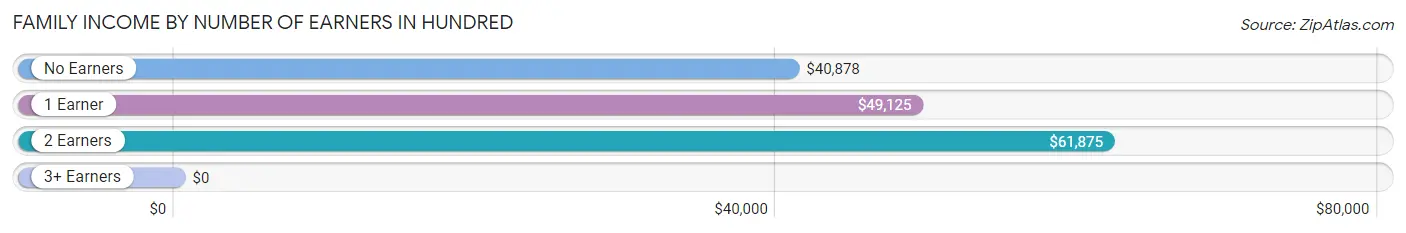
| Number of Earners | # Families | Median Income |
| No Earners | 62 (49.6%) | $40,878 |
| 1 Earner | 21 (16.8%) | $49,125 |
| 2 Earners | 42 (33.6%) | $61,875 |
| 3+ Earners | 0 (0.0%) | $0 |
| Total | 125 (100.0%) | $48,375 |
Household Income in Hundred
Household Income Brackets in Hundred
With 52 households falling in the category, the $50,000 to $74,999 income range is the most frequent in Hundred, accounting for 27.7% of all households.
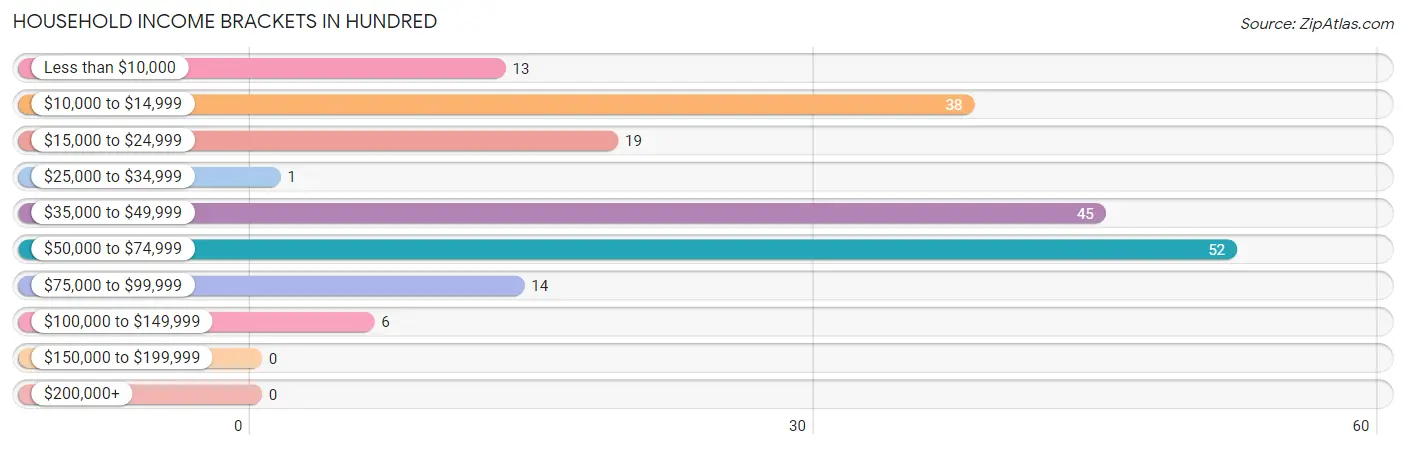
| Income Bracket | # Households | % Households |
| Less than $10,000 | 13 | 6.9% |
| $10,000 to $14,999 | 38 | 20.2% |
| $15,000 to $24,999 | 19 | 10.1% |
| $25,000 to $34,999 | 1 | 0.5% |
| $35,000 to $49,999 | 45 | 23.9% |
| $50,000 to $74,999 | 52 | 27.7% |
| $75,000 to $99,999 | 14 | 7.4% |
| $100,000 to $149,999 | 6 | 3.2% |
| $150,000 to $199,999 | 0 | 0.0% |
| $200,000+ | 0 | 0.0% |
Household Income by Householder Age in Hundred
The median household income in Hundred is $41,216, with the highest median household income of $40,507 found in the 65+ years age bracket for the primary householder. A total of 91 households (48.4%) fall into this category.
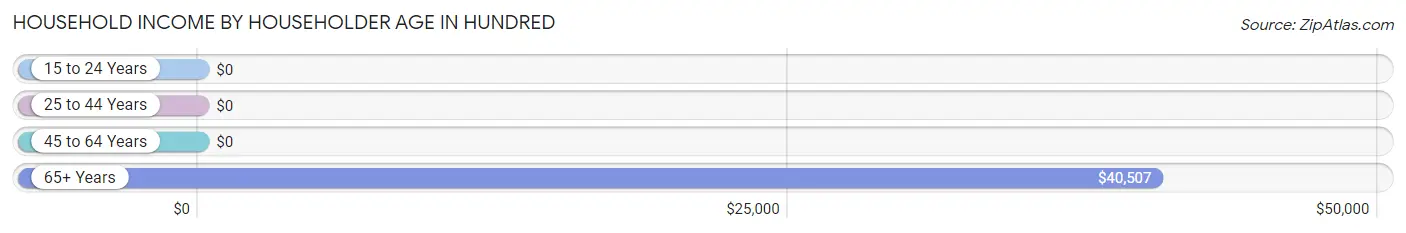
| Income Bracket | # Households | Median Income |
| 15 to 24 Years | 0 (0.0%) | $0 |
| 25 to 44 Years | 31 (16.5%) | $0 |
| 45 to 64 Years | 66 (35.1%) | $0 |
| 65+ Years | 91 (48.4%) | $40,507 |
| Total | 188 (100.0%) | $41,216 |
Poverty in Hundred
Income Below Poverty by Sex and Age in Hundred
With 16.5% poverty level for males and 24.4% for females among the residents of Hundred, 55 to 64 year old males and 55 to 64 year old females are the most vulnerable to poverty, with 9 males (81.8%) and 31 females (47.0%) in their respective age groups living below the poverty level.
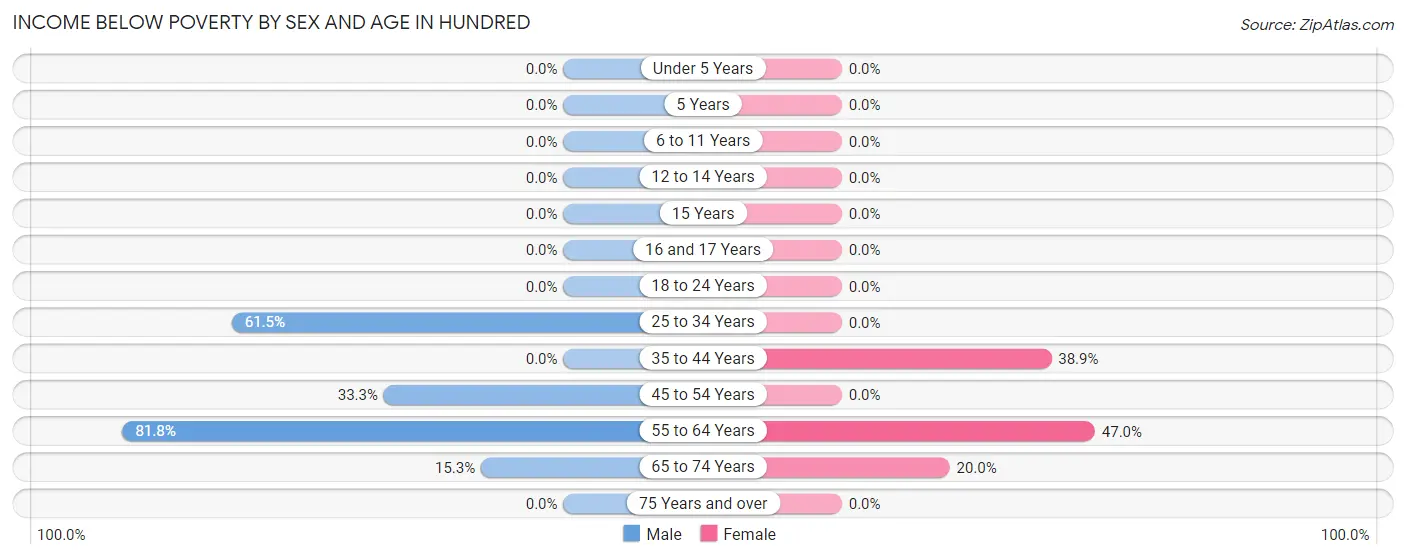
| Age Bracket | Male | Female |
| Under 5 Years | 0 (0.0%) | 0 (0.0%) |
| 5 Years | 0 (0.0%) | 0 (0.0%) |
| 6 to 11 Years | 0 (0.0%) | 0 (0.0%) |
| 12 to 14 Years | 0 (0.0%) | 0 (0.0%) |
| 15 Years | 0 (0.0%) | 0 (0.0%) |
| 16 and 17 Years | 0 (0.0%) | 0 (0.0%) |
| 18 to 24 Years | 0 (0.0%) | 0 (0.0%) |
| 25 to 34 Years | 8 (61.5%) | 0 (0.0%) |
| 35 to 44 Years | 0 (0.0%) | 14 (38.9%) |
| 45 to 54 Years | 2 (33.3%) | 0 (0.0%) |
| 55 to 64 Years | 9 (81.8%) | 31 (47.0%) |
| 65 to 74 Years | 11 (15.3%) | 3 (20.0%) |
| 75 Years and over | 0 (0.0%) | 0 (0.0%) |
| Total | 30 (16.5%) | 48 (24.4%) |
Income Above Poverty by Sex and Age in Hundred
According to the poverty statistics in Hundred, males aged 6 to 11 years and females aged under 5 years are the age groups that are most secure financially, with 100.0% of males and 100.0% of females in these age groups living above the poverty line.
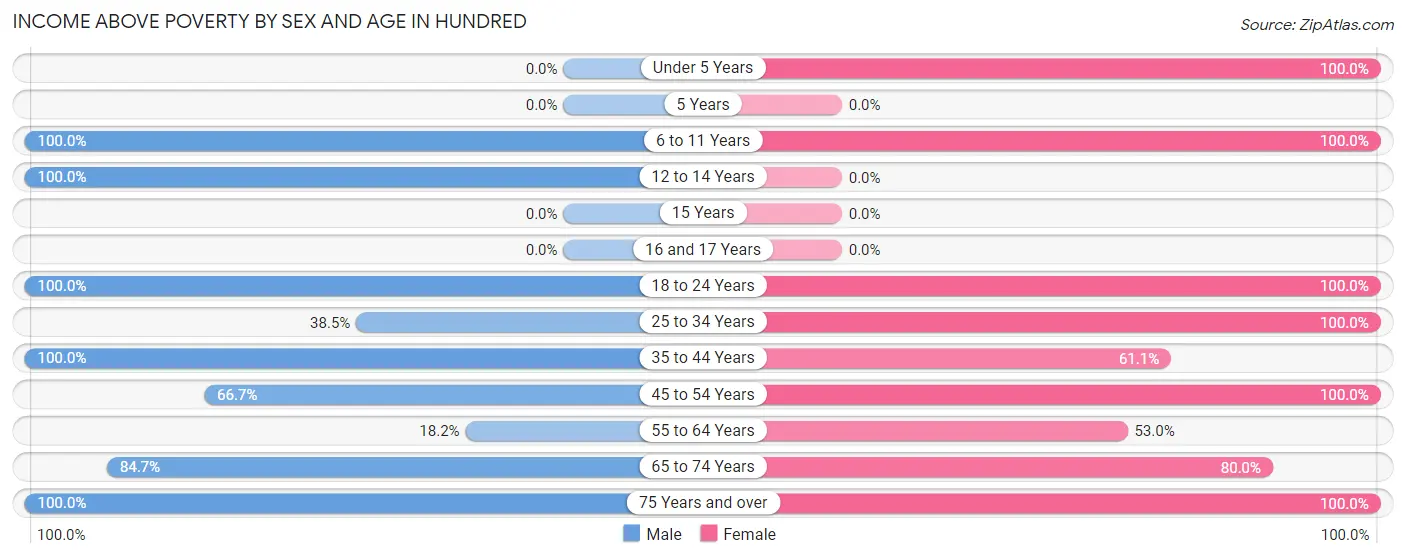
| Age Bracket | Male | Female |
| Under 5 Years | 0 (0.0%) | 11 (100.0%) |
| 5 Years | 0 (0.0%) | 0 (0.0%) |
| 6 to 11 Years | 13 (100.0%) | 19 (100.0%) |
| 12 to 14 Years | 11 (100.0%) | 0 (0.0%) |
| 15 Years | 0 (0.0%) | 0 (0.0%) |
| 16 and 17 Years | 0 (0.0%) | 0 (0.0%) |
| 18 to 24 Years | 35 (100.0%) | 6 (100.0%) |
| 25 to 34 Years | 5 (38.5%) | 6 (100.0%) |
| 35 to 44 Years | 7 (100.0%) | 22 (61.1%) |
| 45 to 54 Years | 4 (66.7%) | 32 (100.0%) |
| 55 to 64 Years | 2 (18.2%) | 35 (53.0%) |
| 65 to 74 Years | 61 (84.7%) | 12 (80.0%) |
| 75 Years and over | 14 (100.0%) | 6 (100.0%) |
| Total | 152 (83.5%) | 149 (75.6%) |
Income Below Poverty Among Married-Couple Families in Hundred
The poverty statistics for married-couple families in Hundred show that 18.4% or 16 of the total 87 families live below the poverty line. Families with no children have the highest poverty rate of 21.6%, comprising of 16 families. On the other hand, families with 1 or 2 children have the lowest poverty rate of 0.0%, which includes 0 families.
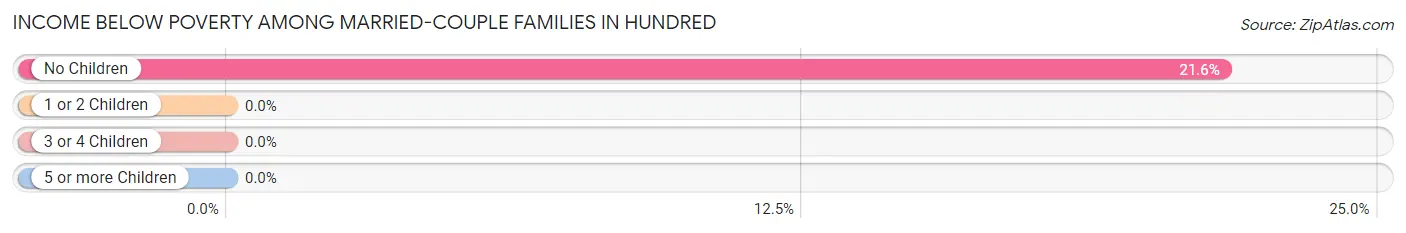
| Children | Above Poverty | Below Poverty |
| No Children | 58 (78.4%) | 16 (21.6%) |
| 1 or 2 Children | 8 (100.0%) | 0 (0.0%) |
| 3 or 4 Children | 5 (100.0%) | 0 (0.0%) |
| 5 or more Children | 0 (0.0%) | 0 (0.0%) |
| Total | 71 (81.6%) | 16 (18.4%) |
Income Below Poverty Among Single-Parent Households in Hundred
| Children | Single Father | Single Mother |
| No Children | 0 (0.0%) | 0 (0.0%) |
| 1 or 2 Children | 0 (0.0%) | 0 (0.0%) |
| 3 or 4 Children | 0 (0.0%) | 0 (0.0%) |
| 5 or more Children | 0 (0.0%) | 0 (0.0%) |
| Total | 0 (0.0%) | 0 (0.0%) |
Income Below Poverty Among Married-Couple vs Single-Parent Households in Hundred
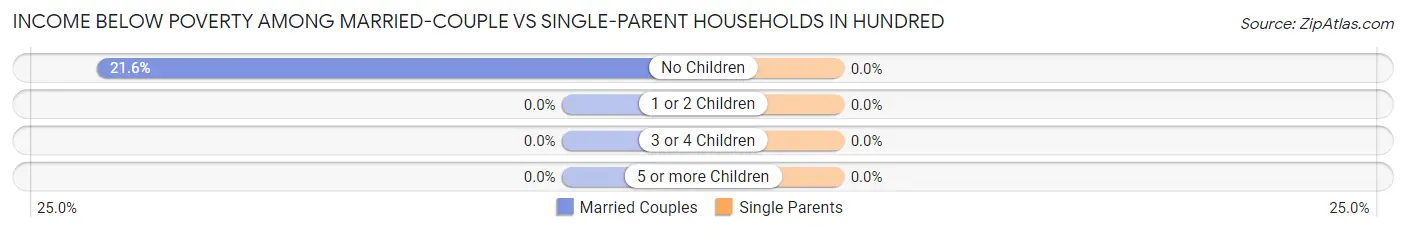
| Children | Married-Couple Families | Single-Parent Households |
| No Children | 16 (21.6%) | 0 (0.0%) |
| 1 or 2 Children | 0 (0.0%) | 0 (0.0%) |
| 3 or 4 Children | 0 (0.0%) | 0 (0.0%) |
| 5 or more Children | 0 (0.0%) | 0 (0.0%) |
| Total | 16 (18.4%) | 0 (0.0%) |
Race in Hundred
The most populous races in Hundred are White / Caucasian (376 | 99.2%), and Two or more Races (3 | 0.8%).
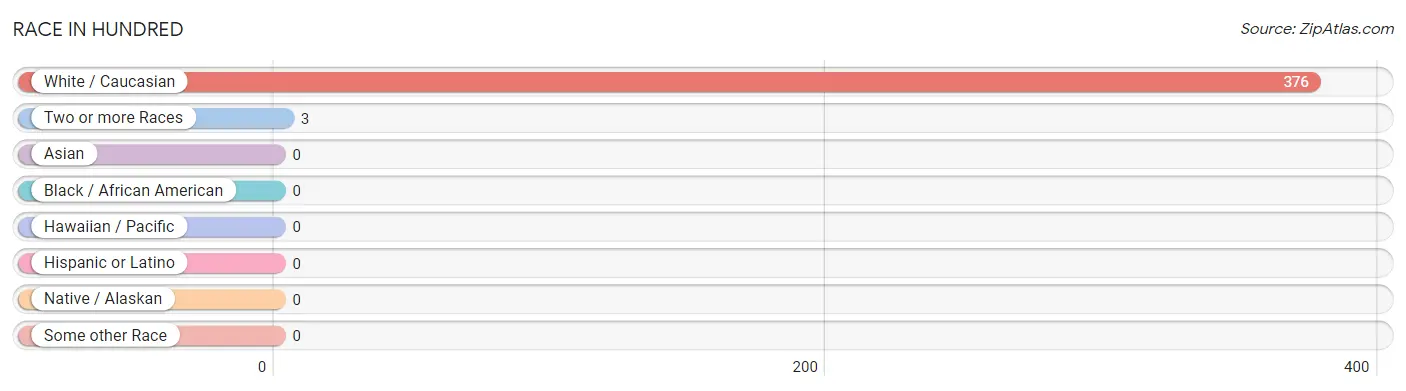
| Race | # Population | % Population |
| Asian | 0 | 0.0% |
| Black / African American | 0 | 0.0% |
| Hawaiian / Pacific | 0 | 0.0% |
| Hispanic or Latino | 0 | 0.0% |
| Native / Alaskan | 0 | 0.0% |
| White / Caucasian | 376 | 99.2% |
| Two or more Races | 3 | 0.8% |
| Some other Race | 0 | 0.0% |
| Total | 379 | 100.0% |
Ancestry in Hundred
The most populous ancestries reported in Hundred are German (103 | 27.2%), English (81 | 21.4%), American (51 | 13.5%), Irish (47 | 12.4%), and Italian (9 | 2.4%), together accounting for 76.8% of all Hundred residents.
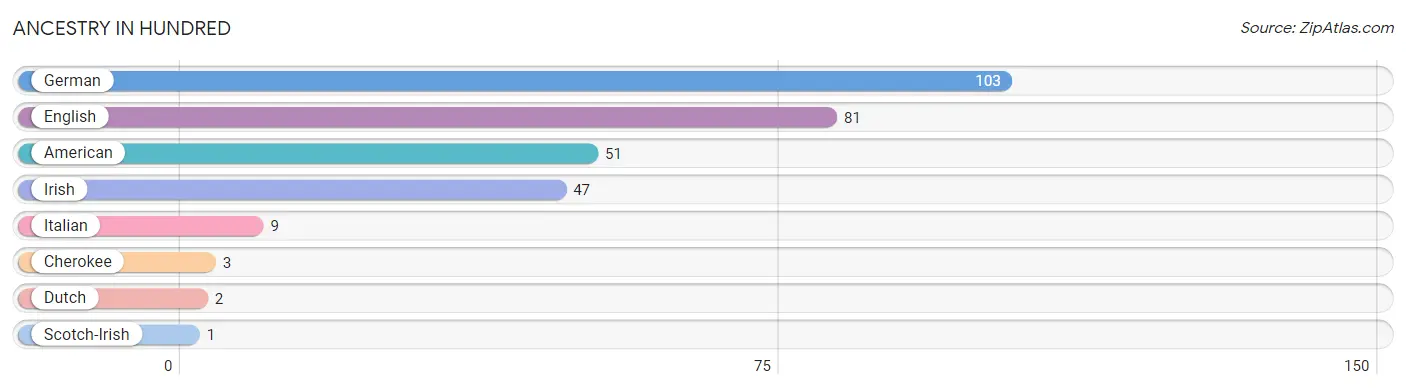
| Ancestry | # Population | % Population |
| American | 51 | 13.5% |
| Cherokee | 3 | 0.8% |
| Dutch | 2 | 0.5% |
| English | 81 | 21.4% |
| German | 103 | 27.2% |
| Irish | 47 | 12.4% |
| Italian | 9 | 2.4% |
| Scotch-Irish | 1 | 0.3% | View All 8 Rows |
Immigrants in Hundred

| Immigration Origin | # Population | % Population | View All 0 Rows |
Sex and Age in Hundred
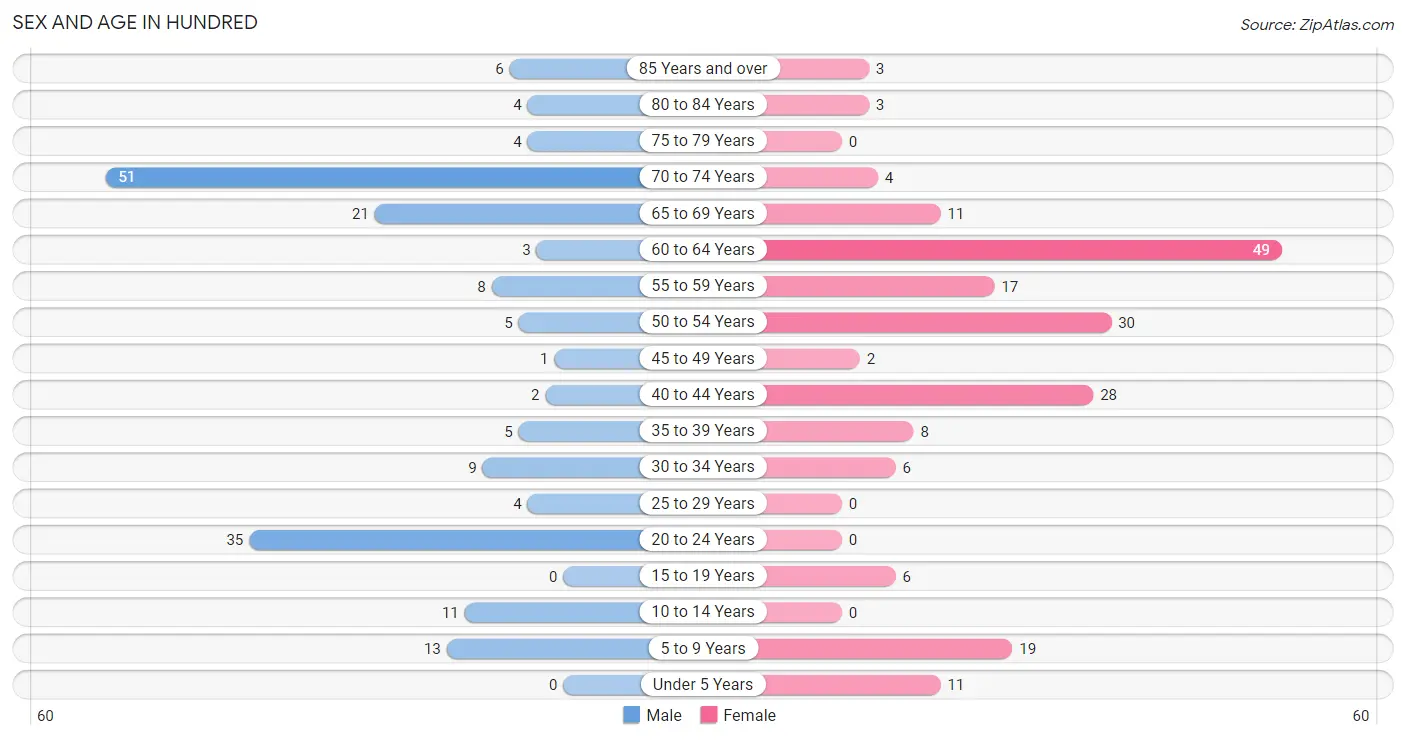
Sex and Age in Hundred
The most populous age groups in Hundred are 70 to 74 Years (51 | 28.0%) for men and 60 to 64 Years (49 | 24.9%) for women.
| Age Bracket | Male | Female |
| Under 5 Years | 0 (0.0%) | 11 (5.6%) |
| 5 to 9 Years | 13 (7.1%) | 19 (9.6%) |
| 10 to 14 Years | 11 (6.0%) | 0 (0.0%) |
| 15 to 19 Years | 0 (0.0%) | 6 (3.0%) |
| 20 to 24 Years | 35 (19.2%) | 0 (0.0%) |
| 25 to 29 Years | 4 (2.2%) | 0 (0.0%) |
| 30 to 34 Years | 9 (5.0%) | 6 (3.0%) |
| 35 to 39 Years | 5 (2.8%) | 8 (4.1%) |
| 40 to 44 Years | 2 (1.1%) | 28 (14.2%) |
| 45 to 49 Years | 1 (0.5%) | 2 (1.0%) |
| 50 to 54 Years | 5 (2.8%) | 30 (15.2%) |
| 55 to 59 Years | 8 (4.4%) | 17 (8.6%) |
| 60 to 64 Years | 3 (1.7%) | 49 (24.9%) |
| 65 to 69 Years | 21 (11.5%) | 11 (5.6%) |
| 70 to 74 Years | 51 (28.0%) | 4 (2.0%) |
| 75 to 79 Years | 4 (2.2%) | 0 (0.0%) |
| 80 to 84 Years | 4 (2.2%) | 3 (1.5%) |
| 85 Years and over | 6 (3.3%) | 3 (1.5%) |
| Total | 182 (100.0%) | 197 (100.0%) |
Families and Households in Hundred
Median Family Size in Hundred
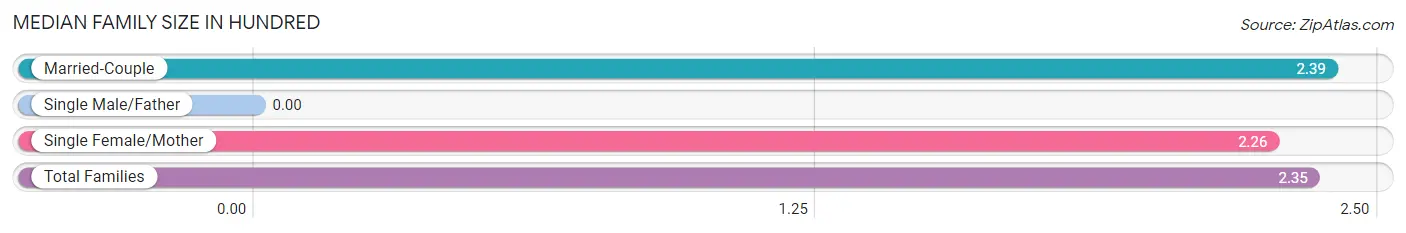
| Family Type | # Families | Family Size |
| Married-Couple | 87 (69.6%) | 2.39 |
| Single Male/Father | 0 (0.0%) | - |
| Single Female/Mother | 38 (30.4%) | 2.26 |
| Total Families | 125 (100.0%) | 2.35 |
Median Household Size in Hundred
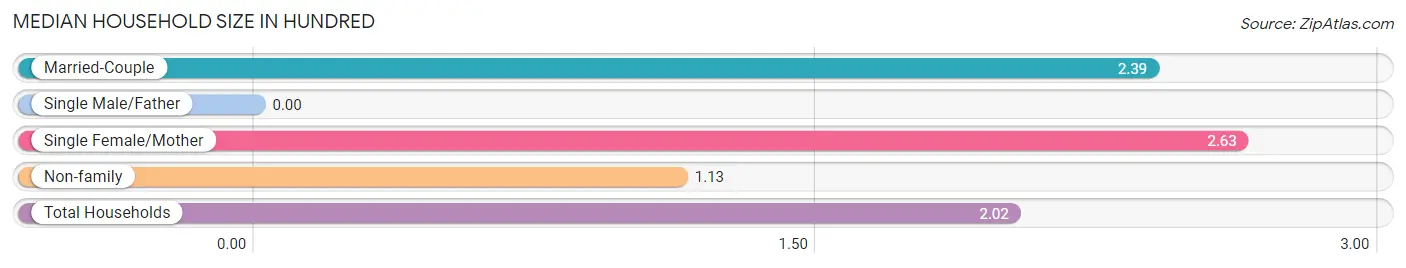
| Household Type | # Households | Household Size |
| Married-Couple | 87 (46.3%) | 2.39 |
| Single Male/Father | 0 (0.0%) | - |
| Single Female/Mother | 38 (20.2%) | 2.63 |
| Non-family | 63 (33.5%) | 1.13 |
| Total Households | 188 (100.0%) | 2.02 |
Household Size by Marriage Status in Hundred
Out of a total of 188 households in Hundred, 125 (66.5%) are family households, while 63 (33.5%) are nonfamily households. The most numerous type of family households are 2-person households, comprising 102, and the most common type of nonfamily households are 1-person households, comprising 60.
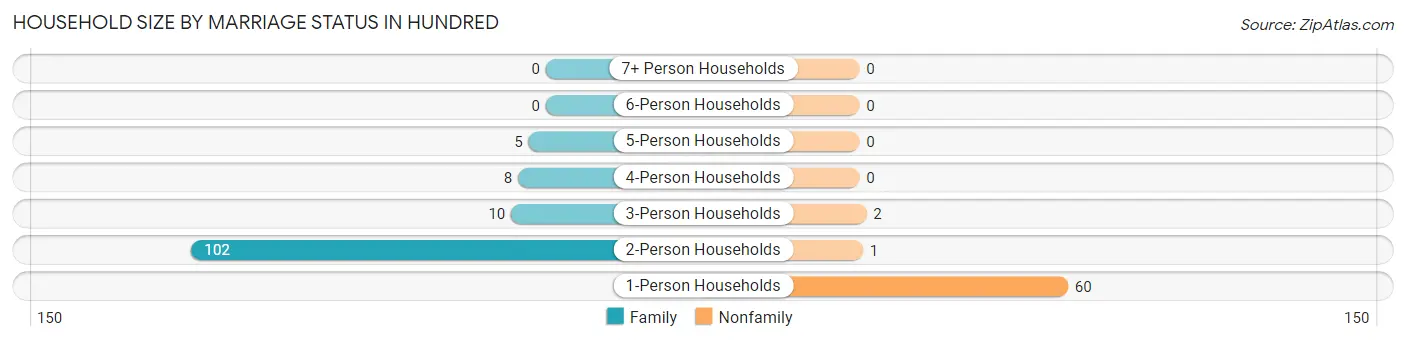
| Household Size | Family Households | Nonfamily Households |
| 1-Person Households | - | 60 (31.9%) |
| 2-Person Households | 102 (54.3%) | 1 (0.5%) |
| 3-Person Households | 10 (5.3%) | 2 (1.1%) |
| 4-Person Households | 8 (4.3%) | 0 (0.0%) |
| 5-Person Households | 5 (2.7%) | 0 (0.0%) |
| 6-Person Households | 0 (0.0%) | 0 (0.0%) |
| 7+ Person Households | 0 (0.0%) | 0 (0.0%) |
| Total | 125 (66.5%) | 63 (33.5%) |
Female Fertility in Hundred
Fertility by Age in Hundred
| Age Bracket | Women with Births | Births / 1,000 Women |
| 15 to 19 years | 0 (0.0%) | 0.0 |
| 20 to 34 years | 0 (0.0%) | 0.0 |
| 35 to 50 years | 0 (0.0%) | 0.0 |
| Total | 0 (0.0%) | 0.0 |
Fertility by Age by Marriage Status in Hundred
| Age Bracket | Married | Unmarried |
| 15 to 19 years | 0 (0.0%) | 0 (0.0%) |
| 20 to 34 years | 0 (0.0%) | 0 (0.0%) |
| 35 to 50 years | 0 (0.0%) | 0 (0.0%) |
| Total | 0 (0.0%) | 0 (0.0%) |
Fertility by Education in Hundred
| Educational Attainment | Women with Births | Births / 1,000 Women |
| Less than High School | 0 (0.0%) | 0.0 |
| High School Diploma | 0 (0.0%) | 0.0 |
| College or Associate's Degree | 0 (0.0%) | 0.0 |
| Bachelor's Degree | 0 (0.0%) | 0.0 |
| Graduate Degree | 0 (0.0%) | 0.0 |
| Total | 0 (0.0%) | 0.0 |
Fertility by Education by Marriage Status in Hundred
| Educational Attainment | Married | Unmarried |
| Less than High School | 0 (0.0%) | 0 (0.0%) |
| High School Diploma | 0 (0.0%) | 0 (0.0%) |
| College or Associate's Degree | 0 (0.0%) | 0 (0.0%) |
| Bachelor's Degree | 0 (0.0%) | 0 (0.0%) |
| Graduate Degree | 0 (0.0%) | 0 (0.0%) |
| Total | 0 (0.0%) | 0 (0.0%) |
Employment Characteristics in Hundred
Employment by Class of Employer in Hundred
Among the 129 employed individuals in Hundred, private company employees (81 | 62.8%), state government employees (39 | 30.2%), and local government employees (9 | 7.0%) make up the most common classes of employment.
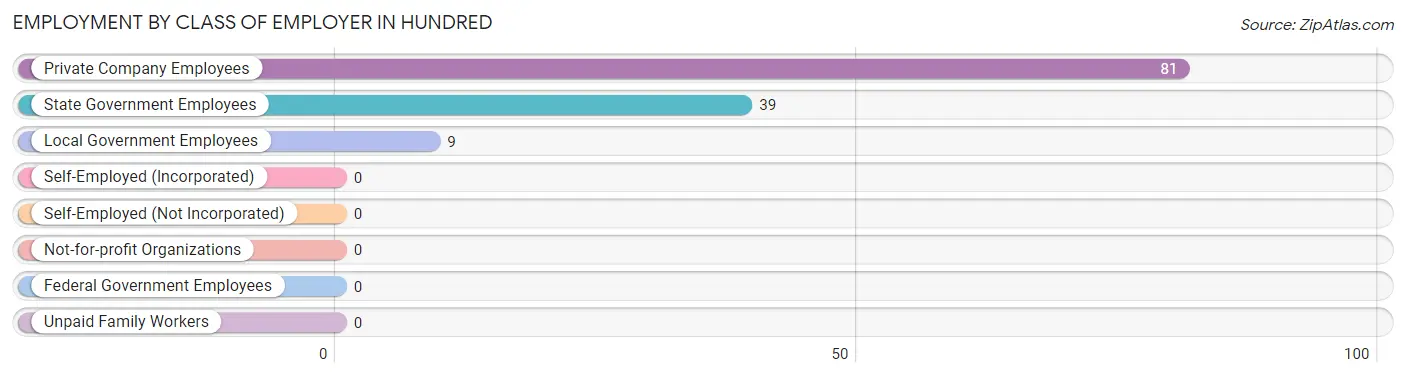
| Employer Class | # Employees | % Employees |
| Private Company Employees | 81 | 62.8% |
| Self-Employed (Incorporated) | 0 | 0.0% |
| Self-Employed (Not Incorporated) | 0 | 0.0% |
| Not-for-profit Organizations | 0 | 0.0% |
| Local Government Employees | 9 | 7.0% |
| State Government Employees | 39 | 30.2% |
| Federal Government Employees | 0 | 0.0% |
| Unpaid Family Workers | 0 | 0.0% |
| Total | 129 | 100.0% |
Employment Status by Age in Hundred
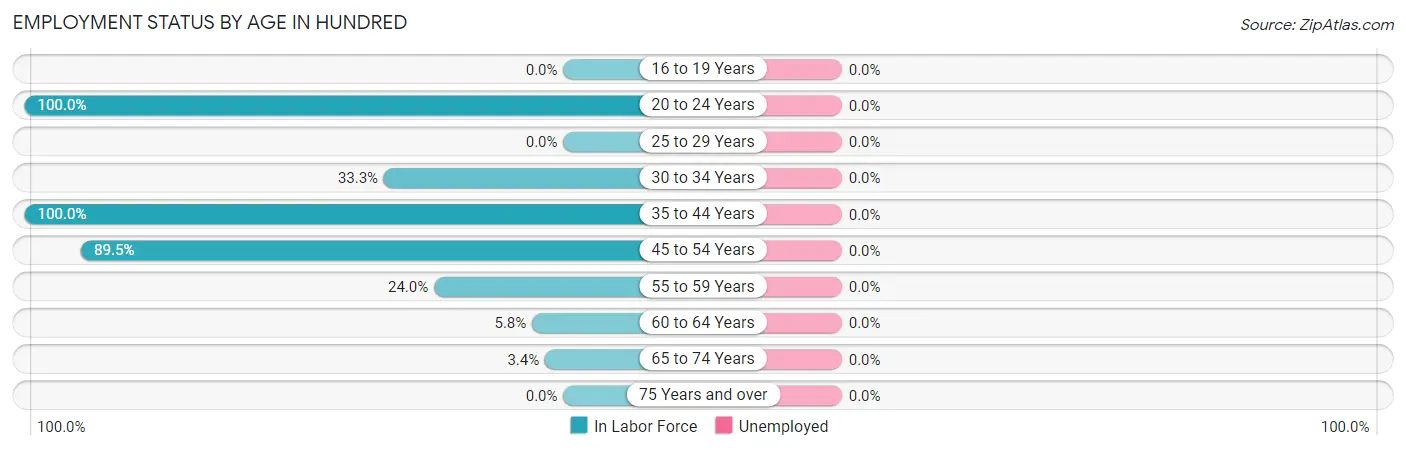
| Age Bracket | In Labor Force | Unemployed |
| 16 to 19 Years | 0 (0.0%) | 0 (0.0%) |
| 20 to 24 Years | 35 (100.0%) | 0 (0.0%) |
| 25 to 29 Years | 0 (0.0%) | 0 (0.0%) |
| 30 to 34 Years | 5 (33.3%) | 0 (0.0%) |
| 35 to 44 Years | 43 (100.0%) | 0 (0.0%) |
| 45 to 54 Years | 34 (89.5%) | 0 (0.0%) |
| 55 to 59 Years | 6 (24.0%) | 0 (0.0%) |
| 60 to 64 Years | 3 (5.8%) | 0 (0.0%) |
| 65 to 74 Years | 3 (3.4%) | 0 (0.0%) |
| 75 Years and over | 0 (0.0%) | 0 (0.0%) |
| Total | 129 (39.7%) | 0 (0.0%) |
Employment Status by Educational Attainment in Hundred
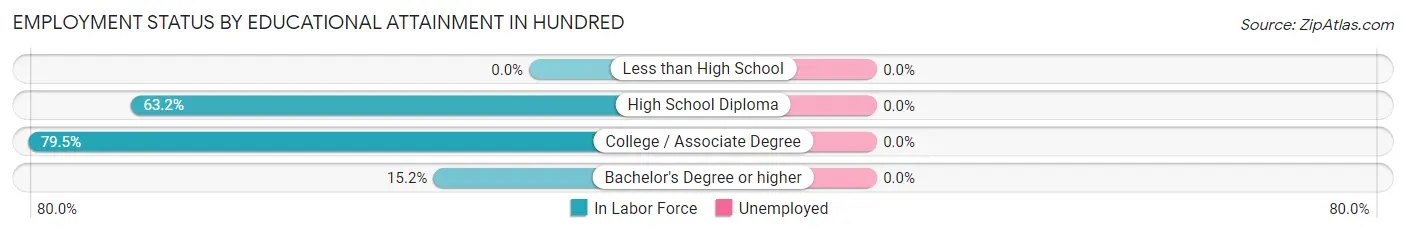
| Educational Attainment | In Labor Force | Unemployed |
| Less than High School | 0 (0.0%) | 0 (0.0%) |
| High School Diploma | 55 (63.2%) | 0 (0.0%) |
| College / Associate Degree | 31 (79.5%) | 0 (0.0%) |
| Bachelor's Degree or higher | 5 (15.2%) | 0 (0.0%) |
| Total | 91 (51.4%) | 0 (0.0%) |
Employment Occupations by Sex in Hundred
Management, Business, Science and Arts Occupations
The most common Management, Business, Science and Arts occupations in Hundred are Computers, Engineering & Science (5 | 3.9%), Architecture & Engineering (5 | 3.9%), Community & Social Service (5 | 3.9%), and Education Instruction & Library (5 | 3.9%).
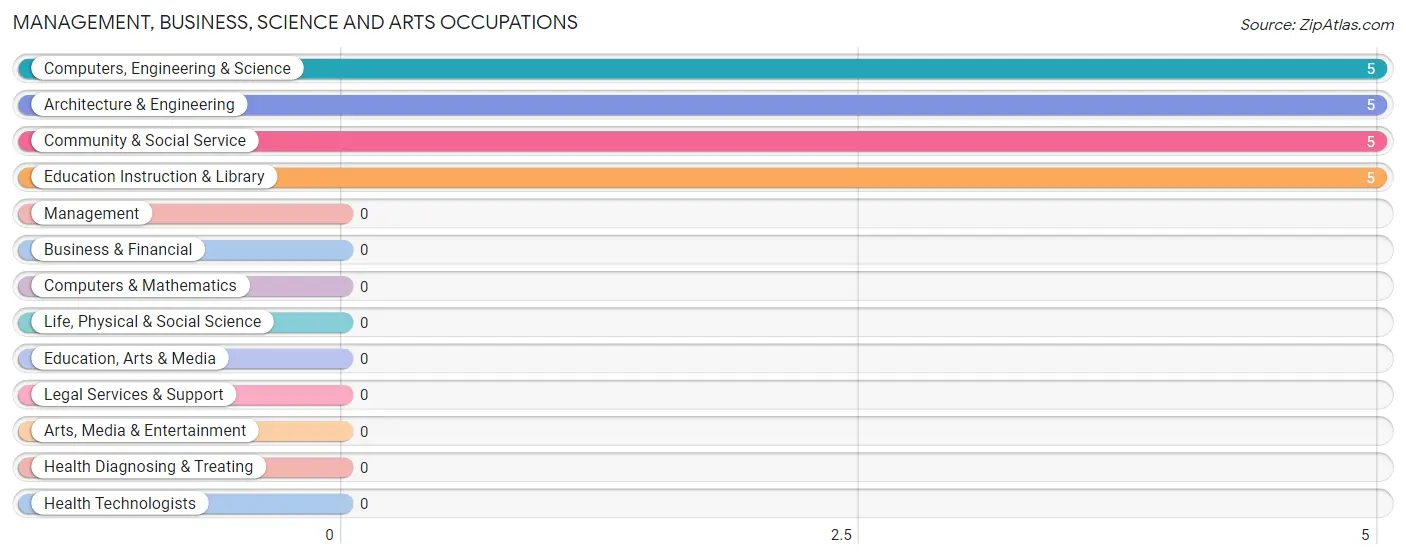
Management, Business, Science and Arts Occupations by Sex
Within the Management, Business, Science and Arts occupations in Hundred, the most male-oriented occupations are Computers, Engineering & Science (100.0%), Architecture & Engineering (100.0%), and Community & Social Service (40.0%), while the most female-oriented occupations are Community & Social Service (60.0%), and Education Instruction & Library (60.0%).
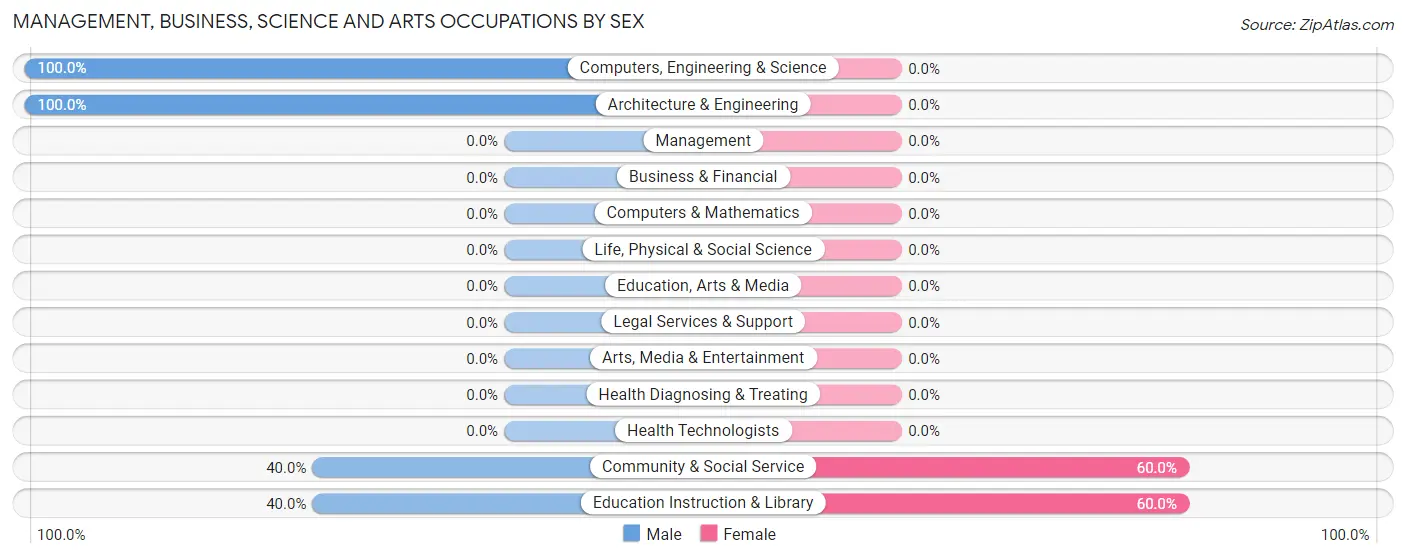
| Occupation | Male | Female |
| Management | 0 (0.0%) | 0 (0.0%) |
| Business & Financial | 0 (0.0%) | 0 (0.0%) |
| Computers, Engineering & Science | 5 (100.0%) | 0 (0.0%) |
| Computers & Mathematics | 0 (0.0%) | 0 (0.0%) |
| Architecture & Engineering | 5 (100.0%) | 0 (0.0%) |
| Life, Physical & Social Science | 0 (0.0%) | 0 (0.0%) |
| Community & Social Service | 2 (40.0%) | 3 (60.0%) |
| Education, Arts & Media | 0 (0.0%) | 0 (0.0%) |
| Legal Services & Support | 0 (0.0%) | 0 (0.0%) |
| Education Instruction & Library | 2 (40.0%) | 3 (60.0%) |
| Arts, Media & Entertainment | 0 (0.0%) | 0 (0.0%) |
| Health Diagnosing & Treating | 0 (0.0%) | 0 (0.0%) |
| Health Technologists | 0 (0.0%) | 0 (0.0%) |
| Total (Category) | 7 (70.0%) | 3 (30.0%) |
| Total (Overall) | 53 (41.1%) | 76 (58.9%) |
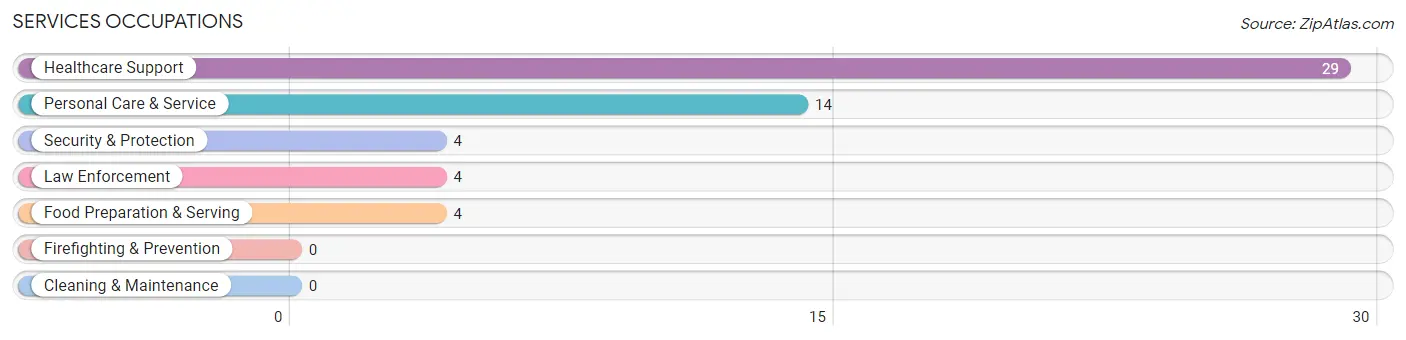
Services Occupations
The most common Services occupations in Hundred are Healthcare Support (29 | 22.5%), Personal Care & Service (14 | 10.8%), Security & Protection (4 | 3.1%), Law Enforcement (4 | 3.1%), and Food Preparation & Serving (4 | 3.1%).
Services Occupations by Sex
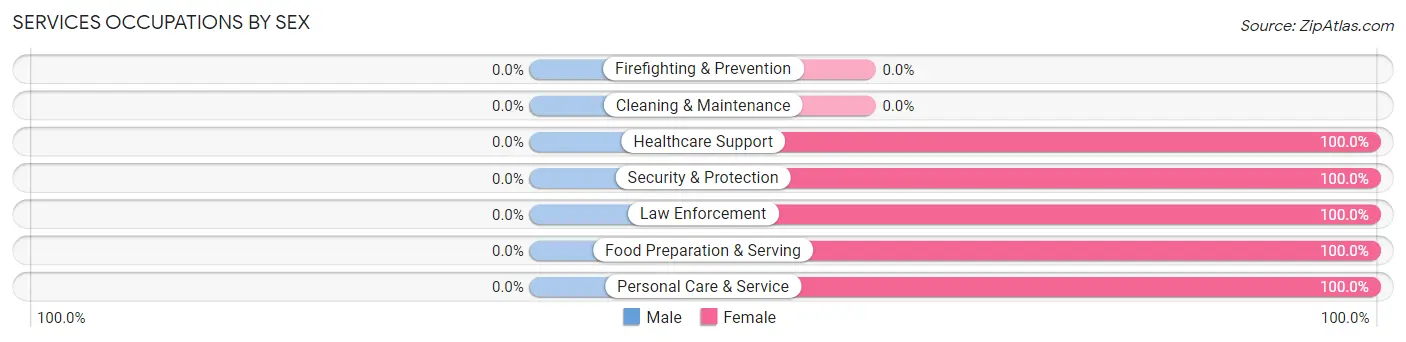
| Occupation | Male | Female |
| Healthcare Support | 0 (0.0%) | 29 (100.0%) |
| Security & Protection | 0 (0.0%) | 4 (100.0%) |
| Firefighting & Prevention | 0 (0.0%) | 0 (0.0%) |
| Law Enforcement | 0 (0.0%) | 4 (100.0%) |
| Food Preparation & Serving | 0 (0.0%) | 4 (100.0%) |
| Cleaning & Maintenance | 0 (0.0%) | 0 (0.0%) |
| Personal Care & Service | 0 (0.0%) | 14 (100.0%) |
| Total (Category) | 0 (0.0%) | 51 (100.0%) |
| Total (Overall) | 53 (41.1%) | 76 (58.9%) |
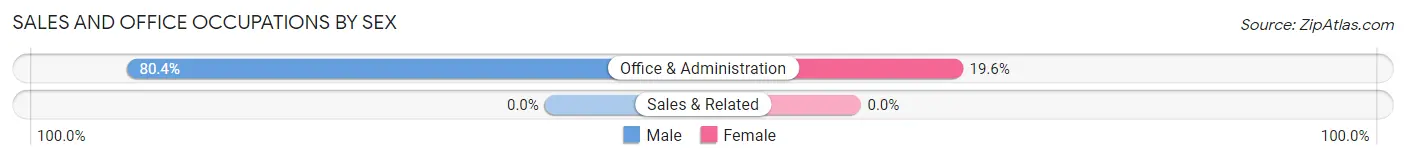
Sales and Office Occupations
The most common Sales and Office occupations in Hundred are , and Office & Administration (51 | 39.5%).
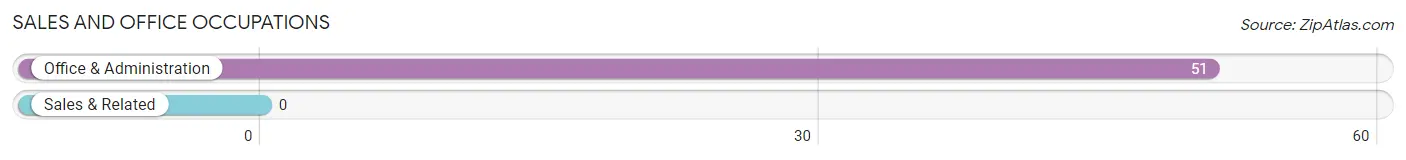
Sales and Office Occupations by Sex
| Occupation | Male | Female |
| Sales & Related | 0 (0.0%) | 0 (0.0%) |
| Office & Administration | 41 (80.4%) | 10 (19.6%) |
| Total (Category) | 41 (80.4%) | 10 (19.6%) |
| Total (Overall) | 53 (41.1%) | 76 (58.9%) |
Natural Resources, Construction and Maintenance Occupations
The most common Natural Resources, Construction and Maintenance occupations in Hundred are , and Construction & Extraction (5 | 3.9%).
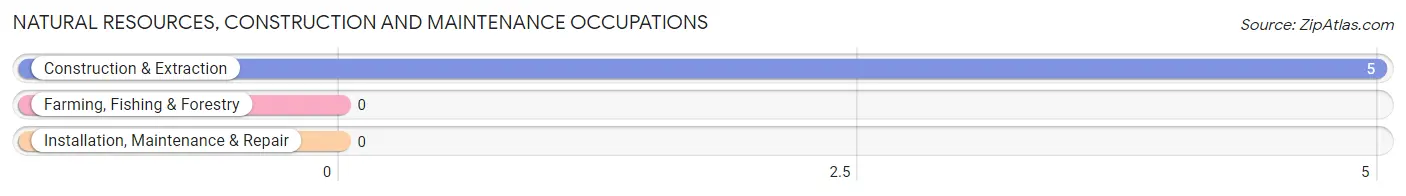
Natural Resources, Construction and Maintenance Occupations by Sex
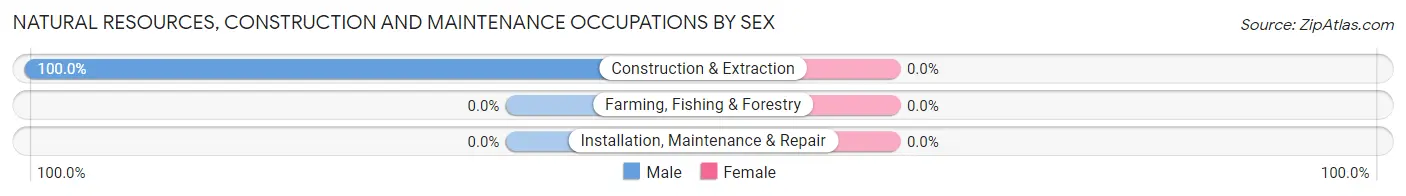
| Occupation | Male | Female |
| Farming, Fishing & Forestry | 0 (0.0%) | 0 (0.0%) |
| Construction & Extraction | 5 (100.0%) | 0 (0.0%) |
| Installation, Maintenance & Repair | 0 (0.0%) | 0 (0.0%) |
| Total (Category) | 5 (100.0%) | 0 (0.0%) |
| Total (Overall) | 53 (41.1%) | 76 (58.9%) |
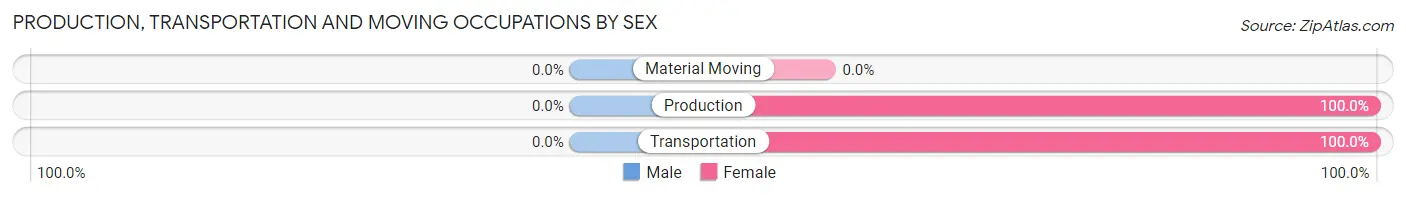
Production, Transportation and Moving Occupations
The most common Production, Transportation and Moving occupations in Hundred are Production (10 | 7.7%), and Transportation (2 | 1.5%).
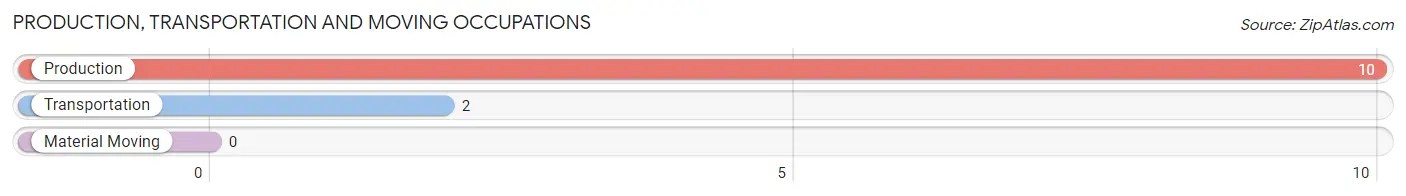
Production, Transportation and Moving Occupations by Sex
| Occupation | Male | Female |
| Production | 0 (0.0%) | 10 (100.0%) |
| Transportation | 0 (0.0%) | 2 (100.0%) |
| Material Moving | 0 (0.0%) | 0 (0.0%) |
| Total (Category) | 0 (0.0%) | 12 (100.0%) |
| Total (Overall) | 53 (41.1%) | 76 (58.9%) |
Employment Industries by Sex in Hundred
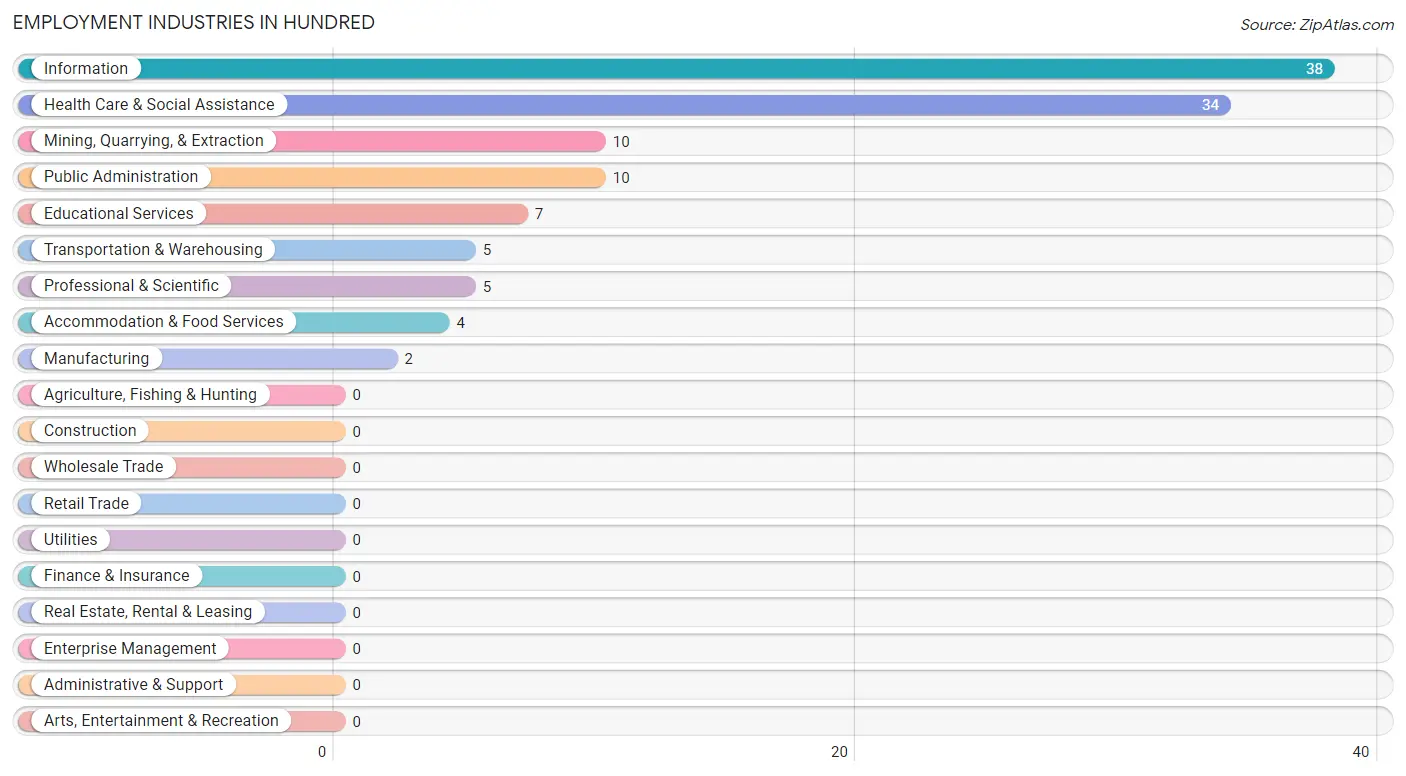
Employment Industries in Hundred
The major employment industries in Hundred include Information (38 | 29.5%), Health Care & Social Assistance (34 | 26.4%), Mining, Quarrying, & Extraction (10 | 7.7%), Public Administration (10 | 7.7%), and Educational Services (7 | 5.4%).
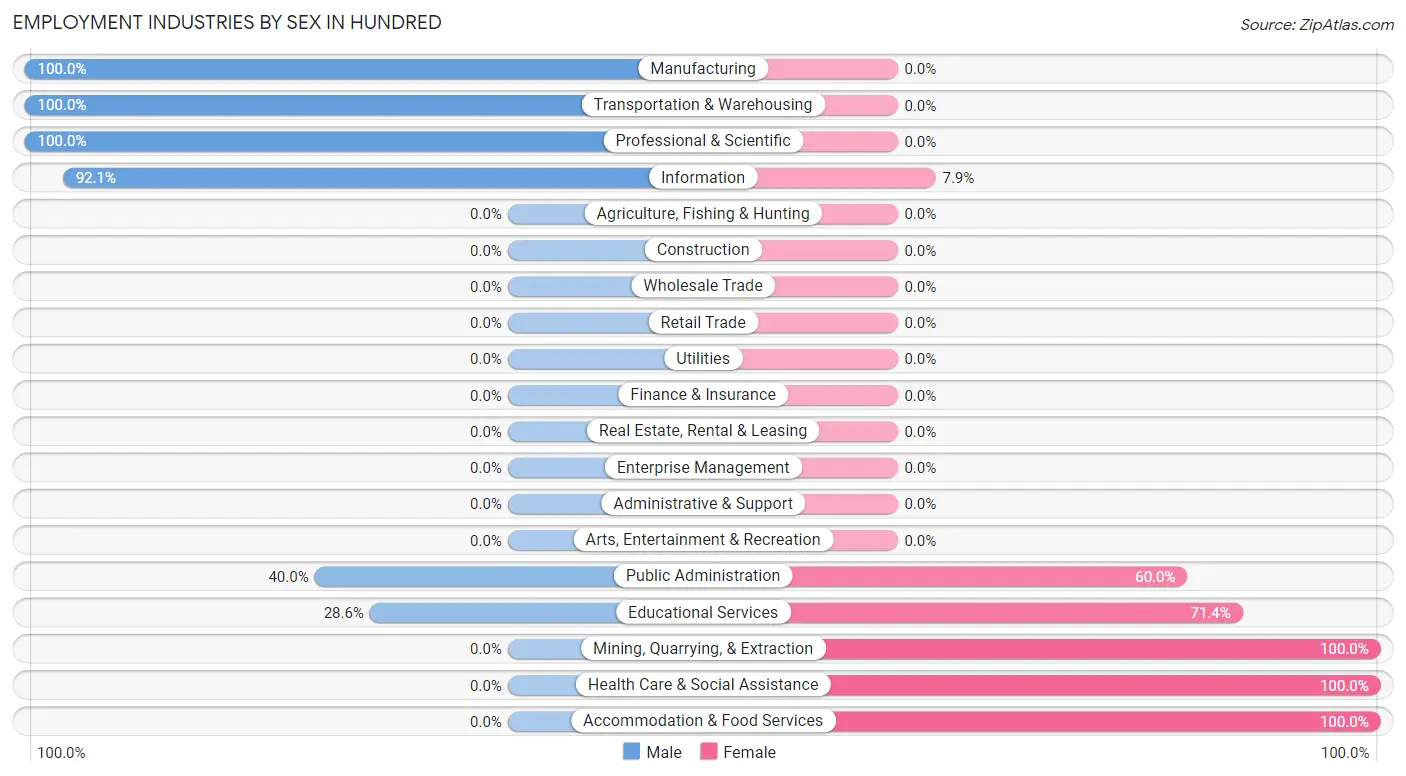
Employment Industries by Sex in Hundred
The Hundred industries that see more men than women are Manufacturing (100.0%), Transportation & Warehousing (100.0%), and Professional & Scientific (100.0%), whereas the industries that tend to have a higher number of women are Mining, Quarrying, & Extraction (100.0%), Health Care & Social Assistance (100.0%), and Accommodation & Food Services (100.0%).
| Industry | Male | Female |
| Agriculture, Fishing & Hunting | 0 (0.0%) | 0 (0.0%) |
| Mining, Quarrying, & Extraction | 0 (0.0%) | 10 (100.0%) |
| Construction | 0 (0.0%) | 0 (0.0%) |
| Manufacturing | 2 (100.0%) | 0 (0.0%) |
| Wholesale Trade | 0 (0.0%) | 0 (0.0%) |
| Retail Trade | 0 (0.0%) | 0 (0.0%) |
| Transportation & Warehousing | 5 (100.0%) | 0 (0.0%) |
| Utilities | 0 (0.0%) | 0 (0.0%) |
| Information | 35 (92.1%) | 3 (7.9%) |
| Finance & Insurance | 0 (0.0%) | 0 (0.0%) |
| Real Estate, Rental & Leasing | 0 (0.0%) | 0 (0.0%) |
| Professional & Scientific | 5 (100.0%) | 0 (0.0%) |
| Enterprise Management | 0 (0.0%) | 0 (0.0%) |
| Administrative & Support | 0 (0.0%) | 0 (0.0%) |
| Educational Services | 2 (28.6%) | 5 (71.4%) |
| Health Care & Social Assistance | 0 (0.0%) | 34 (100.0%) |
| Arts, Entertainment & Recreation | 0 (0.0%) | 0 (0.0%) |
| Accommodation & Food Services | 0 (0.0%) | 4 (100.0%) |
| Public Administration | 4 (40.0%) | 6 (60.0%) |
| Total | 53 (41.1%) | 76 (58.9%) |
Education in Hundred
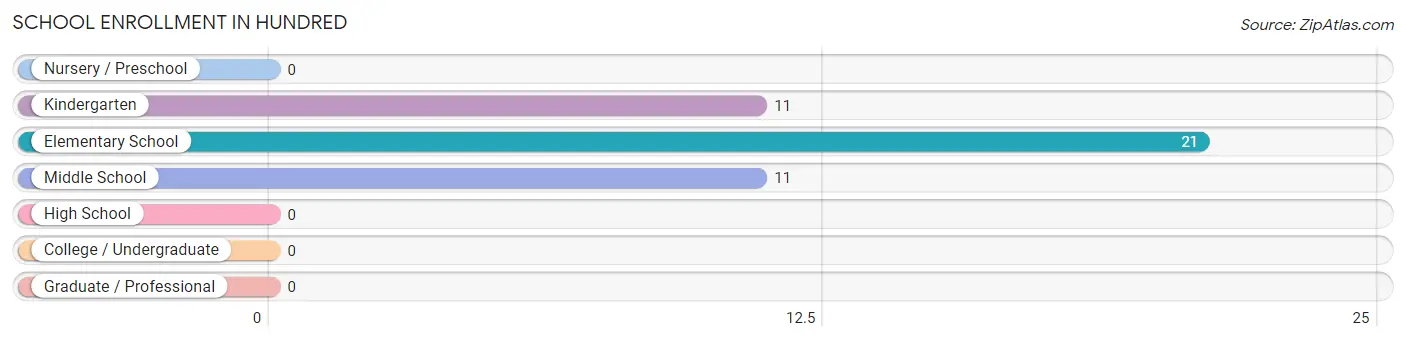
School Enrollment in Hundred
The most common levels of schooling among the 43 students in Hundred are elementary school (21 | 48.8%), kindergarten (11 | 25.6%), and middle school (11 | 25.6%).
| School Level | # Students | % Students |
| Nursery / Preschool | 0 | 0.0% |
| Kindergarten | 11 | 25.6% |
| Elementary School | 21 | 48.8% |
| Middle School | 11 | 25.6% |
| High School | 0 | 0.0% |
| College / Undergraduate | 0 | 0.0% |
| Graduate / Professional | 0 | 0.0% |
| Total | 43 | 100.0% |
School Enrollment by Age by Funding Source in Hundred
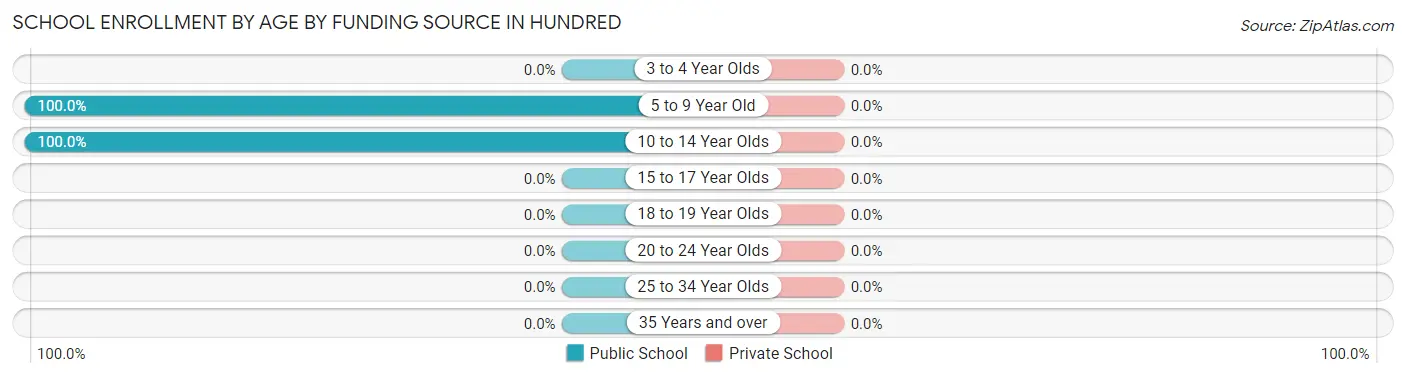
| Age Bracket | Public School | Private School |
| 3 to 4 Year Olds | 0 (0.0%) | 0 (0.0%) |
| 5 to 9 Year Old | 32 (100.0%) | 0 (0.0%) |
| 10 to 14 Year Olds | 11 (100.0%) | 0 (0.0%) |
| 15 to 17 Year Olds | 0 (0.0%) | 0 (0.0%) |
| 18 to 19 Year Olds | 0 (0.0%) | 0 (0.0%) |
| 20 to 24 Year Olds | 0 (0.0%) | 0 (0.0%) |
| 25 to 34 Year Olds | 0 (0.0%) | 0 (0.0%) |
| 35 Years and over | 0 (0.0%) | 0 (0.0%) |
| Total | 43 (100.0%) | 0 (0.0%) |
Educational Attainment by Field of Study in Hundred
Science & technology (28 | 53.8%), education (19 | 36.5%), engineering (3 | 5.8%), psychology (1 | 1.9%), and arts & humanities (1 | 1.9%) are the most common fields of study among 52 individuals in Hundred who have obtained a bachelor's degree or higher.
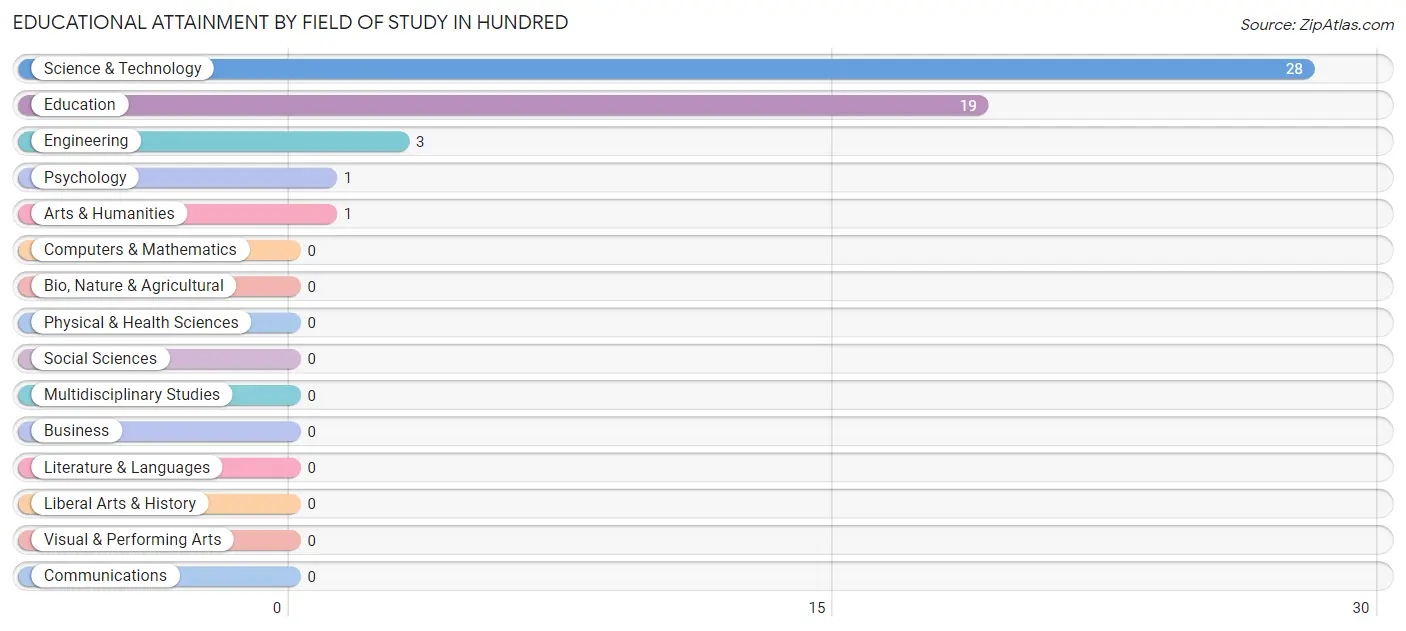
| Field of Study | # Graduates | % Graduates |
| Computers & Mathematics | 0 | 0.0% |
| Bio, Nature & Agricultural | 0 | 0.0% |
| Physical & Health Sciences | 0 | 0.0% |
| Psychology | 1 | 1.9% |
| Social Sciences | 0 | 0.0% |
| Engineering | 3 | 5.8% |
| Multidisciplinary Studies | 0 | 0.0% |
| Science & Technology | 28 | 53.8% |
| Business | 0 | 0.0% |
| Education | 19 | 36.5% |
| Literature & Languages | 0 | 0.0% |
| Liberal Arts & History | 0 | 0.0% |
| Visual & Performing Arts | 0 | 0.0% |
| Communications | 0 | 0.0% |
| Arts & Humanities | 1 | 1.9% |
| Total | 52 | 100.0% |
Transportation & Commute in Hundred
Vehicle Availability by Sex in Hundred
The most prevalent vehicle ownership categories in Hundred are males with 2 vehicles (47, accounting for 88.7%) and females with 2 vehicles (40, making up 61.8%).
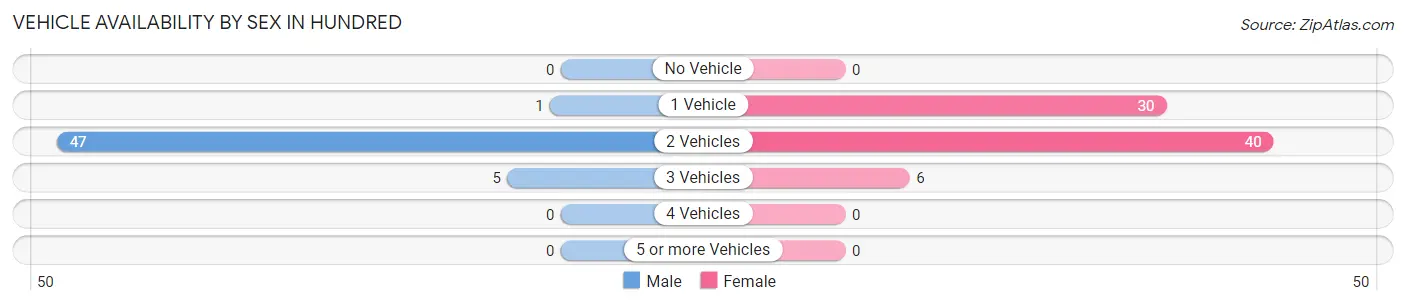
| Vehicles Available | Male | Female |
| No Vehicle | 0 (0.0%) | 0 (0.0%) |
| 1 Vehicle | 1 (1.9%) | 30 (39.5%) |
| 2 Vehicles | 47 (88.7%) | 40 (52.6%) |
| 3 Vehicles | 5 (9.4%) | 6 (7.9%) |
| 4 Vehicles | 0 (0.0%) | 0 (0.0%) |
| 5 or more Vehicles | 0 (0.0%) | 0 (0.0%) |
| Total | 53 (100.0%) | 76 (100.0%) |
Commute Time in Hundred
The most frequently occuring commute durations in Hundred are 45 to 59 minutes (68 commuters, 52.7%), 30 to 34 minutes (17 commuters, 13.2%), and less than 5 minutes (13 commuters, 10.1%).
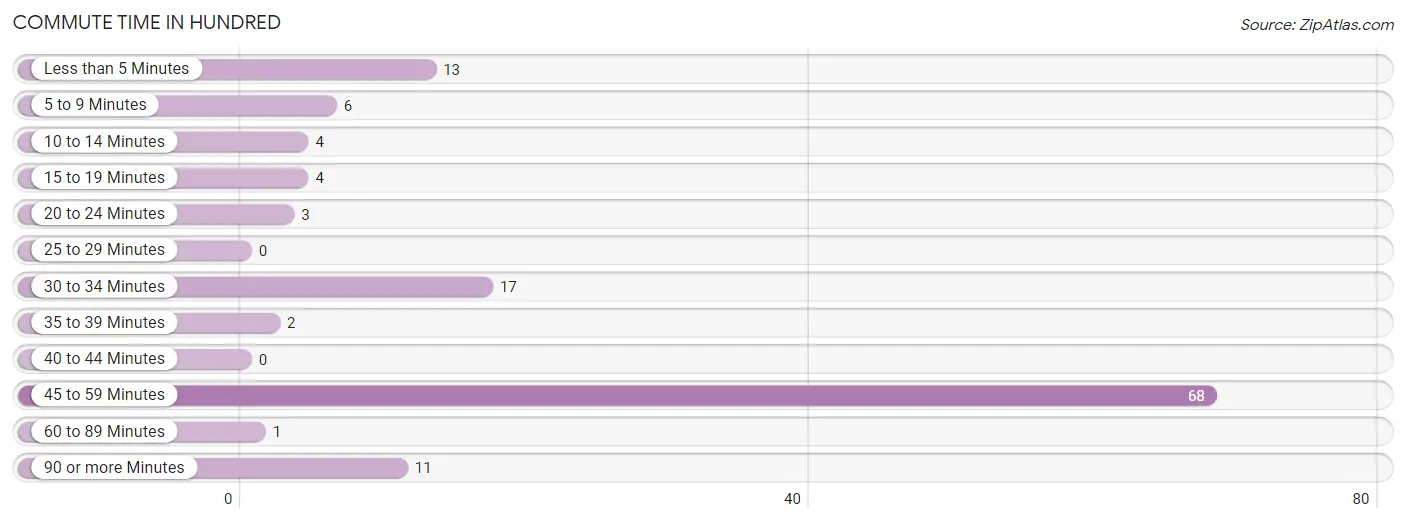
| Commute Time | # Commuters | % Commuters |
| Less than 5 Minutes | 13 | 10.1% |
| 5 to 9 Minutes | 6 | 4.6% |
| 10 to 14 Minutes | 4 | 3.1% |
| 15 to 19 Minutes | 4 | 3.1% |
| 20 to 24 Minutes | 3 | 2.3% |
| 25 to 29 Minutes | 0 | 0.0% |
| 30 to 34 Minutes | 17 | 13.2% |
| 35 to 39 Minutes | 2 | 1.5% |
| 40 to 44 Minutes | 0 | 0.0% |
| 45 to 59 Minutes | 68 | 52.7% |
| 60 to 89 Minutes | 1 | 0.8% |
| 90 or more Minutes | 11 | 8.5% |
Commute Time by Sex in Hundred
The most common commute times in Hundred are 45 to 59 minutes (35 commuters, 66.0%) for males and 45 to 59 minutes (33 commuters, 43.4%) for females.
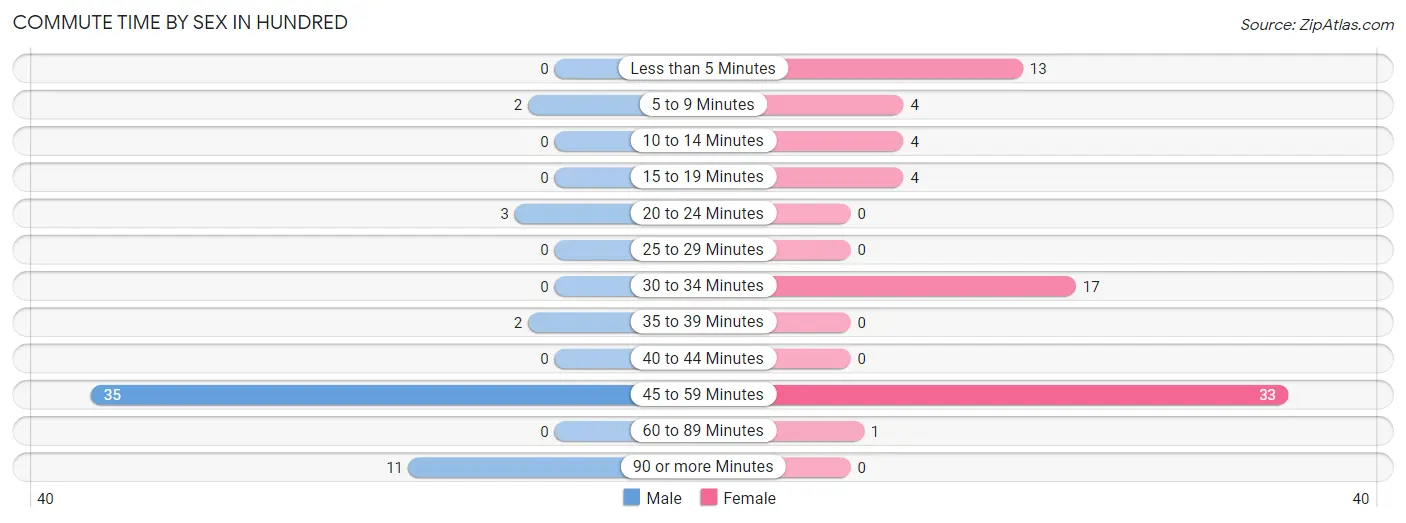
| Commute Time | Male | Female |
| Less than 5 Minutes | 0 (0.0%) | 13 (17.1%) |
| 5 to 9 Minutes | 2 (3.8%) | 4 (5.3%) |
| 10 to 14 Minutes | 0 (0.0%) | 4 (5.3%) |
| 15 to 19 Minutes | 0 (0.0%) | 4 (5.3%) |
| 20 to 24 Minutes | 3 (5.7%) | 0 (0.0%) |
| 25 to 29 Minutes | 0 (0.0%) | 0 (0.0%) |
| 30 to 34 Minutes | 0 (0.0%) | 17 (22.4%) |
| 35 to 39 Minutes | 2 (3.8%) | 0 (0.0%) |
| 40 to 44 Minutes | 0 (0.0%) | 0 (0.0%) |
| 45 to 59 Minutes | 35 (66.0%) | 33 (43.4%) |
| 60 to 89 Minutes | 0 (0.0%) | 1 (1.3%) |
| 90 or more Minutes | 11 (20.7%) | 0 (0.0%) |
Time of Departure to Work by Sex in Hundred
The most frequent times of departure to work in Hundred are 9:00 AM to 9:59 AM (35, 66.0%) for males and 7:00 AM to 7:29 AM (41, 53.9%) for females.
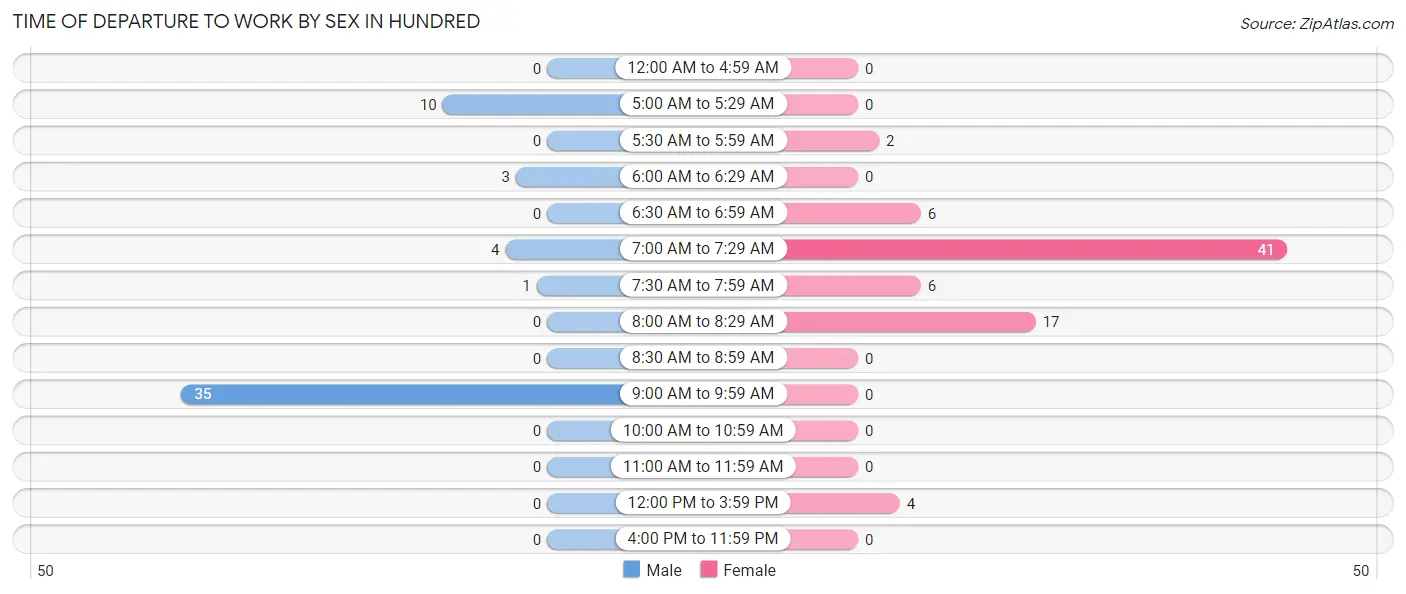
| Time of Departure | Male | Female |
| 12:00 AM to 4:59 AM | 0 (0.0%) | 0 (0.0%) |
| 5:00 AM to 5:29 AM | 10 (18.9%) | 0 (0.0%) |
| 5:30 AM to 5:59 AM | 0 (0.0%) | 2 (2.6%) |
| 6:00 AM to 6:29 AM | 3 (5.7%) | 0 (0.0%) |
| 6:30 AM to 6:59 AM | 0 (0.0%) | 6 (7.9%) |
| 7:00 AM to 7:29 AM | 4 (7.5%) | 41 (53.9%) |
| 7:30 AM to 7:59 AM | 1 (1.9%) | 6 (7.9%) |
| 8:00 AM to 8:29 AM | 0 (0.0%) | 17 (22.4%) |
| 8:30 AM to 8:59 AM | 0 (0.0%) | 0 (0.0%) |
| 9:00 AM to 9:59 AM | 35 (66.0%) | 0 (0.0%) |
| 10:00 AM to 10:59 AM | 0 (0.0%) | 0 (0.0%) |
| 11:00 AM to 11:59 AM | 0 (0.0%) | 0 (0.0%) |
| 12:00 PM to 3:59 PM | 0 (0.0%) | 4 (5.3%) |
| 4:00 PM to 11:59 PM | 0 (0.0%) | 0 (0.0%) |
| Total | 53 (100.0%) | 76 (100.0%) |
Housing Occupancy in Hundred
Occupancy by Ownership in Hundred
Of the total 188 dwellings in Hundred, owner-occupied units account for 145 (77.1%), while renter-occupied units make up 43 (22.9%).
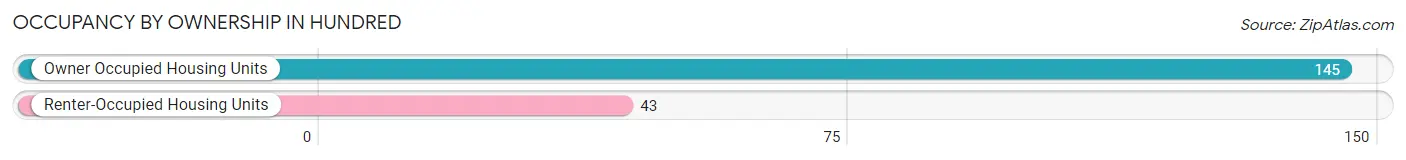
| Occupancy | # Housing Units | % Housing Units |
| Owner Occupied Housing Units | 145 | 77.1% |
| Renter-Occupied Housing Units | 43 | 22.9% |
| Total Occupied Housing Units | 188 | 100.0% |
Occupancy by Household Size in Hundred
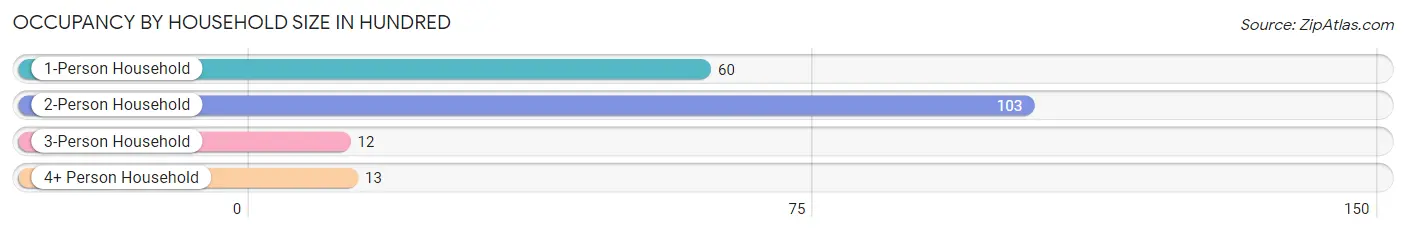
| Household Size | # Housing Units | % Housing Units |
| 1-Person Household | 60 | 31.9% |
| 2-Person Household | 103 | 54.8% |
| 3-Person Household | 12 | 6.4% |
| 4+ Person Household | 13 | 6.9% |
| Total Housing Units | 188 | 100.0% |
Occupancy by Ownership by Household Size in Hundred
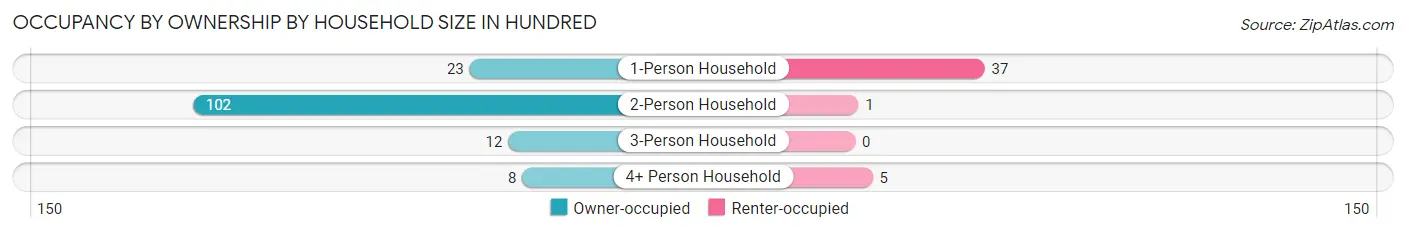
| Household Size | Owner-occupied | Renter-occupied |
| 1-Person Household | 23 (38.3%) | 37 (61.7%) |
| 2-Person Household | 102 (99.0%) | 1 (1.0%) |
| 3-Person Household | 12 (100.0%) | 0 (0.0%) |
| 4+ Person Household | 8 (61.5%) | 5 (38.5%) |
| Total Housing Units | 145 (77.1%) | 43 (22.9%) |
Occupancy by Educational Attainment in Hundred
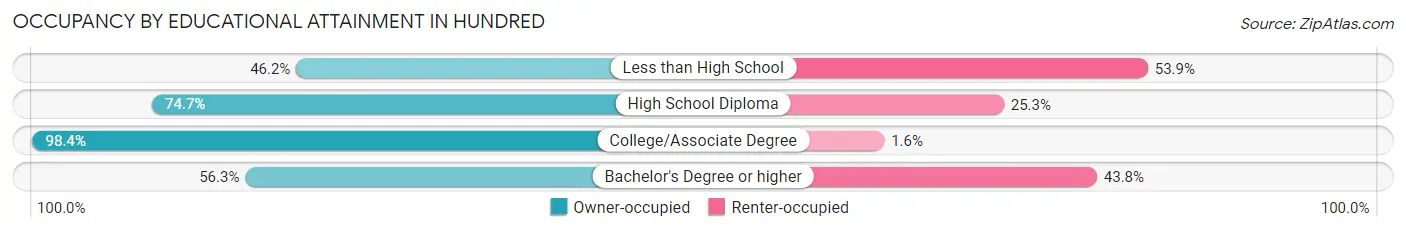
| Household Size | Owner-occupied | Renter-occupied |
| Less than High School | 12 (46.2%) | 14 (53.8%) |
| High School Diploma | 62 (74.7%) | 21 (25.3%) |
| College/Associate Degree | 62 (98.4%) | 1 (1.6%) |
| Bachelor's Degree or higher | 9 (56.2%) | 7 (43.8%) |
Occupancy by Age of Householder in Hundred
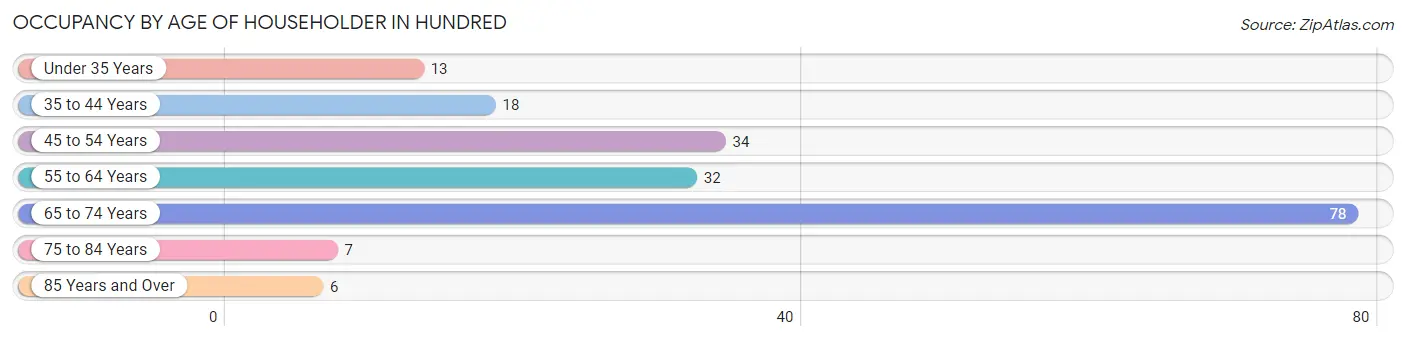
| Age Bracket | # Households | % Households |
| Under 35 Years | 13 | 6.9% |
| 35 to 44 Years | 18 | 9.6% |
| 45 to 54 Years | 34 | 18.1% |
| 55 to 64 Years | 32 | 17.0% |
| 65 to 74 Years | 78 | 41.5% |
| 75 to 84 Years | 7 | 3.7% |
| 85 Years and Over | 6 | 3.2% |
| Total | 188 | 100.0% |
Housing Finances in Hundred
Median Income by Occupancy in Hundred
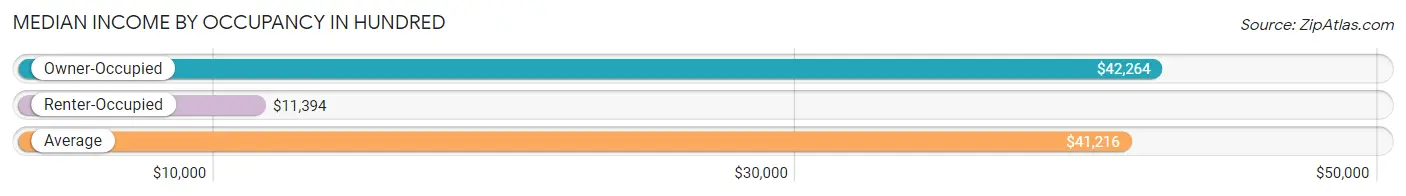
| Occupancy Type | # Households | Median Income |
| Owner-Occupied | 145 (77.1%) | $42,264 |
| Renter-Occupied | 43 (22.9%) | $11,394 |
| Average | 188 (100.0%) | $41,216 |
Occupancy by Householder Income Bracket in Hundred
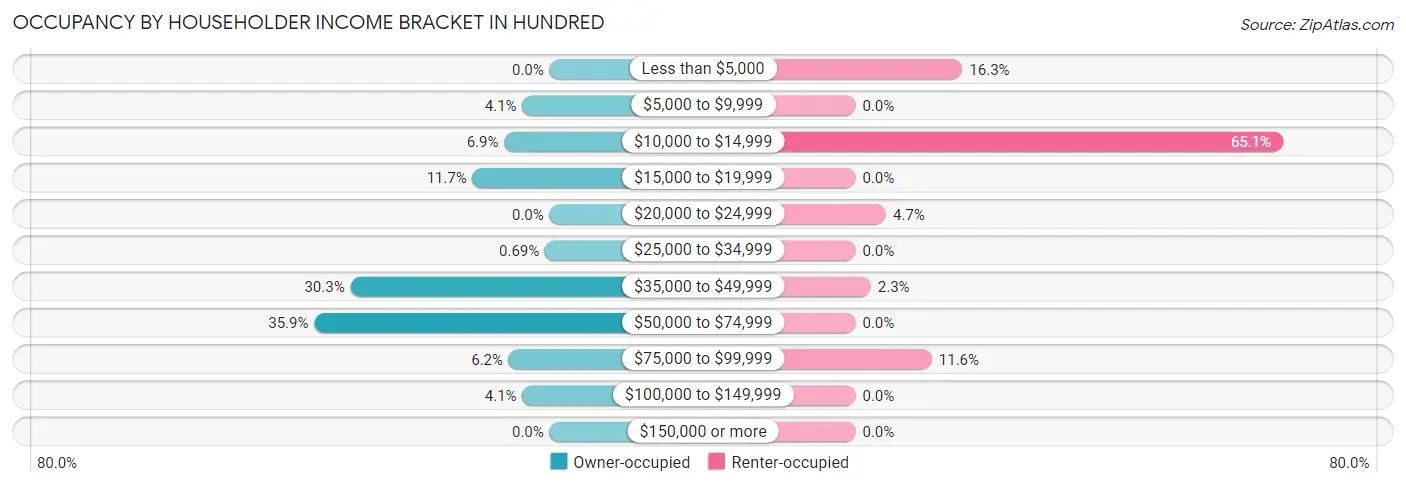
| Income Bracket | Owner-occupied | Renter-occupied |
| Less than $5,000 | 0 (0.0%) | 7 (16.3%) |
| $5,000 to $9,999 | 6 (4.1%) | 0 (0.0%) |
| $10,000 to $14,999 | 10 (6.9%) | 28 (65.1%) |
| $15,000 to $19,999 | 17 (11.7%) | 0 (0.0%) |
| $20,000 to $24,999 | 0 (0.0%) | 2 (4.6%) |
| $25,000 to $34,999 | 1 (0.7%) | 0 (0.0%) |
| $35,000 to $49,999 | 44 (30.3%) | 1 (2.3%) |
| $50,000 to $74,999 | 52 (35.9%) | 0 (0.0%) |
| $75,000 to $99,999 | 9 (6.2%) | 5 (11.6%) |
| $100,000 to $149,999 | 6 (4.1%) | 0 (0.0%) |
| $150,000 or more | 0 (0.0%) | 0 (0.0%) |
| Total | 145 (100.0%) | 43 (100.0%) |
Monthly Housing Cost Tiers in Hundred
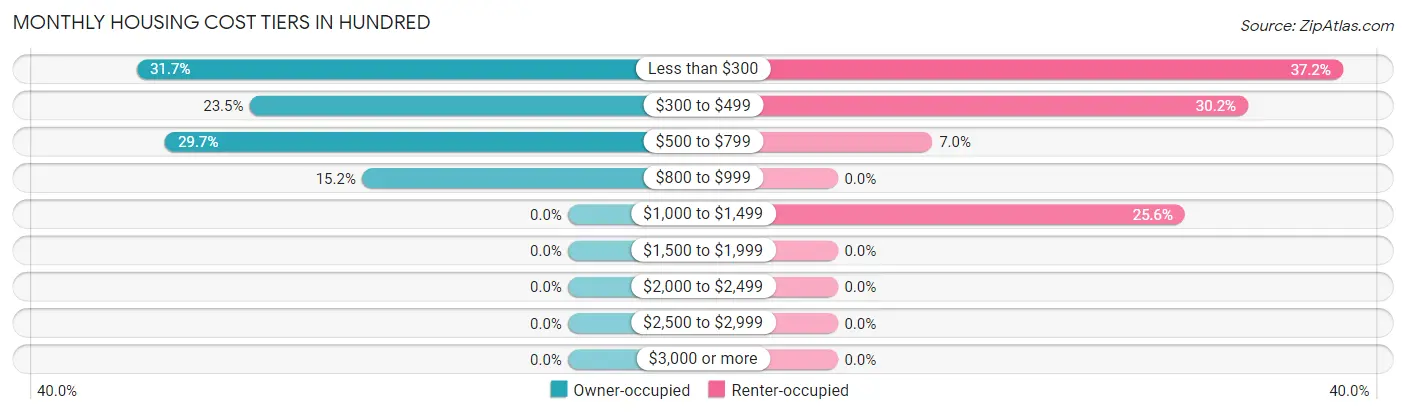
| Monthly Cost | Owner-occupied | Renter-occupied |
| Less than $300 | 46 (31.7%) | 16 (37.2%) |
| $300 to $499 | 34 (23.4%) | 13 (30.2%) |
| $500 to $799 | 43 (29.7%) | 3 (7.0%) |
| $800 to $999 | 22 (15.2%) | 0 (0.0%) |
| $1,000 to $1,499 | 0 (0.0%) | 11 (25.6%) |
| $1,500 to $1,999 | 0 (0.0%) | 0 (0.0%) |
| $2,000 to $2,499 | 0 (0.0%) | 0 (0.0%) |
| $2,500 to $2,999 | 0 (0.0%) | 0 (0.0%) |
| $3,000 or more | 0 (0.0%) | 0 (0.0%) |
| Total | 145 (100.0%) | 43 (100.0%) |
Physical Housing Characteristics in Hundred
Housing Structures in Hundred
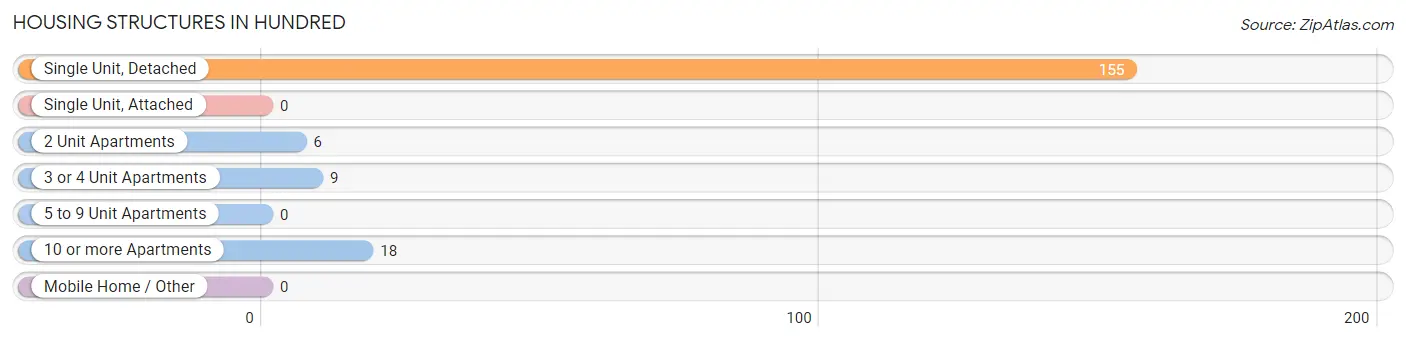
| Structure Type | # Housing Units | % Housing Units |
| Single Unit, Detached | 155 | 82.5% |
| Single Unit, Attached | 0 | 0.0% |
| 2 Unit Apartments | 6 | 3.2% |
| 3 or 4 Unit Apartments | 9 | 4.8% |
| 5 to 9 Unit Apartments | 0 | 0.0% |
| 10 or more Apartments | 18 | 9.6% |
| Mobile Home / Other | 0 | 0.0% |
| Total | 188 | 100.0% |
Housing Structures by Occupancy in Hundred
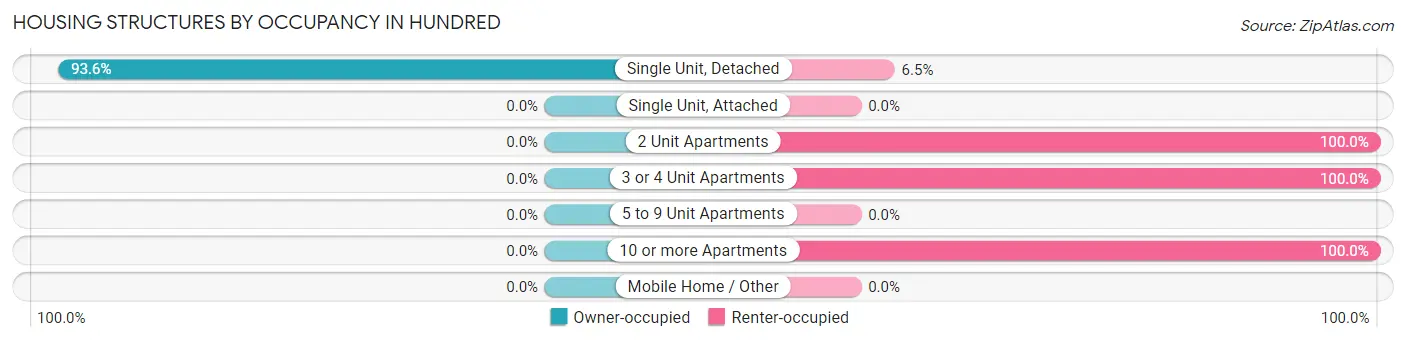
| Structure Type | Owner-occupied | Renter-occupied |
| Single Unit, Detached | 145 (93.5%) | 10 (6.5%) |
| Single Unit, Attached | 0 (0.0%) | 0 (0.0%) |
| 2 Unit Apartments | 0 (0.0%) | 6 (100.0%) |
| 3 or 4 Unit Apartments | 0 (0.0%) | 9 (100.0%) |
| 5 to 9 Unit Apartments | 0 (0.0%) | 0 (0.0%) |
| 10 or more Apartments | 0 (0.0%) | 18 (100.0%) |
| Mobile Home / Other | 0 (0.0%) | 0 (0.0%) |
| Total | 145 (77.1%) | 43 (22.9%) |
Housing Structures by Number of Rooms in Hundred
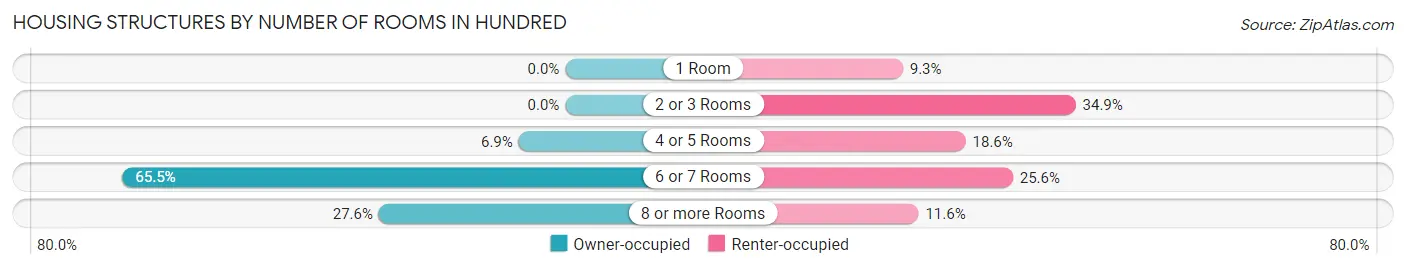
| Number of Rooms | Owner-occupied | Renter-occupied |
| 1 Room | 0 (0.0%) | 4 (9.3%) |
| 2 or 3 Rooms | 0 (0.0%) | 15 (34.9%) |
| 4 or 5 Rooms | 10 (6.9%) | 8 (18.6%) |
| 6 or 7 Rooms | 95 (65.5%) | 11 (25.6%) |
| 8 or more Rooms | 40 (27.6%) | 5 (11.6%) |
| Total | 145 (100.0%) | 43 (100.0%) |
Housing Structure by Heating Type in Hundred
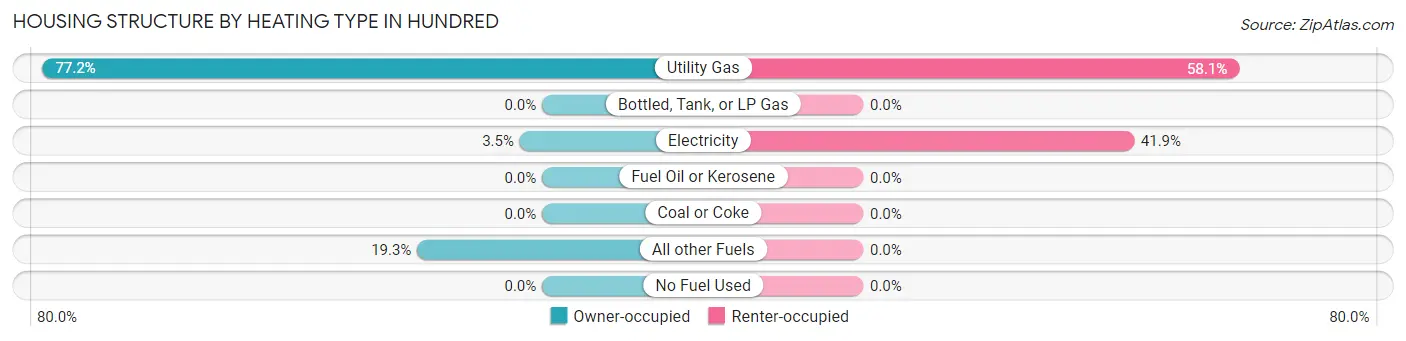
| Heating Type | Owner-occupied | Renter-occupied |
| Utility Gas | 112 (77.2%) | 25 (58.1%) |
| Bottled, Tank, or LP Gas | 0 (0.0%) | 0 (0.0%) |
| Electricity | 5 (3.5%) | 18 (41.9%) |
| Fuel Oil or Kerosene | 0 (0.0%) | 0 (0.0%) |
| Coal or Coke | 0 (0.0%) | 0 (0.0%) |
| All other Fuels | 28 (19.3%) | 0 (0.0%) |
| No Fuel Used | 0 (0.0%) | 0 (0.0%) |
| Total | 145 (100.0%) | 43 (100.0%) |
Household Vehicle Usage in Hundred
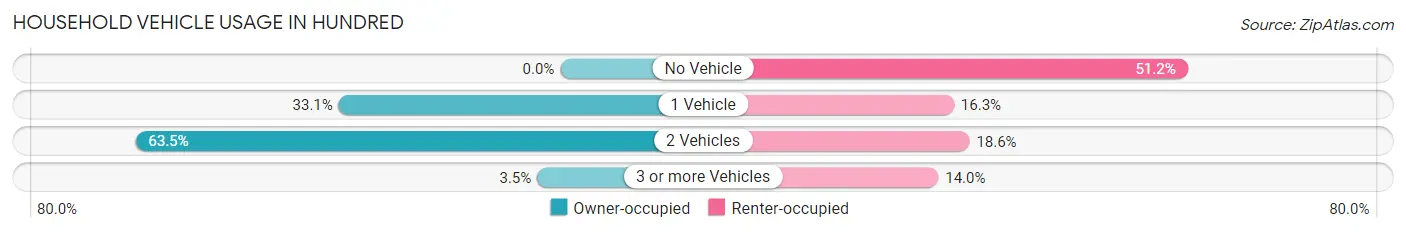
| Vehicles per Household | Owner-occupied | Renter-occupied |
| No Vehicle | 0 (0.0%) | 22 (51.2%) |
| 1 Vehicle | 48 (33.1%) | 7 (16.3%) |
| 2 Vehicles | 92 (63.4%) | 8 (18.6%) |
| 3 or more Vehicles | 5 (3.5%) | 6 (14.0%) |
| Total | 145 (100.0%) | 43 (100.0%) |
Real Estate & Mortgages in Hundred
Real Estate and Mortgage Overview in Hundred
| Characteristic | Without Mortgage | With Mortgage |
| Housing Units | 108 | 37 |
| Median Property Value | - | - |
| Median Household Income | $41,757 | $0 |
| Monthly Housing Costs | $317 | $0 |
| Real Estate Taxes | $529 | $0 |
Property Value by Mortgage Status in Hundred
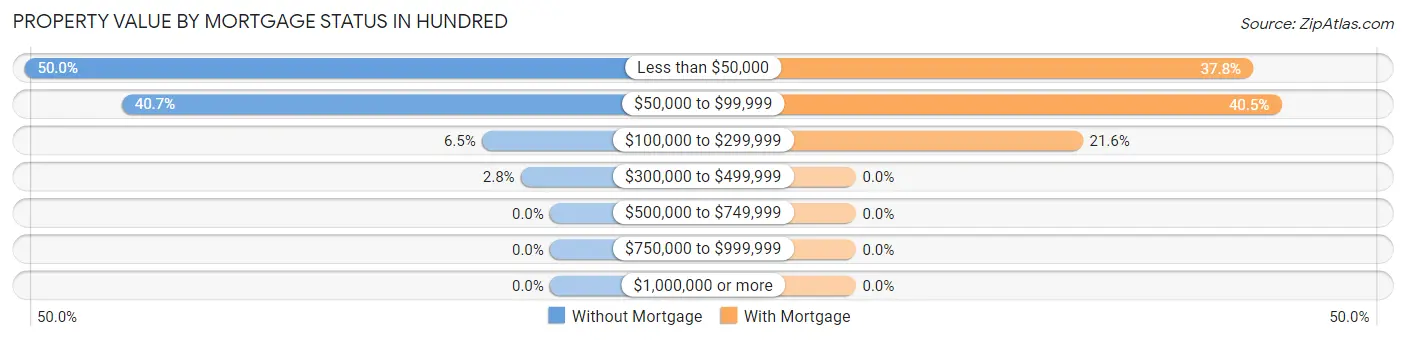
| Property Value | Without Mortgage | With Mortgage |
| Less than $50,000 | 54 (50.0%) | 14 (37.8%) |
| $50,000 to $99,999 | 44 (40.7%) | 15 (40.5%) |
| $100,000 to $299,999 | 7 (6.5%) | 8 (21.6%) |
| $300,000 to $499,999 | 3 (2.8%) | 0 (0.0%) |
| $500,000 to $749,999 | 0 (0.0%) | 0 (0.0%) |
| $750,000 to $999,999 | 0 (0.0%) | 0 (0.0%) |
| $1,000,000 or more | 0 (0.0%) | 0 (0.0%) |
| Total | 108 (100.0%) | 37 (100.0%) |
Household Income by Mortgage Status in Hundred
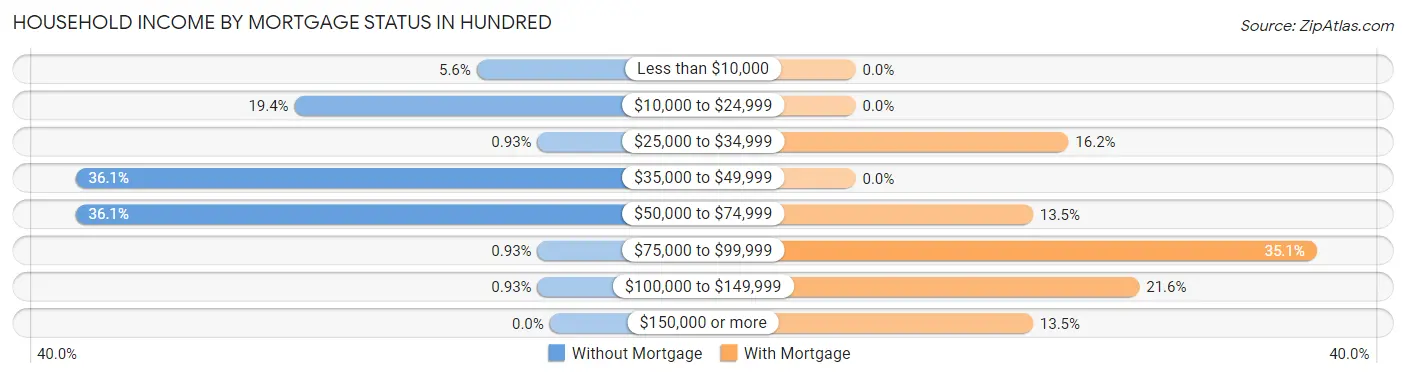
| Household Income | Without Mortgage | With Mortgage |
| Less than $10,000 | 6 (5.6%) | 0 (0.0%) |
| $10,000 to $24,999 | 21 (19.4%) | 0 (0.0%) |
| $25,000 to $34,999 | 1 (0.9%) | 6 (16.2%) |
| $35,000 to $49,999 | 39 (36.1%) | 0 (0.0%) |
| $50,000 to $74,999 | 39 (36.1%) | 5 (13.5%) |
| $75,000 to $99,999 | 1 (0.9%) | 13 (35.1%) |
| $100,000 to $149,999 | 1 (0.9%) | 8 (21.6%) |
| $150,000 or more | 0 (0.0%) | 5 (13.5%) |
| Total | 108 (100.0%) | 37 (100.0%) |
Property Value to Household Income Ratio in Hundred
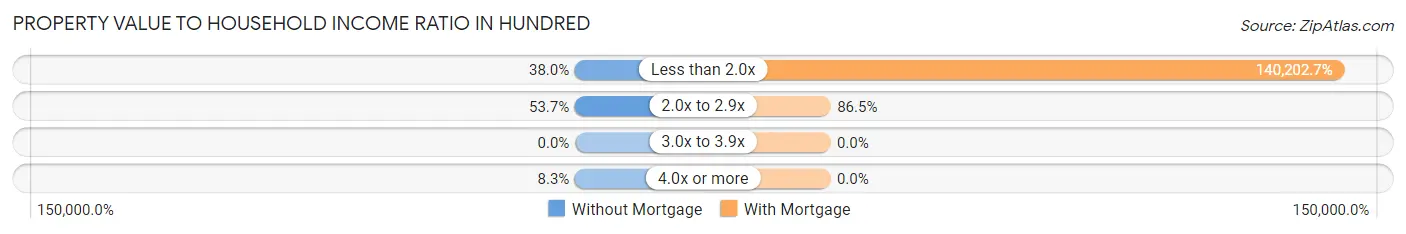
| Value-to-Income Ratio | Without Mortgage | With Mortgage |
| Less than 2.0x | 41 (38.0%) | 51,875 (140,202.7%) |
| 2.0x to 2.9x | 58 (53.7%) | 32 (86.5%) |
| 3.0x to 3.9x | 0 (0.0%) | 0 (0.0%) |
| 4.0x or more | 9 (8.3%) | 0 (0.0%) |
| Total | 108 (100.0%) | 37 (100.0%) |
Real Estate Taxes by Mortgage Status in Hundred
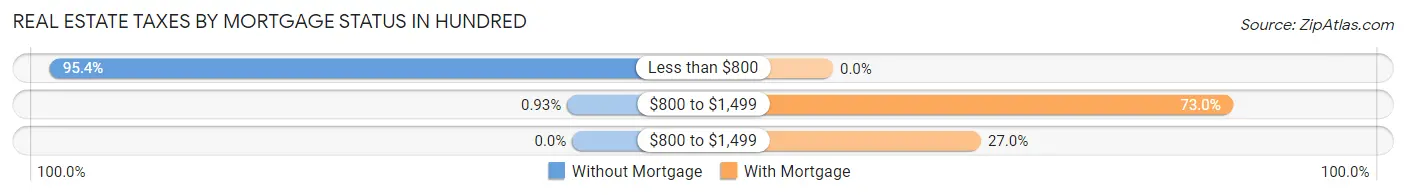
| Property Taxes | Without Mortgage | With Mortgage |
| Less than $800 | 103 (95.4%) | 0 (0.0%) |
| $800 to $1,499 | 1 (0.9%) | 27 (73.0%) |
| $800 to $1,499 | 0 (0.0%) | 10 (27.0%) |
| Total | 108 (100.0%) | 37 (100.0%) |
Health & Disability in Hundred
Health Insurance Coverage by Age in Hundred
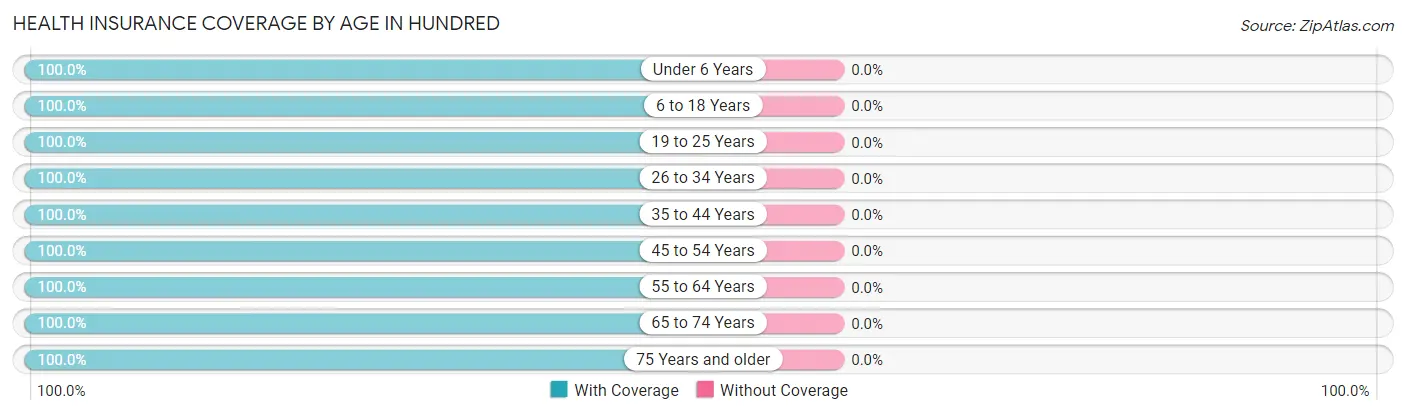
| Age Bracket | With Coverage | Without Coverage |
| Under 6 Years | 11 (100.0%) | 0 (0.0%) |
| 6 to 18 Years | 43 (100.0%) | 0 (0.0%) |
| 19 to 25 Years | 41 (100.0%) | 0 (0.0%) |
| 26 to 34 Years | 19 (100.0%) | 0 (0.0%) |
| 35 to 44 Years | 43 (100.0%) | 0 (0.0%) |
| 45 to 54 Years | 38 (100.0%) | 0 (0.0%) |
| 55 to 64 Years | 77 (100.0%) | 0 (0.0%) |
| 65 to 74 Years | 87 (100.0%) | 0 (0.0%) |
| 75 Years and older | 20 (100.0%) | 0 (0.0%) |
| Total | 379 (100.0%) | 0 (0.0%) |
Health Insurance Coverage by Citizenship Status in Hundred
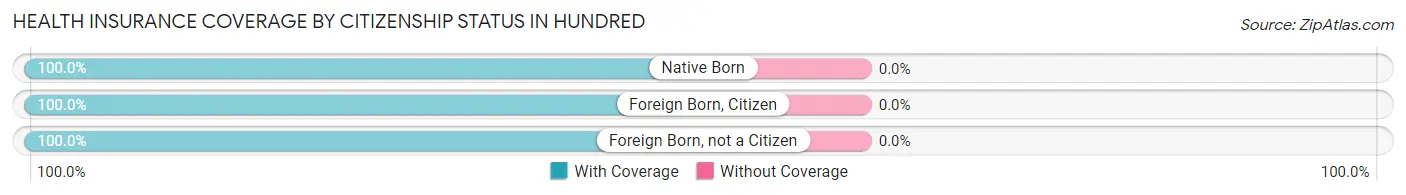
| Citizenship Status | With Coverage | Without Coverage |
| Native Born | 11 (100.0%) | 0 (0.0%) |
| Foreign Born, Citizen | 43 (100.0%) | 0 (0.0%) |
| Foreign Born, not a Citizen | 41 (100.0%) | 0 (0.0%) |
Health Insurance Coverage by Household Income in Hundred
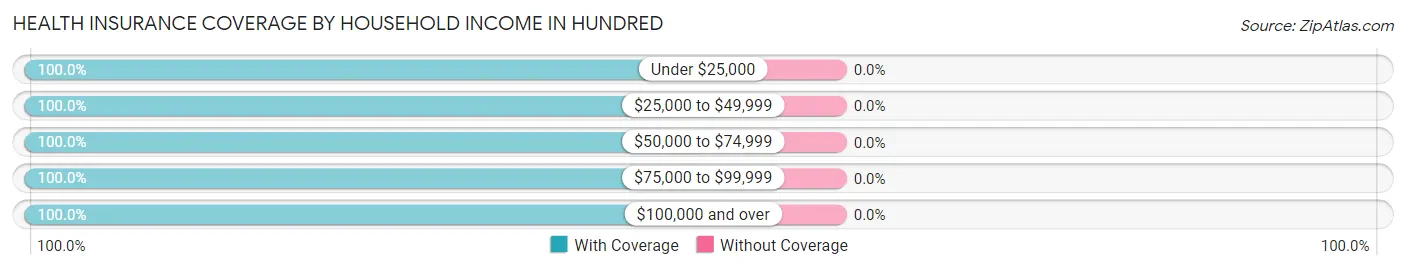
| Household Income | With Coverage | Without Coverage |
| Under $25,000 | 83 (100.0%) | 0 (0.0%) |
| $25,000 to $49,999 | 87 (100.0%) | 0 (0.0%) |
| $50,000 to $74,999 | 122 (100.0%) | 0 (0.0%) |
| $75,000 to $99,999 | 70 (100.0%) | 0 (0.0%) |
| $100,000 and over | 17 (100.0%) | 0 (0.0%) |
Public vs Private Health Insurance Coverage by Age in Hundred
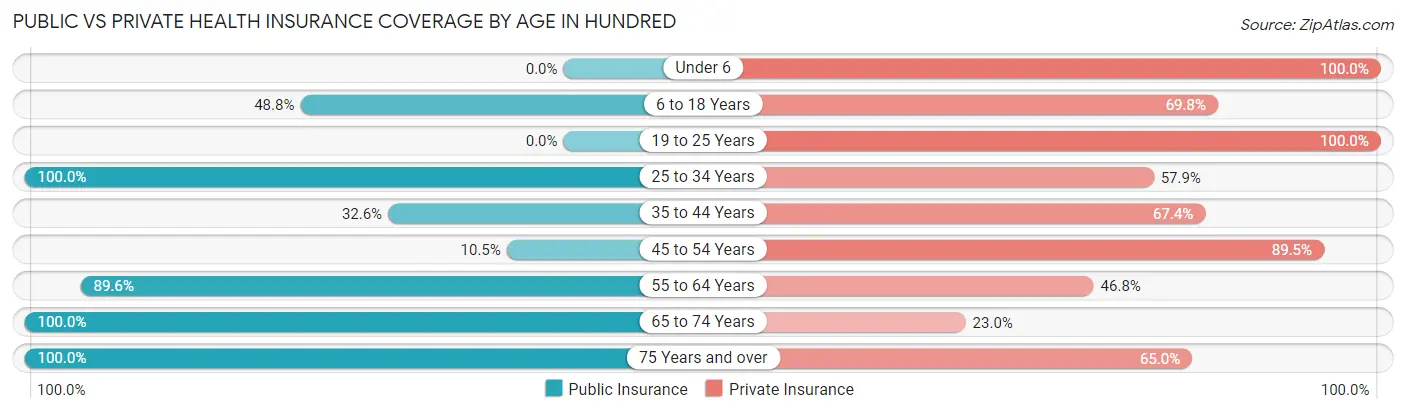
| Age Bracket | Public Insurance | Private Insurance |
| Under 6 | 0 (0.0%) | 11 (100.0%) |
| 6 to 18 Years | 21 (48.8%) | 30 (69.8%) |
| 19 to 25 Years | 0 (0.0%) | 41 (100.0%) |
| 25 to 34 Years | 19 (100.0%) | 11 (57.9%) |
| 35 to 44 Years | 14 (32.6%) | 29 (67.4%) |
| 45 to 54 Years | 4 (10.5%) | 34 (89.5%) |
| 55 to 64 Years | 69 (89.6%) | 36 (46.8%) |
| 65 to 74 Years | 87 (100.0%) | 20 (23.0%) |
| 75 Years and over | 20 (100.0%) | 13 (65.0%) |
| Total | 234 (61.7%) | 225 (59.4%) |
Disability Status by Sex by Age in Hundred
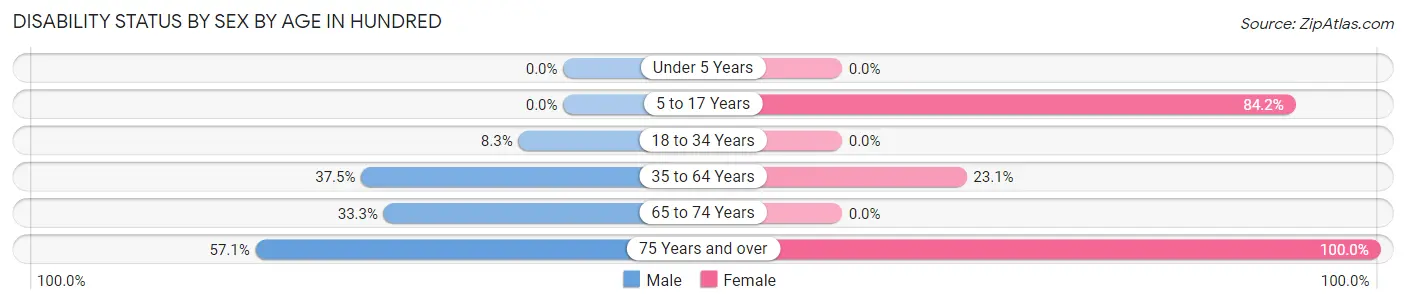
| Age Bracket | Male | Female |
| Under 5 Years | 0 (0.0%) | 0 (0.0%) |
| 5 to 17 Years | 0 (0.0%) | 16 (84.2%) |
| 18 to 34 Years | 4 (8.3%) | 0 (0.0%) |
| 35 to 64 Years | 9 (37.5%) | 31 (23.1%) |
| 65 to 74 Years | 24 (33.3%) | 0 (0.0%) |
| 75 Years and over | 8 (57.1%) | 6 (100.0%) |
Disability Class by Sex by Age in Hundred
Disability Class: Hearing Difficulty
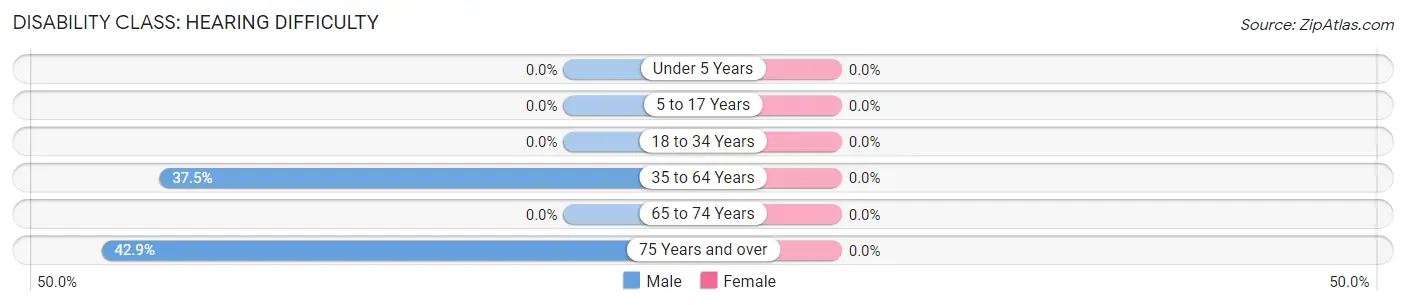
| Age Bracket | Male | Female |
| Under 5 Years | 0 (0.0%) | 0 (0.0%) |
| 5 to 17 Years | 0 (0.0%) | 0 (0.0%) |
| 18 to 34 Years | 0 (0.0%) | 0 (0.0%) |
| 35 to 64 Years | 9 (37.5%) | 0 (0.0%) |
| 65 to 74 Years | 0 (0.0%) | 0 (0.0%) |
| 75 Years and over | 6 (42.9%) | 0 (0.0%) |
Disability Class: Vision Difficulty
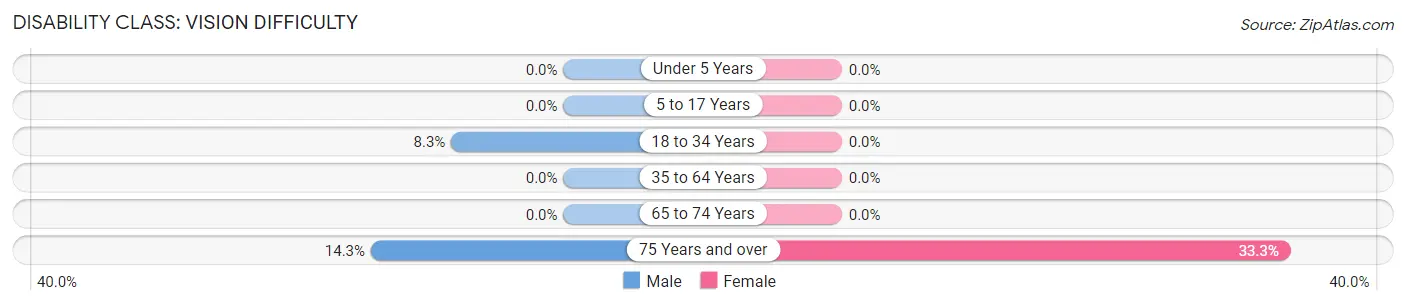
| Age Bracket | Male | Female |
| Under 5 Years | 0 (0.0%) | 0 (0.0%) |
| 5 to 17 Years | 0 (0.0%) | 0 (0.0%) |
| 18 to 34 Years | 4 (8.3%) | 0 (0.0%) |
| 35 to 64 Years | 0 (0.0%) | 0 (0.0%) |
| 65 to 74 Years | 0 (0.0%) | 0 (0.0%) |
| 75 Years and over | 2 (14.3%) | 2 (33.3%) |
Disability Class: Cognitive Difficulty
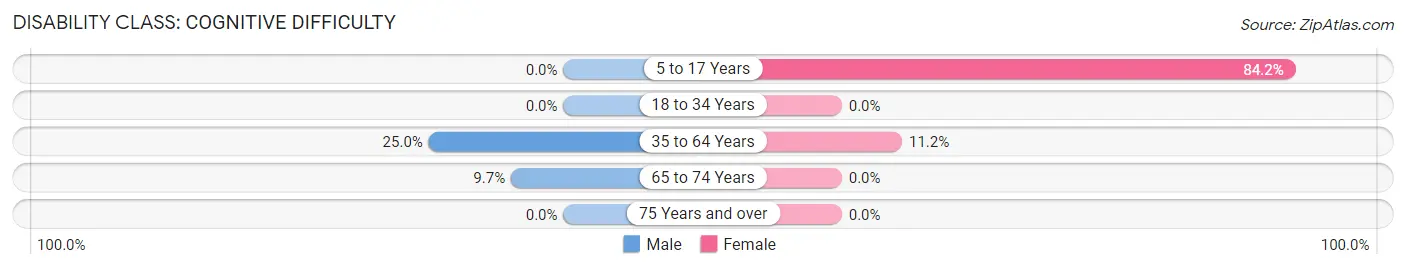
| Age Bracket | Male | Female |
| 5 to 17 Years | 0 (0.0%) | 16 (84.2%) |
| 18 to 34 Years | 0 (0.0%) | 0 (0.0%) |
| 35 to 64 Years | 6 (25.0%) | 15 (11.2%) |
| 65 to 74 Years | 7 (9.7%) | 0 (0.0%) |
| 75 Years and over | 0 (0.0%) | 0 (0.0%) |
Disability Class: Ambulatory Difficulty
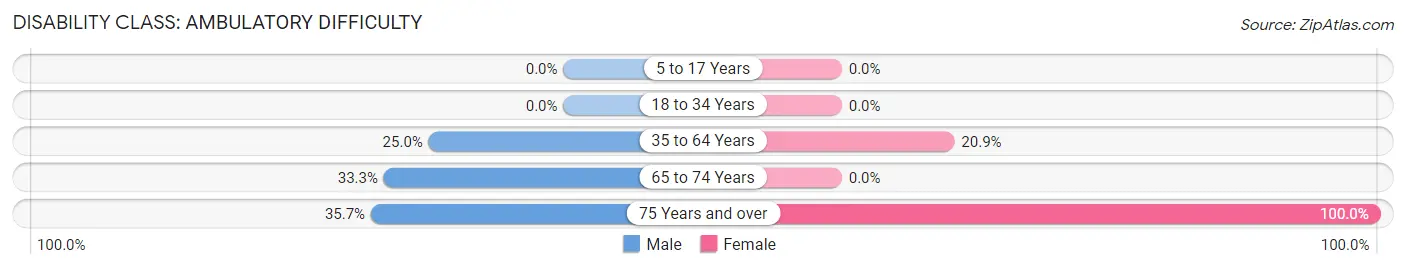
| Age Bracket | Male | Female |
| 5 to 17 Years | 0 (0.0%) | 0 (0.0%) |
| 18 to 34 Years | 0 (0.0%) | 0 (0.0%) |
| 35 to 64 Years | 6 (25.0%) | 28 (20.9%) |
| 65 to 74 Years | 24 (33.3%) | 0 (0.0%) |
| 75 Years and over | 5 (35.7%) | 6 (100.0%) |
Disability Class: Self-Care Difficulty
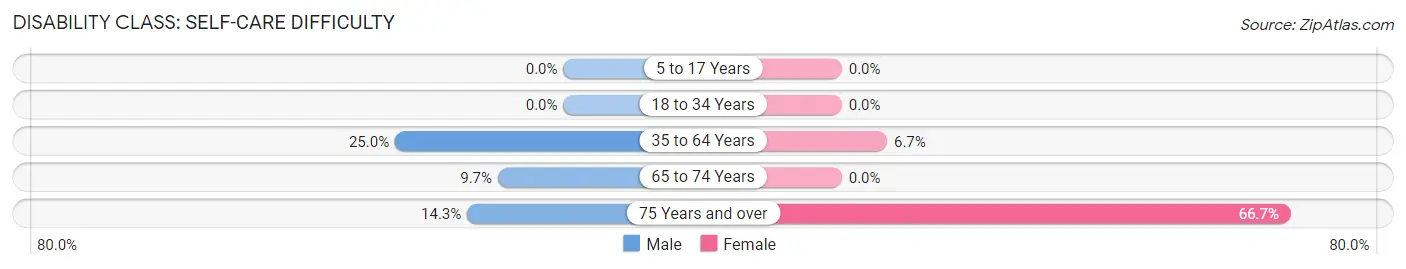
| Age Bracket | Male | Female |
| 5 to 17 Years | 0 (0.0%) | 0 (0.0%) |
| 18 to 34 Years | 0 (0.0%) | 0 (0.0%) |
| 35 to 64 Years | 6 (25.0%) | 9 (6.7%) |
| 65 to 74 Years | 7 (9.7%) | 0 (0.0%) |
| 75 Years and over | 2 (14.3%) | 4 (66.7%) |
Technology Access in Hundred
Computing Device Access in Hundred
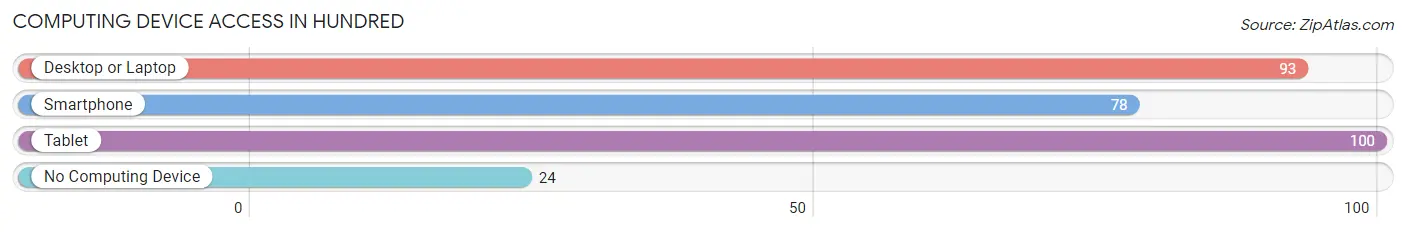
| Device Type | # Households | % Households |
| Desktop or Laptop | 93 | 49.5% |
| Smartphone | 78 | 41.5% |
| Tablet | 100 | 53.2% |
| No Computing Device | 24 | 12.8% |
| Total | 188 | 100.0% |
Internet Access in Hundred
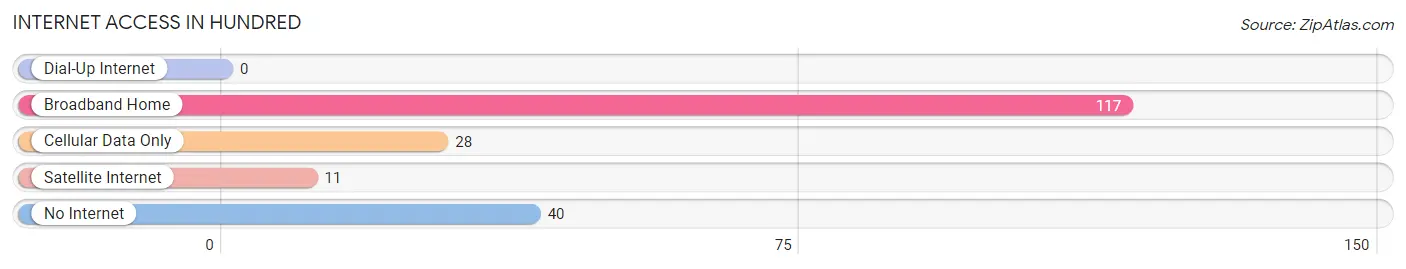
| Internet Type | # Households | % Households |
| Dial-Up Internet | 0 | 0.0% |
| Broadband Home | 117 | 62.2% |
| Cellular Data Only | 28 | 14.9% |
| Satellite Internet | 11 | 5.9% |
| No Internet | 40 | 21.3% |
| Total | 188 | 100.0% |
Hundred Summary
West Virginia is a state located in the Appalachian region of the United States. It is bordered by Virginia to the southeast, Kentucky to the southwest, Ohio to the northwest, and Pennsylvania and Maryland to the northeast. West Virginia is the 41st largest state by area and ranks 38th in population, with around 1.8 million residents as of 2019. The capital and largest city is Charleston.
History
West Virginia was originally part of the state of Virginia, but it became its own state in 1863 during the American Civil War. The state was formed after the western counties of Virginia seceded from the state in order to remain in the Union. West Virginia was the only state to be formed by seceding from a Confederate state during the Civil War.
West Virginia was a major producer of coal and timber during the 19th and 20th centuries. The state was also a major producer of oil and natural gas in the late 20th century.
Geography
West Virginia is located in the Appalachian region of the United States. It is bordered by Virginia to the southeast, Kentucky to the southwest, Ohio to the northwest, and Pennsylvania and Maryland to the northeast.
The state is divided into two distinct regions: the Allegheny Plateau in the west and the Appalachian Mountains in the east. The Allegheny Plateau is a plateau that is characterized by rolling hills and valleys. The Appalachian Mountains are a range of mountains that run through the eastern part of the state.
The highest point in West Virginia is Spruce Knob, which is located in the Allegheny Mountains and has an elevation of 4,863 feet (1,482 meters). The lowest point in the state is Harpers Ferry, which is located in the Shenandoah Valley and has an elevation of 240 feet (73 meters).
Economy
West Virginia has a diverse economy that is largely based on the production of coal, natural gas, and timber. The state is also a major producer of chemicals, steel, and aluminum.
West Virginia is home to several large companies, including Appalachian Power, Consol Energy, and Mylan Pharmaceuticals. The state is also home to several major universities, including West Virginia University, Marshall University, and West Virginia State University.
West Virginia has a relatively low unemployment rate of 4.2%, which is lower than the national average of 4.7%. The median household income in the state is $45,852, which is slightly lower than the national median of $50,221.
Demographics
West Virginia has a population of around 1.8 million people, making it the 38th most populous state in the United States. The state has a population density of 77.3 people per square mile, which is lower than the national average of 87.4 people per square mile.
The racial makeup of West Virginia is 92.2% White, 4.2% Black or African American, 0.7% Asian, 0.2% Native American, and 2.7% from other races. The state also has a large Hispanic or Latino population, which makes up 3.2% of the population.
West Virginia is a largely rural state, with around 70% of the population living in rural areas. The largest cities in the state are Charleston, Huntington, Parkersburg, Morgantown, and Wheeling.
Common Questions
What is Per Capita Income in Hundred?
Per Capita income in Hundred is $21,456.
What is the Median Family Income in Hundred?
Median Family Income in Hundred is $48,375.
What is the Median Household income in Hundred?
Median Household Income in Hundred is $41,216.
What is Income or Wage Gap in Hundred?
Income or Wage Gap in Hundred is 38.9%.
Women in Hundred earn 61.1 cents for every dollar earned by a man.
What is Family Income Deficit in Hundred?
Family Income Deficit in Hundred is $6,350.
Families that are below poverty line in Hundred earn $6,350 less on average than the poverty threshold level.
What is Inequality or Gini Index in Hundred?
Inequality or Gini Index in Hundred is 0.38.
What is the Total Population of Hundred?
Total Population of Hundred is 379.
What is the Total Male Population of Hundred?
Total Male Population of Hundred is 182.
What is the Total Female Population of Hundred?
Total Female Population of Hundred is 197.
What is the Ratio of Males per 100 Females in Hundred?
There are 92.39 Males per 100 Females in Hundred.
What is the Ratio of Females per 100 Males in Hundred?
There are 108.24 Females per 100 Males in Hundred.
What is the Median Population Age in Hundred?
Median Population Age in Hundred is 52.9 Years.
What is the Average Family Size in Hundred
Average Family Size in Hundred is 2.4 People.
What is the Average Household Size in Hundred
Average Household Size in Hundred is 2.0 People.
How Large is the Labor Force in Hundred?
There are 129 People in the Labor Forcein in Hundred.
What is the Percentage of People in the Labor Force in Hundred?
39.7% of People are in the Labor Force in Hundred.