Harrisville, WV Map & Demographics
Harrisville Map
Harrisville Overview
$29,386
PER CAPITA INCOME
$55,938
AVG FAMILY INCOME
$40,114
AVG HOUSEHOLD INCOME
69.3%
WAGE / INCOME GAP [ % ]
30.7¢/ $1
WAGE / INCOME GAP [ $ ]
0.54
INEQUALITY / GINI INDEX
1,620
TOTAL POPULATION
699
MALE POPULATION
921
FEMALE POPULATION
75.90
MALES / 100 FEMALES
131.76
FEMALES / 100 MALES
44.7
MEDIAN AGE
3.0
AVG FAMILY SIZE
2.3
AVG HOUSEHOLD SIZE
588
LABOR FORCE [ PEOPLE ]
45.4%
PERCENT IN LABOR FORCE
5.3%
UNEMPLOYMENT RATE
Harrisville Zip Codes
Income in Harrisville
Income Overview in Harrisville
Per Capita Income in Harrisville is $29,386, while median incomes of families and households are $55,938 and $40,114 respectively.
| Characteristic | Number | Measure |
| Per Capita Income | 1,620 | $29,386 |
| Median Family Income | 411 | $55,938 |
| Mean Family Income | 411 | $77,955 |
| Median Household Income | 693 | $40,114 |
| Mean Household Income | 693 | $68,392 |
| Income Deficit | 411 | $0 |
| Wage / Income Gap (%) | 1,620 | 69.33% |
| Wage / Income Gap ($) | 1,620 | 30.67¢ per $1 |
| Gini / Inequality Index | 1,620 | 0.54 |
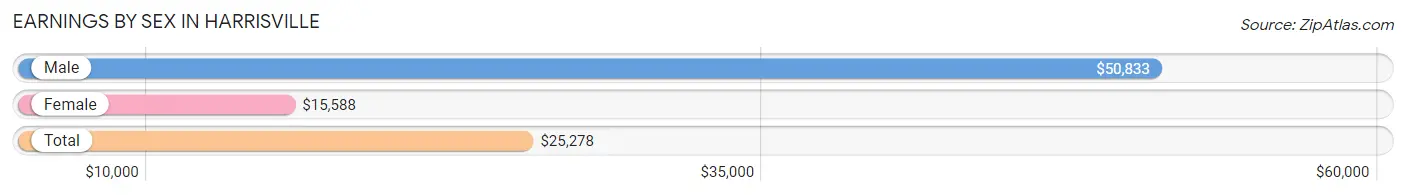
Earnings by Sex in Harrisville
Average Earnings in Harrisville are $25,278, $50,833 for men and $15,588 for women, a difference of 69.3%.
| Sex | Number | Average Earnings |
| Male | 250 (38.2%) | $50,833 |
| Female | 404 (61.8%) | $15,588 |
| Total | 654 (100.0%) | $25,278 |
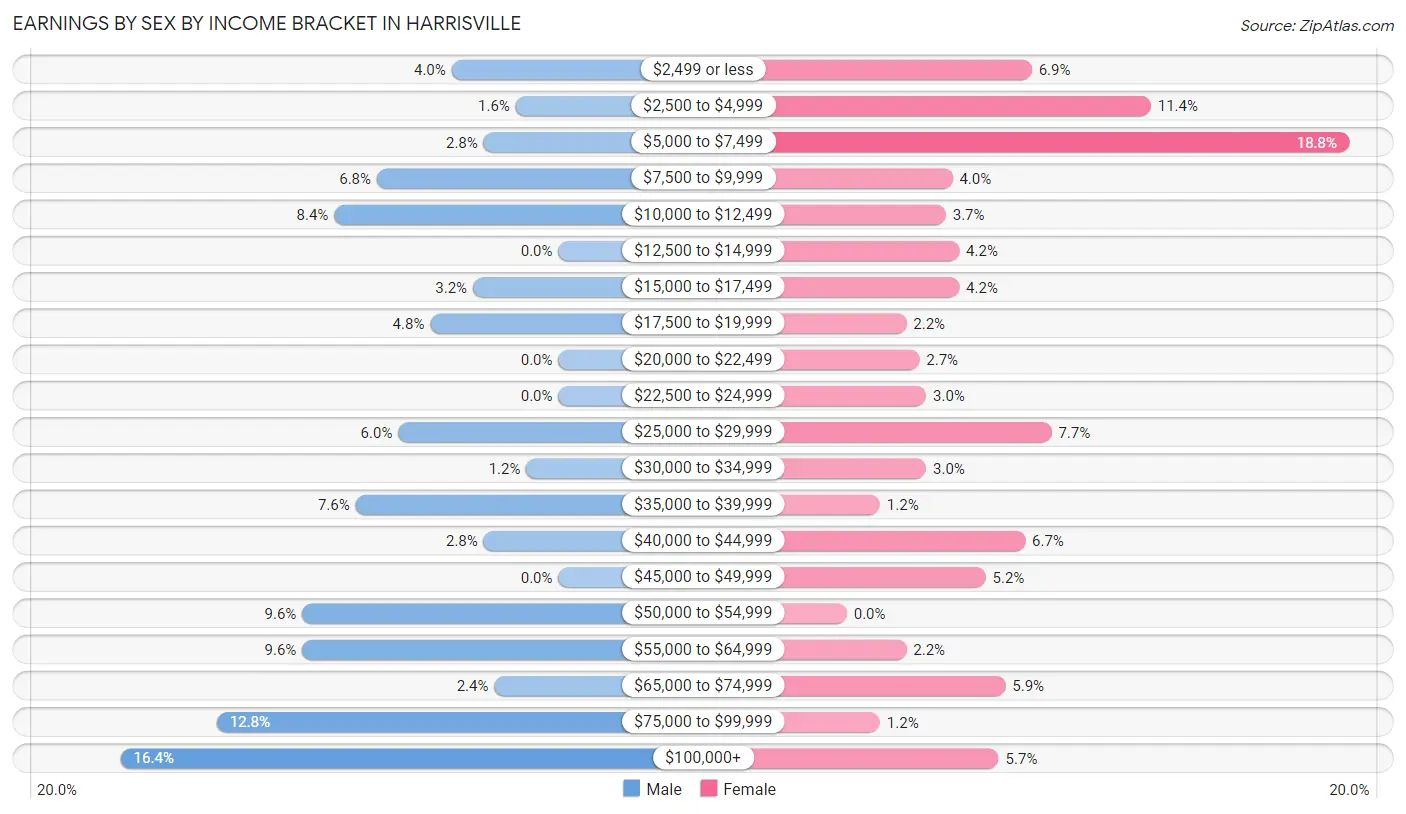
Earnings by Sex by Income Bracket in Harrisville
The most common earnings brackets in Harrisville are $100,000+ for men (41 | 16.4%) and $5,000 to $7,499 for women (76 | 18.8%).
| Income | Male | Female |
| $2,499 or less | 10 (4.0%) | 28 (6.9%) |
| $2,500 to $4,999 | 4 (1.6%) | 46 (11.4%) |
| $5,000 to $7,499 | 7 (2.8%) | 76 (18.8%) |
| $7,500 to $9,999 | 17 (6.8%) | 16 (4.0%) |
| $10,000 to $12,499 | 21 (8.4%) | 15 (3.7%) |
| $12,500 to $14,999 | 0 (0.0%) | 17 (4.2%) |
| $15,000 to $17,499 | 8 (3.2%) | 17 (4.2%) |
| $17,500 to $19,999 | 12 (4.8%) | 9 (2.2%) |
| $20,000 to $22,499 | 0 (0.0%) | 11 (2.7%) |
| $22,500 to $24,999 | 0 (0.0%) | 12 (3.0%) |
| $25,000 to $29,999 | 15 (6.0%) | 31 (7.7%) |
| $30,000 to $34,999 | 3 (1.2%) | 12 (3.0%) |
| $35,000 to $39,999 | 19 (7.6%) | 5 (1.2%) |
| $40,000 to $44,999 | 7 (2.8%) | 27 (6.7%) |
| $45,000 to $49,999 | 0 (0.0%) | 21 (5.2%) |
| $50,000 to $54,999 | 24 (9.6%) | 0 (0.0%) |
| $55,000 to $64,999 | 24 (9.6%) | 9 (2.2%) |
| $65,000 to $74,999 | 6 (2.4%) | 24 (5.9%) |
| $75,000 to $99,999 | 32 (12.8%) | 5 (1.2%) |
| $100,000+ | 41 (16.4%) | 23 (5.7%) |
| Total | 250 (100.0%) | 404 (100.0%) |
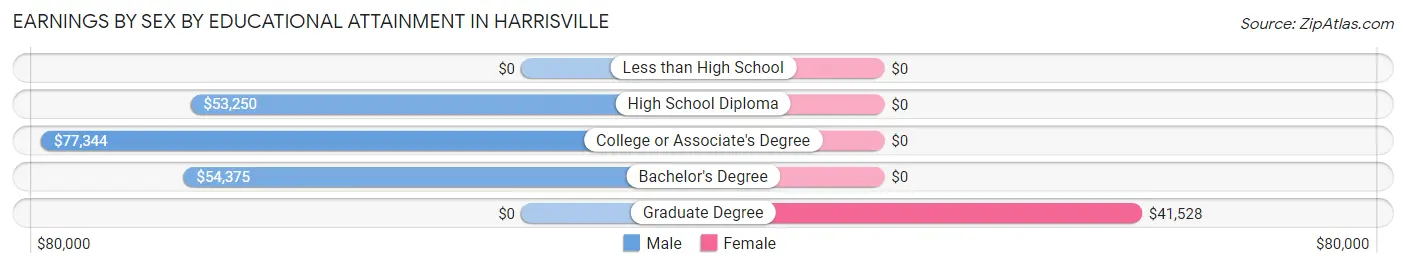
Earnings by Sex by Educational Attainment in Harrisville
Average earnings in Harrisville are $53,125 for men and $19,444 for women, a difference of 63.4%. Men with an educational attainment of college or associate's degree enjoy the highest average annual earnings of $77,344, while those with high school diploma education earn the least with $53,250. Women with an educational attainment of graduate degree earn the most with the average annual earnings of $41,528, while those with graduate degree education have the smallest earnings of $41,528.
| Educational Attainment | Male Income | Female Income |
| Less than High School | - | - |
| High School Diploma | $53,250 | $0 |
| College or Associate's Degree | $77,344 | $0 |
| Bachelor's Degree | $54,375 | $0 |
| Graduate Degree | - | - |
| Total | $53,125 | $19,444 |
Family Income in Harrisville
Family Income Brackets in Harrisville
According to the Harrisville family income data, there are 76 families falling into the $50,000 to $74,999 income range, which is the most common income bracket and makes up 18.5% of all families. Conversely, the less than $10,000 income bracket is the least frequent group with only 3 families (0.7%) belonging to this category.
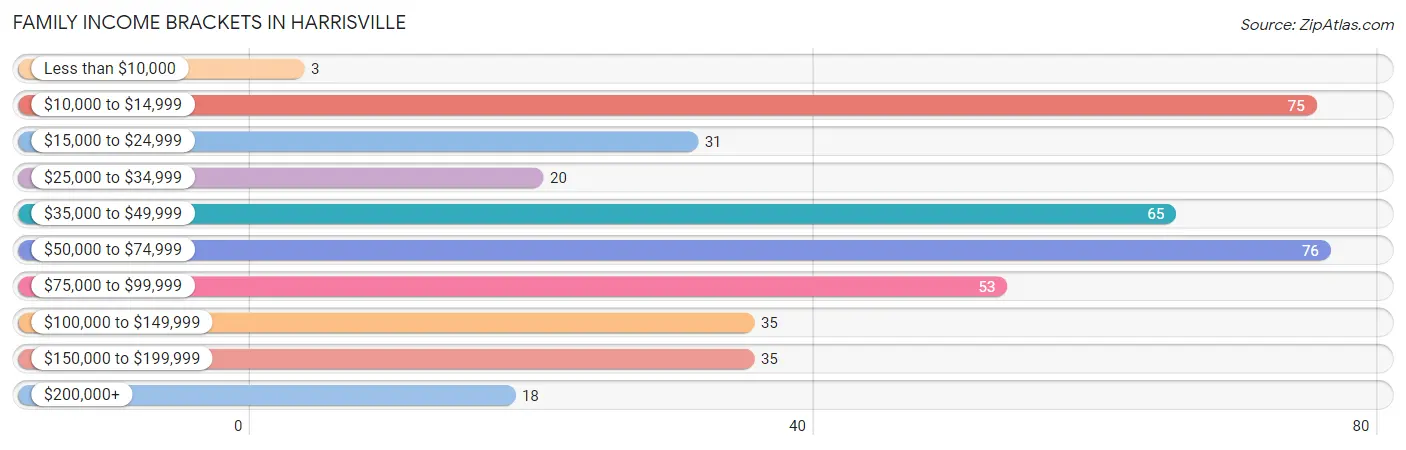
| Income Bracket | # Families | % Families |
| Less than $10,000 | 3 | 0.7% |
| $10,000 to $14,999 | 75 | 18.2% |
| $15,000 to $24,999 | 31 | 7.5% |
| $25,000 to $34,999 | 20 | 4.9% |
| $35,000 to $49,999 | 65 | 15.8% |
| $50,000 to $74,999 | 76 | 18.5% |
| $75,000 to $99,999 | 53 | 12.9% |
| $100,000 to $149,999 | 35 | 8.5% |
| $150,000 to $199,999 | 35 | 8.5% |
| $200,000+ | 18 | 4.4% |
Family Income by Famaliy Size in Harrisville
3-person families (90 | 21.9%) account for the highest median family income in Harrisville with $73,929 per family, while 2-person families (212 | 51.6%) have the highest median income of $30,729 per family member.
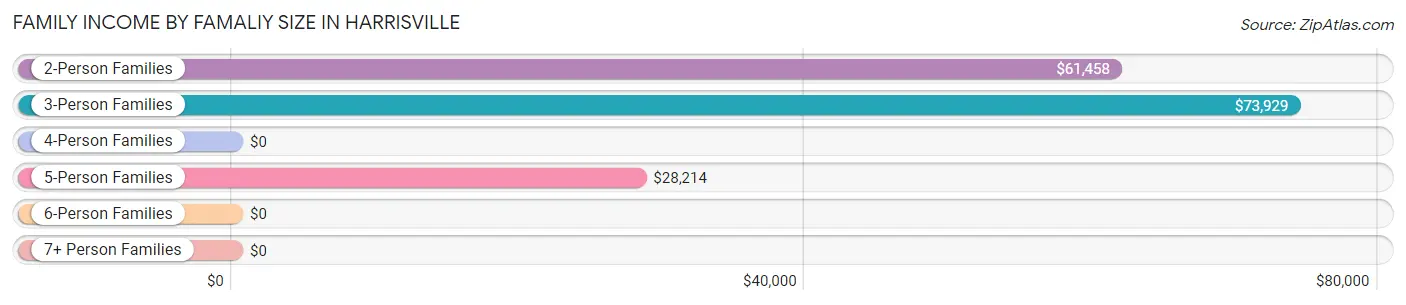
| Income Bracket | # Families | Median Income |
| 2-Person Families | 212 (51.6%) | $61,458 |
| 3-Person Families | 90 (21.9%) | $73,929 |
| 4-Person Families | 87 (21.2%) | $0 |
| 5-Person Families | 18 (4.4%) | $28,214 |
| 6-Person Families | 4 (1.0%) | $0 |
| 7+ Person Families | 0 (0.0%) | $0 |
| Total | 411 (100.0%) | $55,938 |
Family Income by Number of Earners in Harrisville
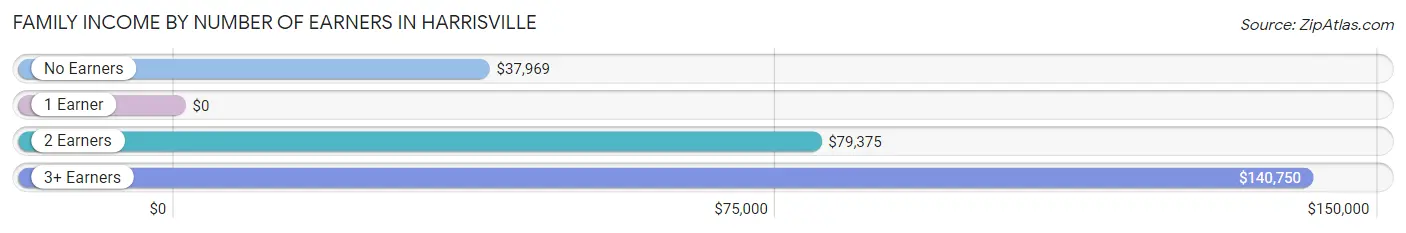
| Number of Earners | # Families | Median Income |
| No Earners | 123 (29.9%) | $37,969 |
| 1 Earner | 103 (25.1%) | $0 |
| 2 Earners | 148 (36.0%) | $79,375 |
| 3+ Earners | 37 (9.0%) | $140,750 |
| Total | 411 (100.0%) | $55,938 |
Household Income in Harrisville
Household Income Brackets in Harrisville
With 109 households falling in the category, the $50,000 to $74,999 income range is the most frequent in Harrisville, accounting for 15.7% of all households. In contrast, only 22 households (3.2%) fall into the $200,000+ income bracket, making it the least populous group.
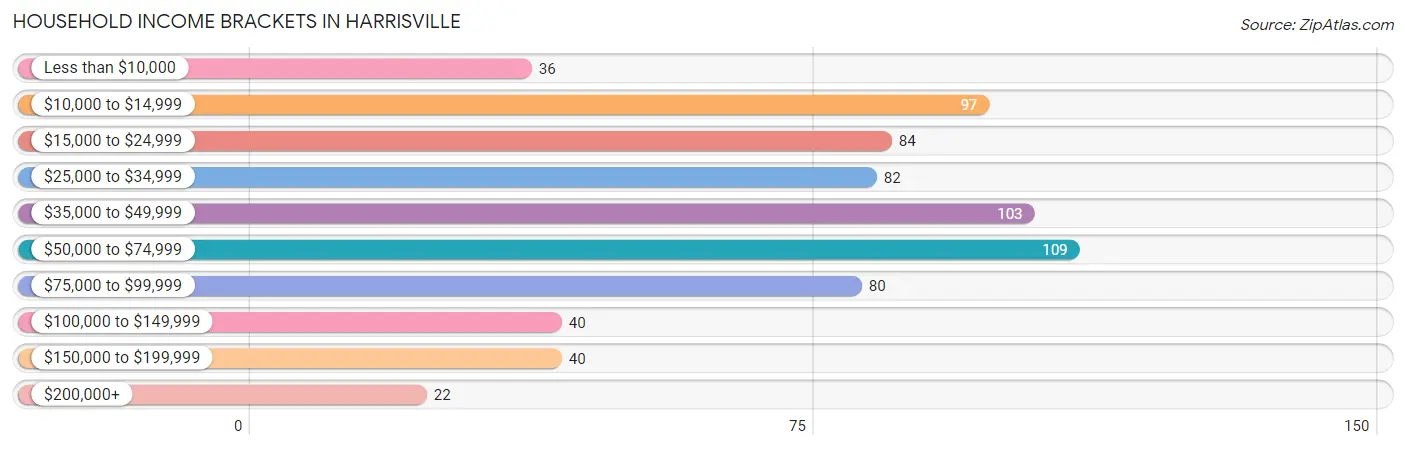
| Income Bracket | # Households | % Households |
| Less than $10,000 | 36 | 5.2% |
| $10,000 to $14,999 | 97 | 14.0% |
| $15,000 to $24,999 | 84 | 12.1% |
| $25,000 to $34,999 | 82 | 11.8% |
| $35,000 to $49,999 | 103 | 14.9% |
| $50,000 to $74,999 | 109 | 15.7% |
| $75,000 to $99,999 | 80 | 11.5% |
| $100,000 to $149,999 | 40 | 5.8% |
| $150,000 to $199,999 | 40 | 5.8% |
| $200,000+ | 22 | 3.2% |
Household Income by Householder Age in Harrisville
The median household income in Harrisville is $40,114, with the highest median household income of $61,458 found in the 45 to 64 years age bracket for the primary householder. A total of 205 households (29.6%) fall into this category. Meanwhile, the 15 to 24 years age bracket for the primary householder has the lowest median household income of $0, with 5 households (0.7%) in this group.
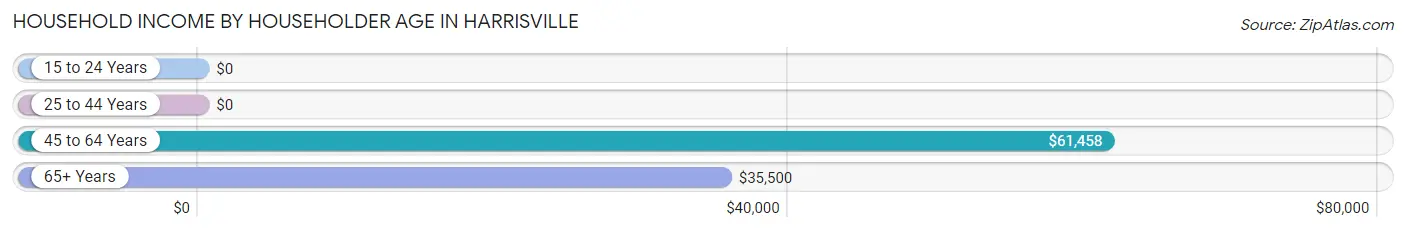
| Income Bracket | # Households | Median Income |
| 15 to 24 Years | 5 (0.7%) | $0 |
| 25 to 44 Years | 179 (25.8%) | $0 |
| 45 to 64 Years | 205 (29.6%) | $61,458 |
| 65+ Years | 304 (43.9%) | $35,500 |
| Total | 693 (100.0%) | $40,114 |
Poverty in Harrisville
Income Below Poverty by Sex and Age in Harrisville
With 32.9% poverty level for males and 29.0% for females among the residents of Harrisville, 12 to 14 year old males and 16 and 17 year old females are the most vulnerable to poverty, with 29 males (85.3%) and 36 females (90.0%) in their respective age groups living below the poverty level.
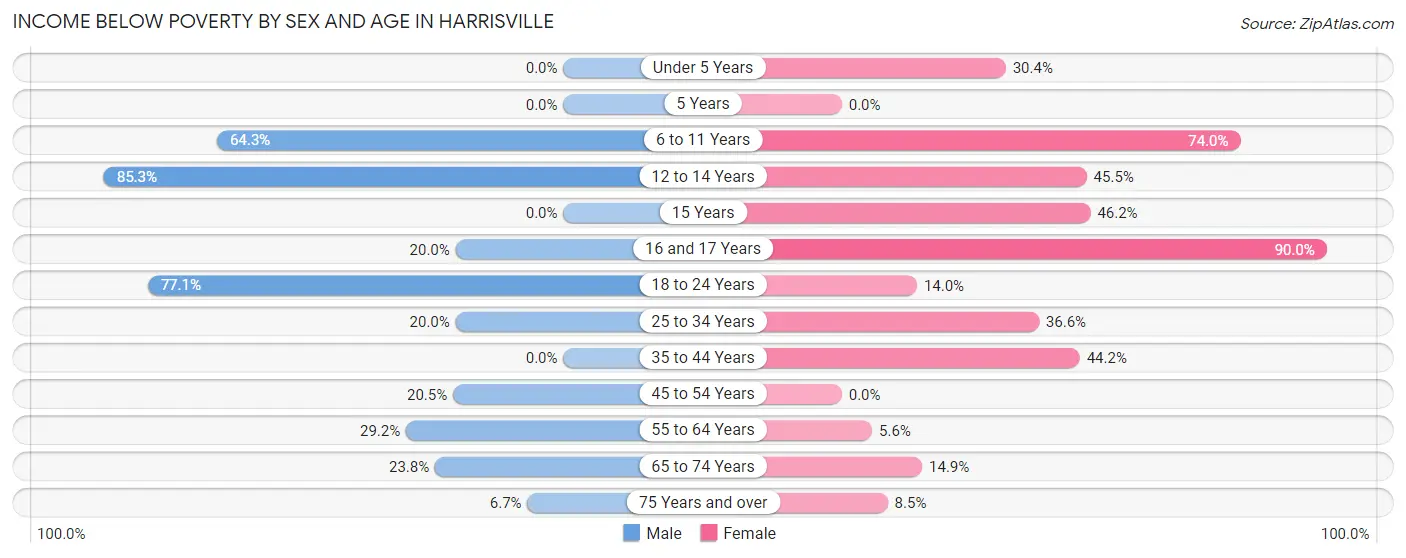
| Age Bracket | Male | Female |
| Under 5 Years | 0 (0.0%) | 7 (30.4%) |
| 5 Years | 0 (0.0%) | 0 (0.0%) |
| 6 to 11 Years | 72 (64.3%) | 54 (74.0%) |
| 12 to 14 Years | 29 (85.3%) | 10 (45.5%) |
| 15 Years | 0 (0.0%) | 12 (46.2%) |
| 16 and 17 Years | 4 (20.0%) | 36 (90.0%) |
| 18 to 24 Years | 27 (77.1%) | 12 (14.0%) |
| 25 to 34 Years | 14 (20.0%) | 15 (36.6%) |
| 35 to 44 Years | 0 (0.0%) | 72 (44.2%) |
| 45 to 54 Years | 17 (20.5%) | 0 (0.0%) |
| 55 to 64 Years | 40 (29.2%) | 4 (5.6%) |
| 65 to 74 Years | 20 (23.8%) | 17 (14.9%) |
| 75 Years and over | 4 (6.7%) | 12 (8.5%) |
| Total | 227 (32.9%) | 251 (29.0%) |
Income Above Poverty by Sex and Age in Harrisville
According to the poverty statistics in Harrisville, males aged under 5 years and females aged 45 to 54 years are the age groups that are most secure financially, with 100.0% of males and 100.0% of females in these age groups living above the poverty line.
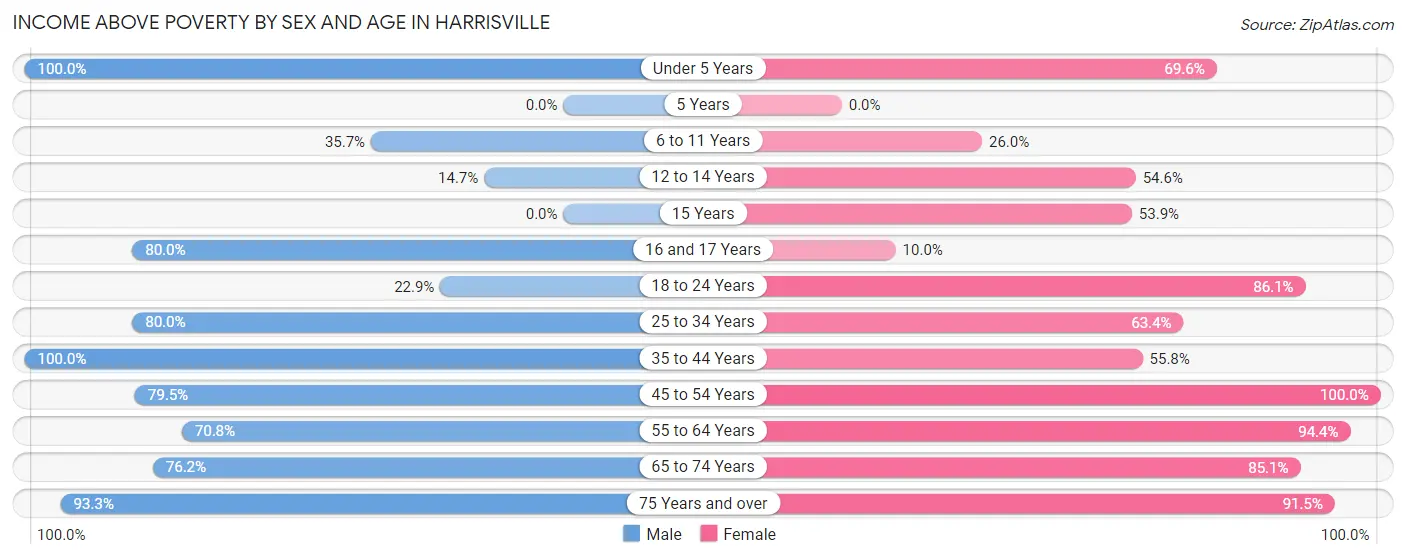
| Age Bracket | Male | Female |
| Under 5 Years | 16 (100.0%) | 16 (69.6%) |
| 5 Years | 0 (0.0%) | 0 (0.0%) |
| 6 to 11 Years | 40 (35.7%) | 19 (26.0%) |
| 12 to 14 Years | 5 (14.7%) | 12 (54.5%) |
| 15 Years | 0 (0.0%) | 14 (53.8%) |
| 16 and 17 Years | 16 (80.0%) | 4 (10.0%) |
| 18 to 24 Years | 8 (22.9%) | 74 (86.1%) |
| 25 to 34 Years | 56 (80.0%) | 26 (63.4%) |
| 35 to 44 Years | 40 (100.0%) | 91 (55.8%) |
| 45 to 54 Years | 66 (79.5%) | 66 (100.0%) |
| 55 to 64 Years | 97 (70.8%) | 67 (94.4%) |
| 65 to 74 Years | 64 (76.2%) | 97 (85.1%) |
| 75 Years and over | 56 (93.3%) | 129 (91.5%) |
| Total | 464 (67.1%) | 615 (71.0%) |
Income Below Poverty Among Married-Couple Families in Harrisville
The poverty statistics for married-couple families in Harrisville show that 7.5% or 22 of the total 295 families live below the poverty line. Families with 3 or 4 children have the highest poverty rate of 77.8%, comprising of 14 families. On the other hand, families with 1 or 2 children have the lowest poverty rate of 0.0%, which includes 0 families.
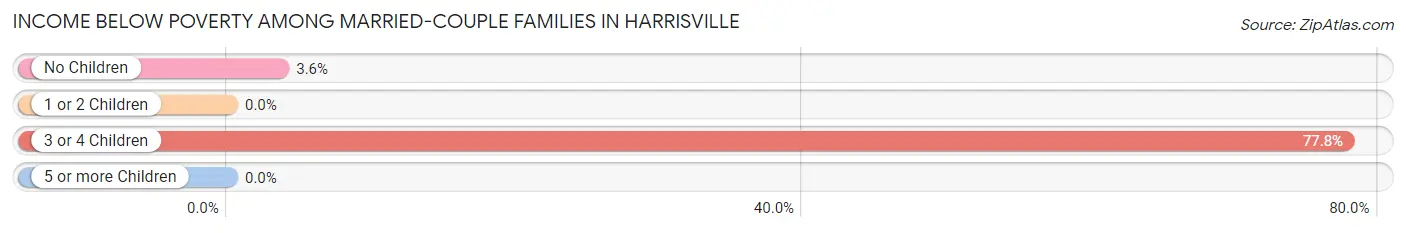
| Children | Above Poverty | Below Poverty |
| No Children | 216 (96.4%) | 8 (3.6%) |
| 1 or 2 Children | 53 (100.0%) | 0 (0.0%) |
| 3 or 4 Children | 4 (22.2%) | 14 (77.8%) |
| 5 or more Children | 0 (0.0%) | 0 (0.0%) |
| Total | 273 (92.5%) | 22 (7.5%) |
Income Below Poverty Among Single-Parent Households in Harrisville
According to the poverty data in Harrisville, 38.9% or 7 single-father households and 74.5% or 73 single-mother households are living below the poverty line. Among single-father households, those with no children have the highest poverty rate, with 7 households (38.9%) experiencing poverty. Likewise, among single-mother households, those with no children have the highest poverty rate, with 3 households (100.0%) falling below the poverty line.
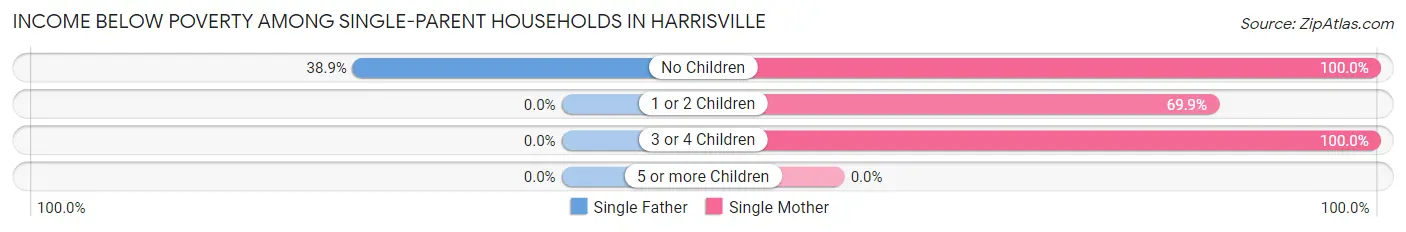
| Children | Single Father | Single Mother |
| No Children | 7 (38.9%) | 3 (100.0%) |
| 1 or 2 Children | 0 (0.0%) | 58 (69.9%) |
| 3 or 4 Children | 0 (0.0%) | 12 (100.0%) |
| 5 or more Children | 0 (0.0%) | 0 (0.0%) |
| Total | 7 (38.9%) | 73 (74.5%) |
Income Below Poverty Among Married-Couple vs Single-Parent Households in Harrisville
The poverty data for Harrisville shows that 22 of the married-couple family households (7.5%) and 80 of the single-parent households (69.0%) are living below the poverty level. Within the married-couple family households, those with 3 or 4 children have the highest poverty rate, with 14 households (77.8%) falling below the poverty line. Among the single-parent households, those with 3 or 4 children have the highest poverty rate, with 12 household (100.0%) living below poverty.
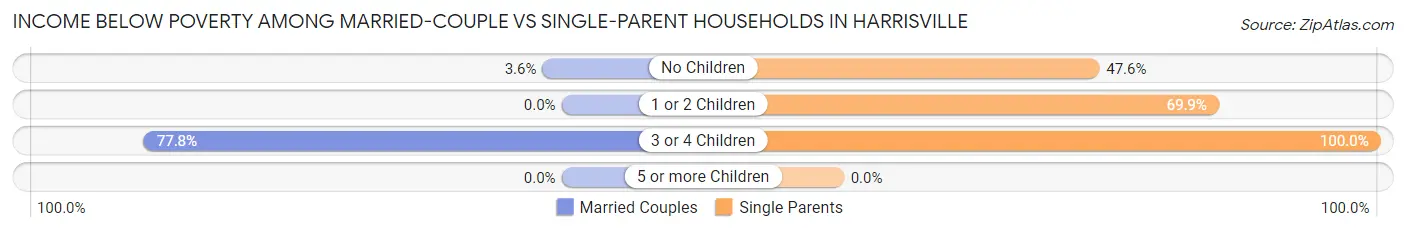
| Children | Married-Couple Families | Single-Parent Households |
| No Children | 8 (3.6%) | 10 (47.6%) |
| 1 or 2 Children | 0 (0.0%) | 58 (69.9%) |
| 3 or 4 Children | 14 (77.8%) | 12 (100.0%) |
| 5 or more Children | 0 (0.0%) | 0 (0.0%) |
| Total | 22 (7.5%) | 80 (69.0%) |
Race in Harrisville
The most populous races in Harrisville are White / Caucasian (1,543 | 95.3%), Asian (50 | 3.1%), and Two or more Races (24 | 1.5%).
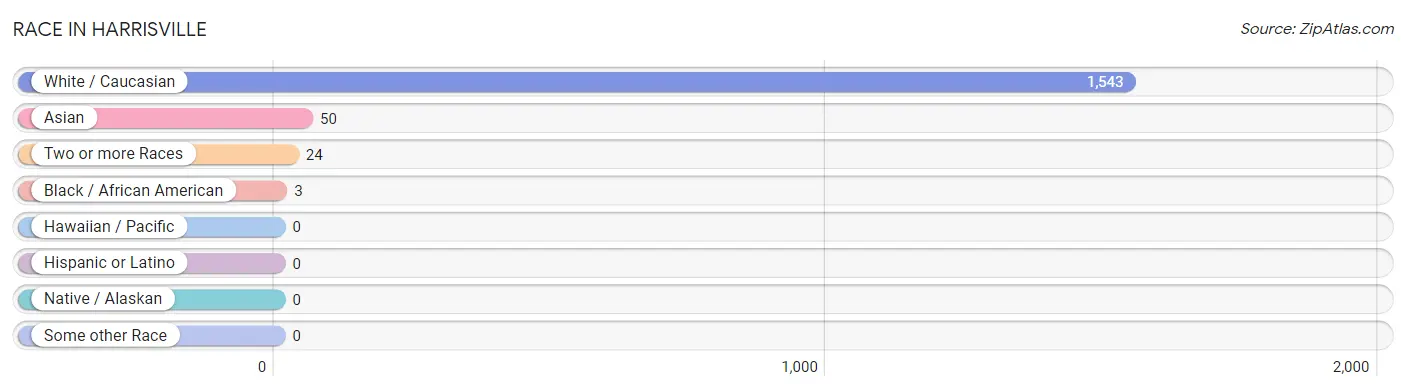
| Race | # Population | % Population |
| Asian | 50 | 3.1% |
| Black / African American | 3 | 0.2% |
| Hawaiian / Pacific | 0 | 0.0% |
| Hispanic or Latino | 0 | 0.0% |
| Native / Alaskan | 0 | 0.0% |
| White / Caucasian | 1,543 | 95.3% |
| Two or more Races | 24 | 1.5% |
| Some other Race | 0 | 0.0% |
| Total | 1,620 | 100.0% |
Ancestry in Harrisville
The most populous ancestries reported in Harrisville are American (269 | 16.6%), Irish (217 | 13.4%), German (193 | 11.9%), English (186 | 11.5%), and Dutch (68 | 4.2%), together accounting for 57.6% of all Harrisville residents.
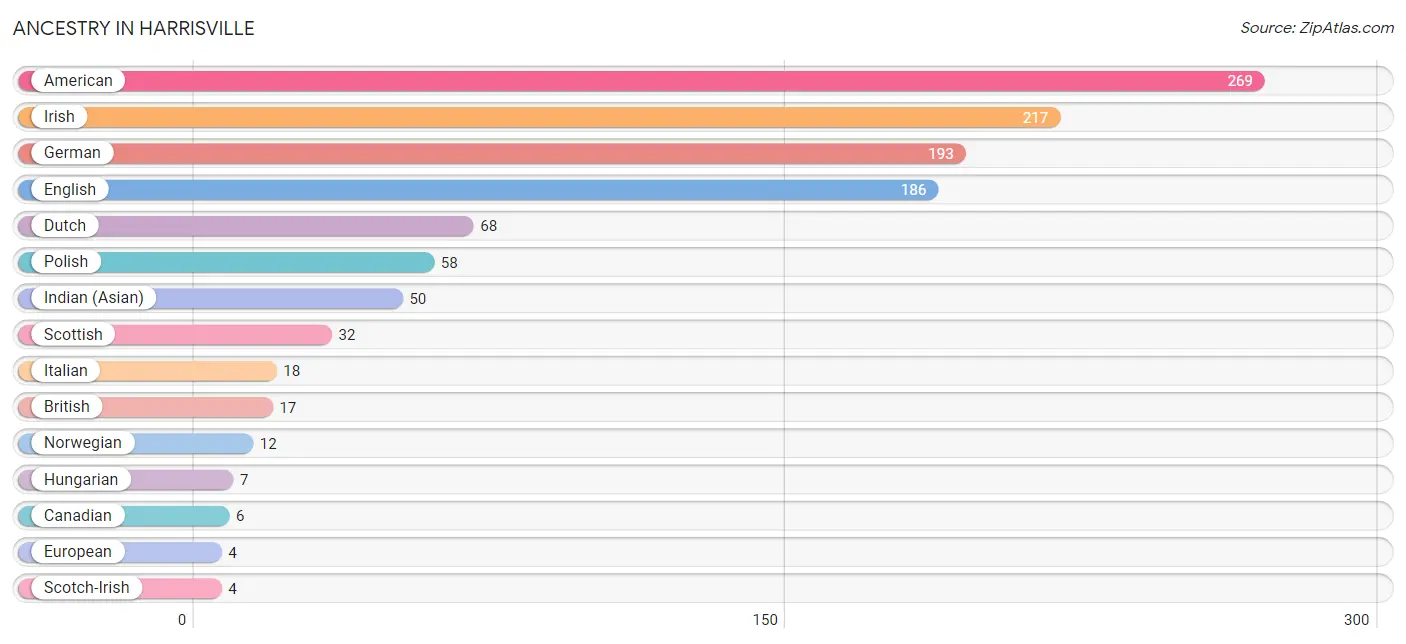
| Ancestry | # Population | % Population |
| American | 269 | 16.6% |
| Belgian | 3 | 0.2% |
| British | 17 | 1.1% |
| Canadian | 6 | 0.4% |
| Dutch | 68 | 4.2% |
| English | 186 | 11.5% |
| European | 4 | 0.3% |
| German | 193 | 11.9% |
| Hungarian | 7 | 0.4% |
| Indian (Asian) | 50 | 3.1% |
| Irish | 217 | 13.4% |
| Italian | 18 | 1.1% |
| Norwegian | 12 | 0.7% |
| Polish | 58 | 3.6% |
| Scotch-Irish | 4 | 0.3% |
| Scottish | 32 | 2.0% |
| Swedish | 3 | 0.2% | View All 17 Rows |
Immigrants in Harrisville
The most numerous immigrant groups reported in Harrisville came from Asia (50 | 3.1%), China (50 | 3.1%), and Eastern Asia (50 | 3.1%), together accounting for 9.3% of all Harrisville residents.
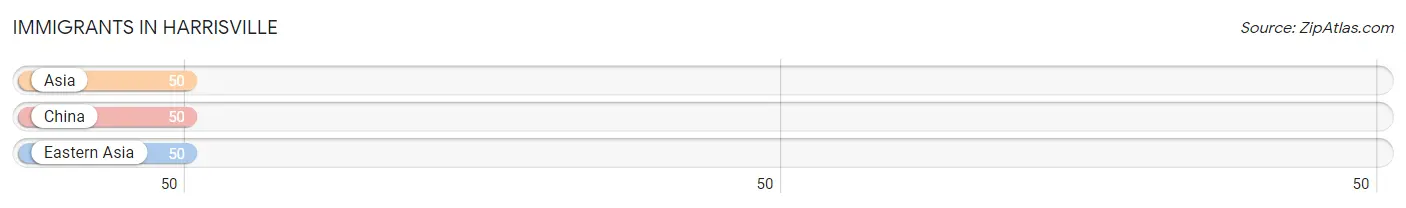
| Immigration Origin | # Population | % Population |
| Asia | 50 | 3.1% |
| China | 50 | 3.1% |
| Eastern Asia | 50 | 3.1% | View All 3 Rows |
Sex and Age in Harrisville
Sex and Age in Harrisville
The most populous age groups in Harrisville are 60 to 64 Years (95 | 13.6%) for men and 15 to 19 Years (111 | 12.0%) for women.
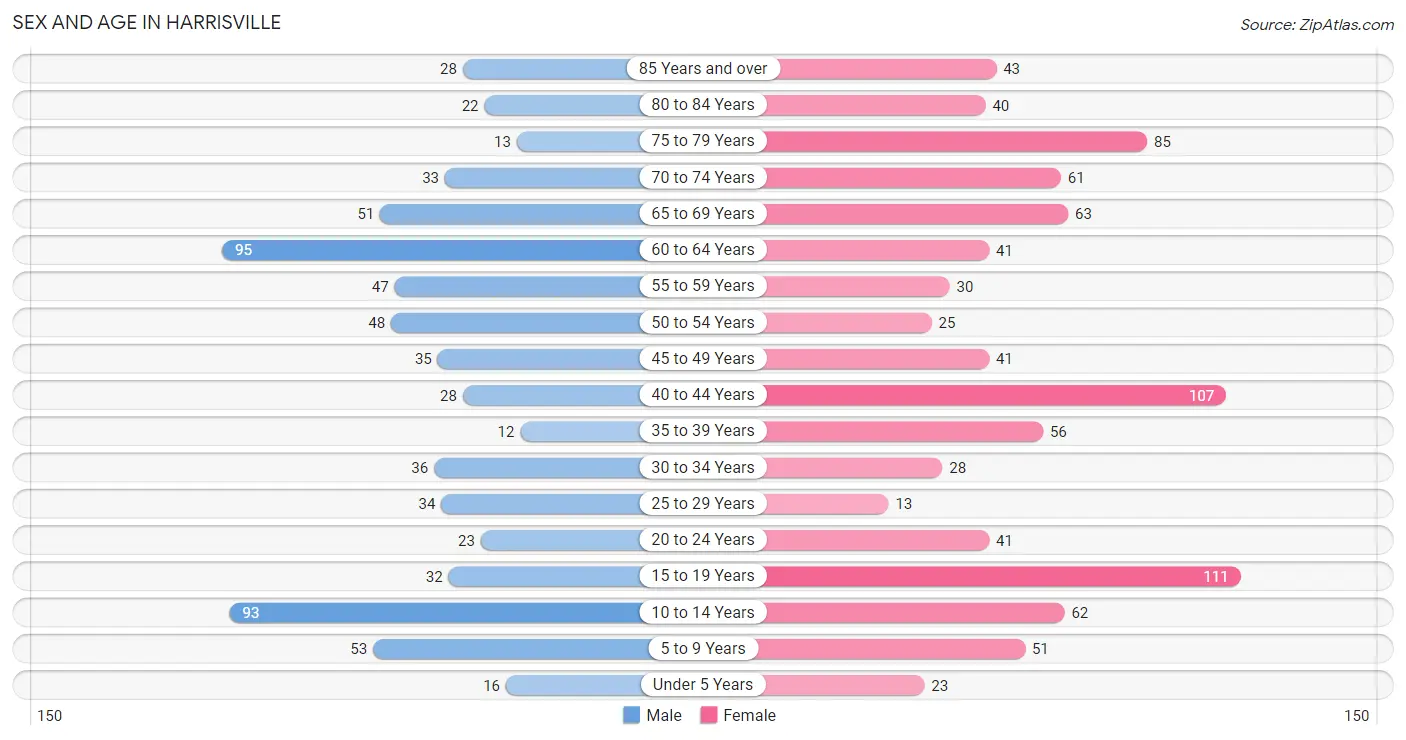
| Age Bracket | Male | Female |
| Under 5 Years | 16 (2.3%) | 23 (2.5%) |
| 5 to 9 Years | 53 (7.6%) | 51 (5.5%) |
| 10 to 14 Years | 93 (13.3%) | 62 (6.7%) |
| 15 to 19 Years | 32 (4.6%) | 111 (12.0%) |
| 20 to 24 Years | 23 (3.3%) | 41 (4.4%) |
| 25 to 29 Years | 34 (4.9%) | 13 (1.4%) |
| 30 to 34 Years | 36 (5.1%) | 28 (3.0%) |
| 35 to 39 Years | 12 (1.7%) | 56 (6.1%) |
| 40 to 44 Years | 28 (4.0%) | 107 (11.6%) |
| 45 to 49 Years | 35 (5.0%) | 41 (4.4%) |
| 50 to 54 Years | 48 (6.9%) | 25 (2.7%) |
| 55 to 59 Years | 47 (6.7%) | 30 (3.3%) |
| 60 to 64 Years | 95 (13.6%) | 41 (4.4%) |
| 65 to 69 Years | 51 (7.3%) | 63 (6.8%) |
| 70 to 74 Years | 33 (4.7%) | 61 (6.6%) |
| 75 to 79 Years | 13 (1.9%) | 85 (9.2%) |
| 80 to 84 Years | 22 (3.2%) | 40 (4.3%) |
| 85 Years and over | 28 (4.0%) | 43 (4.7%) |
| Total | 699 (100.0%) | 921 (100.0%) |
Families and Households in Harrisville
Median Family Size in Harrisville
The median family size in Harrisville is 3.00 persons per family, with single female/mother families (98 | 23.8%) accounting for the largest median family size of 3.49 persons per family. On the other hand, single male/father families (18 | 4.4%) represent the smallest median family size with 2.50 persons per family.
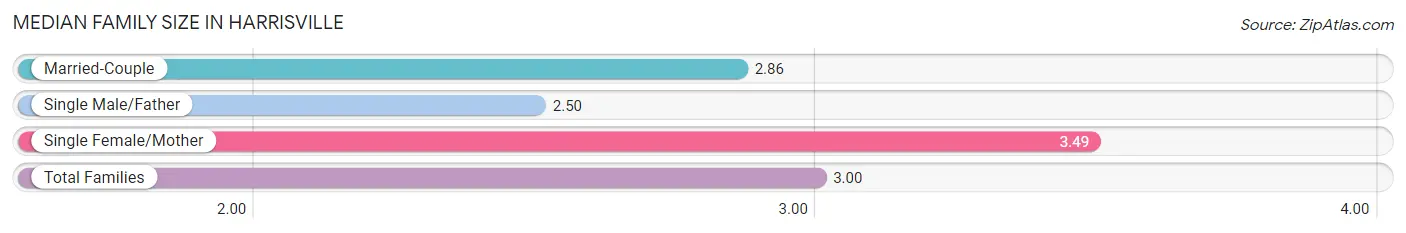
| Family Type | # Families | Family Size |
| Married-Couple | 295 (71.8%) | 2.86 |
| Single Male/Father | 18 (4.4%) | 2.50 |
| Single Female/Mother | 98 (23.8%) | 3.49 |
| Total Families | 411 (100.0%) | 3.00 |
Median Household Size in Harrisville
The median household size in Harrisville is 2.27 persons per household, with single female/mother households (98 | 14.1%) accounting for the largest median household size of 3.89 persons per household. non-family households (282 | 40.7%) represent the smallest median household size with 1.05 persons per household.
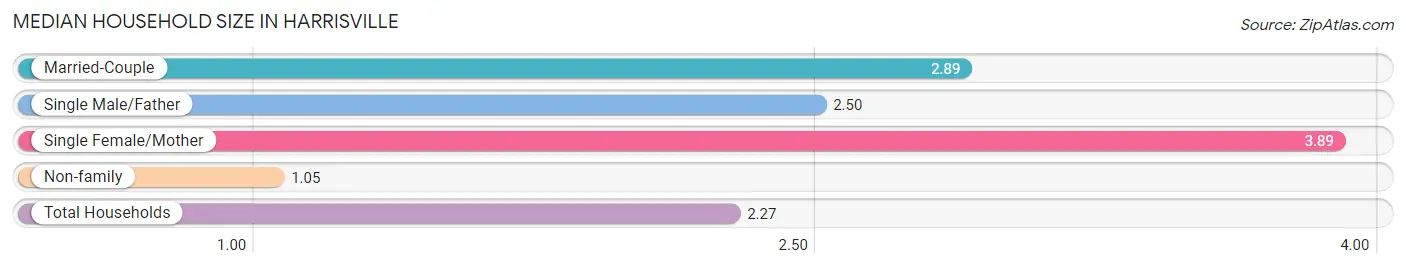
| Household Type | # Households | Household Size |
| Married-Couple | 295 (42.6%) | 2.89 |
| Single Male/Father | 18 (2.6%) | 2.50 |
| Single Female/Mother | 98 (14.1%) | 3.89 |
| Non-family | 282 (40.7%) | 1.05 |
| Total Households | 693 (100.0%) | 2.27 |
Household Size by Marriage Status in Harrisville
Out of a total of 693 households in Harrisville, 411 (59.3%) are family households, while 282 (40.7%) are nonfamily households. The most numerous type of family households are 2-person households, comprising 202, and the most common type of nonfamily households are 1-person households, comprising 272.
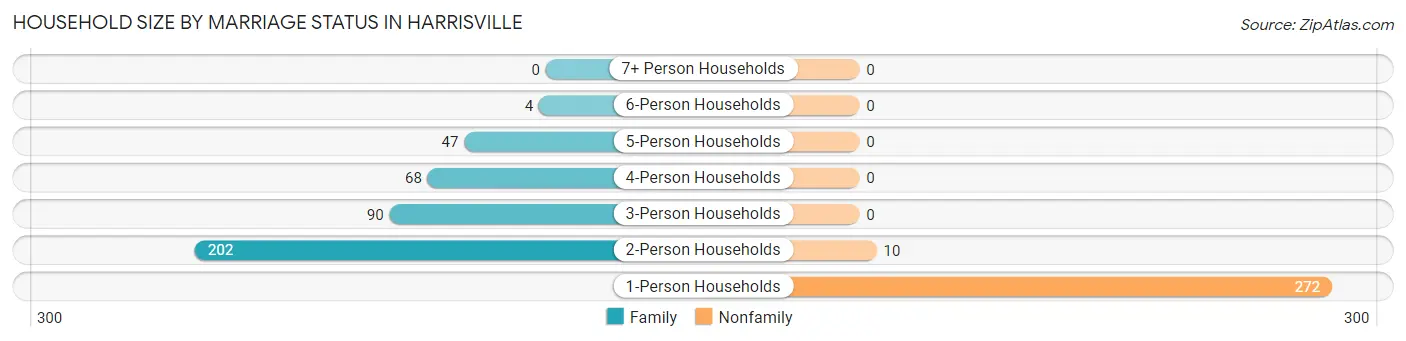
| Household Size | Family Households | Nonfamily Households |
| 1-Person Households | - | 272 (39.3%) |
| 2-Person Households | 202 (29.1%) | 10 (1.4%) |
| 3-Person Households | 90 (13.0%) | 0 (0.0%) |
| 4-Person Households | 68 (9.8%) | 0 (0.0%) |
| 5-Person Households | 47 (6.8%) | 0 (0.0%) |
| 6-Person Households | 4 (0.6%) | 0 (0.0%) |
| 7+ Person Households | 0 (0.0%) | 0 (0.0%) |
| Total | 411 (59.3%) | 282 (40.7%) |
Female Fertility in Harrisville
Fertility by Age in Harrisville
Average fertility rate in Harrisville is 37.0 births per 1,000 women. Women in the age bracket of 20 to 34 years have the highest fertility rate with 122.0 births per 1,000 women. Women in the age bracket of 20 to 34 years acount for 66.7% of all women with births.
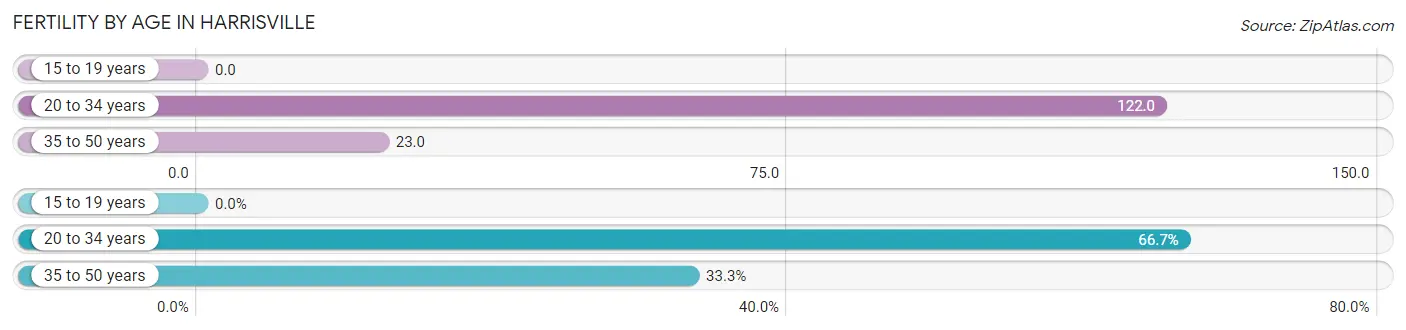
| Age Bracket | Women with Births | Births / 1,000 Women |
| 15 to 19 years | 0 (0.0%) | 0.0 |
| 20 to 34 years | 10 (66.7%) | 122.0 |
| 35 to 50 years | 5 (33.3%) | 23.0 |
| Total | 15 (100.0%) | 37.0 |
Fertility by Age by Marriage Status in Harrisville
33.3% of women with births (15) in Harrisville are married. The highest percentage of unmarried women with births falls into 20 to 34 years age bracket with 100.0% of them unmarried at the time of birth, while the lowest percentage of unmarried women with births belong to 35 to 50 years age bracket with 0.0% of them unmarried.
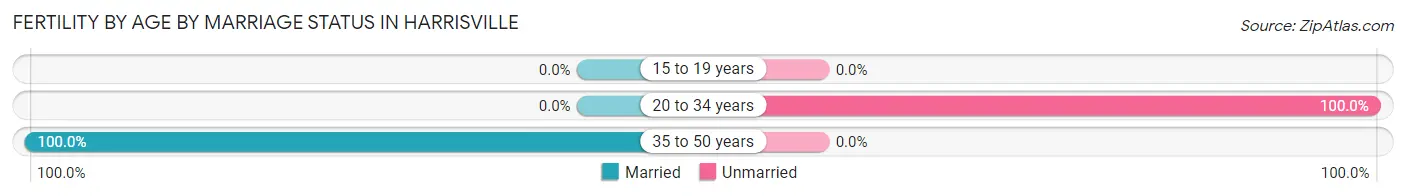
| Age Bracket | Married | Unmarried |
| 15 to 19 years | 0 (0.0%) | 0 (0.0%) |
| 20 to 34 years | 0 (0.0%) | 10 (100.0%) |
| 35 to 50 years | 5 (100.0%) | 0 (0.0%) |
| Total | 5 (33.3%) | 10 (66.7%) |
Fertility by Education in Harrisville
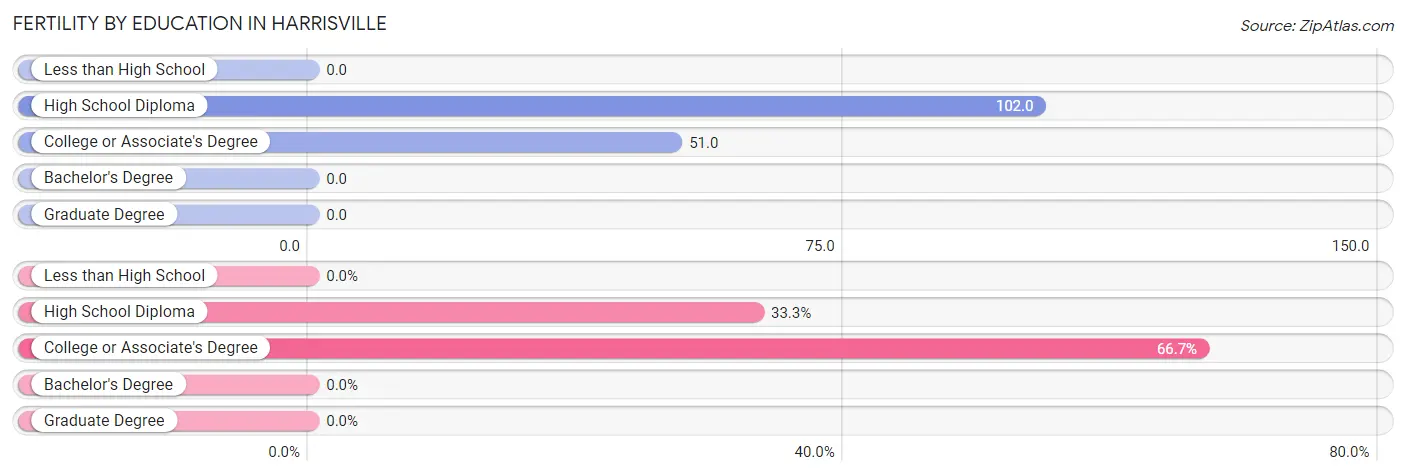
| Educational Attainment | Women with Births | Births / 1,000 Women |
| Less than High School | 0 (0.0%) | 0.0 |
| High School Diploma | 5 (33.3%) | 102.0 |
| College or Associate's Degree | 10 (66.7%) | 51.0 |
| Bachelor's Degree | 0 (0.0%) | 0.0 |
| Graduate Degree | 0 (0.0%) | 0.0 |
| Total | 15 (100.0%) | 37.0 |
Fertility by Education by Marriage Status in Harrisville
66.7% of women with births in Harrisville are unmarried. Women with the educational attainment of high school diploma are most likely to be married with 100.0% of them married at childbirth, while women with the educational attainment of college or associate's degree are least likely to be married with 100.0% of them unmarried at childbirth.
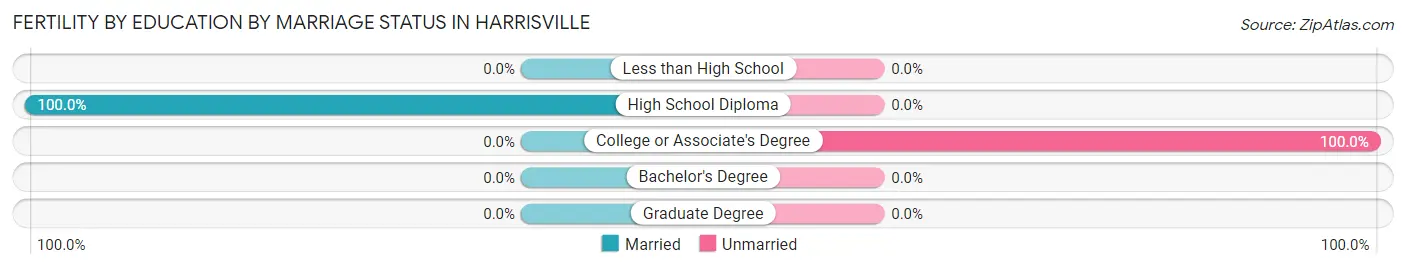
| Educational Attainment | Married | Unmarried |
| Less than High School | 0 (0.0%) | 0 (0.0%) |
| High School Diploma | 5 (100.0%) | 0 (0.0%) |
| College or Associate's Degree | 0 (0.0%) | 10 (100.0%) |
| Bachelor's Degree | 0 (0.0%) | 0 (0.0%) |
| Graduate Degree | 0 (0.0%) | 0 (0.0%) |
| Total | 5 (33.3%) | 10 (66.7%) |
Employment Characteristics in Harrisville
Employment by Class of Employer in Harrisville
Among the 558 employed individuals in Harrisville, private company employees (299 | 53.6%), state government employees (82 | 14.7%), and local government employees (68 | 12.2%) make up the most common classes of employment.
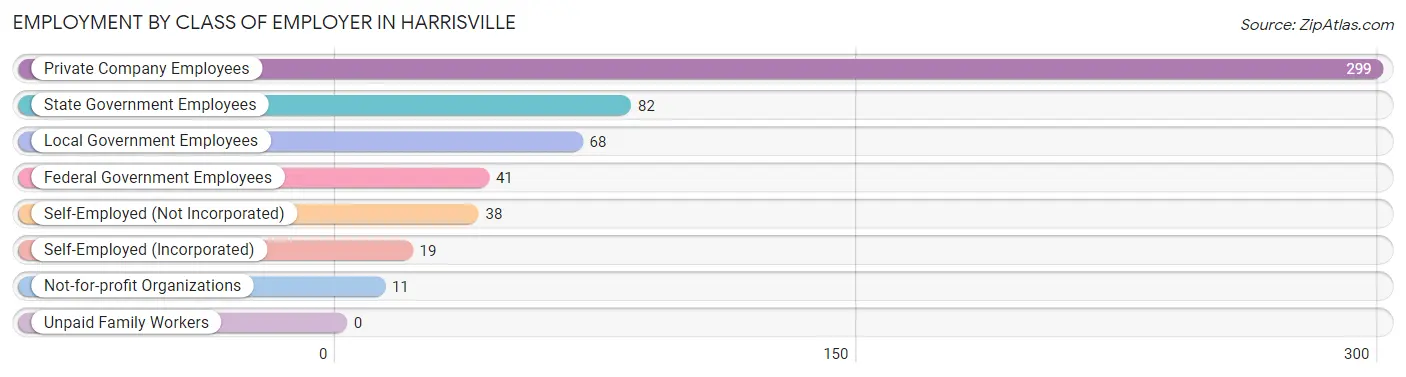
| Employer Class | # Employees | % Employees |
| Private Company Employees | 299 | 53.6% |
| Self-Employed (Incorporated) | 19 | 3.4% |
| Self-Employed (Not Incorporated) | 38 | 6.8% |
| Not-for-profit Organizations | 11 | 2.0% |
| Local Government Employees | 68 | 12.2% |
| State Government Employees | 82 | 14.7% |
| Federal Government Employees | 41 | 7.3% |
| Unpaid Family Workers | 0 | 0.0% |
| Total | 558 | 100.0% |
Employment Status by Age in Harrisville
According to the labor force statistics for Harrisville, out of the total population over 16 years of age (1,296), 45.4% or 588 individuals are in the labor force, with 5.3% or 31 of them unemployed. The age group with the highest labor force participation rate is 30 to 34 years, with 89.1% or 57 individuals in the labor force. Within the labor force, the 65 to 74 years age range has the highest percentage of unemployed individuals, with 41.7% or 10 of them being unemployed.
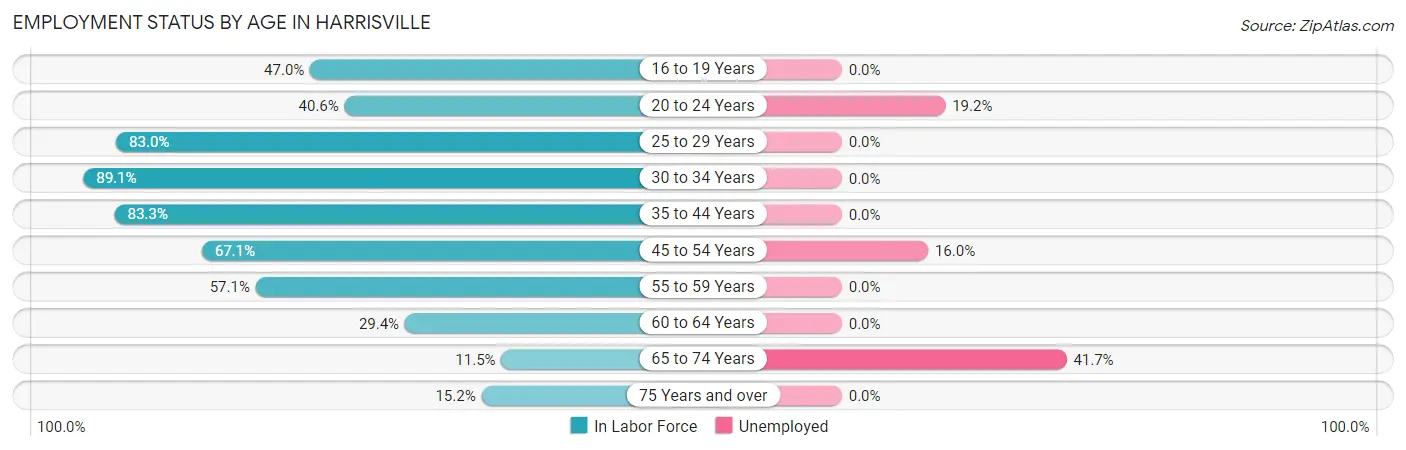
| Age Bracket | In Labor Force | Unemployed |
| 16 to 19 Years | 55 (47.0%) | 0 (0.0%) |
| 20 to 24 Years | 26 (40.6%) | 5 (19.2%) |
| 25 to 29 Years | 39 (83.0%) | 0 (0.0%) |
| 30 to 34 Years | 57 (89.1%) | 0 (0.0%) |
| 35 to 44 Years | 169 (83.3%) | 0 (0.0%) |
| 45 to 54 Years | 100 (67.1%) | 16 (16.0%) |
| 55 to 59 Years | 44 (57.1%) | 0 (0.0%) |
| 60 to 64 Years | 40 (29.4%) | 0 (0.0%) |
| 65 to 74 Years | 24 (11.5%) | 10 (41.7%) |
| 75 Years and over | 35 (15.2%) | 0 (0.0%) |
| Total | 588 (45.4%) | 31 (5.3%) |
Employment Status by Educational Attainment in Harrisville
According to labor force statistics for Harrisville, 66.4% of individuals (449) out of the total population between 25 and 64 years of age (676) are in the labor force, with 3.6% or 16 of them being unemployed. The group with the highest labor force participation rate are those with the educational attainment of bachelor's degree or higher, with 84.4% or 92 individuals in the labor force. Within the labor force, individuals with high school diploma education have the highest percentage of unemployment, with 8.7% or 16 of them being unemployed.
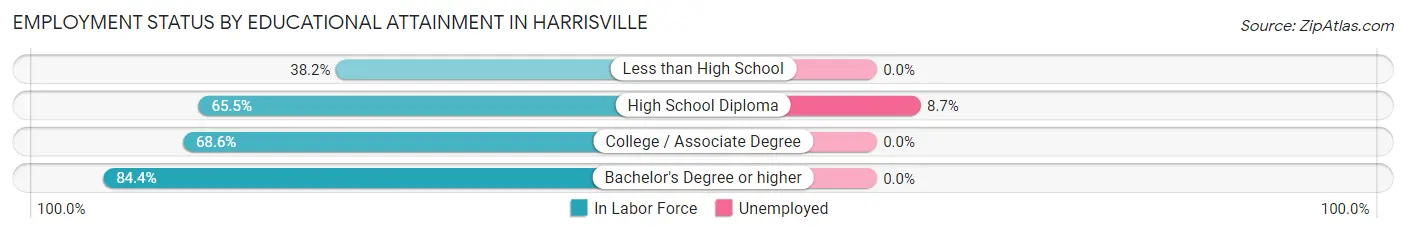
| Educational Attainment | In Labor Force | Unemployed |
| Less than High School | 29 (38.2%) | 0 (0.0%) |
| High School Diploma | 184 (65.5%) | 24 (8.7%) |
| College / Associate Degree | 144 (68.6%) | 0 (0.0%) |
| Bachelor's Degree or higher | 92 (84.4%) | 0 (0.0%) |
| Total | 449 (66.4%) | 24 (3.6%) |
Employment Occupations by Sex in Harrisville
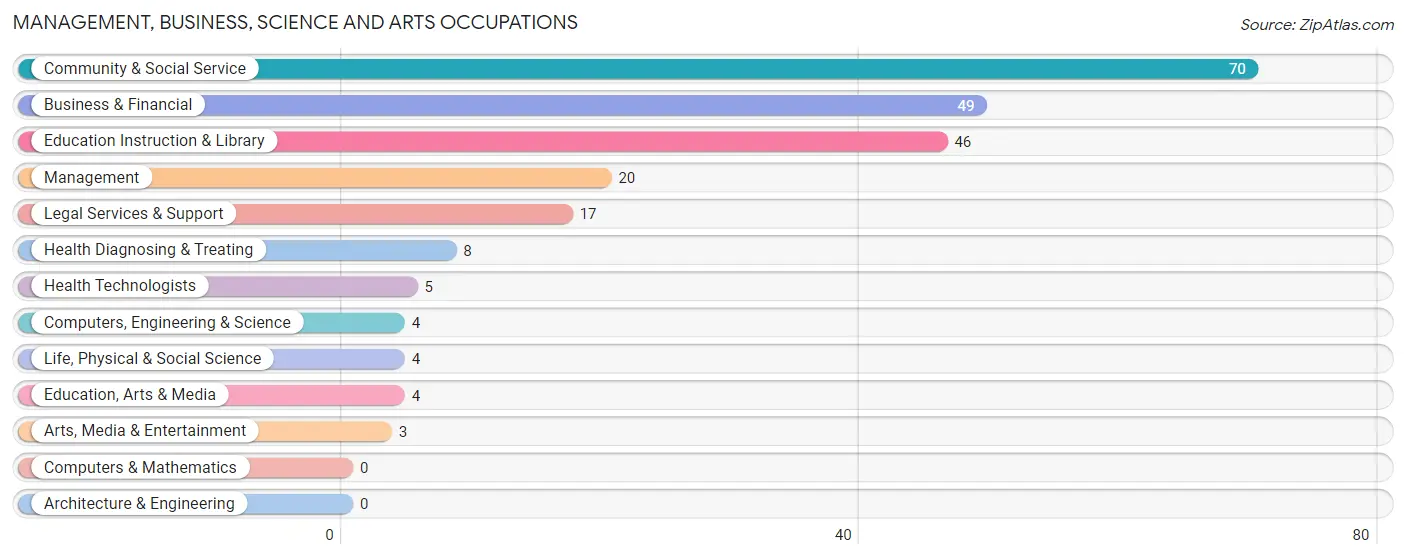
Management, Business, Science and Arts Occupations
The most common Management, Business, Science and Arts occupations in Harrisville are Community & Social Service (70 | 12.5%), Business & Financial (49 | 8.8%), Education Instruction & Library (46 | 8.2%), Management (20 | 3.6%), and Legal Services & Support (17 | 3.0%).
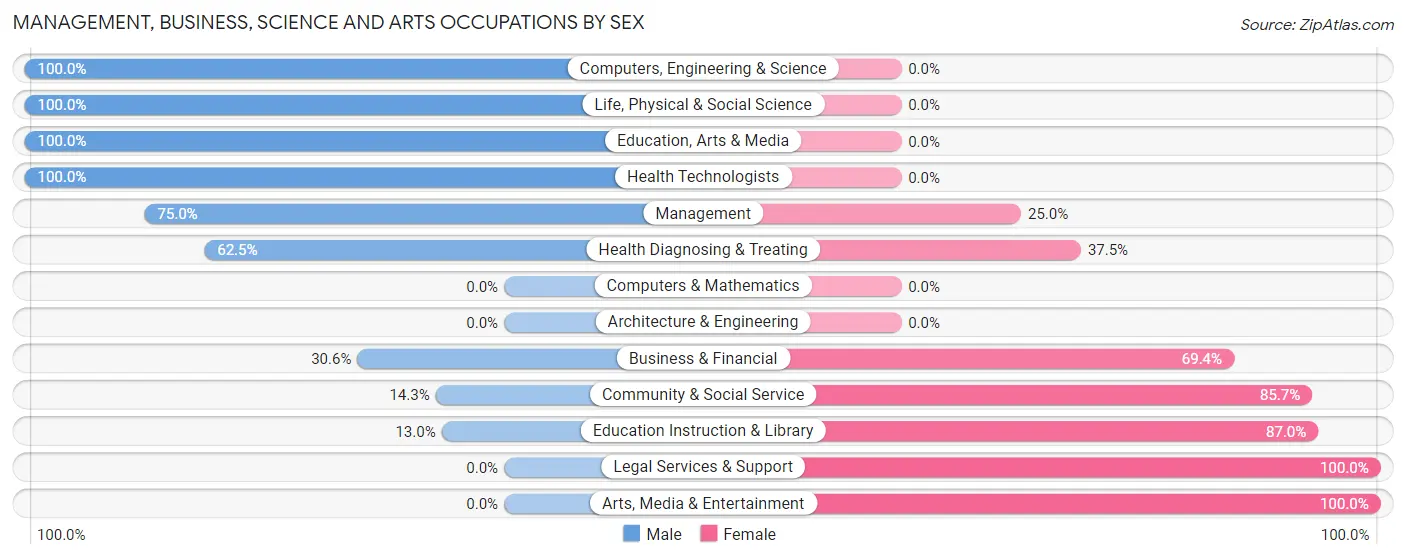
Management, Business, Science and Arts Occupations by Sex
Within the Management, Business, Science and Arts occupations in Harrisville, the most male-oriented occupations are Computers, Engineering & Science (100.0%), Life, Physical & Social Science (100.0%), and Education, Arts & Media (100.0%), while the most female-oriented occupations are Legal Services & Support (100.0%), Arts, Media & Entertainment (100.0%), and Education Instruction & Library (87.0%).
| Occupation | Male | Female |
| Management | 15 (75.0%) | 5 (25.0%) |
| Business & Financial | 15 (30.6%) | 34 (69.4%) |
| Computers, Engineering & Science | 4 (100.0%) | 0 (0.0%) |
| Computers & Mathematics | 0 (0.0%) | 0 (0.0%) |
| Architecture & Engineering | 0 (0.0%) | 0 (0.0%) |
| Life, Physical & Social Science | 4 (100.0%) | 0 (0.0%) |
| Community & Social Service | 10 (14.3%) | 60 (85.7%) |
| Education, Arts & Media | 4 (100.0%) | 0 (0.0%) |
| Legal Services & Support | 0 (0.0%) | 17 (100.0%) |
| Education Instruction & Library | 6 (13.0%) | 40 (87.0%) |
| Arts, Media & Entertainment | 0 (0.0%) | 3 (100.0%) |
| Health Diagnosing & Treating | 5 (62.5%) | 3 (37.5%) |
| Health Technologists | 5 (100.0%) | 0 (0.0%) |
| Total (Category) | 49 (32.5%) | 102 (67.5%) |
| Total (Overall) | 196 (35.1%) | 362 (64.9%) |
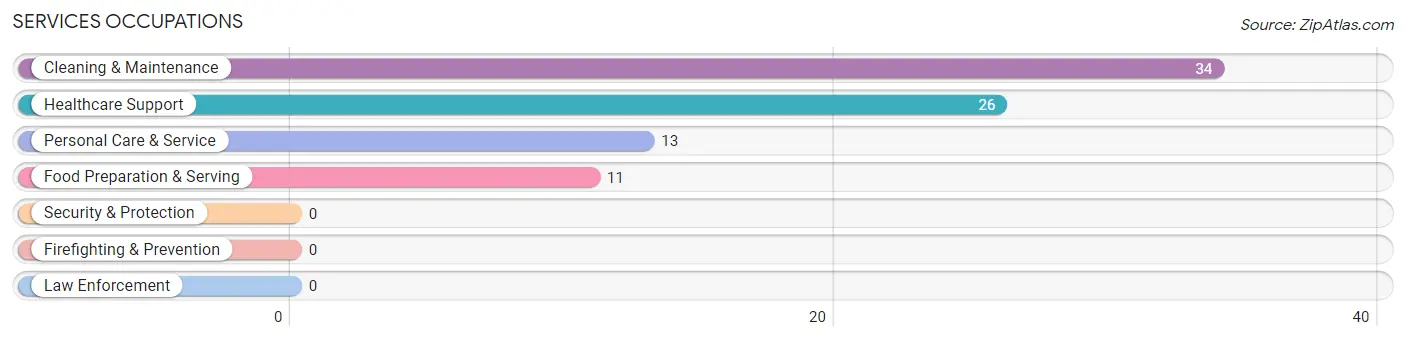
Services Occupations
The most common Services occupations in Harrisville are Cleaning & Maintenance (34 | 6.1%), Healthcare Support (26 | 4.7%), Personal Care & Service (13 | 2.3%), and Food Preparation & Serving (11 | 2.0%).
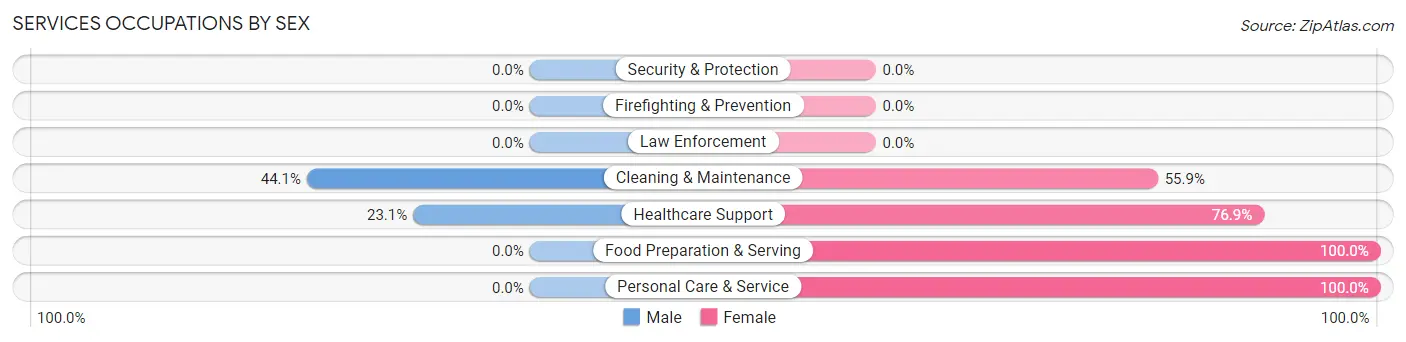
Services Occupations by Sex
Within the Services occupations in Harrisville, the most male-oriented occupations are Cleaning & Maintenance (44.1%), and Healthcare Support (23.1%), while the most female-oriented occupations are Food Preparation & Serving (100.0%), Personal Care & Service (100.0%), and Healthcare Support (76.9%).
| Occupation | Male | Female |
| Healthcare Support | 6 (23.1%) | 20 (76.9%) |
| Security & Protection | 0 (0.0%) | 0 (0.0%) |
| Firefighting & Prevention | 0 (0.0%) | 0 (0.0%) |
| Law Enforcement | 0 (0.0%) | 0 (0.0%) |
| Food Preparation & Serving | 0 (0.0%) | 11 (100.0%) |
| Cleaning & Maintenance | 15 (44.1%) | 19 (55.9%) |
| Personal Care & Service | 0 (0.0%) | 13 (100.0%) |
| Total (Category) | 21 (25.0%) | 63 (75.0%) |
| Total (Overall) | 196 (35.1%) | 362 (64.9%) |
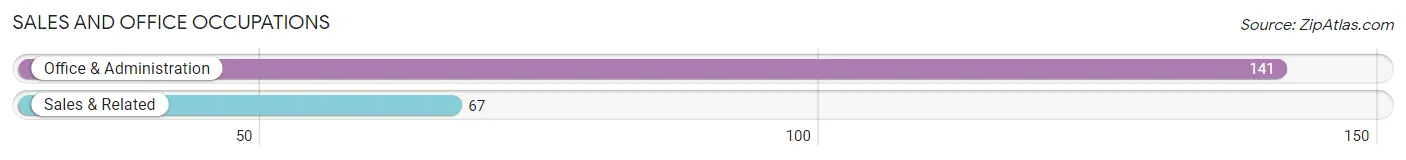
Sales and Office Occupations
The most common Sales and Office occupations in Harrisville are Office & Administration (141 | 25.3%), and Sales & Related (67 | 12.0%).
Sales and Office Occupations by Sex
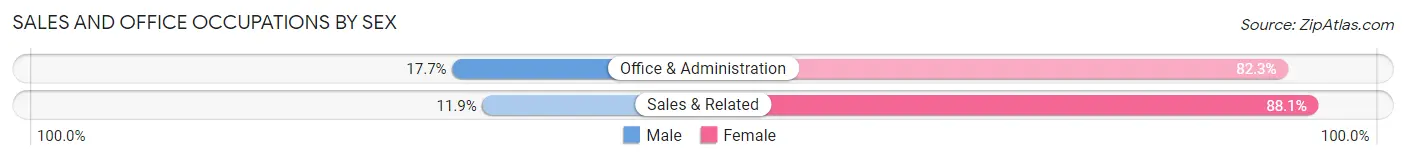
| Occupation | Male | Female |
| Sales & Related | 8 (11.9%) | 59 (88.1%) |
| Office & Administration | 25 (17.7%) | 116 (82.3%) |
| Total (Category) | 33 (15.9%) | 175 (84.1%) |
| Total (Overall) | 196 (35.1%) | 362 (64.9%) |
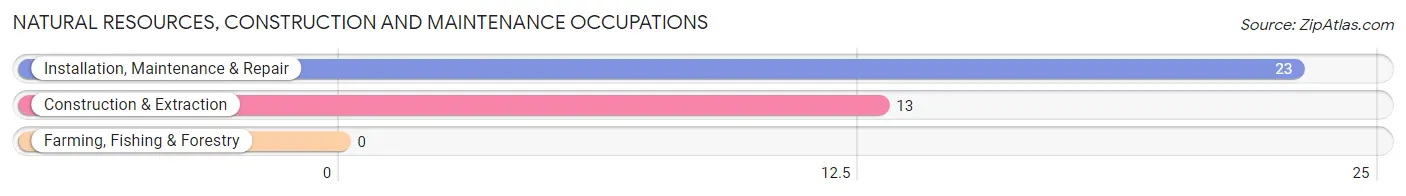
Natural Resources, Construction and Maintenance Occupations
The most common Natural Resources, Construction and Maintenance occupations in Harrisville are Installation, Maintenance & Repair (23 | 4.1%), and Construction & Extraction (13 | 2.3%).
Natural Resources, Construction and Maintenance Occupations by Sex
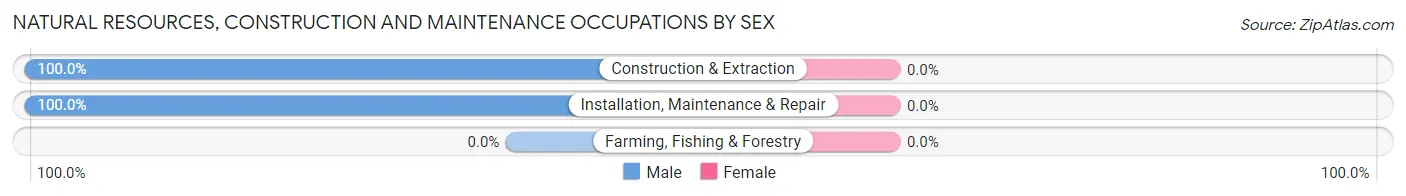
| Occupation | Male | Female |
| Farming, Fishing & Forestry | 0 (0.0%) | 0 (0.0%) |
| Construction & Extraction | 13 (100.0%) | 0 (0.0%) |
| Installation, Maintenance & Repair | 23 (100.0%) | 0 (0.0%) |
| Total (Category) | 36 (100.0%) | 0 (0.0%) |
| Total (Overall) | 196 (35.1%) | 362 (64.9%) |
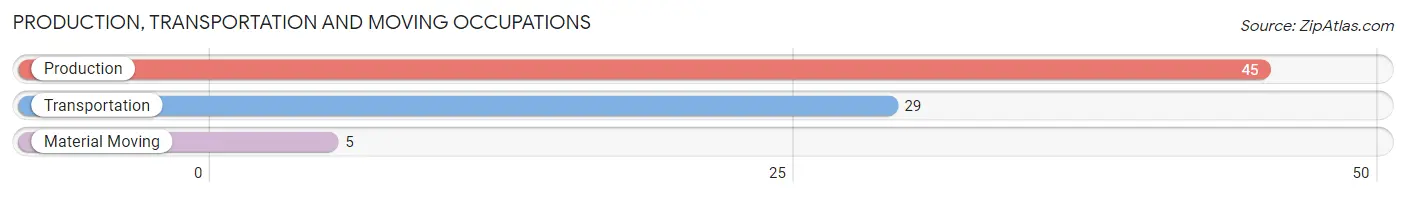
Production, Transportation and Moving Occupations
The most common Production, Transportation and Moving occupations in Harrisville are Production (45 | 8.1%), Transportation (29 | 5.2%), and Material Moving (5 | 0.9%).
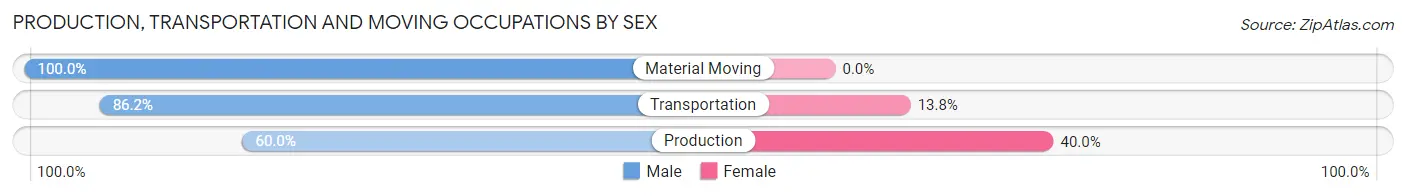
Production, Transportation and Moving Occupations by Sex
| Occupation | Male | Female |
| Production | 27 (60.0%) | 18 (40.0%) |
| Transportation | 25 (86.2%) | 4 (13.8%) |
| Material Moving | 5 (100.0%) | 0 (0.0%) |
| Total (Category) | 57 (72.2%) | 22 (27.9%) |
| Total (Overall) | 196 (35.1%) | 362 (64.9%) |
Employment Industries by Sex in Harrisville
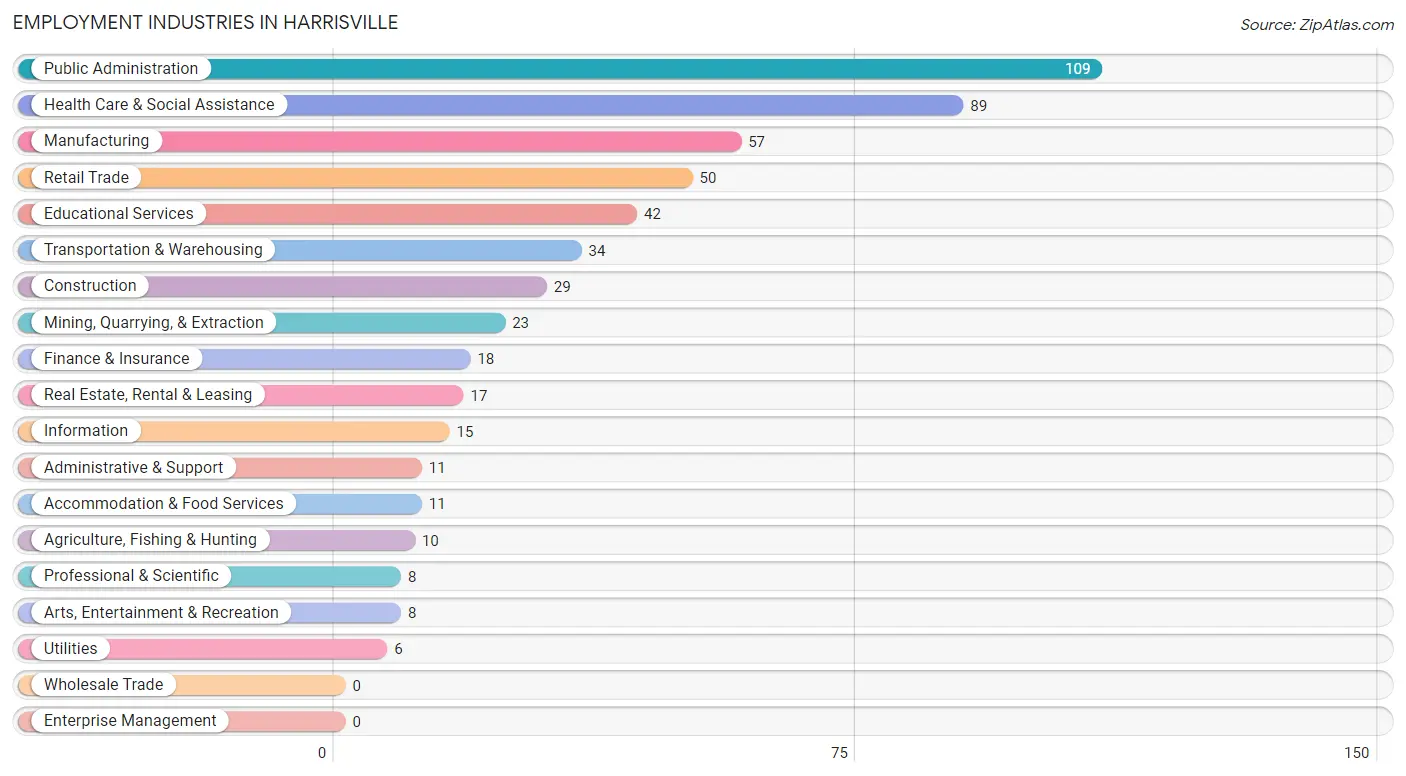
Employment Industries in Harrisville
The major employment industries in Harrisville include Public Administration (109 | 19.5%), Health Care & Social Assistance (89 | 16.0%), Manufacturing (57 | 10.2%), Retail Trade (50 | 9.0%), and Educational Services (42 | 7.5%).
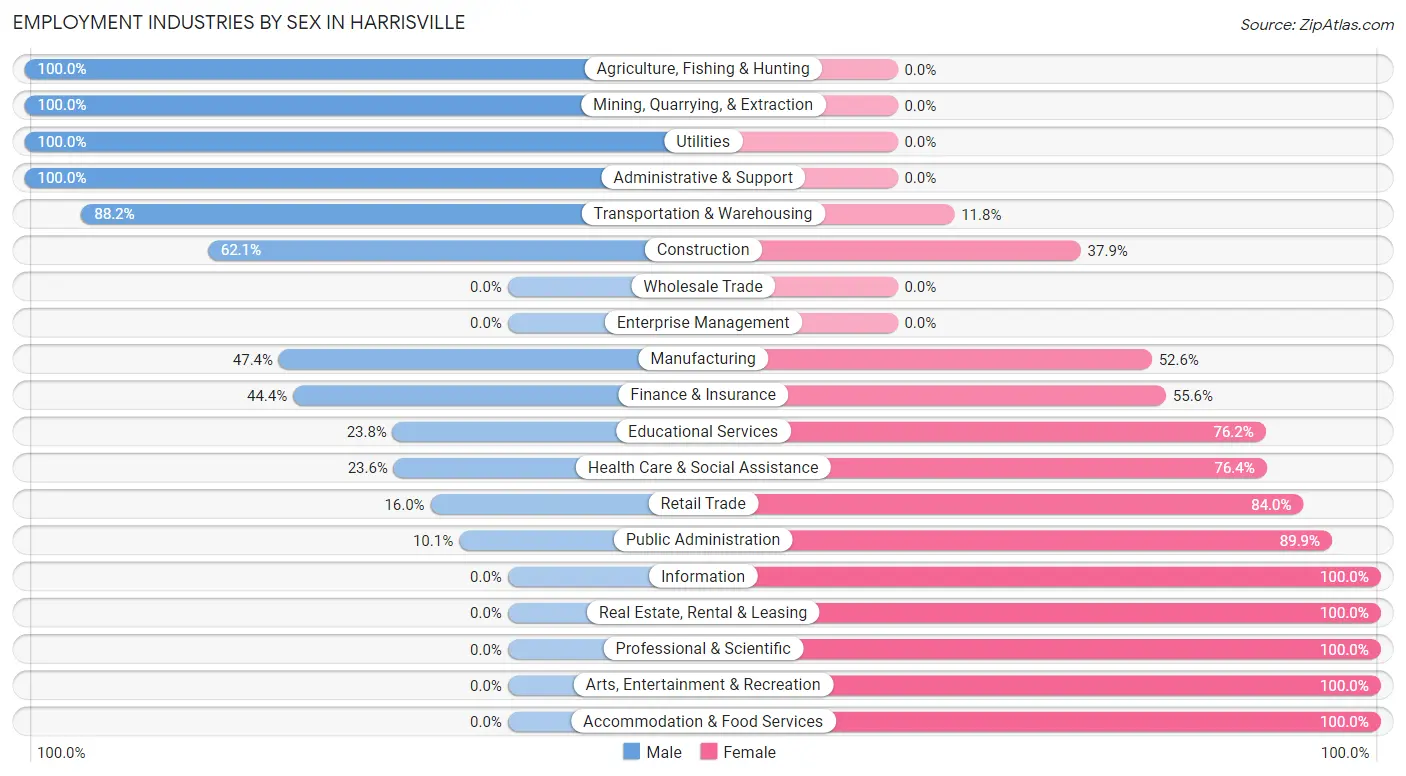
Employment Industries by Sex in Harrisville
The Harrisville industries that see more men than women are Agriculture, Fishing & Hunting (100.0%), Mining, Quarrying, & Extraction (100.0%), and Utilities (100.0%), whereas the industries that tend to have a higher number of women are Information (100.0%), Real Estate, Rental & Leasing (100.0%), and Professional & Scientific (100.0%).
| Industry | Male | Female |
| Agriculture, Fishing & Hunting | 10 (100.0%) | 0 (0.0%) |
| Mining, Quarrying, & Extraction | 23 (100.0%) | 0 (0.0%) |
| Construction | 18 (62.1%) | 11 (37.9%) |
| Manufacturing | 27 (47.4%) | 30 (52.6%) |
| Wholesale Trade | 0 (0.0%) | 0 (0.0%) |
| Retail Trade | 8 (16.0%) | 42 (84.0%) |
| Transportation & Warehousing | 30 (88.2%) | 4 (11.8%) |
| Utilities | 6 (100.0%) | 0 (0.0%) |
| Information | 0 (0.0%) | 15 (100.0%) |
| Finance & Insurance | 8 (44.4%) | 10 (55.6%) |
| Real Estate, Rental & Leasing | 0 (0.0%) | 17 (100.0%) |
| Professional & Scientific | 0 (0.0%) | 8 (100.0%) |
| Enterprise Management | 0 (0.0%) | 0 (0.0%) |
| Administrative & Support | 11 (100.0%) | 0 (0.0%) |
| Educational Services | 10 (23.8%) | 32 (76.2%) |
| Health Care & Social Assistance | 21 (23.6%) | 68 (76.4%) |
| Arts, Entertainment & Recreation | 0 (0.0%) | 8 (100.0%) |
| Accommodation & Food Services | 0 (0.0%) | 11 (100.0%) |
| Public Administration | 11 (10.1%) | 98 (89.9%) |
| Total | 196 (35.1%) | 362 (64.9%) |
Education in Harrisville
School Enrollment in Harrisville
The most common levels of schooling among the 418 students in Harrisville are middle school (124 | 29.7%), high school (106 | 25.4%), and elementary school (87 | 20.8%).
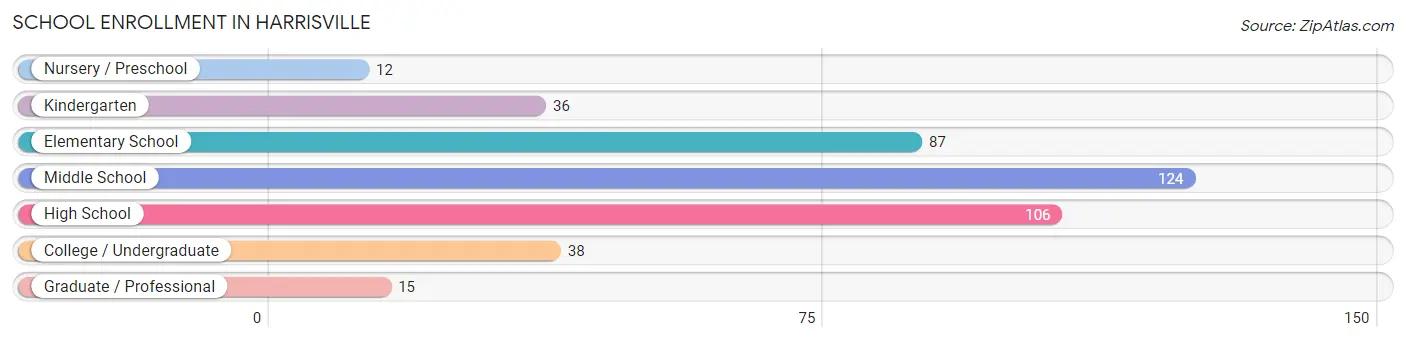
| School Level | # Students | % Students |
| Nursery / Preschool | 12 | 2.9% |
| Kindergarten | 36 | 8.6% |
| Elementary School | 87 | 20.8% |
| Middle School | 124 | 29.7% |
| High School | 106 | 25.4% |
| College / Undergraduate | 38 | 9.1% |
| Graduate / Professional | 15 | 3.6% |
| Total | 418 | 100.0% |
School Enrollment by Age by Funding Source in Harrisville
Out of a total of 418 students who are enrolled in schools in Harrisville, 66 (15.8%) attend a private institution, while the remaining 352 (84.2%) are enrolled in public schools. The age group of 3 to 4 year olds has the highest likelihood of being enrolled in private schools, with 12 (100.0% in the age bracket) enrolled. Conversely, the age group of 5 to 9 year old has the lowest likelihood of being enrolled in a private school, with 104 (100.0% in the age bracket) attending a public institution.
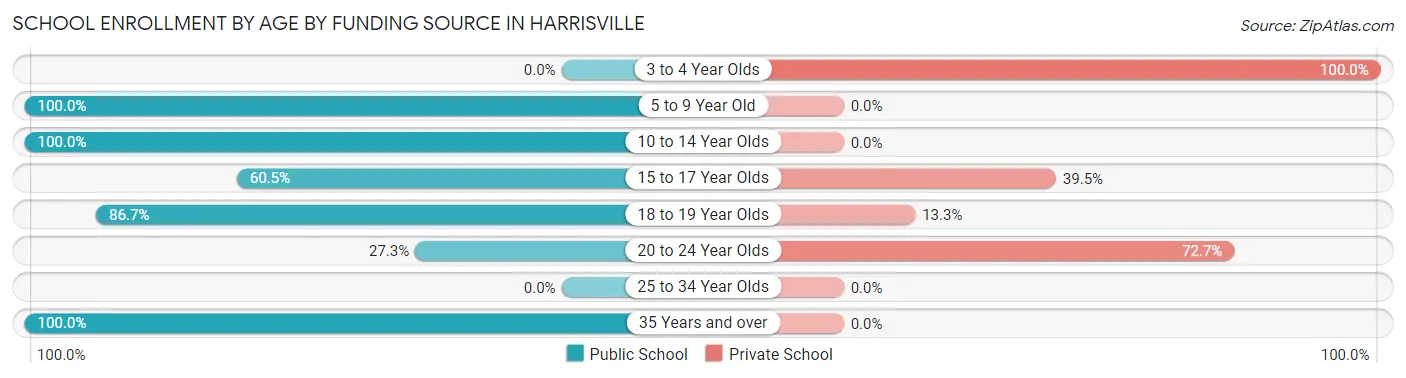
| Age Bracket | Public School | Private School |
| 3 to 4 Year Olds | 0 (0.0%) | 12 (100.0%) |
| 5 to 9 Year Old | 104 (100.0%) | 0 (0.0%) |
| 10 to 14 Year Olds | 155 (100.0%) | 0 (0.0%) |
| 15 to 17 Year Olds | 52 (60.5%) | 34 (39.5%) |
| 18 to 19 Year Olds | 26 (86.7%) | 4 (13.3%) |
| 20 to 24 Year Olds | 6 (27.3%) | 16 (72.7%) |
| 25 to 34 Year Olds | 0 (0.0%) | 0 (0.0%) |
| 35 Years and over | 9 (100.0%) | 0 (0.0%) |
| Total | 352 (84.2%) | 66 (15.8%) |
Educational Attainment by Field of Study in Harrisville
Business (70 | 40.7%), education (68 | 39.5%), visual & performing arts (12 | 7.0%), science & technology (10 | 5.8%), and bio, nature & agricultural (7 | 4.1%) are the most common fields of study among 172 individuals in Harrisville who have obtained a bachelor's degree or higher.
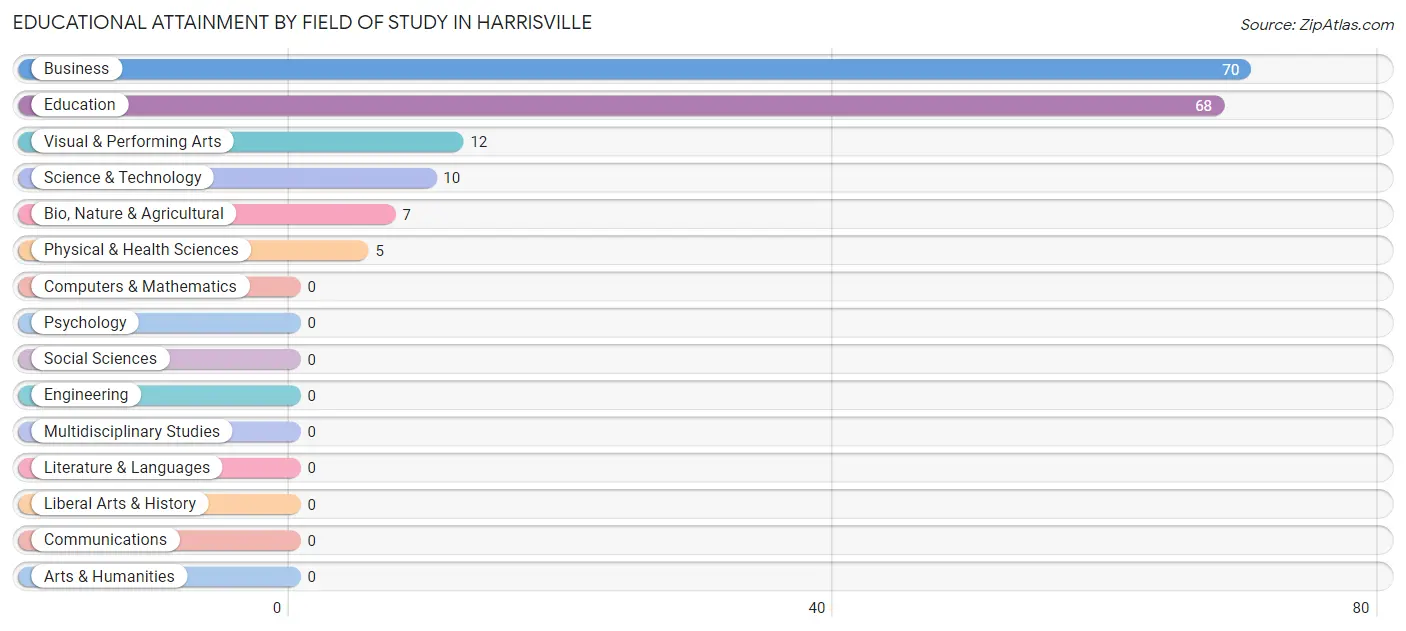
| Field of Study | # Graduates | % Graduates |
| Computers & Mathematics | 0 | 0.0% |
| Bio, Nature & Agricultural | 7 | 4.1% |
| Physical & Health Sciences | 5 | 2.9% |
| Psychology | 0 | 0.0% |
| Social Sciences | 0 | 0.0% |
| Engineering | 0 | 0.0% |
| Multidisciplinary Studies | 0 | 0.0% |
| Science & Technology | 10 | 5.8% |
| Business | 70 | 40.7% |
| Education | 68 | 39.5% |
| Literature & Languages | 0 | 0.0% |
| Liberal Arts & History | 0 | 0.0% |
| Visual & Performing Arts | 12 | 7.0% |
| Communications | 0 | 0.0% |
| Arts & Humanities | 0 | 0.0% |
| Total | 172 | 100.0% |
Transportation & Commute in Harrisville
Vehicle Availability by Sex in Harrisville
The most prevalent vehicle ownership categories in Harrisville are males with 2 vehicles (70, accounting for 35.7%) and females with 2 vehicles (122, making up 19.3%).
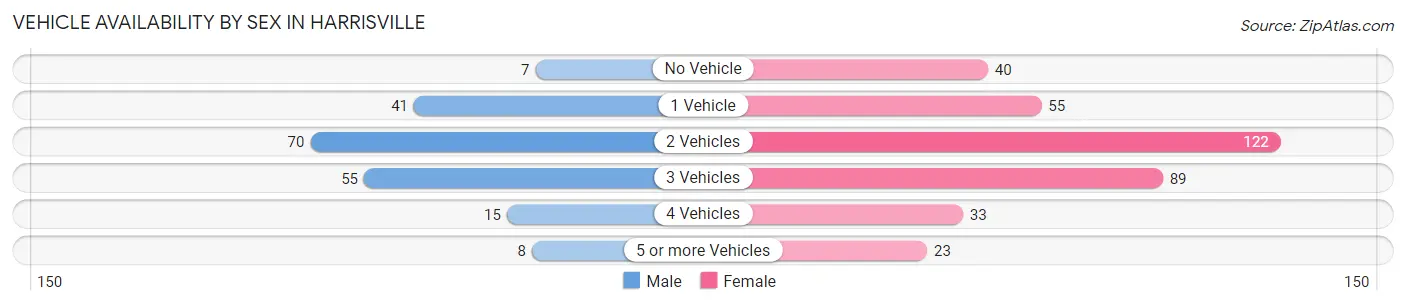
| Vehicles Available | Male | Female |
| No Vehicle | 7 (3.6%) | 40 (11.1%) |
| 1 Vehicle | 41 (20.9%) | 55 (15.2%) |
| 2 Vehicles | 70 (35.7%) | 122 (33.7%) |
| 3 Vehicles | 55 (28.1%) | 89 (24.6%) |
| 4 Vehicles | 15 (7.6%) | 33 (9.1%) |
| 5 or more Vehicles | 8 (4.1%) | 23 (6.4%) |
| Total | 196 (100.0%) | 362 (100.0%) |
Commute Time in Harrisville
The most frequently occuring commute durations in Harrisville are 5 to 9 minutes (111 commuters, 21.6%), 10 to 14 minutes (90 commuters, 17.5%), and 45 to 59 minutes (68 commuters, 13.2%).
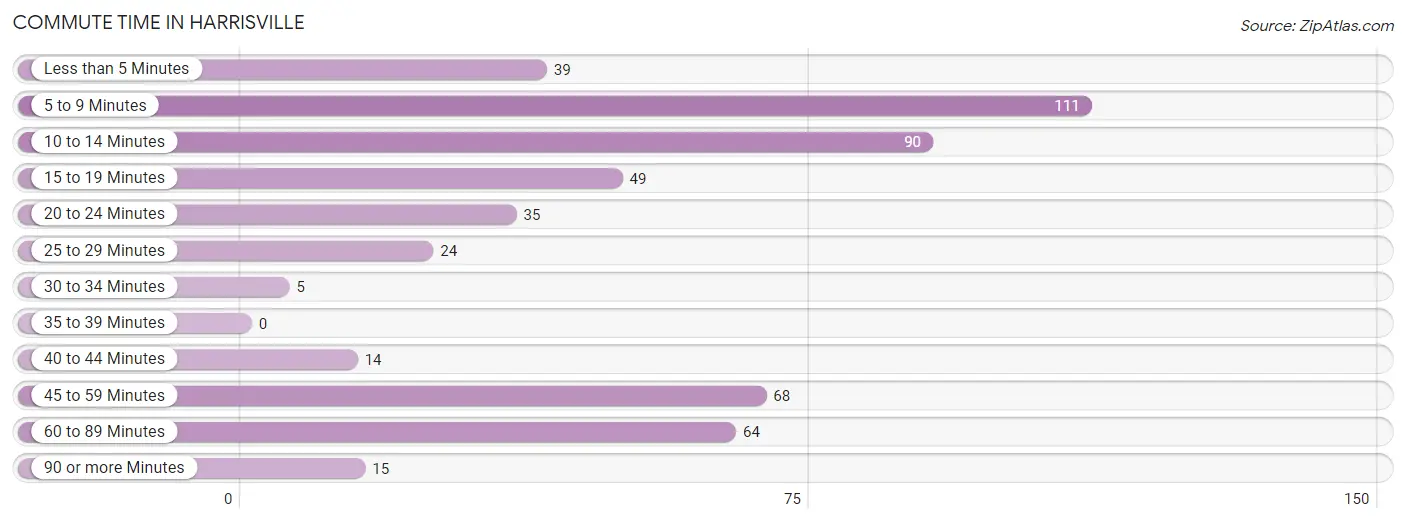
| Commute Time | # Commuters | % Commuters |
| Less than 5 Minutes | 39 | 7.6% |
| 5 to 9 Minutes | 111 | 21.6% |
| 10 to 14 Minutes | 90 | 17.5% |
| 15 to 19 Minutes | 49 | 9.5% |
| 20 to 24 Minutes | 35 | 6.8% |
| 25 to 29 Minutes | 24 | 4.7% |
| 30 to 34 Minutes | 5 | 1.0% |
| 35 to 39 Minutes | 0 | 0.0% |
| 40 to 44 Minutes | 14 | 2.7% |
| 45 to 59 Minutes | 68 | 13.2% |
| 60 to 89 Minutes | 64 | 12.4% |
| 90 or more Minutes | 15 | 2.9% |
Commute Time by Sex in Harrisville
The most common commute times in Harrisville are 5 to 9 minutes (41 commuters, 21.8%) for males and 5 to 9 minutes (70 commuters, 21.5%) for females.
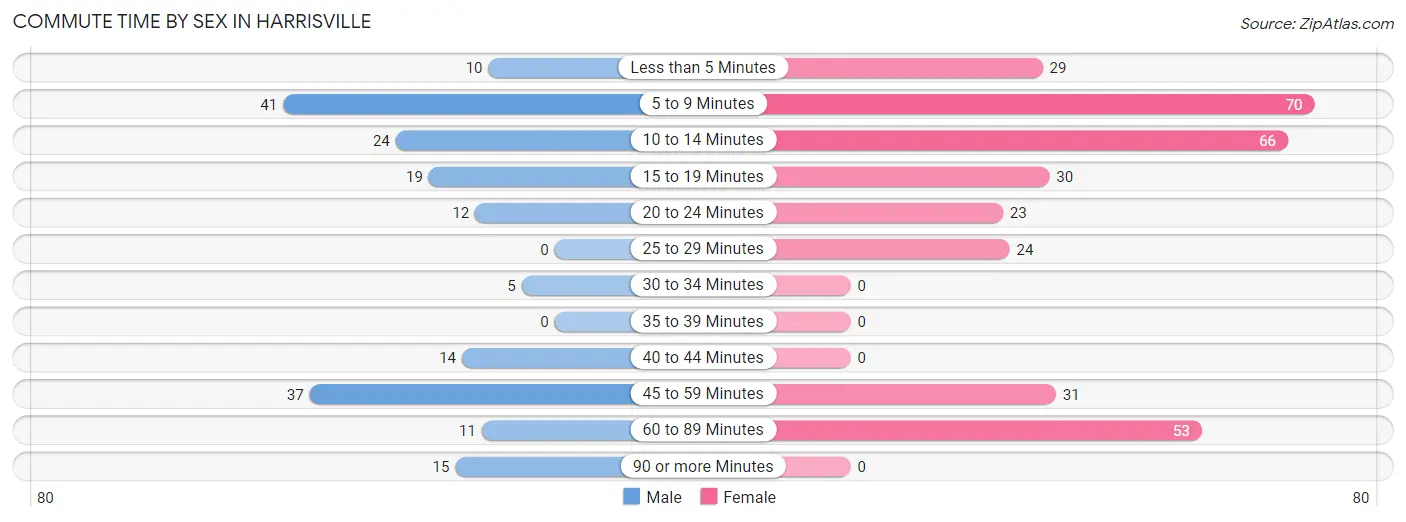
| Commute Time | Male | Female |
| Less than 5 Minutes | 10 (5.3%) | 29 (8.9%) |
| 5 to 9 Minutes | 41 (21.8%) | 70 (21.5%) |
| 10 to 14 Minutes | 24 (12.8%) | 66 (20.3%) |
| 15 to 19 Minutes | 19 (10.1%) | 30 (9.2%) |
| 20 to 24 Minutes | 12 (6.4%) | 23 (7.1%) |
| 25 to 29 Minutes | 0 (0.0%) | 24 (7.4%) |
| 30 to 34 Minutes | 5 (2.7%) | 0 (0.0%) |
| 35 to 39 Minutes | 0 (0.0%) | 0 (0.0%) |
| 40 to 44 Minutes | 14 (7.4%) | 0 (0.0%) |
| 45 to 59 Minutes | 37 (19.7%) | 31 (9.5%) |
| 60 to 89 Minutes | 11 (5.9%) | 53 (16.3%) |
| 90 or more Minutes | 15 (8.0%) | 0 (0.0%) |
Time of Departure to Work by Sex in Harrisville
The most frequent times of departure to work in Harrisville are 9:00 AM to 9:59 AM (27, 14.4%) for males and 7:30 AM to 7:59 AM (63, 19.3%) for females.
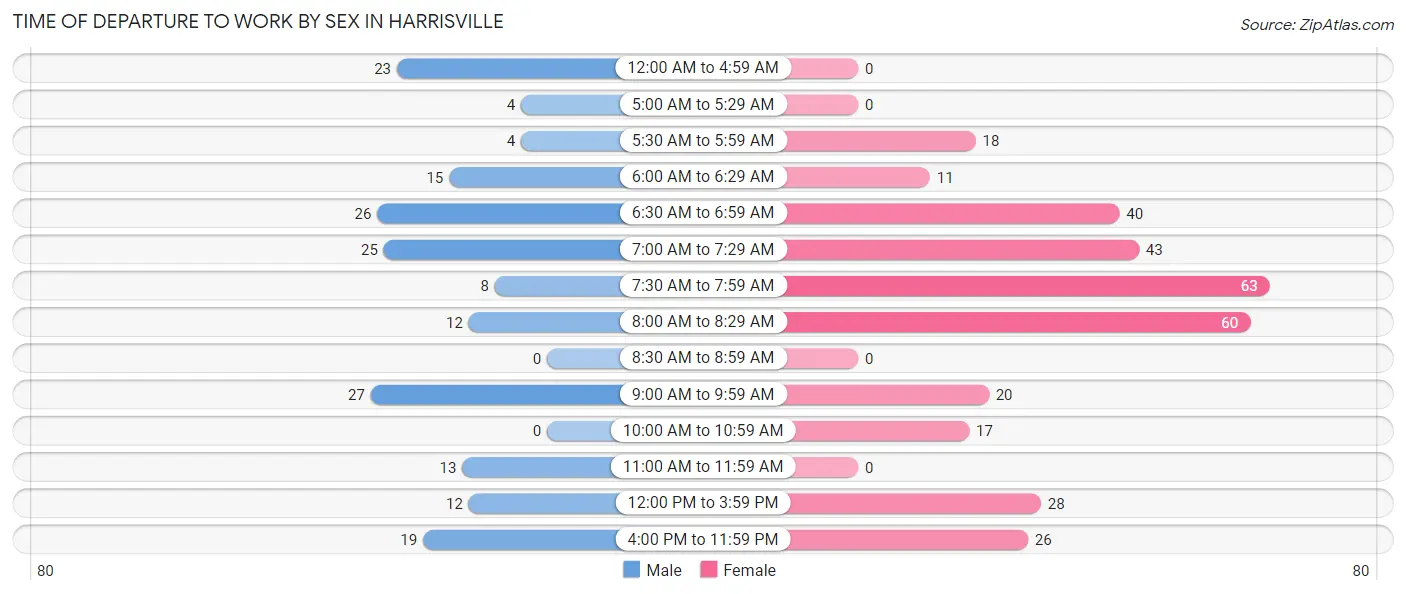
| Time of Departure | Male | Female |
| 12:00 AM to 4:59 AM | 23 (12.2%) | 0 (0.0%) |
| 5:00 AM to 5:29 AM | 4 (2.1%) | 0 (0.0%) |
| 5:30 AM to 5:59 AM | 4 (2.1%) | 18 (5.5%) |
| 6:00 AM to 6:29 AM | 15 (8.0%) | 11 (3.4%) |
| 6:30 AM to 6:59 AM | 26 (13.8%) | 40 (12.3%) |
| 7:00 AM to 7:29 AM | 25 (13.3%) | 43 (13.2%) |
| 7:30 AM to 7:59 AM | 8 (4.3%) | 63 (19.3%) |
| 8:00 AM to 8:29 AM | 12 (6.4%) | 60 (18.4%) |
| 8:30 AM to 8:59 AM | 0 (0.0%) | 0 (0.0%) |
| 9:00 AM to 9:59 AM | 27 (14.4%) | 20 (6.1%) |
| 10:00 AM to 10:59 AM | 0 (0.0%) | 17 (5.2%) |
| 11:00 AM to 11:59 AM | 13 (6.9%) | 0 (0.0%) |
| 12:00 PM to 3:59 PM | 12 (6.4%) | 28 (8.6%) |
| 4:00 PM to 11:59 PM | 19 (10.1%) | 26 (8.0%) |
| Total | 188 (100.0%) | 326 (100.0%) |
Housing Occupancy in Harrisville
Occupancy by Ownership in Harrisville
Of the total 693 dwellings in Harrisville, owner-occupied units account for 491 (70.9%), while renter-occupied units make up 202 (29.1%).
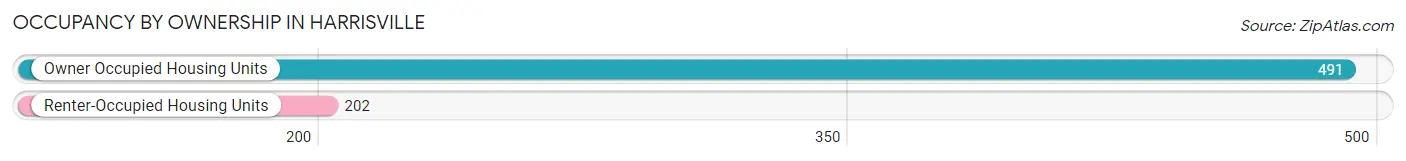
| Occupancy | # Housing Units | % Housing Units |
| Owner Occupied Housing Units | 491 | 70.9% |
| Renter-Occupied Housing Units | 202 | 29.1% |
| Total Occupied Housing Units | 693 | 100.0% |
Occupancy by Household Size in Harrisville
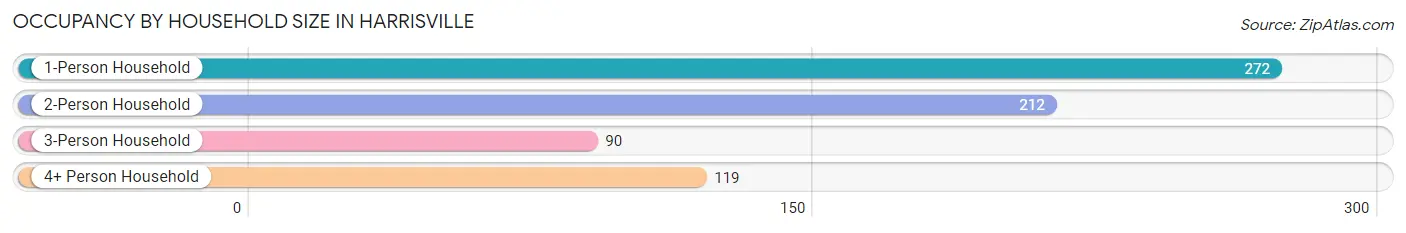
| Household Size | # Housing Units | % Housing Units |
| 1-Person Household | 272 | 39.3% |
| 2-Person Household | 212 | 30.6% |
| 3-Person Household | 90 | 13.0% |
| 4+ Person Household | 119 | 17.2% |
| Total Housing Units | 693 | 100.0% |
Occupancy by Ownership by Household Size in Harrisville
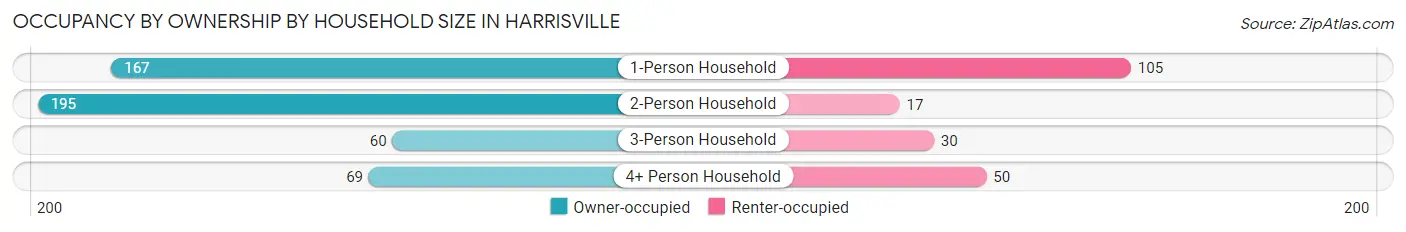
| Household Size | Owner-occupied | Renter-occupied |
| 1-Person Household | 167 (61.4%) | 105 (38.6%) |
| 2-Person Household | 195 (92.0%) | 17 (8.0%) |
| 3-Person Household | 60 (66.7%) | 30 (33.3%) |
| 4+ Person Household | 69 (58.0%) | 50 (42.0%) |
| Total Housing Units | 491 (70.9%) | 202 (29.1%) |
Occupancy by Educational Attainment in Harrisville
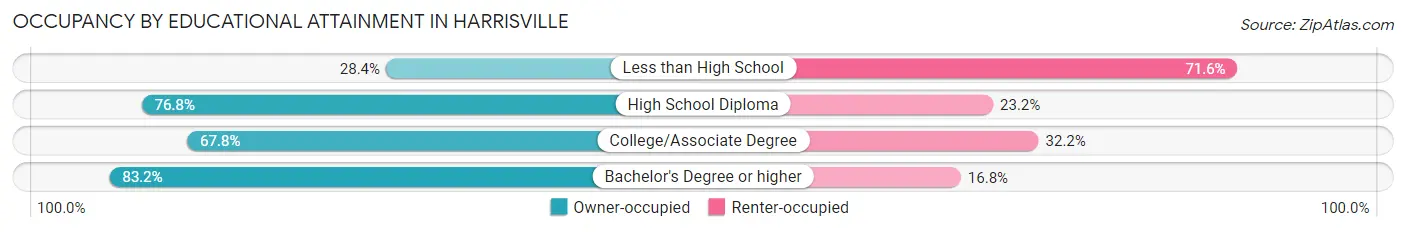
| Household Size | Owner-occupied | Renter-occupied |
| Less than High School | 21 (28.4%) | 53 (71.6%) |
| High School Diploma | 265 (76.8%) | 80 (23.2%) |
| College/Associate Degree | 101 (67.8%) | 48 (32.2%) |
| Bachelor's Degree or higher | 104 (83.2%) | 21 (16.8%) |
Occupancy by Age of Householder in Harrisville
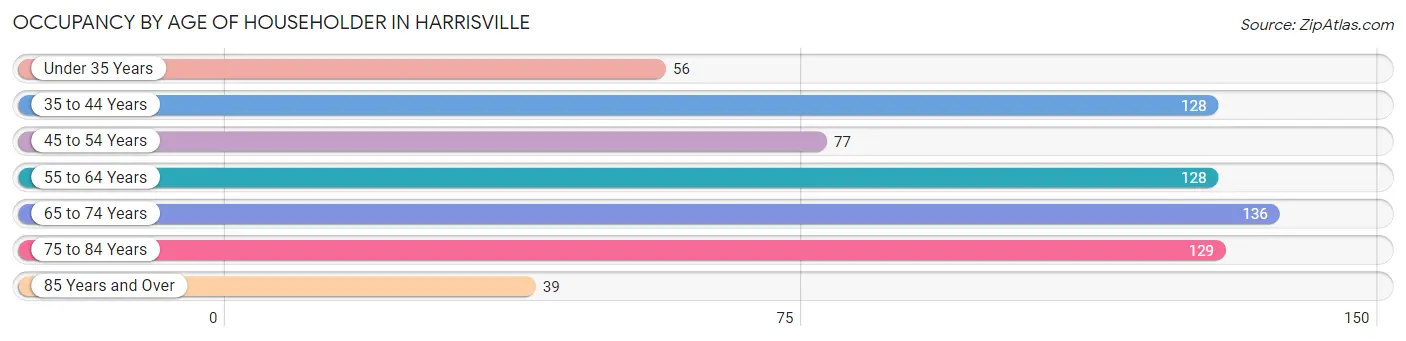
| Age Bracket | # Households | % Households |
| Under 35 Years | 56 | 8.1% |
| 35 to 44 Years | 128 | 18.5% |
| 45 to 54 Years | 77 | 11.1% |
| 55 to 64 Years | 128 | 18.5% |
| 65 to 74 Years | 136 | 19.6% |
| 75 to 84 Years | 129 | 18.6% |
| 85 Years and Over | 39 | 5.6% |
| Total | 693 | 100.0% |
Housing Finances in Harrisville
Median Income by Occupancy in Harrisville
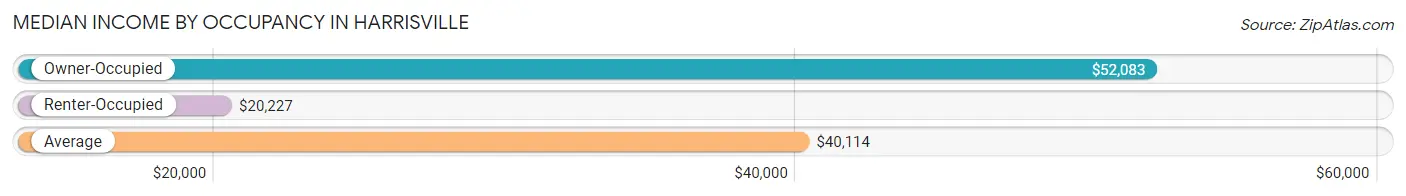
| Occupancy Type | # Households | Median Income |
| Owner-Occupied | 491 (70.9%) | $52,083 |
| Renter-Occupied | 202 (29.1%) | $20,227 |
| Average | 693 (100.0%) | $40,114 |
Occupancy by Householder Income Bracket in Harrisville
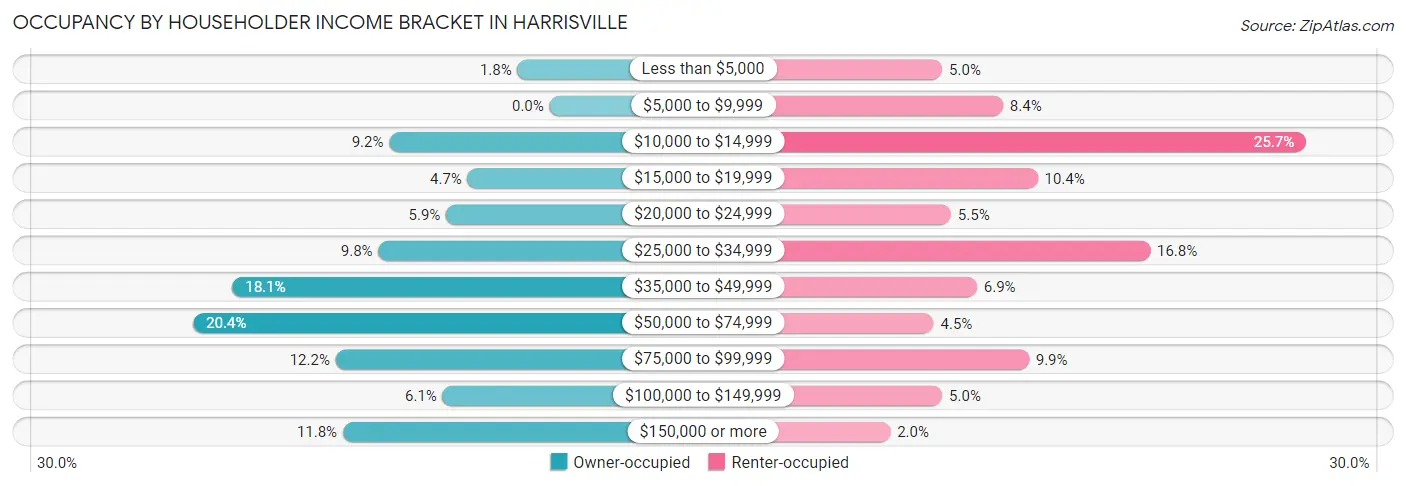
| Income Bracket | Owner-occupied | Renter-occupied |
| Less than $5,000 | 9 (1.8%) | 10 (5.0%) |
| $5,000 to $9,999 | 0 (0.0%) | 17 (8.4%) |
| $10,000 to $14,999 | 45 (9.2%) | 52 (25.7%) |
| $15,000 to $19,999 | 23 (4.7%) | 21 (10.4%) |
| $20,000 to $24,999 | 29 (5.9%) | 11 (5.4%) |
| $25,000 to $34,999 | 48 (9.8%) | 34 (16.8%) |
| $35,000 to $49,999 | 89 (18.1%) | 14 (6.9%) |
| $50,000 to $74,999 | 100 (20.4%) | 9 (4.5%) |
| $75,000 to $99,999 | 60 (12.2%) | 20 (9.9%) |
| $100,000 to $149,999 | 30 (6.1%) | 10 (5.0%) |
| $150,000 or more | 58 (11.8%) | 4 (2.0%) |
| Total | 491 (100.0%) | 202 (100.0%) |
Monthly Housing Cost Tiers in Harrisville
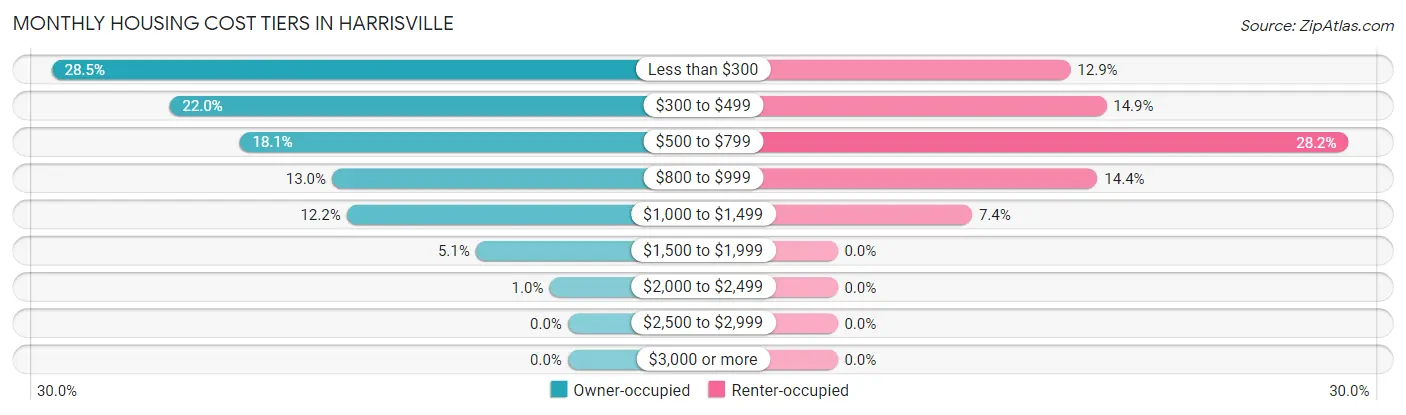
| Monthly Cost | Owner-occupied | Renter-occupied |
| Less than $300 | 140 (28.5%) | 26 (12.9%) |
| $300 to $499 | 108 (22.0%) | 30 (14.8%) |
| $500 to $799 | 89 (18.1%) | 57 (28.2%) |
| $800 to $999 | 64 (13.0%) | 29 (14.4%) |
| $1,000 to $1,499 | 60 (12.2%) | 15 (7.4%) |
| $1,500 to $1,999 | 25 (5.1%) | 0 (0.0%) |
| $2,000 to $2,499 | 5 (1.0%) | 0 (0.0%) |
| $2,500 to $2,999 | 0 (0.0%) | 0 (0.0%) |
| $3,000 or more | 0 (0.0%) | 0 (0.0%) |
| Total | 491 (100.0%) | 202 (100.0%) |
Physical Housing Characteristics in Harrisville
Housing Structures in Harrisville
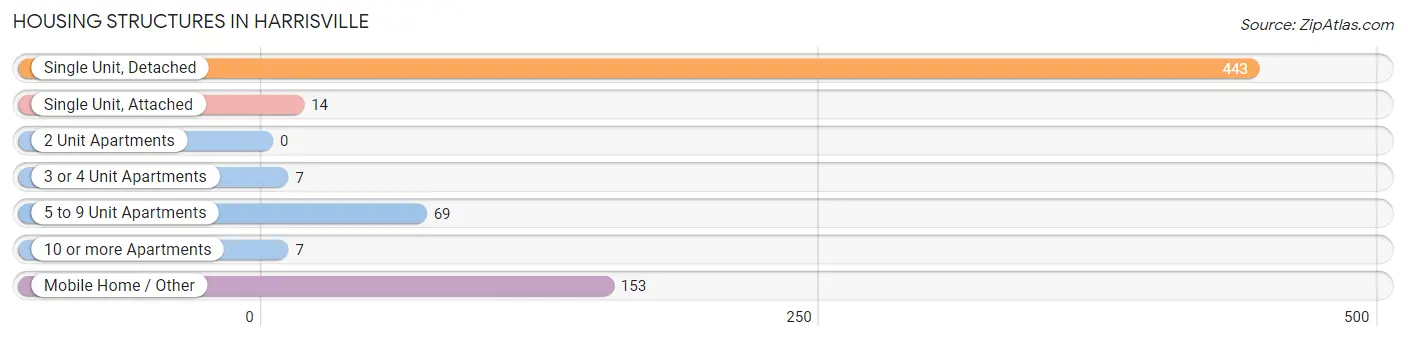
| Structure Type | # Housing Units | % Housing Units |
| Single Unit, Detached | 443 | 63.9% |
| Single Unit, Attached | 14 | 2.0% |
| 2 Unit Apartments | 0 | 0.0% |
| 3 or 4 Unit Apartments | 7 | 1.0% |
| 5 to 9 Unit Apartments | 69 | 10.0% |
| 10 or more Apartments | 7 | 1.0% |
| Mobile Home / Other | 153 | 22.1% |
| Total | 693 | 100.0% |
Housing Structures by Occupancy in Harrisville
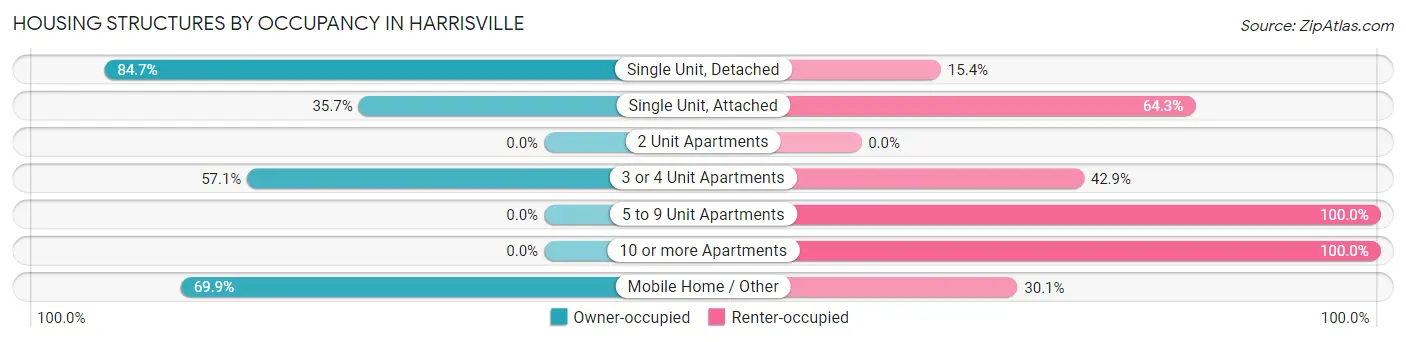
| Structure Type | Owner-occupied | Renter-occupied |
| Single Unit, Detached | 375 (84.7%) | 68 (15.3%) |
| Single Unit, Attached | 5 (35.7%) | 9 (64.3%) |
| 2 Unit Apartments | 0 (0.0%) | 0 (0.0%) |
| 3 or 4 Unit Apartments | 4 (57.1%) | 3 (42.9%) |
| 5 to 9 Unit Apartments | 0 (0.0%) | 69 (100.0%) |
| 10 or more Apartments | 0 (0.0%) | 7 (100.0%) |
| Mobile Home / Other | 107 (69.9%) | 46 (30.1%) |
| Total | 491 (70.9%) | 202 (29.1%) |
Housing Structures by Number of Rooms in Harrisville
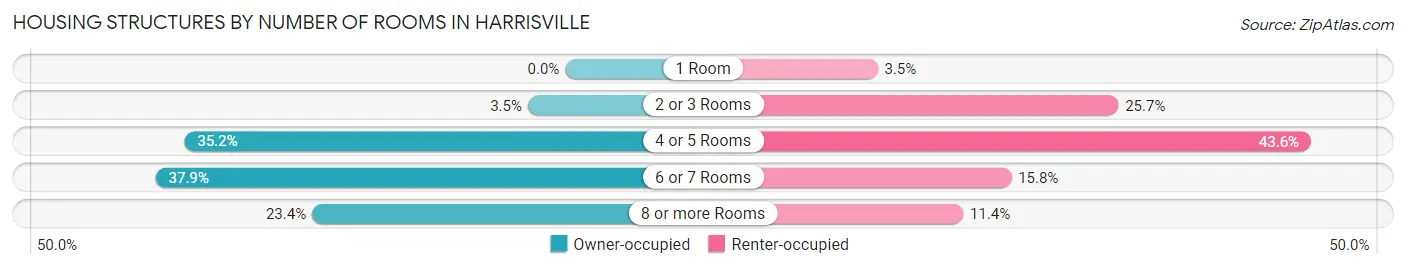
| Number of Rooms | Owner-occupied | Renter-occupied |
| 1 Room | 0 (0.0%) | 7 (3.5%) |
| 2 or 3 Rooms | 17 (3.5%) | 52 (25.7%) |
| 4 or 5 Rooms | 173 (35.2%) | 88 (43.6%) |
| 6 or 7 Rooms | 186 (37.9%) | 32 (15.8%) |
| 8 or more Rooms | 115 (23.4%) | 23 (11.4%) |
| Total | 491 (100.0%) | 202 (100.0%) |
Housing Structure by Heating Type in Harrisville
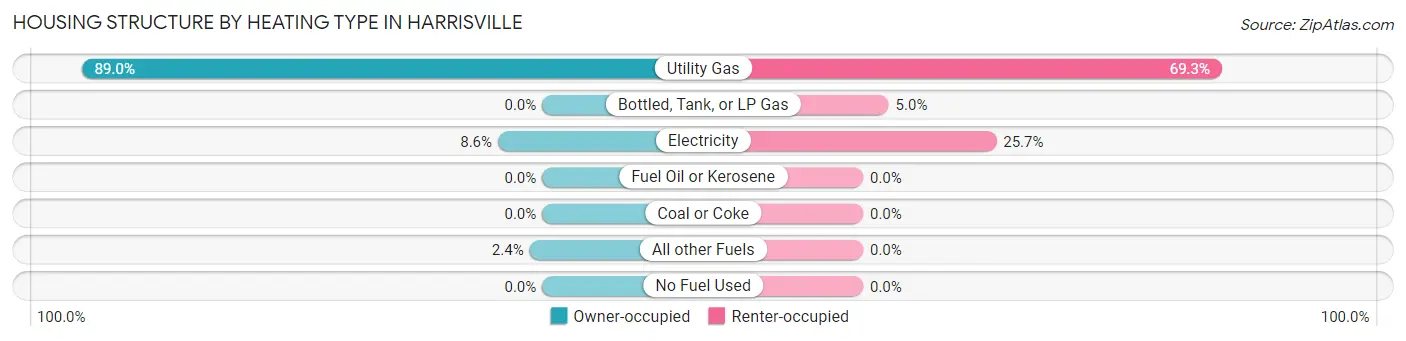
| Heating Type | Owner-occupied | Renter-occupied |
| Utility Gas | 437 (89.0%) | 140 (69.3%) |
| Bottled, Tank, or LP Gas | 0 (0.0%) | 10 (5.0%) |
| Electricity | 42 (8.6%) | 52 (25.7%) |
| Fuel Oil or Kerosene | 0 (0.0%) | 0 (0.0%) |
| Coal or Coke | 0 (0.0%) | 0 (0.0%) |
| All other Fuels | 12 (2.4%) | 0 (0.0%) |
| No Fuel Used | 0 (0.0%) | 0 (0.0%) |
| Total | 491 (100.0%) | 202 (100.0%) |
Household Vehicle Usage in Harrisville
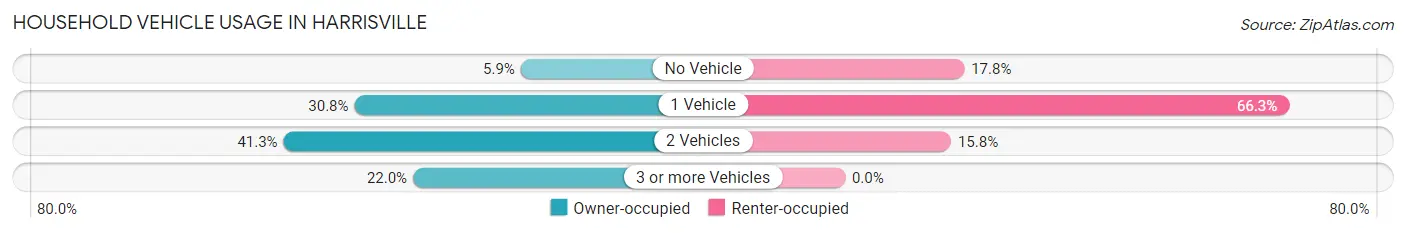
| Vehicles per Household | Owner-occupied | Renter-occupied |
| No Vehicle | 29 (5.9%) | 36 (17.8%) |
| 1 Vehicle | 151 (30.7%) | 134 (66.3%) |
| 2 Vehicles | 203 (41.3%) | 32 (15.8%) |
| 3 or more Vehicles | 108 (22.0%) | 0 (0.0%) |
| Total | 491 (100.0%) | 202 (100.0%) |
Real Estate & Mortgages in Harrisville
Real Estate and Mortgage Overview in Harrisville
| Characteristic | Without Mortgage | With Mortgage |
| Housing Units | 270 | 221 |
| Median Property Value | $102,100 | $126,500 |
| Median Household Income | $39,000 | $20 |
| Monthly Housing Costs | $297 | $0 |
| Real Estate Taxes | $564 | $14 |
Property Value by Mortgage Status in Harrisville
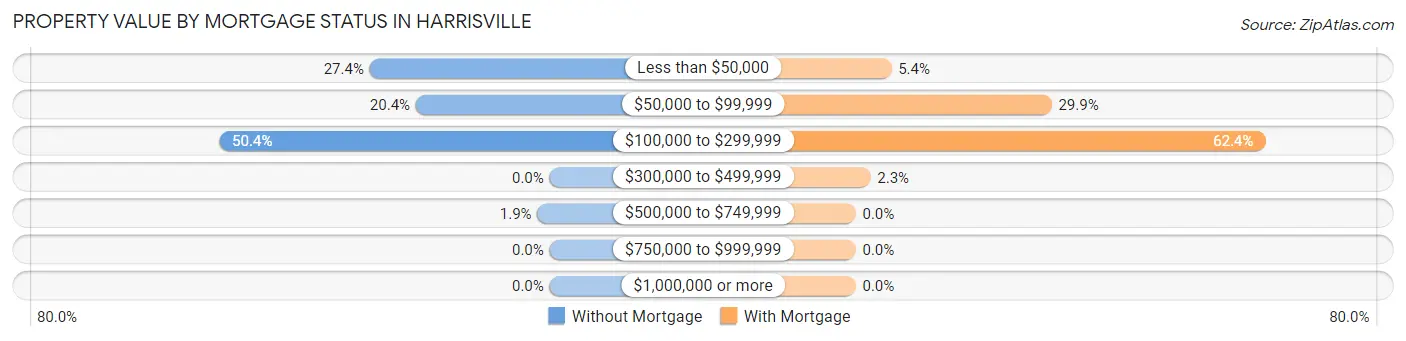
| Property Value | Without Mortgage | With Mortgage |
| Less than $50,000 | 74 (27.4%) | 12 (5.4%) |
| $50,000 to $99,999 | 55 (20.4%) | 66 (29.9%) |
| $100,000 to $299,999 | 136 (50.4%) | 138 (62.4%) |
| $300,000 to $499,999 | 0 (0.0%) | 5 (2.3%) |
| $500,000 to $749,999 | 5 (1.8%) | 0 (0.0%) |
| $750,000 to $999,999 | 0 (0.0%) | 0 (0.0%) |
| $1,000,000 or more | 0 (0.0%) | 0 (0.0%) |
| Total | 270 (100.0%) | 221 (100.0%) |
Household Income by Mortgage Status in Harrisville
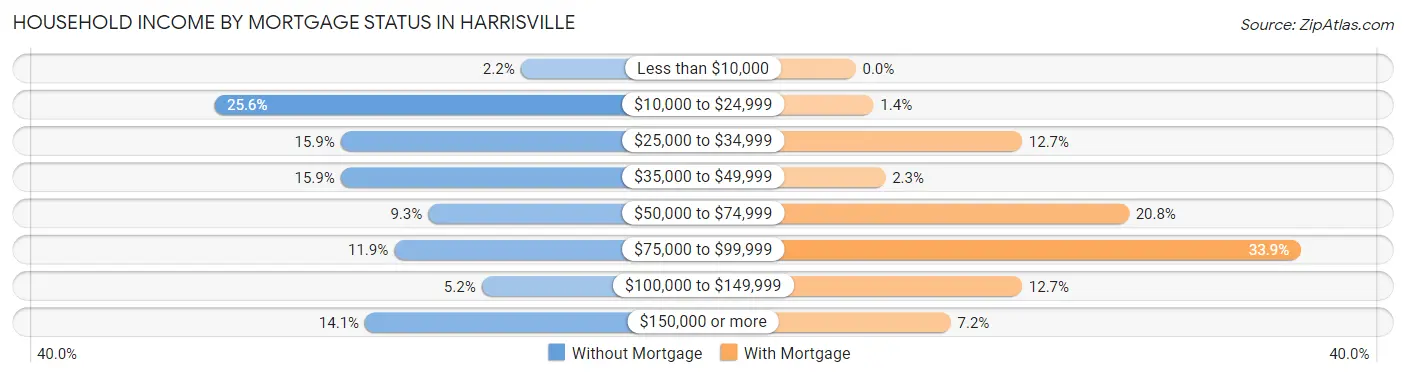
| Household Income | Without Mortgage | With Mortgage |
| Less than $10,000 | 6 (2.2%) | 0 (0.0%) |
| $10,000 to $24,999 | 69 (25.6%) | 3 (1.4%) |
| $25,000 to $34,999 | 43 (15.9%) | 28 (12.7%) |
| $35,000 to $49,999 | 43 (15.9%) | 5 (2.3%) |
| $50,000 to $74,999 | 25 (9.3%) | 46 (20.8%) |
| $75,000 to $99,999 | 32 (11.8%) | 75 (33.9%) |
| $100,000 to $149,999 | 14 (5.2%) | 28 (12.7%) |
| $150,000 or more | 38 (14.1%) | 16 (7.2%) |
| Total | 270 (100.0%) | 221 (100.0%) |
Property Value to Household Income Ratio in Harrisville
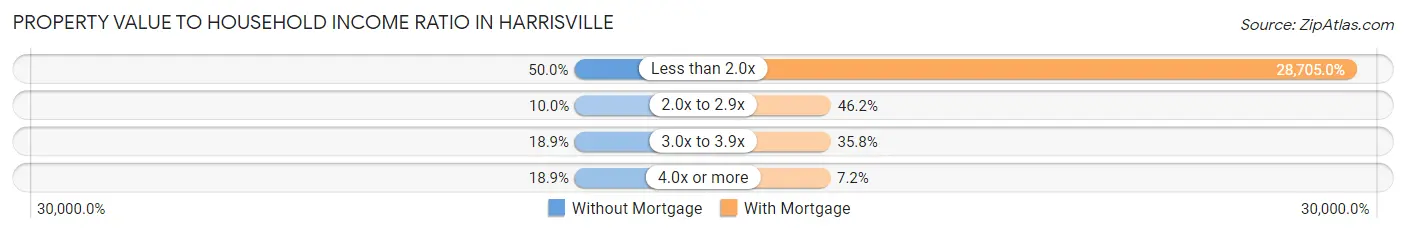
| Value-to-Income Ratio | Without Mortgage | With Mortgage |
| Less than 2.0x | 135 (50.0%) | 63,438 (28,705.0%) |
| 2.0x to 2.9x | 27 (10.0%) | 102 (46.2%) |
| 3.0x to 3.9x | 51 (18.9%) | 79 (35.7%) |
| 4.0x or more | 51 (18.9%) | 16 (7.2%) |
| Total | 270 (100.0%) | 221 (100.0%) |
Real Estate Taxes by Mortgage Status in Harrisville
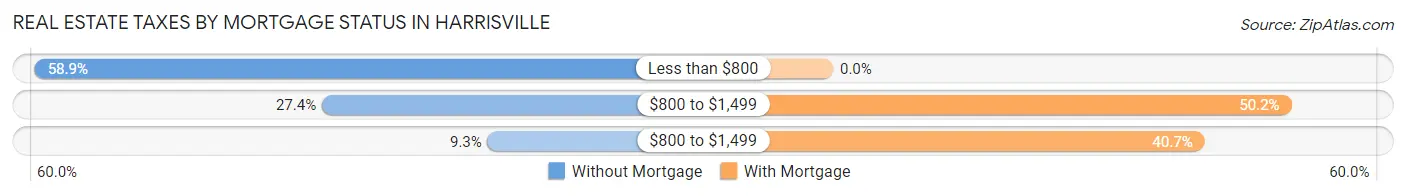
| Property Taxes | Without Mortgage | With Mortgage |
| Less than $800 | 159 (58.9%) | 0 (0.0%) |
| $800 to $1,499 | 74 (27.4%) | 111 (50.2%) |
| $800 to $1,499 | 25 (9.3%) | 90 (40.7%) |
| Total | 270 (100.0%) | 221 (100.0%) |
Health & Disability in Harrisville
Health Insurance Coverage by Age in Harrisville
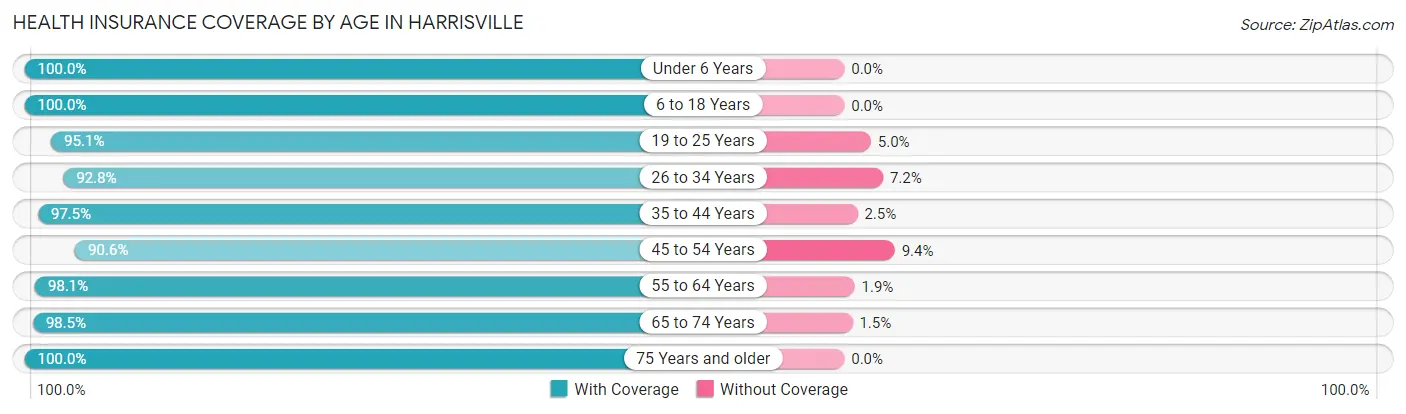
| Age Bracket | With Coverage | Without Coverage |
| Under 6 Years | 39 (100.0%) | 0 (0.0%) |
| 6 to 18 Years | 365 (100.0%) | 0 (0.0%) |
| 19 to 25 Years | 96 (95.1%) | 5 (5.0%) |
| 26 to 34 Years | 103 (92.8%) | 8 (7.2%) |
| 35 to 44 Years | 198 (97.5%) | 5 (2.5%) |
| 45 to 54 Years | 135 (90.6%) | 14 (9.4%) |
| 55 to 64 Years | 204 (98.1%) | 4 (1.9%) |
| 65 to 74 Years | 195 (98.5%) | 3 (1.5%) |
| 75 Years and older | 201 (100.0%) | 0 (0.0%) |
| Total | 1,536 (97.5%) | 39 (2.5%) |
Health Insurance Coverage by Citizenship Status in Harrisville
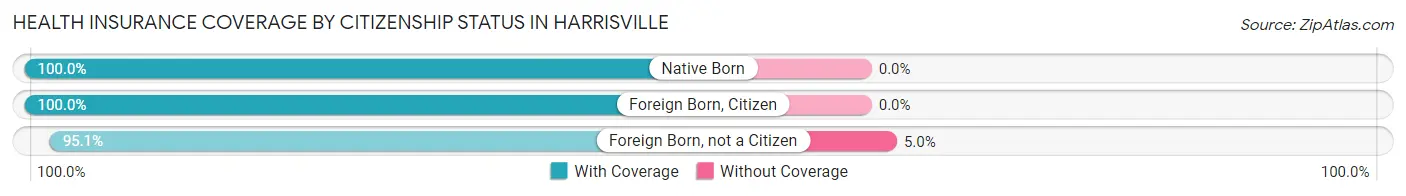
| Citizenship Status | With Coverage | Without Coverage |
| Native Born | 39 (100.0%) | 0 (0.0%) |
| Foreign Born, Citizen | 365 (100.0%) | 0 (0.0%) |
| Foreign Born, not a Citizen | 96 (95.1%) | 5 (5.0%) |
Health Insurance Coverage by Household Income in Harrisville
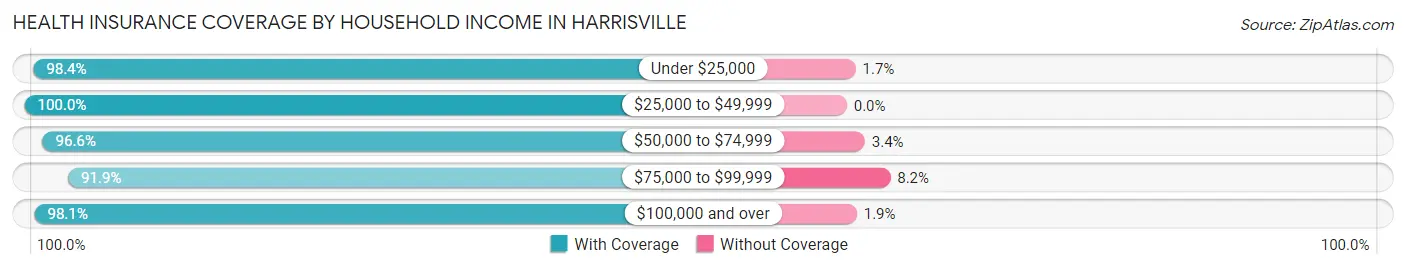
| Household Income | With Coverage | Without Coverage |
| Under $25,000 | 478 (98.4%) | 8 (1.7%) |
| $25,000 to $49,999 | 382 (100.0%) | 0 (0.0%) |
| $50,000 to $74,999 | 200 (96.6%) | 7 (3.4%) |
| $75,000 to $99,999 | 214 (91.8%) | 19 (8.2%) |
| $100,000 and over | 262 (98.1%) | 5 (1.9%) |
Public vs Private Health Insurance Coverage by Age in Harrisville
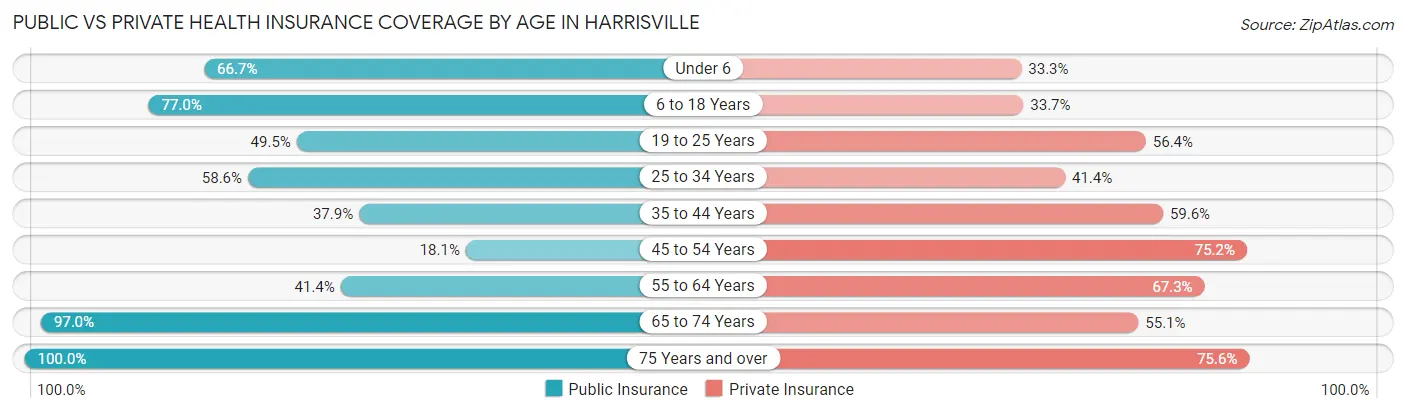
| Age Bracket | Public Insurance | Private Insurance |
| Under 6 | 26 (66.7%) | 13 (33.3%) |
| 6 to 18 Years | 281 (77.0%) | 123 (33.7%) |
| 19 to 25 Years | 50 (49.5%) | 57 (56.4%) |
| 25 to 34 Years | 65 (58.6%) | 46 (41.4%) |
| 35 to 44 Years | 77 (37.9%) | 121 (59.6%) |
| 45 to 54 Years | 27 (18.1%) | 112 (75.2%) |
| 55 to 64 Years | 86 (41.3%) | 140 (67.3%) |
| 65 to 74 Years | 192 (97.0%) | 109 (55.0%) |
| 75 Years and over | 201 (100.0%) | 152 (75.6%) |
| Total | 1,005 (63.8%) | 873 (55.4%) |
Disability Status by Sex by Age in Harrisville
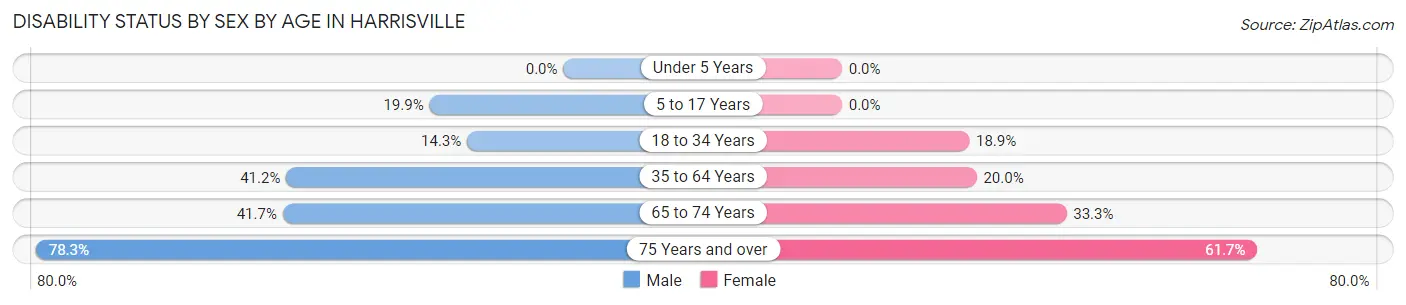
| Age Bracket | Male | Female |
| Under 5 Years | 0 (0.0%) | 0 (0.0%) |
| 5 to 17 Years | 33 (19.9%) | 0 (0.0%) |
| 18 to 34 Years | 15 (14.3%) | 24 (18.9%) |
| 35 to 64 Years | 107 (41.1%) | 60 (20.0%) |
| 65 to 74 Years | 35 (41.7%) | 38 (33.3%) |
| 75 Years and over | 47 (78.3%) | 87 (61.7%) |
Disability Class by Sex by Age in Harrisville
Disability Class: Hearing Difficulty
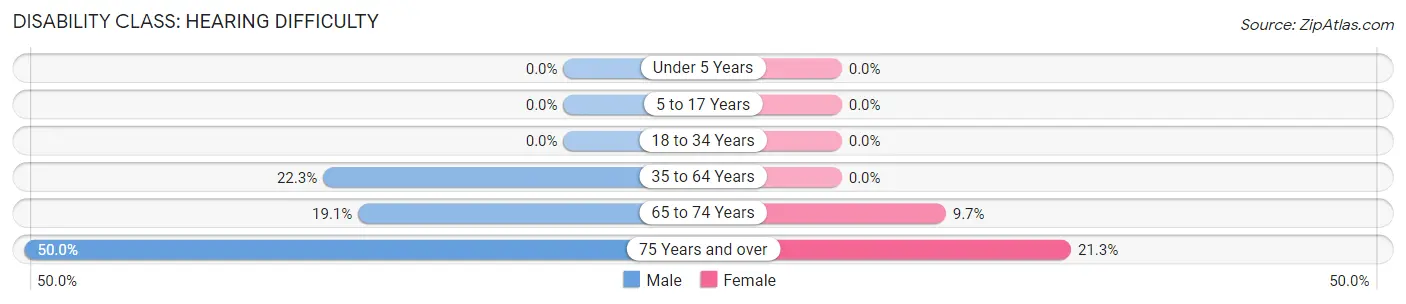
| Age Bracket | Male | Female |
| Under 5 Years | 0 (0.0%) | 0 (0.0%) |
| 5 to 17 Years | 0 (0.0%) | 0 (0.0%) |
| 18 to 34 Years | 0 (0.0%) | 0 (0.0%) |
| 35 to 64 Years | 58 (22.3%) | 0 (0.0%) |
| 65 to 74 Years | 16 (19.1%) | 11 (9.7%) |
| 75 Years and over | 30 (50.0%) | 30 (21.3%) |
Disability Class: Vision Difficulty
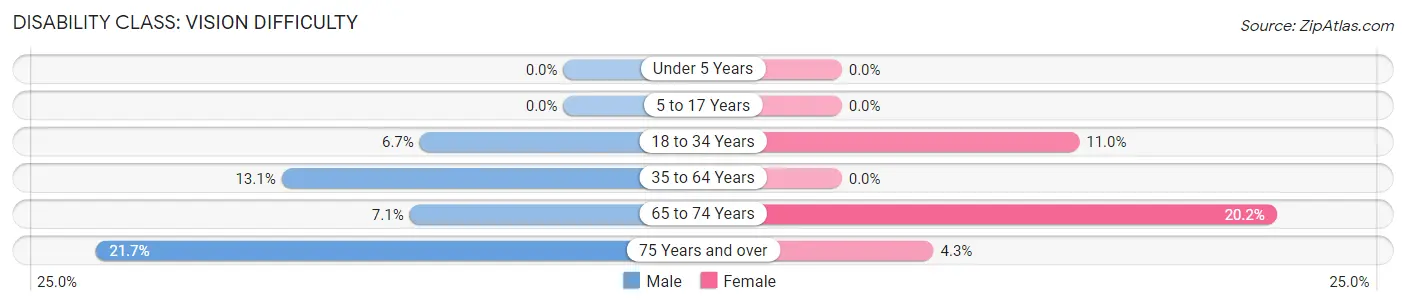
| Age Bracket | Male | Female |
| Under 5 Years | 0 (0.0%) | 0 (0.0%) |
| 5 to 17 Years | 0 (0.0%) | 0 (0.0%) |
| 18 to 34 Years | 7 (6.7%) | 14 (11.0%) |
| 35 to 64 Years | 34 (13.1%) | 0 (0.0%) |
| 65 to 74 Years | 6 (7.1%) | 23 (20.2%) |
| 75 Years and over | 13 (21.7%) | 6 (4.3%) |
Disability Class: Cognitive Difficulty
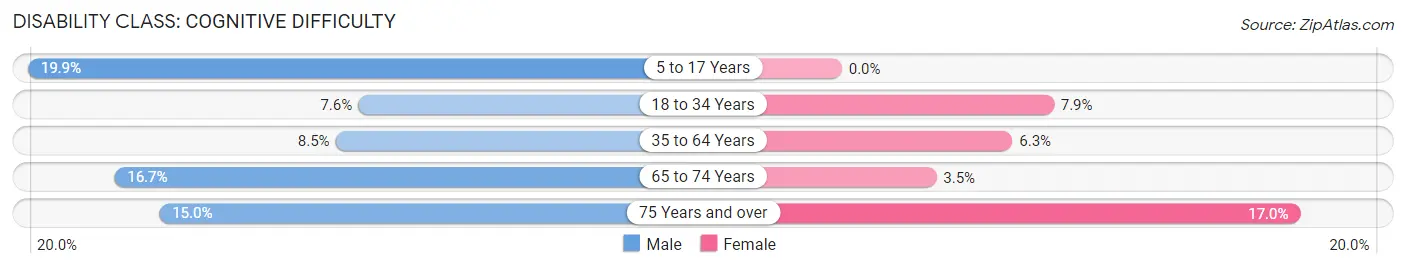
| Age Bracket | Male | Female |
| 5 to 17 Years | 33 (19.9%) | 0 (0.0%) |
| 18 to 34 Years | 8 (7.6%) | 10 (7.9%) |
| 35 to 64 Years | 22 (8.5%) | 19 (6.3%) |
| 65 to 74 Years | 14 (16.7%) | 4 (3.5%) |
| 75 Years and over | 9 (15.0%) | 24 (17.0%) |
Disability Class: Ambulatory Difficulty
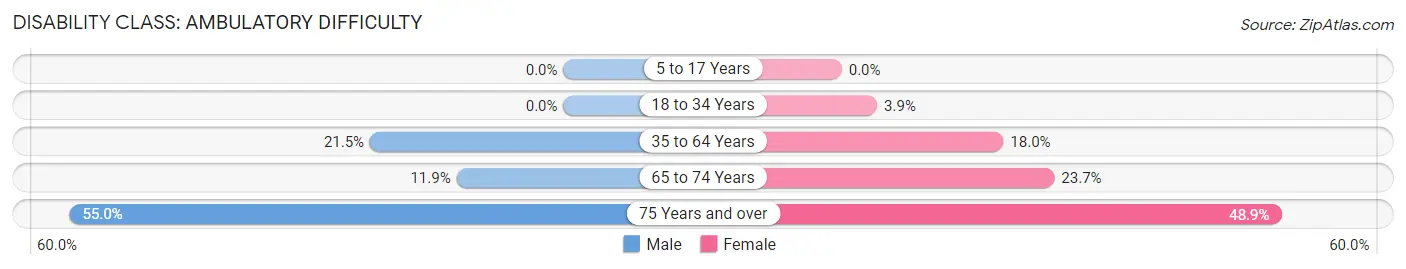
| Age Bracket | Male | Female |
| 5 to 17 Years | 0 (0.0%) | 0 (0.0%) |
| 18 to 34 Years | 0 (0.0%) | 5 (3.9%) |
| 35 to 64 Years | 56 (21.5%) | 54 (18.0%) |
| 65 to 74 Years | 10 (11.9%) | 27 (23.7%) |
| 75 Years and over | 33 (55.0%) | 69 (48.9%) |
Disability Class: Self-Care Difficulty
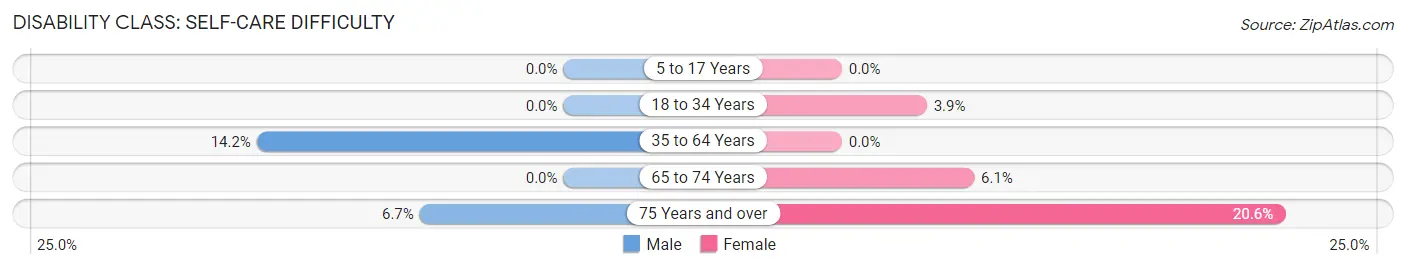
| Age Bracket | Male | Female |
| 5 to 17 Years | 0 (0.0%) | 0 (0.0%) |
| 18 to 34 Years | 0 (0.0%) | 5 (3.9%) |
| 35 to 64 Years | 37 (14.2%) | 0 (0.0%) |
| 65 to 74 Years | 0 (0.0%) | 7 (6.1%) |
| 75 Years and over | 4 (6.7%) | 29 (20.6%) |
Technology Access in Harrisville
Computing Device Access in Harrisville
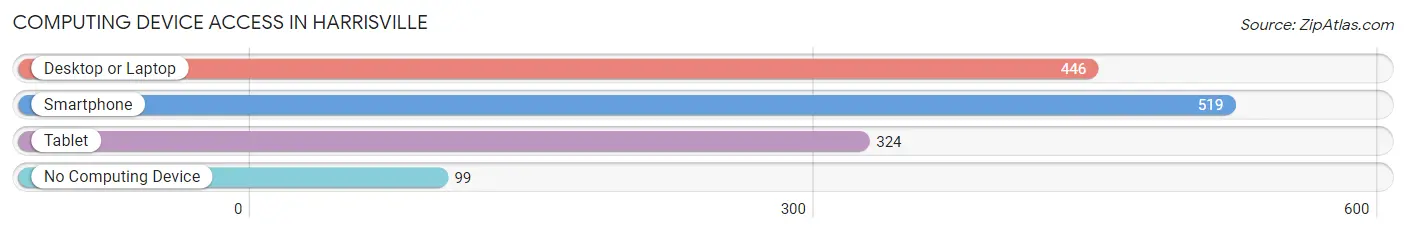
| Device Type | # Households | % Households |
| Desktop or Laptop | 446 | 64.4% |
| Smartphone | 519 | 74.9% |
| Tablet | 324 | 46.8% |
| No Computing Device | 99 | 14.3% |
| Total | 693 | 100.0% |
Internet Access in Harrisville
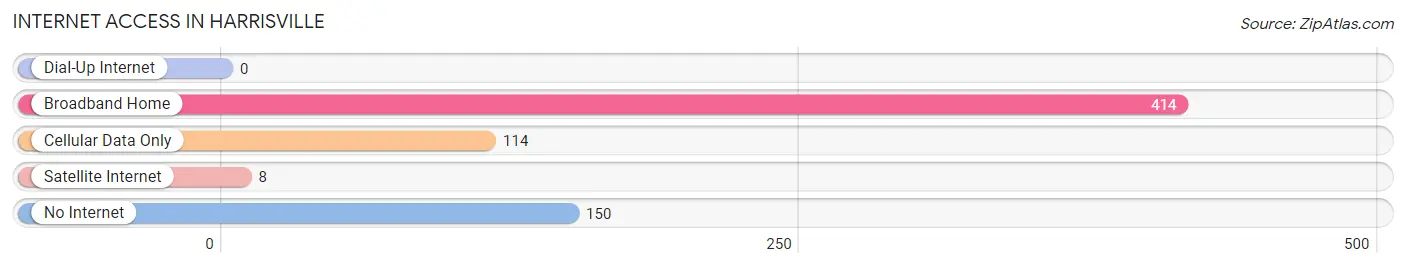
| Internet Type | # Households | % Households |
| Dial-Up Internet | 0 | 0.0% |
| Broadband Home | 414 | 59.7% |
| Cellular Data Only | 114 | 16.5% |
| Satellite Internet | 8 | 1.1% |
| No Internet | 150 | 21.6% |
| Total | 693 | 100.0% |
Harrisville Summary
Harville, West Virginia is a small town located in the northern part of the state, in the Appalachian Mountains. It is situated in the county of Preston, and is part of the Morgantown Metropolitan Statistical Area. The town has a population of just over 1,000 people, and is known for its rural charm and small-town atmosphere.
History
Harville was founded in 1820 by a group of settlers from Pennsylvania. The town was named after the Harville family, who were among the first settlers. The town was originally a farming community, and the main crops grown were corn, wheat, and oats. The town also had a few small businesses, such as a general store and a blacksmith shop.
In the late 19th century, the town began to grow and develop. The railroad came to Harville in 1887, and this allowed the town to become more connected to the outside world. The railroad also allowed for the development of the coal industry in the area, and this led to an influx of new residents.
Geography
Harville is located in the northern part of West Virginia, in the Appalachian Mountains. The town is situated in Preston County, and is part of the Morgantown Metropolitan Statistical Area. The town is located at an elevation of 1,845 feet above sea level.
The town is surrounded by rolling hills and mountains, and is located near the Cheat River. The town is also located near the Monongahela National Forest, which provides a variety of outdoor activities for visitors and residents alike.
Economy
The economy of Harville is largely based on agriculture and tourism. The town is home to several farms, which produce a variety of crops, including corn, wheat, and oats. The town also has a few small businesses, such as a general store and a blacksmith shop.
The town is also a popular tourist destination, as it is located near the Monongahela National Forest. The town is also home to several historic sites, such as the Harville Historic District, which is listed on the National Register of Historic Places.
Demographics
As of the 2010 census, the population of Harville was 1,072. The racial makeup of the town was 97.3% White, 0.7% African American, 0.2% Native American, 0.2% Asian, 0.1% Pacific Islander, 0.2% from other races, and 1.3% from two or more races. Hispanic or Latino of any race were 0.7% of the population.
The median income for a household in the town was $30,000, and the median income for a family was $35,000. The per capita income for the town was $15,000. About 15.3% of families and 17.2% of the population were below the poverty line, including 22.2% of those under age 18 and 8.3% of those age 65 or over.
Conclusion
Harville, West Virginia is a small town located in the northern part of the state, in the Appalachian Mountains. It is situated in the county of Preston, and is part of the Morgantown Metropolitan Statistical Area. The town has a population of just over 1,000 people, and is known for its rural charm and small-town atmosphere. The economy of Harville is largely based on agriculture and tourism, and the town is home to several farms, small businesses, and historic sites. The racial makeup of the town is predominantly white, and the median income for a household is $30,000. Harville is a charming and peaceful town, and is a great place to visit or live.
Common Questions
What is Per Capita Income in Harrisville?
Per Capita income in Harrisville is $29,386.
What is the Median Family Income in Harrisville?
Median Family Income in Harrisville is $55,938.
What is the Median Household income in Harrisville?
Median Household Income in Harrisville is $40,114.
What is Income or Wage Gap in Harrisville?
Income or Wage Gap in Harrisville is 69.3%.
Women in Harrisville earn 30.7 cents for every dollar earned by a man.
What is Inequality or Gini Index in Harrisville?
Inequality or Gini Index in Harrisville is 0.54.
What is the Total Population of Harrisville?
Total Population of Harrisville is 1,620.
What is the Total Male Population of Harrisville?
Total Male Population of Harrisville is 699.
What is the Total Female Population of Harrisville?
Total Female Population of Harrisville is 921.
What is the Ratio of Males per 100 Females in Harrisville?
There are 75.90 Males per 100 Females in Harrisville.
What is the Ratio of Females per 100 Males in Harrisville?
There are 131.76 Females per 100 Males in Harrisville.
What is the Median Population Age in Harrisville?
Median Population Age in Harrisville is 44.7 Years.
What is the Average Family Size in Harrisville
Average Family Size in Harrisville is 3.0 People.
What is the Average Household Size in Harrisville
Average Household Size in Harrisville is 2.3 People.
How Large is the Labor Force in Harrisville?
There are 588 People in the Labor Forcein in Harrisville.
What is the Percentage of People in the Labor Force in Harrisville?
45.4% of People are in the Labor Force in Harrisville.
What is the Unemployment Rate in Harrisville?
Unemployment Rate in Harrisville is 5.3%.