Harpers Ferry, WV Map & Demographics
Harpers Ferry Map

Harpers Ferry Overview
$52,917
PER CAPITA INCOME
$109,904
AVG FAMILY INCOME
$109,183
AVG HOUSEHOLD INCOME
0.32
INEQUALITY / GINI INDEX
301
TOTAL POPULATION
143
MALE POPULATION
158
FEMALE POPULATION
90.51
MALES / 100 FEMALES
110.49
FEMALES / 100 MALES
57.8
MEDIAN AGE
2.9
AVG FAMILY SIZE
2.4
AVG HOUSEHOLD SIZE
147
LABOR FORCE [ PEOPLE ]
54.4%
PERCENT IN LABOR FORCE
8.2%
UNEMPLOYMENT RATE
Harpers Ferry Zip Codes
Harpers Ferry Area Codes
Income in Harpers Ferry
Income Overview in Harpers Ferry
Per Capita Income in Harpers Ferry is $52,917, while median incomes of families and households are $109,904 and $109,183 respectively.
| Characteristic | Number | Measure |
| Per Capita Income | 301 | $52,917 |
| Median Family Income | 90 | $109,904 |
| Mean Family Income | 90 | $128,134 |
| Median Household Income | 125 | $109,183 |
| Mean Household Income | 125 | $121,800 |
| Income Deficit | 90 | $0 |
| Wage / Income Gap (%) | 301 | 0.00% |
| Wage / Income Gap ($) | 301 | 100.00¢ per $1 |
| Gini / Inequality Index | 301 | 0.32 |
Earnings by Sex in Harpers Ferry
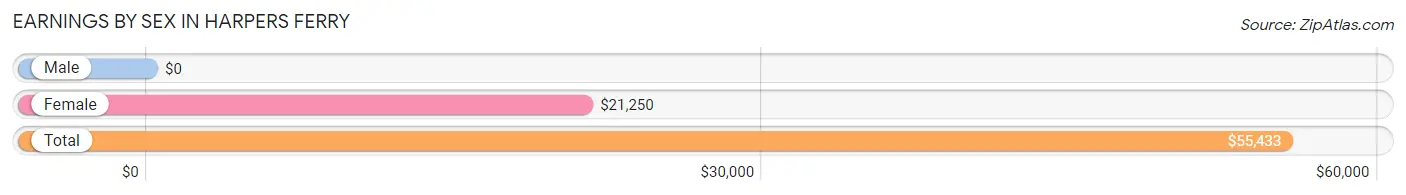
| Sex | Number | Average Earnings |
| Male | 97 (69.8%) | $0 |
| Female | 42 (30.2%) | $21,250 |
| Total | 139 (100.0%) | $55,433 |
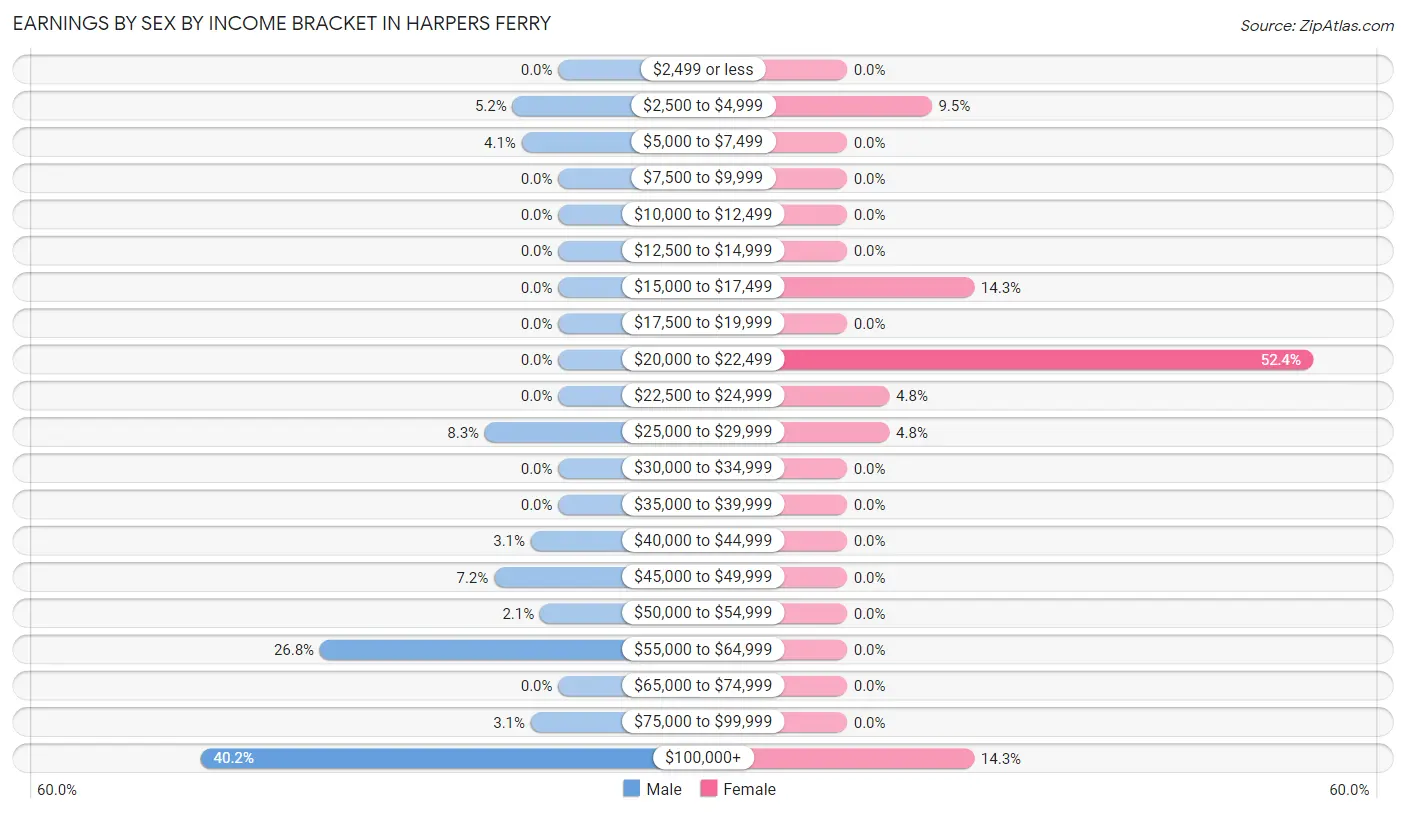
Earnings by Sex by Income Bracket in Harpers Ferry
The most common earnings brackets in Harpers Ferry are $100,000+ for men (39 | 40.2%) and $20,000 to $22,499 for women (22 | 52.4%).
| Income | Male | Female |
| $2,499 or less | 0 (0.0%) | 0 (0.0%) |
| $2,500 to $4,999 | 5 (5.1%) | 4 (9.5%) |
| $5,000 to $7,499 | 4 (4.1%) | 0 (0.0%) |
| $7,500 to $9,999 | 0 (0.0%) | 0 (0.0%) |
| $10,000 to $12,499 | 0 (0.0%) | 0 (0.0%) |
| $12,500 to $14,999 | 0 (0.0%) | 0 (0.0%) |
| $15,000 to $17,499 | 0 (0.0%) | 6 (14.3%) |
| $17,500 to $19,999 | 0 (0.0%) | 0 (0.0%) |
| $20,000 to $22,499 | 0 (0.0%) | 22 (52.4%) |
| $22,500 to $24,999 | 0 (0.0%) | 2 (4.8%) |
| $25,000 to $29,999 | 8 (8.3%) | 2 (4.8%) |
| $30,000 to $34,999 | 0 (0.0%) | 0 (0.0%) |
| $35,000 to $39,999 | 0 (0.0%) | 0 (0.0%) |
| $40,000 to $44,999 | 3 (3.1%) | 0 (0.0%) |
| $45,000 to $49,999 | 7 (7.2%) | 0 (0.0%) |
| $50,000 to $54,999 | 2 (2.1%) | 0 (0.0%) |
| $55,000 to $64,999 | 26 (26.8%) | 0 (0.0%) |
| $65,000 to $74,999 | 0 (0.0%) | 0 (0.0%) |
| $75,000 to $99,999 | 3 (3.1%) | 0 (0.0%) |
| $100,000+ | 39 (40.2%) | 6 (14.3%) |
| Total | 97 (100.0%) | 42 (100.0%) |
Earnings by Sex by Educational Attainment in Harpers Ferry
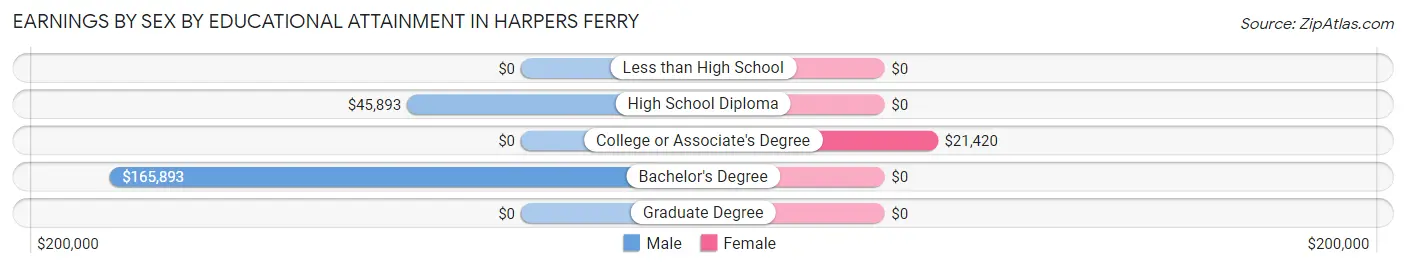
| Educational Attainment | Male Income | Female Income |
| Less than High School | - | - |
| High School Diploma | $45,893 | $0 |
| College or Associate's Degree | - | - |
| Bachelor's Degree | $165,893 | $0 |
| Graduate Degree | - | - |
| Total | - | - |
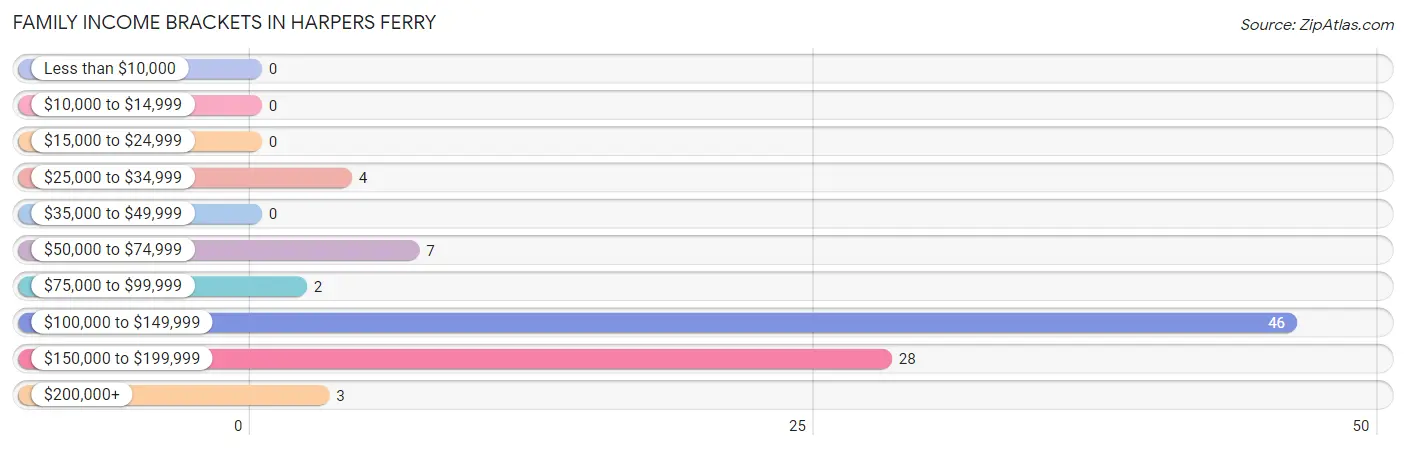
Family Income in Harpers Ferry
Family Income Brackets in Harpers Ferry
According to the Harpers Ferry family income data, there are 46 families falling into the $100,000 to $149,999 income range, which is the most common income bracket and makes up 51.1% of all families.
| Income Bracket | # Families | % Families |
| Less than $10,000 | 0 | 0.0% |
| $10,000 to $14,999 | 0 | 0.0% |
| $15,000 to $24,999 | 0 | 0.0% |
| $25,000 to $34,999 | 4 | 4.4% |
| $35,000 to $49,999 | 0 | 0.0% |
| $50,000 to $74,999 | 7 | 7.8% |
| $75,000 to $99,999 | 2 | 2.2% |
| $100,000 to $149,999 | 46 | 51.1% |
| $150,000 to $199,999 | 28 | 31.1% |
| $200,000+ | 3 | 3.3% |
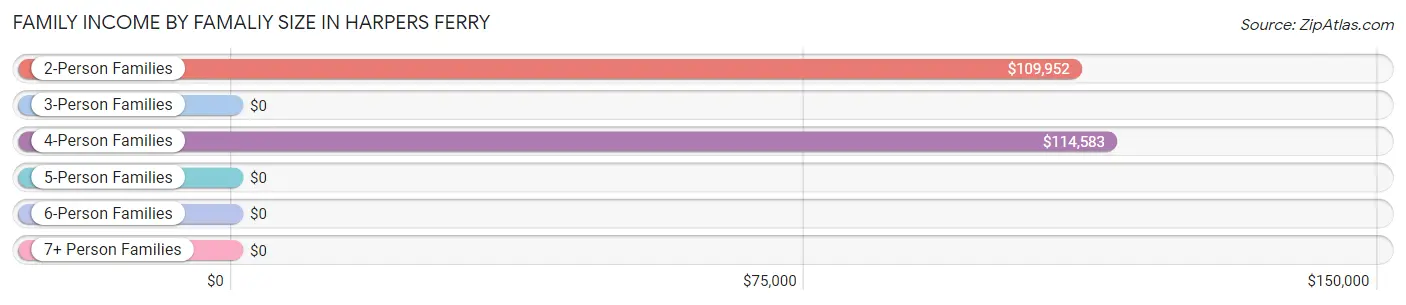
Family Income by Famaliy Size in Harpers Ferry
4-person families (9 | 10.0%) account for the highest median family income in Harpers Ferry with $114,583 per family, while 2-person families (71 | 78.9%) have the highest median income of $54,976 per family member.
| Income Bracket | # Families | Median Income |
| 2-Person Families | 71 (78.9%) | $109,952 |
| 3-Person Families | 3 (3.3%) | $0 |
| 4-Person Families | 9 (10.0%) | $114,583 |
| 5-Person Families | 0 (0.0%) | $0 |
| 6-Person Families | 7 (7.8%) | $0 |
| 7+ Person Families | 0 (0.0%) | $0 |
| Total | 90 (100.0%) | $109,904 |
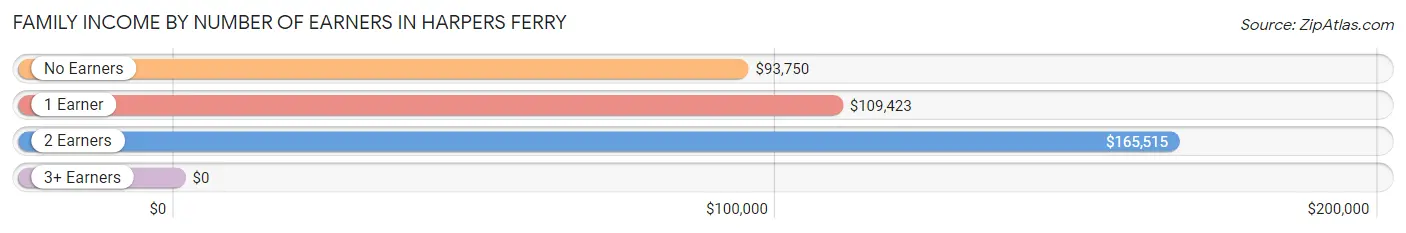
Family Income by Number of Earners in Harpers Ferry
| Number of Earners | # Families | Median Income |
| No Earners | 12 (13.3%) | $93,750 |
| 1 Earner | 50 (55.6%) | $109,423 |
| 2 Earners | 27 (30.0%) | $165,515 |
| 3+ Earners | 1 (1.1%) | $0 |
| Total | 90 (100.0%) | $109,904 |
Household Income in Harpers Ferry
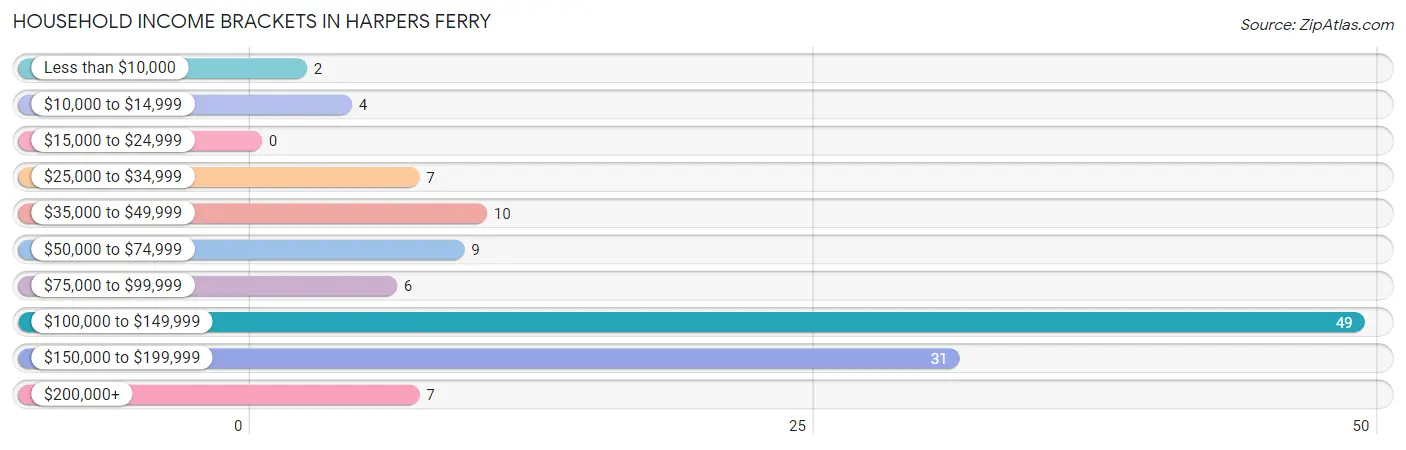
Household Income Brackets in Harpers Ferry
With 49 households falling in the category, the $100,000 to $149,999 income range is the most frequent in Harpers Ferry, accounting for 39.2% of all households.
| Income Bracket | # Households | % Households |
| Less than $10,000 | 2 | 1.6% |
| $10,000 to $14,999 | 4 | 3.2% |
| $15,000 to $24,999 | 0 | 0.0% |
| $25,000 to $34,999 | 7 | 5.6% |
| $35,000 to $49,999 | 10 | 8.0% |
| $50,000 to $74,999 | 9 | 7.2% |
| $75,000 to $99,999 | 6 | 4.8% |
| $100,000 to $149,999 | 49 | 39.2% |
| $150,000 to $199,999 | 31 | 24.8% |
| $200,000+ | 7 | 5.6% |
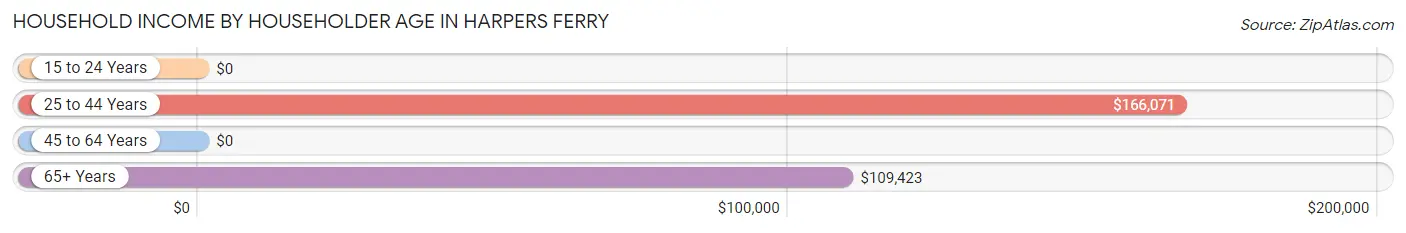
Household Income by Householder Age in Harpers Ferry
The median household income in Harpers Ferry is $109,183, with the highest median household income of $166,071 found in the 25 to 44 years age bracket for the primary householder. A total of 14 households (11.2%) fall into this category.
| Income Bracket | # Households | Median Income |
| 15 to 24 Years | 0 (0.0%) | $0 |
| 25 to 44 Years | 14 (11.2%) | $166,071 |
| 45 to 64 Years | 37 (29.6%) | $0 |
| 65+ Years | 74 (59.2%) | $109,423 |
| Total | 125 (100.0%) | $109,183 |
Poverty in Harpers Ferry
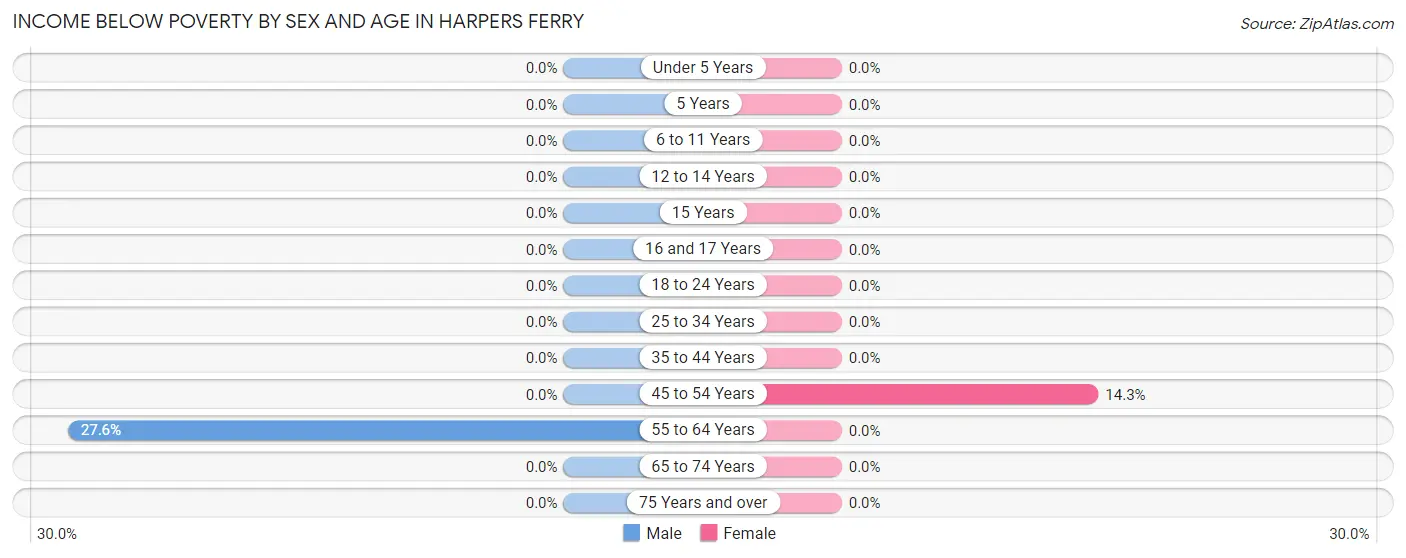
Income Below Poverty by Sex and Age in Harpers Ferry
With 5.6% poverty level for males and 1.3% for females among the residents of Harpers Ferry, 55 to 64 year old males and 45 to 54 year old females are the most vulnerable to poverty, with 8 males (27.6%) and 2 females (14.3%) in their respective age groups living below the poverty level.
| Age Bracket | Male | Female |
| Under 5 Years | 0 (0.0%) | 0 (0.0%) |
| 5 Years | 0 (0.0%) | 0 (0.0%) |
| 6 to 11 Years | 0 (0.0%) | 0 (0.0%) |
| 12 to 14 Years | 0 (0.0%) | 0 (0.0%) |
| 15 Years | 0 (0.0%) | 0 (0.0%) |
| 16 and 17 Years | 0 (0.0%) | 0 (0.0%) |
| 18 to 24 Years | 0 (0.0%) | 0 (0.0%) |
| 25 to 34 Years | 0 (0.0%) | 0 (0.0%) |
| 35 to 44 Years | 0 (0.0%) | 0 (0.0%) |
| 45 to 54 Years | 0 (0.0%) | 2 (14.3%) |
| 55 to 64 Years | 8 (27.6%) | 0 (0.0%) |
| 65 to 74 Years | 0 (0.0%) | 0 (0.0%) |
| 75 Years and over | 0 (0.0%) | 0 (0.0%) |
| Total | 8 (5.6%) | 2 (1.3%) |
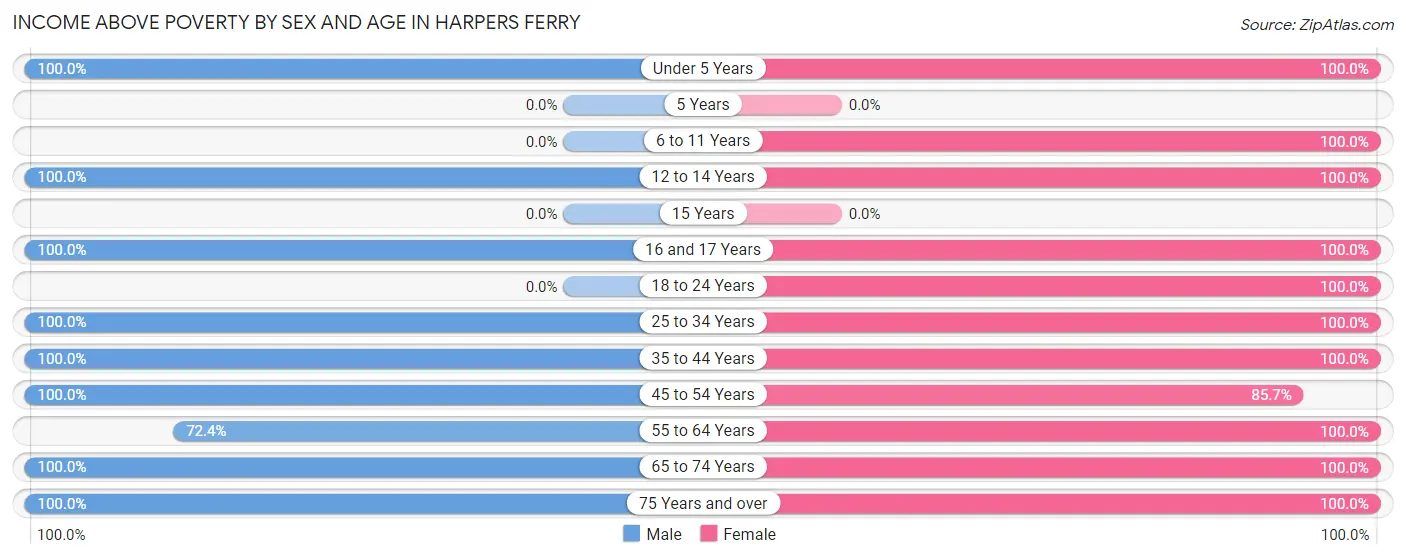
Income Above Poverty by Sex and Age in Harpers Ferry
According to the poverty statistics in Harpers Ferry, males aged under 5 years and females aged under 5 years are the age groups that are most secure financially, with 100.0% of males and 100.0% of females in these age groups living above the poverty line.
| Age Bracket | Male | Female |
| Under 5 Years | 8 (100.0%) | 4 (100.0%) |
| 5 Years | 0 (0.0%) | 0 (0.0%) |
| 6 to 11 Years | 0 (0.0%) | 14 (100.0%) |
| 12 to 14 Years | 1 (100.0%) | 4 (100.0%) |
| 15 Years | 0 (0.0%) | 0 (0.0%) |
| 16 and 17 Years | 6 (100.0%) | 7 (100.0%) |
| 18 to 24 Years | 0 (0.0%) | 4 (100.0%) |
| 25 to 34 Years | 6 (100.0%) | 15 (100.0%) |
| 35 to 44 Years | 14 (100.0%) | 13 (100.0%) |
| 45 to 54 Years | 9 (100.0%) | 12 (85.7%) |
| 55 to 64 Years | 21 (72.4%) | 34 (100.0%) |
| 65 to 74 Years | 30 (100.0%) | 38 (100.0%) |
| 75 Years and over | 40 (100.0%) | 11 (100.0%) |
| Total | 135 (94.4%) | 156 (98.7%) |
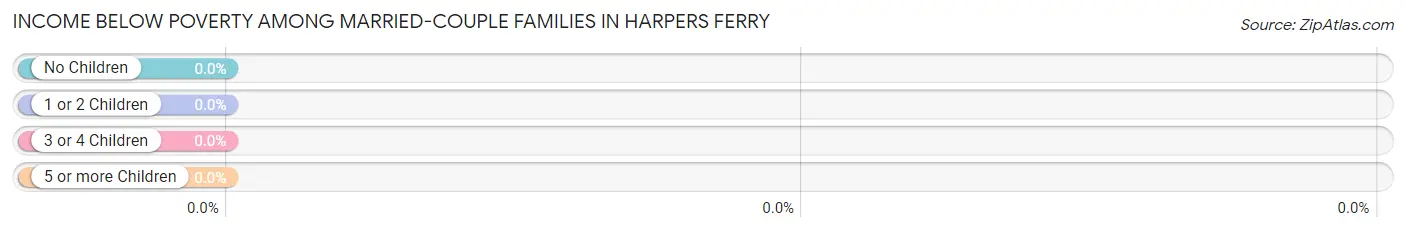
Income Below Poverty Among Married-Couple Families in Harpers Ferry
| Children | Above Poverty | Below Poverty |
| No Children | 74 (100.0%) | 0 (0.0%) |
| 1 or 2 Children | 6 (100.0%) | 0 (0.0%) |
| 3 or 4 Children | 7 (100.0%) | 0 (0.0%) |
| 5 or more Children | 0 (0.0%) | 0 (0.0%) |
| Total | 87 (100.0%) | 0 (0.0%) |
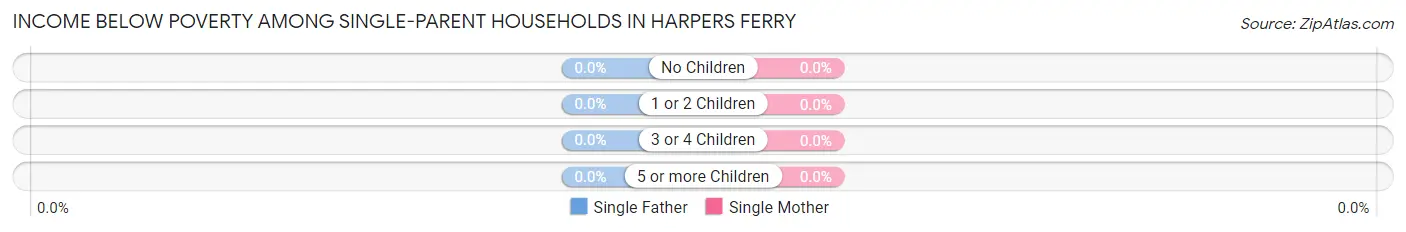
Income Below Poverty Among Single-Parent Households in Harpers Ferry
| Children | Single Father | Single Mother |
| No Children | 0 (0.0%) | 0 (0.0%) |
| 1 or 2 Children | 0 (0.0%) | 0 (0.0%) |
| 3 or 4 Children | 0 (0.0%) | 0 (0.0%) |
| 5 or more Children | 0 (0.0%) | 0 (0.0%) |
| Total | 0 (0.0%) | 0 (0.0%) |
Income Below Poverty Among Married-Couple vs Single-Parent Households in Harpers Ferry
| Children | Married-Couple Families | Single-Parent Households |
| No Children | 0 (0.0%) | 0 (0.0%) |
| 1 or 2 Children | 0 (0.0%) | 0 (0.0%) |
| 3 or 4 Children | 0 (0.0%) | 0 (0.0%) |
| 5 or more Children | 0 (0.0%) | 0 (0.0%) |
| Total | 0 (0.0%) | 0 (0.0%) |
Race in Harpers Ferry
The most populous races in Harpers Ferry are White / Caucasian (293 | 97.3%), Asian (3 | 1.0%), and Black / African American (3 | 1.0%).
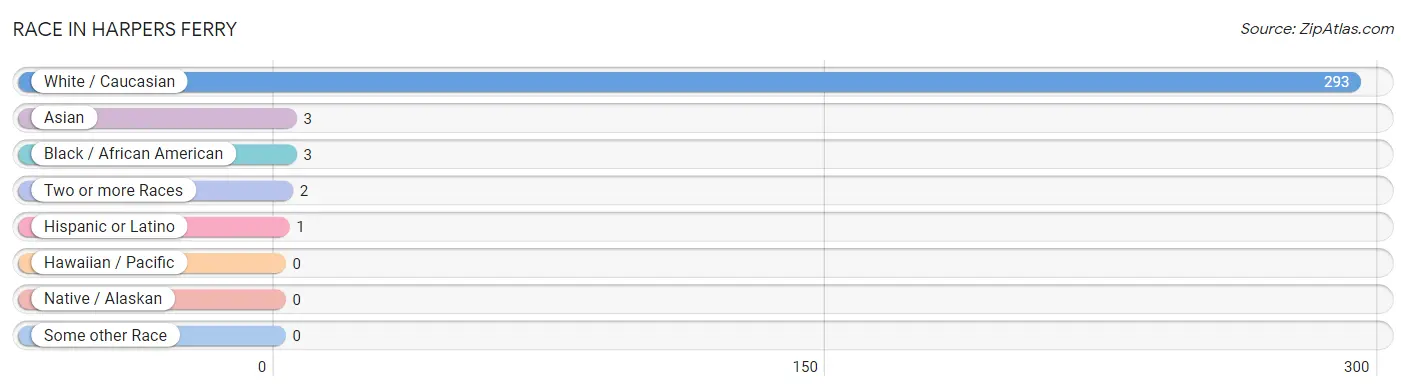
| Race | # Population | % Population |
| Asian | 3 | 1.0% |
| Black / African American | 3 | 1.0% |
| Hawaiian / Pacific | 0 | 0.0% |
| Hispanic or Latino | 1 | 0.3% |
| Native / Alaskan | 0 | 0.0% |
| White / Caucasian | 293 | 97.3% |
| Two or more Races | 2 | 0.7% |
| Some other Race | 0 | 0.0% |
| Total | 301 | 100.0% |
Ancestry in Harpers Ferry
The most populous ancestries reported in Harpers Ferry are English (97 | 32.2%), Irish (91 | 30.2%), German (77 | 25.6%), Scottish (26 | 8.6%), and Swedish (21 | 7.0%), together accounting for 103.7% of all Harpers Ferry residents.
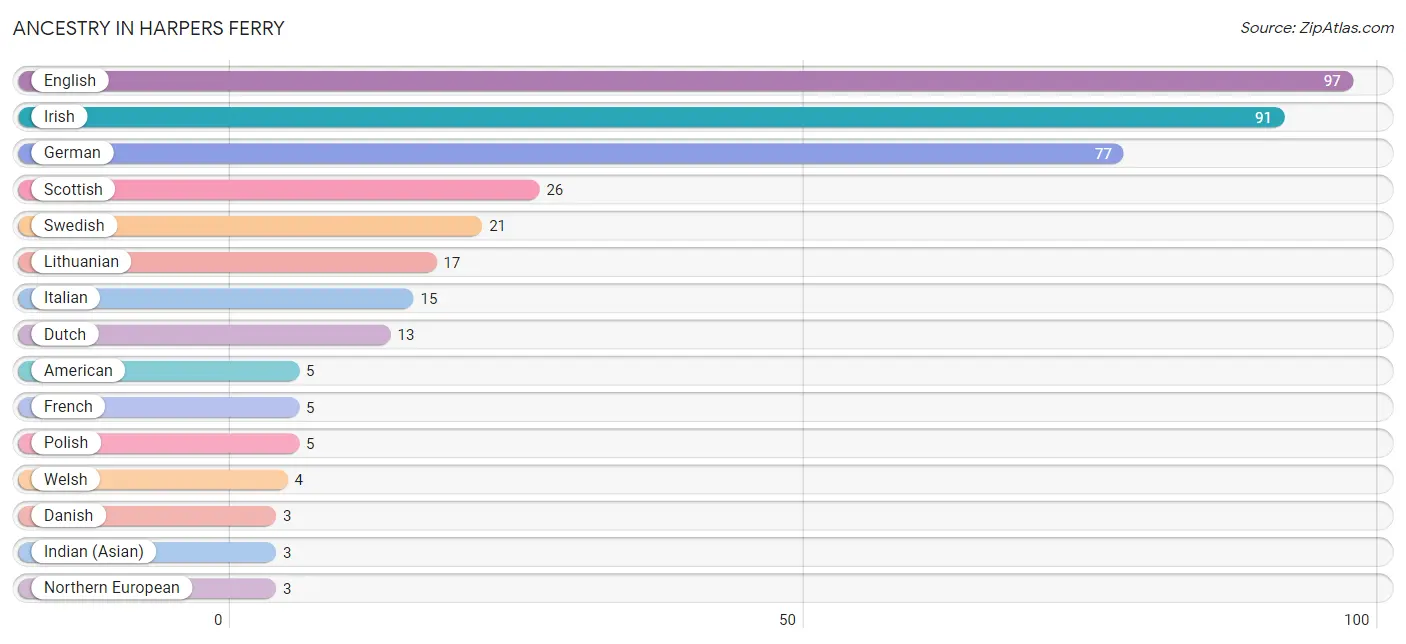
| Ancestry | # Population | % Population |
| American | 5 | 1.7% |
| Argentinean | 1 | 0.3% |
| Danish | 3 | 1.0% |
| Dutch | 13 | 4.3% |
| English | 97 | 32.2% |
| Finnish | 2 | 0.7% |
| French | 5 | 1.7% |
| German | 77 | 25.6% |
| Indian (Asian) | 3 | 1.0% |
| Irish | 91 | 30.2% |
| Italian | 15 | 5.0% |
| Lithuanian | 17 | 5.7% |
| Northern European | 3 | 1.0% |
| Polish | 5 | 1.7% |
| Russian | 2 | 0.7% |
| Scottish | 26 | 8.6% |
| South American | 1 | 0.3% |
| Swedish | 21 | 7.0% |
| Thai | 2 | 0.7% |
| Welsh | 4 | 1.3% | View All 20 Rows |
Immigrants in Harpers Ferry
The most numerous immigrant groups reported in Harpers Ferry came from Europe (6 | 2.0%), Eastern Europe (4 | 1.3%), Asia (3 | 1.0%), Indonesia (3 | 1.0%), and South Eastern Asia (3 | 1.0%), together accounting for 6.3% of all Harpers Ferry residents.
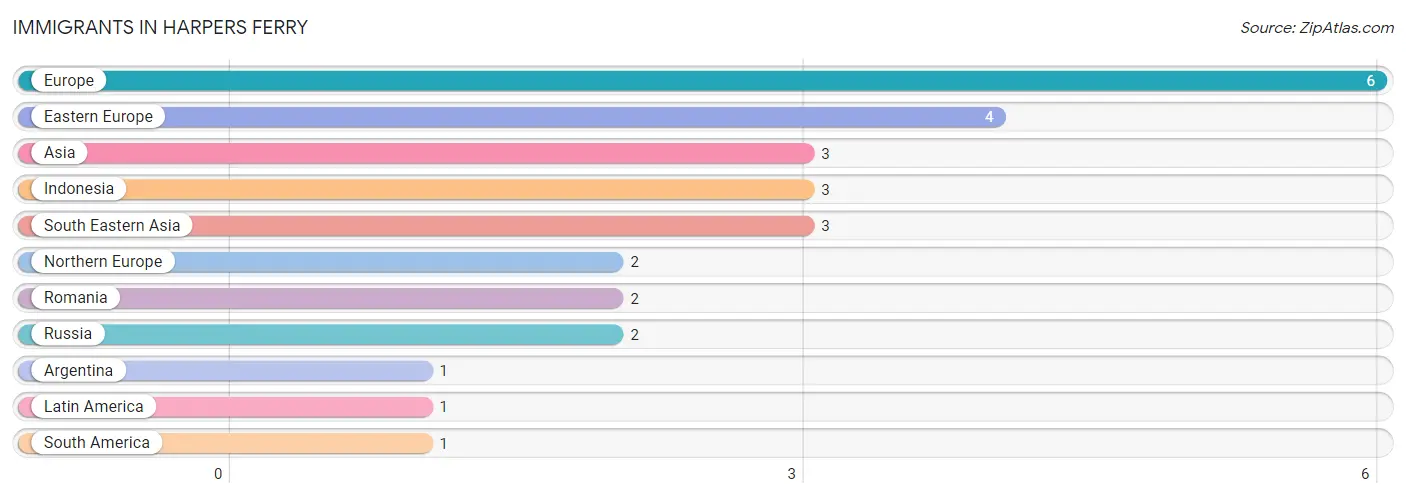
| Immigration Origin | # Population | % Population |
| Argentina | 1 | 0.3% |
| Asia | 3 | 1.0% |
| Eastern Europe | 4 | 1.3% |
| Europe | 6 | 2.0% |
| Indonesia | 3 | 1.0% |
| Latin America | 1 | 0.3% |
| Northern Europe | 2 | 0.7% |
| Romania | 2 | 0.7% |
| Russia | 2 | 0.7% |
| South America | 1 | 0.3% |
| South Eastern Asia | 3 | 1.0% | View All 11 Rows |
Sex and Age in Harpers Ferry
Sex and Age in Harpers Ferry
The most populous age groups in Harpers Ferry are 75 to 79 Years (39 | 27.3%) for men and 65 to 69 Years (28 | 17.7%) for women.
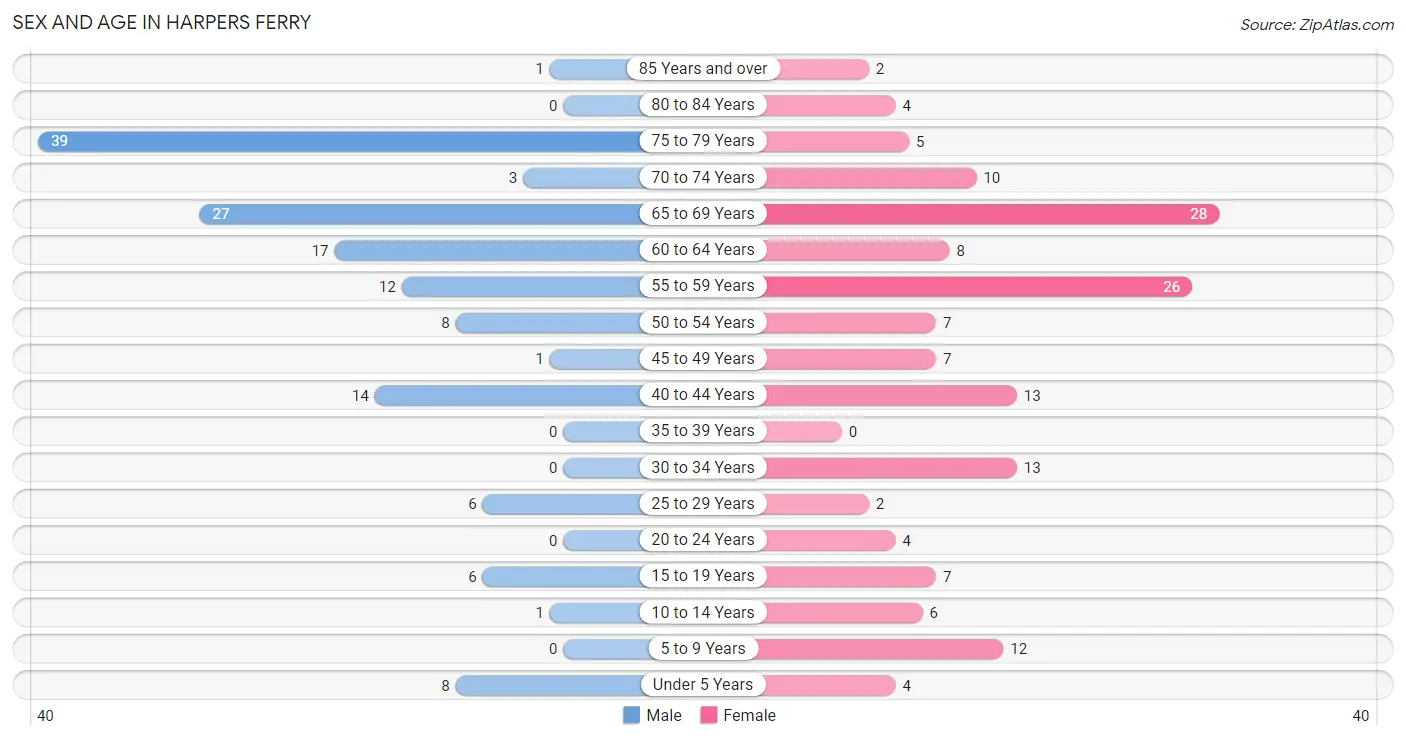
| Age Bracket | Male | Female |
| Under 5 Years | 8 (5.6%) | 4 (2.5%) |
| 5 to 9 Years | 0 (0.0%) | 12 (7.6%) |
| 10 to 14 Years | 1 (0.7%) | 6 (3.8%) |
| 15 to 19 Years | 6 (4.2%) | 7 (4.4%) |
| 20 to 24 Years | 0 (0.0%) | 4 (2.5%) |
| 25 to 29 Years | 6 (4.2%) | 2 (1.3%) |
| 30 to 34 Years | 0 (0.0%) | 13 (8.2%) |
| 35 to 39 Years | 0 (0.0%) | 0 (0.0%) |
| 40 to 44 Years | 14 (9.8%) | 13 (8.2%) |
| 45 to 49 Years | 1 (0.7%) | 7 (4.4%) |
| 50 to 54 Years | 8 (5.6%) | 7 (4.4%) |
| 55 to 59 Years | 12 (8.4%) | 26 (16.5%) |
| 60 to 64 Years | 17 (11.9%) | 8 (5.1%) |
| 65 to 69 Years | 27 (18.9%) | 28 (17.7%) |
| 70 to 74 Years | 3 (2.1%) | 10 (6.3%) |
| 75 to 79 Years | 39 (27.3%) | 5 (3.2%) |
| 80 to 84 Years | 0 (0.0%) | 4 (2.5%) |
| 85 Years and over | 1 (0.7%) | 2 (1.3%) |
| Total | 143 (100.0%) | 158 (100.0%) |
Families and Households in Harpers Ferry
Median Family Size in Harpers Ferry
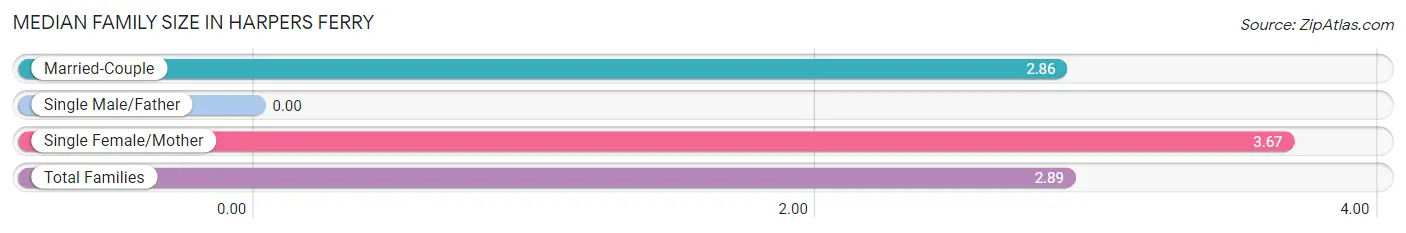
| Family Type | # Families | Family Size |
| Married-Couple | 87 (96.7%) | 2.86 |
| Single Male/Father | 0 (0.0%) | - |
| Single Female/Mother | 3 (3.3%) | 3.67 |
| Total Families | 90 (100.0%) | 2.89 |
Median Household Size in Harpers Ferry
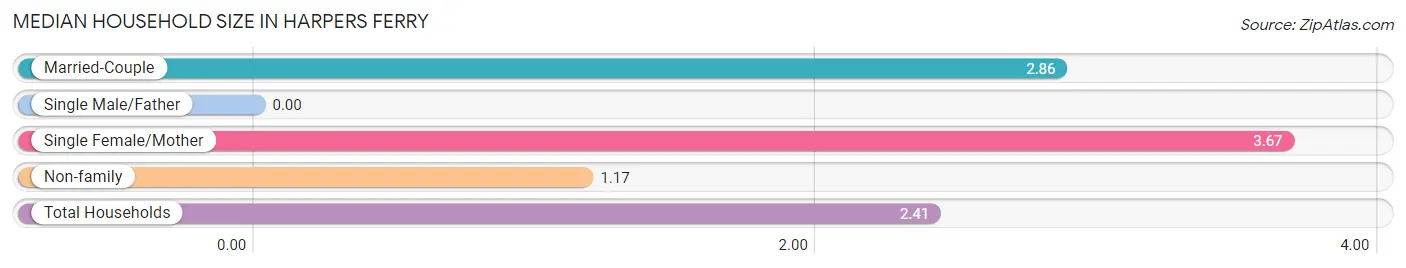
| Household Type | # Households | Household Size |
| Married-Couple | 87 (69.6%) | 2.86 |
| Single Male/Father | 0 (0.0%) | - |
| Single Female/Mother | 3 (2.4%) | 3.67 |
| Non-family | 35 (28.0%) | 1.17 |
| Total Households | 125 (100.0%) | 2.41 |
Household Size by Marriage Status in Harpers Ferry
Out of a total of 125 households in Harpers Ferry, 90 (72.0%) are family households, while 35 (28.0%) are nonfamily households. The most numerous type of family households are 2-person households, comprising 71, and the most common type of nonfamily households are 1-person households, comprising 30.
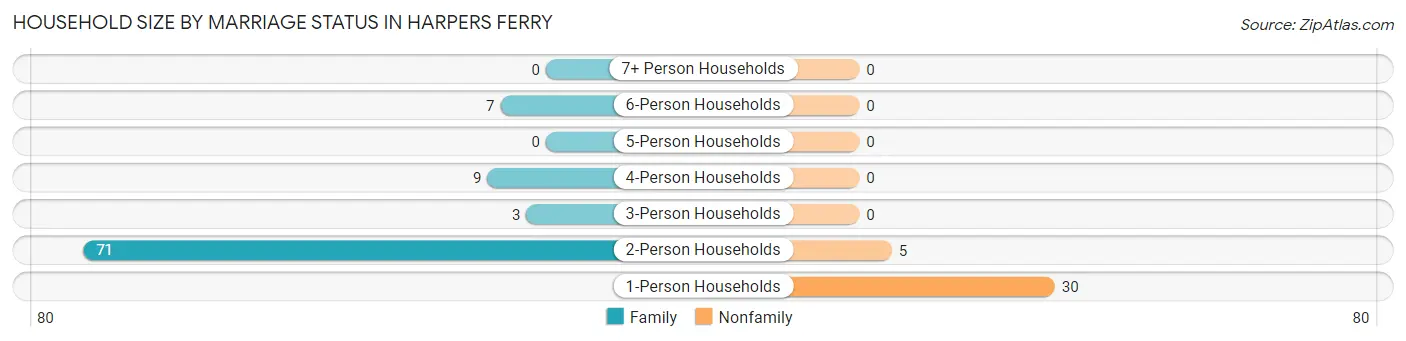
| Household Size | Family Households | Nonfamily Households |
| 1-Person Households | - | 30 (24.0%) |
| 2-Person Households | 71 (56.8%) | 5 (4.0%) |
| 3-Person Households | 3 (2.4%) | 0 (0.0%) |
| 4-Person Households | 9 (7.2%) | 0 (0.0%) |
| 5-Person Households | 0 (0.0%) | 0 (0.0%) |
| 6-Person Households | 7 (5.6%) | 0 (0.0%) |
| 7+ Person Households | 0 (0.0%) | 0 (0.0%) |
| Total | 90 (72.0%) | 35 (28.0%) |
Female Fertility in Harpers Ferry
Fertility by Age in Harpers Ferry
Average fertility rate in Harpers Ferry is 42.0 births per 1,000 women. Women in the age bracket of 35 to 50 years have the highest fertility rate with 91.0 births per 1,000 women. Women in the age bracket of 35 to 50 years acount for 100.0% of all women with births.
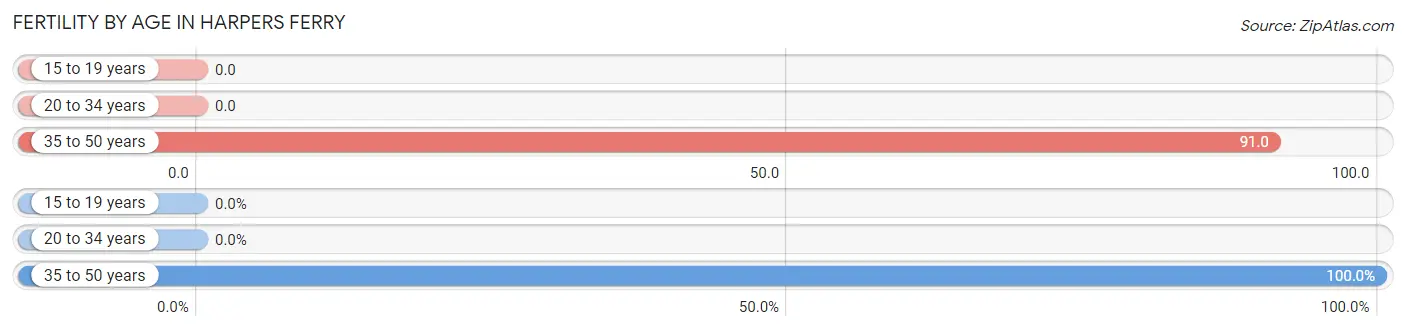
| Age Bracket | Women with Births | Births / 1,000 Women |
| 15 to 19 years | 0 (0.0%) | 0.0 |
| 20 to 34 years | 0 (0.0%) | 0.0 |
| 35 to 50 years | 2 (100.0%) | 91.0 |
| Total | 2 (100.0%) | 42.0 |
Fertility by Age by Marriage Status in Harpers Ferry
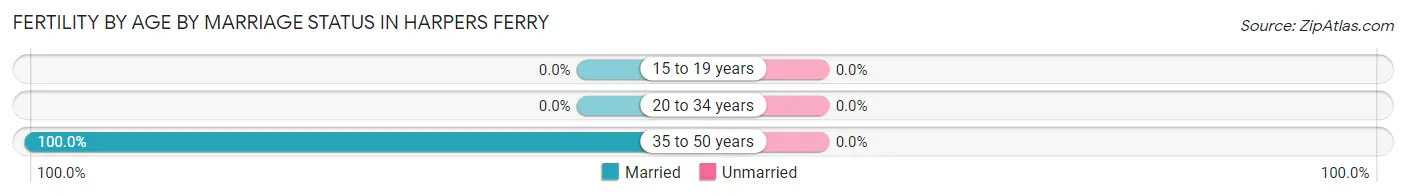
| Age Bracket | Married | Unmarried |
| 15 to 19 years | 0 (0.0%) | 0 (0.0%) |
| 20 to 34 years | 0 (0.0%) | 0 (0.0%) |
| 35 to 50 years | 2 (100.0%) | 0 (0.0%) |
| Total | 2 (100.0%) | 0 (0.0%) |
Fertility by Education in Harpers Ferry
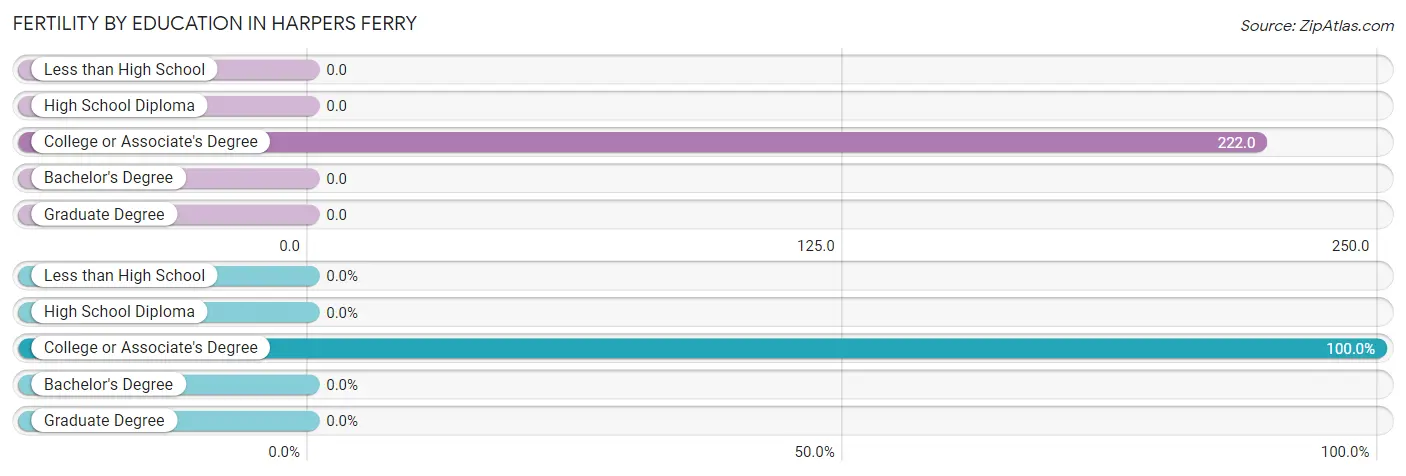
| Educational Attainment | Women with Births | Births / 1,000 Women |
| Less than High School | 0 (0.0%) | 0.0 |
| High School Diploma | 0 (0.0%) | 0.0 |
| College or Associate's Degree | 2 (100.0%) | 222.0 |
| Bachelor's Degree | 0 (0.0%) | 0.0 |
| Graduate Degree | 0 (0.0%) | 0.0 |
| Total | 2 (100.0%) | 42.0 |
Fertility by Education by Marriage Status in Harpers Ferry
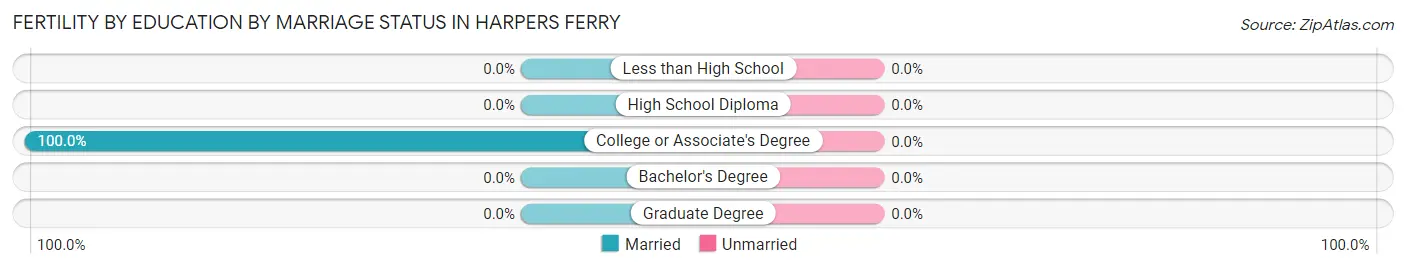
| Educational Attainment | Married | Unmarried |
| Less than High School | 0 (0.0%) | 0 (0.0%) |
| High School Diploma | 0 (0.0%) | 0 (0.0%) |
| College or Associate's Degree | 2 (100.0%) | 0 (0.0%) |
| Bachelor's Degree | 0 (0.0%) | 0 (0.0%) |
| Graduate Degree | 0 (0.0%) | 0 (0.0%) |
| Total | 2 (100.0%) | 0 (0.0%) |
Employment Characteristics in Harpers Ferry
Employment by Class of Employer in Harpers Ferry
Among the 135 employed individuals in Harpers Ferry, private company employees (79 | 58.5%), self-employed (not incorporated) (30 | 22.2%), and local government employees (8 | 5.9%) make up the most common classes of employment.
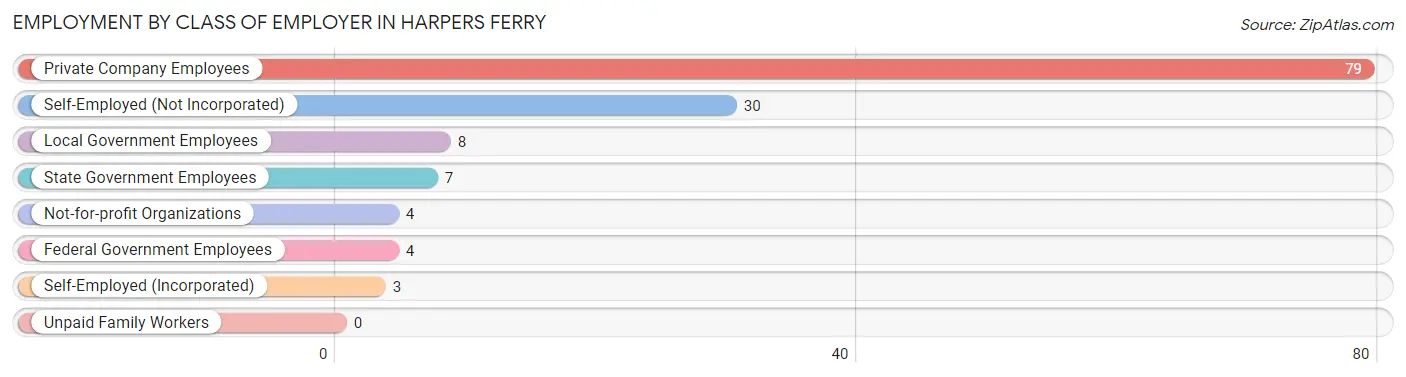
| Employer Class | # Employees | % Employees |
| Private Company Employees | 79 | 58.5% |
| Self-Employed (Incorporated) | 3 | 2.2% |
| Self-Employed (Not Incorporated) | 30 | 22.2% |
| Not-for-profit Organizations | 4 | 3.0% |
| Local Government Employees | 8 | 5.9% |
| State Government Employees | 7 | 5.2% |
| Federal Government Employees | 4 | 3.0% |
| Unpaid Family Workers | 0 | 0.0% |
| Total | 135 | 100.0% |
Employment Status by Age in Harpers Ferry
According to the labor force statistics for Harpers Ferry, out of the total population over 16 years of age (270), 54.4% or 147 individuals are in the labor force, with 8.2% or 12 of them unemployed. The age group with the highest labor force participation rate is 25 to 29 years, with 100.0% or 8 individuals in the labor force. Within the labor force, the 30 to 34 years age range has the highest percentage of unemployed individuals, with 84.6% or 11 of them being unemployed.
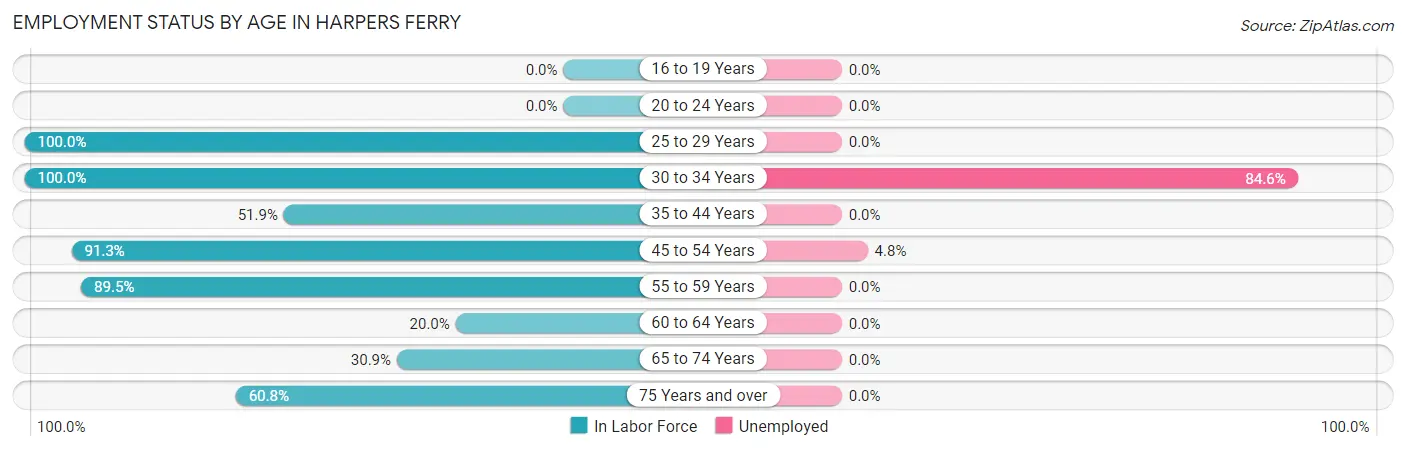
| Age Bracket | In Labor Force | Unemployed |
| 16 to 19 Years | 0 (0.0%) | 0 (0.0%) |
| 20 to 24 Years | 0 (0.0%) | 0 (0.0%) |
| 25 to 29 Years | 8 (100.0%) | 0 (0.0%) |
| 30 to 34 Years | 13 (100.0%) | 11 (84.6%) |
| 35 to 44 Years | 14 (51.9%) | 0 (0.0%) |
| 45 to 54 Years | 21 (91.3%) | 1 (4.8%) |
| 55 to 59 Years | 34 (89.5%) | 0 (0.0%) |
| 60 to 64 Years | 5 (20.0%) | 0 (0.0%) |
| 65 to 74 Years | 21 (30.9%) | 0 (0.0%) |
| 75 Years and over | 31 (60.8%) | 0 (0.0%) |
| Total | 147 (54.4%) | 12 (8.2%) |
Employment Status by Educational Attainment in Harpers Ferry
According to labor force statistics for Harpers Ferry, 70.9% of individuals (95) out of the total population between 25 and 64 years of age (134) are in the labor force, with 12.6% or 12 of them being unemployed. The group with the highest labor force participation rate are those with the educational attainment of less than high school, with 100.0% or 10 individuals in the labor force. Within the labor force, individuals with high school diploma education have the highest percentage of unemployment, with 39.3% or 11 of them being unemployed.
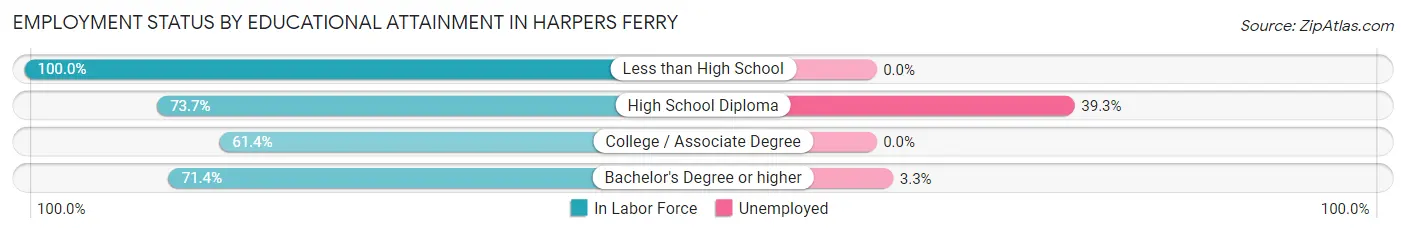
| Educational Attainment | In Labor Force | Unemployed |
| Less than High School | 10 (100.0%) | 0 (0.0%) |
| High School Diploma | 28 (73.7%) | 15 (39.3%) |
| College / Associate Degree | 27 (61.4%) | 0 (0.0%) |
| Bachelor's Degree or higher | 30 (71.4%) | 1 (3.3%) |
| Total | 95 (70.9%) | 17 (12.6%) |
Employment Occupations by Sex in Harpers Ferry
Management, Business, Science and Arts Occupations
The most common Management, Business, Science and Arts occupations in Harpers Ferry are Management (45 | 33.3%), Community & Social Service (33 | 24.4%), Education Instruction & Library (28 | 20.7%), Business & Financial (24 | 17.8%), and Arts, Media & Entertainment (5 | 3.7%).
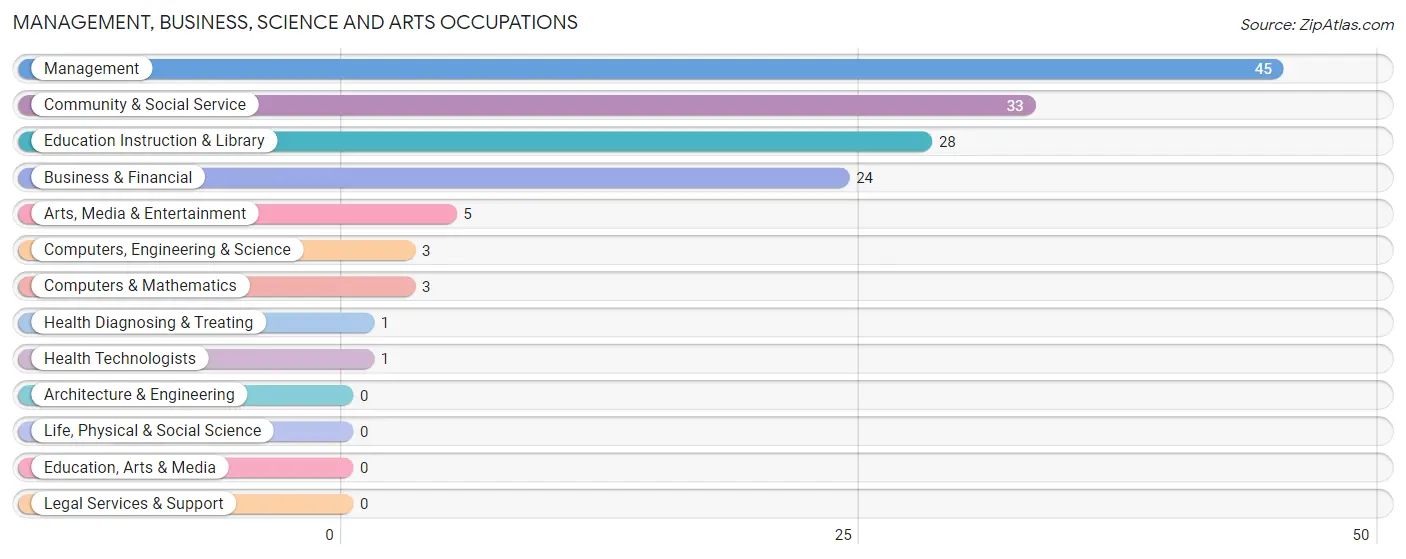
Management, Business, Science and Arts Occupations by Sex
Within the Management, Business, Science and Arts occupations in Harpers Ferry, the most male-oriented occupations are Business & Financial (100.0%), Arts, Media & Entertainment (100.0%), and Health Diagnosing & Treating (100.0%), while the most female-oriented occupations are Computers, Engineering & Science (100.0%), Computers & Mathematics (100.0%), and Management (55.6%).
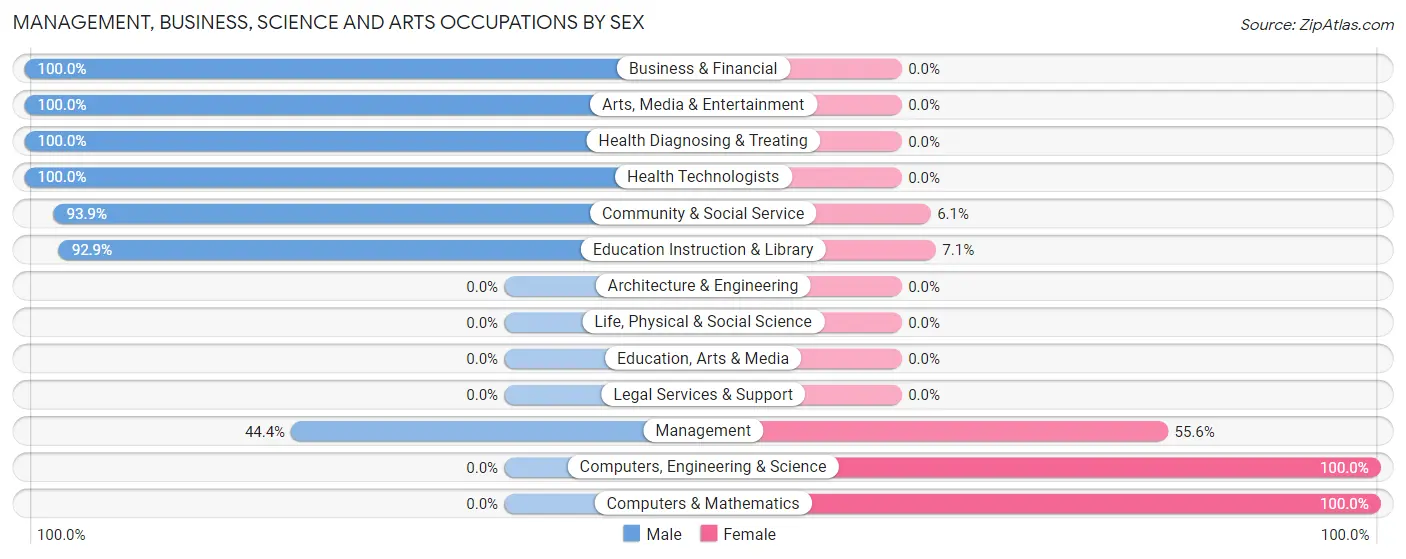
| Occupation | Male | Female |
| Management | 20 (44.4%) | 25 (55.6%) |
| Business & Financial | 24 (100.0%) | 0 (0.0%) |
| Computers, Engineering & Science | 0 (0.0%) | 3 (100.0%) |
| Computers & Mathematics | 0 (0.0%) | 3 (100.0%) |
| Architecture & Engineering | 0 (0.0%) | 0 (0.0%) |
| Life, Physical & Social Science | 0 (0.0%) | 0 (0.0%) |
| Community & Social Service | 31 (93.9%) | 2 (6.1%) |
| Education, Arts & Media | 0 (0.0%) | 0 (0.0%) |
| Legal Services & Support | 0 (0.0%) | 0 (0.0%) |
| Education Instruction & Library | 26 (92.9%) | 2 (7.1%) |
| Arts, Media & Entertainment | 5 (100.0%) | 0 (0.0%) |
| Health Diagnosing & Treating | 1 (100.0%) | 0 (0.0%) |
| Health Technologists | 1 (100.0%) | 0 (0.0%) |
| Total (Category) | 76 (71.7%) | 30 (28.3%) |
| Total (Overall) | 97 (71.9%) | 38 (28.1%) |
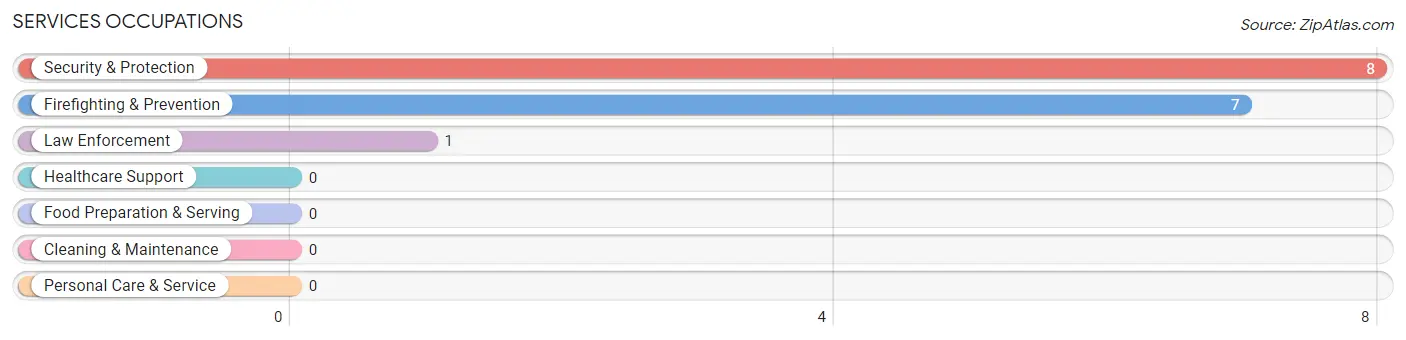
Services Occupations
The most common Services occupations in Harpers Ferry are Security & Protection (8 | 5.9%), Firefighting & Prevention (7 | 5.2%), and Law Enforcement (1 | 0.7%).
Services Occupations by Sex
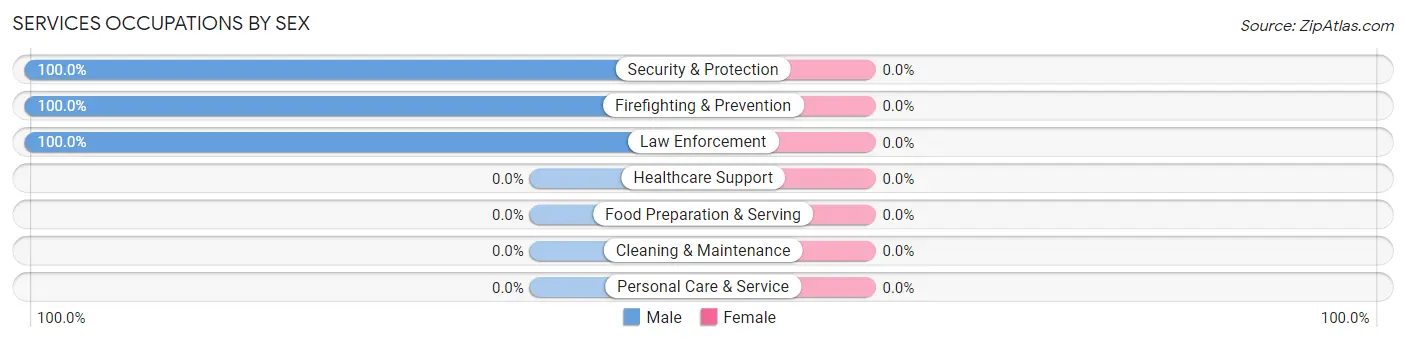
| Occupation | Male | Female |
| Healthcare Support | 0 (0.0%) | 0 (0.0%) |
| Security & Protection | 8 (100.0%) | 0 (0.0%) |
| Firefighting & Prevention | 7 (100.0%) | 0 (0.0%) |
| Law Enforcement | 1 (100.0%) | 0 (0.0%) |
| Food Preparation & Serving | 0 (0.0%) | 0 (0.0%) |
| Cleaning & Maintenance | 0 (0.0%) | 0 (0.0%) |
| Personal Care & Service | 0 (0.0%) | 0 (0.0%) |
| Total (Category) | 8 (100.0%) | 0 (0.0%) |
| Total (Overall) | 97 (71.9%) | 38 (28.1%) |
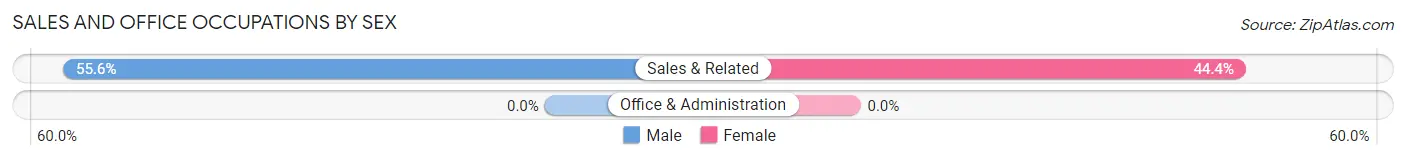
Sales and Office Occupations
The most common Sales and Office occupations in Harpers Ferry are , and Sales & Related (18 | 13.3%).
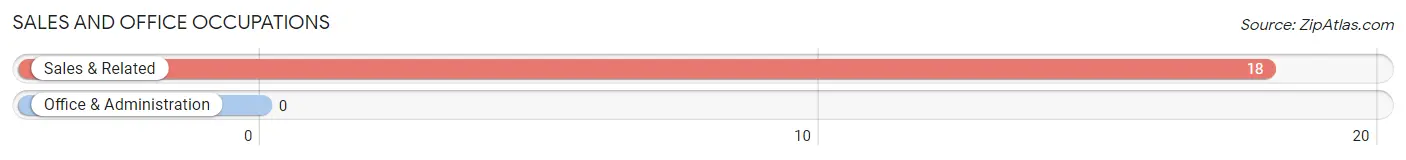
Sales and Office Occupations by Sex
| Occupation | Male | Female |
| Sales & Related | 10 (55.6%) | 8 (44.4%) |
| Office & Administration | 0 (0.0%) | 0 (0.0%) |
| Total (Category) | 10 (55.6%) | 8 (44.4%) |
| Total (Overall) | 97 (71.9%) | 38 (28.1%) |
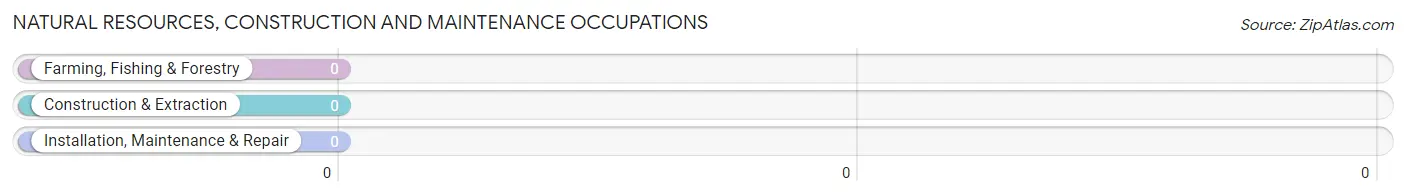
Natural Resources, Construction and Maintenance Occupations
Natural Resources, Construction and Maintenance Occupations by Sex
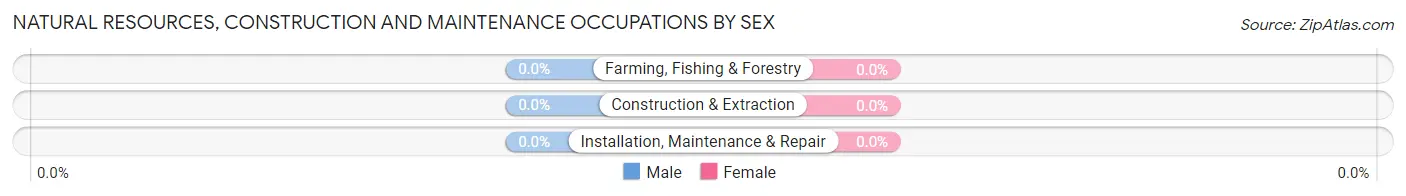
| Occupation | Male | Female |
| Farming, Fishing & Forestry | 0 (0.0%) | 0 (0.0%) |
| Construction & Extraction | 0 (0.0%) | 0 (0.0%) |
| Installation, Maintenance & Repair | 0 (0.0%) | 0 (0.0%) |
| Total (Category) | 0 (0.0%) | 0 (0.0%) |
| Total (Overall) | 97 (71.9%) | 38 (28.1%) |
Production, Transportation and Moving Occupations
The most common Production, Transportation and Moving occupations in Harpers Ferry are , and Production (3 | 2.2%).
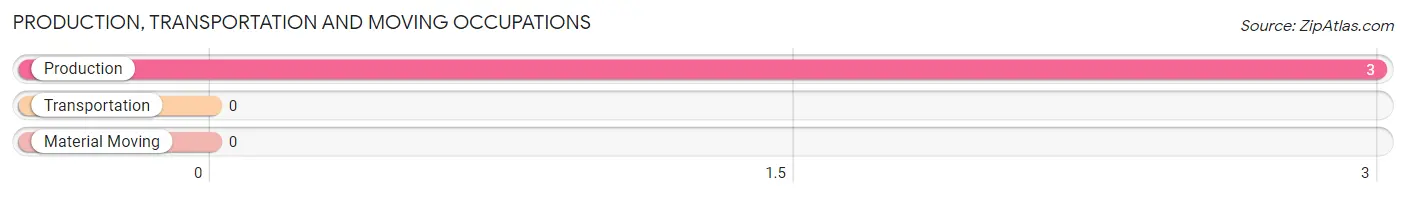
Production, Transportation and Moving Occupations by Sex
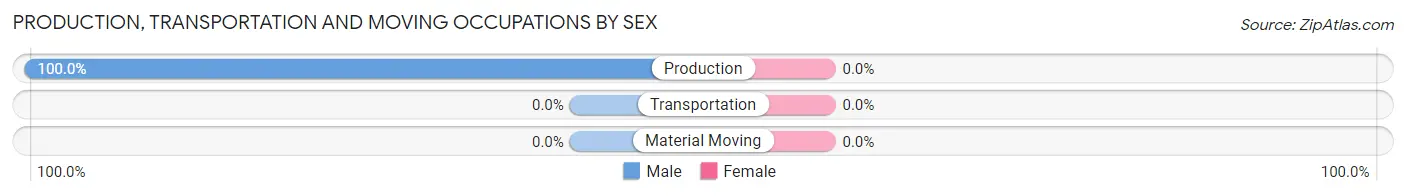
| Occupation | Male | Female |
| Production | 3 (100.0%) | 0 (0.0%) |
| Transportation | 0 (0.0%) | 0 (0.0%) |
| Material Moving | 0 (0.0%) | 0 (0.0%) |
| Total (Category) | 3 (100.0%) | 0 (0.0%) |
| Total (Overall) | 97 (71.9%) | 38 (28.1%) |
Employment Industries by Sex in Harpers Ferry
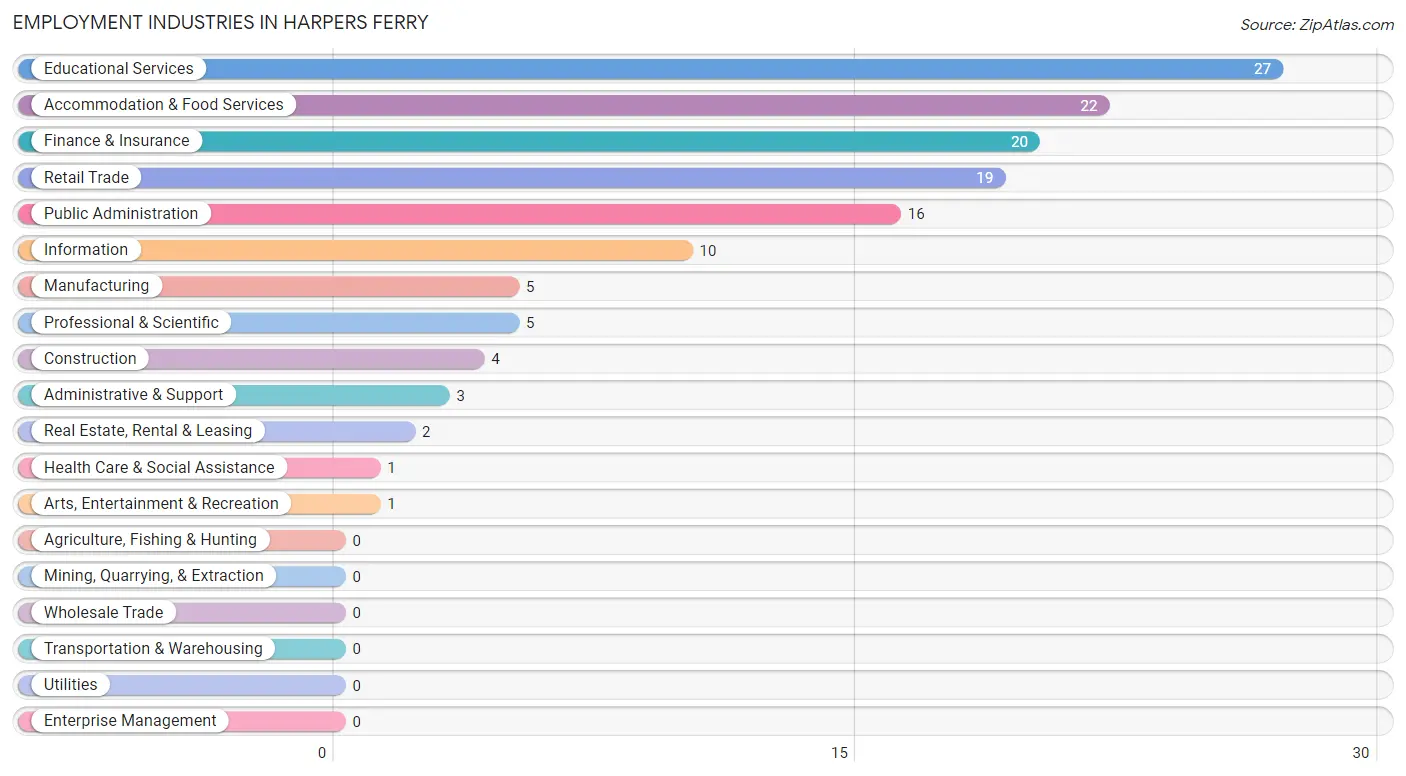
Employment Industries in Harpers Ferry
The major employment industries in Harpers Ferry include Educational Services (27 | 20.0%), Accommodation & Food Services (22 | 16.3%), Finance & Insurance (20 | 14.8%), Retail Trade (19 | 14.1%), and Public Administration (16 | 11.8%).
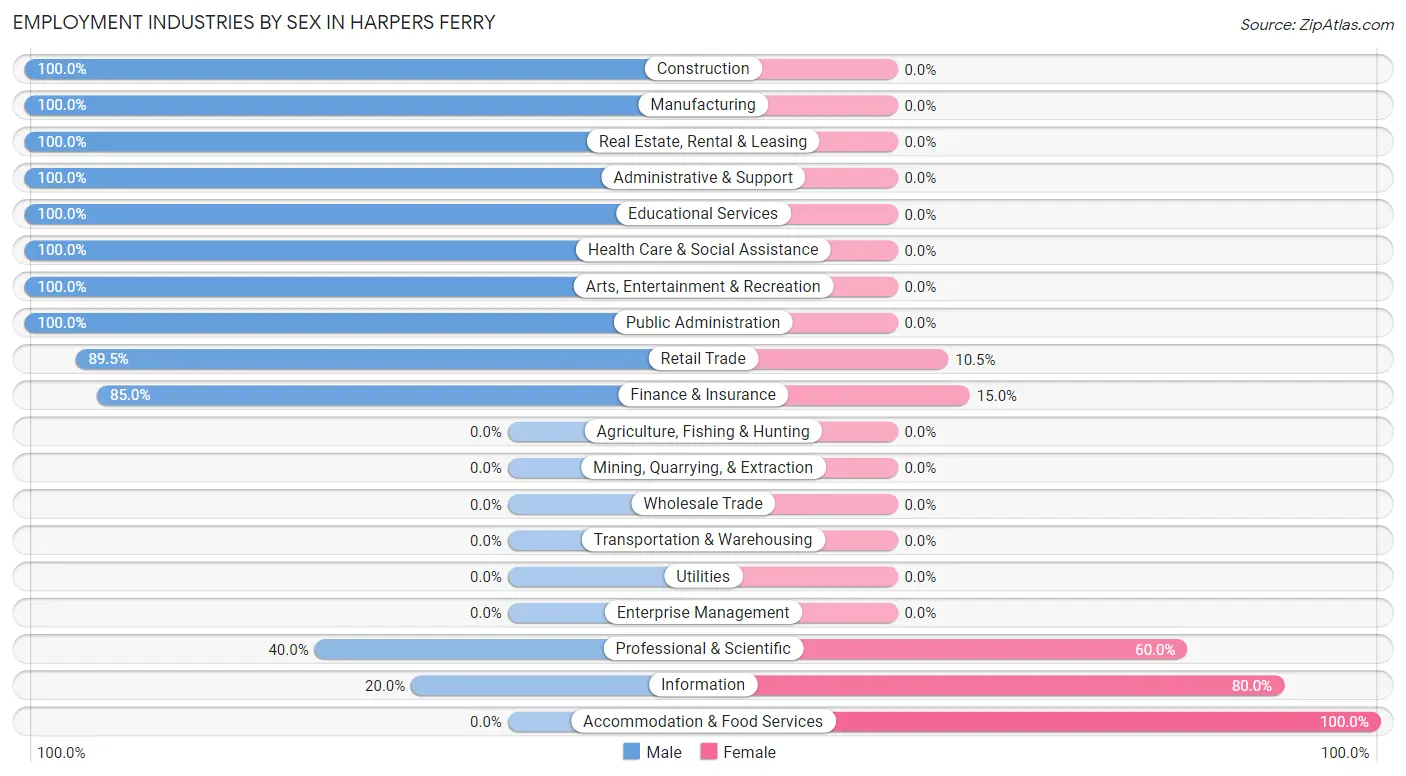
Employment Industries by Sex in Harpers Ferry
The Harpers Ferry industries that see more men than women are Construction (100.0%), Manufacturing (100.0%), and Real Estate, Rental & Leasing (100.0%), whereas the industries that tend to have a higher number of women are Accommodation & Food Services (100.0%), Information (80.0%), and Professional & Scientific (60.0%).
| Industry | Male | Female |
| Agriculture, Fishing & Hunting | 0 (0.0%) | 0 (0.0%) |
| Mining, Quarrying, & Extraction | 0 (0.0%) | 0 (0.0%) |
| Construction | 4 (100.0%) | 0 (0.0%) |
| Manufacturing | 5 (100.0%) | 0 (0.0%) |
| Wholesale Trade | 0 (0.0%) | 0 (0.0%) |
| Retail Trade | 17 (89.5%) | 2 (10.5%) |
| Transportation & Warehousing | 0 (0.0%) | 0 (0.0%) |
| Utilities | 0 (0.0%) | 0 (0.0%) |
| Information | 2 (20.0%) | 8 (80.0%) |
| Finance & Insurance | 17 (85.0%) | 3 (15.0%) |
| Real Estate, Rental & Leasing | 2 (100.0%) | 0 (0.0%) |
| Professional & Scientific | 2 (40.0%) | 3 (60.0%) |
| Enterprise Management | 0 (0.0%) | 0 (0.0%) |
| Administrative & Support | 3 (100.0%) | 0 (0.0%) |
| Educational Services | 27 (100.0%) | 0 (0.0%) |
| Health Care & Social Assistance | 1 (100.0%) | 0 (0.0%) |
| Arts, Entertainment & Recreation | 1 (100.0%) | 0 (0.0%) |
| Accommodation & Food Services | 0 (0.0%) | 22 (100.0%) |
| Public Administration | 16 (100.0%) | 0 (0.0%) |
| Total | 97 (71.9%) | 38 (28.1%) |
Education in Harpers Ferry
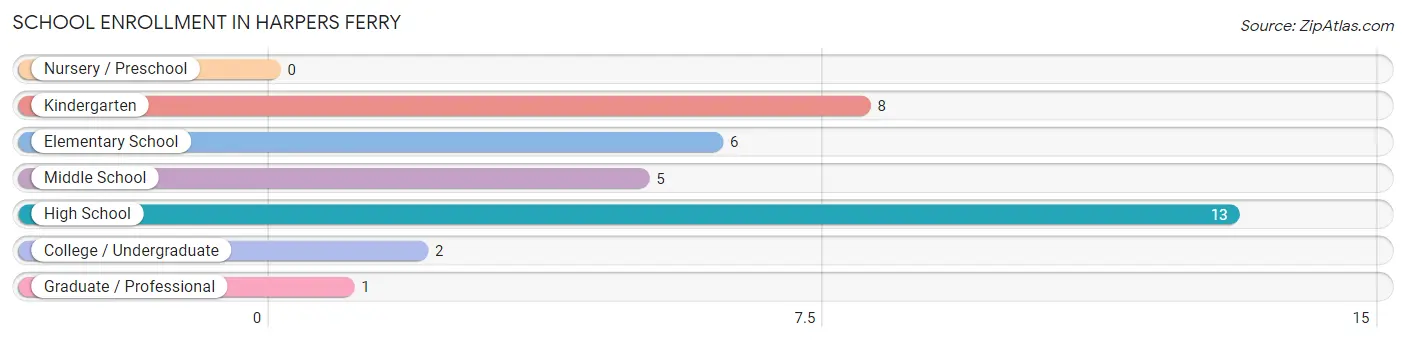
School Enrollment in Harpers Ferry
The most common levels of schooling among the 35 students in Harpers Ferry are high school (13 | 37.1%), kindergarten (8 | 22.9%), and elementary school (6 | 17.1%).
| School Level | # Students | % Students |
| Nursery / Preschool | 0 | 0.0% |
| Kindergarten | 8 | 22.9% |
| Elementary School | 6 | 17.1% |
| Middle School | 5 | 14.3% |
| High School | 13 | 37.1% |
| College / Undergraduate | 2 | 5.7% |
| Graduate / Professional | 1 | 2.9% |
| Total | 35 | 100.0% |
School Enrollment by Age by Funding Source in Harpers Ferry
Out of a total of 35 students who are enrolled in schools in Harpers Ferry, 9 (25.7%) attend a private institution, while the remaining 26 (74.3%) are enrolled in public schools. The age group of 10 to 14 year olds has the highest likelihood of being enrolled in private schools, with 6 (85.7% in the age bracket) enrolled. Conversely, the age group of 5 to 9 year old has the lowest likelihood of being enrolled in a private school, with 12 (100.0% in the age bracket) attending a public institution.
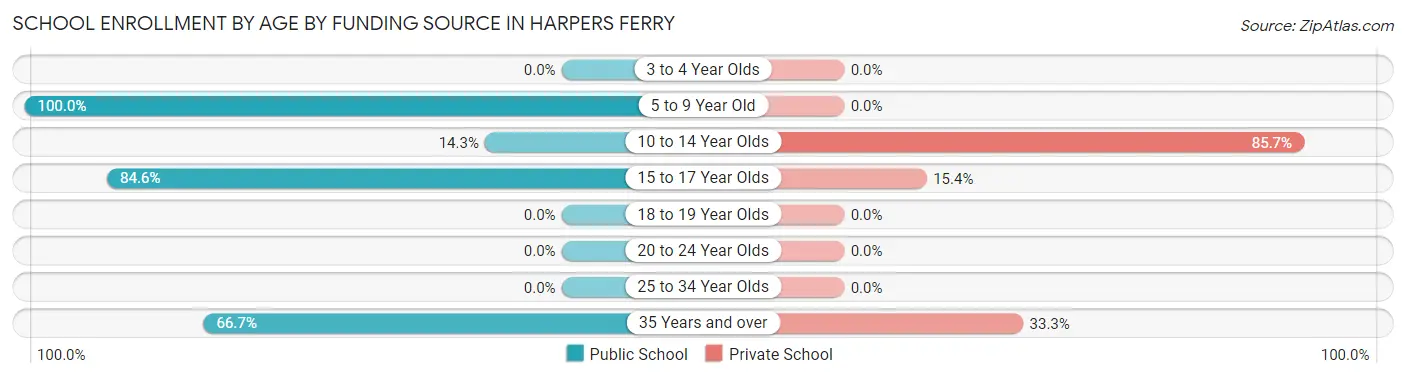
| Age Bracket | Public School | Private School |
| 3 to 4 Year Olds | 0 (0.0%) | 0 (0.0%) |
| 5 to 9 Year Old | 12 (100.0%) | 0 (0.0%) |
| 10 to 14 Year Olds | 1 (14.3%) | 6 (85.7%) |
| 15 to 17 Year Olds | 11 (84.6%) | 2 (15.4%) |
| 18 to 19 Year Olds | 0 (0.0%) | 0 (0.0%) |
| 20 to 24 Year Olds | 0 (0.0%) | 0 (0.0%) |
| 25 to 34 Year Olds | 0 (0.0%) | 0 (0.0%) |
| 35 Years and over | 2 (66.7%) | 1 (33.3%) |
| Total | 26 (74.3%) | 9 (25.7%) |
Educational Attainment by Field of Study in Harpers Ferry
Liberal arts & history (33 | 20.4%), visual & performing arts (28 | 17.3%), business (22 | 13.6%), education (22 | 13.6%), and literature & languages (11 | 6.8%) are the most common fields of study among 162 individuals in Harpers Ferry who have obtained a bachelor's degree or higher.
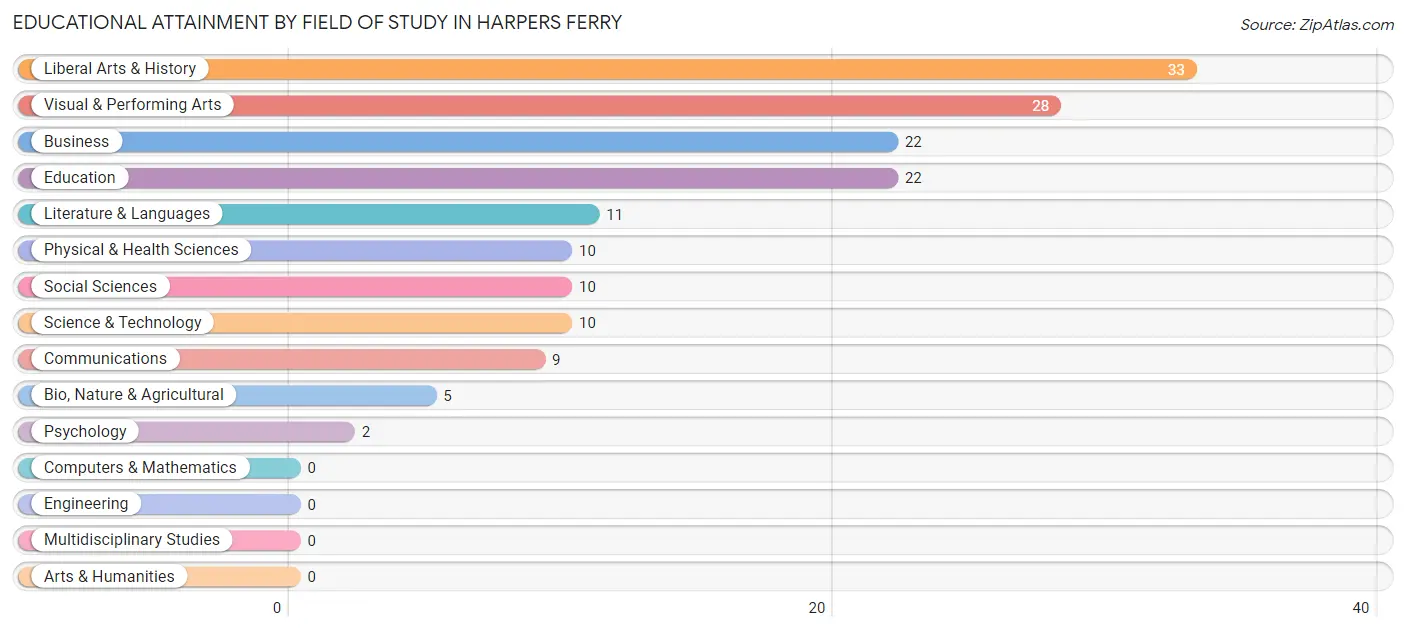
| Field of Study | # Graduates | % Graduates |
| Computers & Mathematics | 0 | 0.0% |
| Bio, Nature & Agricultural | 5 | 3.1% |
| Physical & Health Sciences | 10 | 6.2% |
| Psychology | 2 | 1.2% |
| Social Sciences | 10 | 6.2% |
| Engineering | 0 | 0.0% |
| Multidisciplinary Studies | 0 | 0.0% |
| Science & Technology | 10 | 6.2% |
| Business | 22 | 13.6% |
| Education | 22 | 13.6% |
| Literature & Languages | 11 | 6.8% |
| Liberal Arts & History | 33 | 20.4% |
| Visual & Performing Arts | 28 | 17.3% |
| Communications | 9 | 5.6% |
| Arts & Humanities | 0 | 0.0% |
| Total | 162 | 100.0% |
Transportation & Commute in Harpers Ferry
Vehicle Availability by Sex in Harpers Ferry
The most prevalent vehicle ownership categories in Harpers Ferry are males with 2 vehicles (72, accounting for 74.2%) and females with 2 vehicles (33, making up 189.5%).
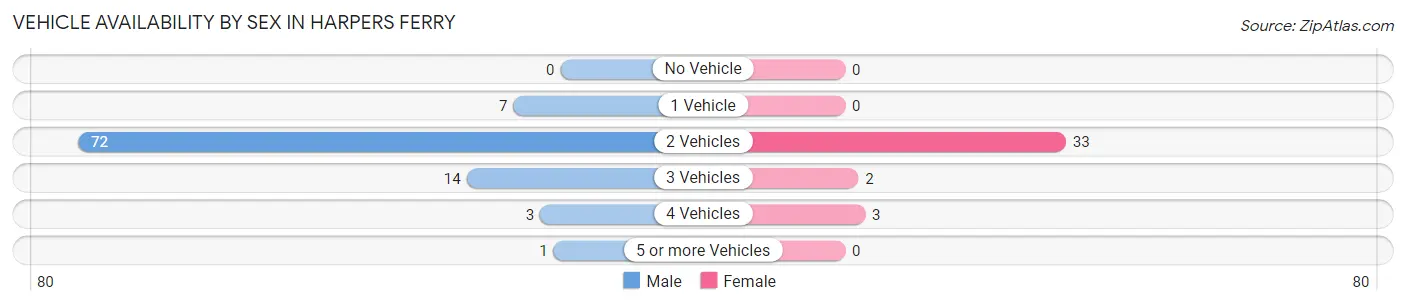
| Vehicles Available | Male | Female |
| No Vehicle | 0 (0.0%) | 0 (0.0%) |
| 1 Vehicle | 7 (7.2%) | 0 (0.0%) |
| 2 Vehicles | 72 (74.2%) | 33 (86.8%) |
| 3 Vehicles | 14 (14.4%) | 2 (5.3%) |
| 4 Vehicles | 3 (3.1%) | 3 (7.9%) |
| 5 or more Vehicles | 1 (1.0%) | 0 (0.0%) |
| Total | 97 (100.0%) | 38 (100.0%) |
Commute Time in Harpers Ferry
The most frequently occuring commute durations in Harpers Ferry are 90 or more minutes (35 commuters, 41.7%), 20 to 24 minutes (17 commuters, 20.2%), and 45 to 59 minutes (8 commuters, 9.5%).
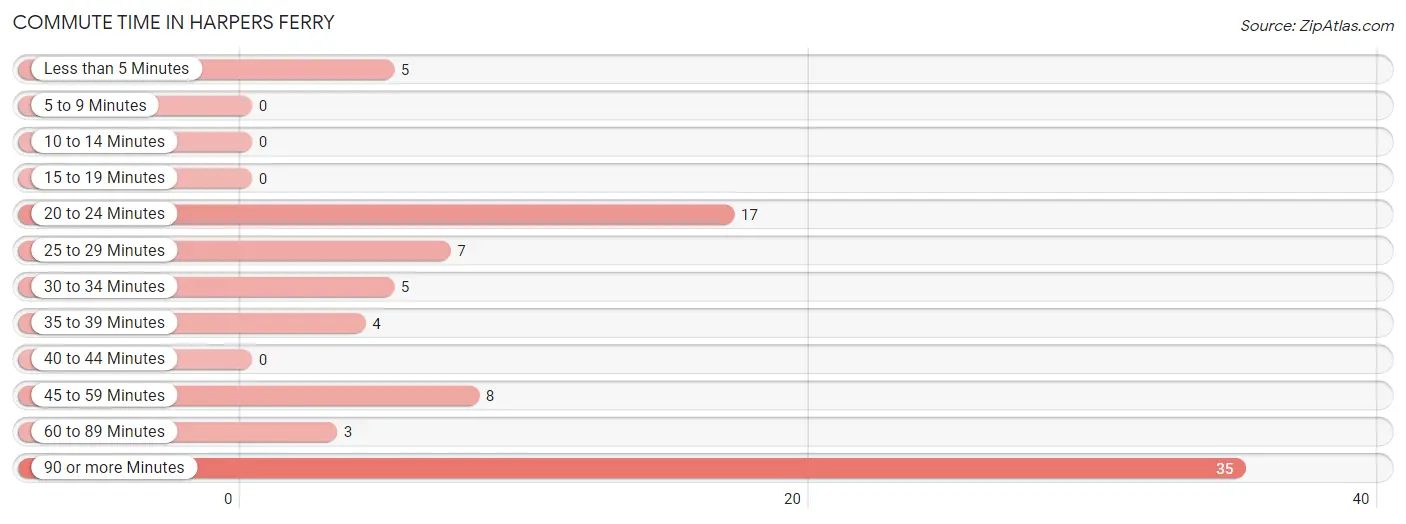
| Commute Time | # Commuters | % Commuters |
| Less than 5 Minutes | 5 | 5.9% |
| 5 to 9 Minutes | 0 | 0.0% |
| 10 to 14 Minutes | 0 | 0.0% |
| 15 to 19 Minutes | 0 | 0.0% |
| 20 to 24 Minutes | 17 | 20.2% |
| 25 to 29 Minutes | 7 | 8.3% |
| 30 to 34 Minutes | 5 | 5.9% |
| 35 to 39 Minutes | 4 | 4.8% |
| 40 to 44 Minutes | 0 | 0.0% |
| 45 to 59 Minutes | 8 | 9.5% |
| 60 to 89 Minutes | 3 | 3.6% |
| 90 or more Minutes | 35 | 41.7% |
Commute Time by Sex in Harpers Ferry
The most common commute times in Harpers Ferry are 90 or more minutes (30 commuters, 42.2%) for males and 20 to 24 minutes (6 commuters, 46.2%) for females.
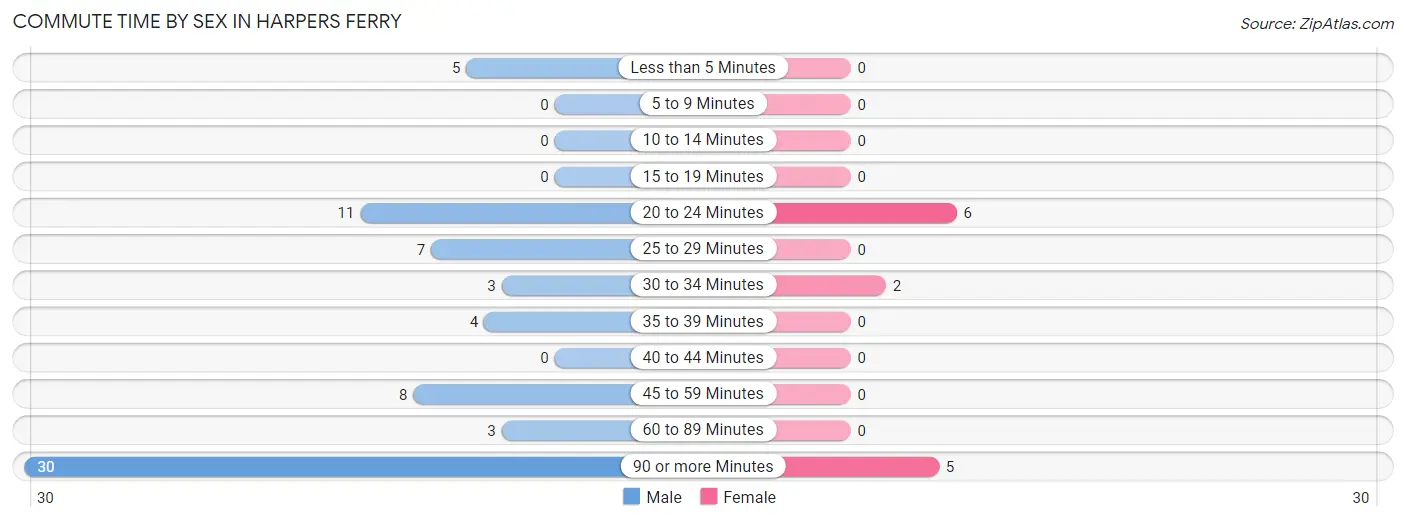
| Commute Time | Male | Female |
| Less than 5 Minutes | 5 (7.0%) | 0 (0.0%) |
| 5 to 9 Minutes | 0 (0.0%) | 0 (0.0%) |
| 10 to 14 Minutes | 0 (0.0%) | 0 (0.0%) |
| 15 to 19 Minutes | 0 (0.0%) | 0 (0.0%) |
| 20 to 24 Minutes | 11 (15.5%) | 6 (46.2%) |
| 25 to 29 Minutes | 7 (9.9%) | 0 (0.0%) |
| 30 to 34 Minutes | 3 (4.2%) | 2 (15.4%) |
| 35 to 39 Minutes | 4 (5.6%) | 0 (0.0%) |
| 40 to 44 Minutes | 0 (0.0%) | 0 (0.0%) |
| 45 to 59 Minutes | 8 (11.3%) | 0 (0.0%) |
| 60 to 89 Minutes | 3 (4.2%) | 0 (0.0%) |
| 90 or more Minutes | 30 (42.2%) | 5 (38.5%) |
Time of Departure to Work by Sex in Harpers Ferry
The most frequent times of departure to work in Harpers Ferry are 5:30 AM to 5:59 AM (26, 36.6%) for males and 12:00 AM to 4:59 AM (8, 61.5%) for females.
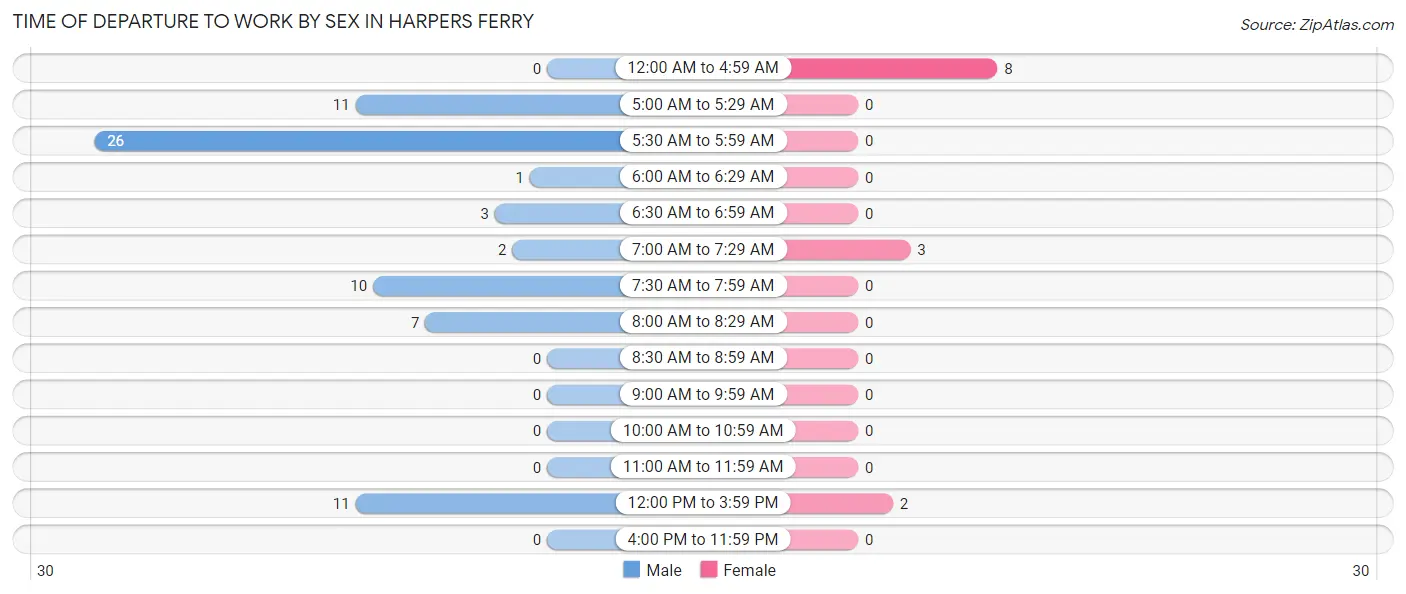
| Time of Departure | Male | Female |
| 12:00 AM to 4:59 AM | 0 (0.0%) | 8 (61.5%) |
| 5:00 AM to 5:29 AM | 11 (15.5%) | 0 (0.0%) |
| 5:30 AM to 5:59 AM | 26 (36.6%) | 0 (0.0%) |
| 6:00 AM to 6:29 AM | 1 (1.4%) | 0 (0.0%) |
| 6:30 AM to 6:59 AM | 3 (4.2%) | 0 (0.0%) |
| 7:00 AM to 7:29 AM | 2 (2.8%) | 3 (23.1%) |
| 7:30 AM to 7:59 AM | 10 (14.1%) | 0 (0.0%) |
| 8:00 AM to 8:29 AM | 7 (9.9%) | 0 (0.0%) |
| 8:30 AM to 8:59 AM | 0 (0.0%) | 0 (0.0%) |
| 9:00 AM to 9:59 AM | 0 (0.0%) | 0 (0.0%) |
| 10:00 AM to 10:59 AM | 0 (0.0%) | 0 (0.0%) |
| 11:00 AM to 11:59 AM | 0 (0.0%) | 0 (0.0%) |
| 12:00 PM to 3:59 PM | 11 (15.5%) | 2 (15.4%) |
| 4:00 PM to 11:59 PM | 0 (0.0%) | 0 (0.0%) |
| Total | 71 (100.0%) | 13 (100.0%) |
Housing Occupancy in Harpers Ferry
Occupancy by Ownership in Harpers Ferry
Of the total 125 dwellings in Harpers Ferry, owner-occupied units account for 121 (96.8%), while renter-occupied units make up 4 (3.2%).
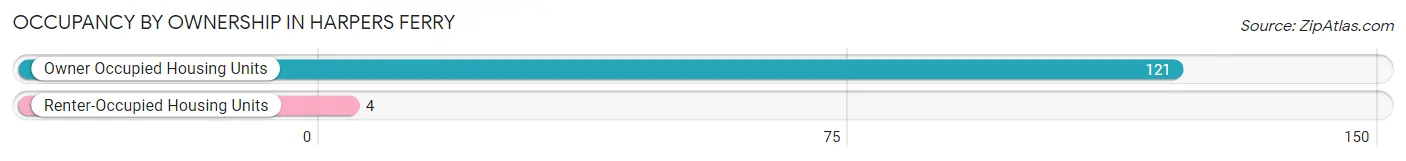
| Occupancy | # Housing Units | % Housing Units |
| Owner Occupied Housing Units | 121 | 96.8% |
| Renter-Occupied Housing Units | 4 | 3.2% |
| Total Occupied Housing Units | 125 | 100.0% |
Occupancy by Household Size in Harpers Ferry
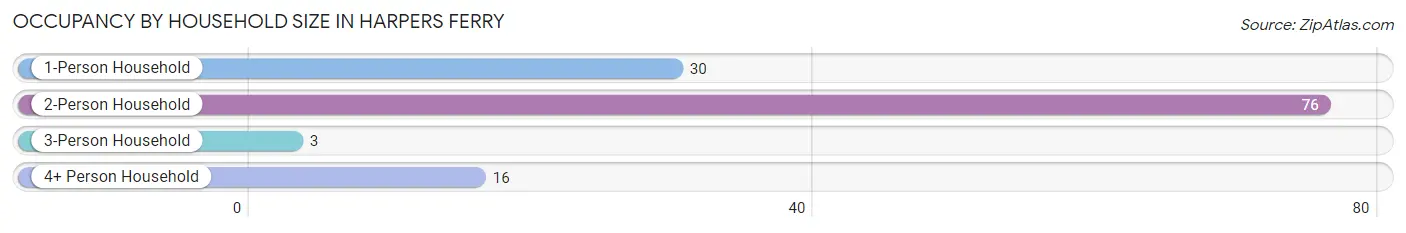
| Household Size | # Housing Units | % Housing Units |
| 1-Person Household | 30 | 24.0% |
| 2-Person Household | 76 | 60.8% |
| 3-Person Household | 3 | 2.4% |
| 4+ Person Household | 16 | 12.8% |
| Total Housing Units | 125 | 100.0% |
Occupancy by Ownership by Household Size in Harpers Ferry
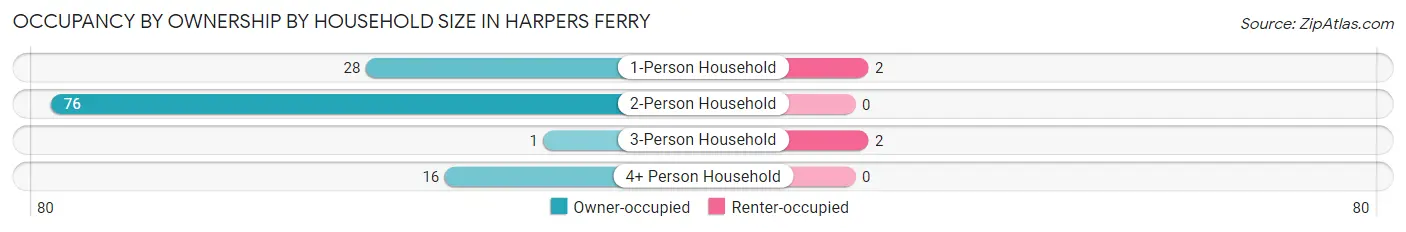
| Household Size | Owner-occupied | Renter-occupied |
| 1-Person Household | 28 (93.3%) | 2 (6.7%) |
| 2-Person Household | 76 (100.0%) | 0 (0.0%) |
| 3-Person Household | 1 (33.3%) | 2 (66.7%) |
| 4+ Person Household | 16 (100.0%) | 0 (0.0%) |
| Total Housing Units | 121 (96.8%) | 4 (3.2%) |
Occupancy by Educational Attainment in Harpers Ferry
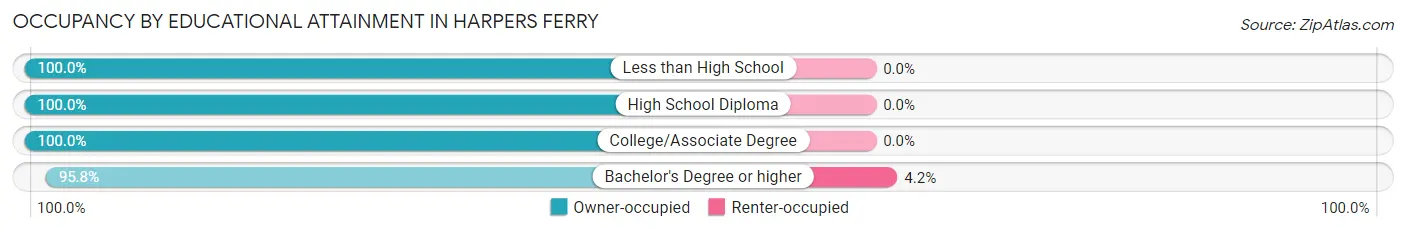
| Household Size | Owner-occupied | Renter-occupied |
| Less than High School | 6 (100.0%) | 0 (0.0%) |
| High School Diploma | 15 (100.0%) | 0 (0.0%) |
| College/Associate Degree | 9 (100.0%) | 0 (0.0%) |
| Bachelor's Degree or higher | 91 (95.8%) | 4 (4.2%) |
Occupancy by Age of Householder in Harpers Ferry
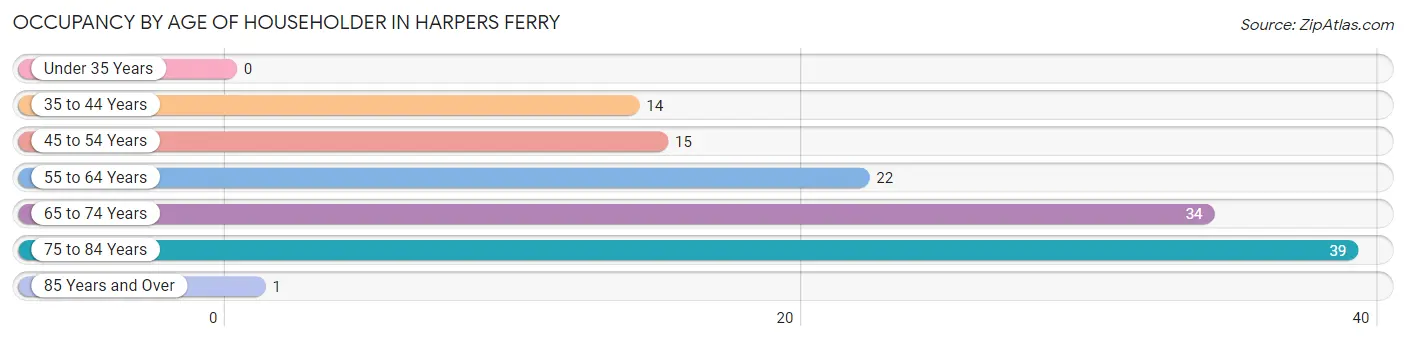
| Age Bracket | # Households | % Households |
| Under 35 Years | 0 | 0.0% |
| 35 to 44 Years | 14 | 11.2% |
| 45 to 54 Years | 15 | 12.0% |
| 55 to 64 Years | 22 | 17.6% |
| 65 to 74 Years | 34 | 27.2% |
| 75 to 84 Years | 39 | 31.2% |
| 85 Years and Over | 1 | 0.8% |
| Total | 125 | 100.0% |
Housing Finances in Harpers Ferry
Median Income by Occupancy in Harpers Ferry
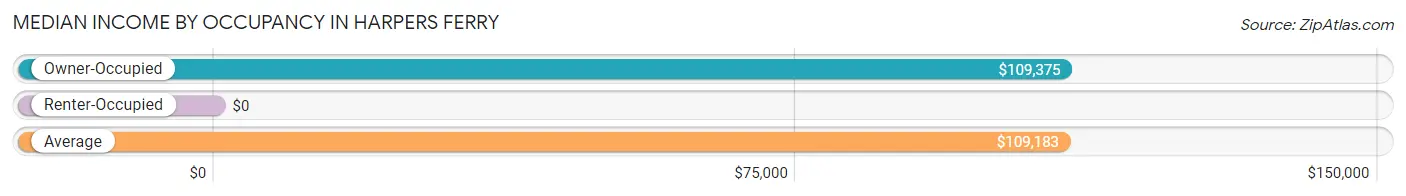
| Occupancy Type | # Households | Median Income |
| Owner-Occupied | 121 (96.8%) | $109,375 |
| Renter-Occupied | 4 (3.2%) | $0 |
| Average | 125 (100.0%) | $109,183 |
Occupancy by Householder Income Bracket in Harpers Ferry
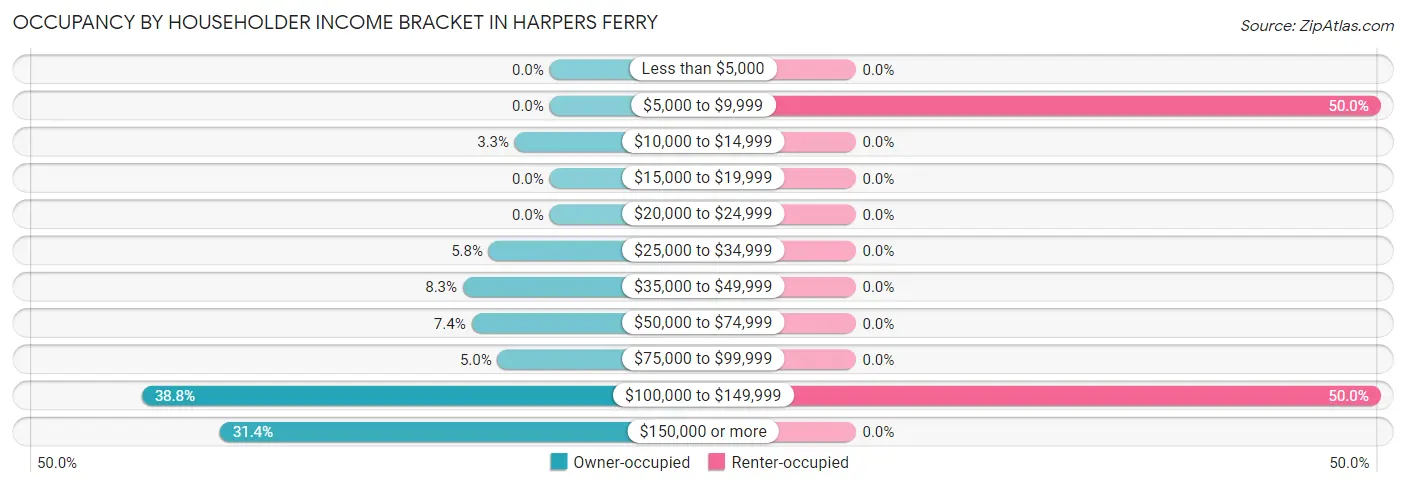
| Income Bracket | Owner-occupied | Renter-occupied |
| Less than $5,000 | 0 (0.0%) | 0 (0.0%) |
| $5,000 to $9,999 | 0 (0.0%) | 2 (50.0%) |
| $10,000 to $14,999 | 4 (3.3%) | 0 (0.0%) |
| $15,000 to $19,999 | 0 (0.0%) | 0 (0.0%) |
| $20,000 to $24,999 | 0 (0.0%) | 0 (0.0%) |
| $25,000 to $34,999 | 7 (5.8%) | 0 (0.0%) |
| $35,000 to $49,999 | 10 (8.3%) | 0 (0.0%) |
| $50,000 to $74,999 | 9 (7.4%) | 0 (0.0%) |
| $75,000 to $99,999 | 6 (5.0%) | 0 (0.0%) |
| $100,000 to $149,999 | 47 (38.8%) | 2 (50.0%) |
| $150,000 or more | 38 (31.4%) | 0 (0.0%) |
| Total | 121 (100.0%) | 4 (100.0%) |
Monthly Housing Cost Tiers in Harpers Ferry
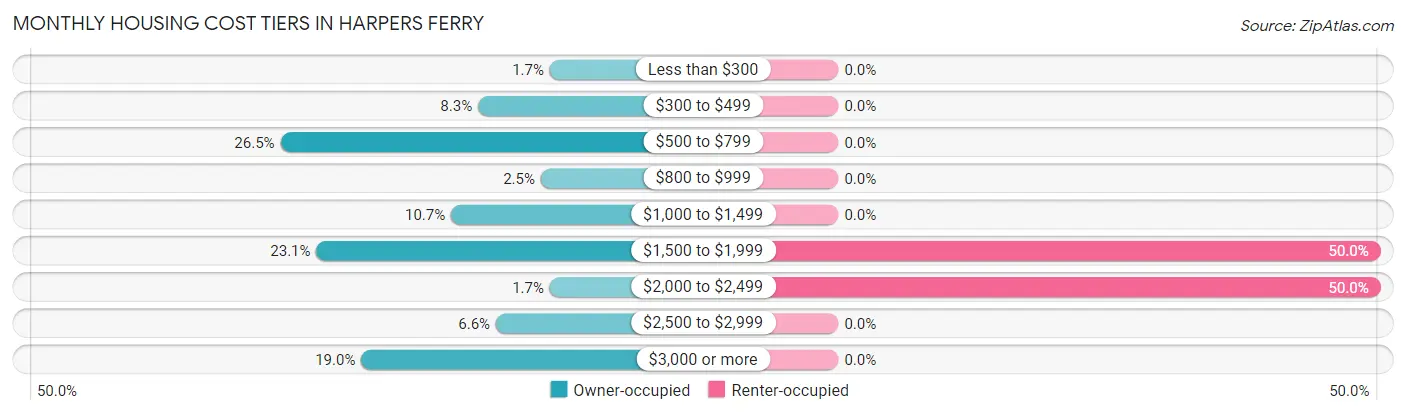
| Monthly Cost | Owner-occupied | Renter-occupied |
| Less than $300 | 2 (1.7%) | 0 (0.0%) |
| $300 to $499 | 10 (8.3%) | 0 (0.0%) |
| $500 to $799 | 32 (26.5%) | 0 (0.0%) |
| $800 to $999 | 3 (2.5%) | 0 (0.0%) |
| $1,000 to $1,499 | 13 (10.7%) | 0 (0.0%) |
| $1,500 to $1,999 | 28 (23.1%) | 2 (50.0%) |
| $2,000 to $2,499 | 2 (1.7%) | 2 (50.0%) |
| $2,500 to $2,999 | 8 (6.6%) | 0 (0.0%) |
| $3,000 or more | 23 (19.0%) | 0 (0.0%) |
| Total | 121 (100.0%) | 4 (100.0%) |
Physical Housing Characteristics in Harpers Ferry
Housing Structures in Harpers Ferry
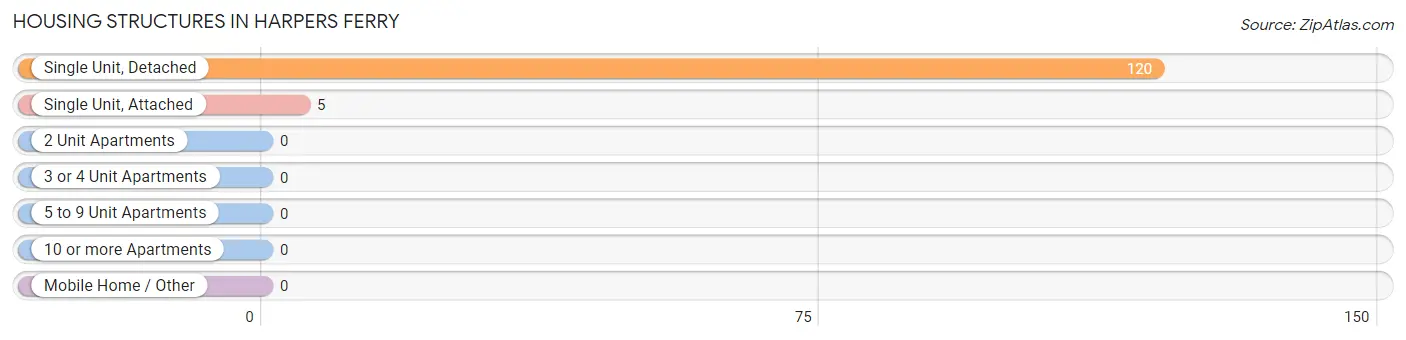
| Structure Type | # Housing Units | % Housing Units |
| Single Unit, Detached | 120 | 96.0% |
| Single Unit, Attached | 5 | 4.0% |
| 2 Unit Apartments | 0 | 0.0% |
| 3 or 4 Unit Apartments | 0 | 0.0% |
| 5 to 9 Unit Apartments | 0 | 0.0% |
| 10 or more Apartments | 0 | 0.0% |
| Mobile Home / Other | 0 | 0.0% |
| Total | 125 | 100.0% |
Housing Structures by Occupancy in Harpers Ferry
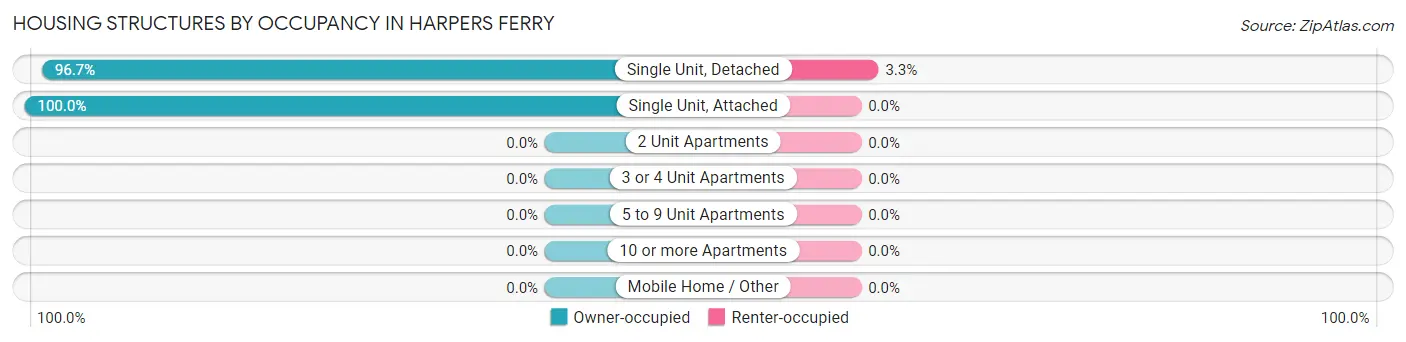
| Structure Type | Owner-occupied | Renter-occupied |
| Single Unit, Detached | 116 (96.7%) | 4 (3.3%) |
| Single Unit, Attached | 5 (100.0%) | 0 (0.0%) |
| 2 Unit Apartments | 0 (0.0%) | 0 (0.0%) |
| 3 or 4 Unit Apartments | 0 (0.0%) | 0 (0.0%) |
| 5 to 9 Unit Apartments | 0 (0.0%) | 0 (0.0%) |
| 10 or more Apartments | 0 (0.0%) | 0 (0.0%) |
| Mobile Home / Other | 0 (0.0%) | 0 (0.0%) |
| Total | 121 (96.8%) | 4 (3.2%) |
Housing Structures by Number of Rooms in Harpers Ferry
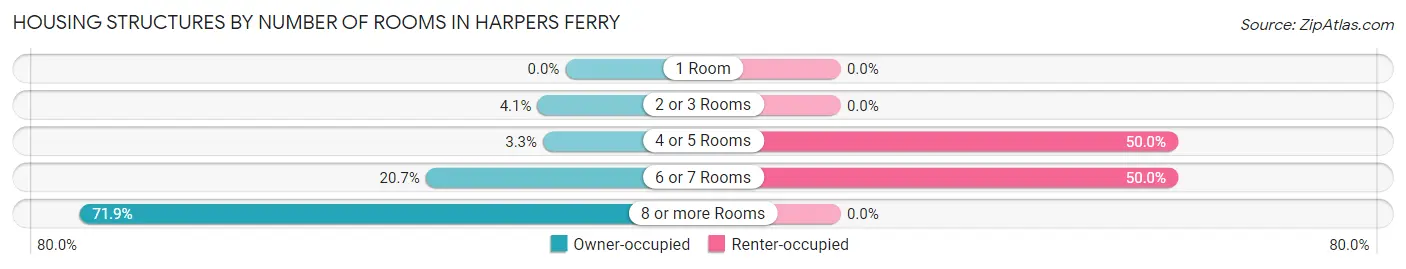
| Number of Rooms | Owner-occupied | Renter-occupied |
| 1 Room | 0 (0.0%) | 0 (0.0%) |
| 2 or 3 Rooms | 5 (4.1%) | 0 (0.0%) |
| 4 or 5 Rooms | 4 (3.3%) | 2 (50.0%) |
| 6 or 7 Rooms | 25 (20.7%) | 2 (50.0%) |
| 8 or more Rooms | 87 (71.9%) | 0 (0.0%) |
| Total | 121 (100.0%) | 4 (100.0%) |
Housing Structure by Heating Type in Harpers Ferry
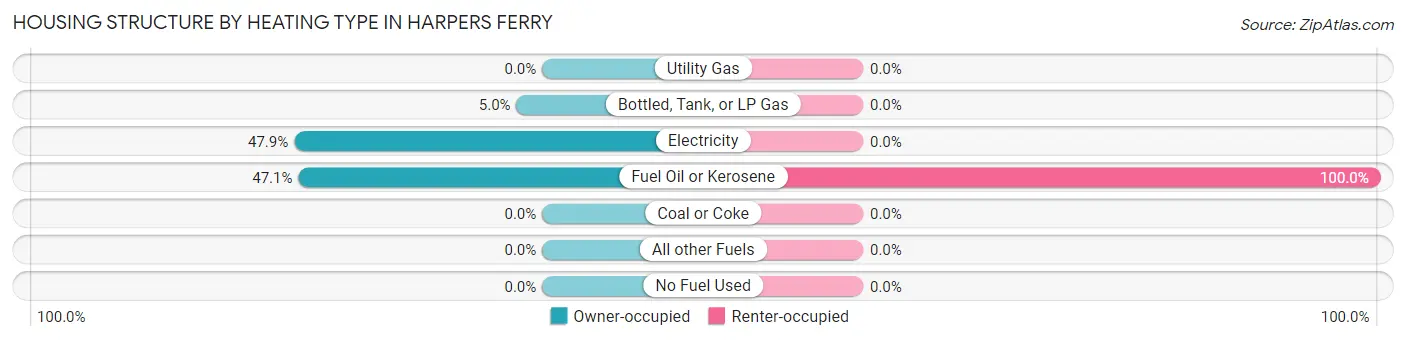
| Heating Type | Owner-occupied | Renter-occupied |
| Utility Gas | 0 (0.0%) | 0 (0.0%) |
| Bottled, Tank, or LP Gas | 6 (5.0%) | 0 (0.0%) |
| Electricity | 58 (47.9%) | 0 (0.0%) |
| Fuel Oil or Kerosene | 57 (47.1%) | 4 (100.0%) |
| Coal or Coke | 0 (0.0%) | 0 (0.0%) |
| All other Fuels | 0 (0.0%) | 0 (0.0%) |
| No Fuel Used | 0 (0.0%) | 0 (0.0%) |
| Total | 121 (100.0%) | 4 (100.0%) |
Household Vehicle Usage in Harpers Ferry
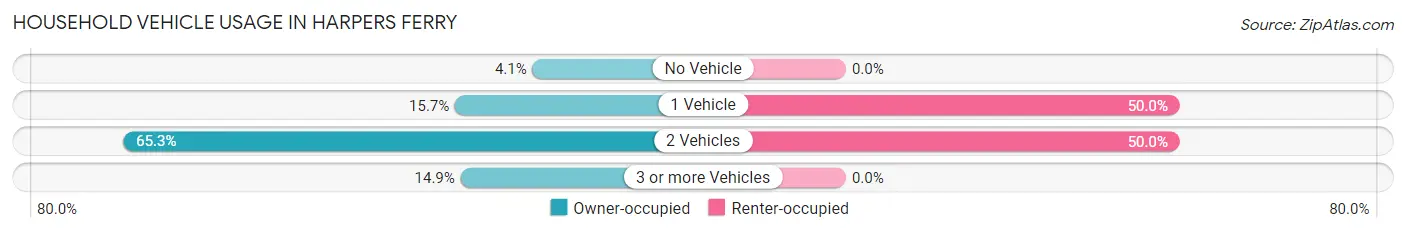
| Vehicles per Household | Owner-occupied | Renter-occupied |
| No Vehicle | 5 (4.1%) | 0 (0.0%) |
| 1 Vehicle | 19 (15.7%) | 2 (50.0%) |
| 2 Vehicles | 79 (65.3%) | 2 (50.0%) |
| 3 or more Vehicles | 18 (14.9%) | 0 (0.0%) |
| Total | 121 (100.0%) | 4 (100.0%) |
Real Estate & Mortgages in Harpers Ferry
Real Estate and Mortgage Overview in Harpers Ferry
| Characteristic | Without Mortgage | With Mortgage |
| Housing Units | 47 | 74 |
| Median Property Value | $346,100 | $483,300 |
| Median Household Income | $108,317 | $38 |
| Monthly Housing Costs | $633 | $23 |
| Real Estate Taxes | $2,317 | $0 |
Property Value by Mortgage Status in Harpers Ferry
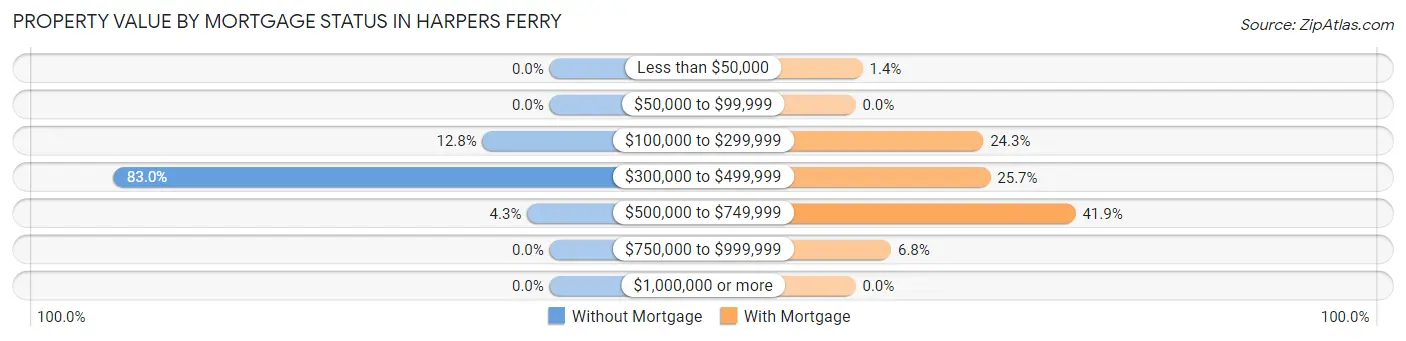
| Property Value | Without Mortgage | With Mortgage |
| Less than $50,000 | 0 (0.0%) | 1 (1.3%) |
| $50,000 to $99,999 | 0 (0.0%) | 0 (0.0%) |
| $100,000 to $299,999 | 6 (12.8%) | 18 (24.3%) |
| $300,000 to $499,999 | 39 (83.0%) | 19 (25.7%) |
| $500,000 to $749,999 | 2 (4.3%) | 31 (41.9%) |
| $750,000 to $999,999 | 0 (0.0%) | 5 (6.8%) |
| $1,000,000 or more | 0 (0.0%) | 0 (0.0%) |
| Total | 47 (100.0%) | 74 (100.0%) |
Household Income by Mortgage Status in Harpers Ferry
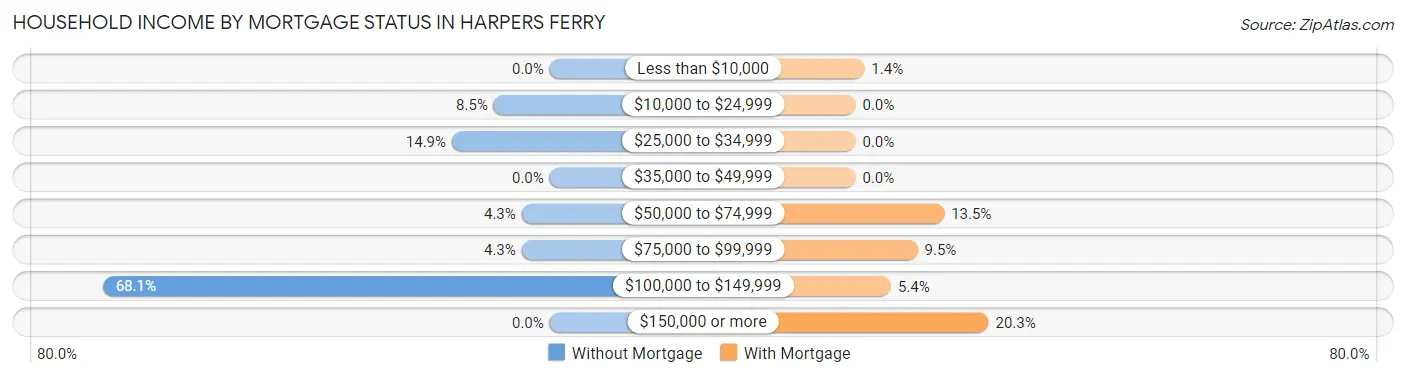
| Household Income | Without Mortgage | With Mortgage |
| Less than $10,000 | 0 (0.0%) | 1 (1.3%) |
| $10,000 to $24,999 | 4 (8.5%) | 0 (0.0%) |
| $25,000 to $34,999 | 7 (14.9%) | 0 (0.0%) |
| $35,000 to $49,999 | 0 (0.0%) | 0 (0.0%) |
| $50,000 to $74,999 | 2 (4.3%) | 10 (13.5%) |
| $75,000 to $99,999 | 2 (4.3%) | 7 (9.5%) |
| $100,000 to $149,999 | 32 (68.1%) | 4 (5.4%) |
| $150,000 or more | 0 (0.0%) | 15 (20.3%) |
| Total | 47 (100.0%) | 74 (100.0%) |
Property Value to Household Income Ratio in Harpers Ferry
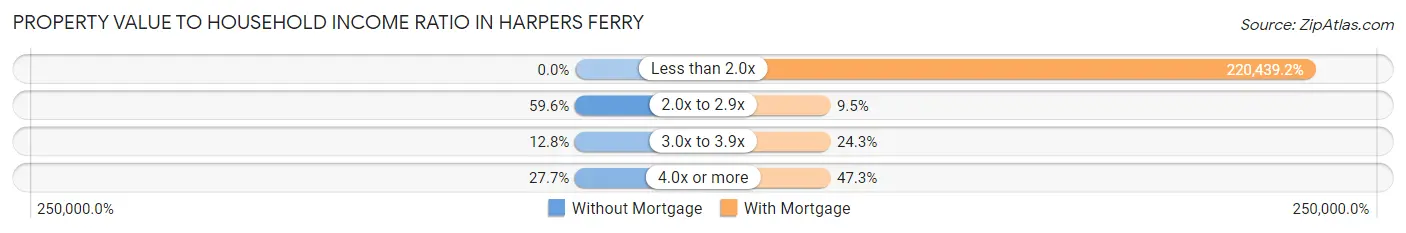
| Value-to-Income Ratio | Without Mortgage | With Mortgage |
| Less than 2.0x | 0 (0.0%) | 163,125 (220,439.2%) |
| 2.0x to 2.9x | 28 (59.6%) | 7 (9.5%) |
| 3.0x to 3.9x | 6 (12.8%) | 18 (24.3%) |
| 4.0x or more | 13 (27.7%) | 35 (47.3%) |
| Total | 47 (100.0%) | 74 (100.0%) |
Real Estate Taxes by Mortgage Status in Harpers Ferry
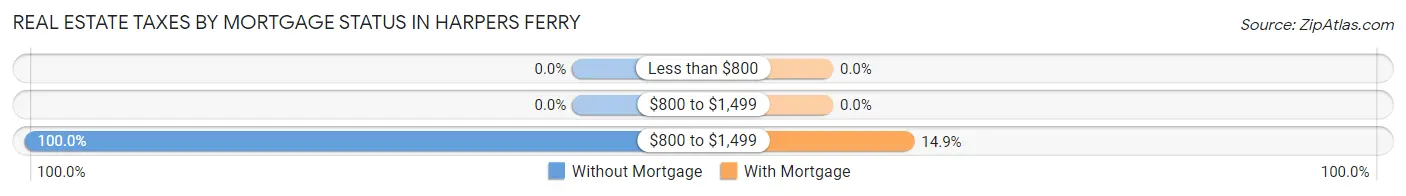
| Property Taxes | Without Mortgage | With Mortgage |
| Less than $800 | 0 (0.0%) | 0 (0.0%) |
| $800 to $1,499 | 0 (0.0%) | 0 (0.0%) |
| $800 to $1,499 | 47 (100.0%) | 11 (14.9%) |
| Total | 47 (100.0%) | 74 (100.0%) |
Health & Disability in Harpers Ferry
Health Insurance Coverage by Age in Harpers Ferry
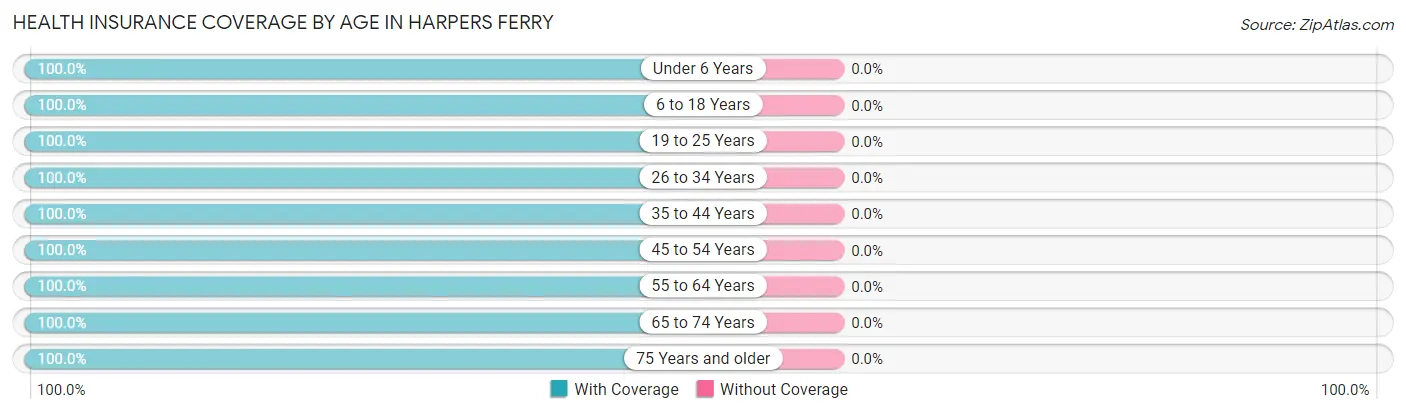
| Age Bracket | With Coverage | Without Coverage |
| Under 6 Years | 12 (100.0%) | 0 (0.0%) |
| 6 to 18 Years | 32 (100.0%) | 0 (0.0%) |
| 19 to 25 Years | 4 (100.0%) | 0 (0.0%) |
| 26 to 34 Years | 21 (100.0%) | 0 (0.0%) |
| 35 to 44 Years | 27 (100.0%) | 0 (0.0%) |
| 45 to 54 Years | 23 (100.0%) | 0 (0.0%) |
| 55 to 64 Years | 63 (100.0%) | 0 (0.0%) |
| 65 to 74 Years | 68 (100.0%) | 0 (0.0%) |
| 75 Years and older | 51 (100.0%) | 0 (0.0%) |
| Total | 301 (100.0%) | 0 (0.0%) |
Health Insurance Coverage by Citizenship Status in Harpers Ferry
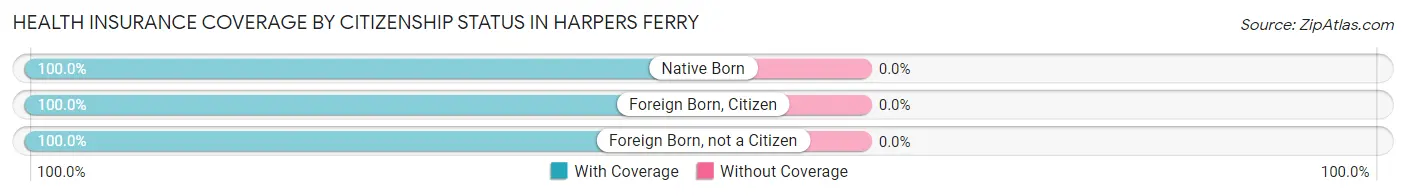
| Citizenship Status | With Coverage | Without Coverage |
| Native Born | 12 (100.0%) | 0 (0.0%) |
| Foreign Born, Citizen | 32 (100.0%) | 0 (0.0%) |
| Foreign Born, not a Citizen | 4 (100.0%) | 0 (0.0%) |
Health Insurance Coverage by Household Income in Harpers Ferry
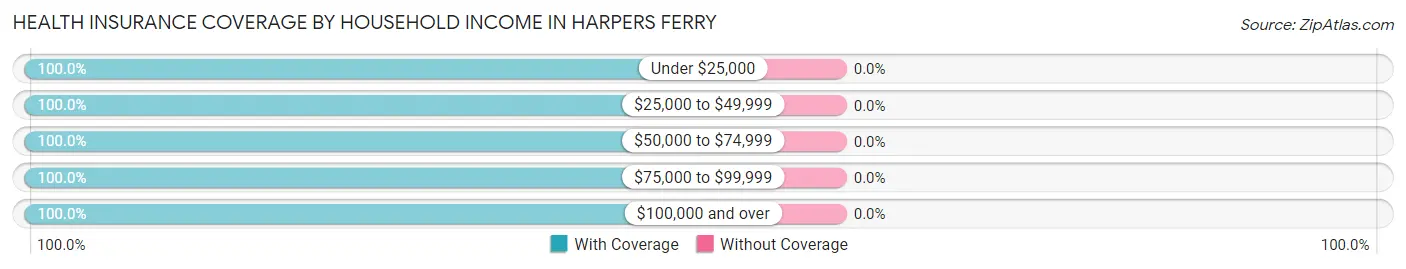
| Household Income | With Coverage | Without Coverage |
| Under $25,000 | 6 (100.0%) | 0 (0.0%) |
| $25,000 to $49,999 | 21 (100.0%) | 0 (0.0%) |
| $50,000 to $74,999 | 54 (100.0%) | 0 (0.0%) |
| $75,000 to $99,999 | 8 (100.0%) | 0 (0.0%) |
| $100,000 and over | 212 (100.0%) | 0 (0.0%) |
Public vs Private Health Insurance Coverage by Age in Harpers Ferry
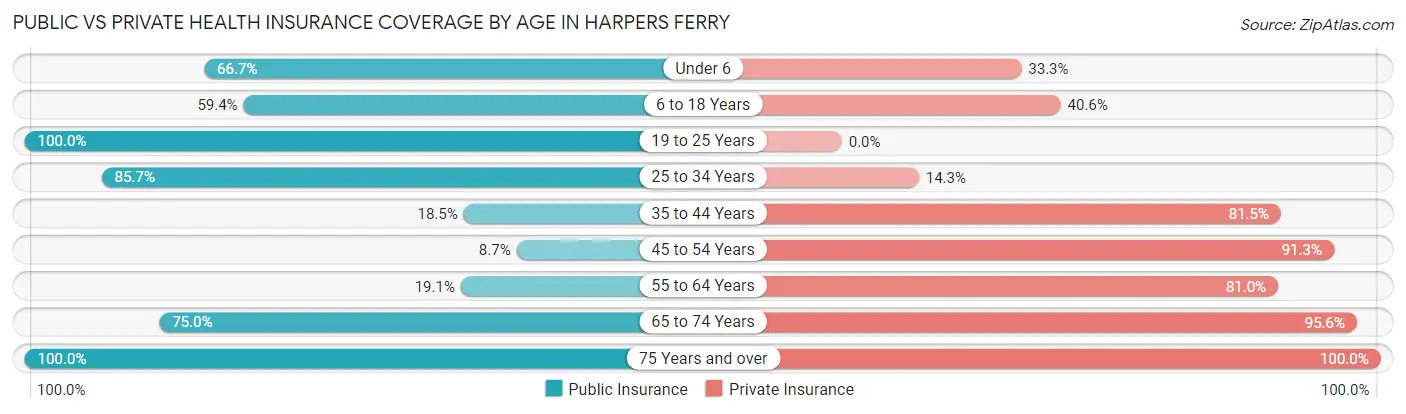
| Age Bracket | Public Insurance | Private Insurance |
| Under 6 | 8 (66.7%) | 4 (33.3%) |
| 6 to 18 Years | 19 (59.4%) | 13 (40.6%) |
| 19 to 25 Years | 4 (100.0%) | 0 (0.0%) |
| 25 to 34 Years | 18 (85.7%) | 3 (14.3%) |
| 35 to 44 Years | 5 (18.5%) | 22 (81.5%) |
| 45 to 54 Years | 2 (8.7%) | 21 (91.3%) |
| 55 to 64 Years | 12 (19.1%) | 51 (80.9%) |
| 65 to 74 Years | 51 (75.0%) | 65 (95.6%) |
| 75 Years and over | 51 (100.0%) | 51 (100.0%) |
| Total | 170 (56.5%) | 230 (76.4%) |
Disability Status by Sex by Age in Harpers Ferry
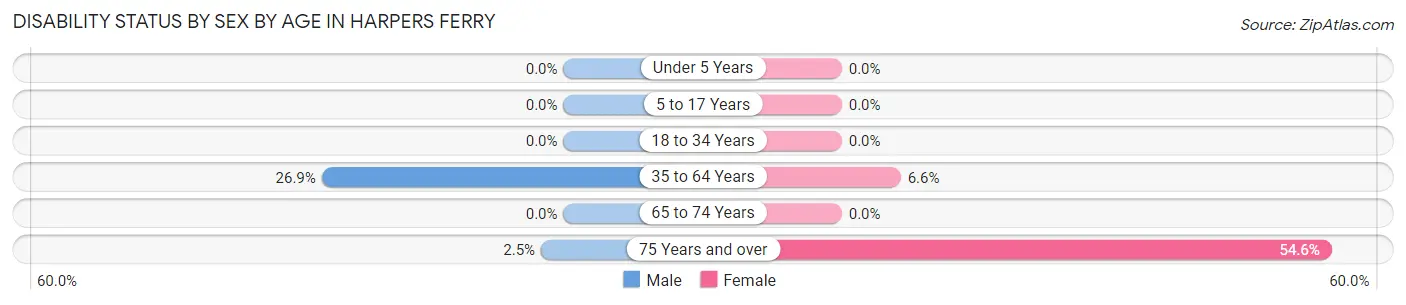
| Age Bracket | Male | Female |
| Under 5 Years | 0 (0.0%) | 0 (0.0%) |
| 5 to 17 Years | 0 (0.0%) | 0 (0.0%) |
| 18 to 34 Years | 0 (0.0%) | 0 (0.0%) |
| 35 to 64 Years | 14 (26.9%) | 4 (6.6%) |
| 65 to 74 Years | 0 (0.0%) | 0 (0.0%) |
| 75 Years and over | 1 (2.5%) | 6 (54.5%) |
Disability Class by Sex by Age in Harpers Ferry
Disability Class: Hearing Difficulty
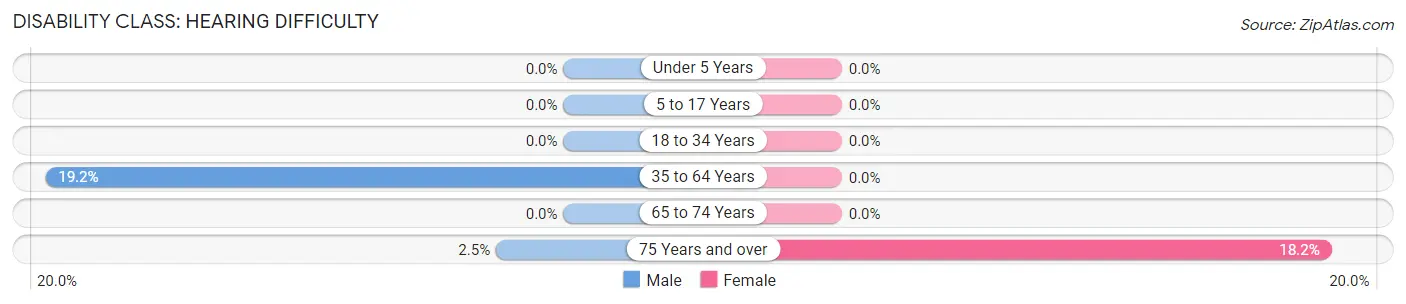
| Age Bracket | Male | Female |
| Under 5 Years | 0 (0.0%) | 0 (0.0%) |
| 5 to 17 Years | 0 (0.0%) | 0 (0.0%) |
| 18 to 34 Years | 0 (0.0%) | 0 (0.0%) |
| 35 to 64 Years | 10 (19.2%) | 0 (0.0%) |
| 65 to 74 Years | 0 (0.0%) | 0 (0.0%) |
| 75 Years and over | 1 (2.5%) | 2 (18.2%) |
Disability Class: Vision Difficulty
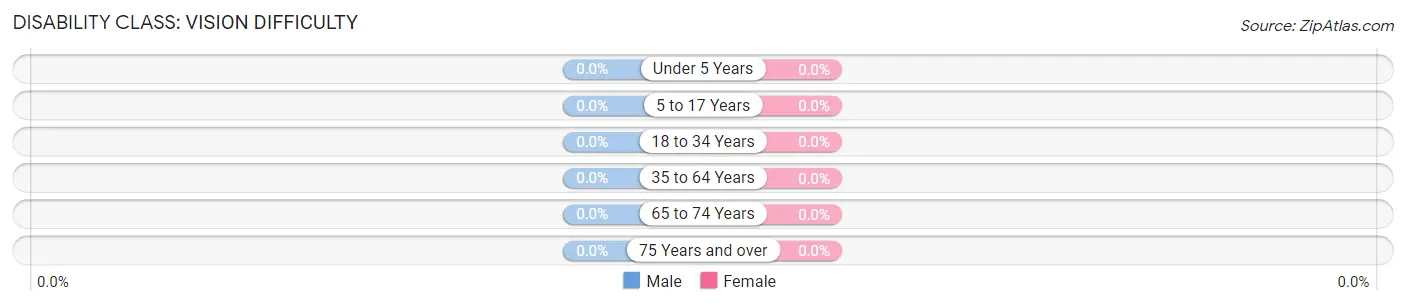
| Age Bracket | Male | Female |
| Under 5 Years | 0 (0.0%) | 0 (0.0%) |
| 5 to 17 Years | 0 (0.0%) | 0 (0.0%) |
| 18 to 34 Years | 0 (0.0%) | 0 (0.0%) |
| 35 to 64 Years | 0 (0.0%) | 0 (0.0%) |
| 65 to 74 Years | 0 (0.0%) | 0 (0.0%) |
| 75 Years and over | 0 (0.0%) | 0 (0.0%) |
Disability Class: Cognitive Difficulty
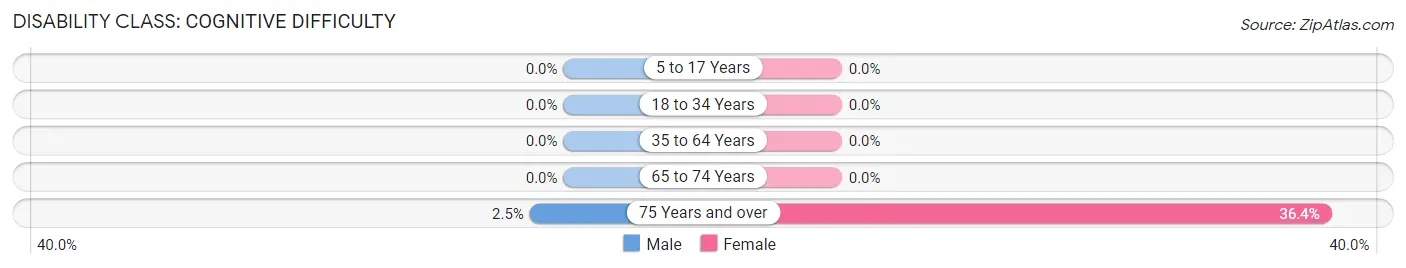
| Age Bracket | Male | Female |
| 5 to 17 Years | 0 (0.0%) | 0 (0.0%) |
| 18 to 34 Years | 0 (0.0%) | 0 (0.0%) |
| 35 to 64 Years | 0 (0.0%) | 0 (0.0%) |
| 65 to 74 Years | 0 (0.0%) | 0 (0.0%) |
| 75 Years and over | 1 (2.5%) | 4 (36.4%) |
Disability Class: Ambulatory Difficulty
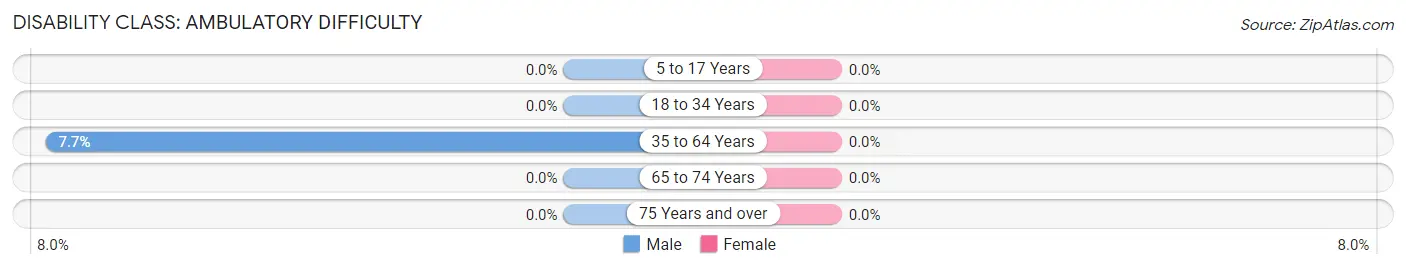
| Age Bracket | Male | Female |
| 5 to 17 Years | 0 (0.0%) | 0 (0.0%) |
| 18 to 34 Years | 0 (0.0%) | 0 (0.0%) |
| 35 to 64 Years | 4 (7.7%) | 0 (0.0%) |
| 65 to 74 Years | 0 (0.0%) | 0 (0.0%) |
| 75 Years and over | 0 (0.0%) | 0 (0.0%) |
Disability Class: Self-Care Difficulty
| Age Bracket | Male | Female |
| 5 to 17 Years | 0 (0.0%) | 0 (0.0%) |
| 18 to 34 Years | 0 (0.0%) | 0 (0.0%) |
| 35 to 64 Years | 0 (0.0%) | 0 (0.0%) |
| 65 to 74 Years | 0 (0.0%) | 0 (0.0%) |
| 75 Years and over | 0 (0.0%) | 0 (0.0%) |
Technology Access in Harpers Ferry
Computing Device Access in Harpers Ferry
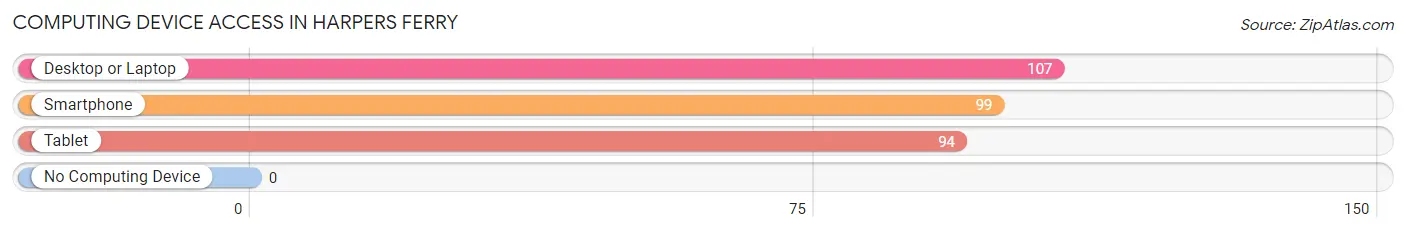
| Device Type | # Households | % Households |
| Desktop or Laptop | 107 | 85.6% |
| Smartphone | 99 | 79.2% |
| Tablet | 94 | 75.2% |
| No Computing Device | 0 | 0.0% |
| Total | 125 | 100.0% |
Internet Access in Harpers Ferry
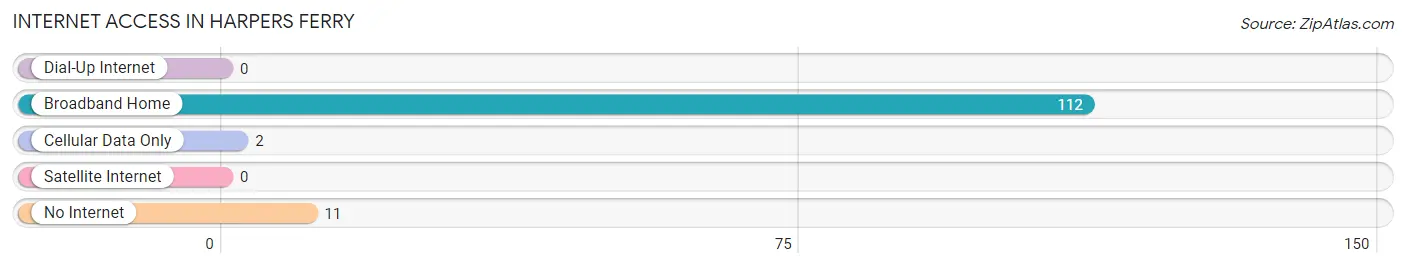
| Internet Type | # Households | % Households |
| Dial-Up Internet | 0 | 0.0% |
| Broadband Home | 112 | 89.6% |
| Cellular Data Only | 2 | 1.6% |
| Satellite Internet | 0 | 0.0% |
| No Internet | 11 | 8.8% |
| Total | 125 | 100.0% |
Harpers Ferry Summary
Harpers Ferry, West Virginia is a small town located in the eastern panhandle of the state, along the Potomac and Shenandoah Rivers. It is a part of Jefferson County and is located approximately 75 miles northwest of Washington, D.C. The town is best known for its role in the Civil War and its historical significance.
History
Harpers Ferry was founded in 1747 by Robert Harper, a Quaker from Pennsylvania. He established a ferry service across the Potomac River and the town was named after him. The town quickly grew and became an important transportation hub for the region. It was also a major industrial center, with several factories and mills.
In 1859, John Brown led a raid on the town in an attempt to start a slave revolt. The raid failed and Brown was captured and hanged. The event was a major turning point in the Civil War and is remembered as one of the most important events in American history.
During the Civil War, Harpers Ferry was the site of several battles. The town changed hands several times and was eventually occupied by Union forces. After the war, the town slowly recovered and began to rebuild.
Geography
Harpers Ferry is located in the eastern panhandle of West Virginia, along the Potomac and Shenandoah Rivers. The town is situated at the confluence of the two rivers, which form the border between Maryland and Virginia. The town is surrounded by the Blue Ridge Mountains and is located approximately 75 miles northwest of Washington, D.C.
The town has a total area of 1.2 square miles, all of which is land. The climate is humid subtropical, with hot, humid summers and cold, wet winters.
Economy
Harpers Ferry’s economy is largely based on tourism. The town is a popular destination for visitors interested in its historical significance and its natural beauty. The town is home to several museums, including the John Brown Wax Museum and the Harpers Ferry National Historical Park.
The town also has several small businesses, including restaurants, shops, and galleries. The town is also home to several wineries and breweries.
Demographics
As of the 2010 census, Harpers Ferry had a population of 286. The racial makeup of the town was 94.2% White, 2.1% African American, 0.7% Native American, 0.7% Asian, and 2.3% from two or more races. Hispanic or Latino of any race were 1.4% of the population.
The median household income in Harpers Ferry was $45,833, and the median family income was $50,000. The per capita income for the town was $20,945. About 8.3% of families and 10.3% of the population were below the poverty line.
Harpers Ferry is a small town with a rich history and a unique culture. It is a popular tourist destination and is home to several museums and other attractions. The town is also home to several small businesses and is a great place to live and work.
Common Questions
What is Per Capita Income in Harpers Ferry?
Per Capita income in Harpers Ferry is $52,917.
What is the Median Family Income in Harpers Ferry?
Median Family Income in Harpers Ferry is $109,904.
What is the Median Household income in Harpers Ferry?
Median Household Income in Harpers Ferry is $109,183.
What is Inequality or Gini Index in Harpers Ferry?
Inequality or Gini Index in Harpers Ferry is 0.32.
What is the Total Population of Harpers Ferry?
Total Population of Harpers Ferry is 301.
What is the Total Male Population of Harpers Ferry?
Total Male Population of Harpers Ferry is 143.
What is the Total Female Population of Harpers Ferry?
Total Female Population of Harpers Ferry is 158.
What is the Ratio of Males per 100 Females in Harpers Ferry?
There are 90.51 Males per 100 Females in Harpers Ferry.
What is the Ratio of Females per 100 Males in Harpers Ferry?
There are 110.49 Females per 100 Males in Harpers Ferry.
What is the Median Population Age in Harpers Ferry?
Median Population Age in Harpers Ferry is 57.8 Years.
What is the Average Family Size in Harpers Ferry
Average Family Size in Harpers Ferry is 2.9 People.
What is the Average Household Size in Harpers Ferry
Average Household Size in Harpers Ferry is 2.4 People.
How Large is the Labor Force in Harpers Ferry?
There are 147 People in the Labor Forcein in Harpers Ferry.
What is the Percentage of People in the Labor Force in Harpers Ferry?
54.4% of People are in the Labor Force in Harpers Ferry.
What is the Unemployment Rate in Harpers Ferry?
Unemployment Rate in Harpers Ferry is 8.2%.