Hambleton, WV Map & Demographics
Hambleton Map
Hambleton Overview
$24,336
PER CAPITA INCOME
$60,278
AVG FAMILY INCOME
$43,125
AVG HOUSEHOLD INCOME
37.6%
WAGE / INCOME GAP [ % ]
62.4¢/ $1
WAGE / INCOME GAP [ $ ]
0.28
INEQUALITY / GINI INDEX
203
TOTAL POPULATION
89
MALE POPULATION
114
FEMALE POPULATION
78.07
MALES / 100 FEMALES
128.09
FEMALES / 100 MALES
55.6
MEDIAN AGE
3.0
AVG FAMILY SIZE
2.4
AVG HOUSEHOLD SIZE
66
LABOR FORCE [ PEOPLE ]
38.2%
PERCENT IN LABOR FORCE
Hambleton Zip Codes
Hambleton Area Codes
Income in Hambleton
Income Overview in Hambleton
Per Capita Income in Hambleton is $24,336, while median incomes of families and households are $60,278 and $43,125 respectively.
| Characteristic | Number | Measure |
| Per Capita Income | 203 | $24,336 |
| Median Family Income | 42 | $60,278 |
| Mean Family Income | 42 | $61,469 |
| Median Household Income | 86 | $43,125 |
| Mean Household Income | 86 | $51,931 |
| Income Deficit | 42 | $0 |
| Wage / Income Gap (%) | 203 | 37.58% |
| Wage / Income Gap ($) | 203 | 62.42¢ per $1 |
| Gini / Inequality Index | 203 | 0.28 |
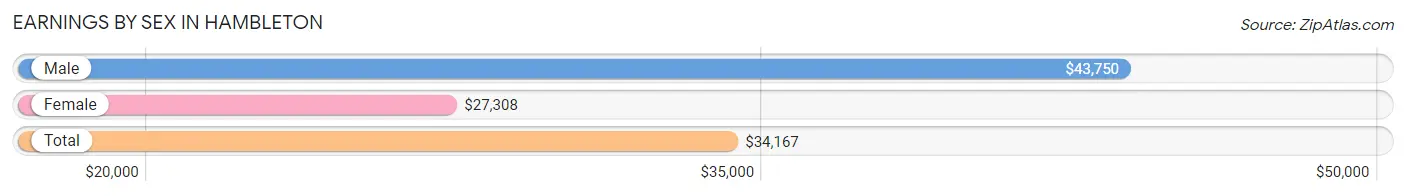
Earnings by Sex in Hambleton
Average Earnings in Hambleton are $34,167, $43,750 for men and $27,308 for women, a difference of 37.6%.
| Sex | Number | Average Earnings |
| Male | 34 (51.5%) | $43,750 |
| Female | 32 (48.5%) | $27,308 |
| Total | 66 (100.0%) | $34,167 |
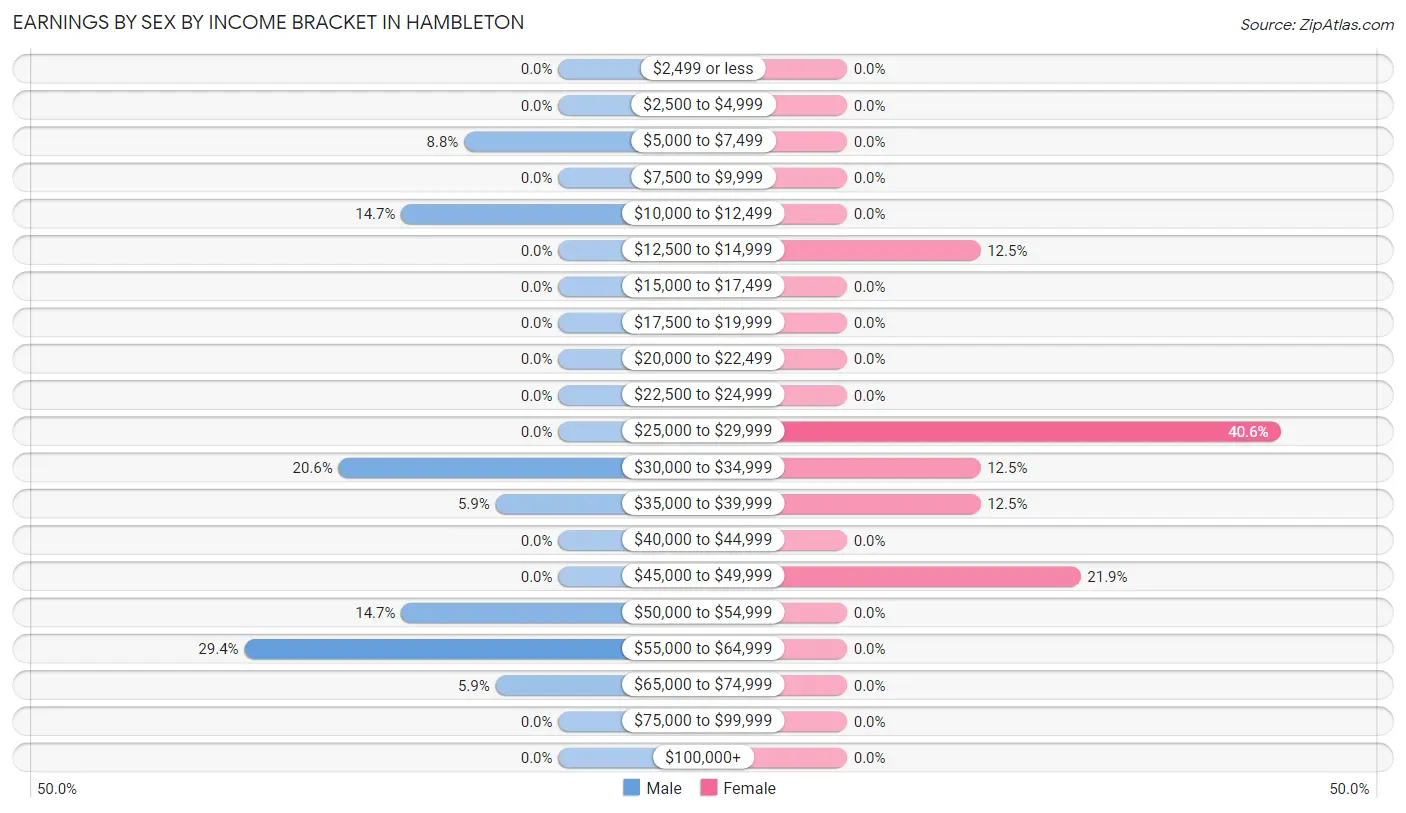
Earnings by Sex by Income Bracket in Hambleton
The most common earnings brackets in Hambleton are $55,000 to $64,999 for men (10 | 29.4%) and $25,000 to $29,999 for women (13 | 40.6%).
| Income | Male | Female |
| $2,499 or less | 0 (0.0%) | 0 (0.0%) |
| $2,500 to $4,999 | 0 (0.0%) | 0 (0.0%) |
| $5,000 to $7,499 | 3 (8.8%) | 0 (0.0%) |
| $7,500 to $9,999 | 0 (0.0%) | 0 (0.0%) |
| $10,000 to $12,499 | 5 (14.7%) | 0 (0.0%) |
| $12,500 to $14,999 | 0 (0.0%) | 4 (12.5%) |
| $15,000 to $17,499 | 0 (0.0%) | 0 (0.0%) |
| $17,500 to $19,999 | 0 (0.0%) | 0 (0.0%) |
| $20,000 to $22,499 | 0 (0.0%) | 0 (0.0%) |
| $22,500 to $24,999 | 0 (0.0%) | 0 (0.0%) |
| $25,000 to $29,999 | 0 (0.0%) | 13 (40.6%) |
| $30,000 to $34,999 | 7 (20.6%) | 4 (12.5%) |
| $35,000 to $39,999 | 2 (5.9%) | 4 (12.5%) |
| $40,000 to $44,999 | 0 (0.0%) | 0 (0.0%) |
| $45,000 to $49,999 | 0 (0.0%) | 7 (21.9%) |
| $50,000 to $54,999 | 5 (14.7%) | 0 (0.0%) |
| $55,000 to $64,999 | 10 (29.4%) | 0 (0.0%) |
| $65,000 to $74,999 | 2 (5.9%) | 0 (0.0%) |
| $75,000 to $99,999 | 0 (0.0%) | 0 (0.0%) |
| $100,000+ | 0 (0.0%) | 0 (0.0%) |
| Total | 34 (100.0%) | 32 (100.0%) |
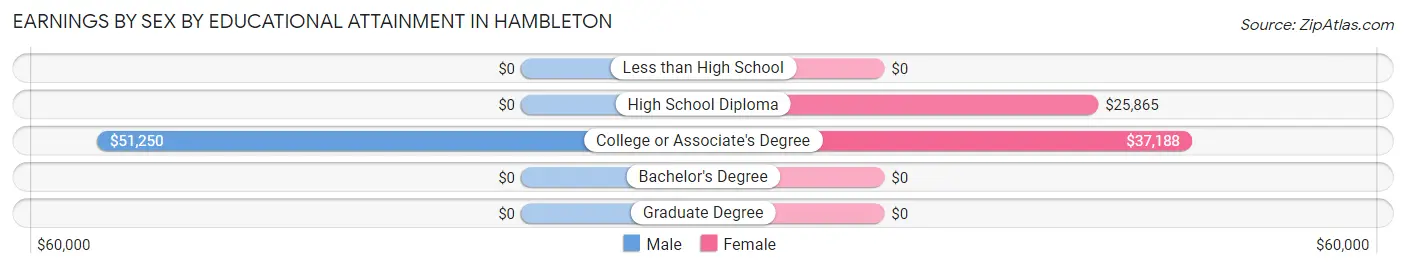
Earnings by Sex by Educational Attainment in Hambleton
Average earnings in Hambleton are $50,750 for men and $27,308 for women, a difference of 46.2%. Men with an educational attainment of college or associate's degree enjoy the highest average annual earnings of $51,250, while those with college or associate's degree education earn the least with $51,250. Women with an educational attainment of college or associate's degree earn the most with the average annual earnings of $37,188, while those with high school diploma education have the smallest earnings of $25,865.
| Educational Attainment | Male Income | Female Income |
| Less than High School | - | - |
| High School Diploma | - | - |
| College or Associate's Degree | $51,250 | $37,188 |
| Bachelor's Degree | - | - |
| Graduate Degree | - | - |
| Total | $50,750 | $27,308 |
Family Income in Hambleton
Family Income Brackets in Hambleton
According to the Hambleton family income data, there are 19 families falling into the $50,000 to $74,999 income range, which is the most common income bracket and makes up 45.2% of all families.
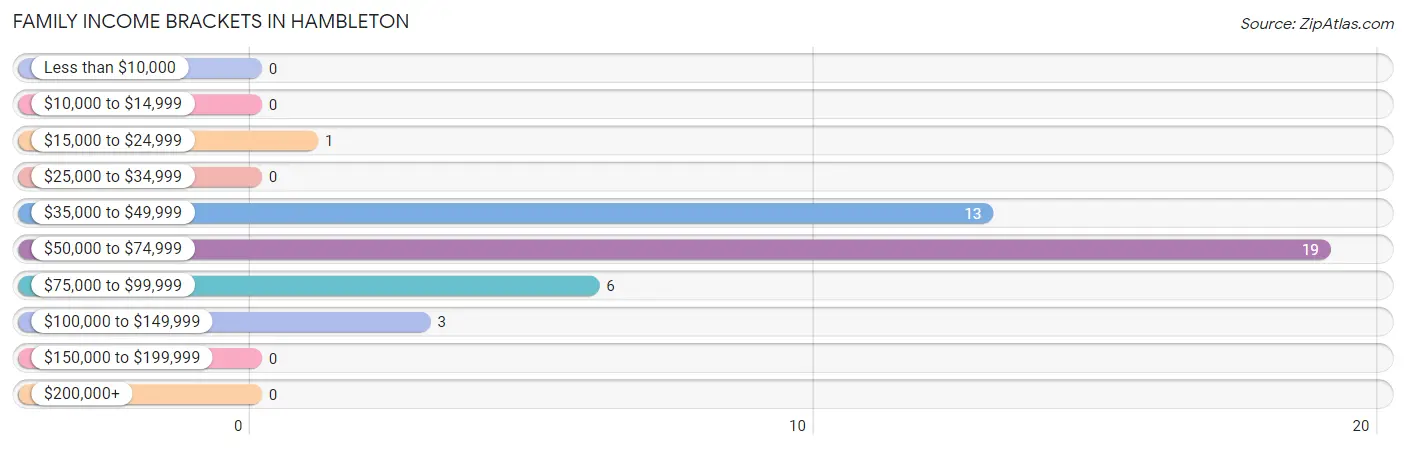
| Income Bracket | # Families | % Families |
| Less than $10,000 | 0 | 0.0% |
| $10,000 to $14,999 | 0 | 0.0% |
| $15,000 to $24,999 | 1 | 2.4% |
| $25,000 to $34,999 | 0 | 0.0% |
| $35,000 to $49,999 | 13 | 31.0% |
| $50,000 to $74,999 | 19 | 45.2% |
| $75,000 to $99,999 | 6 | 14.3% |
| $100,000 to $149,999 | 3 | 7.1% |
| $150,000 to $199,999 | 0 | 0.0% |
| $200,000+ | 0 | 0.0% |
Family Income by Famaliy Size in Hambleton
4-person families (13 | 30.9%) account for the highest median family income in Hambleton with $61,607 per family, while 2-person families (25 | 59.5%) have the highest median income of $29,062 per family member.
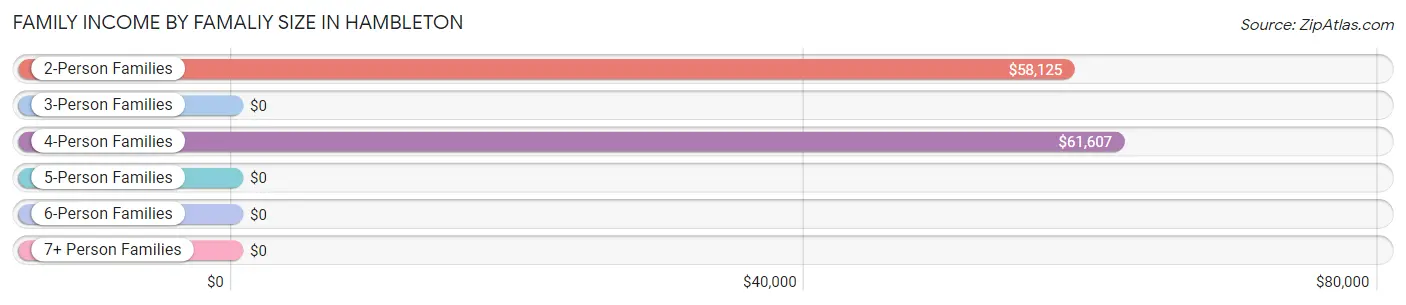
| Income Bracket | # Families | Median Income |
| 2-Person Families | 25 (59.5%) | $58,125 |
| 3-Person Families | 4 (9.5%) | $0 |
| 4-Person Families | 13 (30.9%) | $61,607 |
| 5-Person Families | 0 (0.0%) | $0 |
| 6-Person Families | 0 (0.0%) | $0 |
| 7+ Person Families | 0 (0.0%) | $0 |
| Total | 42 (100.0%) | $60,278 |
Family Income by Number of Earners in Hambleton
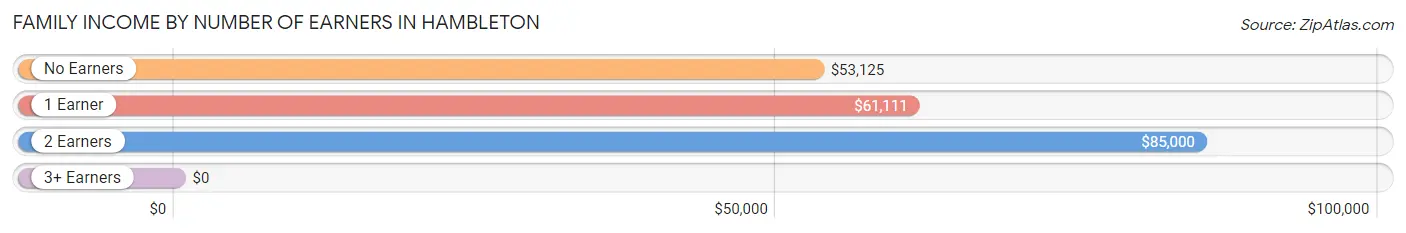
| Number of Earners | # Families | Median Income |
| No Earners | 16 (38.1%) | $53,125 |
| 1 Earner | 18 (42.9%) | $61,111 |
| 2 Earners | 8 (19.1%) | $85,000 |
| 3+ Earners | 0 (0.0%) | $0 |
| Total | 42 (100.0%) | $60,278 |
Household Income in Hambleton
Household Income Brackets in Hambleton
With 21 households falling in the category, the $35,000 to $49,999 income range is the most frequent in Hambleton, accounting for 24.4% of all households.
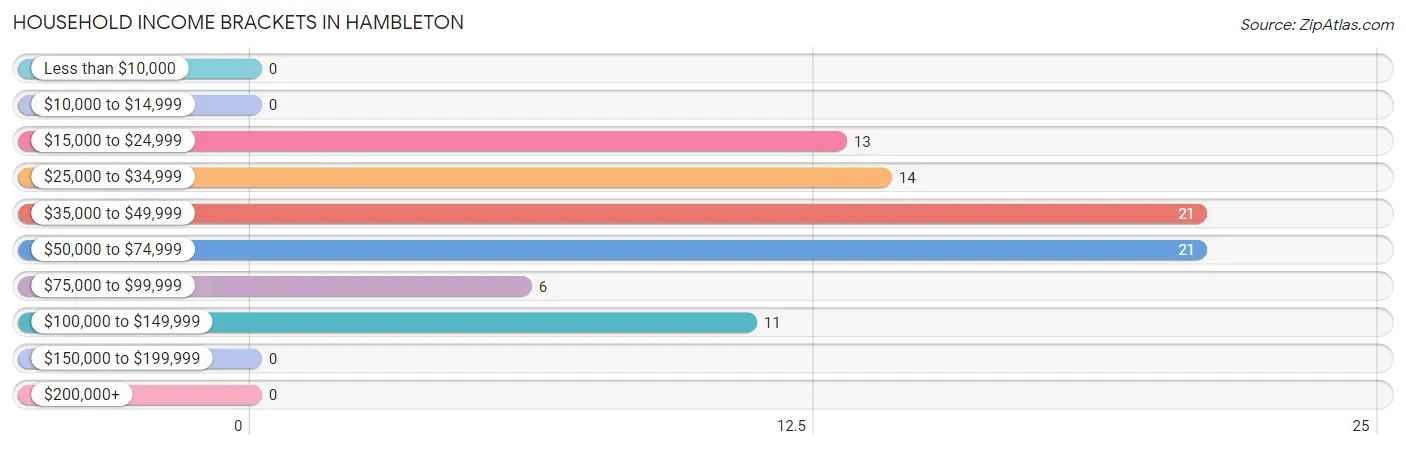
| Income Bracket | # Households | % Households |
| Less than $10,000 | 0 | 0.0% |
| $10,000 to $14,999 | 0 | 0.0% |
| $15,000 to $24,999 | 13 | 15.1% |
| $25,000 to $34,999 | 14 | 16.3% |
| $35,000 to $49,999 | 21 | 24.4% |
| $50,000 to $74,999 | 21 | 24.4% |
| $75,000 to $99,999 | 6 | 7.0% |
| $100,000 to $149,999 | 11 | 12.8% |
| $150,000 to $199,999 | 0 | 0.0% |
| $200,000+ | 0 | 0.0% |
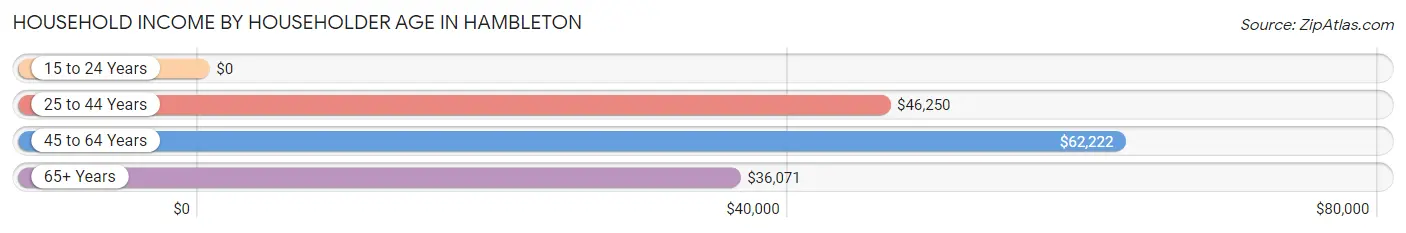
Household Income by Householder Age in Hambleton
The median household income in Hambleton is $43,125, with the highest median household income of $62,222 found in the 45 to 64 years age bracket for the primary householder. A total of 34 households (39.5%) fall into this category.
| Income Bracket | # Households | Median Income |
| 15 to 24 Years | 0 (0.0%) | $0 |
| 25 to 44 Years | 10 (11.6%) | $46,250 |
| 45 to 64 Years | 34 (39.5%) | $62,222 |
| 65+ Years | 42 (48.8%) | $36,071 |
| Total | 86 (100.0%) | $43,125 |
Poverty in Hambleton
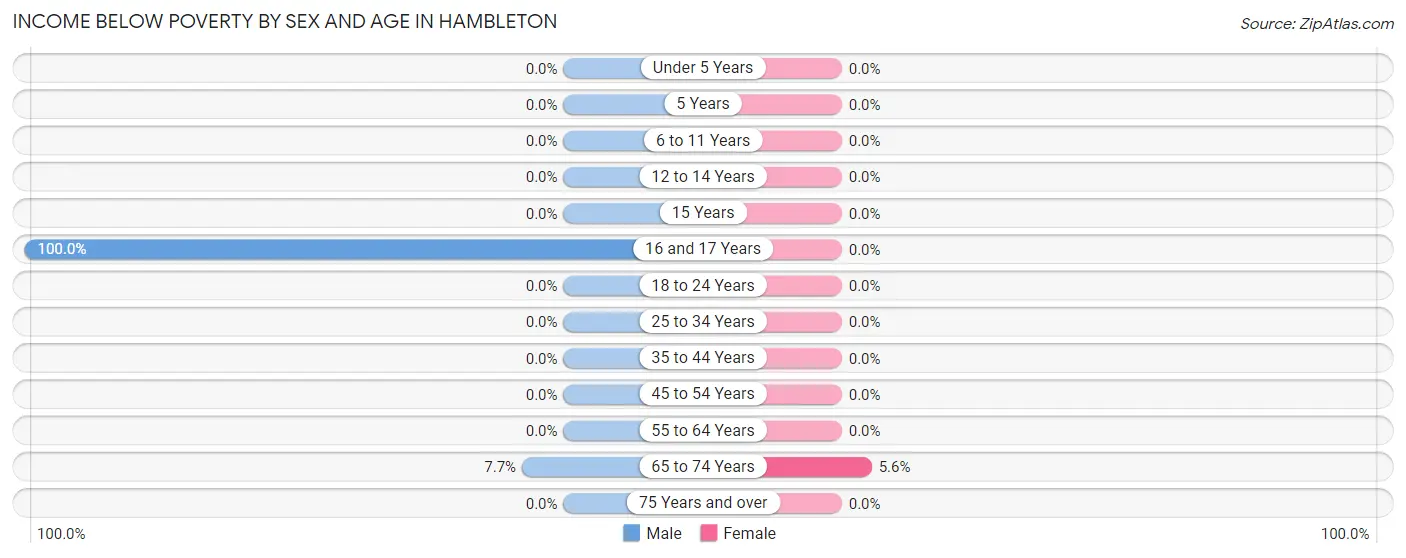
Income Below Poverty by Sex and Age in Hambleton
With 4.8% poverty level for males and 1.0% for females among the residents of Hambleton, 16 and 17 year old males and 65 to 74 year old females are the most vulnerable to poverty, with 3 males (100.0%) and 1 females (5.6%) in their respective age groups living below the poverty level.
| Age Bracket | Male | Female |
| Under 5 Years | 0 (0.0%) | 0 (0.0%) |
| 5 Years | 0 (0.0%) | 0 (0.0%) |
| 6 to 11 Years | 0 (0.0%) | 0 (0.0%) |
| 12 to 14 Years | 0 (0.0%) | 0 (0.0%) |
| 15 Years | 0 (0.0%) | 0 (0.0%) |
| 16 and 17 Years | 3 (100.0%) | 0 (0.0%) |
| 18 to 24 Years | 0 (0.0%) | 0 (0.0%) |
| 25 to 34 Years | 0 (0.0%) | 0 (0.0%) |
| 35 to 44 Years | 0 (0.0%) | 0 (0.0%) |
| 45 to 54 Years | 0 (0.0%) | 0 (0.0%) |
| 55 to 64 Years | 0 (0.0%) | 0 (0.0%) |
| 65 to 74 Years | 1 (7.7%) | 1 (5.6%) |
| 75 Years and over | 0 (0.0%) | 0 (0.0%) |
| Total | 4 (4.8%) | 1 (1.0%) |
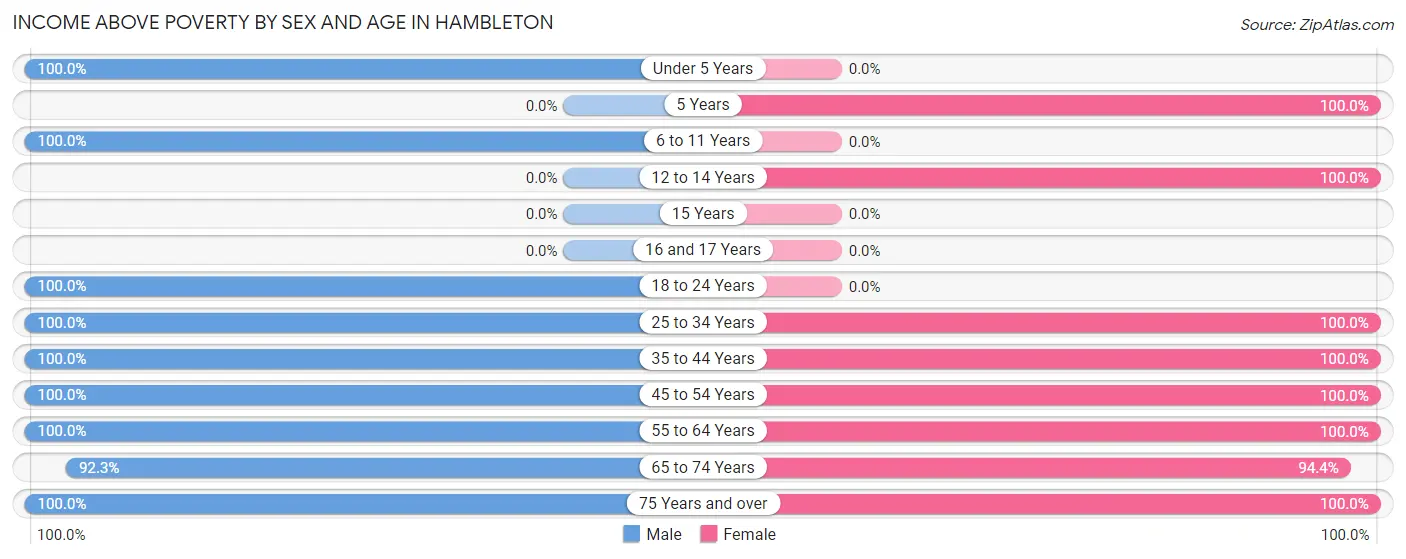
Income Above Poverty by Sex and Age in Hambleton
According to the poverty statistics in Hambleton, males aged under 5 years and females aged 5 years are the age groups that are most secure financially, with 100.0% of males and 100.0% of females in these age groups living above the poverty line.
| Age Bracket | Male | Female |
| Under 5 Years | 3 (100.0%) | 0 (0.0%) |
| 5 Years | 0 (0.0%) | 2 (100.0%) |
| 6 to 11 Years | 4 (100.0%) | 0 (0.0%) |
| 12 to 14 Years | 0 (0.0%) | 6 (100.0%) |
| 15 Years | 0 (0.0%) | 0 (0.0%) |
| 16 and 17 Years | 0 (0.0%) | 0 (0.0%) |
| 18 to 24 Years | 10 (100.0%) | 0 (0.0%) |
| 25 to 34 Years | 4 (100.0%) | 2 (100.0%) |
| 35 to 44 Years | 4 (100.0%) | 19 (100.0%) |
| 45 to 54 Years | 5 (100.0%) | 17 (100.0%) |
| 55 to 64 Years | 22 (100.0%) | 9 (100.0%) |
| 65 to 74 Years | 12 (92.3%) | 17 (94.4%) |
| 75 Years and over | 16 (100.0%) | 31 (100.0%) |
| Total | 80 (95.2%) | 103 (99.0%) |
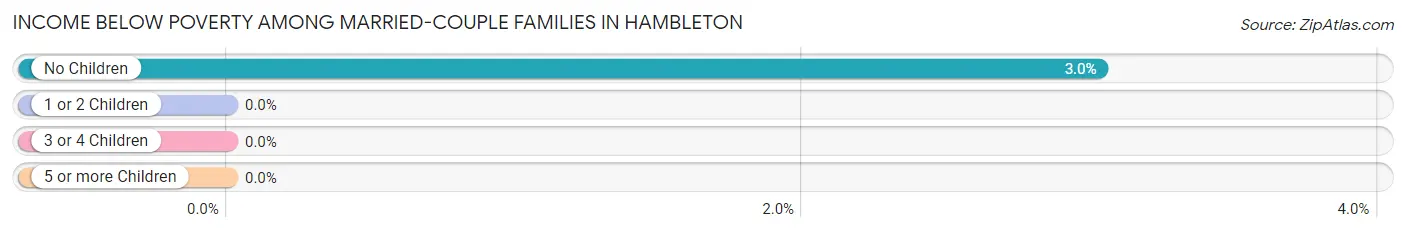
Income Below Poverty Among Married-Couple Families in Hambleton
The poverty statistics for married-couple families in Hambleton show that 2.9% or 1 of the total 35 families live below the poverty line. Families with no children have the highest poverty rate of 3.0%, comprising of 1 families. On the other hand, families with 1 or 2 children have the lowest poverty rate of 0.0%, which includes 0 families.
| Children | Above Poverty | Below Poverty |
| No Children | 32 (97.0%) | 1 (3.0%) |
| 1 or 2 Children | 2 (100.0%) | 0 (0.0%) |
| 3 or 4 Children | 0 (0.0%) | 0 (0.0%) |
| 5 or more Children | 0 (0.0%) | 0 (0.0%) |
| Total | 34 (97.1%) | 1 (2.9%) |
Income Below Poverty Among Single-Parent Households in Hambleton
| Children | Single Father | Single Mother |
| No Children | 0 (0.0%) | 0 (0.0%) |
| 1 or 2 Children | 0 (0.0%) | 0 (0.0%) |
| 3 or 4 Children | 0 (0.0%) | 0 (0.0%) |
| 5 or more Children | 0 (0.0%) | 0 (0.0%) |
| Total | 0 (0.0%) | 0 (0.0%) |
Income Below Poverty Among Married-Couple vs Single-Parent Households in Hambleton
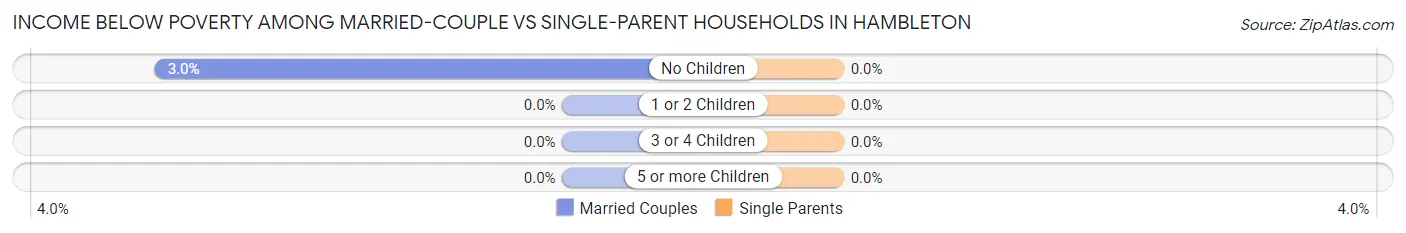
| Children | Married-Couple Families | Single-Parent Households |
| No Children | 1 (3.0%) | 0 (0.0%) |
| 1 or 2 Children | 0 (0.0%) | 0 (0.0%) |
| 3 or 4 Children | 0 (0.0%) | 0 (0.0%) |
| 5 or more Children | 0 (0.0%) | 0 (0.0%) |
| Total | 1 (2.9%) | 0 (0.0%) |
Race in Hambleton
The most populous races in Hambleton are , and White / Caucasian (203 | 100.0%).
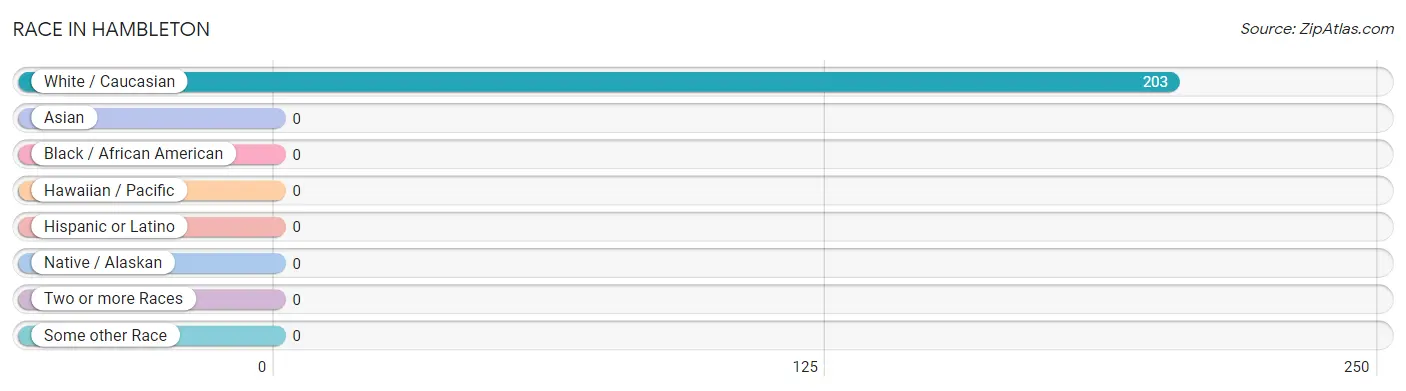
| Race | # Population | % Population |
| Asian | 0 | 0.0% |
| Black / African American | 0 | 0.0% |
| Hawaiian / Pacific | 0 | 0.0% |
| Hispanic or Latino | 0 | 0.0% |
| Native / Alaskan | 0 | 0.0% |
| White / Caucasian | 203 | 100.0% |
| Two or more Races | 0 | 0.0% |
| Some other Race | 0 | 0.0% |
| Total | 203 | 100.0% |
Ancestry in Hambleton
The most populous ancestries reported in Hambleton are American (88 | 43.3%), German (36 | 17.7%), English (32 | 15.8%), Irish (30 | 14.8%), and Scottish (5 | 2.5%), together accounting for 94.1% of all Hambleton residents.
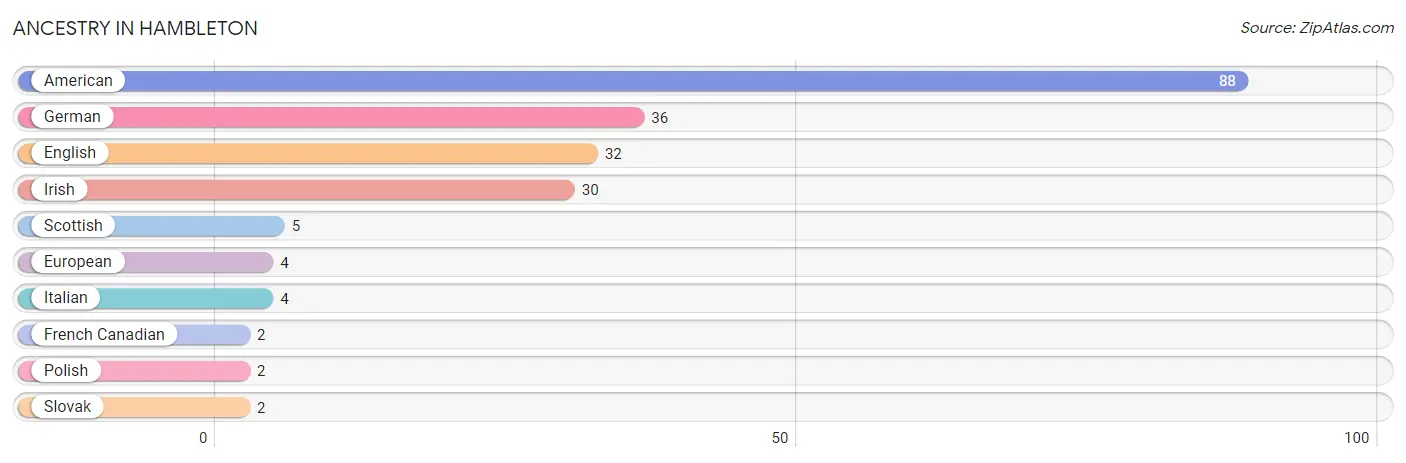
| Ancestry | # Population | % Population |
| American | 88 | 43.3% |
| English | 32 | 15.8% |
| European | 4 | 2.0% |
| French Canadian | 2 | 1.0% |
| German | 36 | 17.7% |
| Irish | 30 | 14.8% |
| Italian | 4 | 2.0% |
| Polish | 2 | 1.0% |
| Scottish | 5 | 2.5% |
| Slovak | 2 | 1.0% | View All 10 Rows |
Immigrants in Hambleton

| Immigration Origin | # Population | % Population | View All 0 Rows |
Sex and Age in Hambleton
Sex and Age in Hambleton
The most populous age groups in Hambleton are 55 to 59 Years (13 | 14.6%) for men and 75 to 79 Years (23 | 20.2%) for women.
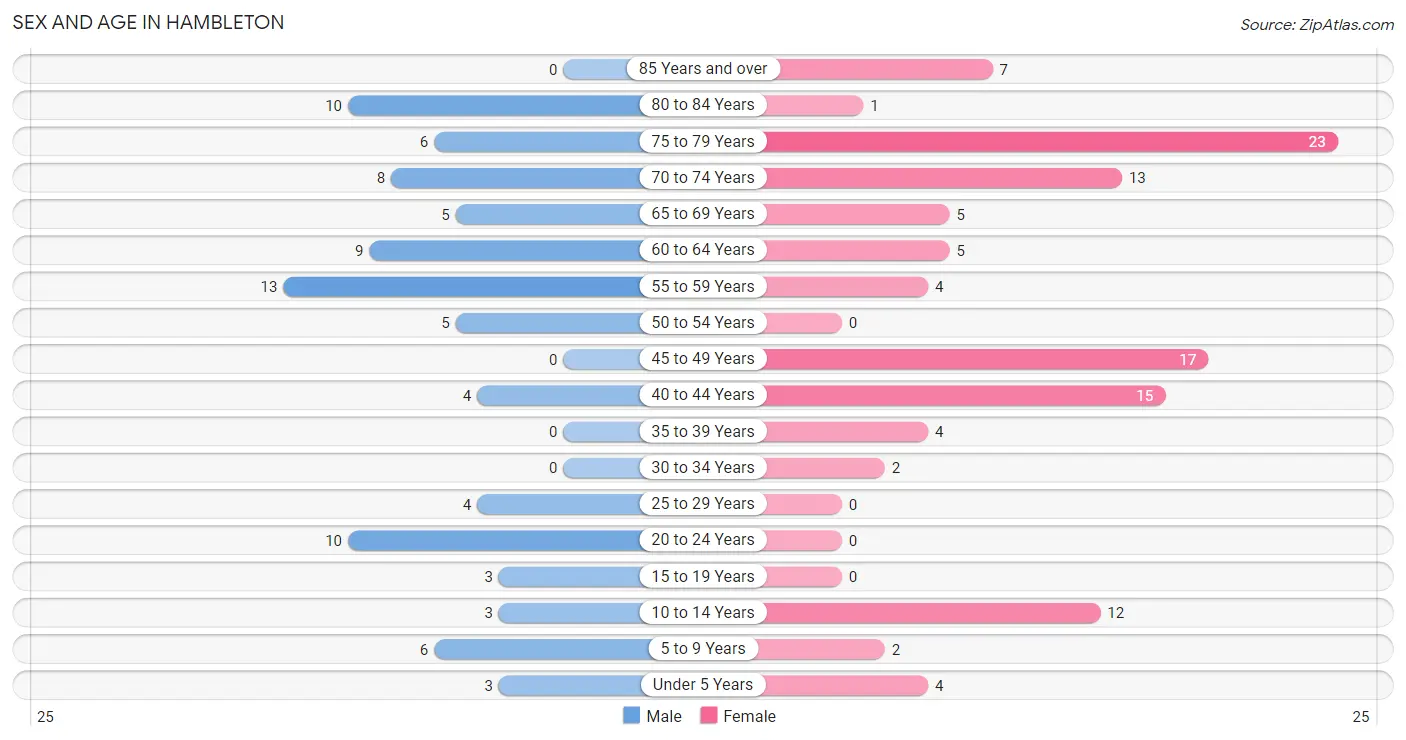
| Age Bracket | Male | Female |
| Under 5 Years | 3 (3.4%) | 4 (3.5%) |
| 5 to 9 Years | 6 (6.7%) | 2 (1.8%) |
| 10 to 14 Years | 3 (3.4%) | 12 (10.5%) |
| 15 to 19 Years | 3 (3.4%) | 0 (0.0%) |
| 20 to 24 Years | 10 (11.2%) | 0 (0.0%) |
| 25 to 29 Years | 4 (4.5%) | 0 (0.0%) |
| 30 to 34 Years | 0 (0.0%) | 2 (1.8%) |
| 35 to 39 Years | 0 (0.0%) | 4 (3.5%) |
| 40 to 44 Years | 4 (4.5%) | 15 (13.2%) |
| 45 to 49 Years | 0 (0.0%) | 17 (14.9%) |
| 50 to 54 Years | 5 (5.6%) | 0 (0.0%) |
| 55 to 59 Years | 13 (14.6%) | 4 (3.5%) |
| 60 to 64 Years | 9 (10.1%) | 5 (4.4%) |
| 65 to 69 Years | 5 (5.6%) | 5 (4.4%) |
| 70 to 74 Years | 8 (9.0%) | 13 (11.4%) |
| 75 to 79 Years | 6 (6.7%) | 23 (20.2%) |
| 80 to 84 Years | 10 (11.2%) | 1 (0.9%) |
| 85 Years and over | 0 (0.0%) | 7 (6.1%) |
| Total | 89 (100.0%) | 114 (100.0%) |
Families and Households in Hambleton
Median Family Size in Hambleton
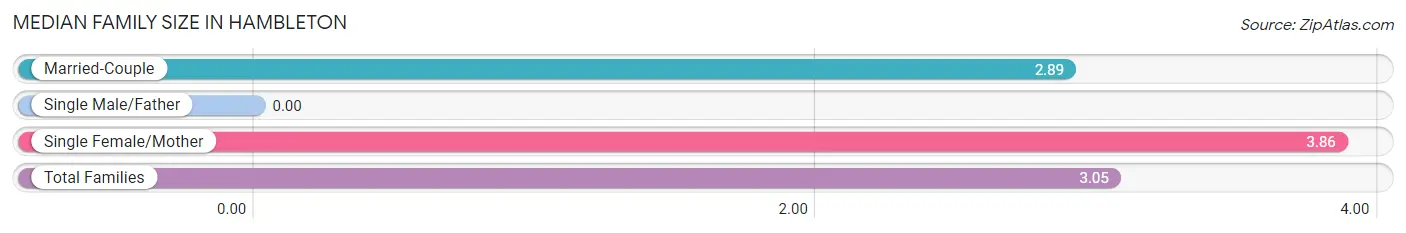
| Family Type | # Families | Family Size |
| Married-Couple | 35 (83.3%) | 2.89 |
| Single Male/Father | 0 (0.0%) | - |
| Single Female/Mother | 7 (16.7%) | 3.86 |
| Total Families | 42 (100.0%) | 3.05 |
Median Household Size in Hambleton
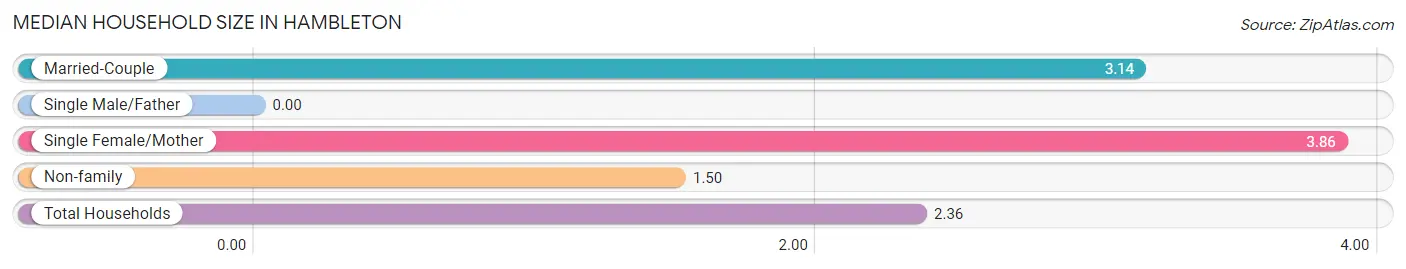
| Household Type | # Households | Household Size |
| Married-Couple | 35 (40.7%) | 3.14 |
| Single Male/Father | 0 (0.0%) | - |
| Single Female/Mother | 7 (8.1%) | 3.86 |
| Non-family | 44 (51.2%) | 1.50 |
| Total Households | 86 (100.0%) | 2.36 |
Household Size by Marriage Status in Hambleton
Out of a total of 86 households in Hambleton, 42 (48.8%) are family households, while 44 (51.2%) are nonfamily households. The most numerous type of family households are 2-person households, comprising 23, and the most common type of nonfamily households are 1-person households, comprising 36.
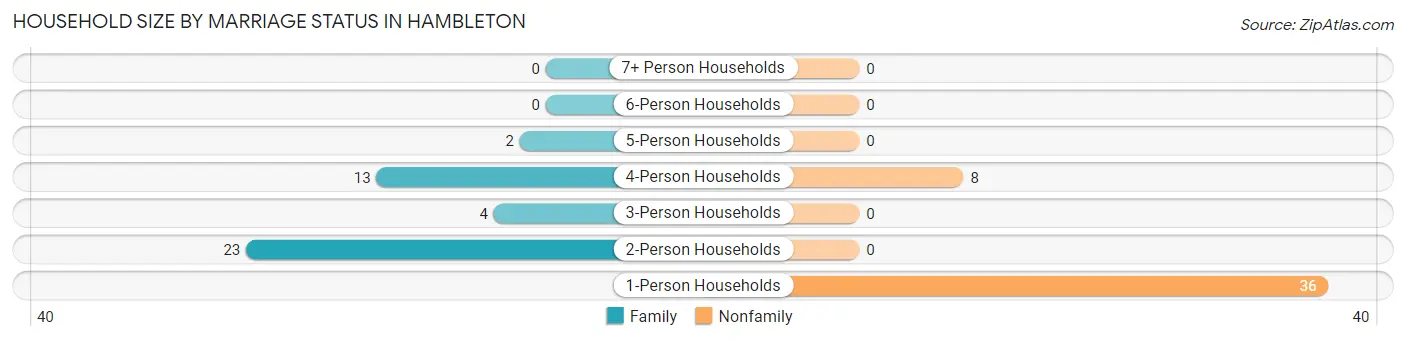
| Household Size | Family Households | Nonfamily Households |
| 1-Person Households | - | 36 (41.9%) |
| 2-Person Households | 23 (26.7%) | 0 (0.0%) |
| 3-Person Households | 4 (4.6%) | 0 (0.0%) |
| 4-Person Households | 13 (15.1%) | 8 (9.3%) |
| 5-Person Households | 2 (2.3%) | 0 (0.0%) |
| 6-Person Households | 0 (0.0%) | 0 (0.0%) |
| 7+ Person Households | 0 (0.0%) | 0 (0.0%) |
| Total | 42 (48.8%) | 44 (51.2%) |
Female Fertility in Hambleton
Fertility by Age in Hambleton
| Age Bracket | Women with Births | Births / 1,000 Women |
| 15 to 19 years | 0 (0.0%) | 0.0 |
| 20 to 34 years | 0 (0.0%) | 0.0 |
| 35 to 50 years | 0 (0.0%) | 0.0 |
| Total | 0 (0.0%) | 0.0 |
Fertility by Age by Marriage Status in Hambleton
| Age Bracket | Married | Unmarried |
| 15 to 19 years | 0 (0.0%) | 0 (0.0%) |
| 20 to 34 years | 0 (0.0%) | 0 (0.0%) |
| 35 to 50 years | 0 (0.0%) | 0 (0.0%) |
| Total | 0 (0.0%) | 0 (0.0%) |
Fertility by Education in Hambleton
| Educational Attainment | Women with Births | Births / 1,000 Women |
| Less than High School | 0 (0.0%) | 0.0 |
| High School Diploma | 0 (0.0%) | 0.0 |
| College or Associate's Degree | 0 (0.0%) | 0.0 |
| Bachelor's Degree | 0 (0.0%) | 0.0 |
| Graduate Degree | 0 (0.0%) | 0.0 |
| Total | 0 (0.0%) | 0.0 |
Fertility by Education by Marriage Status in Hambleton
| Educational Attainment | Married | Unmarried |
| Less than High School | 0 (0.0%) | 0 (0.0%) |
| High School Diploma | 0 (0.0%) | 0 (0.0%) |
| College or Associate's Degree | 0 (0.0%) | 0 (0.0%) |
| Bachelor's Degree | 0 (0.0%) | 0 (0.0%) |
| Graduate Degree | 0 (0.0%) | 0 (0.0%) |
| Total | 0 (0.0%) | 0 (0.0%) |
Employment Characteristics in Hambleton
Employment by Class of Employer in Hambleton
Among the 66 employed individuals in Hambleton, private company employees (34 | 51.5%), local government employees (18 | 27.3%), and state government employees (12 | 18.2%) make up the most common classes of employment.
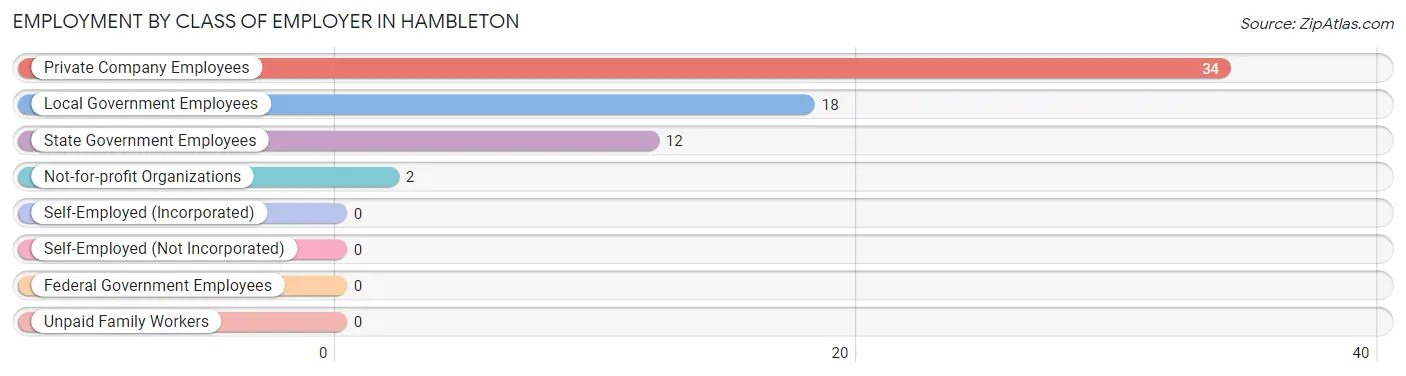
| Employer Class | # Employees | % Employees |
| Private Company Employees | 34 | 51.5% |
| Self-Employed (Incorporated) | 0 | 0.0% |
| Self-Employed (Not Incorporated) | 0 | 0.0% |
| Not-for-profit Organizations | 2 | 3.0% |
| Local Government Employees | 18 | 27.3% |
| State Government Employees | 12 | 18.2% |
| Federal Government Employees | 0 | 0.0% |
| Unpaid Family Workers | 0 | 0.0% |
| Total | 66 | 100.0% |
Employment Status by Age in Hambleton
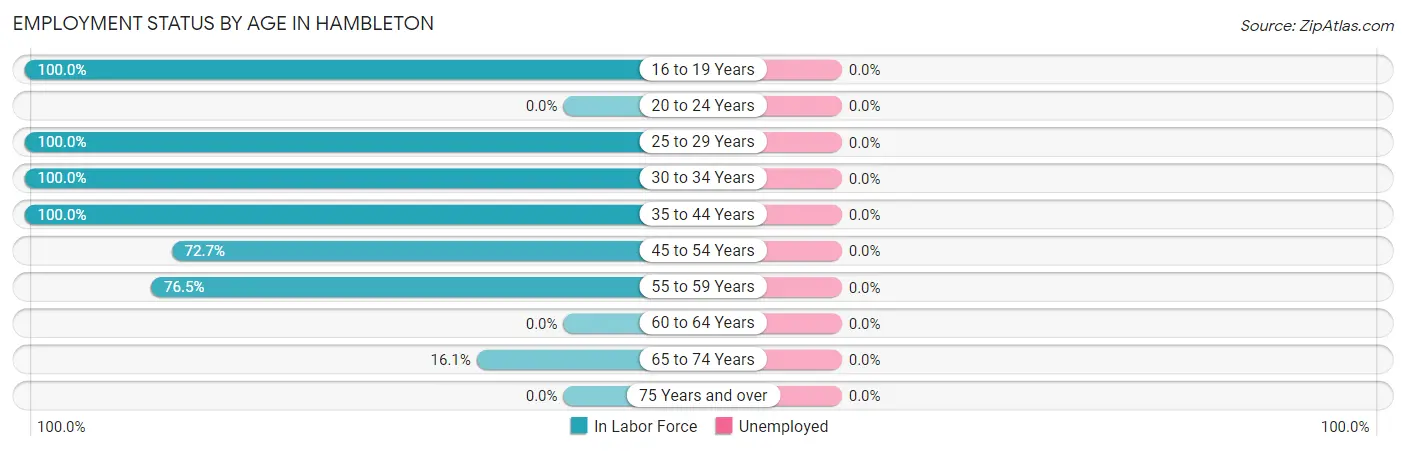
| Age Bracket | In Labor Force | Unemployed |
| 16 to 19 Years | 3 (100.0%) | 0 (0.0%) |
| 20 to 24 Years | 0 (0.0%) | 0 (0.0%) |
| 25 to 29 Years | 4 (100.0%) | 0 (0.0%) |
| 30 to 34 Years | 2 (100.0%) | 0 (0.0%) |
| 35 to 44 Years | 23 (100.0%) | 0 (0.0%) |
| 45 to 54 Years | 16 (72.7%) | 0 (0.0%) |
| 55 to 59 Years | 13 (76.5%) | 0 (0.0%) |
| 60 to 64 Years | 0 (0.0%) | 0 (0.0%) |
| 65 to 74 Years | 5 (16.1%) | 0 (0.0%) |
| 75 Years and over | 0 (0.0%) | 0 (0.0%) |
| Total | 66 (38.2%) | 0 (0.0%) |
Employment Status by Educational Attainment in Hambleton
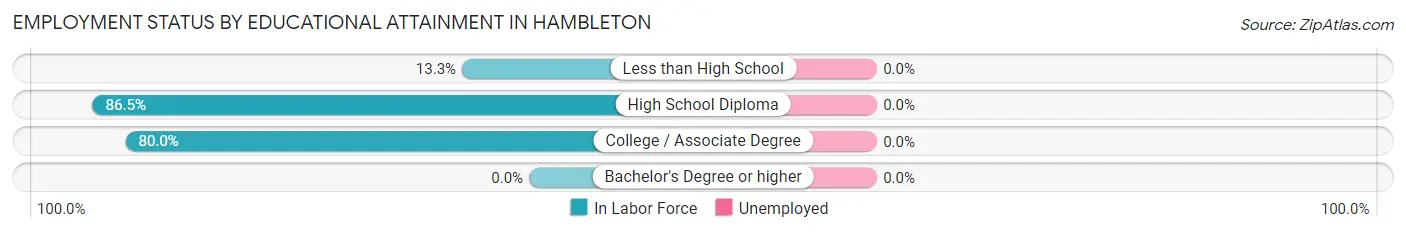
| Educational Attainment | In Labor Force | Unemployed |
| Less than High School | 2 (13.3%) | 0 (0.0%) |
| High School Diploma | 32 (86.5%) | 0 (0.0%) |
| College / Associate Degree | 24 (80.0%) | 0 (0.0%) |
| Bachelor's Degree or higher | 0 (0.0%) | 0 (0.0%) |
| Total | 58 (70.7%) | 0 (0.0%) |
Employment Occupations by Sex in Hambleton
Management, Business, Science and Arts Occupations
The most common Management, Business, Science and Arts occupations in Hambleton are Business & Financial (4 | 6.1%), and Health Diagnosing & Treating (2 | 3.0%).
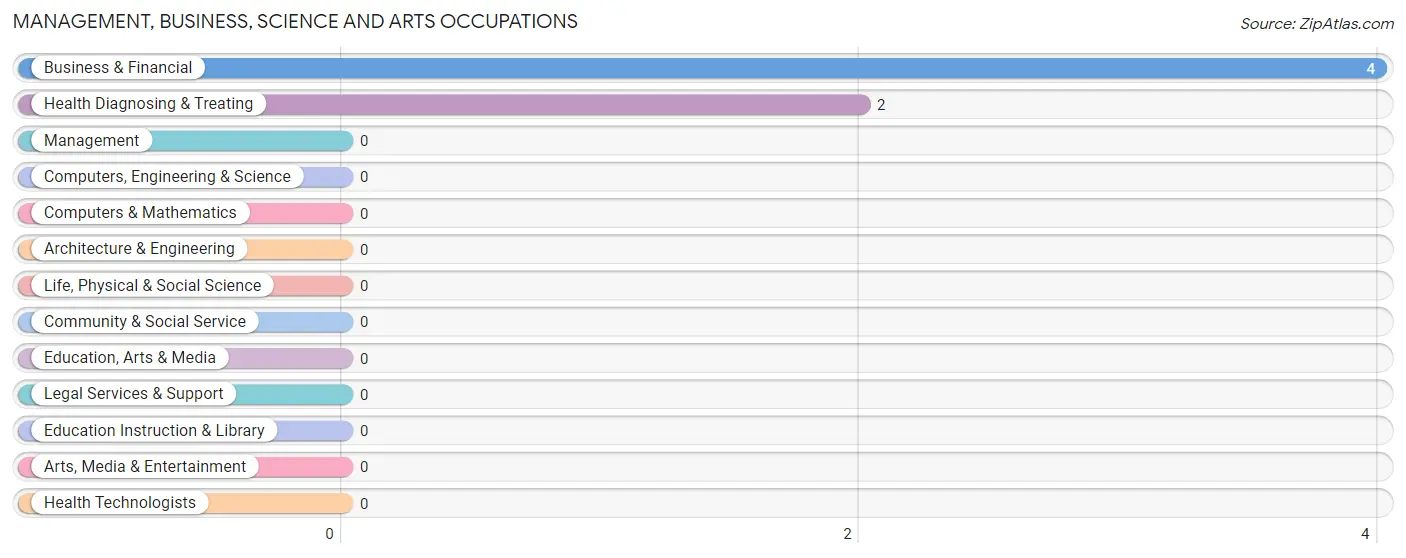
Management, Business, Science and Arts Occupations by Sex
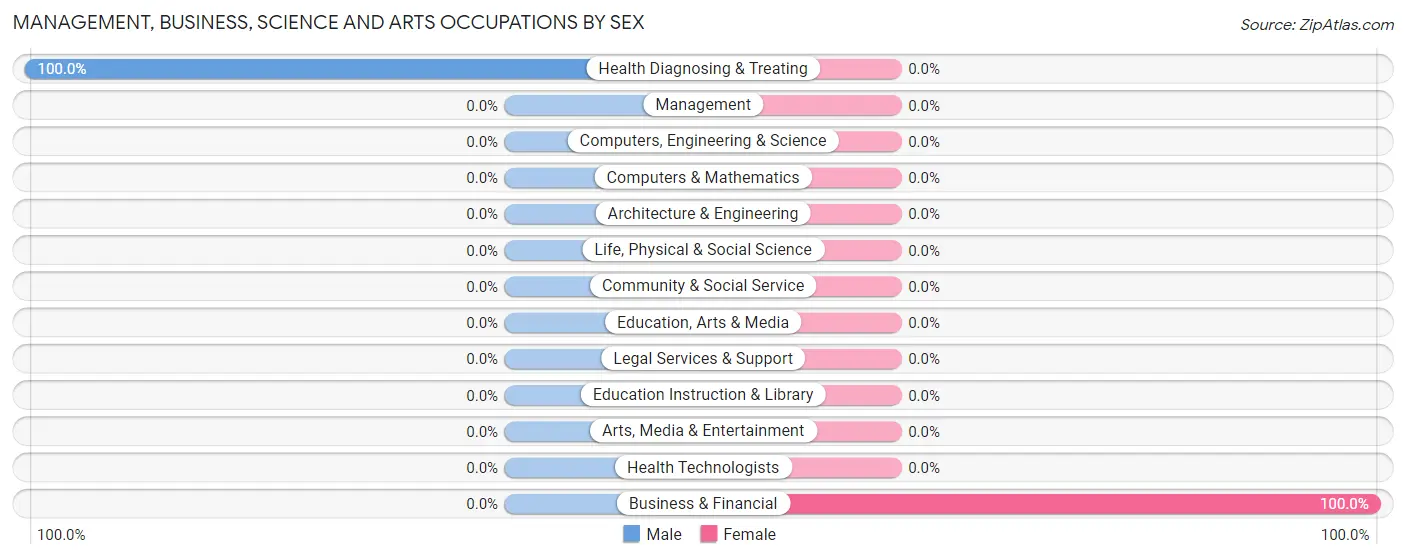
| Occupation | Male | Female |
| Management | 0 (0.0%) | 0 (0.0%) |
| Business & Financial | 0 (0.0%) | 4 (100.0%) |
| Computers, Engineering & Science | 0 (0.0%) | 0 (0.0%) |
| Computers & Mathematics | 0 (0.0%) | 0 (0.0%) |
| Architecture & Engineering | 0 (0.0%) | 0 (0.0%) |
| Life, Physical & Social Science | 0 (0.0%) | 0 (0.0%) |
| Community & Social Service | 0 (0.0%) | 0 (0.0%) |
| Education, Arts & Media | 0 (0.0%) | 0 (0.0%) |
| Legal Services & Support | 0 (0.0%) | 0 (0.0%) |
| Education Instruction & Library | 0 (0.0%) | 0 (0.0%) |
| Arts, Media & Entertainment | 0 (0.0%) | 0 (0.0%) |
| Health Diagnosing & Treating | 2 (100.0%) | 0 (0.0%) |
| Health Technologists | 0 (0.0%) | 0 (0.0%) |
| Total (Category) | 2 (33.3%) | 4 (66.7%) |
| Total (Overall) | 34 (51.5%) | 32 (48.5%) |
Services Occupations
The most common Services occupations in Hambleton are Food Preparation & Serving (16 | 24.2%), and Healthcare Support (9 | 13.6%).
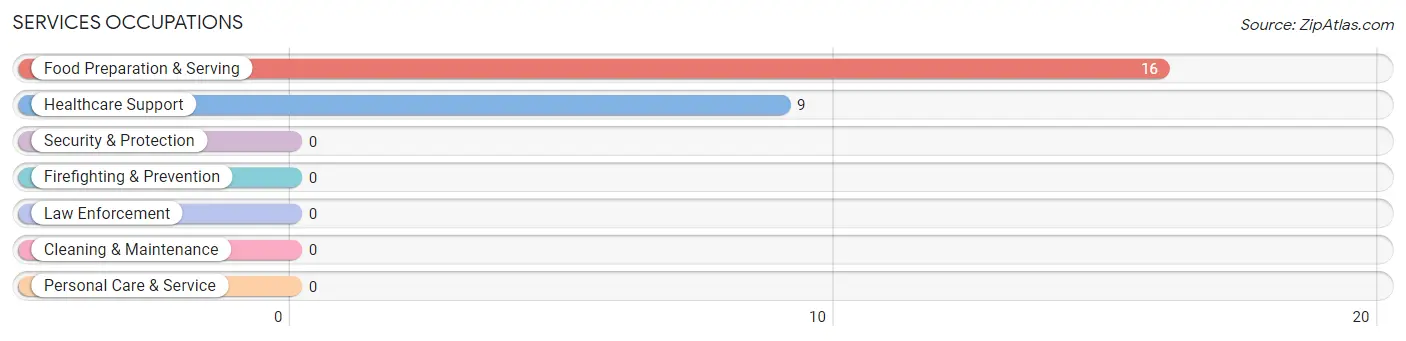
Services Occupations by Sex
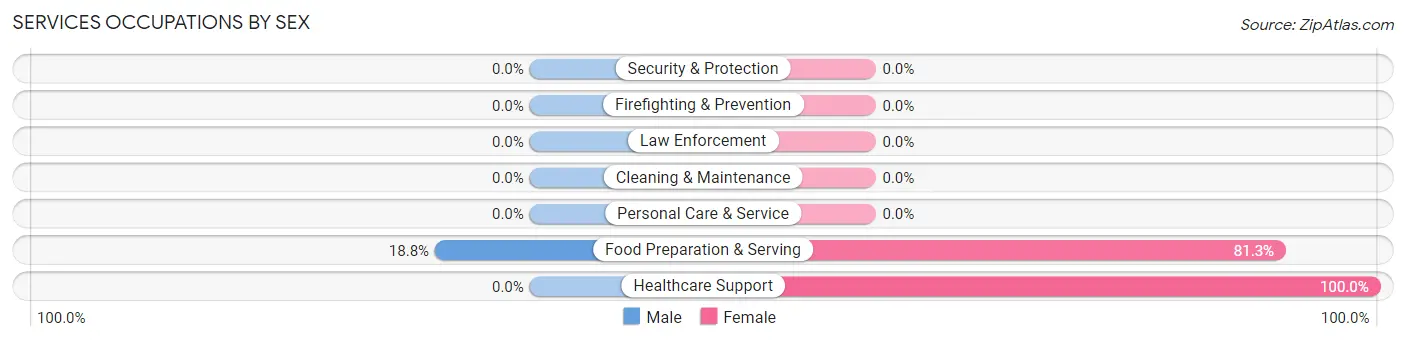
| Occupation | Male | Female |
| Healthcare Support | 0 (0.0%) | 9 (100.0%) |
| Security & Protection | 0 (0.0%) | 0 (0.0%) |
| Firefighting & Prevention | 0 (0.0%) | 0 (0.0%) |
| Law Enforcement | 0 (0.0%) | 0 (0.0%) |
| Food Preparation & Serving | 3 (18.8%) | 13 (81.2%) |
| Cleaning & Maintenance | 0 (0.0%) | 0 (0.0%) |
| Personal Care & Service | 0 (0.0%) | 0 (0.0%) |
| Total (Category) | 3 (12.0%) | 22 (88.0%) |
| Total (Overall) | 34 (51.5%) | 32 (48.5%) |
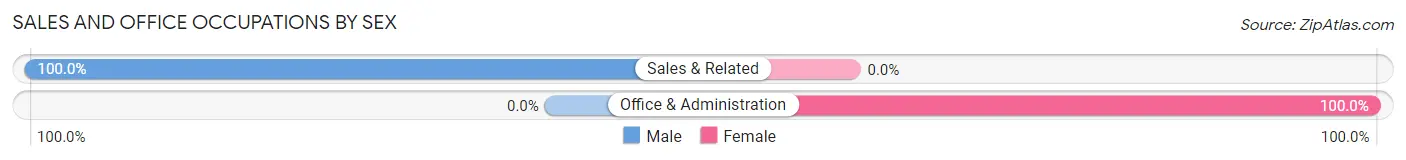
Sales and Office Occupations
The most common Sales and Office occupations in Hambleton are Sales & Related (5 | 7.6%), and Office & Administration (4 | 6.1%).
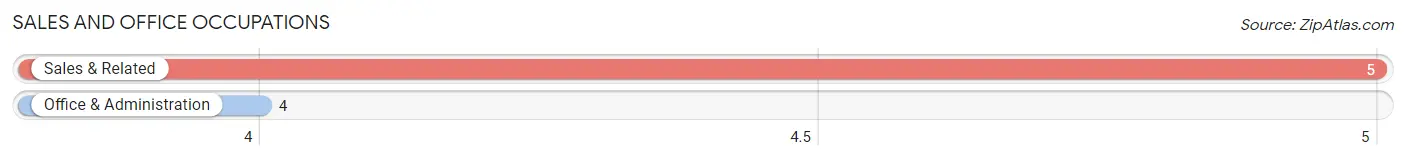
Sales and Office Occupations by Sex
| Occupation | Male | Female |
| Sales & Related | 5 (100.0%) | 0 (0.0%) |
| Office & Administration | 0 (0.0%) | 4 (100.0%) |
| Total (Category) | 5 (55.6%) | 4 (44.4%) |
| Total (Overall) | 34 (51.5%) | 32 (48.5%) |
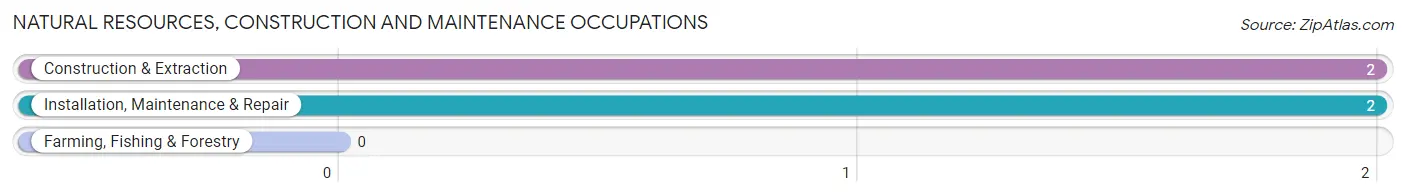
Natural Resources, Construction and Maintenance Occupations
The most common Natural Resources, Construction and Maintenance occupations in Hambleton are Construction & Extraction (2 | 3.0%), and Installation, Maintenance & Repair (2 | 3.0%).
Natural Resources, Construction and Maintenance Occupations by Sex
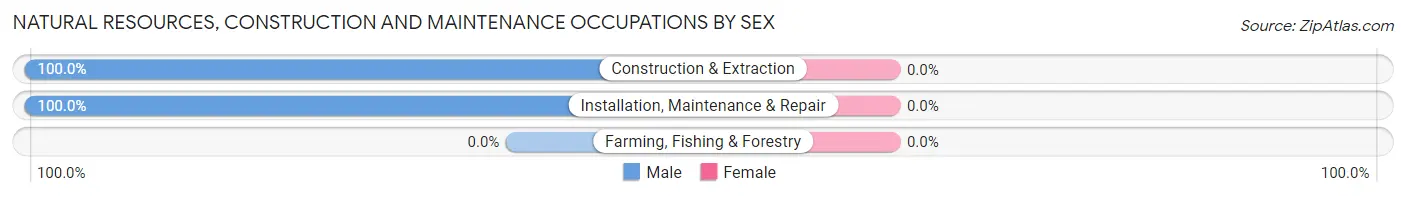
| Occupation | Male | Female |
| Farming, Fishing & Forestry | 0 (0.0%) | 0 (0.0%) |
| Construction & Extraction | 2 (100.0%) | 0 (0.0%) |
| Installation, Maintenance & Repair | 2 (100.0%) | 0 (0.0%) |
| Total (Category) | 4 (100.0%) | 0 (0.0%) |
| Total (Overall) | 34 (51.5%) | 32 (48.5%) |
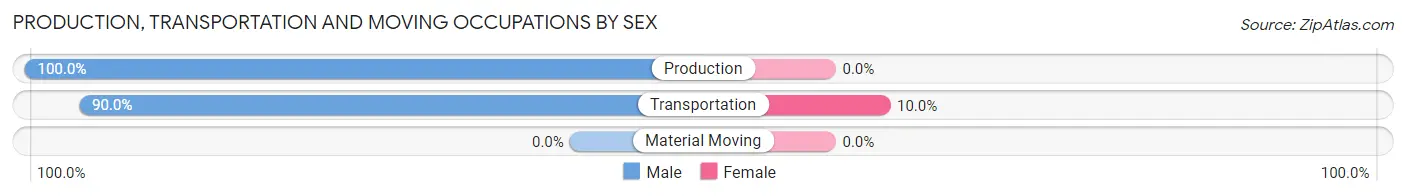
Production, Transportation and Moving Occupations
The most common Production, Transportation and Moving occupations in Hambleton are Transportation (20 | 30.3%), and Production (2 | 3.0%).
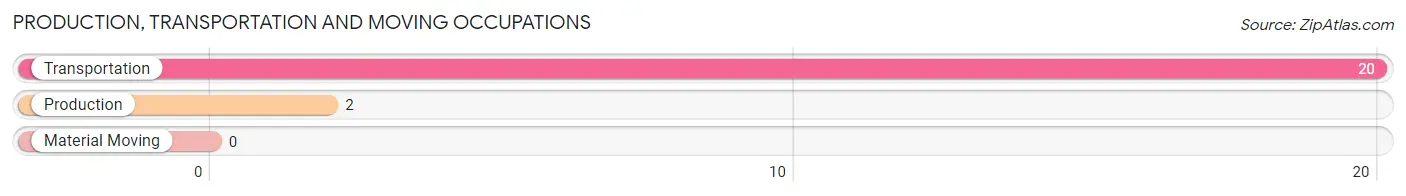
Production, Transportation and Moving Occupations by Sex
| Occupation | Male | Female |
| Production | 2 (100.0%) | 0 (0.0%) |
| Transportation | 18 (90.0%) | 2 (10.0%) |
| Material Moving | 0 (0.0%) | 0 (0.0%) |
| Total (Category) | 20 (90.9%) | 2 (9.1%) |
| Total (Overall) | 34 (51.5%) | 32 (48.5%) |
Employment Industries by Sex in Hambleton
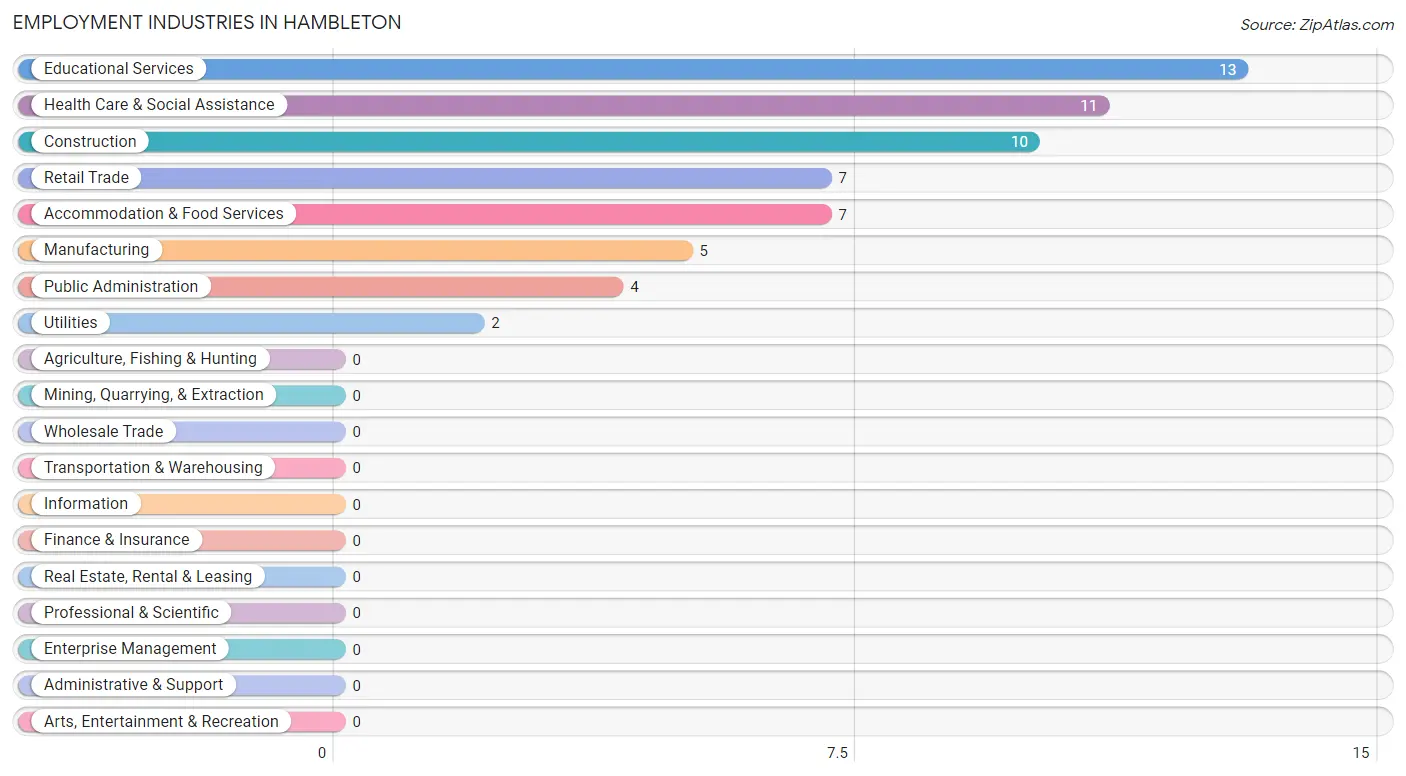
Employment Industries in Hambleton
The major employment industries in Hambleton include Educational Services (13 | 19.7%), Health Care & Social Assistance (11 | 16.7%), Construction (10 | 15.1%), Retail Trade (7 | 10.6%), and Accommodation & Food Services (7 | 10.6%).
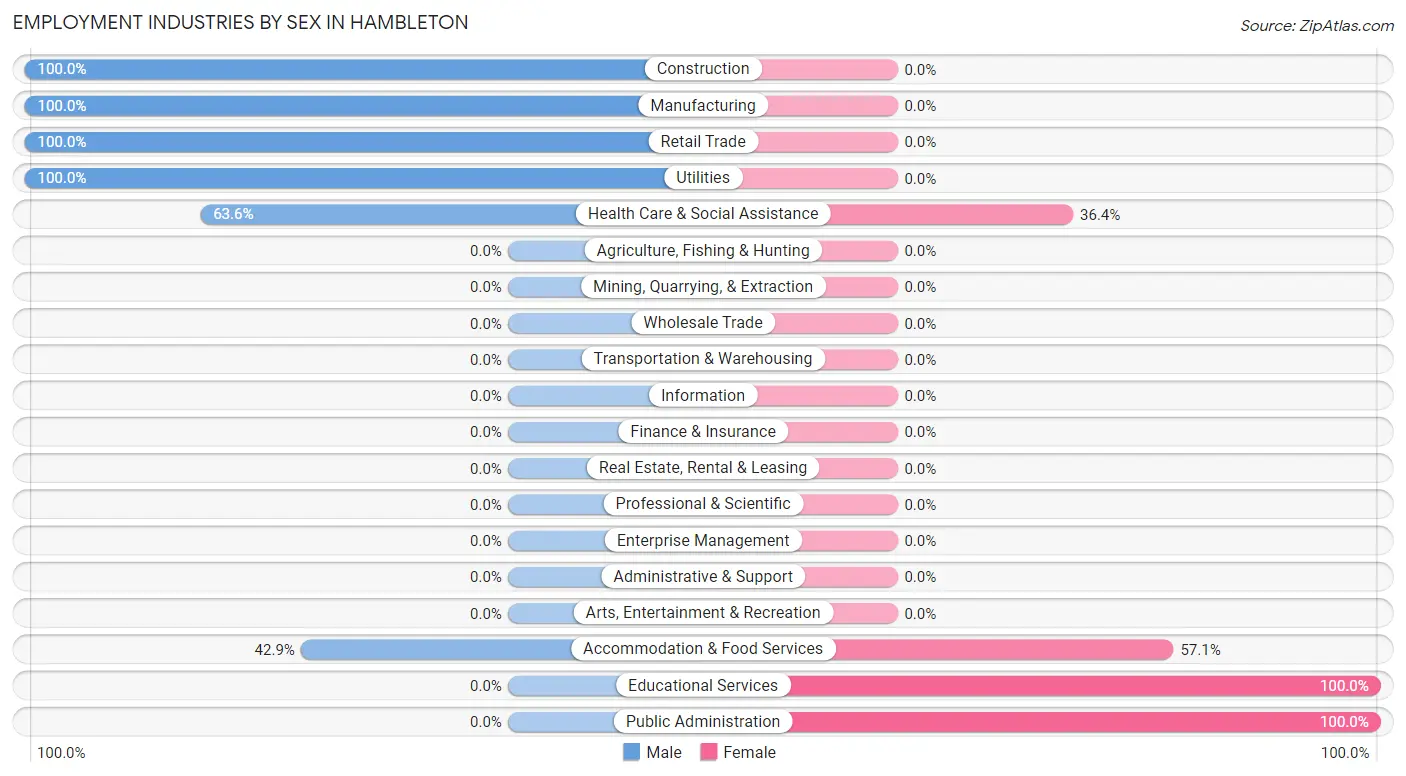
Employment Industries by Sex in Hambleton
The Hambleton industries that see more men than women are Construction (100.0%), Manufacturing (100.0%), and Retail Trade (100.0%), whereas the industries that tend to have a higher number of women are Educational Services (100.0%), Public Administration (100.0%), and Accommodation & Food Services (57.1%).
| Industry | Male | Female |
| Agriculture, Fishing & Hunting | 0 (0.0%) | 0 (0.0%) |
| Mining, Quarrying, & Extraction | 0 (0.0%) | 0 (0.0%) |
| Construction | 10 (100.0%) | 0 (0.0%) |
| Manufacturing | 5 (100.0%) | 0 (0.0%) |
| Wholesale Trade | 0 (0.0%) | 0 (0.0%) |
| Retail Trade | 7 (100.0%) | 0 (0.0%) |
| Transportation & Warehousing | 0 (0.0%) | 0 (0.0%) |
| Utilities | 2 (100.0%) | 0 (0.0%) |
| Information | 0 (0.0%) | 0 (0.0%) |
| Finance & Insurance | 0 (0.0%) | 0 (0.0%) |
| Real Estate, Rental & Leasing | 0 (0.0%) | 0 (0.0%) |
| Professional & Scientific | 0 (0.0%) | 0 (0.0%) |
| Enterprise Management | 0 (0.0%) | 0 (0.0%) |
| Administrative & Support | 0 (0.0%) | 0 (0.0%) |
| Educational Services | 0 (0.0%) | 13 (100.0%) |
| Health Care & Social Assistance | 7 (63.6%) | 4 (36.4%) |
| Arts, Entertainment & Recreation | 0 (0.0%) | 0 (0.0%) |
| Accommodation & Food Services | 3 (42.9%) | 4 (57.1%) |
| Public Administration | 0 (0.0%) | 4 (100.0%) |
| Total | 34 (51.5%) | 32 (48.5%) |
Education in Hambleton
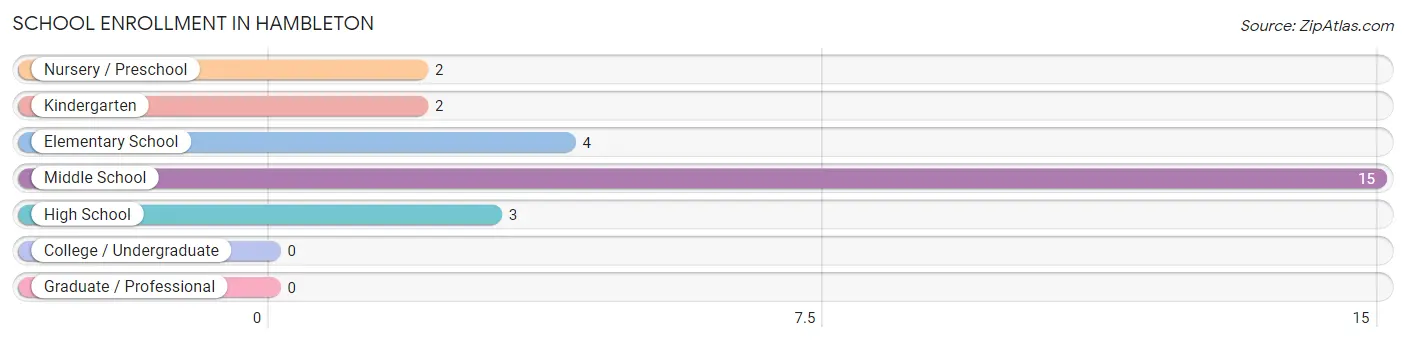
School Enrollment in Hambleton
The most common levels of schooling among the 26 students in Hambleton are middle school (15 | 57.7%), elementary school (4 | 15.4%), and high school (3 | 11.5%).
| School Level | # Students | % Students |
| Nursery / Preschool | 2 | 7.7% |
| Kindergarten | 2 | 7.7% |
| Elementary School | 4 | 15.4% |
| Middle School | 15 | 57.7% |
| High School | 3 | 11.5% |
| College / Undergraduate | 0 | 0.0% |
| Graduate / Professional | 0 | 0.0% |
| Total | 26 | 100.0% |
School Enrollment by Age by Funding Source in Hambleton
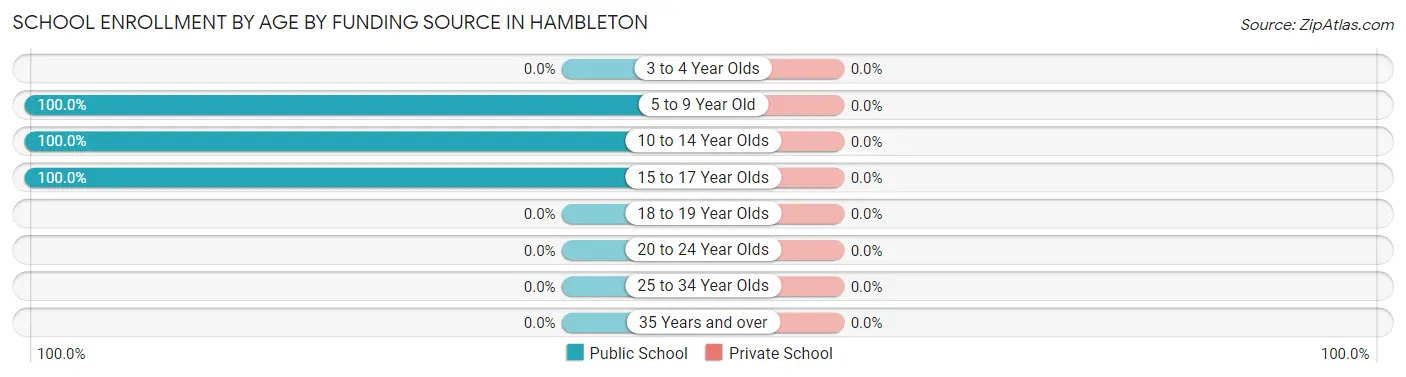
| Age Bracket | Public School | Private School |
| 3 to 4 Year Olds | 0 (0.0%) | 0 (0.0%) |
| 5 to 9 Year Old | 8 (100.0%) | 0 (0.0%) |
| 10 to 14 Year Olds | 15 (100.0%) | 0 (0.0%) |
| 15 to 17 Year Olds | 3 (100.0%) | 0 (0.0%) |
| 18 to 19 Year Olds | 0 (0.0%) | 0 (0.0%) |
| 20 to 24 Year Olds | 0 (0.0%) | 0 (0.0%) |
| 25 to 34 Year Olds | 0 (0.0%) | 0 (0.0%) |
| 35 Years and over | 0 (0.0%) | 0 (0.0%) |
| Total | 26 (100.0%) | 0 (0.0%) |
Educational Attainment by Field of Study in Hambleton
, and education (1 | 100.0%) are the most common fields of study among 1 individuals in Hambleton who have obtained a bachelor's degree or higher.
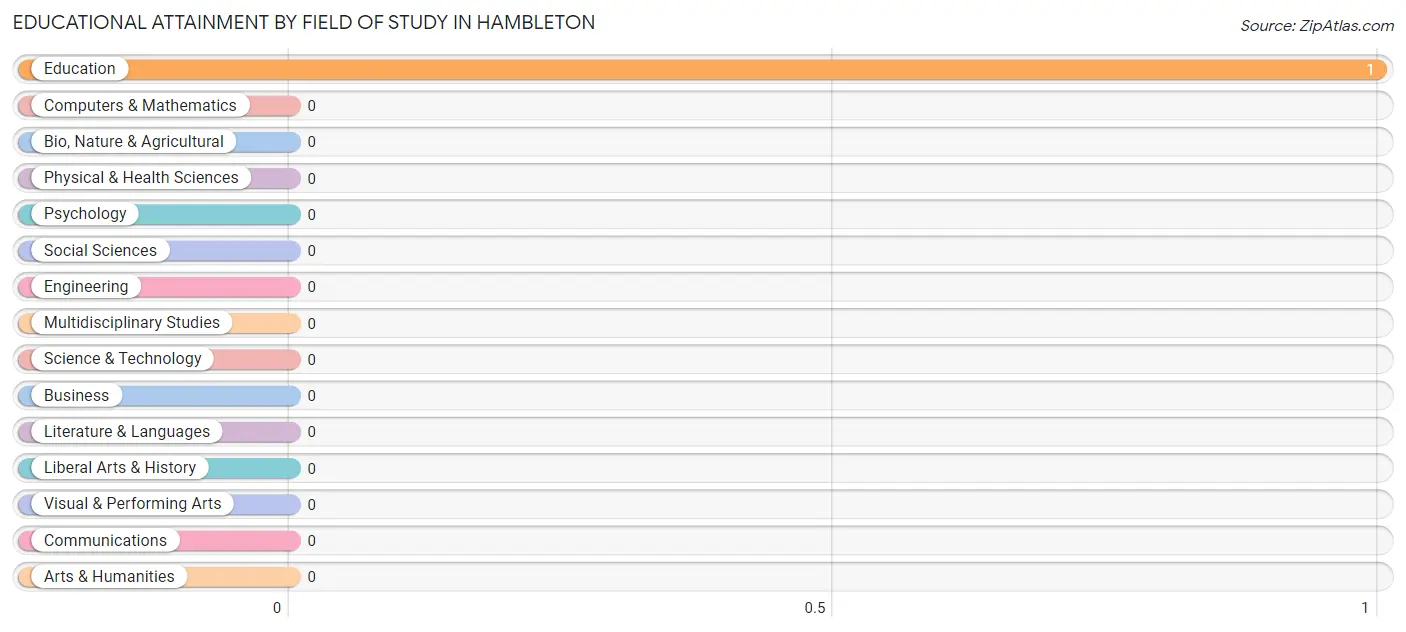
| Field of Study | # Graduates | % Graduates |
| Computers & Mathematics | 0 | 0.0% |
| Bio, Nature & Agricultural | 0 | 0.0% |
| Physical & Health Sciences | 0 | 0.0% |
| Psychology | 0 | 0.0% |
| Social Sciences | 0 | 0.0% |
| Engineering | 0 | 0.0% |
| Multidisciplinary Studies | 0 | 0.0% |
| Science & Technology | 0 | 0.0% |
| Business | 0 | 0.0% |
| Education | 1 | 100.0% |
| Literature & Languages | 0 | 0.0% |
| Liberal Arts & History | 0 | 0.0% |
| Visual & Performing Arts | 0 | 0.0% |
| Communications | 0 | 0.0% |
| Arts & Humanities | 0 | 0.0% |
| Total | 1 | 100.0% |
Transportation & Commute in Hambleton
Vehicle Availability by Sex in Hambleton
The most prevalent vehicle ownership categories in Hambleton are males with 2 vehicles (32, accounting for 94.1%) and females with 2 vehicles (25, making up 100.0%).
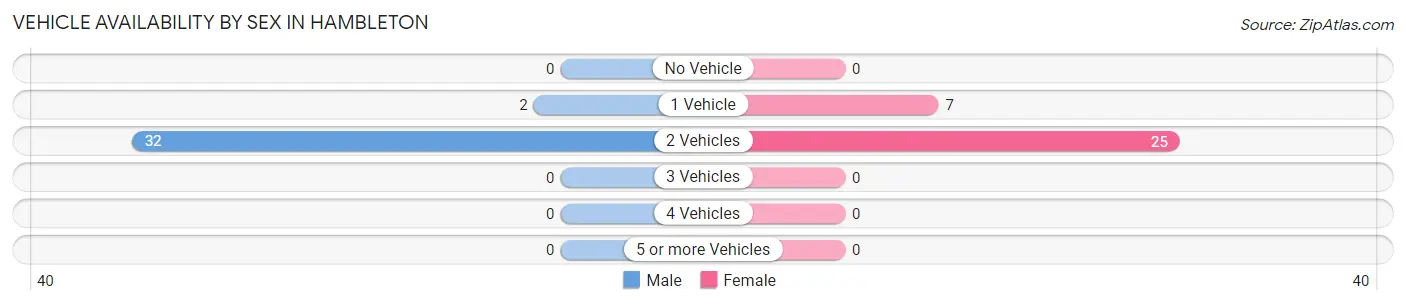
| Vehicles Available | Male | Female |
| No Vehicle | 0 (0.0%) | 0 (0.0%) |
| 1 Vehicle | 2 (5.9%) | 7 (21.9%) |
| 2 Vehicles | 32 (94.1%) | 25 (78.1%) |
| 3 Vehicles | 0 (0.0%) | 0 (0.0%) |
| 4 Vehicles | 0 (0.0%) | 0 (0.0%) |
| 5 or more Vehicles | 0 (0.0%) | 0 (0.0%) |
| Total | 34 (100.0%) | 32 (100.0%) |
Commute Time in Hambleton
The most frequently occuring commute durations in Hambleton are 20 to 24 minutes (17 commuters, 28.8%), 45 to 59 minutes (14 commuters, 23.7%), and 5 to 9 minutes (12 commuters, 20.3%).
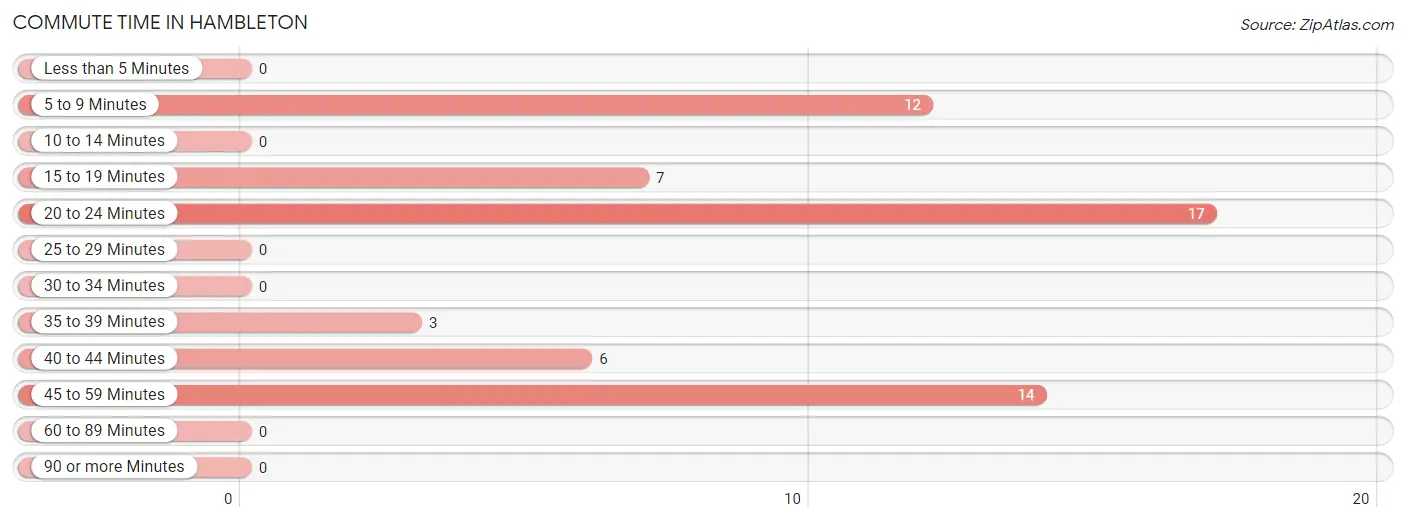
| Commute Time | # Commuters | % Commuters |
| Less than 5 Minutes | 0 | 0.0% |
| 5 to 9 Minutes | 12 | 20.3% |
| 10 to 14 Minutes | 0 | 0.0% |
| 15 to 19 Minutes | 7 | 11.9% |
| 20 to 24 Minutes | 17 | 28.8% |
| 25 to 29 Minutes | 0 | 0.0% |
| 30 to 34 Minutes | 0 | 0.0% |
| 35 to 39 Minutes | 3 | 5.1% |
| 40 to 44 Minutes | 6 | 10.2% |
| 45 to 59 Minutes | 14 | 23.7% |
| 60 to 89 Minutes | 0 | 0.0% |
| 90 or more Minutes | 0 | 0.0% |
Commute Time by Sex in Hambleton
The most common commute times in Hambleton are 5 to 9 minutes (12 commuters, 35.3%) for males and 20 to 24 minutes (17 commuters, 68.0%) for females.
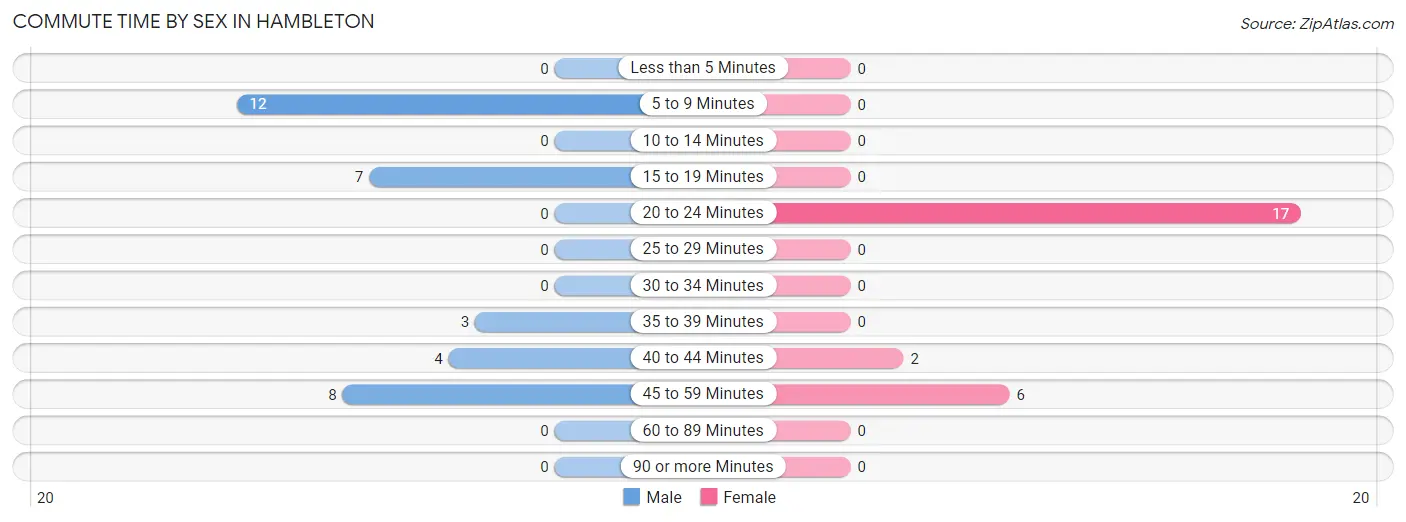
| Commute Time | Male | Female |
| Less than 5 Minutes | 0 (0.0%) | 0 (0.0%) |
| 5 to 9 Minutes | 12 (35.3%) | 0 (0.0%) |
| 10 to 14 Minutes | 0 (0.0%) | 0 (0.0%) |
| 15 to 19 Minutes | 7 (20.6%) | 0 (0.0%) |
| 20 to 24 Minutes | 0 (0.0%) | 17 (68.0%) |
| 25 to 29 Minutes | 0 (0.0%) | 0 (0.0%) |
| 30 to 34 Minutes | 0 (0.0%) | 0 (0.0%) |
| 35 to 39 Minutes | 3 (8.8%) | 0 (0.0%) |
| 40 to 44 Minutes | 4 (11.8%) | 2 (8.0%) |
| 45 to 59 Minutes | 8 (23.5%) | 6 (24.0%) |
| 60 to 89 Minutes | 0 (0.0%) | 0 (0.0%) |
| 90 or more Minutes | 0 (0.0%) | 0 (0.0%) |
Time of Departure to Work by Sex in Hambleton
The most frequent times of departure to work in Hambleton are 5:30 AM to 5:59 AM (8, 23.5%) for males and 6:00 AM to 6:29 AM (13, 52.0%) for females.
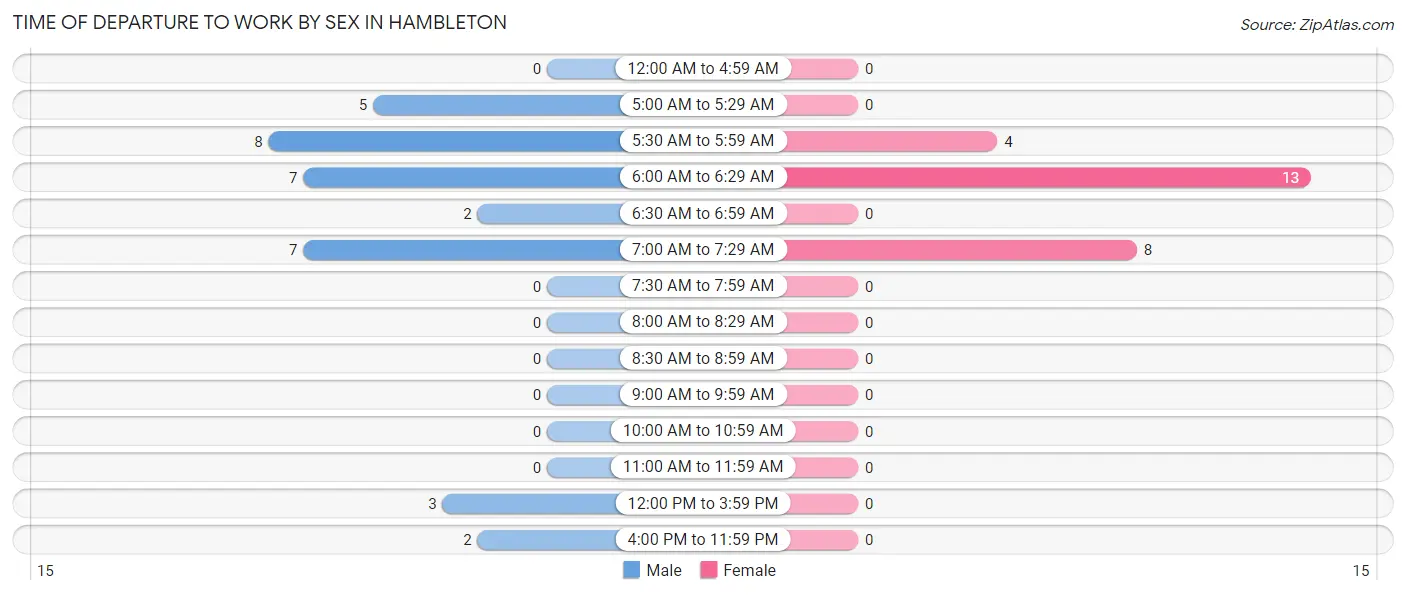
| Time of Departure | Male | Female |
| 12:00 AM to 4:59 AM | 0 (0.0%) | 0 (0.0%) |
| 5:00 AM to 5:29 AM | 5 (14.7%) | 0 (0.0%) |
| 5:30 AM to 5:59 AM | 8 (23.5%) | 4 (16.0%) |
| 6:00 AM to 6:29 AM | 7 (20.6%) | 13 (52.0%) |
| 6:30 AM to 6:59 AM | 2 (5.9%) | 0 (0.0%) |
| 7:00 AM to 7:29 AM | 7 (20.6%) | 8 (32.0%) |
| 7:30 AM to 7:59 AM | 0 (0.0%) | 0 (0.0%) |
| 8:00 AM to 8:29 AM | 0 (0.0%) | 0 (0.0%) |
| 8:30 AM to 8:59 AM | 0 (0.0%) | 0 (0.0%) |
| 9:00 AM to 9:59 AM | 0 (0.0%) | 0 (0.0%) |
| 10:00 AM to 10:59 AM | 0 (0.0%) | 0 (0.0%) |
| 11:00 AM to 11:59 AM | 0 (0.0%) | 0 (0.0%) |
| 12:00 PM to 3:59 PM | 3 (8.8%) | 0 (0.0%) |
| 4:00 PM to 11:59 PM | 2 (5.9%) | 0 (0.0%) |
| Total | 34 (100.0%) | 25 (100.0%) |
Housing Occupancy in Hambleton
Occupancy by Ownership in Hambleton
Of the total 86 dwellings in Hambleton, owner-occupied units account for 83 (96.5%), while renter-occupied units make up 3 (3.5%).
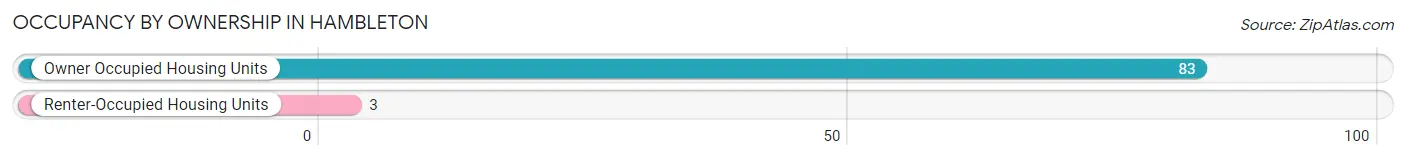
| Occupancy | # Housing Units | % Housing Units |
| Owner Occupied Housing Units | 83 | 96.5% |
| Renter-Occupied Housing Units | 3 | 3.5% |
| Total Occupied Housing Units | 86 | 100.0% |
Occupancy by Household Size in Hambleton
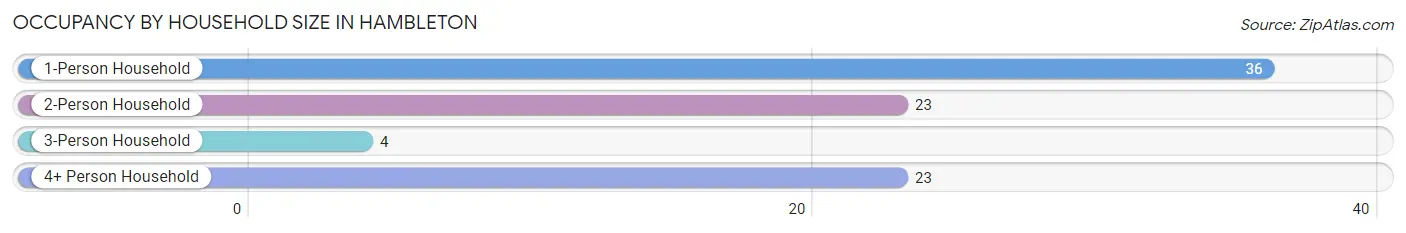
| Household Size | # Housing Units | % Housing Units |
| 1-Person Household | 36 | 41.9% |
| 2-Person Household | 23 | 26.7% |
| 3-Person Household | 4 | 4.6% |
| 4+ Person Household | 23 | 26.7% |
| Total Housing Units | 86 | 100.0% |
Occupancy by Ownership by Household Size in Hambleton
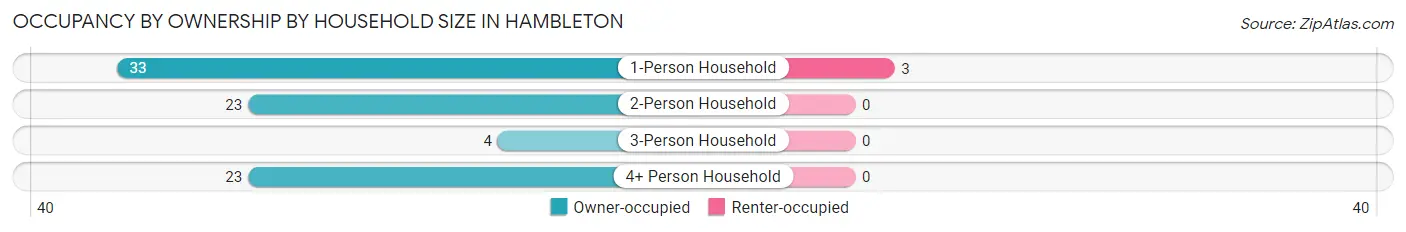
| Household Size | Owner-occupied | Renter-occupied |
| 1-Person Household | 33 (91.7%) | 3 (8.3%) |
| 2-Person Household | 23 (100.0%) | 0 (0.0%) |
| 3-Person Household | 4 (100.0%) | 0 (0.0%) |
| 4+ Person Household | 23 (100.0%) | 0 (0.0%) |
| Total Housing Units | 83 (96.5%) | 3 (3.5%) |
Occupancy by Educational Attainment in Hambleton
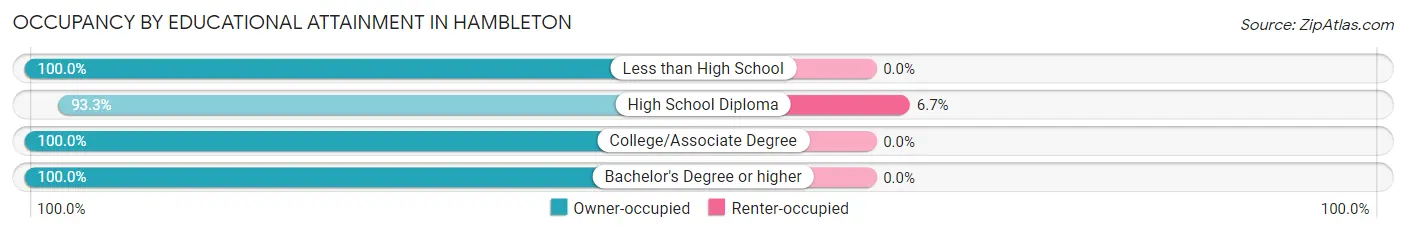
| Household Size | Owner-occupied | Renter-occupied |
| Less than High School | 6 (100.0%) | 0 (0.0%) |
| High School Diploma | 42 (93.3%) | 3 (6.7%) |
| College/Associate Degree | 34 (100.0%) | 0 (0.0%) |
| Bachelor's Degree or higher | 1 (100.0%) | 0 (0.0%) |
Occupancy by Age of Householder in Hambleton
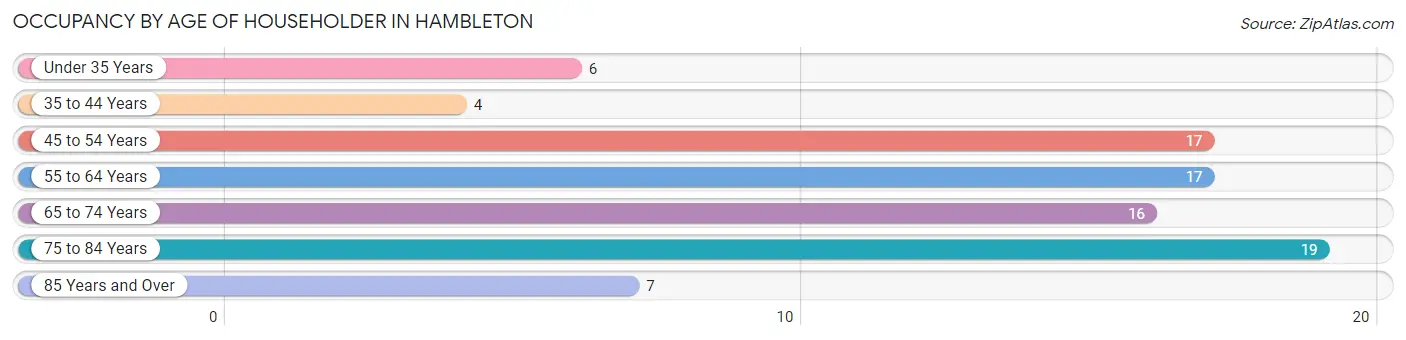
| Age Bracket | # Households | % Households |
| Under 35 Years | 6 | 7.0% |
| 35 to 44 Years | 4 | 4.6% |
| 45 to 54 Years | 17 | 19.8% |
| 55 to 64 Years | 17 | 19.8% |
| 65 to 74 Years | 16 | 18.6% |
| 75 to 84 Years | 19 | 22.1% |
| 85 Years and Over | 7 | 8.1% |
| Total | 86 | 100.0% |
Housing Finances in Hambleton
Median Income by Occupancy in Hambleton
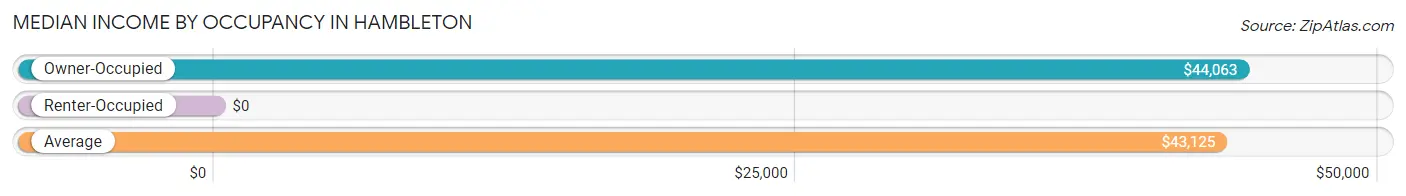
| Occupancy Type | # Households | Median Income |
| Owner-Occupied | 83 (96.5%) | $44,063 |
| Renter-Occupied | 3 (3.5%) | $0 |
| Average | 86 (100.0%) | $43,125 |
Occupancy by Householder Income Bracket in Hambleton
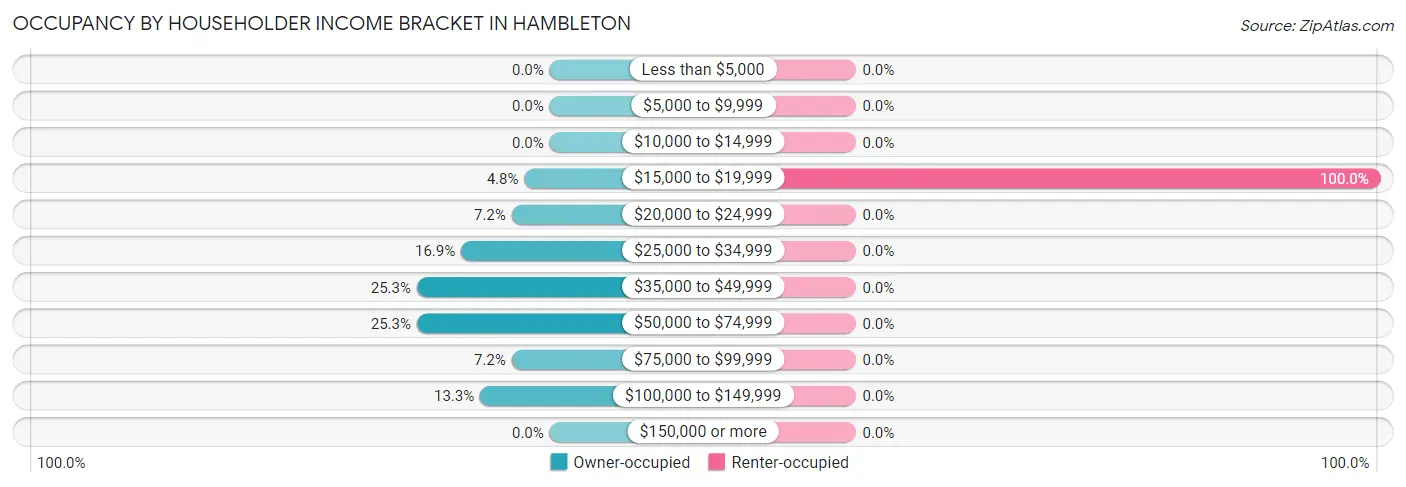
| Income Bracket | Owner-occupied | Renter-occupied |
| Less than $5,000 | 0 (0.0%) | 0 (0.0%) |
| $5,000 to $9,999 | 0 (0.0%) | 0 (0.0%) |
| $10,000 to $14,999 | 0 (0.0%) | 0 (0.0%) |
| $15,000 to $19,999 | 4 (4.8%) | 3 (100.0%) |
| $20,000 to $24,999 | 6 (7.2%) | 0 (0.0%) |
| $25,000 to $34,999 | 14 (16.9%) | 0 (0.0%) |
| $35,000 to $49,999 | 21 (25.3%) | 0 (0.0%) |
| $50,000 to $74,999 | 21 (25.3%) | 0 (0.0%) |
| $75,000 to $99,999 | 6 (7.2%) | 0 (0.0%) |
| $100,000 to $149,999 | 11 (13.3%) | 0 (0.0%) |
| $150,000 or more | 0 (0.0%) | 0 (0.0%) |
| Total | 83 (100.0%) | 3 (100.0%) |
Monthly Housing Cost Tiers in Hambleton
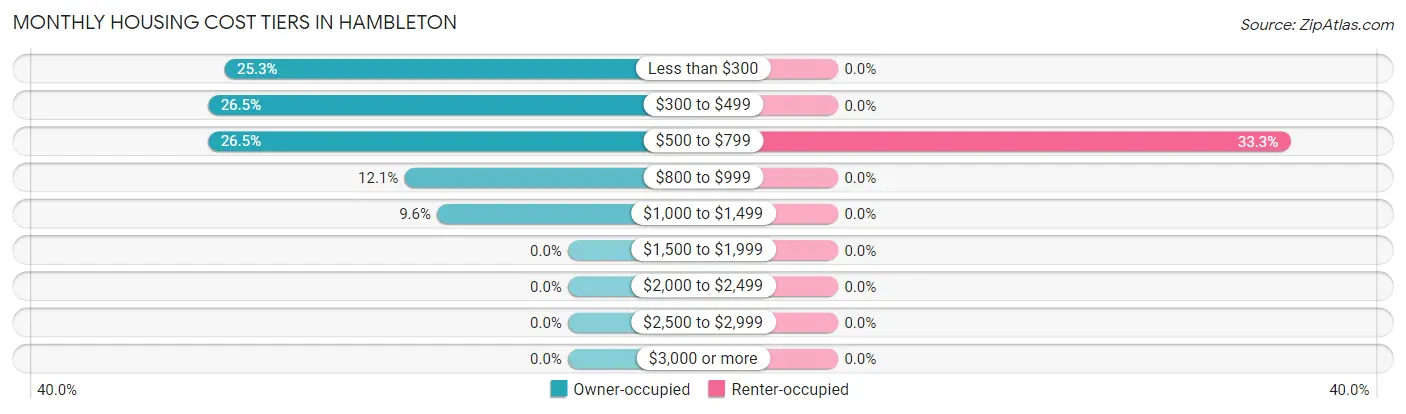
| Monthly Cost | Owner-occupied | Renter-occupied |
| Less than $300 | 21 (25.3%) | 0 (0.0%) |
| $300 to $499 | 22 (26.5%) | 0 (0.0%) |
| $500 to $799 | 22 (26.5%) | 1 (33.3%) |
| $800 to $999 | 10 (12.0%) | 0 (0.0%) |
| $1,000 to $1,499 | 8 (9.6%) | 0 (0.0%) |
| $1,500 to $1,999 | 0 (0.0%) | 0 (0.0%) |
| $2,000 to $2,499 | 0 (0.0%) | 0 (0.0%) |
| $2,500 to $2,999 | 0 (0.0%) | 0 (0.0%) |
| $3,000 or more | 0 (0.0%) | 0 (0.0%) |
| Total | 83 (100.0%) | 3 (100.0%) |
Physical Housing Characteristics in Hambleton
Housing Structures in Hambleton
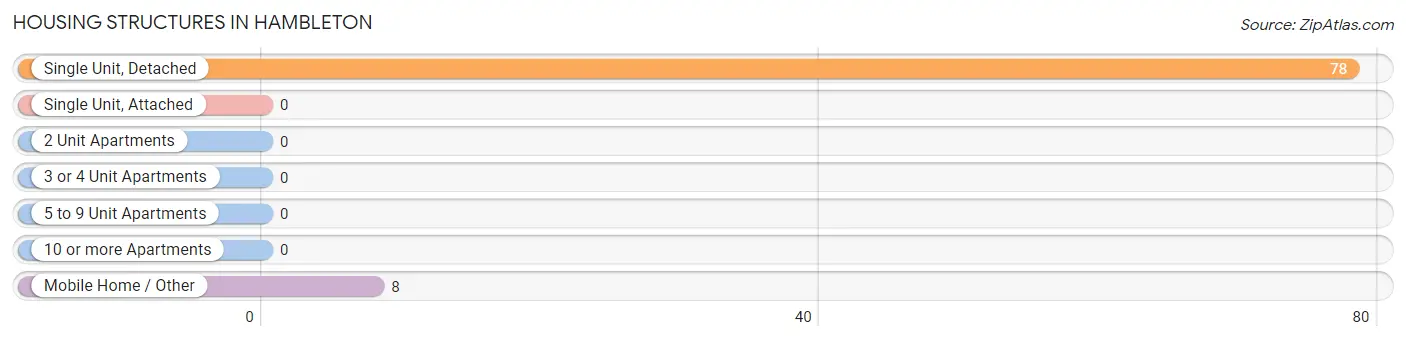
| Structure Type | # Housing Units | % Housing Units |
| Single Unit, Detached | 78 | 90.7% |
| Single Unit, Attached | 0 | 0.0% |
| 2 Unit Apartments | 0 | 0.0% |
| 3 or 4 Unit Apartments | 0 | 0.0% |
| 5 to 9 Unit Apartments | 0 | 0.0% |
| 10 or more Apartments | 0 | 0.0% |
| Mobile Home / Other | 8 | 9.3% |
| Total | 86 | 100.0% |
Housing Structures by Occupancy in Hambleton
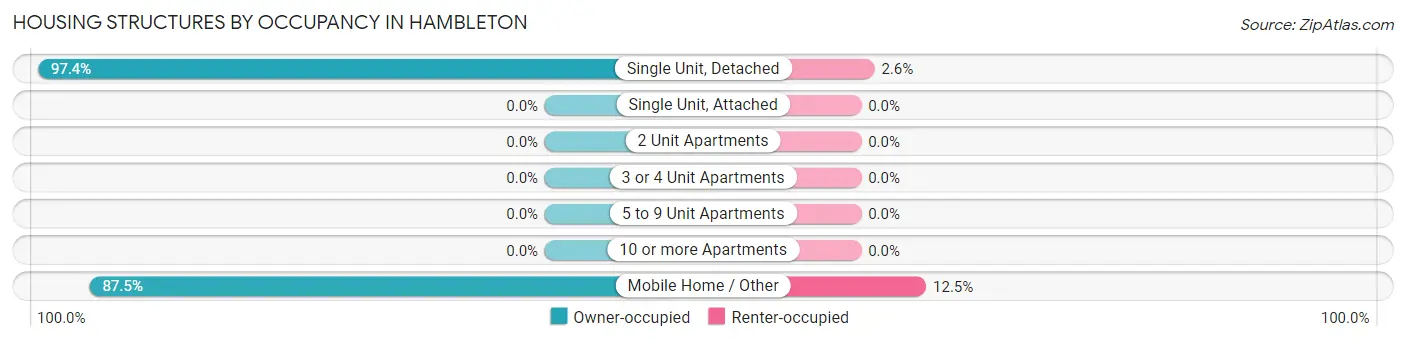
| Structure Type | Owner-occupied | Renter-occupied |
| Single Unit, Detached | 76 (97.4%) | 2 (2.6%) |
| Single Unit, Attached | 0 (0.0%) | 0 (0.0%) |
| 2 Unit Apartments | 0 (0.0%) | 0 (0.0%) |
| 3 or 4 Unit Apartments | 0 (0.0%) | 0 (0.0%) |
| 5 to 9 Unit Apartments | 0 (0.0%) | 0 (0.0%) |
| 10 or more Apartments | 0 (0.0%) | 0 (0.0%) |
| Mobile Home / Other | 7 (87.5%) | 1 (12.5%) |
| Total | 83 (96.5%) | 3 (3.5%) |
Housing Structures by Number of Rooms in Hambleton
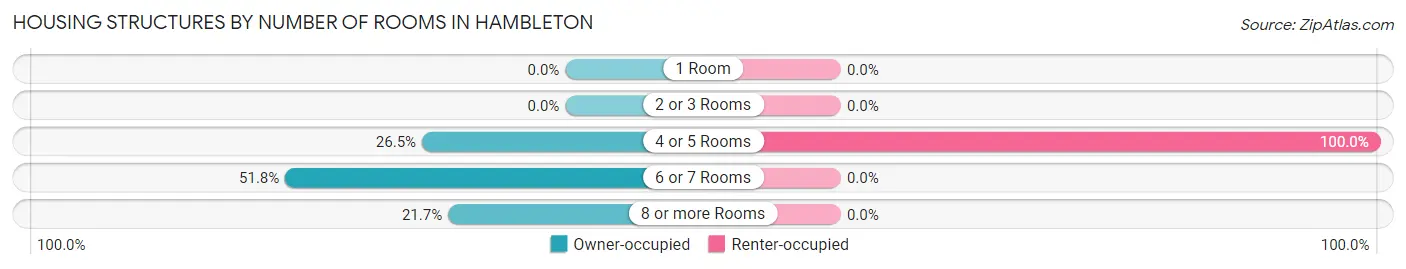
| Number of Rooms | Owner-occupied | Renter-occupied |
| 1 Room | 0 (0.0%) | 0 (0.0%) |
| 2 or 3 Rooms | 0 (0.0%) | 0 (0.0%) |
| 4 or 5 Rooms | 22 (26.5%) | 3 (100.0%) |
| 6 or 7 Rooms | 43 (51.8%) | 0 (0.0%) |
| 8 or more Rooms | 18 (21.7%) | 0 (0.0%) |
| Total | 83 (100.0%) | 3 (100.0%) |
Housing Structure by Heating Type in Hambleton
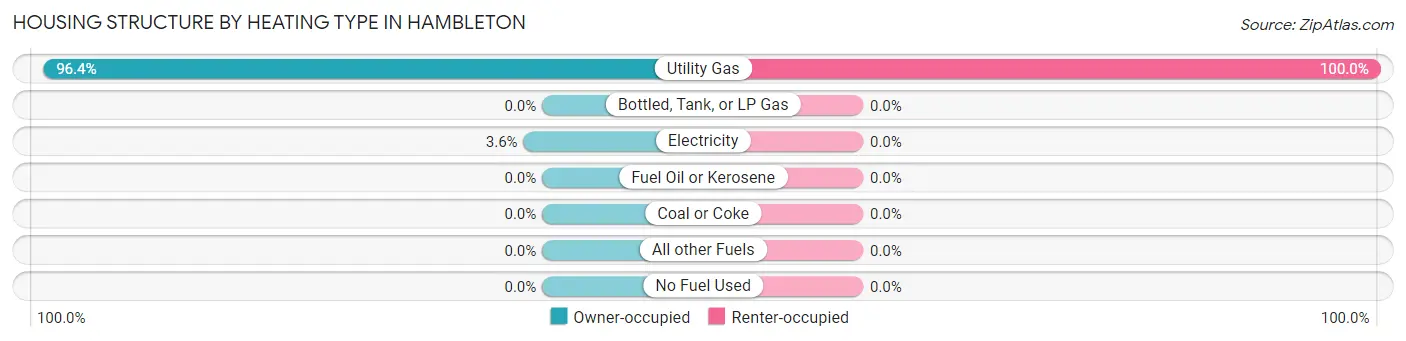
| Heating Type | Owner-occupied | Renter-occupied |
| Utility Gas | 80 (96.4%) | 3 (100.0%) |
| Bottled, Tank, or LP Gas | 0 (0.0%) | 0 (0.0%) |
| Electricity | 3 (3.6%) | 0 (0.0%) |
| Fuel Oil or Kerosene | 0 (0.0%) | 0 (0.0%) |
| Coal or Coke | 0 (0.0%) | 0 (0.0%) |
| All other Fuels | 0 (0.0%) | 0 (0.0%) |
| No Fuel Used | 0 (0.0%) | 0 (0.0%) |
| Total | 83 (100.0%) | 3 (100.0%) |
Household Vehicle Usage in Hambleton
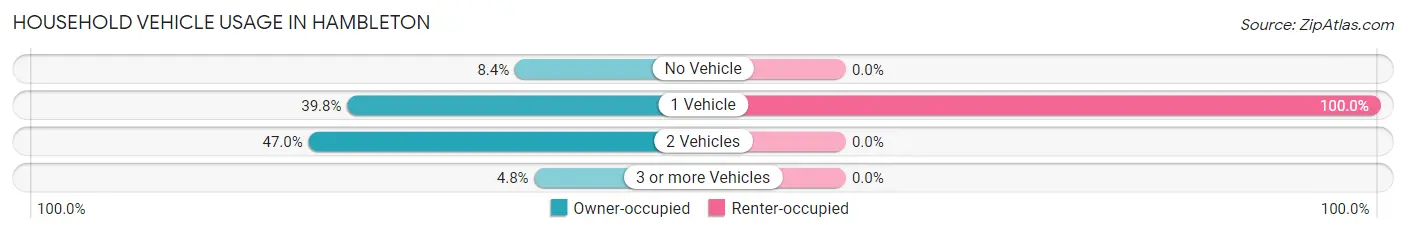
| Vehicles per Household | Owner-occupied | Renter-occupied |
| No Vehicle | 7 (8.4%) | 0 (0.0%) |
| 1 Vehicle | 33 (39.8%) | 3 (100.0%) |
| 2 Vehicles | 39 (47.0%) | 0 (0.0%) |
| 3 or more Vehicles | 4 (4.8%) | 0 (0.0%) |
| Total | 83 (100.0%) | 3 (100.0%) |
Real Estate & Mortgages in Hambleton
Real Estate and Mortgage Overview in Hambleton
| Characteristic | Without Mortgage | With Mortgage |
| Housing Units | 49 | 34 |
| Median Property Value | $90,800 | $125,000 |
| Median Household Income | $42,813 | $0 |
| Monthly Housing Costs | $325 | $0 |
| Real Estate Taxes | $414 | $0 |
Property Value by Mortgage Status in Hambleton
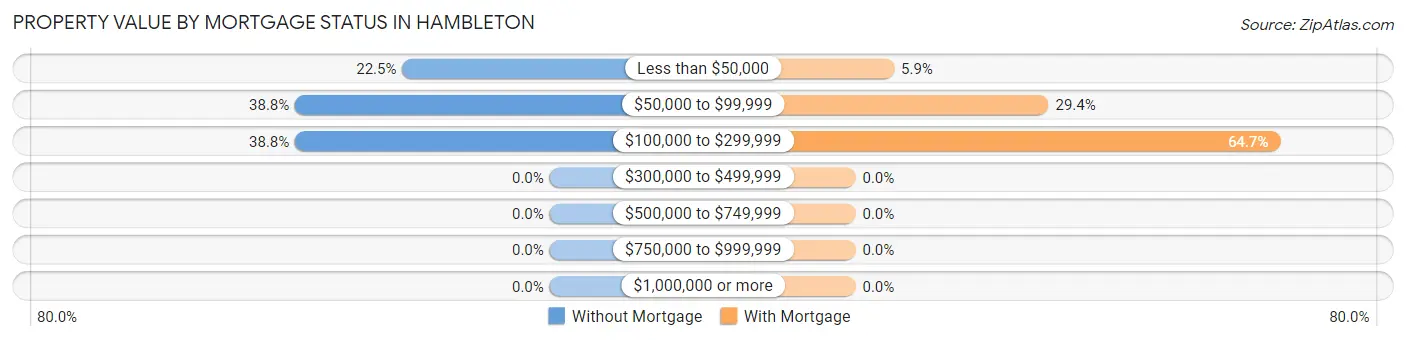
| Property Value | Without Mortgage | With Mortgage |
| Less than $50,000 | 11 (22.5%) | 2 (5.9%) |
| $50,000 to $99,999 | 19 (38.8%) | 10 (29.4%) |
| $100,000 to $299,999 | 19 (38.8%) | 22 (64.7%) |
| $300,000 to $499,999 | 0 (0.0%) | 0 (0.0%) |
| $500,000 to $749,999 | 0 (0.0%) | 0 (0.0%) |
| $750,000 to $999,999 | 0 (0.0%) | 0 (0.0%) |
| $1,000,000 or more | 0 (0.0%) | 0 (0.0%) |
| Total | 49 (100.0%) | 34 (100.0%) |
Household Income by Mortgage Status in Hambleton
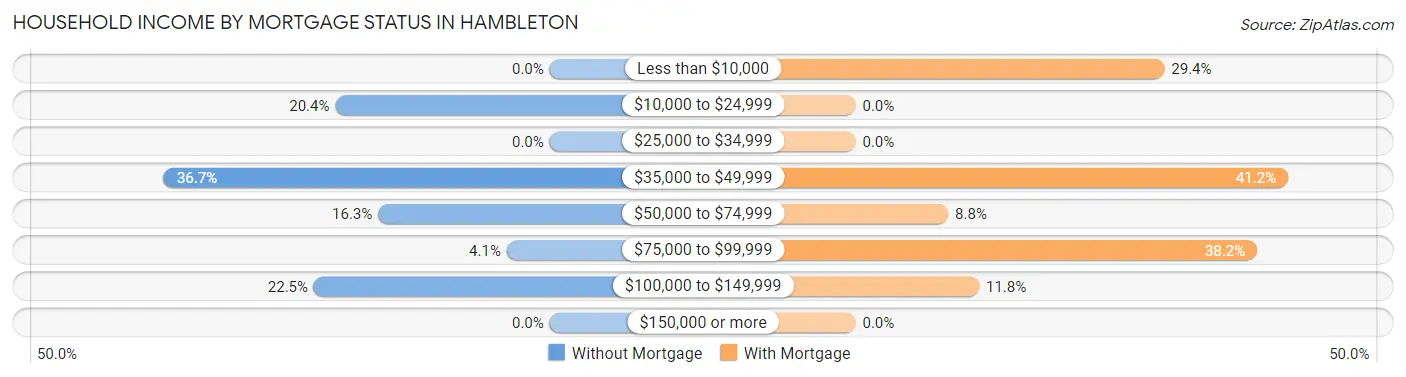
| Household Income | Without Mortgage | With Mortgage |
| Less than $10,000 | 0 (0.0%) | 10 (29.4%) |
| $10,000 to $24,999 | 10 (20.4%) | 0 (0.0%) |
| $25,000 to $34,999 | 0 (0.0%) | 0 (0.0%) |
| $35,000 to $49,999 | 18 (36.7%) | 14 (41.2%) |
| $50,000 to $74,999 | 8 (16.3%) | 3 (8.8%) |
| $75,000 to $99,999 | 2 (4.1%) | 13 (38.2%) |
| $100,000 to $149,999 | 11 (22.5%) | 4 (11.8%) |
| $150,000 or more | 0 (0.0%) | 0 (0.0%) |
| Total | 49 (100.0%) | 34 (100.0%) |
Property Value to Household Income Ratio in Hambleton
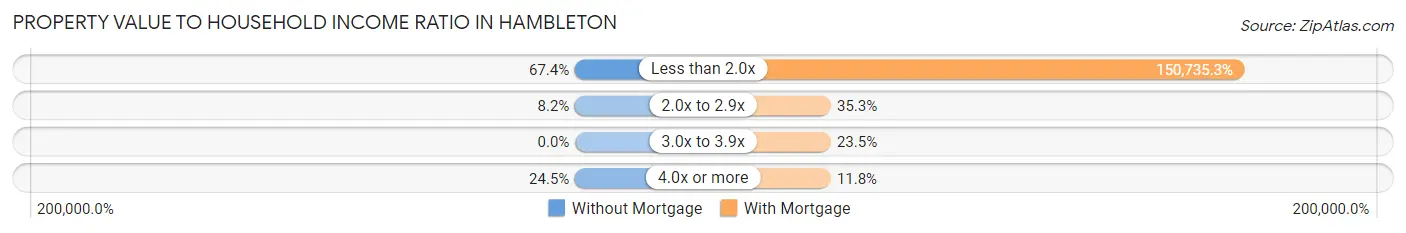
| Value-to-Income Ratio | Without Mortgage | With Mortgage |
| Less than 2.0x | 33 (67.3%) | 51,250 (150,735.3%) |
| 2.0x to 2.9x | 4 (8.2%) | 12 (35.3%) |
| 3.0x to 3.9x | 0 (0.0%) | 8 (23.5%) |
| 4.0x or more | 12 (24.5%) | 4 (11.8%) |
| Total | 49 (100.0%) | 34 (100.0%) |
Real Estate Taxes by Mortgage Status in Hambleton
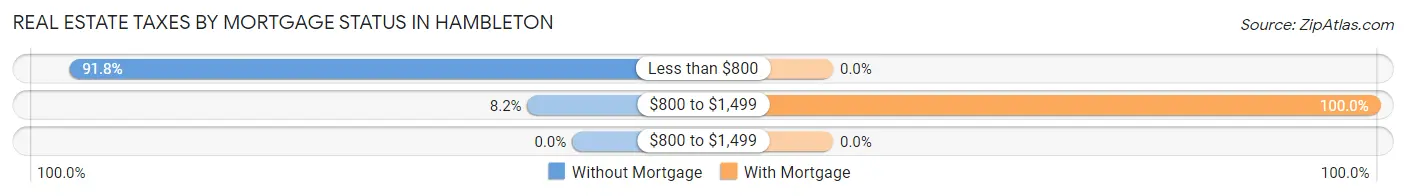
| Property Taxes | Without Mortgage | With Mortgage |
| Less than $800 | 45 (91.8%) | 0 (0.0%) |
| $800 to $1,499 | 4 (8.2%) | 34 (100.0%) |
| $800 to $1,499 | 0 (0.0%) | 0 (0.0%) |
| Total | 49 (100.0%) | 34 (100.0%) |
Health & Disability in Hambleton
Health Insurance Coverage by Age in Hambleton
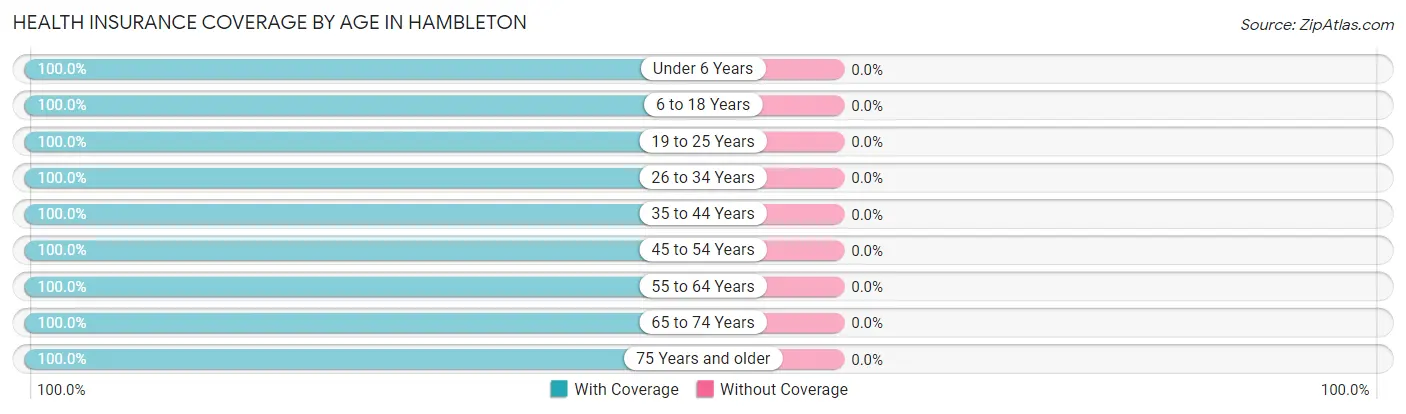
| Age Bracket | With Coverage | Without Coverage |
| Under 6 Years | 11 (100.0%) | 0 (0.0%) |
| 6 to 18 Years | 22 (100.0%) | 0 (0.0%) |
| 19 to 25 Years | 10 (100.0%) | 0 (0.0%) |
| 26 to 34 Years | 6 (100.0%) | 0 (0.0%) |
| 35 to 44 Years | 23 (100.0%) | 0 (0.0%) |
| 45 to 54 Years | 22 (100.0%) | 0 (0.0%) |
| 55 to 64 Years | 31 (100.0%) | 0 (0.0%) |
| 65 to 74 Years | 31 (100.0%) | 0 (0.0%) |
| 75 Years and older | 47 (100.0%) | 0 (0.0%) |
| Total | 203 (100.0%) | 0 (0.0%) |
Health Insurance Coverage by Citizenship Status in Hambleton
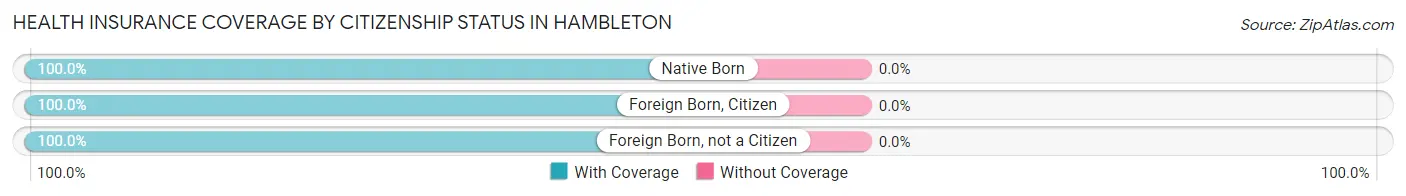
| Citizenship Status | With Coverage | Without Coverage |
| Native Born | 11 (100.0%) | 0 (0.0%) |
| Foreign Born, Citizen | 22 (100.0%) | 0 (0.0%) |
| Foreign Born, not a Citizen | 10 (100.0%) | 0 (0.0%) |
Health Insurance Coverage by Household Income in Hambleton
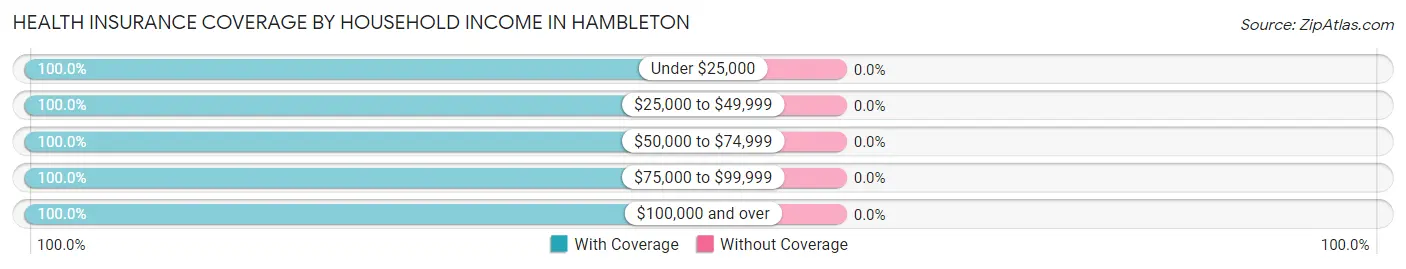
| Household Income | With Coverage | Without Coverage |
| Under $25,000 | 14 (100.0%) | 0 (0.0%) |
| $25,000 to $49,999 | 53 (100.0%) | 0 (0.0%) |
| $50,000 to $74,999 | 78 (100.0%) | 0 (0.0%) |
| $75,000 to $99,999 | 22 (100.0%) | 0 (0.0%) |
| $100,000 and over | 36 (100.0%) | 0 (0.0%) |
Public vs Private Health Insurance Coverage by Age in Hambleton
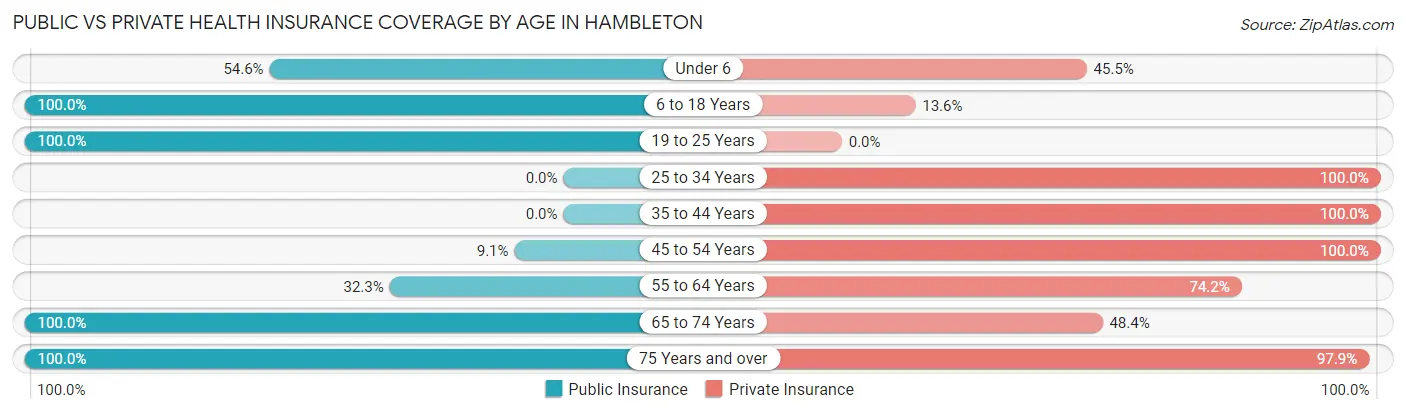
| Age Bracket | Public Insurance | Private Insurance |
| Under 6 | 6 (54.5%) | 5 (45.5%) |
| 6 to 18 Years | 22 (100.0%) | 3 (13.6%) |
| 19 to 25 Years | 10 (100.0%) | 0 (0.0%) |
| 25 to 34 Years | 0 (0.0%) | 6 (100.0%) |
| 35 to 44 Years | 0 (0.0%) | 23 (100.0%) |
| 45 to 54 Years | 2 (9.1%) | 22 (100.0%) |
| 55 to 64 Years | 10 (32.3%) | 23 (74.2%) |
| 65 to 74 Years | 31 (100.0%) | 15 (48.4%) |
| 75 Years and over | 47 (100.0%) | 46 (97.9%) |
| Total | 128 (63.0%) | 143 (70.4%) |
Disability Status by Sex by Age in Hambleton
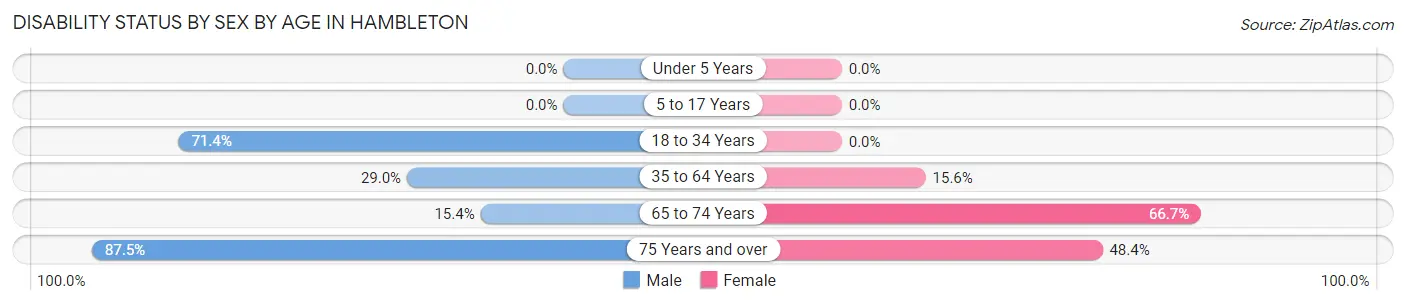
| Age Bracket | Male | Female |
| Under 5 Years | 0 (0.0%) | 0 (0.0%) |
| 5 to 17 Years | 0 (0.0%) | 0 (0.0%) |
| 18 to 34 Years | 10 (71.4%) | 0 (0.0%) |
| 35 to 64 Years | 9 (29.0%) | 7 (15.6%) |
| 65 to 74 Years | 2 (15.4%) | 12 (66.7%) |
| 75 Years and over | 14 (87.5%) | 15 (48.4%) |
Disability Class by Sex by Age in Hambleton
Disability Class: Hearing Difficulty
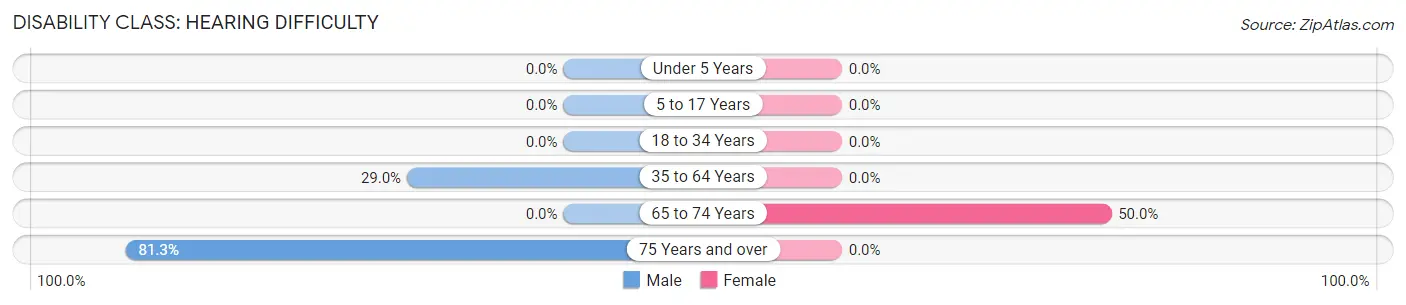
| Age Bracket | Male | Female |
| Under 5 Years | 0 (0.0%) | 0 (0.0%) |
| 5 to 17 Years | 0 (0.0%) | 0 (0.0%) |
| 18 to 34 Years | 0 (0.0%) | 0 (0.0%) |
| 35 to 64 Years | 9 (29.0%) | 0 (0.0%) |
| 65 to 74 Years | 0 (0.0%) | 9 (50.0%) |
| 75 Years and over | 13 (81.2%) | 0 (0.0%) |
Disability Class: Vision Difficulty
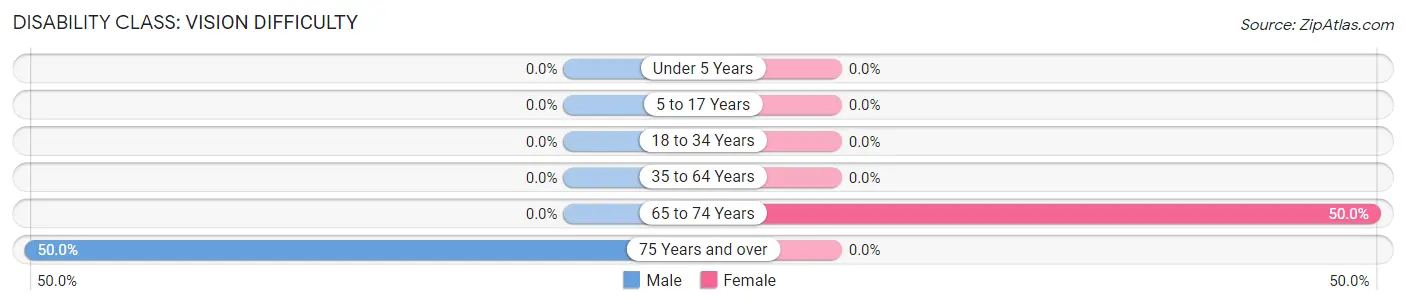
| Age Bracket | Male | Female |
| Under 5 Years | 0 (0.0%) | 0 (0.0%) |
| 5 to 17 Years | 0 (0.0%) | 0 (0.0%) |
| 18 to 34 Years | 0 (0.0%) | 0 (0.0%) |
| 35 to 64 Years | 0 (0.0%) | 0 (0.0%) |
| 65 to 74 Years | 0 (0.0%) | 9 (50.0%) |
| 75 Years and over | 8 (50.0%) | 0 (0.0%) |
Disability Class: Cognitive Difficulty
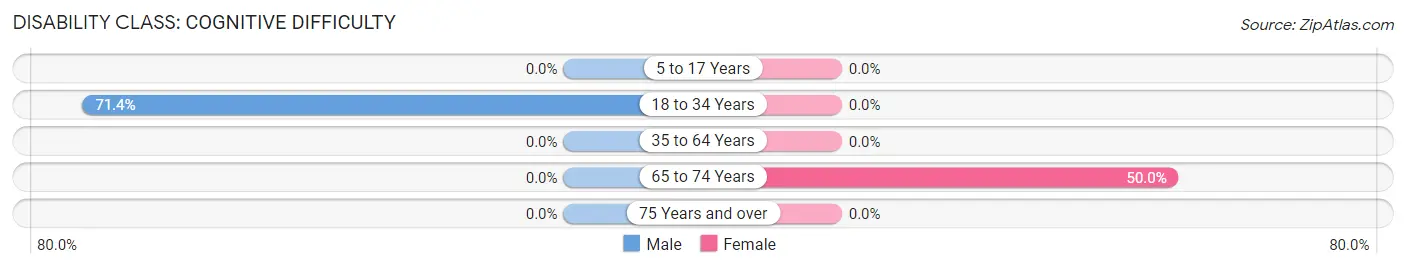
| Age Bracket | Male | Female |
| 5 to 17 Years | 0 (0.0%) | 0 (0.0%) |
| 18 to 34 Years | 10 (71.4%) | 0 (0.0%) |
| 35 to 64 Years | 0 (0.0%) | 0 (0.0%) |
| 65 to 74 Years | 0 (0.0%) | 9 (50.0%) |
| 75 Years and over | 0 (0.0%) | 0 (0.0%) |
Disability Class: Ambulatory Difficulty
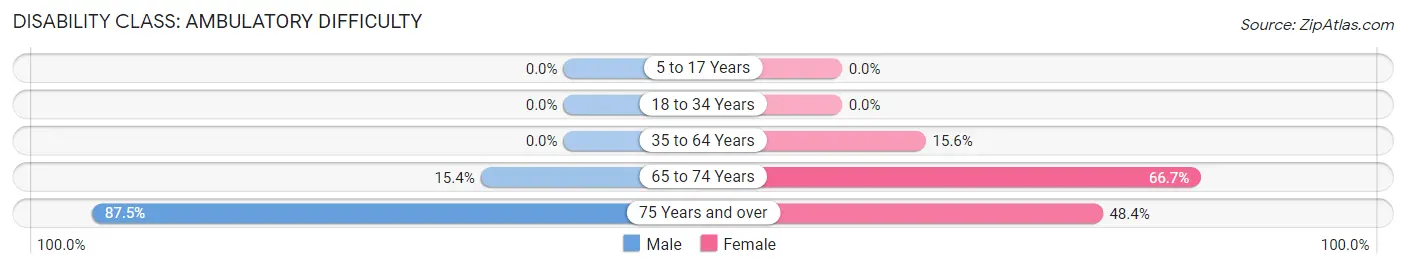
| Age Bracket | Male | Female |
| 5 to 17 Years | 0 (0.0%) | 0 (0.0%) |
| 18 to 34 Years | 0 (0.0%) | 0 (0.0%) |
| 35 to 64 Years | 0 (0.0%) | 7 (15.6%) |
| 65 to 74 Years | 2 (15.4%) | 12 (66.7%) |
| 75 Years and over | 14 (87.5%) | 15 (48.4%) |
Disability Class: Self-Care Difficulty
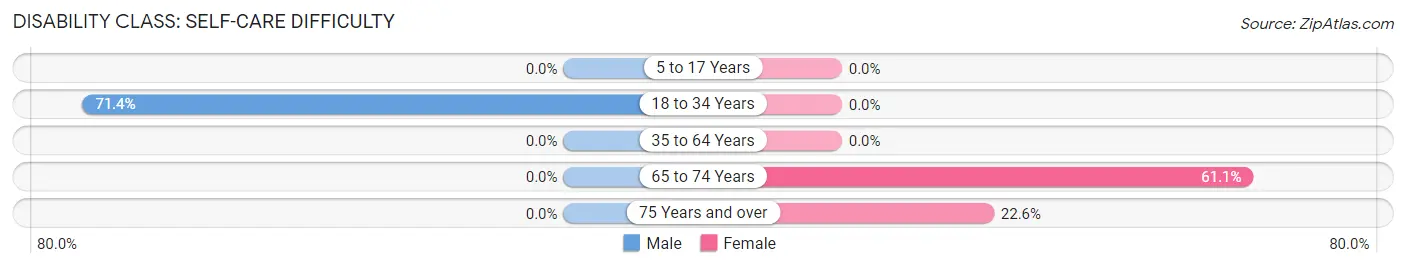
| Age Bracket | Male | Female |
| 5 to 17 Years | 0 (0.0%) | 0 (0.0%) |
| 18 to 34 Years | 10 (71.4%) | 0 (0.0%) |
| 35 to 64 Years | 0 (0.0%) | 0 (0.0%) |
| 65 to 74 Years | 0 (0.0%) | 11 (61.1%) |
| 75 Years and over | 0 (0.0%) | 7 (22.6%) |
Technology Access in Hambleton
Computing Device Access in Hambleton
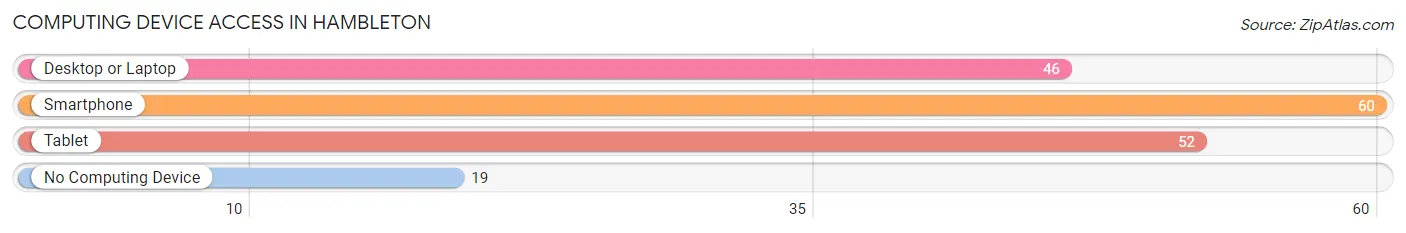
| Device Type | # Households | % Households |
| Desktop or Laptop | 46 | 53.5% |
| Smartphone | 60 | 69.8% |
| Tablet | 52 | 60.5% |
| No Computing Device | 19 | 22.1% |
| Total | 86 | 100.0% |
Internet Access in Hambleton
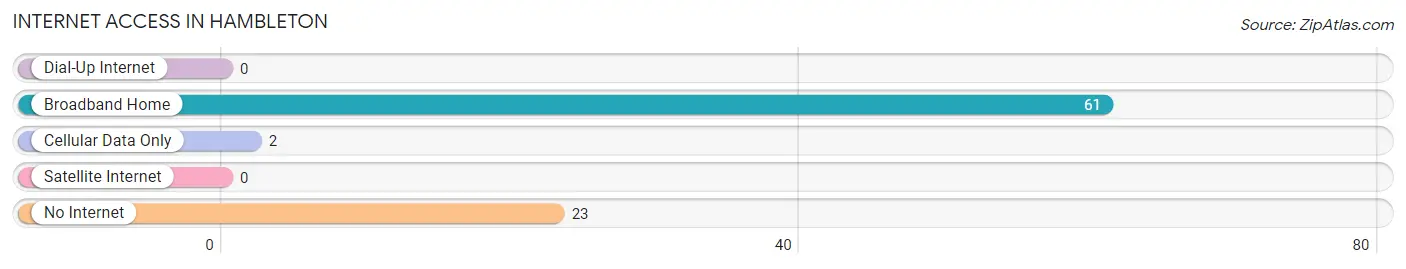
| Internet Type | # Households | % Households |
| Dial-Up Internet | 0 | 0.0% |
| Broadband Home | 61 | 70.9% |
| Cellular Data Only | 2 | 2.3% |
| Satellite Internet | 0 | 0.0% |
| No Internet | 23 | 26.7% |
| Total | 86 | 100.0% |
Hambleton Summary
Hambleton is a small unincorporated community located in Tucker County, West Virginia. It is situated in the Appalachian Mountains, approximately two miles south of the Maryland border. The community is located along the North Fork of the Potomac River, and is surrounded by the Monongahela National Forest.
History
Hambleton was first settled in the late 1700s by a group of German immigrants. The community was originally known as “Hammerschmidt”, after the family who founded it. The name was later changed to “Hambleton”, after the nearby hamlet of Hambleton, Maryland.
The community was primarily an agricultural settlement, with the majority of the population engaged in farming and logging. In the late 1800s, the community began to develop a small coal mining industry. This industry was short-lived, however, and by the early 1900s, the majority of the population had returned to farming and logging.
Geography
Hambleton is located in the Appalachian Mountains of West Virginia. It is situated in the North Fork of the Potomac River Valley, approximately two miles south of the Maryland border. The community is surrounded by the Monongahela National Forest, and is located at an elevation of 2,400 feet.
The climate in Hambleton is classified as humid continental, with cold winters and warm summers. The average annual temperature is approximately 50 degrees Fahrenheit, and the average annual precipitation is approximately 40 inches.
Economy
The economy of Hambleton is primarily based on tourism and agriculture. The community is home to several small businesses, including a general store, a gas station, and a restaurant. The community also has a small logging industry, and is home to several small farms.
Demographics
As of the 2010 census, the population of Hambleton was approximately 200 people. The racial makeup of the community was 97.5% White, 0.5% African American, 0.5% Native American, and 1.5% from other races. The median household income was $30,000, and the median family income was $35,000.
Conclusion
Hambleton is a small unincorporated community located in Tucker County, West Virginia. It is situated in the Appalachian Mountains, approximately two miles south of the Maryland border. The community is located along the North Fork of the Potomac River, and is surrounded by the Monongahela National Forest. The economy of Hambleton is primarily based on tourism and agriculture, and the population of the community is approximately 200 people.
Common Questions
What is Per Capita Income in Hambleton?
Per Capita income in Hambleton is $24,336.
What is the Median Family Income in Hambleton?
Median Family Income in Hambleton is $60,278.
What is the Median Household income in Hambleton?
Median Household Income in Hambleton is $43,125.
What is Income or Wage Gap in Hambleton?
Income or Wage Gap in Hambleton is 37.6%.
Women in Hambleton earn 62.4 cents for every dollar earned by a man.
What is Inequality or Gini Index in Hambleton?
Inequality or Gini Index in Hambleton is 0.28.
What is the Total Population of Hambleton?
Total Population of Hambleton is 203.
What is the Total Male Population of Hambleton?
Total Male Population of Hambleton is 89.
What is the Total Female Population of Hambleton?
Total Female Population of Hambleton is 114.
What is the Ratio of Males per 100 Females in Hambleton?
There are 78.07 Males per 100 Females in Hambleton.
What is the Ratio of Females per 100 Males in Hambleton?
There are 128.09 Females per 100 Males in Hambleton.
What is the Median Population Age in Hambleton?
Median Population Age in Hambleton is 55.6 Years.
What is the Average Family Size in Hambleton
Average Family Size in Hambleton is 3.0 People.
What is the Average Household Size in Hambleton
Average Household Size in Hambleton is 2.4 People.
How Large is the Labor Force in Hambleton?
There are 66 People in the Labor Forcein in Hambleton.
What is the Percentage of People in the Labor Force in Hambleton?
38.2% of People are in the Labor Force in Hambleton.