Green Bank, WV Map & Demographics
Green Bank Map
Green Bank Overview
$68,742
PER CAPITA INCOME
$55,179
AVG FAMILY INCOME
0.49
INEQUALITY / GINI INDEX
59
TOTAL POPULATION
22
MALE POPULATION
37
FEMALE POPULATION
59.46
MALES / 100 FEMALES
168.18
FEMALES / 100 MALES
58.4
MEDIAN AGE
2.9
AVG FAMILY SIZE
1.9
AVG HOUSEHOLD SIZE
32
LABOR FORCE [ PEOPLE ]
68.1%
PERCENT IN LABOR FORCE
Green Bank Zip Codes
Green Bank Area Codes
Income in Green Bank
Income Overview in Green Bank
| Characteristic | Number | Measure |
| Per Capita Income | 59 | $68,742 |
| Median Family Income | 15 | $55,179 |
| Mean Family Income | 15 | $50,653 |
| Median Household Income | 31 | $0 |
| Mean Household Income | 31 | $126,581 |
| Income Deficit | 15 | $0 |
| Wage / Income Gap (%) | 59 | 0.00% |
| Wage / Income Gap ($) | 59 | 100.00¢ per $1 |
| Gini / Inequality Index | 59 | 0.49 |
Earnings by Sex in Green Bank
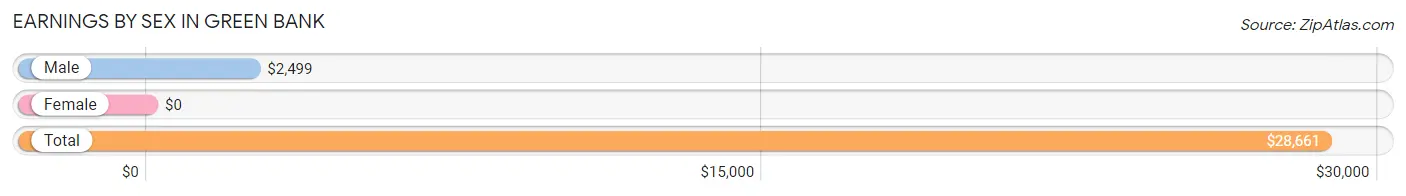
| Sex | Number | Average Earnings |
| Male | 22 (56.4%) | $2,499 |
| Female | 17 (43.6%) | $0 |
| Total | 39 (100.0%) | $28,661 |
Earnings by Sex by Income Bracket in Green Bank
The most common earnings brackets in Green Bank are $2,499 or less for men (13 | 59.1%) and $40,000 to $44,999 for women (10 | 58.8%).
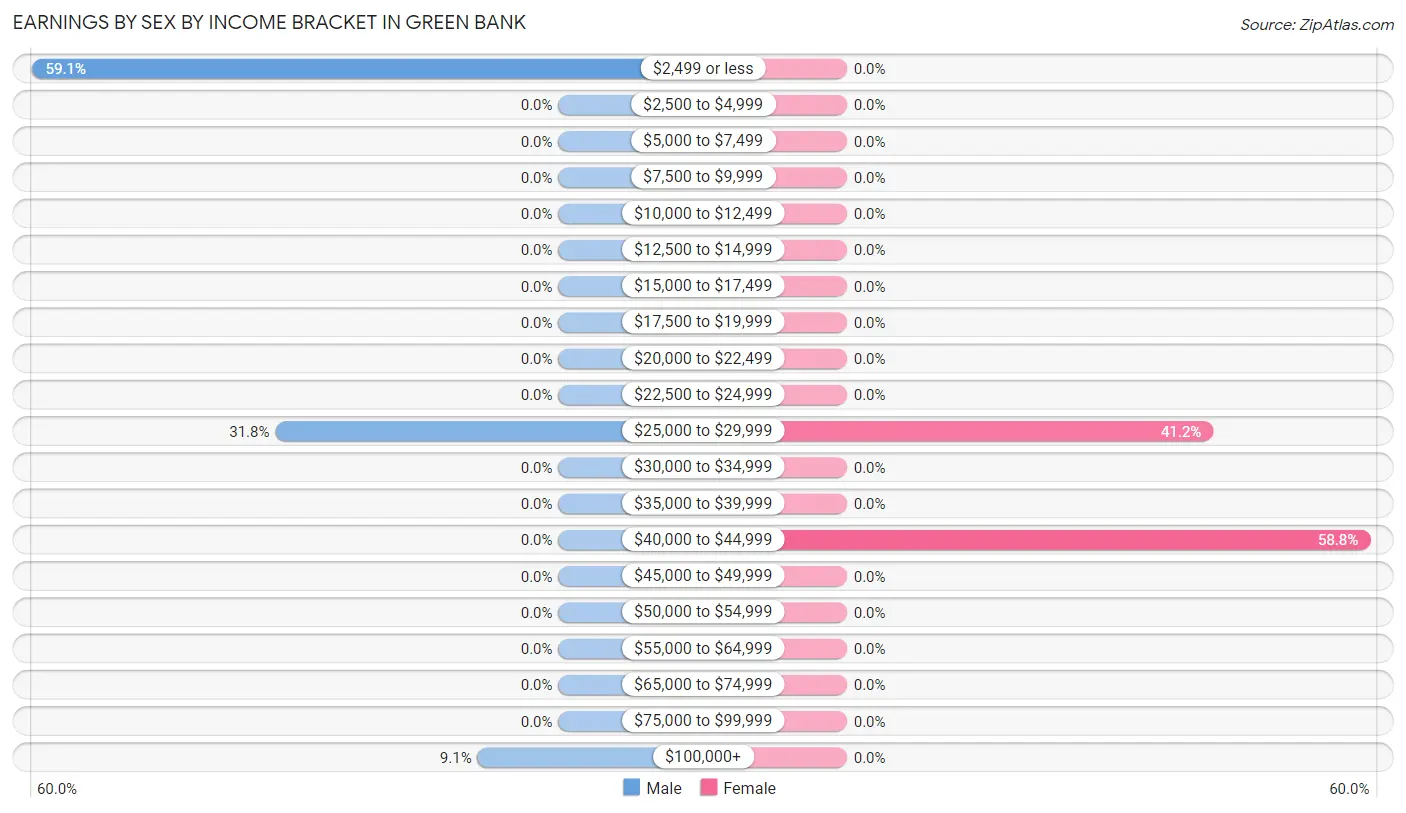
| Income | Male | Female |
| $2,499 or less | 13 (59.1%) | 0 (0.0%) |
| $2,500 to $4,999 | 0 (0.0%) | 0 (0.0%) |
| $5,000 to $7,499 | 0 (0.0%) | 0 (0.0%) |
| $7,500 to $9,999 | 0 (0.0%) | 0 (0.0%) |
| $10,000 to $12,499 | 0 (0.0%) | 0 (0.0%) |
| $12,500 to $14,999 | 0 (0.0%) | 0 (0.0%) |
| $15,000 to $17,499 | 0 (0.0%) | 0 (0.0%) |
| $17,500 to $19,999 | 0 (0.0%) | 0 (0.0%) |
| $20,000 to $22,499 | 0 (0.0%) | 0 (0.0%) |
| $22,500 to $24,999 | 0 (0.0%) | 0 (0.0%) |
| $25,000 to $29,999 | 7 (31.8%) | 7 (41.2%) |
| $30,000 to $34,999 | 0 (0.0%) | 0 (0.0%) |
| $35,000 to $39,999 | 0 (0.0%) | 0 (0.0%) |
| $40,000 to $44,999 | 0 (0.0%) | 10 (58.8%) |
| $45,000 to $49,999 | 0 (0.0%) | 0 (0.0%) |
| $50,000 to $54,999 | 0 (0.0%) | 0 (0.0%) |
| $55,000 to $64,999 | 0 (0.0%) | 0 (0.0%) |
| $65,000 to $74,999 | 0 (0.0%) | 0 (0.0%) |
| $75,000 to $99,999 | 0 (0.0%) | 0 (0.0%) |
| $100,000+ | 2 (9.1%) | 0 (0.0%) |
| Total | 22 (100.0%) | 17 (100.0%) |
Earnings by Sex by Educational Attainment in Green Bank
| Educational Attainment | Male Income | Female Income |
| Less than High School | - | - |
| High School Diploma | - | - |
| College or Associate's Degree | - | - |
| Bachelor's Degree | - | - |
| Graduate Degree | - | - |
| Total | $2,499 | $0 |
Family Income in Green Bank
Family Income Brackets in Green Bank
According to the Green Bank family income data, there are 7 families falling into the $25,000 to $34,999 income range, which is the most common income bracket and makes up 46.7% of all families.
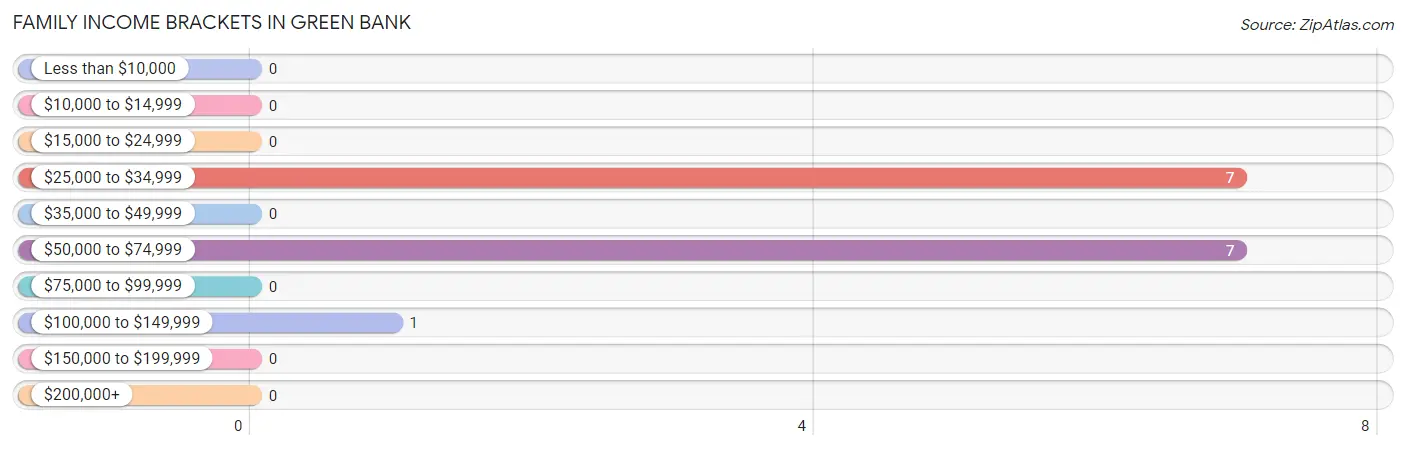
| Income Bracket | # Families | % Families |
| Less than $10,000 | 0 | 0.0% |
| $10,000 to $14,999 | 0 | 0.0% |
| $15,000 to $24,999 | 0 | 0.0% |
| $25,000 to $34,999 | 7 | 46.7% |
| $35,000 to $49,999 | 0 | 0.0% |
| $50,000 to $74,999 | 7 | 46.7% |
| $75,000 to $99,999 | 0 | 0.0% |
| $100,000 to $149,999 | 1 | 6.7% |
| $150,000 to $199,999 | 0 | 0.0% |
| $200,000+ | 0 | 0.0% |
Family Income by Famaliy Size in Green Bank

| Income Bracket | # Families | Median Income |
| 2-Person Families | 8 (53.3%) | $0 |
| 3-Person Families | 7 (46.7%) | $0 |
| 4-Person Families | 0 (0.0%) | $0 |
| 5-Person Families | 0 (0.0%) | $0 |
| 6-Person Families | 0 (0.0%) | $0 |
| 7+ Person Families | 0 (0.0%) | $0 |
| Total | 15 (100.0%) | $55,179 |
Family Income by Number of Earners in Green Bank
| Number of Earners | # Families | Median Income |
| No Earners | 0 (0.0%) | $0 |
| 1 Earner | 8 (53.3%) | $0 |
| 2 Earners | 7 (46.7%) | $0 |
| 3+ Earners | 0 (0.0%) | $0 |
| Total | 15 (100.0%) | $55,179 |
Household Income in Green Bank
Household Income Brackets in Green Bank
With 10 households falling in the category, the $200,000+ income range is the most frequent in Green Bank, accounting for 32.3% of all households.
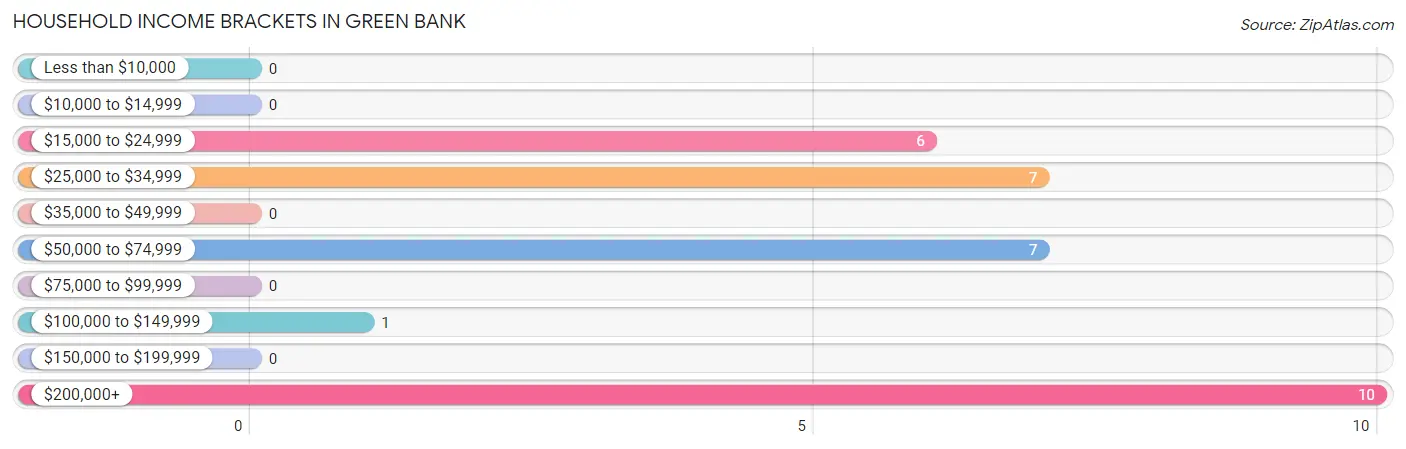
| Income Bracket | # Households | % Households |
| Less than $10,000 | 0 | 0.0% |
| $10,000 to $14,999 | 0 | 0.0% |
| $15,000 to $24,999 | 6 | 19.4% |
| $25,000 to $34,999 | 7 | 22.6% |
| $35,000 to $49,999 | 0 | 0.0% |
| $50,000 to $74,999 | 7 | 22.6% |
| $75,000 to $99,999 | 0 | 0.0% |
| $100,000 to $149,999 | 1 | 3.2% |
| $150,000 to $199,999 | 0 | 0.0% |
| $200,000+ | 10 | 32.3% |
Household Income by Householder Age in Green Bank
| Income Bracket | # Households | Median Income |
| 15 to 24 Years | 0 (0.0%) | $0 |
| 25 to 44 Years | 0 (0.0%) | $0 |
| 45 to 64 Years | 25 (80.6%) | $0 |
| 65+ Years | 6 (19.4%) | $0 |
| Total | 31 (100.0%) | $0 |
Poverty in Green Bank
Income Below Poverty by Sex and Age in Green Bank
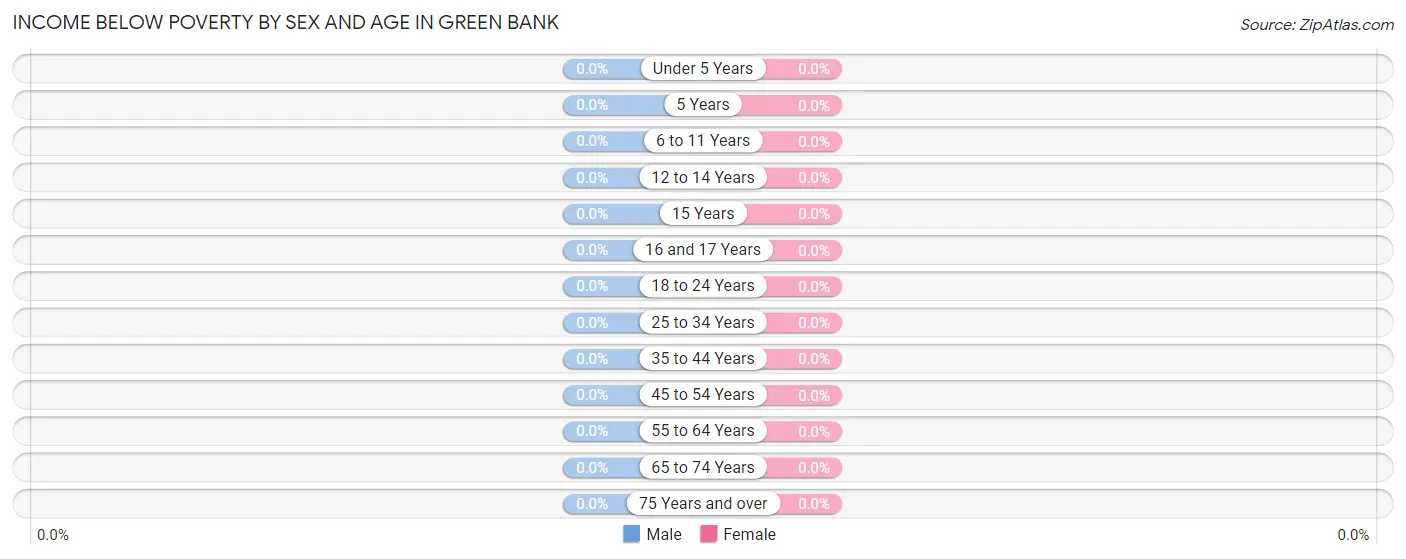
| Age Bracket | Male | Female |
| Under 5 Years | 0 (0.0%) | 0 (0.0%) |
| 5 Years | 0 (0.0%) | 0 (0.0%) |
| 6 to 11 Years | 0 (0.0%) | 0 (0.0%) |
| 12 to 14 Years | 0 (0.0%) | 0 (0.0%) |
| 15 Years | 0 (0.0%) | 0 (0.0%) |
| 16 and 17 Years | 0 (0.0%) | 0 (0.0%) |
| 18 to 24 Years | 0 (0.0%) | 0 (0.0%) |
| 25 to 34 Years | 0 (0.0%) | 0 (0.0%) |
| 35 to 44 Years | 0 (0.0%) | 0 (0.0%) |
| 45 to 54 Years | 0 (0.0%) | 0 (0.0%) |
| 55 to 64 Years | 0 (0.0%) | 0 (0.0%) |
| 65 to 74 Years | 0 (0.0%) | 0 (0.0%) |
| 75 Years and over | 0 (0.0%) | 0 (0.0%) |
| Total | 0 (0.0%) | 0 (0.0%) |
Income Above Poverty by Sex and Age in Green Bank
According to the poverty statistics in Green Bank, males aged 55 to 64 years and females aged 5 years are the age groups that are most secure financially, with 100.0% of males and 100.0% of females in these age groups living above the poverty line.
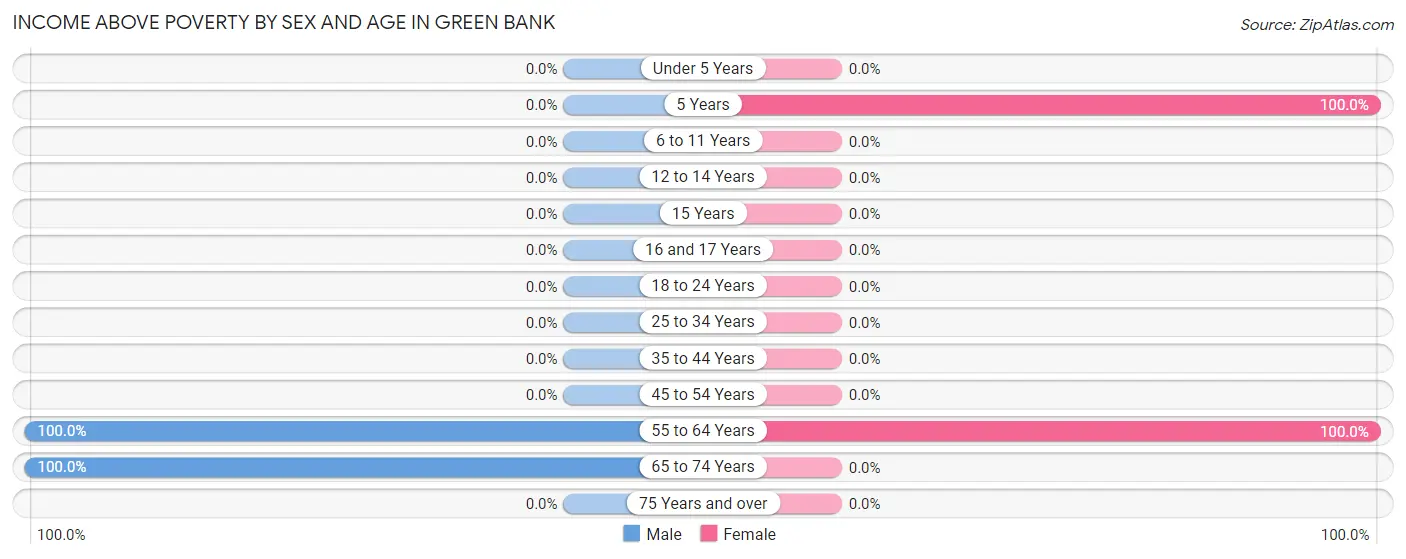
| Age Bracket | Male | Female |
| Under 5 Years | 0 (0.0%) | 0 (0.0%) |
| 5 Years | 0 (0.0%) | 12 (100.0%) |
| 6 to 11 Years | 0 (0.0%) | 0 (0.0%) |
| 12 to 14 Years | 0 (0.0%) | 0 (0.0%) |
| 15 Years | 0 (0.0%) | 0 (0.0%) |
| 16 and 17 Years | 0 (0.0%) | 0 (0.0%) |
| 18 to 24 Years | 0 (0.0%) | 0 (0.0%) |
| 25 to 34 Years | 0 (0.0%) | 0 (0.0%) |
| 35 to 44 Years | 0 (0.0%) | 0 (0.0%) |
| 45 to 54 Years | 0 (0.0%) | 0 (0.0%) |
| 55 to 64 Years | 16 (100.0%) | 25 (100.0%) |
| 65 to 74 Years | 6 (100.0%) | 0 (0.0%) |
| 75 Years and over | 0 (0.0%) | 0 (0.0%) |
| Total | 22 (100.0%) | 37 (100.0%) |
Income Below Poverty Among Married-Couple Families in Green Bank
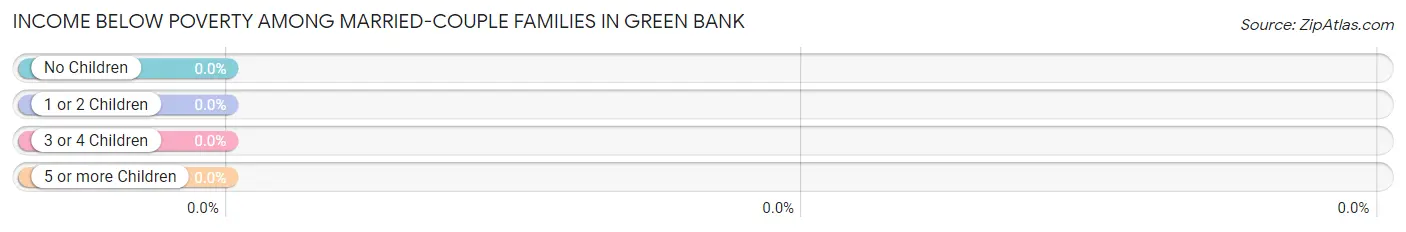
| Children | Above Poverty | Below Poverty |
| No Children | 8 (100.0%) | 0 (0.0%) |
| 1 or 2 Children | 7 (100.0%) | 0 (0.0%) |
| 3 or 4 Children | 0 (0.0%) | 0 (0.0%) |
| 5 or more Children | 0 (0.0%) | 0 (0.0%) |
| Total | 15 (100.0%) | 0 (0.0%) |
Income Below Poverty Among Single-Parent Households in Green Bank
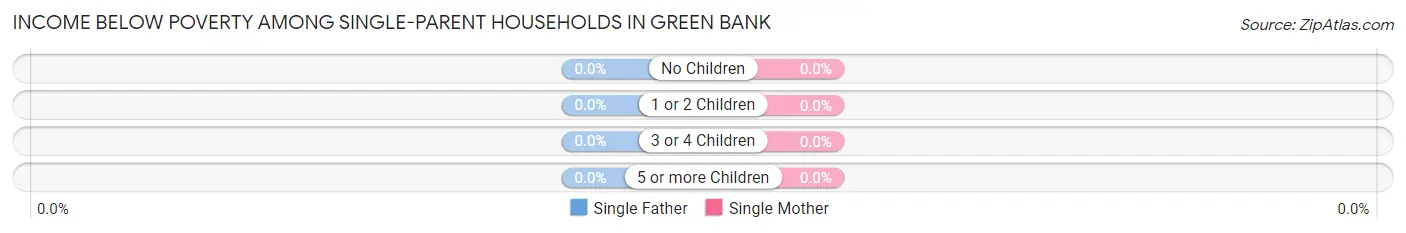
| Children | Single Father | Single Mother |
| No Children | 0 (0.0%) | 0 (0.0%) |
| 1 or 2 Children | 0 (0.0%) | 0 (0.0%) |
| 3 or 4 Children | 0 (0.0%) | 0 (0.0%) |
| 5 or more Children | 0 (0.0%) | 0 (0.0%) |
| Total | 0 (0.0%) | 0 (0.0%) |
Income Below Poverty Among Married-Couple vs Single-Parent Households in Green Bank
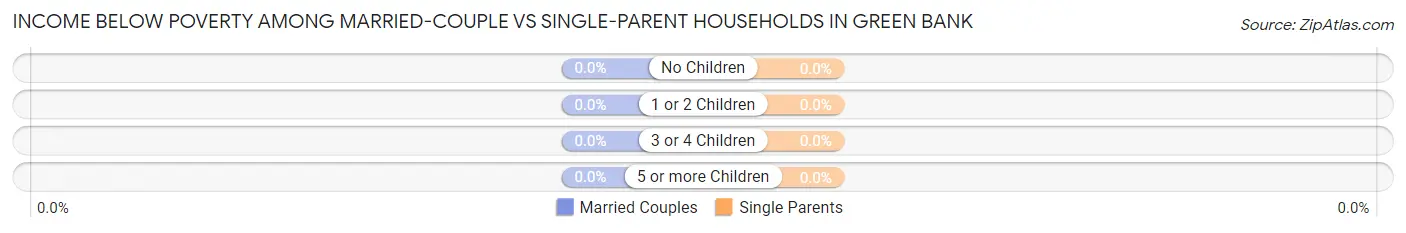
| Children | Married-Couple Families | Single-Parent Households |
| No Children | 0 (0.0%) | 0 (0.0%) |
| 1 or 2 Children | 0 (0.0%) | 0 (0.0%) |
| 3 or 4 Children | 0 (0.0%) | 0 (0.0%) |
| 5 or more Children | 0 (0.0%) | 0 (0.0%) |
| Total | 0 (0.0%) | 0 (0.0%) |
Race in Green Bank
The most populous races in Green Bank are , and White / Caucasian (59 | 100.0%).
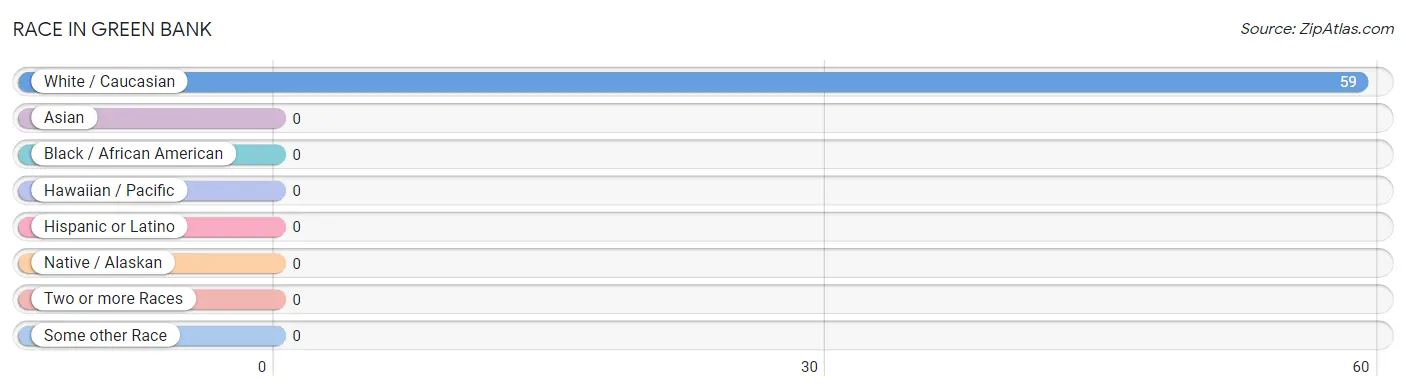
| Race | # Population | % Population |
| Asian | 0 | 0.0% |
| Black / African American | 0 | 0.0% |
| Hawaiian / Pacific | 0 | 0.0% |
| Hispanic or Latino | 0 | 0.0% |
| Native / Alaskan | 0 | 0.0% |
| White / Caucasian | 59 | 100.0% |
| Two or more Races | 0 | 0.0% |
| Some other Race | 0 | 0.0% |
| Total | 59 | 100.0% |
Ancestry in Green Bank
The most populous ancestries reported in Green Bank are American (20 | 33.9%), English (13 | 22.0%), Scotch-Irish (10 | 17.0%), Irish (2 | 3.4%), and German (1 | 1.7%), together accounting for 78.0% of all Green Bank residents.
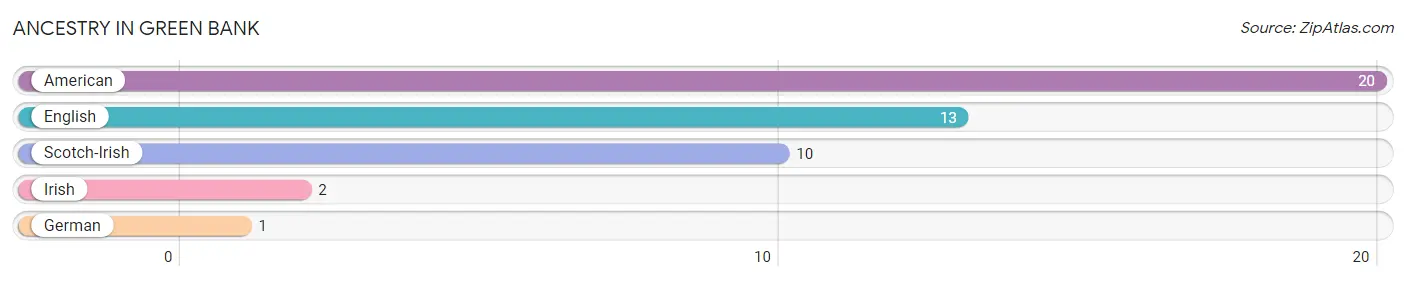
| Ancestry | # Population | % Population |
| American | 20 | 33.9% |
| English | 13 | 22.0% |
| German | 1 | 1.7% |
| Irish | 2 | 3.4% |
| Scotch-Irish | 10 | 17.0% | View All 5 Rows |
Immigrants in Green Bank

| Immigration Origin | # Population | % Population | View All 0 Rows |
Sex and Age in Green Bank
Sex and Age in Green Bank
The most populous age groups in Green Bank are 60 to 64 Years (9 | 40.9%) for men and 55 to 59 Years (17 | 46.0%) for women.
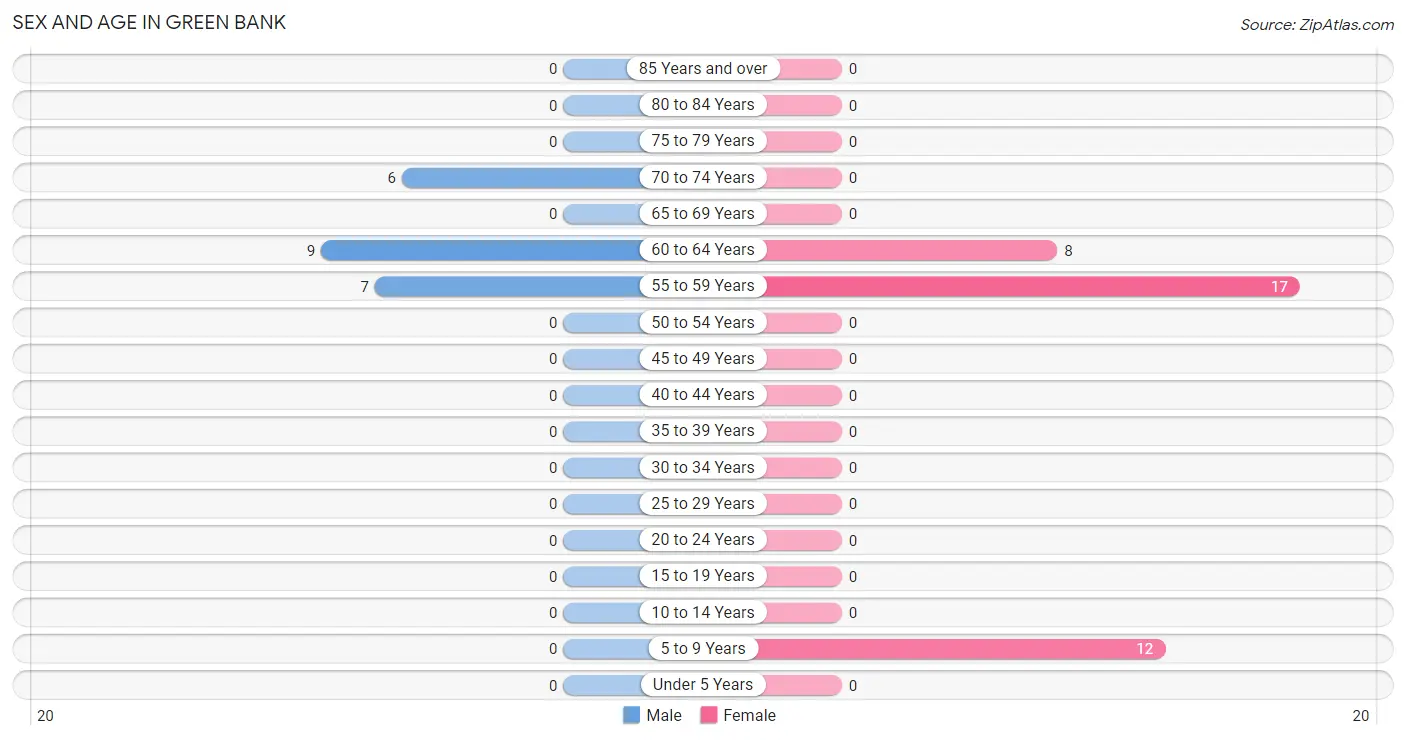
| Age Bracket | Male | Female |
| Under 5 Years | 0 (0.0%) | 0 (0.0%) |
| 5 to 9 Years | 0 (0.0%) | 12 (32.4%) |
| 10 to 14 Years | 0 (0.0%) | 0 (0.0%) |
| 15 to 19 Years | 0 (0.0%) | 0 (0.0%) |
| 20 to 24 Years | 0 (0.0%) | 0 (0.0%) |
| 25 to 29 Years | 0 (0.0%) | 0 (0.0%) |
| 30 to 34 Years | 0 (0.0%) | 0 (0.0%) |
| 35 to 39 Years | 0 (0.0%) | 0 (0.0%) |
| 40 to 44 Years | 0 (0.0%) | 0 (0.0%) |
| 45 to 49 Years | 0 (0.0%) | 0 (0.0%) |
| 50 to 54 Years | 0 (0.0%) | 0 (0.0%) |
| 55 to 59 Years | 7 (31.8%) | 17 (46.0%) |
| 60 to 64 Years | 9 (40.9%) | 8 (21.6%) |
| 65 to 69 Years | 0 (0.0%) | 0 (0.0%) |
| 70 to 74 Years | 6 (27.3%) | 0 (0.0%) |
| 75 to 79 Years | 0 (0.0%) | 0 (0.0%) |
| 80 to 84 Years | 0 (0.0%) | 0 (0.0%) |
| 85 Years and over | 0 (0.0%) | 0 (0.0%) |
| Total | 22 (100.0%) | 37 (100.0%) |
Families and Households in Green Bank
Median Family Size in Green Bank
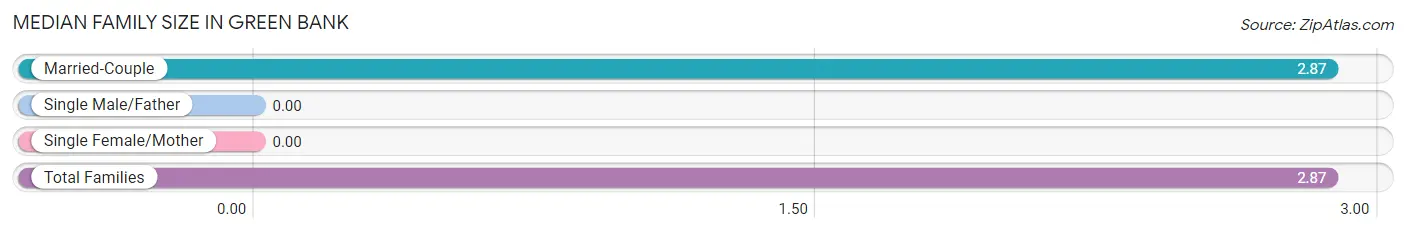
| Family Type | # Families | Family Size |
| Married-Couple | 15 (100.0%) | 2.87 |
| Single Male/Father | 0 (0.0%) | - |
| Single Female/Mother | 0 (0.0%) | - |
| Total Families | 15 (100.0%) | 2.87 |
Median Household Size in Green Bank
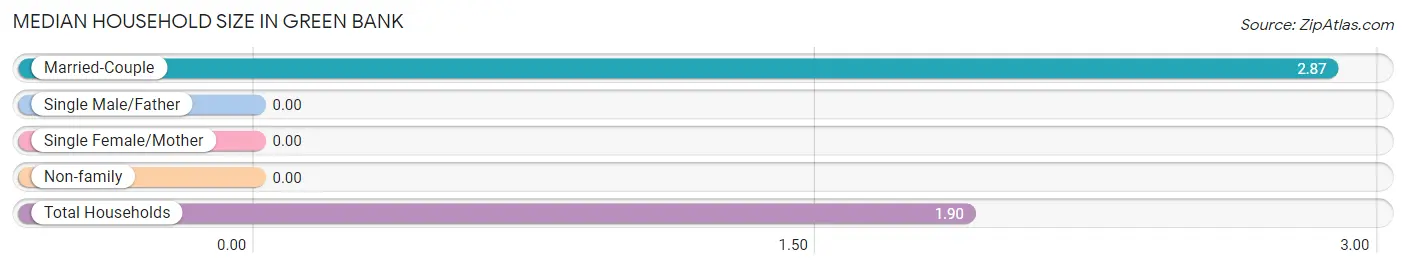
| Household Type | # Households | Household Size |
| Married-Couple | 15 (48.4%) | 2.87 |
| Single Male/Father | 0 (0.0%) | - |
| Single Female/Mother | 0 (0.0%) | - |
| Non-family | 16 (51.6%) | - |
| Total Households | 31 (100.0%) | 1.90 |
Household Size by Marriage Status in Green Bank
Out of a total of 31 households in Green Bank, 15 (48.4%) are family households, while 16 (51.6%) are nonfamily households. The most numerous type of family households are 2-person households, comprising 8, and the most common type of nonfamily households are 1-person households, comprising 16.
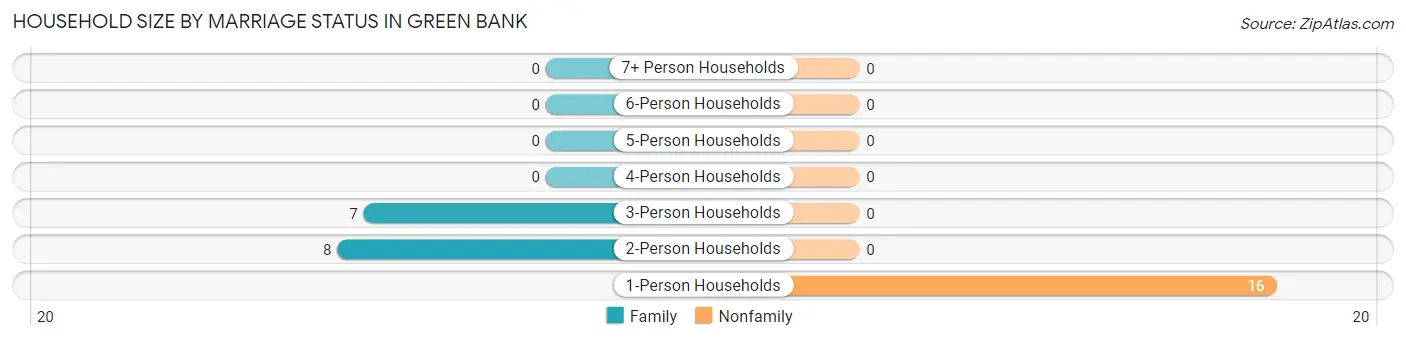
| Household Size | Family Households | Nonfamily Households |
| 1-Person Households | - | 16 (51.6%) |
| 2-Person Households | 8 (25.8%) | 0 (0.0%) |
| 3-Person Households | 7 (22.6%) | 0 (0.0%) |
| 4-Person Households | 0 (0.0%) | 0 (0.0%) |
| 5-Person Households | 0 (0.0%) | 0 (0.0%) |
| 6-Person Households | 0 (0.0%) | 0 (0.0%) |
| 7+ Person Households | 0 (0.0%) | 0 (0.0%) |
| Total | 15 (48.4%) | 16 (51.6%) |
Female Fertility in Green Bank
Fertility by Age in Green Bank
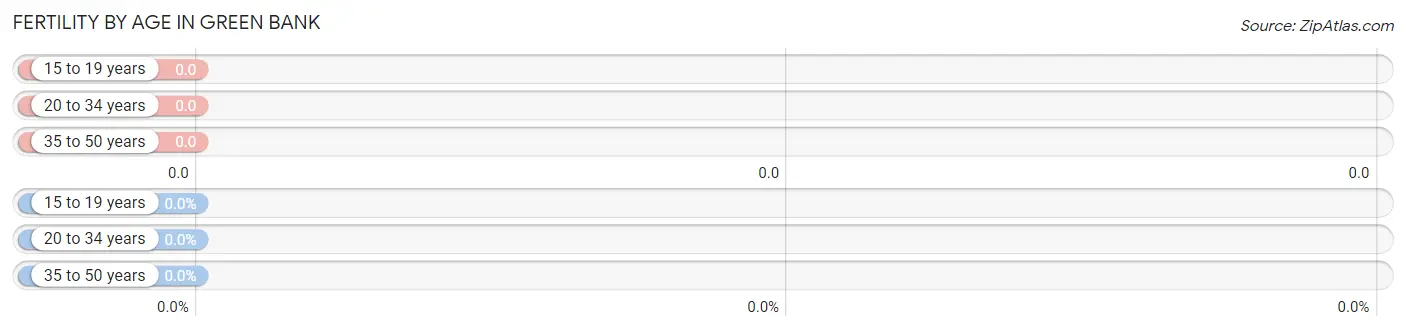
| Age Bracket | Women with Births | Births / 1,000 Women |
| 15 to 19 years | 0 (0.0%) | 0.0 |
| 20 to 34 years | 0 (0.0%) | 0.0 |
| 35 to 50 years | 0 (0.0%) | 0.0 |
| Total | 0 (0.0%) | 0.0 |
Fertility by Age by Marriage Status in Green Bank
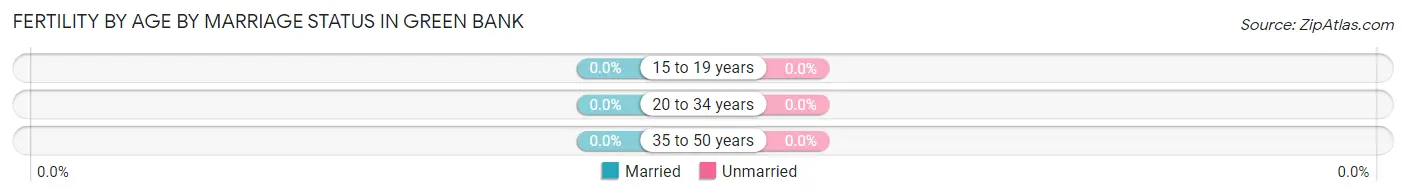
| Age Bracket | Married | Unmarried |
| 15 to 19 years | 0 (0.0%) | 0 (0.0%) |
| 20 to 34 years | 0 (0.0%) | 0 (0.0%) |
| 35 to 50 years | 0 (0.0%) | 0 (0.0%) |
| Total | 0 (0.0%) | 0 (0.0%) |
Fertility by Education in Green Bank
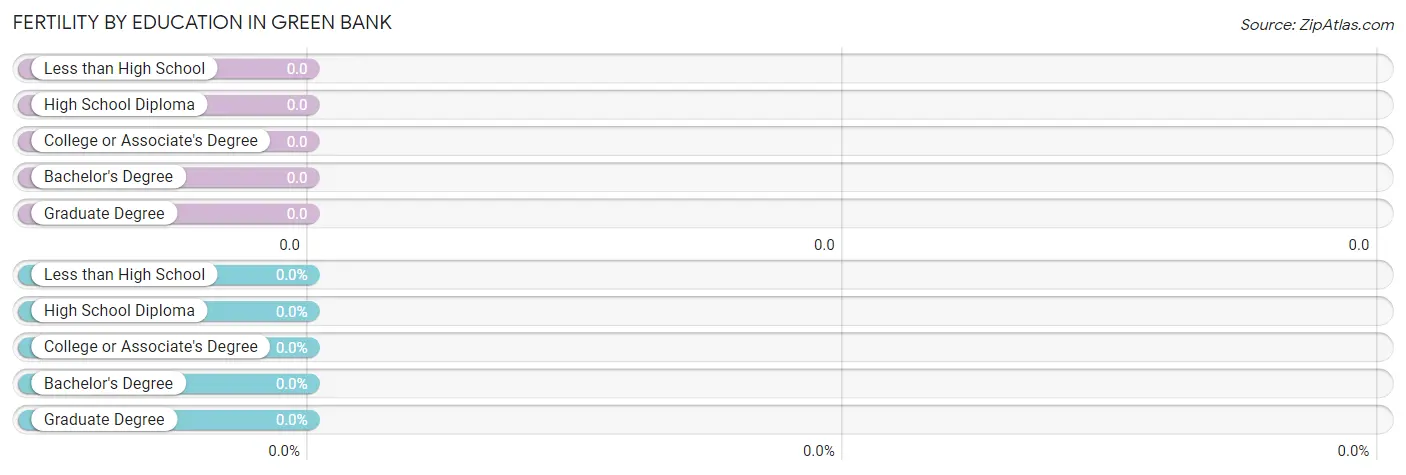
| Educational Attainment | Women with Births | Births / 1,000 Women |
| Less than High School | 0 (0.0%) | 0.0 |
| High School Diploma | 0 (0.0%) | 0.0 |
| College or Associate's Degree | 0 (0.0%) | 0.0 |
| Bachelor's Degree | 0 (0.0%) | 0.0 |
| Graduate Degree | 0 (0.0%) | 0.0 |
| Total | 0 (0.0%) | 0.0 |
Fertility by Education by Marriage Status in Green Bank
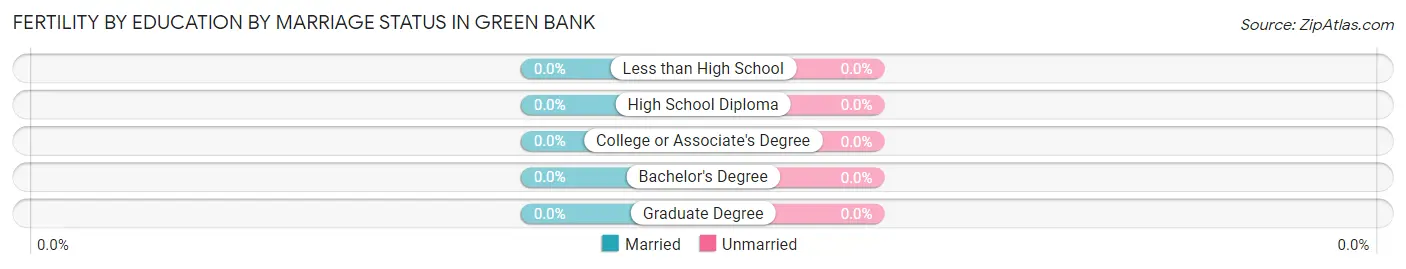
| Educational Attainment | Married | Unmarried |
| Less than High School | 0 (0.0%) | 0 (0.0%) |
| High School Diploma | 0 (0.0%) | 0 (0.0%) |
| College or Associate's Degree | 0 (0.0%) | 0 (0.0%) |
| Bachelor's Degree | 0 (0.0%) | 0 (0.0%) |
| Graduate Degree | 0 (0.0%) | 0 (0.0%) |
| Total | 0 (0.0%) | 0 (0.0%) |
Employment Characteristics in Green Bank
Employment by Class of Employer in Green Bank
Among the 32 employed individuals in Green Bank, private company employees (16 | 50.0%), federal government employees (10 | 31.2%), and state government employees (6 | 18.8%) make up the most common classes of employment.
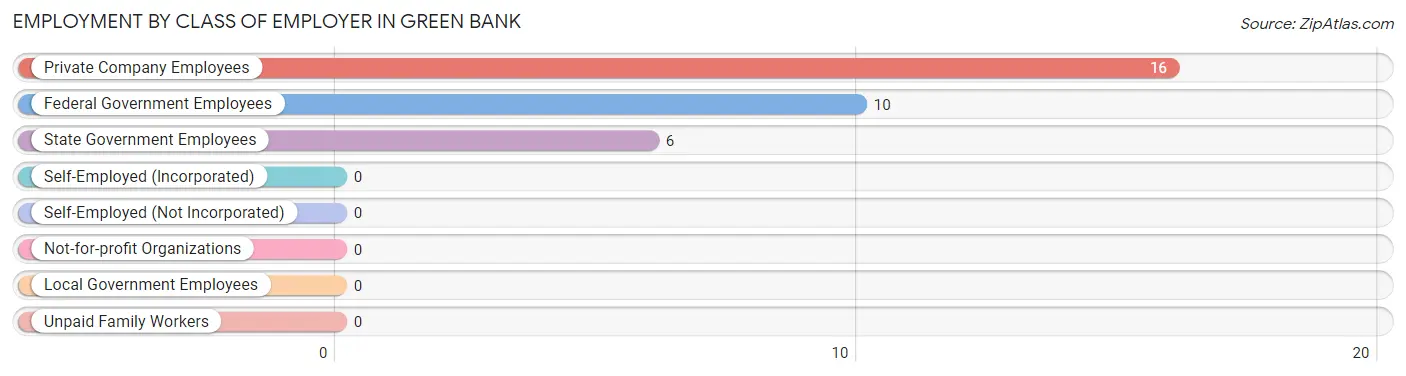
| Employer Class | # Employees | % Employees |
| Private Company Employees | 16 | 50.0% |
| Self-Employed (Incorporated) | 0 | 0.0% |
| Self-Employed (Not Incorporated) | 0 | 0.0% |
| Not-for-profit Organizations | 0 | 0.0% |
| Local Government Employees | 0 | 0.0% |
| State Government Employees | 6 | 18.8% |
| Federal Government Employees | 10 | 31.2% |
| Unpaid Family Workers | 0 | 0.0% |
| Total | 32 | 100.0% |
Employment Status by Age in Green Bank
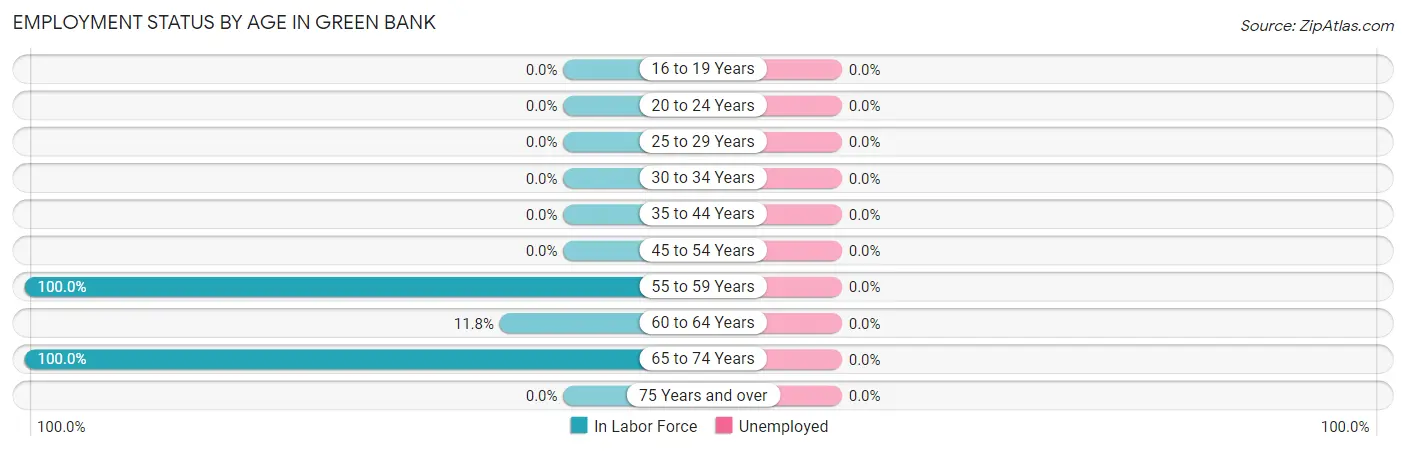
| Age Bracket | In Labor Force | Unemployed |
| 16 to 19 Years | 0 (0.0%) | 0 (0.0%) |
| 20 to 24 Years | 0 (0.0%) | 0 (0.0%) |
| 25 to 29 Years | 0 (0.0%) | 0 (0.0%) |
| 30 to 34 Years | 0 (0.0%) | 0 (0.0%) |
| 35 to 44 Years | 0 (0.0%) | 0 (0.0%) |
| 45 to 54 Years | 0 (0.0%) | 0 (0.0%) |
| 55 to 59 Years | 24 (100.0%) | 0 (0.0%) |
| 60 to 64 Years | 2 (11.8%) | 0 (0.0%) |
| 65 to 74 Years | 6 (100.0%) | 0 (0.0%) |
| 75 Years and over | 0 (0.0%) | 0 (0.0%) |
| Total | 32 (68.1%) | 0 (0.0%) |
Employment Status by Educational Attainment in Green Bank
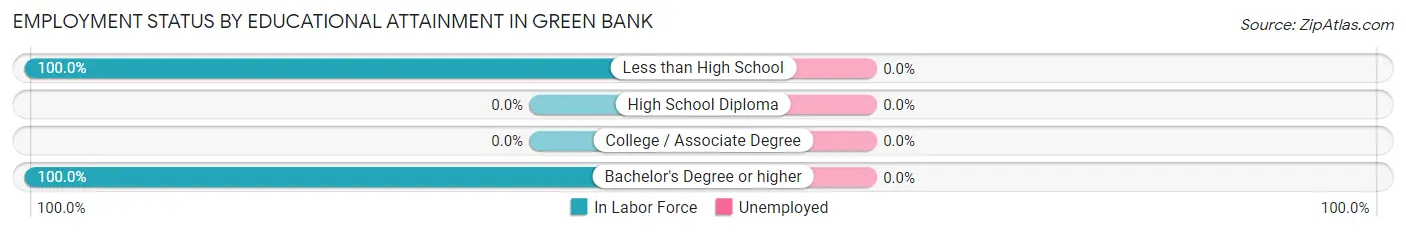
| Educational Attainment | In Labor Force | Unemployed |
| Less than High School | 14 (100.0%) | 0 (0.0%) |
| High School Diploma | 0 (0.0%) | 0 (0.0%) |
| College / Associate Degree | 0 (0.0%) | 0 (0.0%) |
| Bachelor's Degree or higher | 12 (100.0%) | 0 (0.0%) |
| Total | 26 (63.4%) | 0 (0.0%) |
Employment Occupations by Sex in Green Bank
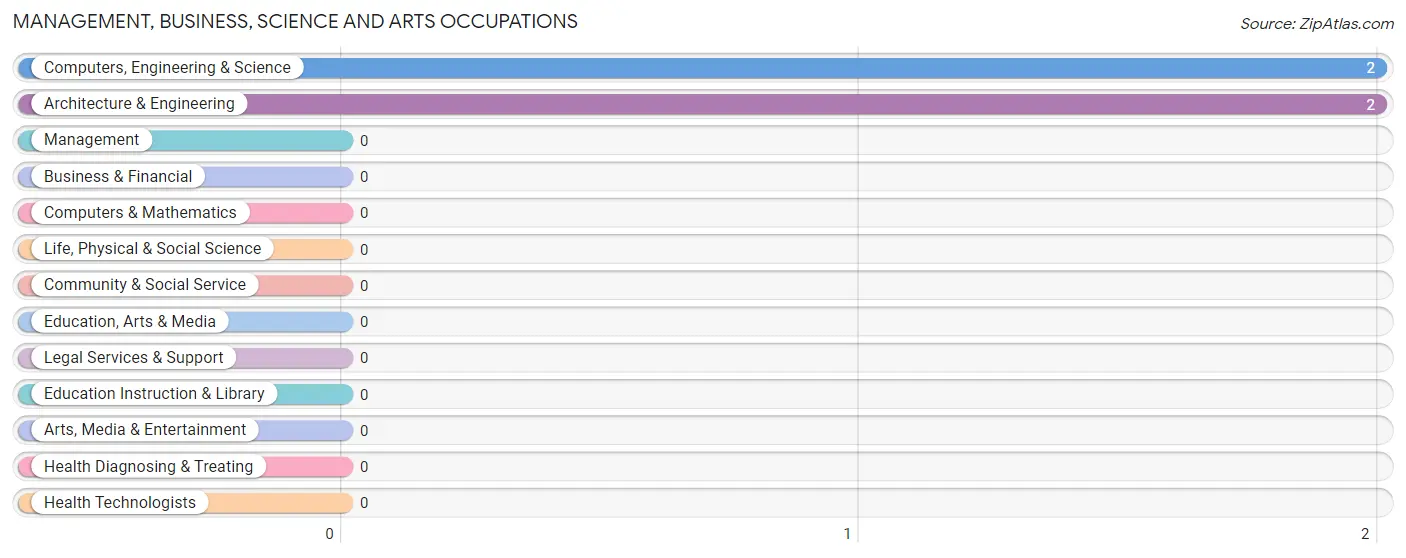
Management, Business, Science and Arts Occupations
The most common Management, Business, Science and Arts occupations in Green Bank are Computers, Engineering & Science (2 | 6.2%), and Architecture & Engineering (2 | 6.2%).
Management, Business, Science and Arts Occupations by Sex
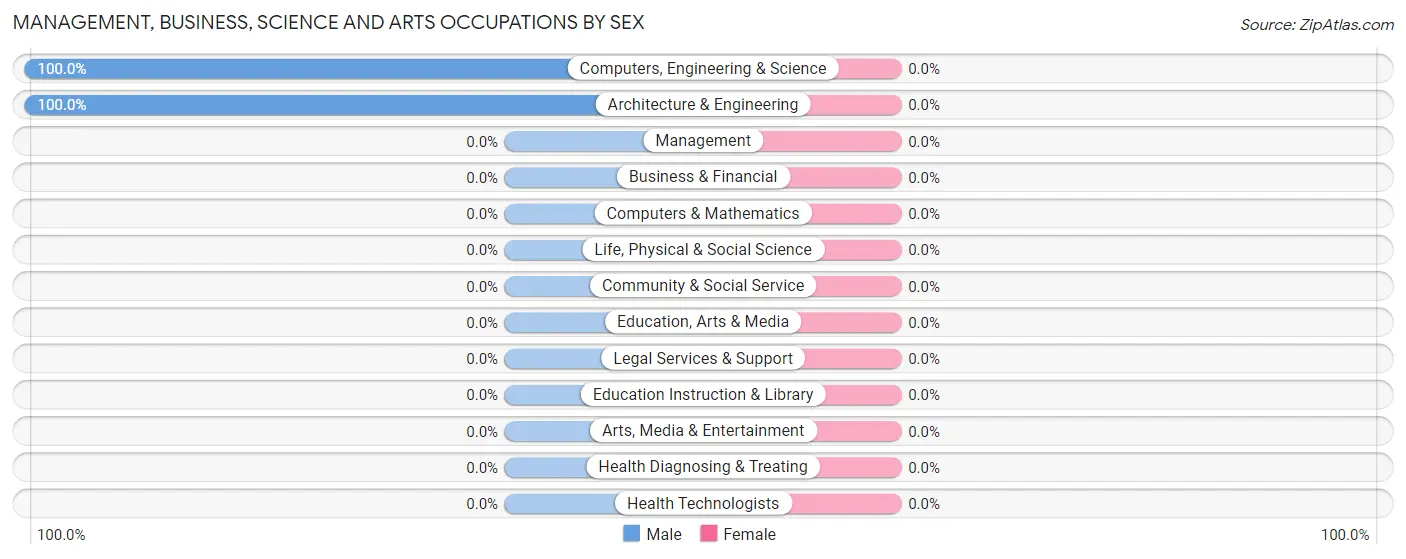
| Occupation | Male | Female |
| Management | 0 (0.0%) | 0 (0.0%) |
| Business & Financial | 0 (0.0%) | 0 (0.0%) |
| Computers, Engineering & Science | 2 (100.0%) | 0 (0.0%) |
| Computers & Mathematics | 0 (0.0%) | 0 (0.0%) |
| Architecture & Engineering | 2 (100.0%) | 0 (0.0%) |
| Life, Physical & Social Science | 0 (0.0%) | 0 (0.0%) |
| Community & Social Service | 0 (0.0%) | 0 (0.0%) |
| Education, Arts & Media | 0 (0.0%) | 0 (0.0%) |
| Legal Services & Support | 0 (0.0%) | 0 (0.0%) |
| Education Instruction & Library | 0 (0.0%) | 0 (0.0%) |
| Arts, Media & Entertainment | 0 (0.0%) | 0 (0.0%) |
| Health Diagnosing & Treating | 0 (0.0%) | 0 (0.0%) |
| Health Technologists | 0 (0.0%) | 0 (0.0%) |
| Total (Category) | 2 (100.0%) | 0 (0.0%) |
| Total (Overall) | 15 (46.9%) | 17 (53.1%) |
Services Occupations
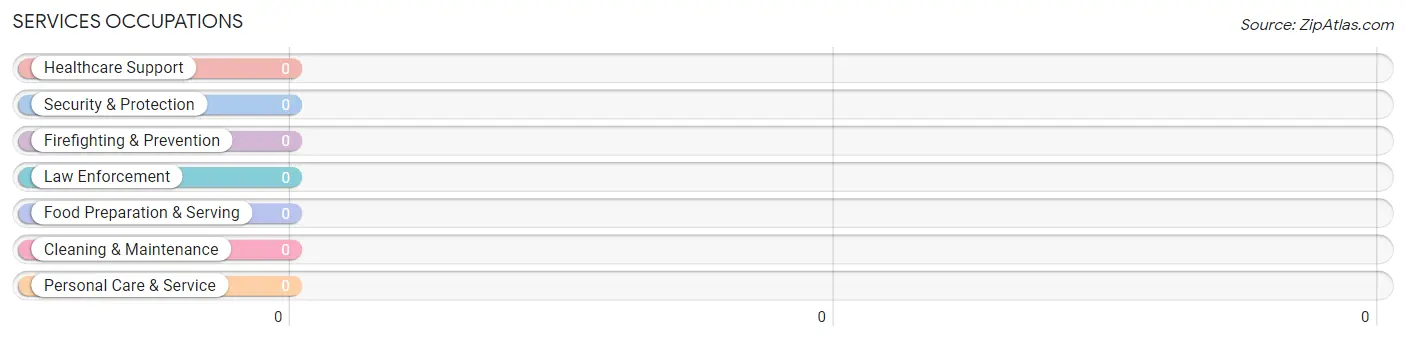
Services Occupations by Sex
| Occupation | Male | Female |
| Healthcare Support | 0 (0.0%) | 0 (0.0%) |
| Security & Protection | 0 (0.0%) | 0 (0.0%) |
| Firefighting & Prevention | 0 (0.0%) | 0 (0.0%) |
| Law Enforcement | 0 (0.0%) | 0 (0.0%) |
| Food Preparation & Serving | 0 (0.0%) | 0 (0.0%) |
| Cleaning & Maintenance | 0 (0.0%) | 0 (0.0%) |
| Personal Care & Service | 0 (0.0%) | 0 (0.0%) |
| Total (Category) | 0 (0.0%) | 0 (0.0%) |
| Total (Overall) | 15 (46.9%) | 17 (53.1%) |
Sales and Office Occupations
The most common Sales and Office occupations in Green Bank are , and Office & Administration (17 | 53.1%).
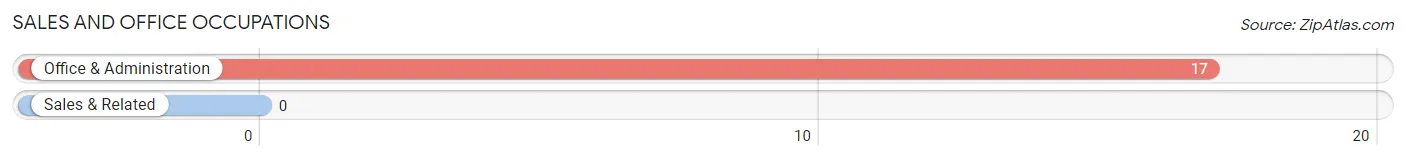
Sales and Office Occupations by Sex
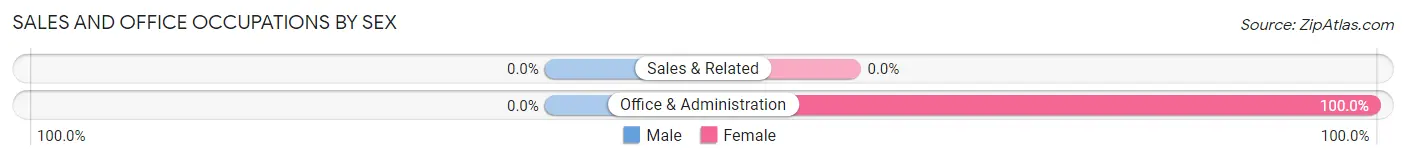
| Occupation | Male | Female |
| Sales & Related | 0 (0.0%) | 0 (0.0%) |
| Office & Administration | 0 (0.0%) | 17 (100.0%) |
| Total (Category) | 0 (0.0%) | 17 (100.0%) |
| Total (Overall) | 15 (46.9%) | 17 (53.1%) |
Natural Resources, Construction and Maintenance Occupations
The most common Natural Resources, Construction and Maintenance occupations in Green Bank are , and Farming, Fishing & Forestry (6 | 18.8%).
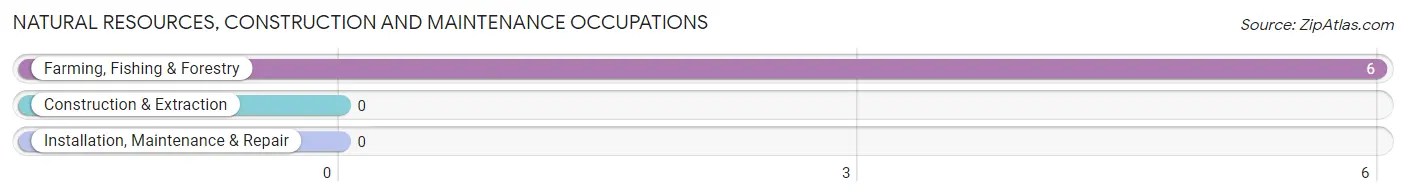
Natural Resources, Construction and Maintenance Occupations by Sex
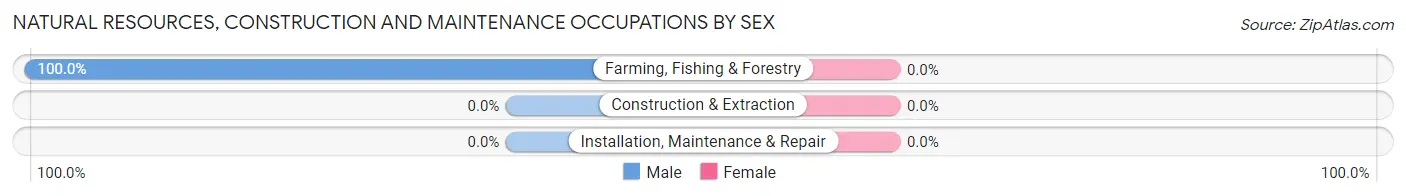
| Occupation | Male | Female |
| Farming, Fishing & Forestry | 6 (100.0%) | 0 (0.0%) |
| Construction & Extraction | 0 (0.0%) | 0 (0.0%) |
| Installation, Maintenance & Repair | 0 (0.0%) | 0 (0.0%) |
| Total (Category) | 6 (100.0%) | 0 (0.0%) |
| Total (Overall) | 15 (46.9%) | 17 (53.1%) |
Production, Transportation and Moving Occupations
The most common Production, Transportation and Moving occupations in Green Bank are , and Material Moving (7 | 21.9%).
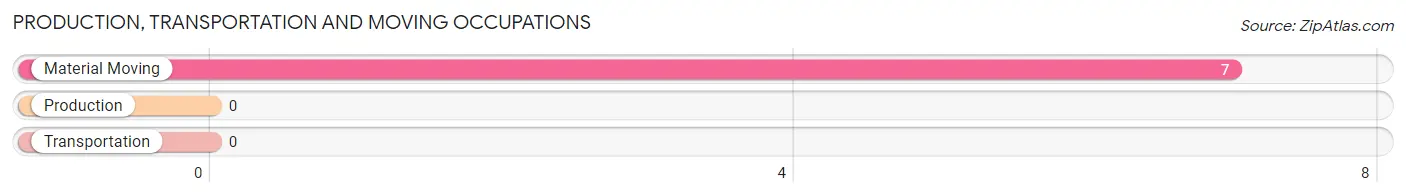
Production, Transportation and Moving Occupations by Sex
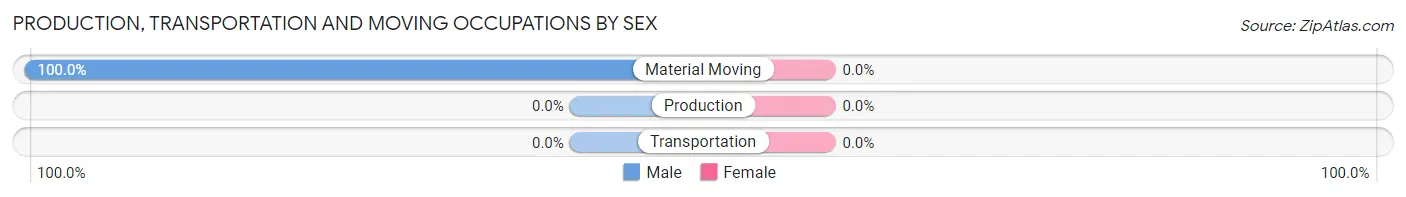
| Occupation | Male | Female |
| Production | 0 (0.0%) | 0 (0.0%) |
| Transportation | 0 (0.0%) | 0 (0.0%) |
| Material Moving | 7 (100.0%) | 0 (0.0%) |
| Total (Category) | 7 (100.0%) | 0 (0.0%) |
| Total (Overall) | 15 (46.9%) | 17 (53.1%) |
Employment Industries by Sex in Green Bank
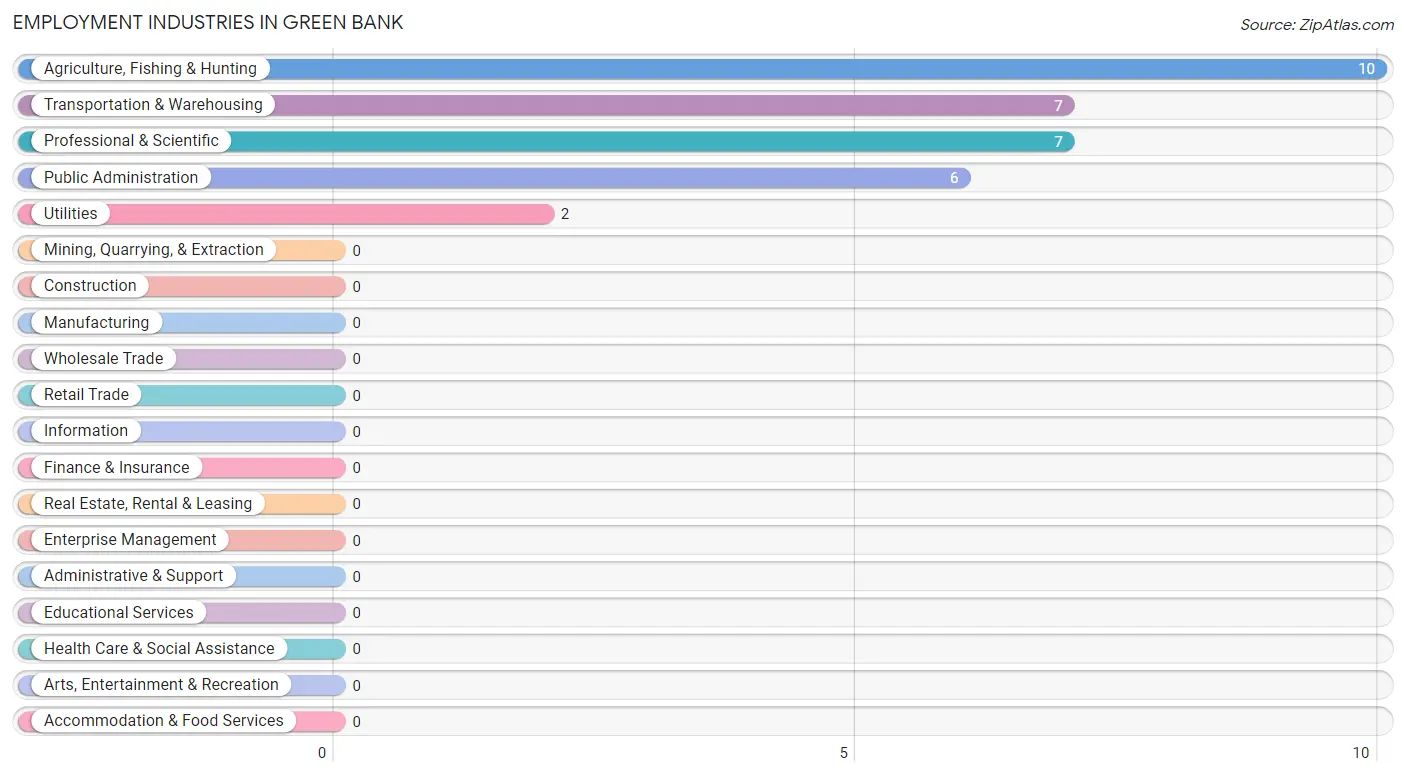
Employment Industries in Green Bank
The major employment industries in Green Bank include Agriculture, Fishing & Hunting (10 | 31.2%), Transportation & Warehousing (7 | 21.9%), Professional & Scientific (7 | 21.9%), Public Administration (6 | 18.8%), and Utilities (2 | 6.2%).
Employment Industries by Sex in Green Bank
The Green Bank industries that see more men than women are Transportation & Warehousing (100.0%), Utilities (100.0%), and Public Administration (100.0%), whereas the industries that tend to have a higher number of women are Agriculture, Fishing & Hunting (100.0%), and Professional & Scientific (100.0%).
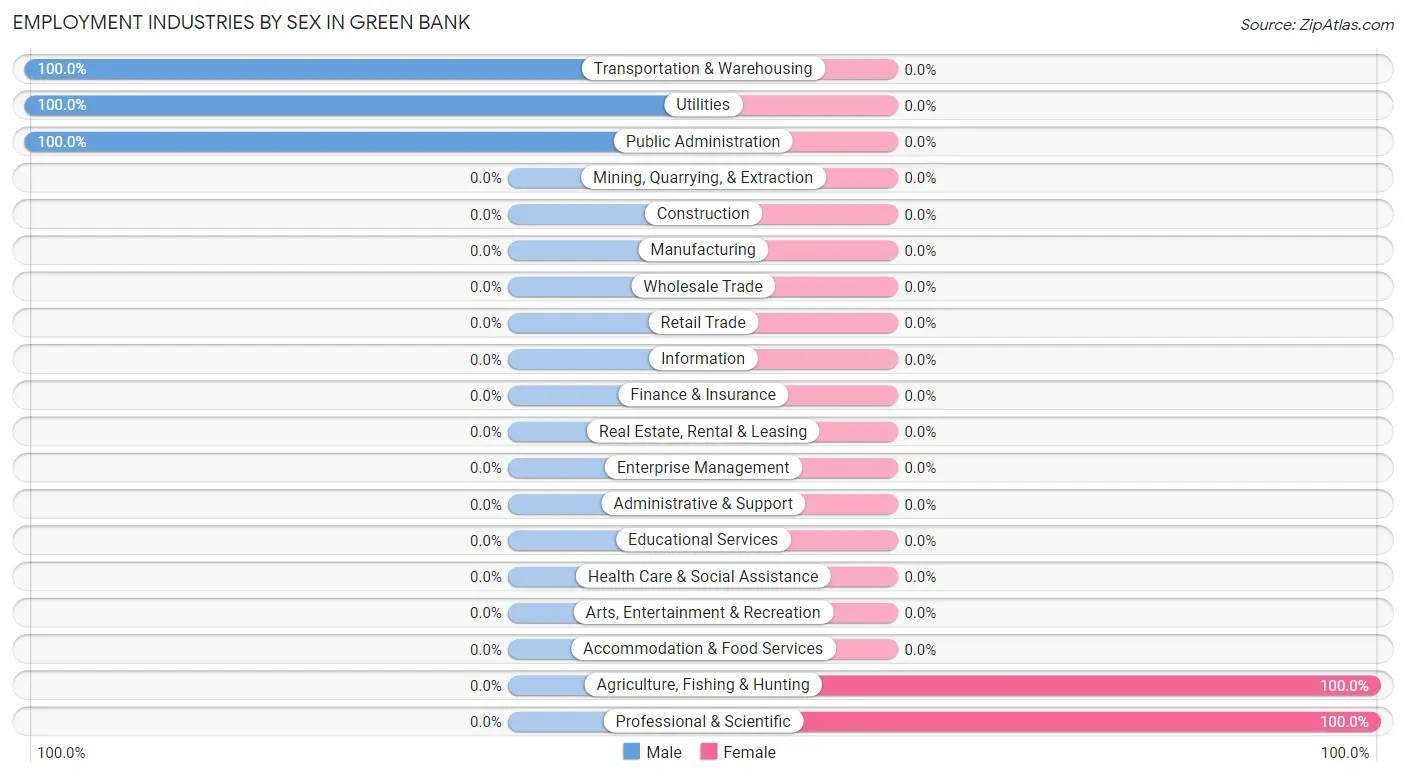
| Industry | Male | Female |
| Agriculture, Fishing & Hunting | 0 (0.0%) | 10 (100.0%) |
| Mining, Quarrying, & Extraction | 0 (0.0%) | 0 (0.0%) |
| Construction | 0 (0.0%) | 0 (0.0%) |
| Manufacturing | 0 (0.0%) | 0 (0.0%) |
| Wholesale Trade | 0 (0.0%) | 0 (0.0%) |
| Retail Trade | 0 (0.0%) | 0 (0.0%) |
| Transportation & Warehousing | 7 (100.0%) | 0 (0.0%) |
| Utilities | 2 (100.0%) | 0 (0.0%) |
| Information | 0 (0.0%) | 0 (0.0%) |
| Finance & Insurance | 0 (0.0%) | 0 (0.0%) |
| Real Estate, Rental & Leasing | 0 (0.0%) | 0 (0.0%) |
| Professional & Scientific | 0 (0.0%) | 7 (100.0%) |
| Enterprise Management | 0 (0.0%) | 0 (0.0%) |
| Administrative & Support | 0 (0.0%) | 0 (0.0%) |
| Educational Services | 0 (0.0%) | 0 (0.0%) |
| Health Care & Social Assistance | 0 (0.0%) | 0 (0.0%) |
| Arts, Entertainment & Recreation | 0 (0.0%) | 0 (0.0%) |
| Accommodation & Food Services | 0 (0.0%) | 0 (0.0%) |
| Public Administration | 6 (100.0%) | 0 (0.0%) |
| Total | 15 (46.9%) | 17 (53.1%) |
Education in Green Bank
School Enrollment in Green Bank
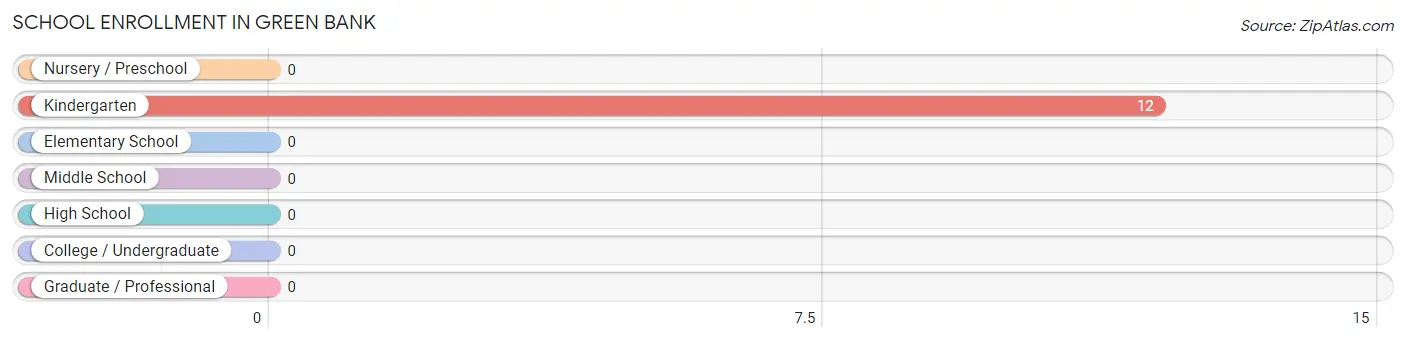
| School Level | # Students | % Students |
| Nursery / Preschool | 0 | 0.0% |
| Kindergarten | 12 | 100.0% |
| Elementary School | 0 | 0.0% |
| Middle School | 0 | 0.0% |
| High School | 0 | 0.0% |
| College / Undergraduate | 0 | 0.0% |
| Graduate / Professional | 0 | 0.0% |
| Total | 12 | 100.0% |
School Enrollment by Age by Funding Source in Green Bank
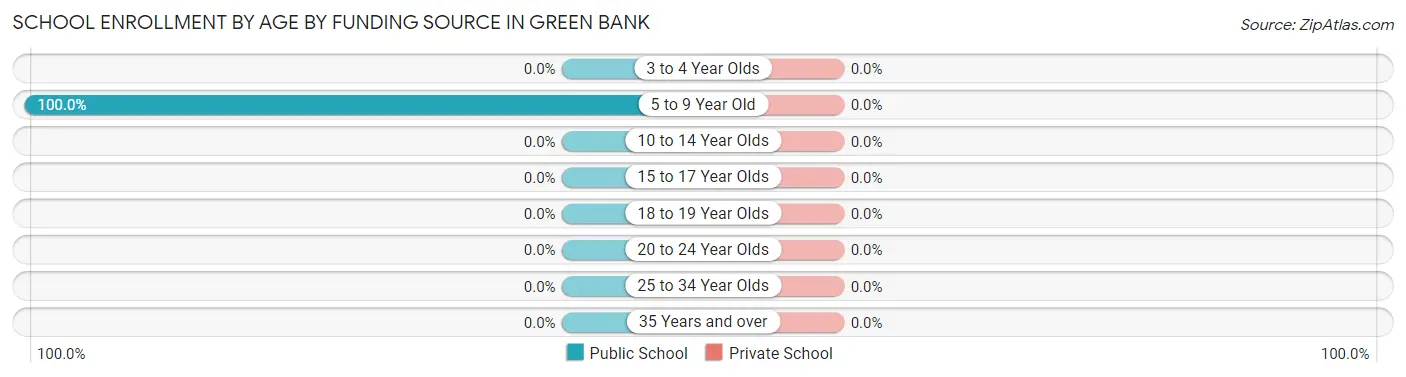
| Age Bracket | Public School | Private School |
| 3 to 4 Year Olds | 0 (0.0%) | 0 (0.0%) |
| 5 to 9 Year Old | 12 (100.0%) | 0 (0.0%) |
| 10 to 14 Year Olds | 0 (0.0%) | 0 (0.0%) |
| 15 to 17 Year Olds | 0 (0.0%) | 0 (0.0%) |
| 18 to 19 Year Olds | 0 (0.0%) | 0 (0.0%) |
| 20 to 24 Year Olds | 0 (0.0%) | 0 (0.0%) |
| 25 to 34 Year Olds | 0 (0.0%) | 0 (0.0%) |
| 35 Years and over | 0 (0.0%) | 0 (0.0%) |
| Total | 12 (100.0%) | 0 (0.0%) |
Educational Attainment by Field of Study in Green Bank
Science & technology (10 | 45.5%), education (10 | 45.5%), and engineering (2 | 9.1%) are the most common fields of study among 22 individuals in Green Bank who have obtained a bachelor's degree or higher.
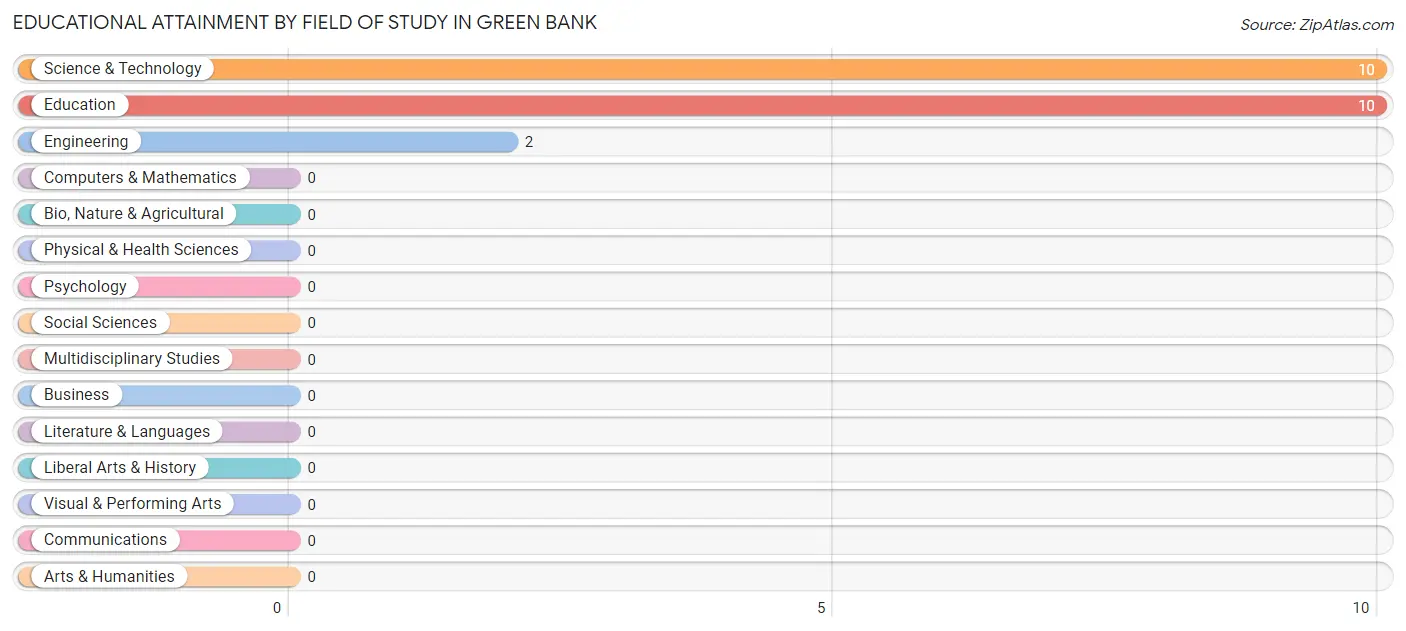
| Field of Study | # Graduates | % Graduates |
| Computers & Mathematics | 0 | 0.0% |
| Bio, Nature & Agricultural | 0 | 0.0% |
| Physical & Health Sciences | 0 | 0.0% |
| Psychology | 0 | 0.0% |
| Social Sciences | 0 | 0.0% |
| Engineering | 2 | 9.1% |
| Multidisciplinary Studies | 0 | 0.0% |
| Science & Technology | 10 | 45.5% |
| Business | 0 | 0.0% |
| Education | 10 | 45.5% |
| Literature & Languages | 0 | 0.0% |
| Liberal Arts & History | 0 | 0.0% |
| Visual & Performing Arts | 0 | 0.0% |
| Communications | 0 | 0.0% |
| Arts & Humanities | 0 | 0.0% |
| Total | 22 | 100.0% |
Transportation & Commute in Green Bank
Vehicle Availability by Sex in Green Bank
The most prevalent vehicle ownership categories in Green Bank are males with 2 vehicles (9, accounting for 60.0%) and females with 2 vehicles (17, making up 52.9%).
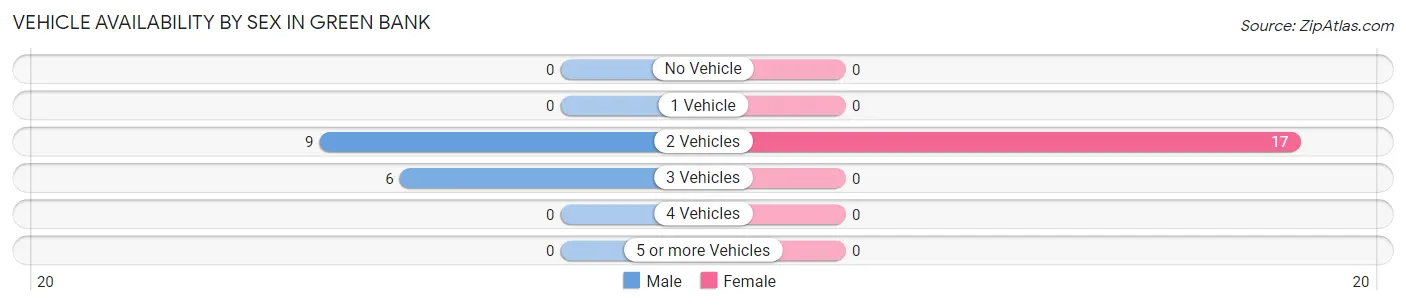
| Vehicles Available | Male | Female |
| No Vehicle | 0 (0.0%) | 0 (0.0%) |
| 1 Vehicle | 0 (0.0%) | 0 (0.0%) |
| 2 Vehicles | 9 (60.0%) | 17 (100.0%) |
| 3 Vehicles | 6 (40.0%) | 0 (0.0%) |
| 4 Vehicles | 0 (0.0%) | 0 (0.0%) |
| 5 or more Vehicles | 0 (0.0%) | 0 (0.0%) |
| Total | 15 (100.0%) | 17 (100.0%) |
Commute Time in Green Bank
The most frequently occuring commute durations in Green Bank are 15 to 19 minutes (16 commuters, 50.0%), 5 to 9 minutes (7 commuters, 21.9%), and 45 to 59 minutes (7 commuters, 21.9%).
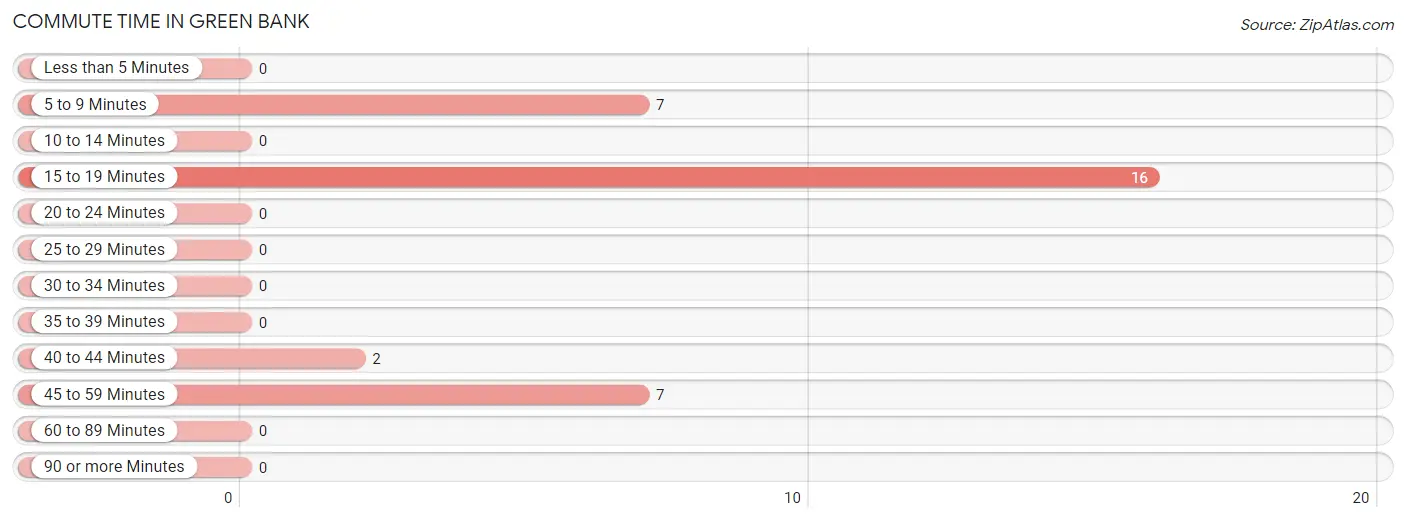
| Commute Time | # Commuters | % Commuters |
| Less than 5 Minutes | 0 | 0.0% |
| 5 to 9 Minutes | 7 | 21.9% |
| 10 to 14 Minutes | 0 | 0.0% |
| 15 to 19 Minutes | 16 | 50.0% |
| 20 to 24 Minutes | 0 | 0.0% |
| 25 to 29 Minutes | 0 | 0.0% |
| 30 to 34 Minutes | 0 | 0.0% |
| 35 to 39 Minutes | 0 | 0.0% |
| 40 to 44 Minutes | 2 | 6.2% |
| 45 to 59 Minutes | 7 | 21.9% |
| 60 to 89 Minutes | 0 | 0.0% |
| 90 or more Minutes | 0 | 0.0% |
Commute Time by Sex in Green Bank
The most common commute times in Green Bank are 45 to 59 minutes (7 commuters, 46.7%) for males and 15 to 19 minutes (10 commuters, 58.8%) for females.
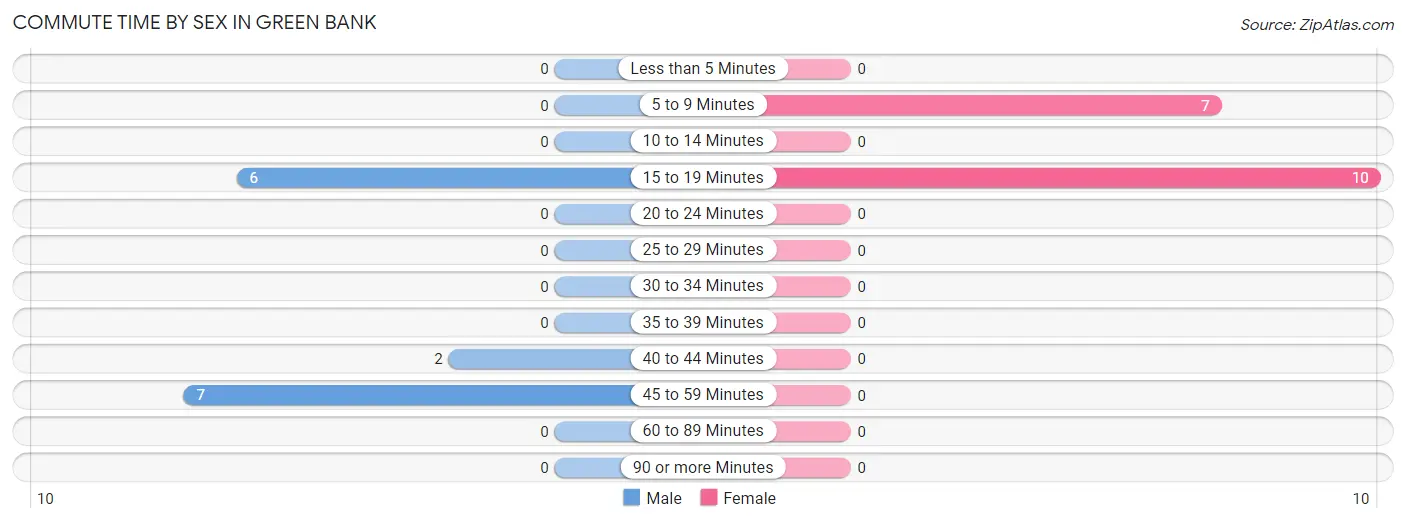
| Commute Time | Male | Female |
| Less than 5 Minutes | 0 (0.0%) | 0 (0.0%) |
| 5 to 9 Minutes | 0 (0.0%) | 7 (41.2%) |
| 10 to 14 Minutes | 0 (0.0%) | 0 (0.0%) |
| 15 to 19 Minutes | 6 (40.0%) | 10 (58.8%) |
| 20 to 24 Minutes | 0 (0.0%) | 0 (0.0%) |
| 25 to 29 Minutes | 0 (0.0%) | 0 (0.0%) |
| 30 to 34 Minutes | 0 (0.0%) | 0 (0.0%) |
| 35 to 39 Minutes | 0 (0.0%) | 0 (0.0%) |
| 40 to 44 Minutes | 2 (13.3%) | 0 (0.0%) |
| 45 to 59 Minutes | 7 (46.7%) | 0 (0.0%) |
| 60 to 89 Minutes | 0 (0.0%) | 0 (0.0%) |
| 90 or more Minutes | 0 (0.0%) | 0 (0.0%) |
Time of Departure to Work by Sex in Green Bank
The most frequent times of departure to work in Green Bank are 5:00 AM to 5:29 AM (13, 86.7%) for males and 7:30 AM to 7:59 AM (10, 58.8%) for females.
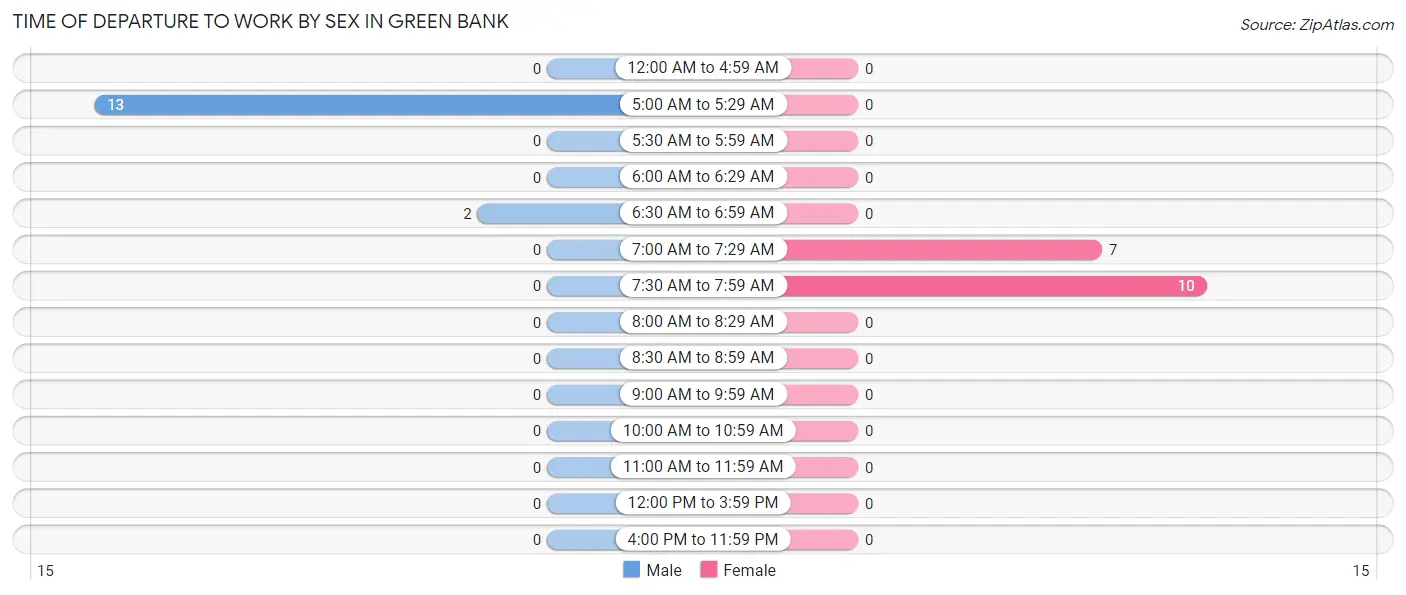
| Time of Departure | Male | Female |
| 12:00 AM to 4:59 AM | 0 (0.0%) | 0 (0.0%) |
| 5:00 AM to 5:29 AM | 13 (86.7%) | 0 (0.0%) |
| 5:30 AM to 5:59 AM | 0 (0.0%) | 0 (0.0%) |
| 6:00 AM to 6:29 AM | 0 (0.0%) | 0 (0.0%) |
| 6:30 AM to 6:59 AM | 2 (13.3%) | 0 (0.0%) |
| 7:00 AM to 7:29 AM | 0 (0.0%) | 7 (41.2%) |
| 7:30 AM to 7:59 AM | 0 (0.0%) | 10 (58.8%) |
| 8:00 AM to 8:29 AM | 0 (0.0%) | 0 (0.0%) |
| 8:30 AM to 8:59 AM | 0 (0.0%) | 0 (0.0%) |
| 9:00 AM to 9:59 AM | 0 (0.0%) | 0 (0.0%) |
| 10:00 AM to 10:59 AM | 0 (0.0%) | 0 (0.0%) |
| 11:00 AM to 11:59 AM | 0 (0.0%) | 0 (0.0%) |
| 12:00 PM to 3:59 PM | 0 (0.0%) | 0 (0.0%) |
| 4:00 PM to 11:59 PM | 0 (0.0%) | 0 (0.0%) |
| Total | 15 (100.0%) | 17 (100.0%) |
Housing Occupancy in Green Bank
Occupancy by Ownership in Green Bank
Of the total 31 dwellings in Green Bank, owner-occupied units account for 24 (77.4%), while renter-occupied units make up 7 (22.6%).
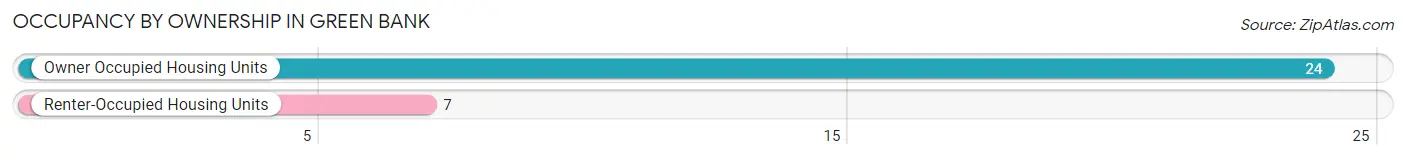
| Occupancy | # Housing Units | % Housing Units |
| Owner Occupied Housing Units | 24 | 77.4% |
| Renter-Occupied Housing Units | 7 | 22.6% |
| Total Occupied Housing Units | 31 | 100.0% |
Occupancy by Household Size in Green Bank
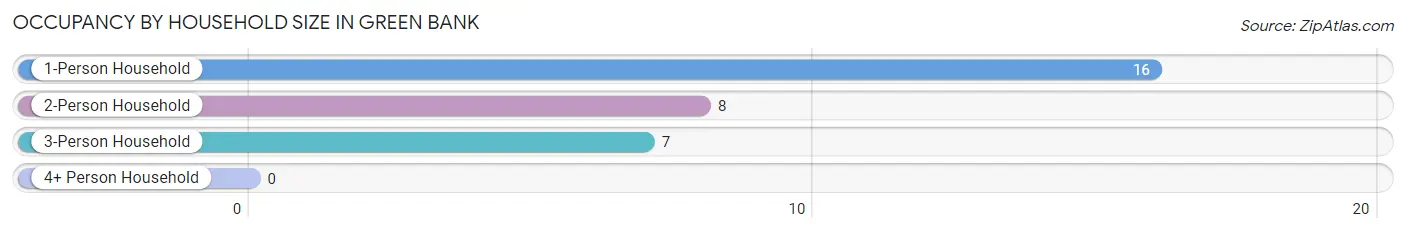
| Household Size | # Housing Units | % Housing Units |
| 1-Person Household | 16 | 51.6% |
| 2-Person Household | 8 | 25.8% |
| 3-Person Household | 7 | 22.6% |
| 4+ Person Household | 0 | 0.0% |
| Total Housing Units | 31 | 100.0% |
Occupancy by Ownership by Household Size in Green Bank
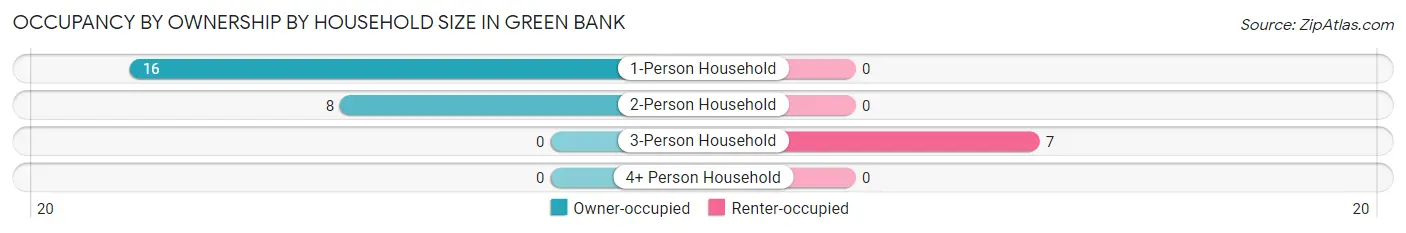
| Household Size | Owner-occupied | Renter-occupied |
| 1-Person Household | 16 (100.0%) | 0 (0.0%) |
| 2-Person Household | 8 (100.0%) | 0 (0.0%) |
| 3-Person Household | 0 (0.0%) | 7 (100.0%) |
| 4+ Person Household | 0 (0.0%) | 0 (0.0%) |
| Total Housing Units | 24 (77.4%) | 7 (22.6%) |
Occupancy by Educational Attainment in Green Bank
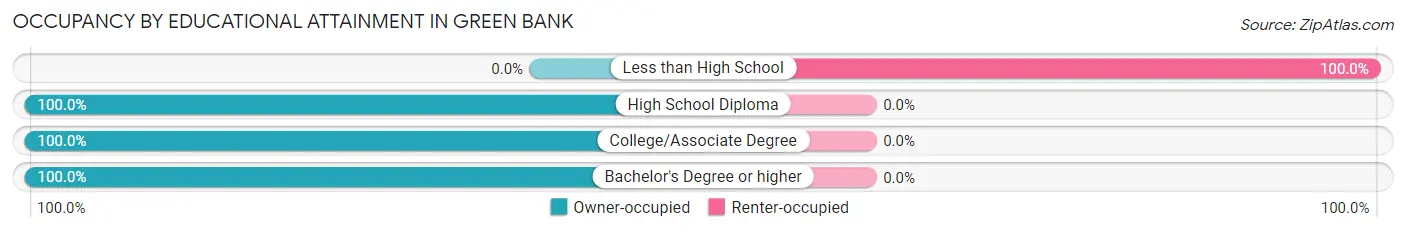
| Household Size | Owner-occupied | Renter-occupied |
| Less than High School | 0 (0.0%) | 7 (100.0%) |
| High School Diploma | 7 (100.0%) | 0 (0.0%) |
| College/Associate Degree | 7 (100.0%) | 0 (0.0%) |
| Bachelor's Degree or higher | 10 (100.0%) | 0 (0.0%) |
Occupancy by Age of Householder in Green Bank
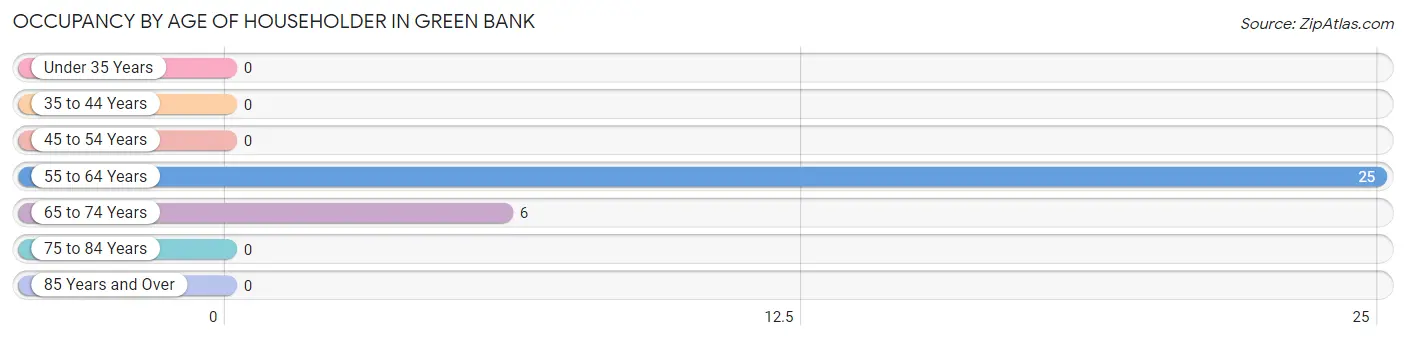
| Age Bracket | # Households | % Households |
| Under 35 Years | 0 | 0.0% |
| 35 to 44 Years | 0 | 0.0% |
| 45 to 54 Years | 0 | 0.0% |
| 55 to 64 Years | 25 | 80.6% |
| 65 to 74 Years | 6 | 19.4% |
| 75 to 84 Years | 0 | 0.0% |
| 85 Years and Over | 0 | 0.0% |
| Total | 31 | 100.0% |
Housing Finances in Green Bank
Median Income by Occupancy in Green Bank
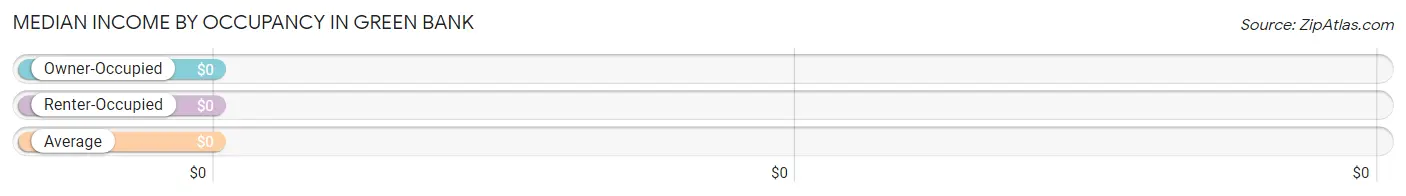
| Occupancy Type | # Households | Median Income |
| Owner-Occupied | 24 (77.4%) | $0 |
| Renter-Occupied | 7 (22.6%) | $0 |
| Average | 31 (100.0%) | $0 |
Occupancy by Householder Income Bracket in Green Bank
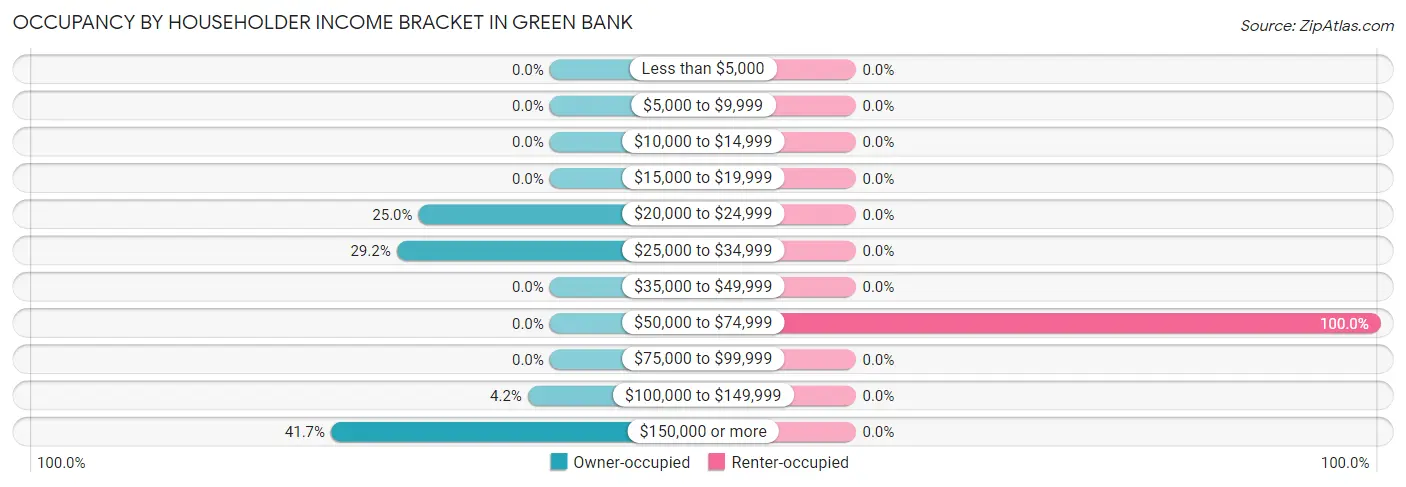
| Income Bracket | Owner-occupied | Renter-occupied |
| Less than $5,000 | 0 (0.0%) | 0 (0.0%) |
| $5,000 to $9,999 | 0 (0.0%) | 0 (0.0%) |
| $10,000 to $14,999 | 0 (0.0%) | 0 (0.0%) |
| $15,000 to $19,999 | 0 (0.0%) | 0 (0.0%) |
| $20,000 to $24,999 | 6 (25.0%) | 0 (0.0%) |
| $25,000 to $34,999 | 7 (29.2%) | 0 (0.0%) |
| $35,000 to $49,999 | 0 (0.0%) | 0 (0.0%) |
| $50,000 to $74,999 | 0 (0.0%) | 7 (100.0%) |
| $75,000 to $99,999 | 0 (0.0%) | 0 (0.0%) |
| $100,000 to $149,999 | 1 (4.2%) | 0 (0.0%) |
| $150,000 or more | 10 (41.7%) | 0 (0.0%) |
| Total | 24 (100.0%) | 7 (100.0%) |
Monthly Housing Cost Tiers in Green Bank
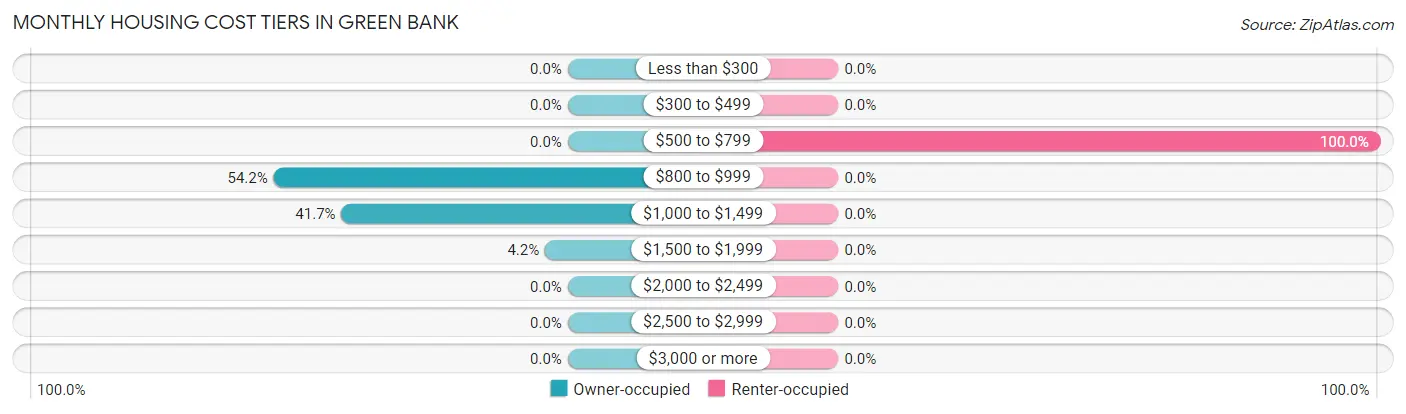
| Monthly Cost | Owner-occupied | Renter-occupied |
| Less than $300 | 0 (0.0%) | 0 (0.0%) |
| $300 to $499 | 0 (0.0%) | 0 (0.0%) |
| $500 to $799 | 0 (0.0%) | 7 (100.0%) |
| $800 to $999 | 13 (54.2%) | 0 (0.0%) |
| $1,000 to $1,499 | 10 (41.7%) | 0 (0.0%) |
| $1,500 to $1,999 | 1 (4.2%) | 0 (0.0%) |
| $2,000 to $2,499 | 0 (0.0%) | 0 (0.0%) |
| $2,500 to $2,999 | 0 (0.0%) | 0 (0.0%) |
| $3,000 or more | 0 (0.0%) | 0 (0.0%) |
| Total | 24 (100.0%) | 7 (100.0%) |
Physical Housing Characteristics in Green Bank
Housing Structures in Green Bank
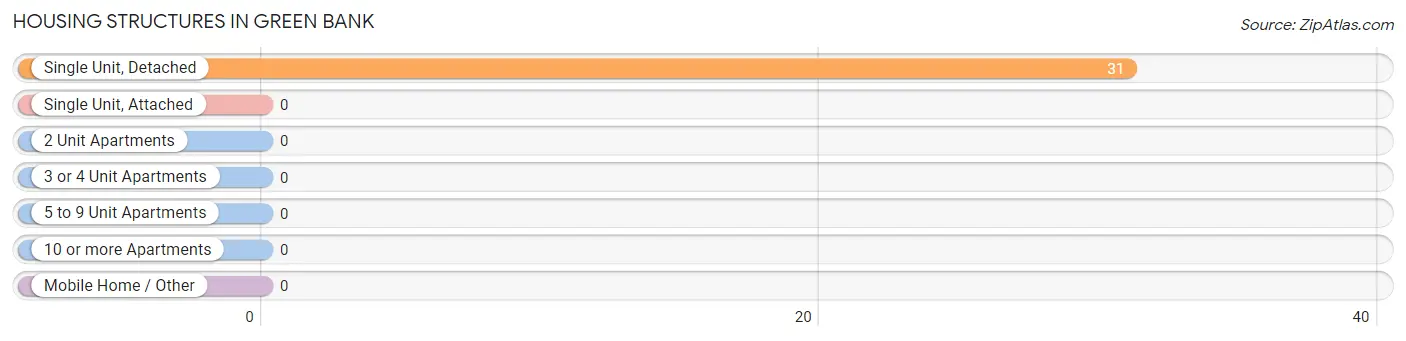
| Structure Type | # Housing Units | % Housing Units |
| Single Unit, Detached | 31 | 100.0% |
| Single Unit, Attached | 0 | 0.0% |
| 2 Unit Apartments | 0 | 0.0% |
| 3 or 4 Unit Apartments | 0 | 0.0% |
| 5 to 9 Unit Apartments | 0 | 0.0% |
| 10 or more Apartments | 0 | 0.0% |
| Mobile Home / Other | 0 | 0.0% |
| Total | 31 | 100.0% |
Housing Structures by Occupancy in Green Bank
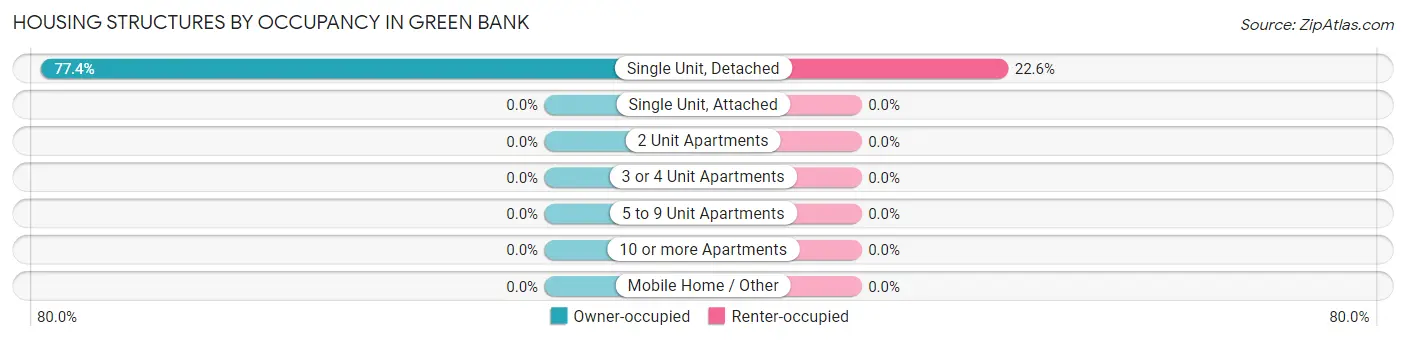
| Structure Type | Owner-occupied | Renter-occupied |
| Single Unit, Detached | 24 (77.4%) | 7 (22.6%) |
| Single Unit, Attached | 0 (0.0%) | 0 (0.0%) |
| 2 Unit Apartments | 0 (0.0%) | 0 (0.0%) |
| 3 or 4 Unit Apartments | 0 (0.0%) | 0 (0.0%) |
| 5 to 9 Unit Apartments | 0 (0.0%) | 0 (0.0%) |
| 10 or more Apartments | 0 (0.0%) | 0 (0.0%) |
| Mobile Home / Other | 0 (0.0%) | 0 (0.0%) |
| Total | 24 (77.4%) | 7 (22.6%) |
Housing Structures by Number of Rooms in Green Bank
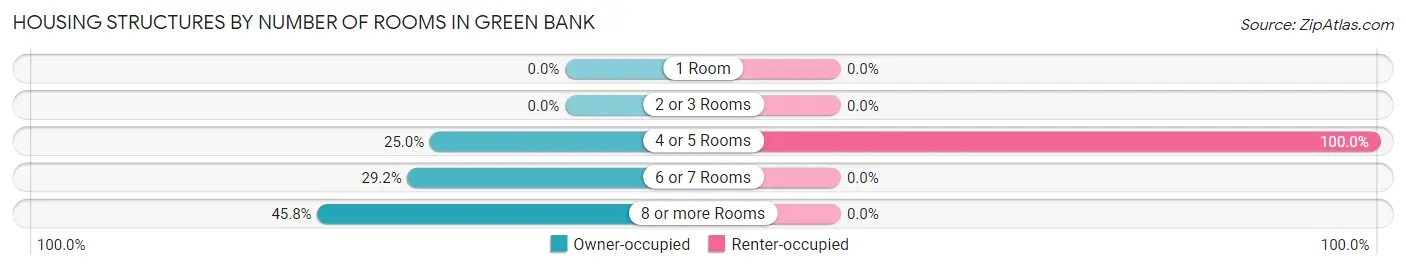
| Number of Rooms | Owner-occupied | Renter-occupied |
| 1 Room | 0 (0.0%) | 0 (0.0%) |
| 2 or 3 Rooms | 0 (0.0%) | 0 (0.0%) |
| 4 or 5 Rooms | 6 (25.0%) | 7 (100.0%) |
| 6 or 7 Rooms | 7 (29.2%) | 0 (0.0%) |
| 8 or more Rooms | 11 (45.8%) | 0 (0.0%) |
| Total | 24 (100.0%) | 7 (100.0%) |
Housing Structure by Heating Type in Green Bank
| Heating Type | Owner-occupied | Renter-occupied |
| Utility Gas | 0 (0.0%) | 7 (100.0%) |
| Bottled, Tank, or LP Gas | 10 (41.7%) | 0 (0.0%) |
| Electricity | 6 (25.0%) | 0 (0.0%) |
| Fuel Oil or Kerosene | 1 (4.2%) | 0 (0.0%) |
| Coal or Coke | 0 (0.0%) | 0 (0.0%) |
| All other Fuels | 7 (29.2%) | 0 (0.0%) |
| No Fuel Used | 0 (0.0%) | 0 (0.0%) |
| Total | 24 (100.0%) | 7 (100.0%) |
Household Vehicle Usage in Green Bank
| Vehicles per Household | Owner-occupied | Renter-occupied |
| No Vehicle | 0 (0.0%) | 0 (0.0%) |
| 1 Vehicle | 0 (0.0%) | 0 (0.0%) |
| 2 Vehicles | 11 (45.8%) | 7 (100.0%) |
| 3 or more Vehicles | 13 (54.2%) | 0 (0.0%) |
| Total | 24 (100.0%) | 7 (100.0%) |
Real Estate & Mortgages in Green Bank
Real Estate and Mortgage Overview in Green Bank
| Characteristic | Without Mortgage | With Mortgage |
| Housing Units | 0 | 24 |
| Median Property Value | - | - |
| Median Household Income | - | - |
| Monthly Housing Costs | - | - |
| Real Estate Taxes | - | - |
Property Value by Mortgage Status in Green Bank
| Property Value | Without Mortgage | With Mortgage |
| Less than $50,000 | 0 (0.0%) | 7 (29.2%) |
| $50,000 to $99,999 | 0 (0.0%) | 0 (0.0%) |
| $100,000 to $299,999 | 0 (0.0%) | 17 (70.8%) |
| $300,000 to $499,999 | 0 (0.0%) | 0 (0.0%) |
| $500,000 to $749,999 | 0 (0.0%) | 0 (0.0%) |
| $750,000 to $999,999 | 0 (0.0%) | 0 (0.0%) |
| $1,000,000 or more | 0 (0.0%) | 0 (0.0%) |
| Total | 0 (0.0%) | 24 (100.0%) |
Household Income by Mortgage Status in Green Bank
| Household Income | Without Mortgage | With Mortgage |
| Less than $10,000 | 0 (0.0%) | 0 (0.0%) |
| $10,000 to $24,999 | 0 (0.0%) | 0 (0.0%) |
| $25,000 to $34,999 | 0 (0.0%) | 6 (25.0%) |
| $35,000 to $49,999 | 0 (0.0%) | 7 (29.2%) |
| $50,000 to $74,999 | 0 (0.0%) | 0 (0.0%) |
| $75,000 to $99,999 | 0 (0.0%) | 0 (0.0%) |
| $100,000 to $149,999 | 0 (0.0%) | 0 (0.0%) |
| $150,000 or more | 0 (0.0%) | 1 (4.2%) |
| Total | 0 (0.0%) | 24 (100.0%) |
Property Value to Household Income Ratio in Green Bank
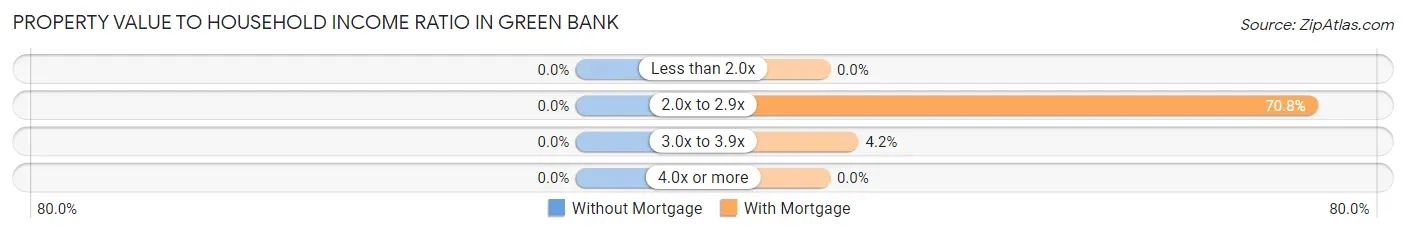
| Value-to-Income Ratio | Without Mortgage | With Mortgage |
| Less than 2.0x | 0 (0.0%) | 0 (0.0%) |
| 2.0x to 2.9x | 0 (0.0%) | 17 (70.8%) |
| 3.0x to 3.9x | 0 (0.0%) | 1 (4.2%) |
| 4.0x or more | 0 (0.0%) | 0 (0.0%) |
| Total | 0 (0.0%) | 24 (100.0%) |
Real Estate Taxes by Mortgage Status in Green Bank
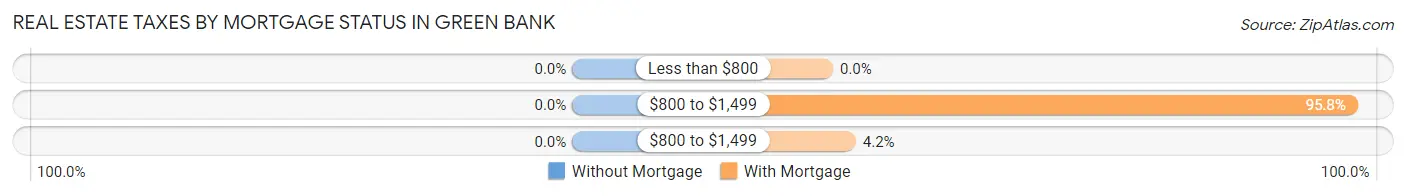
| Property Taxes | Without Mortgage | With Mortgage |
| Less than $800 | 0 (0.0%) | 0 (0.0%) |
| $800 to $1,499 | 0 (0.0%) | 23 (95.8%) |
| $800 to $1,499 | 0 (0.0%) | 1 (4.2%) |
| Total | 0 (0.0%) | 24 (100.0%) |
Health & Disability in Green Bank
Health Insurance Coverage by Age in Green Bank
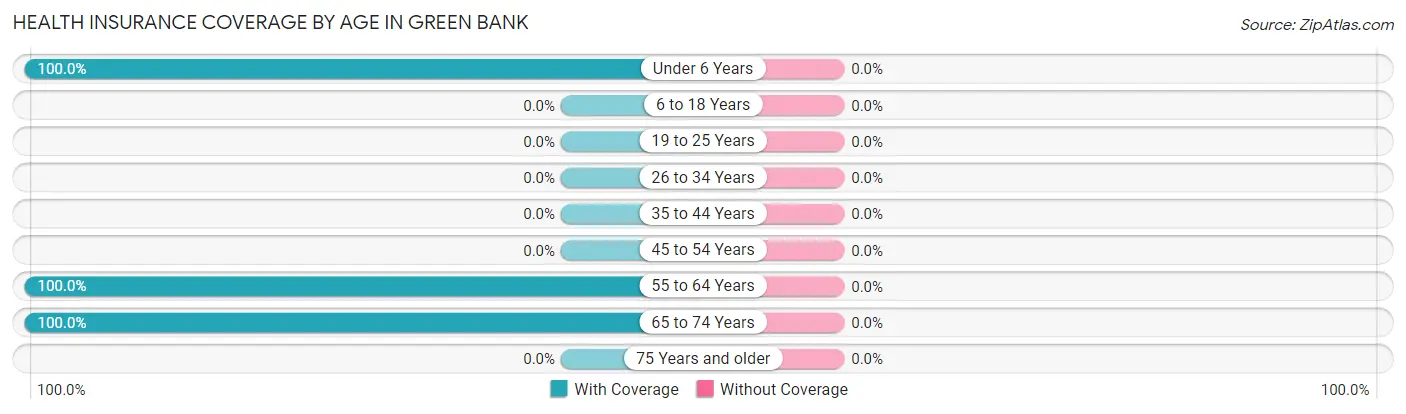
| Age Bracket | With Coverage | Without Coverage |
| Under 6 Years | 12 (100.0%) | 0 (0.0%) |
| 6 to 18 Years | 0 (0.0%) | 0 (0.0%) |
| 19 to 25 Years | 0 (0.0%) | 0 (0.0%) |
| 26 to 34 Years | 0 (0.0%) | 0 (0.0%) |
| 35 to 44 Years | 0 (0.0%) | 0 (0.0%) |
| 45 to 54 Years | 0 (0.0%) | 0 (0.0%) |
| 55 to 64 Years | 41 (100.0%) | 0 (0.0%) |
| 65 to 74 Years | 6 (100.0%) | 0 (0.0%) |
| 75 Years and older | 0 (0.0%) | 0 (0.0%) |
| Total | 59 (100.0%) | 0 (0.0%) |
Health Insurance Coverage by Citizenship Status in Green Bank
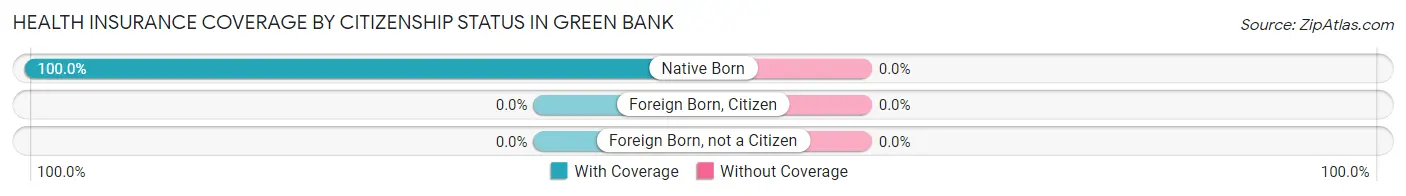
| Citizenship Status | With Coverage | Without Coverage |
| Native Born | 12 (100.0%) | 0 (0.0%) |
| Foreign Born, Citizen | 0 (0.0%) | 0 (0.0%) |
| Foreign Born, not a Citizen | 0 (0.0%) | 0 (0.0%) |
Health Insurance Coverage by Household Income in Green Bank
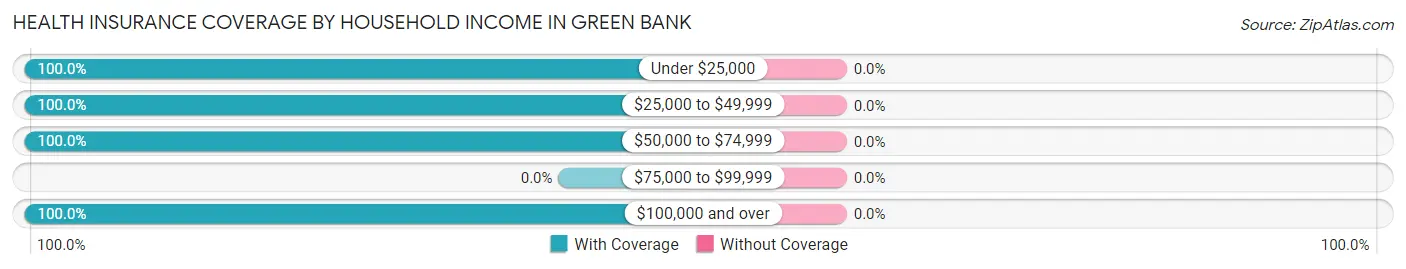
| Household Income | With Coverage | Without Coverage |
| Under $25,000 | 6 (100.0%) | 0 (0.0%) |
| $25,000 to $49,999 | 14 (100.0%) | 0 (0.0%) |
| $50,000 to $74,999 | 26 (100.0%) | 0 (0.0%) |
| $75,000 to $99,999 | 0 (0.0%) | 0 (0.0%) |
| $100,000 and over | 13 (100.0%) | 0 (0.0%) |
Public vs Private Health Insurance Coverage by Age in Green Bank
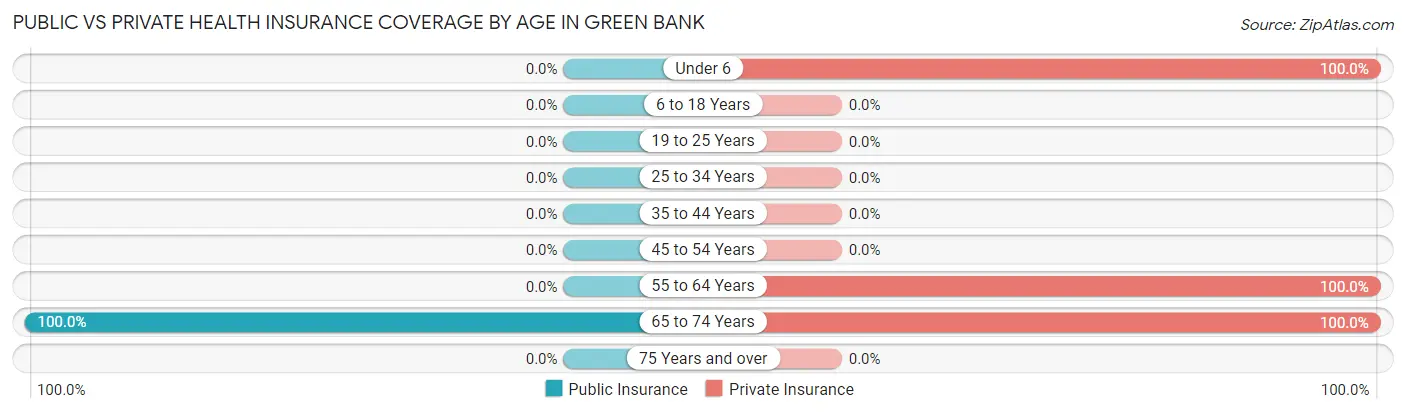
| Age Bracket | Public Insurance | Private Insurance |
| Under 6 | 0 (0.0%) | 12 (100.0%) |
| 6 to 18 Years | 0 (0.0%) | 0 (0.0%) |
| 19 to 25 Years | 0 (0.0%) | 0 (0.0%) |
| 25 to 34 Years | 0 (0.0%) | 0 (0.0%) |
| 35 to 44 Years | 0 (0.0%) | 0 (0.0%) |
| 45 to 54 Years | 0 (0.0%) | 0 (0.0%) |
| 55 to 64 Years | 0 (0.0%) | 41 (100.0%) |
| 65 to 74 Years | 6 (100.0%) | 6 (100.0%) |
| 75 Years and over | 0 (0.0%) | 0 (0.0%) |
| Total | 6 (10.2%) | 59 (100.0%) |
Disability Status by Sex by Age in Green Bank
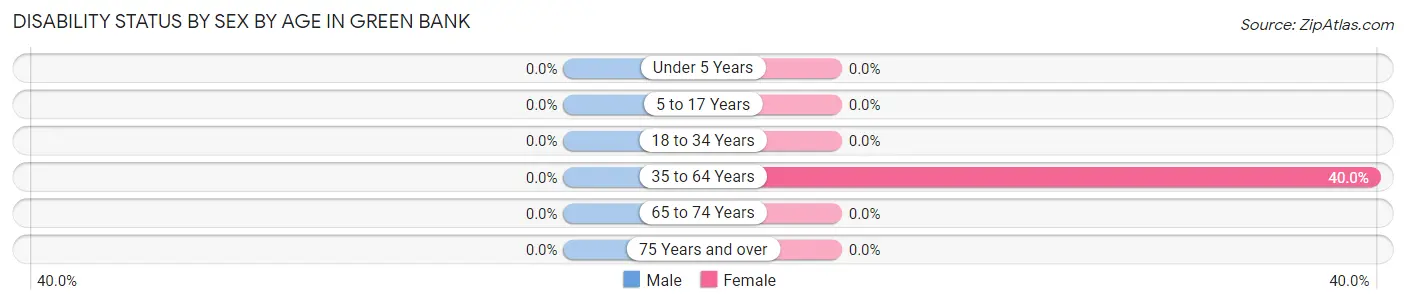
| Age Bracket | Male | Female |
| Under 5 Years | 0 (0.0%) | 0 (0.0%) |
| 5 to 17 Years | 0 (0.0%) | 0 (0.0%) |
| 18 to 34 Years | 0 (0.0%) | 0 (0.0%) |
| 35 to 64 Years | 0 (0.0%) | 10 (40.0%) |
| 65 to 74 Years | 0 (0.0%) | 0 (0.0%) |
| 75 Years and over | 0 (0.0%) | 0 (0.0%) |
Disability Class by Sex by Age in Green Bank
Disability Class: Hearing Difficulty
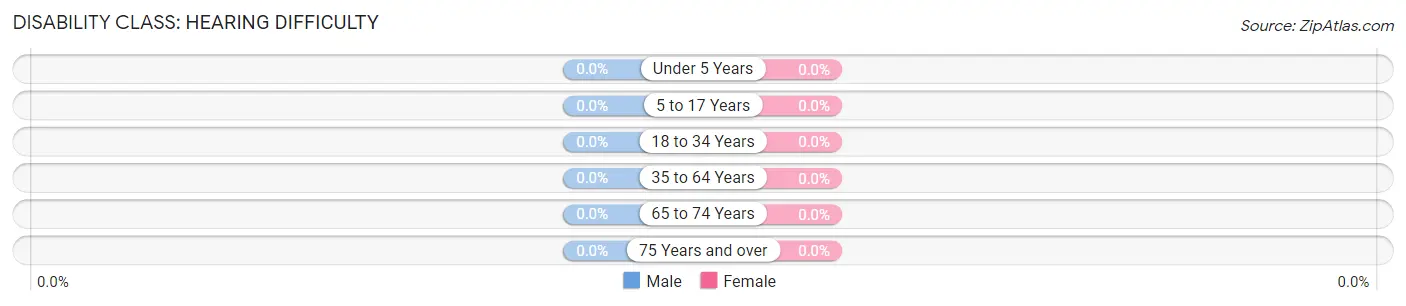
| Age Bracket | Male | Female |
| Under 5 Years | 0 (0.0%) | 0 (0.0%) |
| 5 to 17 Years | 0 (0.0%) | 0 (0.0%) |
| 18 to 34 Years | 0 (0.0%) | 0 (0.0%) |
| 35 to 64 Years | 0 (0.0%) | 0 (0.0%) |
| 65 to 74 Years | 0 (0.0%) | 0 (0.0%) |
| 75 Years and over | 0 (0.0%) | 0 (0.0%) |
Disability Class: Vision Difficulty
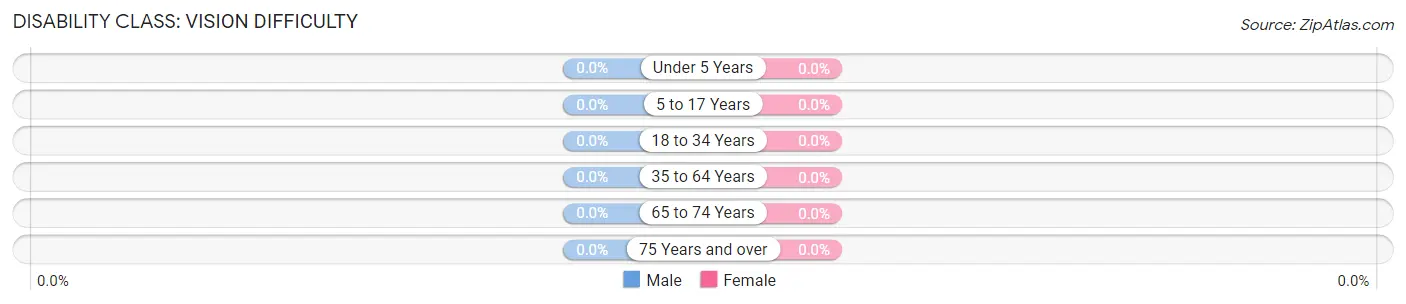
| Age Bracket | Male | Female |
| Under 5 Years | 0 (0.0%) | 0 (0.0%) |
| 5 to 17 Years | 0 (0.0%) | 0 (0.0%) |
| 18 to 34 Years | 0 (0.0%) | 0 (0.0%) |
| 35 to 64 Years | 0 (0.0%) | 0 (0.0%) |
| 65 to 74 Years | 0 (0.0%) | 0 (0.0%) |
| 75 Years and over | 0 (0.0%) | 0 (0.0%) |
Disability Class: Cognitive Difficulty
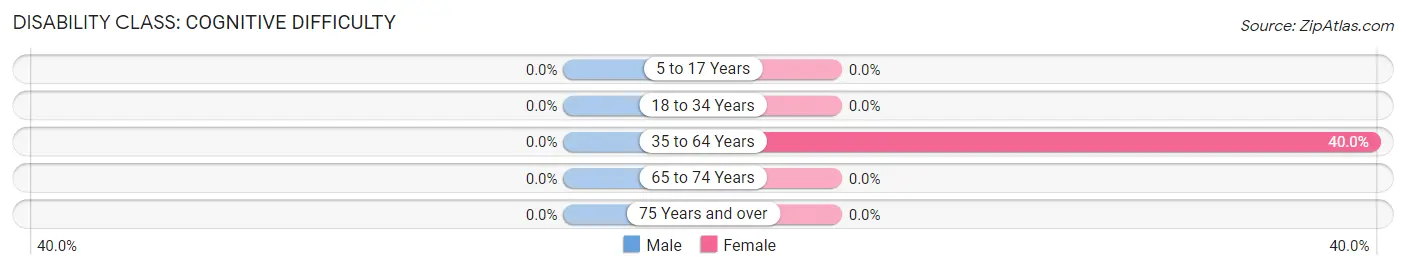
| Age Bracket | Male | Female |
| 5 to 17 Years | 0 (0.0%) | 0 (0.0%) |
| 18 to 34 Years | 0 (0.0%) | 0 (0.0%) |
| 35 to 64 Years | 0 (0.0%) | 10 (40.0%) |
| 65 to 74 Years | 0 (0.0%) | 0 (0.0%) |
| 75 Years and over | 0 (0.0%) | 0 (0.0%) |
Disability Class: Ambulatory Difficulty
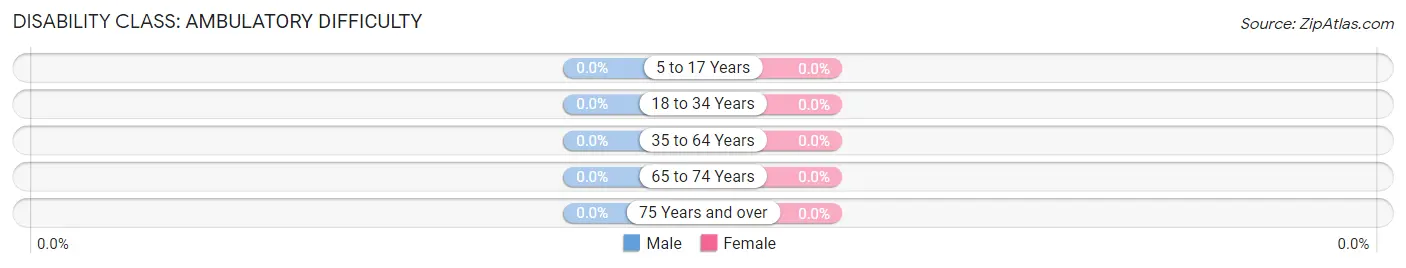
| Age Bracket | Male | Female |
| 5 to 17 Years | 0 (0.0%) | 0 (0.0%) |
| 18 to 34 Years | 0 (0.0%) | 0 (0.0%) |
| 35 to 64 Years | 0 (0.0%) | 0 (0.0%) |
| 65 to 74 Years | 0 (0.0%) | 0 (0.0%) |
| 75 Years and over | 0 (0.0%) | 0 (0.0%) |
Disability Class: Self-Care Difficulty
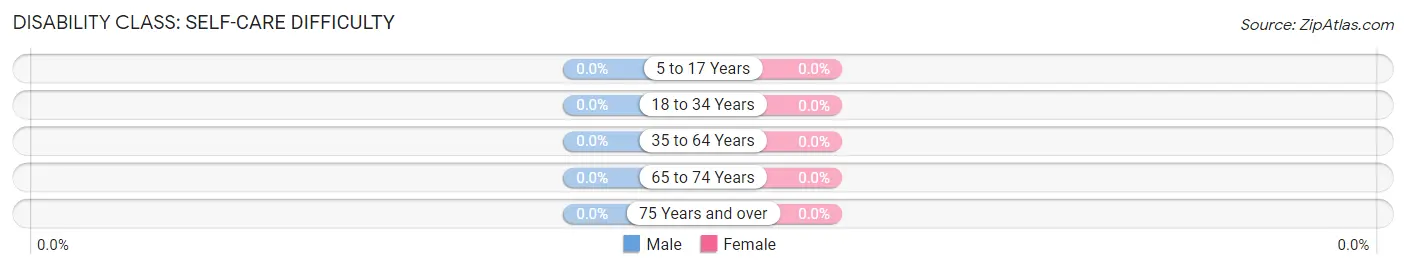
| Age Bracket | Male | Female |
| 5 to 17 Years | 0 (0.0%) | 0 (0.0%) |
| 18 to 34 Years | 0 (0.0%) | 0 (0.0%) |
| 35 to 64 Years | 0 (0.0%) | 0 (0.0%) |
| 65 to 74 Years | 0 (0.0%) | 0 (0.0%) |
| 75 Years and over | 0 (0.0%) | 0 (0.0%) |
Technology Access in Green Bank
Computing Device Access in Green Bank
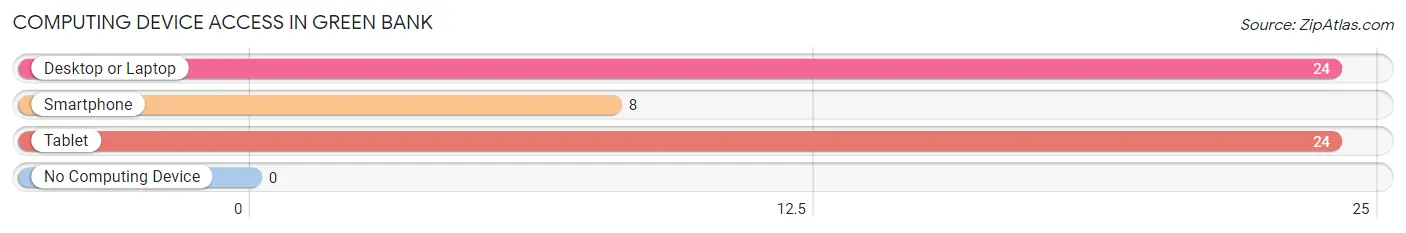
| Device Type | # Households | % Households |
| Desktop or Laptop | 24 | 77.4% |
| Smartphone | 8 | 25.8% |
| Tablet | 24 | 77.4% |
| No Computing Device | 0 | 0.0% |
| Total | 31 | 100.0% |
Internet Access in Green Bank
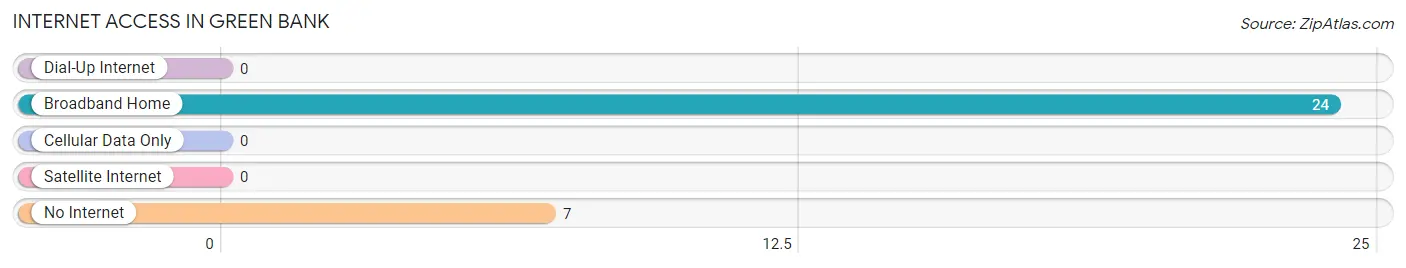
| Internet Type | # Households | % Households |
| Dial-Up Internet | 0 | 0.0% |
| Broadband Home | 24 | 77.4% |
| Cellular Data Only | 0 | 0.0% |
| Satellite Internet | 0 | 0.0% |
| No Internet | 7 | 22.6% |
| Total | 31 | 100.0% |
Green Bank Summary
Green Bank, West Virginia is a small town located in Pocahontas County in the Allegheny Mountains of West Virginia. It is the home of the world’s largest fully steerable radio telescope, the Robert C. Byrd Green Bank Telescope (GBT). The town is also home to the National Radio Astronomy Observatory (NRAO) and the Green Bank Science Center.
History
Green Bank was founded in 1883 by the Green family, who had moved to the area from Pennsylvania. The town was originally called Green Bank Station, and was a stop on the Chesapeake and Ohio Railway. The town was renamed Green Bank in 1891.
In the early 1900s, the town was a popular tourist destination, with many visitors coming to enjoy the scenic beauty of the Allegheny Mountains. The town was also home to a number of businesses, including a hotel, a general store, a post office, and a sawmill.
In the 1950s, the National Radio Astronomy Observatory (NRAO) was established in Green Bank. The NRAO is a research facility dedicated to the study of radio astronomy. The facility is home to the world’s largest fully steerable radio telescope, the Robert C. Byrd Green Bank Telescope (GBT).
Geography
Green Bank is located in Pocahontas County in the Allegheny Mountains of West Virginia. The town is situated at an elevation of 2,845 feet (867 meters). The town is surrounded by the Monongahela National Forest and is located near the headwaters of the Greenbrier River.
The climate in Green Bank is classified as humid continental, with cold winters and warm summers. The average annual temperature is 48°F (9°C). The average annual precipitation is 40 inches (101 cm).
Economy
The economy of Green Bank is largely based on tourism and the NRAO. The town is home to the world’s largest fully steerable radio telescope, the Robert C. Byrd Green Bank Telescope (GBT). The NRAO is a research facility dedicated to the study of radio astronomy.
The town is also home to the Green Bank Science Center, which offers educational programs and activities for visitors. The center also houses a museum, a planetarium, and a library.
Demographics
As of the 2010 census, the population of Green Bank was 143. The racial makeup of the town was 97.2% White, 0.7% African American, 0.7% Native American, and 1.4% from two or more races. The median household income was $30,000.
Green Bank is a small town with a close-knit community. The town is home to a number of churches, including the Green Bank United Methodist Church, the Green Bank Presbyterian Church, and the Green Bank Baptist Church. The town also has a volunteer fire department and a volunteer rescue squad.
Common Questions
What is Per Capita Income in Green Bank?
Per Capita income in Green Bank is $68,742.
What is the Median Family Income in Green Bank?
Median Family Income in Green Bank is $55,179.
What is Inequality or Gini Index in Green Bank?
Inequality or Gini Index in Green Bank is 0.49.
What is the Total Population of Green Bank?
Total Population of Green Bank is 59.
What is the Total Male Population of Green Bank?
Total Male Population of Green Bank is 22.
What is the Total Female Population of Green Bank?
Total Female Population of Green Bank is 37.
What is the Ratio of Males per 100 Females in Green Bank?
There are 59.46 Males per 100 Females in Green Bank.
What is the Ratio of Females per 100 Males in Green Bank?
There are 168.18 Females per 100 Males in Green Bank.
What is the Median Population Age in Green Bank?
Median Population Age in Green Bank is 58.4 Years.
What is the Average Family Size in Green Bank
Average Family Size in Green Bank is 2.9 People.
What is the Average Household Size in Green Bank
Average Household Size in Green Bank is 1.9 People.
How Large is the Labor Force in Green Bank?
There are 32 People in the Labor Forcein in Green Bank.
What is the Percentage of People in the Labor Force in Green Bank?
68.1% of People are in the Labor Force in Green Bank.