Gilbert Creek, WV Map & Demographics
Gilbert Creek Map
Gilbert Creek Overview
$30,631
PER CAPITA INCOME
$86,250
AVG FAMILY INCOME
$77,763
AVG HOUSEHOLD INCOME
52.5%
WAGE / INCOME GAP [ % ]
47.5¢/ $1
WAGE / INCOME GAP [ $ ]
0.35
INEQUALITY / GINI INDEX
805
TOTAL POPULATION
449
MALE POPULATION
356
FEMALE POPULATION
126.12
MALES / 100 FEMALES
79.29
FEMALES / 100 MALES
51.1
MEDIAN AGE
2.6
AVG FAMILY SIZE
2.7
AVG HOUSEHOLD SIZE
273
LABOR FORCE [ PEOPLE ]
36.4%
PERCENT IN LABOR FORCE
4.4%
UNEMPLOYMENT RATE
Income in Gilbert Creek
Income Overview in Gilbert Creek
Per Capita Income in Gilbert Creek is $30,631, while median incomes of families and households are $86,250 and $77,763 respectively.
| Characteristic | Number | Measure |
| Per Capita Income | 805 | $30,631 |
| Median Family Income | 259 | $86,250 |
| Mean Family Income | 259 | $85,732 |
| Median Household Income | 300 | $77,763 |
| Mean Household Income | 300 | $81,895 |
| Income Deficit | 259 | $0 |
| Wage / Income Gap (%) | 805 | 52.51% |
| Wage / Income Gap ($) | 805 | 47.49¢ per $1 |
| Gini / Inequality Index | 805 | 0.35 |
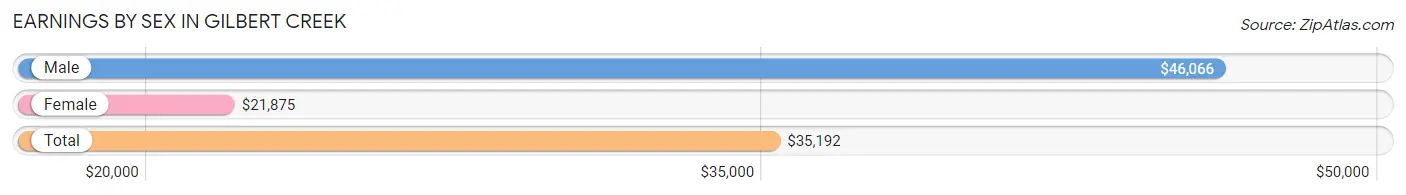
Earnings by Sex in Gilbert Creek
Average Earnings in Gilbert Creek are $35,192, $46,066 for men and $21,875 for women, a difference of 52.5%.
| Sex | Number | Average Earnings |
| Male | 143 (51.1%) | $46,066 |
| Female | 137 (48.9%) | $21,875 |
| Total | 280 (100.0%) | $35,192 |
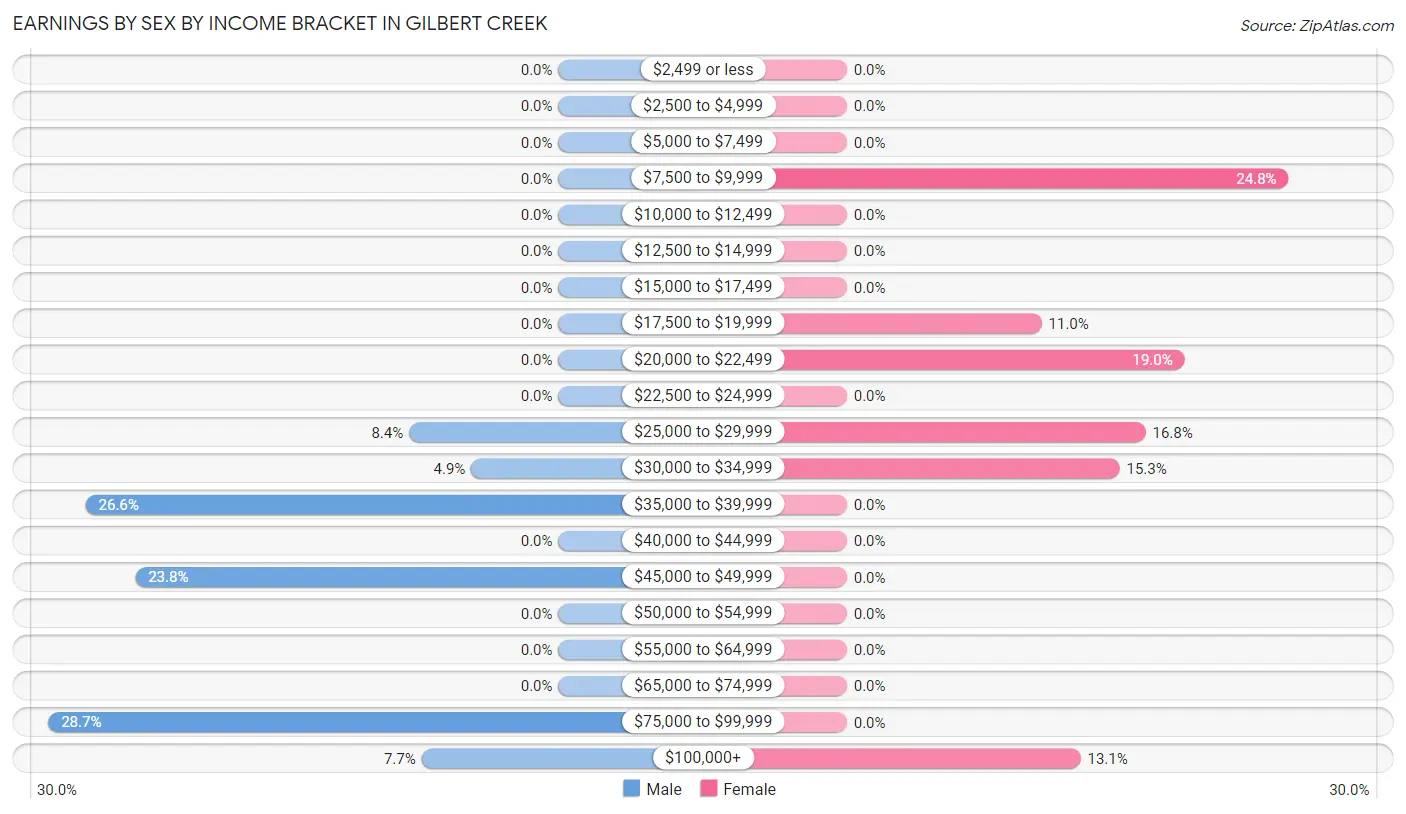
Earnings by Sex by Income Bracket in Gilbert Creek
The most common earnings brackets in Gilbert Creek are $75,000 to $99,999 for men (41 | 28.7%) and $7,500 to $9,999 for women (34 | 24.8%).
| Income | Male | Female |
| $2,499 or less | 0 (0.0%) | 0 (0.0%) |
| $2,500 to $4,999 | 0 (0.0%) | 0 (0.0%) |
| $5,000 to $7,499 | 0 (0.0%) | 0 (0.0%) |
| $7,500 to $9,999 | 0 (0.0%) | 34 (24.8%) |
| $10,000 to $12,499 | 0 (0.0%) | 0 (0.0%) |
| $12,500 to $14,999 | 0 (0.0%) | 0 (0.0%) |
| $15,000 to $17,499 | 0 (0.0%) | 0 (0.0%) |
| $17,500 to $19,999 | 0 (0.0%) | 15 (11.0%) |
| $20,000 to $22,499 | 0 (0.0%) | 26 (19.0%) |
| $22,500 to $24,999 | 0 (0.0%) | 0 (0.0%) |
| $25,000 to $29,999 | 12 (8.4%) | 23 (16.8%) |
| $30,000 to $34,999 | 7 (4.9%) | 21 (15.3%) |
| $35,000 to $39,999 | 38 (26.6%) | 0 (0.0%) |
| $40,000 to $44,999 | 0 (0.0%) | 0 (0.0%) |
| $45,000 to $49,999 | 34 (23.8%) | 0 (0.0%) |
| $50,000 to $54,999 | 0 (0.0%) | 0 (0.0%) |
| $55,000 to $64,999 | 0 (0.0%) | 0 (0.0%) |
| $65,000 to $74,999 | 0 (0.0%) | 0 (0.0%) |
| $75,000 to $99,999 | 41 (28.7%) | 0 (0.0%) |
| $100,000+ | 11 (7.7%) | 18 (13.1%) |
| Total | 143 (100.0%) | 137 (100.0%) |
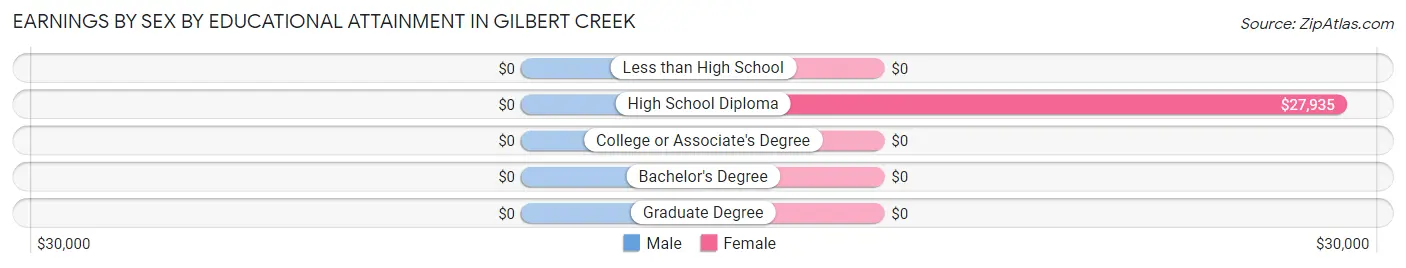
Earnings by Sex by Educational Attainment in Gilbert Creek
| Educational Attainment | Male Income | Female Income |
| Less than High School | - | - |
| High School Diploma | - | - |
| College or Associate's Degree | - | - |
| Bachelor's Degree | - | - |
| Graduate Degree | - | - |
| Total | $46,507 | $28,641 |
Family Income in Gilbert Creek
Family Income Brackets in Gilbert Creek
According to the Gilbert Creek family income data, there are 77 families falling into the $100,000 to $149,999 income range, which is the most common income bracket and makes up 29.7% of all families.
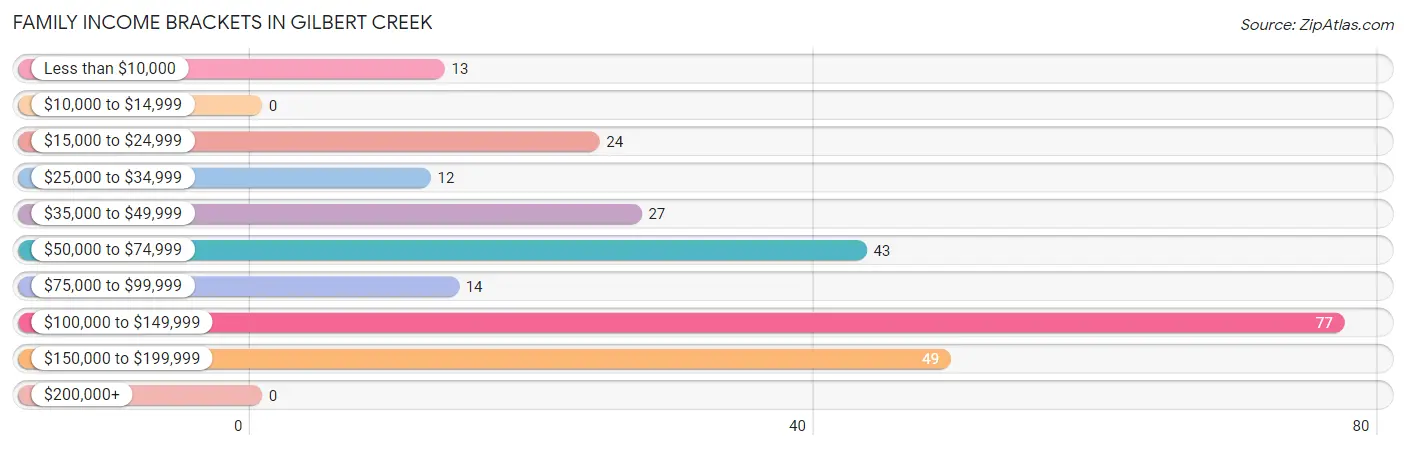
| Income Bracket | # Families | % Families |
| Less than $10,000 | 13 | 5.0% |
| $10,000 to $14,999 | 0 | 0.0% |
| $15,000 to $24,999 | 24 | 9.3% |
| $25,000 to $34,999 | 12 | 4.6% |
| $35,000 to $49,999 | 27 | 10.4% |
| $50,000 to $74,999 | 43 | 16.6% |
| $75,000 to $99,999 | 14 | 5.4% |
| $100,000 to $149,999 | 77 | 29.7% |
| $150,000 to $199,999 | 49 | 18.9% |
| $200,000+ | 0 | 0.0% |
Family Income by Famaliy Size in Gilbert Creek
3-person families (98 | 37.8%) account for the highest median family income in Gilbert Creek with $108,864 per family, while 3-person families (98 | 37.8%) have the highest median income of $36,288 per family member.
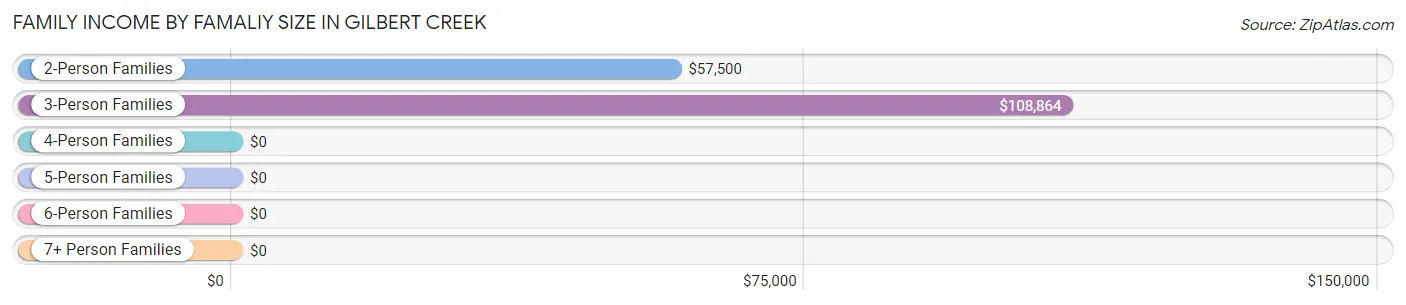
| Income Bracket | # Families | Median Income |
| 2-Person Families | 150 (57.9%) | $57,500 |
| 3-Person Families | 98 (37.8%) | $108,864 |
| 4-Person Families | 11 (4.3%) | $0 |
| 5-Person Families | 0 (0.0%) | $0 |
| 6-Person Families | 0 (0.0%) | $0 |
| 7+ Person Families | 0 (0.0%) | $0 |
| Total | 259 (100.0%) | $86,250 |
Family Income by Number of Earners in Gilbert Creek
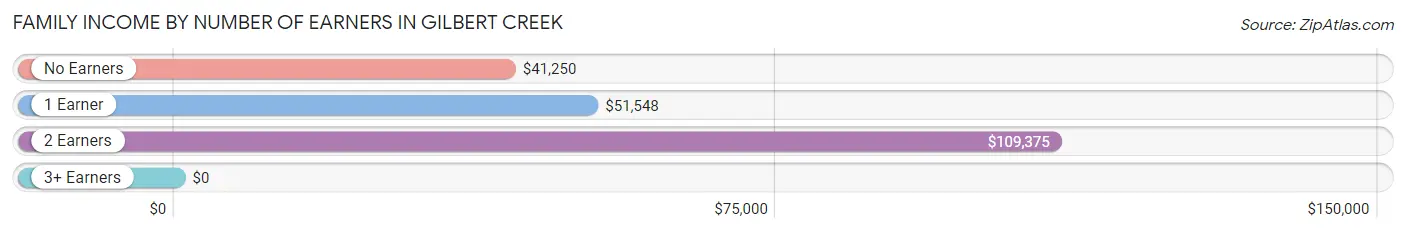
| Number of Earners | # Families | Median Income |
| No Earners | 113 (43.6%) | $41,250 |
| 1 Earner | 50 (19.3%) | $51,548 |
| 2 Earners | 85 (32.8%) | $109,375 |
| 3+ Earners | 11 (4.3%) | $0 |
| Total | 259 (100.0%) | $86,250 |
Household Income in Gilbert Creek
Household Income Brackets in Gilbert Creek
With 77 households falling in the category, the $100,000 to $149,999 income range is the most frequent in Gilbert Creek, accounting for 25.7% of all households.
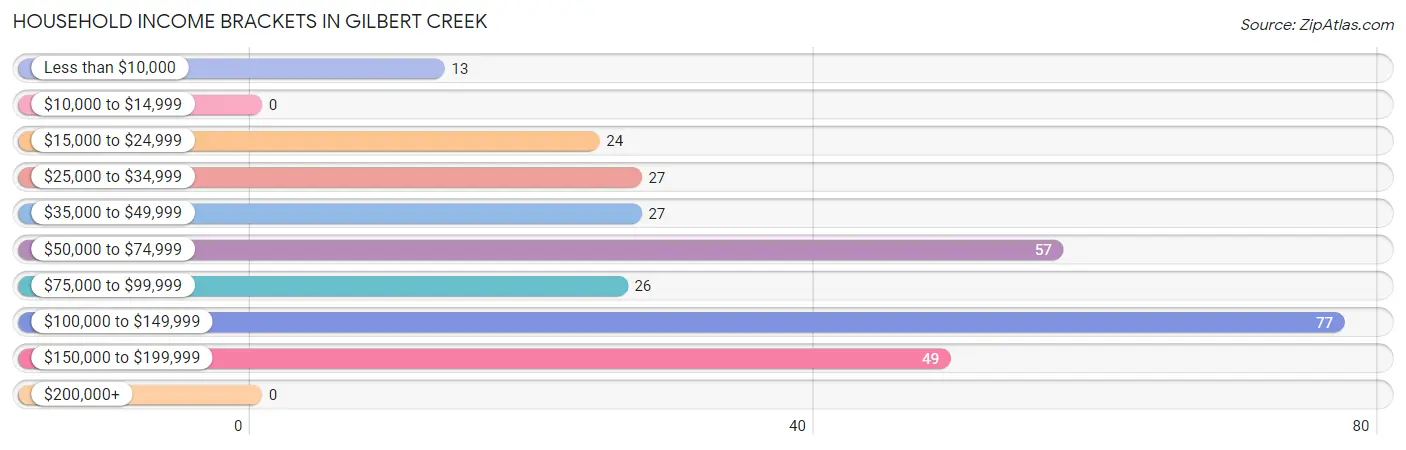
| Income Bracket | # Households | % Households |
| Less than $10,000 | 13 | 4.3% |
| $10,000 to $14,999 | 0 | 0.0% |
| $15,000 to $24,999 | 24 | 8.0% |
| $25,000 to $34,999 | 27 | 9.0% |
| $35,000 to $49,999 | 27 | 9.0% |
| $50,000 to $74,999 | 57 | 19.0% |
| $75,000 to $99,999 | 26 | 8.7% |
| $100,000 to $149,999 | 77 | 25.7% |
| $150,000 to $199,999 | 49 | 16.3% |
| $200,000+ | 0 | 0.0% |
Household Income by Householder Age in Gilbert Creek
The median household income in Gilbert Creek is $77,763, with the highest median household income of $79,803 found in the 65+ years age bracket for the primary householder. A total of 115 households (38.3%) fall into this category.
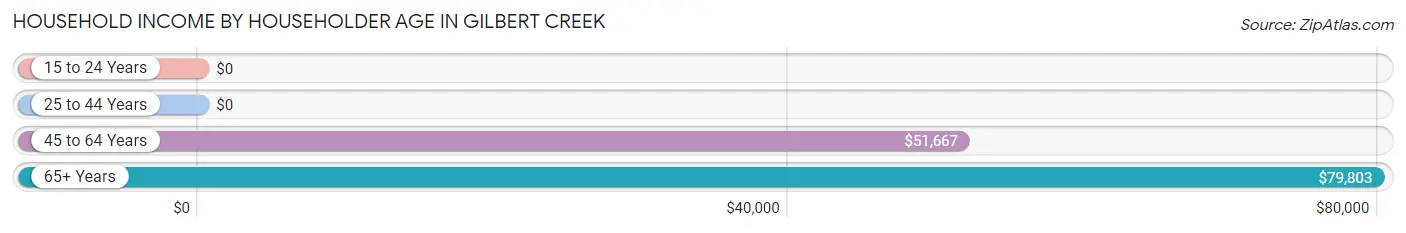
| Income Bracket | # Households | Median Income |
| 15 to 24 Years | 0 (0.0%) | $0 |
| 25 to 44 Years | 11 (3.7%) | $0 |
| 45 to 64 Years | 174 (58.0%) | $51,667 |
| 65+ Years | 115 (38.3%) | $79,803 |
| Total | 300 (100.0%) | $77,763 |
Poverty in Gilbert Creek
Income Below Poverty by Sex and Age in Gilbert Creek
With 6.7% poverty level for males and 28.1% for females among the residents of Gilbert Creek, 45 to 54 year old males and 25 to 34 year old females are the most vulnerable to poverty, with 12 males (26.1%) and 84 females (100.0%) in their respective age groups living below the poverty level.
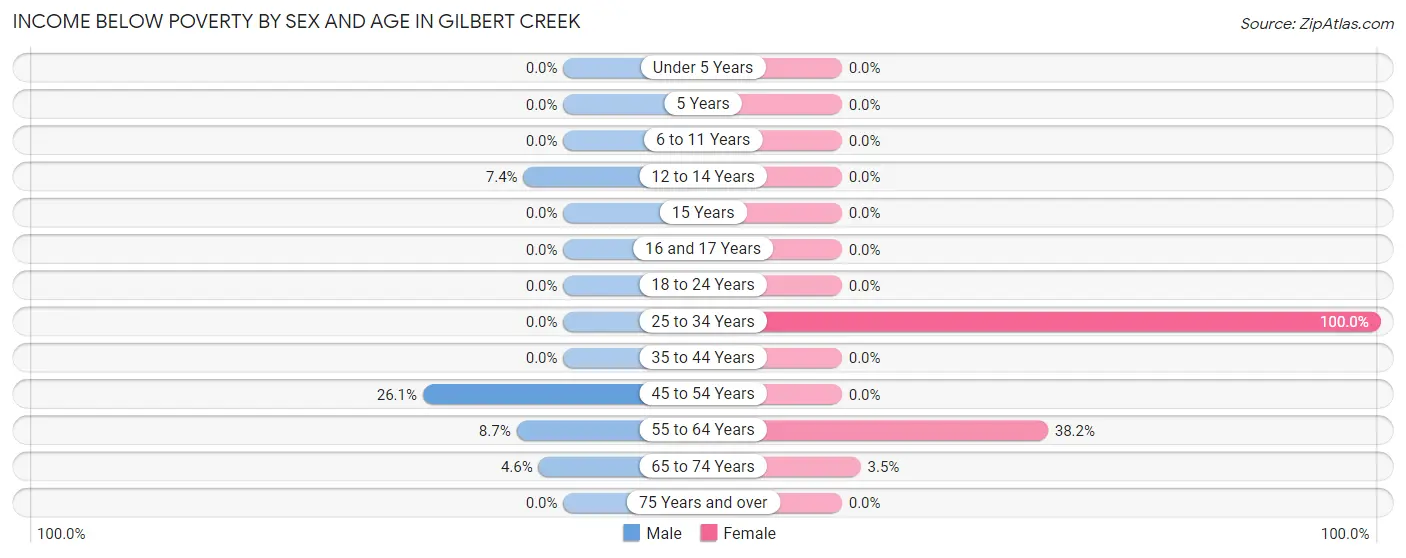
| Age Bracket | Male | Female |
| Under 5 Years | 0 (0.0%) | 0 (0.0%) |
| 5 Years | 0 (0.0%) | 0 (0.0%) |
| 6 to 11 Years | 0 (0.0%) | 0 (0.0%) |
| 12 to 14 Years | 4 (7.4%) | 0 (0.0%) |
| 15 Years | 0 (0.0%) | 0 (0.0%) |
| 16 and 17 Years | 0 (0.0%) | 0 (0.0%) |
| 18 to 24 Years | 0 (0.0%) | 0 (0.0%) |
| 25 to 34 Years | 0 (0.0%) | 84 (100.0%) |
| 35 to 44 Years | 0 (0.0%) | 0 (0.0%) |
| 45 to 54 Years | 12 (26.1%) | 0 (0.0%) |
| 55 to 64 Years | 10 (8.7%) | 13 (38.2%) |
| 65 to 74 Years | 4 (4.6%) | 3 (3.5%) |
| 75 Years and over | 0 (0.0%) | 0 (0.0%) |
| Total | 30 (6.7%) | 100 (28.1%) |
Income Above Poverty by Sex and Age in Gilbert Creek
According to the poverty statistics in Gilbert Creek, males aged 18 to 24 years and females aged 18 to 24 years are the age groups that are most secure financially, with 100.0% of males and 100.0% of females in these age groups living above the poverty line.
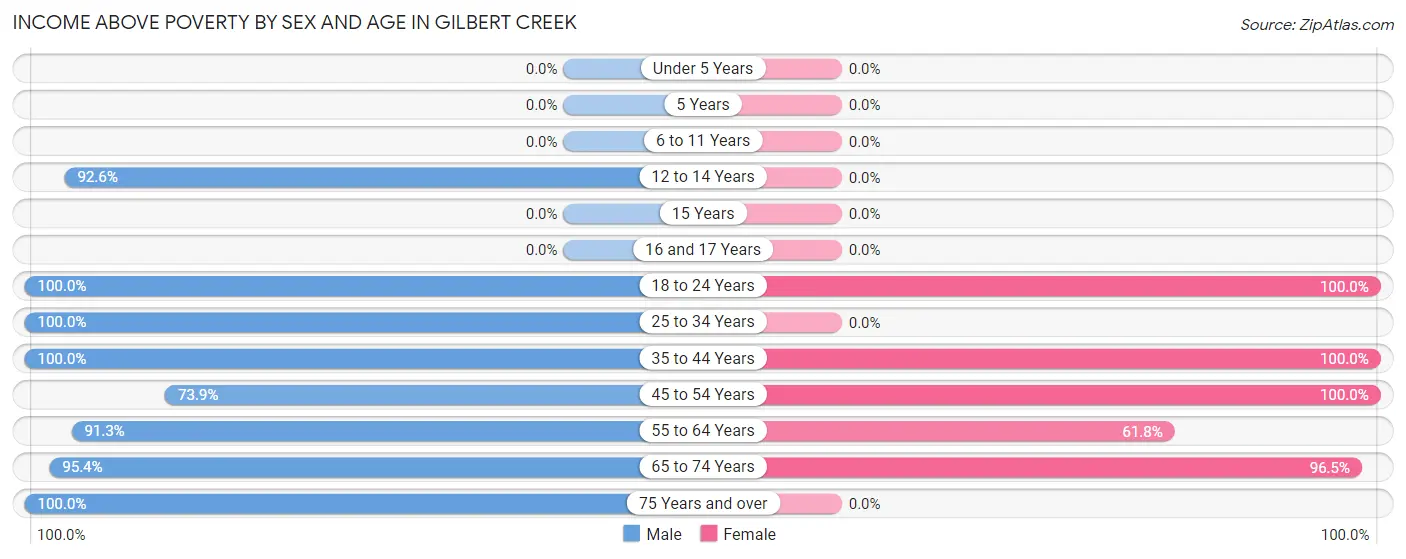
| Age Bracket | Male | Female |
| Under 5 Years | 0 (0.0%) | 0 (0.0%) |
| 5 Years | 0 (0.0%) | 0 (0.0%) |
| 6 to 11 Years | 0 (0.0%) | 0 (0.0%) |
| 12 to 14 Years | 50 (92.6%) | 0 (0.0%) |
| 15 Years | 0 (0.0%) | 0 (0.0%) |
| 16 and 17 Years | 0 (0.0%) | 0 (0.0%) |
| 18 to 24 Years | 34 (100.0%) | 50 (100.0%) |
| 25 to 34 Years | 28 (100.0%) | 0 (0.0%) |
| 35 to 44 Years | 65 (100.0%) | 29 (100.0%) |
| 45 to 54 Years | 34 (73.9%) | 73 (100.0%) |
| 55 to 64 Years | 105 (91.3%) | 21 (61.8%) |
| 65 to 74 Years | 83 (95.4%) | 83 (96.5%) |
| 75 Years and over | 20 (100.0%) | 0 (0.0%) |
| Total | 419 (93.3%) | 256 (71.9%) |
Income Below Poverty Among Married-Couple Families in Gilbert Creek
The poverty statistics for married-couple families in Gilbert Creek show that 7.9% or 16 of the total 203 families live below the poverty line. Families with 1 or 2 children have the highest poverty rate of 11.1%, comprising of 3 families. On the other hand, families with no children have the lowest poverty rate of 7.4%, which includes 13 families.
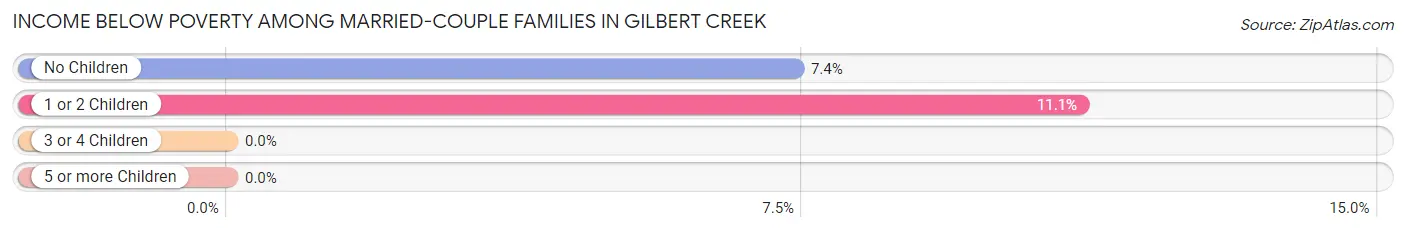
| Children | Above Poverty | Below Poverty |
| No Children | 163 (92.6%) | 13 (7.4%) |
| 1 or 2 Children | 24 (88.9%) | 3 (11.1%) |
| 3 or 4 Children | 0 (0.0%) | 0 (0.0%) |
| 5 or more Children | 0 (0.0%) | 0 (0.0%) |
| Total | 187 (92.1%) | 16 (7.9%) |
Income Below Poverty Among Single-Parent Households in Gilbert Creek
| Children | Single Father | Single Mother |
| No Children | 0 (0.0%) | 0 (0.0%) |
| 1 or 2 Children | 0 (0.0%) | 0 (0.0%) |
| 3 or 4 Children | 0 (0.0%) | 0 (0.0%) |
| 5 or more Children | 0 (0.0%) | 0 (0.0%) |
| Total | 0 (0.0%) | 0 (0.0%) |
Income Below Poverty Among Married-Couple vs Single-Parent Households in Gilbert Creek
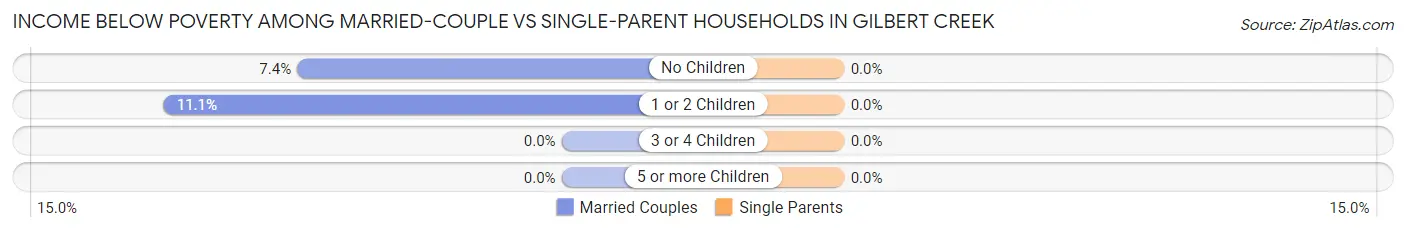
| Children | Married-Couple Families | Single-Parent Households |
| No Children | 13 (7.4%) | 0 (0.0%) |
| 1 or 2 Children | 3 (11.1%) | 0 (0.0%) |
| 3 or 4 Children | 0 (0.0%) | 0 (0.0%) |
| 5 or more Children | 0 (0.0%) | 0 (0.0%) |
| Total | 16 (7.9%) | 0 (0.0%) |
Race in Gilbert Creek
The most populous races in Gilbert Creek are White / Caucasian (776 | 96.4%), and Asian (29 | 3.6%).
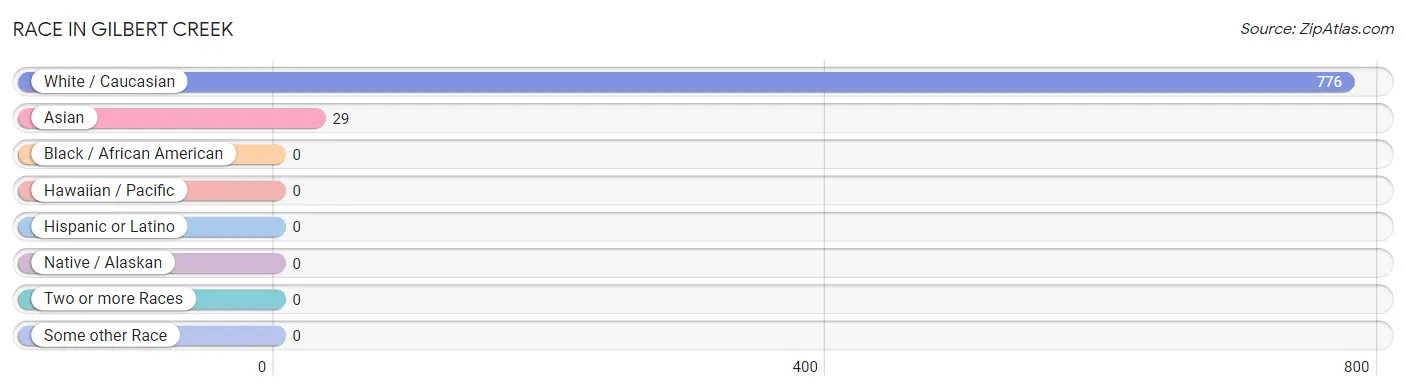
| Race | # Population | % Population |
| Asian | 29 | 3.6% |
| Black / African American | 0 | 0.0% |
| Hawaiian / Pacific | 0 | 0.0% |
| Hispanic or Latino | 0 | 0.0% |
| Native / Alaskan | 0 | 0.0% |
| White / Caucasian | 776 | 96.4% |
| Two or more Races | 0 | 0.0% |
| Some other Race | 0 | 0.0% |
| Total | 805 | 100.0% |
Ancestry in Gilbert Creek
The most populous ancestries reported in Gilbert Creek are English (73 | 9.1%), German (71 | 8.8%), European (53 | 6.6%), American (52 | 6.5%), and Korean (29 | 3.6%), together accounting for 34.5% of all Gilbert Creek residents.
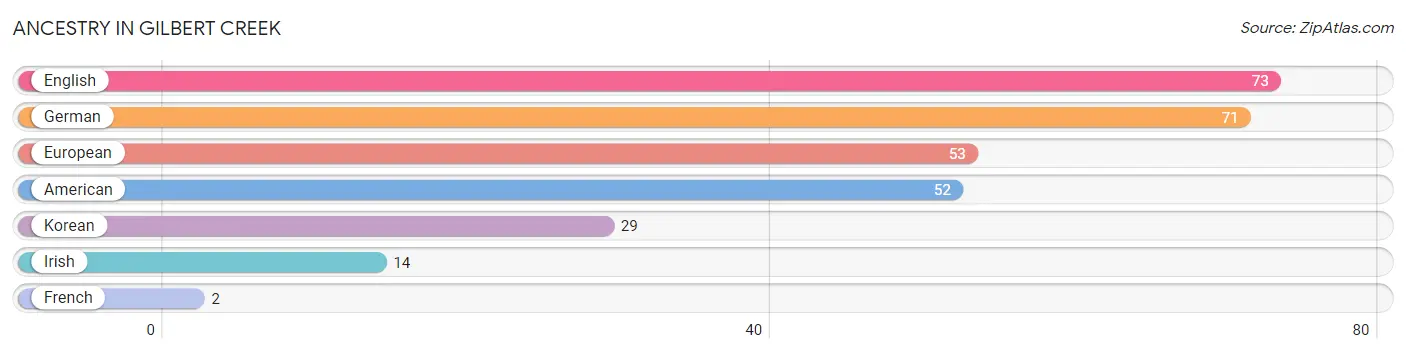
| Ancestry | # Population | % Population |
| American | 52 | 6.5% |
| English | 73 | 9.1% |
| European | 53 | 6.6% |
| French | 2 | 0.3% |
| German | 71 | 8.8% |
| Irish | 14 | 1.7% |
| Korean | 29 | 3.6% | View All 7 Rows |
Immigrants in Gilbert Creek
The most numerous immigrant groups reported in Gilbert Creek came from Asia (29 | 3.6%), Philippines (29 | 3.6%), and South Eastern Asia (29 | 3.6%), together accounting for 10.8% of all Gilbert Creek residents.
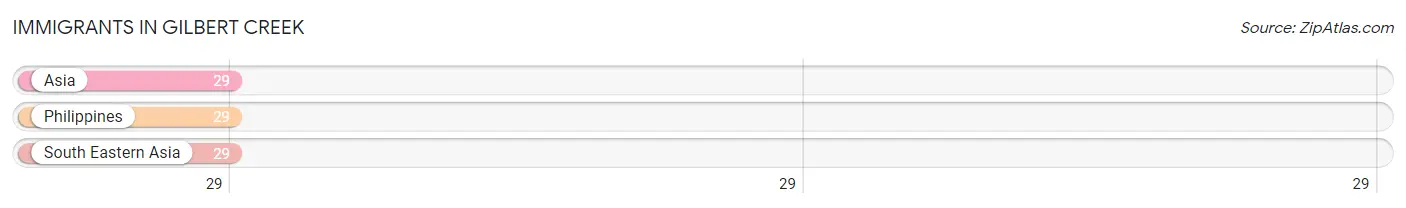
| Immigration Origin | # Population | % Population |
| Asia | 29 | 3.6% |
| Philippines | 29 | 3.6% |
| South Eastern Asia | 29 | 3.6% | View All 3 Rows |
Sex and Age in Gilbert Creek
Sex and Age in Gilbert Creek
The most populous age groups in Gilbert Creek are 60 to 64 Years (94 | 20.9%) for men and 25 to 29 Years (73 | 20.5%) for women.
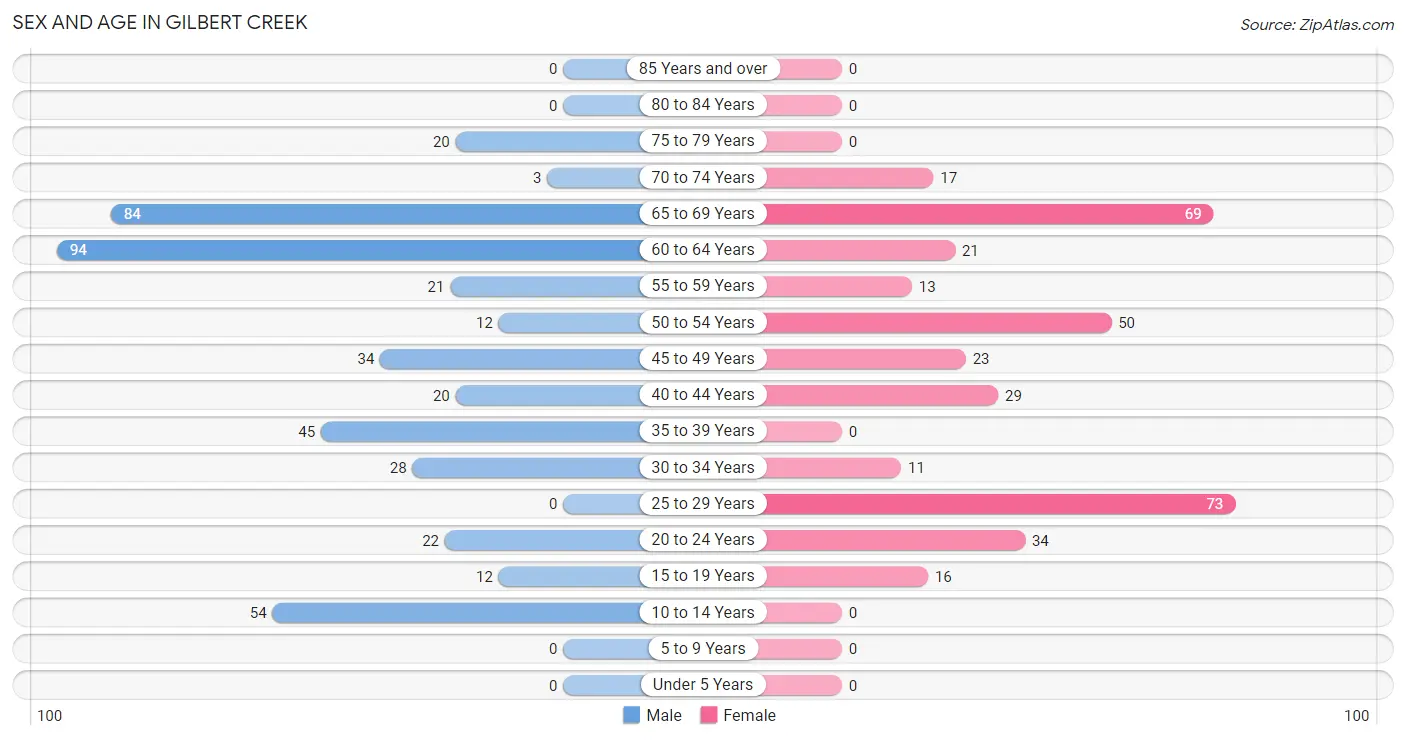
| Age Bracket | Male | Female |
| Under 5 Years | 0 (0.0%) | 0 (0.0%) |
| 5 to 9 Years | 0 (0.0%) | 0 (0.0%) |
| 10 to 14 Years | 54 (12.0%) | 0 (0.0%) |
| 15 to 19 Years | 12 (2.7%) | 16 (4.5%) |
| 20 to 24 Years | 22 (4.9%) | 34 (9.6%) |
| 25 to 29 Years | 0 (0.0%) | 73 (20.5%) |
| 30 to 34 Years | 28 (6.2%) | 11 (3.1%) |
| 35 to 39 Years | 45 (10.0%) | 0 (0.0%) |
| 40 to 44 Years | 20 (4.4%) | 29 (8.2%) |
| 45 to 49 Years | 34 (7.6%) | 23 (6.5%) |
| 50 to 54 Years | 12 (2.7%) | 50 (14.0%) |
| 55 to 59 Years | 21 (4.7%) | 13 (3.6%) |
| 60 to 64 Years | 94 (20.9%) | 21 (5.9%) |
| 65 to 69 Years | 84 (18.7%) | 69 (19.4%) |
| 70 to 74 Years | 3 (0.7%) | 17 (4.8%) |
| 75 to 79 Years | 20 (4.4%) | 0 (0.0%) |
| 80 to 84 Years | 0 (0.0%) | 0 (0.0%) |
| 85 Years and over | 0 (0.0%) | 0 (0.0%) |
| Total | 449 (100.0%) | 356 (100.0%) |
Families and Households in Gilbert Creek
Median Family Size in Gilbert Creek
The median family size in Gilbert Creek is 2.58 persons per family, with single female/mother families (18 | 7.0%) accounting for the largest median family size of 2.89 persons per family. On the other hand, single male/father families (38 | 14.7%) represent the smallest median family size with 2.21 persons per family.
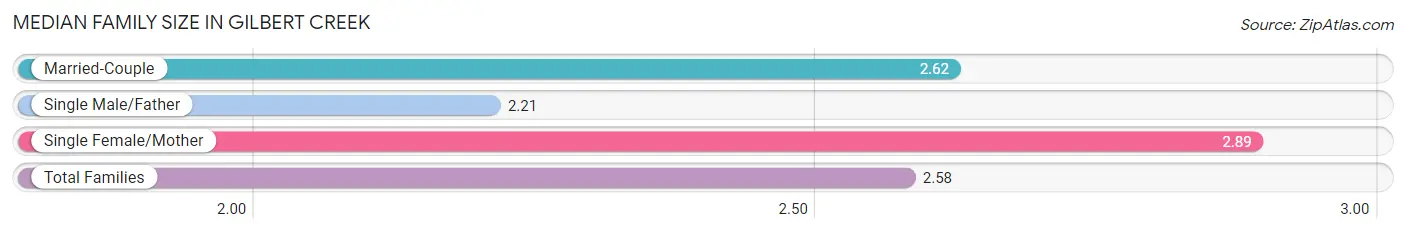
| Family Type | # Families | Family Size |
| Married-Couple | 203 (78.4%) | 2.62 |
| Single Male/Father | 38 (14.7%) | 2.21 |
| Single Female/Mother | 18 (7.0%) | 2.89 |
| Total Families | 259 (100.0%) | 2.58 |
Median Household Size in Gilbert Creek
The median household size in Gilbert Creek is 2.68 persons per household, with single male/father households (38 | 12.7%) accounting for the largest median household size of 4.42 persons per household. non-family households (41 | 13.7%) represent the smallest median household size with 1.29 persons per household.
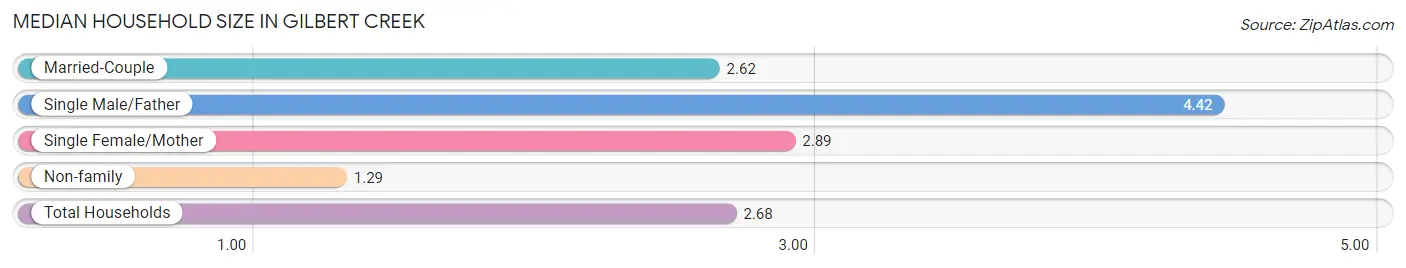
| Household Type | # Households | Household Size |
| Married-Couple | 203 (67.7%) | 2.62 |
| Single Male/Father | 38 (12.7%) | 4.42 |
| Single Female/Mother | 18 (6.0%) | 2.89 |
| Non-family | 41 (13.7%) | 1.29 |
| Total Households | 300 (100.0%) | 2.68 |
Household Size by Marriage Status in Gilbert Creek
Out of a total of 300 households in Gilbert Creek, 259 (86.3%) are family households, while 41 (13.7%) are nonfamily households. The most numerous type of family households are 3-person households, comprising 136, and the most common type of nonfamily households are 1-person households, comprising 26.
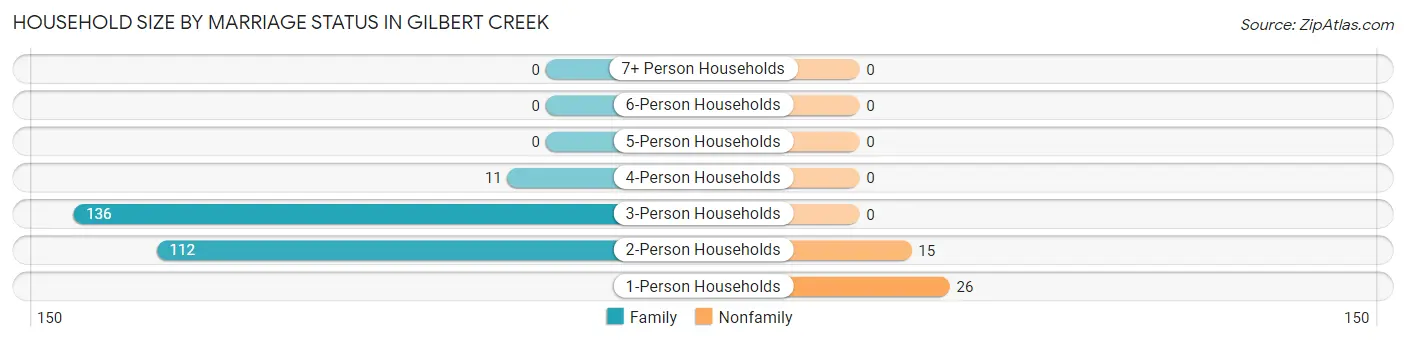
| Household Size | Family Households | Nonfamily Households |
| 1-Person Households | - | 26 (8.7%) |
| 2-Person Households | 112 (37.3%) | 15 (5.0%) |
| 3-Person Households | 136 (45.3%) | 0 (0.0%) |
| 4-Person Households | 11 (3.7%) | 0 (0.0%) |
| 5-Person Households | 0 (0.0%) | 0 (0.0%) |
| 6-Person Households | 0 (0.0%) | 0 (0.0%) |
| 7+ Person Households | 0 (0.0%) | 0 (0.0%) |
| Total | 259 (86.3%) | 41 (13.7%) |
Female Fertility in Gilbert Creek
Fertility by Age in Gilbert Creek
| Age Bracket | Women with Births | Births / 1,000 Women |
| 15 to 19 years | 0 (0.0%) | 0.0 |
| 20 to 34 years | 0 (0.0%) | 0.0 |
| 35 to 50 years | 0 (0.0%) | 0.0 |
| Total | 0 (0.0%) | 0.0 |
Fertility by Age by Marriage Status in Gilbert Creek
| Age Bracket | Married | Unmarried |
| 15 to 19 years | 0 (0.0%) | 0 (0.0%) |
| 20 to 34 years | 0 (0.0%) | 0 (0.0%) |
| 35 to 50 years | 0 (0.0%) | 0 (0.0%) |
| Total | 0 (0.0%) | 0 (0.0%) |
Fertility by Education in Gilbert Creek
| Educational Attainment | Women with Births | Births / 1,000 Women |
| Less than High School | 0 (0.0%) | 0.0 |
| High School Diploma | 0 (0.0%) | 0.0 |
| College or Associate's Degree | 0 (0.0%) | 0.0 |
| Bachelor's Degree | 0 (0.0%) | 0.0 |
| Graduate Degree | 0 (0.0%) | 0.0 |
| Total | 0 (0.0%) | 0.0 |
Fertility by Education by Marriage Status in Gilbert Creek
| Educational Attainment | Married | Unmarried |
| Less than High School | 0 (0.0%) | 0 (0.0%) |
| High School Diploma | 0 (0.0%) | 0 (0.0%) |
| College or Associate's Degree | 0 (0.0%) | 0 (0.0%) |
| Bachelor's Degree | 0 (0.0%) | 0 (0.0%) |
| Graduate Degree | 0 (0.0%) | 0 (0.0%) |
| Total | 0 (0.0%) | 0 (0.0%) |
Employment Characteristics in Gilbert Creek
Employment by Class of Employer in Gilbert Creek
Among the 261 employed individuals in Gilbert Creek, private company employees (122 | 46.7%), state government employees (47 | 18.0%), and local government employees (33 | 12.6%) make up the most common classes of employment.
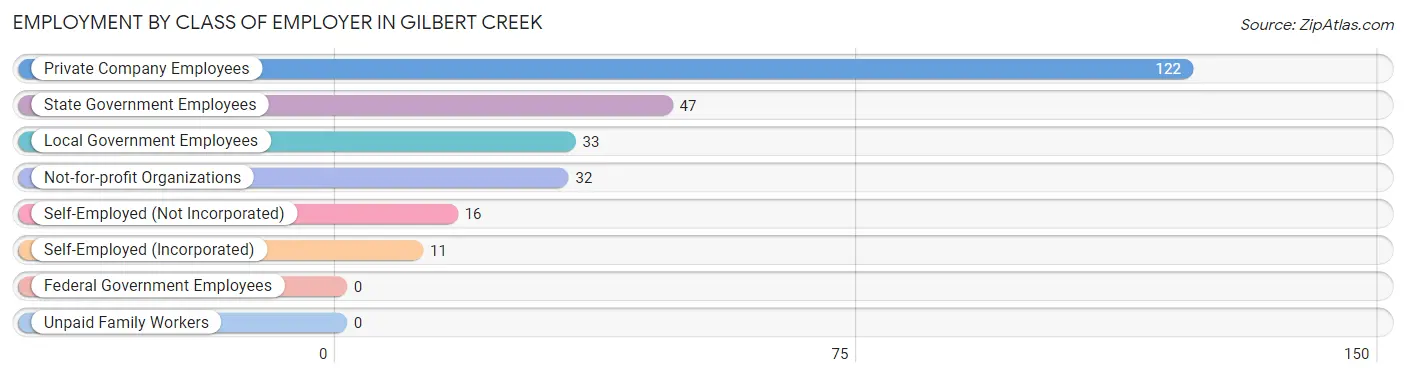
| Employer Class | # Employees | % Employees |
| Private Company Employees | 122 | 46.7% |
| Self-Employed (Incorporated) | 11 | 4.2% |
| Self-Employed (Not Incorporated) | 16 | 6.1% |
| Not-for-profit Organizations | 32 | 12.3% |
| Local Government Employees | 33 | 12.6% |
| State Government Employees | 47 | 18.0% |
| Federal Government Employees | 0 | 0.0% |
| Unpaid Family Workers | 0 | 0.0% |
| Total | 261 | 100.0% |
Employment Status by Age in Gilbert Creek
According to the labor force statistics for Gilbert Creek, out of the total population over 16 years of age (751), 36.4% or 273 individuals are in the labor force, with 4.4% or 12 of them unemployed. The age group with the highest labor force participation rate is 35 to 44 years, with 78.7% or 74 individuals in the labor force. Within the labor force, the 45 to 54 years age range has the highest percentage of unemployed individuals, with 17.9% or 12 of them being unemployed.
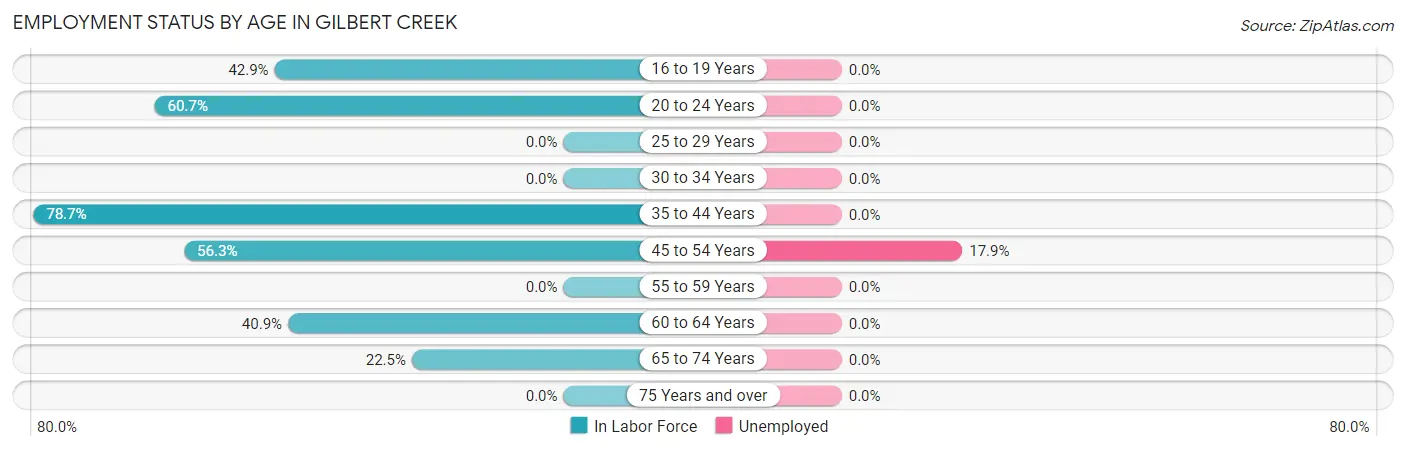
| Age Bracket | In Labor Force | Unemployed |
| 16 to 19 Years | 12 (42.9%) | 0 (0.0%) |
| 20 to 24 Years | 34 (60.7%) | 0 (0.0%) |
| 25 to 29 Years | 0 (0.0%) | 0 (0.0%) |
| 30 to 34 Years | 0 (0.0%) | 0 (0.0%) |
| 35 to 44 Years | 74 (78.7%) | 0 (0.0%) |
| 45 to 54 Years | 67 (56.3%) | 12 (17.9%) |
| 55 to 59 Years | 0 (0.0%) | 0 (0.0%) |
| 60 to 64 Years | 47 (40.9%) | 0 (0.0%) |
| 65 to 74 Years | 39 (22.5%) | 0 (0.0%) |
| 75 Years and over | 0 (0.0%) | 0 (0.0%) |
| Total | 273 (36.4%) | 12 (4.4%) |
Employment Status by Educational Attainment in Gilbert Creek
According to labor force statistics for Gilbert Creek, 39.7% of individuals (188) out of the total population between 25 and 64 years of age (474) are in the labor force, with 6.4% or 12 of them being unemployed. The group with the highest labor force participation rate are those with the educational attainment of college / associate degree, with 63.0% or 46 individuals in the labor force. Within the labor force, individuals with high school diploma education have the highest percentage of unemployment, with 27.9% or 12 of them being unemployed.
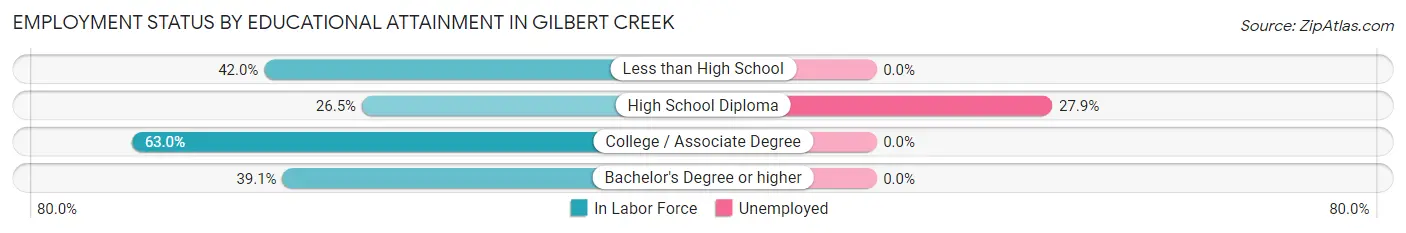
| Educational Attainment | In Labor Force | Unemployed |
| Less than High School | 81 (42.0%) | 0 (0.0%) |
| High School Diploma | 43 (26.5%) | 45 (27.9%) |
| College / Associate Degree | 46 (63.0%) | 0 (0.0%) |
| Bachelor's Degree or higher | 18 (39.1%) | 0 (0.0%) |
| Total | 188 (39.7%) | 30 (6.4%) |
Employment Occupations by Sex in Gilbert Creek
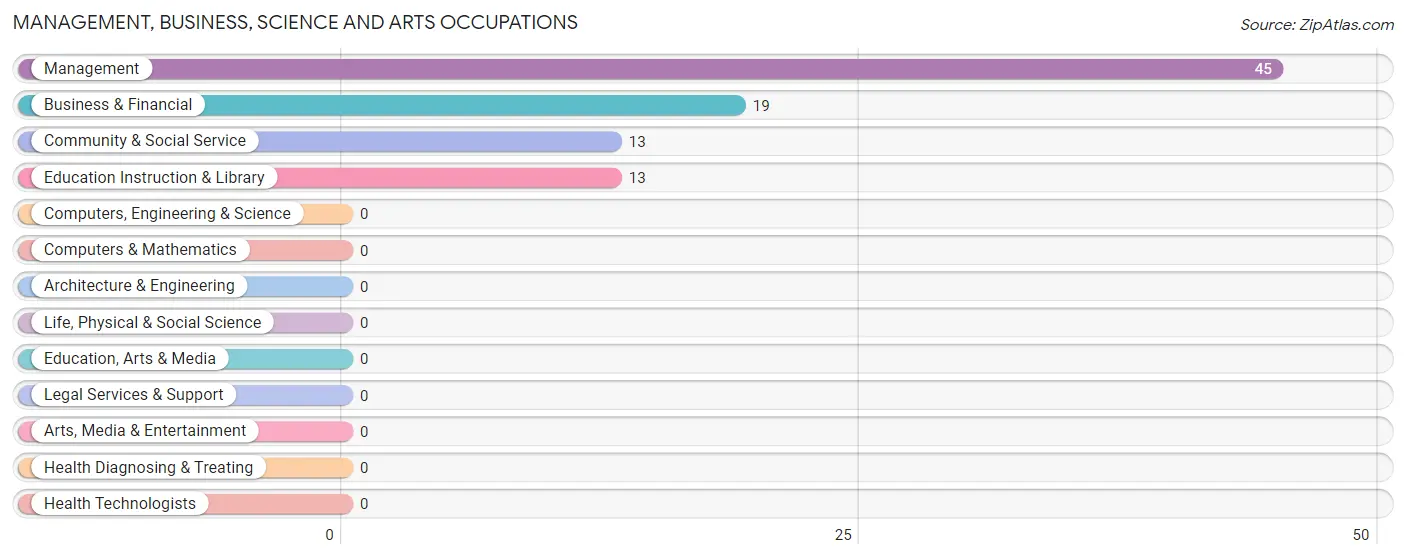
Management, Business, Science and Arts Occupations
The most common Management, Business, Science and Arts occupations in Gilbert Creek are Management (45 | 17.2%), Business & Financial (19 | 7.3%), Community & Social Service (13 | 5.0%), and Education Instruction & Library (13 | 5.0%).
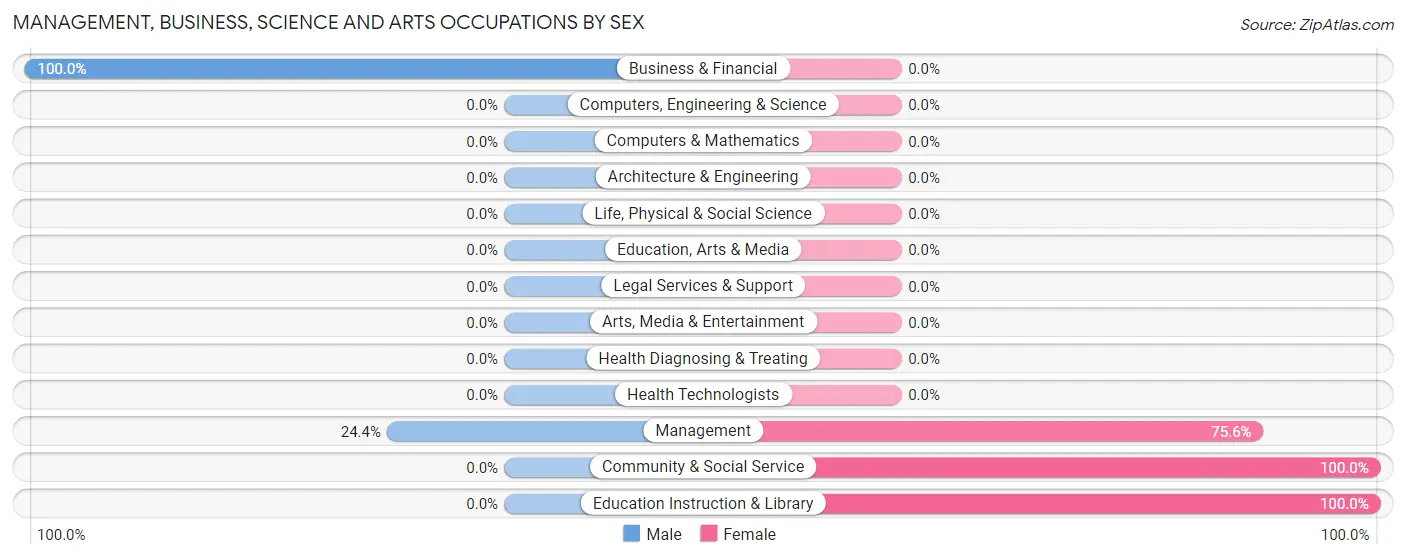
Management, Business, Science and Arts Occupations by Sex
Within the Management, Business, Science and Arts occupations in Gilbert Creek, the most male-oriented occupations are Business & Financial (100.0%), and Management (24.4%), while the most female-oriented occupations are Community & Social Service (100.0%), Education Instruction & Library (100.0%), and Management (75.6%).
| Occupation | Male | Female |
| Management | 11 (24.4%) | 34 (75.6%) |
| Business & Financial | 19 (100.0%) | 0 (0.0%) |
| Computers, Engineering & Science | 0 (0.0%) | 0 (0.0%) |
| Computers & Mathematics | 0 (0.0%) | 0 (0.0%) |
| Architecture & Engineering | 0 (0.0%) | 0 (0.0%) |
| Life, Physical & Social Science | 0 (0.0%) | 0 (0.0%) |
| Community & Social Service | 0 (0.0%) | 13 (100.0%) |
| Education, Arts & Media | 0 (0.0%) | 0 (0.0%) |
| Legal Services & Support | 0 (0.0%) | 0 (0.0%) |
| Education Instruction & Library | 0 (0.0%) | 13 (100.0%) |
| Arts, Media & Entertainment | 0 (0.0%) | 0 (0.0%) |
| Health Diagnosing & Treating | 0 (0.0%) | 0 (0.0%) |
| Health Technologists | 0 (0.0%) | 0 (0.0%) |
| Total (Category) | 30 (39.0%) | 47 (61.0%) |
| Total (Overall) | 124 (47.5%) | 137 (52.5%) |
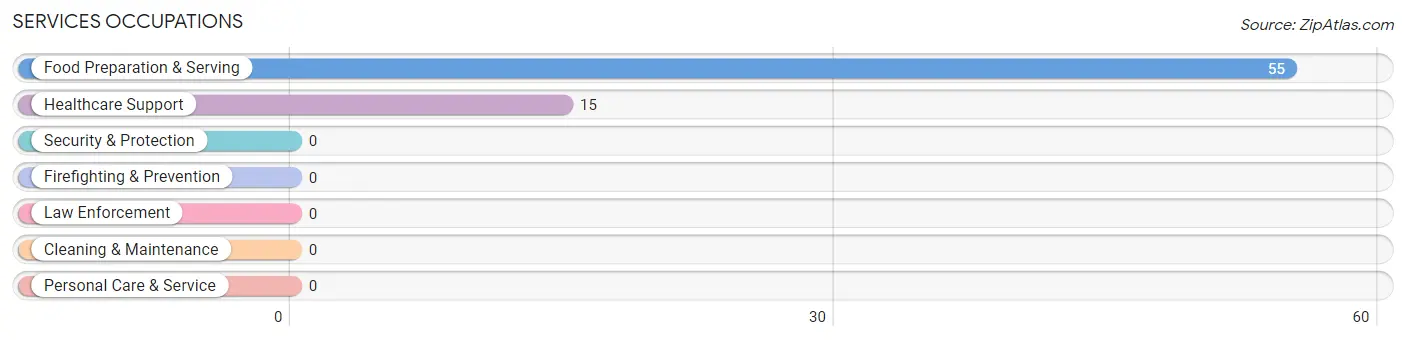
Services Occupations
The most common Services occupations in Gilbert Creek are Food Preparation & Serving (55 | 21.1%), and Healthcare Support (15 | 5.8%).
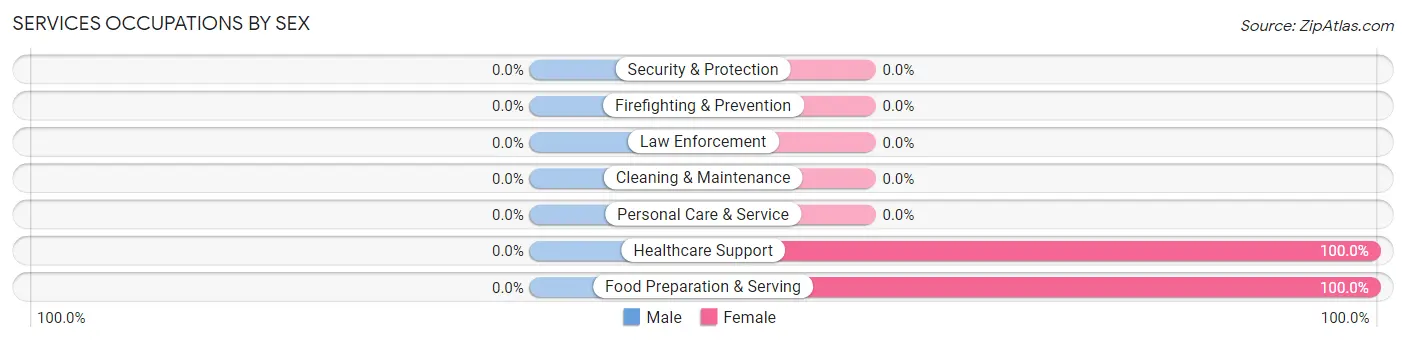
Services Occupations by Sex
| Occupation | Male | Female |
| Healthcare Support | 0 (0.0%) | 15 (100.0%) |
| Security & Protection | 0 (0.0%) | 0 (0.0%) |
| Firefighting & Prevention | 0 (0.0%) | 0 (0.0%) |
| Law Enforcement | 0 (0.0%) | 0 (0.0%) |
| Food Preparation & Serving | 0 (0.0%) | 55 (100.0%) |
| Cleaning & Maintenance | 0 (0.0%) | 0 (0.0%) |
| Personal Care & Service | 0 (0.0%) | 0 (0.0%) |
| Total (Category) | 0 (0.0%) | 70 (100.0%) |
| Total (Overall) | 124 (47.5%) | 137 (52.5%) |
Sales and Office Occupations
The most common Sales and Office occupations in Gilbert Creek are Sales & Related (19 | 7.3%), and Office & Administration (13 | 5.0%).
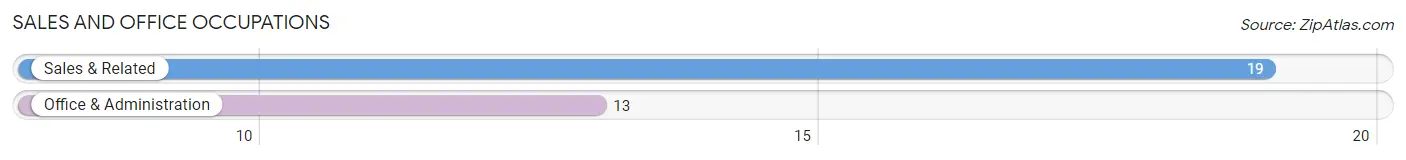
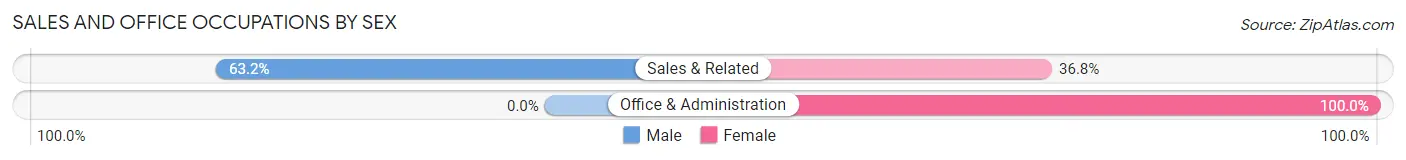
Sales and Office Occupations by Sex
| Occupation | Male | Female |
| Sales & Related | 12 (63.2%) | 7 (36.8%) |
| Office & Administration | 0 (0.0%) | 13 (100.0%) |
| Total (Category) | 12 (37.5%) | 20 (62.5%) |
| Total (Overall) | 124 (47.5%) | 137 (52.5%) |
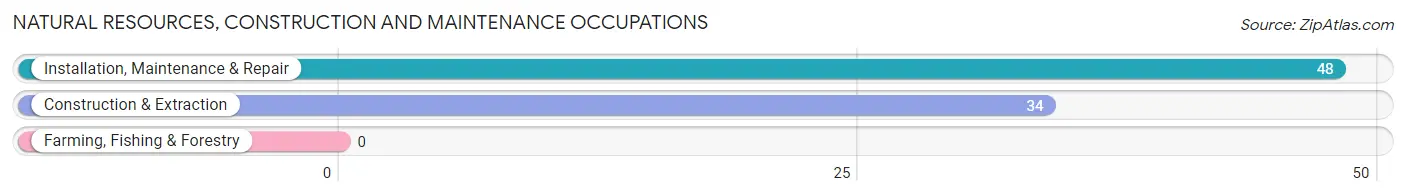
Natural Resources, Construction and Maintenance Occupations
The most common Natural Resources, Construction and Maintenance occupations in Gilbert Creek are Installation, Maintenance & Repair (48 | 18.4%), and Construction & Extraction (34 | 13.0%).
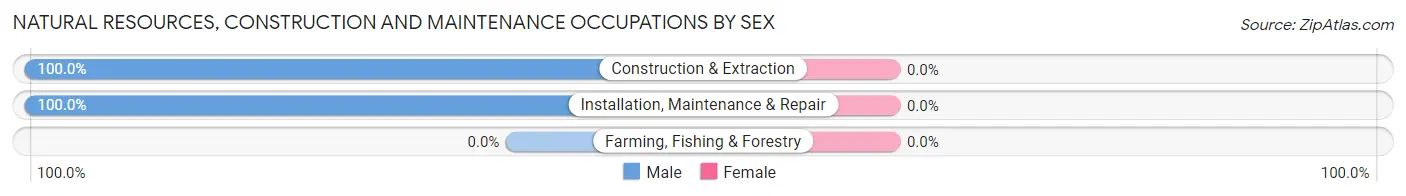
Natural Resources, Construction and Maintenance Occupations by Sex
| Occupation | Male | Female |
| Farming, Fishing & Forestry | 0 (0.0%) | 0 (0.0%) |
| Construction & Extraction | 34 (100.0%) | 0 (0.0%) |
| Installation, Maintenance & Repair | 48 (100.0%) | 0 (0.0%) |
| Total (Category) | 82 (100.0%) | 0 (0.0%) |
| Total (Overall) | 124 (47.5%) | 137 (52.5%) |
Production, Transportation and Moving Occupations
Production, Transportation and Moving Occupations by Sex
| Occupation | Male | Female |
| Production | 0 (0.0%) | 0 (0.0%) |
| Transportation | 0 (0.0%) | 0 (0.0%) |
| Material Moving | 0 (0.0%) | 0 (0.0%) |
| Total (Category) | 0 (0.0%) | 0 (0.0%) |
| Total (Overall) | 124 (47.5%) | 137 (52.5%) |
Employment Industries by Sex in Gilbert Creek
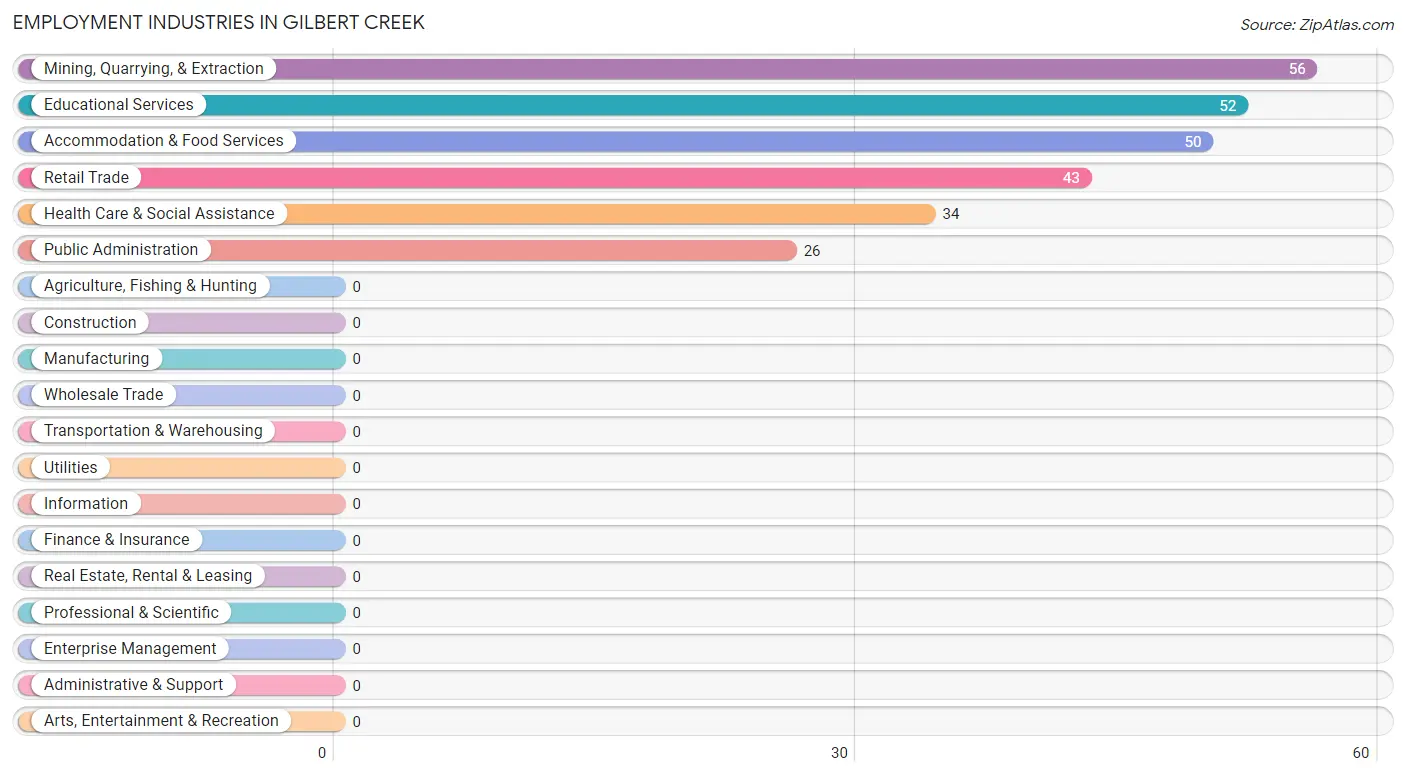
Employment Industries in Gilbert Creek
The major employment industries in Gilbert Creek include Mining, Quarrying, & Extraction (56 | 21.5%), Educational Services (52 | 19.9%), Accommodation & Food Services (50 | 19.2%), Retail Trade (43 | 16.5%), and Health Care & Social Assistance (34 | 13.0%).
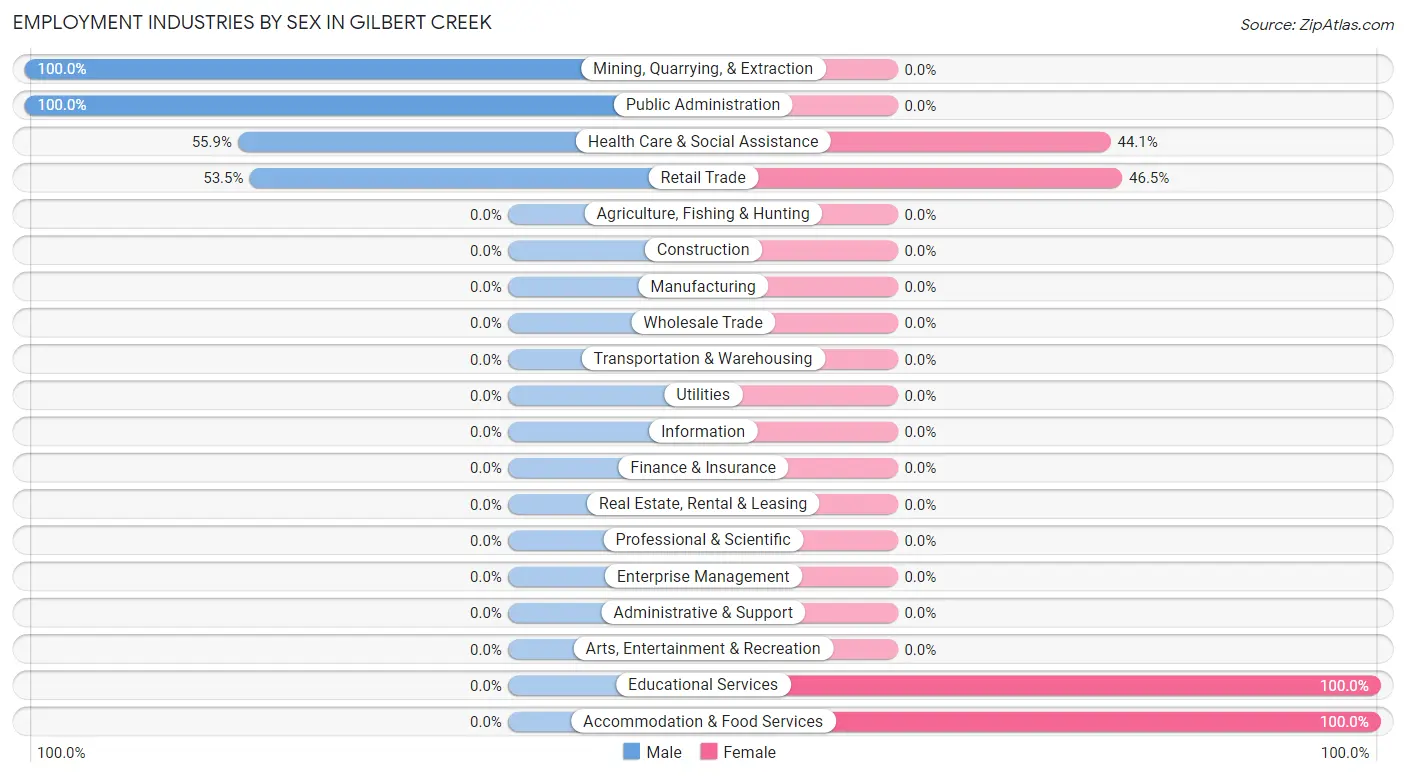
Employment Industries by Sex in Gilbert Creek
The Gilbert Creek industries that see more men than women are Mining, Quarrying, & Extraction (100.0%), Public Administration (100.0%), and Health Care & Social Assistance (55.9%), whereas the industries that tend to have a higher number of women are Educational Services (100.0%), Accommodation & Food Services (100.0%), and Retail Trade (46.5%).
| Industry | Male | Female |
| Agriculture, Fishing & Hunting | 0 (0.0%) | 0 (0.0%) |
| Mining, Quarrying, & Extraction | 56 (100.0%) | 0 (0.0%) |
| Construction | 0 (0.0%) | 0 (0.0%) |
| Manufacturing | 0 (0.0%) | 0 (0.0%) |
| Wholesale Trade | 0 (0.0%) | 0 (0.0%) |
| Retail Trade | 23 (53.5%) | 20 (46.5%) |
| Transportation & Warehousing | 0 (0.0%) | 0 (0.0%) |
| Utilities | 0 (0.0%) | 0 (0.0%) |
| Information | 0 (0.0%) | 0 (0.0%) |
| Finance & Insurance | 0 (0.0%) | 0 (0.0%) |
| Real Estate, Rental & Leasing | 0 (0.0%) | 0 (0.0%) |
| Professional & Scientific | 0 (0.0%) | 0 (0.0%) |
| Enterprise Management | 0 (0.0%) | 0 (0.0%) |
| Administrative & Support | 0 (0.0%) | 0 (0.0%) |
| Educational Services | 0 (0.0%) | 52 (100.0%) |
| Health Care & Social Assistance | 19 (55.9%) | 15 (44.1%) |
| Arts, Entertainment & Recreation | 0 (0.0%) | 0 (0.0%) |
| Accommodation & Food Services | 0 (0.0%) | 50 (100.0%) |
| Public Administration | 26 (100.0%) | 0 (0.0%) |
| Total | 124 (47.5%) | 137 (52.5%) |
Education in Gilbert Creek
School Enrollment in Gilbert Creek
The most common levels of schooling among the 138 students in Gilbert Creek are college / undergraduate (72 | 52.2%), middle school (54 | 39.1%), and high school (12 | 8.7%).
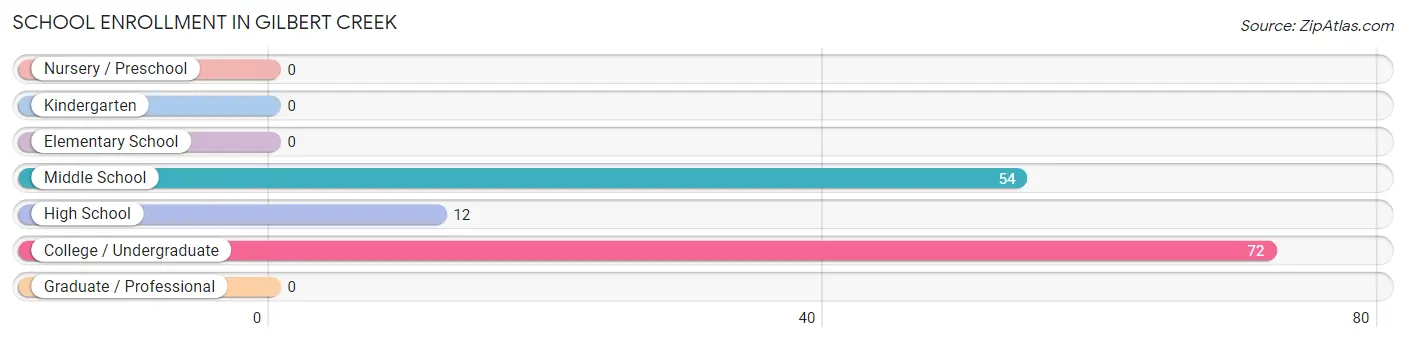
| School Level | # Students | % Students |
| Nursery / Preschool | 0 | 0.0% |
| Kindergarten | 0 | 0.0% |
| Elementary School | 0 | 0.0% |
| Middle School | 54 | 39.1% |
| High School | 12 | 8.7% |
| College / Undergraduate | 72 | 52.2% |
| Graduate / Professional | 0 | 0.0% |
| Total | 138 | 100.0% |
School Enrollment by Age by Funding Source in Gilbert Creek
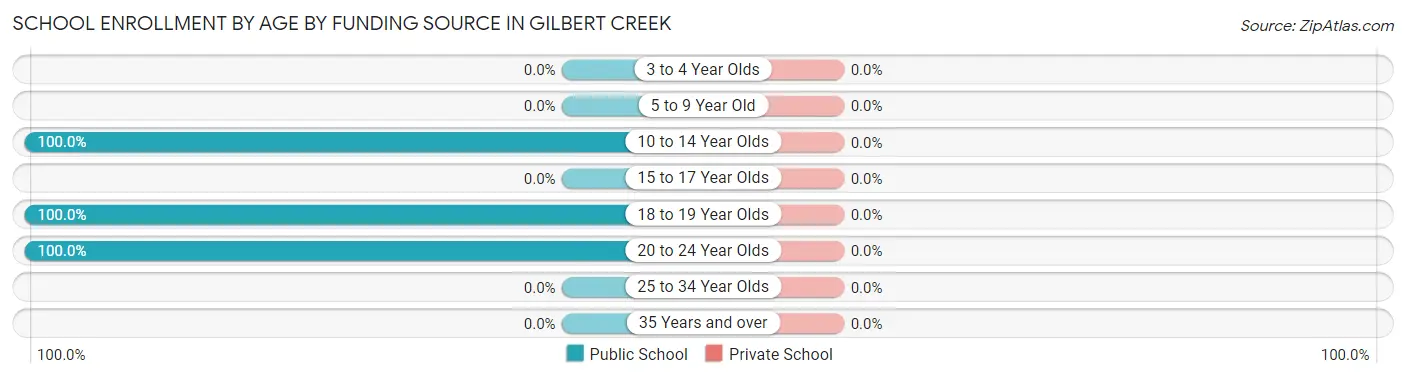
| Age Bracket | Public School | Private School |
| 3 to 4 Year Olds | 0 (0.0%) | 0 (0.0%) |
| 5 to 9 Year Old | 0 (0.0%) | 0 (0.0%) |
| 10 to 14 Year Olds | 54 (100.0%) | 0 (0.0%) |
| 15 to 17 Year Olds | 0 (0.0%) | 0 (0.0%) |
| 18 to 19 Year Olds | 28 (100.0%) | 0 (0.0%) |
| 20 to 24 Year Olds | 56 (100.0%) | 0 (0.0%) |
| 25 to 34 Year Olds | 0 (0.0%) | 0 (0.0%) |
| 35 Years and over | 0 (0.0%) | 0 (0.0%) |
| Total | 138 (100.0%) | 0 (0.0%) |
Educational Attainment by Field of Study in Gilbert Creek
Education (63 | 40.4%), business (33 | 21.1%), computers & mathematics (28 | 17.9%), science & technology (15 | 9.6%), and liberal arts & history (14 | 9.0%) are the most common fields of study among 156 individuals in Gilbert Creek who have obtained a bachelor's degree or higher.
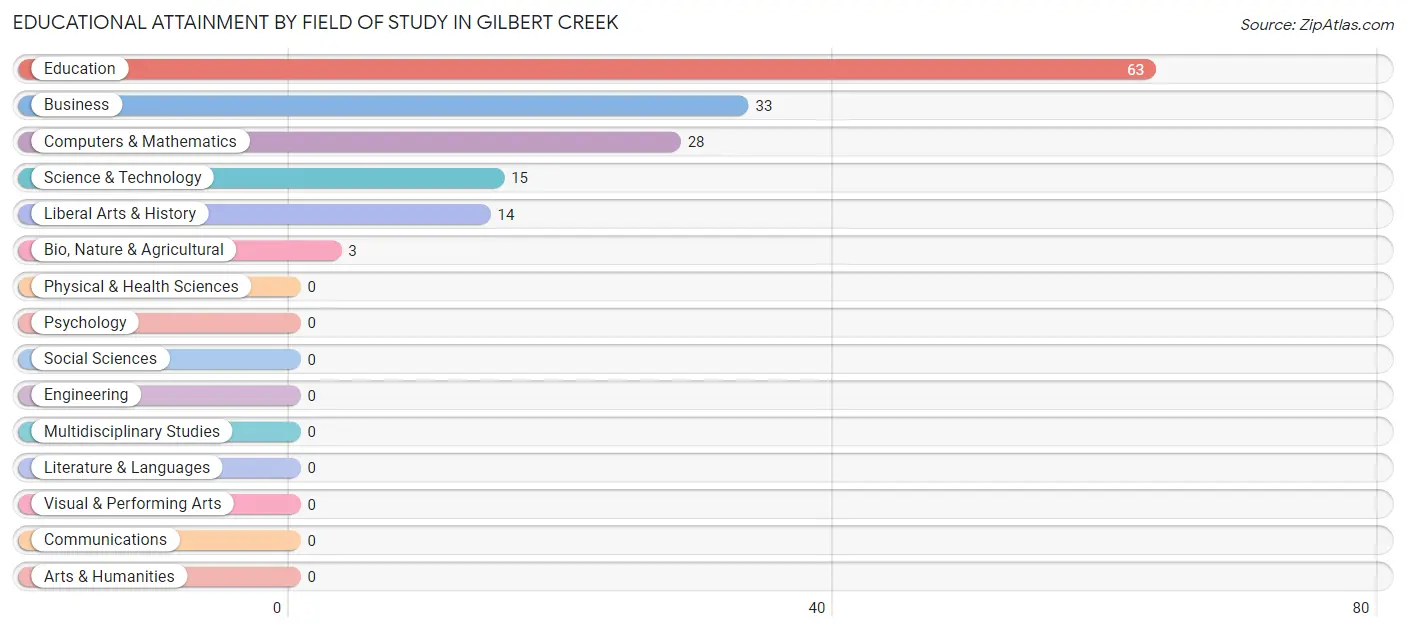
| Field of Study | # Graduates | % Graduates |
| Computers & Mathematics | 28 | 17.9% |
| Bio, Nature & Agricultural | 3 | 1.9% |
| Physical & Health Sciences | 0 | 0.0% |
| Psychology | 0 | 0.0% |
| Social Sciences | 0 | 0.0% |
| Engineering | 0 | 0.0% |
| Multidisciplinary Studies | 0 | 0.0% |
| Science & Technology | 15 | 9.6% |
| Business | 33 | 21.1% |
| Education | 63 | 40.4% |
| Literature & Languages | 0 | 0.0% |
| Liberal Arts & History | 14 | 9.0% |
| Visual & Performing Arts | 0 | 0.0% |
| Communications | 0 | 0.0% |
| Arts & Humanities | 0 | 0.0% |
| Total | 156 | 100.0% |
Transportation & Commute in Gilbert Creek
Vehicle Availability by Sex in Gilbert Creek
The most prevalent vehicle ownership categories in Gilbert Creek are males with 2 vehicles (60, accounting for 48.4%) and females with 2 vehicles (7, making up 43.8%).
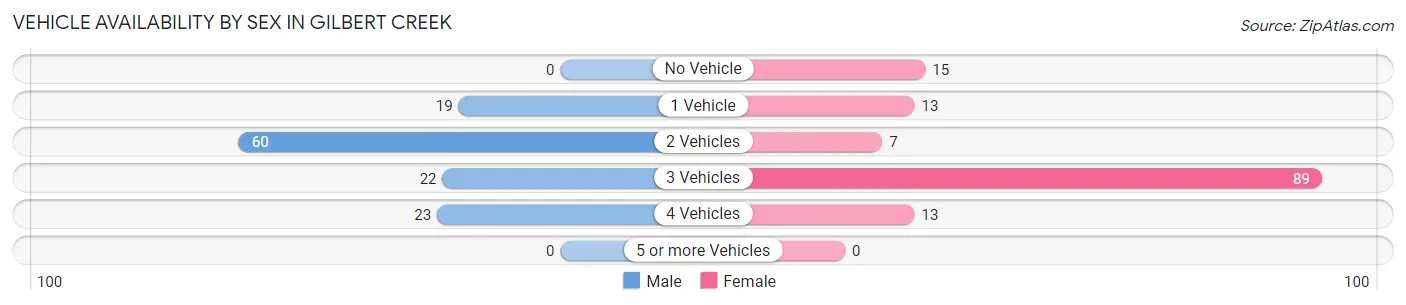
| Vehicles Available | Male | Female |
| No Vehicle | 0 (0.0%) | 15 (11.0%) |
| 1 Vehicle | 19 (15.3%) | 13 (9.5%) |
| 2 Vehicles | 60 (48.4%) | 7 (5.1%) |
| 3 Vehicles | 22 (17.7%) | 89 (65.0%) |
| 4 Vehicles | 23 (18.5%) | 13 (9.5%) |
| 5 or more Vehicles | 0 (0.0%) | 0 (0.0%) |
| Total | 124 (100.0%) | 137 (100.0%) |
Commute Time in Gilbert Creek
The most frequently occuring commute durations in Gilbert Creek are 15 to 19 minutes (88 commuters, 33.7%), 60 to 89 minutes (48 commuters, 18.4%), and 30 to 34 minutes (36 commuters, 13.8%).
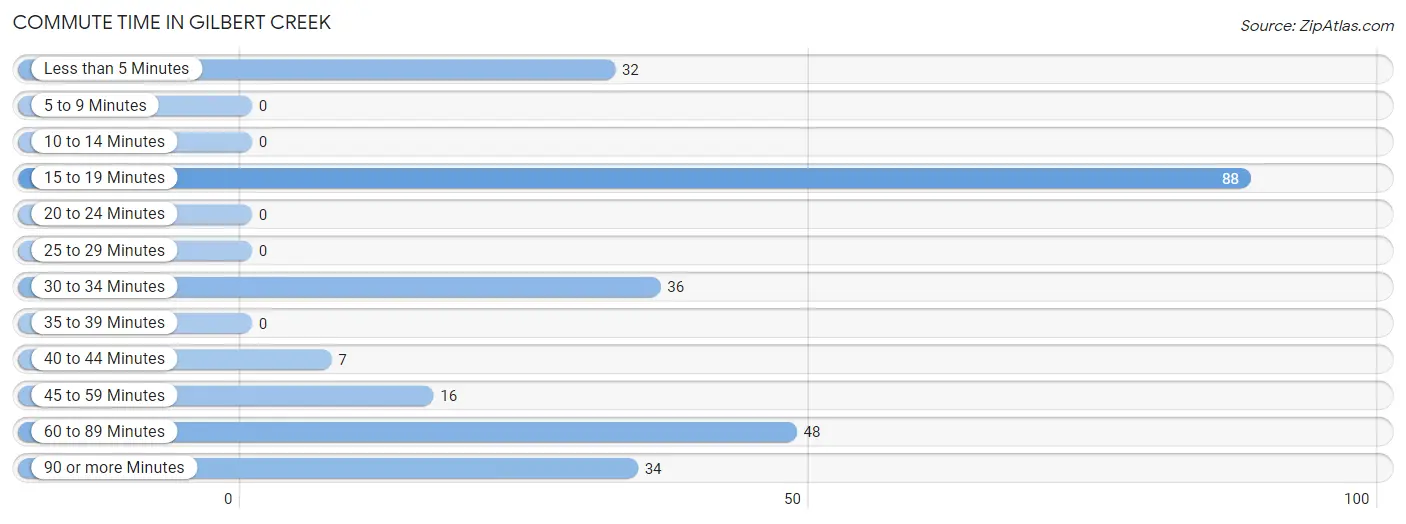
| Commute Time | # Commuters | % Commuters |
| Less than 5 Minutes | 32 | 12.3% |
| 5 to 9 Minutes | 0 | 0.0% |
| 10 to 14 Minutes | 0 | 0.0% |
| 15 to 19 Minutes | 88 | 33.7% |
| 20 to 24 Minutes | 0 | 0.0% |
| 25 to 29 Minutes | 0 | 0.0% |
| 30 to 34 Minutes | 36 | 13.8% |
| 35 to 39 Minutes | 0 | 0.0% |
| 40 to 44 Minutes | 7 | 2.7% |
| 45 to 59 Minutes | 16 | 6.1% |
| 60 to 89 Minutes | 48 | 18.4% |
| 90 or more Minutes | 34 | 13.0% |
Commute Time by Sex in Gilbert Creek
The most common commute times in Gilbert Creek are 60 to 89 minutes (48 commuters, 38.7%) for males and 15 to 19 minutes (65 commuters, 47.4%) for females.
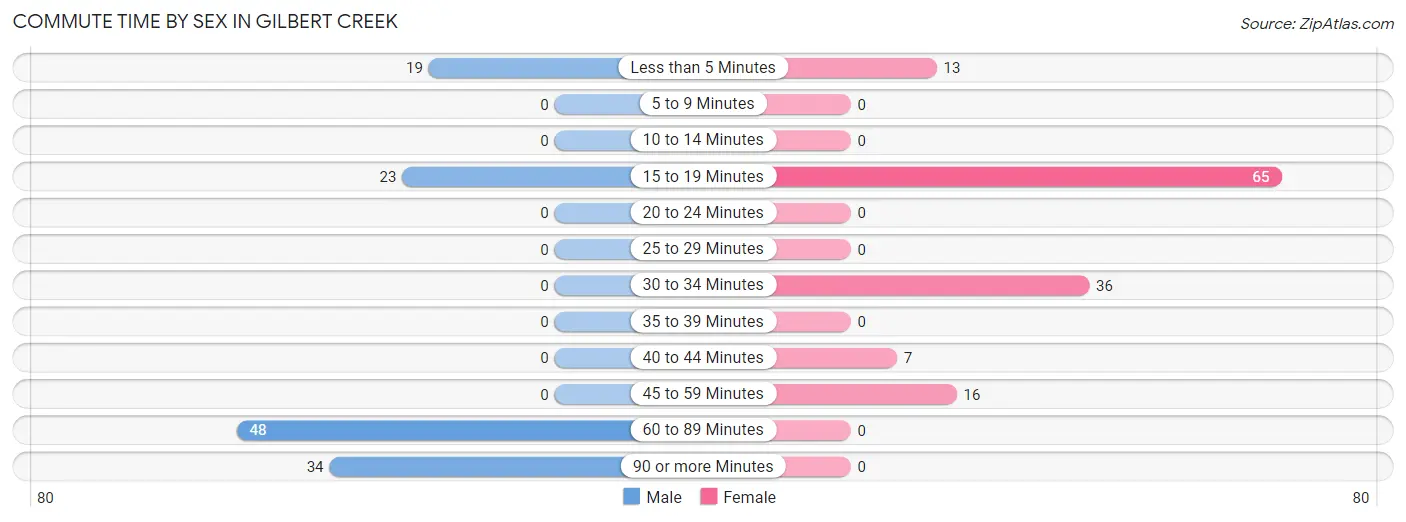
| Commute Time | Male | Female |
| Less than 5 Minutes | 19 (15.3%) | 13 (9.5%) |
| 5 to 9 Minutes | 0 (0.0%) | 0 (0.0%) |
| 10 to 14 Minutes | 0 (0.0%) | 0 (0.0%) |
| 15 to 19 Minutes | 23 (18.5%) | 65 (47.4%) |
| 20 to 24 Minutes | 0 (0.0%) | 0 (0.0%) |
| 25 to 29 Minutes | 0 (0.0%) | 0 (0.0%) |
| 30 to 34 Minutes | 0 (0.0%) | 36 (26.3%) |
| 35 to 39 Minutes | 0 (0.0%) | 0 (0.0%) |
| 40 to 44 Minutes | 0 (0.0%) | 7 (5.1%) |
| 45 to 59 Minutes | 0 (0.0%) | 16 (11.7%) |
| 60 to 89 Minutes | 48 (38.7%) | 0 (0.0%) |
| 90 or more Minutes | 34 (27.4%) | 0 (0.0%) |
Time of Departure to Work by Sex in Gilbert Creek
The most frequent times of departure to work in Gilbert Creek are 12:00 PM to 3:59 PM (48, 38.7%) for males and 10:00 AM to 10:59 AM (47, 34.3%) for females.
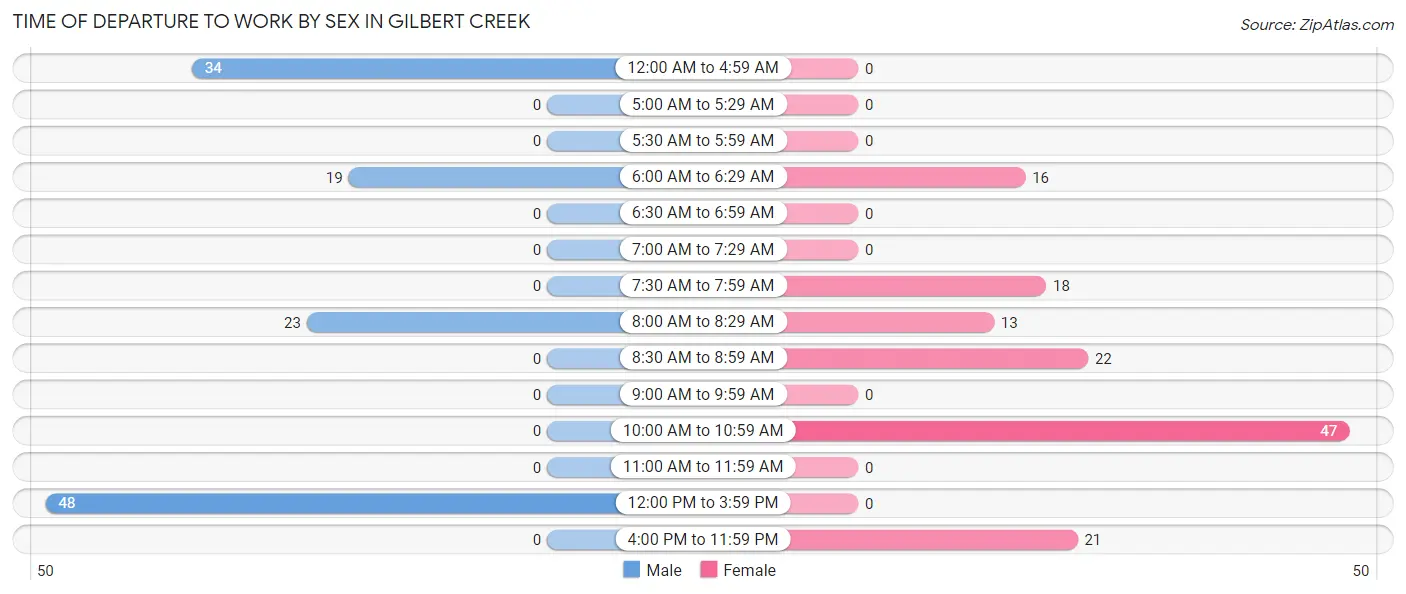
| Time of Departure | Male | Female |
| 12:00 AM to 4:59 AM | 34 (27.4%) | 0 (0.0%) |
| 5:00 AM to 5:29 AM | 0 (0.0%) | 0 (0.0%) |
| 5:30 AM to 5:59 AM | 0 (0.0%) | 0 (0.0%) |
| 6:00 AM to 6:29 AM | 19 (15.3%) | 16 (11.7%) |
| 6:30 AM to 6:59 AM | 0 (0.0%) | 0 (0.0%) |
| 7:00 AM to 7:29 AM | 0 (0.0%) | 0 (0.0%) |
| 7:30 AM to 7:59 AM | 0 (0.0%) | 18 (13.1%) |
| 8:00 AM to 8:29 AM | 23 (18.5%) | 13 (9.5%) |
| 8:30 AM to 8:59 AM | 0 (0.0%) | 22 (16.1%) |
| 9:00 AM to 9:59 AM | 0 (0.0%) | 0 (0.0%) |
| 10:00 AM to 10:59 AM | 0 (0.0%) | 47 (34.3%) |
| 11:00 AM to 11:59 AM | 0 (0.0%) | 0 (0.0%) |
| 12:00 PM to 3:59 PM | 48 (38.7%) | 0 (0.0%) |
| 4:00 PM to 11:59 PM | 0 (0.0%) | 21 (15.3%) |
| Total | 124 (100.0%) | 137 (100.0%) |
Housing Occupancy in Gilbert Creek
Occupancy by Ownership in Gilbert Creek
Of the total 300 dwellings in Gilbert Creek, owner-occupied units account for 250 (83.3%), while renter-occupied units make up 50 (16.7%).
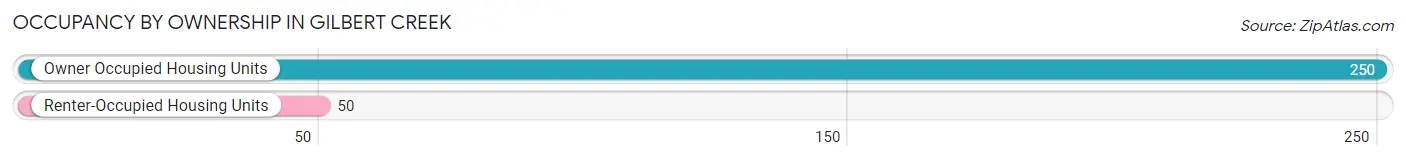
| Occupancy | # Housing Units | % Housing Units |
| Owner Occupied Housing Units | 250 | 83.3% |
| Renter-Occupied Housing Units | 50 | 16.7% |
| Total Occupied Housing Units | 300 | 100.0% |
Occupancy by Household Size in Gilbert Creek
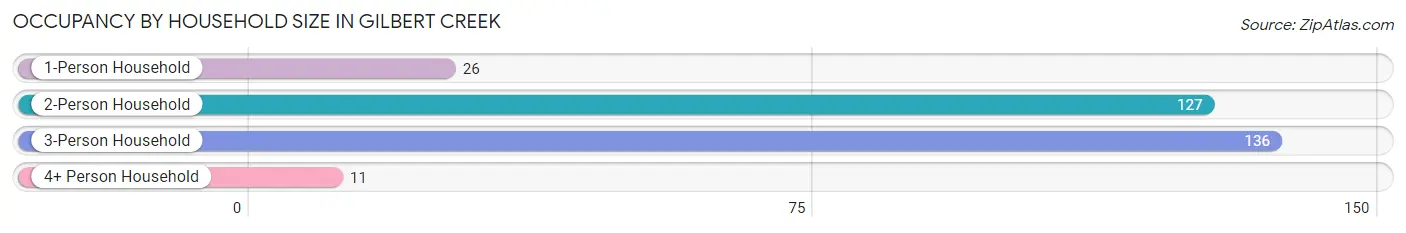
| Household Size | # Housing Units | % Housing Units |
| 1-Person Household | 26 | 8.7% |
| 2-Person Household | 127 | 42.3% |
| 3-Person Household | 136 | 45.3% |
| 4+ Person Household | 11 | 3.7% |
| Total Housing Units | 300 | 100.0% |
Occupancy by Ownership by Household Size in Gilbert Creek
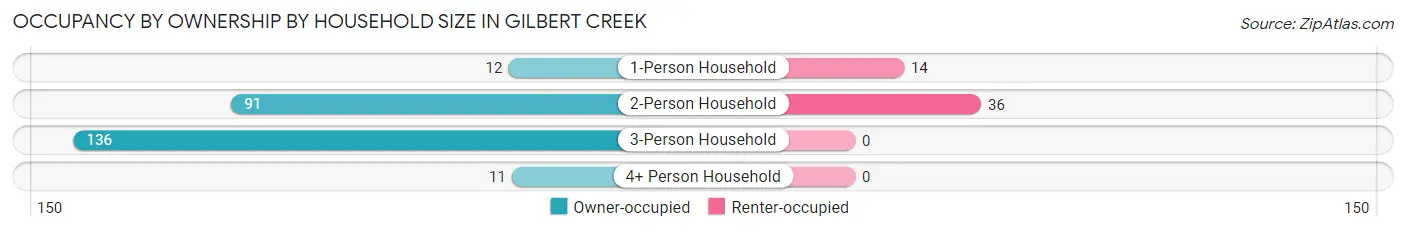
| Household Size | Owner-occupied | Renter-occupied |
| 1-Person Household | 12 (46.2%) | 14 (53.8%) |
| 2-Person Household | 91 (71.7%) | 36 (28.3%) |
| 3-Person Household | 136 (100.0%) | 0 (0.0%) |
| 4+ Person Household | 11 (100.0%) | 0 (0.0%) |
| Total Housing Units | 250 (83.3%) | 50 (16.7%) |
Occupancy by Educational Attainment in Gilbert Creek
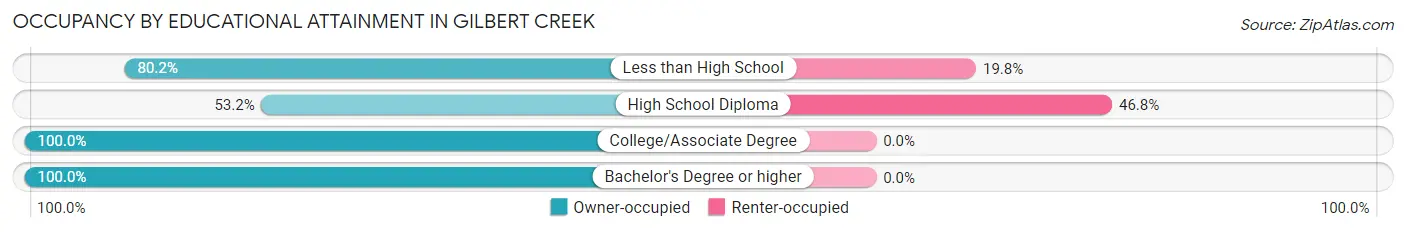
| Household Size | Owner-occupied | Renter-occupied |
| Less than High School | 85 (80.2%) | 21 (19.8%) |
| High School Diploma | 33 (53.2%) | 29 (46.8%) |
| College/Associate Degree | 53 (100.0%) | 0 (0.0%) |
| Bachelor's Degree or higher | 79 (100.0%) | 0 (0.0%) |
Occupancy by Age of Householder in Gilbert Creek
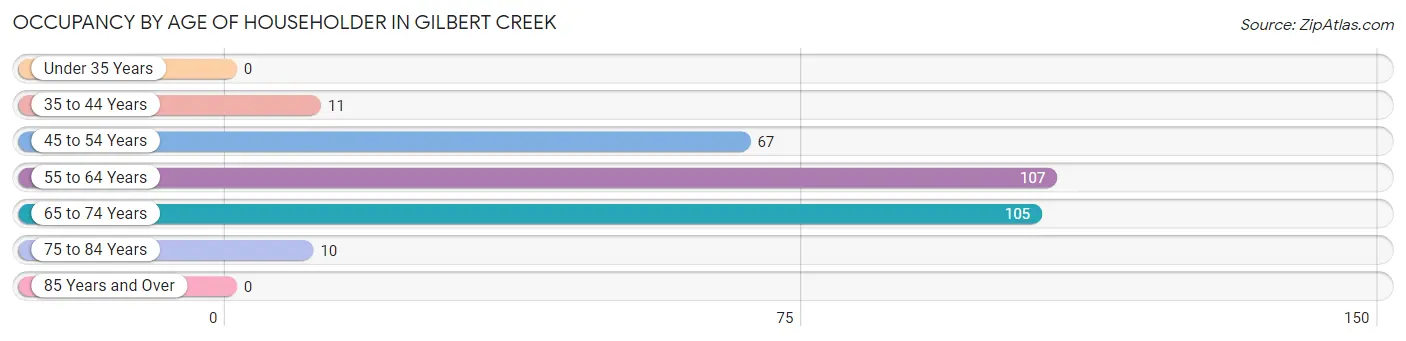
| Age Bracket | # Households | % Households |
| Under 35 Years | 0 | 0.0% |
| 35 to 44 Years | 11 | 3.7% |
| 45 to 54 Years | 67 | 22.3% |
| 55 to 64 Years | 107 | 35.7% |
| 65 to 74 Years | 105 | 35.0% |
| 75 to 84 Years | 10 | 3.3% |
| 85 Years and Over | 0 | 0.0% |
| Total | 300 | 100.0% |
Housing Finances in Gilbert Creek
Median Income by Occupancy in Gilbert Creek
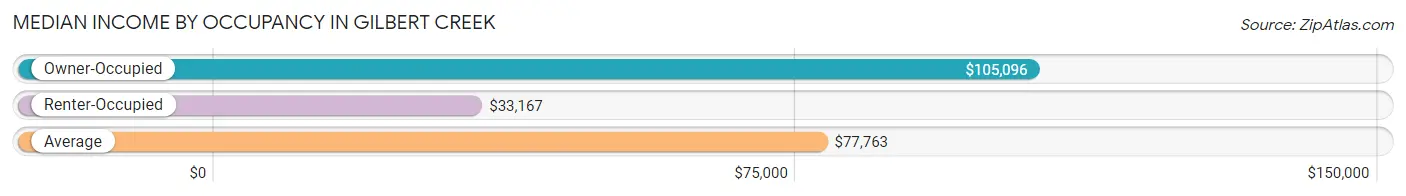
| Occupancy Type | # Households | Median Income |
| Owner-Occupied | 250 (83.3%) | $105,096 |
| Renter-Occupied | 50 (16.7%) | $33,167 |
| Average | 300 (100.0%) | $77,763 |
Occupancy by Householder Income Bracket in Gilbert Creek
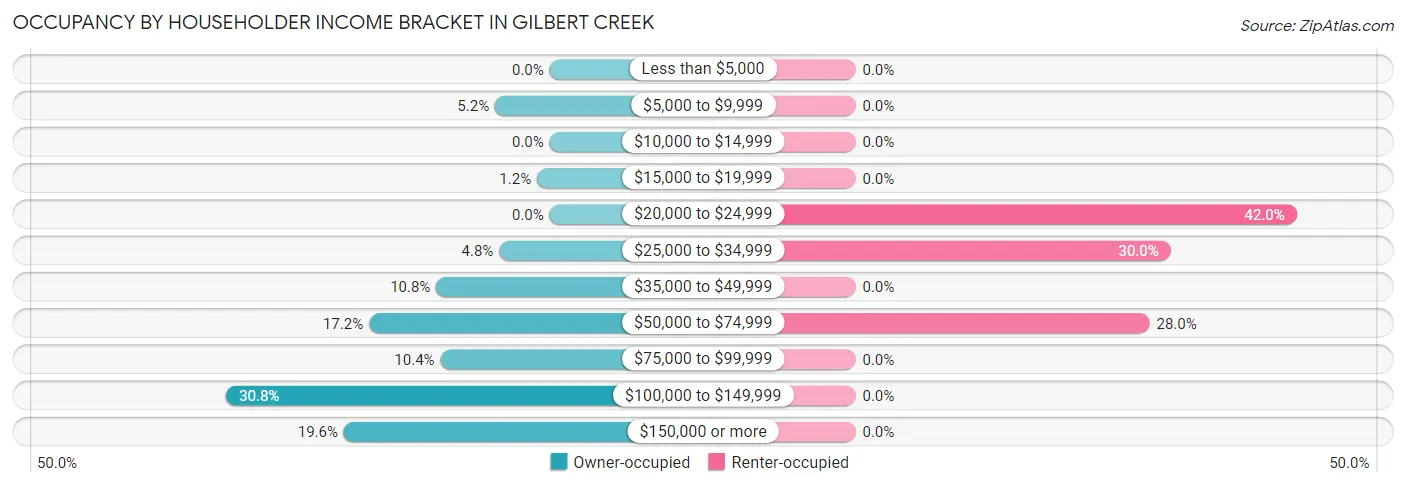
| Income Bracket | Owner-occupied | Renter-occupied |
| Less than $5,000 | 0 (0.0%) | 0 (0.0%) |
| $5,000 to $9,999 | 13 (5.2%) | 0 (0.0%) |
| $10,000 to $14,999 | 0 (0.0%) | 0 (0.0%) |
| $15,000 to $19,999 | 3 (1.2%) | 0 (0.0%) |
| $20,000 to $24,999 | 0 (0.0%) | 21 (42.0%) |
| $25,000 to $34,999 | 12 (4.8%) | 15 (30.0%) |
| $35,000 to $49,999 | 27 (10.8%) | 0 (0.0%) |
| $50,000 to $74,999 | 43 (17.2%) | 14 (28.0%) |
| $75,000 to $99,999 | 26 (10.4%) | 0 (0.0%) |
| $100,000 to $149,999 | 77 (30.8%) | 0 (0.0%) |
| $150,000 or more | 49 (19.6%) | 0 (0.0%) |
| Total | 250 (100.0%) | 50 (100.0%) |
Monthly Housing Cost Tiers in Gilbert Creek
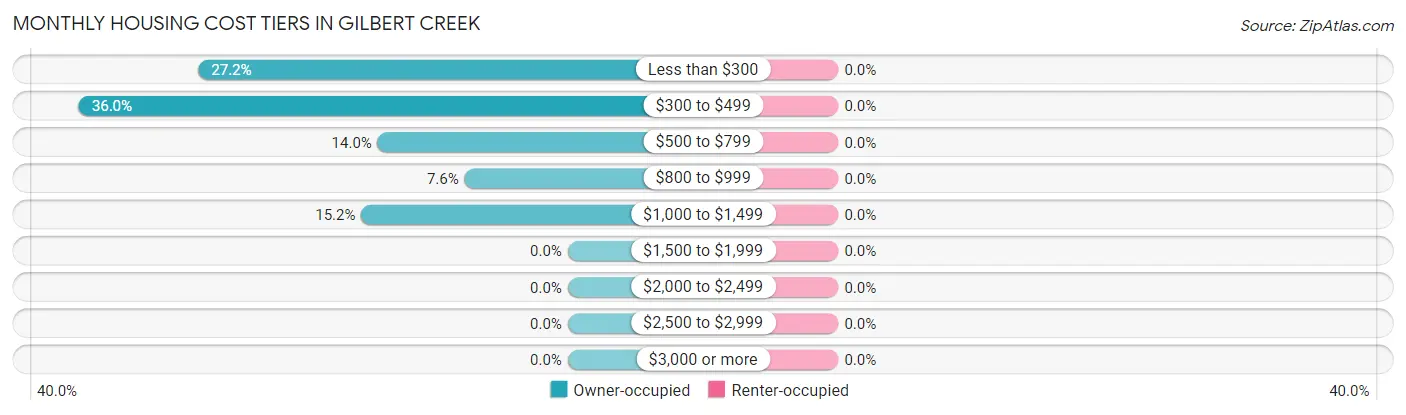
| Monthly Cost | Owner-occupied | Renter-occupied |
| Less than $300 | 68 (27.2%) | 0 (0.0%) |
| $300 to $499 | 90 (36.0%) | 0 (0.0%) |
| $500 to $799 | 35 (14.0%) | 0 (0.0%) |
| $800 to $999 | 19 (7.6%) | 0 (0.0%) |
| $1,000 to $1,499 | 38 (15.2%) | 0 (0.0%) |
| $1,500 to $1,999 | 0 (0.0%) | 0 (0.0%) |
| $2,000 to $2,499 | 0 (0.0%) | 0 (0.0%) |
| $2,500 to $2,999 | 0 (0.0%) | 0 (0.0%) |
| $3,000 or more | 0 (0.0%) | 0 (0.0%) |
| Total | 250 (100.0%) | 50 (100.0%) |
Physical Housing Characteristics in Gilbert Creek
Housing Structures in Gilbert Creek
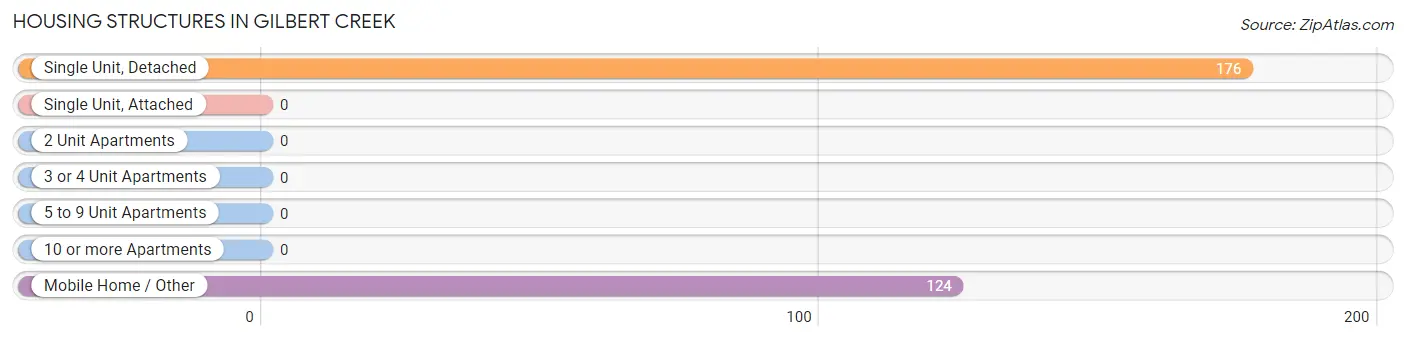
| Structure Type | # Housing Units | % Housing Units |
| Single Unit, Detached | 176 | 58.7% |
| Single Unit, Attached | 0 | 0.0% |
| 2 Unit Apartments | 0 | 0.0% |
| 3 or 4 Unit Apartments | 0 | 0.0% |
| 5 to 9 Unit Apartments | 0 | 0.0% |
| 10 or more Apartments | 0 | 0.0% |
| Mobile Home / Other | 124 | 41.3% |
| Total | 300 | 100.0% |
Housing Structures by Occupancy in Gilbert Creek
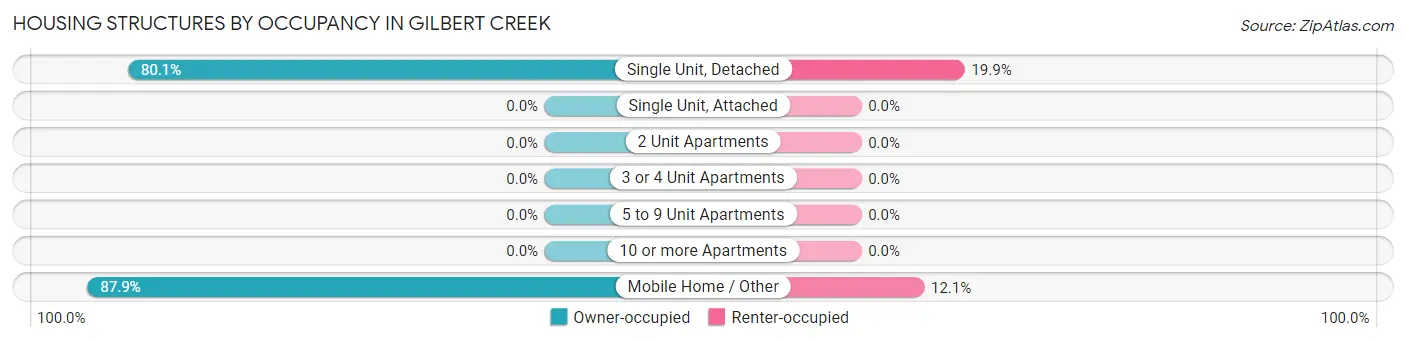
| Structure Type | Owner-occupied | Renter-occupied |
| Single Unit, Detached | 141 (80.1%) | 35 (19.9%) |
| Single Unit, Attached | 0 (0.0%) | 0 (0.0%) |
| 2 Unit Apartments | 0 (0.0%) | 0 (0.0%) |
| 3 or 4 Unit Apartments | 0 (0.0%) | 0 (0.0%) |
| 5 to 9 Unit Apartments | 0 (0.0%) | 0 (0.0%) |
| 10 or more Apartments | 0 (0.0%) | 0 (0.0%) |
| Mobile Home / Other | 109 (87.9%) | 15 (12.1%) |
| Total | 250 (83.3%) | 50 (16.7%) |
Housing Structures by Number of Rooms in Gilbert Creek
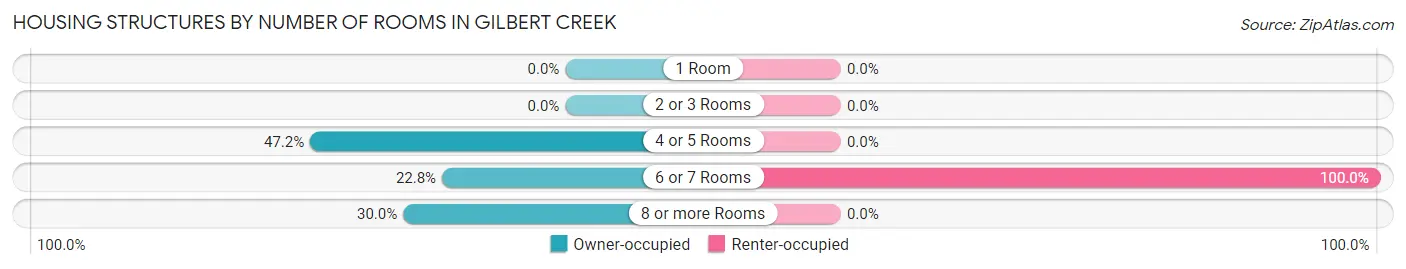
| Number of Rooms | Owner-occupied | Renter-occupied |
| 1 Room | 0 (0.0%) | 0 (0.0%) |
| 2 or 3 Rooms | 0 (0.0%) | 0 (0.0%) |
| 4 or 5 Rooms | 118 (47.2%) | 0 (0.0%) |
| 6 or 7 Rooms | 57 (22.8%) | 50 (100.0%) |
| 8 or more Rooms | 75 (30.0%) | 0 (0.0%) |
| Total | 250 (100.0%) | 50 (100.0%) |
Housing Structure by Heating Type in Gilbert Creek
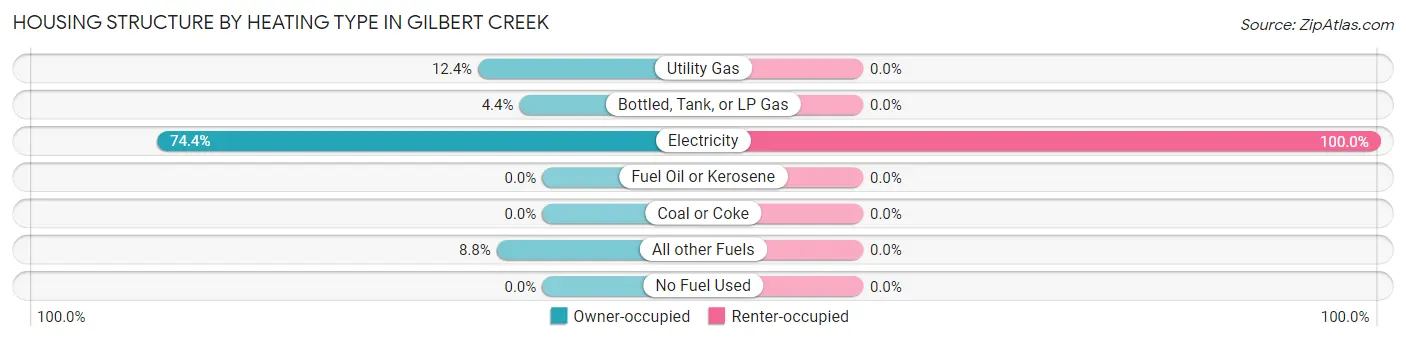
| Heating Type | Owner-occupied | Renter-occupied |
| Utility Gas | 31 (12.4%) | 0 (0.0%) |
| Bottled, Tank, or LP Gas | 11 (4.4%) | 0 (0.0%) |
| Electricity | 186 (74.4%) | 50 (100.0%) |
| Fuel Oil or Kerosene | 0 (0.0%) | 0 (0.0%) |
| Coal or Coke | 0 (0.0%) | 0 (0.0%) |
| All other Fuels | 22 (8.8%) | 0 (0.0%) |
| No Fuel Used | 0 (0.0%) | 0 (0.0%) |
| Total | 250 (100.0%) | 50 (100.0%) |
Household Vehicle Usage in Gilbert Creek
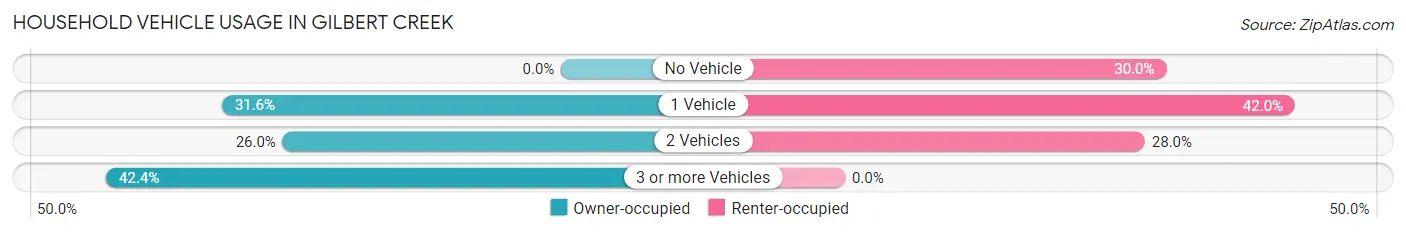
| Vehicles per Household | Owner-occupied | Renter-occupied |
| No Vehicle | 0 (0.0%) | 15 (30.0%) |
| 1 Vehicle | 79 (31.6%) | 21 (42.0%) |
| 2 Vehicles | 65 (26.0%) | 14 (28.0%) |
| 3 or more Vehicles | 106 (42.4%) | 0 (0.0%) |
| Total | 250 (100.0%) | 50 (100.0%) |
Real Estate & Mortgages in Gilbert Creek
Real Estate and Mortgage Overview in Gilbert Creek
| Characteristic | Without Mortgage | With Mortgage |
| Housing Units | 235 | 15 |
| Median Property Value | $108,900 | $0 |
| Median Household Income | $105,817 | $0 |
| Monthly Housing Costs | $342 | $0 |
| Real Estate Taxes | $261 | $0 |
Property Value by Mortgage Status in Gilbert Creek
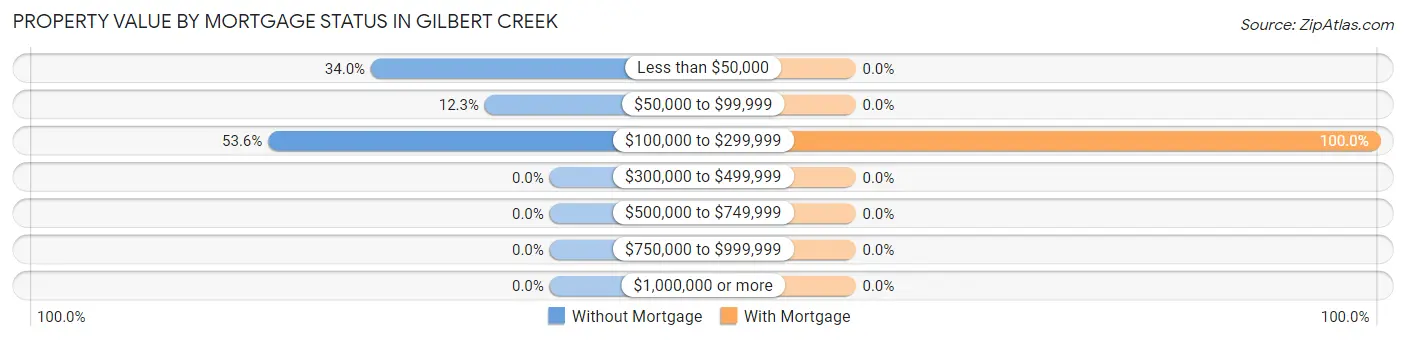
| Property Value | Without Mortgage | With Mortgage |
| Less than $50,000 | 80 (34.0%) | 0 (0.0%) |
| $50,000 to $99,999 | 29 (12.3%) | 0 (0.0%) |
| $100,000 to $299,999 | 126 (53.6%) | 15 (100.0%) |
| $300,000 to $499,999 | 0 (0.0%) | 0 (0.0%) |
| $500,000 to $749,999 | 0 (0.0%) | 0 (0.0%) |
| $750,000 to $999,999 | 0 (0.0%) | 0 (0.0%) |
| $1,000,000 or more | 0 (0.0%) | 0 (0.0%) |
| Total | 235 (100.0%) | 15 (100.0%) |
Household Income by Mortgage Status in Gilbert Creek
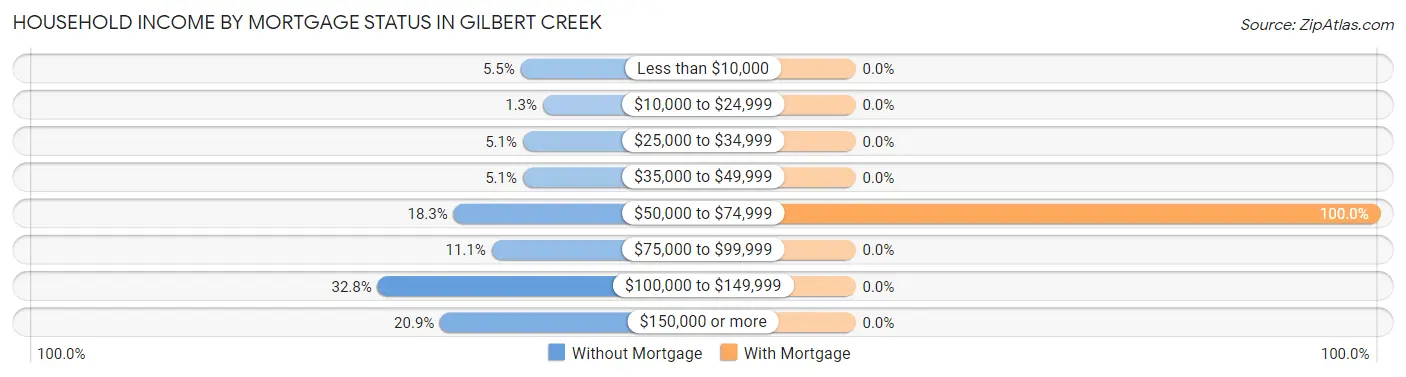
| Household Income | Without Mortgage | With Mortgage |
| Less than $10,000 | 13 (5.5%) | 0 (0.0%) |
| $10,000 to $24,999 | 3 (1.3%) | 0 (0.0%) |
| $25,000 to $34,999 | 12 (5.1%) | 0 (0.0%) |
| $35,000 to $49,999 | 12 (5.1%) | 0 (0.0%) |
| $50,000 to $74,999 | 43 (18.3%) | 15 (100.0%) |
| $75,000 to $99,999 | 26 (11.1%) | 0 (0.0%) |
| $100,000 to $149,999 | 77 (32.8%) | 0 (0.0%) |
| $150,000 or more | 49 (20.8%) | 0 (0.0%) |
| Total | 235 (100.0%) | 15 (100.0%) |
Property Value to Household Income Ratio in Gilbert Creek
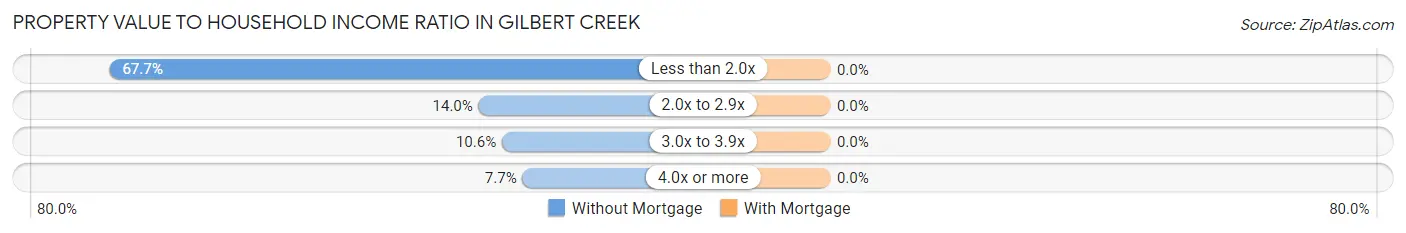
| Value-to-Income Ratio | Without Mortgage | With Mortgage |
| Less than 2.0x | 159 (67.7%) | 0 (0.0%) |
| 2.0x to 2.9x | 33 (14.0%) | 0 (0.0%) |
| 3.0x to 3.9x | 25 (10.6%) | 0 (0.0%) |
| 4.0x or more | 18 (7.7%) | 0 (0.0%) |
| Total | 235 (100.0%) | 15 (100.0%) |
Real Estate Taxes by Mortgage Status in Gilbert Creek
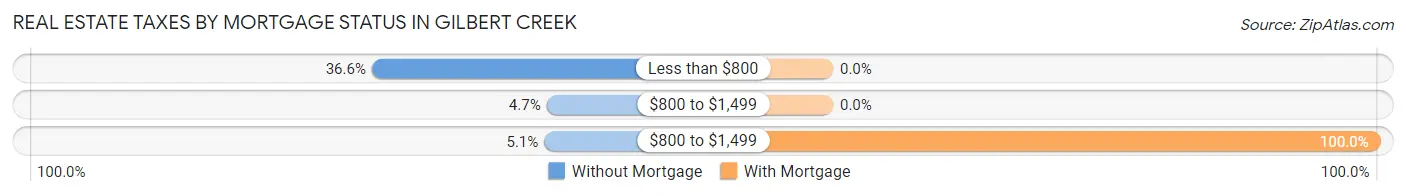
| Property Taxes | Without Mortgage | With Mortgage |
| Less than $800 | 86 (36.6%) | 0 (0.0%) |
| $800 to $1,499 | 11 (4.7%) | 0 (0.0%) |
| $800 to $1,499 | 12 (5.1%) | 15 (100.0%) |
| Total | 235 (100.0%) | 15 (100.0%) |
Health & Disability in Gilbert Creek
Health Insurance Coverage by Age in Gilbert Creek
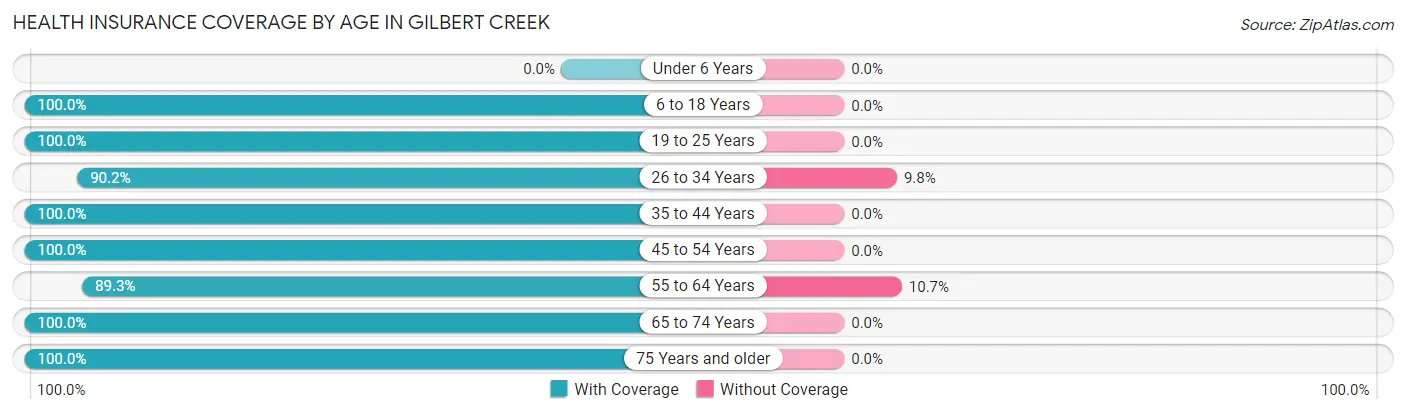
| Age Bracket | With Coverage | Without Coverage |
| Under 6 Years | 0 (0.0%) | 0 (0.0%) |
| 6 to 18 Years | 82 (100.0%) | 0 (0.0%) |
| 19 to 25 Years | 56 (100.0%) | 0 (0.0%) |
| 26 to 34 Years | 101 (90.2%) | 11 (9.8%) |
| 35 to 44 Years | 94 (100.0%) | 0 (0.0%) |
| 45 to 54 Years | 119 (100.0%) | 0 (0.0%) |
| 55 to 64 Years | 133 (89.3%) | 16 (10.7%) |
| 65 to 74 Years | 173 (100.0%) | 0 (0.0%) |
| 75 Years and older | 20 (100.0%) | 0 (0.0%) |
| Total | 778 (96.7%) | 27 (3.4%) |
Health Insurance Coverage by Citizenship Status in Gilbert Creek
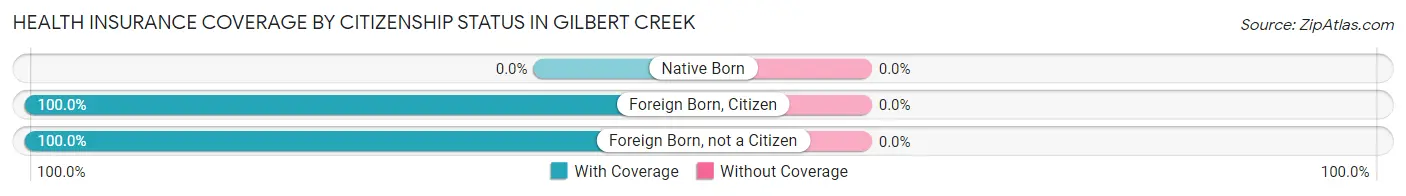
| Citizenship Status | With Coverage | Without Coverage |
| Native Born | 0 (0.0%) | 0 (0.0%) |
| Foreign Born, Citizen | 82 (100.0%) | 0 (0.0%) |
| Foreign Born, not a Citizen | 56 (100.0%) | 0 (0.0%) |
Health Insurance Coverage by Household Income in Gilbert Creek
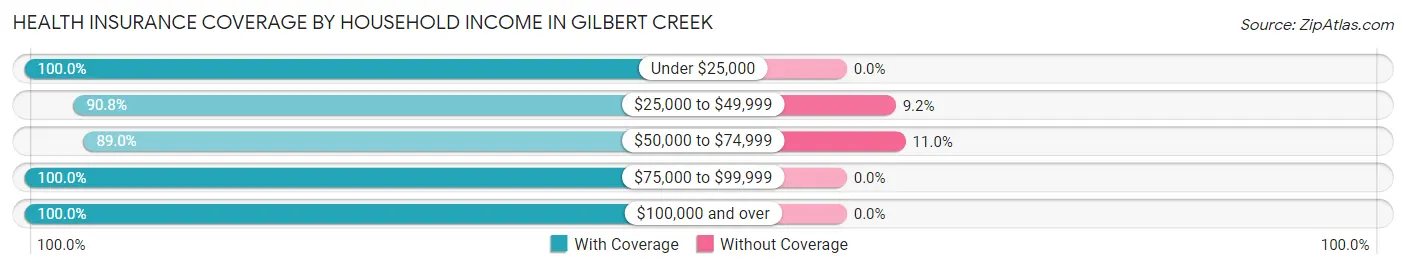
| Household Income | With Coverage | Without Coverage |
| Under $25,000 | 78 (100.0%) | 0 (0.0%) |
| $25,000 to $49,999 | 109 (90.8%) | 11 (9.2%) |
| $50,000 to $74,999 | 129 (89.0%) | 16 (11.0%) |
| $75,000 to $99,999 | 39 (100.0%) | 0 (0.0%) |
| $100,000 and over | 423 (100.0%) | 0 (0.0%) |
Public vs Private Health Insurance Coverage by Age in Gilbert Creek
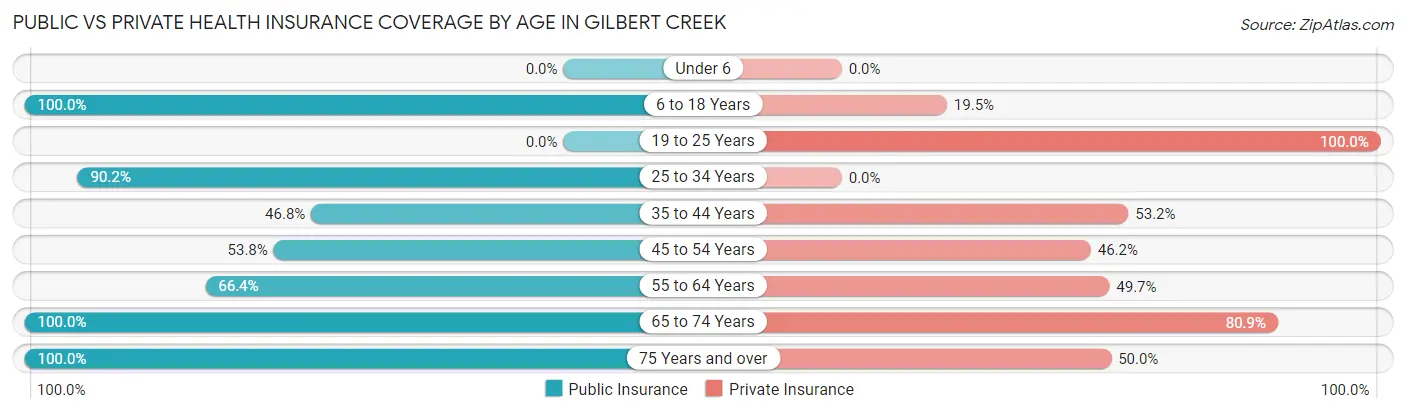
| Age Bracket | Public Insurance | Private Insurance |
| Under 6 | 0 (0.0%) | 0 (0.0%) |
| 6 to 18 Years | 82 (100.0%) | 16 (19.5%) |
| 19 to 25 Years | 0 (0.0%) | 56 (100.0%) |
| 25 to 34 Years | 101 (90.2%) | 0 (0.0%) |
| 35 to 44 Years | 44 (46.8%) | 50 (53.2%) |
| 45 to 54 Years | 64 (53.8%) | 55 (46.2%) |
| 55 to 64 Years | 99 (66.4%) | 74 (49.7%) |
| 65 to 74 Years | 173 (100.0%) | 140 (80.9%) |
| 75 Years and over | 20 (100.0%) | 10 (50.0%) |
| Total | 583 (72.4%) | 401 (49.8%) |
Disability Status by Sex by Age in Gilbert Creek
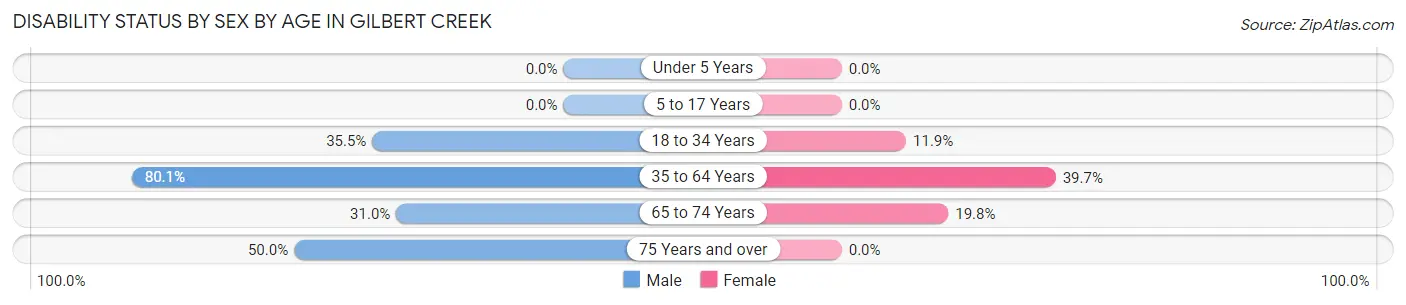
| Age Bracket | Male | Female |
| Under 5 Years | 0 (0.0%) | 0 (0.0%) |
| 5 to 17 Years | 0 (0.0%) | 0 (0.0%) |
| 18 to 34 Years | 22 (35.5%) | 16 (11.9%) |
| 35 to 64 Years | 181 (80.1%) | 54 (39.7%) |
| 65 to 74 Years | 27 (31.0%) | 17 (19.8%) |
| 75 Years and over | 10 (50.0%) | 0 (0.0%) |
Disability Class by Sex by Age in Gilbert Creek
Disability Class: Hearing Difficulty
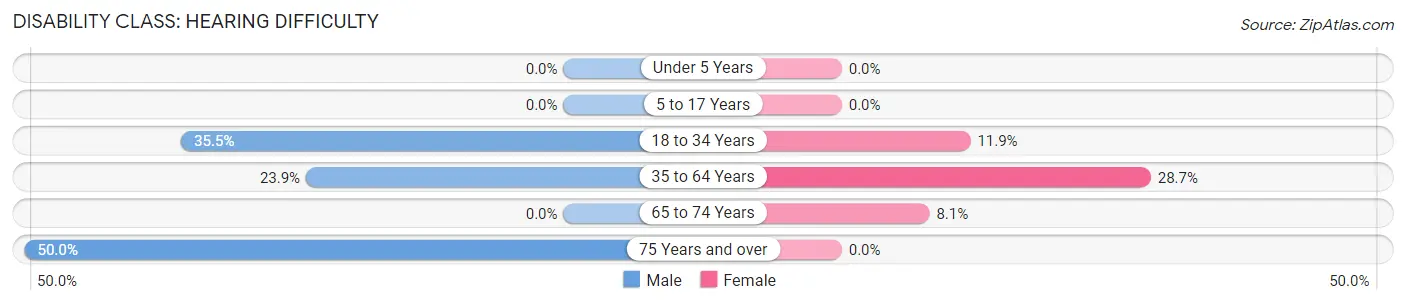
| Age Bracket | Male | Female |
| Under 5 Years | 0 (0.0%) | 0 (0.0%) |
| 5 to 17 Years | 0 (0.0%) | 0 (0.0%) |
| 18 to 34 Years | 22 (35.5%) | 16 (11.9%) |
| 35 to 64 Years | 54 (23.9%) | 39 (28.7%) |
| 65 to 74 Years | 0 (0.0%) | 7 (8.1%) |
| 75 Years and over | 10 (50.0%) | 0 (0.0%) |
Disability Class: Vision Difficulty
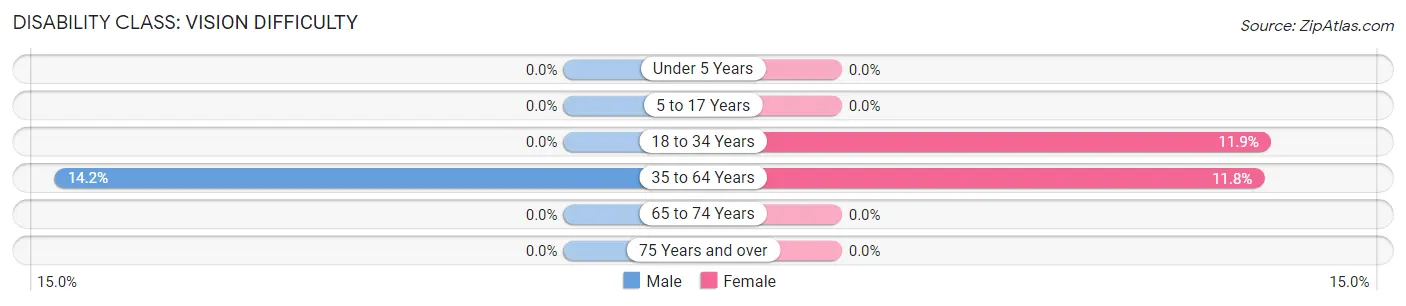
| Age Bracket | Male | Female |
| Under 5 Years | 0 (0.0%) | 0 (0.0%) |
| 5 to 17 Years | 0 (0.0%) | 0 (0.0%) |
| 18 to 34 Years | 0 (0.0%) | 16 (11.9%) |
| 35 to 64 Years | 32 (14.2%) | 16 (11.8%) |
| 65 to 74 Years | 0 (0.0%) | 0 (0.0%) |
| 75 Years and over | 0 (0.0%) | 0 (0.0%) |
Disability Class: Cognitive Difficulty

| Age Bracket | Male | Female |
| 5 to 17 Years | 0 (0.0%) | 0 (0.0%) |
| 18 to 34 Years | 0 (0.0%) | 0 (0.0%) |
| 35 to 64 Years | 105 (46.5%) | 39 (28.7%) |
| 65 to 74 Years | 8 (9.2%) | 0 (0.0%) |
| 75 Years and over | 0 (0.0%) | 0 (0.0%) |
Disability Class: Ambulatory Difficulty
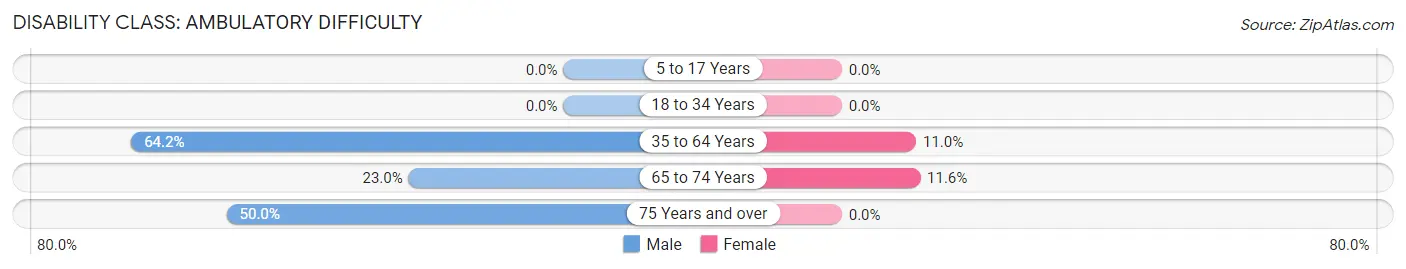
| Age Bracket | Male | Female |
| 5 to 17 Years | 0 (0.0%) | 0 (0.0%) |
| 18 to 34 Years | 0 (0.0%) | 0 (0.0%) |
| 35 to 64 Years | 145 (64.2%) | 15 (11.0%) |
| 65 to 74 Years | 20 (23.0%) | 10 (11.6%) |
| 75 Years and over | 10 (50.0%) | 0 (0.0%) |
Disability Class: Self-Care Difficulty
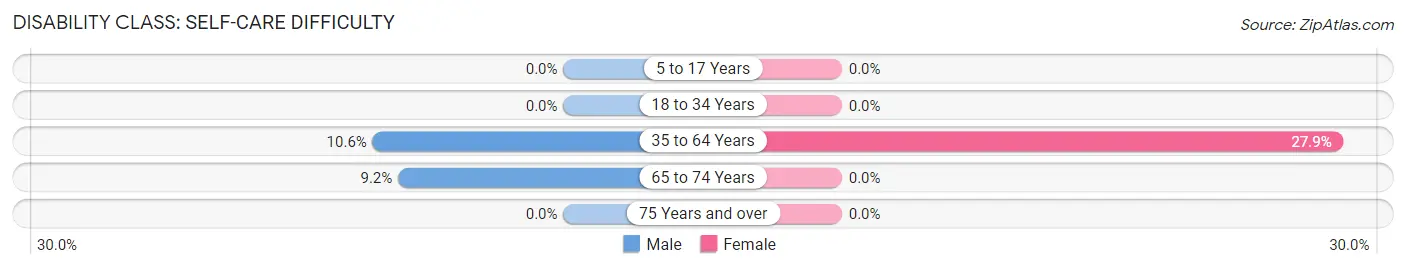
| Age Bracket | Male | Female |
| 5 to 17 Years | 0 (0.0%) | 0 (0.0%) |
| 18 to 34 Years | 0 (0.0%) | 0 (0.0%) |
| 35 to 64 Years | 24 (10.6%) | 38 (27.9%) |
| 65 to 74 Years | 8 (9.2%) | 0 (0.0%) |
| 75 Years and over | 0 (0.0%) | 0 (0.0%) |
Technology Access in Gilbert Creek
Computing Device Access in Gilbert Creek
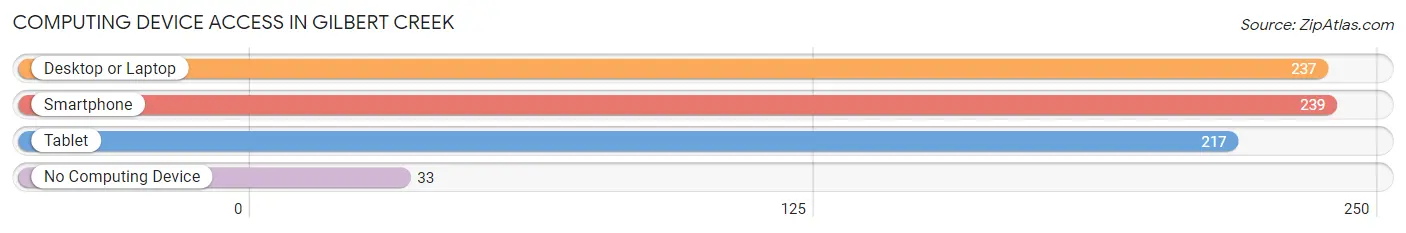
| Device Type | # Households | % Households |
| Desktop or Laptop | 237 | 79.0% |
| Smartphone | 239 | 79.7% |
| Tablet | 217 | 72.3% |
| No Computing Device | 33 | 11.0% |
| Total | 300 | 100.0% |
Internet Access in Gilbert Creek
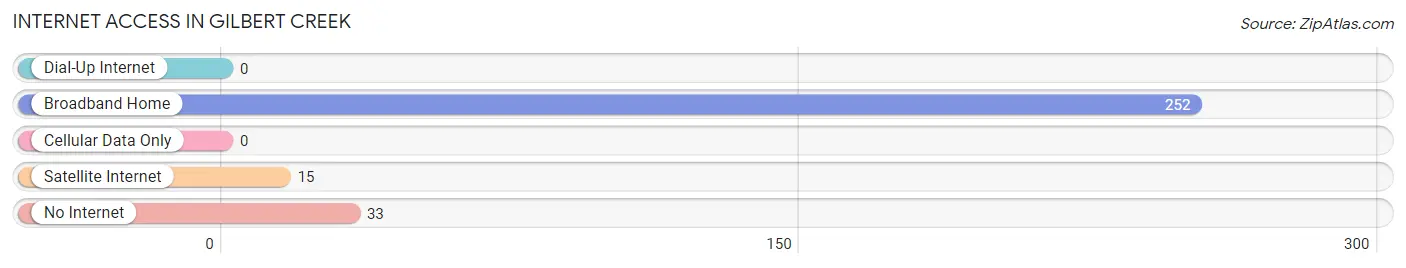
| Internet Type | # Households | % Households |
| Dial-Up Internet | 0 | 0.0% |
| Broadband Home | 252 | 84.0% |
| Cellular Data Only | 0 | 0.0% |
| Satellite Internet | 15 | 5.0% |
| No Internet | 33 | 11.0% |
| Total | 300 | 100.0% |
Gilbert Creek Summary
Gilbert Creek, West Virginia is a small unincorporated community located in the eastern part of the state in the county of McDowell. It is situated in the Appalachian Mountains and is surrounded by the towns of Welch, Gary, and Kimball. The population of Gilbert Creek is estimated to be around 200 people.
History
The area that is now Gilbert Creek was first settled in the late 1700s by a group of settlers from North Carolina. The settlers were primarily of English and Scottish descent and were looking for a place to call home. The area was originally known as “Gilbert’s Creek” after the first settler, Gilbert. The name was eventually shortened to Gilbert Creek.
The area was primarily a farming community until the early 1900s when coal mining began to take off in the area. The coal industry brought a lot of jobs and economic growth to the area. The town of Gilbert Creek was officially incorporated in 1912.
Geography
Gilbert Creek is located in the Appalachian Mountains in the eastern part of West Virginia. The town is situated in the Tug Fork Valley and is surrounded by the towns of Welch, Gary, and Kimball. The area is known for its rolling hills and lush forests. The climate in the area is generally mild with temperatures ranging from the mid-50s in the winter to the mid-80s in the summer.
Economy
The economy of Gilbert Creek is primarily based on coal mining. The town is home to several coal mines, including the Gilbert Creek Mine, which is the largest in the area. The coal industry has been the main source of employment for the town’s residents for many years.
In addition to coal mining, the town also has a few small businesses, including a general store, a gas station, and a few restaurants. The town also has a few small manufacturing companies that produce furniture and other items.
Demographics
The population of Gilbert Creek is estimated to be around 200 people. The town is predominantly white with a small minority population. The median household income in the town is around $30,000. The town has a high rate of poverty, with around 40% of the population living below the poverty line.
Conclusion
Gilbert Creek, West Virginia is a small unincorporated community located in the eastern part of the state in the county of McDowell. It is situated in the Appalachian Mountains and is surrounded by the towns of Welch, Gary, and Kimball. The population of Gilbert Creek is estimated to be around 200 people. The economy of the town is primarily based on coal mining, with a few small businesses and manufacturing companies also present. The town is predominantly white with a small minority population and has a high rate of poverty.
Common Questions
What is Per Capita Income in Gilbert Creek?
Per Capita income in Gilbert Creek is $30,631.
What is the Median Family Income in Gilbert Creek?
Median Family Income in Gilbert Creek is $86,250.
What is the Median Household income in Gilbert Creek?
Median Household Income in Gilbert Creek is $77,763.
What is Income or Wage Gap in Gilbert Creek?
Income or Wage Gap in Gilbert Creek is 52.5%.
Women in Gilbert Creek earn 47.5 cents for every dollar earned by a man.
What is Inequality or Gini Index in Gilbert Creek?
Inequality or Gini Index in Gilbert Creek is 0.35.
What is the Total Population of Gilbert Creek?
Total Population of Gilbert Creek is 805.
What is the Total Male Population of Gilbert Creek?
Total Male Population of Gilbert Creek is 449.
What is the Total Female Population of Gilbert Creek?
Total Female Population of Gilbert Creek is 356.
What is the Ratio of Males per 100 Females in Gilbert Creek?
There are 126.12 Males per 100 Females in Gilbert Creek.
What is the Ratio of Females per 100 Males in Gilbert Creek?
There are 79.29 Females per 100 Males in Gilbert Creek.
What is the Median Population Age in Gilbert Creek?
Median Population Age in Gilbert Creek is 51.1 Years.
What is the Average Family Size in Gilbert Creek
Average Family Size in Gilbert Creek is 2.6 People.
What is the Average Household Size in Gilbert Creek
Average Household Size in Gilbert Creek is 2.7 People.
How Large is the Labor Force in Gilbert Creek?
There are 273 People in the Labor Forcein in Gilbert Creek.
What is the Percentage of People in the Labor Force in Gilbert Creek?
36.4% of People are in the Labor Force in Gilbert Creek.
What is the Unemployment Rate in Gilbert Creek?
Unemployment Rate in Gilbert Creek is 4.4%.