Flatwoods, WV Map & Demographics
Flatwoods Map
Flatwoods Overview
$20,777
PER CAPITA INCOME
$51,719
AVG FAMILY INCOME
$51,094
AVG HOUSEHOLD INCOME
9.0%
WAGE / INCOME GAP [ % ]
91.0¢/ $1
WAGE / INCOME GAP [ $ ]
0.36
INEQUALITY / GINI INDEX
411
TOTAL POPULATION
168
MALE POPULATION
243
FEMALE POPULATION
69.14
MALES / 100 FEMALES
144.64
FEMALES / 100 MALES
37.1
MEDIAN AGE
3.6
AVG FAMILY SIZE
3.3
AVG HOUSEHOLD SIZE
189
LABOR FORCE [ PEOPLE ]
55.4%
PERCENT IN LABOR FORCE
20.6%
UNEMPLOYMENT RATE
Flatwoods Zip Codes
Flatwoods Area Codes
Income in Flatwoods
Income Overview in Flatwoods
Per Capita Income in Flatwoods is $20,777, while median incomes of families and households are $51,719 and $51,094 respectively.
| Characteristic | Number | Measure |
| Per Capita Income | 411 | $20,777 |
| Median Family Income | 96 | $51,719 |
| Mean Family Income | 96 | $52,351 |
| Median Household Income | 126 | $51,094 |
| Mean Household Income | 126 | $56,373 |
| Income Deficit | 96 | $0 |
| Wage / Income Gap (%) | 411 | 8.98% |
| Wage / Income Gap ($) | 411 | 91.02¢ per $1 |
| Gini / Inequality Index | 411 | 0.36 |
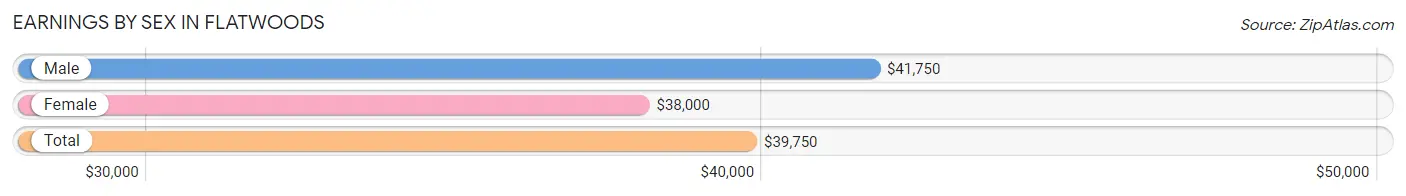
Earnings by Sex in Flatwoods
Average Earnings in Flatwoods are $39,750, $41,750 for men and $38,000 for women, a difference of 9.0%.
| Sex | Number | Average Earnings |
| Male | 63 (36.8%) | $41,750 |
| Female | 108 (63.2%) | $38,000 |
| Total | 171 (100.0%) | $39,750 |
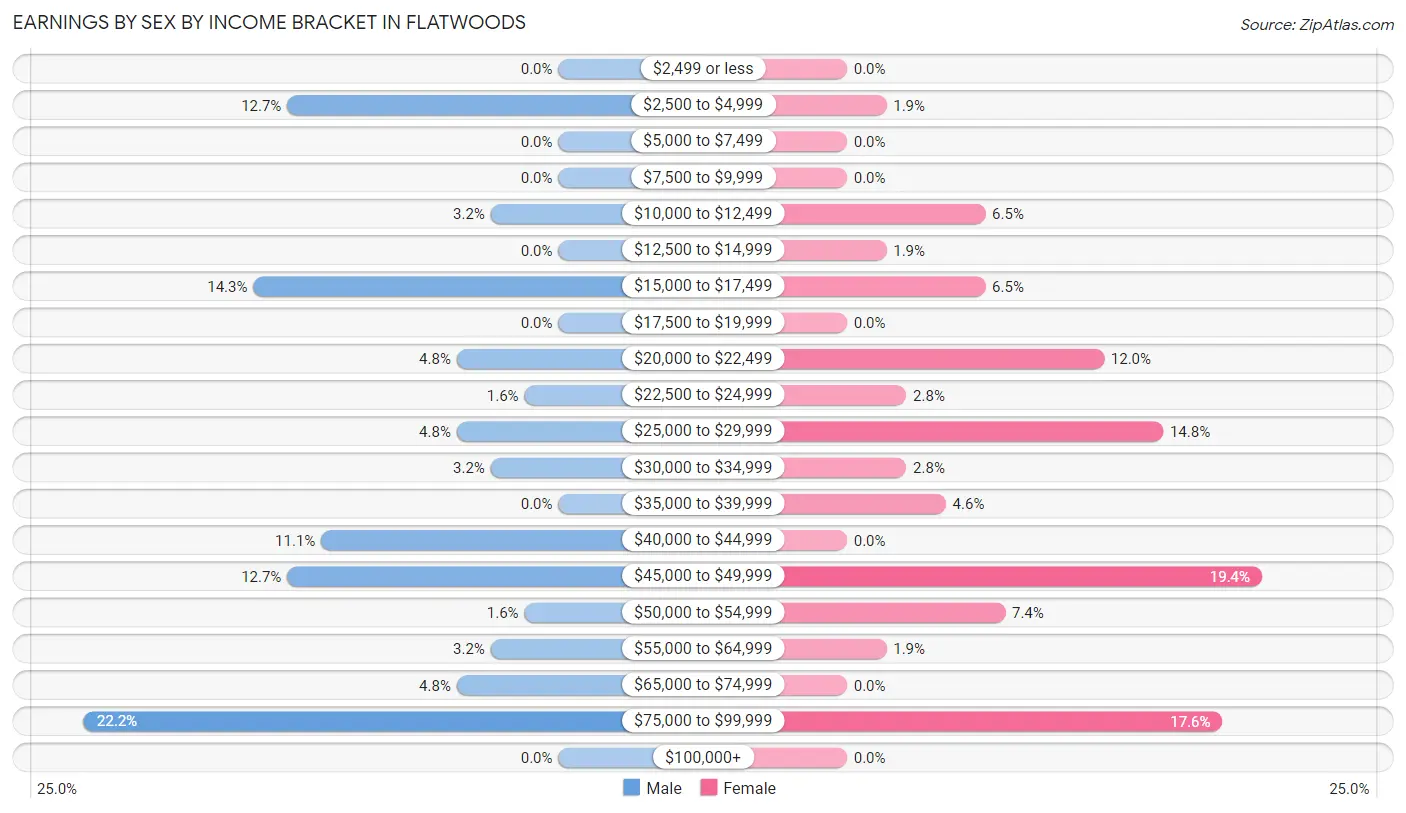
Earnings by Sex by Income Bracket in Flatwoods
The most common earnings brackets in Flatwoods are $75,000 to $99,999 for men (14 | 22.2%) and $45,000 to $49,999 for women (21 | 19.4%).
| Income | Male | Female |
| $2,499 or less | 0 (0.0%) | 0 (0.0%) |
| $2,500 to $4,999 | 8 (12.7%) | 2 (1.8%) |
| $5,000 to $7,499 | 0 (0.0%) | 0 (0.0%) |
| $7,500 to $9,999 | 0 (0.0%) | 0 (0.0%) |
| $10,000 to $12,499 | 2 (3.2%) | 7 (6.5%) |
| $12,500 to $14,999 | 0 (0.0%) | 2 (1.8%) |
| $15,000 to $17,499 | 9 (14.3%) | 7 (6.5%) |
| $17,500 to $19,999 | 0 (0.0%) | 0 (0.0%) |
| $20,000 to $22,499 | 3 (4.8%) | 13 (12.0%) |
| $22,500 to $24,999 | 1 (1.6%) | 3 (2.8%) |
| $25,000 to $29,999 | 3 (4.8%) | 16 (14.8%) |
| $30,000 to $34,999 | 2 (3.2%) | 3 (2.8%) |
| $35,000 to $39,999 | 0 (0.0%) | 5 (4.6%) |
| $40,000 to $44,999 | 7 (11.1%) | 0 (0.0%) |
| $45,000 to $49,999 | 8 (12.7%) | 21 (19.4%) |
| $50,000 to $54,999 | 1 (1.6%) | 8 (7.4%) |
| $55,000 to $64,999 | 2 (3.2%) | 2 (1.8%) |
| $65,000 to $74,999 | 3 (4.8%) | 0 (0.0%) |
| $75,000 to $99,999 | 14 (22.2%) | 19 (17.6%) |
| $100,000+ | 0 (0.0%) | 0 (0.0%) |
| Total | 63 (100.0%) | 108 (100.0%) |
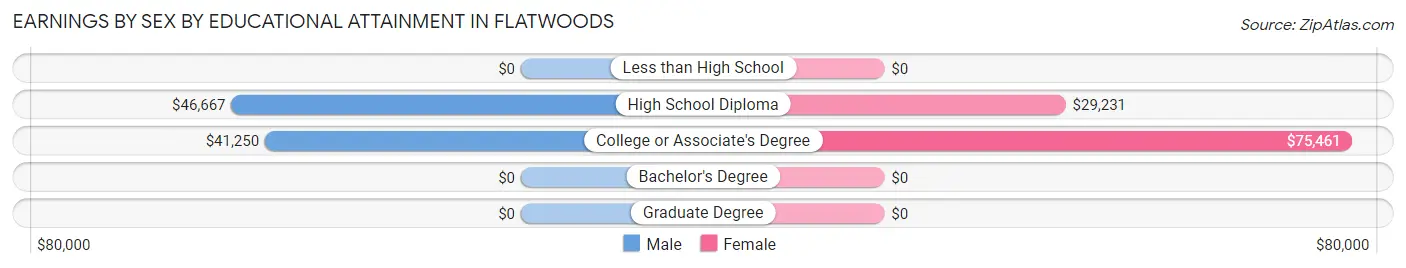
Earnings by Sex by Educational Attainment in Flatwoods
Average earnings in Flatwoods are $45,781 for men and $47,667 for women, a difference of 4.0%. Men with an educational attainment of high school diploma enjoy the highest average annual earnings of $46,667, while those with college or associate's degree education earn the least with $41,250. Women with an educational attainment of college or associate's degree earn the most with the average annual earnings of $75,461, while those with high school diploma education have the smallest earnings of $29,231.
| Educational Attainment | Male Income | Female Income |
| Less than High School | - | - |
| High School Diploma | $46,667 | $29,231 |
| College or Associate's Degree | $41,250 | $75,461 |
| Bachelor's Degree | - | - |
| Graduate Degree | - | - |
| Total | $45,781 | $47,667 |
Family Income in Flatwoods
Family Income Brackets in Flatwoods
According to the Flatwoods family income data, there are 42 families falling into the $50,000 to $74,999 income range, which is the most common income bracket and makes up 43.8% of all families.
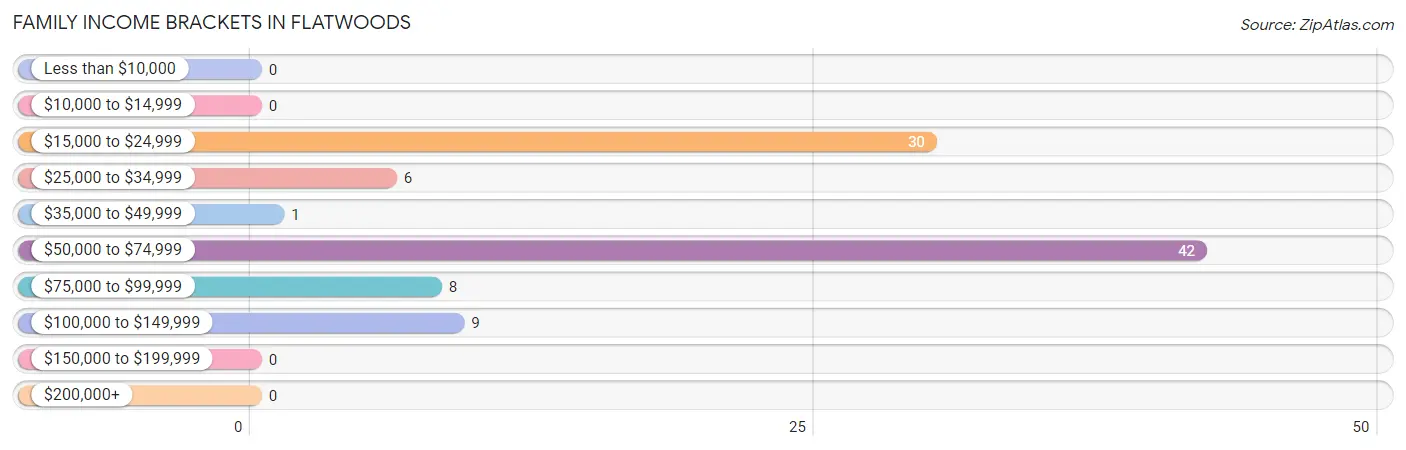
| Income Bracket | # Families | % Families |
| Less than $10,000 | 0 | 0.0% |
| $10,000 to $14,999 | 0 | 0.0% |
| $15,000 to $24,999 | 30 | 31.3% |
| $25,000 to $34,999 | 6 | 6.3% |
| $35,000 to $49,999 | 1 | 1.0% |
| $50,000 to $74,999 | 42 | 43.8% |
| $75,000 to $99,999 | 8 | 8.3% |
| $100,000 to $149,999 | 9 | 9.4% |
| $150,000 to $199,999 | 0 | 0.0% |
| $200,000+ | 0 | 0.0% |
Family Income by Famaliy Size in Flatwoods
3-person families (26 | 27.1%) account for the highest median family income in Flatwoods with $68,611 per family, while 3-person families (26 | 27.1%) have the highest median income of $22,870 per family member.
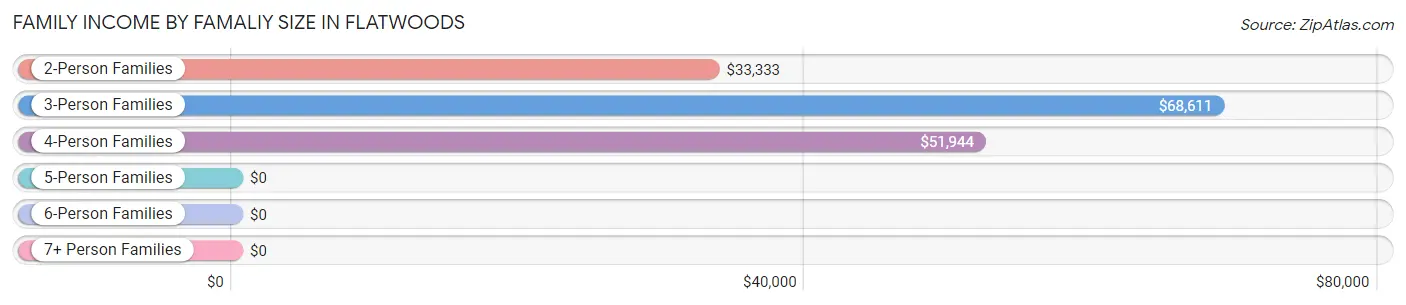
| Income Bracket | # Families | Median Income |
| 2-Person Families | 48 (50.0%) | $33,333 |
| 3-Person Families | 26 (27.1%) | $68,611 |
| 4-Person Families | 16 (16.7%) | $51,944 |
| 5-Person Families | 6 (6.2%) | $0 |
| 6-Person Families | 0 (0.0%) | $0 |
| 7+ Person Families | 0 (0.0%) | $0 |
| Total | 96 (100.0%) | $51,719 |
Family Income by Number of Earners in Flatwoods
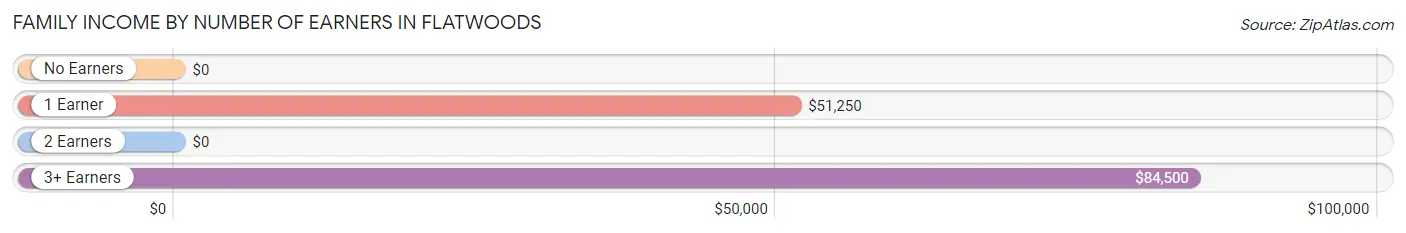
| Number of Earners | # Families | Median Income |
| No Earners | 23 (24.0%) | $0 |
| 1 Earner | 51 (53.1%) | $51,250 |
| 2 Earners | 14 (14.6%) | $0 |
| 3+ Earners | 8 (8.3%) | $84,500 |
| Total | 96 (100.0%) | $51,719 |
Household Income in Flatwoods
Household Income Brackets in Flatwoods
With 44 households falling in the category, the $50,000 to $74,999 income range is the most frequent in Flatwoods, accounting for 34.9% of all households.
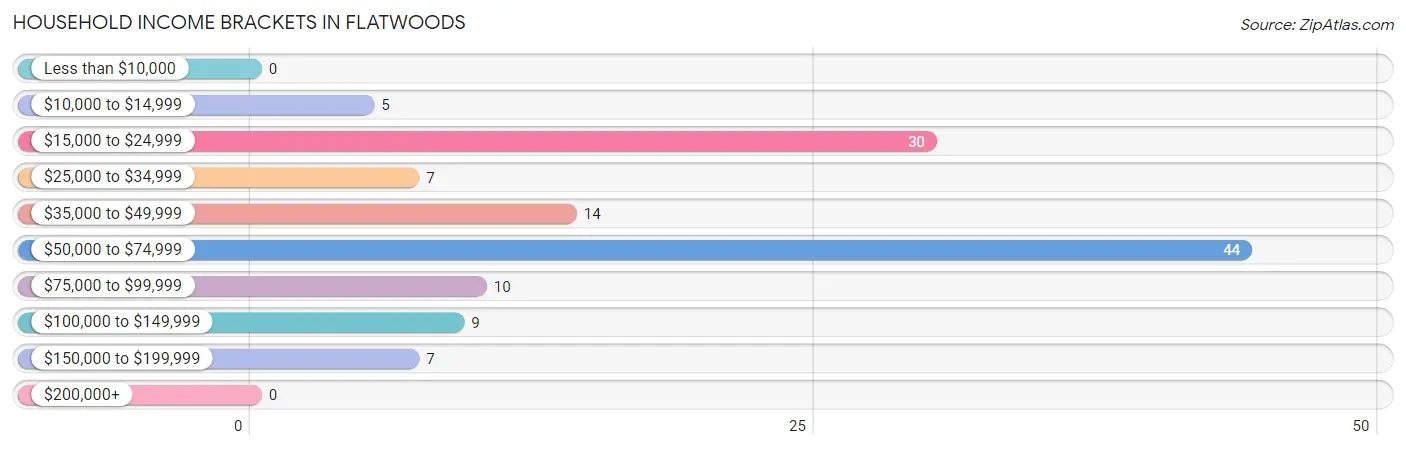
| Income Bracket | # Households | % Households |
| Less than $10,000 | 0 | 0.0% |
| $10,000 to $14,999 | 5 | 4.0% |
| $15,000 to $24,999 | 30 | 23.8% |
| $25,000 to $34,999 | 7 | 5.6% |
| $35,000 to $49,999 | 14 | 11.1% |
| $50,000 to $74,999 | 44 | 34.9% |
| $75,000 to $99,999 | 10 | 7.9% |
| $100,000 to $149,999 | 9 | 7.1% |
| $150,000 to $199,999 | 7 | 5.6% |
| $200,000+ | 0 | 0.0% |
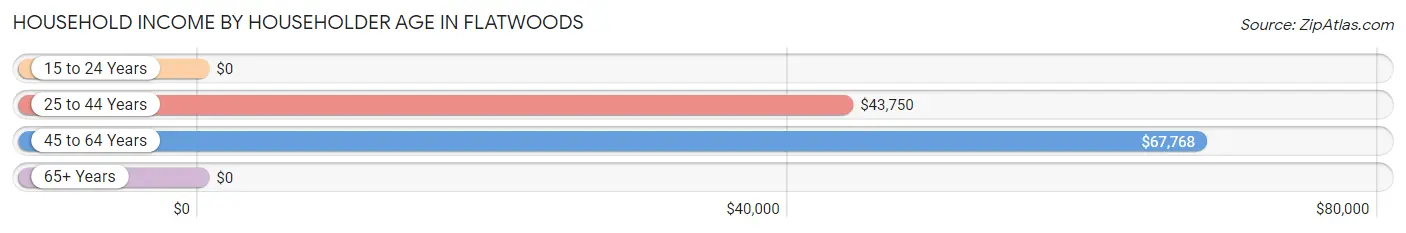
Household Income by Householder Age in Flatwoods
The median household income in Flatwoods is $51,094, with the highest median household income of $67,768 found in the 45 to 64 years age bracket for the primary householder. A total of 73 households (57.9%) fall into this category. Meanwhile, the 15 to 24 years age bracket for the primary householder has the lowest median household income of $0, with 3 households (2.4%) in this group.
| Income Bracket | # Households | Median Income |
| 15 to 24 Years | 3 (2.4%) | $0 |
| 25 to 44 Years | 23 (18.2%) | $43,750 |
| 45 to 64 Years | 73 (57.9%) | $67,768 |
| 65+ Years | 27 (21.4%) | $0 |
| Total | 126 (100.0%) | $51,094 |
Poverty in Flatwoods
Income Below Poverty by Sex and Age in Flatwoods
With 28.0% poverty level for males and 8.2% for females among the residents of Flatwoods, 16 and 17 year old males and 65 to 74 year old females are the most vulnerable to poverty, with 2 males (100.0%) and 12 females (60.0%) in their respective age groups living below the poverty level.
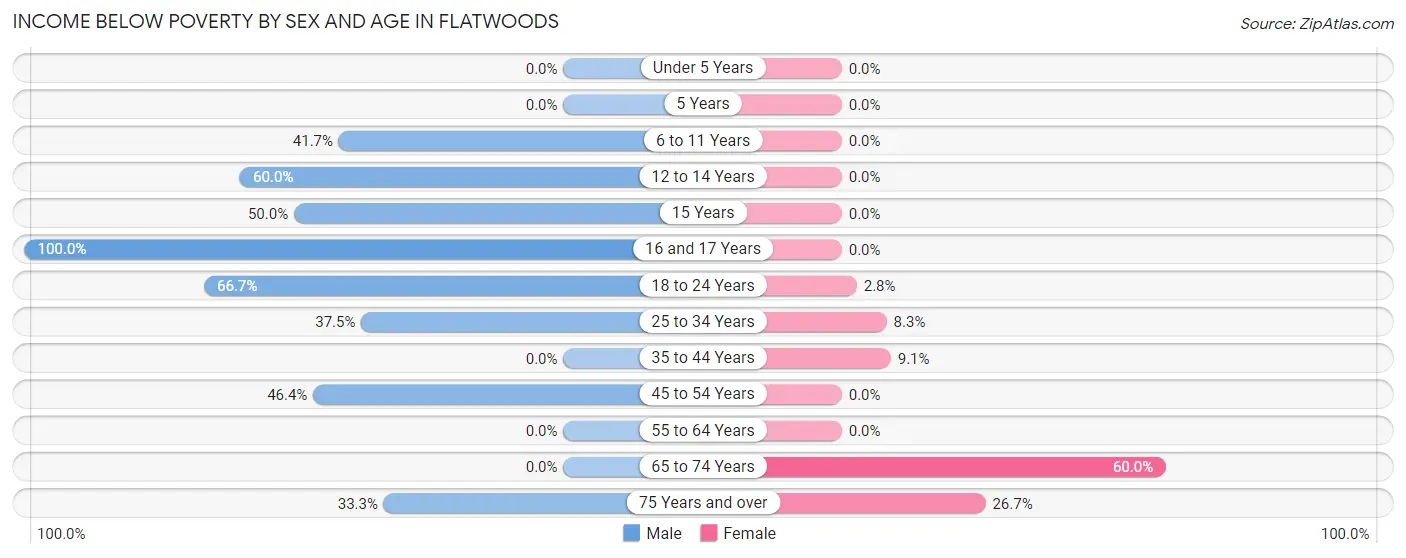
| Age Bracket | Male | Female |
| Under 5 Years | 0 (0.0%) | 0 (0.0%) |
| 5 Years | 0 (0.0%) | 0 (0.0%) |
| 6 to 11 Years | 15 (41.7%) | 0 (0.0%) |
| 12 to 14 Years | 3 (60.0%) | 0 (0.0%) |
| 15 Years | 2 (50.0%) | 0 (0.0%) |
| 16 and 17 Years | 2 (100.0%) | 0 (0.0%) |
| 18 to 24 Years | 8 (66.7%) | 1 (2.8%) |
| 25 to 34 Years | 3 (37.5%) | 2 (8.3%) |
| 35 to 44 Years | 0 (0.0%) | 1 (9.1%) |
| 45 to 54 Years | 13 (46.4%) | 0 (0.0%) |
| 55 to 64 Years | 0 (0.0%) | 0 (0.0%) |
| 65 to 74 Years | 0 (0.0%) | 12 (60.0%) |
| 75 Years and over | 1 (33.3%) | 4 (26.7%) |
| Total | 47 (28.0%) | 20 (8.2%) |
Income Above Poverty by Sex and Age in Flatwoods
According to the poverty statistics in Flatwoods, males aged 35 to 44 years and females aged under 5 years are the age groups that are most secure financially, with 100.0% of males and 100.0% of females in these age groups living above the poverty line.
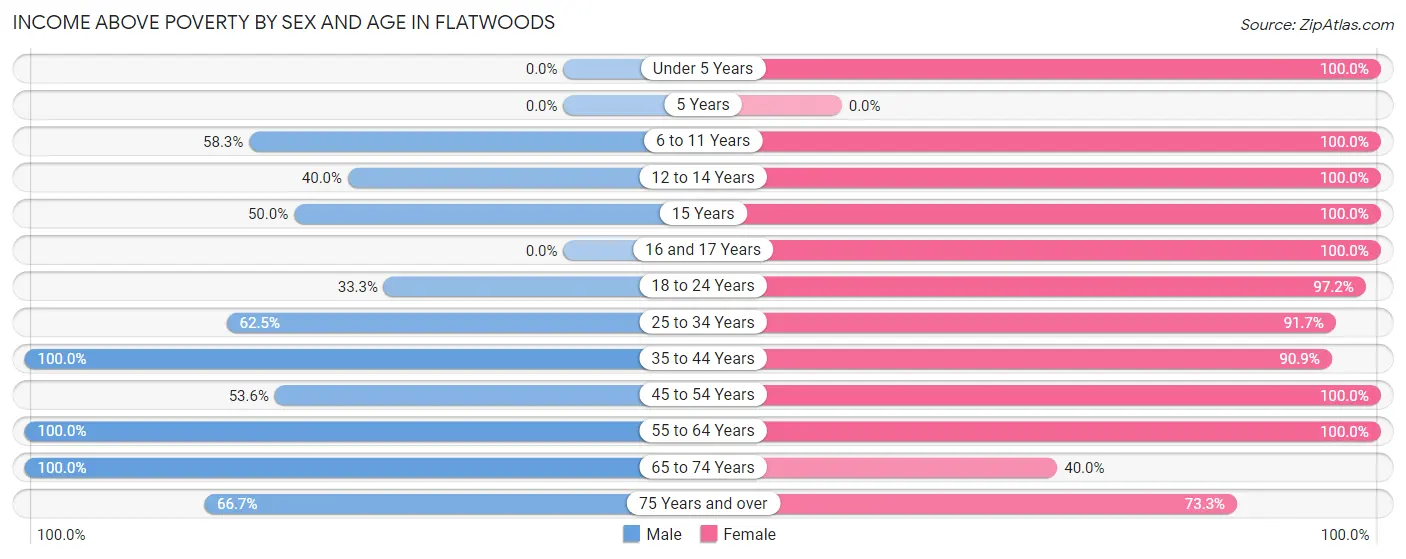
| Age Bracket | Male | Female |
| Under 5 Years | 0 (0.0%) | 5 (100.0%) |
| 5 Years | 0 (0.0%) | 0 (0.0%) |
| 6 to 11 Years | 21 (58.3%) | 13 (100.0%) |
| 12 to 14 Years | 2 (40.0%) | 2 (100.0%) |
| 15 Years | 2 (50.0%) | 5 (100.0%) |
| 16 and 17 Years | 0 (0.0%) | 43 (100.0%) |
| 18 to 24 Years | 4 (33.3%) | 35 (97.2%) |
| 25 to 34 Years | 5 (62.5%) | 22 (91.7%) |
| 35 to 44 Years | 39 (100.0%) | 10 (90.9%) |
| 45 to 54 Years | 15 (53.6%) | 38 (100.0%) |
| 55 to 64 Years | 25 (100.0%) | 31 (100.0%) |
| 65 to 74 Years | 6 (100.0%) | 8 (40.0%) |
| 75 Years and over | 2 (66.7%) | 11 (73.3%) |
| Total | 121 (72.0%) | 223 (91.8%) |
Income Below Poverty Among Married-Couple Families in Flatwoods
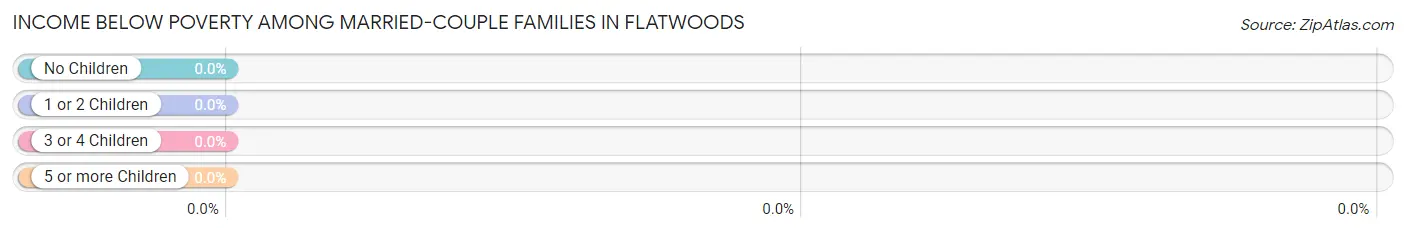
| Children | Above Poverty | Below Poverty |
| No Children | 39 (100.0%) | 0 (0.0%) |
| 1 or 2 Children | 16 (100.0%) | 0 (0.0%) |
| 3 or 4 Children | 1 (100.0%) | 0 (0.0%) |
| 5 or more Children | 0 (0.0%) | 0 (0.0%) |
| Total | 56 (100.0%) | 0 (0.0%) |
Income Below Poverty Among Single-Parent Households in Flatwoods
According to the poverty data in Flatwoods, 86.7% or 13 single-father households and 60.0% or 15 single-mother households are living below the poverty line. Among single-father households, those with 1 or 2 children have the highest poverty rate, with 13 households (92.9%) experiencing poverty. Likewise, among single-mother households, those with no children have the highest poverty rate, with 12 households (80.0%) falling below the poverty line.
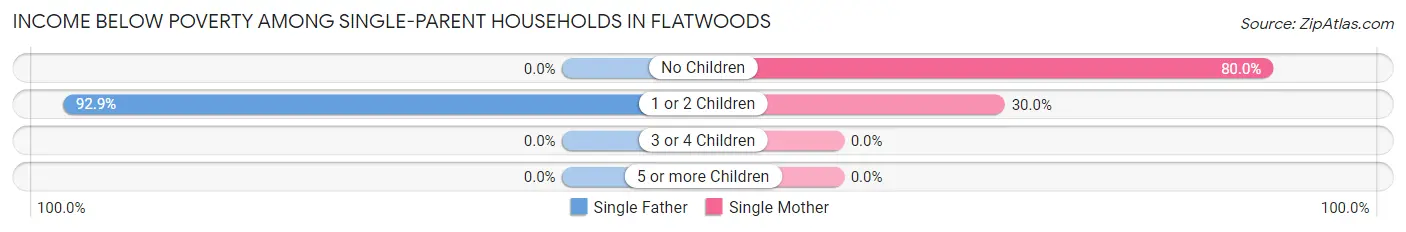
| Children | Single Father | Single Mother |
| No Children | 0 (0.0%) | 12 (80.0%) |
| 1 or 2 Children | 13 (92.9%) | 3 (30.0%) |
| 3 or 4 Children | 0 (0.0%) | 0 (0.0%) |
| 5 or more Children | 0 (0.0%) | 0 (0.0%) |
| Total | 13 (86.7%) | 15 (60.0%) |
Income Below Poverty Among Married-Couple vs Single-Parent Households in Flatwoods
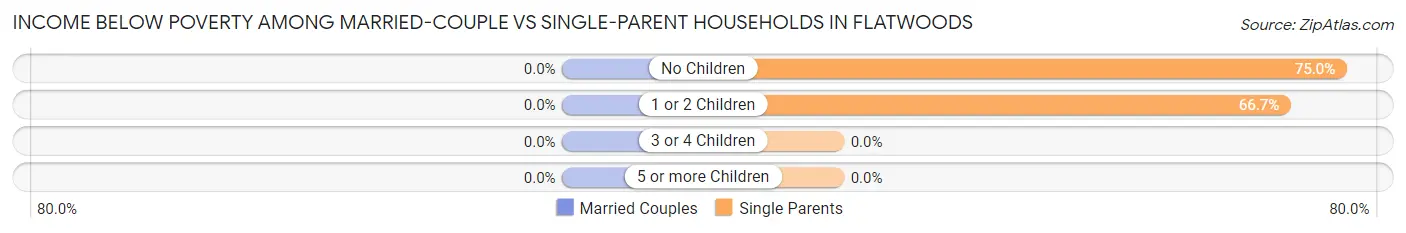
| Children | Married-Couple Families | Single-Parent Households |
| No Children | 0 (0.0%) | 12 (75.0%) |
| 1 or 2 Children | 0 (0.0%) | 16 (66.7%) |
| 3 or 4 Children | 0 (0.0%) | 0 (0.0%) |
| 5 or more Children | 0 (0.0%) | 0 (0.0%) |
| Total | 0 (0.0%) | 28 (70.0%) |
Race in Flatwoods
The most populous races in Flatwoods are White / Caucasian (376 | 91.5%), Two or more Races (26 | 6.3%), and Hispanic or Latino (9 | 2.2%).
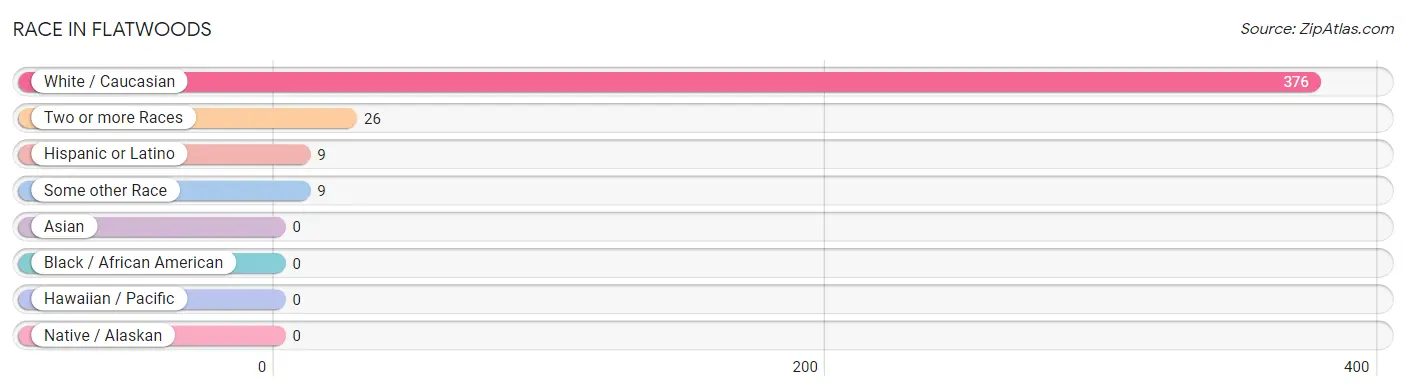
| Race | # Population | % Population |
| Asian | 0 | 0.0% |
| Black / African American | 0 | 0.0% |
| Hawaiian / Pacific | 0 | 0.0% |
| Hispanic or Latino | 9 | 2.2% |
| Native / Alaskan | 0 | 0.0% |
| White / Caucasian | 376 | 91.5% |
| Two or more Races | 26 | 6.3% |
| Some other Race | 9 | 2.2% |
| Total | 411 | 100.0% |
Ancestry in Flatwoods
The most populous ancestries reported in Flatwoods are English (40 | 9.7%), American (38 | 9.2%), German (37 | 9.0%), Irish (30 | 7.3%), and Scottish (15 | 3.6%), together accounting for 38.9% of all Flatwoods residents.
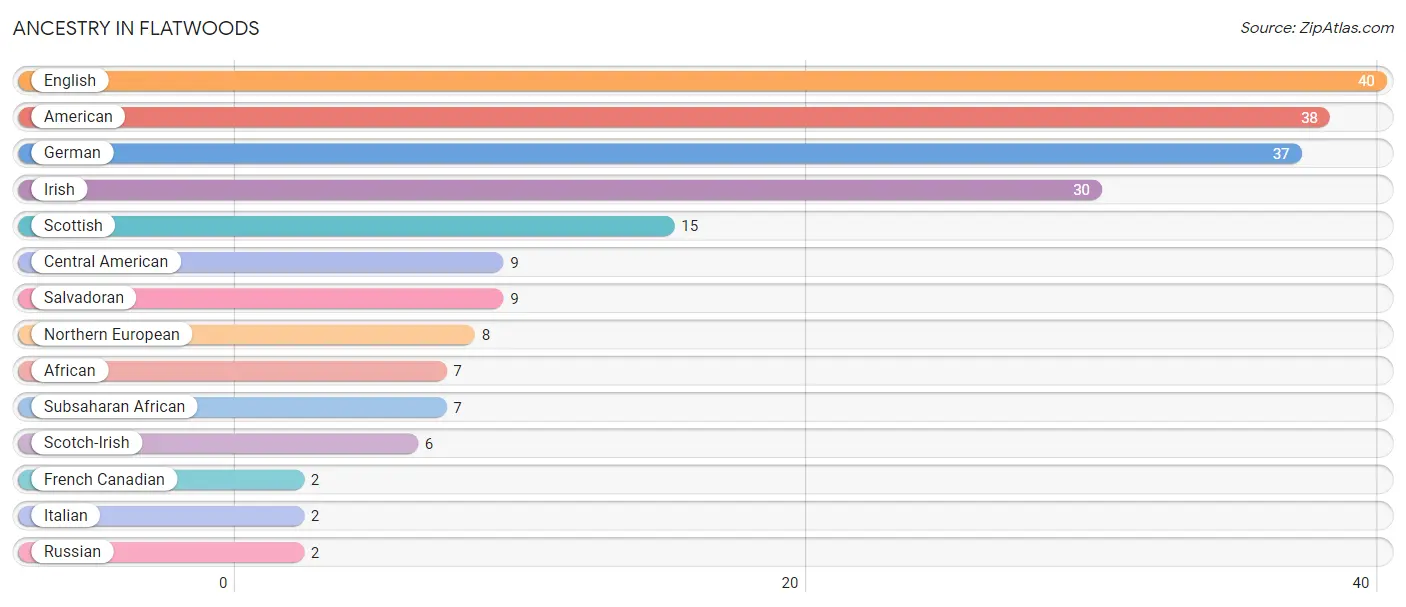
| Ancestry | # Population | % Population |
| African | 7 | 1.7% |
| American | 38 | 9.2% |
| Central American | 9 | 2.2% |
| English | 40 | 9.7% |
| French Canadian | 2 | 0.5% |
| German | 37 | 9.0% |
| Irish | 30 | 7.3% |
| Italian | 2 | 0.5% |
| Northern European | 8 | 1.9% |
| Russian | 2 | 0.5% |
| Salvadoran | 9 | 2.2% |
| Scotch-Irish | 6 | 1.5% |
| Scottish | 15 | 3.6% |
| Subsaharan African | 7 | 1.7% | View All 14 Rows |
Immigrants in Flatwoods
The most numerous immigrant groups reported in Flatwoods came from , and Canada (2 | 0.5%), together accounting for 0.5% of all Flatwoods residents.

| Immigration Origin | # Population | % Population |
| Canada | 2 | 0.5% | View All 1 Rows |
Sex and Age in Flatwoods
Sex and Age in Flatwoods
The most populous age groups in Flatwoods are 10 to 14 Years (30 | 17.9%) for men and 15 to 19 Years (57 | 23.5%) for women.
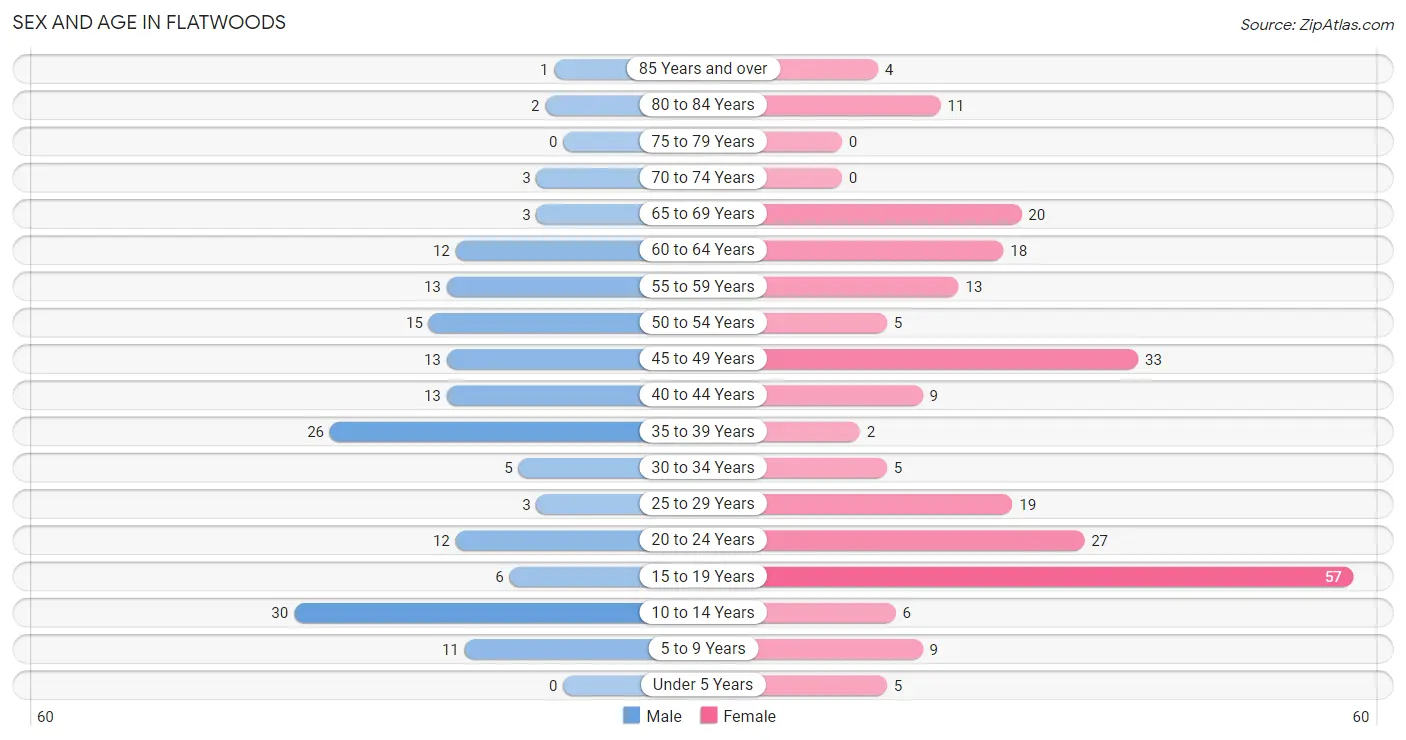
| Age Bracket | Male | Female |
| Under 5 Years | 0 (0.0%) | 5 (2.1%) |
| 5 to 9 Years | 11 (6.6%) | 9 (3.7%) |
| 10 to 14 Years | 30 (17.9%) | 6 (2.5%) |
| 15 to 19 Years | 6 (3.6%) | 57 (23.5%) |
| 20 to 24 Years | 12 (7.1%) | 27 (11.1%) |
| 25 to 29 Years | 3 (1.8%) | 19 (7.8%) |
| 30 to 34 Years | 5 (3.0%) | 5 (2.1%) |
| 35 to 39 Years | 26 (15.5%) | 2 (0.8%) |
| 40 to 44 Years | 13 (7.7%) | 9 (3.7%) |
| 45 to 49 Years | 13 (7.7%) | 33 (13.6%) |
| 50 to 54 Years | 15 (8.9%) | 5 (2.1%) |
| 55 to 59 Years | 13 (7.7%) | 13 (5.3%) |
| 60 to 64 Years | 12 (7.1%) | 18 (7.4%) |
| 65 to 69 Years | 3 (1.8%) | 20 (8.2%) |
| 70 to 74 Years | 3 (1.8%) | 0 (0.0%) |
| 75 to 79 Years | 0 (0.0%) | 0 (0.0%) |
| 80 to 84 Years | 2 (1.2%) | 11 (4.5%) |
| 85 Years and over | 1 (0.6%) | 4 (1.7%) |
| Total | 168 (100.0%) | 243 (100.0%) |
Families and Households in Flatwoods
Median Family Size in Flatwoods
The median family size in Flatwoods is 3.56 persons per family, with married-couple families (56 | 58.3%) accounting for the largest median family size of 4.09 persons per family. On the other hand, single male/father families (15 | 15.6%) represent the smallest median family size with 2.53 persons per family.
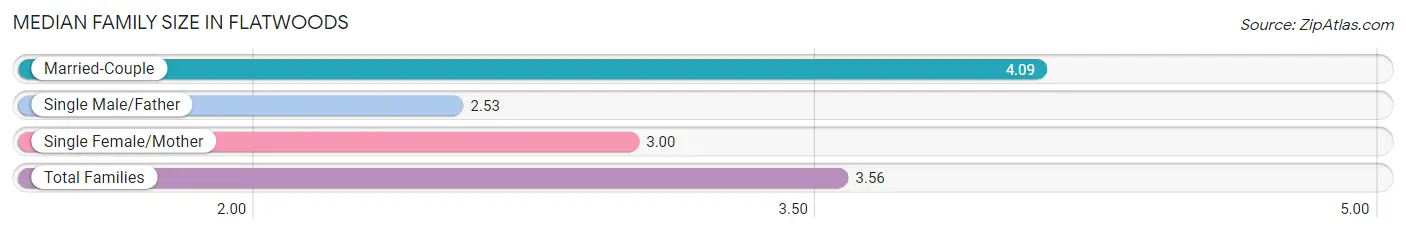
| Family Type | # Families | Family Size |
| Married-Couple | 56 (58.3%) | 4.09 |
| Single Male/Father | 15 (15.6%) | 2.53 |
| Single Female/Mother | 25 (26.0%) | 3.00 |
| Total Families | 96 (100.0%) | 3.56 |
Median Household Size in Flatwoods
The median household size in Flatwoods is 3.26 persons per household, with married-couple households (56 | 44.4%) accounting for the largest median household size of 4.09 persons per household. non-family households (30 | 23.8%) represent the smallest median household size with 2.20 persons per household.
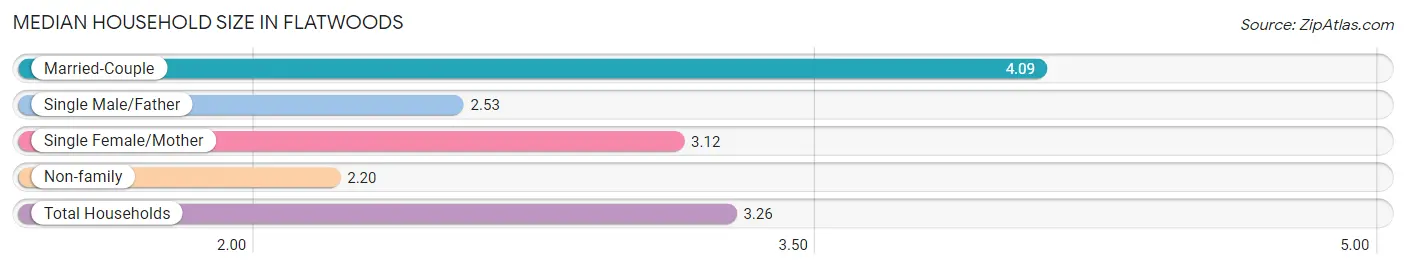
| Household Type | # Households | Household Size |
| Married-Couple | 56 (44.4%) | 4.09 |
| Single Male/Father | 15 (11.9%) | 2.53 |
| Single Female/Mother | 25 (19.8%) | 3.12 |
| Non-family | 30 (23.8%) | 2.20 |
| Total Households | 126 (100.0%) | 3.26 |
Household Size by Marriage Status in Flatwoods
Out of a total of 126 households in Flatwoods, 96 (76.2%) are family households, while 30 (23.8%) are nonfamily households. The most numerous type of family households are 2-person households, comprising 48, and the most common type of nonfamily households are 1-person households, comprising 18.
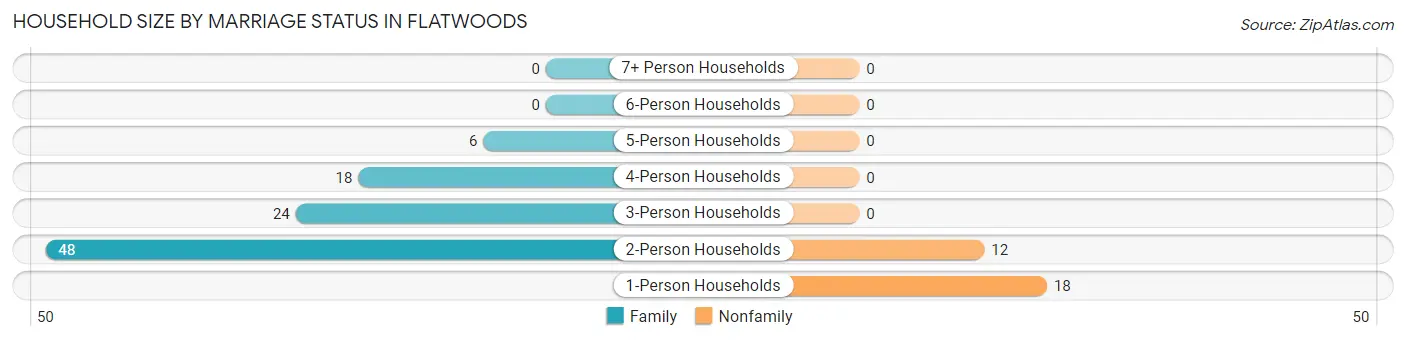
| Household Size | Family Households | Nonfamily Households |
| 1-Person Households | - | 18 (14.3%) |
| 2-Person Households | 48 (38.1%) | 12 (9.5%) |
| 3-Person Households | 24 (19.1%) | 0 (0.0%) |
| 4-Person Households | 18 (14.3%) | 0 (0.0%) |
| 5-Person Households | 6 (4.8%) | 0 (0.0%) |
| 6-Person Households | 0 (0.0%) | 0 (0.0%) |
| 7+ Person Households | 0 (0.0%) | 0 (0.0%) |
| Total | 96 (76.2%) | 30 (23.8%) |
Female Fertility in Flatwoods
Fertility by Age in Flatwoods
| Age Bracket | Women with Births | Births / 1,000 Women |
| 15 to 19 years | 0 (0.0%) | 0.0 |
| 20 to 34 years | 0 (0.0%) | 0.0 |
| 35 to 50 years | 0 (0.0%) | 0.0 |
| Total | 0 (0.0%) | 0.0 |
Fertility by Age by Marriage Status in Flatwoods
| Age Bracket | Married | Unmarried |
| 15 to 19 years | 0 (0.0%) | 0 (0.0%) |
| 20 to 34 years | 0 (0.0%) | 0 (0.0%) |
| 35 to 50 years | 0 (0.0%) | 0 (0.0%) |
| Total | 0 (0.0%) | 0 (0.0%) |
Fertility by Education in Flatwoods
| Educational Attainment | Women with Births | Births / 1,000 Women |
| Less than High School | 0 (0.0%) | 0.0 |
| High School Diploma | 0 (0.0%) | 0.0 |
| College or Associate's Degree | 0 (0.0%) | 0.0 |
| Bachelor's Degree | 0 (0.0%) | 0.0 |
| Graduate Degree | 0 (0.0%) | 0.0 |
| Total | 0 (0.0%) | 0.0 |
Fertility by Education by Marriage Status in Flatwoods
| Educational Attainment | Married | Unmarried |
| Less than High School | 0 (0.0%) | 0 (0.0%) |
| High School Diploma | 0 (0.0%) | 0 (0.0%) |
| College or Associate's Degree | 0 (0.0%) | 0 (0.0%) |
| Bachelor's Degree | 0 (0.0%) | 0 (0.0%) |
| Graduate Degree | 0 (0.0%) | 0 (0.0%) |
| Total | 0 (0.0%) | 0 (0.0%) |
Employment Characteristics in Flatwoods
Employment by Class of Employer in Flatwoods
Among the 139 employed individuals in Flatwoods, private company employees (109 | 78.4%), state government employees (13 | 9.3%), and local government employees (10 | 7.2%) make up the most common classes of employment.
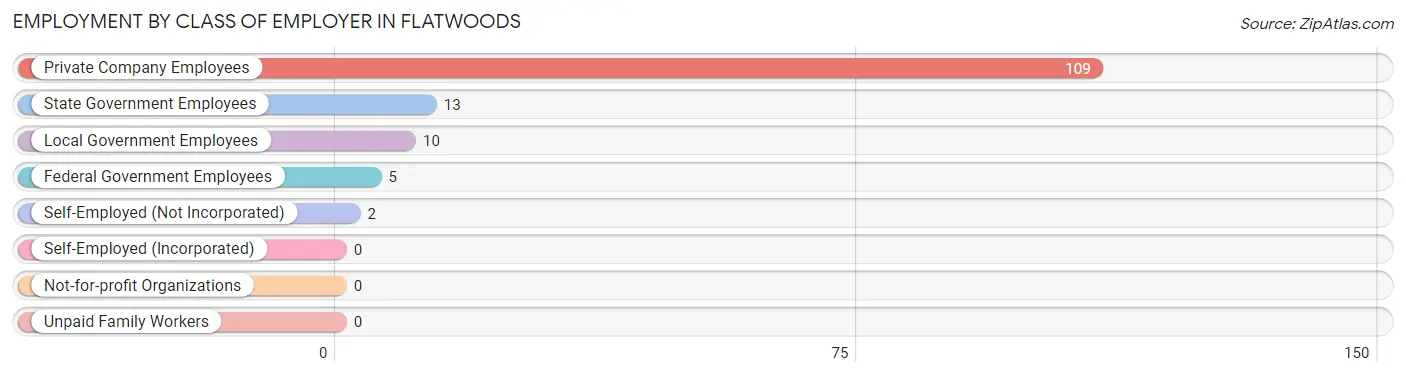
| Employer Class | # Employees | % Employees |
| Private Company Employees | 109 | 78.4% |
| Self-Employed (Incorporated) | 0 | 0.0% |
| Self-Employed (Not Incorporated) | 2 | 1.4% |
| Not-for-profit Organizations | 0 | 0.0% |
| Local Government Employees | 10 | 7.2% |
| State Government Employees | 13 | 9.3% |
| Federal Government Employees | 5 | 3.6% |
| Unpaid Family Workers | 0 | 0.0% |
| Total | 139 | 100.0% |
Employment Status by Age in Flatwoods
According to the labor force statistics for Flatwoods, out of the total population over 16 years of age (341), 55.4% or 189 individuals are in the labor force, with 20.6% or 39 of them unemployed. The age group with the highest labor force participation rate is 20 to 24 years, with 100.0% or 39 individuals in the labor force. Within the labor force, the 16 to 19 years age range has the highest percentage of unemployed individuals, with 40.0% or 6 of them being unemployed.
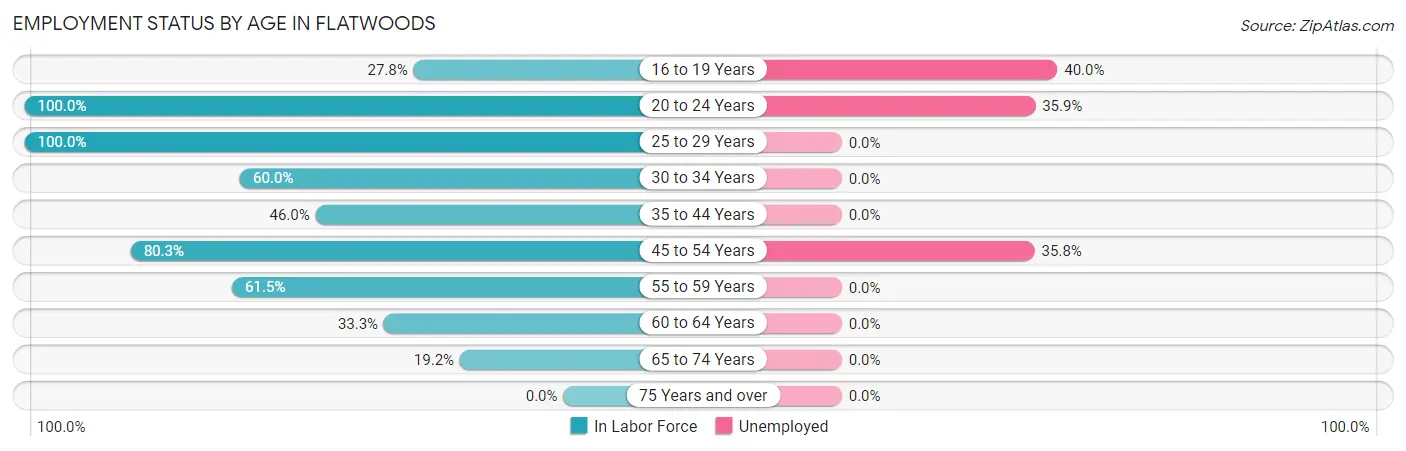
| Age Bracket | In Labor Force | Unemployed |
| 16 to 19 Years | 15 (27.8%) | 6 (40.0%) |
| 20 to 24 Years | 39 (100.0%) | 14 (35.9%) |
| 25 to 29 Years | 22 (100.0%) | 0 (0.0%) |
| 30 to 34 Years | 6 (60.0%) | 0 (0.0%) |
| 35 to 44 Years | 23 (46.0%) | 0 (0.0%) |
| 45 to 54 Years | 53 (80.3%) | 19 (35.8%) |
| 55 to 59 Years | 16 (61.5%) | 0 (0.0%) |
| 60 to 64 Years | 10 (33.3%) | 0 (0.0%) |
| 65 to 74 Years | 5 (19.2%) | 0 (0.0%) |
| 75 Years and over | 0 (0.0%) | 0 (0.0%) |
| Total | 189 (55.4%) | 39 (20.6%) |
Employment Status by Educational Attainment in Flatwoods
According to labor force statistics for Flatwoods, 63.7% of individuals (130) out of the total population between 25 and 64 years of age (204) are in the labor force, with 14.6% or 19 of them being unemployed. The group with the highest labor force participation rate are those with the educational attainment of high school diploma, with 79.3% or 73 individuals in the labor force. Within the labor force, individuals with college / associate degree education have the highest percentage of unemployment, with 41.3% or 19 of them being unemployed.
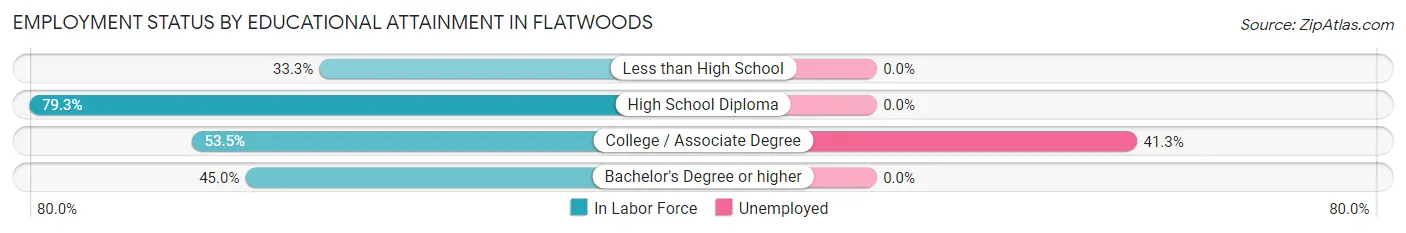
| Educational Attainment | In Labor Force | Unemployed |
| Less than High School | 2 (33.3%) | 0 (0.0%) |
| High School Diploma | 73 (79.3%) | 0 (0.0%) |
| College / Associate Degree | 46 (53.5%) | 36 (41.3%) |
| Bachelor's Degree or higher | 9 (45.0%) | 0 (0.0%) |
| Total | 130 (63.7%) | 30 (14.6%) |
Employment Occupations by Sex in Flatwoods
Management, Business, Science and Arts Occupations
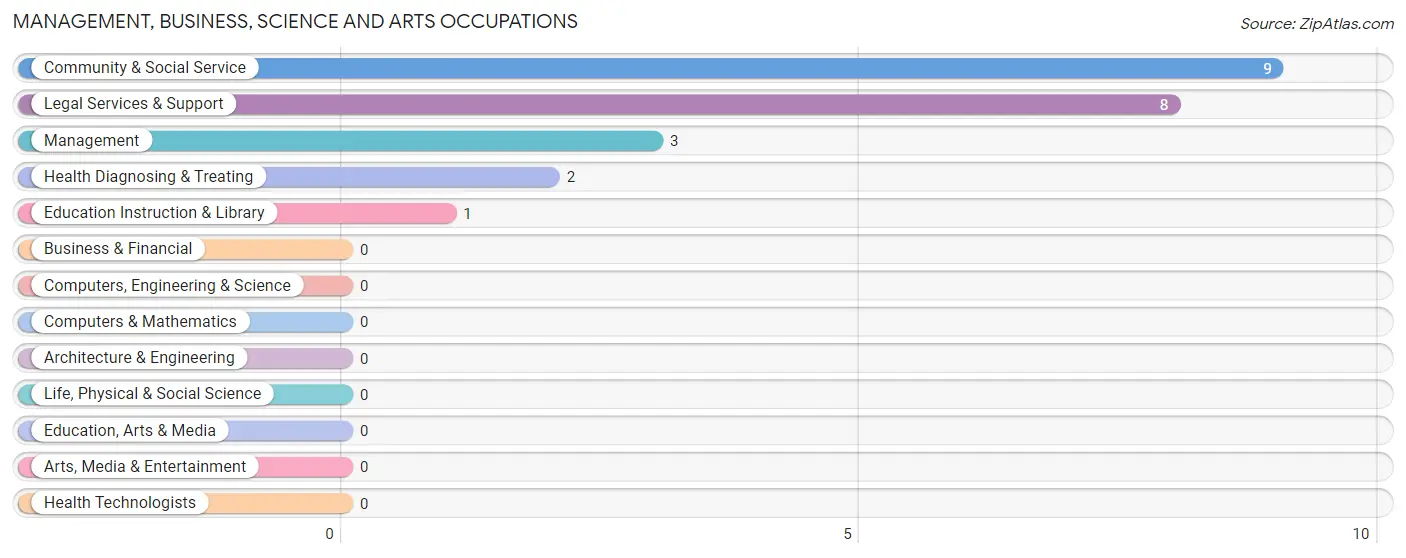
The most common Management, Business, Science and Arts occupations in Flatwoods are Community & Social Service (9 | 6.0%), Legal Services & Support (8 | 5.3%), Management (3 | 2.0%), Health Diagnosing & Treating (2 | 1.3%), and Education Instruction & Library (1 | 0.7%).
Management, Business, Science and Arts Occupations by Sex
Within the Management, Business, Science and Arts occupations in Flatwoods, the most male-oriented occupations are Management (100.0%), and Health Diagnosing & Treating (100.0%), while the most female-oriented occupations are Community & Social Service (100.0%), Legal Services & Support (100.0%), and Education Instruction & Library (100.0%).
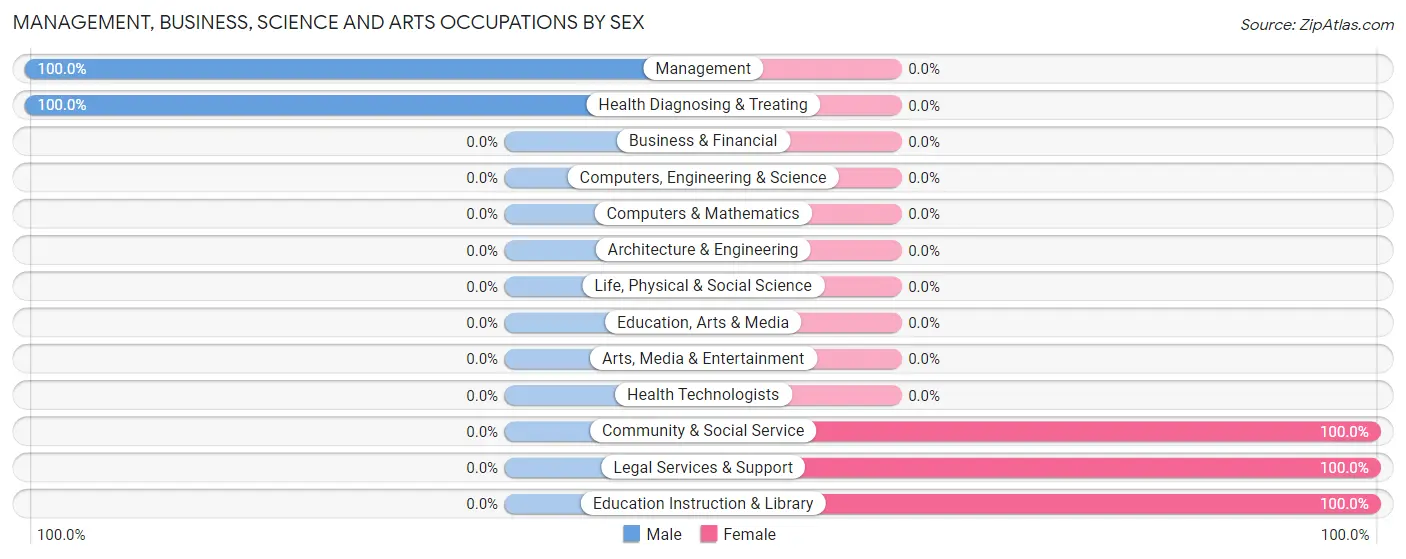
| Occupation | Male | Female |
| Management | 3 (100.0%) | 0 (0.0%) |
| Business & Financial | 0 (0.0%) | 0 (0.0%) |
| Computers, Engineering & Science | 0 (0.0%) | 0 (0.0%) |
| Computers & Mathematics | 0 (0.0%) | 0 (0.0%) |
| Architecture & Engineering | 0 (0.0%) | 0 (0.0%) |
| Life, Physical & Social Science | 0 (0.0%) | 0 (0.0%) |
| Community & Social Service | 0 (0.0%) | 9 (100.0%) |
| Education, Arts & Media | 0 (0.0%) | 0 (0.0%) |
| Legal Services & Support | 0 (0.0%) | 8 (100.0%) |
| Education Instruction & Library | 0 (0.0%) | 1 (100.0%) |
| Arts, Media & Entertainment | 0 (0.0%) | 0 (0.0%) |
| Health Diagnosing & Treating | 2 (100.0%) | 0 (0.0%) |
| Health Technologists | 0 (0.0%) | 0 (0.0%) |
| Total (Category) | 5 (35.7%) | 9 (64.3%) |
| Total (Overall) | 61 (40.7%) | 89 (59.3%) |
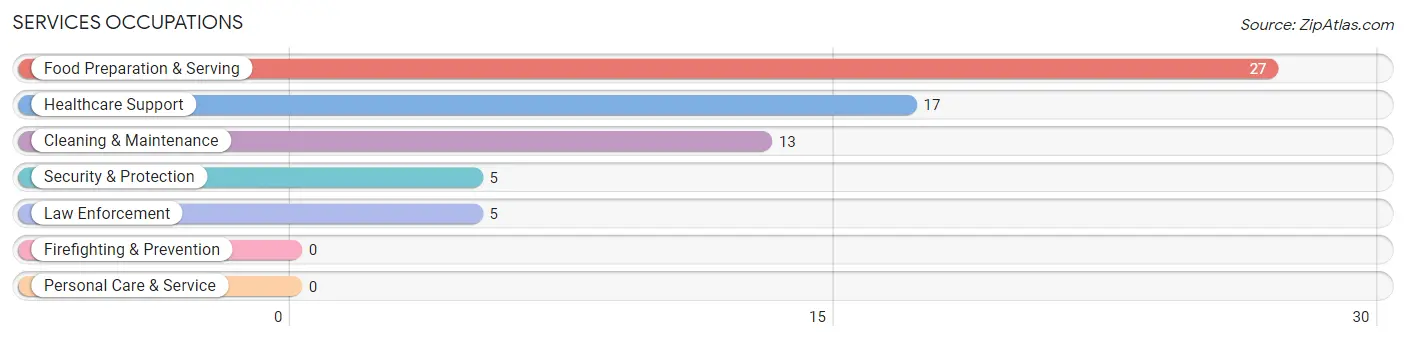
Services Occupations
The most common Services occupations in Flatwoods are Food Preparation & Serving (27 | 18.0%), Healthcare Support (17 | 11.3%), Cleaning & Maintenance (13 | 8.7%), Security & Protection (5 | 3.3%), and Law Enforcement (5 | 3.3%).
Services Occupations by Sex
Within the Services occupations in Flatwoods, the most male-oriented occupations are Security & Protection (100.0%), Law Enforcement (100.0%), and Cleaning & Maintenance (53.8%), while the most female-oriented occupations are Healthcare Support (100.0%), Food Preparation & Serving (55.6%), and Cleaning & Maintenance (46.2%).
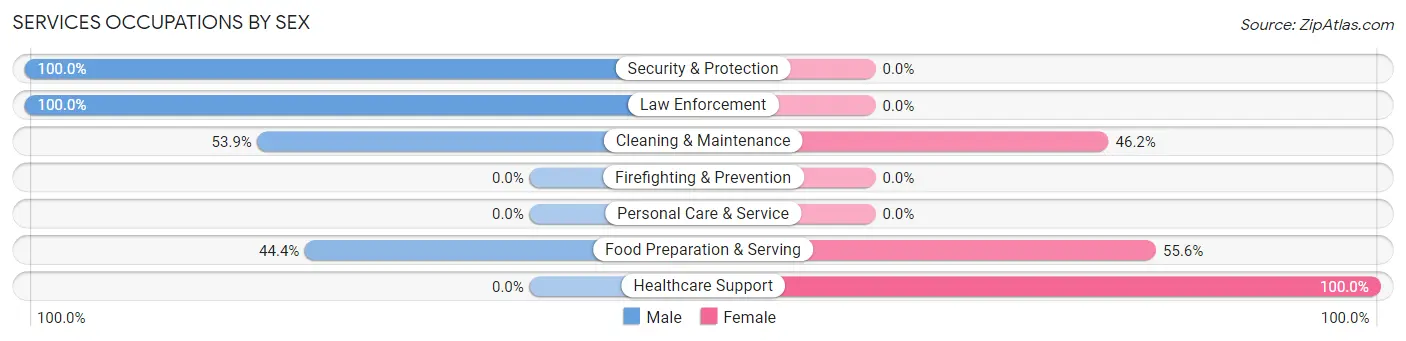
| Occupation | Male | Female |
| Healthcare Support | 0 (0.0%) | 17 (100.0%) |
| Security & Protection | 5 (100.0%) | 0 (0.0%) |
| Firefighting & Prevention | 0 (0.0%) | 0 (0.0%) |
| Law Enforcement | 5 (100.0%) | 0 (0.0%) |
| Food Preparation & Serving | 12 (44.4%) | 15 (55.6%) |
| Cleaning & Maintenance | 7 (53.8%) | 6 (46.2%) |
| Personal Care & Service | 0 (0.0%) | 0 (0.0%) |
| Total (Category) | 24 (38.7%) | 38 (61.3%) |
| Total (Overall) | 61 (40.7%) | 89 (59.3%) |
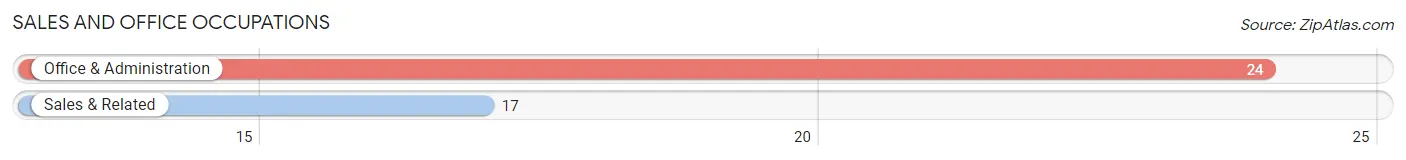
Sales and Office Occupations
The most common Sales and Office occupations in Flatwoods are Office & Administration (24 | 16.0%), and Sales & Related (17 | 11.3%).
Sales and Office Occupations by Sex
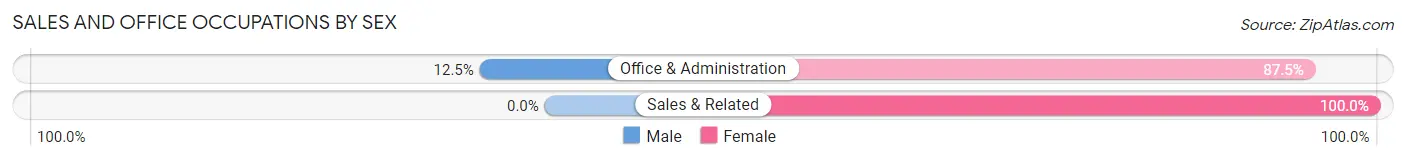
| Occupation | Male | Female |
| Sales & Related | 0 (0.0%) | 17 (100.0%) |
| Office & Administration | 3 (12.5%) | 21 (87.5%) |
| Total (Category) | 3 (7.3%) | 38 (92.7%) |
| Total (Overall) | 61 (40.7%) | 89 (59.3%) |
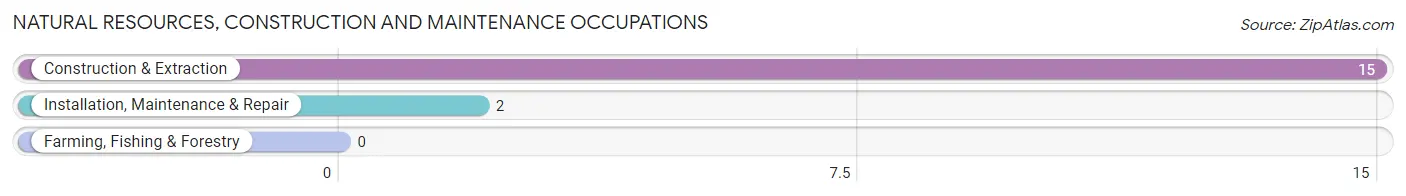
Natural Resources, Construction and Maintenance Occupations
The most common Natural Resources, Construction and Maintenance occupations in Flatwoods are Construction & Extraction (15 | 10.0%), and Installation, Maintenance & Repair (2 | 1.3%).
Natural Resources, Construction and Maintenance Occupations by Sex
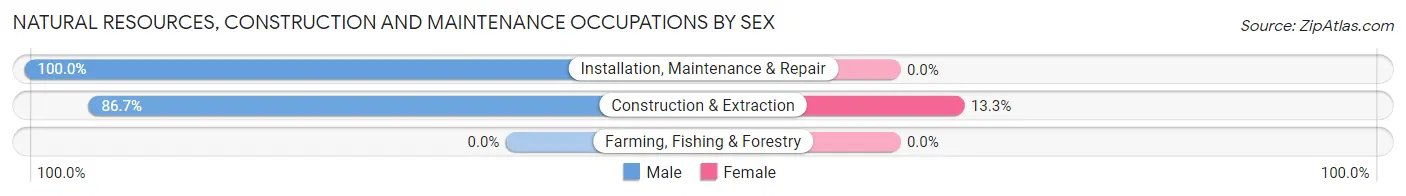
| Occupation | Male | Female |
| Farming, Fishing & Forestry | 0 (0.0%) | 0 (0.0%) |
| Construction & Extraction | 13 (86.7%) | 2 (13.3%) |
| Installation, Maintenance & Repair | 2 (100.0%) | 0 (0.0%) |
| Total (Category) | 15 (88.2%) | 2 (11.8%) |
| Total (Overall) | 61 (40.7%) | 89 (59.3%) |
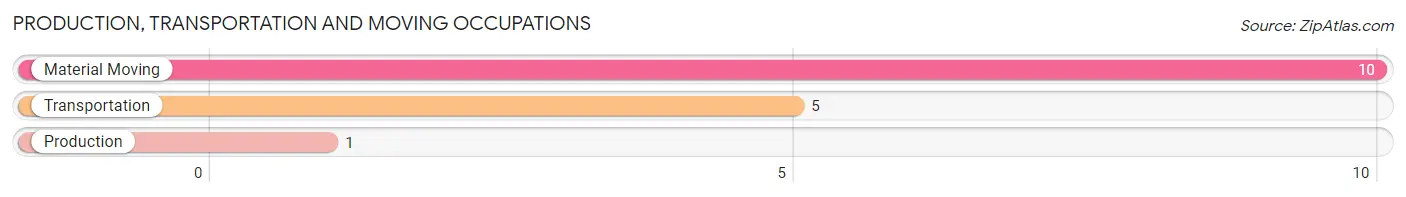
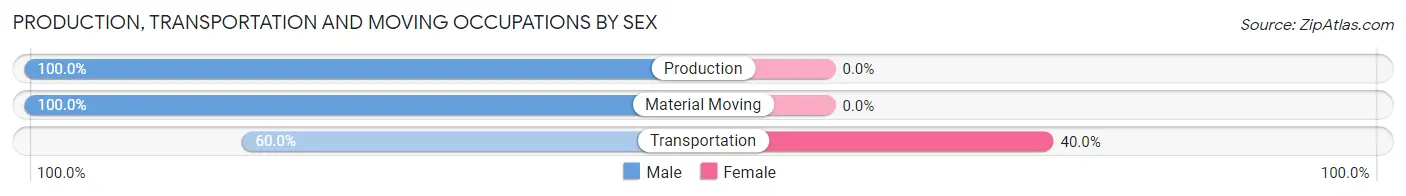
Production, Transportation and Moving Occupations
The most common Production, Transportation and Moving occupations in Flatwoods are Material Moving (10 | 6.7%), Transportation (5 | 3.3%), and Production (1 | 0.7%).
Production, Transportation and Moving Occupations by Sex
| Occupation | Male | Female |
| Production | 1 (100.0%) | 0 (0.0%) |
| Transportation | 3 (60.0%) | 2 (40.0%) |
| Material Moving | 10 (100.0%) | 0 (0.0%) |
| Total (Category) | 14 (87.5%) | 2 (12.5%) |
| Total (Overall) | 61 (40.7%) | 89 (59.3%) |
Employment Industries by Sex in Flatwoods
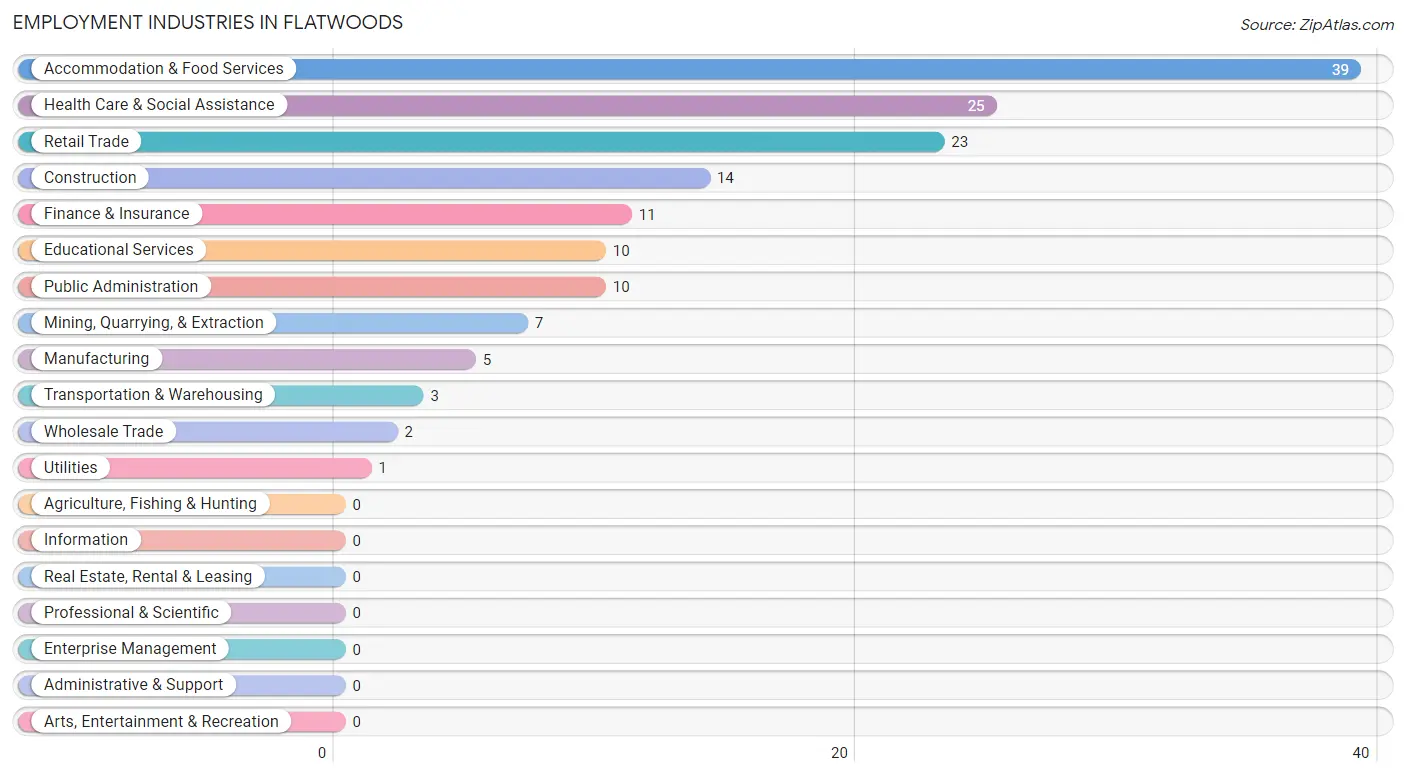
Employment Industries in Flatwoods
The major employment industries in Flatwoods include Accommodation & Food Services (39 | 26.0%), Health Care & Social Assistance (25 | 16.7%), Retail Trade (23 | 15.3%), Construction (14 | 9.3%), and Finance & Insurance (11 | 7.3%).
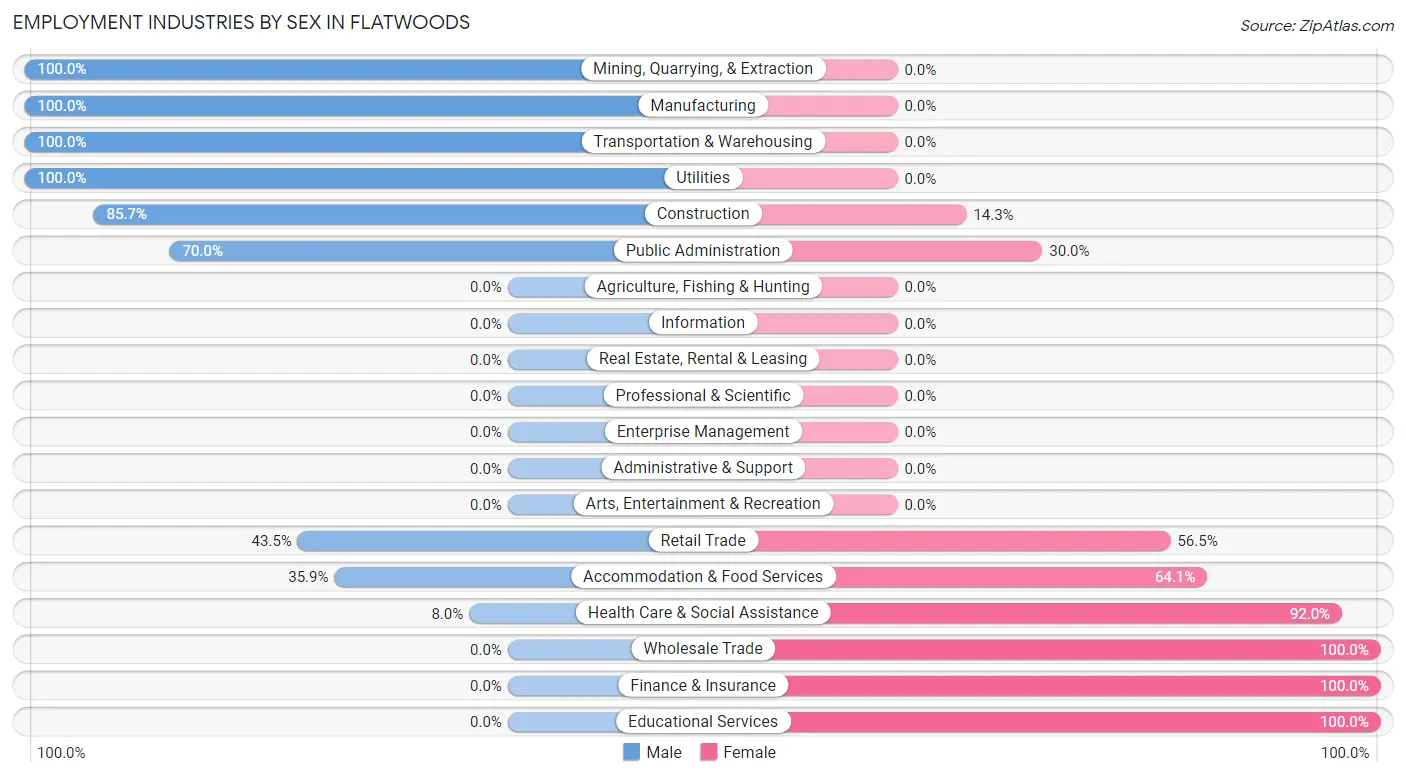
Employment Industries by Sex in Flatwoods
The Flatwoods industries that see more men than women are Mining, Quarrying, & Extraction (100.0%), Manufacturing (100.0%), and Transportation & Warehousing (100.0%), whereas the industries that tend to have a higher number of women are Wholesale Trade (100.0%), Finance & Insurance (100.0%), and Educational Services (100.0%).
| Industry | Male | Female |
| Agriculture, Fishing & Hunting | 0 (0.0%) | 0 (0.0%) |
| Mining, Quarrying, & Extraction | 7 (100.0%) | 0 (0.0%) |
| Construction | 12 (85.7%) | 2 (14.3%) |
| Manufacturing | 5 (100.0%) | 0 (0.0%) |
| Wholesale Trade | 0 (0.0%) | 2 (100.0%) |
| Retail Trade | 10 (43.5%) | 13 (56.5%) |
| Transportation & Warehousing | 3 (100.0%) | 0 (0.0%) |
| Utilities | 1 (100.0%) | 0 (0.0%) |
| Information | 0 (0.0%) | 0 (0.0%) |
| Finance & Insurance | 0 (0.0%) | 11 (100.0%) |
| Real Estate, Rental & Leasing | 0 (0.0%) | 0 (0.0%) |
| Professional & Scientific | 0 (0.0%) | 0 (0.0%) |
| Enterprise Management | 0 (0.0%) | 0 (0.0%) |
| Administrative & Support | 0 (0.0%) | 0 (0.0%) |
| Educational Services | 0 (0.0%) | 10 (100.0%) |
| Health Care & Social Assistance | 2 (8.0%) | 23 (92.0%) |
| Arts, Entertainment & Recreation | 0 (0.0%) | 0 (0.0%) |
| Accommodation & Food Services | 14 (35.9%) | 25 (64.1%) |
| Public Administration | 7 (70.0%) | 3 (30.0%) |
| Total | 61 (40.7%) | 89 (59.3%) |
Education in Flatwoods
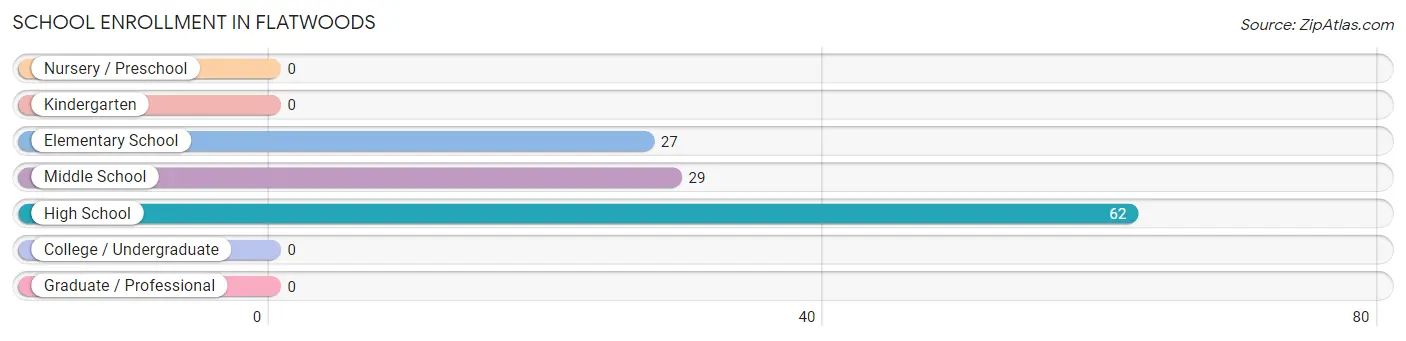
School Enrollment in Flatwoods
The most common levels of schooling among the 118 students in Flatwoods are high school (62 | 52.5%), middle school (29 | 24.6%), and elementary school (27 | 22.9%).
| School Level | # Students | % Students |
| Nursery / Preschool | 0 | 0.0% |
| Kindergarten | 0 | 0.0% |
| Elementary School | 27 | 22.9% |
| Middle School | 29 | 24.6% |
| High School | 62 | 52.5% |
| College / Undergraduate | 0 | 0.0% |
| Graduate / Professional | 0 | 0.0% |
| Total | 118 | 100.0% |
School Enrollment by Age by Funding Source in Flatwoods
Out of a total of 118 students who are enrolled in schools in Flatwoods, 26 (22.0%) attend a private institution, while the remaining 92 (78.0%) are enrolled in public schools. The age group of 18 to 19 year olds has the highest likelihood of being enrolled in private schools, with 6 (75.0% in the age bracket) enrolled. Conversely, the age group of 15 to 17 year olds has the lowest likelihood of being enrolled in a private school, with 54 (100.0% in the age bracket) attending a public institution.
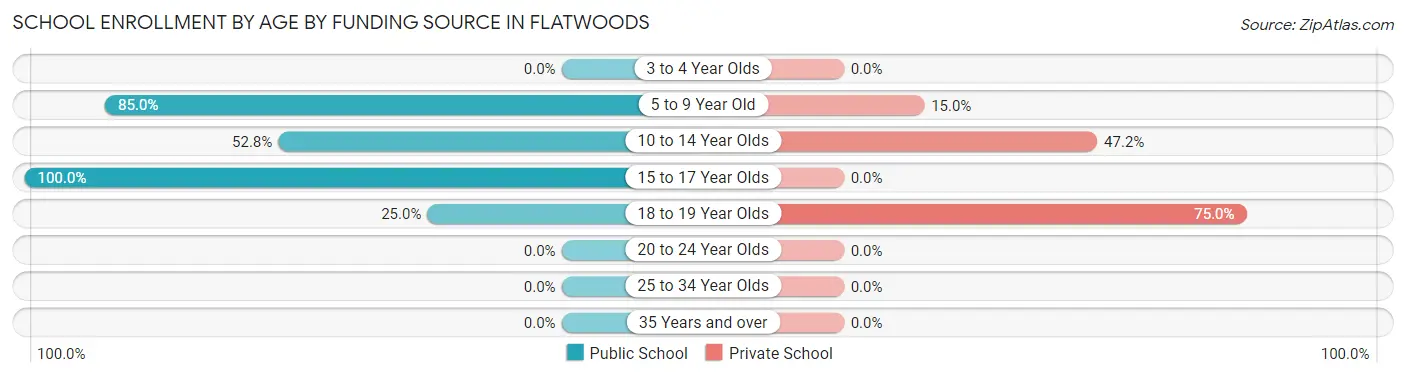
| Age Bracket | Public School | Private School |
| 3 to 4 Year Olds | 0 (0.0%) | 0 (0.0%) |
| 5 to 9 Year Old | 17 (85.0%) | 3 (15.0%) |
| 10 to 14 Year Olds | 19 (52.8%) | 17 (47.2%) |
| 15 to 17 Year Olds | 54 (100.0%) | 0 (0.0%) |
| 18 to 19 Year Olds | 2 (25.0%) | 6 (75.0%) |
| 20 to 24 Year Olds | 0 (0.0%) | 0 (0.0%) |
| 25 to 34 Year Olds | 0 (0.0%) | 0 (0.0%) |
| 35 Years and over | 0 (0.0%) | 0 (0.0%) |
| Total | 92 (78.0%) | 26 (22.0%) |
Educational Attainment by Field of Study in Flatwoods
Education (15 | 38.5%), social sciences (8 | 20.5%), liberal arts & history (8 | 20.5%), science & technology (6 | 15.4%), and business (2 | 5.1%) are the most common fields of study among 39 individuals in Flatwoods who have obtained a bachelor's degree or higher.

| Field of Study | # Graduates | % Graduates |
| Computers & Mathematics | 0 | 0.0% |
| Bio, Nature & Agricultural | 0 | 0.0% |
| Physical & Health Sciences | 0 | 0.0% |
| Psychology | 0 | 0.0% |
| Social Sciences | 8 | 20.5% |
| Engineering | 0 | 0.0% |
| Multidisciplinary Studies | 0 | 0.0% |
| Science & Technology | 6 | 15.4% |
| Business | 2 | 5.1% |
| Education | 15 | 38.5% |
| Literature & Languages | 0 | 0.0% |
| Liberal Arts & History | 8 | 20.5% |
| Visual & Performing Arts | 0 | 0.0% |
| Communications | 0 | 0.0% |
| Arts & Humanities | 0 | 0.0% |
| Total | 39 | 100.0% |
Transportation & Commute in Flatwoods
Vehicle Availability by Sex in Flatwoods
The most prevalent vehicle ownership categories in Flatwoods are males with 2 vehicles (30, accounting for 49.2%) and females with 2 vehicles (13, making up 38.5%).
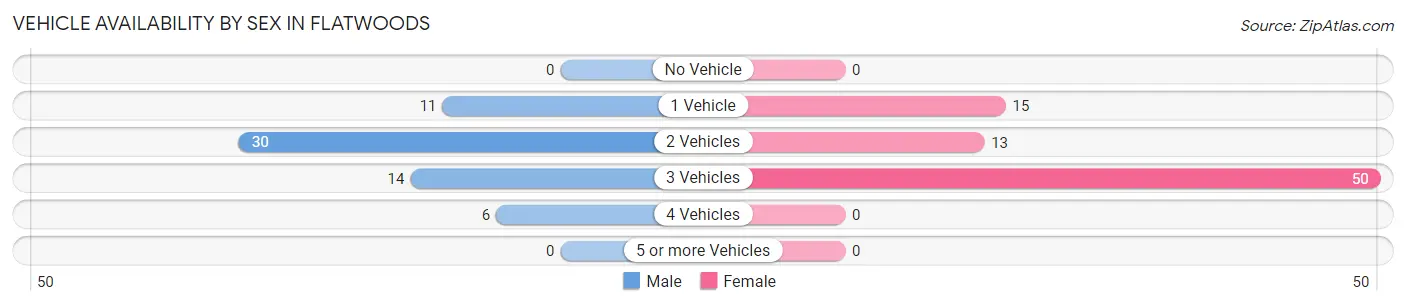
| Vehicles Available | Male | Female |
| No Vehicle | 0 (0.0%) | 0 (0.0%) |
| 1 Vehicle | 11 (18.0%) | 15 (19.2%) |
| 2 Vehicles | 30 (49.2%) | 13 (16.7%) |
| 3 Vehicles | 14 (23.0%) | 50 (64.1%) |
| 4 Vehicles | 6 (9.8%) | 0 (0.0%) |
| 5 or more Vehicles | 0 (0.0%) | 0 (0.0%) |
| Total | 61 (100.0%) | 78 (100.0%) |
Commute Time in Flatwoods
The most frequently occuring commute durations in Flatwoods are 10 to 14 minutes (25 commuters, 20.7%), 5 to 9 minutes (23 commuters, 19.0%), and 15 to 19 minutes (17 commuters, 14.1%).
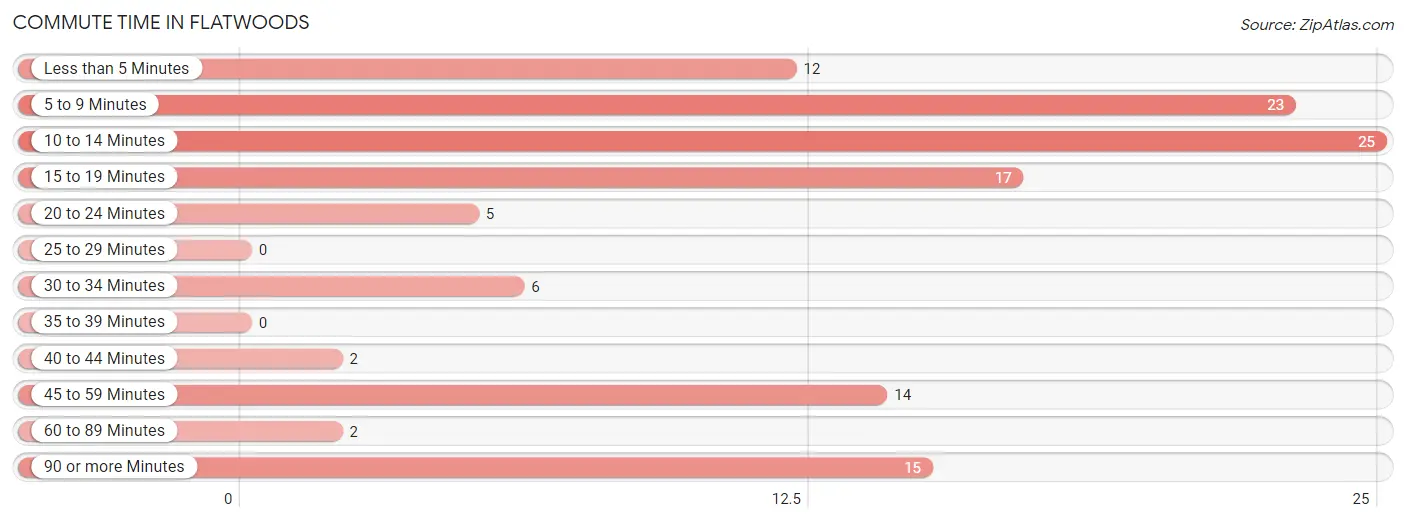
| Commute Time | # Commuters | % Commuters |
| Less than 5 Minutes | 12 | 9.9% |
| 5 to 9 Minutes | 23 | 19.0% |
| 10 to 14 Minutes | 25 | 20.7% |
| 15 to 19 Minutes | 17 | 14.1% |
| 20 to 24 Minutes | 5 | 4.1% |
| 25 to 29 Minutes | 0 | 0.0% |
| 30 to 34 Minutes | 6 | 5.0% |
| 35 to 39 Minutes | 0 | 0.0% |
| 40 to 44 Minutes | 2 | 1.7% |
| 45 to 59 Minutes | 14 | 11.6% |
| 60 to 89 Minutes | 2 | 1.7% |
| 90 or more Minutes | 15 | 12.4% |
Commute Time by Sex in Flatwoods
The most common commute times in Flatwoods are 90 or more minutes (15 commuters, 29.4%) for males and 10 to 14 minutes (14 commuters, 20.0%) for females.
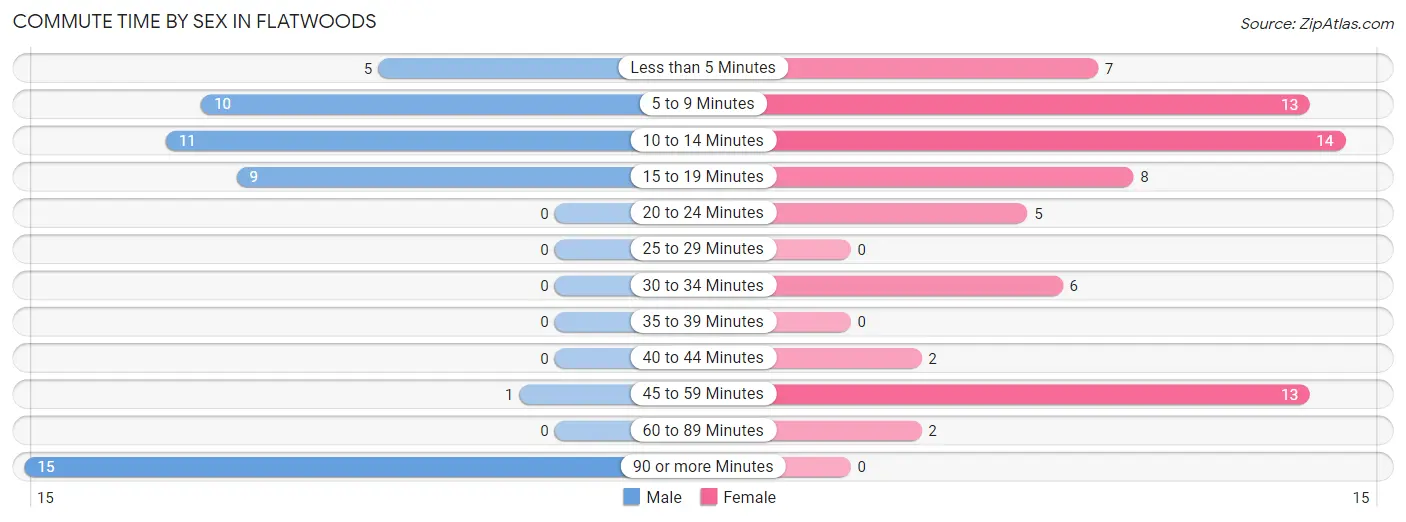
| Commute Time | Male | Female |
| Less than 5 Minutes | 5 (9.8%) | 7 (10.0%) |
| 5 to 9 Minutes | 10 (19.6%) | 13 (18.6%) |
| 10 to 14 Minutes | 11 (21.6%) | 14 (20.0%) |
| 15 to 19 Minutes | 9 (17.6%) | 8 (11.4%) |
| 20 to 24 Minutes | 0 (0.0%) | 5 (7.1%) |
| 25 to 29 Minutes | 0 (0.0%) | 0 (0.0%) |
| 30 to 34 Minutes | 0 (0.0%) | 6 (8.6%) |
| 35 to 39 Minutes | 0 (0.0%) | 0 (0.0%) |
| 40 to 44 Minutes | 0 (0.0%) | 2 (2.9%) |
| 45 to 59 Minutes | 1 (2.0%) | 13 (18.6%) |
| 60 to 89 Minutes | 0 (0.0%) | 2 (2.9%) |
| 90 or more Minutes | 15 (29.4%) | 0 (0.0%) |
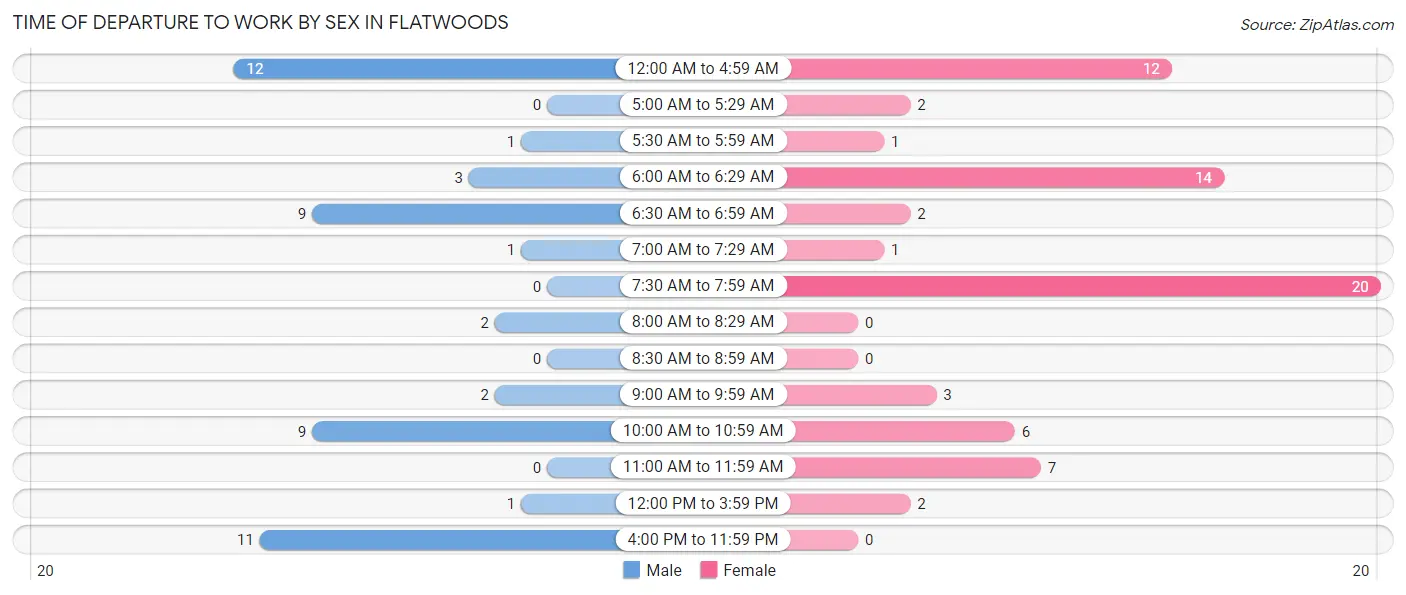
Time of Departure to Work by Sex in Flatwoods
The most frequent times of departure to work in Flatwoods are 12:00 AM to 4:59 AM (12, 23.5%) for males and 7:30 AM to 7:59 AM (20, 28.6%) for females.
| Time of Departure | Male | Female |
| 12:00 AM to 4:59 AM | 12 (23.5%) | 12 (17.1%) |
| 5:00 AM to 5:29 AM | 0 (0.0%) | 2 (2.9%) |
| 5:30 AM to 5:59 AM | 1 (2.0%) | 1 (1.4%) |
| 6:00 AM to 6:29 AM | 3 (5.9%) | 14 (20.0%) |
| 6:30 AM to 6:59 AM | 9 (17.6%) | 2 (2.9%) |
| 7:00 AM to 7:29 AM | 1 (2.0%) | 1 (1.4%) |
| 7:30 AM to 7:59 AM | 0 (0.0%) | 20 (28.6%) |
| 8:00 AM to 8:29 AM | 2 (3.9%) | 0 (0.0%) |
| 8:30 AM to 8:59 AM | 0 (0.0%) | 0 (0.0%) |
| 9:00 AM to 9:59 AM | 2 (3.9%) | 3 (4.3%) |
| 10:00 AM to 10:59 AM | 9 (17.6%) | 6 (8.6%) |
| 11:00 AM to 11:59 AM | 0 (0.0%) | 7 (10.0%) |
| 12:00 PM to 3:59 PM | 1 (2.0%) | 2 (2.9%) |
| 4:00 PM to 11:59 PM | 11 (21.6%) | 0 (0.0%) |
| Total | 51 (100.0%) | 70 (100.0%) |
Housing Occupancy in Flatwoods
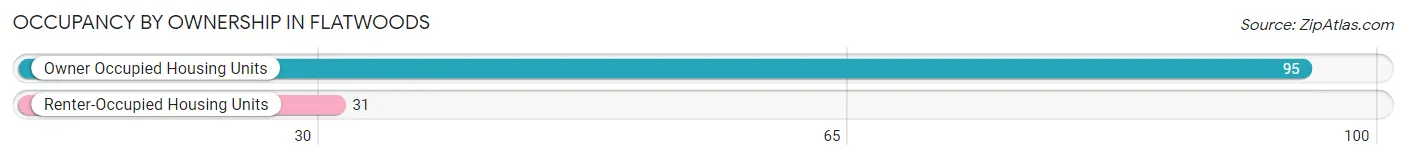
Occupancy by Ownership in Flatwoods
Of the total 126 dwellings in Flatwoods, owner-occupied units account for 95 (75.4%), while renter-occupied units make up 31 (24.6%).
| Occupancy | # Housing Units | % Housing Units |
| Owner Occupied Housing Units | 95 | 75.4% |
| Renter-Occupied Housing Units | 31 | 24.6% |
| Total Occupied Housing Units | 126 | 100.0% |
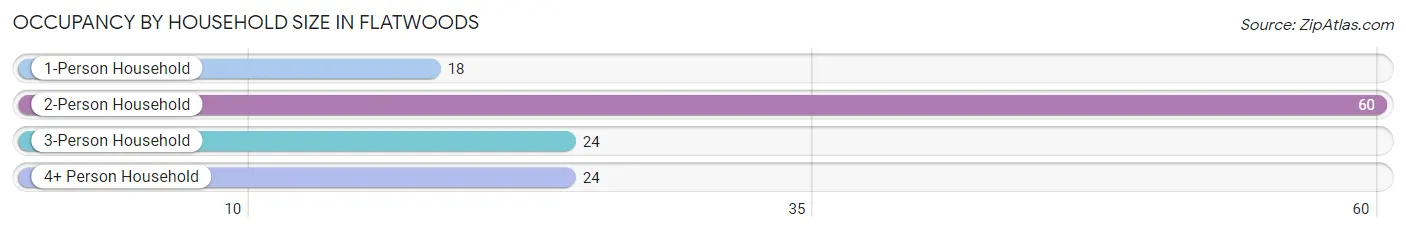
Occupancy by Household Size in Flatwoods
| Household Size | # Housing Units | % Housing Units |
| 1-Person Household | 18 | 14.3% |
| 2-Person Household | 60 | 47.6% |
| 3-Person Household | 24 | 19.1% |
| 4+ Person Household | 24 | 19.1% |
| Total Housing Units | 126 | 100.0% |
Occupancy by Ownership by Household Size in Flatwoods
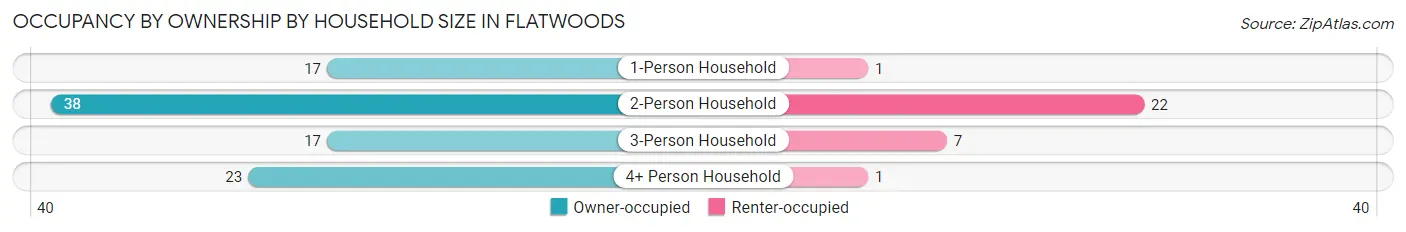
| Household Size | Owner-occupied | Renter-occupied |
| 1-Person Household | 17 (94.4%) | 1 (5.6%) |
| 2-Person Household | 38 (63.3%) | 22 (36.7%) |
| 3-Person Household | 17 (70.8%) | 7 (29.2%) |
| 4+ Person Household | 23 (95.8%) | 1 (4.2%) |
| Total Housing Units | 95 (75.4%) | 31 (24.6%) |
Occupancy by Educational Attainment in Flatwoods
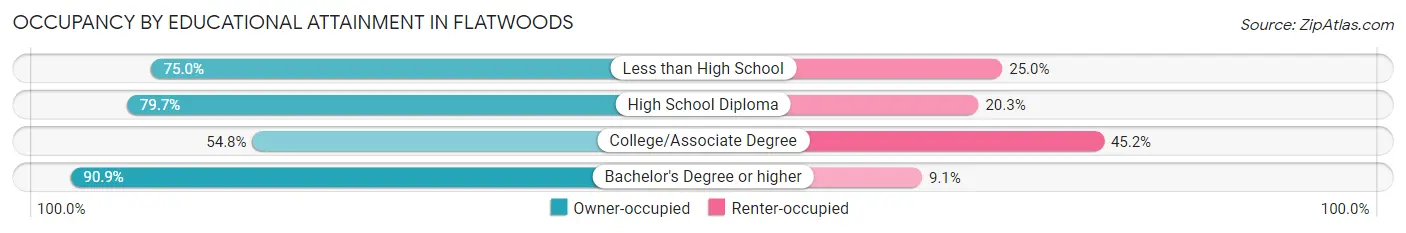
| Household Size | Owner-occupied | Renter-occupied |
| Less than High School | 3 (75.0%) | 1 (25.0%) |
| High School Diploma | 55 (79.7%) | 14 (20.3%) |
| College/Associate Degree | 17 (54.8%) | 14 (45.2%) |
| Bachelor's Degree or higher | 20 (90.9%) | 2 (9.1%) |
Occupancy by Age of Householder in Flatwoods
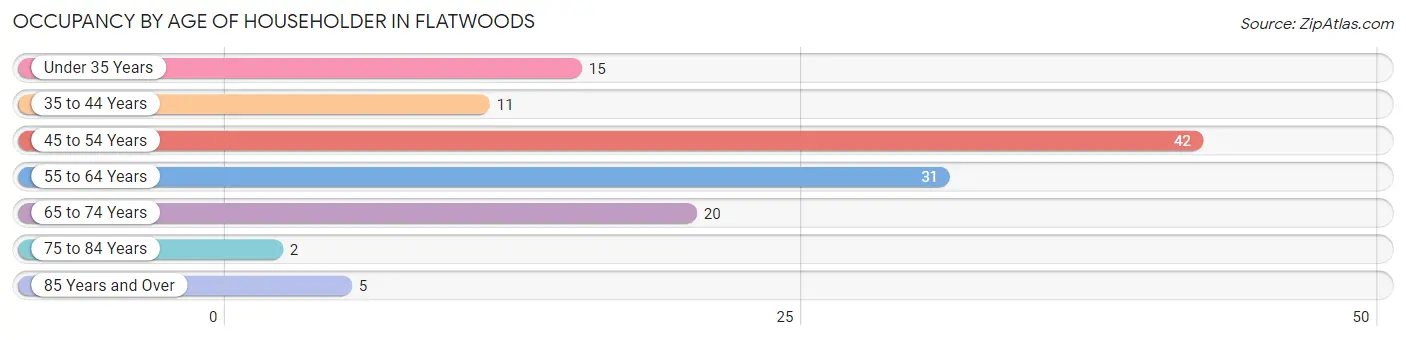
| Age Bracket | # Households | % Households |
| Under 35 Years | 15 | 11.9% |
| 35 to 44 Years | 11 | 8.7% |
| 45 to 54 Years | 42 | 33.3% |
| 55 to 64 Years | 31 | 24.6% |
| 65 to 74 Years | 20 | 15.9% |
| 75 to 84 Years | 2 | 1.6% |
| 85 Years and Over | 5 | 4.0% |
| Total | 126 | 100.0% |
Housing Finances in Flatwoods
Median Income by Occupancy in Flatwoods
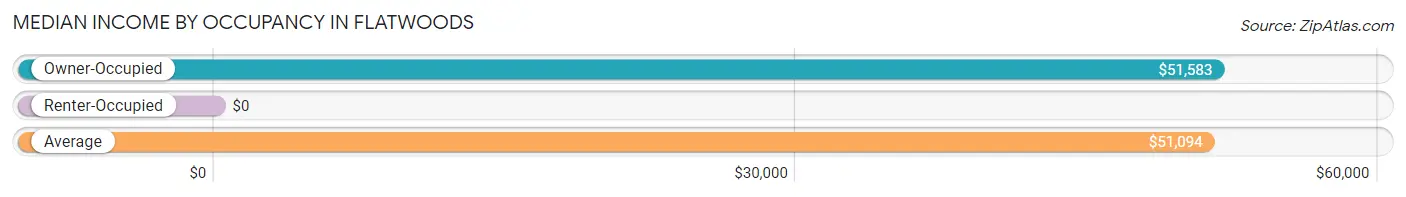
| Occupancy Type | # Households | Median Income |
| Owner-Occupied | 95 (75.4%) | $51,583 |
| Renter-Occupied | 31 (24.6%) | $0 |
| Average | 126 (100.0%) | $51,094 |
Occupancy by Householder Income Bracket in Flatwoods
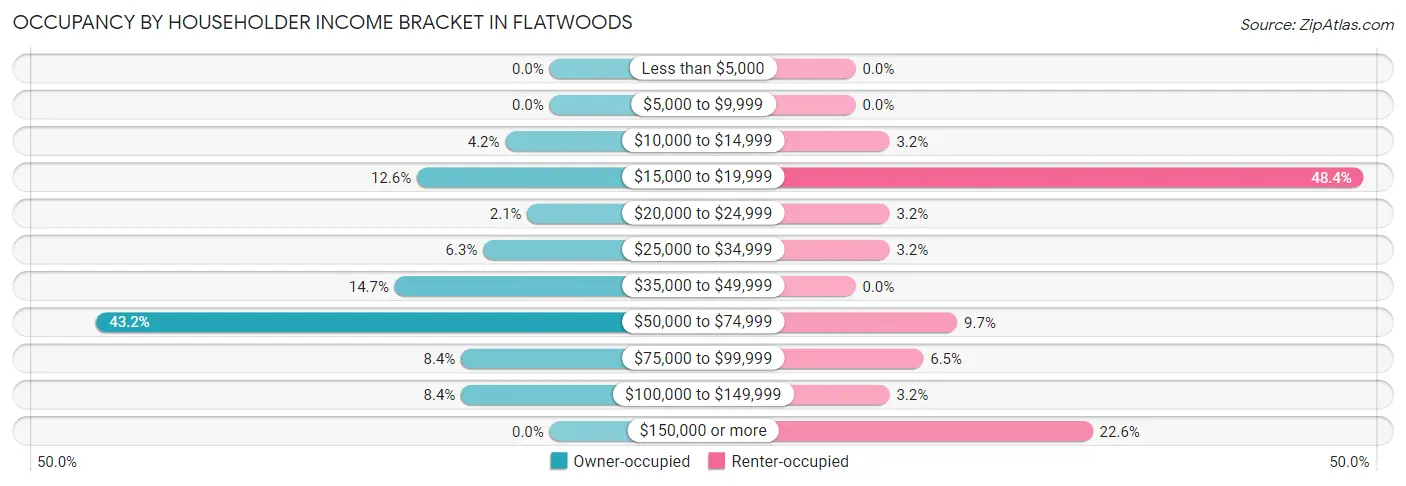
| Income Bracket | Owner-occupied | Renter-occupied |
| Less than $5,000 | 0 (0.0%) | 0 (0.0%) |
| $5,000 to $9,999 | 0 (0.0%) | 0 (0.0%) |
| $10,000 to $14,999 | 4 (4.2%) | 1 (3.2%) |
| $15,000 to $19,999 | 12 (12.6%) | 15 (48.4%) |
| $20,000 to $24,999 | 2 (2.1%) | 1 (3.2%) |
| $25,000 to $34,999 | 6 (6.3%) | 1 (3.2%) |
| $35,000 to $49,999 | 14 (14.7%) | 0 (0.0%) |
| $50,000 to $74,999 | 41 (43.2%) | 3 (9.7%) |
| $75,000 to $99,999 | 8 (8.4%) | 2 (6.5%) |
| $100,000 to $149,999 | 8 (8.4%) | 1 (3.2%) |
| $150,000 or more | 0 (0.0%) | 7 (22.6%) |
| Total | 95 (100.0%) | 31 (100.0%) |
Monthly Housing Cost Tiers in Flatwoods
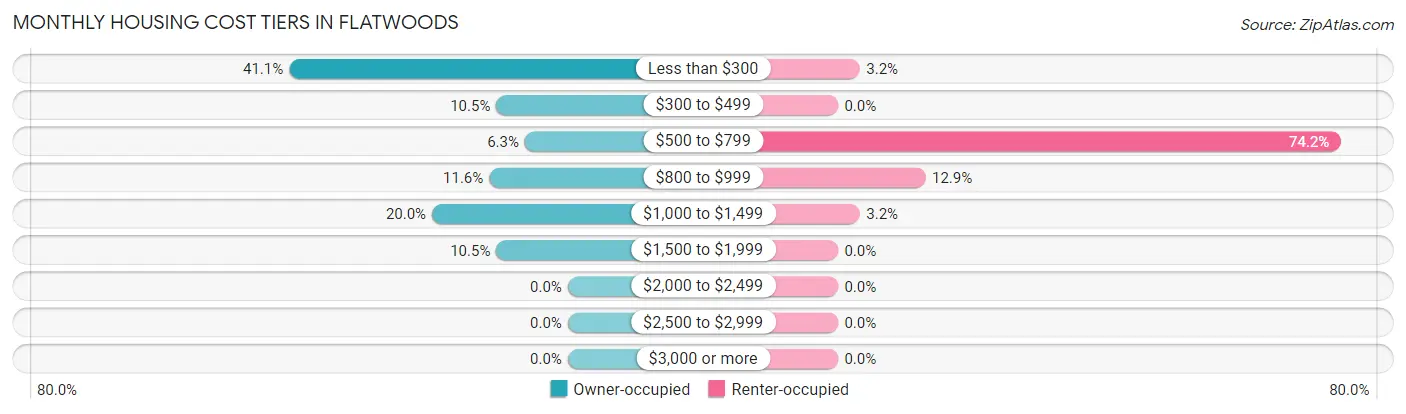
| Monthly Cost | Owner-occupied | Renter-occupied |
| Less than $300 | 39 (41.0%) | 1 (3.2%) |
| $300 to $499 | 10 (10.5%) | 0 (0.0%) |
| $500 to $799 | 6 (6.3%) | 23 (74.2%) |
| $800 to $999 | 11 (11.6%) | 4 (12.9%) |
| $1,000 to $1,499 | 19 (20.0%) | 1 (3.2%) |
| $1,500 to $1,999 | 10 (10.5%) | 0 (0.0%) |
| $2,000 to $2,499 | 0 (0.0%) | 0 (0.0%) |
| $2,500 to $2,999 | 0 (0.0%) | 0 (0.0%) |
| $3,000 or more | 0 (0.0%) | 0 (0.0%) |
| Total | 95 (100.0%) | 31 (100.0%) |
Physical Housing Characteristics in Flatwoods
Housing Structures in Flatwoods
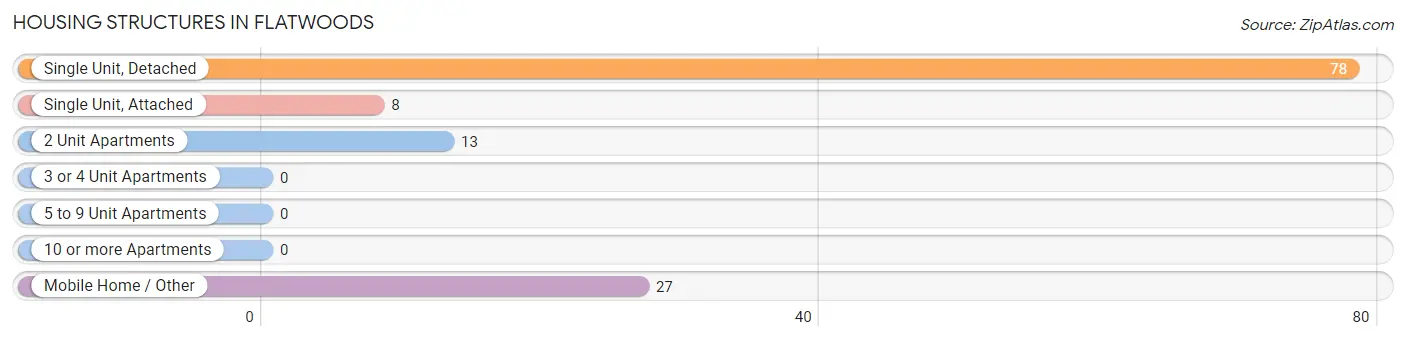
| Structure Type | # Housing Units | % Housing Units |
| Single Unit, Detached | 78 | 61.9% |
| Single Unit, Attached | 8 | 6.4% |
| 2 Unit Apartments | 13 | 10.3% |
| 3 or 4 Unit Apartments | 0 | 0.0% |
| 5 to 9 Unit Apartments | 0 | 0.0% |
| 10 or more Apartments | 0 | 0.0% |
| Mobile Home / Other | 27 | 21.4% |
| Total | 126 | 100.0% |
Housing Structures by Occupancy in Flatwoods
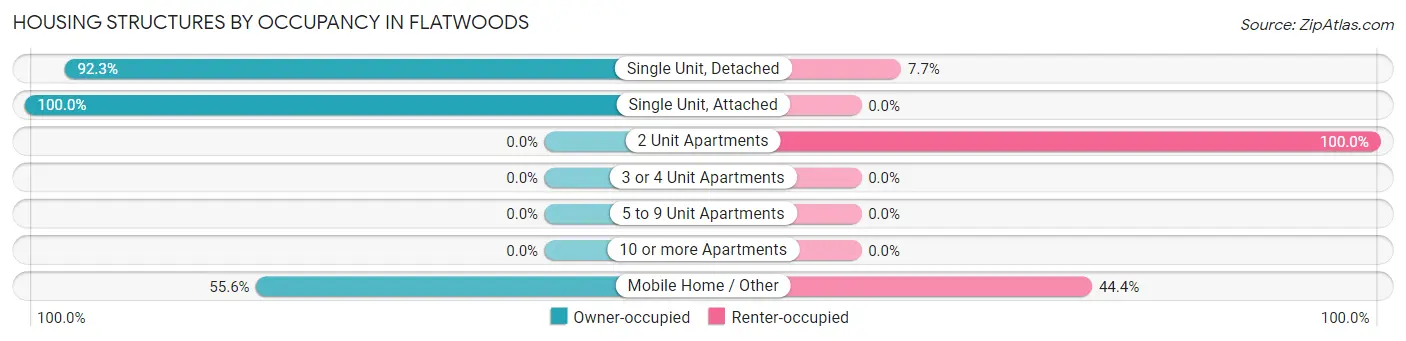
| Structure Type | Owner-occupied | Renter-occupied |
| Single Unit, Detached | 72 (92.3%) | 6 (7.7%) |
| Single Unit, Attached | 8 (100.0%) | 0 (0.0%) |
| 2 Unit Apartments | 0 (0.0%) | 13 (100.0%) |
| 3 or 4 Unit Apartments | 0 (0.0%) | 0 (0.0%) |
| 5 to 9 Unit Apartments | 0 (0.0%) | 0 (0.0%) |
| 10 or more Apartments | 0 (0.0%) | 0 (0.0%) |
| Mobile Home / Other | 15 (55.6%) | 12 (44.4%) |
| Total | 95 (75.4%) | 31 (24.6%) |
Housing Structures by Number of Rooms in Flatwoods
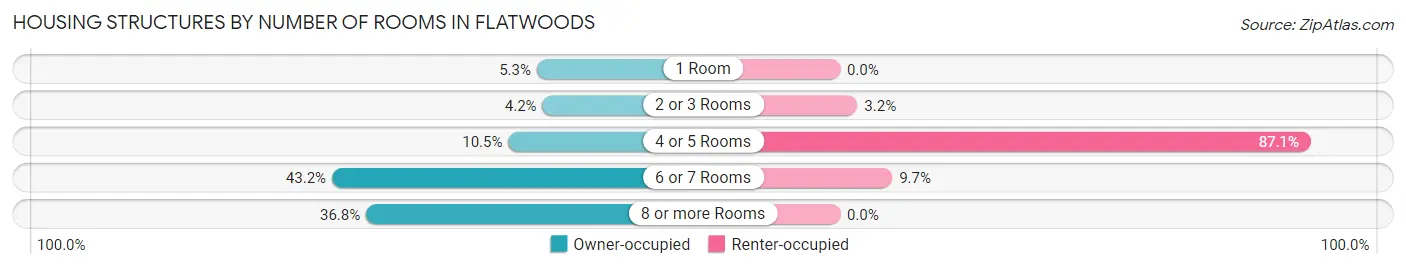
| Number of Rooms | Owner-occupied | Renter-occupied |
| 1 Room | 5 (5.3%) | 0 (0.0%) |
| 2 or 3 Rooms | 4 (4.2%) | 1 (3.2%) |
| 4 or 5 Rooms | 10 (10.5%) | 27 (87.1%) |
| 6 or 7 Rooms | 41 (43.2%) | 3 (9.7%) |
| 8 or more Rooms | 35 (36.8%) | 0 (0.0%) |
| Total | 95 (100.0%) | 31 (100.0%) |
Housing Structure by Heating Type in Flatwoods
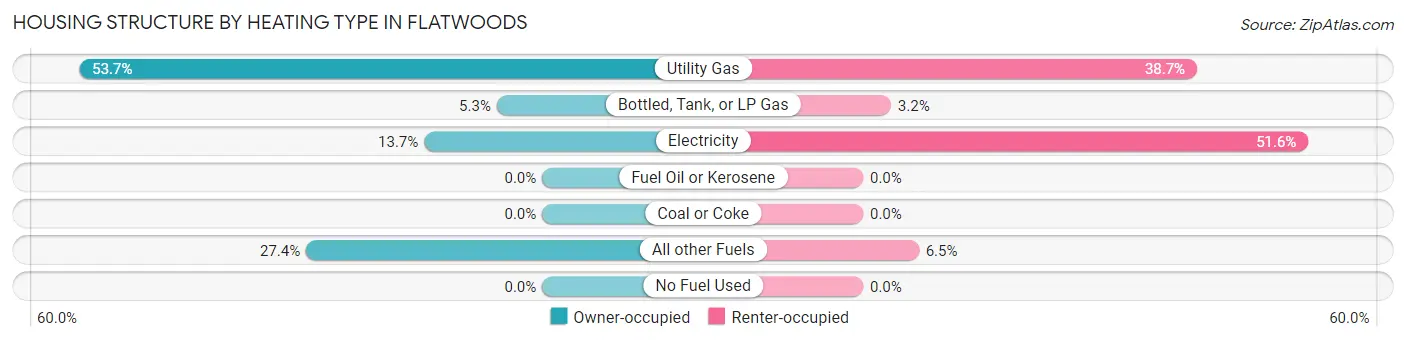
| Heating Type | Owner-occupied | Renter-occupied |
| Utility Gas | 51 (53.7%) | 12 (38.7%) |
| Bottled, Tank, or LP Gas | 5 (5.3%) | 1 (3.2%) |
| Electricity | 13 (13.7%) | 16 (51.6%) |
| Fuel Oil or Kerosene | 0 (0.0%) | 0 (0.0%) |
| Coal or Coke | 0 (0.0%) | 0 (0.0%) |
| All other Fuels | 26 (27.4%) | 2 (6.5%) |
| No Fuel Used | 0 (0.0%) | 0 (0.0%) |
| Total | 95 (100.0%) | 31 (100.0%) |
Household Vehicle Usage in Flatwoods
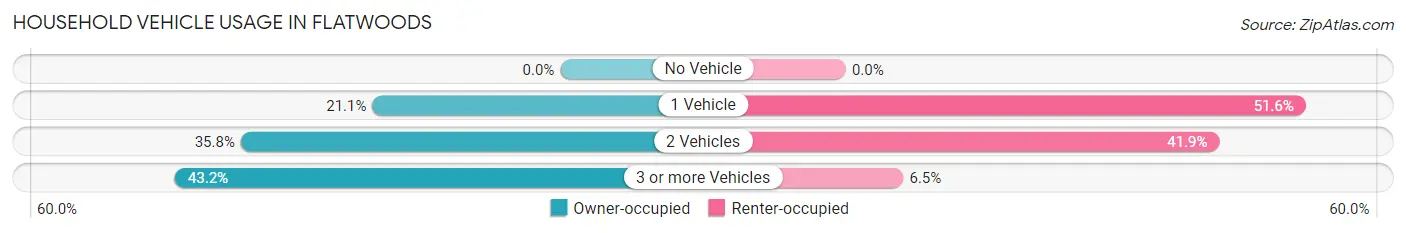
| Vehicles per Household | Owner-occupied | Renter-occupied |
| No Vehicle | 0 (0.0%) | 0 (0.0%) |
| 1 Vehicle | 20 (21.0%) | 16 (51.6%) |
| 2 Vehicles | 34 (35.8%) | 13 (41.9%) |
| 3 or more Vehicles | 41 (43.2%) | 2 (6.5%) |
| Total | 95 (100.0%) | 31 (100.0%) |
Real Estate & Mortgages in Flatwoods
Real Estate and Mortgage Overview in Flatwoods
| Characteristic | Without Mortgage | With Mortgage |
| Housing Units | 49 | 46 |
| Median Property Value | $77,000 | $183,300 |
| Median Household Income | $43,750 | $0 |
| Monthly Housing Costs | $270 | $0 |
| Real Estate Taxes | $429 | $0 |
Property Value by Mortgage Status in Flatwoods
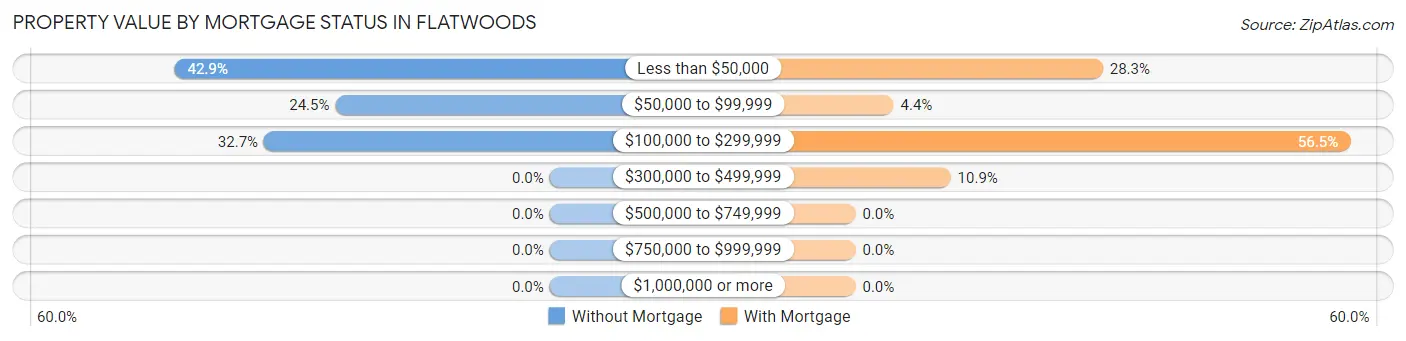
| Property Value | Without Mortgage | With Mortgage |
| Less than $50,000 | 21 (42.9%) | 13 (28.3%) |
| $50,000 to $99,999 | 12 (24.5%) | 2 (4.3%) |
| $100,000 to $299,999 | 16 (32.7%) | 26 (56.5%) |
| $300,000 to $499,999 | 0 (0.0%) | 5 (10.9%) |
| $500,000 to $749,999 | 0 (0.0%) | 0 (0.0%) |
| $750,000 to $999,999 | 0 (0.0%) | 0 (0.0%) |
| $1,000,000 or more | 0 (0.0%) | 0 (0.0%) |
| Total | 49 (100.0%) | 46 (100.0%) |
Household Income by Mortgage Status in Flatwoods
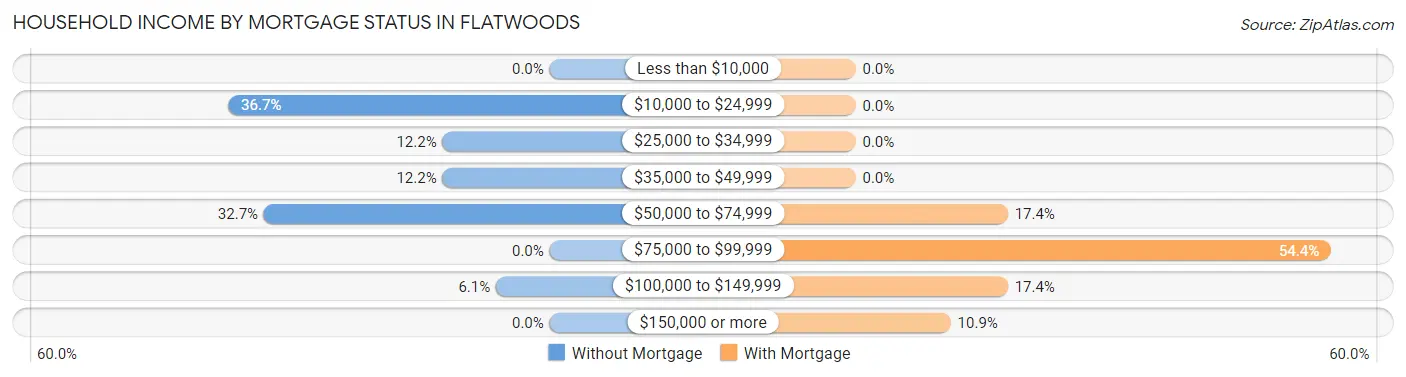
| Household Income | Without Mortgage | With Mortgage |
| Less than $10,000 | 0 (0.0%) | 0 (0.0%) |
| $10,000 to $24,999 | 18 (36.7%) | 0 (0.0%) |
| $25,000 to $34,999 | 6 (12.2%) | 0 (0.0%) |
| $35,000 to $49,999 | 6 (12.2%) | 0 (0.0%) |
| $50,000 to $74,999 | 16 (32.7%) | 8 (17.4%) |
| $75,000 to $99,999 | 0 (0.0%) | 25 (54.3%) |
| $100,000 to $149,999 | 3 (6.1%) | 8 (17.4%) |
| $150,000 or more | 0 (0.0%) | 5 (10.9%) |
| Total | 49 (100.0%) | 46 (100.0%) |
Property Value to Household Income Ratio in Flatwoods
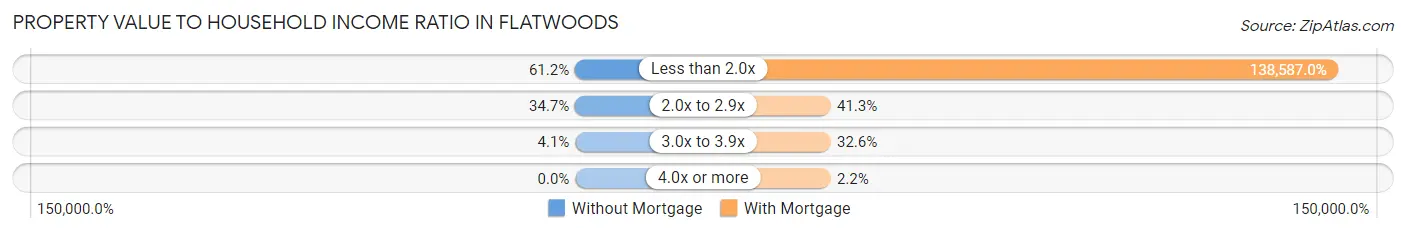
| Value-to-Income Ratio | Without Mortgage | With Mortgage |
| Less than 2.0x | 30 (61.2%) | 63,750 (138,587.0%) |
| 2.0x to 2.9x | 17 (34.7%) | 19 (41.3%) |
| 3.0x to 3.9x | 2 (4.1%) | 15 (32.6%) |
| 4.0x or more | 0 (0.0%) | 1 (2.2%) |
| Total | 49 (100.0%) | 46 (100.0%) |
Real Estate Taxes by Mortgage Status in Flatwoods
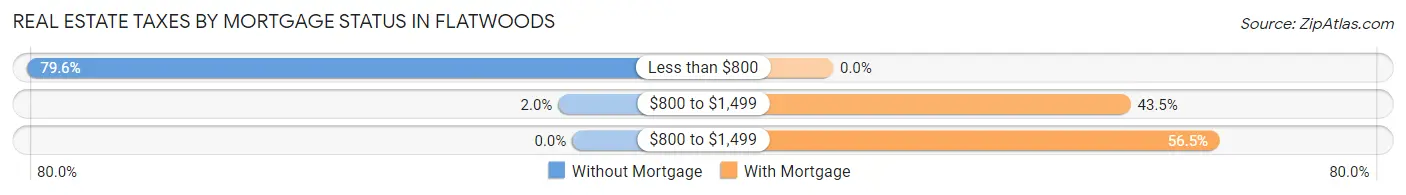
| Property Taxes | Without Mortgage | With Mortgage |
| Less than $800 | 39 (79.6%) | 0 (0.0%) |
| $800 to $1,499 | 1 (2.0%) | 20 (43.5%) |
| $800 to $1,499 | 0 (0.0%) | 26 (56.5%) |
| Total | 49 (100.0%) | 46 (100.0%) |
Health & Disability in Flatwoods
Health Insurance Coverage by Age in Flatwoods
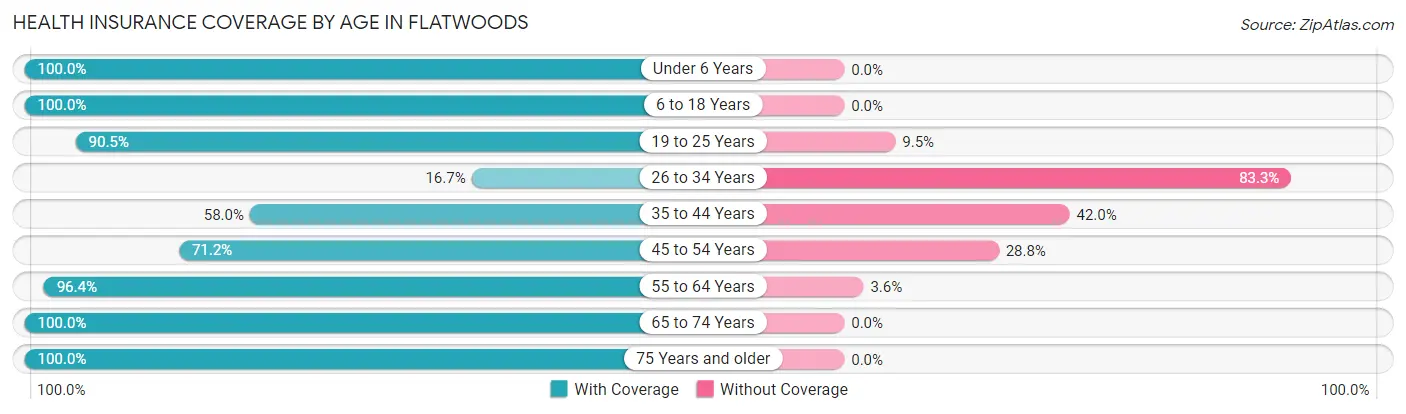
| Age Bracket | With Coverage | Without Coverage |
| Under 6 Years | 5 (100.0%) | 0 (0.0%) |
| 6 to 18 Years | 118 (100.0%) | 0 (0.0%) |
| 19 to 25 Years | 38 (90.5%) | 4 (9.5%) |
| 26 to 34 Years | 5 (16.7%) | 25 (83.3%) |
| 35 to 44 Years | 29 (58.0%) | 21 (42.0%) |
| 45 to 54 Years | 47 (71.2%) | 19 (28.8%) |
| 55 to 64 Years | 54 (96.4%) | 2 (3.6%) |
| 65 to 74 Years | 26 (100.0%) | 0 (0.0%) |
| 75 Years and older | 18 (100.0%) | 0 (0.0%) |
| Total | 340 (82.7%) | 71 (17.3%) |
Health Insurance Coverage by Citizenship Status in Flatwoods
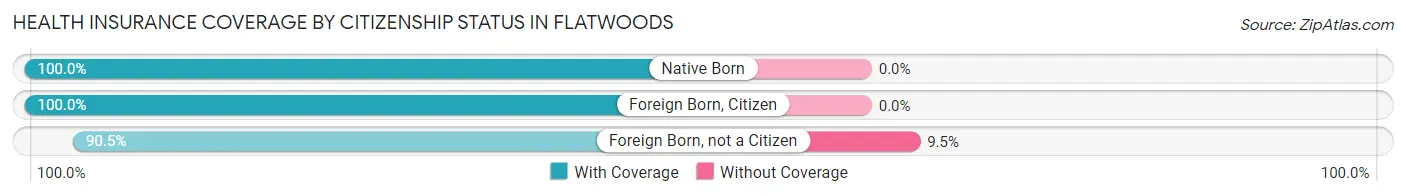
| Citizenship Status | With Coverage | Without Coverage |
| Native Born | 5 (100.0%) | 0 (0.0%) |
| Foreign Born, Citizen | 118 (100.0%) | 0 (0.0%) |
| Foreign Born, not a Citizen | 38 (90.5%) | 4 (9.5%) |
Health Insurance Coverage by Household Income in Flatwoods
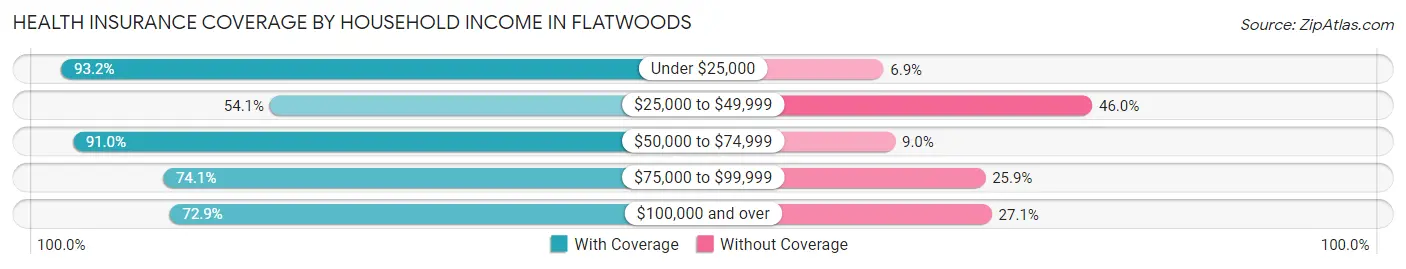
| Household Income | With Coverage | Without Coverage |
| Under $25,000 | 68 (93.1%) | 5 (6.9%) |
| $25,000 to $49,999 | 20 (54.0%) | 17 (46.0%) |
| $50,000 to $74,999 | 161 (91.0%) | 16 (9.0%) |
| $75,000 to $99,999 | 40 (74.1%) | 14 (25.9%) |
| $100,000 and over | 51 (72.9%) | 19 (27.1%) |
Public vs Private Health Insurance Coverage by Age in Flatwoods
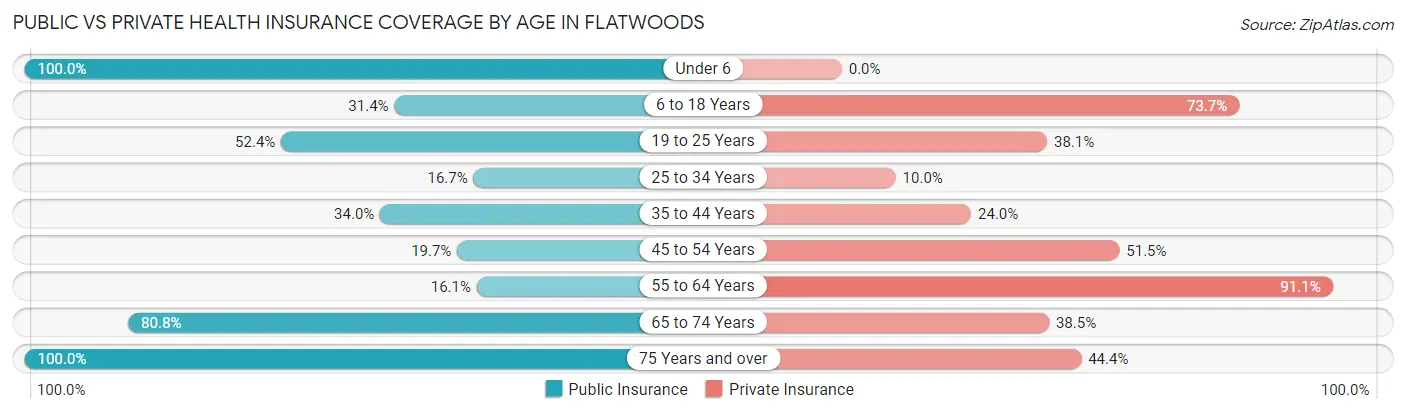
| Age Bracket | Public Insurance | Private Insurance |
| Under 6 | 5 (100.0%) | 0 (0.0%) |
| 6 to 18 Years | 37 (31.4%) | 87 (73.7%) |
| 19 to 25 Years | 22 (52.4%) | 16 (38.1%) |
| 25 to 34 Years | 5 (16.7%) | 3 (10.0%) |
| 35 to 44 Years | 17 (34.0%) | 12 (24.0%) |
| 45 to 54 Years | 13 (19.7%) | 34 (51.5%) |
| 55 to 64 Years | 9 (16.1%) | 51 (91.1%) |
| 65 to 74 Years | 21 (80.8%) | 10 (38.5%) |
| 75 Years and over | 18 (100.0%) | 8 (44.4%) |
| Total | 147 (35.8%) | 221 (53.8%) |
Disability Status by Sex by Age in Flatwoods
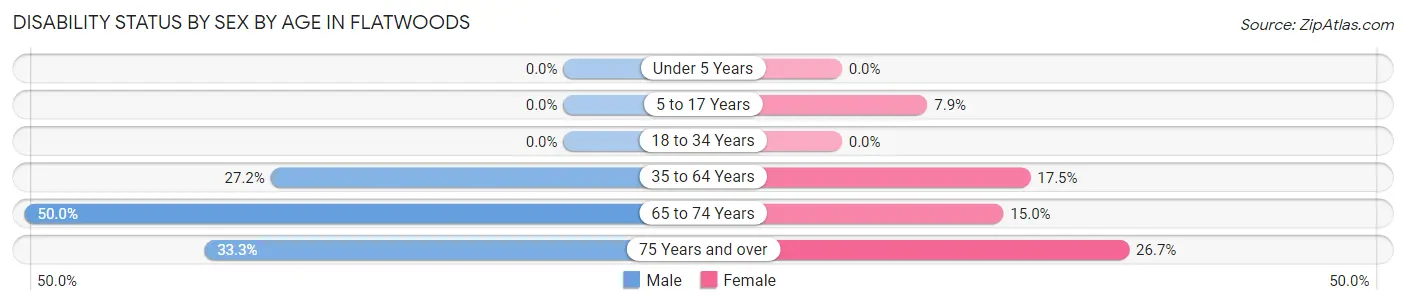
| Age Bracket | Male | Female |
| Under 5 Years | 0 (0.0%) | 0 (0.0%) |
| 5 to 17 Years | 0 (0.0%) | 5 (7.9%) |
| 18 to 34 Years | 0 (0.0%) | 0 (0.0%) |
| 35 to 64 Years | 25 (27.2%) | 14 (17.5%) |
| 65 to 74 Years | 3 (50.0%) | 3 (15.0%) |
| 75 Years and over | 1 (33.3%) | 4 (26.7%) |
Disability Class by Sex by Age in Flatwoods
Disability Class: Hearing Difficulty
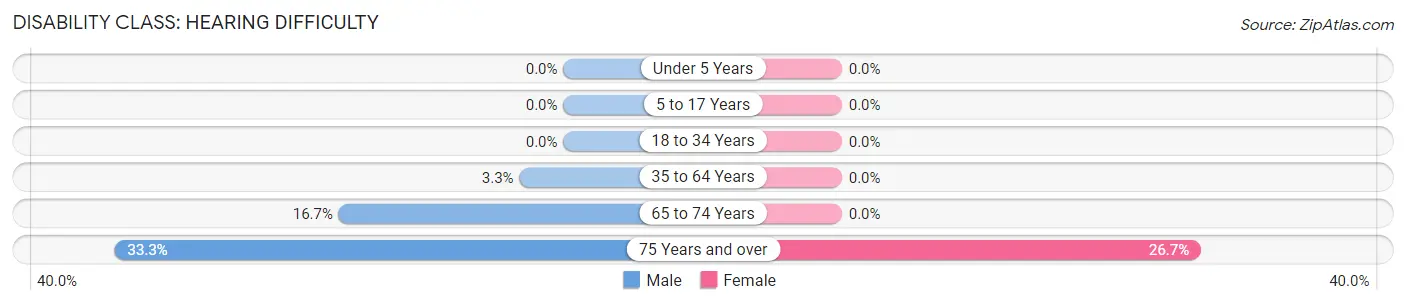
| Age Bracket | Male | Female |
| Under 5 Years | 0 (0.0%) | 0 (0.0%) |
| 5 to 17 Years | 0 (0.0%) | 0 (0.0%) |
| 18 to 34 Years | 0 (0.0%) | 0 (0.0%) |
| 35 to 64 Years | 3 (3.3%) | 0 (0.0%) |
| 65 to 74 Years | 1 (16.7%) | 0 (0.0%) |
| 75 Years and over | 1 (33.3%) | 4 (26.7%) |
Disability Class: Vision Difficulty
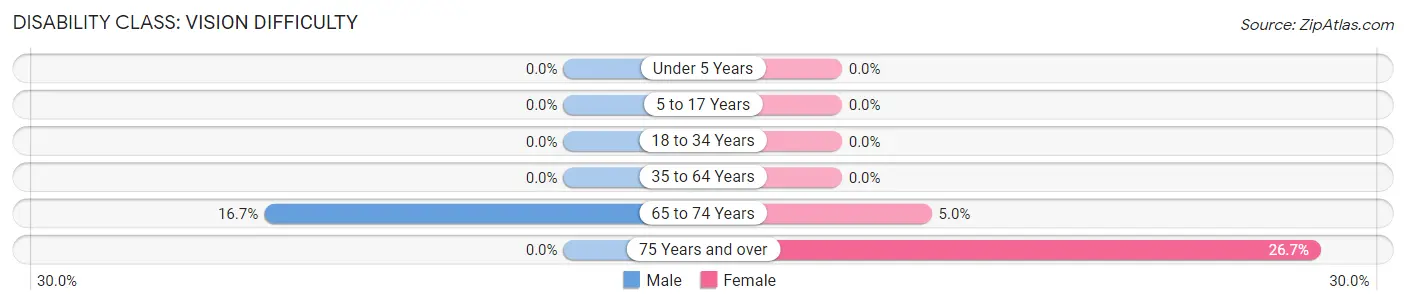
| Age Bracket | Male | Female |
| Under 5 Years | 0 (0.0%) | 0 (0.0%) |
| 5 to 17 Years | 0 (0.0%) | 0 (0.0%) |
| 18 to 34 Years | 0 (0.0%) | 0 (0.0%) |
| 35 to 64 Years | 0 (0.0%) | 0 (0.0%) |
| 65 to 74 Years | 1 (16.7%) | 1 (5.0%) |
| 75 Years and over | 0 (0.0%) | 4 (26.7%) |
Disability Class: Cognitive Difficulty
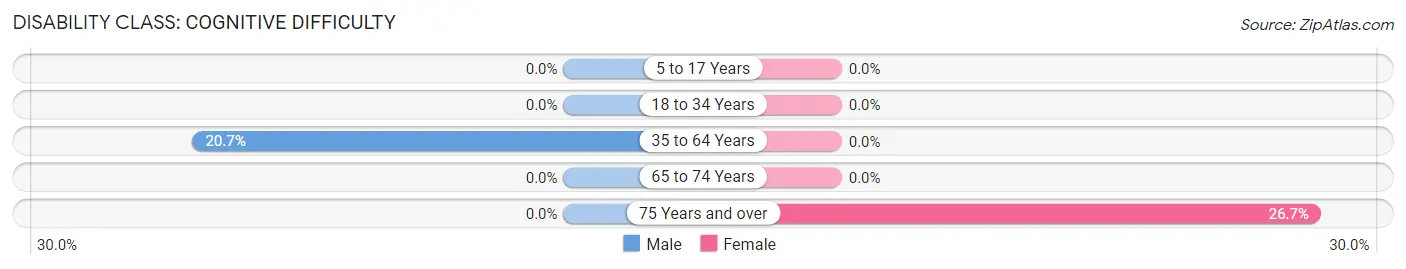
| Age Bracket | Male | Female |
| 5 to 17 Years | 0 (0.0%) | 0 (0.0%) |
| 18 to 34 Years | 0 (0.0%) | 0 (0.0%) |
| 35 to 64 Years | 19 (20.6%) | 0 (0.0%) |
| 65 to 74 Years | 0 (0.0%) | 0 (0.0%) |
| 75 Years and over | 0 (0.0%) | 4 (26.7%) |
Disability Class: Ambulatory Difficulty

| Age Bracket | Male | Female |
| 5 to 17 Years | 0 (0.0%) | 0 (0.0%) |
| 18 to 34 Years | 0 (0.0%) | 0 (0.0%) |
| 35 to 64 Years | 4 (4.3%) | 14 (17.5%) |
| 65 to 74 Years | 3 (50.0%) | 2 (10.0%) |
| 75 Years and over | 0 (0.0%) | 4 (26.7%) |
Disability Class: Self-Care Difficulty
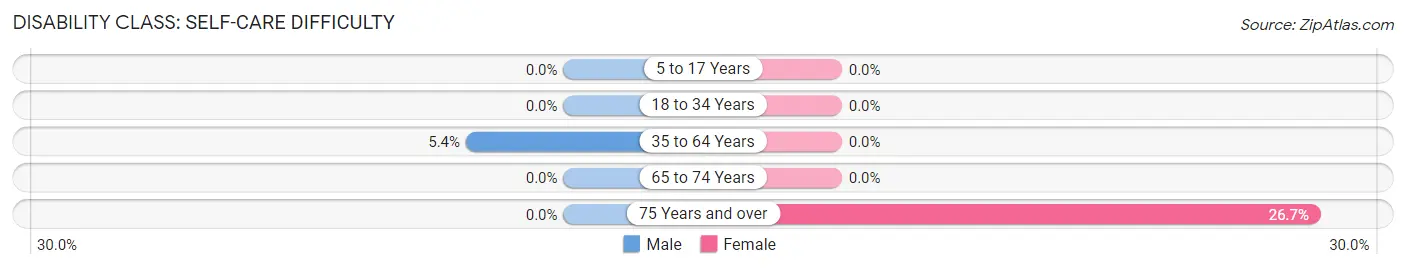
| Age Bracket | Male | Female |
| 5 to 17 Years | 0 (0.0%) | 0 (0.0%) |
| 18 to 34 Years | 0 (0.0%) | 0 (0.0%) |
| 35 to 64 Years | 5 (5.4%) | 0 (0.0%) |
| 65 to 74 Years | 0 (0.0%) | 0 (0.0%) |
| 75 Years and over | 0 (0.0%) | 4 (26.7%) |
Technology Access in Flatwoods
Computing Device Access in Flatwoods
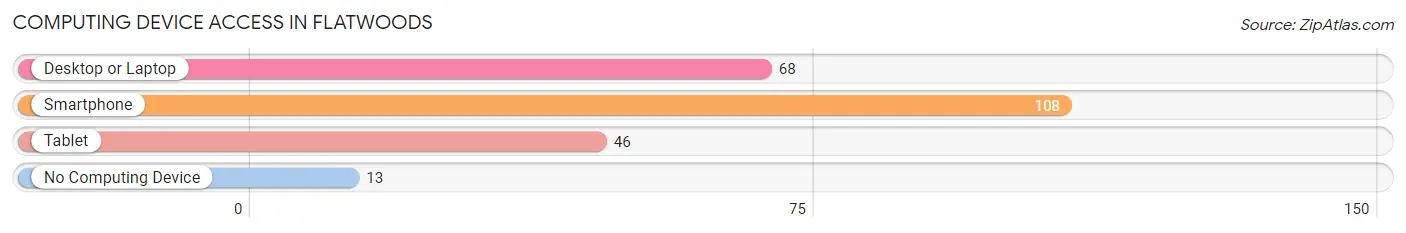
| Device Type | # Households | % Households |
| Desktop or Laptop | 68 | 54.0% |
| Smartphone | 108 | 85.7% |
| Tablet | 46 | 36.5% |
| No Computing Device | 13 | 10.3% |
| Total | 126 | 100.0% |
Internet Access in Flatwoods
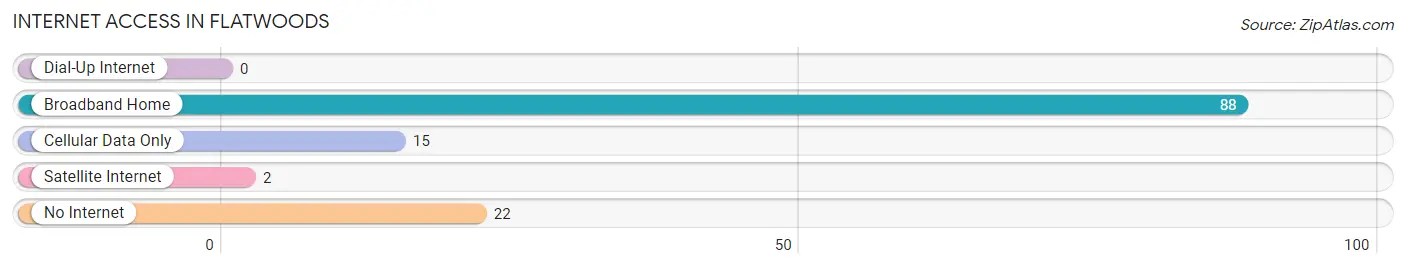
| Internet Type | # Households | % Households |
| Dial-Up Internet | 0 | 0.0% |
| Broadband Home | 88 | 69.8% |
| Cellular Data Only | 15 | 11.9% |
| Satellite Internet | 2 | 1.6% |
| No Internet | 22 | 17.5% |
| Total | 126 | 100.0% |
Flatwoods Summary
Flatwoods is a small town located in Braxton County, West Virginia. It is situated in the foothills of the Appalachian Mountains and is part of the larger metropolitan area of Charleston, West Virginia. The town has a population of approximately 1,500 people and is known for its rural charm and friendly atmosphere.
History
Flatwoods was first settled in the late 1700s by a group of settlers from Pennsylvania. The town was originally known as “Flatwoods Settlement” and was located near the headwaters of the Little Kanawha River. The town was officially incorporated in 1891 and was named after the flat terrain of the area.
The town was a major hub for the coal mining industry in the early 1900s. The coal industry provided jobs and economic stability to the town and its residents. The town also had a thriving lumber industry, which provided timber for the construction of homes and businesses.
The town experienced a period of decline in the mid-1900s as the coal industry began to decline. The town’s population decreased and many businesses closed. However, the town has experienced a resurgence in recent years as new businesses have opened and the population has grown.
Geography
Flatwoods is located in the foothills of the Appalachian Mountains in Braxton County, West Virginia. The town is situated along the Little Kanawha River and is surrounded by rolling hills and forests. The town is located approximately 30 miles from the state capital of Charleston.
The town has a total area of 1.2 square miles and has an elevation of 1,068 feet. The climate in Flatwoods is humid and subtropical, with hot summers and mild winters.
Economy
The economy of Flatwoods is largely based on the coal mining industry. The town is home to several coal mines, which provide jobs and economic stability to the town and its residents. The town also has a thriving lumber industry, which provides timber for the construction of homes and businesses.
The town also has a growing tourism industry, with several attractions such as the Flatwoods Monster Museum and the Flatwoods Country Club. The town also has several restaurants, shops, and other businesses that cater to tourists.
Demographics
As of the 2010 census, the population of Flatwoods was 1,500. The racial makeup of the town was 97.3% White, 0.7% African American, 0.3% Native American, 0.3% Asian, and 1.3% from other races. The median household income was $30,000 and the median family income was $35,000.
The town has a large elderly population, with approximately 25% of the population over the age of 65. The town also has a large number of children, with approximately 25% of the population under the age of 18.
Conclusion
Flatwoods is a small town located in Braxton County, West Virginia. The town has a population of approximately 1,500 people and is known for its rural charm and friendly atmosphere. The town’s economy is largely based on the coal mining industry and the lumber industry. The town also has a growing tourism industry, with several attractions and businesses catering to tourists. The town has a large elderly population and a large number of children.
Common Questions
What is Per Capita Income in Flatwoods?
Per Capita income in Flatwoods is $20,777.
What is the Median Family Income in Flatwoods?
Median Family Income in Flatwoods is $51,719.
What is the Median Household income in Flatwoods?
Median Household Income in Flatwoods is $51,094.
What is Income or Wage Gap in Flatwoods?
Income or Wage Gap in Flatwoods is 9.0%.
Women in Flatwoods earn 91.0 cents for every dollar earned by a man.
What is Inequality or Gini Index in Flatwoods?
Inequality or Gini Index in Flatwoods is 0.36.
What is the Total Population of Flatwoods?
Total Population of Flatwoods is 411.
What is the Total Male Population of Flatwoods?
Total Male Population of Flatwoods is 168.
What is the Total Female Population of Flatwoods?
Total Female Population of Flatwoods is 243.
What is the Ratio of Males per 100 Females in Flatwoods?
There are 69.14 Males per 100 Females in Flatwoods.
What is the Ratio of Females per 100 Males in Flatwoods?
There are 144.64 Females per 100 Males in Flatwoods.
What is the Median Population Age in Flatwoods?
Median Population Age in Flatwoods is 37.1 Years.
What is the Average Family Size in Flatwoods
Average Family Size in Flatwoods is 3.6 People.
What is the Average Household Size in Flatwoods
Average Household Size in Flatwoods is 3.3 People.
How Large is the Labor Force in Flatwoods?
There are 189 People in the Labor Forcein in Flatwoods.
What is the Percentage of People in the Labor Force in Flatwoods?
55.4% of People are in the Labor Force in Flatwoods.
What is the Unemployment Rate in Flatwoods?
Unemployment Rate in Flatwoods is 20.6%.