Fayetteville, WV Map & Demographics
Fayetteville Map
Fayetteville Overview
$30,764
PER CAPITA INCOME
$63,772
AVG FAMILY INCOME
$63,514
AVG HOUSEHOLD INCOME
32.7%
WAGE / INCOME GAP [ % ]
67.3¢/ $1
WAGE / INCOME GAP [ $ ]
0.37
INEQUALITY / GINI INDEX
2,890
TOTAL POPULATION
1,509
MALE POPULATION
1,381
FEMALE POPULATION
109.27
MALES / 100 FEMALES
91.52
FEMALES / 100 MALES
44.8
MEDIAN AGE
2.9
AVG FAMILY SIZE
2.3
AVG HOUSEHOLD SIZE
1,112
LABOR FORCE [ PEOPLE ]
47.8%
PERCENT IN LABOR FORCE
3.5%
UNEMPLOYMENT RATE
Fayetteville Zip Codes
Fayetteville Area Codes
Income in Fayetteville
Income Overview in Fayetteville
Per Capita Income in Fayetteville is $30,764, while median incomes of families and households are $63,772 and $63,514 respectively.
| Characteristic | Number | Measure |
| Per Capita Income | 2,890 | $30,764 |
| Median Family Income | 798 | $63,772 |
| Mean Family Income | 798 | $75,123 |
| Median Household Income | 1,232 | $63,514 |
| Mean Household Income | 1,232 | $71,644 |
| Income Deficit | 798 | $0 |
| Wage / Income Gap (%) | 2,890 | 32.70% |
| Wage / Income Gap ($) | 2,890 | 67.30¢ per $1 |
| Gini / Inequality Index | 2,890 | 0.37 |
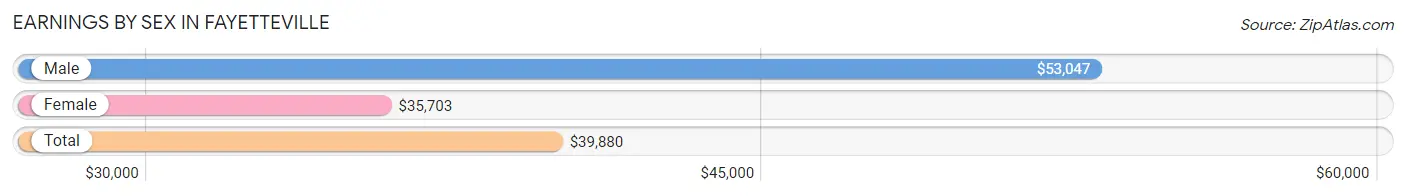
Earnings by Sex in Fayetteville
Average Earnings in Fayetteville are $39,880, $53,047 for men and $35,703 for women, a difference of 32.7%.
| Sex | Number | Average Earnings |
| Male | 773 (66.3%) | $53,047 |
| Female | 392 (33.7%) | $35,703 |
| Total | 1,165 (100.0%) | $39,880 |
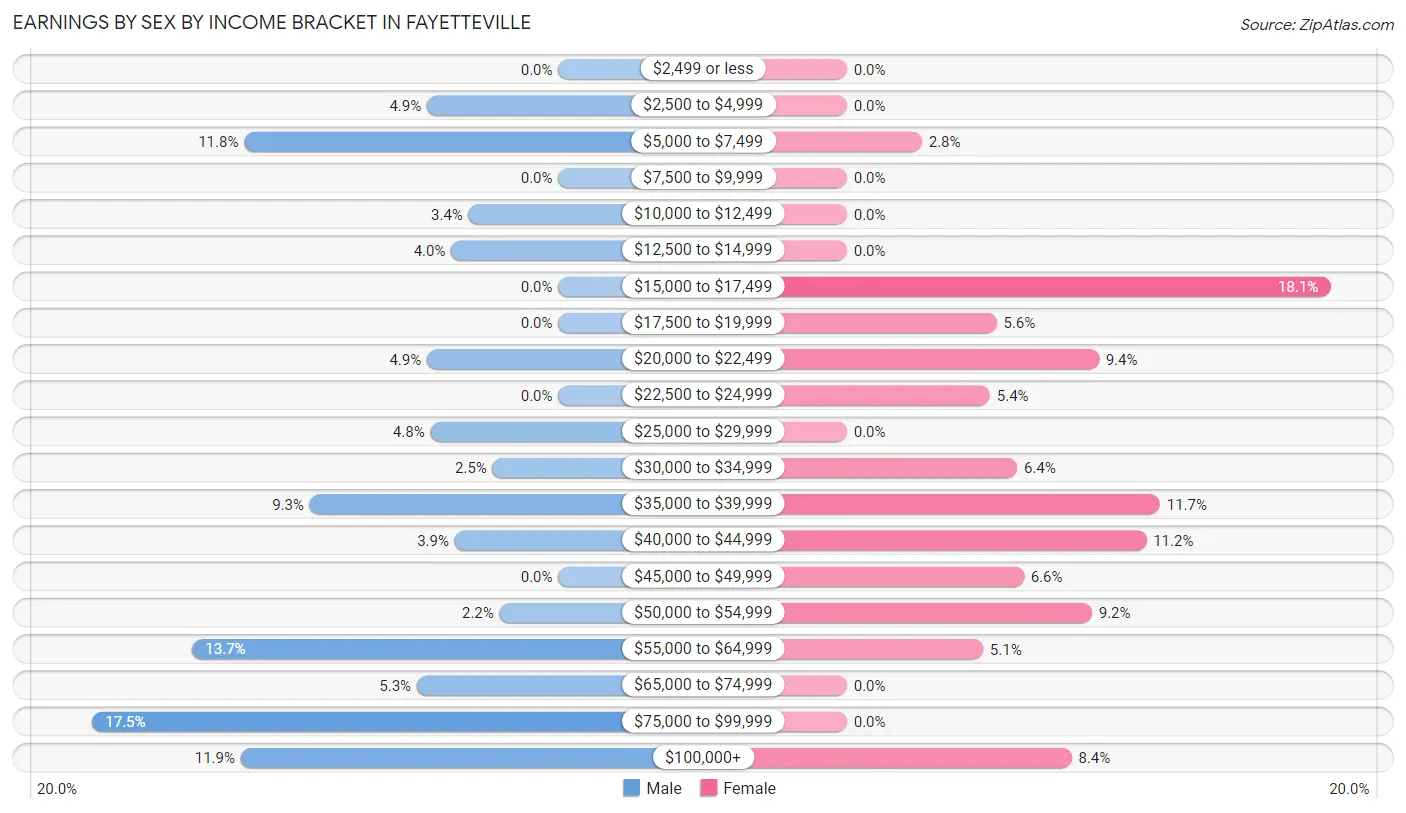
Earnings by Sex by Income Bracket in Fayetteville
The most common earnings brackets in Fayetteville are $75,000 to $99,999 for men (135 | 17.5%) and $15,000 to $17,499 for women (71 | 18.1%).
| Income | Male | Female |
| $2,499 or less | 0 (0.0%) | 0 (0.0%) |
| $2,500 to $4,999 | 38 (4.9%) | 0 (0.0%) |
| $5,000 to $7,499 | 91 (11.8%) | 11 (2.8%) |
| $7,500 to $9,999 | 0 (0.0%) | 0 (0.0%) |
| $10,000 to $12,499 | 26 (3.4%) | 0 (0.0%) |
| $12,500 to $14,999 | 31 (4.0%) | 0 (0.0%) |
| $15,000 to $17,499 | 0 (0.0%) | 71 (18.1%) |
| $17,500 to $19,999 | 0 (0.0%) | 22 (5.6%) |
| $20,000 to $22,499 | 38 (4.9%) | 37 (9.4%) |
| $22,500 to $24,999 | 0 (0.0%) | 21 (5.4%) |
| $25,000 to $29,999 | 37 (4.8%) | 0 (0.0%) |
| $30,000 to $34,999 | 19 (2.5%) | 25 (6.4%) |
| $35,000 to $39,999 | 72 (9.3%) | 46 (11.7%) |
| $40,000 to $44,999 | 30 (3.9%) | 44 (11.2%) |
| $45,000 to $49,999 | 0 (0.0%) | 26 (6.6%) |
| $50,000 to $54,999 | 17 (2.2%) | 36 (9.2%) |
| $55,000 to $64,999 | 106 (13.7%) | 20 (5.1%) |
| $65,000 to $74,999 | 41 (5.3%) | 0 (0.0%) |
| $75,000 to $99,999 | 135 (17.5%) | 0 (0.0%) |
| $100,000+ | 92 (11.9%) | 33 (8.4%) |
| Total | 773 (100.0%) | 392 (100.0%) |
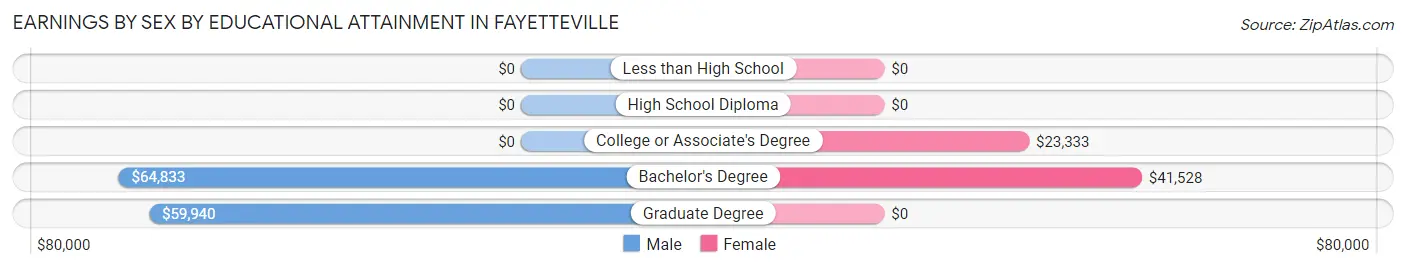
Earnings by Sex by Educational Attainment in Fayetteville
Average earnings in Fayetteville are $53,281 for men and $36,602 for women, a difference of 31.3%. Men with an educational attainment of bachelor's degree enjoy the highest average annual earnings of $64,833, while those with graduate degree education earn the least with $59,940. Women with an educational attainment of bachelor's degree earn the most with the average annual earnings of $41,528, while those with college or associate's degree education have the smallest earnings of $23,333.
| Educational Attainment | Male Income | Female Income |
| Less than High School | - | - |
| High School Diploma | - | - |
| College or Associate's Degree | - | - |
| Bachelor's Degree | $64,833 | $41,528 |
| Graduate Degree | $59,940 | $0 |
| Total | $53,281 | $36,602 |
Family Income in Fayetteville
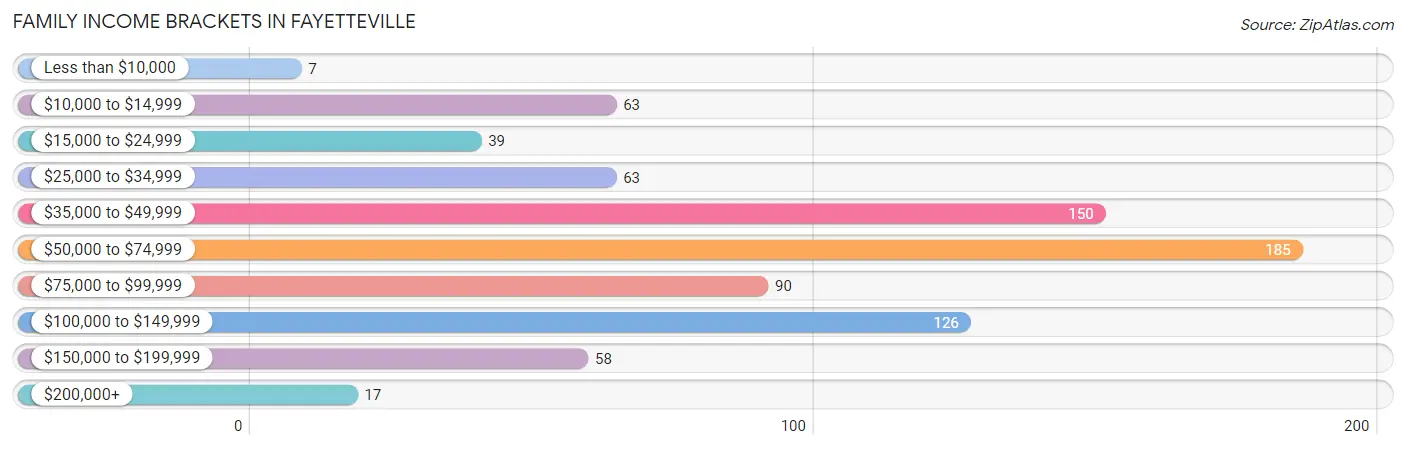
Family Income Brackets in Fayetteville
According to the Fayetteville family income data, there are 185 families falling into the $50,000 to $74,999 income range, which is the most common income bracket and makes up 23.2% of all families. Conversely, the less than $10,000 income bracket is the least frequent group with only 7 families (0.9%) belonging to this category.
| Income Bracket | # Families | % Families |
| Less than $10,000 | 7 | 0.9% |
| $10,000 to $14,999 | 63 | 7.9% |
| $15,000 to $24,999 | 39 | 4.9% |
| $25,000 to $34,999 | 63 | 7.9% |
| $35,000 to $49,999 | 150 | 18.8% |
| $50,000 to $74,999 | 185 | 23.2% |
| $75,000 to $99,999 | 90 | 11.3% |
| $100,000 to $149,999 | 126 | 15.8% |
| $150,000 to $199,999 | 58 | 7.3% |
| $200,000+ | 17 | 2.1% |
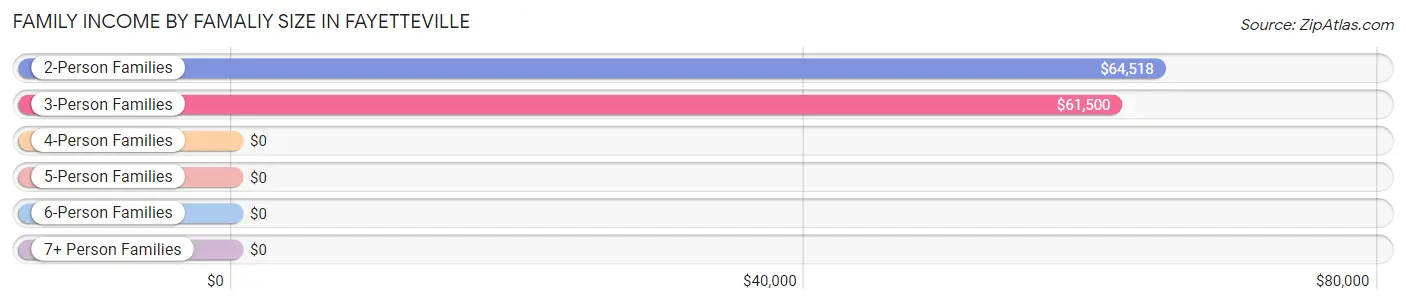
Family Income by Famaliy Size in Fayetteville
2-person families (410 | 51.4%) account for the highest median family income in Fayetteville with $64,518 per family, while 2-person families (410 | 51.4%) have the highest median income of $32,259 per family member.
| Income Bracket | # Families | Median Income |
| 2-Person Families | 410 (51.4%) | $64,518 |
| 3-Person Families | 258 (32.3%) | $61,500 |
| 4-Person Families | 115 (14.4%) | $0 |
| 5-Person Families | 0 (0.0%) | $0 |
| 6-Person Families | 0 (0.0%) | $0 |
| 7+ Person Families | 15 (1.9%) | $0 |
| Total | 798 (100.0%) | $63,772 |
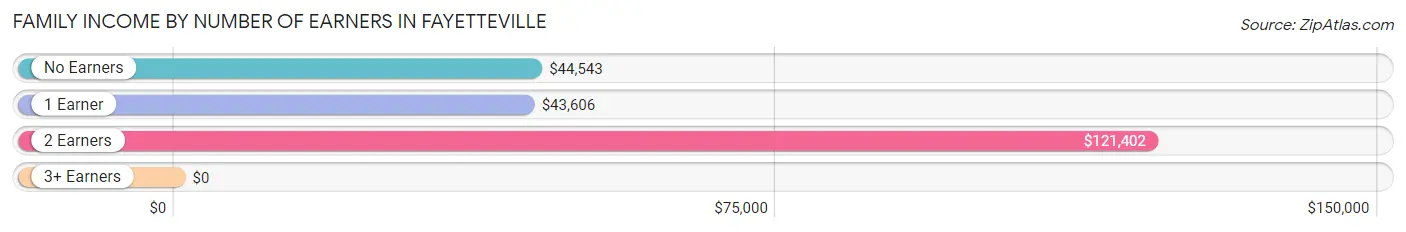
Family Income by Number of Earners in Fayetteville
| Number of Earners | # Families | Median Income |
| No Earners | 281 (35.2%) | $44,543 |
| 1 Earner | 249 (31.2%) | $43,606 |
| 2 Earners | 254 (31.8%) | $121,402 |
| 3+ Earners | 14 (1.8%) | $0 |
| Total | 798 (100.0%) | $63,772 |
Household Income in Fayetteville
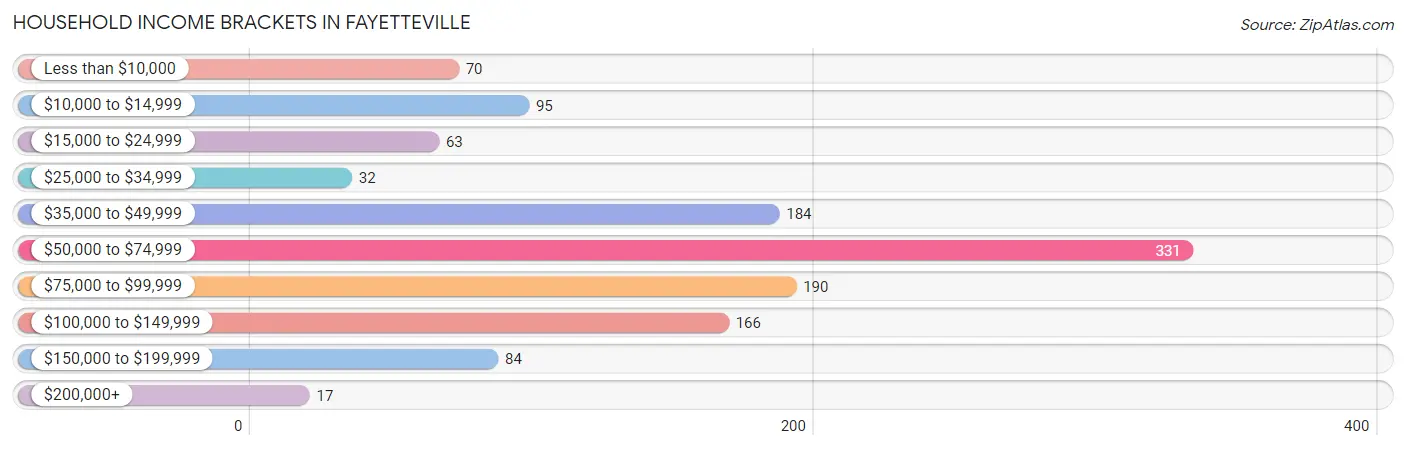
Household Income Brackets in Fayetteville
With 331 households falling in the category, the $50,000 to $74,999 income range is the most frequent in Fayetteville, accounting for 26.9% of all households. In contrast, only 17 households (1.4%) fall into the $200,000+ income bracket, making it the least populous group.
| Income Bracket | # Households | % Households |
| Less than $10,000 | 70 | 5.7% |
| $10,000 to $14,999 | 95 | 7.7% |
| $15,000 to $24,999 | 63 | 5.1% |
| $25,000 to $34,999 | 32 | 2.6% |
| $35,000 to $49,999 | 184 | 14.9% |
| $50,000 to $74,999 | 331 | 26.9% |
| $75,000 to $99,999 | 190 | 15.4% |
| $100,000 to $149,999 | 166 | 13.5% |
| $150,000 to $199,999 | 84 | 6.8% |
| $200,000+ | 17 | 1.4% |
Household Income by Householder Age in Fayetteville
The median household income in Fayetteville is $63,514, with the highest median household income of $85,500 found in the 25 to 44 years age bracket for the primary householder. A total of 382 households (31.0%) fall into this category. Meanwhile, the 15 to 24 years age bracket for the primary householder has the lowest median household income of $0, with 18 households (1.5%) in this group.
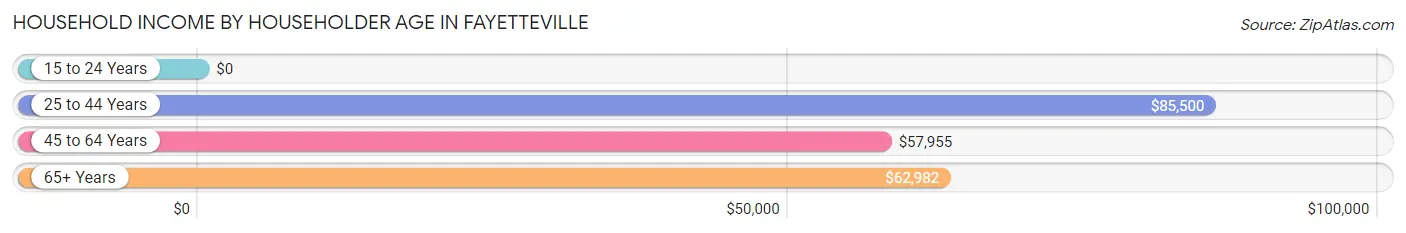
| Income Bracket | # Households | Median Income |
| 15 to 24 Years | 18 (1.5%) | $0 |
| 25 to 44 Years | 382 (31.0%) | $85,500 |
| 45 to 64 Years | 430 (34.9%) | $57,955 |
| 65+ Years | 402 (32.6%) | $62,982 |
| Total | 1,232 (100.0%) | $63,514 |
Poverty in Fayetteville
Income Below Poverty by Sex and Age in Fayetteville
With 26.8% poverty level for males and 20.8% for females among the residents of Fayetteville, 12 to 14 year old males and 18 to 24 year old females are the most vulnerable to poverty, with 47 males (100.0%) and 11 females (47.8%) in their respective age groups living below the poverty level.
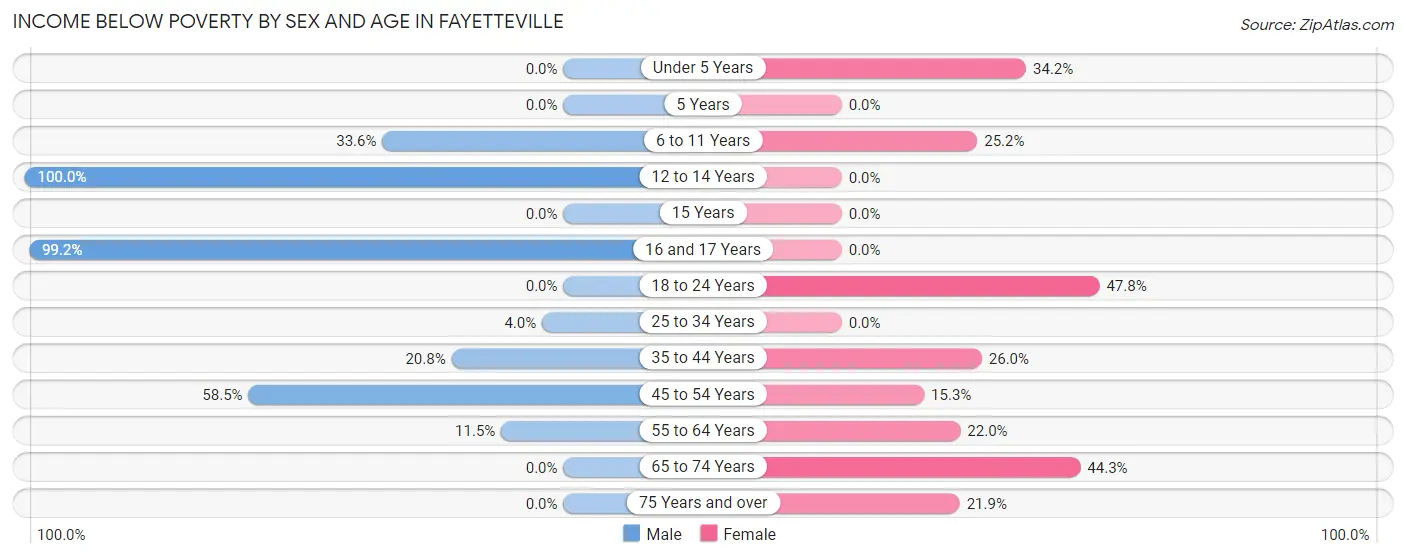
| Age Bracket | Male | Female |
| Under 5 Years | 0 (0.0%) | 26 (34.2%) |
| 5 Years | 0 (0.0%) | 0 (0.0%) |
| 6 to 11 Years | 41 (33.6%) | 42 (25.2%) |
| 12 to 14 Years | 47 (100.0%) | 0 (0.0%) |
| 15 Years | 0 (0.0%) | 0 (0.0%) |
| 16 and 17 Years | 121 (99.2%) | 0 (0.0%) |
| 18 to 24 Years | 0 (0.0%) | 11 (47.8%) |
| 25 to 34 Years | 7 (4.0%) | 0 (0.0%) |
| 35 to 44 Years | 49 (20.8%) | 39 (26.0%) |
| 45 to 54 Years | 114 (58.5%) | 13 (15.3%) |
| 55 to 64 Years | 21 (11.5%) | 61 (22.0%) |
| 65 to 74 Years | 0 (0.0%) | 31 (44.3%) |
| 75 Years and over | 0 (0.0%) | 58 (21.9%) |
| Total | 400 (26.8%) | 281 (20.8%) |
Income Above Poverty by Sex and Age in Fayetteville
According to the poverty statistics in Fayetteville, males aged under 5 years and females aged 12 to 14 years are the age groups that are most secure financially, with 100.0% of males and 100.0% of females in these age groups living above the poverty line.
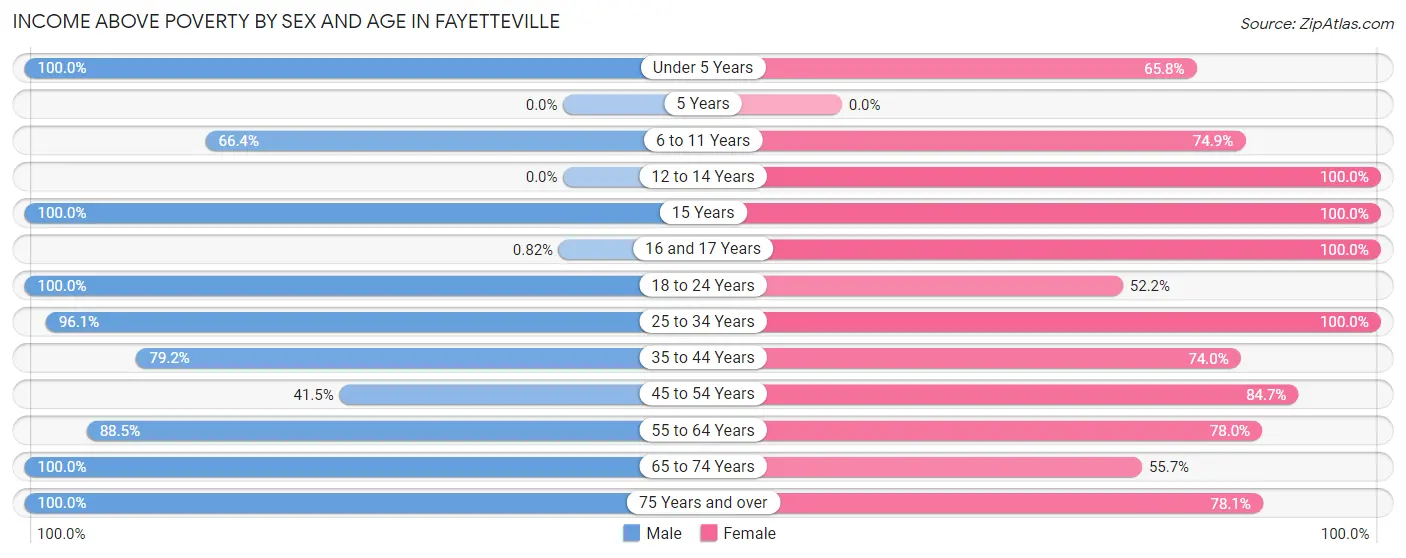
| Age Bracket | Male | Female |
| Under 5 Years | 36 (100.0%) | 50 (65.8%) |
| 5 Years | 0 (0.0%) | 0 (0.0%) |
| 6 to 11 Years | 81 (66.4%) | 125 (74.9%) |
| 12 to 14 Years | 0 (0.0%) | 74 (100.0%) |
| 15 Years | 24 (100.0%) | 18 (100.0%) |
| 16 and 17 Years | 1 (0.8%) | 22 (100.0%) |
| 18 to 24 Years | 39 (100.0%) | 12 (52.2%) |
| 25 to 34 Years | 170 (96.1%) | 125 (100.0%) |
| 35 to 44 Years | 187 (79.2%) | 111 (74.0%) |
| 45 to 54 Years | 81 (41.5%) | 72 (84.7%) |
| 55 to 64 Years | 161 (88.5%) | 216 (78.0%) |
| 65 to 74 Years | 123 (100.0%) | 39 (55.7%) |
| 75 Years and over | 188 (100.0%) | 207 (78.1%) |
| Total | 1,091 (73.2%) | 1,071 (79.2%) |
Income Below Poverty Among Married-Couple Families in Fayetteville
The poverty statistics for married-couple families in Fayetteville show that 3.1% or 15 of the total 489 families live below the poverty line. Families with no children have the highest poverty rate of 4.0%, comprising of 15 families. On the other hand, families with 1 or 2 children have the lowest poverty rate of 0.0%, which includes 0 families.
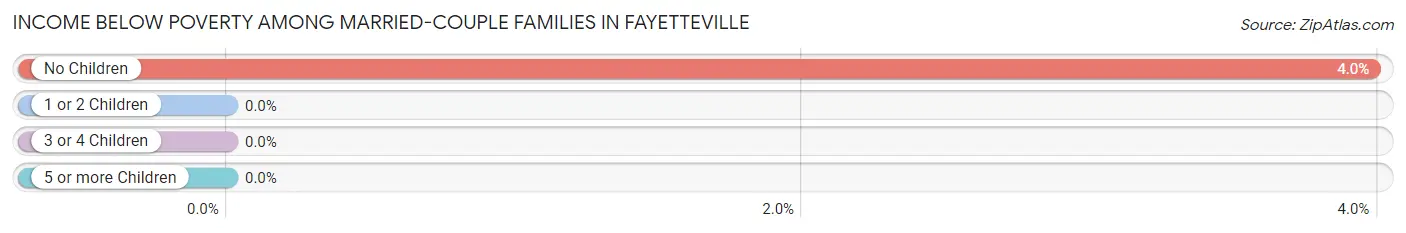
| Children | Above Poverty | Below Poverty |
| No Children | 362 (96.0%) | 15 (4.0%) |
| 1 or 2 Children | 97 (100.0%) | 0 (0.0%) |
| 3 or 4 Children | 0 (0.0%) | 0 (0.0%) |
| 5 or more Children | 15 (100.0%) | 0 (0.0%) |
| Total | 474 (96.9%) | 15 (3.1%) |
Income Below Poverty Among Single-Parent Households in Fayetteville
According to the poverty data in Fayetteville, 62.8% or 86 single-father households and 22.7% or 39 single-mother households are living below the poverty line. Among single-father households, those with no children have the highest poverty rate, with 55 households (100.0%) experiencing poverty. Likewise, among single-mother households, those with 3 or 4 children have the highest poverty rate, with 39 households (100.0%) falling below the poverty line.
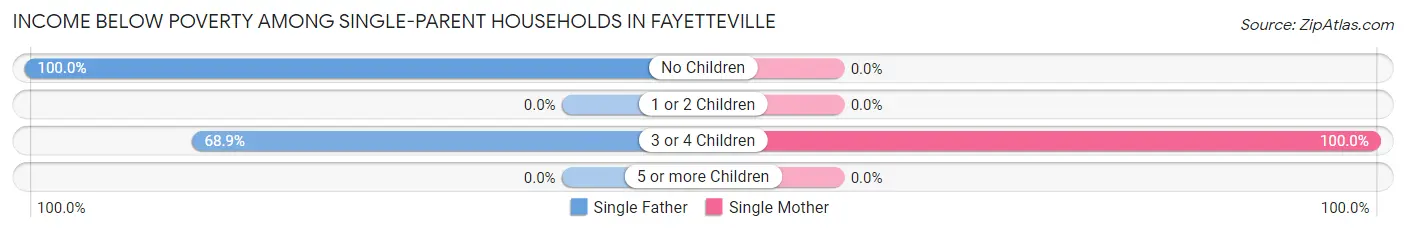
| Children | Single Father | Single Mother |
| No Children | 55 (100.0%) | 0 (0.0%) |
| 1 or 2 Children | 0 (0.0%) | 0 (0.0%) |
| 3 or 4 Children | 31 (68.9%) | 39 (100.0%) |
| 5 or more Children | 0 (0.0%) | 0 (0.0%) |
| Total | 86 (62.8%) | 39 (22.7%) |
Income Below Poverty Among Married-Couple vs Single-Parent Households in Fayetteville
The poverty data for Fayetteville shows that 15 of the married-couple family households (3.1%) and 125 of the single-parent households (40.5%) are living below the poverty level. Within the married-couple family households, those with no children have the highest poverty rate, with 15 households (4.0%) falling below the poverty line. Among the single-parent households, those with 3 or 4 children have the highest poverty rate, with 70 household (83.3%) living below poverty.
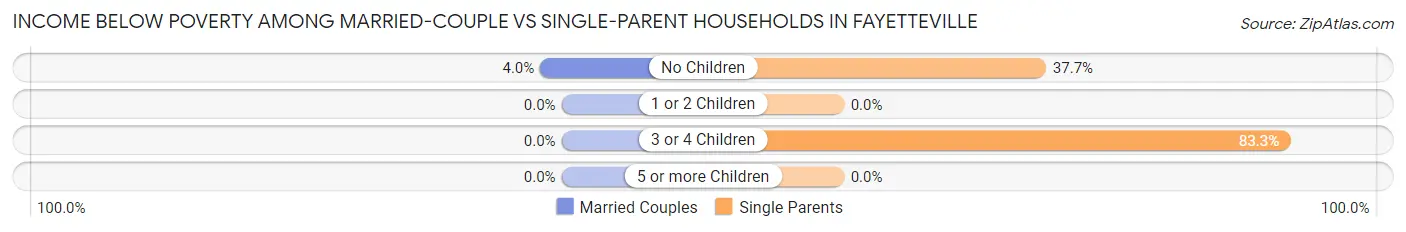
| Children | Married-Couple Families | Single-Parent Households |
| No Children | 15 (4.0%) | 55 (37.7%) |
| 1 or 2 Children | 0 (0.0%) | 0 (0.0%) |
| 3 or 4 Children | 0 (0.0%) | 70 (83.3%) |
| 5 or more Children | 0 (0.0%) | 0 (0.0%) |
| Total | 15 (3.1%) | 125 (40.5%) |
Race in Fayetteville
The most populous races in Fayetteville are White / Caucasian (2,829 | 97.9%), Black / African American (32 | 1.1%), and Two or more Races (29 | 1.0%).
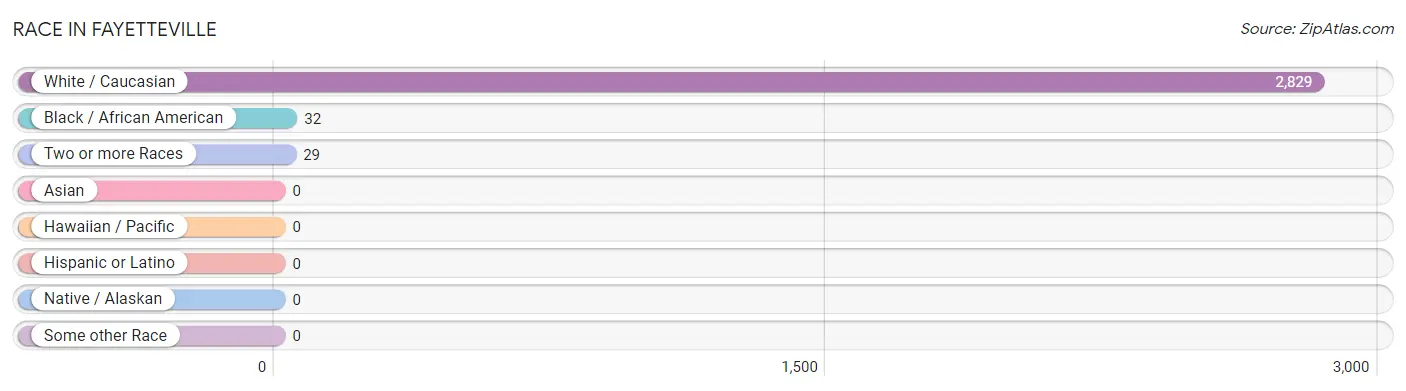
| Race | # Population | % Population |
| Asian | 0 | 0.0% |
| Black / African American | 32 | 1.1% |
| Hawaiian / Pacific | 0 | 0.0% |
| Hispanic or Latino | 0 | 0.0% |
| Native / Alaskan | 0 | 0.0% |
| White / Caucasian | 2,829 | 97.9% |
| Two or more Races | 29 | 1.0% |
| Some other Race | 0 | 0.0% |
| Total | 2,890 | 100.0% |
Ancestry in Fayetteville
The most populous ancestries reported in Fayetteville are English (502 | 17.4%), Irish (459 | 15.9%), German (415 | 14.4%), American (77 | 2.7%), and Dutch (66 | 2.3%), together accounting for 52.6% of all Fayetteville residents.
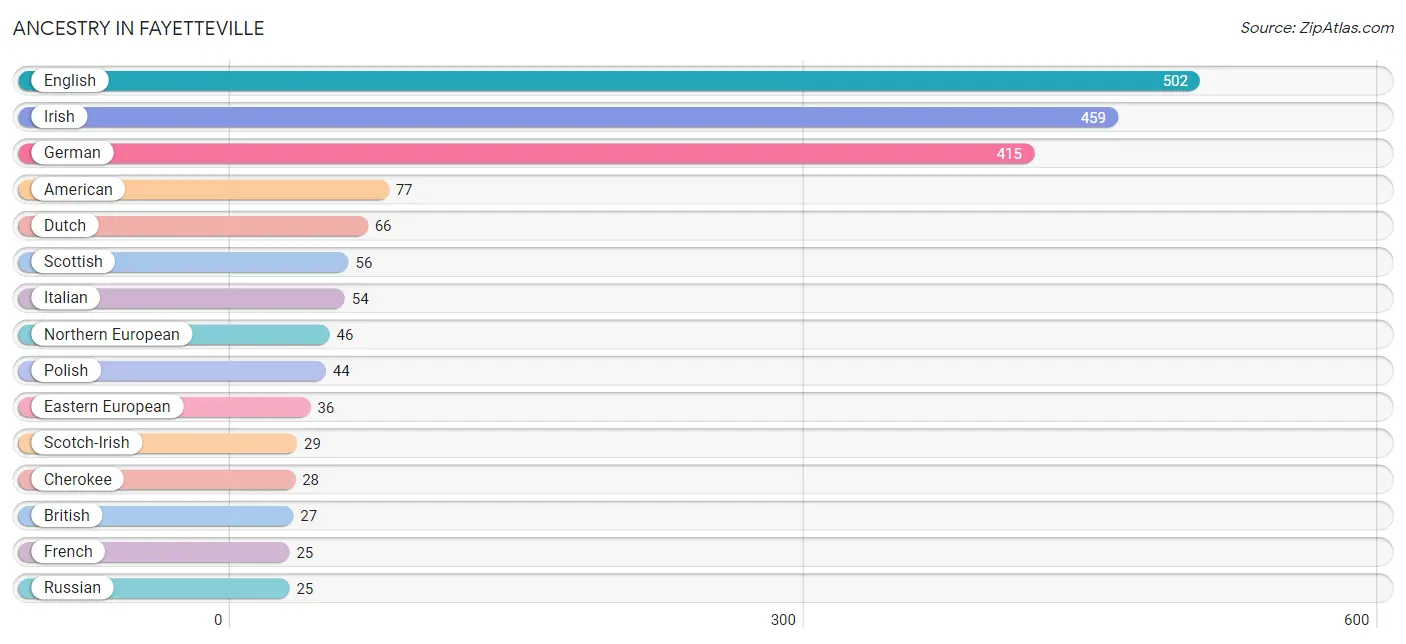
| Ancestry | # Population | % Population |
| American | 77 | 2.7% |
| British | 27 | 0.9% |
| Cherokee | 28 | 1.0% |
| Dutch | 66 | 2.3% |
| Eastern European | 36 | 1.3% |
| English | 502 | 17.4% |
| French | 25 | 0.9% |
| German | 415 | 14.4% |
| Irish | 459 | 15.9% |
| Italian | 54 | 1.9% |
| Northern European | 46 | 1.6% |
| Polish | 44 | 1.5% |
| Russian | 25 | 0.9% |
| Scotch-Irish | 29 | 1.0% |
| Scottish | 56 | 1.9% | View All 15 Rows |
Immigrants in Fayetteville

| Immigration Origin | # Population | % Population | View All 0 Rows |
Sex and Age in Fayetteville
Sex and Age in Fayetteville
The most populous age groups in Fayetteville are 15 to 19 Years (146 | 9.7%) for men and 60 to 64 Years (180 | 13.0%) for women.
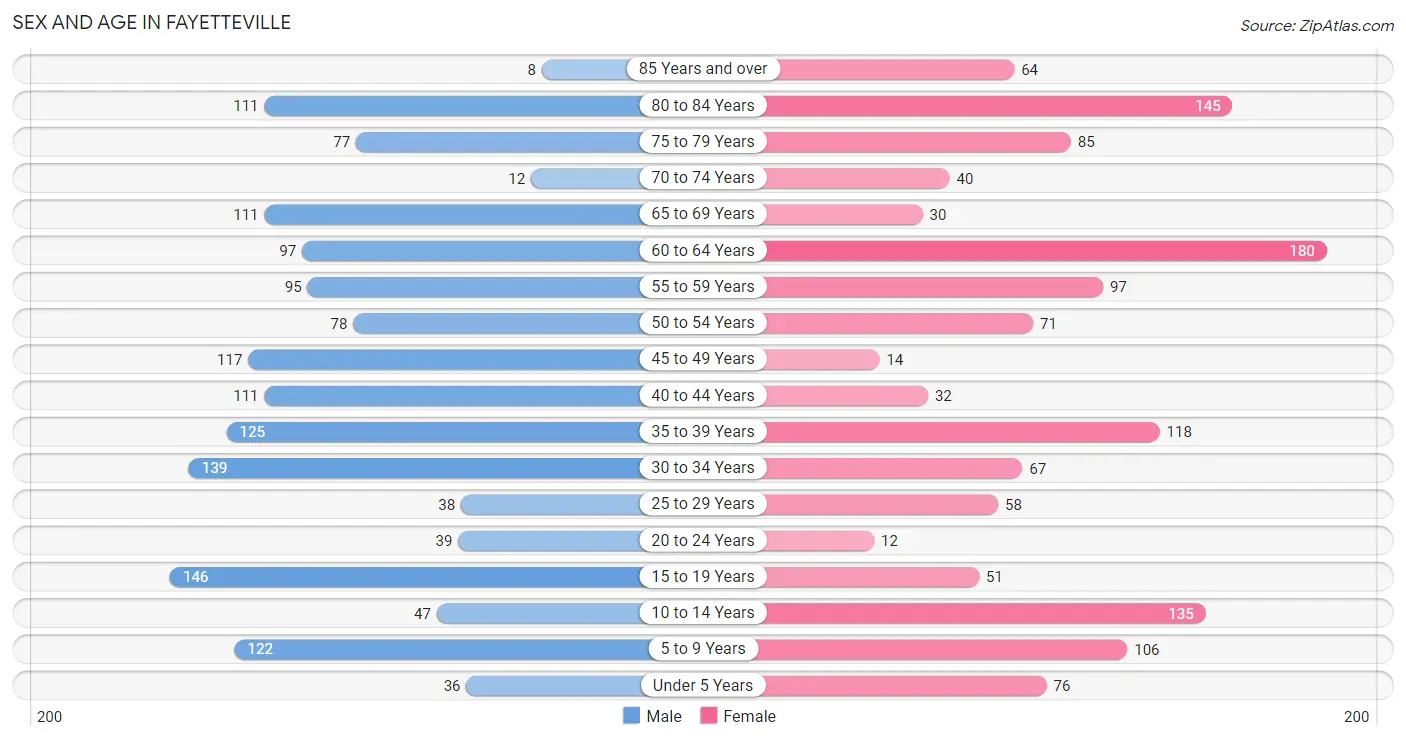
| Age Bracket | Male | Female |
| Under 5 Years | 36 (2.4%) | 76 (5.5%) |
| 5 to 9 Years | 122 (8.1%) | 106 (7.7%) |
| 10 to 14 Years | 47 (3.1%) | 135 (9.8%) |
| 15 to 19 Years | 146 (9.7%) | 51 (3.7%) |
| 20 to 24 Years | 39 (2.6%) | 12 (0.9%) |
| 25 to 29 Years | 38 (2.5%) | 58 (4.2%) |
| 30 to 34 Years | 139 (9.2%) | 67 (4.9%) |
| 35 to 39 Years | 125 (8.3%) | 118 (8.5%) |
| 40 to 44 Years | 111 (7.4%) | 32 (2.3%) |
| 45 to 49 Years | 117 (7.7%) | 14 (1.0%) |
| 50 to 54 Years | 78 (5.2%) | 71 (5.1%) |
| 55 to 59 Years | 95 (6.3%) | 97 (7.0%) |
| 60 to 64 Years | 97 (6.4%) | 180 (13.0%) |
| 65 to 69 Years | 111 (7.4%) | 30 (2.2%) |
| 70 to 74 Years | 12 (0.8%) | 40 (2.9%) |
| 75 to 79 Years | 77 (5.1%) | 85 (6.1%) |
| 80 to 84 Years | 111 (7.4%) | 145 (10.5%) |
| 85 Years and over | 8 (0.5%) | 64 (4.6%) |
| Total | 1,509 (100.0%) | 1,381 (100.0%) |
Families and Households in Fayetteville
Median Family Size in Fayetteville
The median family size in Fayetteville is 2.87 persons per family, with single female/mother families (172 | 21.5%) accounting for the largest median family size of 3.53 persons per family. On the other hand, married-couple families (489 | 61.3%) represent the smallest median family size with 2.50 persons per family.
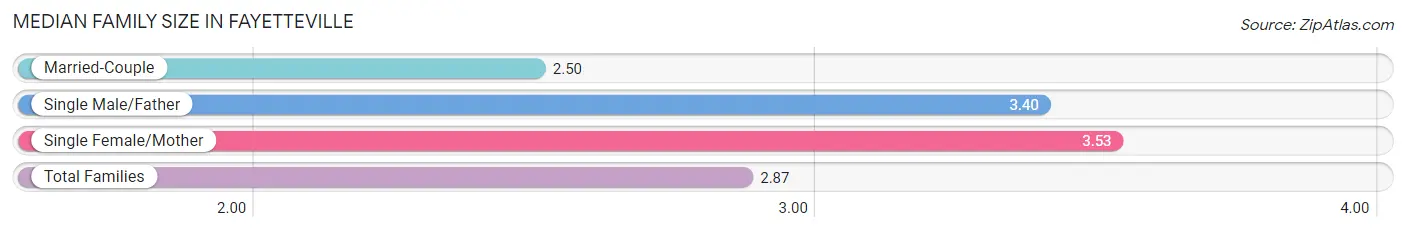
| Family Type | # Families | Family Size |
| Married-Couple | 489 (61.3%) | 2.50 |
| Single Male/Father | 137 (17.2%) | 3.40 |
| Single Female/Mother | 172 (21.5%) | 3.53 |
| Total Families | 798 (100.0%) | 2.87 |
Median Household Size in Fayetteville
The median household size in Fayetteville is 2.31 persons per household, with single male/father households (137 | 11.1%) accounting for the largest median household size of 3.72 persons per household. non-family households (434 | 35.2%) represent the smallest median household size with 1.12 persons per household.
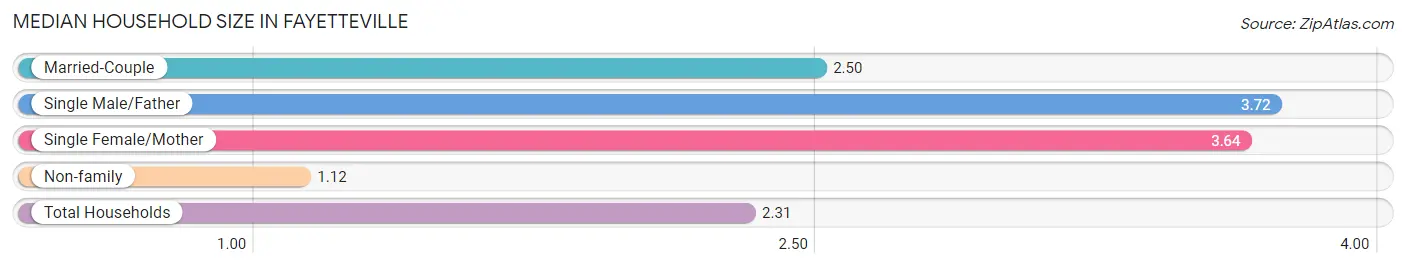
| Household Type | # Households | Household Size |
| Married-Couple | 489 (39.7%) | 2.50 |
| Single Male/Father | 137 (11.1%) | 3.72 |
| Single Female/Mother | 172 (14.0%) | 3.64 |
| Non-family | 434 (35.2%) | 1.12 |
| Total Households | 1,232 (100.0%) | 2.31 |
Household Size by Marriage Status in Fayetteville
Out of a total of 1,232 households in Fayetteville, 798 (64.8%) are family households, while 434 (35.2%) are nonfamily households. The most numerous type of family households are 2-person households, comprising 392, and the most common type of nonfamily households are 1-person households, comprising 393.
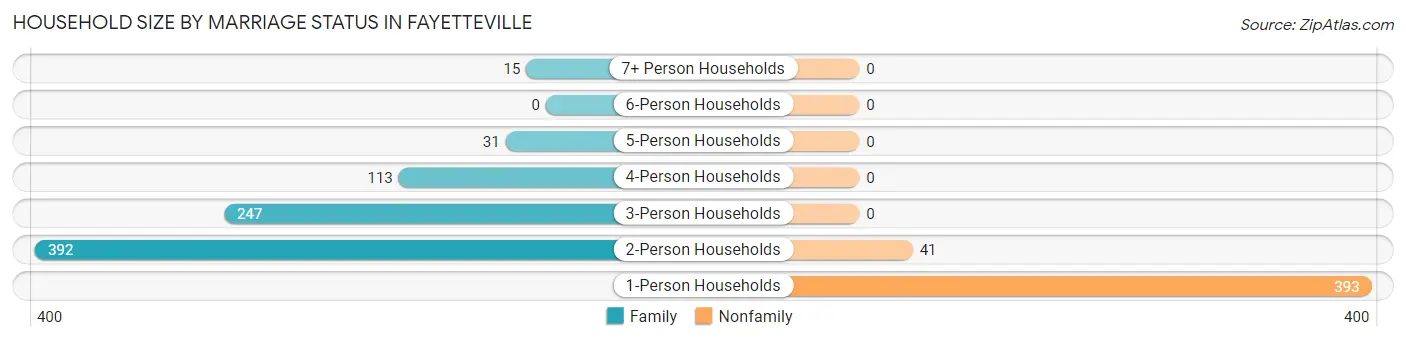
| Household Size | Family Households | Nonfamily Households |
| 1-Person Households | - | 393 (31.9%) |
| 2-Person Households | 392 (31.8%) | 41 (3.3%) |
| 3-Person Households | 247 (20.1%) | 0 (0.0%) |
| 4-Person Households | 113 (9.2%) | 0 (0.0%) |
| 5-Person Households | 31 (2.5%) | 0 (0.0%) |
| 6-Person Households | 0 (0.0%) | 0 (0.0%) |
| 7+ Person Households | 15 (1.2%) | 0 (0.0%) |
| Total | 798 (64.8%) | 434 (35.2%) |
Female Fertility in Fayetteville
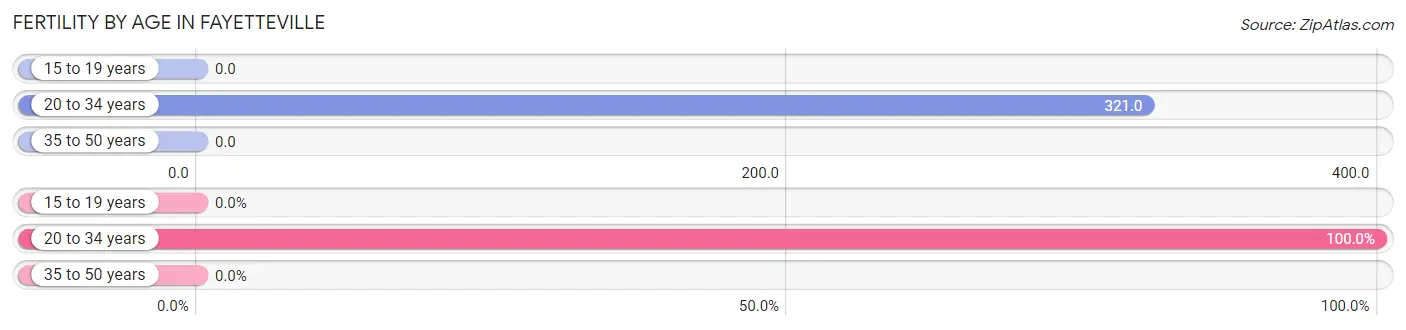
Fertility by Age in Fayetteville
Average fertility rate in Fayetteville is 113.0 births per 1,000 women. Women in the age bracket of 20 to 34 years have the highest fertility rate with 321.0 births per 1,000 women. Women in the age bracket of 20 to 34 years acount for 100.0% of all women with births.
| Age Bracket | Women with Births | Births / 1,000 Women |
| 15 to 19 years | 0 (0.0%) | 0.0 |
| 20 to 34 years | 44 (100.0%) | 321.0 |
| 35 to 50 years | 0 (0.0%) | 0.0 |
| Total | 44 (100.0%) | 113.0 |
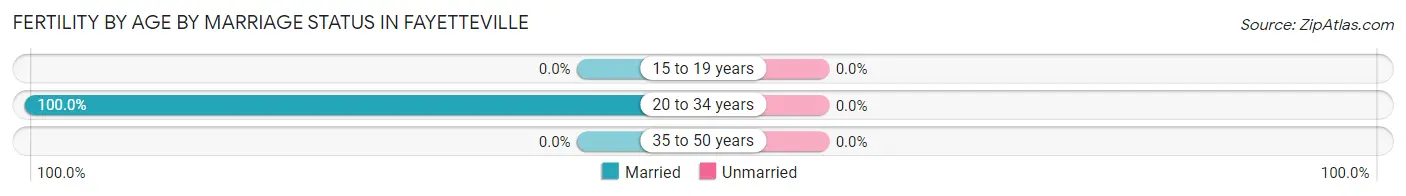
Fertility by Age by Marriage Status in Fayetteville
| Age Bracket | Married | Unmarried |
| 15 to 19 years | 0 (0.0%) | 0 (0.0%) |
| 20 to 34 years | 44 (100.0%) | 0 (0.0%) |
| 35 to 50 years | 0 (0.0%) | 0 (0.0%) |
| Total | 44 (100.0%) | 0 (0.0%) |
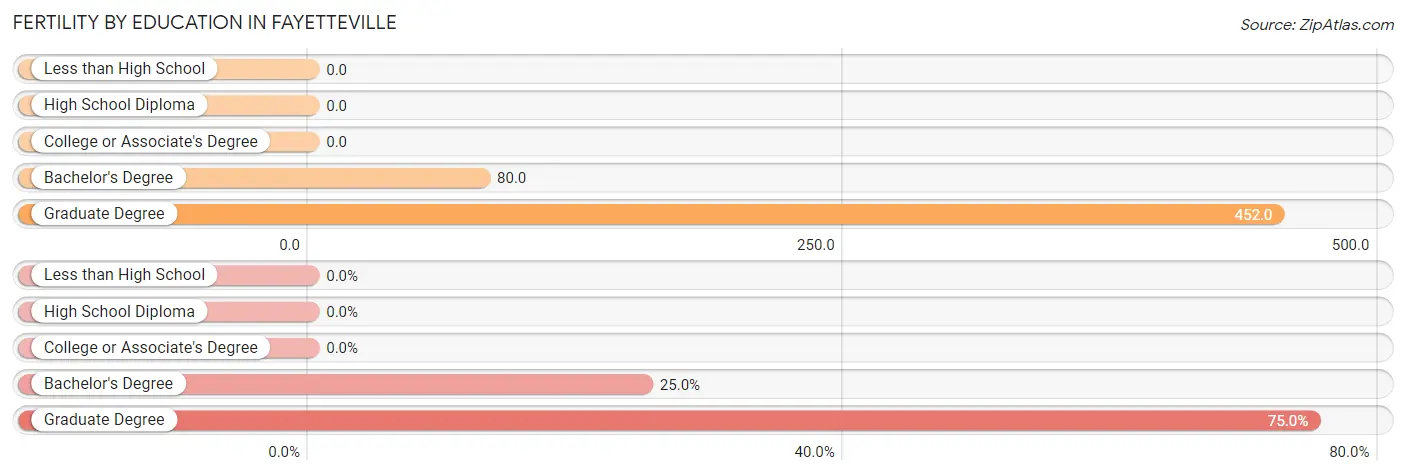
Fertility by Education in Fayetteville
| Educational Attainment | Women with Births | Births / 1,000 Women |
| Less than High School | 0 (0.0%) | 0.0 |
| High School Diploma | 0 (0.0%) | 0.0 |
| College or Associate's Degree | 0 (0.0%) | 0.0 |
| Bachelor's Degree | 11 (25.0%) | 80.0 |
| Graduate Degree | 33 (75.0%) | 452.0 |
| Total | 44 (100.0%) | 113.0 |
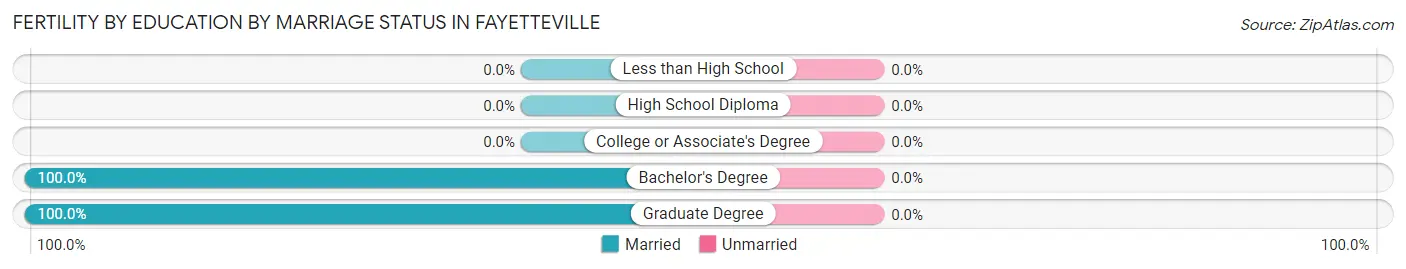
Fertility by Education by Marriage Status in Fayetteville
| Educational Attainment | Married | Unmarried |
| Less than High School | 0 (0.0%) | 0 (0.0%) |
| High School Diploma | 0 (0.0%) | 0 (0.0%) |
| College or Associate's Degree | 0 (0.0%) | 0 (0.0%) |
| Bachelor's Degree | 11 (100.0%) | 0 (0.0%) |
| Graduate Degree | 33 (100.0%) | 0 (0.0%) |
| Total | 44 (100.0%) | 0 (0.0%) |
Employment Characteristics in Fayetteville
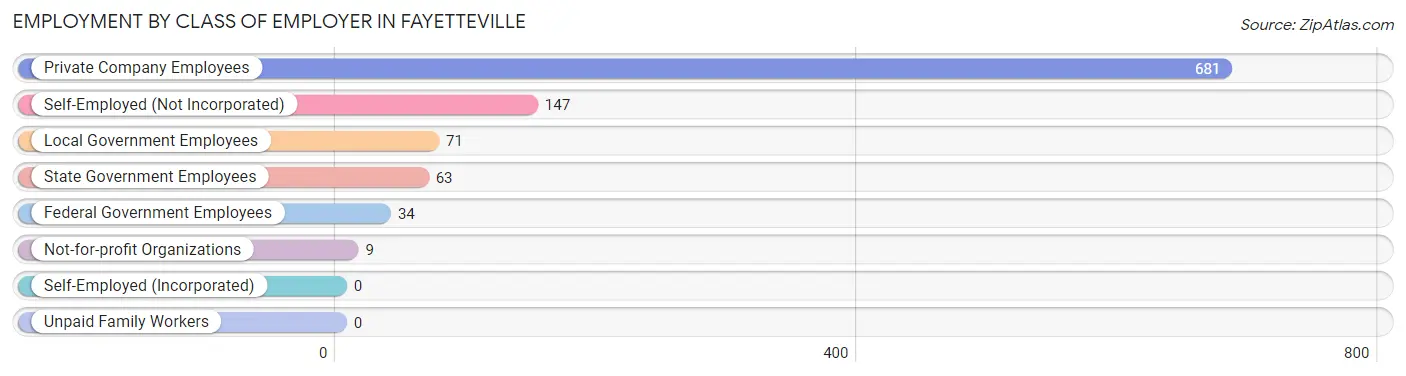
Employment by Class of Employer in Fayetteville
Among the 1,005 employed individuals in Fayetteville, private company employees (681 | 67.8%), self-employed (not incorporated) (147 | 14.6%), and local government employees (71 | 7.1%) make up the most common classes of employment.
| Employer Class | # Employees | % Employees |
| Private Company Employees | 681 | 67.8% |
| Self-Employed (Incorporated) | 0 | 0.0% |
| Self-Employed (Not Incorporated) | 147 | 14.6% |
| Not-for-profit Organizations | 9 | 0.9% |
| Local Government Employees | 71 | 7.1% |
| State Government Employees | 63 | 6.3% |
| Federal Government Employees | 34 | 3.4% |
| Unpaid Family Workers | 0 | 0.0% |
| Total | 1,005 | 100.0% |
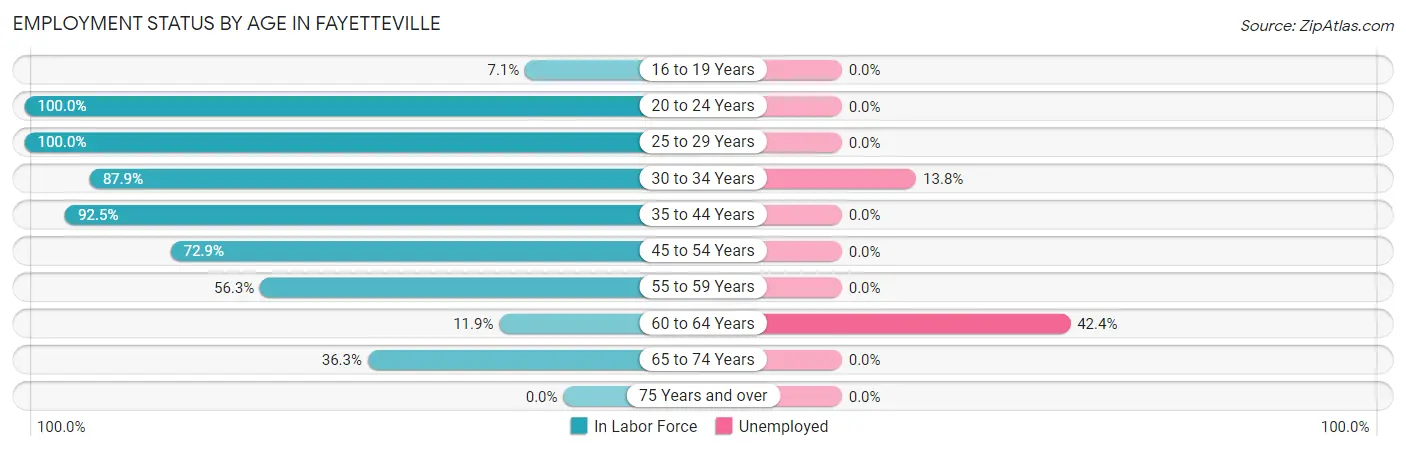
Employment Status by Age in Fayetteville
According to the labor force statistics for Fayetteville, out of the total population over 16 years of age (2,326), 47.8% or 1,112 individuals are in the labor force, with 3.5% or 39 of them unemployed. The age group with the highest labor force participation rate is 20 to 24 years, with 100.0% or 51 individuals in the labor force. Within the labor force, the 60 to 64 years age range has the highest percentage of unemployed individuals, with 42.4% or 14 of them being unemployed.
| Age Bracket | In Labor Force | Unemployed |
| 16 to 19 Years | 11 (7.1%) | 0 (0.0%) |
| 20 to 24 Years | 51 (100.0%) | 0 (0.0%) |
| 25 to 29 Years | 96 (100.0%) | 0 (0.0%) |
| 30 to 34 Years | 181 (87.9%) | 25 (13.8%) |
| 35 to 44 Years | 357 (92.5%) | 0 (0.0%) |
| 45 to 54 Years | 204 (72.9%) | 0 (0.0%) |
| 55 to 59 Years | 108 (56.3%) | 0 (0.0%) |
| 60 to 64 Years | 33 (11.9%) | 14 (42.4%) |
| 65 to 74 Years | 70 (36.3%) | 0 (0.0%) |
| 75 Years and over | 0 (0.0%) | 0 (0.0%) |
| Total | 1,112 (47.8%) | 39 (3.5%) |
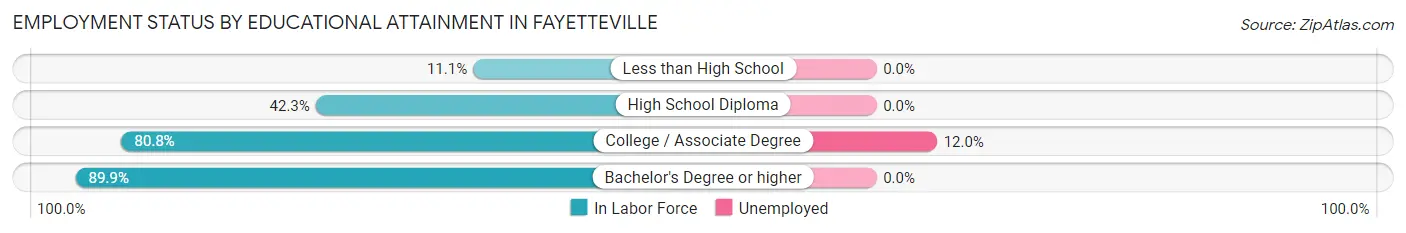
Employment Status by Educational Attainment in Fayetteville
According to labor force statistics for Fayetteville, 68.1% of individuals (979) out of the total population between 25 and 64 years of age (1,437) are in the labor force, with 4.0% or 39 of them being unemployed. The group with the highest labor force participation rate are those with the educational attainment of bachelor's degree or higher, with 89.9% or 488 individuals in the labor force. Within the labor force, individuals with college / associate degree education have the highest percentage of unemployment, with 12.0% or 39 of them being unemployed.
| Educational Attainment | In Labor Force | Unemployed |
| Less than High School | 15 (11.1%) | 0 (0.0%) |
| High School Diploma | 151 (42.3%) | 0 (0.0%) |
| College / Associate Degree | 325 (80.8%) | 48 (12.0%) |
| Bachelor's Degree or higher | 488 (89.9%) | 0 (0.0%) |
| Total | 979 (68.1%) | 57 (4.0%) |
Employment Occupations by Sex in Fayetteville
Management, Business, Science and Arts Occupations
The most common Management, Business, Science and Arts occupations in Fayetteville are Community & Social Service (178 | 16.6%), Arts, Media & Entertainment (117 | 10.9%), Health Diagnosing & Treating (92 | 8.6%), Business & Financial (87 | 8.1%), and Health Technologists (76 | 7.1%).
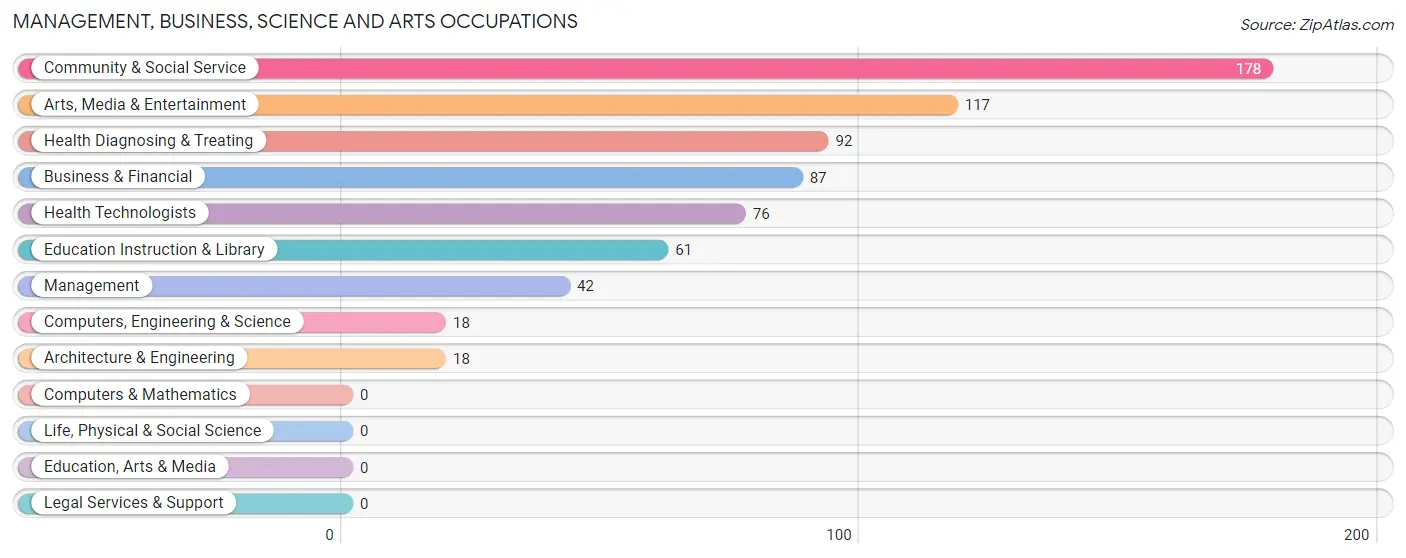
Management, Business, Science and Arts Occupations by Sex
Within the Management, Business, Science and Arts occupations in Fayetteville, the most male-oriented occupations are Computers, Engineering & Science (100.0%), Architecture & Engineering (100.0%), and Business & Financial (66.7%), while the most female-oriented occupations are Education Instruction & Library (75.4%), Management (59.5%), and Health Technologists (57.9%).
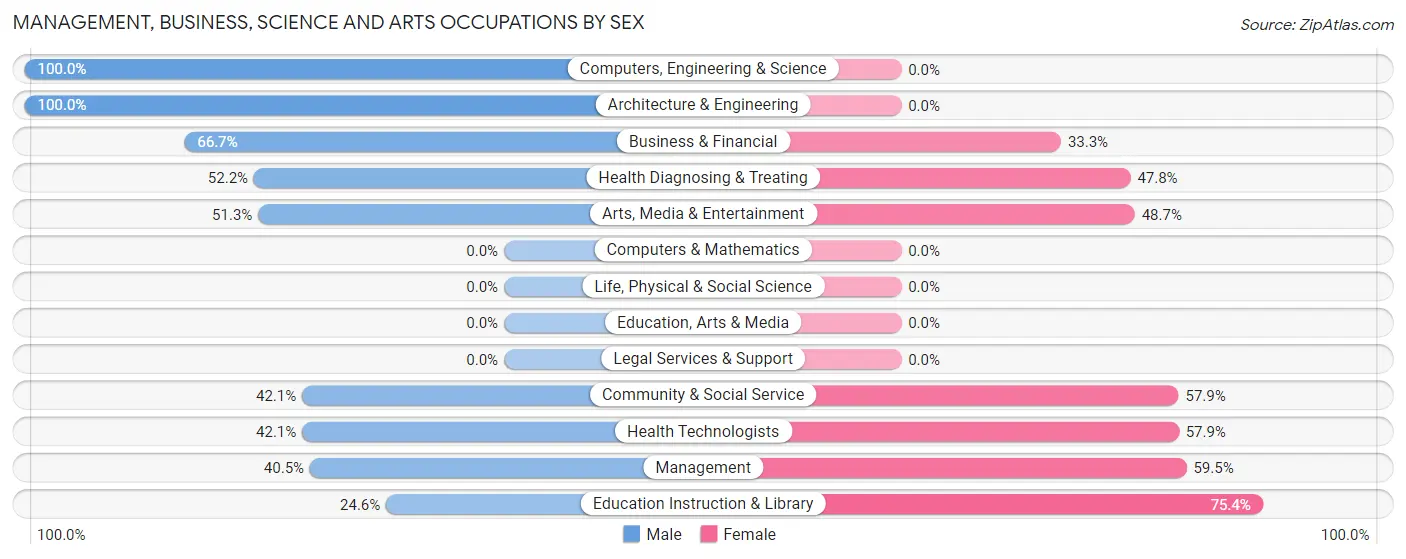
| Occupation | Male | Female |
| Management | 17 (40.5%) | 25 (59.5%) |
| Business & Financial | 58 (66.7%) | 29 (33.3%) |
| Computers, Engineering & Science | 18 (100.0%) | 0 (0.0%) |
| Computers & Mathematics | 0 (0.0%) | 0 (0.0%) |
| Architecture & Engineering | 18 (100.0%) | 0 (0.0%) |
| Life, Physical & Social Science | 0 (0.0%) | 0 (0.0%) |
| Community & Social Service | 75 (42.1%) | 103 (57.9%) |
| Education, Arts & Media | 0 (0.0%) | 0 (0.0%) |
| Legal Services & Support | 0 (0.0%) | 0 (0.0%) |
| Education Instruction & Library | 15 (24.6%) | 46 (75.4%) |
| Arts, Media & Entertainment | 60 (51.3%) | 57 (48.7%) |
| Health Diagnosing & Treating | 48 (52.2%) | 44 (47.8%) |
| Health Technologists | 32 (42.1%) | 44 (57.9%) |
| Total (Category) | 216 (51.8%) | 201 (48.2%) |
| Total (Overall) | 695 (64.8%) | 377 (35.2%) |
Services Occupations
The most common Services occupations in Fayetteville are Food Preparation & Serving (112 | 10.4%), Security & Protection (78 | 7.3%), Law Enforcement (78 | 7.3%), Personal Care & Service (43 | 4.0%), and Cleaning & Maintenance (39 | 3.6%).
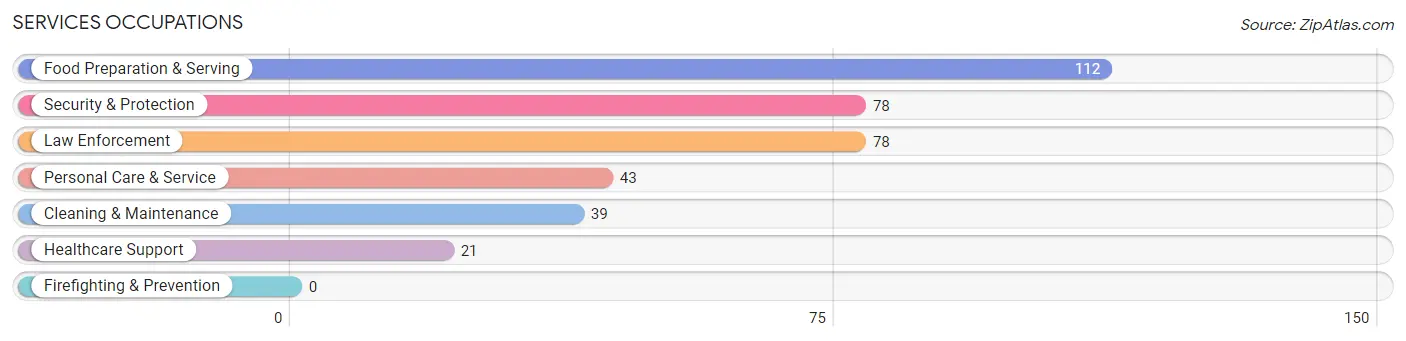
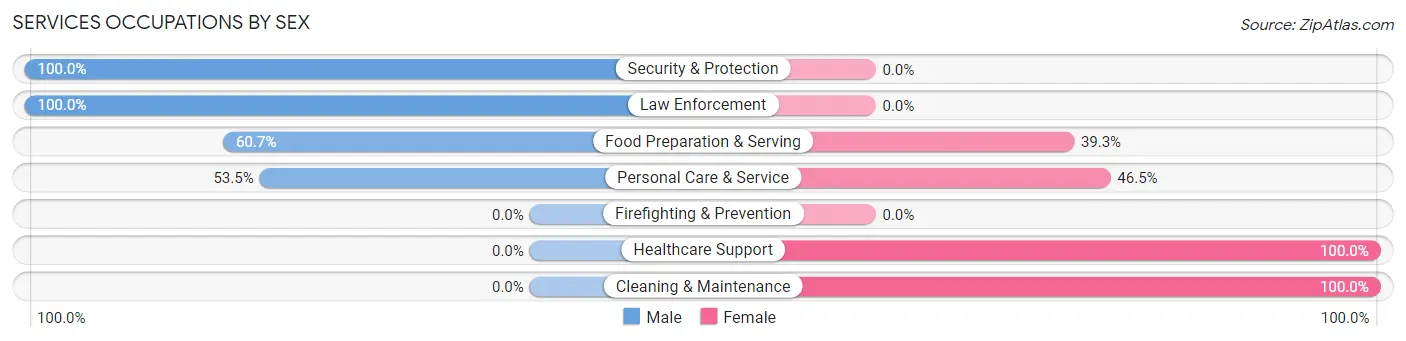
Services Occupations by Sex
Within the Services occupations in Fayetteville, the most male-oriented occupations are Security & Protection (100.0%), Law Enforcement (100.0%), and Food Preparation & Serving (60.7%), while the most female-oriented occupations are Healthcare Support (100.0%), Cleaning & Maintenance (100.0%), and Personal Care & Service (46.5%).
| Occupation | Male | Female |
| Healthcare Support | 0 (0.0%) | 21 (100.0%) |
| Security & Protection | 78 (100.0%) | 0 (0.0%) |
| Firefighting & Prevention | 0 (0.0%) | 0 (0.0%) |
| Law Enforcement | 78 (100.0%) | 0 (0.0%) |
| Food Preparation & Serving | 68 (60.7%) | 44 (39.3%) |
| Cleaning & Maintenance | 0 (0.0%) | 39 (100.0%) |
| Personal Care & Service | 23 (53.5%) | 20 (46.5%) |
| Total (Category) | 169 (57.7%) | 124 (42.3%) |
| Total (Overall) | 695 (64.8%) | 377 (35.2%) |
Sales and Office Occupations
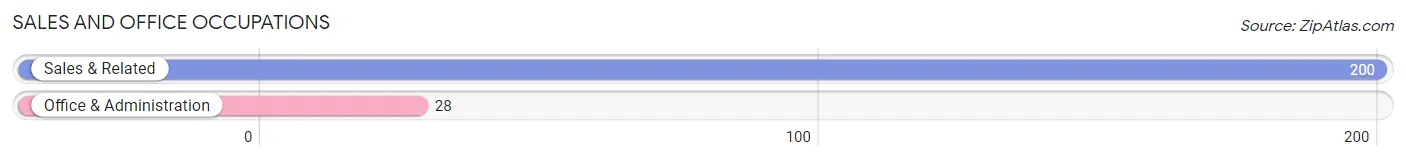
The most common Sales and Office occupations in Fayetteville are Sales & Related (200 | 18.7%), and Office & Administration (28 | 2.6%).
Sales and Office Occupations by Sex
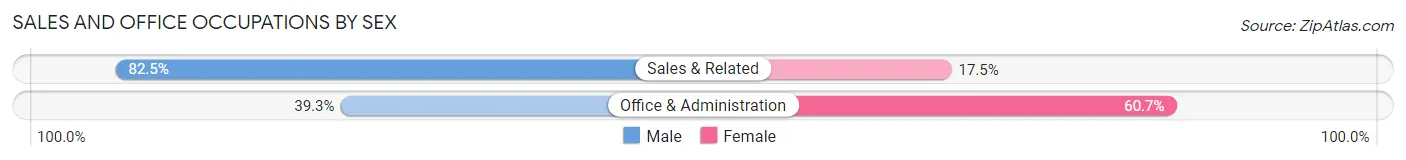
| Occupation | Male | Female |
| Sales & Related | 165 (82.5%) | 35 (17.5%) |
| Office & Administration | 11 (39.3%) | 17 (60.7%) |
| Total (Category) | 176 (77.2%) | 52 (22.8%) |
| Total (Overall) | 695 (64.8%) | 377 (35.2%) |
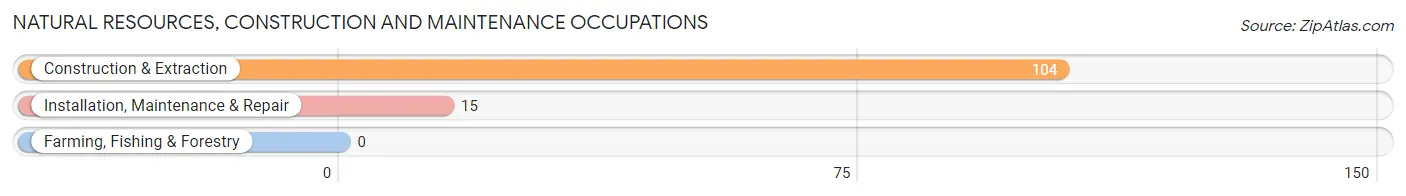
Natural Resources, Construction and Maintenance Occupations
The most common Natural Resources, Construction and Maintenance occupations in Fayetteville are Construction & Extraction (104 | 9.7%), and Installation, Maintenance & Repair (15 | 1.4%).
Natural Resources, Construction and Maintenance Occupations by Sex
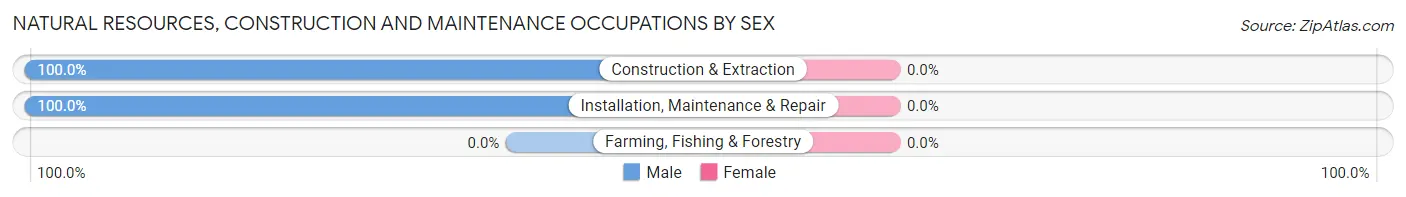
| Occupation | Male | Female |
| Farming, Fishing & Forestry | 0 (0.0%) | 0 (0.0%) |
| Construction & Extraction | 104 (100.0%) | 0 (0.0%) |
| Installation, Maintenance & Repair | 15 (100.0%) | 0 (0.0%) |
| Total (Category) | 119 (100.0%) | 0 (0.0%) |
| Total (Overall) | 695 (64.8%) | 377 (35.2%) |
Production, Transportation and Moving Occupations
The most common Production, Transportation and Moving occupations in Fayetteville are , and Transportation (15 | 1.4%).
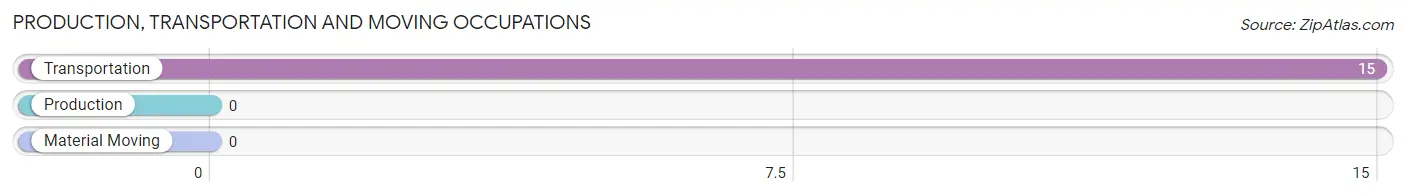
Production, Transportation and Moving Occupations by Sex
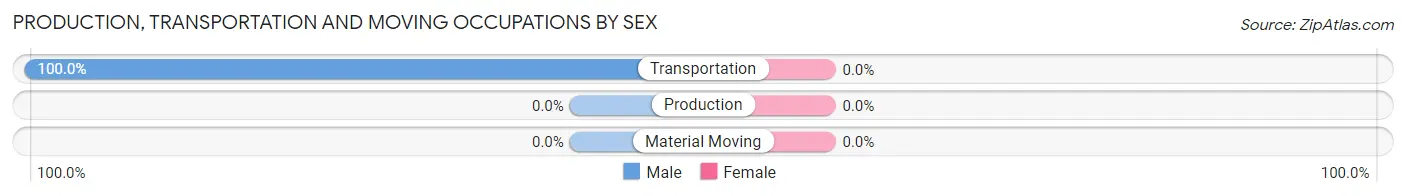
| Occupation | Male | Female |
| Production | 0 (0.0%) | 0 (0.0%) |
| Transportation | 15 (100.0%) | 0 (0.0%) |
| Material Moving | 0 (0.0%) | 0 (0.0%) |
| Total (Category) | 15 (100.0%) | 0 (0.0%) |
| Total (Overall) | 695 (64.8%) | 377 (35.2%) |
Employment Industries by Sex in Fayetteville
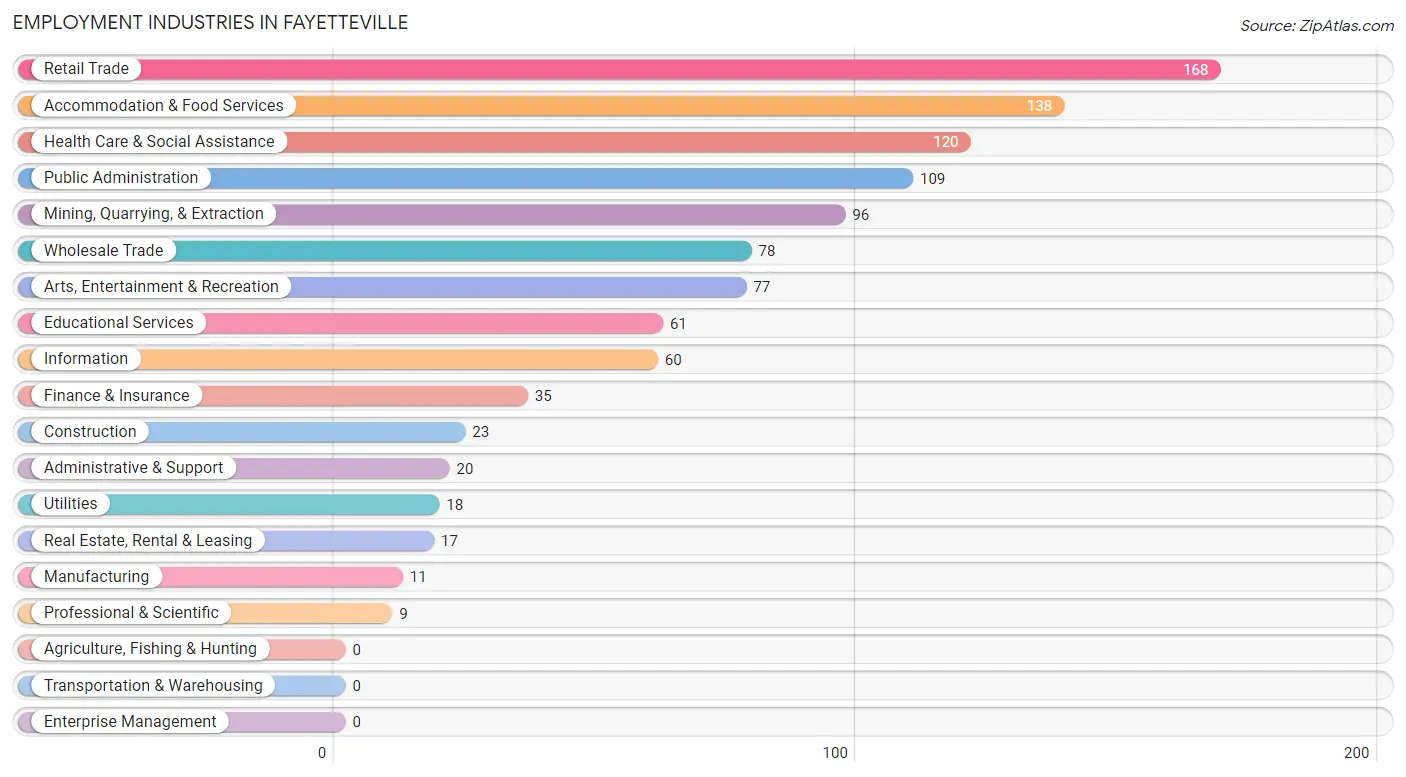
Employment Industries in Fayetteville
The major employment industries in Fayetteville include Retail Trade (168 | 15.7%), Accommodation & Food Services (138 | 12.9%), Health Care & Social Assistance (120 | 11.2%), Public Administration (109 | 10.2%), and Mining, Quarrying, & Extraction (96 | 9.0%).
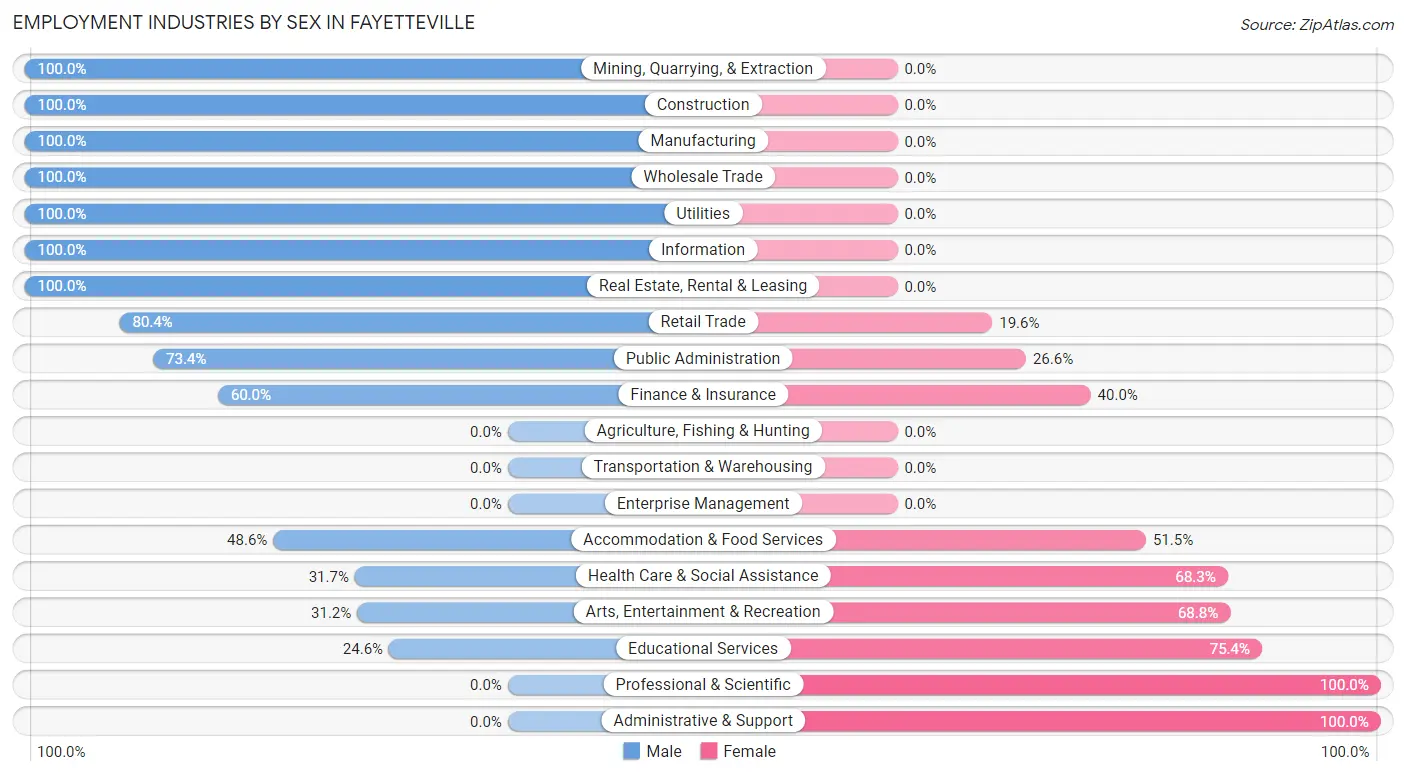
Employment Industries by Sex in Fayetteville
The Fayetteville industries that see more men than women are Mining, Quarrying, & Extraction (100.0%), Construction (100.0%), and Manufacturing (100.0%), whereas the industries that tend to have a higher number of women are Professional & Scientific (100.0%), Administrative & Support (100.0%), and Educational Services (75.4%).
| Industry | Male | Female |
| Agriculture, Fishing & Hunting | 0 (0.0%) | 0 (0.0%) |
| Mining, Quarrying, & Extraction | 96 (100.0%) | 0 (0.0%) |
| Construction | 23 (100.0%) | 0 (0.0%) |
| Manufacturing | 11 (100.0%) | 0 (0.0%) |
| Wholesale Trade | 78 (100.0%) | 0 (0.0%) |
| Retail Trade | 135 (80.4%) | 33 (19.6%) |
| Transportation & Warehousing | 0 (0.0%) | 0 (0.0%) |
| Utilities | 18 (100.0%) | 0 (0.0%) |
| Information | 60 (100.0%) | 0 (0.0%) |
| Finance & Insurance | 21 (60.0%) | 14 (40.0%) |
| Real Estate, Rental & Leasing | 17 (100.0%) | 0 (0.0%) |
| Professional & Scientific | 0 (0.0%) | 9 (100.0%) |
| Enterprise Management | 0 (0.0%) | 0 (0.0%) |
| Administrative & Support | 0 (0.0%) | 20 (100.0%) |
| Educational Services | 15 (24.6%) | 46 (75.4%) |
| Health Care & Social Assistance | 38 (31.7%) | 82 (68.3%) |
| Arts, Entertainment & Recreation | 24 (31.2%) | 53 (68.8%) |
| Accommodation & Food Services | 67 (48.5%) | 71 (51.4%) |
| Public Administration | 80 (73.4%) | 29 (26.6%) |
| Total | 695 (64.8%) | 377 (35.2%) |
Education in Fayetteville
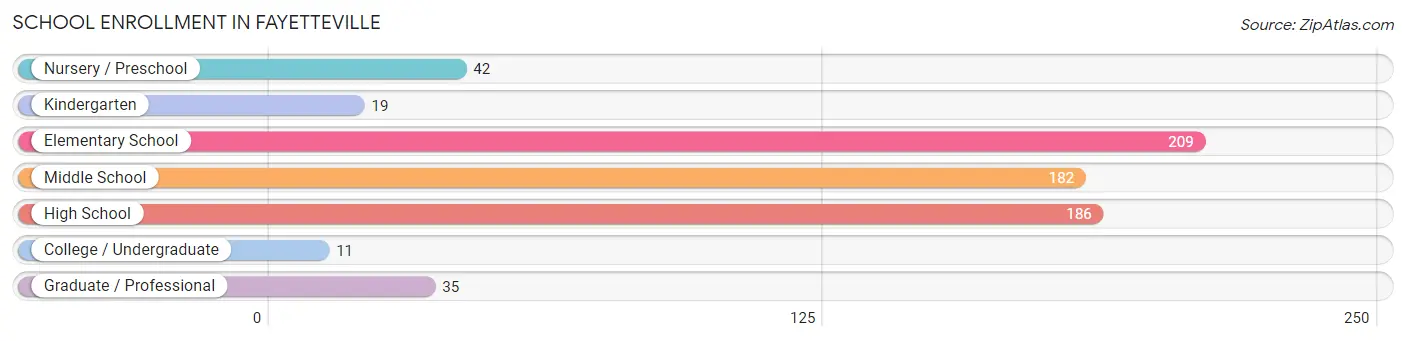
School Enrollment in Fayetteville
The most common levels of schooling among the 684 students in Fayetteville are elementary school (209 | 30.6%), high school (186 | 27.2%), and middle school (182 | 26.6%).
| School Level | # Students | % Students |
| Nursery / Preschool | 42 | 6.1% |
| Kindergarten | 19 | 2.8% |
| Elementary School | 209 | 30.6% |
| Middle School | 182 | 26.6% |
| High School | 186 | 27.2% |
| College / Undergraduate | 11 | 1.6% |
| Graduate / Professional | 35 | 5.1% |
| Total | 684 | 100.0% |
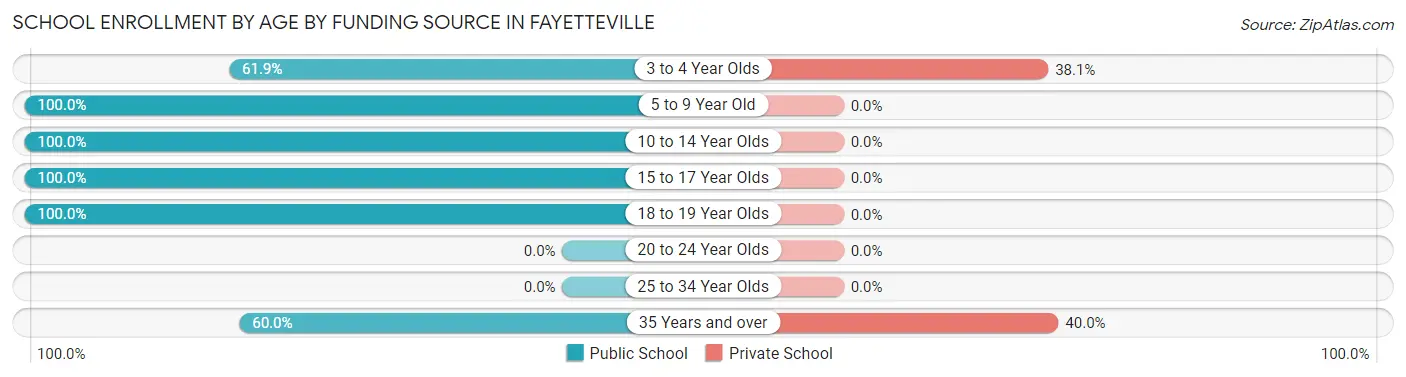
School Enrollment by Age by Funding Source in Fayetteville
Out of a total of 684 students who are enrolled in schools in Fayetteville, 30 (4.4%) attend a private institution, while the remaining 654 (95.6%) are enrolled in public schools. The age group of 35 years and over has the highest likelihood of being enrolled in private schools, with 14 (40.0% in the age bracket) enrolled. Conversely, the age group of 5 to 9 year old has the lowest likelihood of being enrolled in a private school, with 228 (100.0% in the age bracket) attending a public institution.
| Age Bracket | Public School | Private School |
| 3 to 4 Year Olds | 26 (61.9%) | 16 (38.1%) |
| 5 to 9 Year Old | 228 (100.0%) | 0 (0.0%) |
| 10 to 14 Year Olds | 182 (100.0%) | 0 (0.0%) |
| 15 to 17 Year Olds | 186 (100.0%) | 0 (0.0%) |
| 18 to 19 Year Olds | 11 (100.0%) | 0 (0.0%) |
| 20 to 24 Year Olds | 0 (0.0%) | 0 (0.0%) |
| 25 to 34 Year Olds | 0 (0.0%) | 0 (0.0%) |
| 35 Years and over | 21 (60.0%) | 14 (40.0%) |
| Total | 654 (95.6%) | 30 (4.4%) |
Educational Attainment by Field of Study in Fayetteville
Education (101 | 14.2%), bio, nature & agricultural (91 | 12.8%), business (90 | 12.6%), literature & languages (80 | 11.2%), and arts & humanities (73 | 10.2%) are the most common fields of study among 713 individuals in Fayetteville who have obtained a bachelor's degree or higher.
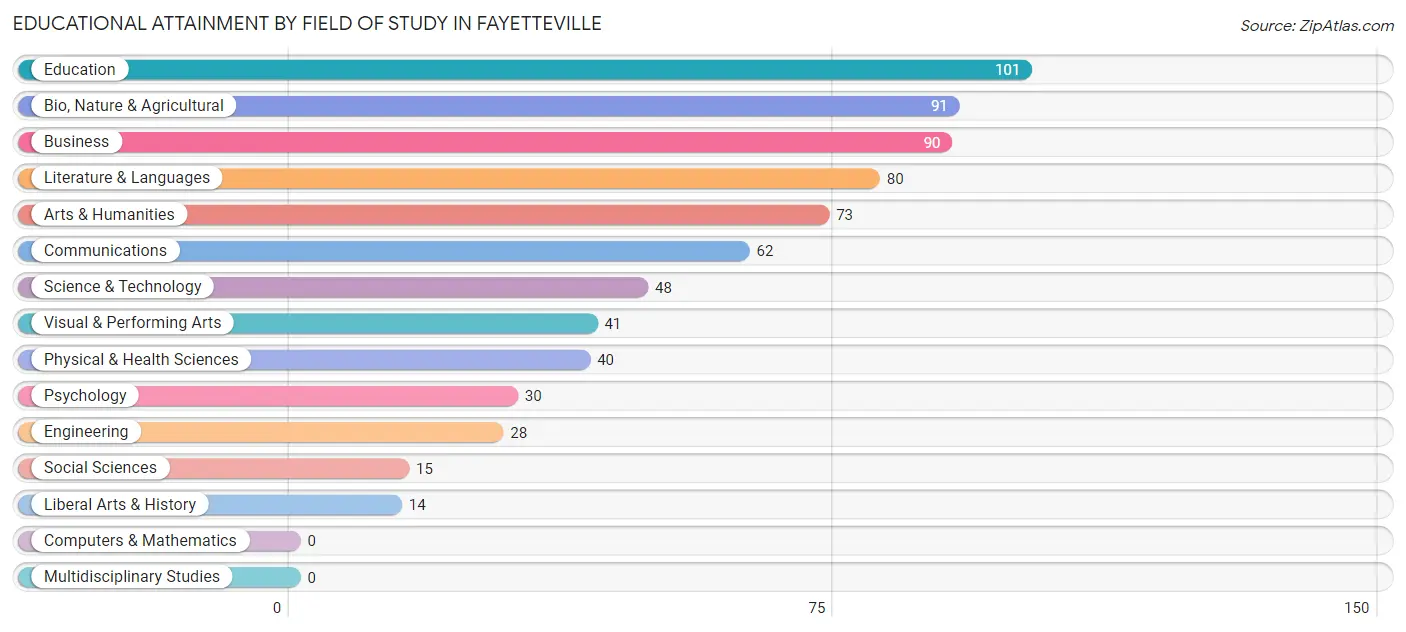
| Field of Study | # Graduates | % Graduates |
| Computers & Mathematics | 0 | 0.0% |
| Bio, Nature & Agricultural | 91 | 12.8% |
| Physical & Health Sciences | 40 | 5.6% |
| Psychology | 30 | 4.2% |
| Social Sciences | 15 | 2.1% |
| Engineering | 28 | 3.9% |
| Multidisciplinary Studies | 0 | 0.0% |
| Science & Technology | 48 | 6.7% |
| Business | 90 | 12.6% |
| Education | 101 | 14.2% |
| Literature & Languages | 80 | 11.2% |
| Liberal Arts & History | 14 | 2.0% |
| Visual & Performing Arts | 41 | 5.8% |
| Communications | 62 | 8.7% |
| Arts & Humanities | 73 | 10.2% |
| Total | 713 | 100.0% |
Transportation & Commute in Fayetteville
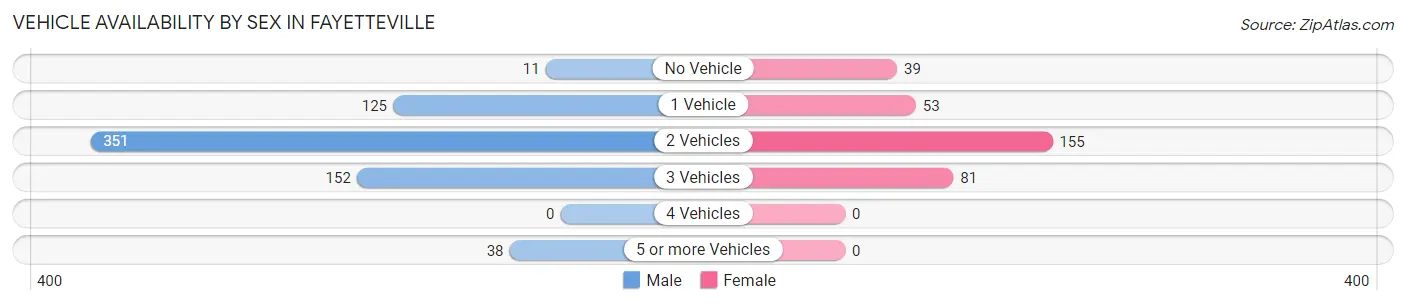
Vehicle Availability by Sex in Fayetteville
The most prevalent vehicle ownership categories in Fayetteville are males with 2 vehicles (351, accounting for 51.8%) and females with 2 vehicles (155, making up 107.0%).
| Vehicles Available | Male | Female |
| No Vehicle | 11 (1.6%) | 39 (11.9%) |
| 1 Vehicle | 125 (18.5%) | 53 (16.2%) |
| 2 Vehicles | 351 (51.8%) | 155 (47.3%) |
| 3 Vehicles | 152 (22.5%) | 81 (24.7%) |
| 4 Vehicles | 0 (0.0%) | 0 (0.0%) |
| 5 or more Vehicles | 38 (5.6%) | 0 (0.0%) |
| Total | 677 (100.0%) | 328 (100.0%) |
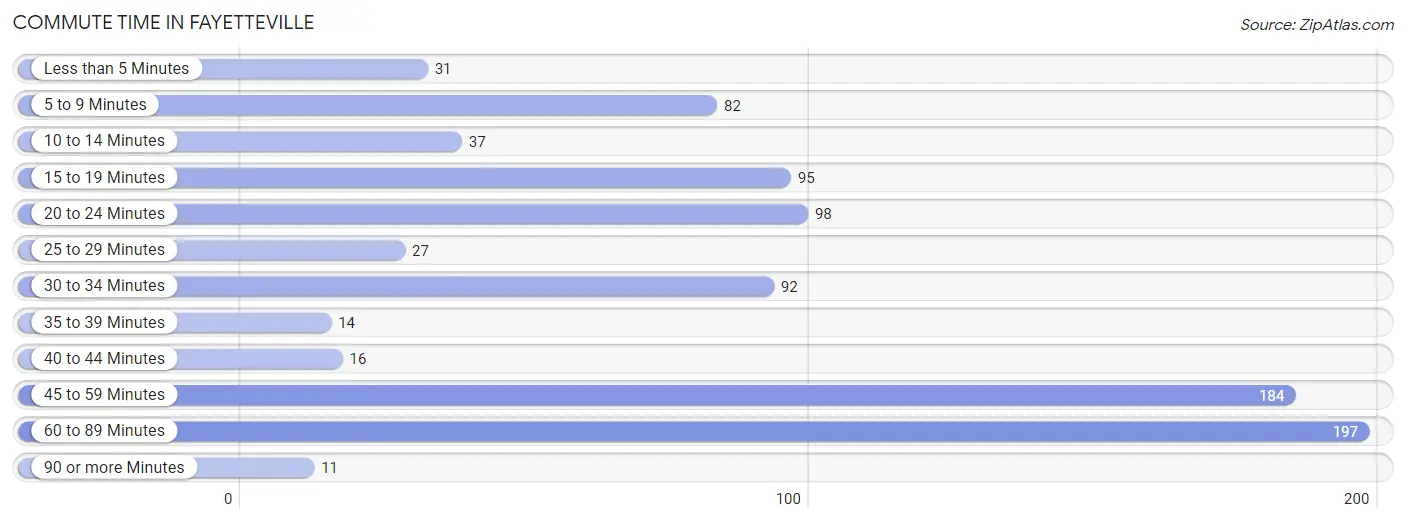
Commute Time in Fayetteville
The most frequently occuring commute durations in Fayetteville are 60 to 89 minutes (197 commuters, 22.3%), 45 to 59 minutes (184 commuters, 20.8%), and 20 to 24 minutes (98 commuters, 11.1%).
| Commute Time | # Commuters | % Commuters |
| Less than 5 Minutes | 31 | 3.5% |
| 5 to 9 Minutes | 82 | 9.3% |
| 10 to 14 Minutes | 37 | 4.2% |
| 15 to 19 Minutes | 95 | 10.7% |
| 20 to 24 Minutes | 98 | 11.1% |
| 25 to 29 Minutes | 27 | 3.0% |
| 30 to 34 Minutes | 92 | 10.4% |
| 35 to 39 Minutes | 14 | 1.6% |
| 40 to 44 Minutes | 16 | 1.8% |
| 45 to 59 Minutes | 184 | 20.8% |
| 60 to 89 Minutes | 197 | 22.3% |
| 90 or more Minutes | 11 | 1.2% |
Commute Time by Sex in Fayetteville
The most common commute times in Fayetteville are 60 to 89 minutes (168 commuters, 27.4%) for males and 20 to 24 minutes (73 commuters, 26.9%) for females.
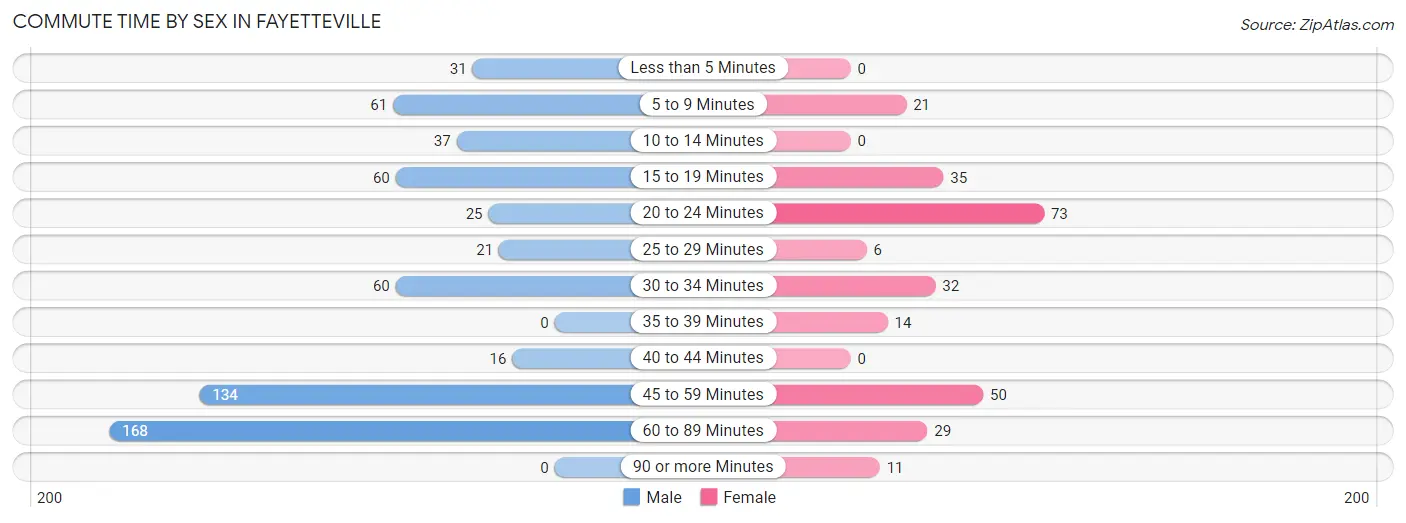
| Commute Time | Male | Female |
| Less than 5 Minutes | 31 (5.1%) | 0 (0.0%) |
| 5 to 9 Minutes | 61 (10.0%) | 21 (7.7%) |
| 10 to 14 Minutes | 37 (6.0%) | 0 (0.0%) |
| 15 to 19 Minutes | 60 (9.8%) | 35 (12.9%) |
| 20 to 24 Minutes | 25 (4.1%) | 73 (26.9%) |
| 25 to 29 Minutes | 21 (3.4%) | 6 (2.2%) |
| 30 to 34 Minutes | 60 (9.8%) | 32 (11.8%) |
| 35 to 39 Minutes | 0 (0.0%) | 14 (5.2%) |
| 40 to 44 Minutes | 16 (2.6%) | 0 (0.0%) |
| 45 to 59 Minutes | 134 (21.9%) | 50 (18.4%) |
| 60 to 89 Minutes | 168 (27.4%) | 29 (10.7%) |
| 90 or more Minutes | 0 (0.0%) | 11 (4.1%) |
Time of Departure to Work by Sex in Fayetteville
The most frequent times of departure to work in Fayetteville are 12:00 PM to 3:59 PM (246, 40.1%) for males and 7:00 AM to 7:29 AM (61, 22.5%) for females.
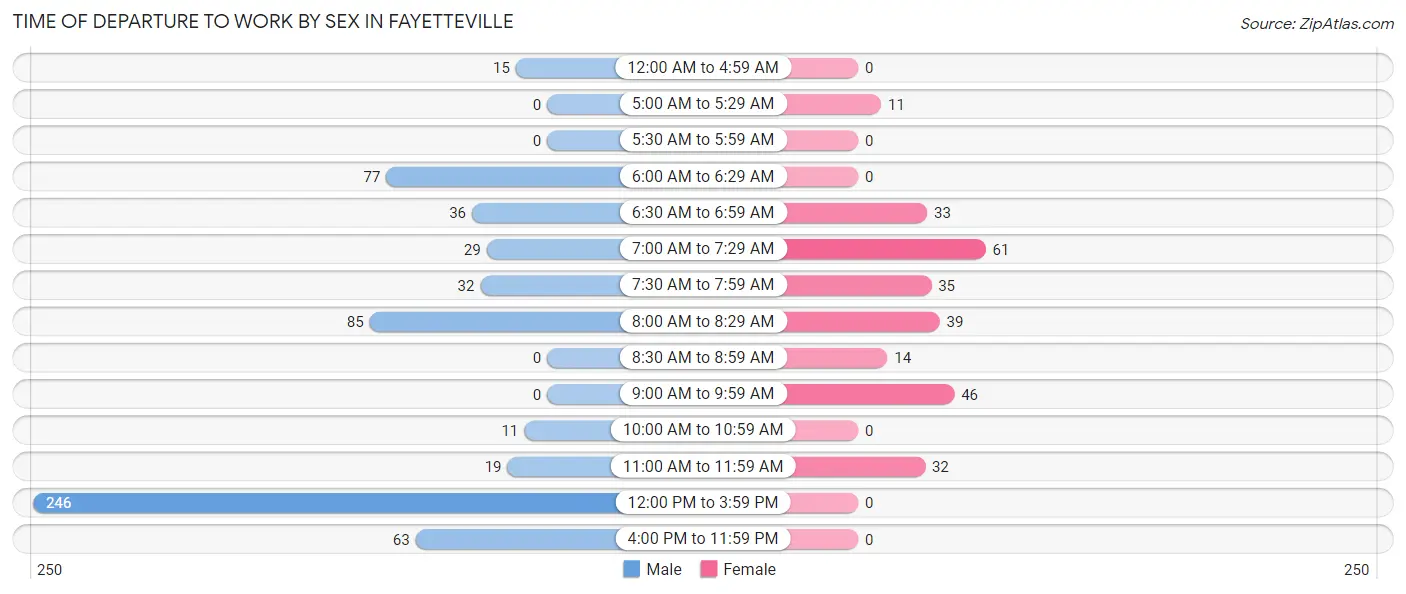
| Time of Departure | Male | Female |
| 12:00 AM to 4:59 AM | 15 (2.5%) | 0 (0.0%) |
| 5:00 AM to 5:29 AM | 0 (0.0%) | 11 (4.1%) |
| 5:30 AM to 5:59 AM | 0 (0.0%) | 0 (0.0%) |
| 6:00 AM to 6:29 AM | 77 (12.6%) | 0 (0.0%) |
| 6:30 AM to 6:59 AM | 36 (5.9%) | 33 (12.2%) |
| 7:00 AM to 7:29 AM | 29 (4.7%) | 61 (22.5%) |
| 7:30 AM to 7:59 AM | 32 (5.2%) | 35 (12.9%) |
| 8:00 AM to 8:29 AM | 85 (13.9%) | 39 (14.4%) |
| 8:30 AM to 8:59 AM | 0 (0.0%) | 14 (5.2%) |
| 9:00 AM to 9:59 AM | 0 (0.0%) | 46 (17.0%) |
| 10:00 AM to 10:59 AM | 11 (1.8%) | 0 (0.0%) |
| 11:00 AM to 11:59 AM | 19 (3.1%) | 32 (11.8%) |
| 12:00 PM to 3:59 PM | 246 (40.1%) | 0 (0.0%) |
| 4:00 PM to 11:59 PM | 63 (10.3%) | 0 (0.0%) |
| Total | 613 (100.0%) | 271 (100.0%) |
Housing Occupancy in Fayetteville
Occupancy by Ownership in Fayetteville
Of the total 1,232 dwellings in Fayetteville, owner-occupied units account for 925 (75.1%), while renter-occupied units make up 307 (24.9%).
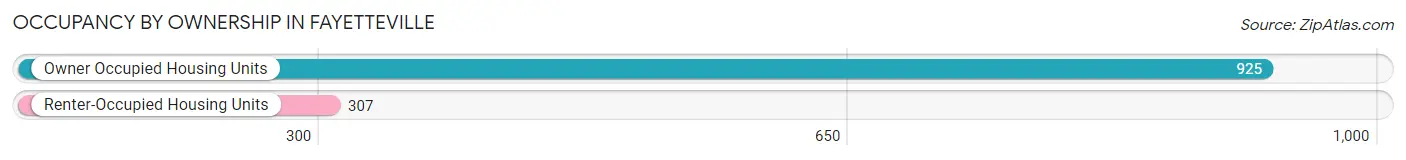
| Occupancy | # Housing Units | % Housing Units |
| Owner Occupied Housing Units | 925 | 75.1% |
| Renter-Occupied Housing Units | 307 | 24.9% |
| Total Occupied Housing Units | 1,232 | 100.0% |
Occupancy by Household Size in Fayetteville
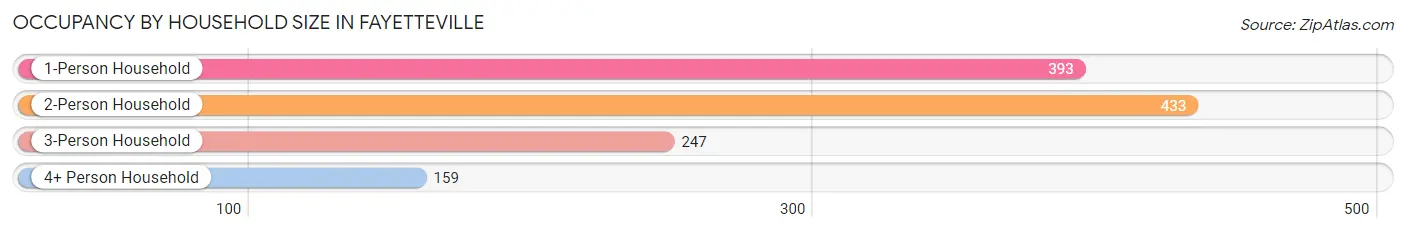
| Household Size | # Housing Units | % Housing Units |
| 1-Person Household | 393 | 31.9% |
| 2-Person Household | 433 | 35.1% |
| 3-Person Household | 247 | 20.1% |
| 4+ Person Household | 159 | 12.9% |
| Total Housing Units | 1,232 | 100.0% |
Occupancy by Ownership by Household Size in Fayetteville
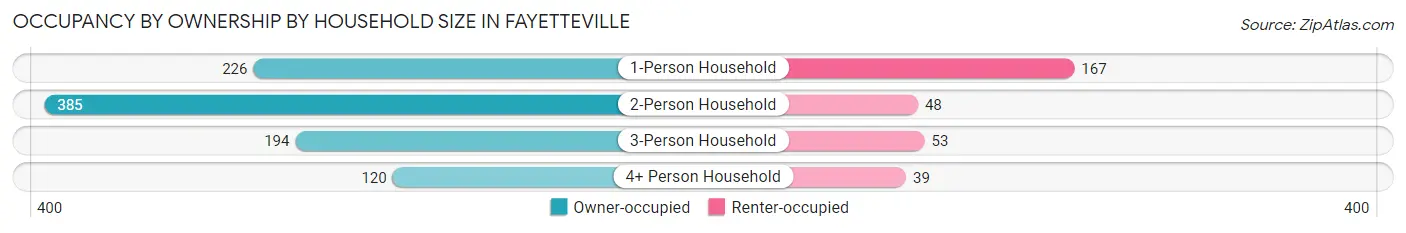
| Household Size | Owner-occupied | Renter-occupied |
| 1-Person Household | 226 (57.5%) | 167 (42.5%) |
| 2-Person Household | 385 (88.9%) | 48 (11.1%) |
| 3-Person Household | 194 (78.5%) | 53 (21.5%) |
| 4+ Person Household | 120 (75.5%) | 39 (24.5%) |
| Total Housing Units | 925 (75.1%) | 307 (24.9%) |
Occupancy by Educational Attainment in Fayetteville
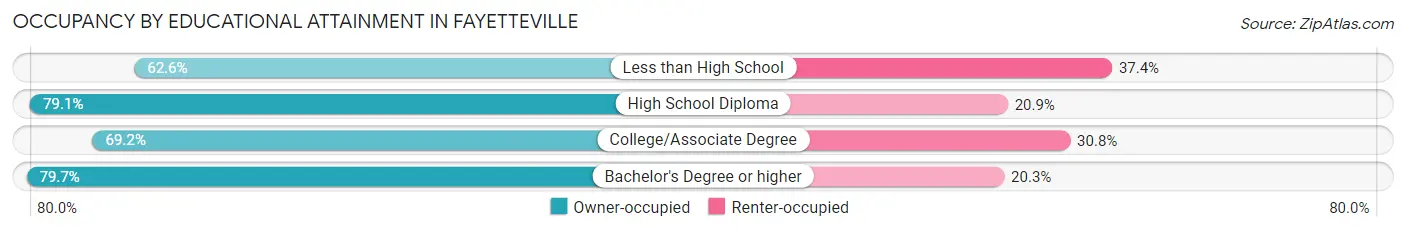
| Household Size | Owner-occupied | Renter-occupied |
| Less than High School | 82 (62.6%) | 49 (37.4%) |
| High School Diploma | 258 (79.1%) | 68 (20.9%) |
| College/Associate Degree | 216 (69.2%) | 96 (30.8%) |
| Bachelor's Degree or higher | 369 (79.7%) | 94 (20.3%) |
Occupancy by Age of Householder in Fayetteville
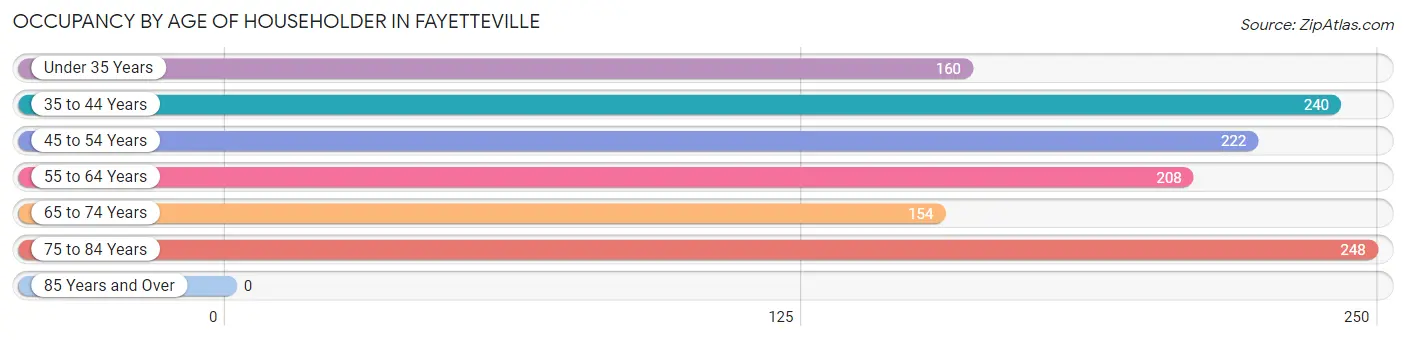
| Age Bracket | # Households | % Households |
| Under 35 Years | 160 | 13.0% |
| 35 to 44 Years | 240 | 19.5% |
| 45 to 54 Years | 222 | 18.0% |
| 55 to 64 Years | 208 | 16.9% |
| 65 to 74 Years | 154 | 12.5% |
| 75 to 84 Years | 248 | 20.1% |
| 85 Years and Over | 0 | 0.0% |
| Total | 1,232 | 100.0% |
Housing Finances in Fayetteville
Median Income by Occupancy in Fayetteville
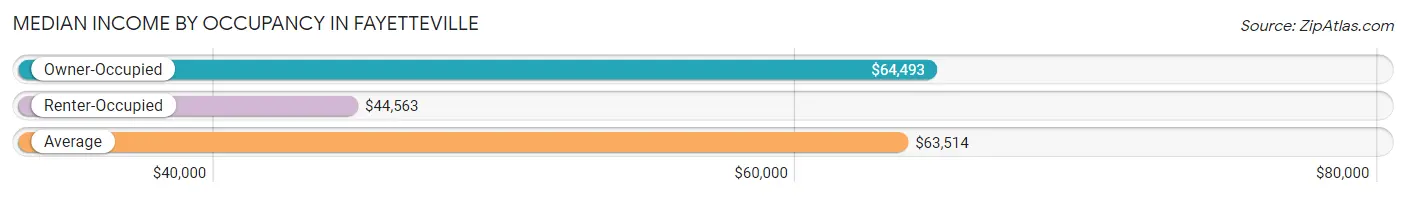
| Occupancy Type | # Households | Median Income |
| Owner-Occupied | 925 (75.1%) | $64,493 |
| Renter-Occupied | 307 (24.9%) | $44,563 |
| Average | 1,232 (100.0%) | $63,514 |
Occupancy by Householder Income Bracket in Fayetteville
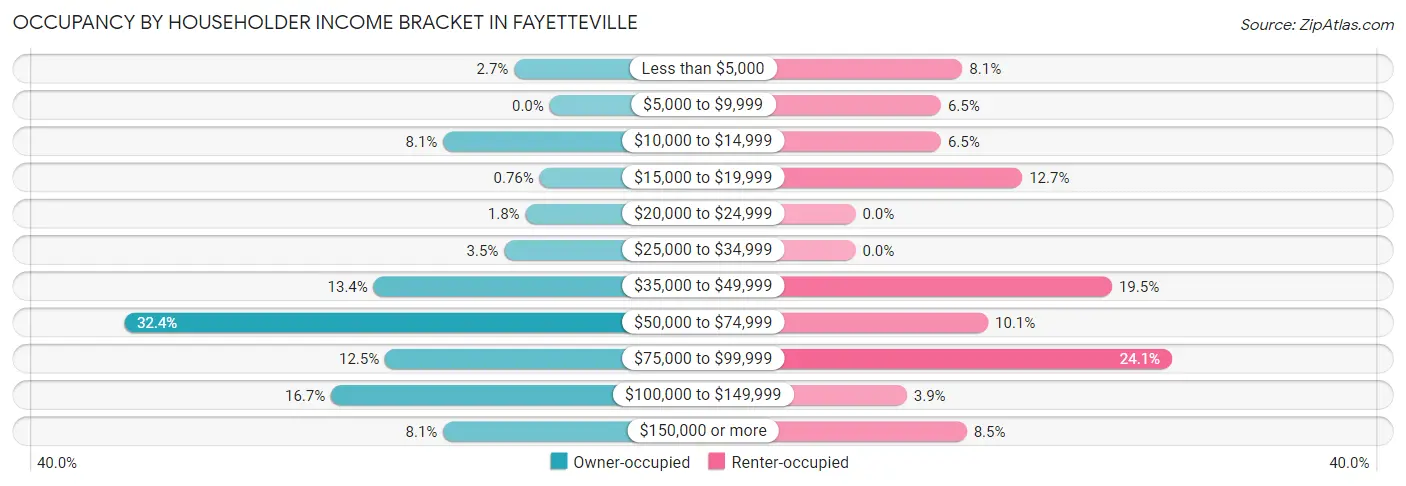
| Income Bracket | Owner-occupied | Renter-occupied |
| Less than $5,000 | 25 (2.7%) | 25 (8.1%) |
| $5,000 to $9,999 | 0 (0.0%) | 20 (6.5%) |
| $10,000 to $14,999 | 75 (8.1%) | 20 (6.5%) |
| $15,000 to $19,999 | 7 (0.8%) | 39 (12.7%) |
| $20,000 to $24,999 | 17 (1.8%) | 0 (0.0%) |
| $25,000 to $34,999 | 32 (3.5%) | 0 (0.0%) |
| $35,000 to $49,999 | 124 (13.4%) | 60 (19.5%) |
| $50,000 to $74,999 | 300 (32.4%) | 31 (10.1%) |
| $75,000 to $99,999 | 116 (12.5%) | 74 (24.1%) |
| $100,000 to $149,999 | 154 (16.7%) | 12 (3.9%) |
| $150,000 or more | 75 (8.1%) | 26 (8.5%) |
| Total | 925 (100.0%) | 307 (100.0%) |
Monthly Housing Cost Tiers in Fayetteville
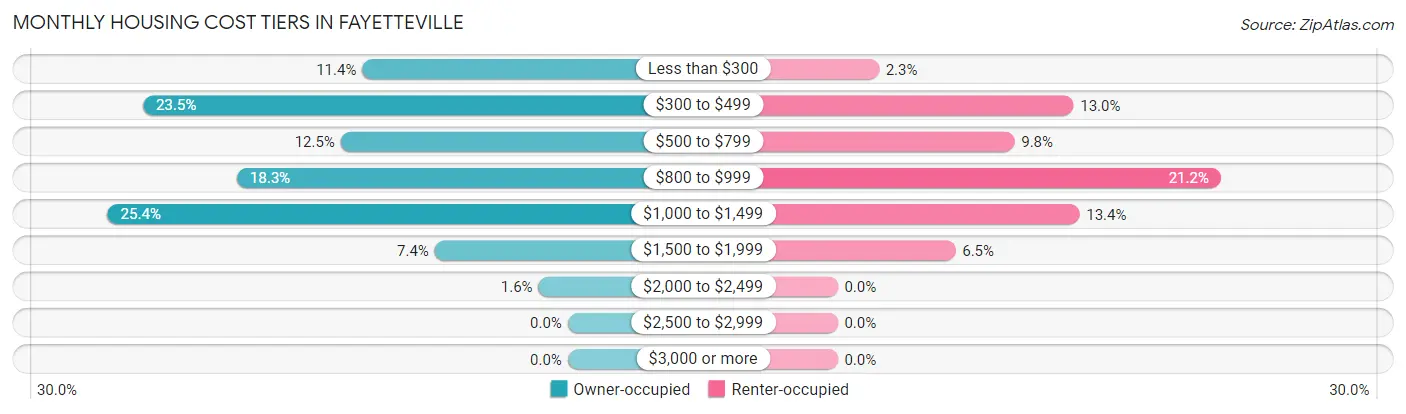
| Monthly Cost | Owner-occupied | Renter-occupied |
| Less than $300 | 105 (11.4%) | 7 (2.3%) |
| $300 to $499 | 217 (23.5%) | 40 (13.0%) |
| $500 to $799 | 116 (12.5%) | 30 (9.8%) |
| $800 to $999 | 169 (18.3%) | 65 (21.2%) |
| $1,000 to $1,499 | 235 (25.4%) | 41 (13.4%) |
| $1,500 to $1,999 | 68 (7.3%) | 20 (6.5%) |
| $2,000 to $2,499 | 15 (1.6%) | 0 (0.0%) |
| $2,500 to $2,999 | 0 (0.0%) | 0 (0.0%) |
| $3,000 or more | 0 (0.0%) | 0 (0.0%) |
| Total | 925 (100.0%) | 307 (100.0%) |
Physical Housing Characteristics in Fayetteville
Housing Structures in Fayetteville
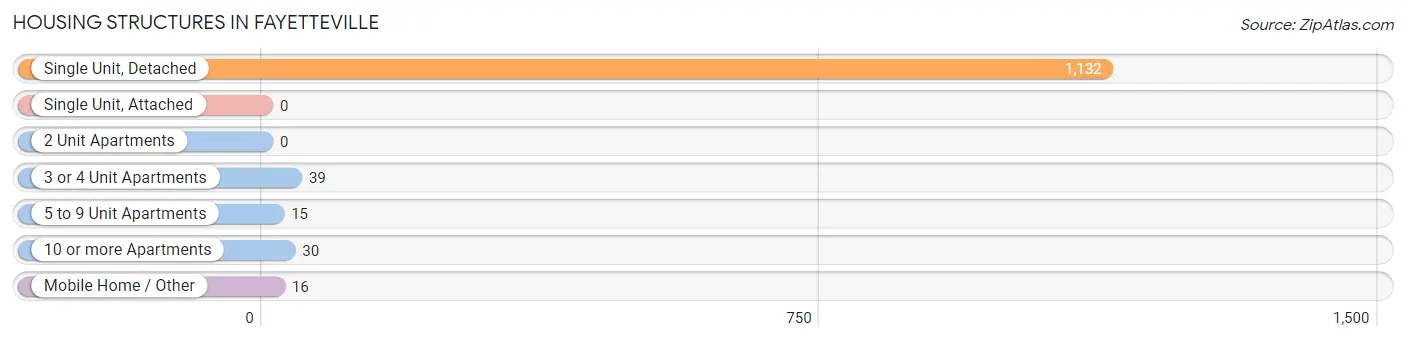
| Structure Type | # Housing Units | % Housing Units |
| Single Unit, Detached | 1,132 | 91.9% |
| Single Unit, Attached | 0 | 0.0% |
| 2 Unit Apartments | 0 | 0.0% |
| 3 or 4 Unit Apartments | 39 | 3.2% |
| 5 to 9 Unit Apartments | 15 | 1.2% |
| 10 or more Apartments | 30 | 2.4% |
| Mobile Home / Other | 16 | 1.3% |
| Total | 1,232 | 100.0% |
Housing Structures by Occupancy in Fayetteville
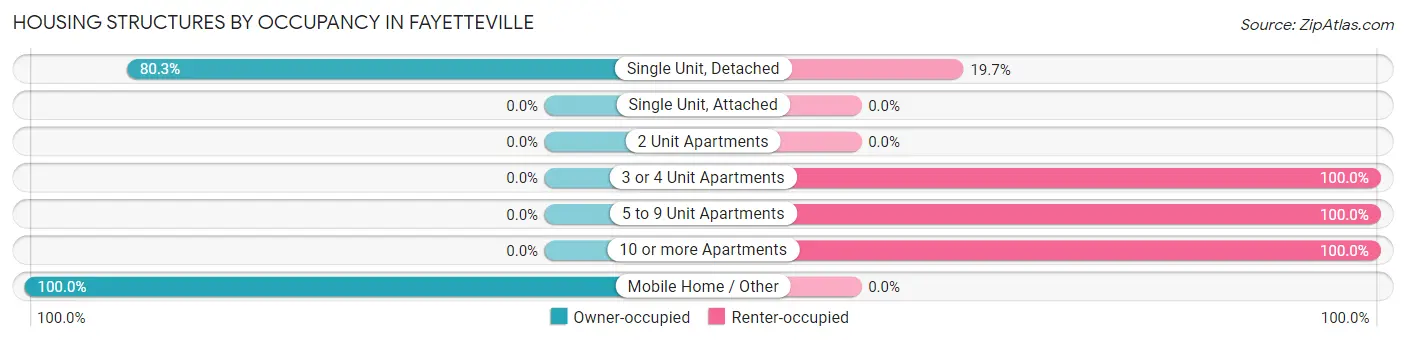
| Structure Type | Owner-occupied | Renter-occupied |
| Single Unit, Detached | 909 (80.3%) | 223 (19.7%) |
| Single Unit, Attached | 0 (0.0%) | 0 (0.0%) |
| 2 Unit Apartments | 0 (0.0%) | 0 (0.0%) |
| 3 or 4 Unit Apartments | 0 (0.0%) | 39 (100.0%) |
| 5 to 9 Unit Apartments | 0 (0.0%) | 15 (100.0%) |
| 10 or more Apartments | 0 (0.0%) | 30 (100.0%) |
| Mobile Home / Other | 16 (100.0%) | 0 (0.0%) |
| Total | 925 (75.1%) | 307 (24.9%) |
Housing Structures by Number of Rooms in Fayetteville
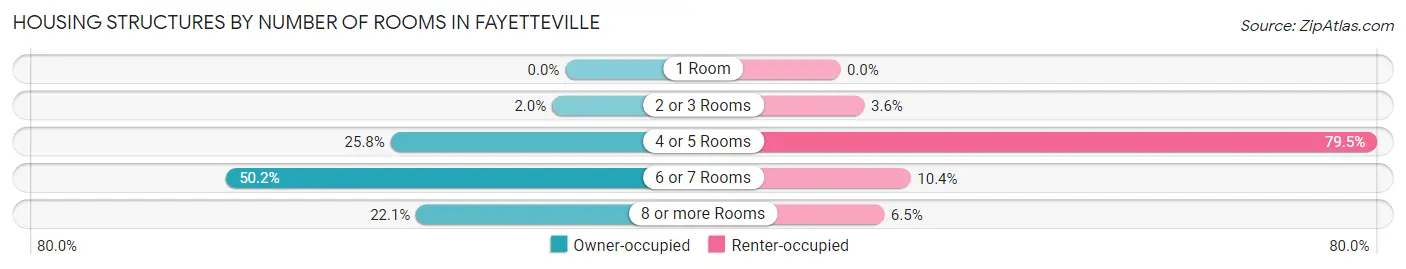
| Number of Rooms | Owner-occupied | Renter-occupied |
| 1 Room | 0 (0.0%) | 0 (0.0%) |
| 2 or 3 Rooms | 18 (1.9%) | 11 (3.6%) |
| 4 or 5 Rooms | 239 (25.8%) | 244 (79.5%) |
| 6 or 7 Rooms | 464 (50.2%) | 32 (10.4%) |
| 8 or more Rooms | 204 (22.1%) | 20 (6.5%) |
| Total | 925 (100.0%) | 307 (100.0%) |
Housing Structure by Heating Type in Fayetteville
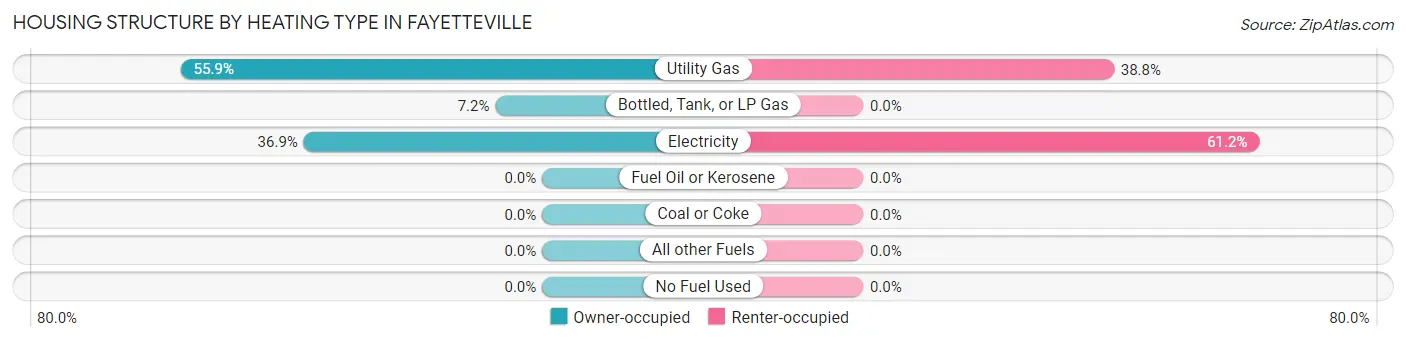
| Heating Type | Owner-occupied | Renter-occupied |
| Utility Gas | 517 (55.9%) | 119 (38.8%) |
| Bottled, Tank, or LP Gas | 67 (7.2%) | 0 (0.0%) |
| Electricity | 341 (36.9%) | 188 (61.2%) |
| Fuel Oil or Kerosene | 0 (0.0%) | 0 (0.0%) |
| Coal or Coke | 0 (0.0%) | 0 (0.0%) |
| All other Fuels | 0 (0.0%) | 0 (0.0%) |
| No Fuel Used | 0 (0.0%) | 0 (0.0%) |
| Total | 925 (100.0%) | 307 (100.0%) |
Household Vehicle Usage in Fayetteville
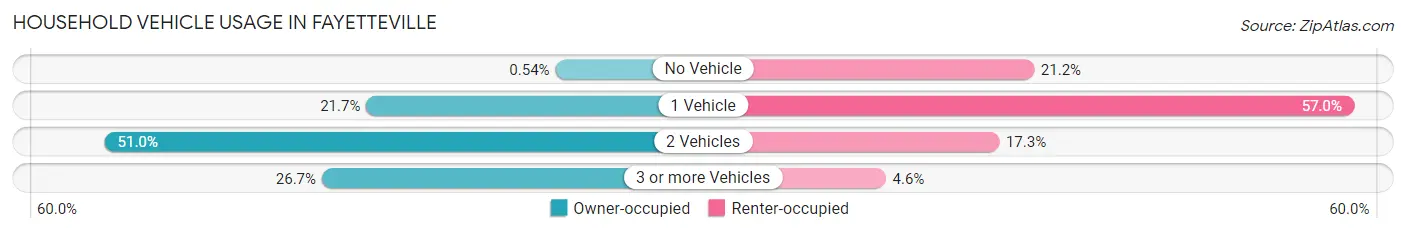
| Vehicles per Household | Owner-occupied | Renter-occupied |
| No Vehicle | 5 (0.5%) | 65 (21.2%) |
| 1 Vehicle | 201 (21.7%) | 175 (57.0%) |
| 2 Vehicles | 472 (51.0%) | 53 (17.3%) |
| 3 or more Vehicles | 247 (26.7%) | 14 (4.6%) |
| Total | 925 (100.0%) | 307 (100.0%) |
Real Estate & Mortgages in Fayetteville
Real Estate and Mortgage Overview in Fayetteville
| Characteristic | Without Mortgage | With Mortgage |
| Housing Units | 393 | 532 |
| Median Property Value | $118,500 | $159,100 |
| Median Household Income | $57,225 | $75 |
| Monthly Housing Costs | $410 | $0 |
| Real Estate Taxes | $1,129 | $0 |
Property Value by Mortgage Status in Fayetteville
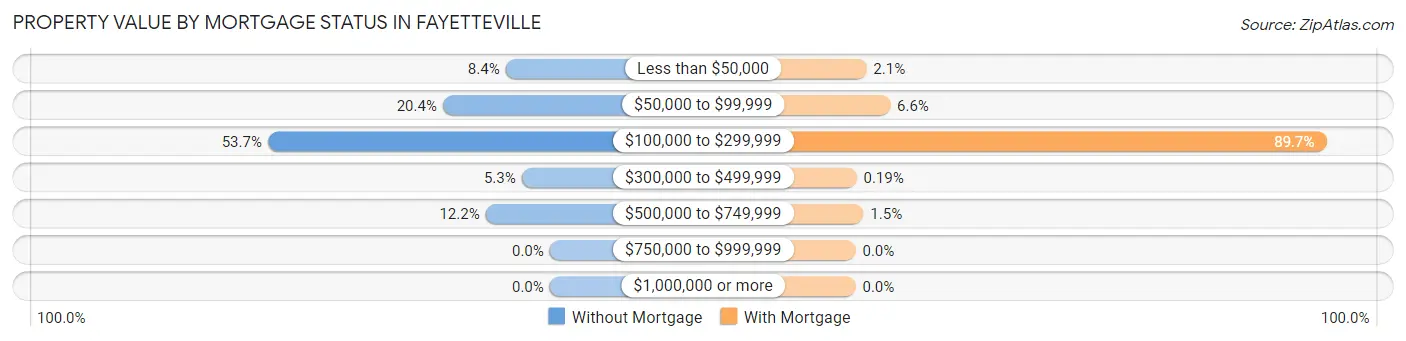
| Property Value | Without Mortgage | With Mortgage |
| Less than $50,000 | 33 (8.4%) | 11 (2.1%) |
| $50,000 to $99,999 | 80 (20.4%) | 35 (6.6%) |
| $100,000 to $299,999 | 211 (53.7%) | 477 (89.7%) |
| $300,000 to $499,999 | 21 (5.3%) | 1 (0.2%) |
| $500,000 to $749,999 | 48 (12.2%) | 8 (1.5%) |
| $750,000 to $999,999 | 0 (0.0%) | 0 (0.0%) |
| $1,000,000 or more | 0 (0.0%) | 0 (0.0%) |
| Total | 393 (100.0%) | 532 (100.0%) |
Household Income by Mortgage Status in Fayetteville
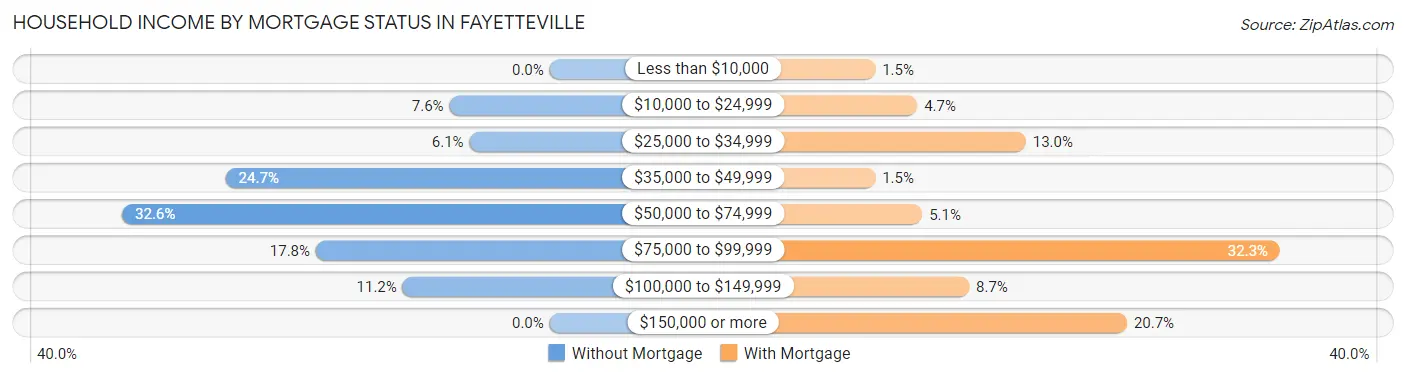
| Household Income | Without Mortgage | With Mortgage |
| Less than $10,000 | 0 (0.0%) | 8 (1.5%) |
| $10,000 to $24,999 | 30 (7.6%) | 25 (4.7%) |
| $25,000 to $34,999 | 24 (6.1%) | 69 (13.0%) |
| $35,000 to $49,999 | 97 (24.7%) | 8 (1.5%) |
| $50,000 to $74,999 | 128 (32.6%) | 27 (5.1%) |
| $75,000 to $99,999 | 70 (17.8%) | 172 (32.3%) |
| $100,000 to $149,999 | 44 (11.2%) | 46 (8.6%) |
| $150,000 or more | 0 (0.0%) | 110 (20.7%) |
| Total | 393 (100.0%) | 532 (100.0%) |
Property Value to Household Income Ratio in Fayetteville
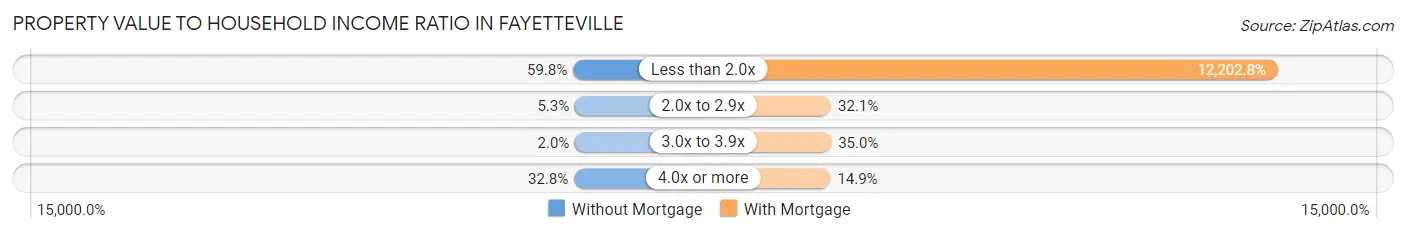
| Value-to-Income Ratio | Without Mortgage | With Mortgage |
| Less than 2.0x | 235 (59.8%) | 64,919 (12,202.8%) |
| 2.0x to 2.9x | 21 (5.3%) | 171 (32.1%) |
| 3.0x to 3.9x | 8 (2.0%) | 186 (35.0%) |
| 4.0x or more | 129 (32.8%) | 79 (14.8%) |
| Total | 393 (100.0%) | 532 (100.0%) |
Real Estate Taxes by Mortgage Status in Fayetteville
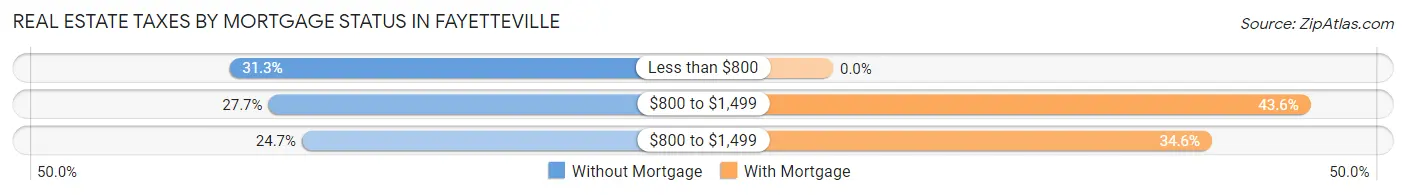
| Property Taxes | Without Mortgage | With Mortgage |
| Less than $800 | 123 (31.3%) | 0 (0.0%) |
| $800 to $1,499 | 109 (27.7%) | 232 (43.6%) |
| $800 to $1,499 | 97 (24.7%) | 184 (34.6%) |
| Total | 393 (100.0%) | 532 (100.0%) |
Health & Disability in Fayetteville
Health Insurance Coverage by Age in Fayetteville
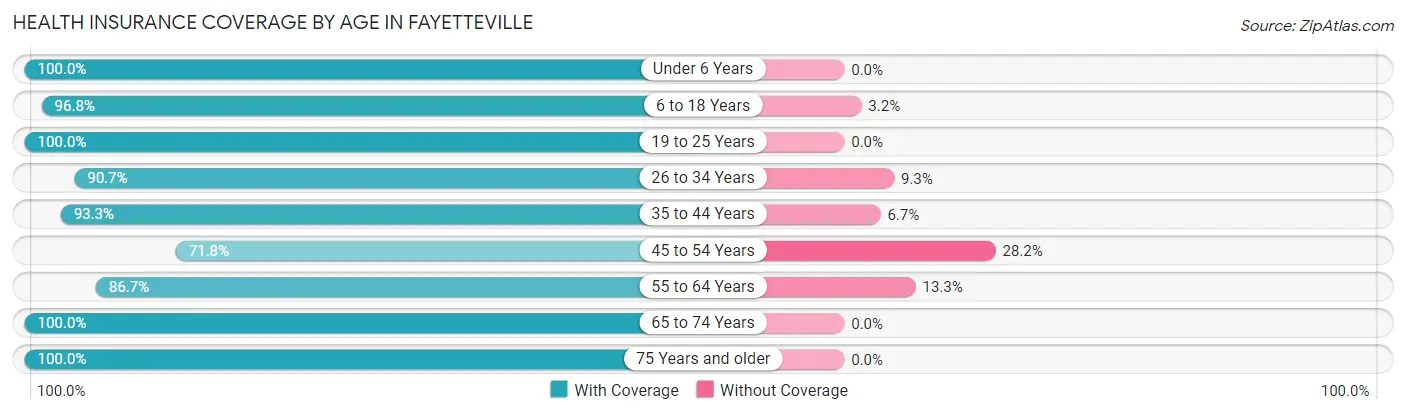
| Age Bracket | With Coverage | Without Coverage |
| Under 6 Years | 112 (100.0%) | 0 (0.0%) |
| 6 to 18 Years | 577 (96.8%) | 19 (3.2%) |
| 19 to 25 Years | 62 (100.0%) | 0 (0.0%) |
| 26 to 34 Years | 274 (90.7%) | 28 (9.3%) |
| 35 to 44 Years | 360 (93.3%) | 26 (6.7%) |
| 45 to 54 Years | 201 (71.8%) | 79 (28.2%) |
| 55 to 64 Years | 398 (86.7%) | 61 (13.3%) |
| 65 to 74 Years | 193 (100.0%) | 0 (0.0%) |
| 75 Years and older | 453 (100.0%) | 0 (0.0%) |
| Total | 2,630 (92.5%) | 213 (7.5%) |
Health Insurance Coverage by Citizenship Status in Fayetteville
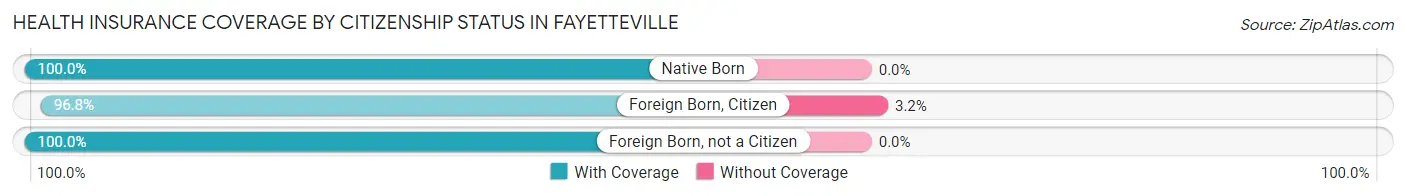
| Citizenship Status | With Coverage | Without Coverage |
| Native Born | 112 (100.0%) | 0 (0.0%) |
| Foreign Born, Citizen | 577 (96.8%) | 19 (3.2%) |
| Foreign Born, not a Citizen | 62 (100.0%) | 0 (0.0%) |
Health Insurance Coverage by Household Income in Fayetteville
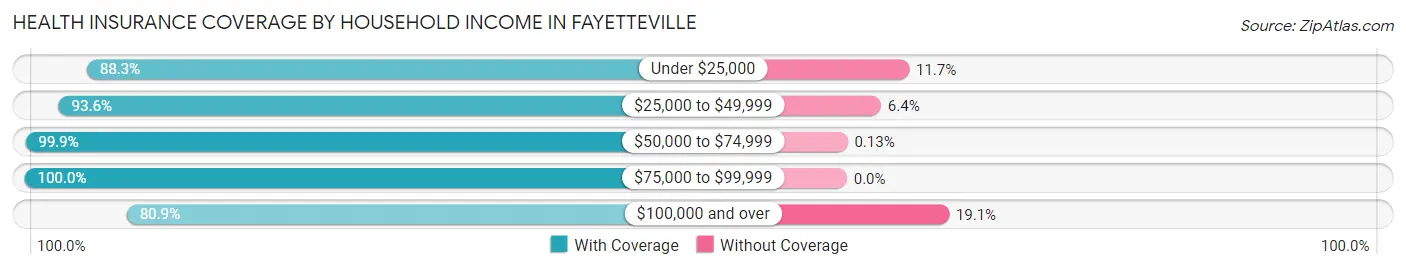
| Household Income | With Coverage | Without Coverage |
| Under $25,000 | 462 (88.3%) | 61 (11.7%) |
| $25,000 to $49,999 | 381 (93.6%) | 26 (6.4%) |
| $50,000 to $74,999 | 775 (99.9%) | 1 (0.1%) |
| $75,000 to $99,999 | 484 (100.0%) | 0 (0.0%) |
| $100,000 and over | 528 (80.9%) | 125 (19.1%) |
Public vs Private Health Insurance Coverage by Age in Fayetteville
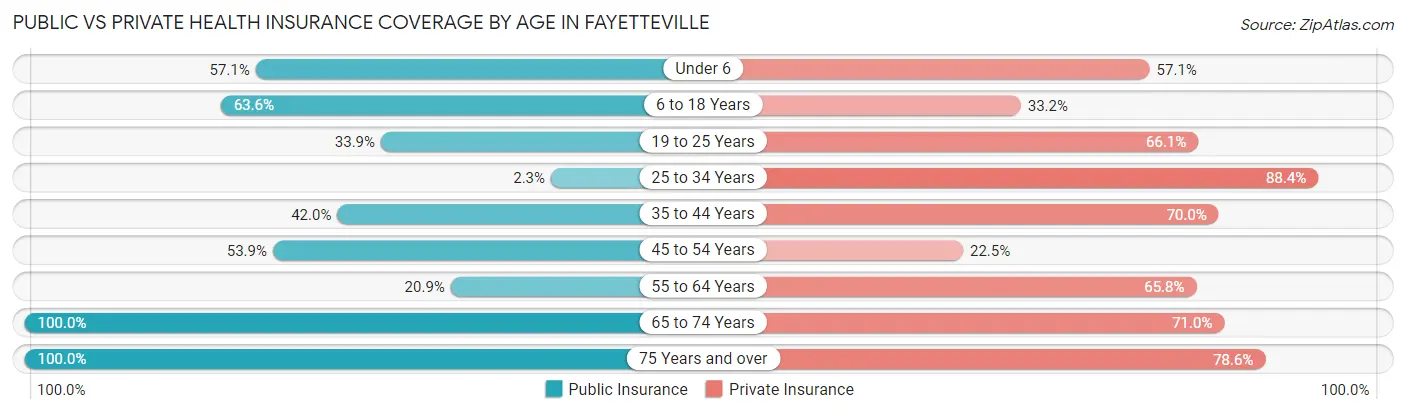
| Age Bracket | Public Insurance | Private Insurance |
| Under 6 | 64 (57.1%) | 64 (57.1%) |
| 6 to 18 Years | 379 (63.6%) | 198 (33.2%) |
| 19 to 25 Years | 21 (33.9%) | 41 (66.1%) |
| 25 to 34 Years | 7 (2.3%) | 267 (88.4%) |
| 35 to 44 Years | 162 (42.0%) | 270 (70.0%) |
| 45 to 54 Years | 151 (53.9%) | 63 (22.5%) |
| 55 to 64 Years | 96 (20.9%) | 302 (65.8%) |
| 65 to 74 Years | 193 (100.0%) | 137 (71.0%) |
| 75 Years and over | 453 (100.0%) | 356 (78.6%) |
| Total | 1,526 (53.7%) | 1,698 (59.7%) |
Disability Status by Sex by Age in Fayetteville
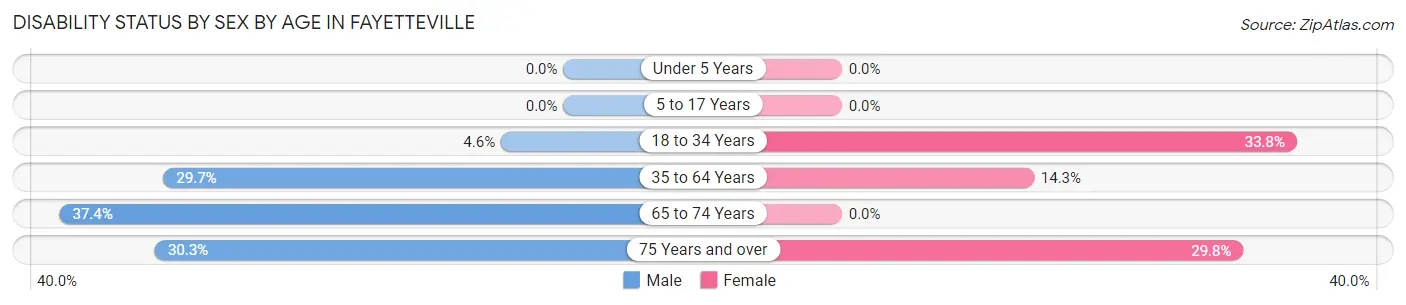
| Age Bracket | Male | Female |
| Under 5 Years | 0 (0.0%) | 0 (0.0%) |
| 5 to 17 Years | 0 (0.0%) | 0 (0.0%) |
| 18 to 34 Years | 10 (4.6%) | 50 (33.8%) |
| 35 to 64 Years | 182 (29.7%) | 73 (14.3%) |
| 65 to 74 Years | 46 (37.4%) | 0 (0.0%) |
| 75 Years and over | 57 (30.3%) | 79 (29.8%) |
Disability Class by Sex by Age in Fayetteville
Disability Class: Hearing Difficulty
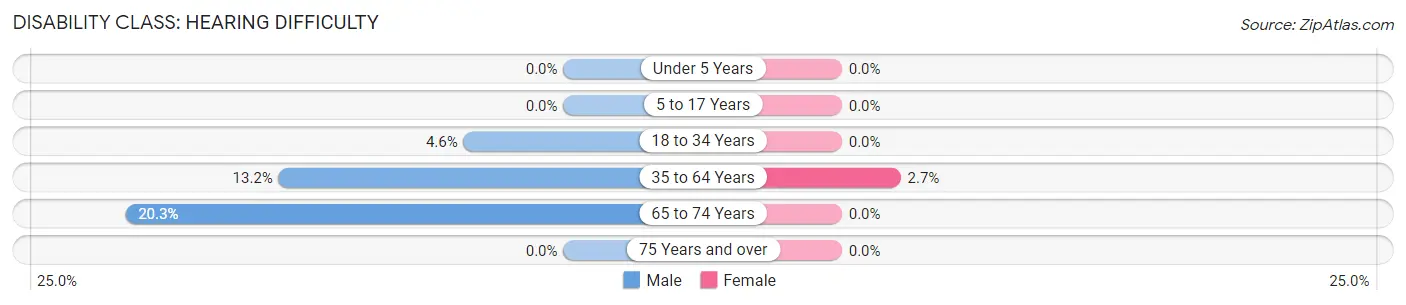
| Age Bracket | Male | Female |
| Under 5 Years | 0 (0.0%) | 0 (0.0%) |
| 5 to 17 Years | 0 (0.0%) | 0 (0.0%) |
| 18 to 34 Years | 10 (4.6%) | 0 (0.0%) |
| 35 to 64 Years | 81 (13.2%) | 14 (2.7%) |
| 65 to 74 Years | 25 (20.3%) | 0 (0.0%) |
| 75 Years and over | 0 (0.0%) | 0 (0.0%) |
Disability Class: Vision Difficulty
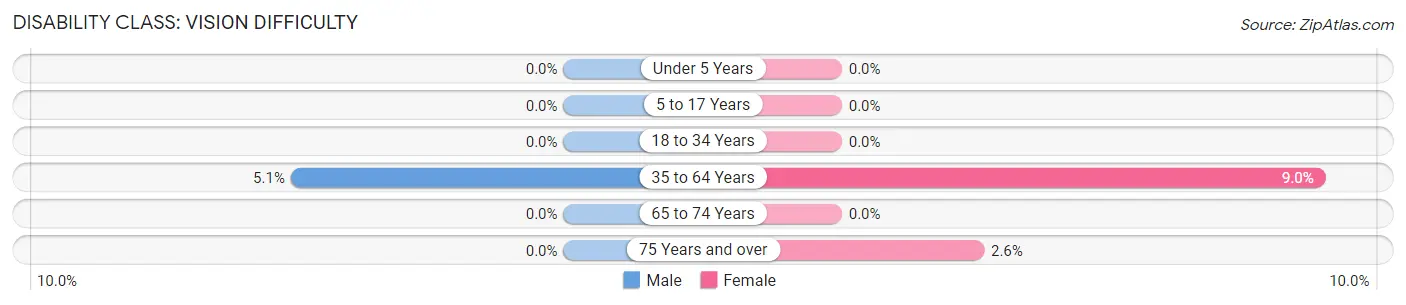
| Age Bracket | Male | Female |
| Under 5 Years | 0 (0.0%) | 0 (0.0%) |
| 5 to 17 Years | 0 (0.0%) | 0 (0.0%) |
| 18 to 34 Years | 0 (0.0%) | 0 (0.0%) |
| 35 to 64 Years | 31 (5.1%) | 46 (9.0%) |
| 65 to 74 Years | 0 (0.0%) | 0 (0.0%) |
| 75 Years and over | 0 (0.0%) | 7 (2.6%) |
Disability Class: Cognitive Difficulty
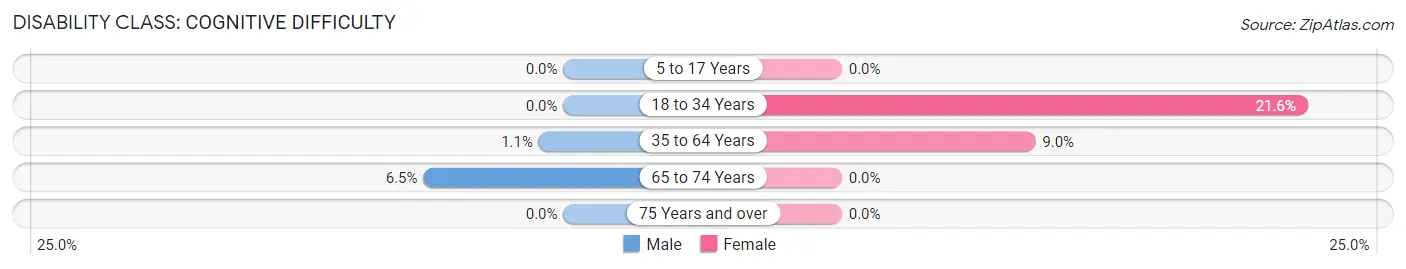
| Age Bracket | Male | Female |
| 5 to 17 Years | 0 (0.0%) | 0 (0.0%) |
| 18 to 34 Years | 0 (0.0%) | 32 (21.6%) |
| 35 to 64 Years | 7 (1.1%) | 46 (9.0%) |
| 65 to 74 Years | 8 (6.5%) | 0 (0.0%) |
| 75 Years and over | 0 (0.0%) | 0 (0.0%) |
Disability Class: Ambulatory Difficulty
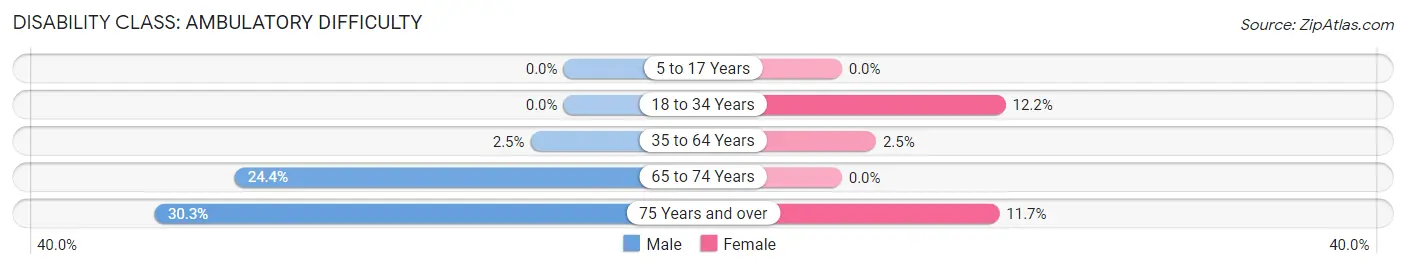
| Age Bracket | Male | Female |
| 5 to 17 Years | 0 (0.0%) | 0 (0.0%) |
| 18 to 34 Years | 0 (0.0%) | 18 (12.2%) |
| 35 to 64 Years | 15 (2.5%) | 13 (2.5%) |
| 65 to 74 Years | 30 (24.4%) | 0 (0.0%) |
| 75 Years and over | 57 (30.3%) | 31 (11.7%) |
Disability Class: Self-Care Difficulty
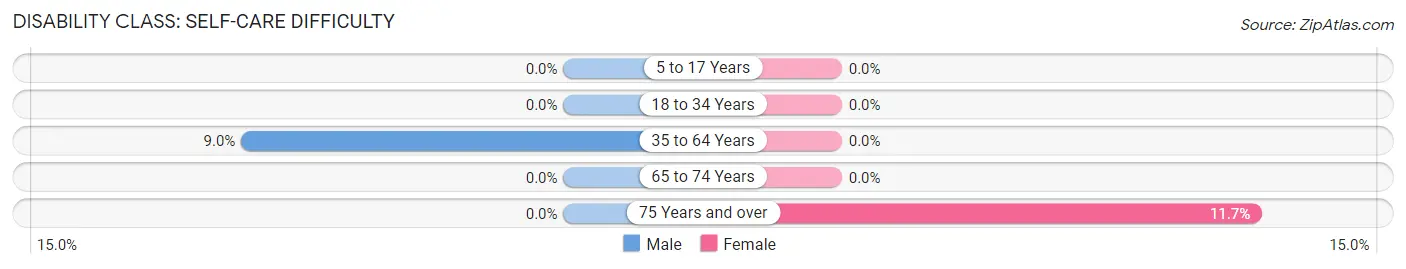
| Age Bracket | Male | Female |
| 5 to 17 Years | 0 (0.0%) | 0 (0.0%) |
| 18 to 34 Years | 0 (0.0%) | 0 (0.0%) |
| 35 to 64 Years | 55 (9.0%) | 0 (0.0%) |
| 65 to 74 Years | 0 (0.0%) | 0 (0.0%) |
| 75 Years and over | 0 (0.0%) | 31 (11.7%) |
Technology Access in Fayetteville
Computing Device Access in Fayetteville
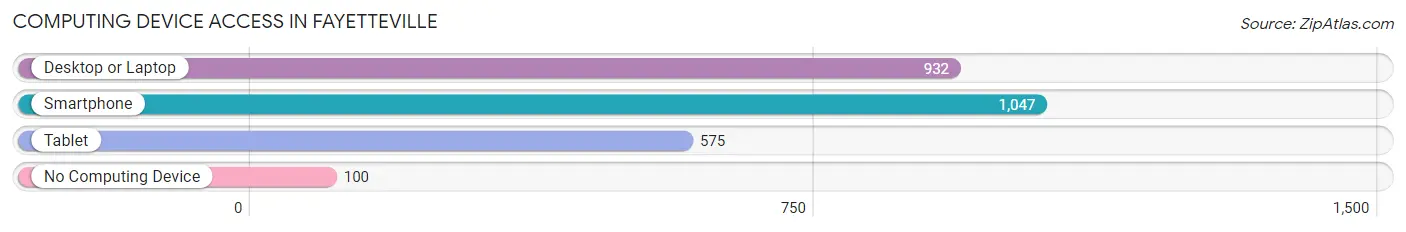
| Device Type | # Households | % Households |
| Desktop or Laptop | 932 | 75.6% |
| Smartphone | 1,047 | 85.0% |
| Tablet | 575 | 46.7% |
| No Computing Device | 100 | 8.1% |
| Total | 1,232 | 100.0% |
Internet Access in Fayetteville
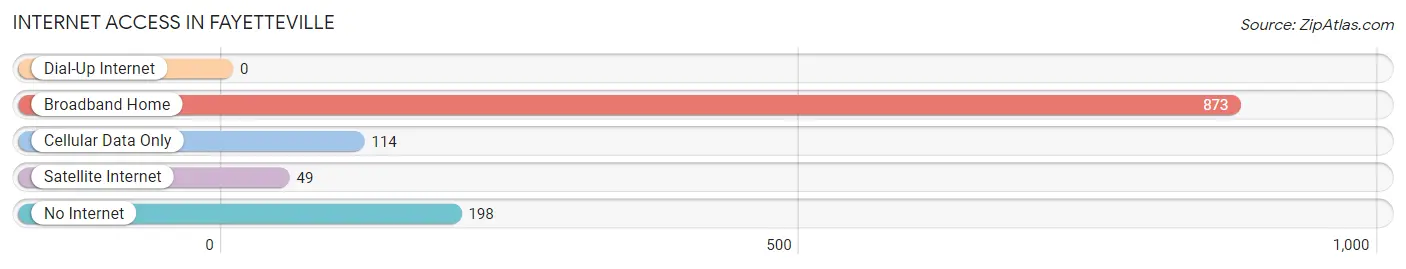
| Internet Type | # Households | % Households |
| Dial-Up Internet | 0 | 0.0% |
| Broadband Home | 873 | 70.9% |
| Cellular Data Only | 114 | 9.2% |
| Satellite Internet | 49 | 4.0% |
| No Internet | 198 | 16.1% |
| Total | 1,232 | 100.0% |
Fayetteville Summary
Fayetteville, West Virginia is a small town located in the southeastern part of the state. It is situated in the New River Gorge National River area and is part of the Fayette County. The town is known for its outdoor recreation opportunities, such as whitewater rafting, rock climbing, and hiking. It is also home to the New River Gorge Bridge, the longest single-span arch bridge in the world.
History
Fayetteville was founded in 1798 by a group of settlers from Virginia. The town was named after the Marquis de Lafayette, a French military officer who fought in the American Revolutionary War. The town was originally a farming community, but it soon became a center for the coal and timber industries. The town was incorporated in 1831 and was the county seat of Fayette County.
In the late 19th century, the Chesapeake and Ohio Railway (C&O) built a line through the town, connecting it to the rest of the state. This allowed the town to become a major hub for the coal and timber industries. The town also became a popular tourist destination, as it was located near the New River Gorge.
Geography
Fayetteville is located in the southeastern part of West Virginia, in the New River Gorge National River area. The town is situated in the Appalachian Mountains and is surrounded by the New River, the Gauley River, and the Meadow River. The town is located at an elevation of 1,400 feet and has a total area of 1.2 square miles.
The climate in Fayetteville is humid subtropical, with hot summers and mild winters. The average annual temperature is around 57 degrees Fahrenheit, and the average annual precipitation is around 43 inches.
Economy
The economy of Fayetteville is largely based on tourism and outdoor recreation. The town is home to the New River Gorge Bridge, which is the longest single-span arch bridge in the world. The bridge attracts thousands of visitors each year, and the town has become a popular destination for whitewater rafting, rock climbing, and hiking.
The town is also home to several small businesses, including restaurants, shops, and galleries. The town is also home to several coal mines, which provide jobs for many of the town’s residents.
Demographics
As of the 2010 census, the population of Fayetteville was 2,892. The racial makeup of the town was 97.2% White, 0.7% African American, 0.2% Native American, 0.3% Asian, 0.1% Pacific Islander, and 1.5% from other races. The median household income was $31,250, and the median family income was $37,500.
Fayetteville is a small town with a close-knit community. The town is known for its outdoor recreation opportunities and its friendly atmosphere. It is a great place to live, work, and play.
Common Questions
What is Per Capita Income in Fayetteville?
Per Capita income in Fayetteville is $30,764.
What is the Median Family Income in Fayetteville?
Median Family Income in Fayetteville is $63,772.
What is the Median Household income in Fayetteville?
Median Household Income in Fayetteville is $63,514.
What is Income or Wage Gap in Fayetteville?
Income or Wage Gap in Fayetteville is 32.7%.
Women in Fayetteville earn 67.3 cents for every dollar earned by a man.
What is Inequality or Gini Index in Fayetteville?
Inequality or Gini Index in Fayetteville is 0.37.
What is the Total Population of Fayetteville?
Total Population of Fayetteville is 2,890.
What is the Total Male Population of Fayetteville?
Total Male Population of Fayetteville is 1,509.
What is the Total Female Population of Fayetteville?
Total Female Population of Fayetteville is 1,381.
What is the Ratio of Males per 100 Females in Fayetteville?
There are 109.27 Males per 100 Females in Fayetteville.
What is the Ratio of Females per 100 Males in Fayetteville?
There are 91.52 Females per 100 Males in Fayetteville.
What is the Median Population Age in Fayetteville?
Median Population Age in Fayetteville is 44.8 Years.
What is the Average Family Size in Fayetteville
Average Family Size in Fayetteville is 2.9 People.
What is the Average Household Size in Fayetteville
Average Household Size in Fayetteville is 2.3 People.
How Large is the Labor Force in Fayetteville?
There are 1,112 People in the Labor Forcein in Fayetteville.
What is the Percentage of People in the Labor Force in Fayetteville?
47.8% of People are in the Labor Force in Fayetteville.
What is the Unemployment Rate in Fayetteville?
Unemployment Rate in Fayetteville is 3.5%.