Falling Waters, WV Map & Demographics
Falling Waters Map
Falling Waters Overview
$26,303
PER CAPITA INCOME
$57,596
AVG FAMILY INCOME
$84,038
AVG HOUSEHOLD INCOME
42.6%
WAGE / INCOME GAP [ % ]
57.4¢/ $1
WAGE / INCOME GAP [ $ ]
0.25
INEQUALITY / GINI INDEX
2,150
TOTAL POPULATION
1,414
MALE POPULATION
736
FEMALE POPULATION
192.12
MALES / 100 FEMALES
52.05
FEMALES / 100 MALES
32.2
MEDIAN AGE
3.5
AVG FAMILY SIZE
3.2
AVG HOUSEHOLD SIZE
1,119
LABOR FORCE [ PEOPLE ]
68.8%
PERCENT IN LABOR FORCE
12.0%
UNEMPLOYMENT RATE
Falling Waters Zip Codes
Income in Falling Waters
Income Overview in Falling Waters
Per Capita Income in Falling Waters is $26,303, while median incomes of families and households are $57,596 and $84,038 respectively.
| Characteristic | Number | Measure |
| Per Capita Income | 2,150 | $26,303 |
| Median Family Income | 433 | $57,596 |
| Mean Family Income | 433 | $71,079 |
| Median Household Income | 676 | $84,038 |
| Mean Household Income | 676 | $84,266 |
| Income Deficit | 433 | $0 |
| Wage / Income Gap (%) | 2,150 | 42.62% |
| Wage / Income Gap ($) | 2,150 | 57.38¢ per $1 |
| Gini / Inequality Index | 2,150 | 0.25 |
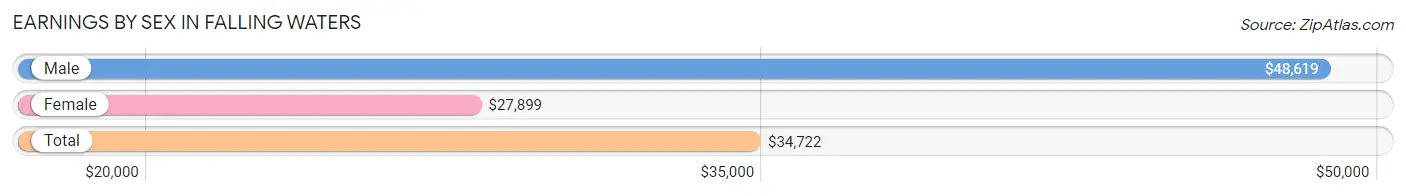
Earnings by Sex in Falling Waters
Average Earnings in Falling Waters are $34,722, $48,619 for men and $27,899 for women, a difference of 42.6%.
| Sex | Number | Average Earnings |
| Male | 771 (61.8%) | $48,619 |
| Female | 477 (38.2%) | $27,899 |
| Total | 1,248 (100.0%) | $34,722 |
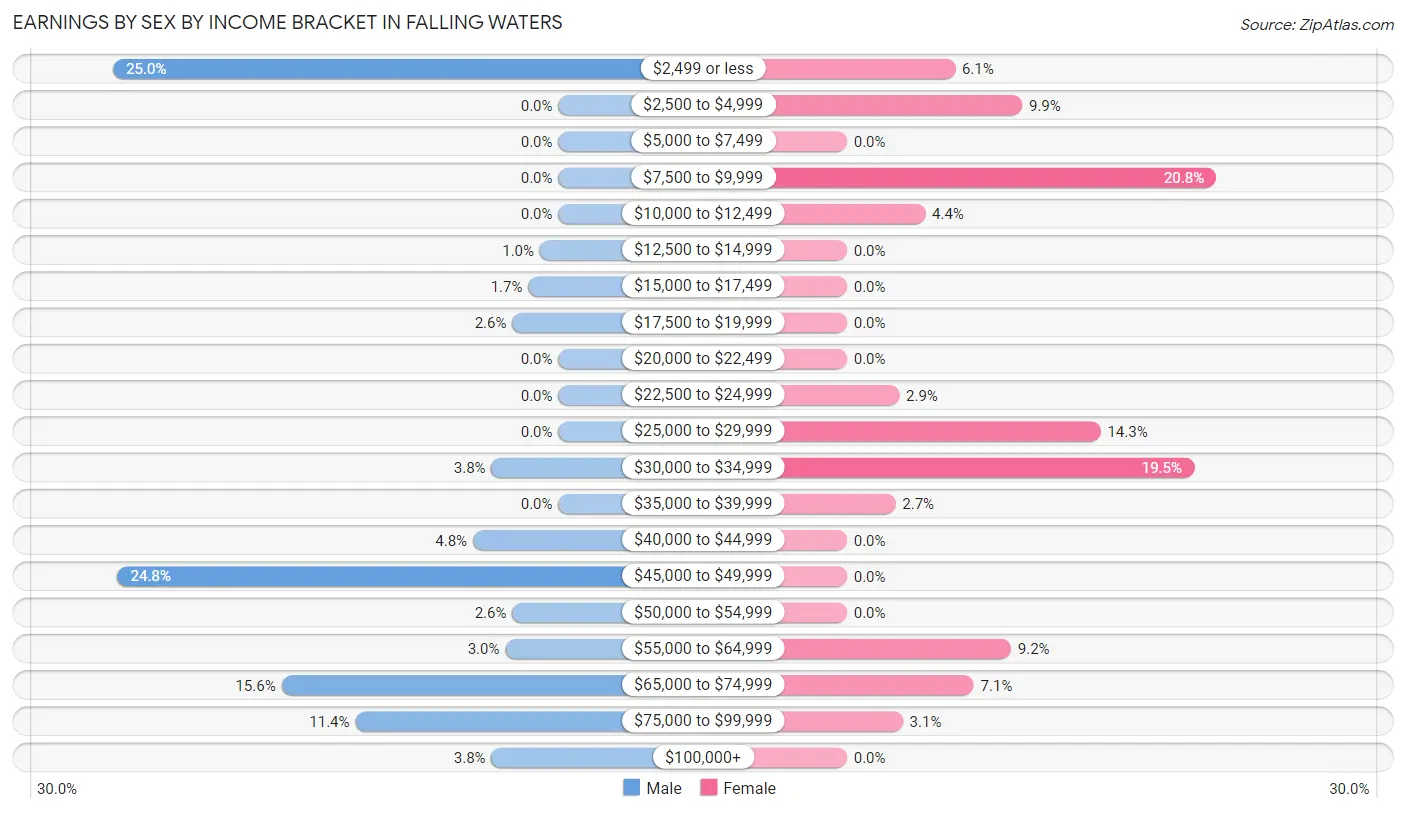
Earnings by Sex by Income Bracket in Falling Waters
The most common earnings brackets in Falling Waters are $2,499 or less for men (193 | 25.0%) and $7,500 to $9,999 for women (99 | 20.7%).
| Income | Male | Female |
| $2,499 or less | 193 (25.0%) | 29 (6.1%) |
| $2,500 to $4,999 | 0 (0.0%) | 47 (9.9%) |
| $5,000 to $7,499 | 0 (0.0%) | 0 (0.0%) |
| $7,500 to $9,999 | 0 (0.0%) | 99 (20.7%) |
| $10,000 to $12,499 | 0 (0.0%) | 21 (4.4%) |
| $12,500 to $14,999 | 8 (1.0%) | 0 (0.0%) |
| $15,000 to $17,499 | 13 (1.7%) | 0 (0.0%) |
| $17,500 to $19,999 | 20 (2.6%) | 0 (0.0%) |
| $20,000 to $22,499 | 0 (0.0%) | 0 (0.0%) |
| $22,500 to $24,999 | 0 (0.0%) | 14 (2.9%) |
| $25,000 to $29,999 | 0 (0.0%) | 68 (14.3%) |
| $30,000 to $34,999 | 29 (3.8%) | 93 (19.5%) |
| $35,000 to $39,999 | 0 (0.0%) | 13 (2.7%) |
| $40,000 to $44,999 | 37 (4.8%) | 0 (0.0%) |
| $45,000 to $49,999 | 191 (24.8%) | 0 (0.0%) |
| $50,000 to $54,999 | 20 (2.6%) | 0 (0.0%) |
| $55,000 to $64,999 | 23 (3.0%) | 44 (9.2%) |
| $65,000 to $74,999 | 120 (15.6%) | 34 (7.1%) |
| $75,000 to $99,999 | 88 (11.4%) | 15 (3.1%) |
| $100,000+ | 29 (3.8%) | 0 (0.0%) |
| Total | 771 (100.0%) | 477 (100.0%) |
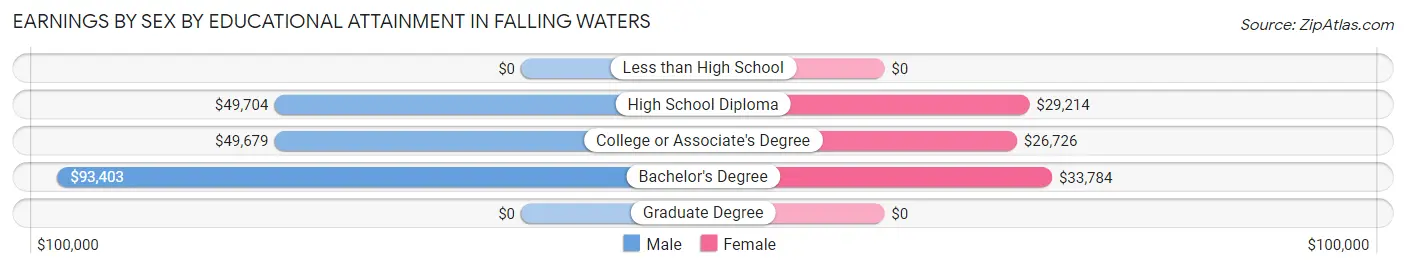
Earnings by Sex by Educational Attainment in Falling Waters
Average earnings in Falling Waters are $49,974 for men and $32,877 for women, a difference of 34.2%. Men with an educational attainment of bachelor's degree enjoy the highest average annual earnings of $93,403, while those with college or associate's degree education earn the least with $49,679. Women with an educational attainment of bachelor's degree earn the most with the average annual earnings of $33,784, while those with college or associate's degree education have the smallest earnings of $26,726.
| Educational Attainment | Male Income | Female Income |
| Less than High School | - | - |
| High School Diploma | $49,704 | $29,214 |
| College or Associate's Degree | $49,679 | $26,726 |
| Bachelor's Degree | $93,403 | $33,784 |
| Graduate Degree | - | - |
| Total | $49,974 | $32,877 |
Family Income in Falling Waters
Family Income Brackets in Falling Waters
According to the Falling Waters family income data, there are 189 families falling into the $50,000 to $74,999 income range, which is the most common income bracket and makes up 43.6% of all families.
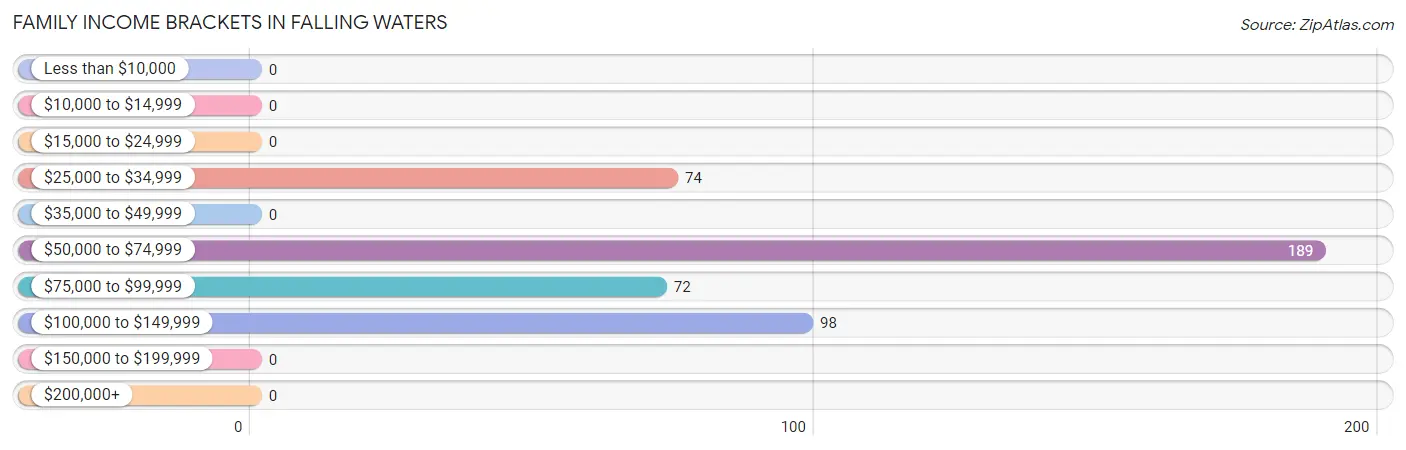
| Income Bracket | # Families | % Families |
| Less than $10,000 | 0 | 0.0% |
| $10,000 to $14,999 | 0 | 0.0% |
| $15,000 to $24,999 | 0 | 0.0% |
| $25,000 to $34,999 | 74 | 17.1% |
| $35,000 to $49,999 | 0 | 0.0% |
| $50,000 to $74,999 | 189 | 43.6% |
| $75,000 to $99,999 | 72 | 16.6% |
| $100,000 to $149,999 | 98 | 22.6% |
| $150,000 to $199,999 | 0 | 0.0% |
| $200,000+ | 0 | 0.0% |
Family Income by Famaliy Size in Falling Waters
4-person families (63 | 14.5%) account for the highest median family income in Falling Waters with $86,438 per family, while 2-person families (246 | 56.8%) have the highest median income of $25,870 per family member.
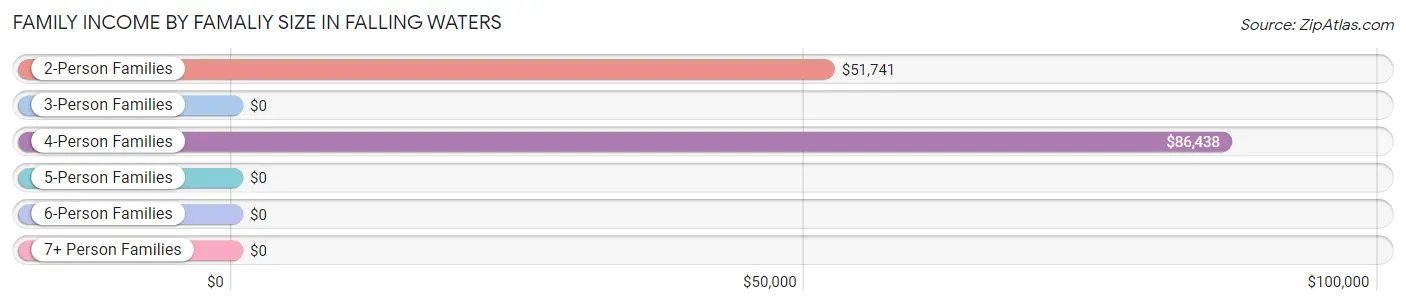
| Income Bracket | # Families | Median Income |
| 2-Person Families | 246 (56.8%) | $51,741 |
| 3-Person Families | 51 (11.8%) | $0 |
| 4-Person Families | 63 (14.5%) | $86,438 |
| 5-Person Families | 12 (2.8%) | $0 |
| 6-Person Families | 61 (14.1%) | $0 |
| 7+ Person Families | 0 (0.0%) | $0 |
| Total | 433 (100.0%) | $57,596 |
Family Income by Number of Earners in Falling Waters
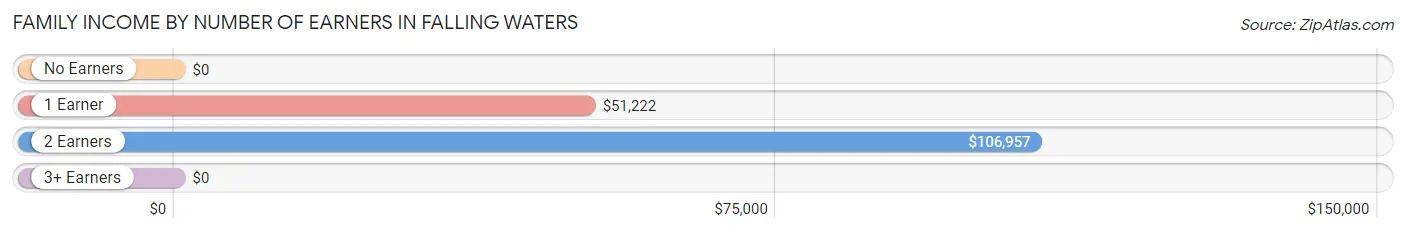
| Number of Earners | # Families | Median Income |
| No Earners | 40 (9.2%) | $0 |
| 1 Earner | 182 (42.0%) | $51,222 |
| 2 Earners | 150 (34.6%) | $106,957 |
| 3+ Earners | 61 (14.1%) | $0 |
| Total | 433 (100.0%) | $57,596 |
Household Income in Falling Waters
Household Income Brackets in Falling Waters
With 247 households falling in the category, the $75,000 to $99,999 income range is the most frequent in Falling Waters, accounting for 36.5% of all households.
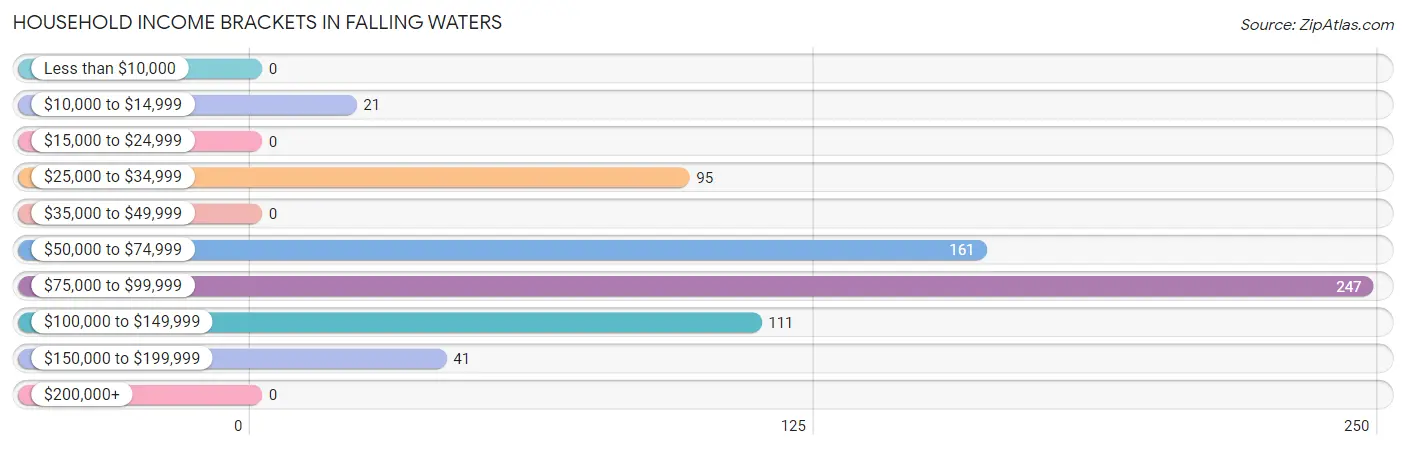
| Income Bracket | # Households | % Households |
| Less than $10,000 | 0 | 0.0% |
| $10,000 to $14,999 | 21 | 3.1% |
| $15,000 to $24,999 | 0 | 0.0% |
| $25,000 to $34,999 | 95 | 14.1% |
| $35,000 to $49,999 | 0 | 0.0% |
| $50,000 to $74,999 | 161 | 23.8% |
| $75,000 to $99,999 | 247 | 36.5% |
| $100,000 to $149,999 | 111 | 16.4% |
| $150,000 to $199,999 | 41 | 6.1% |
| $200,000+ | 0 | 0.0% |
Household Income by Householder Age in Falling Waters
The median household income in Falling Waters is $84,038, with the highest median household income of $93,028 found in the 25 to 44 years age bracket for the primary householder. A total of 369 households (54.6%) fall into this category.
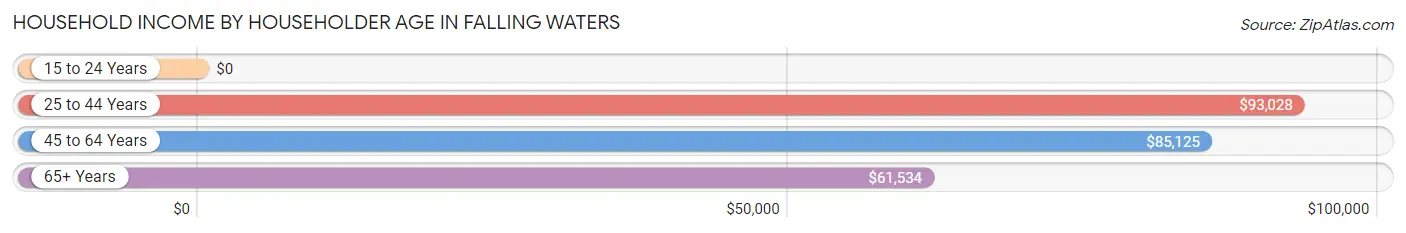
| Income Bracket | # Households | Median Income |
| 15 to 24 Years | 0 (0.0%) | $0 |
| 25 to 44 Years | 369 (54.6%) | $93,028 |
| 45 to 64 Years | 186 (27.5%) | $85,125 |
| 65+ Years | 121 (17.9%) | $61,534 |
| Total | 676 (100.0%) | $84,038 |
Poverty in Falling Waters
Income Below Poverty by Sex and Age in Falling Waters
With 2.1% poverty level for males and 19.7% for females among the residents of Falling Waters, 75 year old and over males and 18 to 24 year old females are the most vulnerable to poverty, with 11 males (50.0%) and 86 females (50.6%) in their respective age groups living below the poverty level.
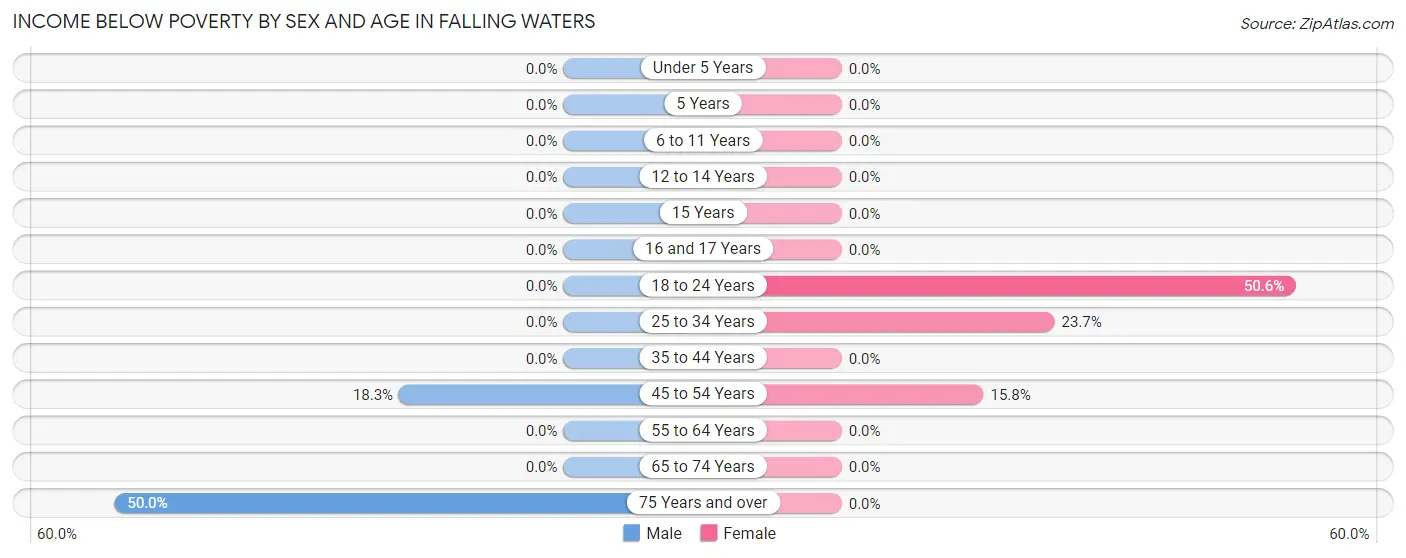
| Age Bracket | Male | Female |
| Under 5 Years | 0 (0.0%) | 0 (0.0%) |
| 5 Years | 0 (0.0%) | 0 (0.0%) |
| 6 to 11 Years | 0 (0.0%) | 0 (0.0%) |
| 12 to 14 Years | 0 (0.0%) | 0 (0.0%) |
| 15 Years | 0 (0.0%) | 0 (0.0%) |
| 16 and 17 Years | 0 (0.0%) | 0 (0.0%) |
| 18 to 24 Years | 0 (0.0%) | 86 (50.6%) |
| 25 to 34 Years | 0 (0.0%) | 50 (23.7%) |
| 35 to 44 Years | 0 (0.0%) | 0 (0.0%) |
| 45 to 54 Years | 13 (18.3%) | 9 (15.8%) |
| 55 to 64 Years | 0 (0.0%) | 0 (0.0%) |
| 65 to 74 Years | 0 (0.0%) | 0 (0.0%) |
| 75 Years and over | 11 (50.0%) | 0 (0.0%) |
| Total | 24 (2.1%) | 145 (19.7%) |
Income Above Poverty by Sex and Age in Falling Waters
According to the poverty statistics in Falling Waters, males aged under 5 years and females aged under 5 years are the age groups that are most secure financially, with 100.0% of males and 100.0% of females in these age groups living above the poverty line.
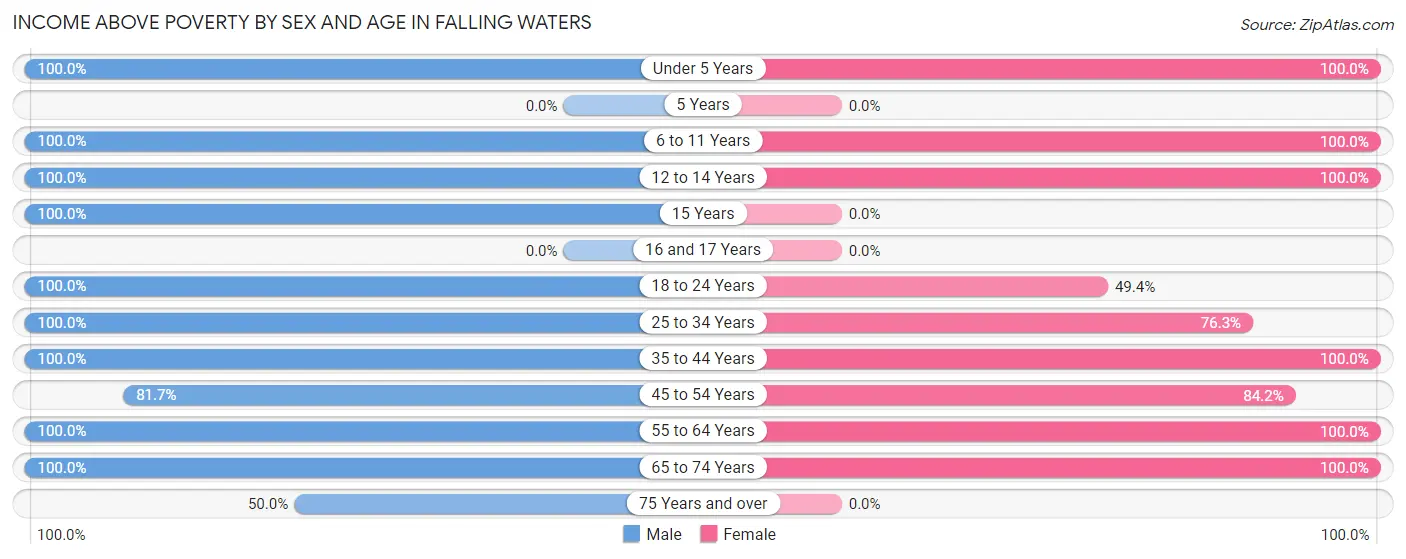
| Age Bracket | Male | Female |
| Under 5 Years | 131 (100.0%) | 32 (100.0%) |
| 5 Years | 0 (0.0%) | 0 (0.0%) |
| 6 to 11 Years | 58 (100.0%) | 13 (100.0%) |
| 12 to 14 Years | 13 (100.0%) | 8 (100.0%) |
| 15 Years | 22 (100.0%) | 0 (0.0%) |
| 16 and 17 Years | 0 (0.0%) | 0 (0.0%) |
| 18 to 24 Years | 207 (100.0%) | 84 (49.4%) |
| 25 to 34 Years | 302 (100.0%) | 161 (76.3%) |
| 35 to 44 Years | 133 (100.0%) | 34 (100.0%) |
| 45 to 54 Years | 58 (81.7%) | 48 (84.2%) |
| 55 to 64 Years | 90 (100.0%) | 103 (100.0%) |
| 65 to 74 Years | 118 (100.0%) | 108 (100.0%) |
| 75 Years and over | 11 (50.0%) | 0 (0.0%) |
| Total | 1,143 (97.9%) | 591 (80.3%) |
Income Below Poverty Among Married-Couple Families in Falling Waters
The poverty statistics for married-couple families in Falling Waters show that 3.3% or 9 of the total 270 families live below the poverty line. Families with no children have the highest poverty rate of 4.4%, comprising of 9 families. On the other hand, families with 1 or 2 children have the lowest poverty rate of 0.0%, which includes 0 families.
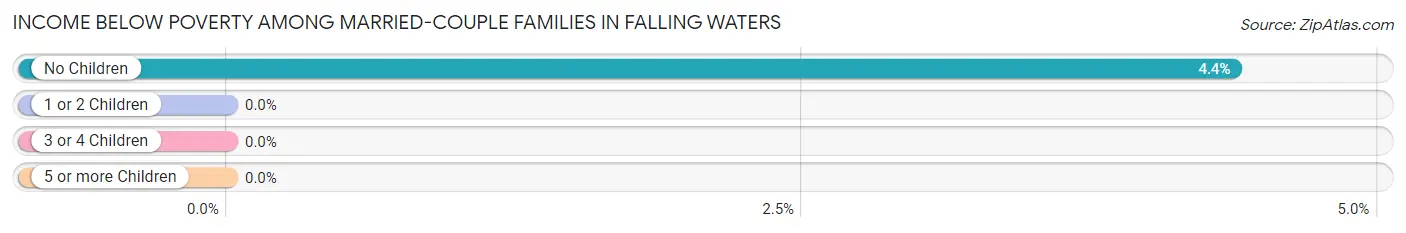
| Children | Above Poverty | Below Poverty |
| No Children | 197 (95.6%) | 9 (4.4%) |
| 1 or 2 Children | 52 (100.0%) | 0 (0.0%) |
| 3 or 4 Children | 12 (100.0%) | 0 (0.0%) |
| 5 or more Children | 0 (0.0%) | 0 (0.0%) |
| Total | 261 (96.7%) | 9 (3.3%) |
Income Below Poverty Among Single-Parent Households in Falling Waters
| Children | Single Father | Single Mother |
| No Children | 0 (0.0%) | 0 (0.0%) |
| 1 or 2 Children | 0 (0.0%) | 0 (0.0%) |
| 3 or 4 Children | 0 (0.0%) | 0 (0.0%) |
| 5 or more Children | 0 (0.0%) | 0 (0.0%) |
| Total | 0 (0.0%) | 0 (0.0%) |
Income Below Poverty Among Married-Couple vs Single-Parent Households in Falling Waters
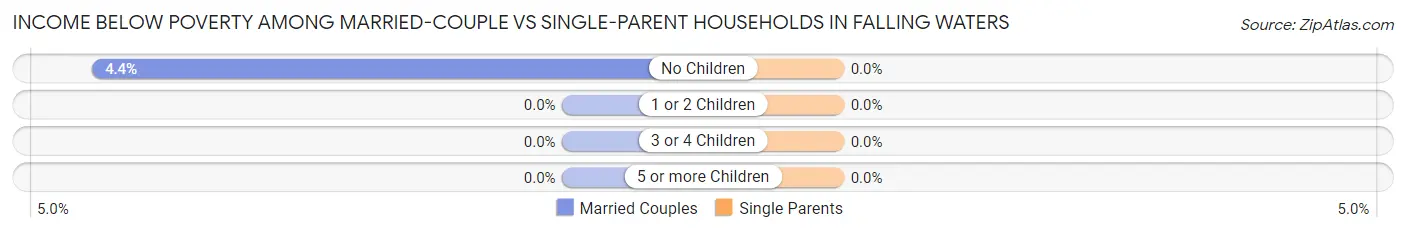
| Children | Married-Couple Families | Single-Parent Households |
| No Children | 9 (4.4%) | 0 (0.0%) |
| 1 or 2 Children | 0 (0.0%) | 0 (0.0%) |
| 3 or 4 Children | 0 (0.0%) | 0 (0.0%) |
| 5 or more Children | 0 (0.0%) | 0 (0.0%) |
| Total | 9 (3.3%) | 0 (0.0%) |
Race in Falling Waters
The most populous races in Falling Waters are White / Caucasian (1,974 | 91.8%), Black / African American (137 | 6.4%), and Two or more Races (39 | 1.8%).
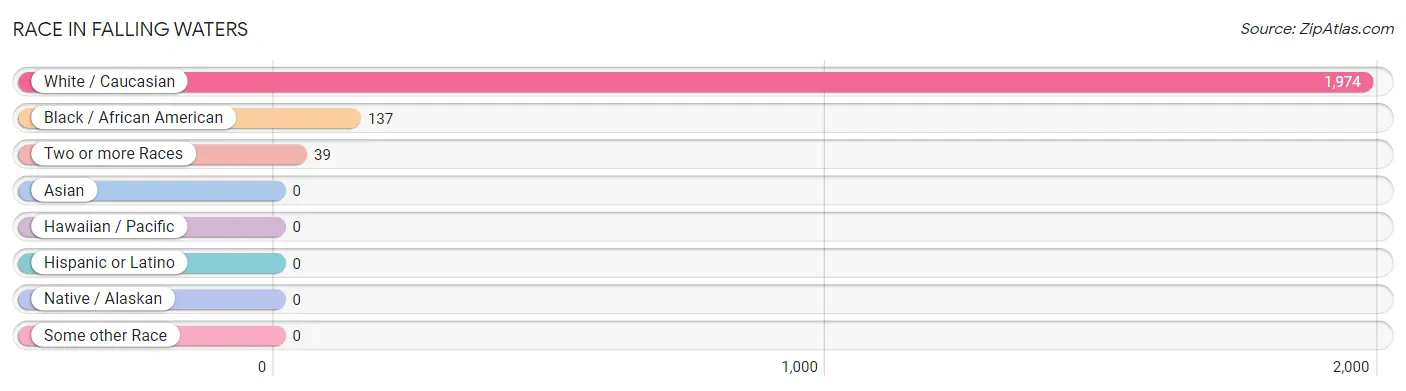
| Race | # Population | % Population |
| Asian | 0 | 0.0% |
| Black / African American | 137 | 6.4% |
| Hawaiian / Pacific | 0 | 0.0% |
| Hispanic or Latino | 0 | 0.0% |
| Native / Alaskan | 0 | 0.0% |
| White / Caucasian | 1,974 | 91.8% |
| Two or more Races | 39 | 1.8% |
| Some other Race | 0 | 0.0% |
| Total | 2,150 | 100.0% |
Ancestry in Falling Waters
The most populous ancestries reported in Falling Waters are English (481 | 22.4%), German (431 | 20.1%), Irish (256 | 11.9%), Italian (125 | 5.8%), and Scottish (62 | 2.9%), together accounting for 63.0% of all Falling Waters residents.
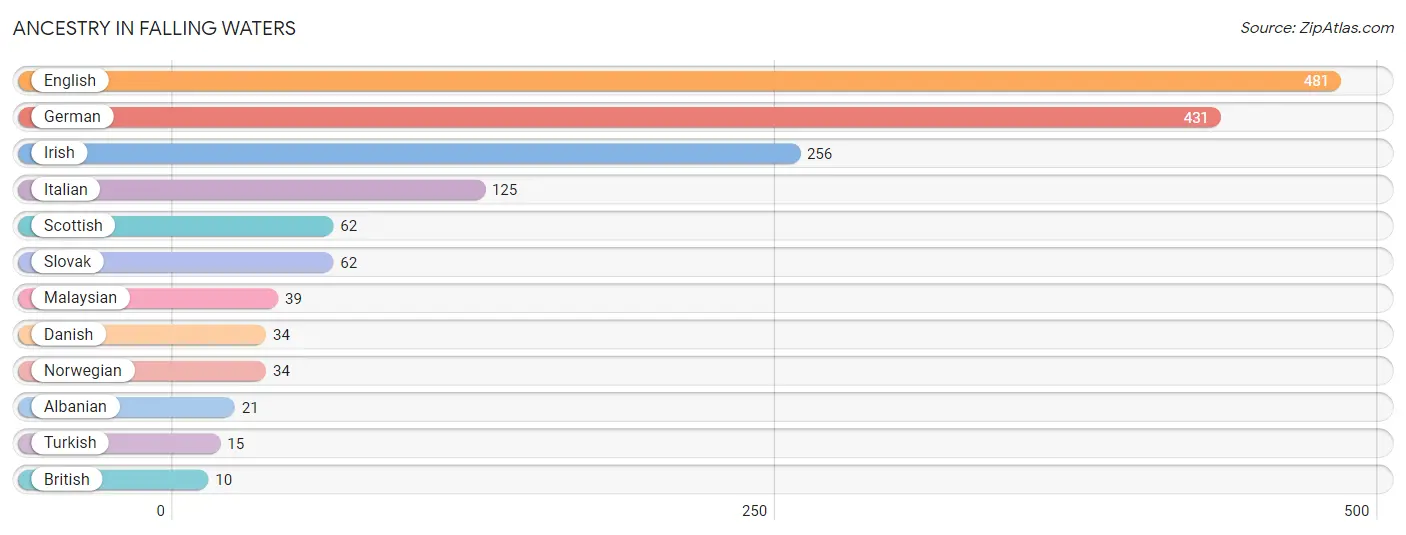
| Ancestry | # Population | % Population |
| Albanian | 21 | 1.0% |
| British | 10 | 0.5% |
| Danish | 34 | 1.6% |
| English | 481 | 22.4% |
| German | 431 | 20.1% |
| Irish | 256 | 11.9% |
| Italian | 125 | 5.8% |
| Malaysian | 39 | 1.8% |
| Norwegian | 34 | 1.6% |
| Scottish | 62 | 2.9% |
| Slovak | 62 | 2.9% |
| Turkish | 15 | 0.7% | View All 12 Rows |
Immigrants in Falling Waters
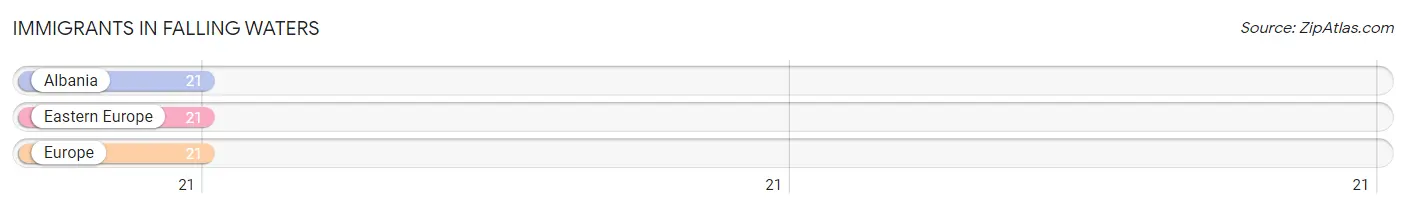
The most numerous immigrant groups reported in Falling Waters came from Albania (21 | 1.0%), Eastern Europe (21 | 1.0%), and Europe (21 | 1.0%), together accounting for 2.9% of all Falling Waters residents.
| Immigration Origin | # Population | % Population |
| Albania | 21 | 1.0% |
| Eastern Europe | 21 | 1.0% |
| Europe | 21 | 1.0% | View All 3 Rows |
Sex and Age in Falling Waters
Sex and Age in Falling Waters
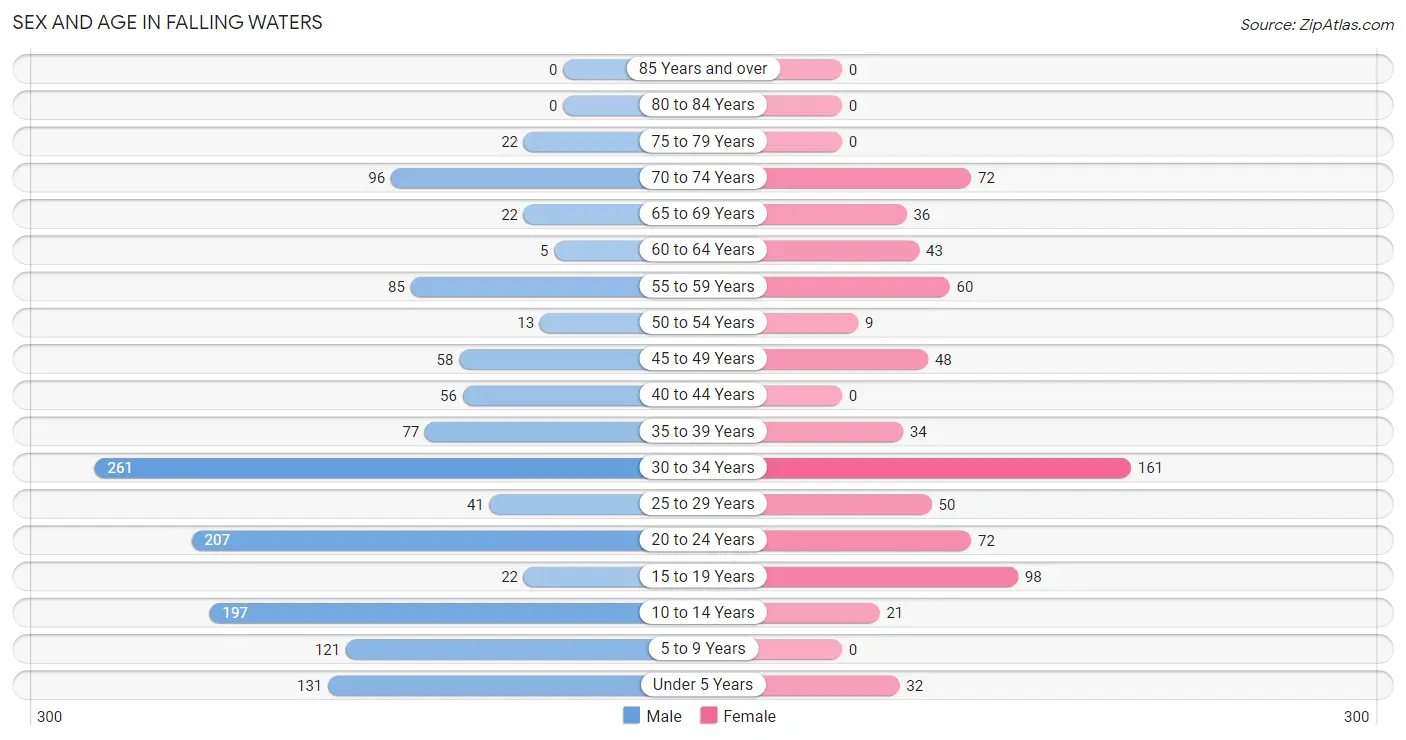
The most populous age groups in Falling Waters are 30 to 34 Years (261 | 18.5%) for men and 30 to 34 Years (161 | 21.9%) for women.
| Age Bracket | Male | Female |
| Under 5 Years | 131 (9.3%) | 32 (4.3%) |
| 5 to 9 Years | 121 (8.6%) | 0 (0.0%) |
| 10 to 14 Years | 197 (13.9%) | 21 (2.9%) |
| 15 to 19 Years | 22 (1.6%) | 98 (13.3%) |
| 20 to 24 Years | 207 (14.6%) | 72 (9.8%) |
| 25 to 29 Years | 41 (2.9%) | 50 (6.8%) |
| 30 to 34 Years | 261 (18.5%) | 161 (21.9%) |
| 35 to 39 Years | 77 (5.4%) | 34 (4.6%) |
| 40 to 44 Years | 56 (4.0%) | 0 (0.0%) |
| 45 to 49 Years | 58 (4.1%) | 48 (6.5%) |
| 50 to 54 Years | 13 (0.9%) | 9 (1.2%) |
| 55 to 59 Years | 85 (6.0%) | 60 (8.2%) |
| 60 to 64 Years | 5 (0.4%) | 43 (5.8%) |
| 65 to 69 Years | 22 (1.6%) | 36 (4.9%) |
| 70 to 74 Years | 96 (6.8%) | 72 (9.8%) |
| 75 to 79 Years | 22 (1.6%) | 0 (0.0%) |
| 80 to 84 Years | 0 (0.0%) | 0 (0.0%) |
| 85 Years and over | 0 (0.0%) | 0 (0.0%) |
| Total | 1,414 (100.0%) | 736 (100.0%) |
Families and Households in Falling Waters
Median Family Size in Falling Waters
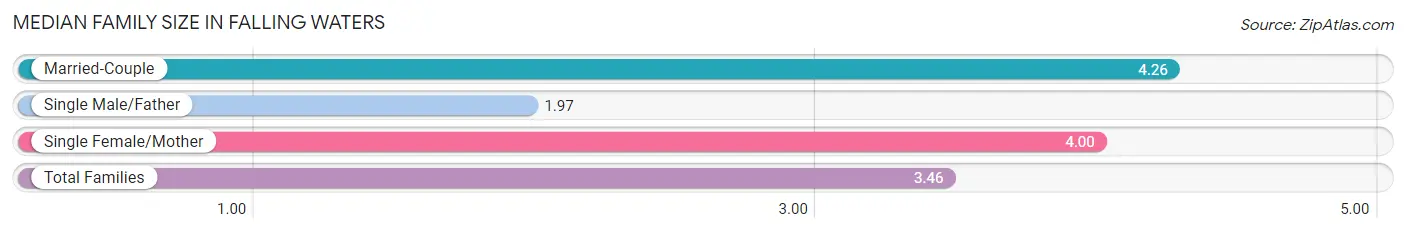
The median family size in Falling Waters is 3.46 persons per family, with married-couple families (270 | 62.4%) accounting for the largest median family size of 4.26 persons per family. On the other hand, single male/father families (150 | 34.6%) represent the smallest median family size with 1.97 persons per family.
| Family Type | # Families | Family Size |
| Married-Couple | 270 (62.4%) | 4.26 |
| Single Male/Father | 150 (34.6%) | 1.97 |
| Single Female/Mother | 13 (3.0%) | 4.00 |
| Total Families | 433 (100.0%) | 3.46 |
Median Household Size in Falling Waters
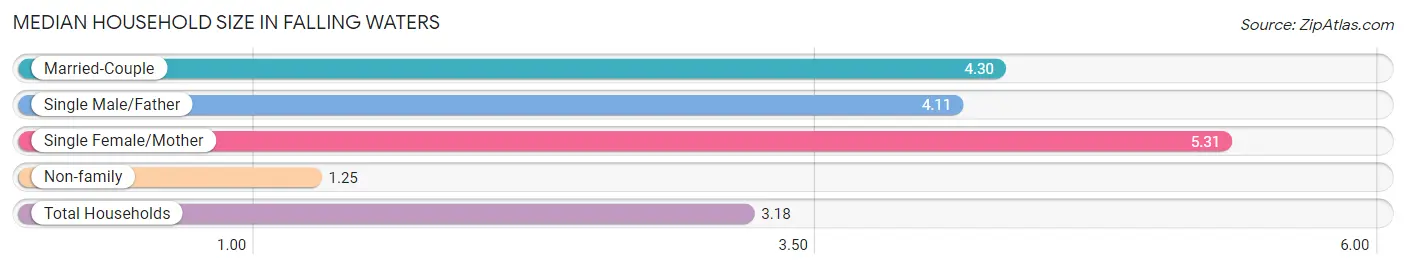
The median household size in Falling Waters is 3.18 persons per household, with single female/mother households (13 | 1.9%) accounting for the largest median household size of 5.31 persons per household. non-family households (243 | 35.9%) represent the smallest median household size with 1.25 persons per household.
| Household Type | # Households | Household Size |
| Married-Couple | 270 (39.9%) | 4.30 |
| Single Male/Father | 150 (22.2%) | 4.11 |
| Single Female/Mother | 13 (1.9%) | 5.31 |
| Non-family | 243 (35.9%) | 1.25 |
| Total Households | 676 (100.0%) | 3.18 |
Household Size by Marriage Status in Falling Waters
Out of a total of 676 households in Falling Waters, 433 (64.0%) are family households, while 243 (35.9%) are nonfamily households. The most numerous type of family households are 6-person households, comprising 196, and the most common type of nonfamily households are 1-person households, comprising 191.
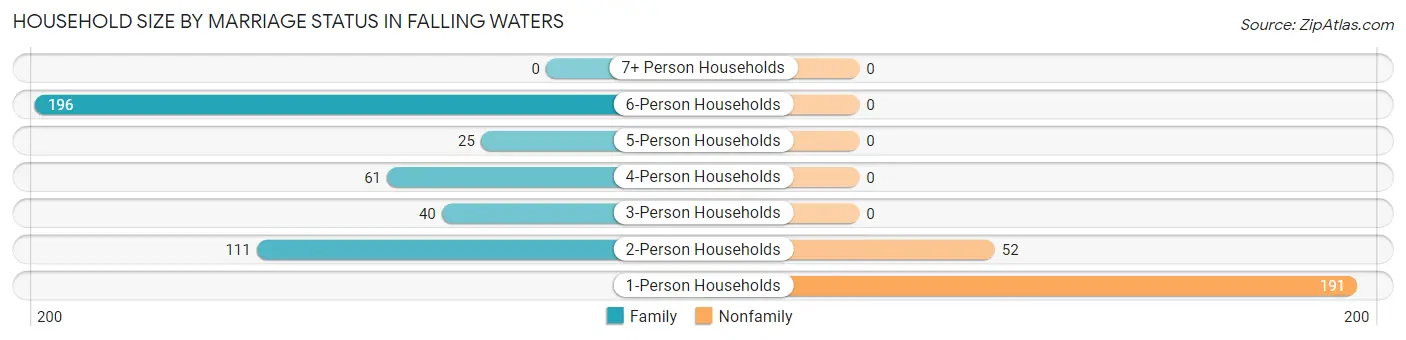
| Household Size | Family Households | Nonfamily Households |
| 1-Person Households | - | 191 (28.2%) |
| 2-Person Households | 111 (16.4%) | 52 (7.7%) |
| 3-Person Households | 40 (5.9%) | 0 (0.0%) |
| 4-Person Households | 61 (9.0%) | 0 (0.0%) |
| 5-Person Households | 25 (3.7%) | 0 (0.0%) |
| 6-Person Households | 196 (29.0%) | 0 (0.0%) |
| 7+ Person Households | 0 (0.0%) | 0 (0.0%) |
| Total | 433 (64.0%) | 243 (35.9%) |
Female Fertility in Falling Waters
Fertility by Age in Falling Waters
| Age Bracket | Women with Births | Births / 1,000 Women |
| 15 to 19 years | 0 (0.0%) | 0.0 |
| 20 to 34 years | 0 (0.0%) | 0.0 |
| 35 to 50 years | 0 (0.0%) | 0.0 |
| Total | 0 (0.0%) | 0.0 |
Fertility by Age by Marriage Status in Falling Waters
| Age Bracket | Married | Unmarried |
| 15 to 19 years | 0 (0.0%) | 0 (0.0%) |
| 20 to 34 years | 0 (0.0%) | 0 (0.0%) |
| 35 to 50 years | 0 (0.0%) | 0 (0.0%) |
| Total | 0 (0.0%) | 0 (0.0%) |
Fertility by Education in Falling Waters
| Educational Attainment | Women with Births | Births / 1,000 Women |
| Less than High School | 0 (0.0%) | 0.0 |
| High School Diploma | 0 (0.0%) | 0.0 |
| College or Associate's Degree | 0 (0.0%) | 0.0 |
| Bachelor's Degree | 0 (0.0%) | 0.0 |
| Graduate Degree | 0 (0.0%) | 0.0 |
| Total | 0 (0.0%) | 0.0 |
Fertility by Education by Marriage Status in Falling Waters
| Educational Attainment | Married | Unmarried |
| Less than High School | 0 (0.0%) | 0 (0.0%) |
| High School Diploma | 0 (0.0%) | 0 (0.0%) |
| College or Associate's Degree | 0 (0.0%) | 0 (0.0%) |
| Bachelor's Degree | 0 (0.0%) | 0 (0.0%) |
| Graduate Degree | 0 (0.0%) | 0 (0.0%) |
| Total | 0 (0.0%) | 0 (0.0%) |
Employment Characteristics in Falling Waters
Employment by Class of Employer in Falling Waters
Among the 985 employed individuals in Falling Waters, private company employees (583 | 59.2%), not-for-profit organizations (121 | 12.3%), and state government employees (118 | 12.0%) make up the most common classes of employment.
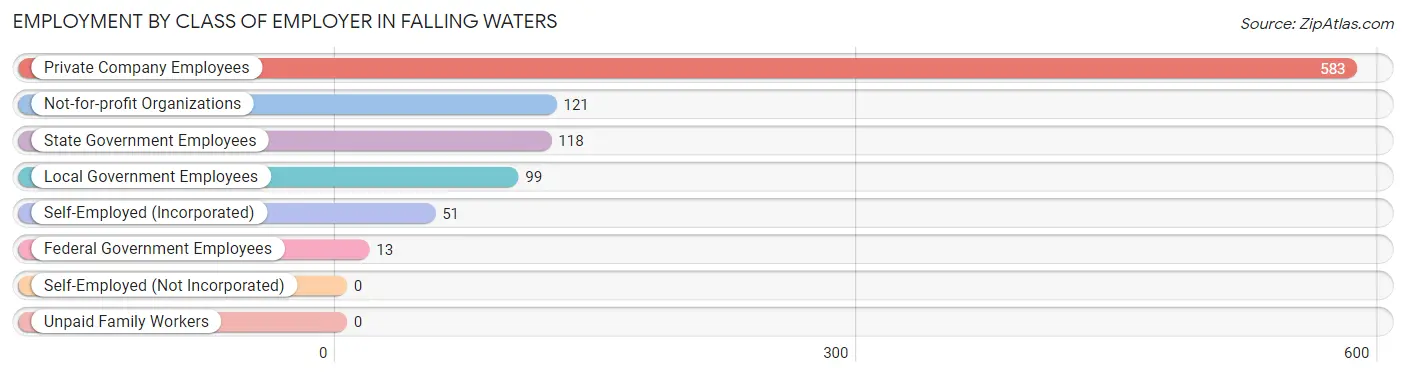
| Employer Class | # Employees | % Employees |
| Private Company Employees | 583 | 59.2% |
| Self-Employed (Incorporated) | 51 | 5.2% |
| Self-Employed (Not Incorporated) | 0 | 0.0% |
| Not-for-profit Organizations | 121 | 12.3% |
| Local Government Employees | 99 | 10.1% |
| State Government Employees | 118 | 12.0% |
| Federal Government Employees | 13 | 1.3% |
| Unpaid Family Workers | 0 | 0.0% |
| Total | 985 | 100.0% |
Employment Status by Age in Falling Waters
According to the labor force statistics for Falling Waters, out of the total population over 16 years of age (1,626), 68.8% or 1,119 individuals are in the labor force, with 12.0% or 134 of them unemployed. The age group with the highest labor force participation rate is 16 to 19 years, with 100.0% or 98 individuals in the labor force. Within the labor force, the 16 to 19 years age range has the highest percentage of unemployed individuals, with 71.4% or 70 of them being unemployed.
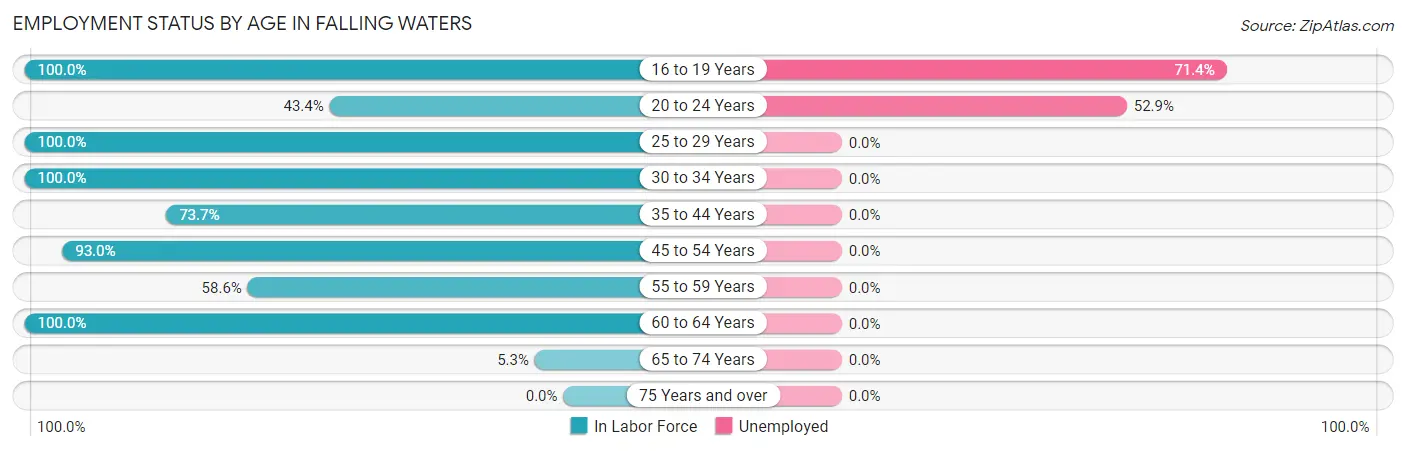
| Age Bracket | In Labor Force | Unemployed |
| 16 to 19 Years | 98 (100.0%) | 70 (71.4%) |
| 20 to 24 Years | 121 (43.4%) | 64 (52.9%) |
| 25 to 29 Years | 91 (100.0%) | 0 (0.0%) |
| 30 to 34 Years | 422 (100.0%) | 0 (0.0%) |
| 35 to 44 Years | 123 (73.7%) | 0 (0.0%) |
| 45 to 54 Years | 119 (93.0%) | 0 (0.0%) |
| 55 to 59 Years | 85 (58.6%) | 0 (0.0%) |
| 60 to 64 Years | 48 (100.0%) | 0 (0.0%) |
| 65 to 74 Years | 12 (5.3%) | 0 (0.0%) |
| 75 Years and over | 0 (0.0%) | 0 (0.0%) |
| Total | 1,119 (68.8%) | 134 (12.0%) |
Employment Status by Educational Attainment in Falling Waters
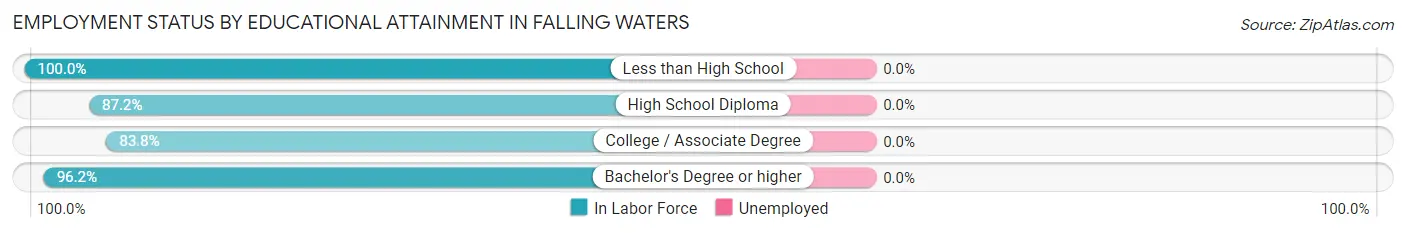
| Educational Attainment | In Labor Force | Unemployed |
| Less than High School | 29 (100.0%) | 0 (0.0%) |
| High School Diploma | 388 (87.2%) | 0 (0.0%) |
| College / Associate Degree | 243 (83.8%) | 0 (0.0%) |
| Bachelor's Degree or higher | 228 (96.2%) | 0 (0.0%) |
| Total | 888 (88.7%) | 0 (0.0%) |
Employment Occupations by Sex in Falling Waters
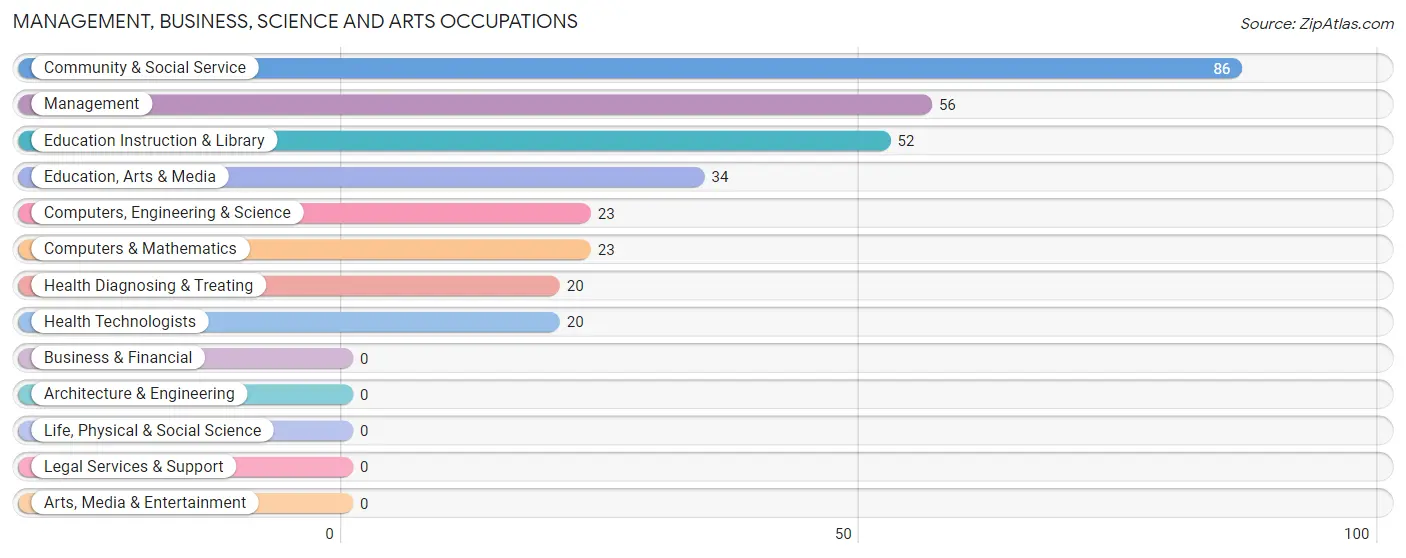
Management, Business, Science and Arts Occupations
The most common Management, Business, Science and Arts occupations in Falling Waters are Community & Social Service (86 | 8.7%), Management (56 | 5.7%), Education Instruction & Library (52 | 5.3%), Education, Arts & Media (34 | 3.5%), and Computers, Engineering & Science (23 | 2.3%).
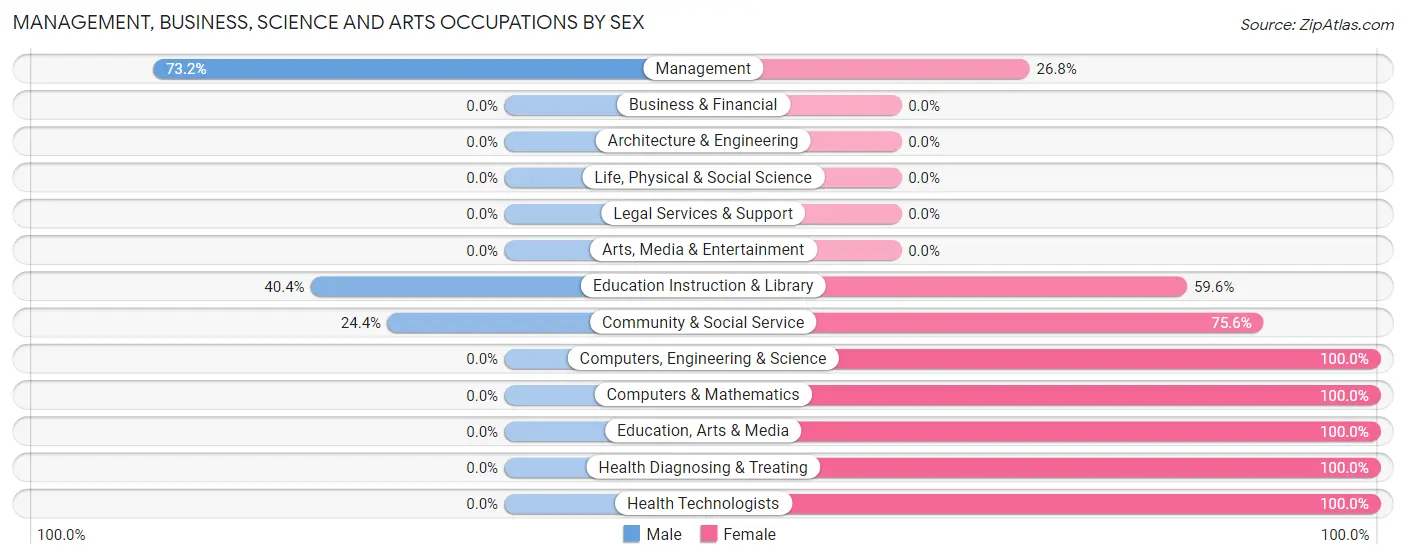
Management, Business, Science and Arts Occupations by Sex
Within the Management, Business, Science and Arts occupations in Falling Waters, the most male-oriented occupations are Management (73.2%), Education Instruction & Library (40.4%), and Community & Social Service (24.4%), while the most female-oriented occupations are Computers, Engineering & Science (100.0%), Computers & Mathematics (100.0%), and Education, Arts & Media (100.0%).
| Occupation | Male | Female |
| Management | 41 (73.2%) | 15 (26.8%) |
| Business & Financial | 0 (0.0%) | 0 (0.0%) |
| Computers, Engineering & Science | 0 (0.0%) | 23 (100.0%) |
| Computers & Mathematics | 0 (0.0%) | 23 (100.0%) |
| Architecture & Engineering | 0 (0.0%) | 0 (0.0%) |
| Life, Physical & Social Science | 0 (0.0%) | 0 (0.0%) |
| Community & Social Service | 21 (24.4%) | 65 (75.6%) |
| Education, Arts & Media | 0 (0.0%) | 34 (100.0%) |
| Legal Services & Support | 0 (0.0%) | 0 (0.0%) |
| Education Instruction & Library | 21 (40.4%) | 31 (59.6%) |
| Arts, Media & Entertainment | 0 (0.0%) | 0 (0.0%) |
| Health Diagnosing & Treating | 0 (0.0%) | 20 (100.0%) |
| Health Technologists | 0 (0.0%) | 20 (100.0%) |
| Total (Category) | 62 (33.5%) | 123 (66.5%) |
| Total (Overall) | 578 (58.7%) | 407 (41.3%) |
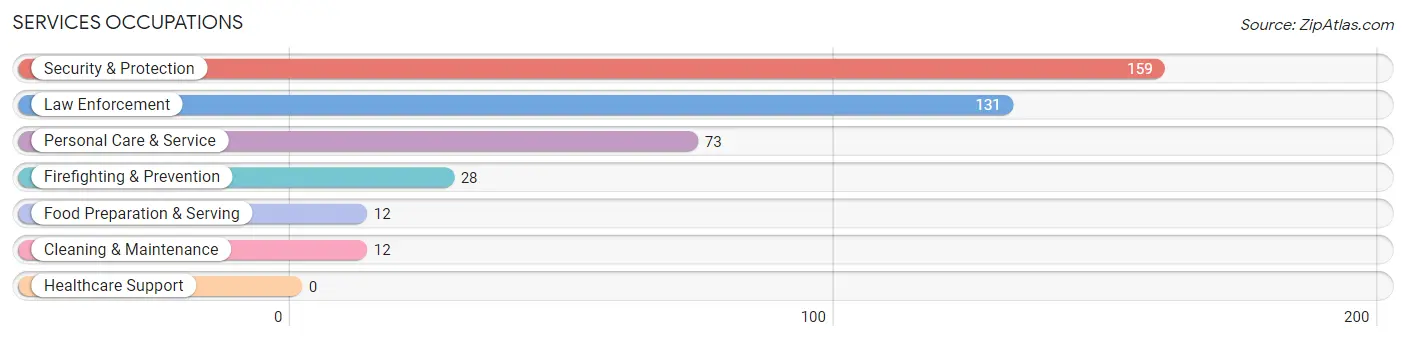
Services Occupations
The most common Services occupations in Falling Waters are Security & Protection (159 | 16.1%), Law Enforcement (131 | 13.3%), Personal Care & Service (73 | 7.4%), Firefighting & Prevention (28 | 2.8%), and Food Preparation & Serving (12 | 1.2%).
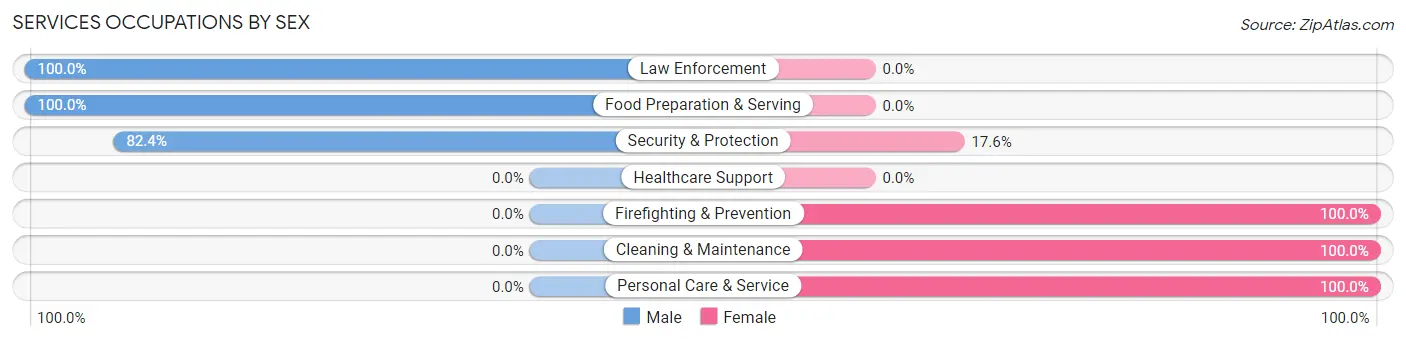
Services Occupations by Sex
Within the Services occupations in Falling Waters, the most male-oriented occupations are Law Enforcement (100.0%), Food Preparation & Serving (100.0%), and Security & Protection (82.4%), while the most female-oriented occupations are Firefighting & Prevention (100.0%), Cleaning & Maintenance (100.0%), and Personal Care & Service (100.0%).
| Occupation | Male | Female |
| Healthcare Support | 0 (0.0%) | 0 (0.0%) |
| Security & Protection | 131 (82.4%) | 28 (17.6%) |
| Firefighting & Prevention | 0 (0.0%) | 28 (100.0%) |
| Law Enforcement | 131 (100.0%) | 0 (0.0%) |
| Food Preparation & Serving | 12 (100.0%) | 0 (0.0%) |
| Cleaning & Maintenance | 0 (0.0%) | 12 (100.0%) |
| Personal Care & Service | 0 (0.0%) | 73 (100.0%) |
| Total (Category) | 143 (55.9%) | 113 (44.1%) |
| Total (Overall) | 578 (58.7%) | 407 (41.3%) |
Sales and Office Occupations
The most common Sales and Office occupations in Falling Waters are Sales & Related (96 | 9.8%), and Office & Administration (75 | 7.6%).
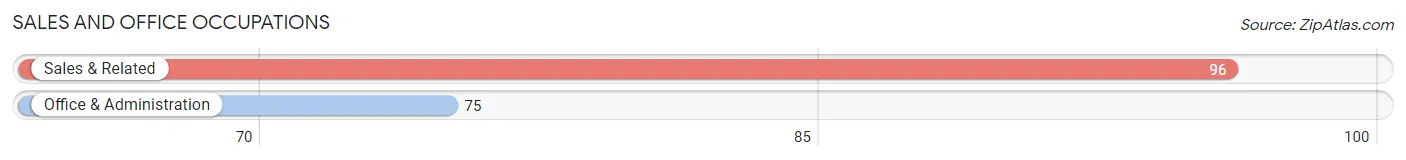
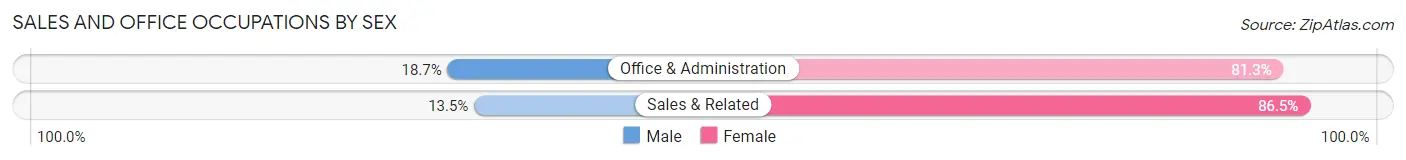
Sales and Office Occupations by Sex
| Occupation | Male | Female |
| Sales & Related | 13 (13.5%) | 83 (86.5%) |
| Office & Administration | 14 (18.7%) | 61 (81.3%) |
| Total (Category) | 27 (15.8%) | 144 (84.2%) |
| Total (Overall) | 578 (58.7%) | 407 (41.3%) |
Natural Resources, Construction and Maintenance Occupations
The most common Natural Resources, Construction and Maintenance occupations in Falling Waters are Installation, Maintenance & Repair (197 | 20.0%), and Construction & Extraction (20 | 2.0%).
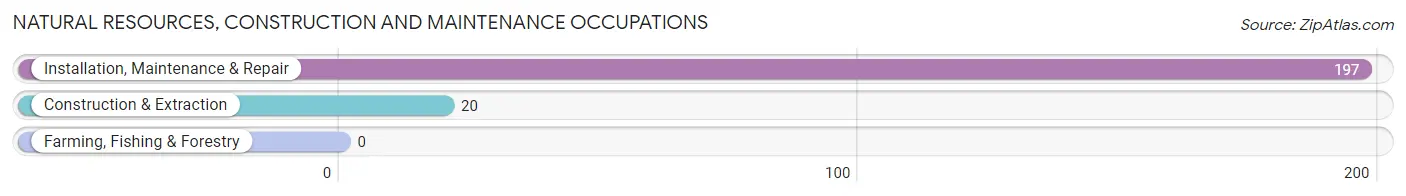
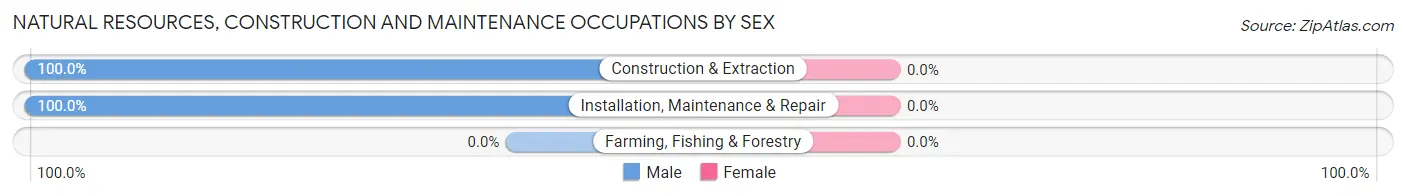
Natural Resources, Construction and Maintenance Occupations by Sex
| Occupation | Male | Female |
| Farming, Fishing & Forestry | 0 (0.0%) | 0 (0.0%) |
| Construction & Extraction | 20 (100.0%) | 0 (0.0%) |
| Installation, Maintenance & Repair | 197 (100.0%) | 0 (0.0%) |
| Total (Category) | 217 (100.0%) | 0 (0.0%) |
| Total (Overall) | 578 (58.7%) | 407 (41.3%) |
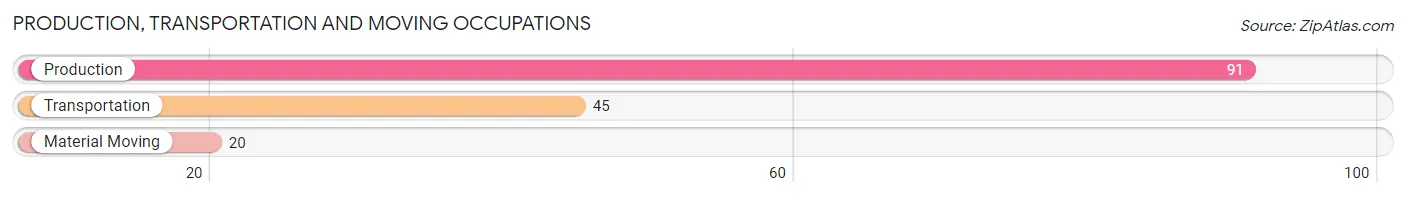
Production, Transportation and Moving Occupations
The most common Production, Transportation and Moving occupations in Falling Waters are Production (91 | 9.2%), Transportation (45 | 4.6%), and Material Moving (20 | 2.0%).
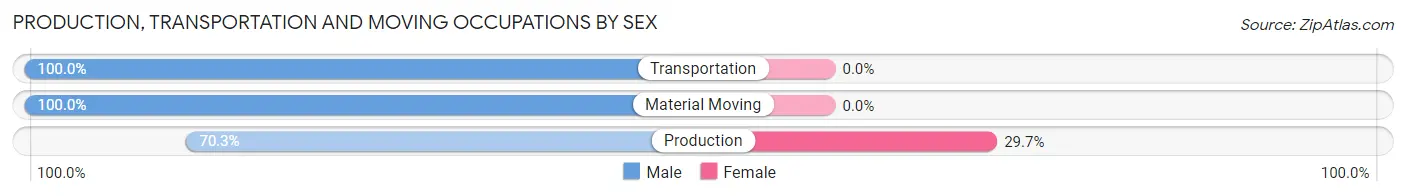
Production, Transportation and Moving Occupations by Sex
| Occupation | Male | Female |
| Production | 64 (70.3%) | 27 (29.7%) |
| Transportation | 45 (100.0%) | 0 (0.0%) |
| Material Moving | 20 (100.0%) | 0 (0.0%) |
| Total (Category) | 129 (82.7%) | 27 (17.3%) |
| Total (Overall) | 578 (58.7%) | 407 (41.3%) |
Employment Industries by Sex in Falling Waters
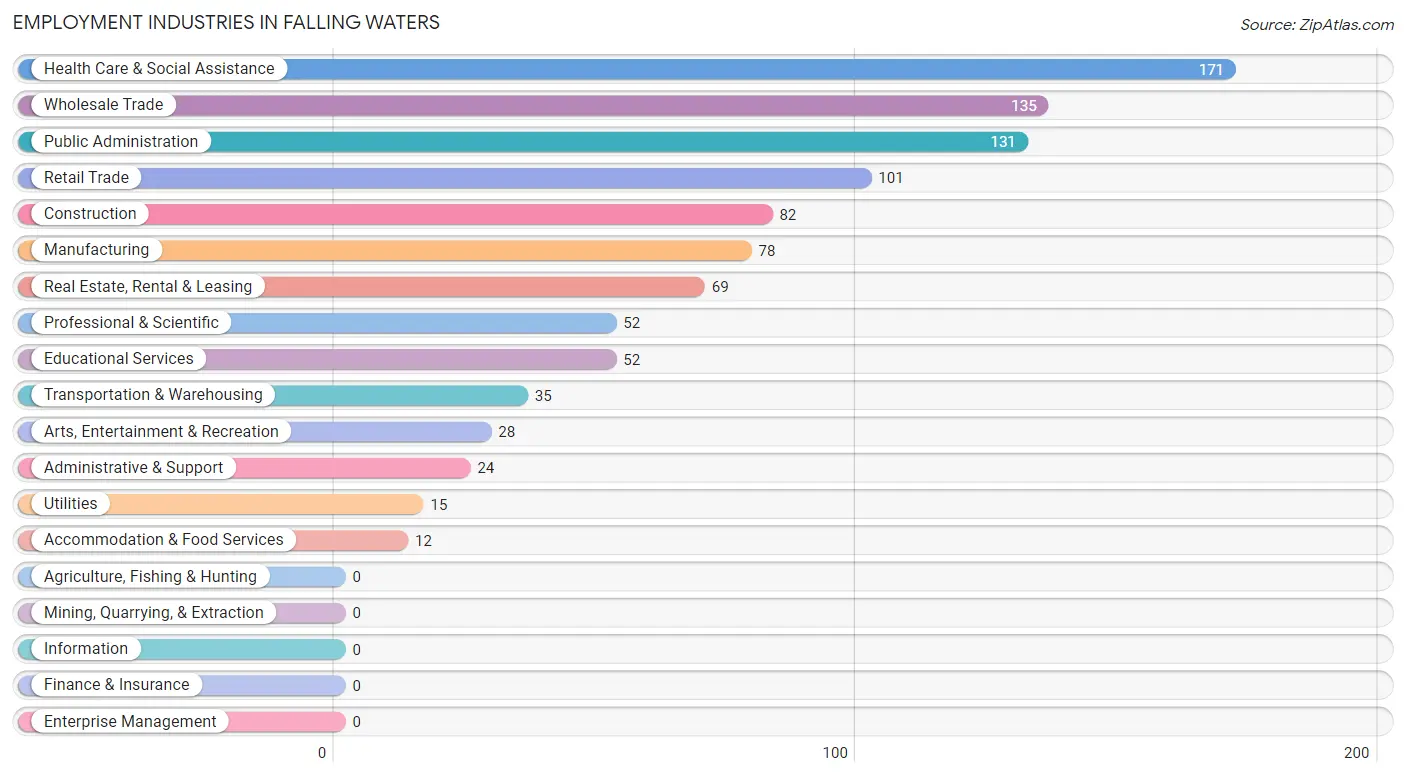
Employment Industries in Falling Waters
The major employment industries in Falling Waters include Health Care & Social Assistance (171 | 17.4%), Wholesale Trade (135 | 13.7%), Public Administration (131 | 13.3%), Retail Trade (101 | 10.2%), and Construction (82 | 8.3%).
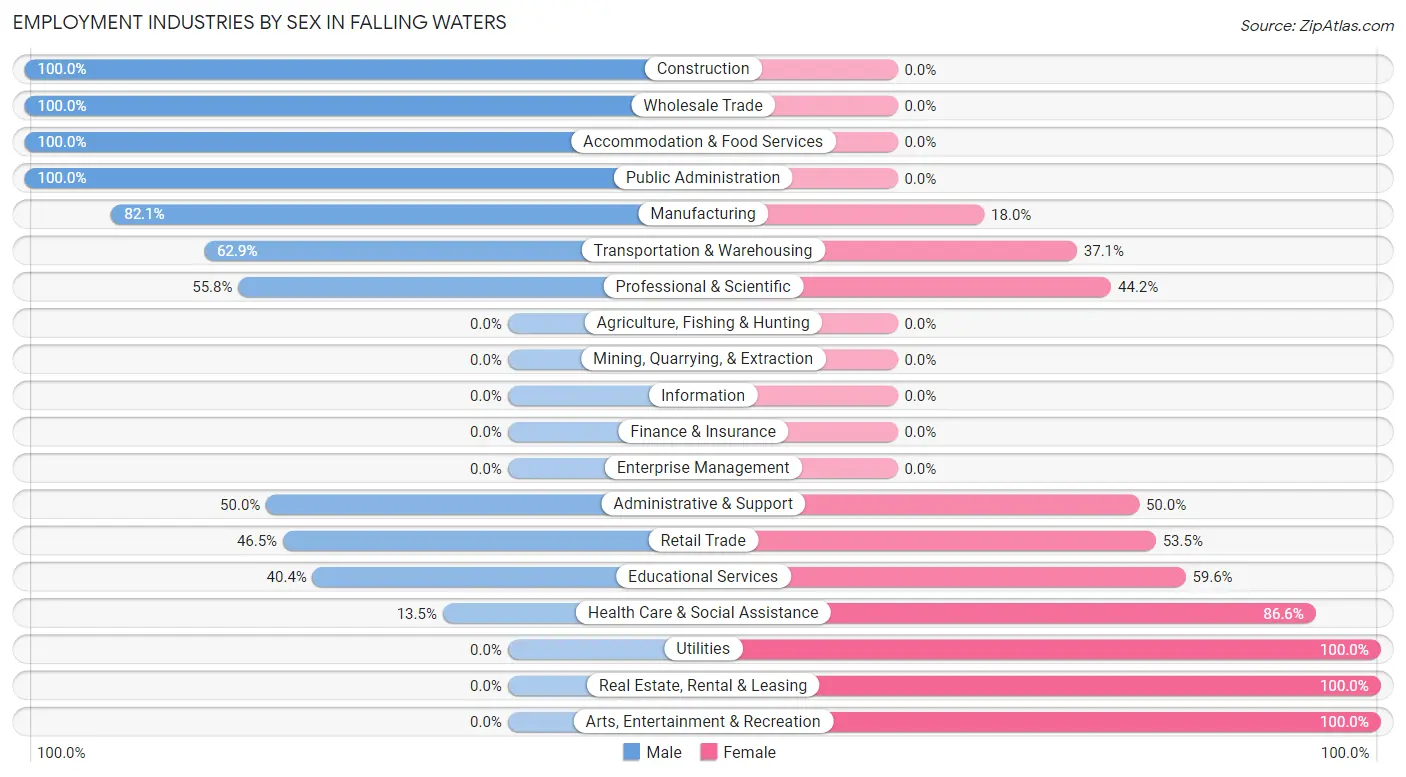
Employment Industries by Sex in Falling Waters
The Falling Waters industries that see more men than women are Construction (100.0%), Wholesale Trade (100.0%), and Accommodation & Food Services (100.0%), whereas the industries that tend to have a higher number of women are Utilities (100.0%), Real Estate, Rental & Leasing (100.0%), and Arts, Entertainment & Recreation (100.0%).
| Industry | Male | Female |
| Agriculture, Fishing & Hunting | 0 (0.0%) | 0 (0.0%) |
| Mining, Quarrying, & Extraction | 0 (0.0%) | 0 (0.0%) |
| Construction | 82 (100.0%) | 0 (0.0%) |
| Manufacturing | 64 (82.1%) | 14 (17.9%) |
| Wholesale Trade | 135 (100.0%) | 0 (0.0%) |
| Retail Trade | 47 (46.5%) | 54 (53.5%) |
| Transportation & Warehousing | 22 (62.9%) | 13 (37.1%) |
| Utilities | 0 (0.0%) | 15 (100.0%) |
| Information | 0 (0.0%) | 0 (0.0%) |
| Finance & Insurance | 0 (0.0%) | 0 (0.0%) |
| Real Estate, Rental & Leasing | 0 (0.0%) | 69 (100.0%) |
| Professional & Scientific | 29 (55.8%) | 23 (44.2%) |
| Enterprise Management | 0 (0.0%) | 0 (0.0%) |
| Administrative & Support | 12 (50.0%) | 12 (50.0%) |
| Educational Services | 21 (40.4%) | 31 (59.6%) |
| Health Care & Social Assistance | 23 (13.5%) | 148 (86.6%) |
| Arts, Entertainment & Recreation | 0 (0.0%) | 28 (100.0%) |
| Accommodation & Food Services | 12 (100.0%) | 0 (0.0%) |
| Public Administration | 131 (100.0%) | 0 (0.0%) |
| Total | 578 (58.7%) | 407 (41.3%) |
Education in Falling Waters
School Enrollment in Falling Waters
The most common levels of schooling among the 385 students in Falling Waters are middle school (210 | 54.5%), elementary school (104 | 27.0%), and college / undergraduate (49 | 12.7%).
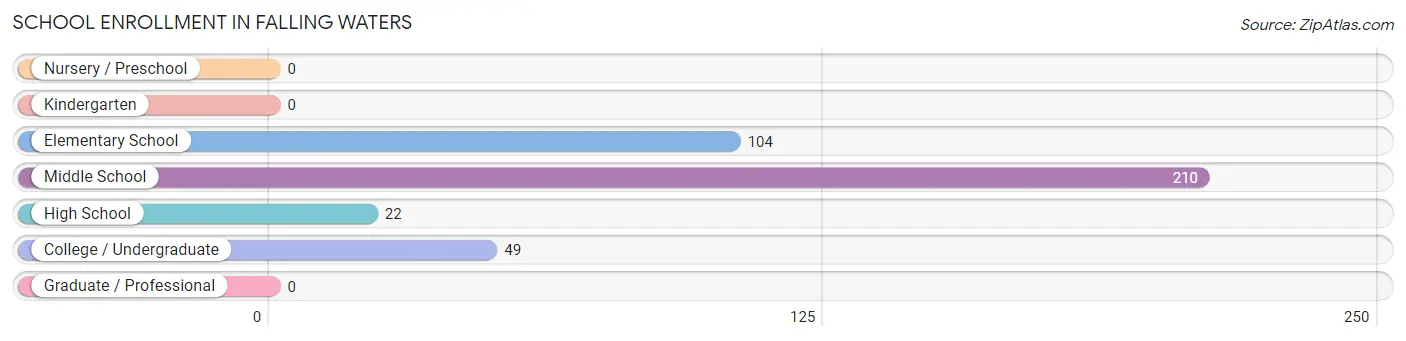
| School Level | # Students | % Students |
| Nursery / Preschool | 0 | 0.0% |
| Kindergarten | 0 | 0.0% |
| Elementary School | 104 | 27.0% |
| Middle School | 210 | 54.5% |
| High School | 22 | 5.7% |
| College / Undergraduate | 49 | 12.7% |
| Graduate / Professional | 0 | 0.0% |
| Total | 385 | 100.0% |
School Enrollment by Age by Funding Source in Falling Waters
Out of a total of 385 students who are enrolled in schools in Falling Waters, 21 (5.5%) attend a private institution, while the remaining 364 (94.5%) are enrolled in public schools. The age group of 25 to 34 year olds has the highest likelihood of being enrolled in private schools, with 21 (100.0% in the age bracket) enrolled. Conversely, the age group of 5 to 9 year old has the lowest likelihood of being enrolled in a private school, with 104 (100.0% in the age bracket) attending a public institution.
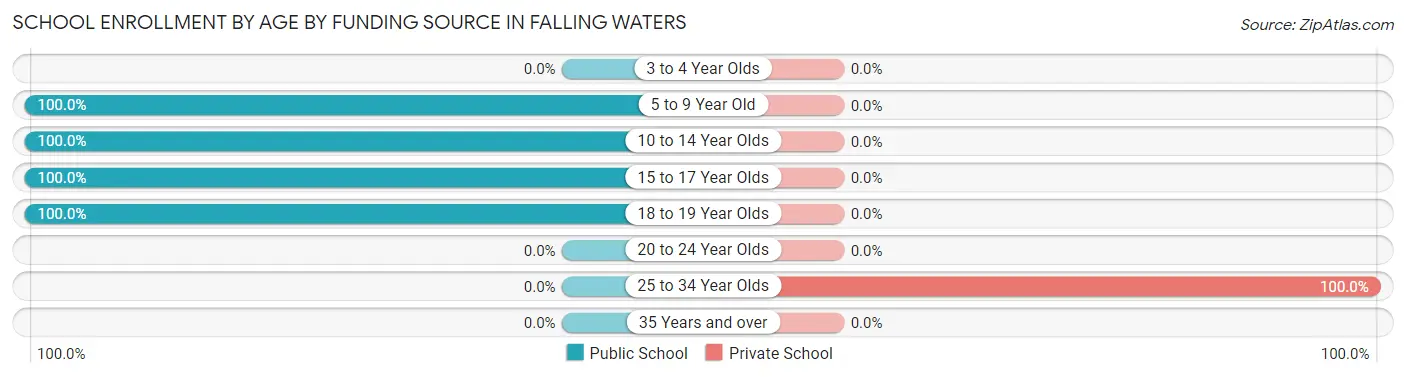
| Age Bracket | Public School | Private School |
| 3 to 4 Year Olds | 0 (0.0%) | 0 (0.0%) |
| 5 to 9 Year Old | 104 (100.0%) | 0 (0.0%) |
| 10 to 14 Year Olds | 210 (100.0%) | 0 (0.0%) |
| 15 to 17 Year Olds | 22 (100.0%) | 0 (0.0%) |
| 18 to 19 Year Olds | 28 (100.0%) | 0 (0.0%) |
| 20 to 24 Year Olds | 0 (0.0%) | 0 (0.0%) |
| 25 to 34 Year Olds | 0 (0.0%) | 21 (100.0%) |
| 35 Years and over | 0 (0.0%) | 0 (0.0%) |
| Total | 364 (94.5%) | 21 (5.5%) |
Educational Attainment by Field of Study in Falling Waters
Science & technology (123 | 36.3%), arts & humanities (107 | 31.6%), computers & mathematics (29 | 8.6%), business (22 | 6.5%), and education (21 | 6.2%) are the most common fields of study among 339 individuals in Falling Waters who have obtained a bachelor's degree or higher.
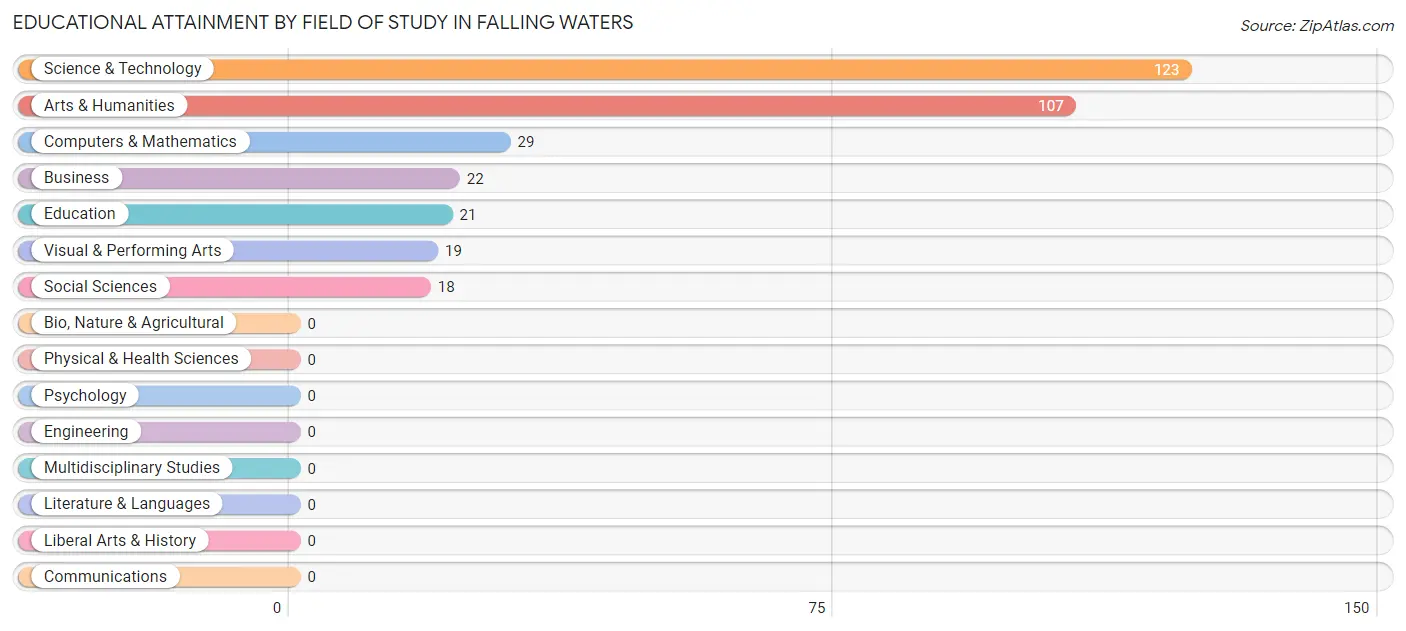
| Field of Study | # Graduates | % Graduates |
| Computers & Mathematics | 29 | 8.6% |
| Bio, Nature & Agricultural | 0 | 0.0% |
| Physical & Health Sciences | 0 | 0.0% |
| Psychology | 0 | 0.0% |
| Social Sciences | 18 | 5.3% |
| Engineering | 0 | 0.0% |
| Multidisciplinary Studies | 0 | 0.0% |
| Science & Technology | 123 | 36.3% |
| Business | 22 | 6.5% |
| Education | 21 | 6.2% |
| Literature & Languages | 0 | 0.0% |
| Liberal Arts & History | 0 | 0.0% |
| Visual & Performing Arts | 19 | 5.6% |
| Communications | 0 | 0.0% |
| Arts & Humanities | 107 | 31.6% |
| Total | 339 | 100.0% |
Transportation & Commute in Falling Waters
Vehicle Availability by Sex in Falling Waters
The most prevalent vehicle ownership categories in Falling Waters are males with 2 vehicles (238, accounting for 41.2%) and females with 2 vehicles (176, making up 58.5%).
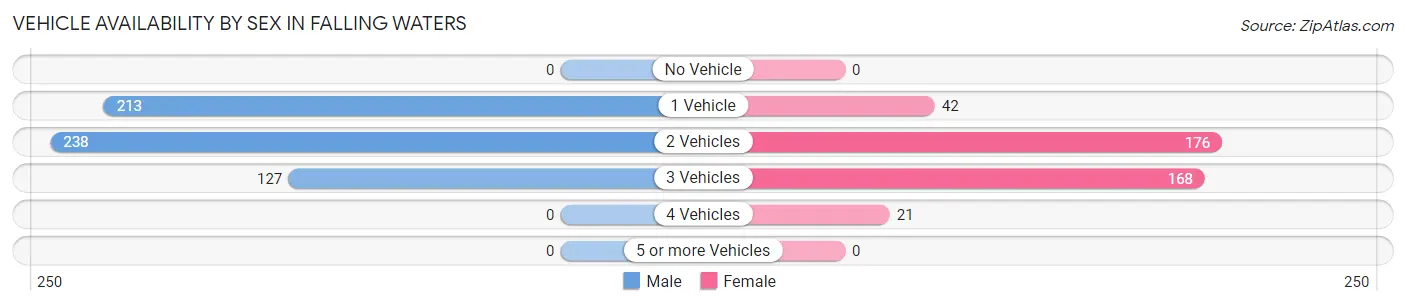
| Vehicles Available | Male | Female |
| No Vehicle | 0 (0.0%) | 0 (0.0%) |
| 1 Vehicle | 213 (36.8%) | 42 (10.3%) |
| 2 Vehicles | 238 (41.2%) | 176 (43.2%) |
| 3 Vehicles | 127 (22.0%) | 168 (41.3%) |
| 4 Vehicles | 0 (0.0%) | 21 (5.2%) |
| 5 or more Vehicles | 0 (0.0%) | 0 (0.0%) |
| Total | 578 (100.0%) | 407 (100.0%) |
Commute Time in Falling Waters
The most frequently occuring commute durations in Falling Waters are 20 to 24 minutes (313 commuters, 34.9%), 10 to 14 minutes (125 commuters, 13.9%), and 15 to 19 minutes (99 commuters, 11.0%).
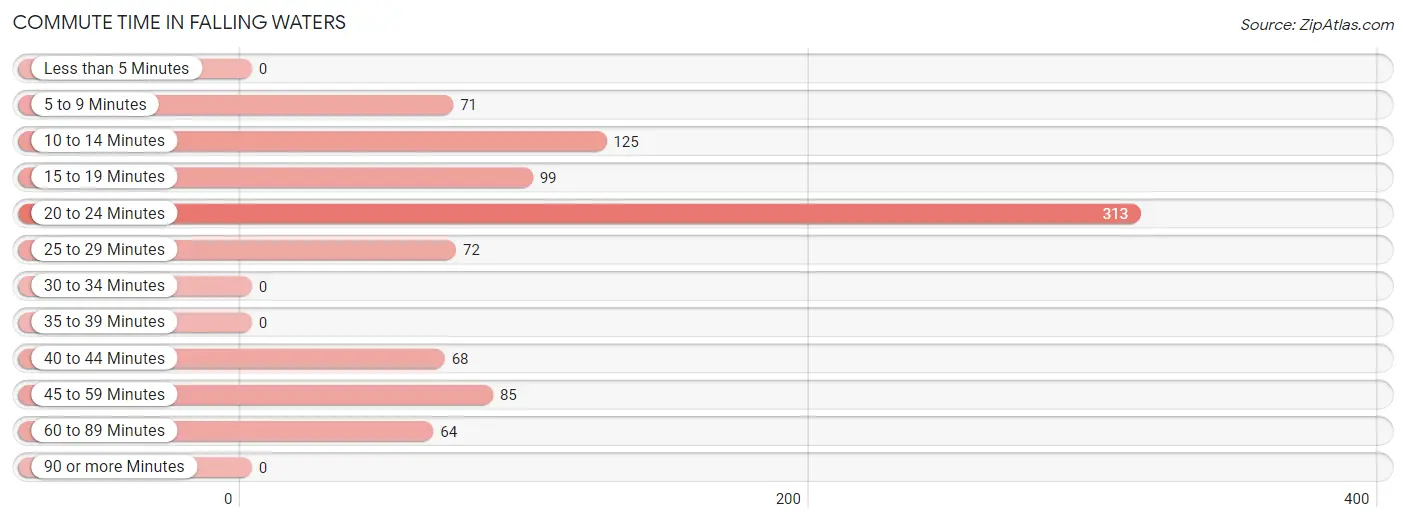
| Commute Time | # Commuters | % Commuters |
| Less than 5 Minutes | 0 | 0.0% |
| 5 to 9 Minutes | 71 | 7.9% |
| 10 to 14 Minutes | 125 | 13.9% |
| 15 to 19 Minutes | 99 | 11.0% |
| 20 to 24 Minutes | 313 | 34.9% |
| 25 to 29 Minutes | 72 | 8.0% |
| 30 to 34 Minutes | 0 | 0.0% |
| 35 to 39 Minutes | 0 | 0.0% |
| 40 to 44 Minutes | 68 | 7.6% |
| 45 to 59 Minutes | 85 | 9.5% |
| 60 to 89 Minutes | 64 | 7.1% |
| 90 or more Minutes | 0 | 0.0% |
Commute Time by Sex in Falling Waters
The most common commute times in Falling Waters are 20 to 24 minutes (208 commuters, 37.9%) for males and 20 to 24 minutes (105 commuters, 30.2%) for females.
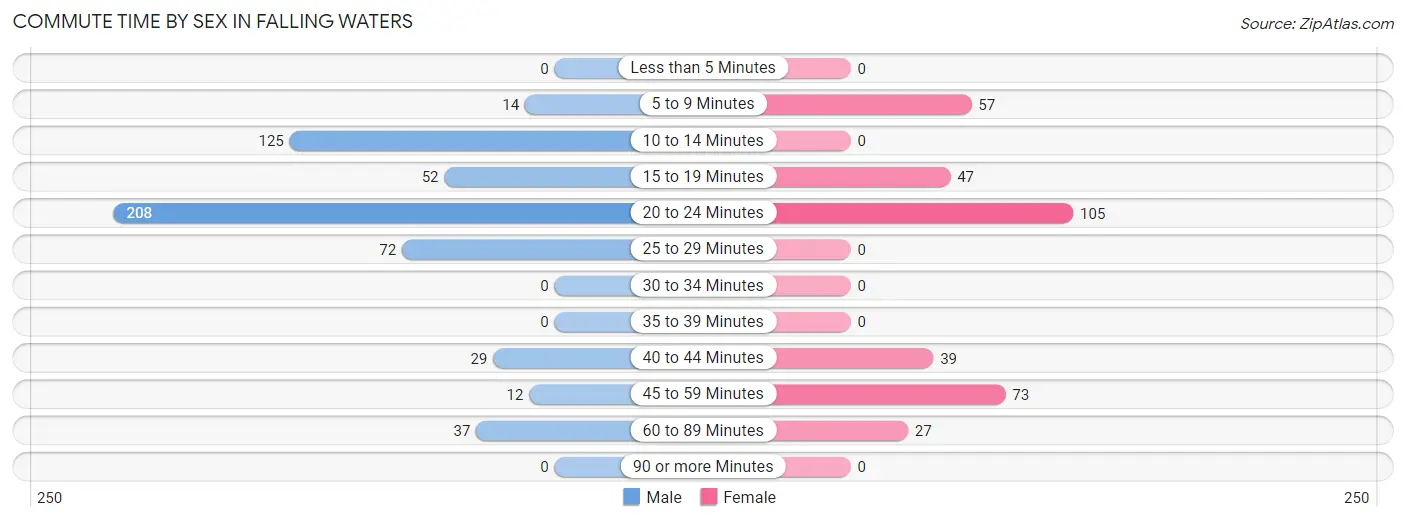
| Commute Time | Male | Female |
| Less than 5 Minutes | 0 (0.0%) | 0 (0.0%) |
| 5 to 9 Minutes | 14 (2.5%) | 57 (16.4%) |
| 10 to 14 Minutes | 125 (22.8%) | 0 (0.0%) |
| 15 to 19 Minutes | 52 (9.5%) | 47 (13.5%) |
| 20 to 24 Minutes | 208 (37.9%) | 105 (30.2%) |
| 25 to 29 Minutes | 72 (13.1%) | 0 (0.0%) |
| 30 to 34 Minutes | 0 (0.0%) | 0 (0.0%) |
| 35 to 39 Minutes | 0 (0.0%) | 0 (0.0%) |
| 40 to 44 Minutes | 29 (5.3%) | 39 (11.2%) |
| 45 to 59 Minutes | 12 (2.2%) | 73 (21.0%) |
| 60 to 89 Minutes | 37 (6.7%) | 27 (7.8%) |
| 90 or more Minutes | 0 (0.0%) | 0 (0.0%) |
Time of Departure to Work by Sex in Falling Waters
The most frequent times of departure to work in Falling Waters are 4:00 PM to 11:59 PM (174, 31.7%) for males and 7:00 AM to 7:29 AM (87, 25.0%) for females.
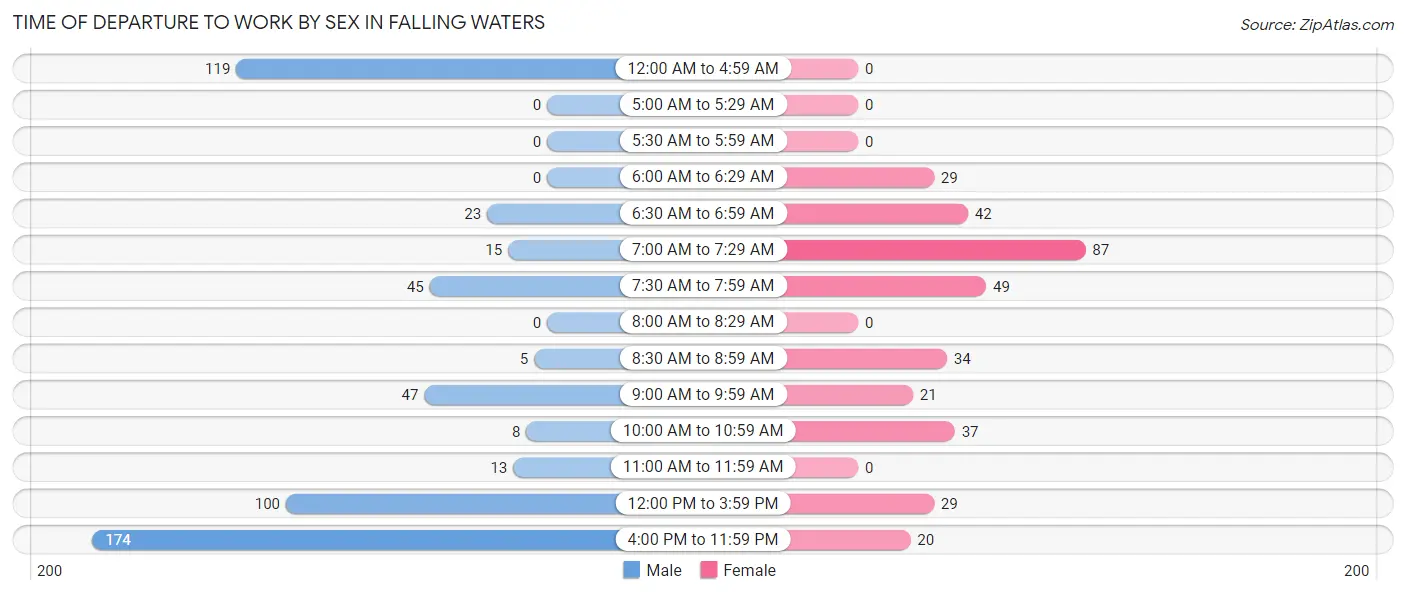
| Time of Departure | Male | Female |
| 12:00 AM to 4:59 AM | 119 (21.7%) | 0 (0.0%) |
| 5:00 AM to 5:29 AM | 0 (0.0%) | 0 (0.0%) |
| 5:30 AM to 5:59 AM | 0 (0.0%) | 0 (0.0%) |
| 6:00 AM to 6:29 AM | 0 (0.0%) | 29 (8.3%) |
| 6:30 AM to 6:59 AM | 23 (4.2%) | 42 (12.1%) |
| 7:00 AM to 7:29 AM | 15 (2.7%) | 87 (25.0%) |
| 7:30 AM to 7:59 AM | 45 (8.2%) | 49 (14.1%) |
| 8:00 AM to 8:29 AM | 0 (0.0%) | 0 (0.0%) |
| 8:30 AM to 8:59 AM | 5 (0.9%) | 34 (9.8%) |
| 9:00 AM to 9:59 AM | 47 (8.6%) | 21 (6.0%) |
| 10:00 AM to 10:59 AM | 8 (1.5%) | 37 (10.6%) |
| 11:00 AM to 11:59 AM | 13 (2.4%) | 0 (0.0%) |
| 12:00 PM to 3:59 PM | 100 (18.2%) | 29 (8.3%) |
| 4:00 PM to 11:59 PM | 174 (31.7%) | 20 (5.8%) |
| Total | 549 (100.0%) | 348 (100.0%) |
Housing Occupancy in Falling Waters
Occupancy by Ownership in Falling Waters
Of the total 676 dwellings in Falling Waters, owner-occupied units account for 384 (56.8%), while renter-occupied units make up 292 (43.2%).
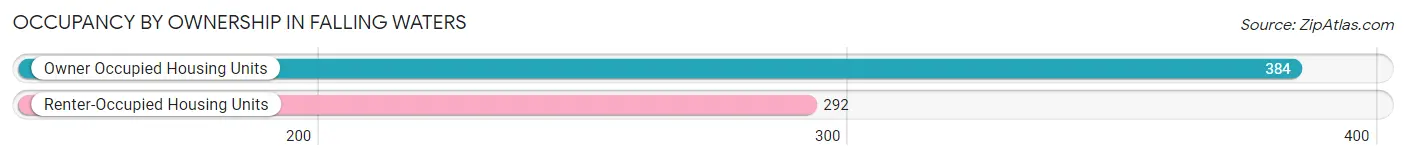
| Occupancy | # Housing Units | % Housing Units |
| Owner Occupied Housing Units | 384 | 56.8% |
| Renter-Occupied Housing Units | 292 | 43.2% |
| Total Occupied Housing Units | 676 | 100.0% |
Occupancy by Household Size in Falling Waters
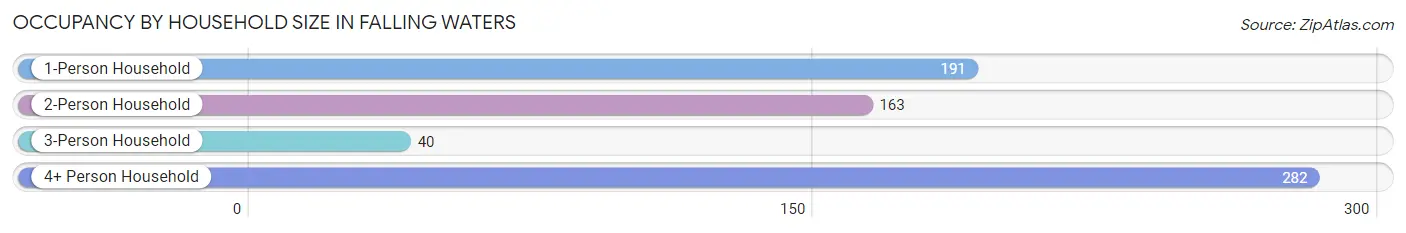
| Household Size | # Housing Units | % Housing Units |
| 1-Person Household | 191 | 28.2% |
| 2-Person Household | 163 | 24.1% |
| 3-Person Household | 40 | 5.9% |
| 4+ Person Household | 282 | 41.7% |
| Total Housing Units | 676 | 100.0% |
Occupancy by Ownership by Household Size in Falling Waters
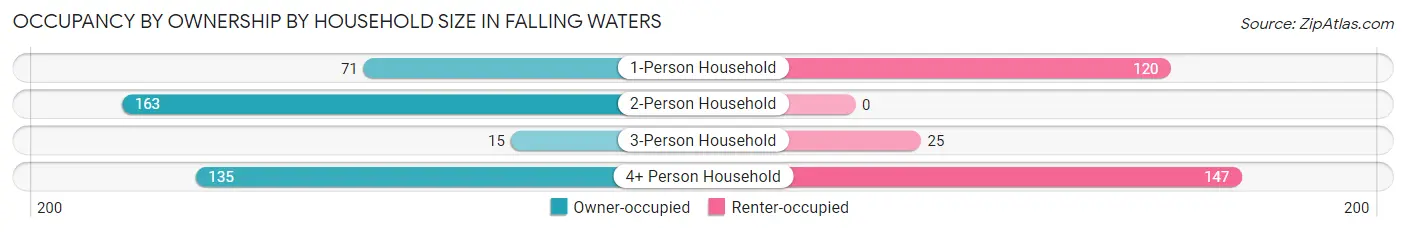
| Household Size | Owner-occupied | Renter-occupied |
| 1-Person Household | 71 (37.2%) | 120 (62.8%) |
| 2-Person Household | 163 (100.0%) | 0 (0.0%) |
| 3-Person Household | 15 (37.5%) | 25 (62.5%) |
| 4+ Person Household | 135 (47.9%) | 147 (52.1%) |
| Total Housing Units | 384 (56.8%) | 292 (43.2%) |
Occupancy by Educational Attainment in Falling Waters
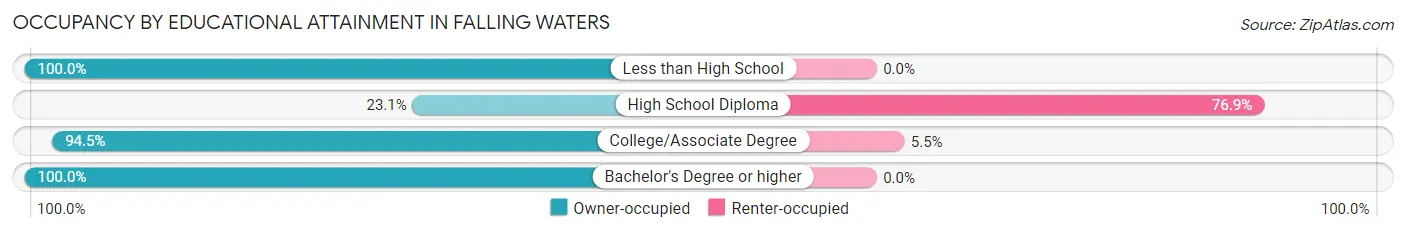
| Household Size | Owner-occupied | Renter-occupied |
| Less than High School | 11 (100.0%) | 0 (0.0%) |
| High School Diploma | 84 (23.1%) | 280 (76.9%) |
| College/Associate Degree | 207 (94.5%) | 12 (5.5%) |
| Bachelor's Degree or higher | 82 (100.0%) | 0 (0.0%) |
Occupancy by Age of Householder in Falling Waters
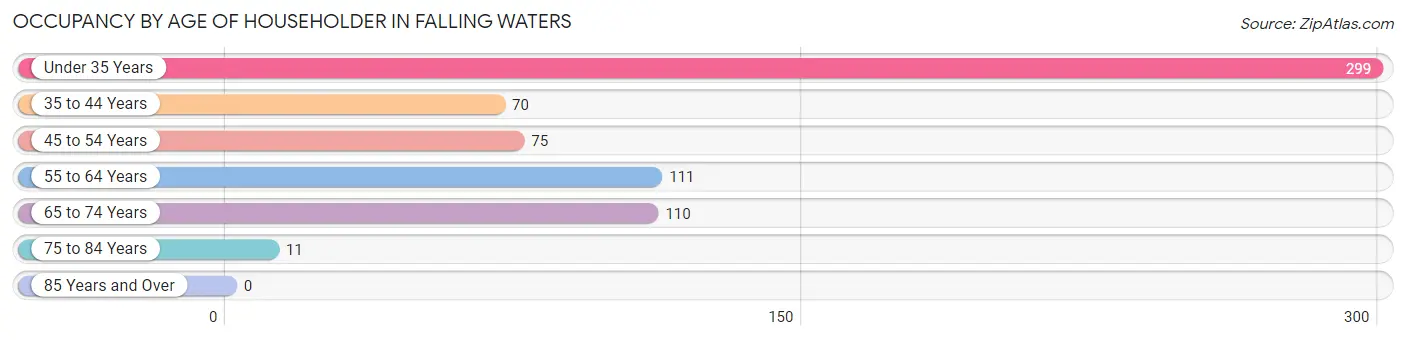
| Age Bracket | # Households | % Households |
| Under 35 Years | 299 | 44.2% |
| 35 to 44 Years | 70 | 10.4% |
| 45 to 54 Years | 75 | 11.1% |
| 55 to 64 Years | 111 | 16.4% |
| 65 to 74 Years | 110 | 16.3% |
| 75 to 84 Years | 11 | 1.6% |
| 85 Years and Over | 0 | 0.0% |
| Total | 676 | 100.0% |
Housing Finances in Falling Waters
Median Income by Occupancy in Falling Waters
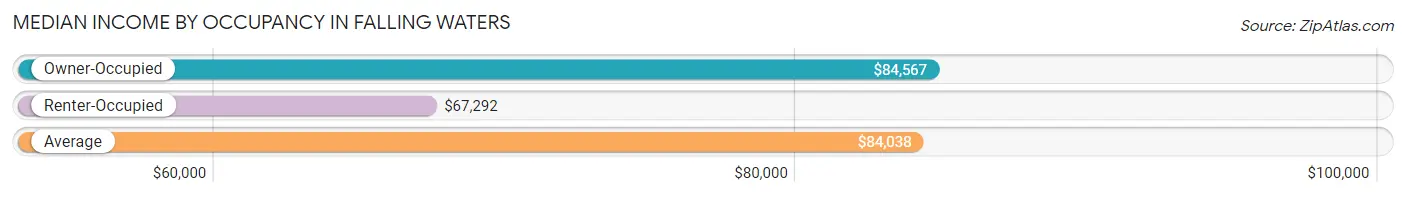
| Occupancy Type | # Households | Median Income |
| Owner-Occupied | 384 (56.8%) | $84,567 |
| Renter-Occupied | 292 (43.2%) | $67,292 |
| Average | 676 (100.0%) | $84,038 |
Occupancy by Householder Income Bracket in Falling Waters
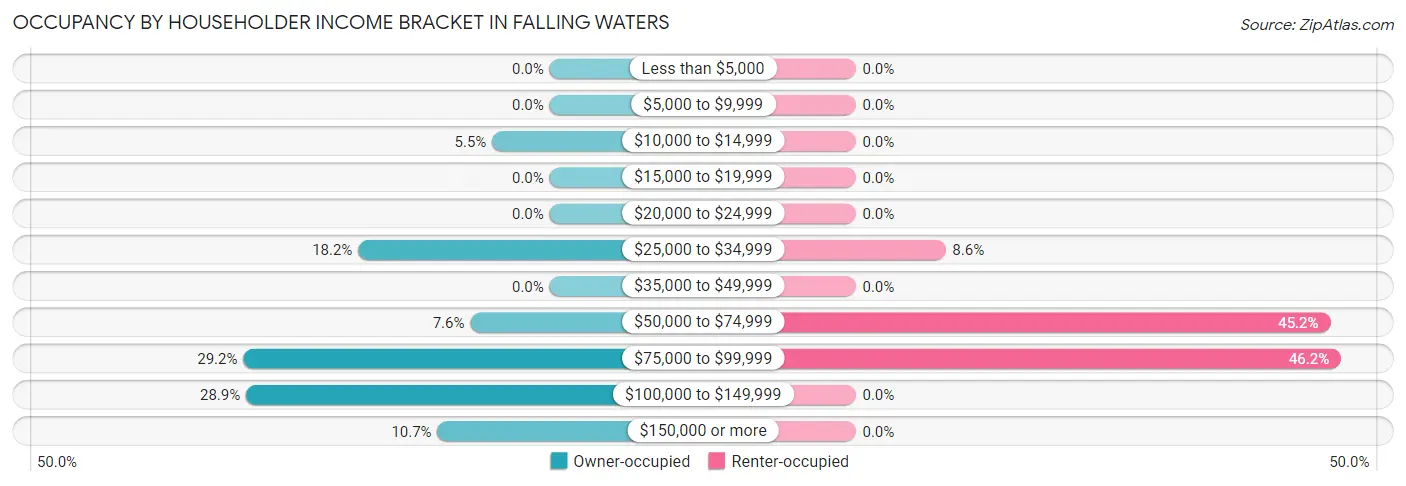
| Income Bracket | Owner-occupied | Renter-occupied |
| Less than $5,000 | 0 (0.0%) | 0 (0.0%) |
| $5,000 to $9,999 | 0 (0.0%) | 0 (0.0%) |
| $10,000 to $14,999 | 21 (5.5%) | 0 (0.0%) |
| $15,000 to $19,999 | 0 (0.0%) | 0 (0.0%) |
| $20,000 to $24,999 | 0 (0.0%) | 0 (0.0%) |
| $25,000 to $34,999 | 70 (18.2%) | 25 (8.6%) |
| $35,000 to $49,999 | 0 (0.0%) | 0 (0.0%) |
| $50,000 to $74,999 | 29 (7.5%) | 132 (45.2%) |
| $75,000 to $99,999 | 112 (29.2%) | 135 (46.2%) |
| $100,000 to $149,999 | 111 (28.9%) | 0 (0.0%) |
| $150,000 or more | 41 (10.7%) | 0 (0.0%) |
| Total | 384 (100.0%) | 292 (100.0%) |
Monthly Housing Cost Tiers in Falling Waters
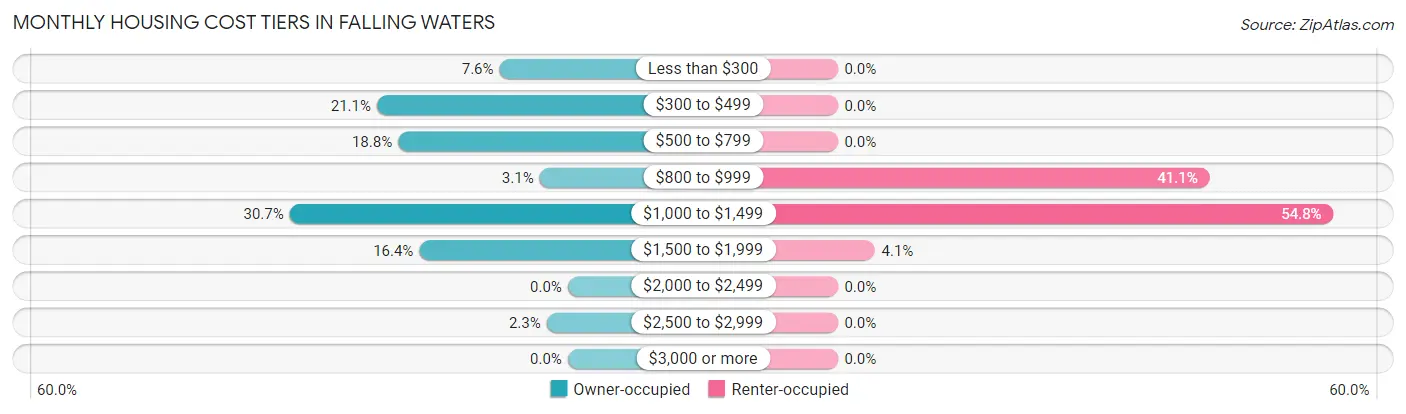
| Monthly Cost | Owner-occupied | Renter-occupied |
| Less than $300 | 29 (7.5%) | 0 (0.0%) |
| $300 to $499 | 81 (21.1%) | 0 (0.0%) |
| $500 to $799 | 72 (18.8%) | 0 (0.0%) |
| $800 to $999 | 12 (3.1%) | 120 (41.1%) |
| $1,000 to $1,499 | 118 (30.7%) | 160 (54.8%) |
| $1,500 to $1,999 | 63 (16.4%) | 12 (4.1%) |
| $2,000 to $2,499 | 0 (0.0%) | 0 (0.0%) |
| $2,500 to $2,999 | 9 (2.3%) | 0 (0.0%) |
| $3,000 or more | 0 (0.0%) | 0 (0.0%) |
| Total | 384 (100.0%) | 292 (100.0%) |
Physical Housing Characteristics in Falling Waters
Housing Structures in Falling Waters
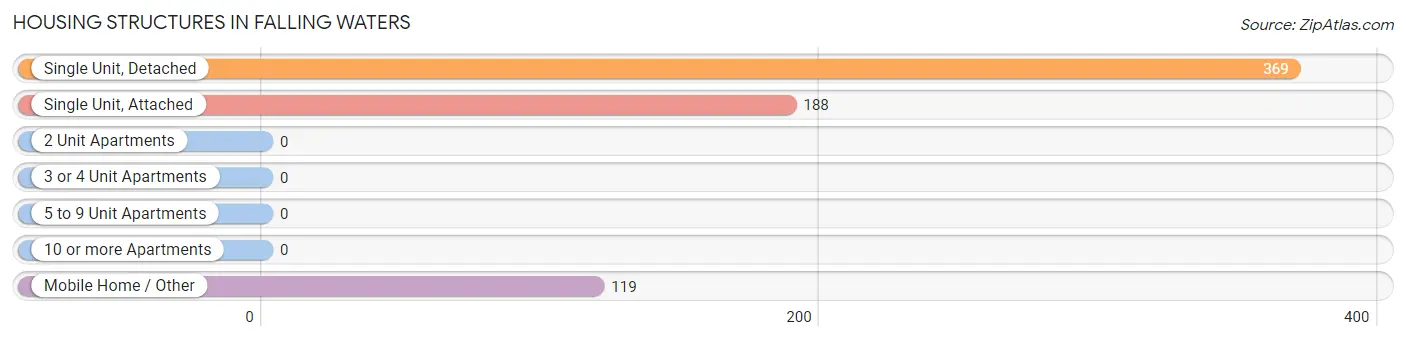
| Structure Type | # Housing Units | % Housing Units |
| Single Unit, Detached | 369 | 54.6% |
| Single Unit, Attached | 188 | 27.8% |
| 2 Unit Apartments | 0 | 0.0% |
| 3 or 4 Unit Apartments | 0 | 0.0% |
| 5 to 9 Unit Apartments | 0 | 0.0% |
| 10 or more Apartments | 0 | 0.0% |
| Mobile Home / Other | 119 | 17.6% |
| Total | 676 | 100.0% |
Housing Structures by Occupancy in Falling Waters
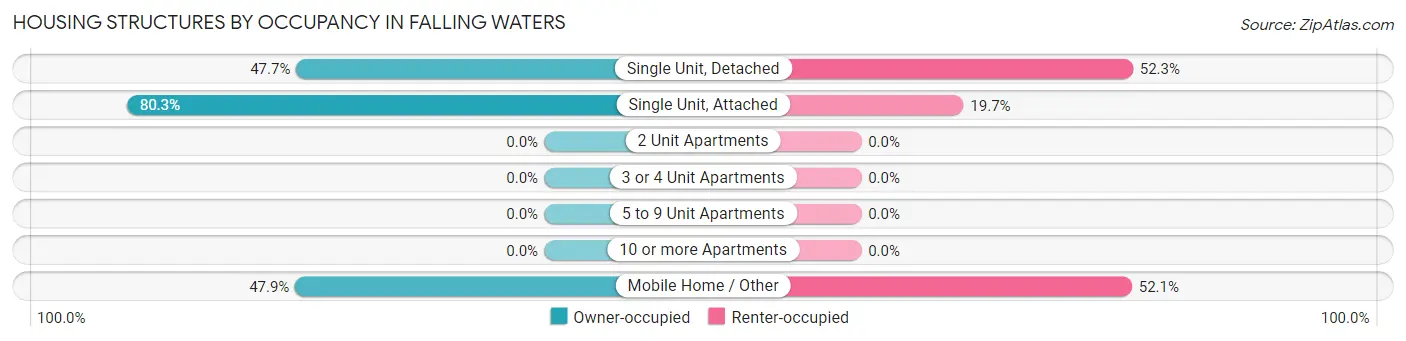
| Structure Type | Owner-occupied | Renter-occupied |
| Single Unit, Detached | 176 (47.7%) | 193 (52.3%) |
| Single Unit, Attached | 151 (80.3%) | 37 (19.7%) |
| 2 Unit Apartments | 0 (0.0%) | 0 (0.0%) |
| 3 or 4 Unit Apartments | 0 (0.0%) | 0 (0.0%) |
| 5 to 9 Unit Apartments | 0 (0.0%) | 0 (0.0%) |
| 10 or more Apartments | 0 (0.0%) | 0 (0.0%) |
| Mobile Home / Other | 57 (47.9%) | 62 (52.1%) |
| Total | 384 (56.8%) | 292 (43.2%) |
Housing Structures by Number of Rooms in Falling Waters
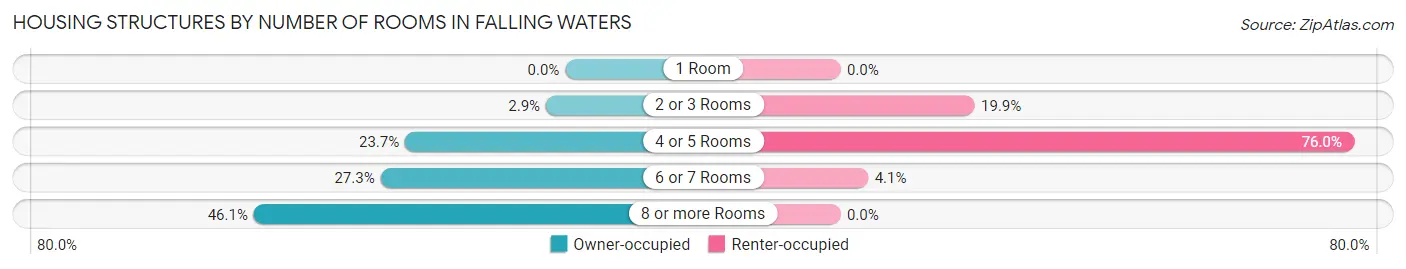
| Number of Rooms | Owner-occupied | Renter-occupied |
| 1 Room | 0 (0.0%) | 0 (0.0%) |
| 2 or 3 Rooms | 11 (2.9%) | 58 (19.9%) |
| 4 or 5 Rooms | 91 (23.7%) | 222 (76.0%) |
| 6 or 7 Rooms | 105 (27.3%) | 12 (4.1%) |
| 8 or more Rooms | 177 (46.1%) | 0 (0.0%) |
| Total | 384 (100.0%) | 292 (100.0%) |
Housing Structure by Heating Type in Falling Waters
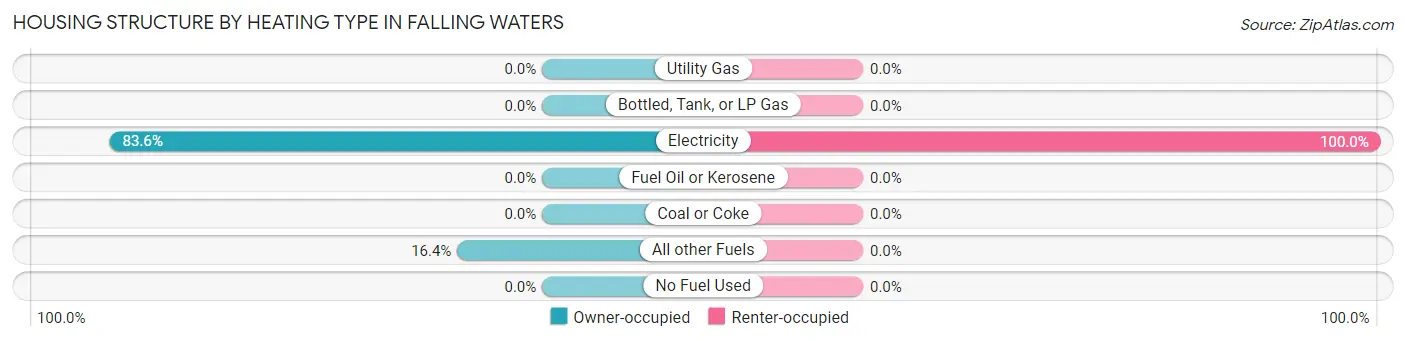
| Heating Type | Owner-occupied | Renter-occupied |
| Utility Gas | 0 (0.0%) | 0 (0.0%) |
| Bottled, Tank, or LP Gas | 0 (0.0%) | 0 (0.0%) |
| Electricity | 321 (83.6%) | 292 (100.0%) |
| Fuel Oil or Kerosene | 0 (0.0%) | 0 (0.0%) |
| Coal or Coke | 0 (0.0%) | 0 (0.0%) |
| All other Fuels | 63 (16.4%) | 0 (0.0%) |
| No Fuel Used | 0 (0.0%) | 0 (0.0%) |
| Total | 384 (100.0%) | 292 (100.0%) |
Household Vehicle Usage in Falling Waters
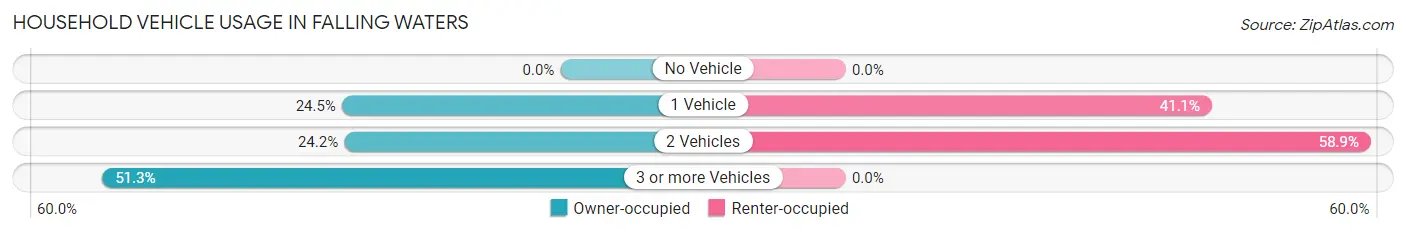
| Vehicles per Household | Owner-occupied | Renter-occupied |
| No Vehicle | 0 (0.0%) | 0 (0.0%) |
| 1 Vehicle | 94 (24.5%) | 120 (41.1%) |
| 2 Vehicles | 93 (24.2%) | 172 (58.9%) |
| 3 or more Vehicles | 197 (51.3%) | 0 (0.0%) |
| Total | 384 (100.0%) | 292 (100.0%) |
Real Estate & Mortgages in Falling Waters
Real Estate and Mortgage Overview in Falling Waters
| Characteristic | Without Mortgage | With Mortgage |
| Housing Units | 110 | 274 |
| Median Property Value | $119,800 | $202,400 |
| Median Household Income | $33,893 | $23 |
| Monthly Housing Costs | $345 | $0 |
| Real Estate Taxes | $572 | $0 |
Property Value by Mortgage Status in Falling Waters
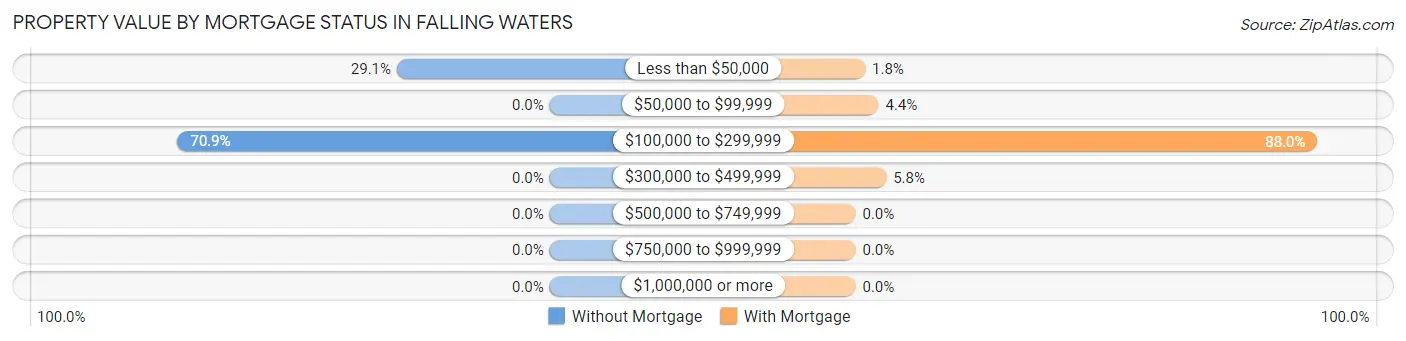
| Property Value | Without Mortgage | With Mortgage |
| Less than $50,000 | 32 (29.1%) | 5 (1.8%) |
| $50,000 to $99,999 | 0 (0.0%) | 12 (4.4%) |
| $100,000 to $299,999 | 78 (70.9%) | 241 (88.0%) |
| $300,000 to $499,999 | 0 (0.0%) | 16 (5.8%) |
| $500,000 to $749,999 | 0 (0.0%) | 0 (0.0%) |
| $750,000 to $999,999 | 0 (0.0%) | 0 (0.0%) |
| $1,000,000 or more | 0 (0.0%) | 0 (0.0%) |
| Total | 110 (100.0%) | 274 (100.0%) |
Household Income by Mortgage Status in Falling Waters
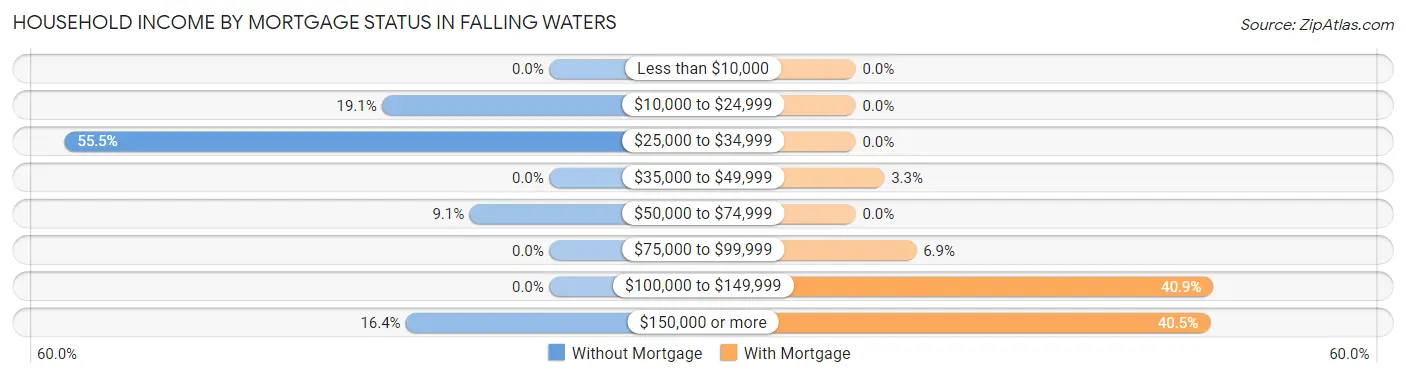
| Household Income | Without Mortgage | With Mortgage |
| Less than $10,000 | 0 (0.0%) | 0 (0.0%) |
| $10,000 to $24,999 | 21 (19.1%) | 0 (0.0%) |
| $25,000 to $34,999 | 61 (55.4%) | 0 (0.0%) |
| $35,000 to $49,999 | 0 (0.0%) | 9 (3.3%) |
| $50,000 to $74,999 | 10 (9.1%) | 0 (0.0%) |
| $75,000 to $99,999 | 0 (0.0%) | 19 (6.9%) |
| $100,000 to $149,999 | 0 (0.0%) | 112 (40.9%) |
| $150,000 or more | 18 (16.4%) | 111 (40.5%) |
| Total | 110 (100.0%) | 274 (100.0%) |
Property Value to Household Income Ratio in Falling Waters
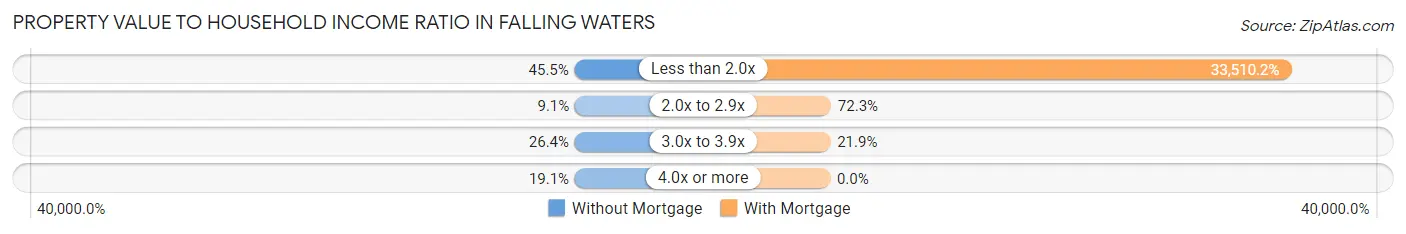
| Value-to-Income Ratio | Without Mortgage | With Mortgage |
| Less than 2.0x | 50 (45.5%) | 91,818 (33,510.2%) |
| 2.0x to 2.9x | 10 (9.1%) | 198 (72.3%) |
| 3.0x to 3.9x | 29 (26.4%) | 60 (21.9%) |
| 4.0x or more | 21 (19.1%) | 0 (0.0%) |
| Total | 110 (100.0%) | 274 (100.0%) |
Real Estate Taxes by Mortgage Status in Falling Waters
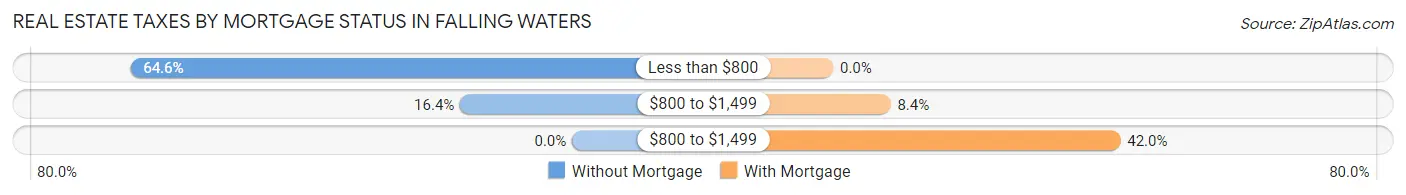
| Property Taxes | Without Mortgage | With Mortgage |
| Less than $800 | 71 (64.5%) | 0 (0.0%) |
| $800 to $1,499 | 18 (16.4%) | 23 (8.4%) |
| $800 to $1,499 | 0 (0.0%) | 115 (42.0%) |
| Total | 110 (100.0%) | 274 (100.0%) |
Health & Disability in Falling Waters
Health Insurance Coverage by Age in Falling Waters
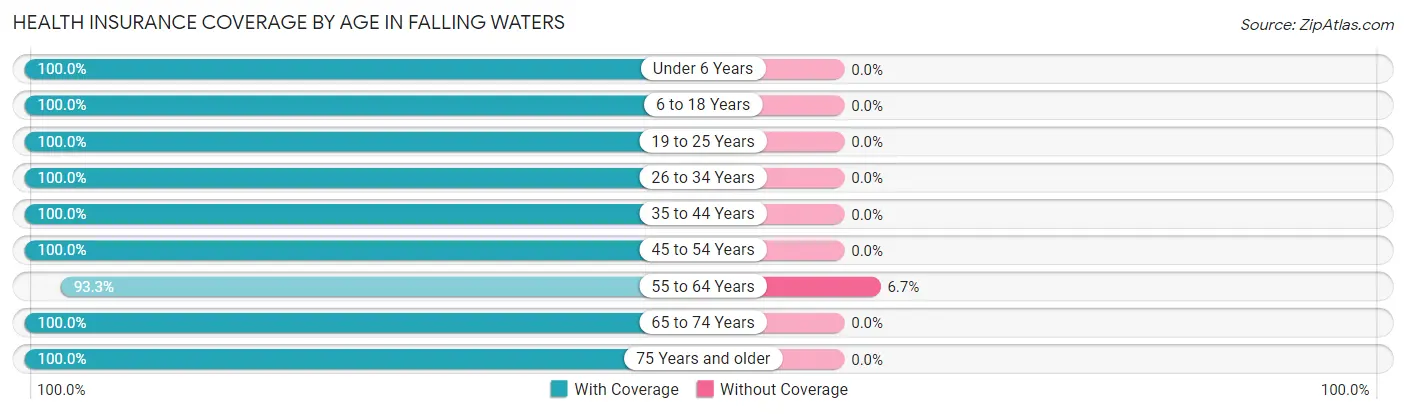
| Age Bracket | With Coverage | Without Coverage |
| Under 6 Years | 163 (100.0%) | 0 (0.0%) |
| 6 to 18 Years | 389 (100.0%) | 0 (0.0%) |
| 19 to 25 Years | 349 (100.0%) | 0 (0.0%) |
| 26 to 34 Years | 513 (100.0%) | 0 (0.0%) |
| 35 to 44 Years | 167 (100.0%) | 0 (0.0%) |
| 45 to 54 Years | 128 (100.0%) | 0 (0.0%) |
| 55 to 64 Years | 180 (93.3%) | 13 (6.7%) |
| 65 to 74 Years | 226 (100.0%) | 0 (0.0%) |
| 75 Years and older | 22 (100.0%) | 0 (0.0%) |
| Total | 2,137 (99.4%) | 13 (0.6%) |
Health Insurance Coverage by Citizenship Status in Falling Waters
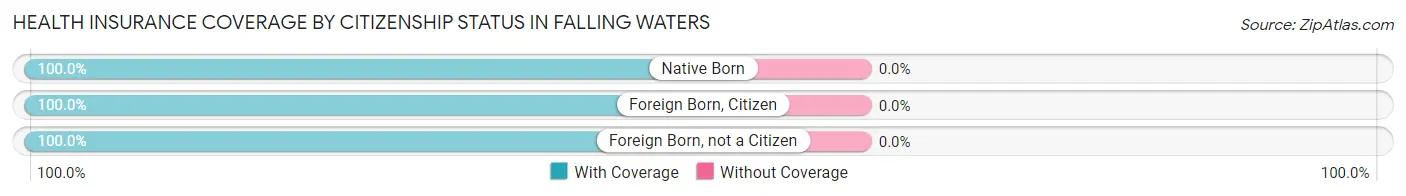
| Citizenship Status | With Coverage | Without Coverage |
| Native Born | 163 (100.0%) | 0 (0.0%) |
| Foreign Born, Citizen | 389 (100.0%) | 0 (0.0%) |
| Foreign Born, not a Citizen | 349 (100.0%) | 0 (0.0%) |
Health Insurance Coverage by Household Income in Falling Waters
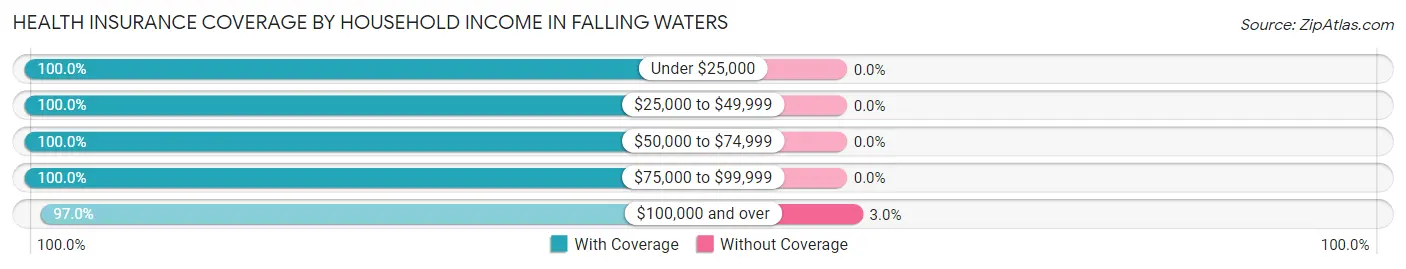
| Household Income | With Coverage | Without Coverage |
| Under $25,000 | 21 (100.0%) | 0 (0.0%) |
| $25,000 to $49,999 | 333 (100.0%) | 0 (0.0%) |
| $50,000 to $74,999 | 275 (100.0%) | 0 (0.0%) |
| $75,000 to $99,999 | 1,083 (100.0%) | 0 (0.0%) |
| $100,000 and over | 425 (97.0%) | 13 (3.0%) |
Public vs Private Health Insurance Coverage by Age in Falling Waters
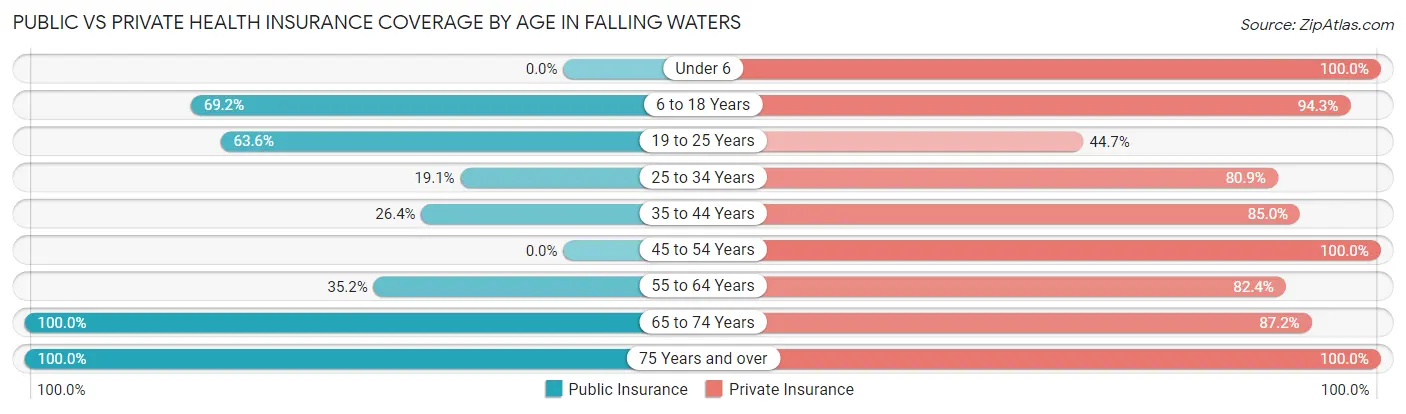
| Age Bracket | Public Insurance | Private Insurance |
| Under 6 | 0 (0.0%) | 163 (100.0%) |
| 6 to 18 Years | 269 (69.2%) | 367 (94.3%) |
| 19 to 25 Years | 222 (63.6%) | 156 (44.7%) |
| 25 to 34 Years | 98 (19.1%) | 415 (80.9%) |
| 35 to 44 Years | 44 (26.4%) | 142 (85.0%) |
| 45 to 54 Years | 0 (0.0%) | 128 (100.0%) |
| 55 to 64 Years | 68 (35.2%) | 159 (82.4%) |
| 65 to 74 Years | 226 (100.0%) | 197 (87.2%) |
| 75 Years and over | 22 (100.0%) | 22 (100.0%) |
| Total | 949 (44.1%) | 1,749 (81.4%) |
Disability Status by Sex by Age in Falling Waters
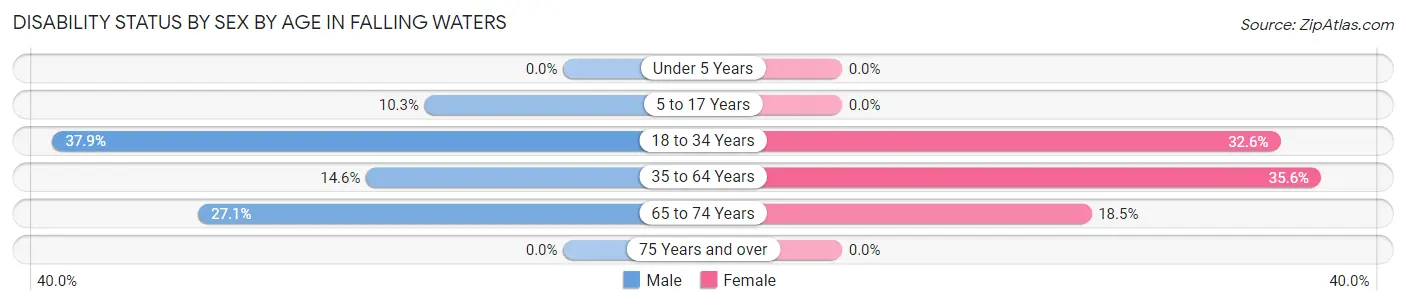
| Age Bracket | Male | Female |
| Under 5 Years | 0 (0.0%) | 0 (0.0%) |
| 5 to 17 Years | 35 (10.3%) | 0 (0.0%) |
| 18 to 34 Years | 193 (37.9%) | 124 (32.6%) |
| 35 to 64 Years | 43 (14.6%) | 69 (35.6%) |
| 65 to 74 Years | 32 (27.1%) | 20 (18.5%) |
| 75 Years and over | 0 (0.0%) | 0 (0.0%) |
Disability Class by Sex by Age in Falling Waters
Disability Class: Hearing Difficulty
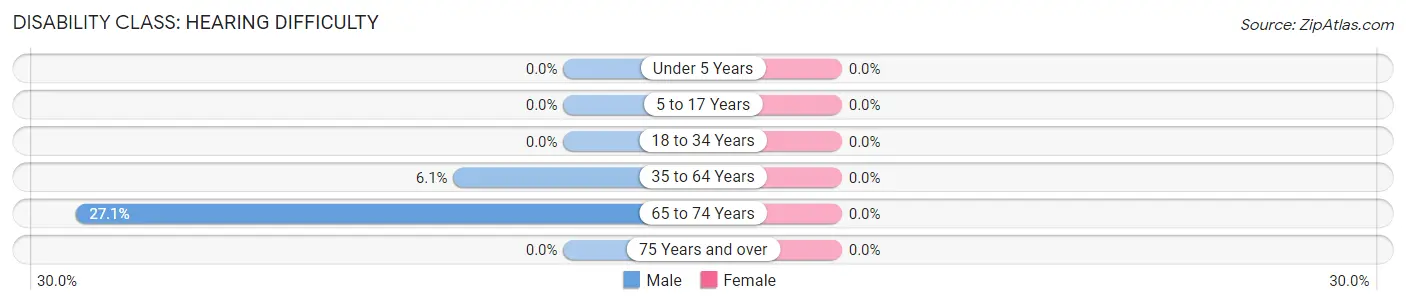
| Age Bracket | Male | Female |
| Under 5 Years | 0 (0.0%) | 0 (0.0%) |
| 5 to 17 Years | 0 (0.0%) | 0 (0.0%) |
| 18 to 34 Years | 0 (0.0%) | 0 (0.0%) |
| 35 to 64 Years | 18 (6.1%) | 0 (0.0%) |
| 65 to 74 Years | 32 (27.1%) | 0 (0.0%) |
| 75 Years and over | 0 (0.0%) | 0 (0.0%) |
Disability Class: Vision Difficulty
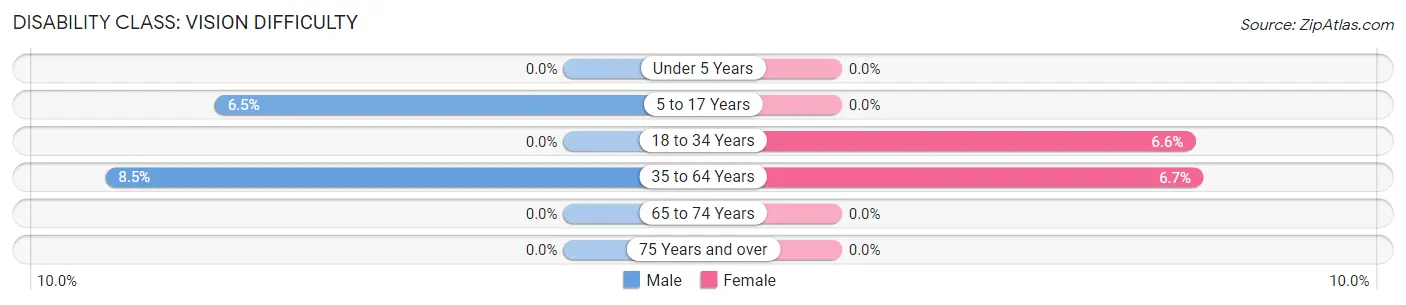
| Age Bracket | Male | Female |
| Under 5 Years | 0 (0.0%) | 0 (0.0%) |
| 5 to 17 Years | 22 (6.5%) | 0 (0.0%) |
| 18 to 34 Years | 0 (0.0%) | 25 (6.6%) |
| 35 to 64 Years | 25 (8.5%) | 13 (6.7%) |
| 65 to 74 Years | 0 (0.0%) | 0 (0.0%) |
| 75 Years and over | 0 (0.0%) | 0 (0.0%) |
Disability Class: Cognitive Difficulty
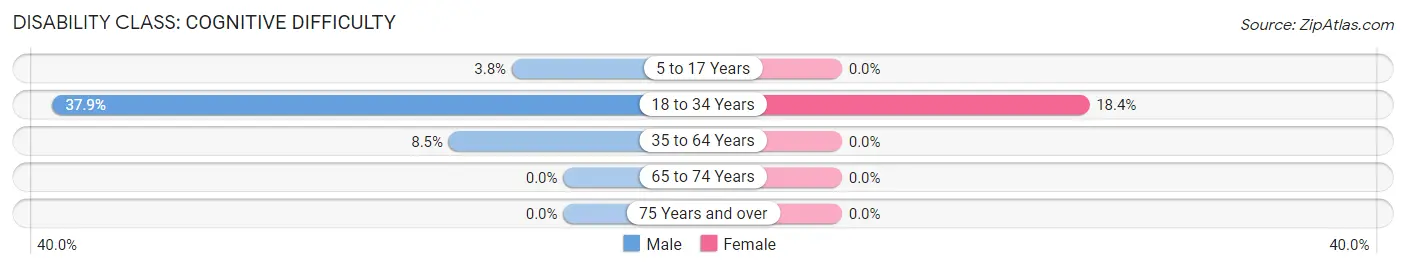
| Age Bracket | Male | Female |
| 5 to 17 Years | 13 (3.8%) | 0 (0.0%) |
| 18 to 34 Years | 193 (37.9%) | 70 (18.4%) |
| 35 to 64 Years | 25 (8.5%) | 0 (0.0%) |
| 65 to 74 Years | 0 (0.0%) | 0 (0.0%) |
| 75 Years and over | 0 (0.0%) | 0 (0.0%) |
Disability Class: Ambulatory Difficulty
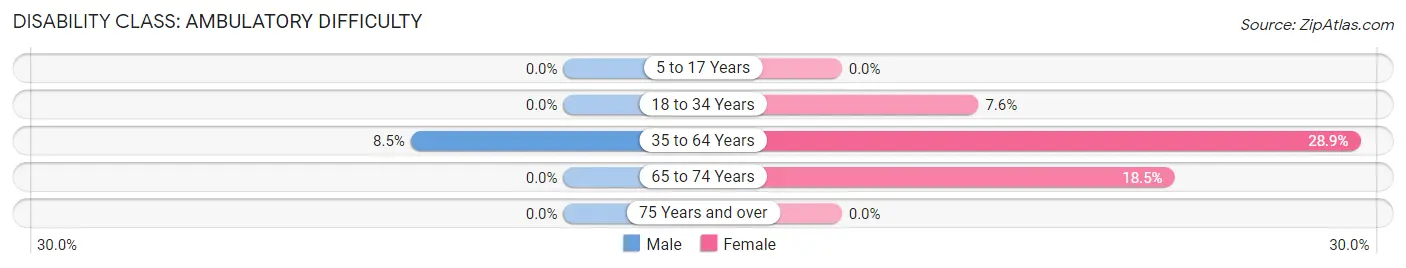
| Age Bracket | Male | Female |
| 5 to 17 Years | 0 (0.0%) | 0 (0.0%) |
| 18 to 34 Years | 0 (0.0%) | 29 (7.6%) |
| 35 to 64 Years | 25 (8.5%) | 56 (28.9%) |
| 65 to 74 Years | 0 (0.0%) | 20 (18.5%) |
| 75 Years and over | 0 (0.0%) | 0 (0.0%) |
Disability Class: Self-Care Difficulty
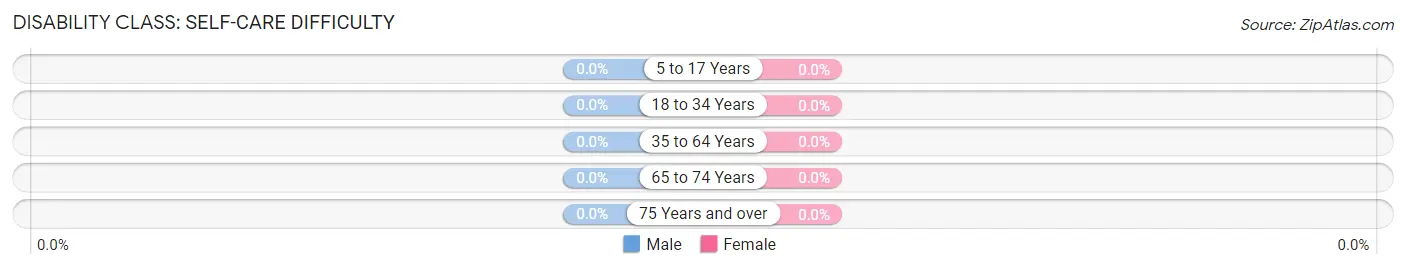
| Age Bracket | Male | Female |
| 5 to 17 Years | 0 (0.0%) | 0 (0.0%) |
| 18 to 34 Years | 0 (0.0%) | 0 (0.0%) |
| 35 to 64 Years | 0 (0.0%) | 0 (0.0%) |
| 65 to 74 Years | 0 (0.0%) | 0 (0.0%) |
| 75 Years and over | 0 (0.0%) | 0 (0.0%) |
Technology Access in Falling Waters
Computing Device Access in Falling Waters
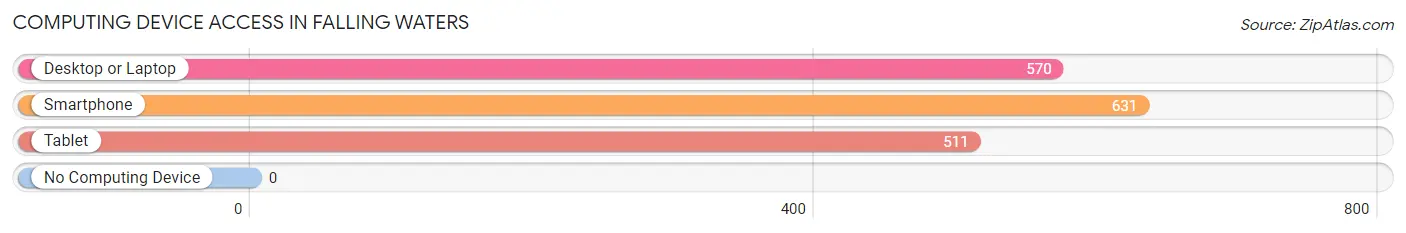
| Device Type | # Households | % Households |
| Desktop or Laptop | 570 | 84.3% |
| Smartphone | 631 | 93.3% |
| Tablet | 511 | 75.6% |
| No Computing Device | 0 | 0.0% |
| Total | 676 | 100.0% |
Internet Access in Falling Waters
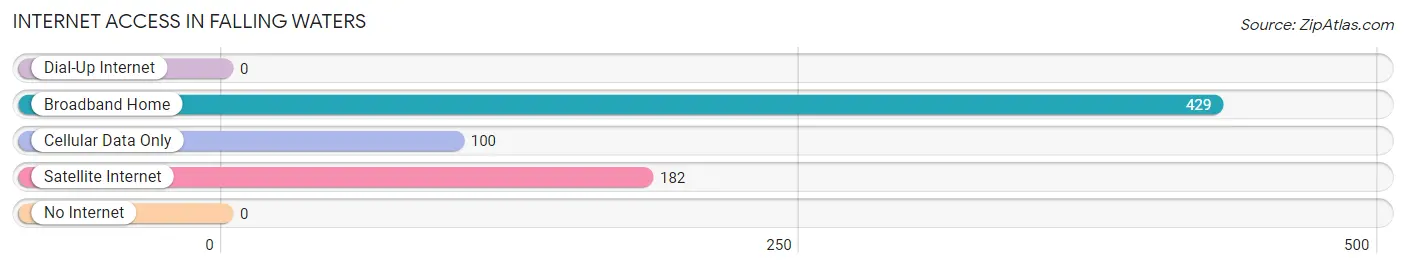
| Internet Type | # Households | % Households |
| Dial-Up Internet | 0 | 0.0% |
| Broadband Home | 429 | 63.5% |
| Cellular Data Only | 100 | 14.8% |
| Satellite Internet | 182 | 26.9% |
| No Internet | 0 | 0.0% |
| Total | 676 | 100.0% |
Falling Waters Summary
Falling Waters, West Virginia is a small town located in Berkeley County, West Virginia. It is situated along the Potomac River, just south of the Maryland border. The town was established in 1732 and is one of the oldest towns in the state. The town has a population of approximately 1,500 people and is part of the Hagerstown-Martinsburg Metropolitan Statistical Area.
History
Falling Waters was established in 1732 by a group of German settlers. The town was originally known as “Falling Waters of the Potomac” and was the first settlement in what is now Berkeley County. The town was named after the nearby waterfall on the Potomac River. The town was an important stop on the National Road, which was the first federally funded highway in the United States. The town was also an important stop on the Baltimore and Ohio Railroad.
The town was the site of a major Civil War battle in 1863. The Battle of Falling Waters was a Confederate victory and resulted in the death of Union General Robert E. Lee. The town was also the site of a major train wreck in 1891, which killed over 100 people.
Geography
Falling Waters is located in the eastern panhandle of West Virginia, just south of the Maryland border. The town is situated along the Potomac River and is surrounded by rolling hills and farmland. The town is located in the Appalachian Mountains and is part of the Appalachian Plateau. The climate in the area is humid and subtropical, with hot summers and mild winters.
Economy
The economy of Falling Waters is largely based on agriculture and tourism. The town is home to several farms, which produce a variety of crops, including corn, soybeans, and hay. The town is also home to several wineries, which produce a variety of wines.
The town is also a popular tourist destination, due to its proximity to the Potomac River and its historic sites. The town is home to several historic sites, including the Falling Waters Battlefield, the Falling Waters Train Wreck Site, and the Falling Waters Covered Bridge. The town is also home to several parks, including the Falling Waters State Park and the Potomac River State Park.
Demographics
As of the 2010 census, the population of Falling Waters was 1,500. The racial makeup of the town was 95.3% White, 1.7% African American, 0.3% Native American, 0.7% Asian, 0.3% from other races, and 1.7% from two or more races. The median household income in the town was $41,250, and the median family income was $50,000. The per capita income in the town was $20,000.
Falling Waters is a small town with a rich history and a vibrant economy. The town is home to several historic sites and is a popular tourist destination. The town is also home to several farms and wineries, which produce a variety of crops and wines. The town has a diverse population and a median household income that is slightly higher than the national average.
Common Questions
What is Per Capita Income in Falling Waters?
Per Capita income in Falling Waters is $26,303.
What is the Median Family Income in Falling Waters?
Median Family Income in Falling Waters is $57,596.
What is the Median Household income in Falling Waters?
Median Household Income in Falling Waters is $84,038.
What is Income or Wage Gap in Falling Waters?
Income or Wage Gap in Falling Waters is 42.6%.
Women in Falling Waters earn 57.4 cents for every dollar earned by a man.
What is Inequality or Gini Index in Falling Waters?
Inequality or Gini Index in Falling Waters is 0.25.
What is the Total Population of Falling Waters?
Total Population of Falling Waters is 2,150.
What is the Total Male Population of Falling Waters?
Total Male Population of Falling Waters is 1,414.
What is the Total Female Population of Falling Waters?
Total Female Population of Falling Waters is 736.
What is the Ratio of Males per 100 Females in Falling Waters?
There are 192.12 Males per 100 Females in Falling Waters.
What is the Ratio of Females per 100 Males in Falling Waters?
There are 52.05 Females per 100 Males in Falling Waters.
What is the Median Population Age in Falling Waters?
Median Population Age in Falling Waters is 32.2 Years.
What is the Average Family Size in Falling Waters
Average Family Size in Falling Waters is 3.5 People.
What is the Average Household Size in Falling Waters
Average Household Size in Falling Waters is 3.2 People.
How Large is the Labor Force in Falling Waters?
There are 1,119 People in the Labor Forcein in Falling Waters.
What is the Percentage of People in the Labor Force in Falling Waters?
68.8% of People are in the Labor Force in Falling Waters.
What is the Unemployment Rate in Falling Waters?
Unemployment Rate in Falling Waters is 12.0%.