Durbin, WV
Durbin Map
Durbin Overview
297
TOTAL POPULATION
159
MALE POPULATION
138
FEMALE POPULATION
115.22
MALES / 100 FEMALES
86.79
FEMALES / 100 MALES
52.1
MEDIAN AGE
3.3
AVG FAMILY SIZE
2.7
AVG HOUSEHOLD SIZE
$23,712
PER CAPITA INCOME
$65,536
AVG FAMILY INCOME
$55,972
AVG HOUSEHOLD INCOME
29.9%
WAGE / INCOME GAP [ % ]
70.1¢/ $1
WAGE / INCOME GAP [ $ ]
0.30
INEQUALITY / GINI INDEX
157
LABOR FORCE [ PEOPLE ]
55.7%
PERCENT IN LABOR FORCE
16.6%
UNEMPLOYMENT RATE
Durbin Zip Codes
Durbin Area Codes
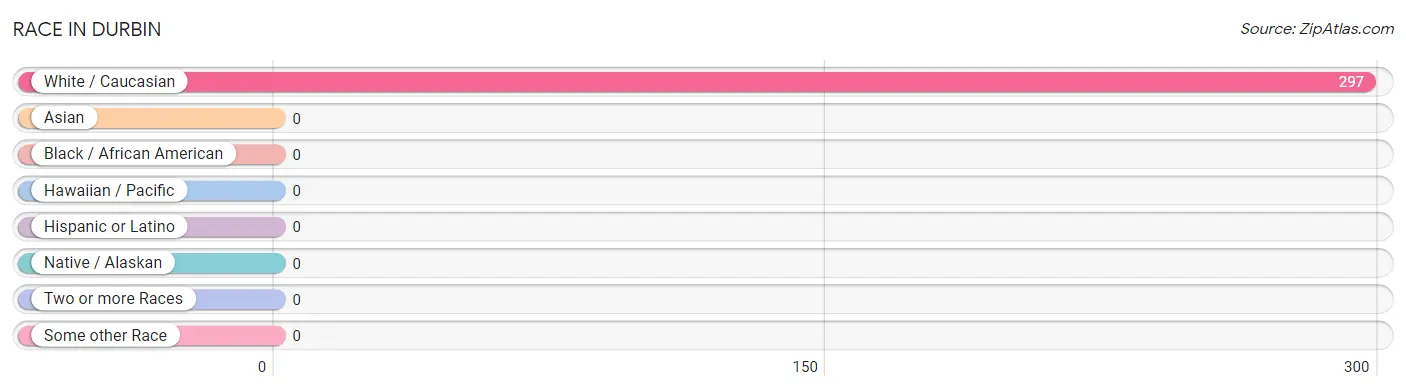
Race in Durbin
The most populous races in Durbin are , and White / Caucasian (297 | 100.0%).
| Race | # Population | % Population |
| Asian | 0 | 0.0% |
| Black / African American | 0 | 0.0% |
| Hawaiian / Pacific | 0 | 0.0% |
| Hispanic or Latino | 0 | 0.0% |
| Native / Alaskan | 0 | 0.0% |
| White / Caucasian | 297 | 100.0% |
| Two or more Races | 0 | 0.0% |
| Some other Race | 0 | 0.0% |
| Total | 297 | 100.0% |
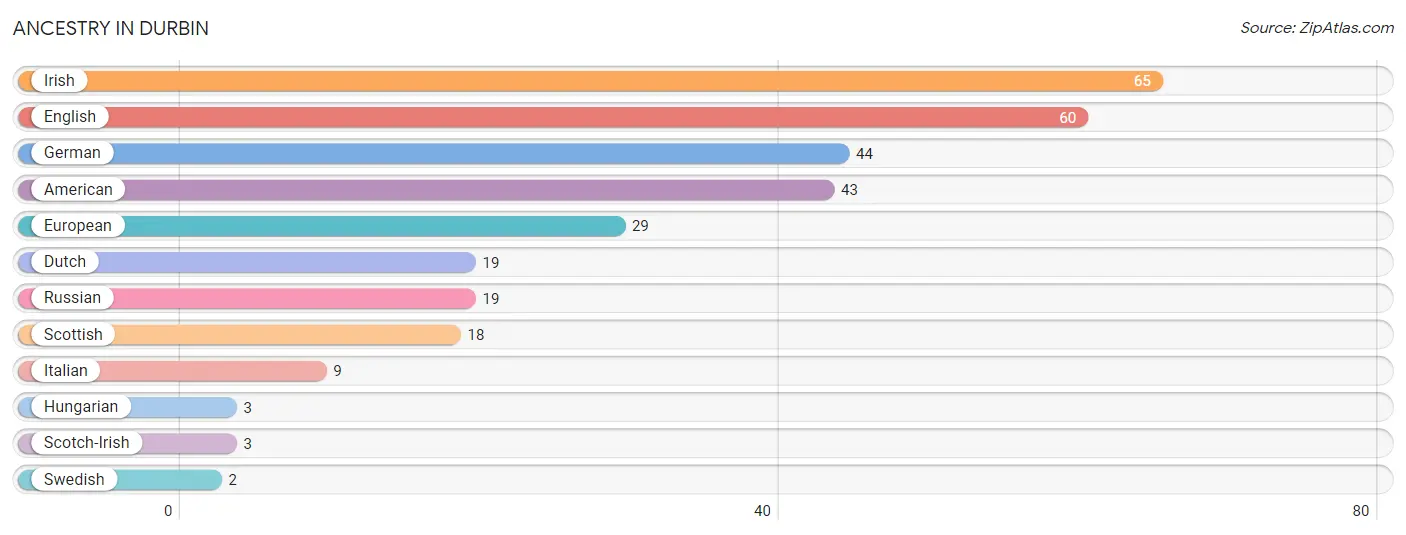
Ancestry in Durbin
The most populous ancestries reported in Durbin are Irish (65 | 21.9%), English (60 | 20.2%), German (44 | 14.8%), American (43 | 14.5%), and European (29 | 9.8%), together accounting for 81.1% of all Durbin residents.
| Ancestry | # Population | % Population |
| American | 43 | 14.5% |
| Dutch | 19 | 6.4% |
| English | 60 | 20.2% |
| European | 29 | 9.8% |
| German | 44 | 14.8% |
| Hungarian | 3 | 1.0% |
| Irish | 65 | 21.9% |
| Italian | 9 | 3.0% |
| Russian | 19 | 6.4% |
| Scotch-Irish | 3 | 1.0% |
| Scottish | 18 | 6.1% |
| Swedish | 2 | 0.7% | View All 12 Rows |
Immigrants in Durbin

| Immigration Origin | # Population | % Population | View All 0 Rows |
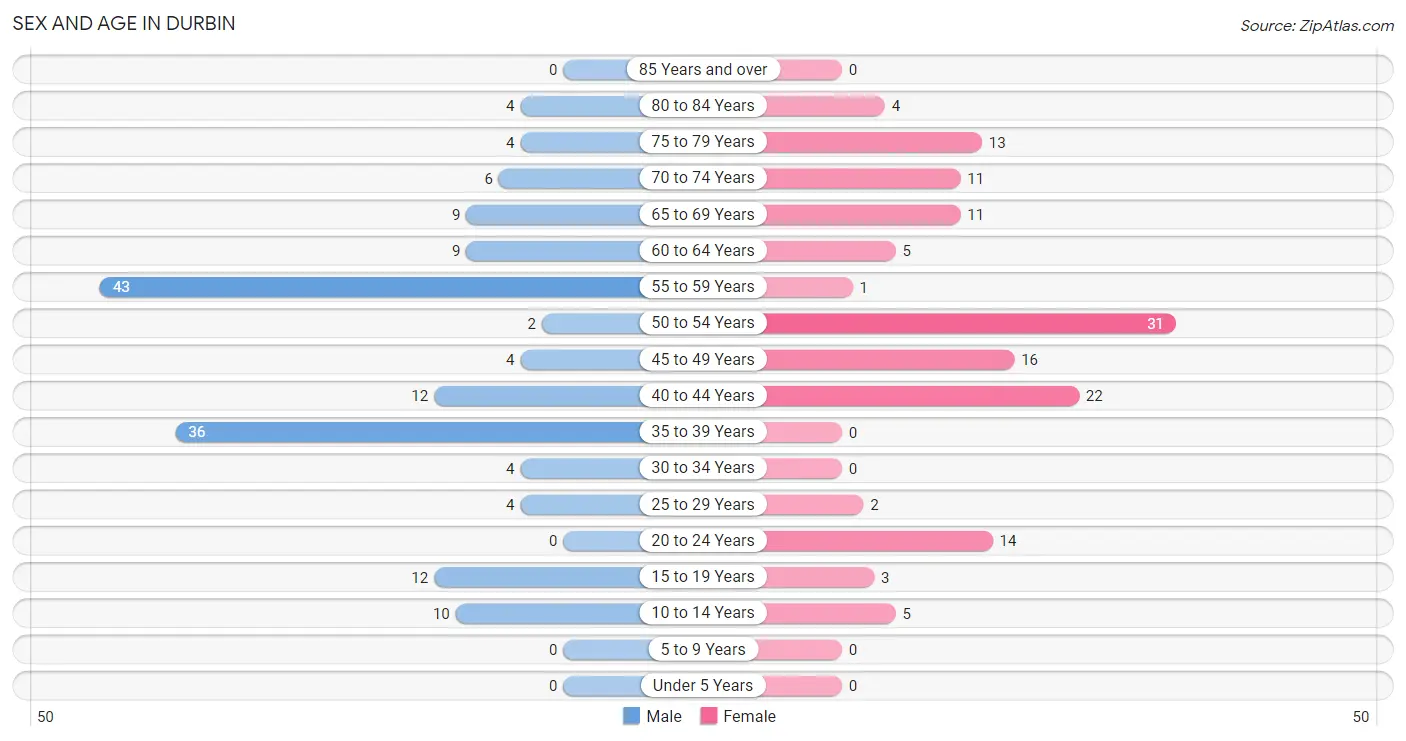
Sex and Age in Durbin
Sex and Age in Durbin
The most populous age groups in Durbin are 55 to 59 Years (43 | 27.0%) for men and 50 to 54 Years (31 | 22.5%) for women.
| Age Bracket | Male | Female |
| Under 5 Years | 0 (0.0%) | 0 (0.0%) |
| 5 to 9 Years | 0 (0.0%) | 0 (0.0%) |
| 10 to 14 Years | 10 (6.3%) | 5 (3.6%) |
| 15 to 19 Years | 12 (7.5%) | 3 (2.2%) |
| 20 to 24 Years | 0 (0.0%) | 14 (10.1%) |
| 25 to 29 Years | 4 (2.5%) | 2 (1.5%) |
| 30 to 34 Years | 4 (2.5%) | 0 (0.0%) |
| 35 to 39 Years | 36 (22.6%) | 0 (0.0%) |
| 40 to 44 Years | 12 (7.5%) | 22 (15.9%) |
| 45 to 49 Years | 4 (2.5%) | 16 (11.6%) |
| 50 to 54 Years | 2 (1.3%) | 31 (22.5%) |
| 55 to 59 Years | 43 (27.0%) | 1 (0.7%) |
| 60 to 64 Years | 9 (5.7%) | 5 (3.6%) |
| 65 to 69 Years | 9 (5.7%) | 11 (8.0%) |
| 70 to 74 Years | 6 (3.8%) | 11 (8.0%) |
| 75 to 79 Years | 4 (2.5%) | 13 (9.4%) |
| 80 to 84 Years | 4 (2.5%) | 4 (2.9%) |
| 85 Years and over | 0 (0.0%) | 0 (0.0%) |
| Total | 159 (100.0%) | 138 (100.0%) |
Families and Households in Durbin
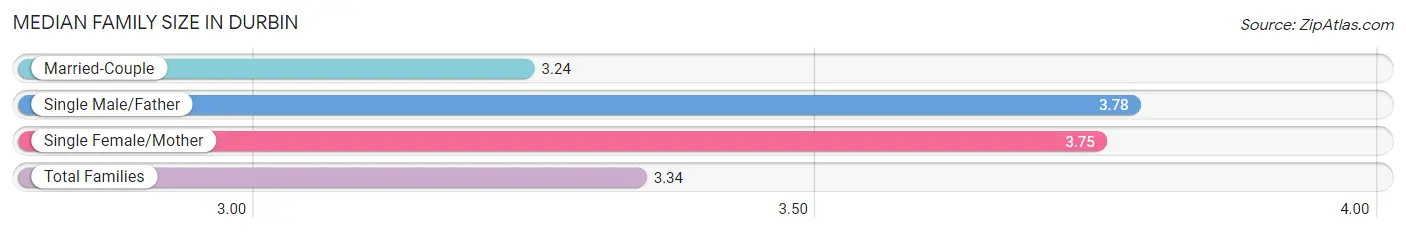
Median Family Size in Durbin
The median family size in Durbin is 3.34 persons per family, with single male/father families (9 | 12.7%) accounting for the largest median family size of 3.78 persons per family. On the other hand, married-couple families (58 | 81.7%) represent the smallest median family size with 3.24 persons per family.
| Family Type | # Families | Family Size |
| Married-Couple | 58 (81.7%) | 3.24 |
| Single Male/Father | 9 (12.7%) | 3.78 |
| Single Female/Mother | 4 (5.6%) | 3.75 |
| Total Families | 71 (100.0%) | 3.34 |
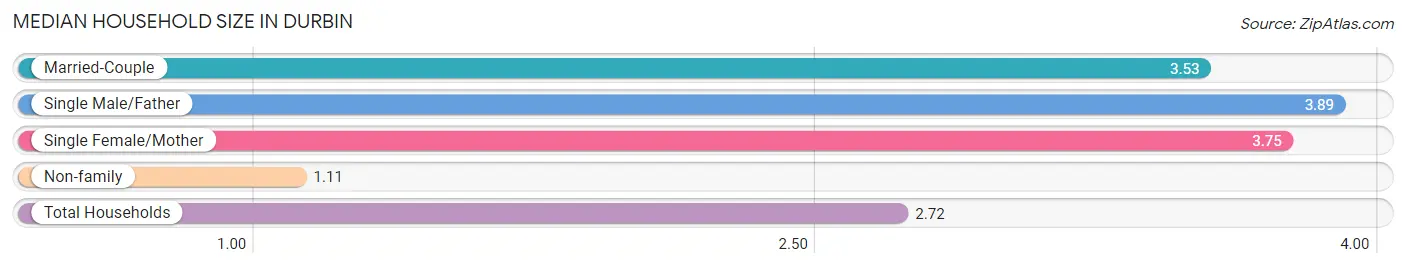
Median Household Size in Durbin
The median household size in Durbin is 2.72 persons per household, with single male/father households (9 | 8.3%) accounting for the largest median household size of 3.89 persons per household. non-family households (38 | 34.9%) represent the smallest median household size with 1.11 persons per household.
| Household Type | # Households | Household Size |
| Married-Couple | 58 (53.2%) | 3.53 |
| Single Male/Father | 9 (8.3%) | 3.89 |
| Single Female/Mother | 4 (3.7%) | 3.75 |
| Non-family | 38 (34.9%) | 1.11 |
| Total Households | 109 (100.0%) | 2.72 |
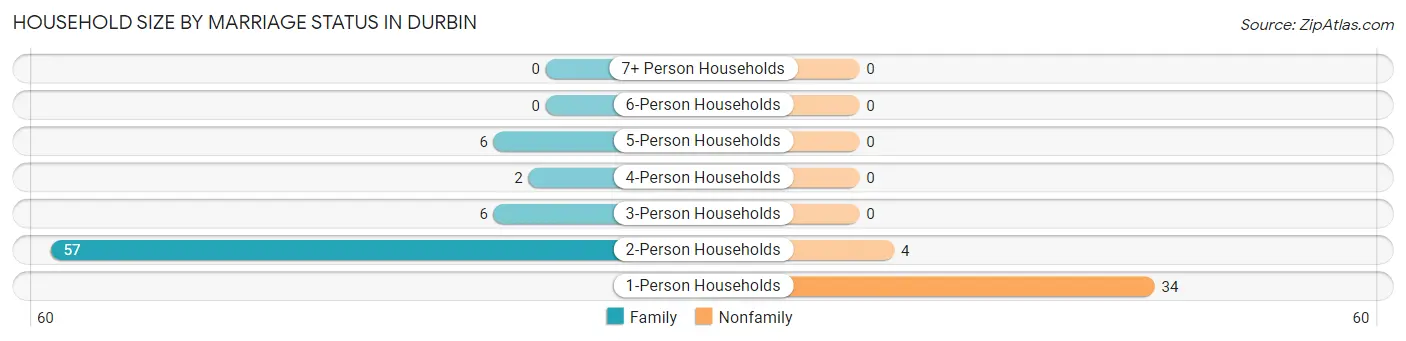
Household Size by Marriage Status in Durbin
Out of a total of 109 households in Durbin, 71 (65.1%) are family households, while 38 (34.9%) are nonfamily households. The most numerous type of family households are 2-person households, comprising 57, and the most common type of nonfamily households are 1-person households, comprising 34.
| Household Size | Family Households | Nonfamily Households |
| 1-Person Households | - | 34 (31.2%) |
| 2-Person Households | 57 (52.3%) | 4 (3.7%) |
| 3-Person Households | 6 (5.5%) | 0 (0.0%) |
| 4-Person Households | 2 (1.8%) | 0 (0.0%) |
| 5-Person Households | 6 (5.5%) | 0 (0.0%) |
| 6-Person Households | 0 (0.0%) | 0 (0.0%) |
| 7+ Person Households | 0 (0.0%) | 0 (0.0%) |
| Total | 71 (65.1%) | 38 (34.9%) |
Female Fertility in Durbin
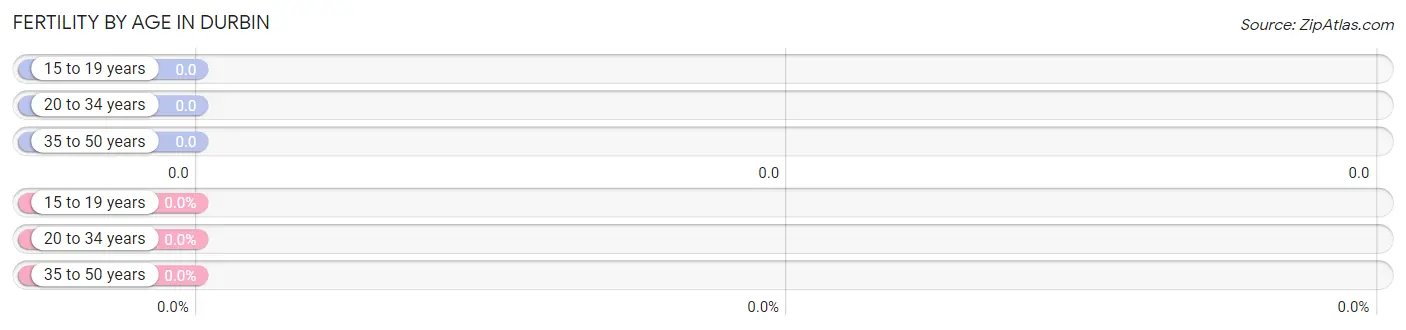
Fertility by Age in Durbin
| Age Bracket | Women with Births | Births / 1,000 Women |
| 15 to 19 years | 0 (0.0%) | 0.0 |
| 20 to 34 years | 0 (0.0%) | 0.0 |
| 35 to 50 years | 0 (0.0%) | 0.0 |
| Total | 0 (0.0%) | 0.0 |
Fertility by Age by Marriage Status in Durbin
| Age Bracket | Married | Unmarried |
| 15 to 19 years | 0 (0.0%) | 0 (0.0%) |
| 20 to 34 years | 0 (0.0%) | 0 (0.0%) |
| 35 to 50 years | 0 (0.0%) | 0 (0.0%) |
| Total | 0 (0.0%) | 0 (0.0%) |
Fertility by Education in Durbin
| Educational Attainment | Women with Births | Births / 1,000 Women |
| Less than High School | 0 (0.0%) | 0.0 |
| High School Diploma | 0 (0.0%) | 0.0 |
| College or Associate's Degree | 0 (0.0%) | 0.0 |
| Bachelor's Degree | 0 (0.0%) | 0.0 |
| Graduate Degree | 0 (0.0%) | 0.0 |
| Total | 0 (0.0%) | 0.0 |
Fertility by Education by Marriage Status in Durbin
| Educational Attainment | Married | Unmarried |
| Less than High School | 0 (0.0%) | 0 (0.0%) |
| High School Diploma | 0 (0.0%) | 0 (0.0%) |
| College or Associate's Degree | 0 (0.0%) | 0 (0.0%) |
| Bachelor's Degree | 0 (0.0%) | 0 (0.0%) |
| Graduate Degree | 0 (0.0%) | 0 (0.0%) |
| Total | 0 (0.0%) | 0 (0.0%) |
Income in Durbin
Income Overview in Durbin
Per Capita Income in Durbin is $23,712, while median incomes of families and households are $65,536 and $55,972 respectively.
| Characteristic | Number | Measure |
| Per Capita Income | 297 | $23,712 |
| Median Family Income | 71 | $65,536 |
| Mean Family Income | 71 | $65,470 |
| Median Household Income | 109 | $55,972 |
| Mean Household Income | 109 | $53,541 |
| Income Deficit | 71 | $0 |
| Wage / Income Gap (%) | 297 | 29.89% |
| Wage / Income Gap ($) | 297 | 70.11¢ per $1 |
| Gini / Inequality Index | 297 | 0.30 |
Earnings by Sex in Durbin
Average Earnings in Durbin are $29,063, $35,417 for men and $24,830 for women, a difference of 29.9%.
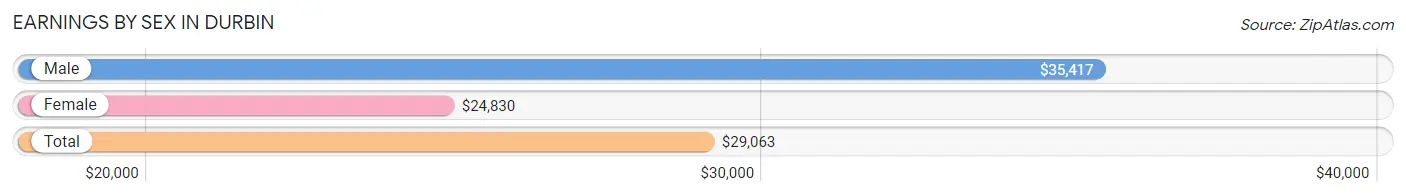
| Sex | Number | Average Earnings |
| Male | 108 (64.7%) | $35,417 |
| Female | 59 (35.3%) | $24,830 |
| Total | 167 (100.0%) | $29,063 |
Earnings by Sex by Income Bracket in Durbin
The most common earnings brackets in Durbin are $45,000 to $49,999 for men (19 | 17.6%) and $25,000 to $29,999 for women (28 | 47.5%).
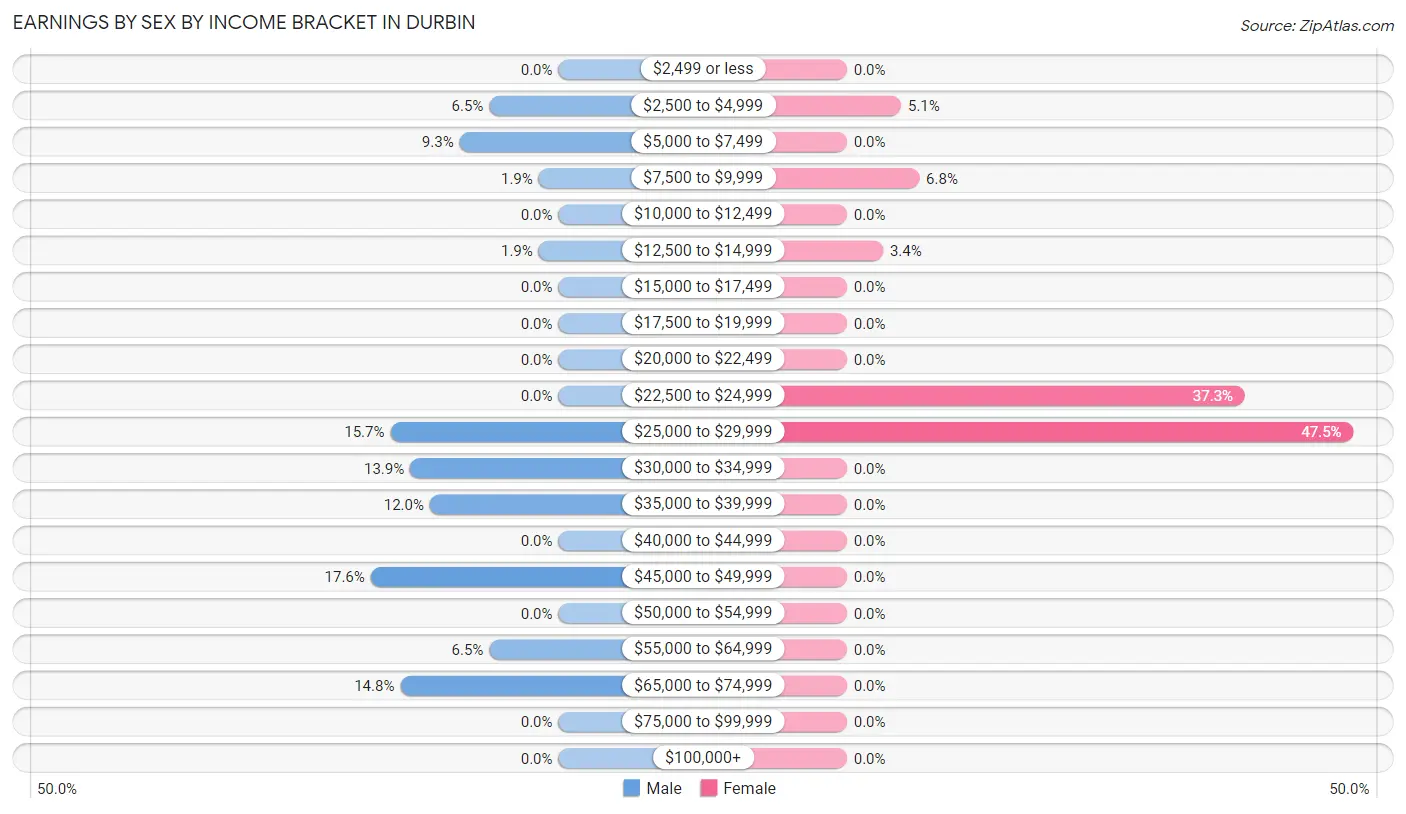
| Income | Male | Female |
| $2,499 or less | 0 (0.0%) | 0 (0.0%) |
| $2,500 to $4,999 | 7 (6.5%) | 3 (5.1%) |
| $5,000 to $7,499 | 10 (9.3%) | 0 (0.0%) |
| $7,500 to $9,999 | 2 (1.8%) | 4 (6.8%) |
| $10,000 to $12,499 | 0 (0.0%) | 0 (0.0%) |
| $12,500 to $14,999 | 2 (1.8%) | 2 (3.4%) |
| $15,000 to $17,499 | 0 (0.0%) | 0 (0.0%) |
| $17,500 to $19,999 | 0 (0.0%) | 0 (0.0%) |
| $20,000 to $22,499 | 0 (0.0%) | 0 (0.0%) |
| $22,500 to $24,999 | 0 (0.0%) | 22 (37.3%) |
| $25,000 to $29,999 | 17 (15.7%) | 28 (47.5%) |
| $30,000 to $34,999 | 15 (13.9%) | 0 (0.0%) |
| $35,000 to $39,999 | 13 (12.0%) | 0 (0.0%) |
| $40,000 to $44,999 | 0 (0.0%) | 0 (0.0%) |
| $45,000 to $49,999 | 19 (17.6%) | 0 (0.0%) |
| $50,000 to $54,999 | 0 (0.0%) | 0 (0.0%) |
| $55,000 to $64,999 | 7 (6.5%) | 0 (0.0%) |
| $65,000 to $74,999 | 16 (14.8%) | 0 (0.0%) |
| $75,000 to $99,999 | 0 (0.0%) | 0 (0.0%) |
| $100,000+ | 0 (0.0%) | 0 (0.0%) |
| Total | 108 (100.0%) | 59 (100.0%) |
Earnings by Sex by Educational Attainment in Durbin
Average earnings in Durbin are $35,417 for men and $24,034 for women, a difference of 32.1%. Men with an educational attainment of bachelor's degree enjoy the highest average annual earnings of $56,875, while those with less than high school education earn the least with $28,917. Women with an educational attainment of high school diploma earn the most with the average annual earnings of $23,625, while those with high school diploma education have the smallest earnings of $23,625.
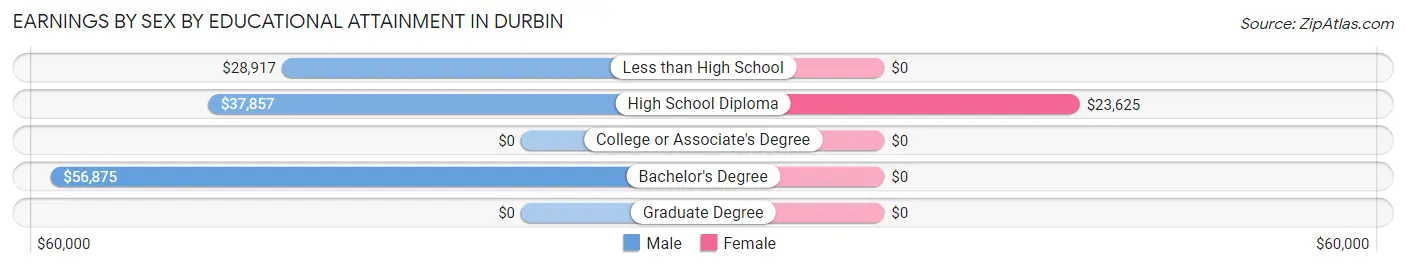
| Educational Attainment | Male Income | Female Income |
| Less than High School | $28,917 | $0 |
| High School Diploma | $37,857 | $23,625 |
| College or Associate's Degree | - | - |
| Bachelor's Degree | $56,875 | $0 |
| Graduate Degree | - | - |
| Total | $35,417 | $24,034 |
Family Income in Durbin
Family Income Brackets in Durbin
According to the Durbin family income data, there are 27 families falling into the $75,000 to $99,999 income range, which is the most common income bracket and makes up 38.0% of all families.
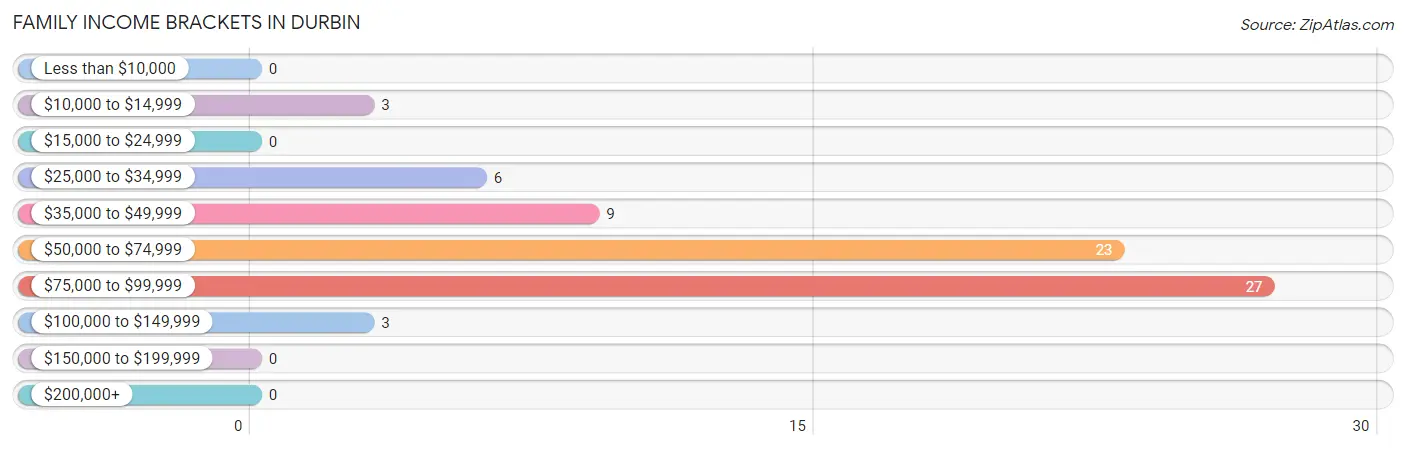
| Income Bracket | # Families | % Families |
| Less than $10,000 | 0 | 0.0% |
| $10,000 to $14,999 | 3 | 4.2% |
| $15,000 to $24,999 | 0 | 0.0% |
| $25,000 to $34,999 | 6 | 8.5% |
| $35,000 to $49,999 | 9 | 12.7% |
| $50,000 to $74,999 | 23 | 32.4% |
| $75,000 to $99,999 | 27 | 38.0% |
| $100,000 to $149,999 | 3 | 4.2% |
| $150,000 to $199,999 | 0 | 0.0% |
| $200,000+ | 0 | 0.0% |
Family Income by Famaliy Size in Durbin
2-person families (59 | 83.1%) account for the highest median family income in Durbin with $66,250 per family, while 2-person families (59 | 83.1%) have the highest median income of $33,125 per family member.
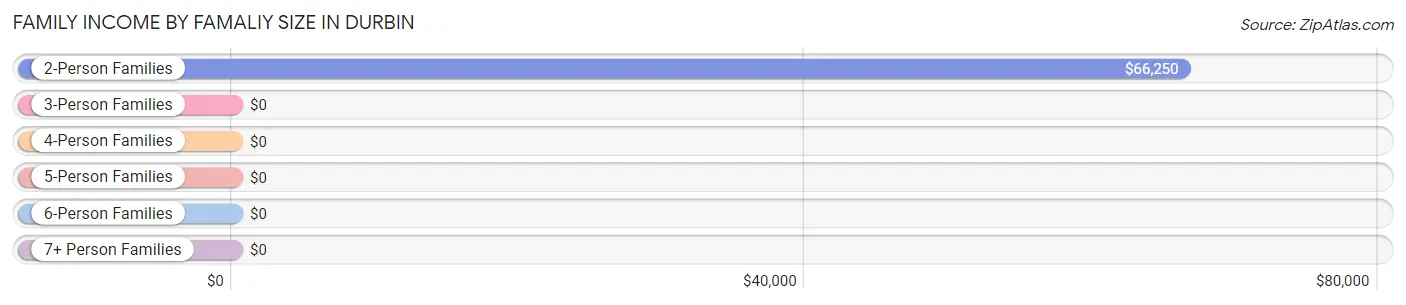
| Income Bracket | # Families | Median Income |
| 2-Person Families | 59 (83.1%) | $66,250 |
| 3-Person Families | 7 (9.9%) | $0 |
| 4-Person Families | 2 (2.8%) | $0 |
| 5-Person Families | 3 (4.2%) | $0 |
| 6-Person Families | 0 (0.0%) | $0 |
| 7+ Person Families | 0 (0.0%) | $0 |
| Total | 71 (100.0%) | $65,536 |
Family Income by Number of Earners in Durbin
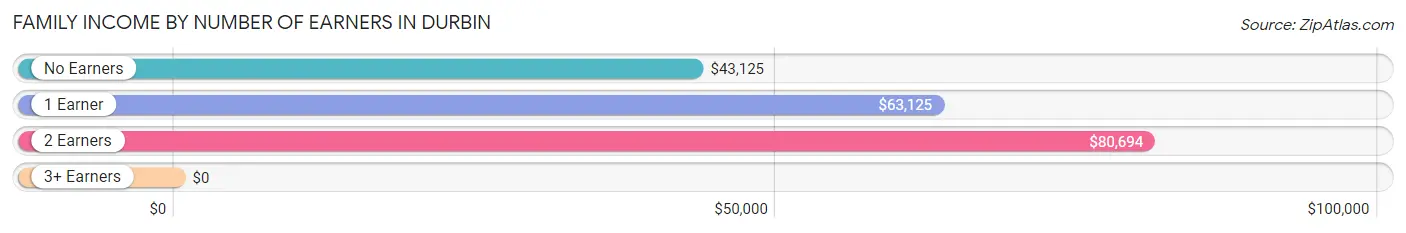
| Number of Earners | # Families | Median Income |
| No Earners | 15 (21.1%) | $43,125 |
| 1 Earner | 13 (18.3%) | $63,125 |
| 2 Earners | 43 (60.6%) | $80,694 |
| 3+ Earners | 0 (0.0%) | $0 |
| Total | 71 (100.0%) | $65,536 |
Household Income in Durbin
Household Income Brackets in Durbin
With 30 households falling in the category, the $50,000 to $74,999 income range is the most frequent in Durbin, accounting for 27.5% of all households.
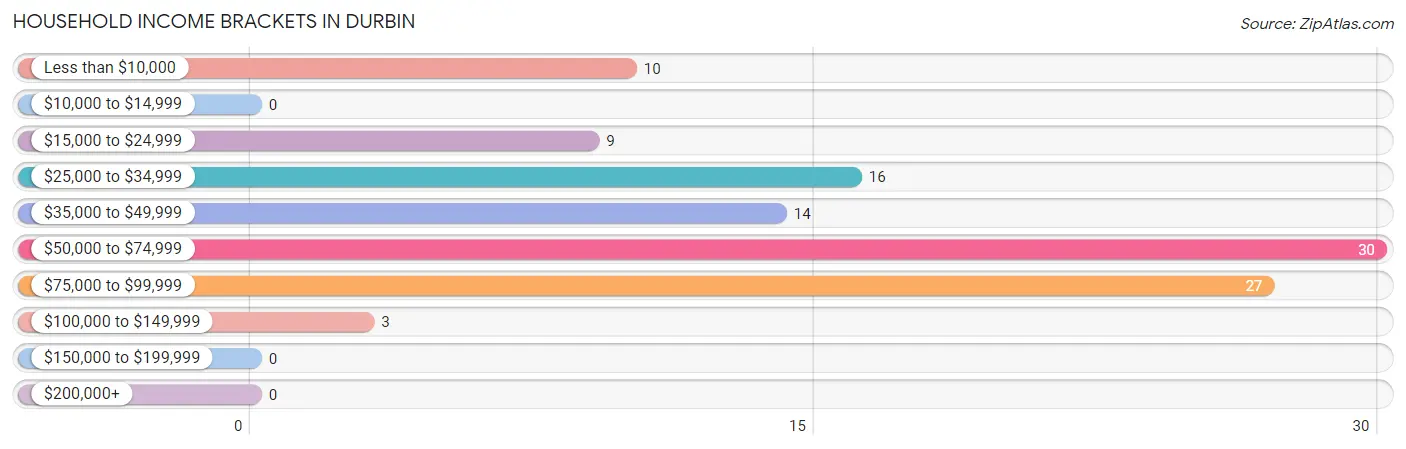
| Income Bracket | # Households | % Households |
| Less than $10,000 | 10 | 9.2% |
| $10,000 to $14,999 | 0 | 0.0% |
| $15,000 to $24,999 | 9 | 8.3% |
| $25,000 to $34,999 | 16 | 14.7% |
| $35,000 to $49,999 | 14 | 12.8% |
| $50,000 to $74,999 | 30 | 27.5% |
| $75,000 to $99,999 | 27 | 24.8% |
| $100,000 to $149,999 | 3 | 2.8% |
| $150,000 to $199,999 | 0 | 0.0% |
| $200,000+ | 0 | 0.0% |
Household Income by Householder Age in Durbin
The median household income in Durbin is $55,972, with the highest median household income of $70,833 found in the 45 to 64 years age bracket for the primary householder. A total of 52 households (47.7%) fall into this category.
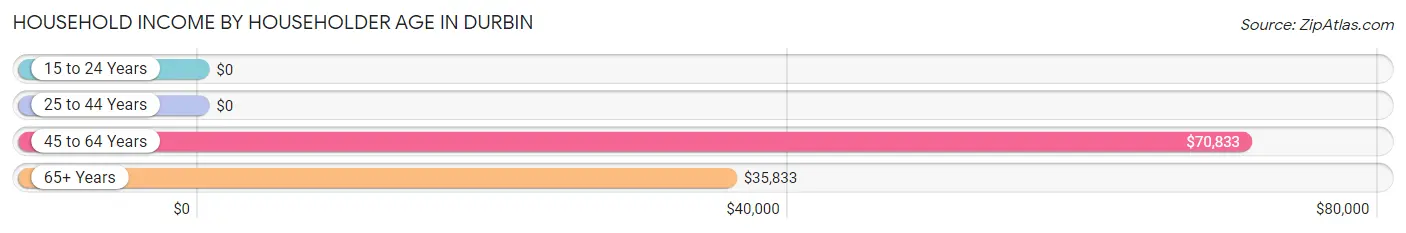
| Income Bracket | # Households | Median Income |
| 15 to 24 Years | 0 (0.0%) | $0 |
| 25 to 44 Years | 11 (10.1%) | $0 |
| 45 to 64 Years | 52 (47.7%) | $70,833 |
| 65+ Years | 46 (42.2%) | $35,833 |
| Total | 109 (100.0%) | $55,972 |
Poverty in Durbin
Income Below Poverty by Sex and Age in Durbin
With 14.5% poverty level for males and 9.4% for females among the residents of Durbin, 18 to 24 year old males and 25 to 34 year old females are the most vulnerable to poverty, with 9 males (100.0%) and 2 females (100.0%) in their respective age groups living below the poverty level.
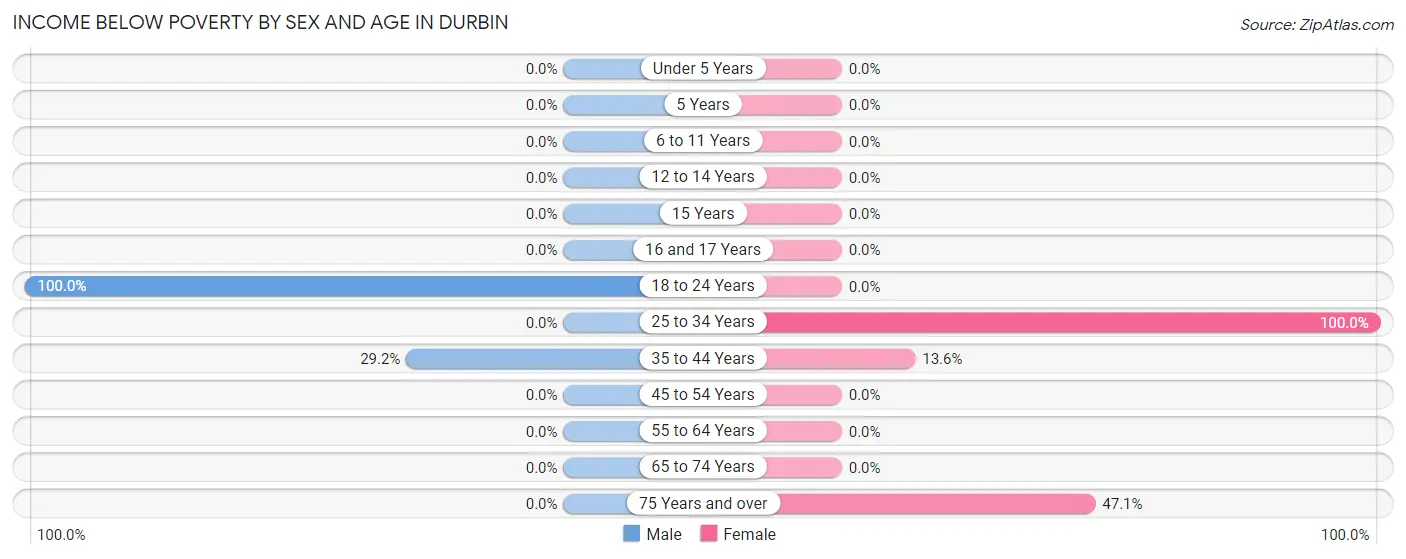
| Age Bracket | Male | Female |
| Under 5 Years | 0 (0.0%) | 0 (0.0%) |
| 5 Years | 0 (0.0%) | 0 (0.0%) |
| 6 to 11 Years | 0 (0.0%) | 0 (0.0%) |
| 12 to 14 Years | 0 (0.0%) | 0 (0.0%) |
| 15 Years | 0 (0.0%) | 0 (0.0%) |
| 16 and 17 Years | 0 (0.0%) | 0 (0.0%) |
| 18 to 24 Years | 9 (100.0%) | 0 (0.0%) |
| 25 to 34 Years | 0 (0.0%) | 2 (100.0%) |
| 35 to 44 Years | 14 (29.2%) | 3 (13.6%) |
| 45 to 54 Years | 0 (0.0%) | 0 (0.0%) |
| 55 to 64 Years | 0 (0.0%) | 0 (0.0%) |
| 65 to 74 Years | 0 (0.0%) | 0 (0.0%) |
| 75 Years and over | 0 (0.0%) | 8 (47.1%) |
| Total | 23 (14.5%) | 13 (9.4%) |
Income Above Poverty by Sex and Age in Durbin
According to the poverty statistics in Durbin, males aged 12 to 14 years and females aged 12 to 14 years are the age groups that are most secure financially, with 100.0% of males and 100.0% of females in these age groups living above the poverty line.
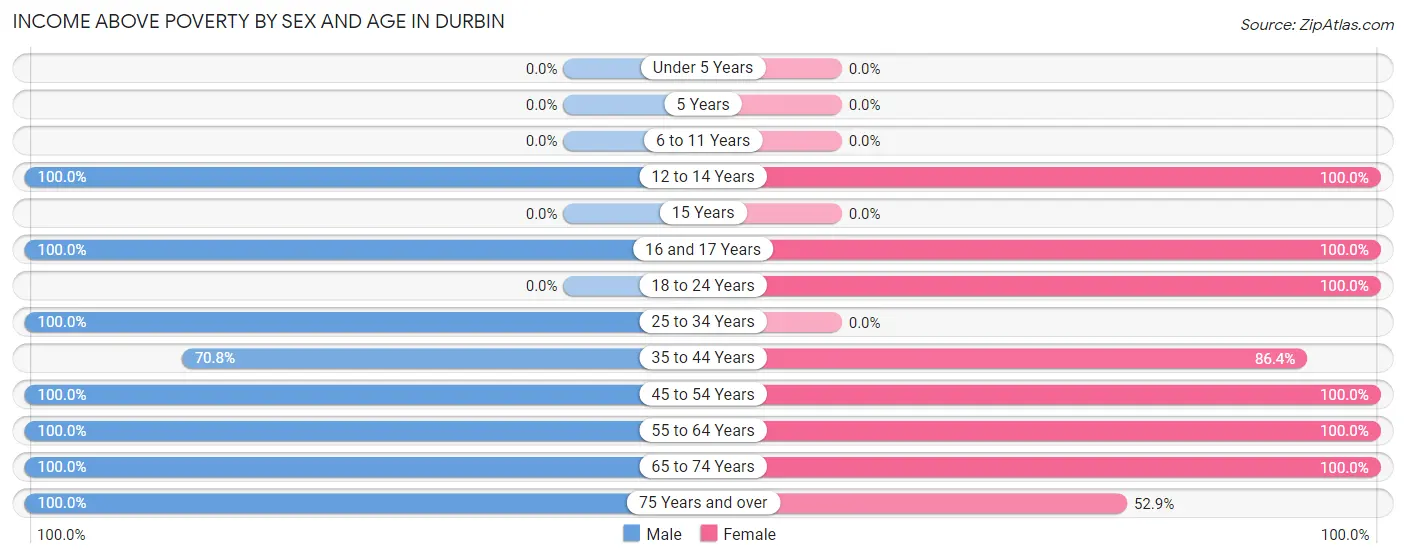
| Age Bracket | Male | Female |
| Under 5 Years | 0 (0.0%) | 0 (0.0%) |
| 5 Years | 0 (0.0%) | 0 (0.0%) |
| 6 to 11 Years | 0 (0.0%) | 0 (0.0%) |
| 12 to 14 Years | 10 (100.0%) | 5 (100.0%) |
| 15 Years | 0 (0.0%) | 0 (0.0%) |
| 16 and 17 Years | 3 (100.0%) | 3 (100.0%) |
| 18 to 24 Years | 0 (0.0%) | 14 (100.0%) |
| 25 to 34 Years | 8 (100.0%) | 0 (0.0%) |
| 35 to 44 Years | 34 (70.8%) | 19 (86.4%) |
| 45 to 54 Years | 6 (100.0%) | 47 (100.0%) |
| 55 to 64 Years | 52 (100.0%) | 6 (100.0%) |
| 65 to 74 Years | 15 (100.0%) | 22 (100.0%) |
| 75 Years and over | 8 (100.0%) | 9 (52.9%) |
| Total | 136 (85.5%) | 125 (90.6%) |
Income Below Poverty Among Married-Couple Families in Durbin
The poverty statistics for married-couple families in Durbin show that 5.2% or 3 of the total 58 families live below the poverty line. Families with no children have the highest poverty rate of 5.9%, comprising of 3 families. On the other hand, families with 1 or 2 children have the lowest poverty rate of 0.0%, which includes 0 families.
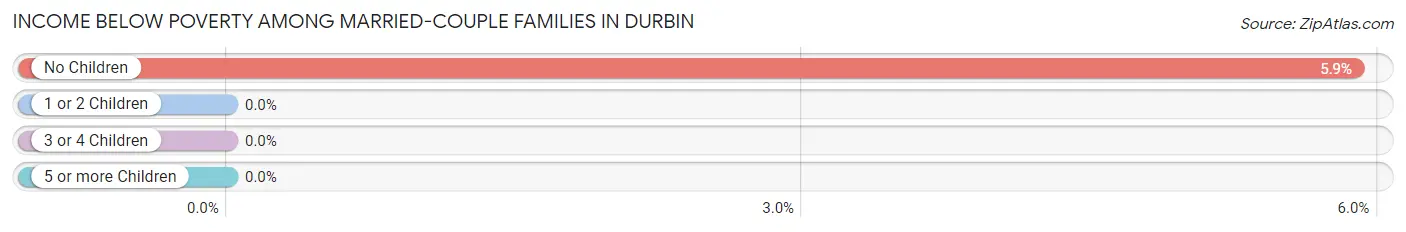
| Children | Above Poverty | Below Poverty |
| No Children | 48 (94.1%) | 3 (5.9%) |
| 1 or 2 Children | 4 (100.0%) | 0 (0.0%) |
| 3 or 4 Children | 3 (100.0%) | 0 (0.0%) |
| 5 or more Children | 0 (0.0%) | 0 (0.0%) |
| Total | 55 (94.8%) | 3 (5.2%) |
Income Below Poverty Among Single-Parent Households in Durbin
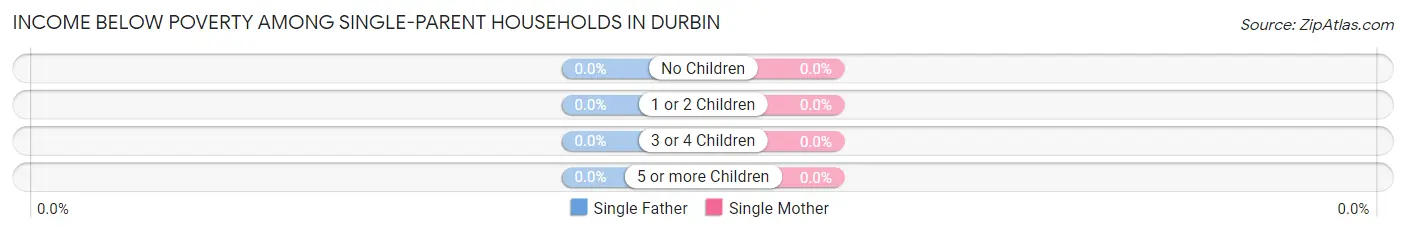
| Children | Single Father | Single Mother |
| No Children | 0 (0.0%) | 0 (0.0%) |
| 1 or 2 Children | 0 (0.0%) | 0 (0.0%) |
| 3 or 4 Children | 0 (0.0%) | 0 (0.0%) |
| 5 or more Children | 0 (0.0%) | 0 (0.0%) |
| Total | 0 (0.0%) | 0 (0.0%) |
Income Below Poverty Among Married-Couple vs Single-Parent Households in Durbin
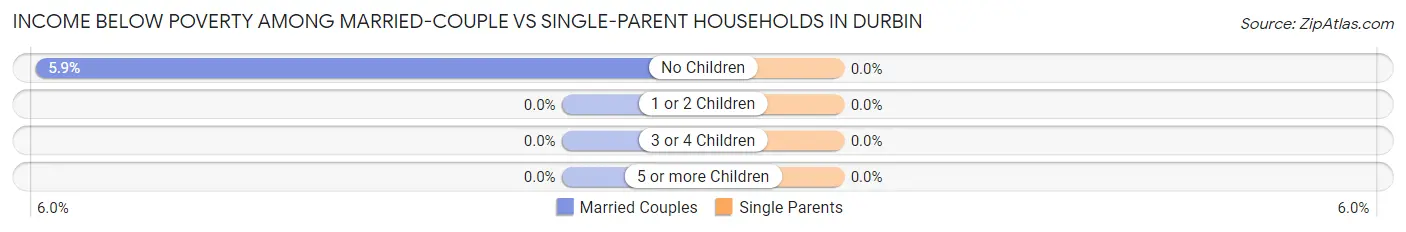
| Children | Married-Couple Families | Single-Parent Households |
| No Children | 3 (5.9%) | 0 (0.0%) |
| 1 or 2 Children | 0 (0.0%) | 0 (0.0%) |
| 3 or 4 Children | 0 (0.0%) | 0 (0.0%) |
| 5 or more Children | 0 (0.0%) | 0 (0.0%) |
| Total | 3 (5.2%) | 0 (0.0%) |
Employment Characteristics in Durbin
Employment by Class of Employer in Durbin
Among the 131 employed individuals in Durbin, private company employees (78 | 59.5%), self-employed (incorporated) (33 | 25.2%), and not-for-profit organizations (11 | 8.4%) make up the most common classes of employment.
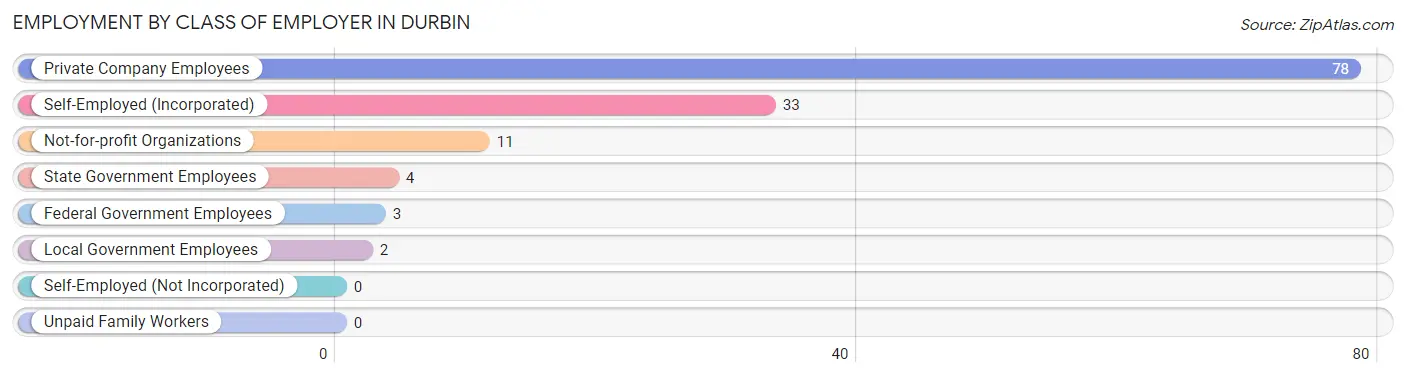
| Employer Class | # Employees | % Employees |
| Private Company Employees | 78 | 59.5% |
| Self-Employed (Incorporated) | 33 | 25.2% |
| Self-Employed (Not Incorporated) | 0 | 0.0% |
| Not-for-profit Organizations | 11 | 8.4% |
| Local Government Employees | 2 | 1.5% |
| State Government Employees | 4 | 3.0% |
| Federal Government Employees | 3 | 2.3% |
| Unpaid Family Workers | 0 | 0.0% |
| Total | 131 | 100.0% |
Employment Status by Age in Durbin
According to the labor force statistics for Durbin, out of the total population over 16 years of age (282), 55.7% or 157 individuals are in the labor force, with 16.6% or 26 of them unemployed. The age group with the highest labor force participation rate is 20 to 24 years, with 100.0% or 14 individuals in the labor force. Within the labor force, the 16 to 19 years age range has the highest percentage of unemployed individuals, with 100.0% or 9 of them being unemployed.
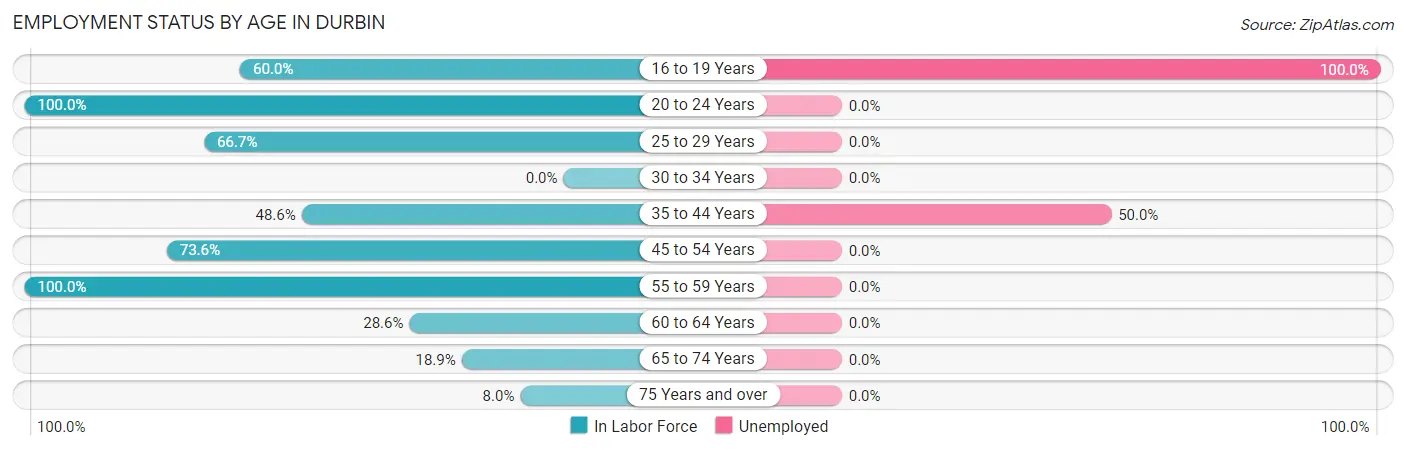
| Age Bracket | In Labor Force | Unemployed |
| 16 to 19 Years | 9 (60.0%) | 9 (100.0%) |
| 20 to 24 Years | 14 (100.0%) | 0 (0.0%) |
| 25 to 29 Years | 4 (66.7%) | 0 (0.0%) |
| 30 to 34 Years | 0 (0.0%) | 0 (0.0%) |
| 35 to 44 Years | 34 (48.6%) | 17 (50.0%) |
| 45 to 54 Years | 39 (73.6%) | 0 (0.0%) |
| 55 to 59 Years | 44 (100.0%) | 0 (0.0%) |
| 60 to 64 Years | 4 (28.6%) | 0 (0.0%) |
| 65 to 74 Years | 7 (18.9%) | 0 (0.0%) |
| 75 Years and over | 2 (8.0%) | 0 (0.0%) |
| Total | 157 (55.7%) | 26 (16.6%) |
Employment Status by Educational Attainment in Durbin
According to labor force statistics for Durbin, 65.4% of individuals (125) out of the total population between 25 and 64 years of age (191) are in the labor force, with 13.6% or 17 of them being unemployed. The group with the highest labor force participation rate are those with the educational attainment of college / associate degree, with 100.0% or 7 individuals in the labor force. Within the labor force, individuals with high school diploma education have the highest percentage of unemployment, with 21.0% or 17 of them being unemployed.
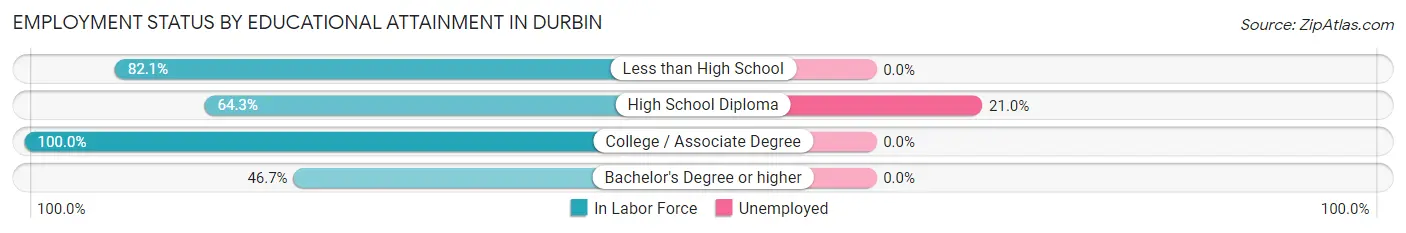
| Educational Attainment | In Labor Force | Unemployed |
| Less than High School | 23 (82.1%) | 0 (0.0%) |
| High School Diploma | 81 (64.3%) | 26 (21.0%) |
| College / Associate Degree | 7 (100.0%) | 0 (0.0%) |
| Bachelor's Degree or higher | 14 (46.7%) | 0 (0.0%) |
| Total | 125 (65.4%) | 26 (13.6%) |
Employment Occupations by Sex in Durbin
Management, Business, Science and Arts Occupations
The most common Management, Business, Science and Arts occupations in Durbin are Computers, Engineering & Science (6 | 4.6%), Architecture & Engineering (3 | 2.3%), Life, Physical & Social Science (3 | 2.3%), and Management (2 | 1.5%).
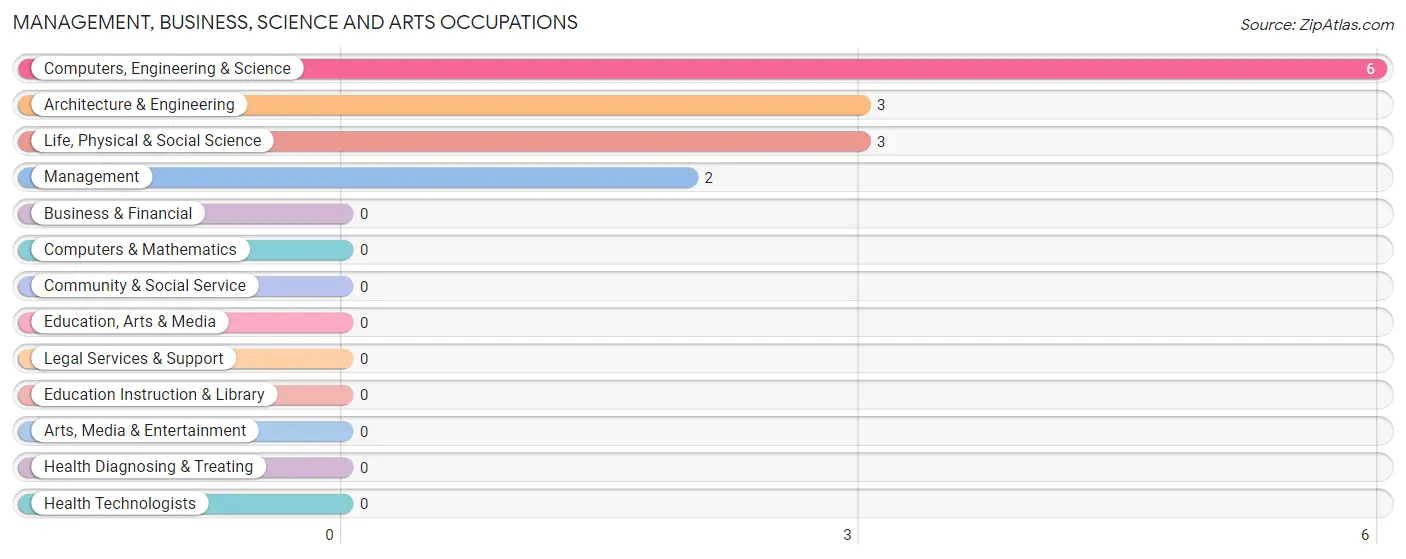
Management, Business, Science and Arts Occupations by Sex
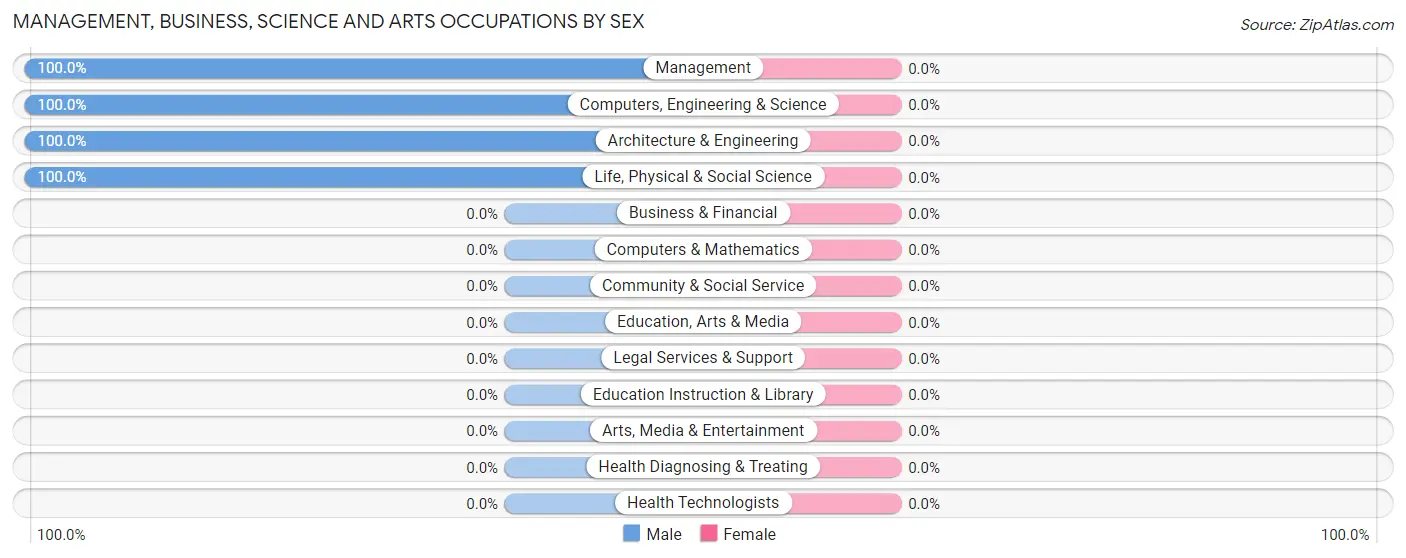
| Occupation | Male | Female |
| Management | 2 (100.0%) | 0 (0.0%) |
| Business & Financial | 0 (0.0%) | 0 (0.0%) |
| Computers, Engineering & Science | 6 (100.0%) | 0 (0.0%) |
| Computers & Mathematics | 0 (0.0%) | 0 (0.0%) |
| Architecture & Engineering | 3 (100.0%) | 0 (0.0%) |
| Life, Physical & Social Science | 3 (100.0%) | 0 (0.0%) |
| Community & Social Service | 0 (0.0%) | 0 (0.0%) |
| Education, Arts & Media | 0 (0.0%) | 0 (0.0%) |
| Legal Services & Support | 0 (0.0%) | 0 (0.0%) |
| Education Instruction & Library | 0 (0.0%) | 0 (0.0%) |
| Arts, Media & Entertainment | 0 (0.0%) | 0 (0.0%) |
| Health Diagnosing & Treating | 0 (0.0%) | 0 (0.0%) |
| Health Technologists | 0 (0.0%) | 0 (0.0%) |
| Total (Category) | 8 (100.0%) | 0 (0.0%) |
| Total (Overall) | 75 (57.3%) | 56 (42.7%) |
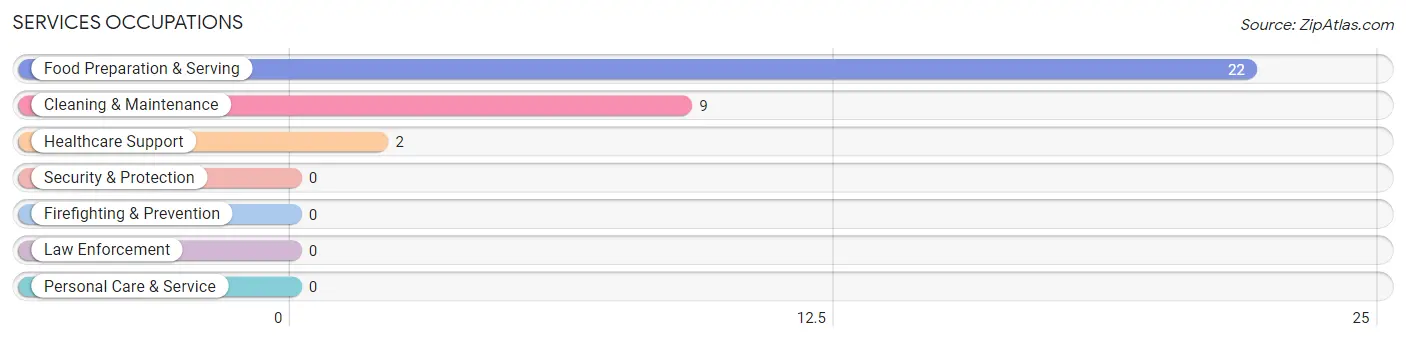
Services Occupations
The most common Services occupations in Durbin are Food Preparation & Serving (22 | 16.8%), Cleaning & Maintenance (9 | 6.9%), and Healthcare Support (2 | 1.5%).
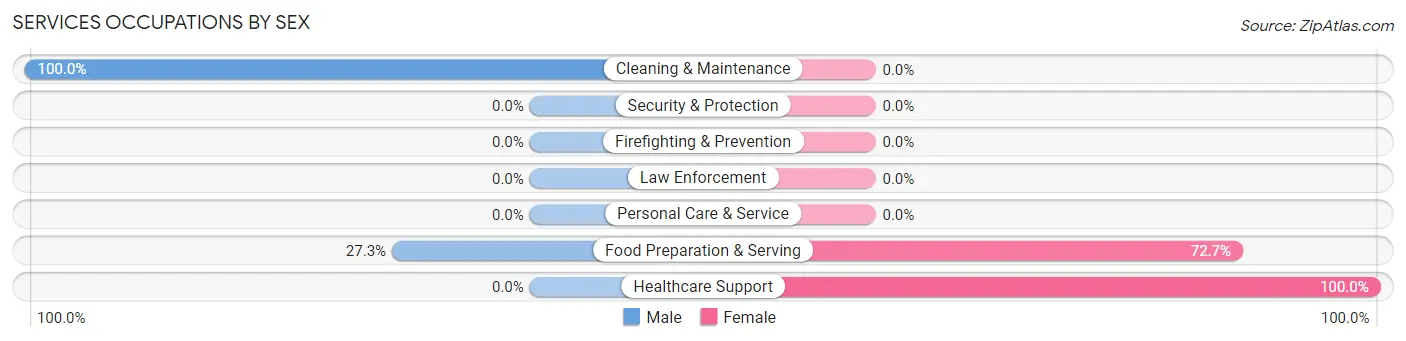
Services Occupations by Sex
Within the Services occupations in Durbin, the most male-oriented occupations are Cleaning & Maintenance (100.0%), and Food Preparation & Serving (27.3%), while the most female-oriented occupations are Healthcare Support (100.0%), and Food Preparation & Serving (72.7%).
| Occupation | Male | Female |
| Healthcare Support | 0 (0.0%) | 2 (100.0%) |
| Security & Protection | 0 (0.0%) | 0 (0.0%) |
| Firefighting & Prevention | 0 (0.0%) | 0 (0.0%) |
| Law Enforcement | 0 (0.0%) | 0 (0.0%) |
| Food Preparation & Serving | 6 (27.3%) | 16 (72.7%) |
| Cleaning & Maintenance | 9 (100.0%) | 0 (0.0%) |
| Personal Care & Service | 0 (0.0%) | 0 (0.0%) |
| Total (Category) | 15 (45.5%) | 18 (54.5%) |
| Total (Overall) | 75 (57.3%) | 56 (42.7%) |
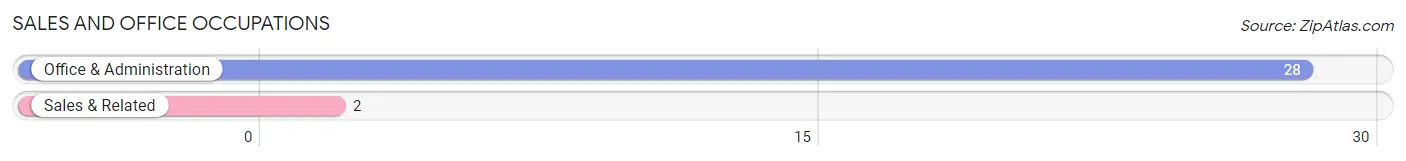
Sales and Office Occupations
The most common Sales and Office occupations in Durbin are Office & Administration (28 | 21.4%), and Sales & Related (2 | 1.5%).
Sales and Office Occupations by Sex
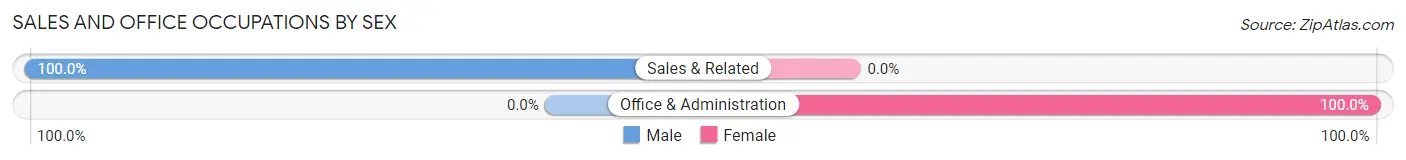
| Occupation | Male | Female |
| Sales & Related | 2 (100.0%) | 0 (0.0%) |
| Office & Administration | 0 (0.0%) | 28 (100.0%) |
| Total (Category) | 2 (6.7%) | 28 (93.3%) |
| Total (Overall) | 75 (57.3%) | 56 (42.7%) |
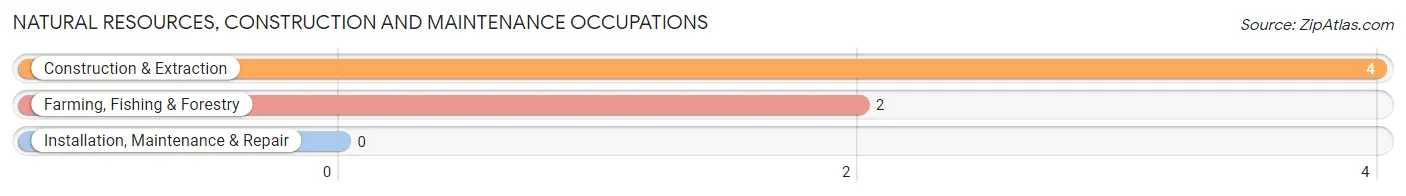
Natural Resources, Construction and Maintenance Occupations
The most common Natural Resources, Construction and Maintenance occupations in Durbin are Construction & Extraction (4 | 3.0%), and Farming, Fishing & Forestry (2 | 1.5%).
Natural Resources, Construction and Maintenance Occupations by Sex
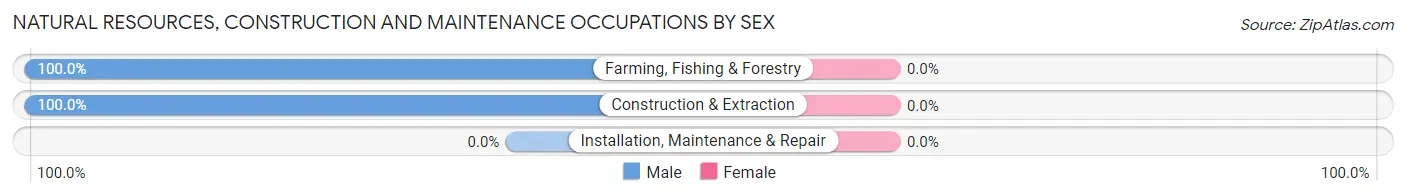
| Occupation | Male | Female |
| Farming, Fishing & Forestry | 2 (100.0%) | 0 (0.0%) |
| Construction & Extraction | 4 (100.0%) | 0 (0.0%) |
| Installation, Maintenance & Repair | 0 (0.0%) | 0 (0.0%) |
| Total (Category) | 6 (100.0%) | 0 (0.0%) |
| Total (Overall) | 75 (57.3%) | 56 (42.7%) |
Production, Transportation and Moving Occupations
The most common Production, Transportation and Moving occupations in Durbin are Material Moving (30 | 22.9%), and Production (24 | 18.3%).
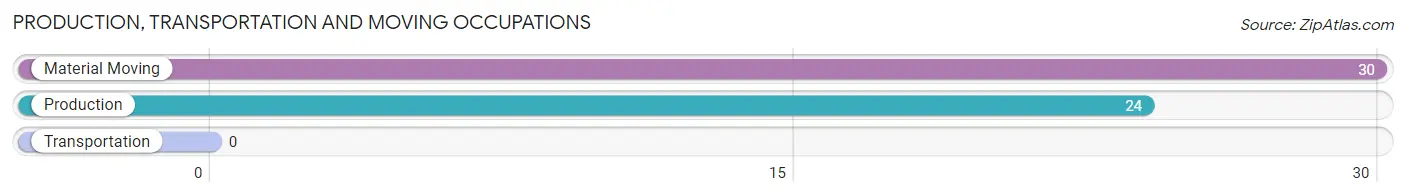
Production, Transportation and Moving Occupations by Sex
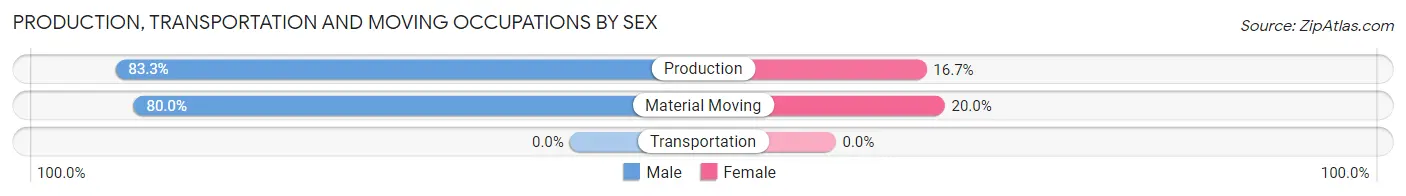
| Occupation | Male | Female |
| Production | 20 (83.3%) | 4 (16.7%) |
| Transportation | 0 (0.0%) | 0 (0.0%) |
| Material Moving | 24 (80.0%) | 6 (20.0%) |
| Total (Category) | 44 (81.5%) | 10 (18.5%) |
| Total (Overall) | 75 (57.3%) | 56 (42.7%) |
Employment Industries by Sex in Durbin
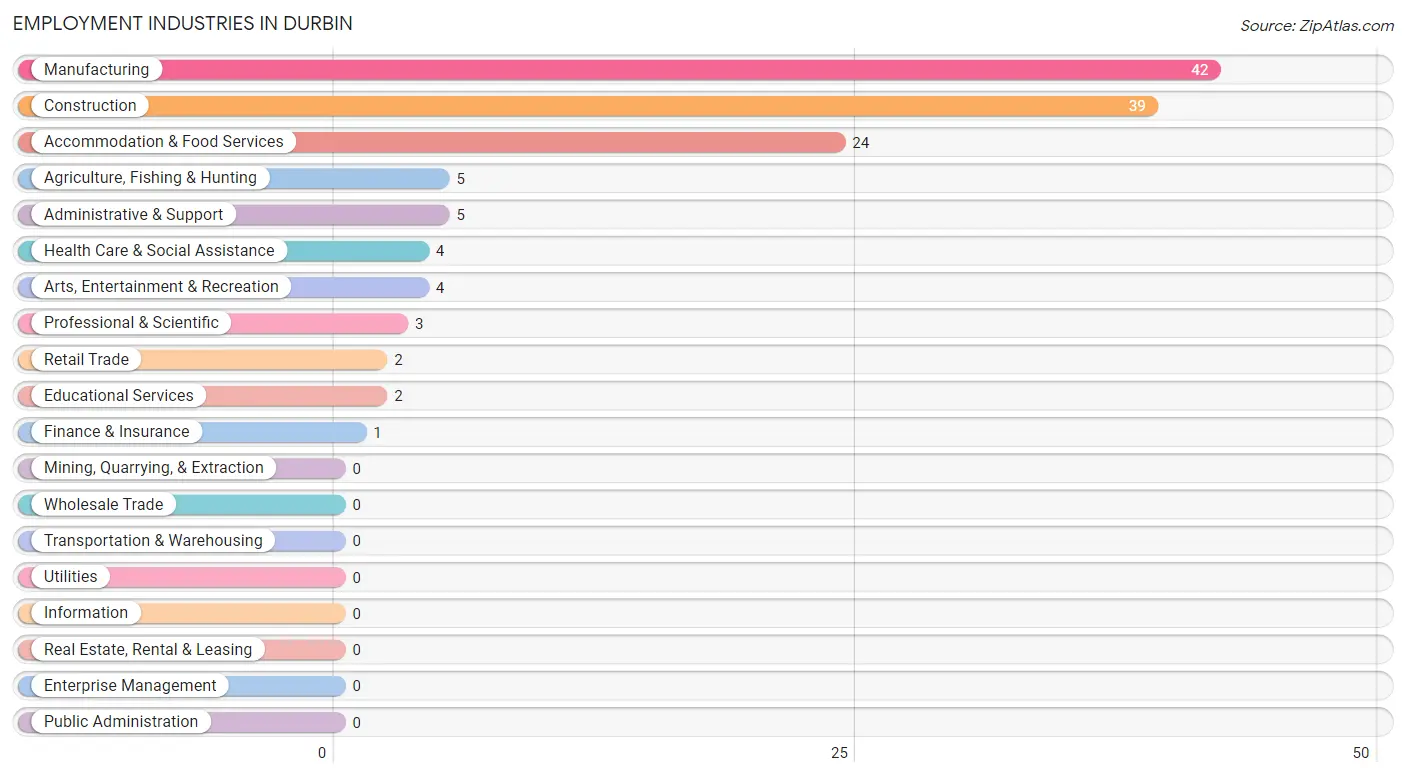
Employment Industries in Durbin
The major employment industries in Durbin include Manufacturing (42 | 32.1%), Construction (39 | 29.8%), Accommodation & Food Services (24 | 18.3%), Agriculture, Fishing & Hunting (5 | 3.8%), and Administrative & Support (5 | 3.8%).
Employment Industries by Sex in Durbin
The Durbin industries that see more men than women are Agriculture, Fishing & Hunting (100.0%), Retail Trade (100.0%), and Professional & Scientific (100.0%), whereas the industries that tend to have a higher number of women are Finance & Insurance (100.0%), Educational Services (100.0%), and Health Care & Social Assistance (100.0%).
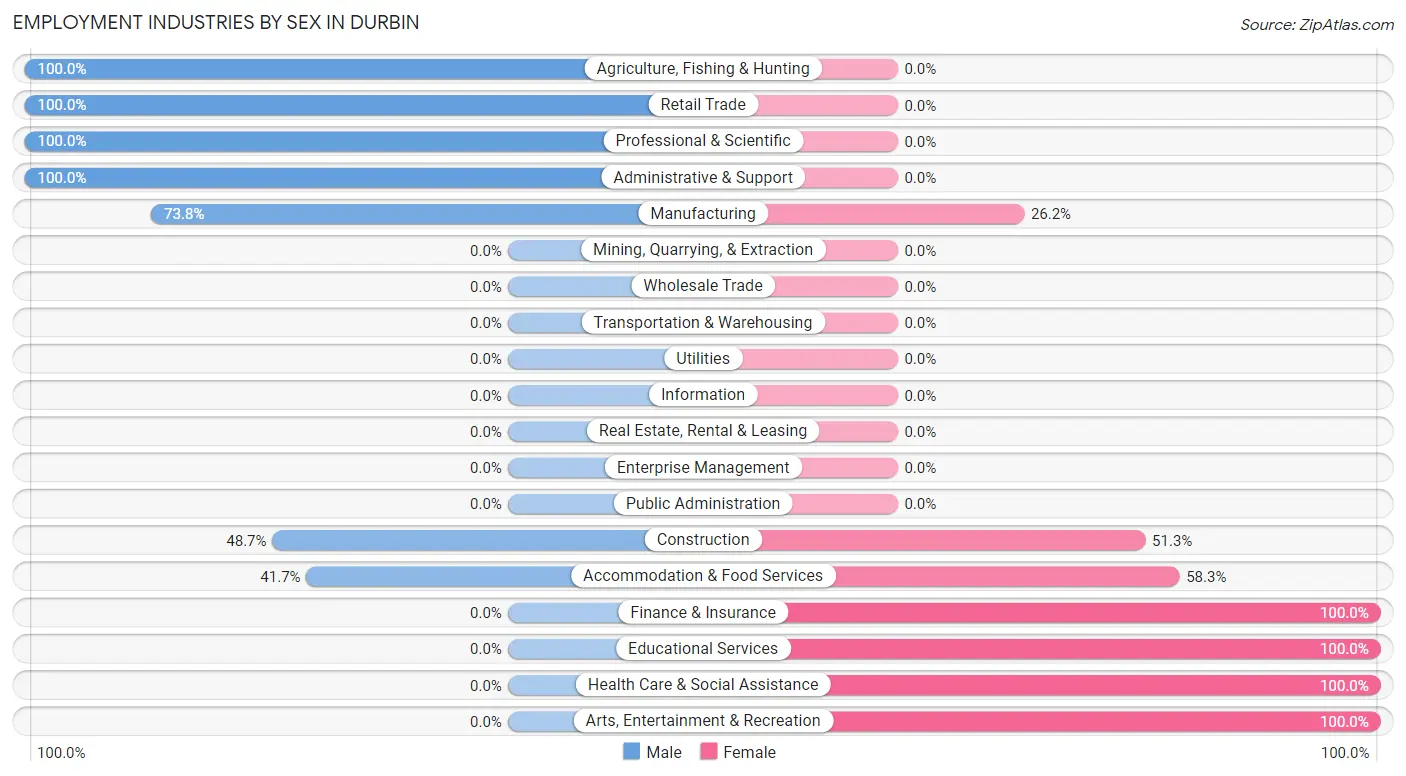
| Industry | Male | Female |
| Agriculture, Fishing & Hunting | 5 (100.0%) | 0 (0.0%) |
| Mining, Quarrying, & Extraction | 0 (0.0%) | 0 (0.0%) |
| Construction | 19 (48.7%) | 20 (51.3%) |
| Manufacturing | 31 (73.8%) | 11 (26.2%) |
| Wholesale Trade | 0 (0.0%) | 0 (0.0%) |
| Retail Trade | 2 (100.0%) | 0 (0.0%) |
| Transportation & Warehousing | 0 (0.0%) | 0 (0.0%) |
| Utilities | 0 (0.0%) | 0 (0.0%) |
| Information | 0 (0.0%) | 0 (0.0%) |
| Finance & Insurance | 0 (0.0%) | 1 (100.0%) |
| Real Estate, Rental & Leasing | 0 (0.0%) | 0 (0.0%) |
| Professional & Scientific | 3 (100.0%) | 0 (0.0%) |
| Enterprise Management | 0 (0.0%) | 0 (0.0%) |
| Administrative & Support | 5 (100.0%) | 0 (0.0%) |
| Educational Services | 0 (0.0%) | 2 (100.0%) |
| Health Care & Social Assistance | 0 (0.0%) | 4 (100.0%) |
| Arts, Entertainment & Recreation | 0 (0.0%) | 4 (100.0%) |
| Accommodation & Food Services | 10 (41.7%) | 14 (58.3%) |
| Public Administration | 0 (0.0%) | 0 (0.0%) |
| Total | 75 (57.3%) | 56 (42.7%) |
Education in Durbin
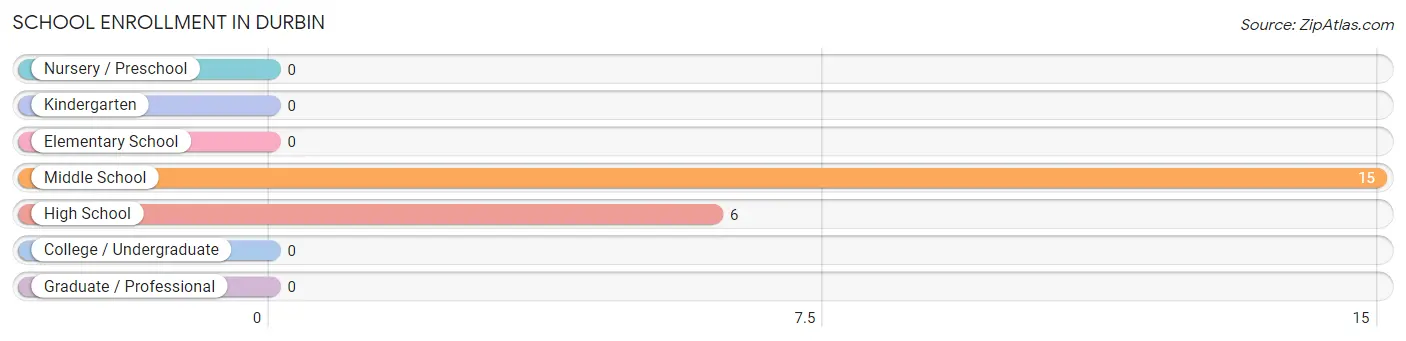
School Enrollment in Durbin
The most common levels of schooling among the 21 students in Durbin are middle school (15 | 71.4%), and high school (6 | 28.6%).
| School Level | # Students | % Students |
| Nursery / Preschool | 0 | 0.0% |
| Kindergarten | 0 | 0.0% |
| Elementary School | 0 | 0.0% |
| Middle School | 15 | 71.4% |
| High School | 6 | 28.6% |
| College / Undergraduate | 0 | 0.0% |
| Graduate / Professional | 0 | 0.0% |
| Total | 21 | 100.0% |
School Enrollment by Age by Funding Source in Durbin
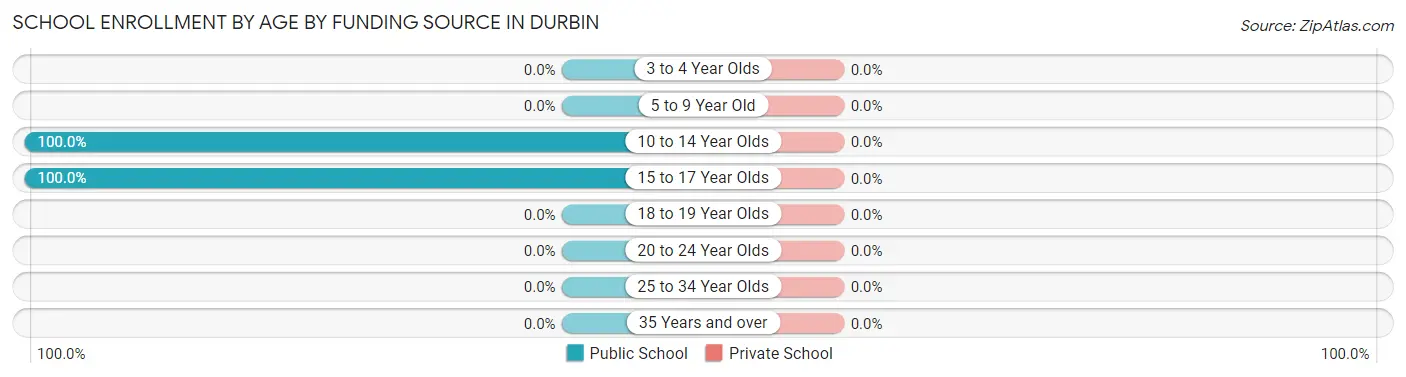
| Age Bracket | Public School | Private School |
| 3 to 4 Year Olds | 0 (0.0%) | 0 (0.0%) |
| 5 to 9 Year Old | 0 (0.0%) | 0 (0.0%) |
| 10 to 14 Year Olds | 15 (100.0%) | 0 (0.0%) |
| 15 to 17 Year Olds | 6 (100.0%) | 0 (0.0%) |
| 18 to 19 Year Olds | 0 (0.0%) | 0 (0.0%) |
| 20 to 24 Year Olds | 0 (0.0%) | 0 (0.0%) |
| 25 to 34 Year Olds | 0 (0.0%) | 0 (0.0%) |
| 35 Years and over | 0 (0.0%) | 0 (0.0%) |
| Total | 21 (100.0%) | 0 (0.0%) |
Educational Attainment by Field of Study in Durbin
Bio, nature & agricultural (17 | 53.1%), science & technology (5 | 15.6%), education (4 | 12.5%), psychology (2 | 6.2%), and business (2 | 6.2%) are the most common fields of study among 32 individuals in Durbin who have obtained a bachelor's degree or higher.
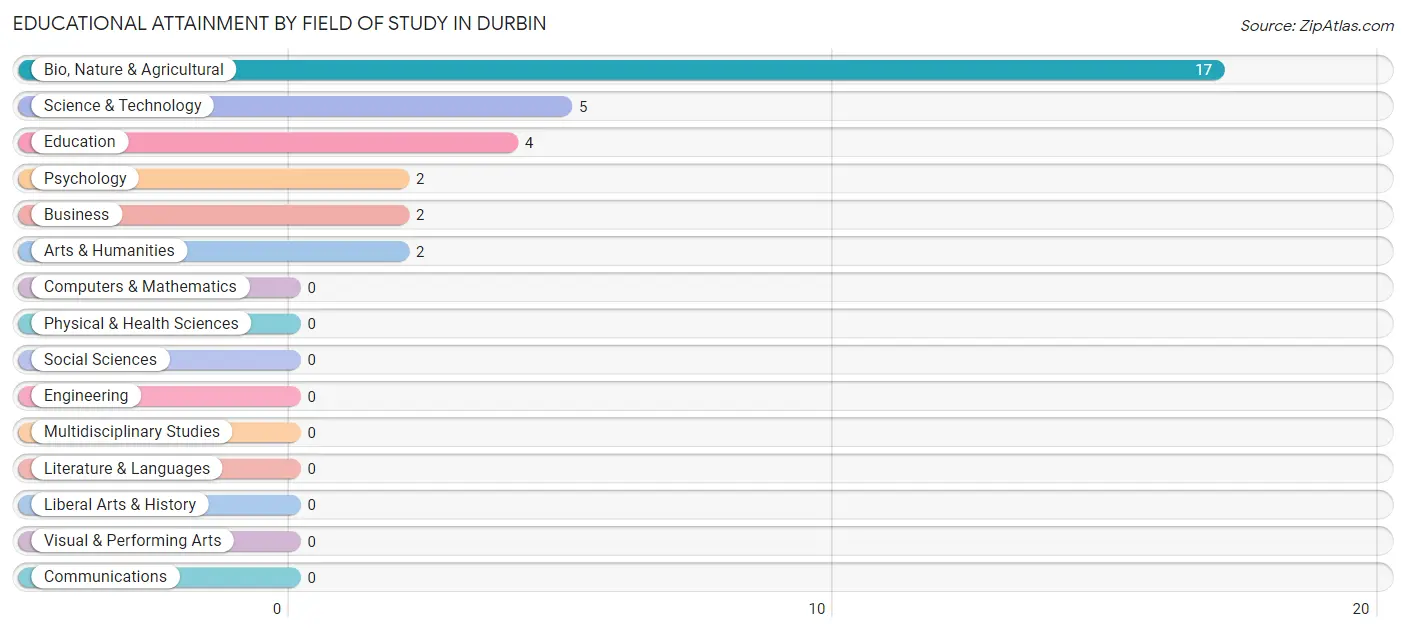
| Field of Study | # Graduates | % Graduates |
| Computers & Mathematics | 0 | 0.0% |
| Bio, Nature & Agricultural | 17 | 53.1% |
| Physical & Health Sciences | 0 | 0.0% |
| Psychology | 2 | 6.2% |
| Social Sciences | 0 | 0.0% |
| Engineering | 0 | 0.0% |
| Multidisciplinary Studies | 0 | 0.0% |
| Science & Technology | 5 | 15.6% |
| Business | 2 | 6.2% |
| Education | 4 | 12.5% |
| Literature & Languages | 0 | 0.0% |
| Liberal Arts & History | 0 | 0.0% |
| Visual & Performing Arts | 0 | 0.0% |
| Communications | 0 | 0.0% |
| Arts & Humanities | 2 | 6.2% |
| Total | 32 | 100.0% |
Transportation & Commute in Durbin
Vehicle Availability by Sex in Durbin
The most prevalent vehicle ownership categories in Durbin are males with 2 vehicles (33, accounting for 44.0%) and females with 2 vehicles (28, making up 58.9%).
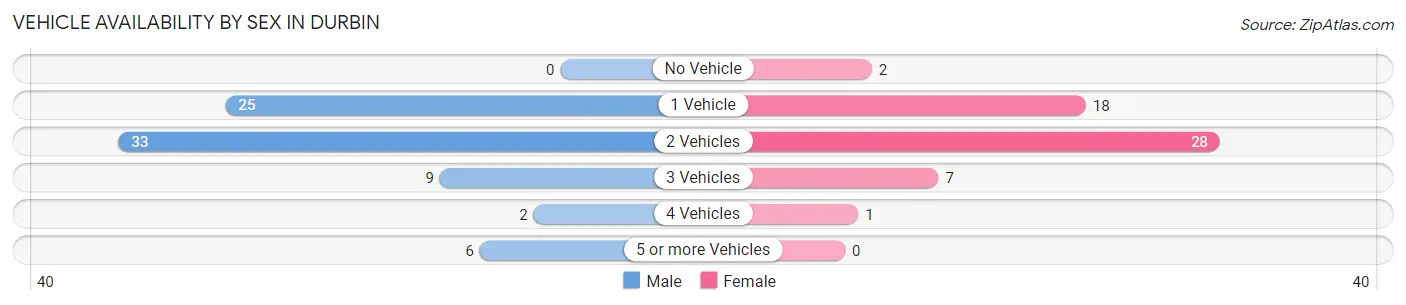
| Vehicles Available | Male | Female |
| No Vehicle | 0 (0.0%) | 2 (3.6%) |
| 1 Vehicle | 25 (33.3%) | 18 (32.1%) |
| 2 Vehicles | 33 (44.0%) | 28 (50.0%) |
| 3 Vehicles | 9 (12.0%) | 7 (12.5%) |
| 4 Vehicles | 2 (2.7%) | 1 (1.8%) |
| 5 or more Vehicles | 6 (8.0%) | 0 (0.0%) |
| Total | 75 (100.0%) | 56 (100.0%) |
Commute Time in Durbin
The most frequently occuring commute durations in Durbin are 5 to 9 minutes (47 commuters, 42.3%), less than 5 minutes (27 commuters, 24.3%), and 10 to 14 minutes (11 commuters, 9.9%).
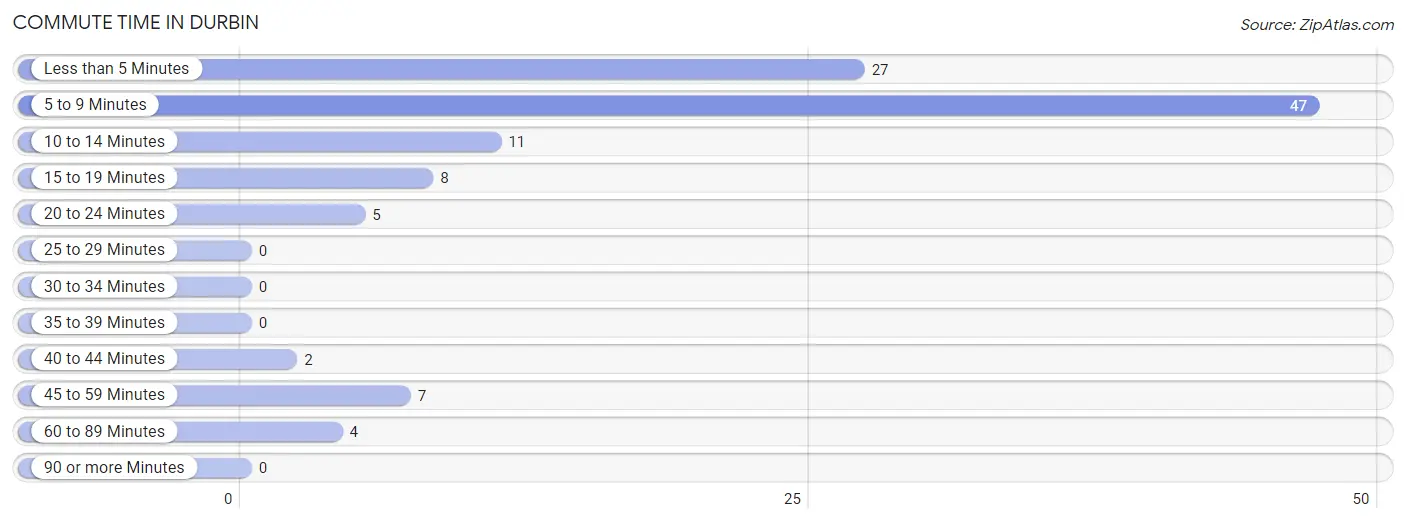
| Commute Time | # Commuters | % Commuters |
| Less than 5 Minutes | 27 | 24.3% |
| 5 to 9 Minutes | 47 | 42.3% |
| 10 to 14 Minutes | 11 | 9.9% |
| 15 to 19 Minutes | 8 | 7.2% |
| 20 to 24 Minutes | 5 | 4.5% |
| 25 to 29 Minutes | 0 | 0.0% |
| 30 to 34 Minutes | 0 | 0.0% |
| 35 to 39 Minutes | 0 | 0.0% |
| 40 to 44 Minutes | 2 | 1.8% |
| 45 to 59 Minutes | 7 | 6.3% |
| 60 to 89 Minutes | 4 | 3.6% |
| 90 or more Minutes | 0 | 0.0% |
Commute Time by Sex in Durbin
The most common commute times in Durbin are 5 to 9 minutes (34 commuters, 45.3%) for males and less than 5 minutes (14 commuters, 38.9%) for females.
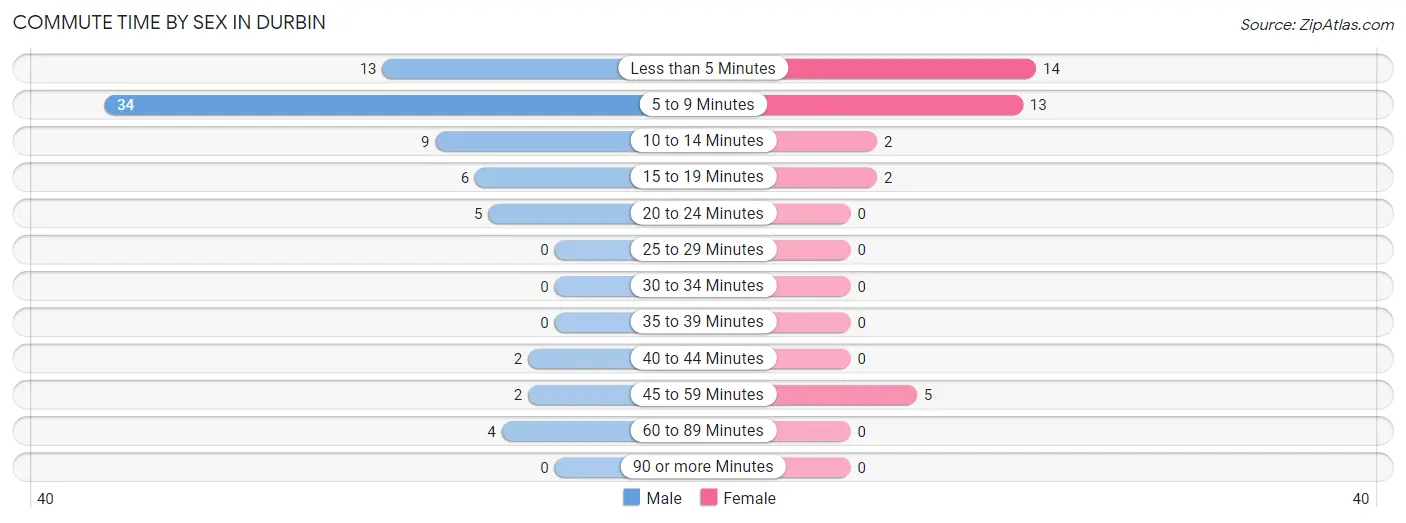
| Commute Time | Male | Female |
| Less than 5 Minutes | 13 (17.3%) | 14 (38.9%) |
| 5 to 9 Minutes | 34 (45.3%) | 13 (36.1%) |
| 10 to 14 Minutes | 9 (12.0%) | 2 (5.6%) |
| 15 to 19 Minutes | 6 (8.0%) | 2 (5.6%) |
| 20 to 24 Minutes | 5 (6.7%) | 0 (0.0%) |
| 25 to 29 Minutes | 0 (0.0%) | 0 (0.0%) |
| 30 to 34 Minutes | 0 (0.0%) | 0 (0.0%) |
| 35 to 39 Minutes | 0 (0.0%) | 0 (0.0%) |
| 40 to 44 Minutes | 2 (2.7%) | 0 (0.0%) |
| 45 to 59 Minutes | 2 (2.7%) | 5 (13.9%) |
| 60 to 89 Minutes | 4 (5.3%) | 0 (0.0%) |
| 90 or more Minutes | 0 (0.0%) | 0 (0.0%) |
Time of Departure to Work by Sex in Durbin
The most frequent times of departure to work in Durbin are 5:30 AM to 5:59 AM (19, 25.3%) for males and 4:00 PM to 11:59 PM (14, 38.9%) for females.
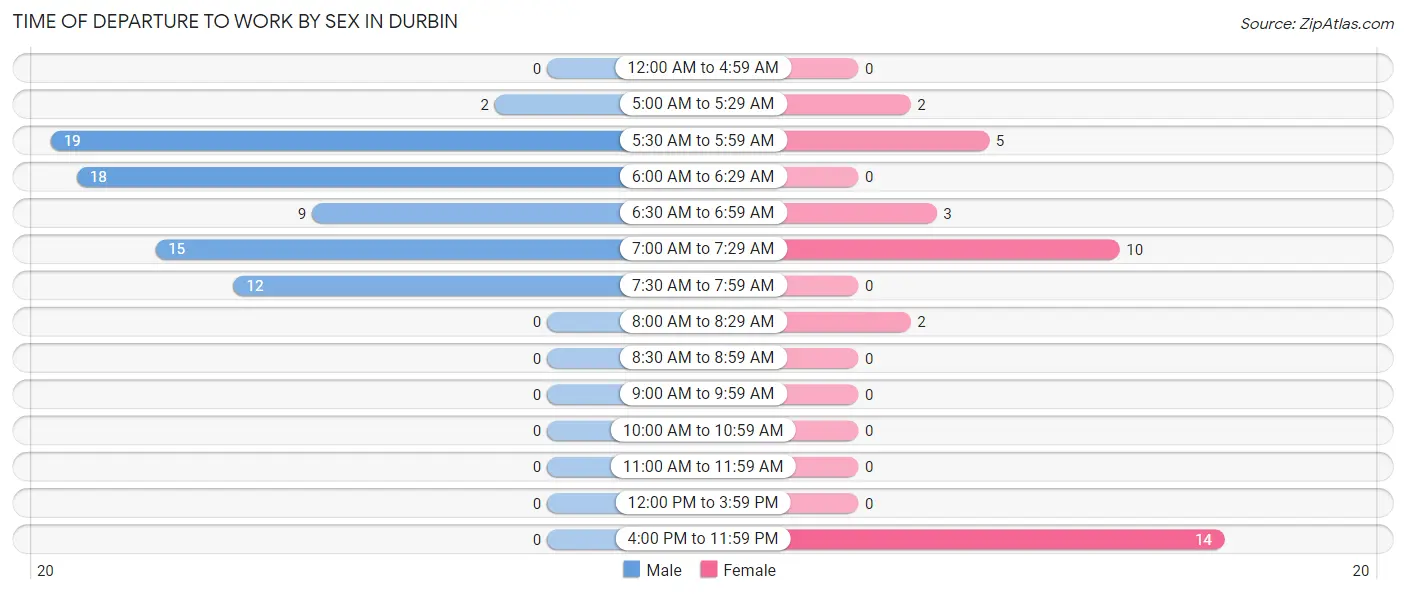
| Time of Departure | Male | Female |
| 12:00 AM to 4:59 AM | 0 (0.0%) | 0 (0.0%) |
| 5:00 AM to 5:29 AM | 2 (2.7%) | 2 (5.6%) |
| 5:30 AM to 5:59 AM | 19 (25.3%) | 5 (13.9%) |
| 6:00 AM to 6:29 AM | 18 (24.0%) | 0 (0.0%) |
| 6:30 AM to 6:59 AM | 9 (12.0%) | 3 (8.3%) |
| 7:00 AM to 7:29 AM | 15 (20.0%) | 10 (27.8%) |
| 7:30 AM to 7:59 AM | 12 (16.0%) | 0 (0.0%) |
| 8:00 AM to 8:29 AM | 0 (0.0%) | 2 (5.6%) |
| 8:30 AM to 8:59 AM | 0 (0.0%) | 0 (0.0%) |
| 9:00 AM to 9:59 AM | 0 (0.0%) | 0 (0.0%) |
| 10:00 AM to 10:59 AM | 0 (0.0%) | 0 (0.0%) |
| 11:00 AM to 11:59 AM | 0 (0.0%) | 0 (0.0%) |
| 12:00 PM to 3:59 PM | 0 (0.0%) | 0 (0.0%) |
| 4:00 PM to 11:59 PM | 0 (0.0%) | 14 (38.9%) |
| Total | 75 (100.0%) | 36 (100.0%) |
Housing Occupancy in Durbin
Occupancy by Ownership in Durbin
Of the total 109 dwellings in Durbin, owner-occupied units account for 90 (82.6%), while renter-occupied units make up 19 (17.4%).
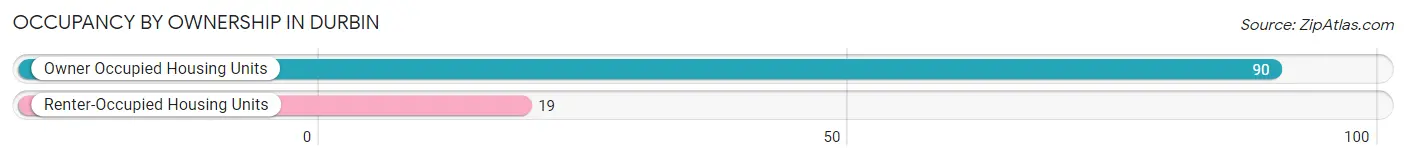
| Occupancy | # Housing Units | % Housing Units |
| Owner Occupied Housing Units | 90 | 82.6% |
| Renter-Occupied Housing Units | 19 | 17.4% |
| Total Occupied Housing Units | 109 | 100.0% |
Occupancy by Household Size in Durbin
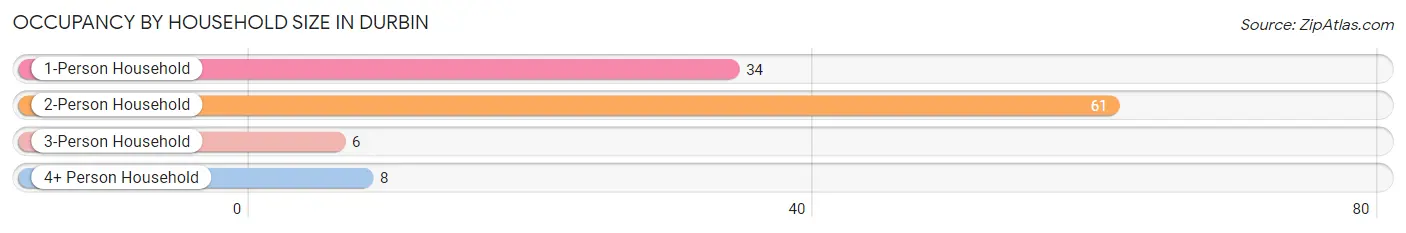
| Household Size | # Housing Units | % Housing Units |
| 1-Person Household | 34 | 31.2% |
| 2-Person Household | 61 | 56.0% |
| 3-Person Household | 6 | 5.5% |
| 4+ Person Household | 8 | 7.3% |
| Total Housing Units | 109 | 100.0% |
Occupancy by Ownership by Household Size in Durbin
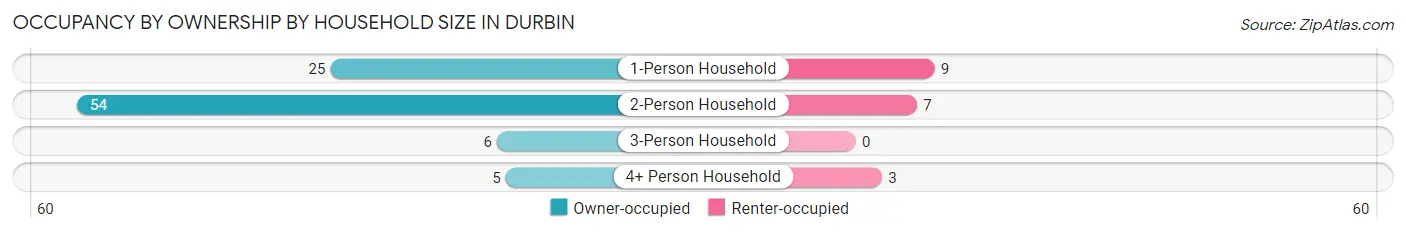
| Household Size | Owner-occupied | Renter-occupied |
| 1-Person Household | 25 (73.5%) | 9 (26.5%) |
| 2-Person Household | 54 (88.5%) | 7 (11.5%) |
| 3-Person Household | 6 (100.0%) | 0 (0.0%) |
| 4+ Person Household | 5 (62.5%) | 3 (37.5%) |
| Total Housing Units | 90 (82.6%) | 19 (17.4%) |
Occupancy by Educational Attainment in Durbin
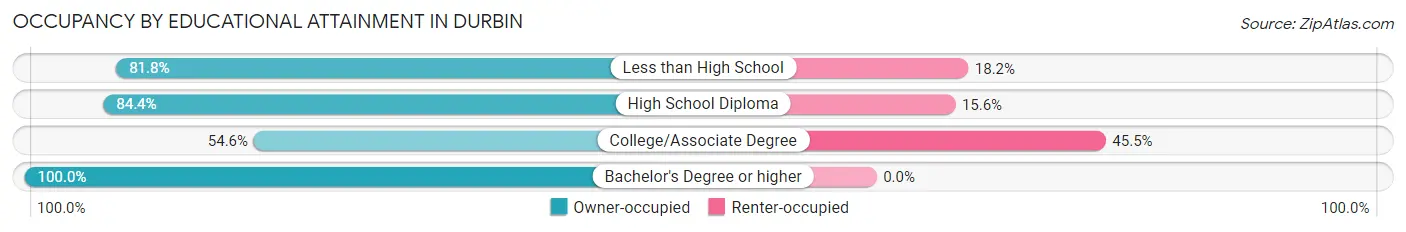
| Household Size | Owner-occupied | Renter-occupied |
| Less than High School | 18 (81.8%) | 4 (18.2%) |
| High School Diploma | 54 (84.4%) | 10 (15.6%) |
| College/Associate Degree | 6 (54.5%) | 5 (45.5%) |
| Bachelor's Degree or higher | 12 (100.0%) | 0 (0.0%) |
Occupancy by Age of Householder in Durbin
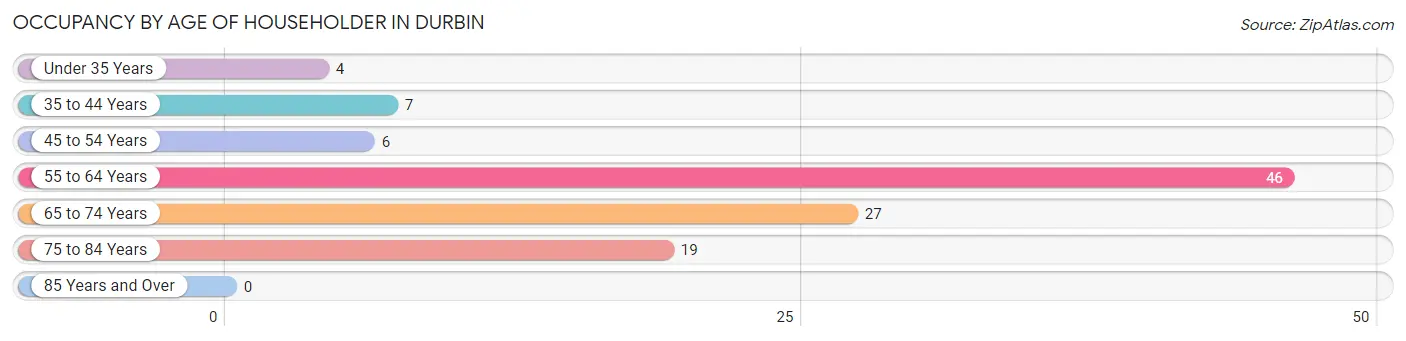
| Age Bracket | # Households | % Households |
| Under 35 Years | 4 | 3.7% |
| 35 to 44 Years | 7 | 6.4% |
| 45 to 54 Years | 6 | 5.5% |
| 55 to 64 Years | 46 | 42.2% |
| 65 to 74 Years | 27 | 24.8% |
| 75 to 84 Years | 19 | 17.4% |
| 85 Years and Over | 0 | 0.0% |
| Total | 109 | 100.0% |
Housing Finances in Durbin
Median Income by Occupancy in Durbin
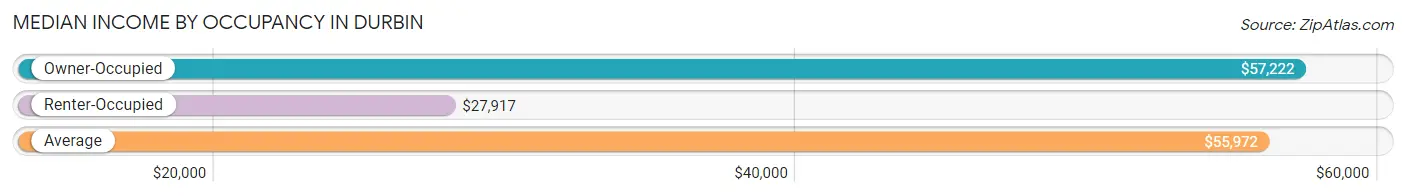
| Occupancy Type | # Households | Median Income |
| Owner-Occupied | 90 (82.6%) | $57,222 |
| Renter-Occupied | 19 (17.4%) | $27,917 |
| Average | 109 (100.0%) | $55,972 |
Occupancy by Householder Income Bracket in Durbin
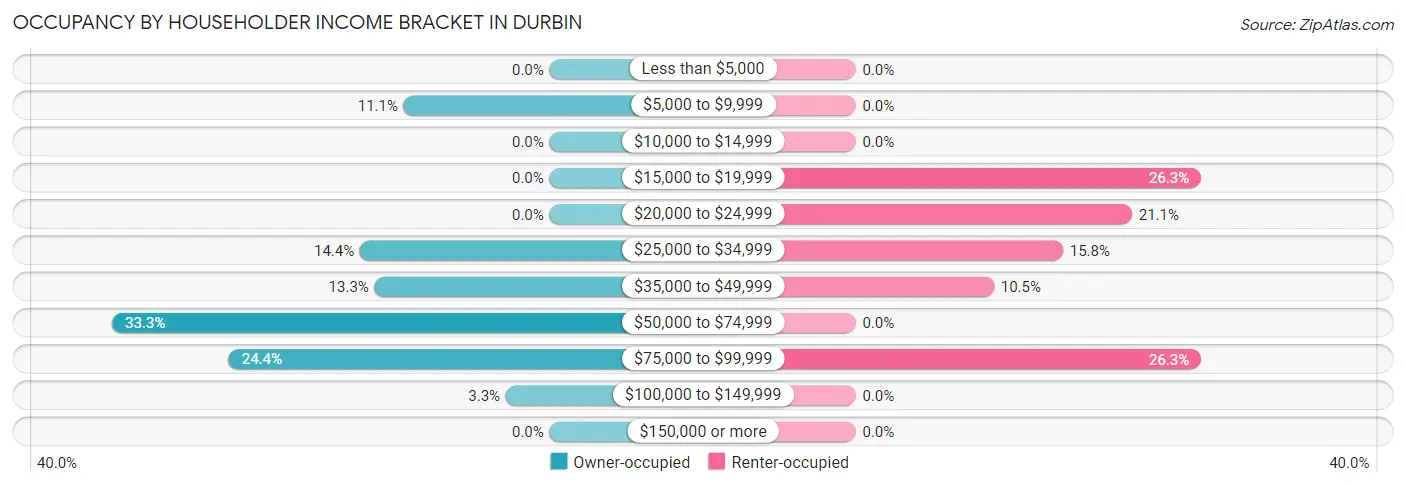
| Income Bracket | Owner-occupied | Renter-occupied |
| Less than $5,000 | 0 (0.0%) | 0 (0.0%) |
| $5,000 to $9,999 | 10 (11.1%) | 0 (0.0%) |
| $10,000 to $14,999 | 0 (0.0%) | 0 (0.0%) |
| $15,000 to $19,999 | 0 (0.0%) | 5 (26.3%) |
| $20,000 to $24,999 | 0 (0.0%) | 4 (21.0%) |
| $25,000 to $34,999 | 13 (14.4%) | 3 (15.8%) |
| $35,000 to $49,999 | 12 (13.3%) | 2 (10.5%) |
| $50,000 to $74,999 | 30 (33.3%) | 0 (0.0%) |
| $75,000 to $99,999 | 22 (24.4%) | 5 (26.3%) |
| $100,000 to $149,999 | 3 (3.3%) | 0 (0.0%) |
| $150,000 or more | 0 (0.0%) | 0 (0.0%) |
| Total | 90 (100.0%) | 19 (100.0%) |
Monthly Housing Cost Tiers in Durbin
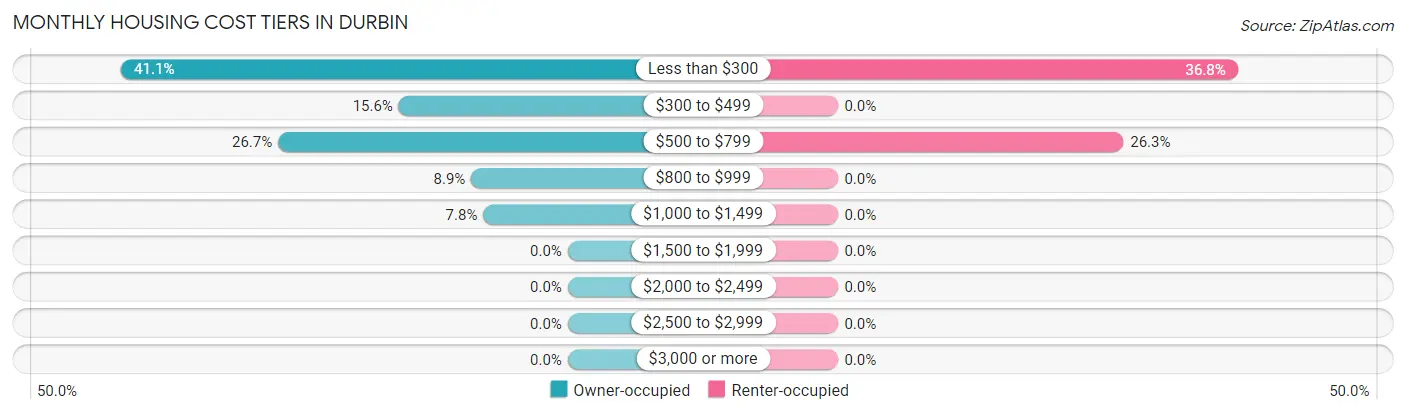
| Monthly Cost | Owner-occupied | Renter-occupied |
| Less than $300 | 37 (41.1%) | 7 (36.8%) |
| $300 to $499 | 14 (15.6%) | 0 (0.0%) |
| $500 to $799 | 24 (26.7%) | 5 (26.3%) |
| $800 to $999 | 8 (8.9%) | 0 (0.0%) |
| $1,000 to $1,499 | 7 (7.8%) | 0 (0.0%) |
| $1,500 to $1,999 | 0 (0.0%) | 0 (0.0%) |
| $2,000 to $2,499 | 0 (0.0%) | 0 (0.0%) |
| $2,500 to $2,999 | 0 (0.0%) | 0 (0.0%) |
| $3,000 or more | 0 (0.0%) | 0 (0.0%) |
| Total | 90 (100.0%) | 19 (100.0%) |
Physical Housing Characteristics in Durbin
Housing Structures in Durbin
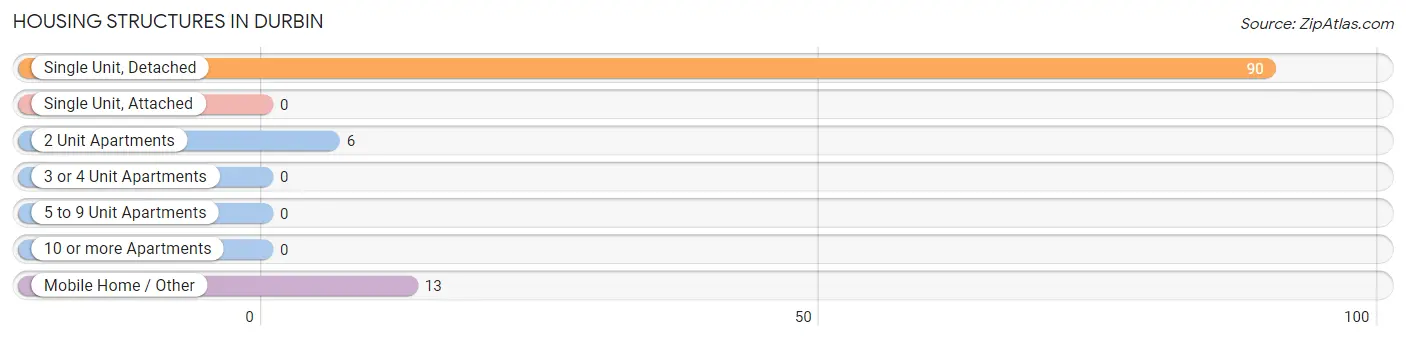
| Structure Type | # Housing Units | % Housing Units |
| Single Unit, Detached | 90 | 82.6% |
| Single Unit, Attached | 0 | 0.0% |
| 2 Unit Apartments | 6 | 5.5% |
| 3 or 4 Unit Apartments | 0 | 0.0% |
| 5 to 9 Unit Apartments | 0 | 0.0% |
| 10 or more Apartments | 0 | 0.0% |
| Mobile Home / Other | 13 | 11.9% |
| Total | 109 | 100.0% |
Housing Structures by Occupancy in Durbin
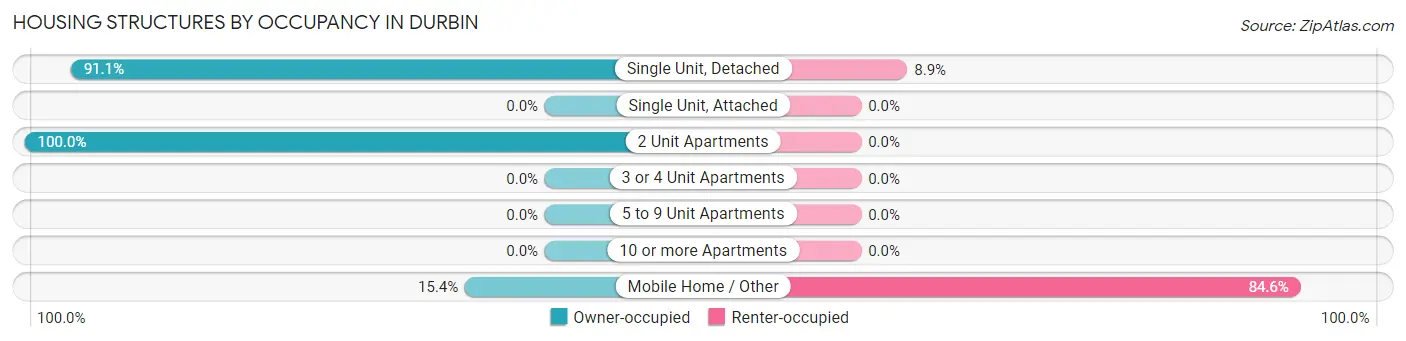
| Structure Type | Owner-occupied | Renter-occupied |
| Single Unit, Detached | 82 (91.1%) | 8 (8.9%) |
| Single Unit, Attached | 0 (0.0%) | 0 (0.0%) |
| 2 Unit Apartments | 6 (100.0%) | 0 (0.0%) |
| 3 or 4 Unit Apartments | 0 (0.0%) | 0 (0.0%) |
| 5 to 9 Unit Apartments | 0 (0.0%) | 0 (0.0%) |
| 10 or more Apartments | 0 (0.0%) | 0 (0.0%) |
| Mobile Home / Other | 2 (15.4%) | 11 (84.6%) |
| Total | 90 (82.6%) | 19 (17.4%) |
Housing Structures by Number of Rooms in Durbin
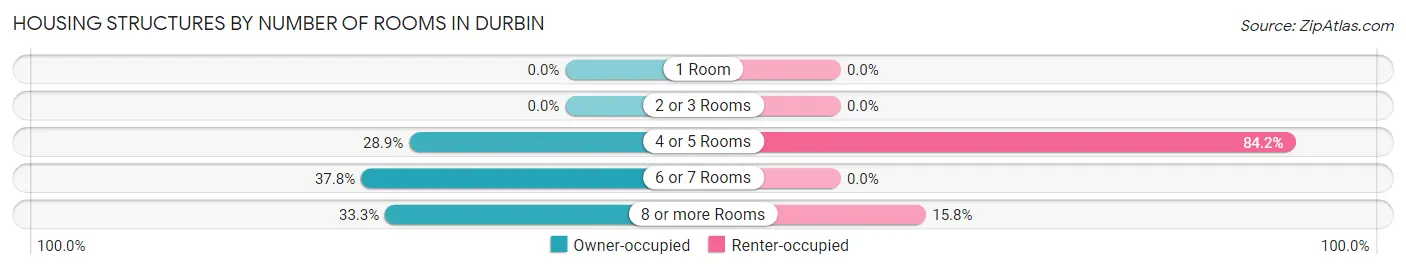
| Number of Rooms | Owner-occupied | Renter-occupied |
| 1 Room | 0 (0.0%) | 0 (0.0%) |
| 2 or 3 Rooms | 0 (0.0%) | 0 (0.0%) |
| 4 or 5 Rooms | 26 (28.9%) | 16 (84.2%) |
| 6 or 7 Rooms | 34 (37.8%) | 0 (0.0%) |
| 8 or more Rooms | 30 (33.3%) | 3 (15.8%) |
| Total | 90 (100.0%) | 19 (100.0%) |
Housing Structure by Heating Type in Durbin
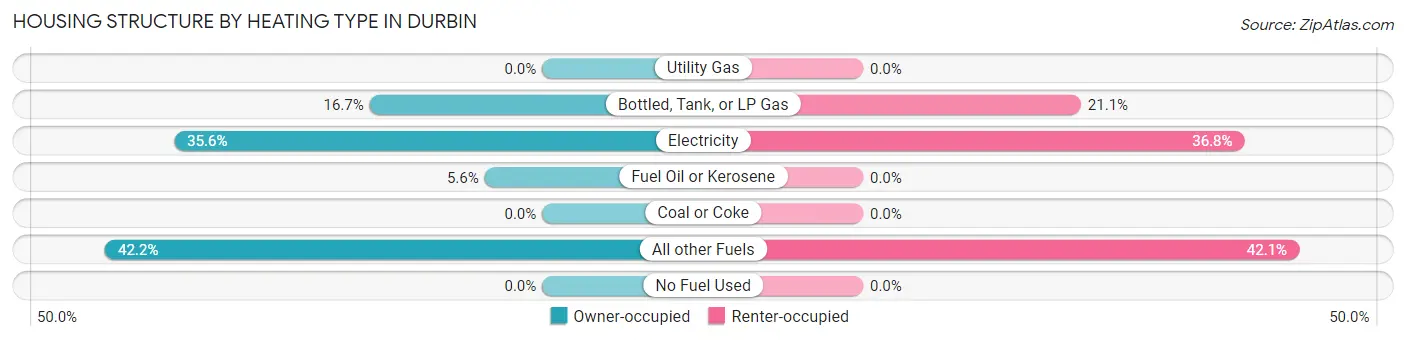
| Heating Type | Owner-occupied | Renter-occupied |
| Utility Gas | 0 (0.0%) | 0 (0.0%) |
| Bottled, Tank, or LP Gas | 15 (16.7%) | 4 (21.0%) |
| Electricity | 32 (35.6%) | 7 (36.8%) |
| Fuel Oil or Kerosene | 5 (5.6%) | 0 (0.0%) |
| Coal or Coke | 0 (0.0%) | 0 (0.0%) |
| All other Fuels | 38 (42.2%) | 8 (42.1%) |
| No Fuel Used | 0 (0.0%) | 0 (0.0%) |
| Total | 90 (100.0%) | 19 (100.0%) |
Household Vehicle Usage in Durbin
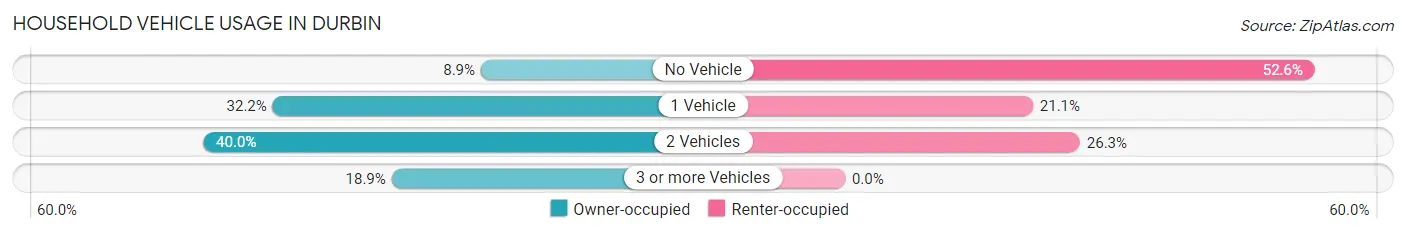
| Vehicles per Household | Owner-occupied | Renter-occupied |
| No Vehicle | 8 (8.9%) | 10 (52.6%) |
| 1 Vehicle | 29 (32.2%) | 4 (21.0%) |
| 2 Vehicles | 36 (40.0%) | 5 (26.3%) |
| 3 or more Vehicles | 17 (18.9%) | 0 (0.0%) |
| Total | 90 (100.0%) | 19 (100.0%) |
Real Estate & Mortgages in Durbin
Real Estate and Mortgage Overview in Durbin
| Characteristic | Without Mortgage | With Mortgage |
| Housing Units | 58 | 32 |
| Median Property Value | - | - |
| Median Household Income | $44,167 | $0 |
| Monthly Housing Costs | $238 | $0 |
| Real Estate Taxes | $394 | $0 |
Property Value by Mortgage Status in Durbin
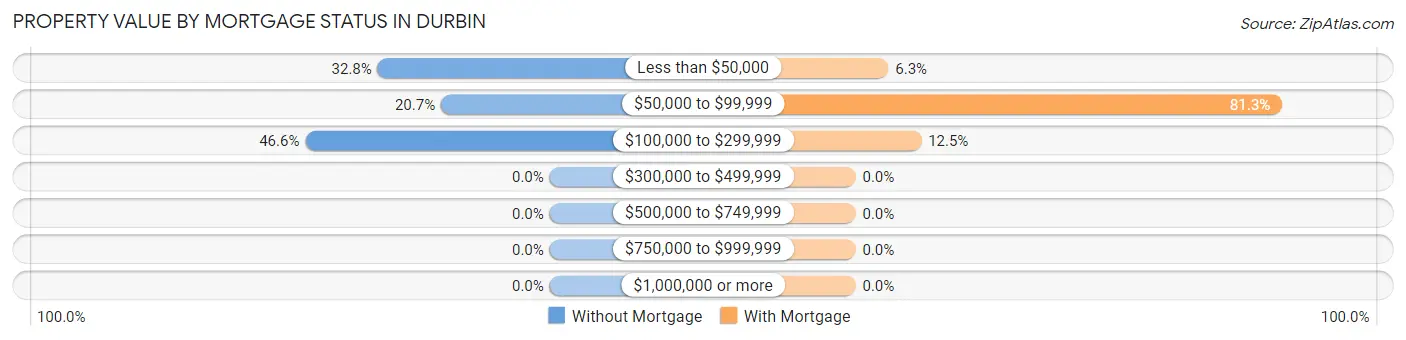
| Property Value | Without Mortgage | With Mortgage |
| Less than $50,000 | 19 (32.8%) | 2 (6.2%) |
| $50,000 to $99,999 | 12 (20.7%) | 26 (81.2%) |
| $100,000 to $299,999 | 27 (46.6%) | 4 (12.5%) |
| $300,000 to $499,999 | 0 (0.0%) | 0 (0.0%) |
| $500,000 to $749,999 | 0 (0.0%) | 0 (0.0%) |
| $750,000 to $999,999 | 0 (0.0%) | 0 (0.0%) |
| $1,000,000 or more | 0 (0.0%) | 0 (0.0%) |
| Total | 58 (100.0%) | 32 (100.0%) |
Household Income by Mortgage Status in Durbin
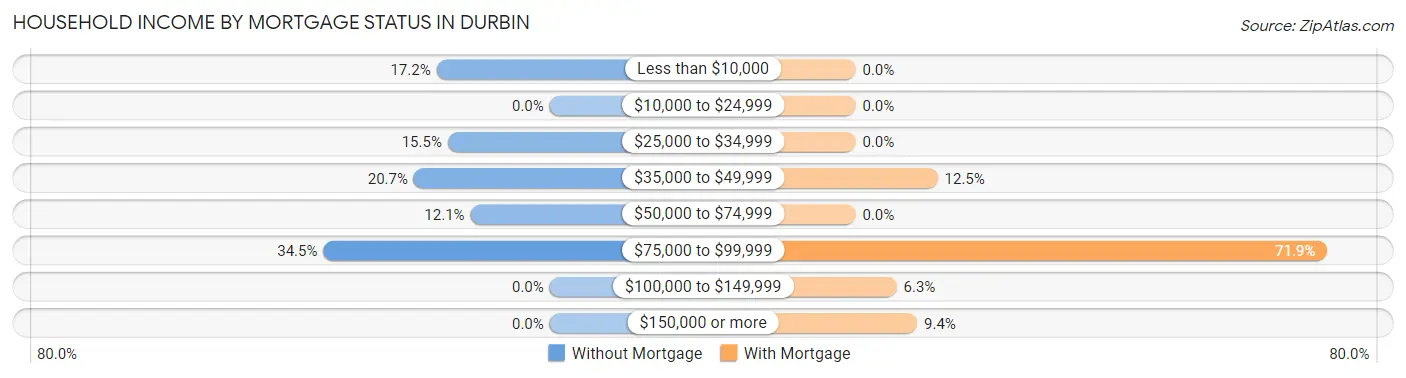
| Household Income | Without Mortgage | With Mortgage |
| Less than $10,000 | 10 (17.2%) | 0 (0.0%) |
| $10,000 to $24,999 | 0 (0.0%) | 0 (0.0%) |
| $25,000 to $34,999 | 9 (15.5%) | 0 (0.0%) |
| $35,000 to $49,999 | 12 (20.7%) | 4 (12.5%) |
| $50,000 to $74,999 | 7 (12.1%) | 0 (0.0%) |
| $75,000 to $99,999 | 20 (34.5%) | 23 (71.9%) |
| $100,000 to $149,999 | 0 (0.0%) | 2 (6.2%) |
| $150,000 or more | 0 (0.0%) | 3 (9.4%) |
| Total | 58 (100.0%) | 32 (100.0%) |
Property Value to Household Income Ratio in Durbin
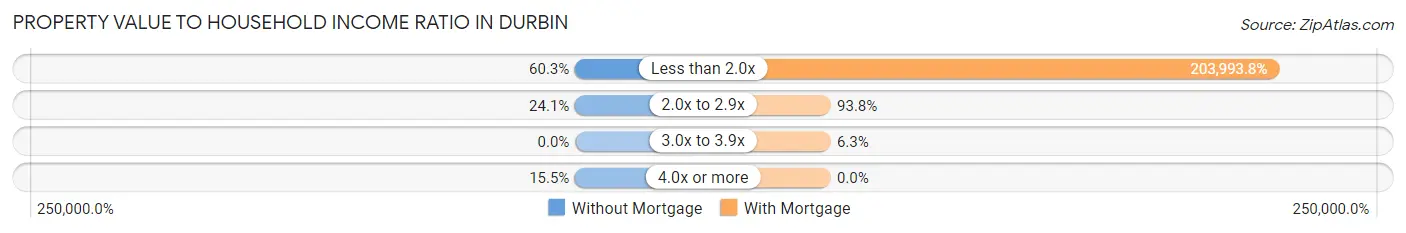
| Value-to-Income Ratio | Without Mortgage | With Mortgage |
| Less than 2.0x | 35 (60.3%) | 65,278 (203,993.8%) |
| 2.0x to 2.9x | 14 (24.1%) | 30 (93.8%) |
| 3.0x to 3.9x | 0 (0.0%) | 2 (6.2%) |
| 4.0x or more | 9 (15.5%) | 0 (0.0%) |
| Total | 58 (100.0%) | 32 (100.0%) |
Real Estate Taxes by Mortgage Status in Durbin
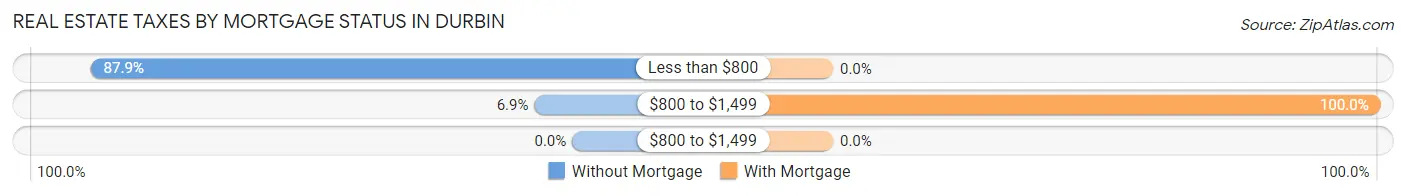
| Property Taxes | Without Mortgage | With Mortgage |
| Less than $800 | 51 (87.9%) | 0 (0.0%) |
| $800 to $1,499 | 4 (6.9%) | 32 (100.0%) |
| $800 to $1,499 | 0 (0.0%) | 0 (0.0%) |
| Total | 58 (100.0%) | 32 (100.0%) |
Health & Disability in Durbin
Health Insurance Coverage by Age in Durbin
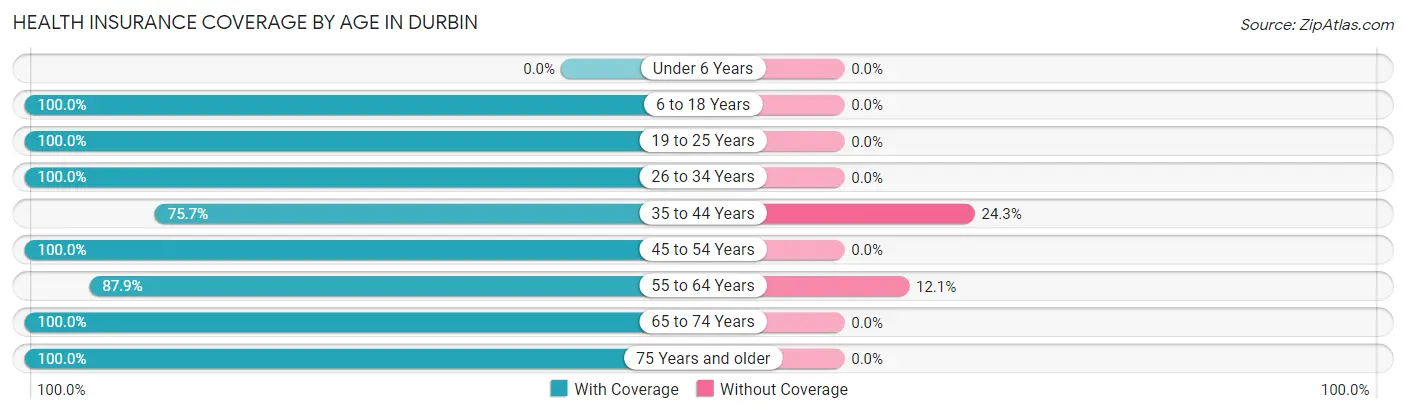
| Age Bracket | With Coverage | Without Coverage |
| Under 6 Years | 0 (0.0%) | 0 (0.0%) |
| 6 to 18 Years | 30 (100.0%) | 0 (0.0%) |
| 19 to 25 Years | 14 (100.0%) | 0 (0.0%) |
| 26 to 34 Years | 10 (100.0%) | 0 (0.0%) |
| 35 to 44 Years | 53 (75.7%) | 17 (24.3%) |
| 45 to 54 Years | 53 (100.0%) | 0 (0.0%) |
| 55 to 64 Years | 51 (87.9%) | 7 (12.1%) |
| 65 to 74 Years | 37 (100.0%) | 0 (0.0%) |
| 75 Years and older | 25 (100.0%) | 0 (0.0%) |
| Total | 273 (91.9%) | 24 (8.1%) |
Health Insurance Coverage by Citizenship Status in Durbin
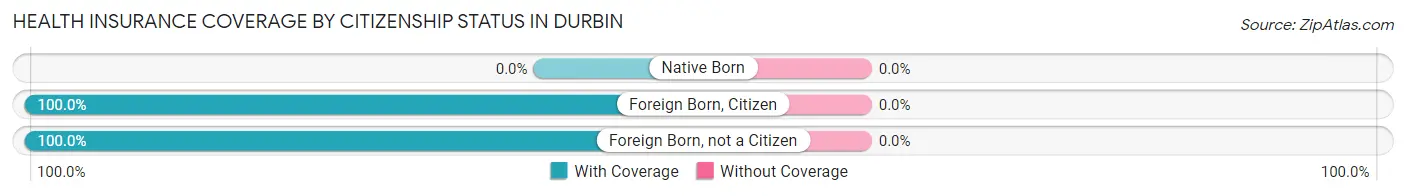
| Citizenship Status | With Coverage | Without Coverage |
| Native Born | 0 (0.0%) | 0 (0.0%) |
| Foreign Born, Citizen | 30 (100.0%) | 0 (0.0%) |
| Foreign Born, not a Citizen | 14 (100.0%) | 0 (0.0%) |
Health Insurance Coverage by Household Income in Durbin
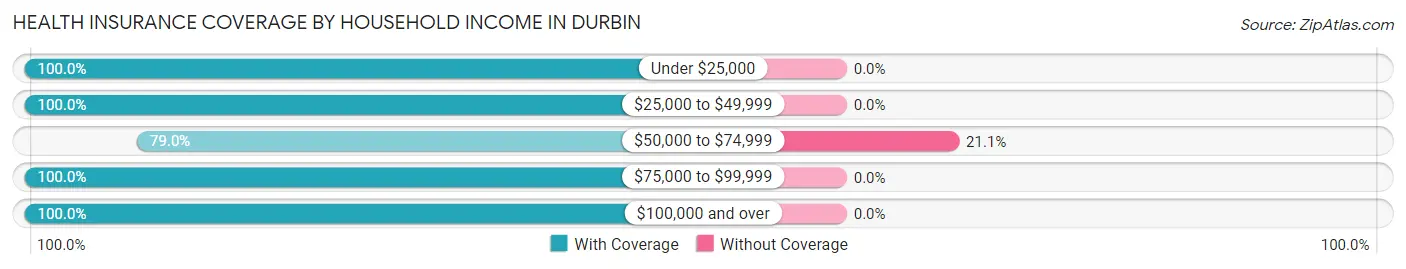
| Household Income | With Coverage | Without Coverage |
| Under $25,000 | 19 (100.0%) | 0 (0.0%) |
| $25,000 to $49,999 | 82 (100.0%) | 0 (0.0%) |
| $50,000 to $74,999 | 90 (78.9%) | 24 (21.0%) |
| $75,000 to $99,999 | 76 (100.0%) | 0 (0.0%) |
| $100,000 and over | 6 (100.0%) | 0 (0.0%) |
Public vs Private Health Insurance Coverage by Age in Durbin
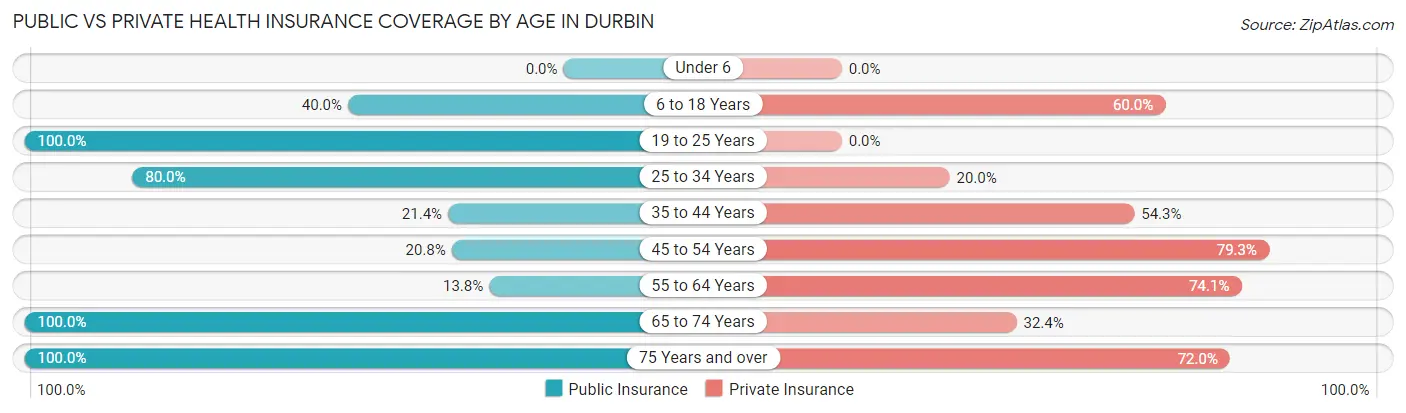
| Age Bracket | Public Insurance | Private Insurance |
| Under 6 | 0 (0.0%) | 0 (0.0%) |
| 6 to 18 Years | 12 (40.0%) | 18 (60.0%) |
| 19 to 25 Years | 14 (100.0%) | 0 (0.0%) |
| 25 to 34 Years | 8 (80.0%) | 2 (20.0%) |
| 35 to 44 Years | 15 (21.4%) | 38 (54.3%) |
| 45 to 54 Years | 11 (20.7%) | 42 (79.2%) |
| 55 to 64 Years | 8 (13.8%) | 43 (74.1%) |
| 65 to 74 Years | 37 (100.0%) | 12 (32.4%) |
| 75 Years and over | 25 (100.0%) | 18 (72.0%) |
| Total | 130 (43.8%) | 173 (58.3%) |
Disability Status by Sex by Age in Durbin
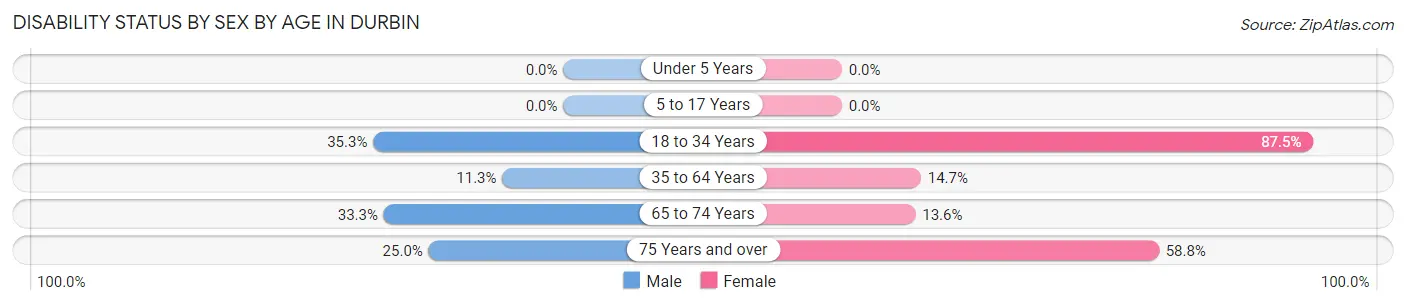
| Age Bracket | Male | Female |
| Under 5 Years | 0 (0.0%) | 0 (0.0%) |
| 5 to 17 Years | 0 (0.0%) | 0 (0.0%) |
| 18 to 34 Years | 6 (35.3%) | 14 (87.5%) |
| 35 to 64 Years | 12 (11.3%) | 11 (14.7%) |
| 65 to 74 Years | 5 (33.3%) | 3 (13.6%) |
| 75 Years and over | 2 (25.0%) | 10 (58.8%) |
Disability Class by Sex by Age in Durbin
Disability Class: Hearing Difficulty
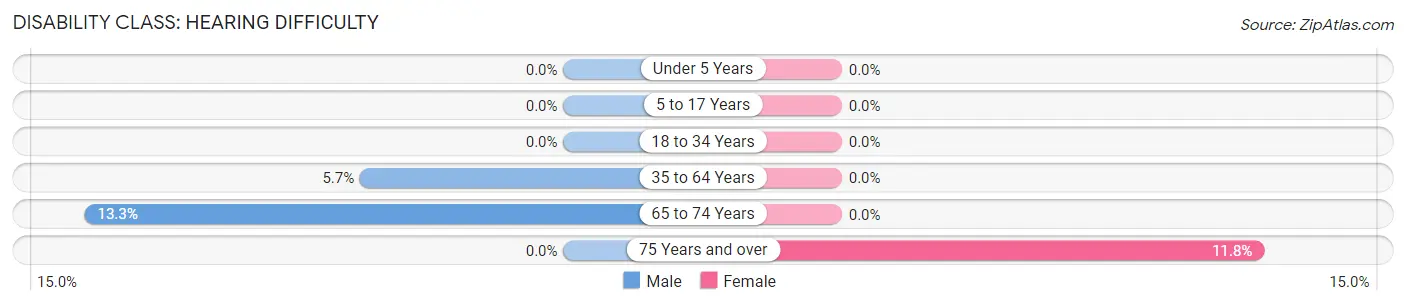
| Age Bracket | Male | Female |
| Under 5 Years | 0 (0.0%) | 0 (0.0%) |
| 5 to 17 Years | 0 (0.0%) | 0 (0.0%) |
| 18 to 34 Years | 0 (0.0%) | 0 (0.0%) |
| 35 to 64 Years | 6 (5.7%) | 0 (0.0%) |
| 65 to 74 Years | 2 (13.3%) | 0 (0.0%) |
| 75 Years and over | 0 (0.0%) | 2 (11.8%) |
Disability Class: Vision Difficulty
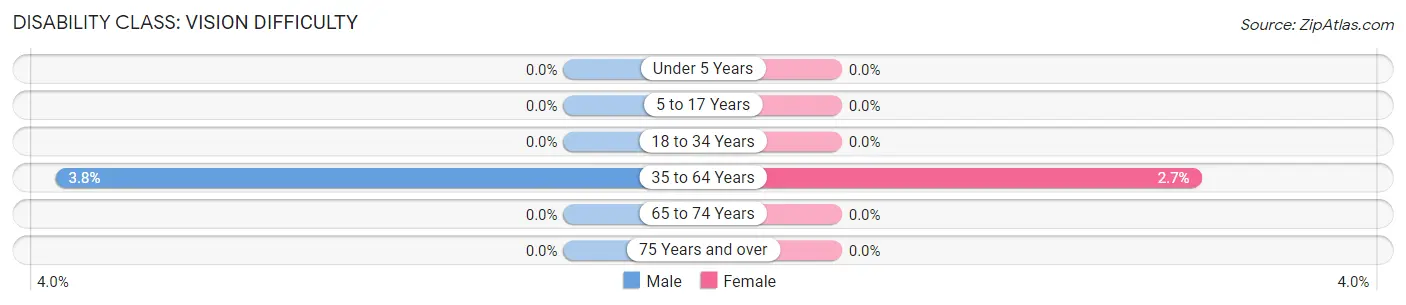
| Age Bracket | Male | Female |
| Under 5 Years | 0 (0.0%) | 0 (0.0%) |
| 5 to 17 Years | 0 (0.0%) | 0 (0.0%) |
| 18 to 34 Years | 0 (0.0%) | 0 (0.0%) |
| 35 to 64 Years | 4 (3.8%) | 2 (2.7%) |
| 65 to 74 Years | 0 (0.0%) | 0 (0.0%) |
| 75 Years and over | 0 (0.0%) | 0 (0.0%) |
Disability Class: Cognitive Difficulty
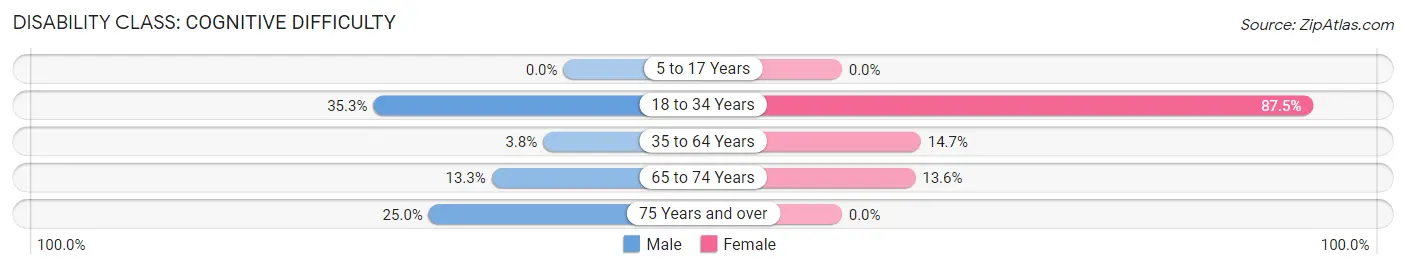
| Age Bracket | Male | Female |
| 5 to 17 Years | 0 (0.0%) | 0 (0.0%) |
| 18 to 34 Years | 6 (35.3%) | 14 (87.5%) |
| 35 to 64 Years | 4 (3.8%) | 11 (14.7%) |
| 65 to 74 Years | 2 (13.3%) | 3 (13.6%) |
| 75 Years and over | 2 (25.0%) | 0 (0.0%) |
Disability Class: Ambulatory Difficulty
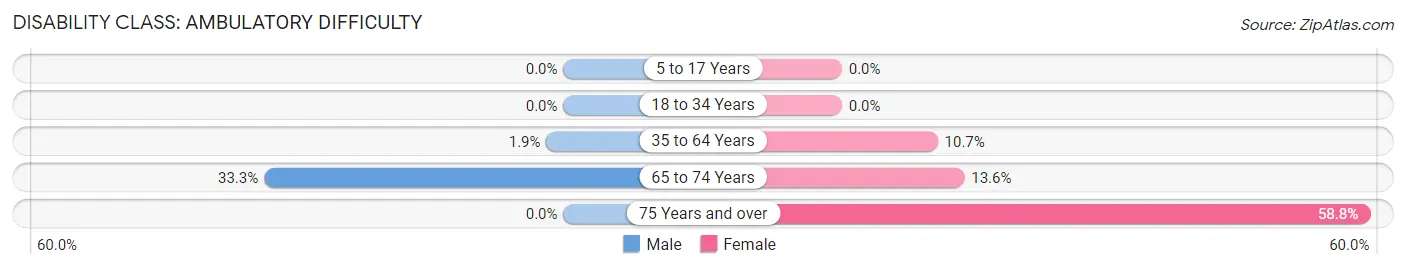
| Age Bracket | Male | Female |
| 5 to 17 Years | 0 (0.0%) | 0 (0.0%) |
| 18 to 34 Years | 0 (0.0%) | 0 (0.0%) |
| 35 to 64 Years | 2 (1.9%) | 8 (10.7%) |
| 65 to 74 Years | 5 (33.3%) | 3 (13.6%) |
| 75 Years and over | 0 (0.0%) | 10 (58.8%) |
Disability Class: Self-Care Difficulty
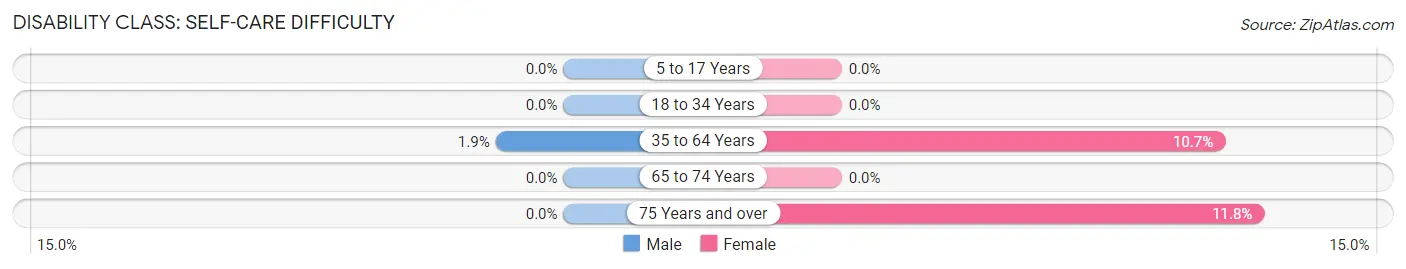
| Age Bracket | Male | Female |
| 5 to 17 Years | 0 (0.0%) | 0 (0.0%) |
| 18 to 34 Years | 0 (0.0%) | 0 (0.0%) |
| 35 to 64 Years | 2 (1.9%) | 8 (10.7%) |
| 65 to 74 Years | 0 (0.0%) | 0 (0.0%) |
| 75 Years and over | 0 (0.0%) | 2 (11.8%) |
Technology Access in Durbin
Computing Device Access in Durbin
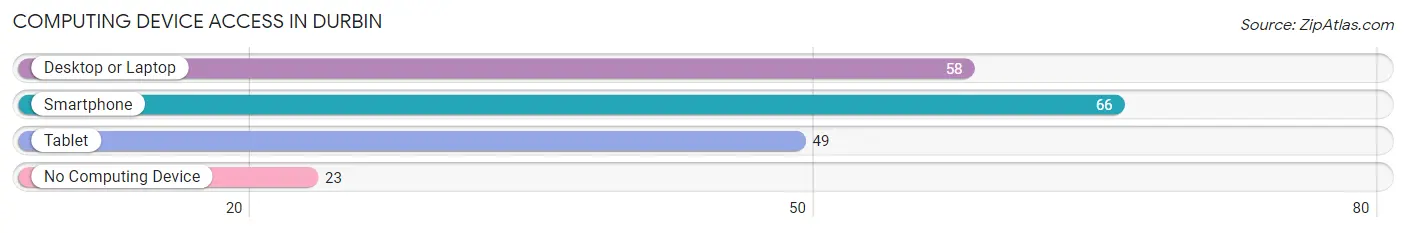
| Device Type | # Households | % Households |
| Desktop or Laptop | 58 | 53.2% |
| Smartphone | 66 | 60.6% |
| Tablet | 49 | 45.0% |
| No Computing Device | 23 | 21.1% |
| Total | 109 | 100.0% |
Internet Access in Durbin
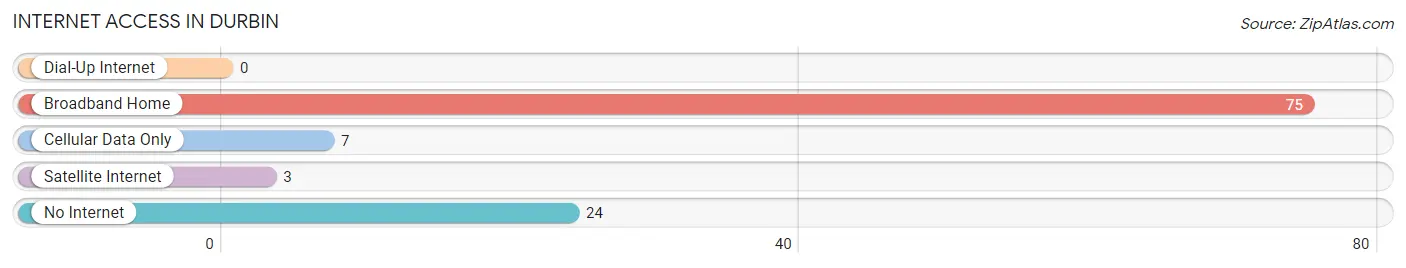
| Internet Type | # Households | % Households |
| Dial-Up Internet | 0 | 0.0% |
| Broadband Home | 75 | 68.8% |
| Cellular Data Only | 7 | 6.4% |
| Satellite Internet | 3 | 2.8% |
| No Internet | 24 | 22.0% |
| Total | 109 | 100.0% |
Durbin Summary
Durbin is a small unincorporated community located in Pocahontas County, West Virginia. It is situated in the Allegheny Mountains, near the headwaters of the Greenbrier River. The population of Durbin was estimated to be around 200 people in 2020.
History
Durbin was first settled in the late 1700s by a group of settlers from Pennsylvania. The town was named after a local settler, John Durbin. The town was officially established in 1832 and was incorporated in 1837.
The town was an important stop on the Staunton-Parkersburg Turnpike, which was a major transportation route in the mid-1800s. The turnpike connected the Shenandoah Valley to the Ohio River Valley.
The town was also an important stop on the Chesapeake and Ohio Railway, which was built in the late 1800s. The railway connected the town to the rest of the country and allowed for the transportation of goods and people.
Geography
Durbin is located in the Allegheny Mountains of West Virginia. The town is situated at an elevation of 2,400 feet above sea level. The town is surrounded by the Monongahela National Forest and is located near the headwaters of the Greenbrier River.
The climate in Durbin is humid continental, with cold winters and hot summers. The average annual temperature is around 50 degrees Fahrenheit. The average annual precipitation is around 40 inches.
Economy
The economy of Durbin is largely based on tourism. The town is a popular destination for outdoor activities such as fishing, hunting, camping, and hiking. The town is also home to several small businesses, including restaurants, shops, and lodging.
The town is also home to the Durbin & Greenbrier Valley Railroad, which offers scenic train rides through the Allegheny Mountains. The railroad is a popular tourist attraction and provides an important source of income for the town.
Demographics
The population of Durbin was estimated to be around 200 people in 2020. The racial makeup of the town is predominantly white, with a small percentage of African Americans and Native Americans. The median household income in Durbin is around $30,000.
Conclusion
Durbin is a small unincorporated community located in Pocahontas County, West Virginia. It was first settled in the late 1700s and was an important stop on the Staunton-Parkersburg Turnpike and the Chesapeake and Ohio Railway. The economy of Durbin is largely based on tourism and the town is home to several small businesses. The population of Durbin was estimated to be around 200 people in 2020.
Common Questions
What is the Total Population of Durbin?
Total Population of Durbin is 297.
What is the Total Male Population of Durbin?
Total Male Population of Durbin is 159.
What is the Total Female Population of Durbin?
Total Female Population of Durbin is 138.
What is the Ratio of Males per 100 Females in Durbin?
There are 115.22 Males per 100 Females in Durbin.
What is the Ratio of Females per 100 Males in Durbin?
There are 86.79 Females per 100 Males in Durbin.
What is the Median Population Age in Durbin?
Median Population Age in Durbin is 52.1 Years.
What is the Average Family Size in Durbin
Average Family Size in Durbin is 3.3 People.
What is the Average Household Size in Durbin
Average Household Size in Durbin is 2.7 People.
What is Per Capita Income in Durbin?
Per Capita income in Durbin is $23,712.
What is the Median Family Income in Durbin?
Median Family Income in Durbin is $65,536.
What is the Median Household income in Durbin?
Median Household Income in Durbin is $55,972.
What is Income or Wage Gap in Durbin?
Income or Wage Gap in Durbin is 29.9%.
Women in Durbin earn 70.1 cents for every dollar earned by a man.
What is Inequality or Gini Index in Durbin?
Inequality or Gini Index in Durbin is 0.30.
How Large is the Labor Force in Durbin?
There are 157 People in the Labor Forcein in Durbin.
What is the Percentage of People in the Labor Force in Durbin?
55.7% of People are in the Labor Force in Durbin.
What is the Unemployment Rate in Durbin?
Unemployment Rate in Durbin is 16.6%.