Dixie, WV Map & Demographics
Dixie Map
Dixie Overview
$40,913
PER CAPITA INCOME
0.38
INEQUALITY / GINI INDEX
98
TOTAL POPULATION
50
MALE POPULATION
48
FEMALE POPULATION
104.17
MALES / 100 FEMALES
96.00
FEMALES / 100 MALES
51.5
MEDIAN AGE
2.0
AVG FAMILY SIZE
2.0
AVG HOUSEHOLD SIZE
47
LABOR FORCE [ PEOPLE ]
48.0%
PERCENT IN LABOR FORCE
Dixie Zip Codes
Dixie Area Codes
Income in Dixie
Income Overview in Dixie
| Characteristic | Number | Measure |
| Per Capita Income | 98 | $40,913 |
| Median Family Income | 48 | $0 |
| Mean Family Income | 48 | $82,863 |
| Median Household Income | 48 | $0 |
| Mean Household Income | 48 | $82,863 |
| Income Deficit | 48 | $0 |
| Wage / Income Gap (%) | 98 | 0.00% |
| Wage / Income Gap ($) | 98 | 100.00¢ per $1 |
| Gini / Inequality Index | 98 | 0.38 |
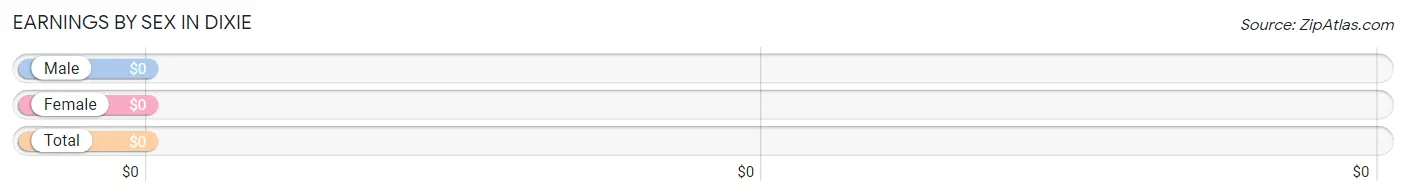
Earnings by Sex in Dixie
| Sex | Number | Average Earnings |
| Male | 15 (31.9%) | $0 |
| Female | 32 (68.1%) | $0 |
| Total | 47 (100.0%) | $0 |
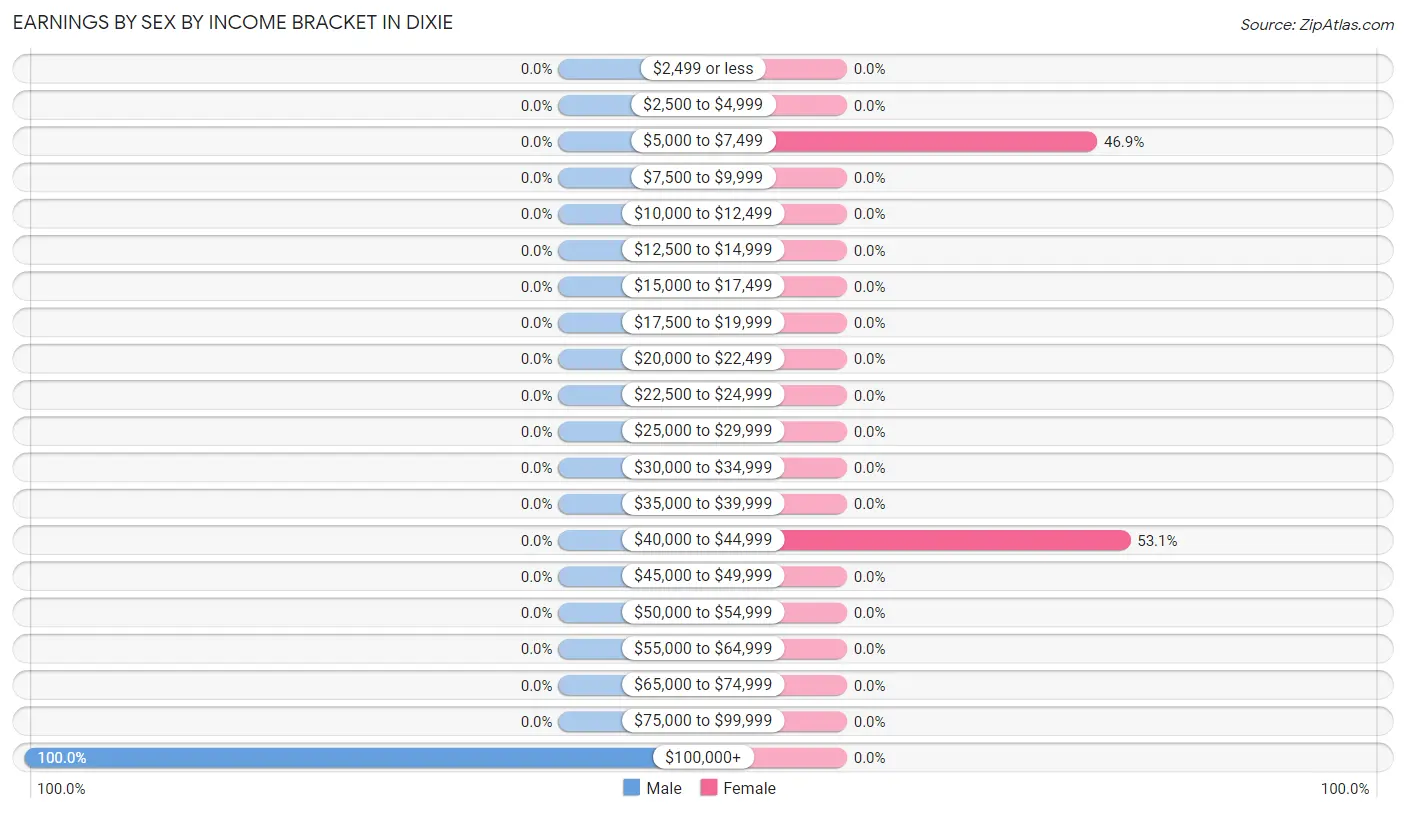
Earnings by Sex by Income Bracket in Dixie
The most common earnings brackets in Dixie are $100,000+ for men (15 | 100.0%) and $40,000 to $44,999 for women (17 | 53.1%).
| Income | Male | Female |
| $2,499 or less | 0 (0.0%) | 0 (0.0%) |
| $2,500 to $4,999 | 0 (0.0%) | 0 (0.0%) |
| $5,000 to $7,499 | 0 (0.0%) | 15 (46.9%) |
| $7,500 to $9,999 | 0 (0.0%) | 0 (0.0%) |
| $10,000 to $12,499 | 0 (0.0%) | 0 (0.0%) |
| $12,500 to $14,999 | 0 (0.0%) | 0 (0.0%) |
| $15,000 to $17,499 | 0 (0.0%) | 0 (0.0%) |
| $17,500 to $19,999 | 0 (0.0%) | 0 (0.0%) |
| $20,000 to $22,499 | 0 (0.0%) | 0 (0.0%) |
| $22,500 to $24,999 | 0 (0.0%) | 0 (0.0%) |
| $25,000 to $29,999 | 0 (0.0%) | 0 (0.0%) |
| $30,000 to $34,999 | 0 (0.0%) | 0 (0.0%) |
| $35,000 to $39,999 | 0 (0.0%) | 0 (0.0%) |
| $40,000 to $44,999 | 0 (0.0%) | 17 (53.1%) |
| $45,000 to $49,999 | 0 (0.0%) | 0 (0.0%) |
| $50,000 to $54,999 | 0 (0.0%) | 0 (0.0%) |
| $55,000 to $64,999 | 0 (0.0%) | 0 (0.0%) |
| $65,000 to $74,999 | 0 (0.0%) | 0 (0.0%) |
| $75,000 to $99,999 | 0 (0.0%) | 0 (0.0%) |
| $100,000+ | 15 (100.0%) | 0 (0.0%) |
| Total | 15 (100.0%) | 32 (100.0%) |
Earnings by Sex by Educational Attainment in Dixie
| Educational Attainment | Male Income | Female Income |
| Less than High School | - | - |
| High School Diploma | - | - |
| College or Associate's Degree | - | - |
| Bachelor's Degree | - | - |
| Graduate Degree | - | - |
| Total | - | - |
Family Income in Dixie
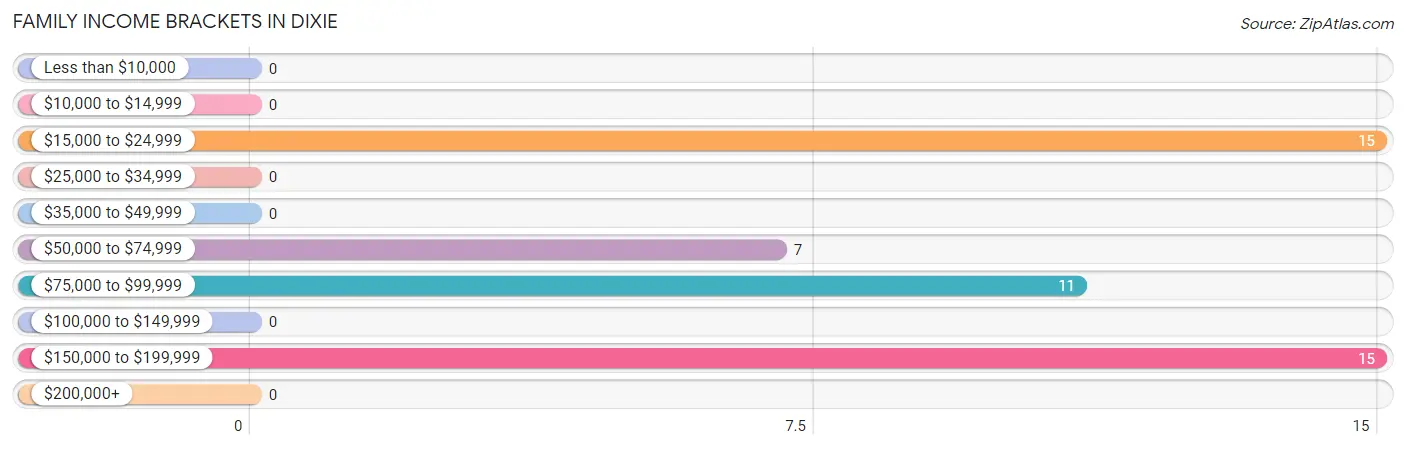
Family Income Brackets in Dixie
According to the Dixie family income data, there are 15 families falling into the $15,000 to $24,999 income range, which is the most common income bracket and makes up 31.2% of all families.
| Income Bracket | # Families | % Families |
| Less than $10,000 | 0 | 0.0% |
| $10,000 to $14,999 | 0 | 0.0% |
| $15,000 to $24,999 | 15 | 31.3% |
| $25,000 to $34,999 | 0 | 0.0% |
| $35,000 to $49,999 | 0 | 0.0% |
| $50,000 to $74,999 | 7 | 14.6% |
| $75,000 to $99,999 | 11 | 22.9% |
| $100,000 to $149,999 | 0 | 0.0% |
| $150,000 to $199,999 | 15 | 31.3% |
| $200,000+ | 0 | 0.0% |
Family Income by Famaliy Size in Dixie
| Income Bracket | # Families | Median Income |
| 2-Person Families | 48 (100.0%) | $0 |
| 3-Person Families | 0 (0.0%) | $0 |
| 4-Person Families | 0 (0.0%) | $0 |
| 5-Person Families | 0 (0.0%) | $0 |
| 6-Person Families | 0 (0.0%) | $0 |
| 7+ Person Families | 0 (0.0%) | $0 |
| Total | 48 (100.0%) | $0 |
Family Income by Number of Earners in Dixie
| Number of Earners | # Families | Median Income |
| No Earners | 18 (37.5%) | $0 |
| 1 Earner | 15 (31.2%) | $0 |
| 2 Earners | 15 (31.2%) | $0 |
| 3+ Earners | 0 (0.0%) | $0 |
| Total | 48 (100.0%) | $0 |
Household Income in Dixie
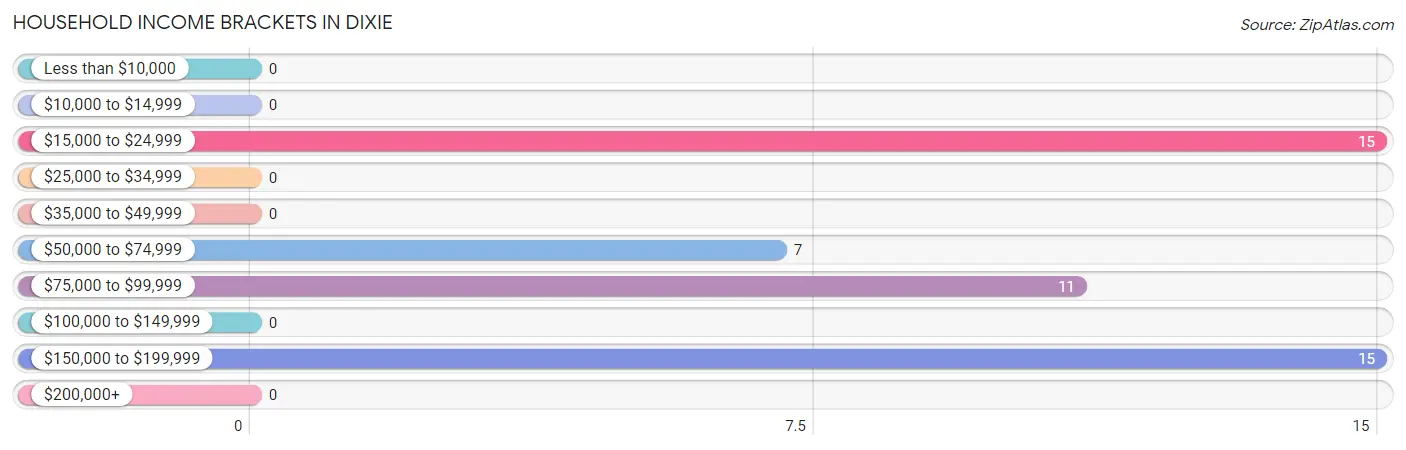
Household Income Brackets in Dixie
With 15 households falling in the category, the $15,000 to $24,999 income range is the most frequent in Dixie, accounting for 31.2% of all households.
| Income Bracket | # Households | % Households |
| Less than $10,000 | 0 | 0.0% |
| $10,000 to $14,999 | 0 | 0.0% |
| $15,000 to $24,999 | 15 | 31.3% |
| $25,000 to $34,999 | 0 | 0.0% |
| $35,000 to $49,999 | 0 | 0.0% |
| $50,000 to $74,999 | 7 | 14.6% |
| $75,000 to $99,999 | 11 | 22.9% |
| $100,000 to $149,999 | 0 | 0.0% |
| $150,000 to $199,999 | 15 | 31.3% |
| $200,000+ | 0 | 0.0% |
Household Income by Householder Age in Dixie
| Income Bracket | # Households | Median Income |
| 15 to 24 Years | 0 (0.0%) | $0 |
| 25 to 44 Years | 15 (31.2%) | $0 |
| 45 to 64 Years | 26 (54.2%) | $0 |
| 65+ Years | 7 (14.6%) | $0 |
| Total | 48 (100.0%) | $0 |
Poverty in Dixie
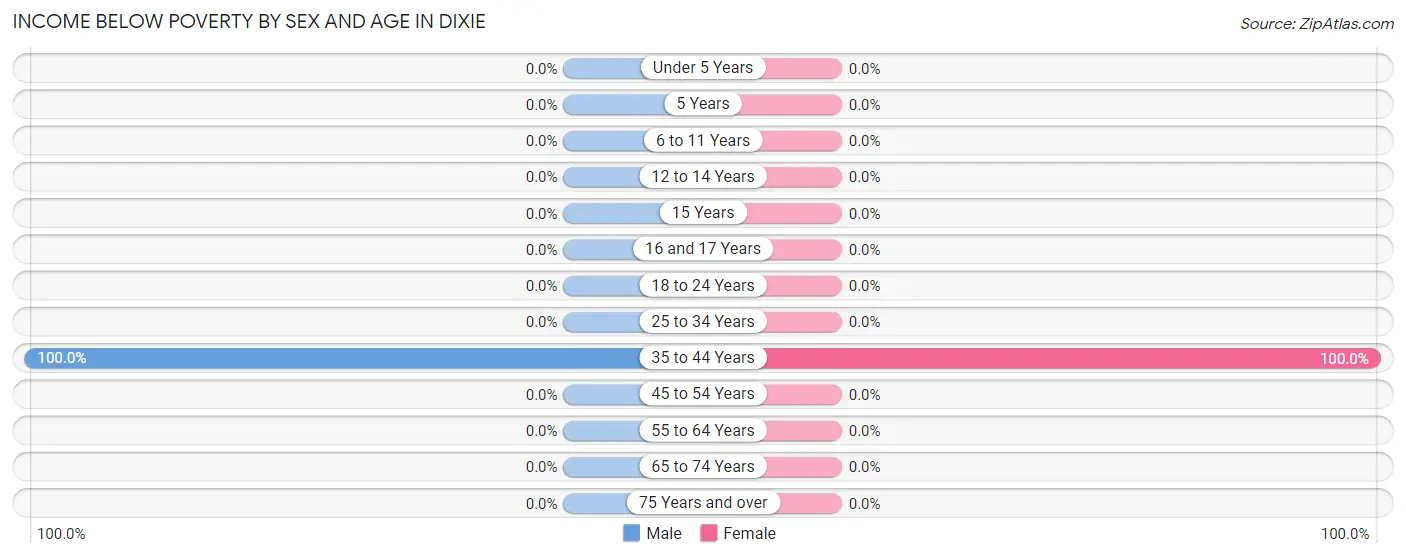
Income Below Poverty by Sex and Age in Dixie
With 34.0% poverty level for males and 31.2% for females among the residents of Dixie, 35 to 44 year old males and 35 to 44 year old females are the most vulnerable to poverty, with 17 males (100.0%) and 15 females (100.0%) in their respective age groups living below the poverty level.
| Age Bracket | Male | Female |
| Under 5 Years | 0 (0.0%) | 0 (0.0%) |
| 5 Years | 0 (0.0%) | 0 (0.0%) |
| 6 to 11 Years | 0 (0.0%) | 0 (0.0%) |
| 12 to 14 Years | 0 (0.0%) | 0 (0.0%) |
| 15 Years | 0 (0.0%) | 0 (0.0%) |
| 16 and 17 Years | 0 (0.0%) | 0 (0.0%) |
| 18 to 24 Years | 0 (0.0%) | 0 (0.0%) |
| 25 to 34 Years | 0 (0.0%) | 0 (0.0%) |
| 35 to 44 Years | 17 (100.0%) | 15 (100.0%) |
| 45 to 54 Years | 0 (0.0%) | 0 (0.0%) |
| 55 to 64 Years | 0 (0.0%) | 0 (0.0%) |
| 65 to 74 Years | 0 (0.0%) | 0 (0.0%) |
| 75 Years and over | 0 (0.0%) | 0 (0.0%) |
| Total | 17 (34.0%) | 15 (31.2%) |
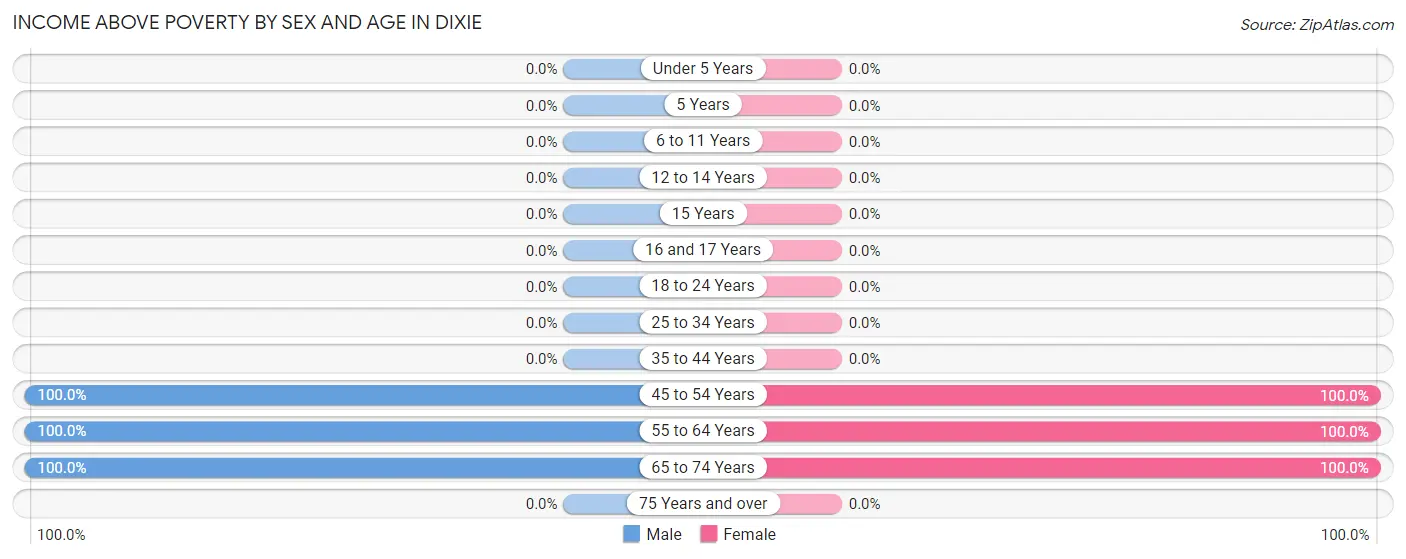
Income Above Poverty by Sex and Age in Dixie
According to the poverty statistics in Dixie, males aged 45 to 54 years and females aged 45 to 54 years are the age groups that are most secure financially, with 100.0% of males and 100.0% of females in these age groups living above the poverty line.
| Age Bracket | Male | Female |
| Under 5 Years | 0 (0.0%) | 0 (0.0%) |
| 5 Years | 0 (0.0%) | 0 (0.0%) |
| 6 to 11 Years | 0 (0.0%) | 0 (0.0%) |
| 12 to 14 Years | 0 (0.0%) | 0 (0.0%) |
| 15 Years | 0 (0.0%) | 0 (0.0%) |
| 16 and 17 Years | 0 (0.0%) | 0 (0.0%) |
| 18 to 24 Years | 0 (0.0%) | 0 (0.0%) |
| 25 to 34 Years | 0 (0.0%) | 0 (0.0%) |
| 35 to 44 Years | 0 (0.0%) | 0 (0.0%) |
| 45 to 54 Years | 15 (100.0%) | 17 (100.0%) |
| 55 to 64 Years | 11 (100.0%) | 10 (100.0%) |
| 65 to 74 Years | 7 (100.0%) | 6 (100.0%) |
| 75 Years and over | 0 (0.0%) | 0 (0.0%) |
| Total | 33 (66.0%) | 33 (68.8%) |
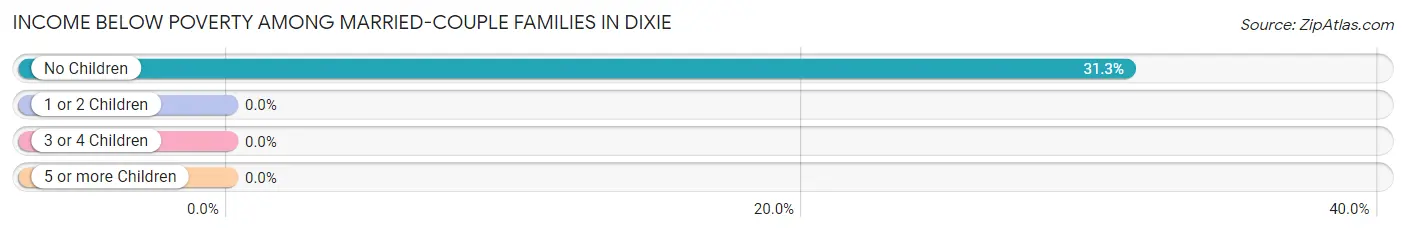
Income Below Poverty Among Married-Couple Families in Dixie
The poverty statistics for married-couple families in Dixie show that 31.2% or 15 of the total 48 families live below the poverty line. Families with no children have the highest poverty rate of 31.2%, comprising of 15 families. On the other hand, families with no children have the lowest poverty rate of 31.2%, which includes 15 families.
| Children | Above Poverty | Below Poverty |
| No Children | 33 (68.8%) | 15 (31.2%) |
| 1 or 2 Children | 0 (0.0%) | 0 (0.0%) |
| 3 or 4 Children | 0 (0.0%) | 0 (0.0%) |
| 5 or more Children | 0 (0.0%) | 0 (0.0%) |
| Total | 33 (68.8%) | 15 (31.2%) |
Income Below Poverty Among Single-Parent Households in Dixie
| Children | Single Father | Single Mother |
| No Children | 0 (0.0%) | 0 (0.0%) |
| 1 or 2 Children | 0 (0.0%) | 0 (0.0%) |
| 3 or 4 Children | 0 (0.0%) | 0 (0.0%) |
| 5 or more Children | 0 (0.0%) | 0 (0.0%) |
| Total | 0 (0.0%) | 0 (0.0%) |
Income Below Poverty Among Married-Couple vs Single-Parent Households in Dixie
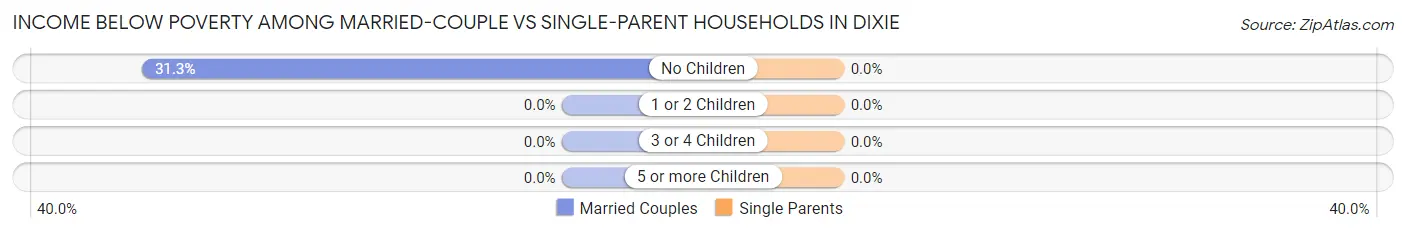
| Children | Married-Couple Families | Single-Parent Households |
| No Children | 15 (31.2%) | 0 (0.0%) |
| 1 or 2 Children | 0 (0.0%) | 0 (0.0%) |
| 3 or 4 Children | 0 (0.0%) | 0 (0.0%) |
| 5 or more Children | 0 (0.0%) | 0 (0.0%) |
| Total | 15 (31.2%) | 0 (0.0%) |
Race in Dixie
The most populous races in Dixie are , and White / Caucasian (98 | 100.0%).
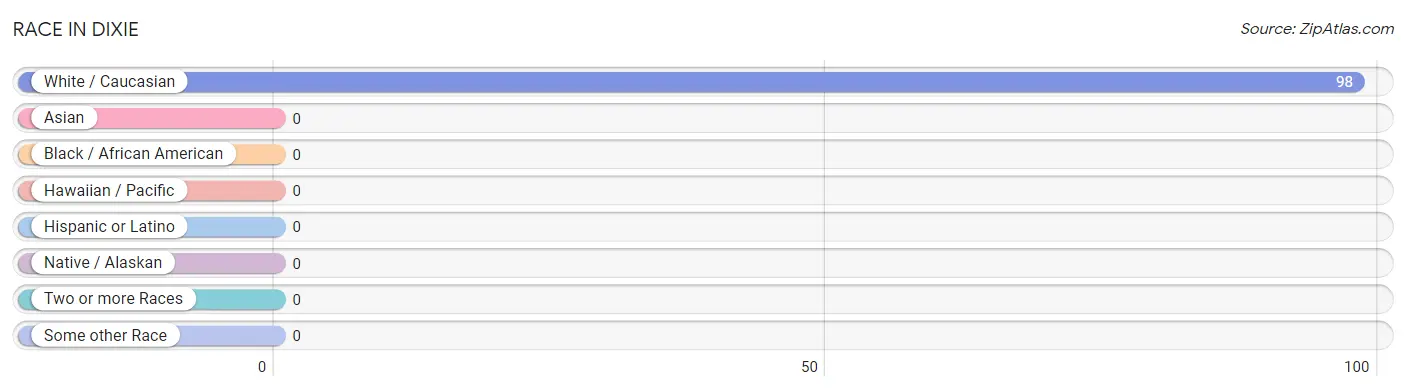
| Race | # Population | % Population |
| Asian | 0 | 0.0% |
| Black / African American | 0 | 0.0% |
| Hawaiian / Pacific | 0 | 0.0% |
| Hispanic or Latino | 0 | 0.0% |
| Native / Alaskan | 0 | 0.0% |
| White / Caucasian | 98 | 100.0% |
| Two or more Races | 0 | 0.0% |
| Some other Race | 0 | 0.0% |
| Total | 98 | 100.0% |
Ancestry in Dixie
The most populous ancestries reported in Dixie are German (15 | 15.3%), and American (13 | 13.3%), together accounting for 28.6% of all Dixie residents.
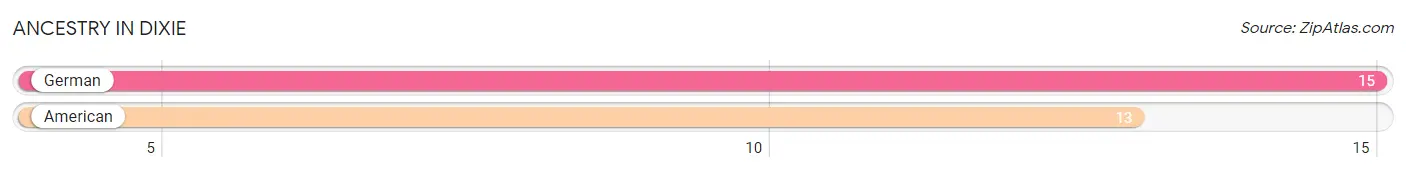
| Ancestry | # Population | % Population |
| American | 13 | 13.3% |
| German | 15 | 15.3% | View All 2 Rows |
Immigrants in Dixie

| Immigration Origin | # Population | % Population | View All 0 Rows |
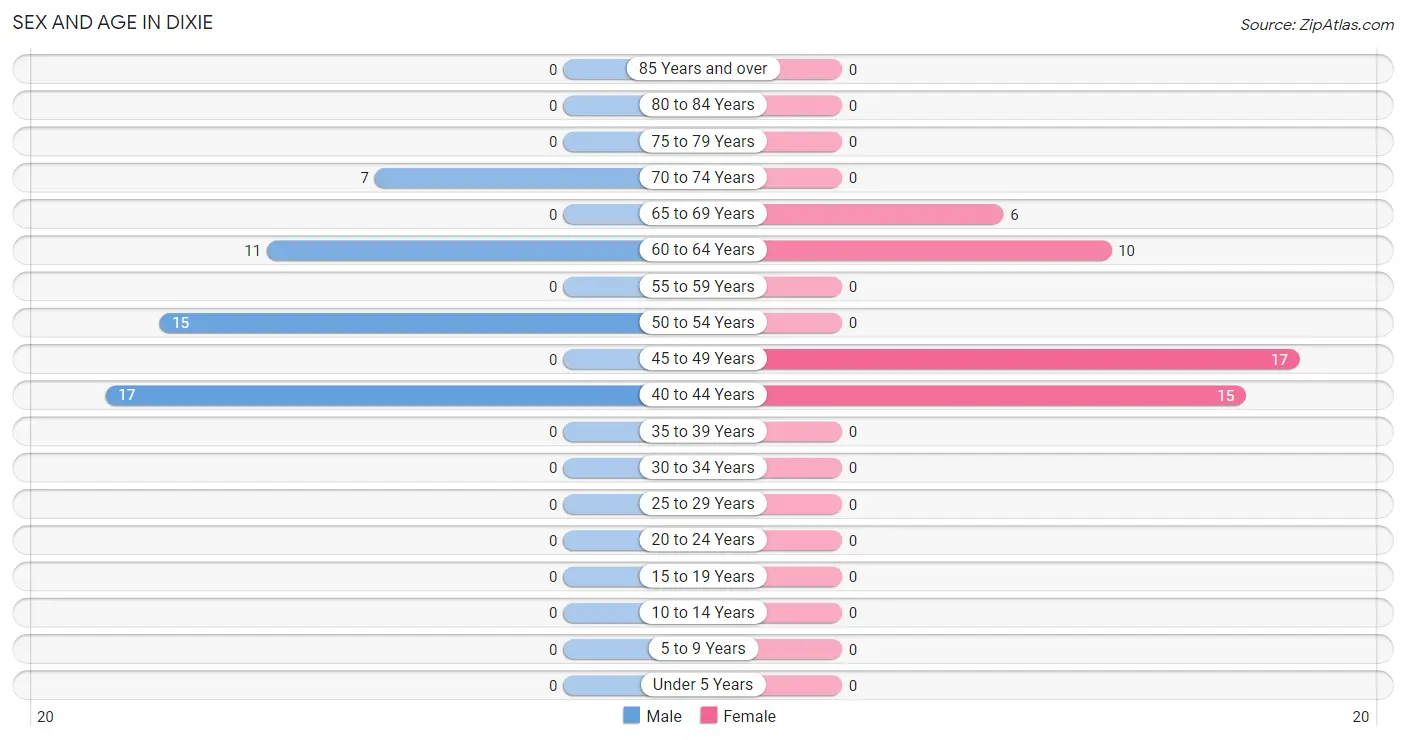
Sex and Age in Dixie
Sex and Age in Dixie
The most populous age groups in Dixie are 40 to 44 Years (17 | 34.0%) for men and 45 to 49 Years (17 | 35.4%) for women.
| Age Bracket | Male | Female |
| Under 5 Years | 0 (0.0%) | 0 (0.0%) |
| 5 to 9 Years | 0 (0.0%) | 0 (0.0%) |
| 10 to 14 Years | 0 (0.0%) | 0 (0.0%) |
| 15 to 19 Years | 0 (0.0%) | 0 (0.0%) |
| 20 to 24 Years | 0 (0.0%) | 0 (0.0%) |
| 25 to 29 Years | 0 (0.0%) | 0 (0.0%) |
| 30 to 34 Years | 0 (0.0%) | 0 (0.0%) |
| 35 to 39 Years | 0 (0.0%) | 0 (0.0%) |
| 40 to 44 Years | 17 (34.0%) | 15 (31.2%) |
| 45 to 49 Years | 0 (0.0%) | 17 (35.4%) |
| 50 to 54 Years | 15 (30.0%) | 0 (0.0%) |
| 55 to 59 Years | 0 (0.0%) | 0 (0.0%) |
| 60 to 64 Years | 11 (22.0%) | 10 (20.8%) |
| 65 to 69 Years | 0 (0.0%) | 6 (12.5%) |
| 70 to 74 Years | 7 (14.0%) | 0 (0.0%) |
| 75 to 79 Years | 0 (0.0%) | 0 (0.0%) |
| 80 to 84 Years | 0 (0.0%) | 0 (0.0%) |
| 85 Years and over | 0 (0.0%) | 0 (0.0%) |
| Total | 50 (100.0%) | 48 (100.0%) |
Families and Households in Dixie
Median Family Size in Dixie
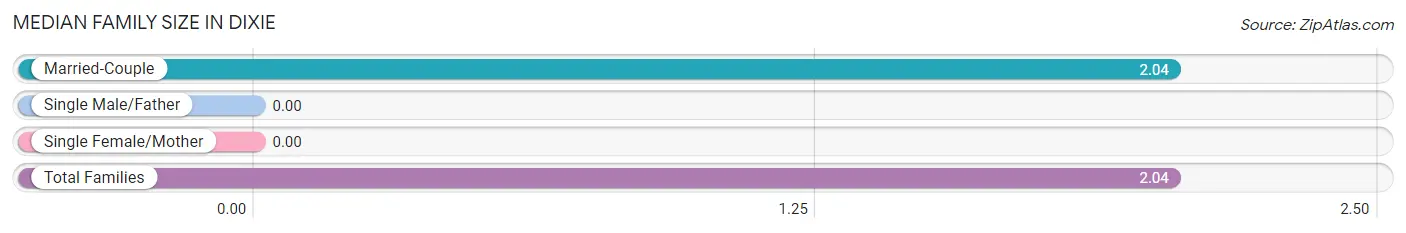
| Family Type | # Families | Family Size |
| Married-Couple | 48 (100.0%) | 2.04 |
| Single Male/Father | 0 (0.0%) | - |
| Single Female/Mother | 0 (0.0%) | - |
| Total Families | 48 (100.0%) | 2.04 |
Median Household Size in Dixie
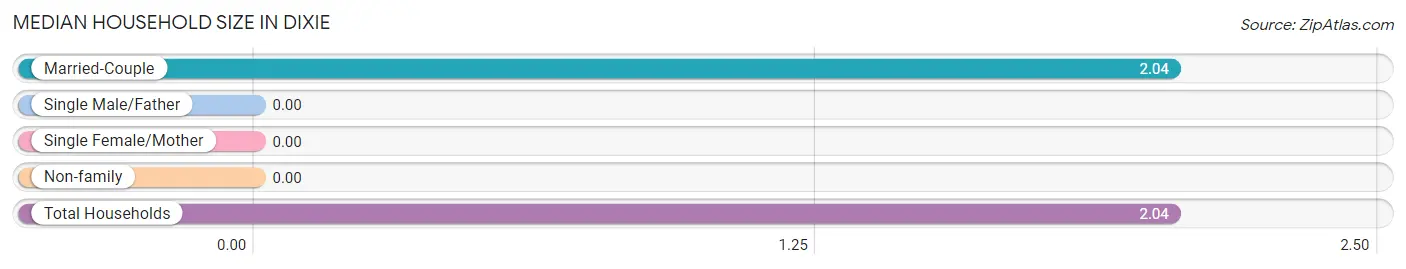
| Household Type | # Households | Household Size |
| Married-Couple | 48 (100.0%) | 2.04 |
| Single Male/Father | 0 (0.0%) | - |
| Single Female/Mother | 0 (0.0%) | - |
| Non-family | 0 (0.0%) | - |
| Total Households | 48 (100.0%) | 2.04 |
Household Size by Marriage Status in Dixie
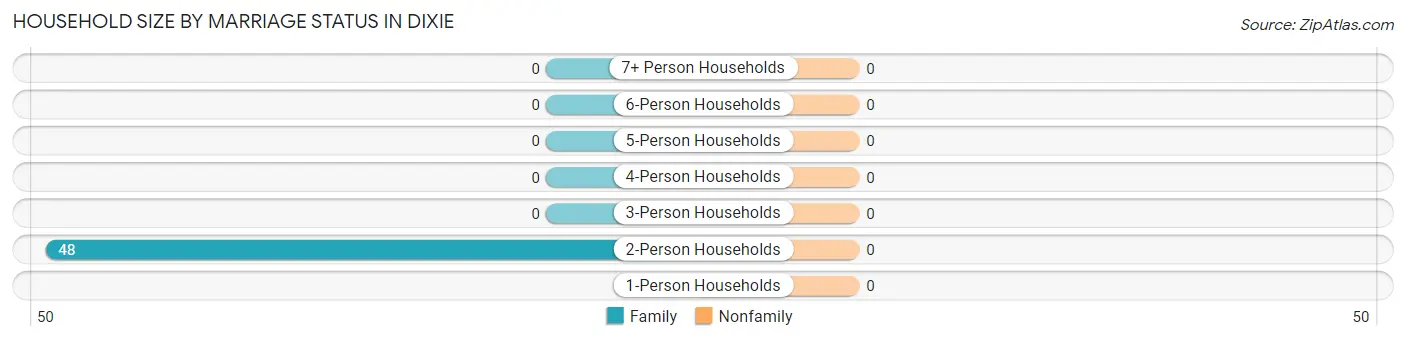
| Household Size | Family Households | Nonfamily Households |
| 1-Person Households | - | 0 (0.0%) |
| 2-Person Households | 48 (100.0%) | 0 (0.0%) |
| 3-Person Households | 0 (0.0%) | 0 (0.0%) |
| 4-Person Households | 0 (0.0%) | 0 (0.0%) |
| 5-Person Households | 0 (0.0%) | 0 (0.0%) |
| 6-Person Households | 0 (0.0%) | 0 (0.0%) |
| 7+ Person Households | 0 (0.0%) | 0 (0.0%) |
| Total | 48 (100.0%) | 0 (0.0%) |
Female Fertility in Dixie
Fertility by Age in Dixie
| Age Bracket | Women with Births | Births / 1,000 Women |
| 15 to 19 years | 0 (0.0%) | 0.0 |
| 20 to 34 years | 0 (0.0%) | 0.0 |
| 35 to 50 years | 0 (0.0%) | 0.0 |
| Total | 0 (0.0%) | 0.0 |
Fertility by Age by Marriage Status in Dixie
| Age Bracket | Married | Unmarried |
| 15 to 19 years | 0 (0.0%) | 0 (0.0%) |
| 20 to 34 years | 0 (0.0%) | 0 (0.0%) |
| 35 to 50 years | 0 (0.0%) | 0 (0.0%) |
| Total | 0 (0.0%) | 0 (0.0%) |
Fertility by Education in Dixie
| Educational Attainment | Women with Births | Births / 1,000 Women |
| Less than High School | 0 (0.0%) | 0.0 |
| High School Diploma | 0 (0.0%) | 0.0 |
| College or Associate's Degree | 0 (0.0%) | 0.0 |
| Bachelor's Degree | 0 (0.0%) | 0.0 |
| Graduate Degree | 0 (0.0%) | 0.0 |
| Total | 0 (0.0%) | 0.0 |
Fertility by Education by Marriage Status in Dixie
| Educational Attainment | Married | Unmarried |
| Less than High School | 0 (0.0%) | 0 (0.0%) |
| High School Diploma | 0 (0.0%) | 0 (0.0%) |
| College or Associate's Degree | 0 (0.0%) | 0 (0.0%) |
| Bachelor's Degree | 0 (0.0%) | 0 (0.0%) |
| Graduate Degree | 0 (0.0%) | 0 (0.0%) |
| Total | 0 (0.0%) | 0 (0.0%) |
Employment Characteristics in Dixie
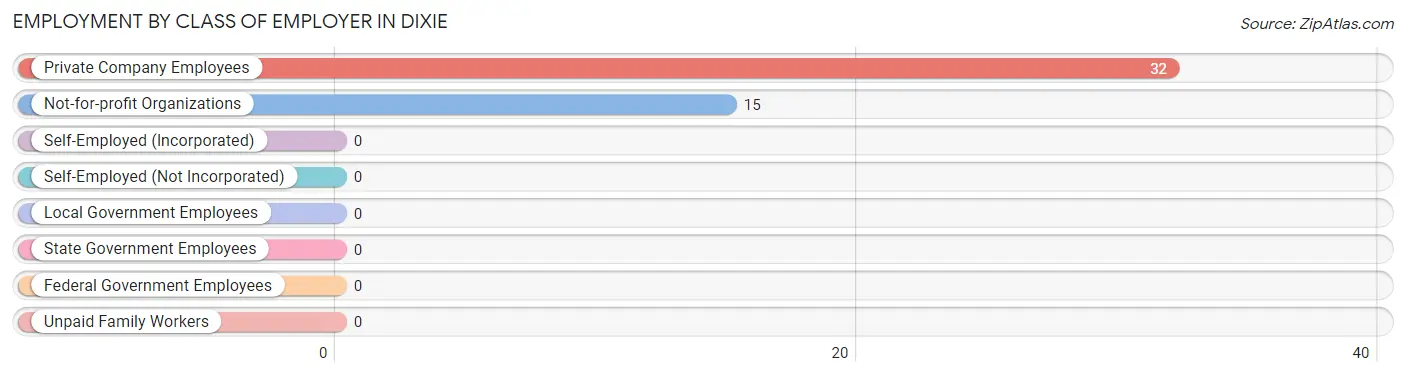
Employment by Class of Employer in Dixie
Among the 47 employed individuals in Dixie, private company employees (32 | 68.1%), and not-for-profit organizations (15 | 31.9%) make up the most common classes of employment.
| Employer Class | # Employees | % Employees |
| Private Company Employees | 32 | 68.1% |
| Self-Employed (Incorporated) | 0 | 0.0% |
| Self-Employed (Not Incorporated) | 0 | 0.0% |
| Not-for-profit Organizations | 15 | 31.9% |
| Local Government Employees | 0 | 0.0% |
| State Government Employees | 0 | 0.0% |
| Federal Government Employees | 0 | 0.0% |
| Unpaid Family Workers | 0 | 0.0% |
| Total | 47 | 100.0% |
Employment Status by Age in Dixie
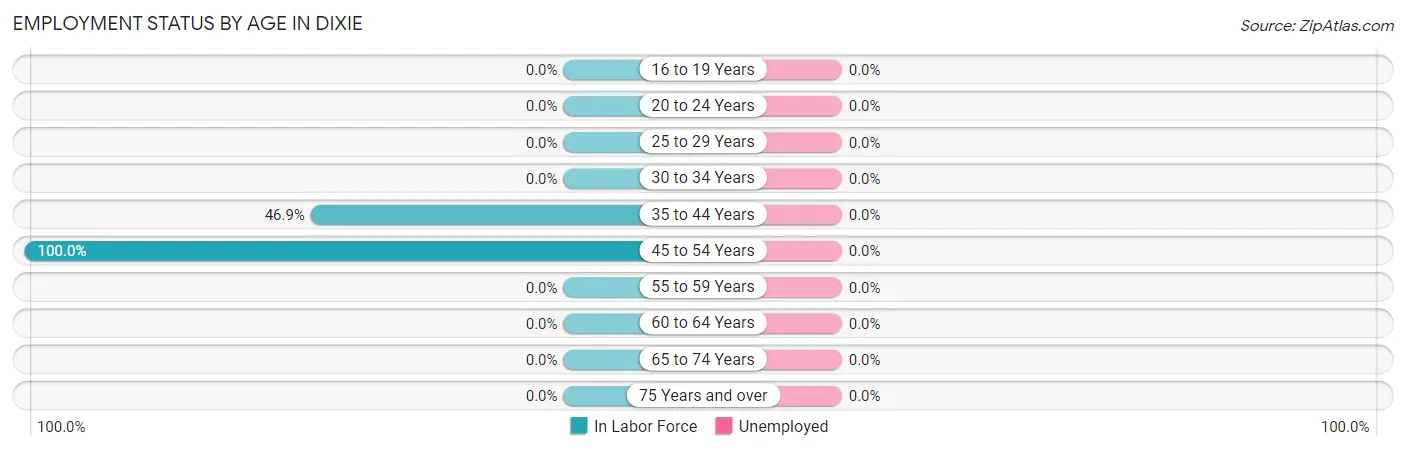
| Age Bracket | In Labor Force | Unemployed |
| 16 to 19 Years | 0 (0.0%) | 0 (0.0%) |
| 20 to 24 Years | 0 (0.0%) | 0 (0.0%) |
| 25 to 29 Years | 0 (0.0%) | 0 (0.0%) |
| 30 to 34 Years | 0 (0.0%) | 0 (0.0%) |
| 35 to 44 Years | 15 (46.9%) | 0 (0.0%) |
| 45 to 54 Years | 32 (100.0%) | 0 (0.0%) |
| 55 to 59 Years | 0 (0.0%) | 0 (0.0%) |
| 60 to 64 Years | 0 (0.0%) | 0 (0.0%) |
| 65 to 74 Years | 0 (0.0%) | 0 (0.0%) |
| 75 Years and over | 0 (0.0%) | 0 (0.0%) |
| Total | 47 (48.0%) | 0 (0.0%) |
Employment Status by Educational Attainment in Dixie
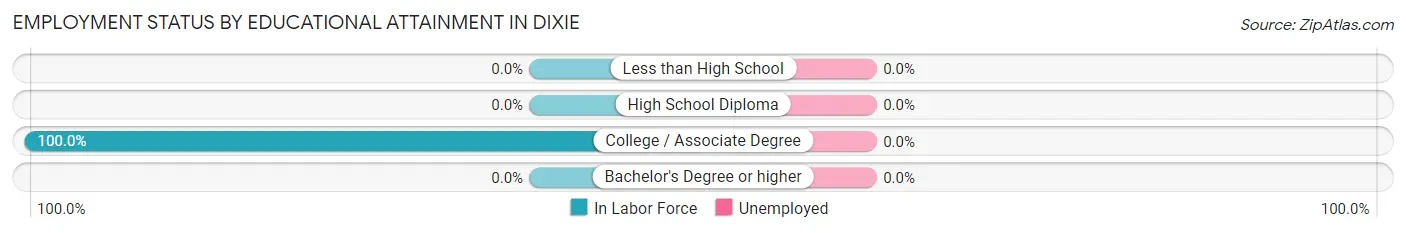
| Educational Attainment | In Labor Force | Unemployed |
| Less than High School | 0 (0.0%) | 0 (0.0%) |
| High School Diploma | 0 (0.0%) | 0 (0.0%) |
| College / Associate Degree | 47 (100.0%) | 0 (0.0%) |
| Bachelor's Degree or higher | 0 (0.0%) | 0 (0.0%) |
| Total | 47 (55.3%) | 0 (0.0%) |
Employment Occupations by Sex in Dixie
Management, Business, Science and Arts Occupations
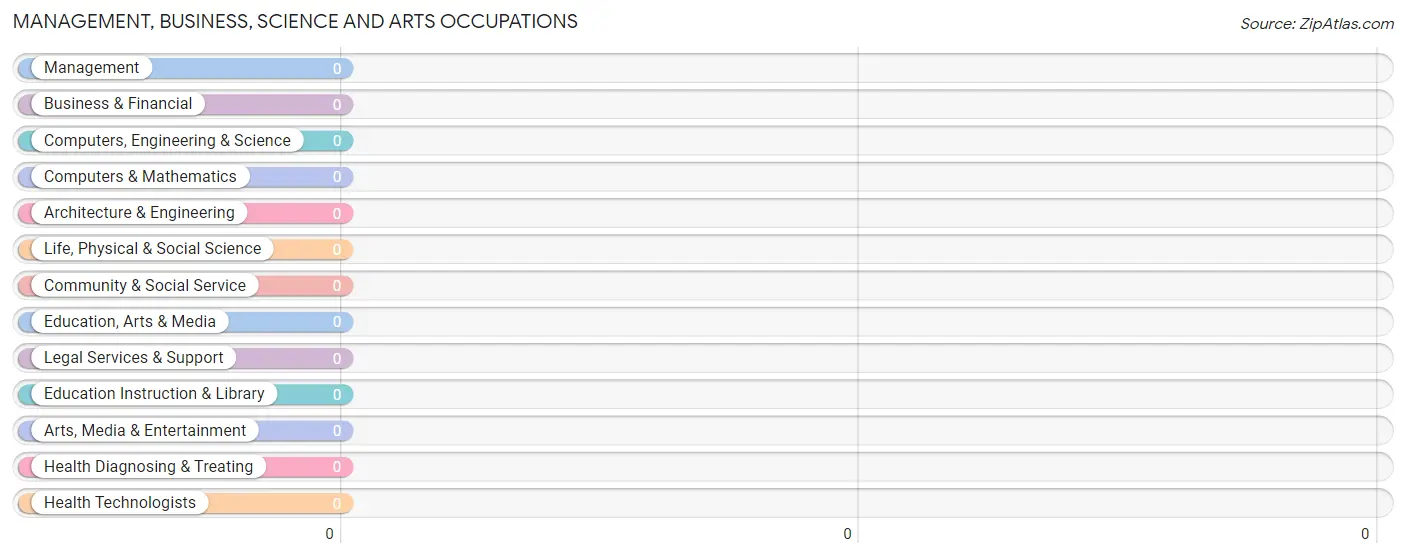
Management, Business, Science and Arts Occupations by Sex
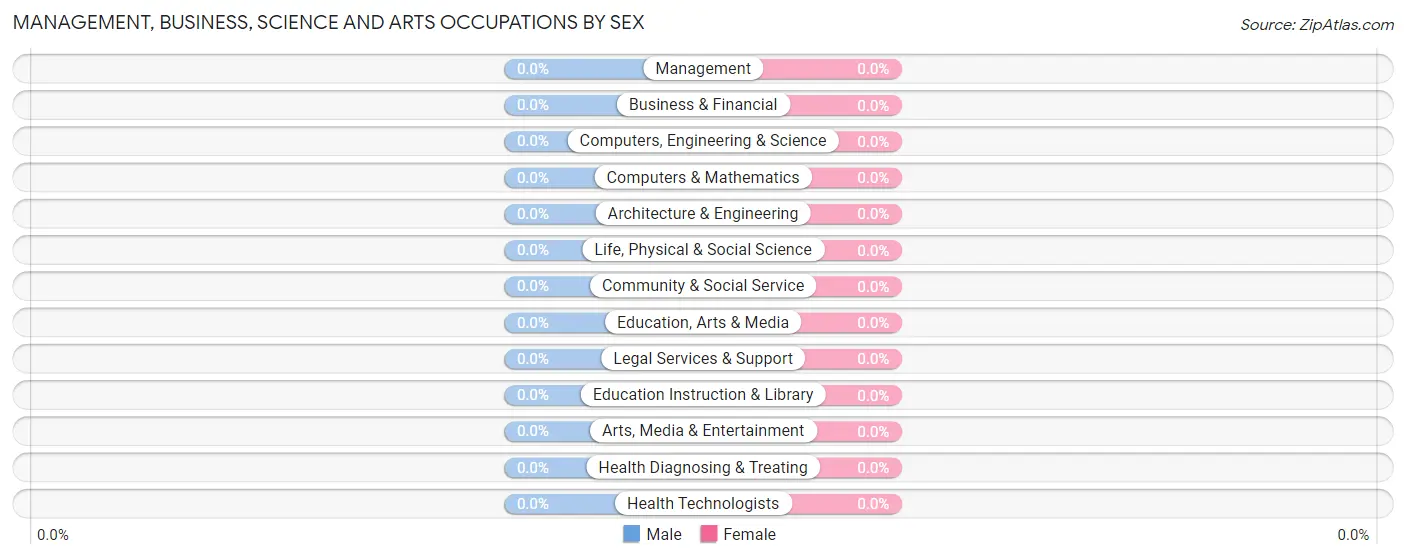
| Occupation | Male | Female |
| Management | 0 (0.0%) | 0 (0.0%) |
| Business & Financial | 0 (0.0%) | 0 (0.0%) |
| Computers, Engineering & Science | 0 (0.0%) | 0 (0.0%) |
| Computers & Mathematics | 0 (0.0%) | 0 (0.0%) |
| Architecture & Engineering | 0 (0.0%) | 0 (0.0%) |
| Life, Physical & Social Science | 0 (0.0%) | 0 (0.0%) |
| Community & Social Service | 0 (0.0%) | 0 (0.0%) |
| Education, Arts & Media | 0 (0.0%) | 0 (0.0%) |
| Legal Services & Support | 0 (0.0%) | 0 (0.0%) |
| Education Instruction & Library | 0 (0.0%) | 0 (0.0%) |
| Arts, Media & Entertainment | 0 (0.0%) | 0 (0.0%) |
| Health Diagnosing & Treating | 0 (0.0%) | 0 (0.0%) |
| Health Technologists | 0 (0.0%) | 0 (0.0%) |
| Total (Category) | 0 (0.0%) | 0 (0.0%) |
| Total (Overall) | 15 (31.9%) | 32 (68.1%) |
Services Occupations
The most common Services occupations in Dixie are , and Healthcare Support (15 | 31.9%).
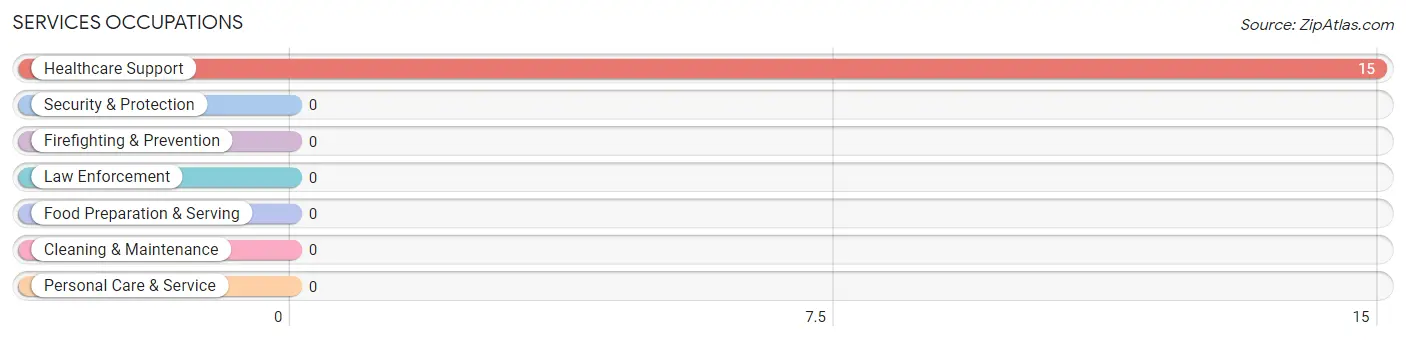
Services Occupations by Sex
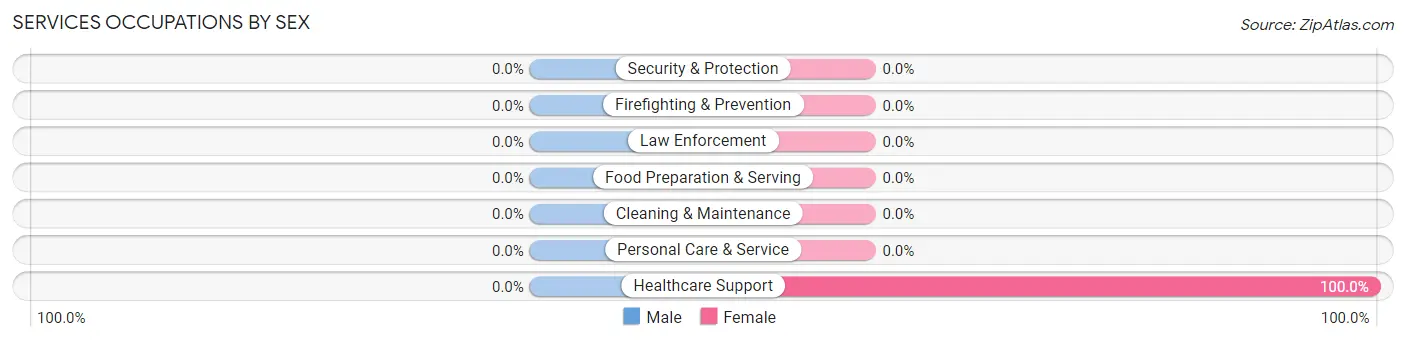
| Occupation | Male | Female |
| Healthcare Support | 0 (0.0%) | 15 (100.0%) |
| Security & Protection | 0 (0.0%) | 0 (0.0%) |
| Firefighting & Prevention | 0 (0.0%) | 0 (0.0%) |
| Law Enforcement | 0 (0.0%) | 0 (0.0%) |
| Food Preparation & Serving | 0 (0.0%) | 0 (0.0%) |
| Cleaning & Maintenance | 0 (0.0%) | 0 (0.0%) |
| Personal Care & Service | 0 (0.0%) | 0 (0.0%) |
| Total (Category) | 0 (0.0%) | 15 (100.0%) |
| Total (Overall) | 15 (31.9%) | 32 (68.1%) |
Sales and Office Occupations
The most common Sales and Office occupations in Dixie are , and Office & Administration (17 | 36.2%).
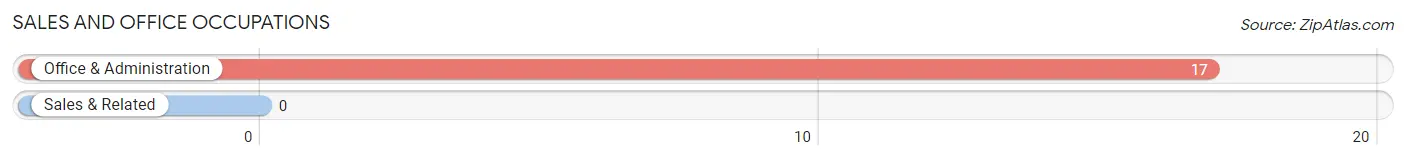
Sales and Office Occupations by Sex
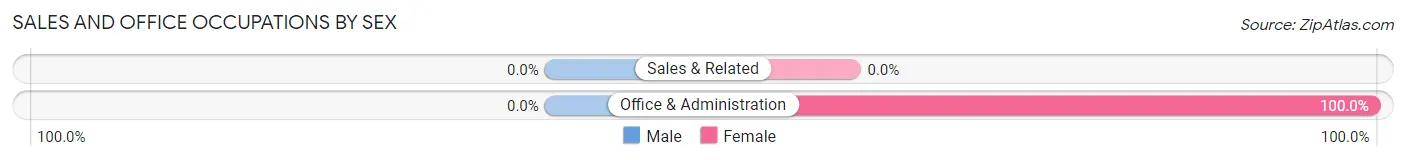
| Occupation | Male | Female |
| Sales & Related | 0 (0.0%) | 0 (0.0%) |
| Office & Administration | 0 (0.0%) | 17 (100.0%) |
| Total (Category) | 0 (0.0%) | 17 (100.0%) |
| Total (Overall) | 15 (31.9%) | 32 (68.1%) |
Natural Resources, Construction and Maintenance Occupations
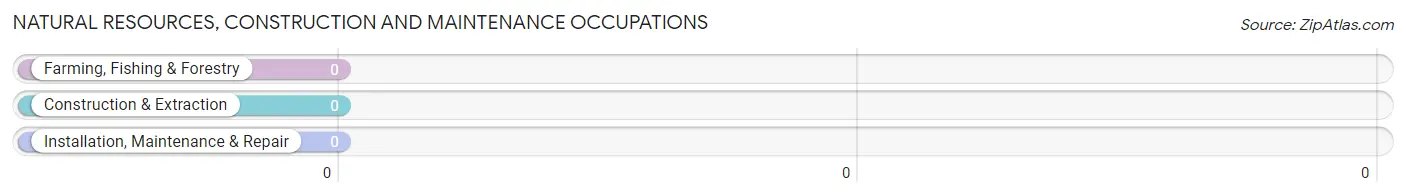
Natural Resources, Construction and Maintenance Occupations by Sex
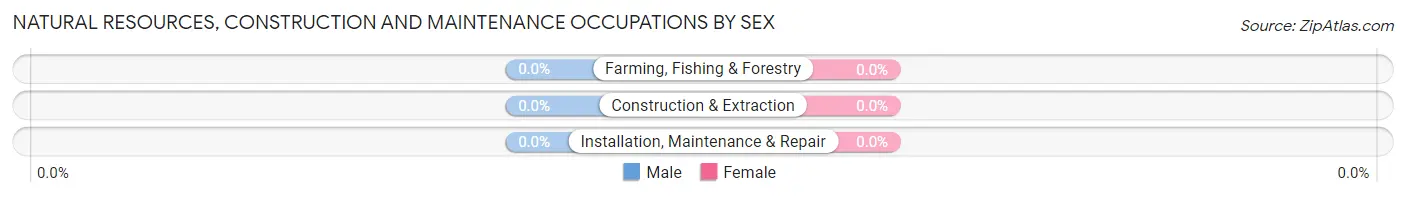
| Occupation | Male | Female |
| Farming, Fishing & Forestry | 0 (0.0%) | 0 (0.0%) |
| Construction & Extraction | 0 (0.0%) | 0 (0.0%) |
| Installation, Maintenance & Repair | 0 (0.0%) | 0 (0.0%) |
| Total (Category) | 0 (0.0%) | 0 (0.0%) |
| Total (Overall) | 15 (31.9%) | 32 (68.1%) |
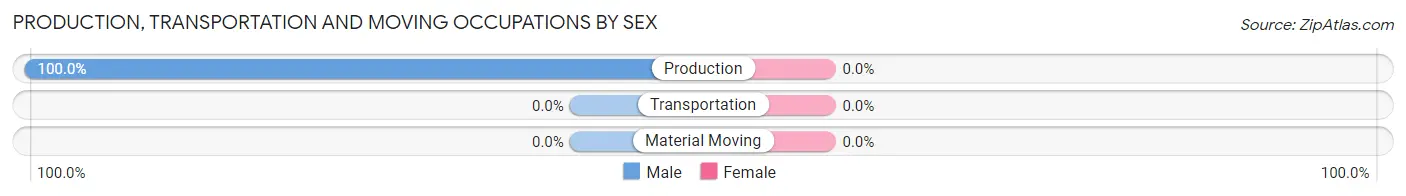
Production, Transportation and Moving Occupations
The most common Production, Transportation and Moving occupations in Dixie are , and Production (15 | 31.9%).
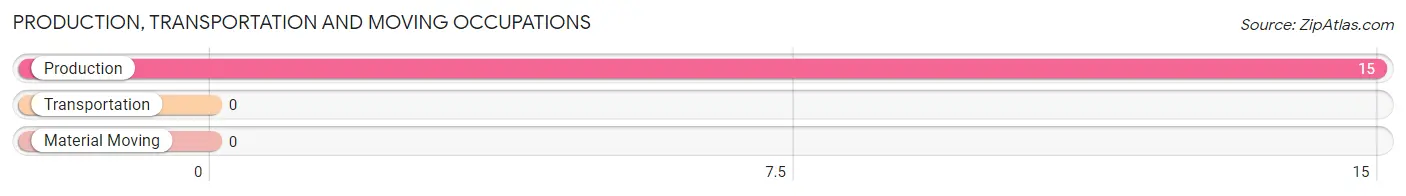
Production, Transportation and Moving Occupations by Sex
| Occupation | Male | Female |
| Production | 15 (100.0%) | 0 (0.0%) |
| Transportation | 0 (0.0%) | 0 (0.0%) |
| Material Moving | 0 (0.0%) | 0 (0.0%) |
| Total (Category) | 15 (100.0%) | 0 (0.0%) |
| Total (Overall) | 15 (31.9%) | 32 (68.1%) |
Employment Industries by Sex in Dixie
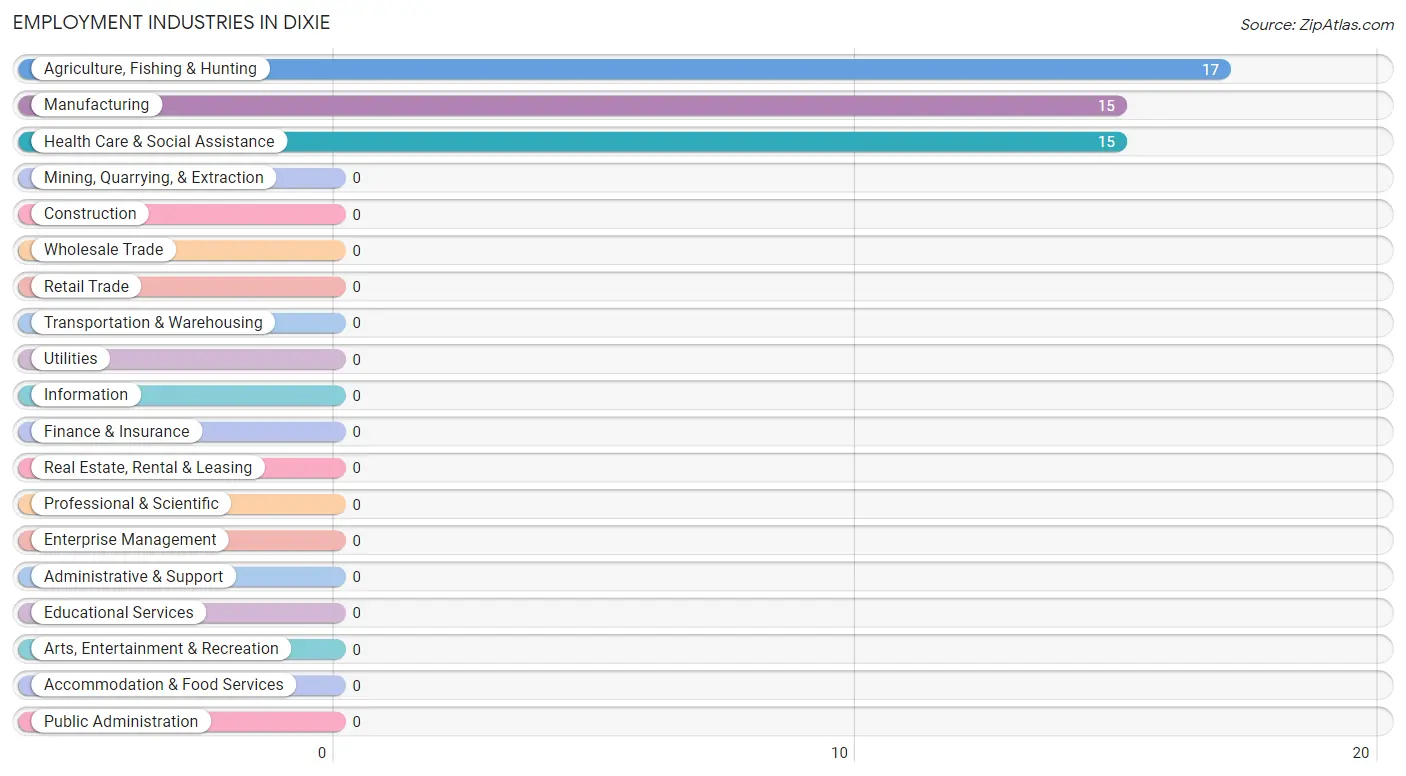
Employment Industries in Dixie
The major employment industries in Dixie include Agriculture, Fishing & Hunting (17 | 36.2%), Manufacturing (15 | 31.9%), and Health Care & Social Assistance (15 | 31.9%).
Employment Industries by Sex in Dixie
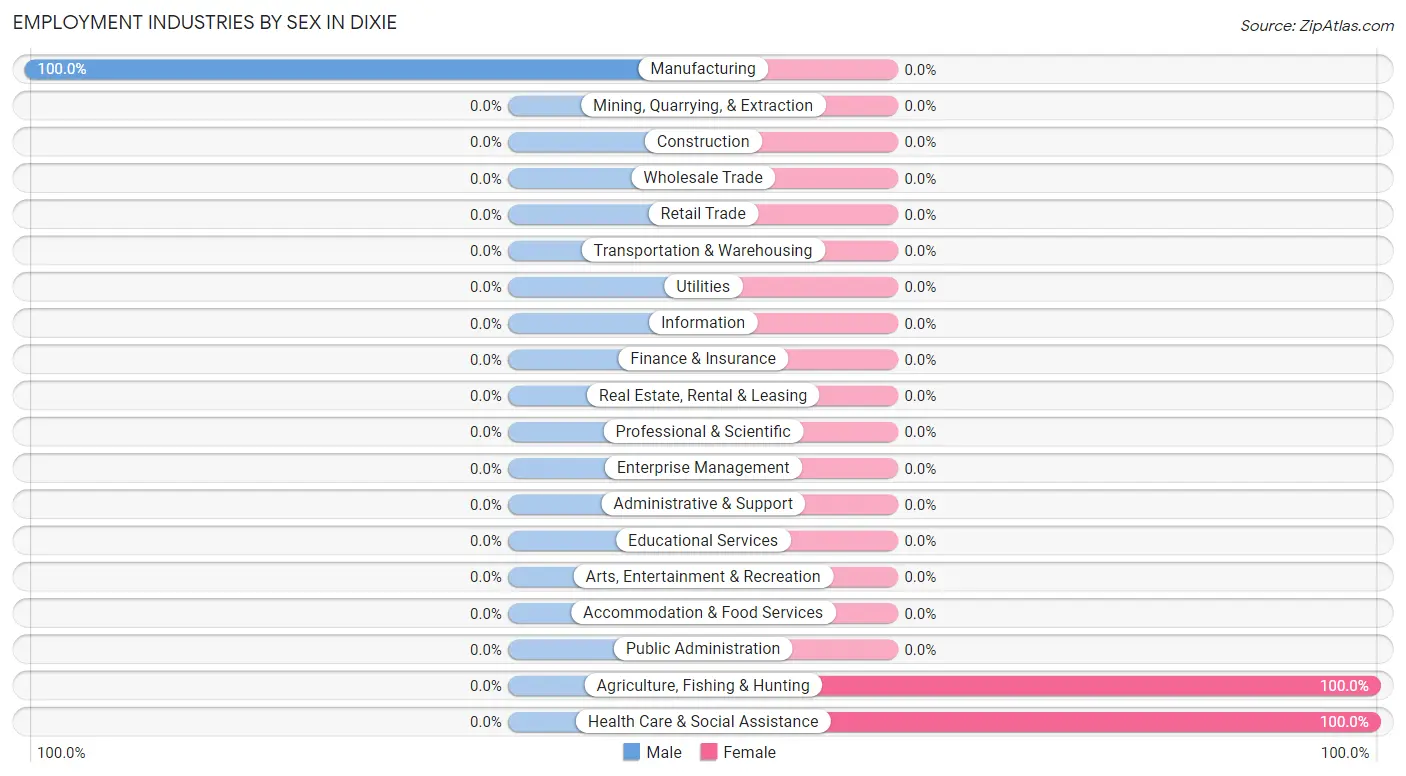
| Industry | Male | Female |
| Agriculture, Fishing & Hunting | 0 (0.0%) | 17 (100.0%) |
| Mining, Quarrying, & Extraction | 0 (0.0%) | 0 (0.0%) |
| Construction | 0 (0.0%) | 0 (0.0%) |
| Manufacturing | 15 (100.0%) | 0 (0.0%) |
| Wholesale Trade | 0 (0.0%) | 0 (0.0%) |
| Retail Trade | 0 (0.0%) | 0 (0.0%) |
| Transportation & Warehousing | 0 (0.0%) | 0 (0.0%) |
| Utilities | 0 (0.0%) | 0 (0.0%) |
| Information | 0 (0.0%) | 0 (0.0%) |
| Finance & Insurance | 0 (0.0%) | 0 (0.0%) |
| Real Estate, Rental & Leasing | 0 (0.0%) | 0 (0.0%) |
| Professional & Scientific | 0 (0.0%) | 0 (0.0%) |
| Enterprise Management | 0 (0.0%) | 0 (0.0%) |
| Administrative & Support | 0 (0.0%) | 0 (0.0%) |
| Educational Services | 0 (0.0%) | 0 (0.0%) |
| Health Care & Social Assistance | 0 (0.0%) | 15 (100.0%) |
| Arts, Entertainment & Recreation | 0 (0.0%) | 0 (0.0%) |
| Accommodation & Food Services | 0 (0.0%) | 0 (0.0%) |
| Public Administration | 0 (0.0%) | 0 (0.0%) |
| Total | 15 (31.9%) | 32 (68.1%) |
Education in Dixie
School Enrollment in Dixie
| School Level | # Students | % Students |
| Nursery / Preschool | 0 | 0.0% |
| Kindergarten | 0 | 0.0% |
| Elementary School | 0 | 0.0% |
| Middle School | 0 | 0.0% |
| High School | 0 | 0.0% |
| College / Undergraduate | 0 | 0.0% |
| Graduate / Professional | 0 | 0.0% |
| Total | 0 | 0.0% |
School Enrollment by Age by Funding Source in Dixie
| Age Bracket | Public School | Private School |
| 3 to 4 Year Olds | 0 (0.0%) | 0 (0.0%) |
| 5 to 9 Year Old | 0 (0.0%) | 0 (0.0%) |
| 10 to 14 Year Olds | 0 (0.0%) | 0 (0.0%) |
| 15 to 17 Year Olds | 0 (0.0%) | 0 (0.0%) |
| 18 to 19 Year Olds | 0 (0.0%) | 0 (0.0%) |
| 20 to 24 Year Olds | 0 (0.0%) | 0 (0.0%) |
| 25 to 34 Year Olds | 0 (0.0%) | 0 (0.0%) |
| 35 Years and over | 0 (0.0%) | 0 (0.0%) |
| Total | 0 (0.0%) | 0 (0.0%) |
Educational Attainment by Field of Study in Dixie
| Field of Study | # Graduates | % Graduates |
| Computers & Mathematics | 0 | 0.0% |
| Bio, Nature & Agricultural | 0 | 0.0% |
| Physical & Health Sciences | 0 | 0.0% |
| Psychology | 0 | 0.0% |
| Social Sciences | 0 | 0.0% |
| Engineering | 0 | 0.0% |
| Multidisciplinary Studies | 0 | 0.0% |
| Science & Technology | 0 | 0.0% |
| Business | 0 | 0.0% |
| Education | 0 | 0.0% |
| Literature & Languages | 0 | 0.0% |
| Liberal Arts & History | 0 | 0.0% |
| Visual & Performing Arts | 0 | 0.0% |
| Communications | 0 | 0.0% |
| Arts & Humanities | 0 | 0.0% |
| Total | 0 | 0.0% |
Transportation & Commute in Dixie
Vehicle Availability by Sex in Dixie
The most prevalent vehicle ownership categories in Dixie are males with 3 vehicles (15, accounting for 100.0%) and females with 3 vehicles (17, making up 46.9%).
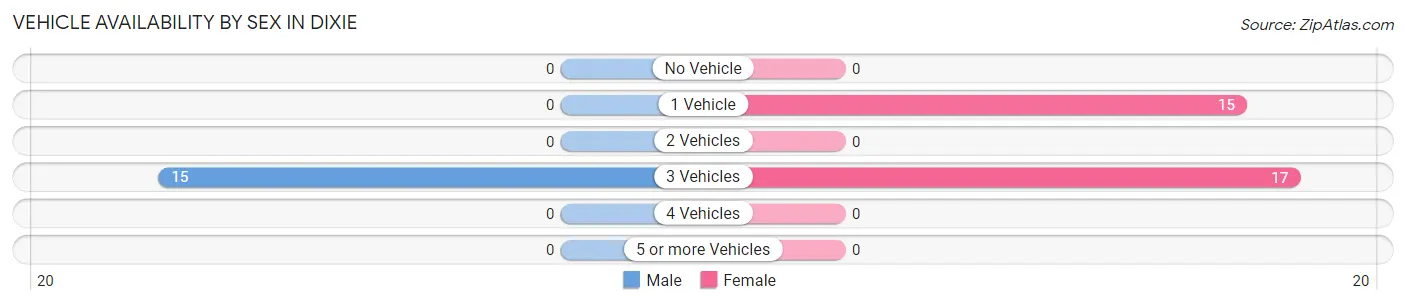
| Vehicles Available | Male | Female |
| No Vehicle | 0 (0.0%) | 0 (0.0%) |
| 1 Vehicle | 0 (0.0%) | 15 (46.9%) |
| 2 Vehicles | 0 (0.0%) | 0 (0.0%) |
| 3 Vehicles | 15 (100.0%) | 17 (53.1%) |
| 4 Vehicles | 0 (0.0%) | 0 (0.0%) |
| 5 or more Vehicles | 0 (0.0%) | 0 (0.0%) |
| Total | 15 (100.0%) | 32 (100.0%) |
Commute Time in Dixie
The most frequently occuring commute durations in Dixie are 20 to 24 minutes (30 commuters, 63.8%), 40 to 44 minutes (17 commuters, 36.2%), and less than 5 minutes (0 commuters, 0.0%).
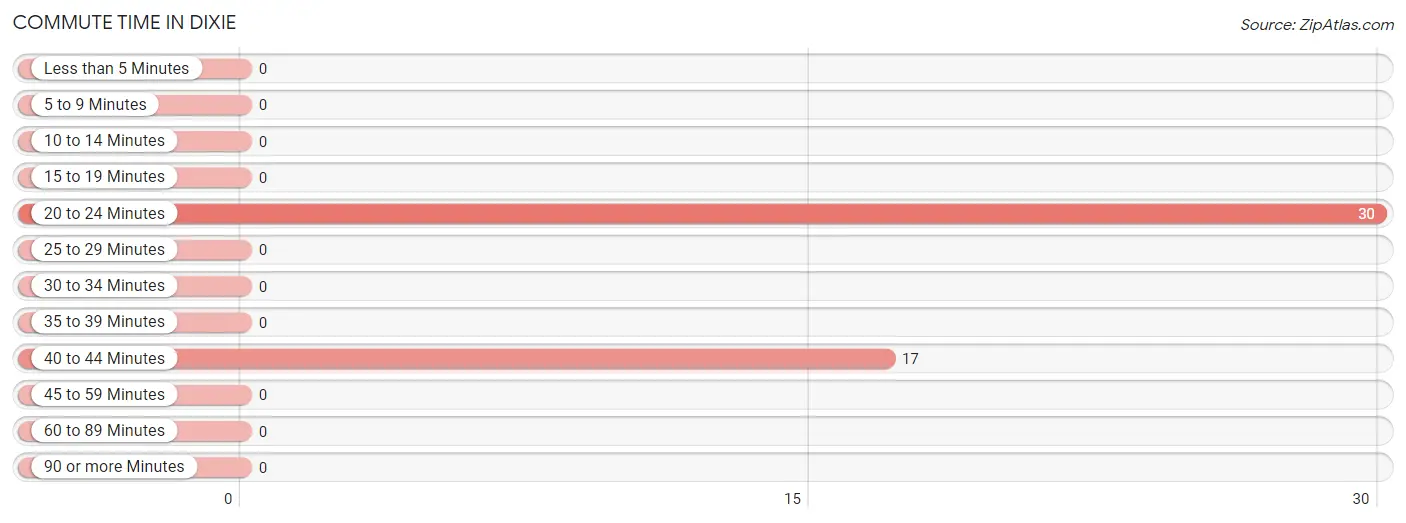
| Commute Time | # Commuters | % Commuters |
| Less than 5 Minutes | 0 | 0.0% |
| 5 to 9 Minutes | 0 | 0.0% |
| 10 to 14 Minutes | 0 | 0.0% |
| 15 to 19 Minutes | 0 | 0.0% |
| 20 to 24 Minutes | 30 | 63.8% |
| 25 to 29 Minutes | 0 | 0.0% |
| 30 to 34 Minutes | 0 | 0.0% |
| 35 to 39 Minutes | 0 | 0.0% |
| 40 to 44 Minutes | 17 | 36.2% |
| 45 to 59 Minutes | 0 | 0.0% |
| 60 to 89 Minutes | 0 | 0.0% |
| 90 or more Minutes | 0 | 0.0% |
Commute Time by Sex in Dixie
The most common commute times in Dixie are 20 to 24 minutes (15 commuters, 100.0%) for males and 40 to 44 minutes (17 commuters, 53.1%) for females.
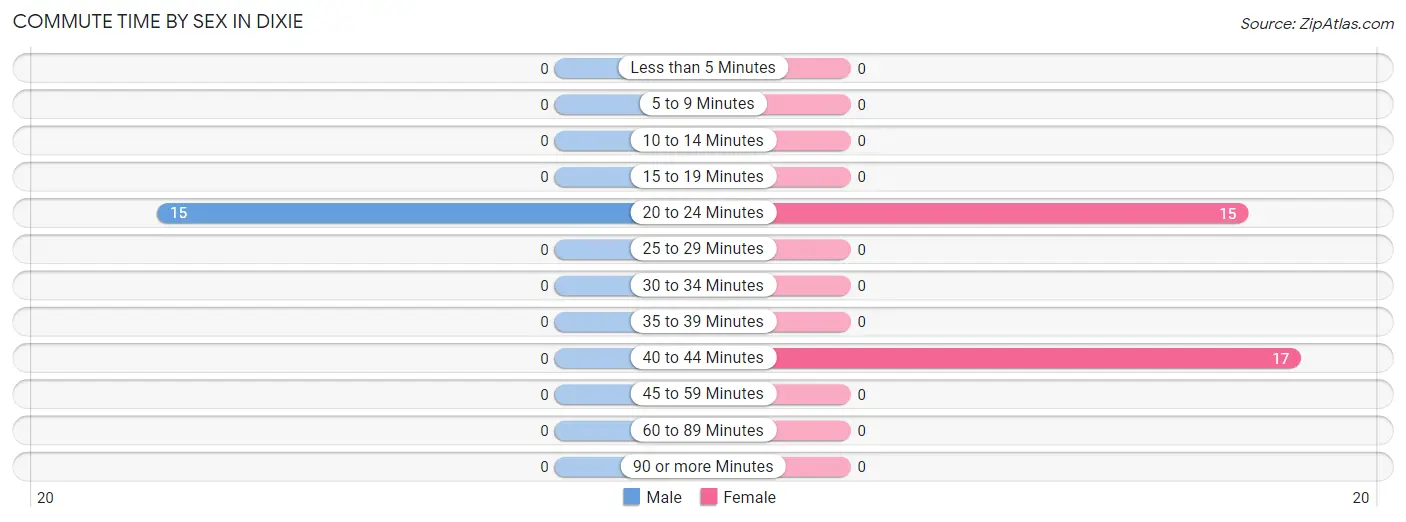
| Commute Time | Male | Female |
| Less than 5 Minutes | 0 (0.0%) | 0 (0.0%) |
| 5 to 9 Minutes | 0 (0.0%) | 0 (0.0%) |
| 10 to 14 Minutes | 0 (0.0%) | 0 (0.0%) |
| 15 to 19 Minutes | 0 (0.0%) | 0 (0.0%) |
| 20 to 24 Minutes | 15 (100.0%) | 15 (46.9%) |
| 25 to 29 Minutes | 0 (0.0%) | 0 (0.0%) |
| 30 to 34 Minutes | 0 (0.0%) | 0 (0.0%) |
| 35 to 39 Minutes | 0 (0.0%) | 0 (0.0%) |
| 40 to 44 Minutes | 0 (0.0%) | 17 (53.1%) |
| 45 to 59 Minutes | 0 (0.0%) | 0 (0.0%) |
| 60 to 89 Minutes | 0 (0.0%) | 0 (0.0%) |
| 90 or more Minutes | 0 (0.0%) | 0 (0.0%) |
Time of Departure to Work by Sex in Dixie
The most frequent times of departure to work in Dixie are 9:00 AM to 9:59 AM (15, 100.0%) for males and 8:00 AM to 8:29 AM (17, 53.1%) for females.
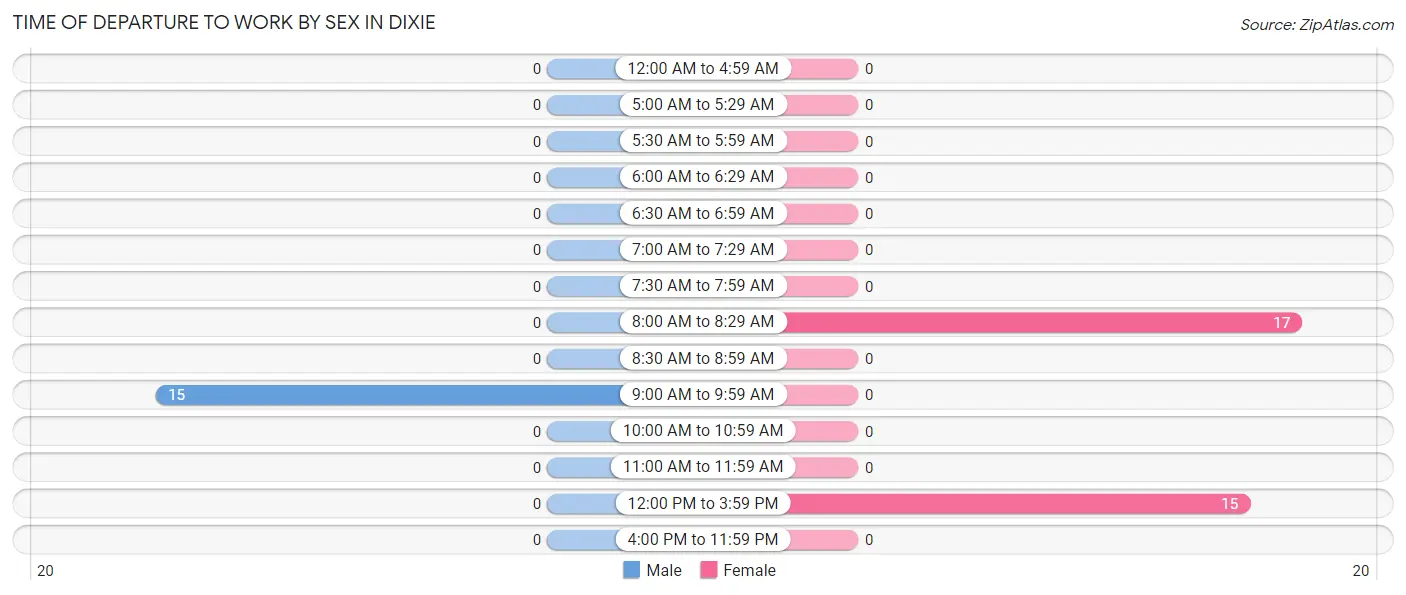
| Time of Departure | Male | Female |
| 12:00 AM to 4:59 AM | 0 (0.0%) | 0 (0.0%) |
| 5:00 AM to 5:29 AM | 0 (0.0%) | 0 (0.0%) |
| 5:30 AM to 5:59 AM | 0 (0.0%) | 0 (0.0%) |
| 6:00 AM to 6:29 AM | 0 (0.0%) | 0 (0.0%) |
| 6:30 AM to 6:59 AM | 0 (0.0%) | 0 (0.0%) |
| 7:00 AM to 7:29 AM | 0 (0.0%) | 0 (0.0%) |
| 7:30 AM to 7:59 AM | 0 (0.0%) | 0 (0.0%) |
| 8:00 AM to 8:29 AM | 0 (0.0%) | 17 (53.1%) |
| 8:30 AM to 8:59 AM | 0 (0.0%) | 0 (0.0%) |
| 9:00 AM to 9:59 AM | 15 (100.0%) | 0 (0.0%) |
| 10:00 AM to 10:59 AM | 0 (0.0%) | 0 (0.0%) |
| 11:00 AM to 11:59 AM | 0 (0.0%) | 0 (0.0%) |
| 12:00 PM to 3:59 PM | 0 (0.0%) | 15 (46.9%) |
| 4:00 PM to 11:59 PM | 0 (0.0%) | 0 (0.0%) |
| Total | 15 (100.0%) | 32 (100.0%) |
Housing Occupancy in Dixie
Occupancy by Ownership in Dixie
Of the total 48 dwellings in Dixie, owner-occupied units account for 48 (100.0%), while renter-occupied units make up 0 (0.0%).
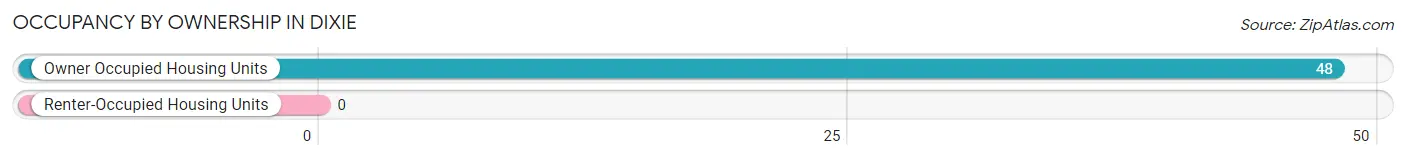
| Occupancy | # Housing Units | % Housing Units |
| Owner Occupied Housing Units | 48 | 100.0% |
| Renter-Occupied Housing Units | 0 | 0.0% |
| Total Occupied Housing Units | 48 | 100.0% |
Occupancy by Household Size in Dixie
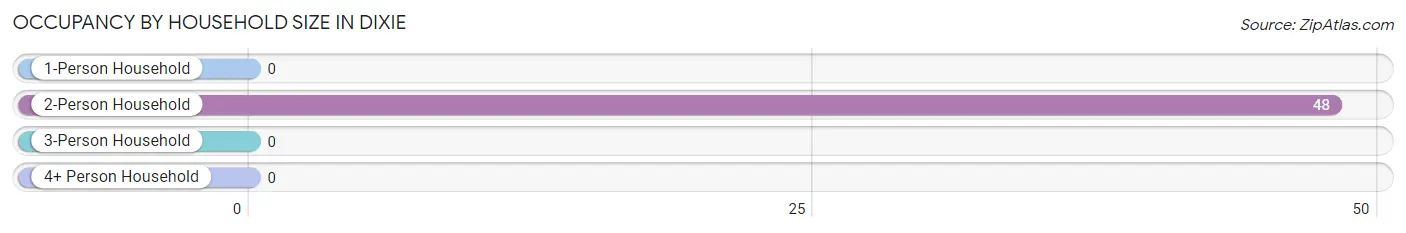
| Household Size | # Housing Units | % Housing Units |
| 1-Person Household | 0 | 0.0% |
| 2-Person Household | 48 | 100.0% |
| 3-Person Household | 0 | 0.0% |
| 4+ Person Household | 0 | 0.0% |
| Total Housing Units | 48 | 100.0% |
Occupancy by Ownership by Household Size in Dixie
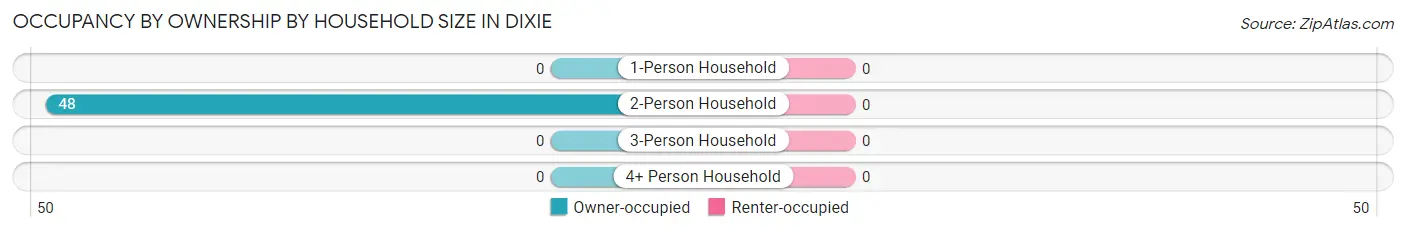
| Household Size | Owner-occupied | Renter-occupied |
| 1-Person Household | 0 (0.0%) | 0 (0.0%) |
| 2-Person Household | 48 (100.0%) | 0 (0.0%) |
| 3-Person Household | 0 (0.0%) | 0 (0.0%) |
| 4+ Person Household | 0 (0.0%) | 0 (0.0%) |
| Total Housing Units | 48 (100.0%) | 0 (0.0%) |
Occupancy by Educational Attainment in Dixie
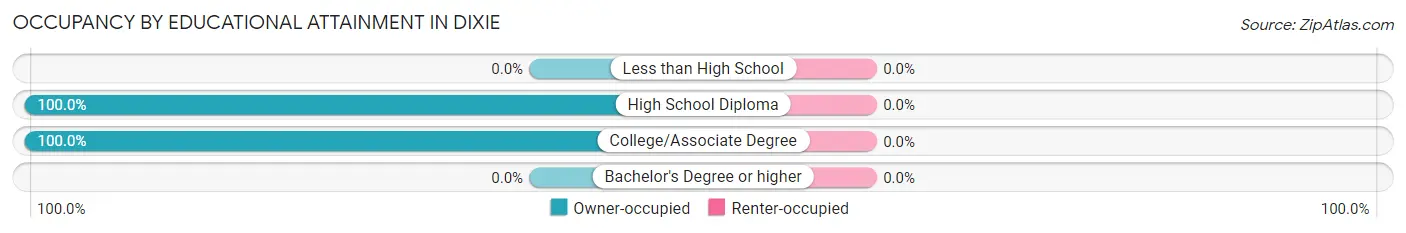
| Household Size | Owner-occupied | Renter-occupied |
| Less than High School | 0 (0.0%) | 0 (0.0%) |
| High School Diploma | 18 (100.0%) | 0 (0.0%) |
| College/Associate Degree | 30 (100.0%) | 0 (0.0%) |
| Bachelor's Degree or higher | 0 (0.0%) | 0 (0.0%) |
Occupancy by Age of Householder in Dixie
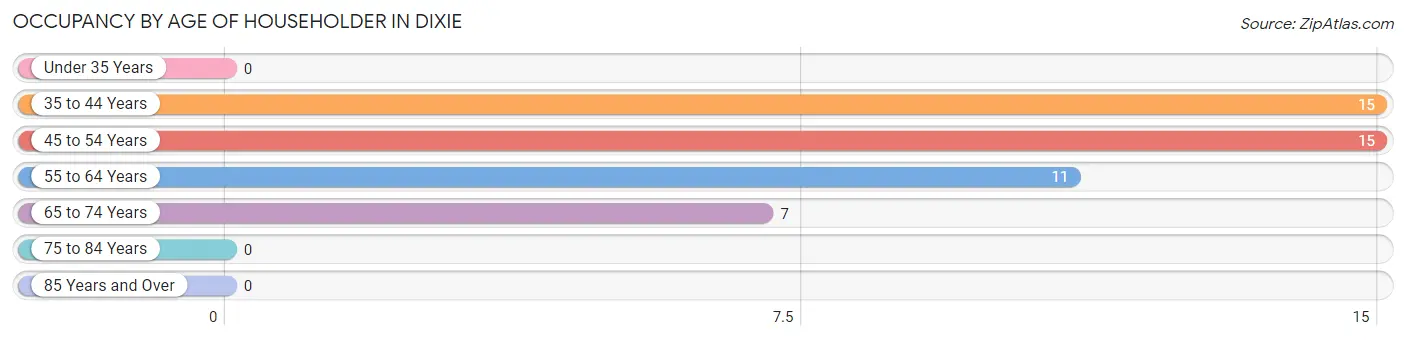
| Age Bracket | # Households | % Households |
| Under 35 Years | 0 | 0.0% |
| 35 to 44 Years | 15 | 31.2% |
| 45 to 54 Years | 15 | 31.2% |
| 55 to 64 Years | 11 | 22.9% |
| 65 to 74 Years | 7 | 14.6% |
| 75 to 84 Years | 0 | 0.0% |
| 85 Years and Over | 0 | 0.0% |
| Total | 48 | 100.0% |
Housing Finances in Dixie
Median Income by Occupancy in Dixie
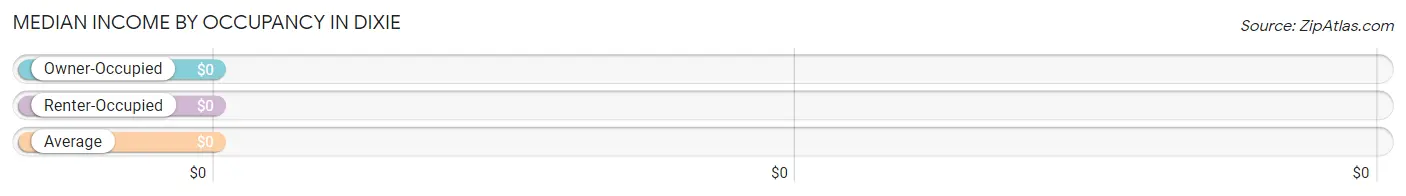
| Occupancy Type | # Households | Median Income |
| Owner-Occupied | 48 (100.0%) | $0 |
| Renter-Occupied | 0 (0.0%) | $0 |
| Average | 48 (100.0%) | $0 |
Occupancy by Householder Income Bracket in Dixie
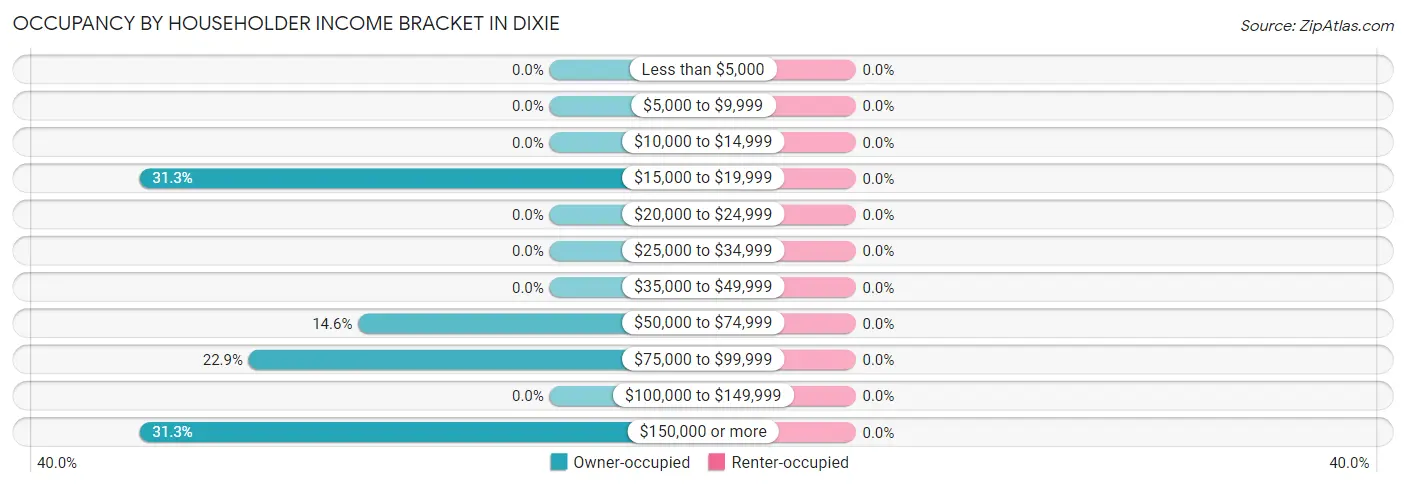
| Income Bracket | Owner-occupied | Renter-occupied |
| Less than $5,000 | 0 (0.0%) | 0 (0.0%) |
| $5,000 to $9,999 | 0 (0.0%) | 0 (0.0%) |
| $10,000 to $14,999 | 0 (0.0%) | 0 (0.0%) |
| $15,000 to $19,999 | 15 (31.2%) | 0 (0.0%) |
| $20,000 to $24,999 | 0 (0.0%) | 0 (0.0%) |
| $25,000 to $34,999 | 0 (0.0%) | 0 (0.0%) |
| $35,000 to $49,999 | 0 (0.0%) | 0 (0.0%) |
| $50,000 to $74,999 | 7 (14.6%) | 0 (0.0%) |
| $75,000 to $99,999 | 11 (22.9%) | 0 (0.0%) |
| $100,000 to $149,999 | 0 (0.0%) | 0 (0.0%) |
| $150,000 or more | 15 (31.2%) | 0 (0.0%) |
| Total | 48 (100.0%) | 0 (0.0%) |
Monthly Housing Cost Tiers in Dixie
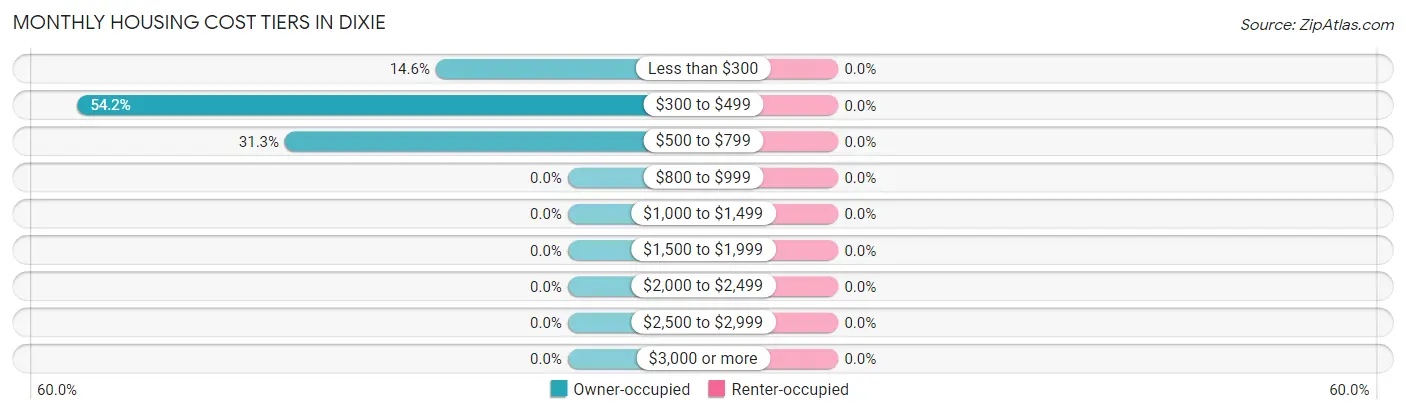
| Monthly Cost | Owner-occupied | Renter-occupied |
| Less than $300 | 7 (14.6%) | 0 (0.0%) |
| $300 to $499 | 26 (54.2%) | 0 (0.0%) |
| $500 to $799 | 15 (31.2%) | 0 (0.0%) |
| $800 to $999 | 0 (0.0%) | 0 (0.0%) |
| $1,000 to $1,499 | 0 (0.0%) | 0 (0.0%) |
| $1,500 to $1,999 | 0 (0.0%) | 0 (0.0%) |
| $2,000 to $2,499 | 0 (0.0%) | 0 (0.0%) |
| $2,500 to $2,999 | 0 (0.0%) | 0 (0.0%) |
| $3,000 or more | 0 (0.0%) | 0 (0.0%) |
| Total | 48 (100.0%) | 0 (0.0%) |
Physical Housing Characteristics in Dixie
Housing Structures in Dixie
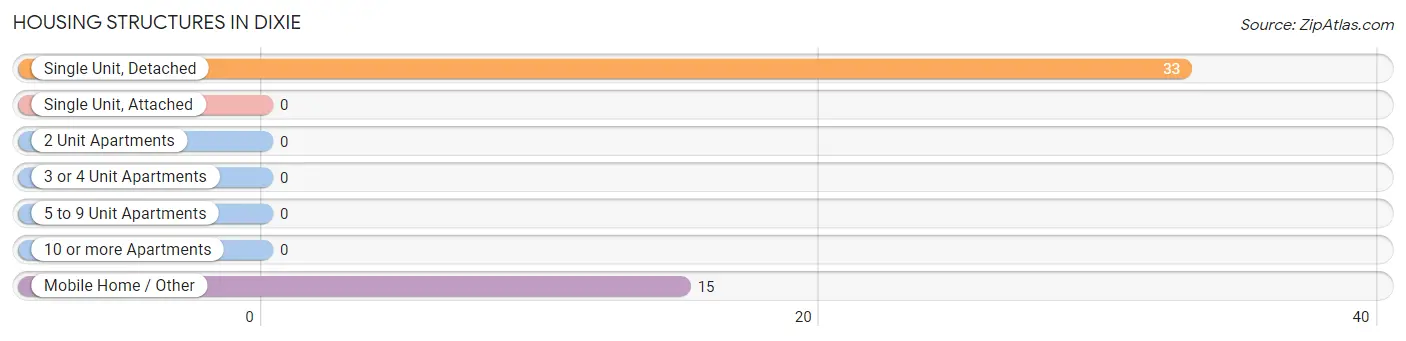
| Structure Type | # Housing Units | % Housing Units |
| Single Unit, Detached | 33 | 68.8% |
| Single Unit, Attached | 0 | 0.0% |
| 2 Unit Apartments | 0 | 0.0% |
| 3 or 4 Unit Apartments | 0 | 0.0% |
| 5 to 9 Unit Apartments | 0 | 0.0% |
| 10 or more Apartments | 0 | 0.0% |
| Mobile Home / Other | 15 | 31.2% |
| Total | 48 | 100.0% |
Housing Structures by Occupancy in Dixie
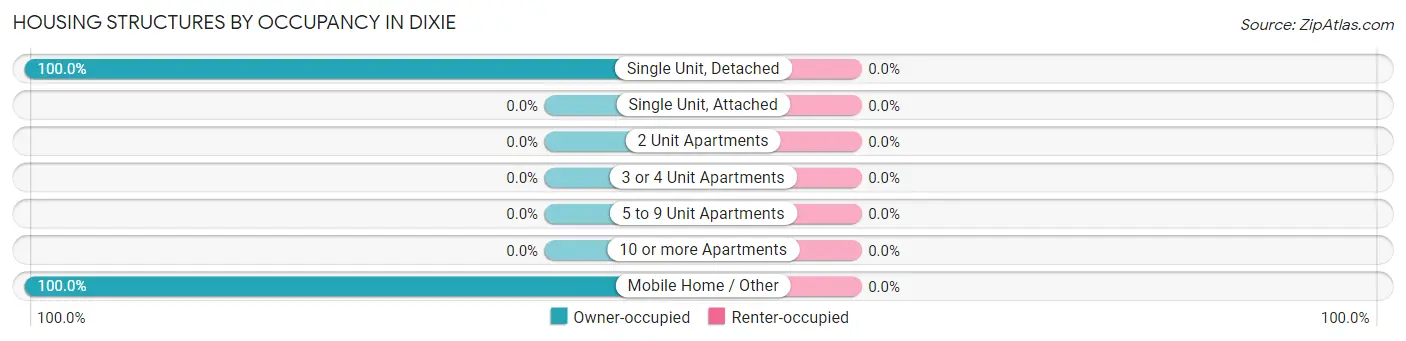
| Structure Type | Owner-occupied | Renter-occupied |
| Single Unit, Detached | 33 (100.0%) | 0 (0.0%) |
| Single Unit, Attached | 0 (0.0%) | 0 (0.0%) |
| 2 Unit Apartments | 0 (0.0%) | 0 (0.0%) |
| 3 or 4 Unit Apartments | 0 (0.0%) | 0 (0.0%) |
| 5 to 9 Unit Apartments | 0 (0.0%) | 0 (0.0%) |
| 10 or more Apartments | 0 (0.0%) | 0 (0.0%) |
| Mobile Home / Other | 15 (100.0%) | 0 (0.0%) |
| Total | 48 (100.0%) | 0 (0.0%) |
Housing Structures by Number of Rooms in Dixie
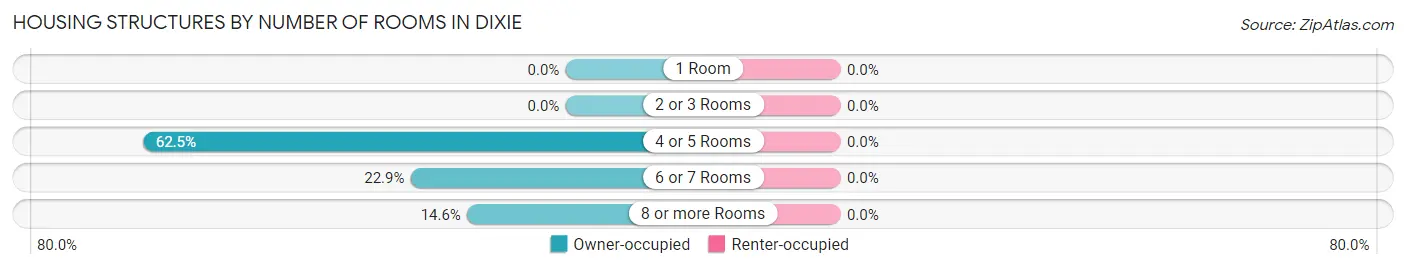
| Number of Rooms | Owner-occupied | Renter-occupied |
| 1 Room | 0 (0.0%) | 0 (0.0%) |
| 2 or 3 Rooms | 0 (0.0%) | 0 (0.0%) |
| 4 or 5 Rooms | 30 (62.5%) | 0 (0.0%) |
| 6 or 7 Rooms | 11 (22.9%) | 0 (0.0%) |
| 8 or more Rooms | 7 (14.6%) | 0 (0.0%) |
| Total | 48 (100.0%) | 0 (0.0%) |
Housing Structure by Heating Type in Dixie
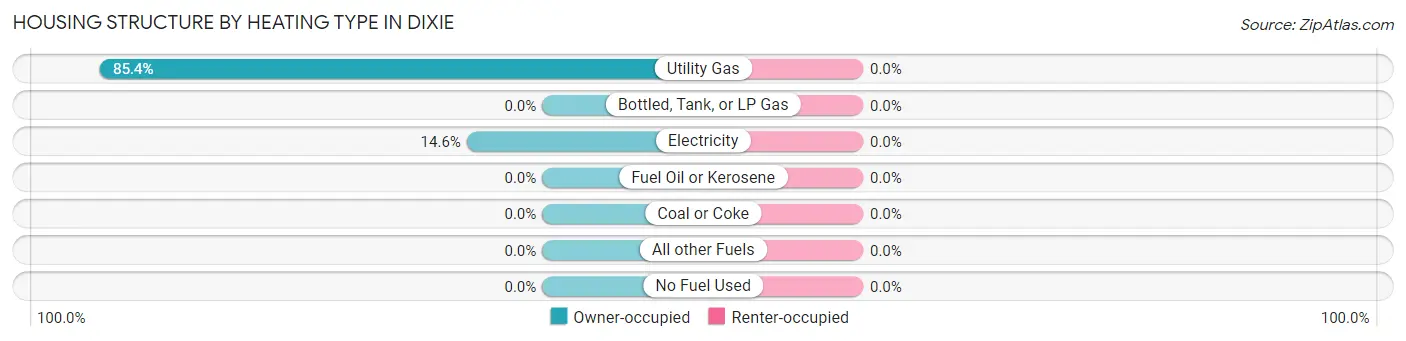
| Heating Type | Owner-occupied | Renter-occupied |
| Utility Gas | 41 (85.4%) | 0 (0.0%) |
| Bottled, Tank, or LP Gas | 0 (0.0%) | 0 (0.0%) |
| Electricity | 7 (14.6%) | 0 (0.0%) |
| Fuel Oil or Kerosene | 0 (0.0%) | 0 (0.0%) |
| Coal or Coke | 0 (0.0%) | 0 (0.0%) |
| All other Fuels | 0 (0.0%) | 0 (0.0%) |
| No Fuel Used | 0 (0.0%) | 0 (0.0%) |
| Total | 48 (100.0%) | 0 (0.0%) |
Household Vehicle Usage in Dixie
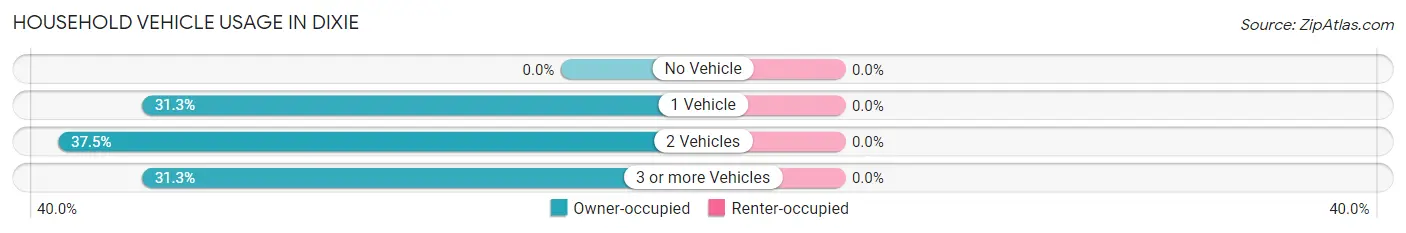
| Vehicles per Household | Owner-occupied | Renter-occupied |
| No Vehicle | 0 (0.0%) | 0 (0.0%) |
| 1 Vehicle | 15 (31.2%) | 0 (0.0%) |
| 2 Vehicles | 18 (37.5%) | 0 (0.0%) |
| 3 or more Vehicles | 15 (31.2%) | 0 (0.0%) |
| Total | 48 (100.0%) | 0 (0.0%) |
Real Estate & Mortgages in Dixie
Real Estate and Mortgage Overview in Dixie
| Characteristic | Without Mortgage | With Mortgage |
| Housing Units | 33 | 15 |
| Median Property Value | - | - |
| Median Household Income | - | - |
| Monthly Housing Costs | $332 | $0 |
| Real Estate Taxes | - | - |
Property Value by Mortgage Status in Dixie
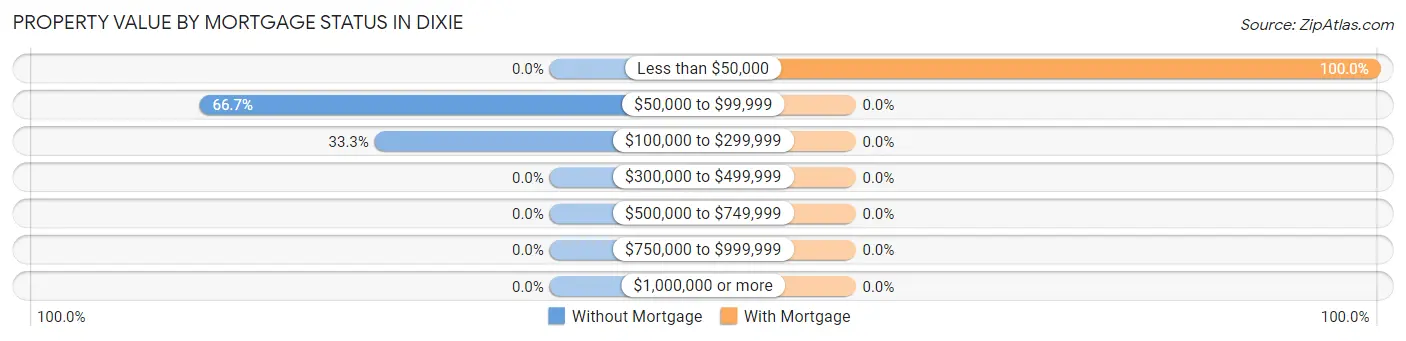
| Property Value | Without Mortgage | With Mortgage |
| Less than $50,000 | 0 (0.0%) | 15 (100.0%) |
| $50,000 to $99,999 | 22 (66.7%) | 0 (0.0%) |
| $100,000 to $299,999 | 11 (33.3%) | 0 (0.0%) |
| $300,000 to $499,999 | 0 (0.0%) | 0 (0.0%) |
| $500,000 to $749,999 | 0 (0.0%) | 0 (0.0%) |
| $750,000 to $999,999 | 0 (0.0%) | 0 (0.0%) |
| $1,000,000 or more | 0 (0.0%) | 0 (0.0%) |
| Total | 33 (100.0%) | 15 (100.0%) |
Household Income by Mortgage Status in Dixie
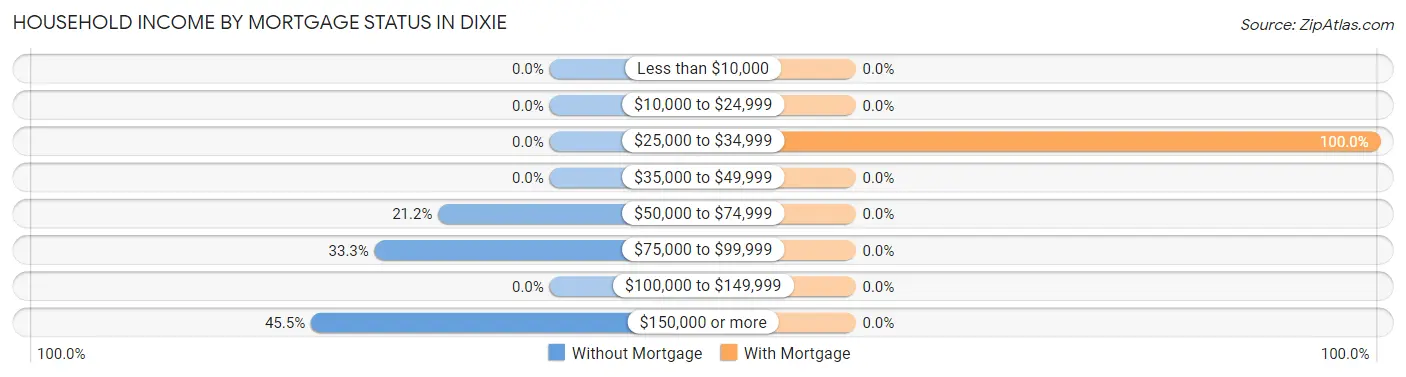
| Household Income | Without Mortgage | With Mortgage |
| Less than $10,000 | 0 (0.0%) | 0 (0.0%) |
| $10,000 to $24,999 | 0 (0.0%) | 0 (0.0%) |
| $25,000 to $34,999 | 0 (0.0%) | 15 (100.0%) |
| $35,000 to $49,999 | 0 (0.0%) | 0 (0.0%) |
| $50,000 to $74,999 | 7 (21.2%) | 0 (0.0%) |
| $75,000 to $99,999 | 11 (33.3%) | 0 (0.0%) |
| $100,000 to $149,999 | 0 (0.0%) | 0 (0.0%) |
| $150,000 or more | 15 (45.5%) | 0 (0.0%) |
| Total | 33 (100.0%) | 15 (100.0%) |
Property Value to Household Income Ratio in Dixie
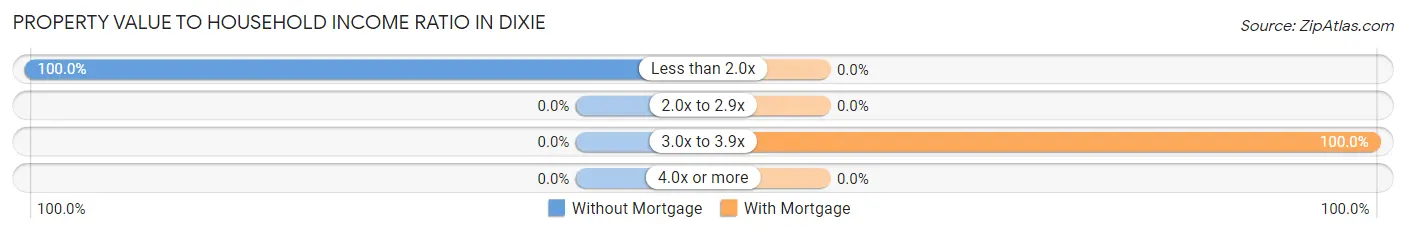
| Value-to-Income Ratio | Without Mortgage | With Mortgage |
| Less than 2.0x | 33 (100.0%) | 0 (0.0%) |
| 2.0x to 2.9x | 0 (0.0%) | 0 (0.0%) |
| 3.0x to 3.9x | 0 (0.0%) | 15 (100.0%) |
| 4.0x or more | 0 (0.0%) | 0 (0.0%) |
| Total | 33 (100.0%) | 15 (100.0%) |
Real Estate Taxes by Mortgage Status in Dixie
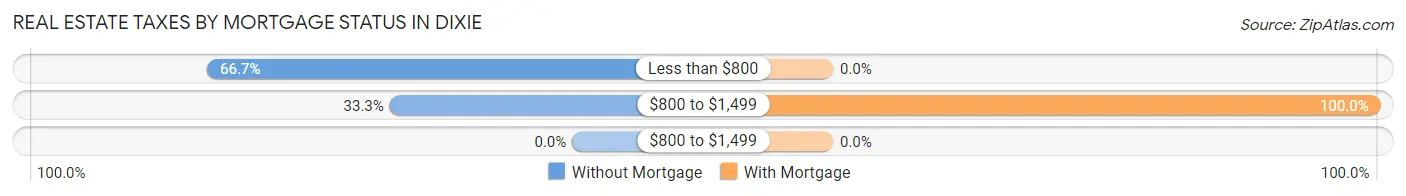
| Property Taxes | Without Mortgage | With Mortgage |
| Less than $800 | 22 (66.7%) | 0 (0.0%) |
| $800 to $1,499 | 11 (33.3%) | 15 (100.0%) |
| $800 to $1,499 | 0 (0.0%) | 0 (0.0%) |
| Total | 33 (100.0%) | 15 (100.0%) |
Health & Disability in Dixie
Health Insurance Coverage by Age in Dixie
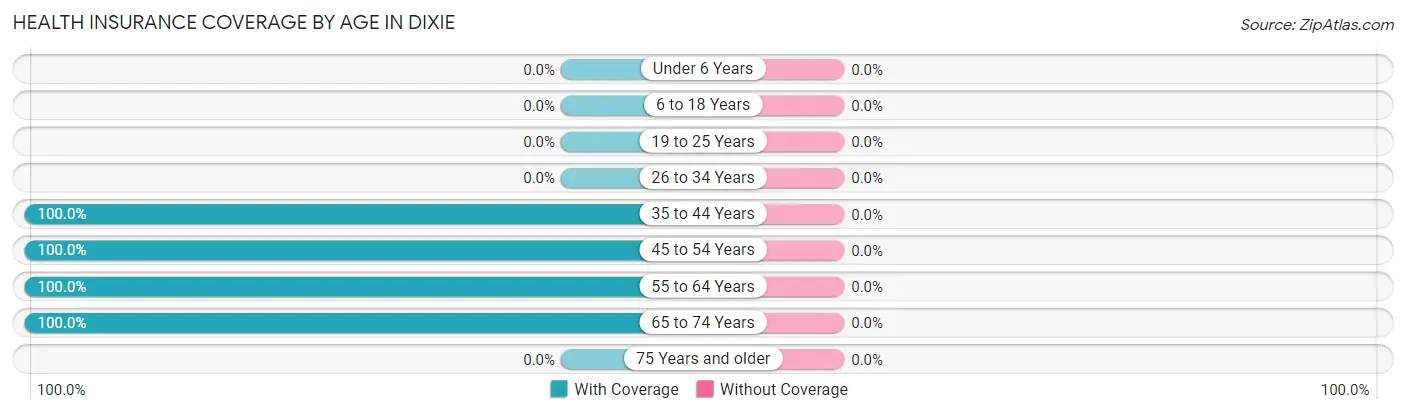
| Age Bracket | With Coverage | Without Coverage |
| Under 6 Years | 0 (0.0%) | 0 (0.0%) |
| 6 to 18 Years | 0 (0.0%) | 0 (0.0%) |
| 19 to 25 Years | 0 (0.0%) | 0 (0.0%) |
| 26 to 34 Years | 0 (0.0%) | 0 (0.0%) |
| 35 to 44 Years | 32 (100.0%) | 0 (0.0%) |
| 45 to 54 Years | 32 (100.0%) | 0 (0.0%) |
| 55 to 64 Years | 21 (100.0%) | 0 (0.0%) |
| 65 to 74 Years | 13 (100.0%) | 0 (0.0%) |
| 75 Years and older | 0 (0.0%) | 0 (0.0%) |
| Total | 98 (100.0%) | 0 (0.0%) |
Health Insurance Coverage by Citizenship Status in Dixie
| Citizenship Status | With Coverage | Without Coverage |
| Native Born | 0 (0.0%) | 0 (0.0%) |
| Foreign Born, Citizen | 0 (0.0%) | 0 (0.0%) |
| Foreign Born, not a Citizen | 0 (0.0%) | 0 (0.0%) |
Health Insurance Coverage by Household Income in Dixie
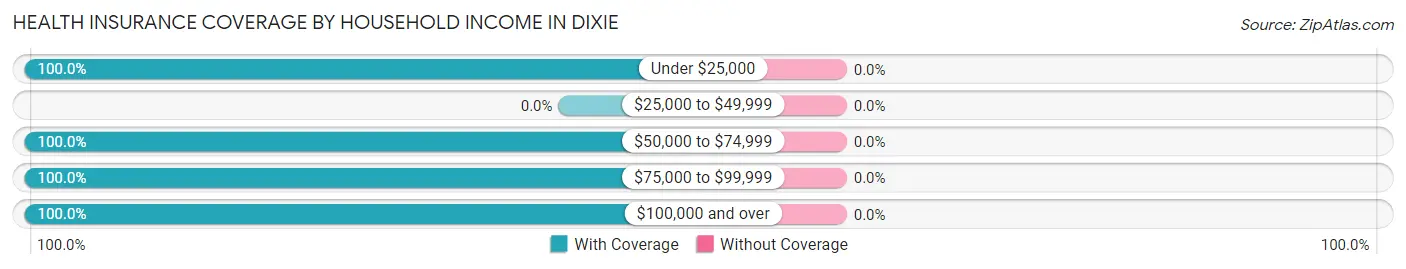
| Household Income | With Coverage | Without Coverage |
| Under $25,000 | 32 (100.0%) | 0 (0.0%) |
| $25,000 to $49,999 | 0 (0.0%) | 0 (0.0%) |
| $50,000 to $74,999 | 13 (100.0%) | 0 (0.0%) |
| $75,000 to $99,999 | 21 (100.0%) | 0 (0.0%) |
| $100,000 and over | 32 (100.0%) | 0 (0.0%) |
Public vs Private Health Insurance Coverage by Age in Dixie
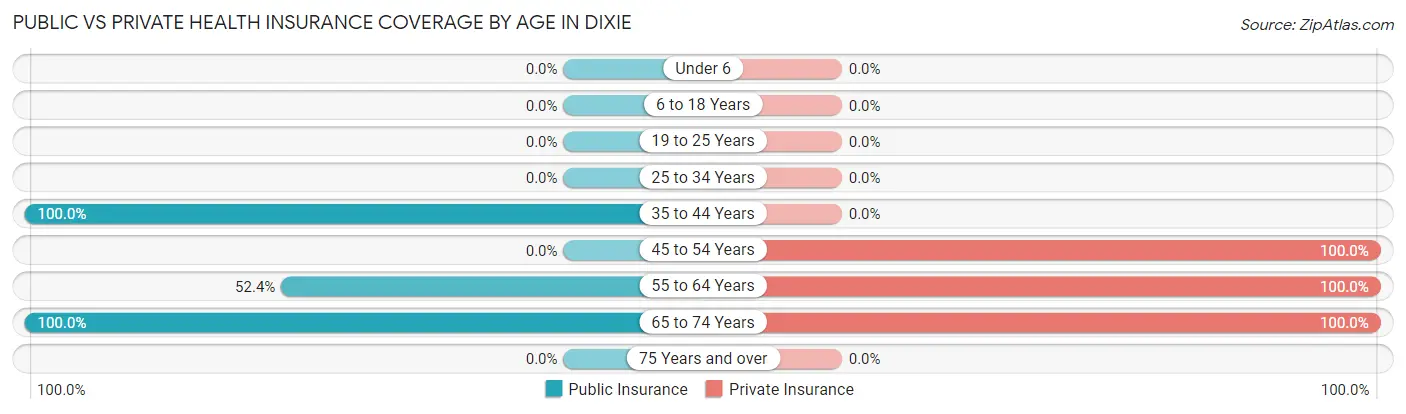
| Age Bracket | Public Insurance | Private Insurance |
| Under 6 | 0 (0.0%) | 0 (0.0%) |
| 6 to 18 Years | 0 (0.0%) | 0 (0.0%) |
| 19 to 25 Years | 0 (0.0%) | 0 (0.0%) |
| 25 to 34 Years | 0 (0.0%) | 0 (0.0%) |
| 35 to 44 Years | 32 (100.0%) | 0 (0.0%) |
| 45 to 54 Years | 0 (0.0%) | 32 (100.0%) |
| 55 to 64 Years | 11 (52.4%) | 21 (100.0%) |
| 65 to 74 Years | 13 (100.0%) | 13 (100.0%) |
| 75 Years and over | 0 (0.0%) | 0 (0.0%) |
| Total | 56 (57.1%) | 66 (67.3%) |
Disability Status by Sex by Age in Dixie
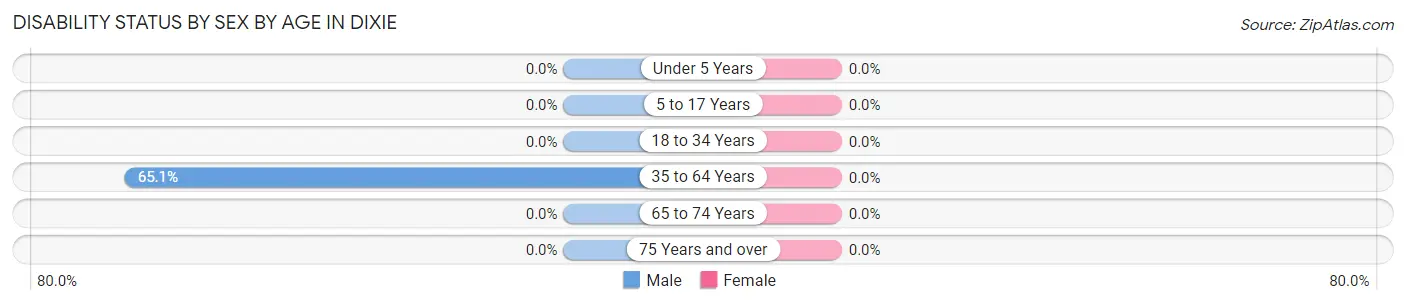
| Age Bracket | Male | Female |
| Under 5 Years | 0 (0.0%) | 0 (0.0%) |
| 5 to 17 Years | 0 (0.0%) | 0 (0.0%) |
| 18 to 34 Years | 0 (0.0%) | 0 (0.0%) |
| 35 to 64 Years | 28 (65.1%) | 0 (0.0%) |
| 65 to 74 Years | 0 (0.0%) | 0 (0.0%) |
| 75 Years and over | 0 (0.0%) | 0 (0.0%) |
Disability Class by Sex by Age in Dixie
Disability Class: Hearing Difficulty
| Age Bracket | Male | Female |
| Under 5 Years | 0 (0.0%) | 0 (0.0%) |
| 5 to 17 Years | 0 (0.0%) | 0 (0.0%) |
| 18 to 34 Years | 0 (0.0%) | 0 (0.0%) |
| 35 to 64 Years | 0 (0.0%) | 0 (0.0%) |
| 65 to 74 Years | 0 (0.0%) | 0 (0.0%) |
| 75 Years and over | 0 (0.0%) | 0 (0.0%) |
Disability Class: Vision Difficulty
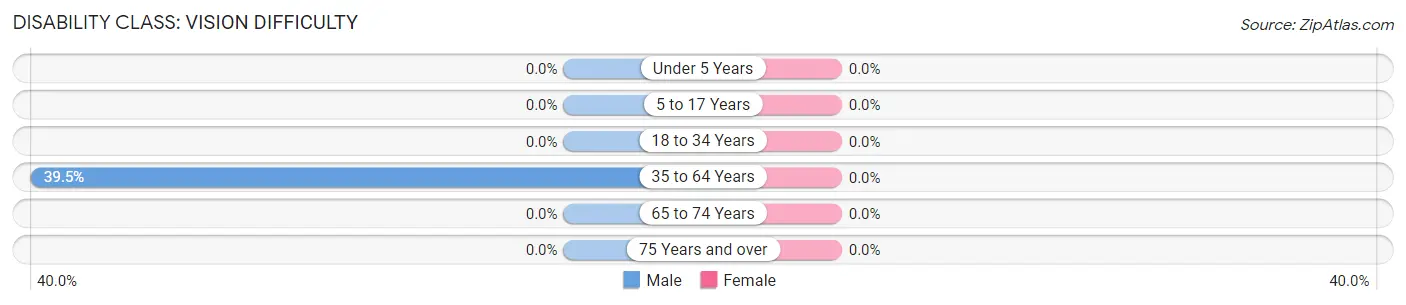
| Age Bracket | Male | Female |
| Under 5 Years | 0 (0.0%) | 0 (0.0%) |
| 5 to 17 Years | 0 (0.0%) | 0 (0.0%) |
| 18 to 34 Years | 0 (0.0%) | 0 (0.0%) |
| 35 to 64 Years | 17 (39.5%) | 0 (0.0%) |
| 65 to 74 Years | 0 (0.0%) | 0 (0.0%) |
| 75 Years and over | 0 (0.0%) | 0 (0.0%) |
Disability Class: Cognitive Difficulty
| Age Bracket | Male | Female |
| 5 to 17 Years | 0 (0.0%) | 0 (0.0%) |
| 18 to 34 Years | 0 (0.0%) | 0 (0.0%) |
| 35 to 64 Years | 0 (0.0%) | 0 (0.0%) |
| 65 to 74 Years | 0 (0.0%) | 0 (0.0%) |
| 75 Years and over | 0 (0.0%) | 0 (0.0%) |
Disability Class: Ambulatory Difficulty
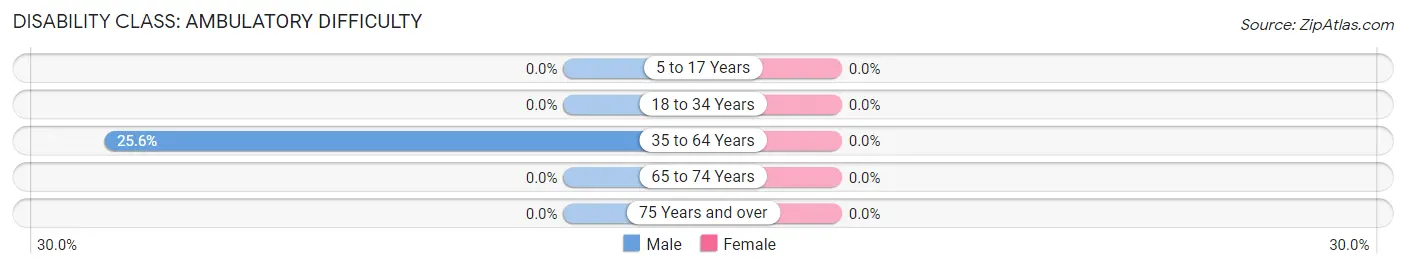
| Age Bracket | Male | Female |
| 5 to 17 Years | 0 (0.0%) | 0 (0.0%) |
| 18 to 34 Years | 0 (0.0%) | 0 (0.0%) |
| 35 to 64 Years | 11 (25.6%) | 0 (0.0%) |
| 65 to 74 Years | 0 (0.0%) | 0 (0.0%) |
| 75 Years and over | 0 (0.0%) | 0 (0.0%) |
Disability Class: Self-Care Difficulty
| Age Bracket | Male | Female |
| 5 to 17 Years | 0 (0.0%) | 0 (0.0%) |
| 18 to 34 Years | 0 (0.0%) | 0 (0.0%) |
| 35 to 64 Years | 0 (0.0%) | 0 (0.0%) |
| 65 to 74 Years | 0 (0.0%) | 0 (0.0%) |
| 75 Years and over | 0 (0.0%) | 0 (0.0%) |
Technology Access in Dixie
Computing Device Access in Dixie
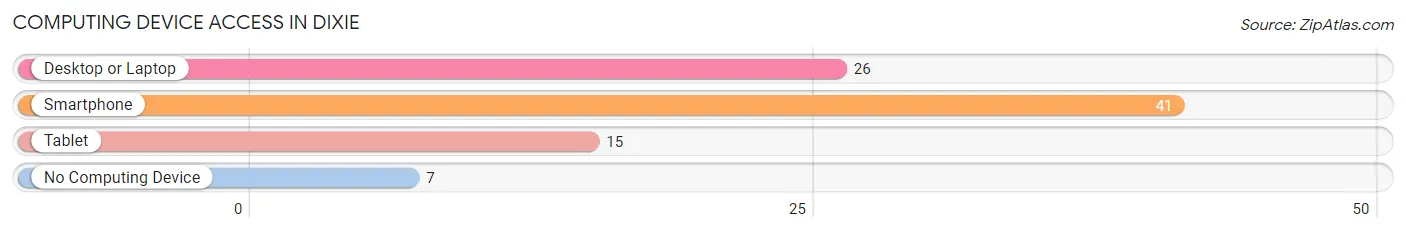
| Device Type | # Households | % Households |
| Desktop or Laptop | 26 | 54.2% |
| Smartphone | 41 | 85.4% |
| Tablet | 15 | 31.2% |
| No Computing Device | 7 | 14.6% |
| Total | 48 | 100.0% |
Internet Access in Dixie
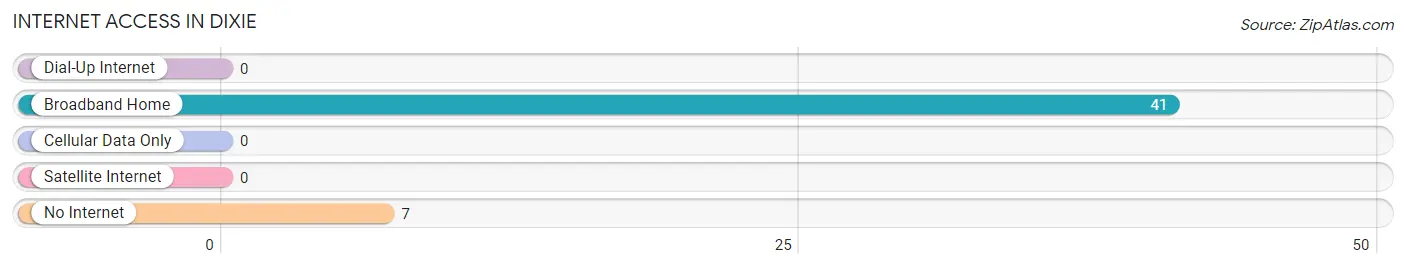
| Internet Type | # Households | % Households |
| Dial-Up Internet | 0 | 0.0% |
| Broadband Home | 41 | 85.4% |
| Cellular Data Only | 0 | 0.0% |
| Satellite Internet | 0 | 0.0% |
| No Internet | 7 | 14.6% |
| Total | 48 | 100.0% |
Dixie Summary
Dixie, West Virginia is a small unincorporated community located in the northern part of the state in Preston County. It is situated in the Appalachian Mountains and is surrounded by the Monongahela National Forest. The community is located along the Cheat River and is home to a population of approximately 200 people.
History
The area that is now Dixie was first settled in the late 1700s by a group of German immigrants. The community was originally known as “Dixieland” and was named after the German word for “ten”, as the area was the tenth settlement in the county. The community was officially established in 1845 and was incorporated in 1887.
In the late 1800s, the area was a popular destination for tourists, as it was home to several resorts and hotels. The area was also known for its coal mining industry, which provided employment for many of the residents.
Geography
Dixie is located in the northern part of Preston County, West Virginia. It is situated in the Appalachian Mountains and is surrounded by the Monongahela National Forest. The community is located along the Cheat River and is home to a population of approximately 200 people.
The area has a humid continental climate, with hot summers and cold winters. The average annual temperature is around 50 degrees Fahrenheit, with an average high of around 75 degrees in the summer and an average low of around 25 degrees in the winter.
Economy
The economy of Dixie is largely based on tourism and agriculture. The area is home to several resorts and hotels, as well as several farms and orchards. The area is also known for its coal mining industry, which provides employment for many of the residents.
Demographics
As of the 2010 census, the population of Dixie was approximately 200 people. The racial makeup of the community was 97.5% White, 0.5% African American, 0.5% Native American, and 1.5% from other races. The median household income was $30,000, and the median family income was $35,000.
Conclusion
Dixie, West Virginia is a small unincorporated community located in the northern part of the state in Preston County. It is situated in the Appalachian Mountains and is surrounded by the Monongahela National Forest. The community is located along the Cheat River and is home to a population of approximately 200 people. The economy of Dixie is largely based on tourism and agriculture, and the area is known for its coal mining industry. The population of Dixie is predominantly White, with a small percentage of African American, Native American, and other races.
Common Questions
What is Per Capita Income in Dixie?
Per Capita income in Dixie is $40,913.
What is Inequality or Gini Index in Dixie?
Inequality or Gini Index in Dixie is 0.38.
What is the Total Population of Dixie?
Total Population of Dixie is 98.
What is the Total Male Population of Dixie?
Total Male Population of Dixie is 50.
What is the Total Female Population of Dixie?
Total Female Population of Dixie is 48.
What is the Ratio of Males per 100 Females in Dixie?
There are 104.17 Males per 100 Females in Dixie.
What is the Ratio of Females per 100 Males in Dixie?
There are 96.00 Females per 100 Males in Dixie.
What is the Median Population Age in Dixie?
Median Population Age in Dixie is 51.5 Years.
What is the Average Family Size in Dixie
Average Family Size in Dixie is 2.0 People.
What is the Average Household Size in Dixie
Average Household Size in Dixie is 2.0 People.
How Large is the Labor Force in Dixie?
There are 47 People in the Labor Forcein in Dixie.
What is the Percentage of People in the Labor Force in Dixie?
48.0% of People are in the Labor Force in Dixie.