Delbarton, WV Map & Demographics
Delbarton Map
Delbarton Overview
$20,896
PER CAPITA INCOME
$58,854
AVG FAMILY INCOME
$34,688
AVG HOUSEHOLD INCOME
0.44
INEQUALITY / GINI INDEX
537
TOTAL POPULATION
274
MALE POPULATION
263
FEMALE POPULATION
104.18
MALES / 100 FEMALES
95.99
FEMALES / 100 MALES
44.6
MEDIAN AGE
3.7
AVG FAMILY SIZE
2.9
AVG HOUSEHOLD SIZE
185
LABOR FORCE [ PEOPLE ]
41.1%
PERCENT IN LABOR FORCE
19.5%
UNEMPLOYMENT RATE
Delbarton Zip Codes
Income in Delbarton
Income Overview in Delbarton
Per Capita Income in Delbarton is $20,896, while median incomes of families and households are $58,854 and $34,688 respectively.
| Characteristic | Number | Measure |
| Per Capita Income | 537 | $20,896 |
| Median Family Income | 115 | $58,854 |
| Mean Family Income | 115 | $69,723 |
| Median Household Income | 187 | $34,688 |
| Mean Household Income | 187 | $53,583 |
| Income Deficit | 115 | $0 |
| Wage / Income Gap (%) | 537 | 0.00% |
| Wage / Income Gap ($) | 537 | 100.00¢ per $1 |
| Gini / Inequality Index | 537 | 0.44 |
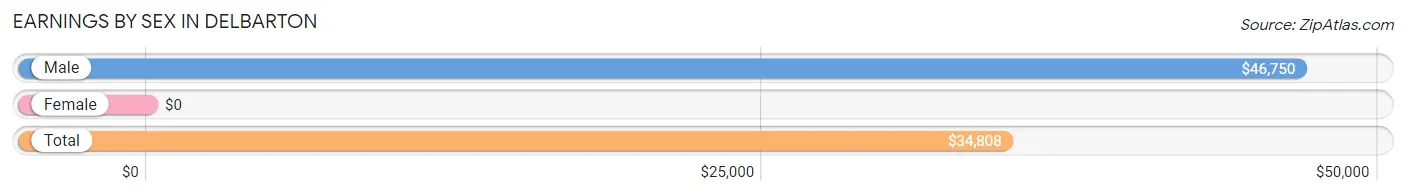
Earnings by Sex in Delbarton
| Sex | Number | Average Earnings |
| Male | 105 (62.5%) | $46,750 |
| Female | 63 (37.5%) | $0 |
| Total | 168 (100.0%) | $34,808 |
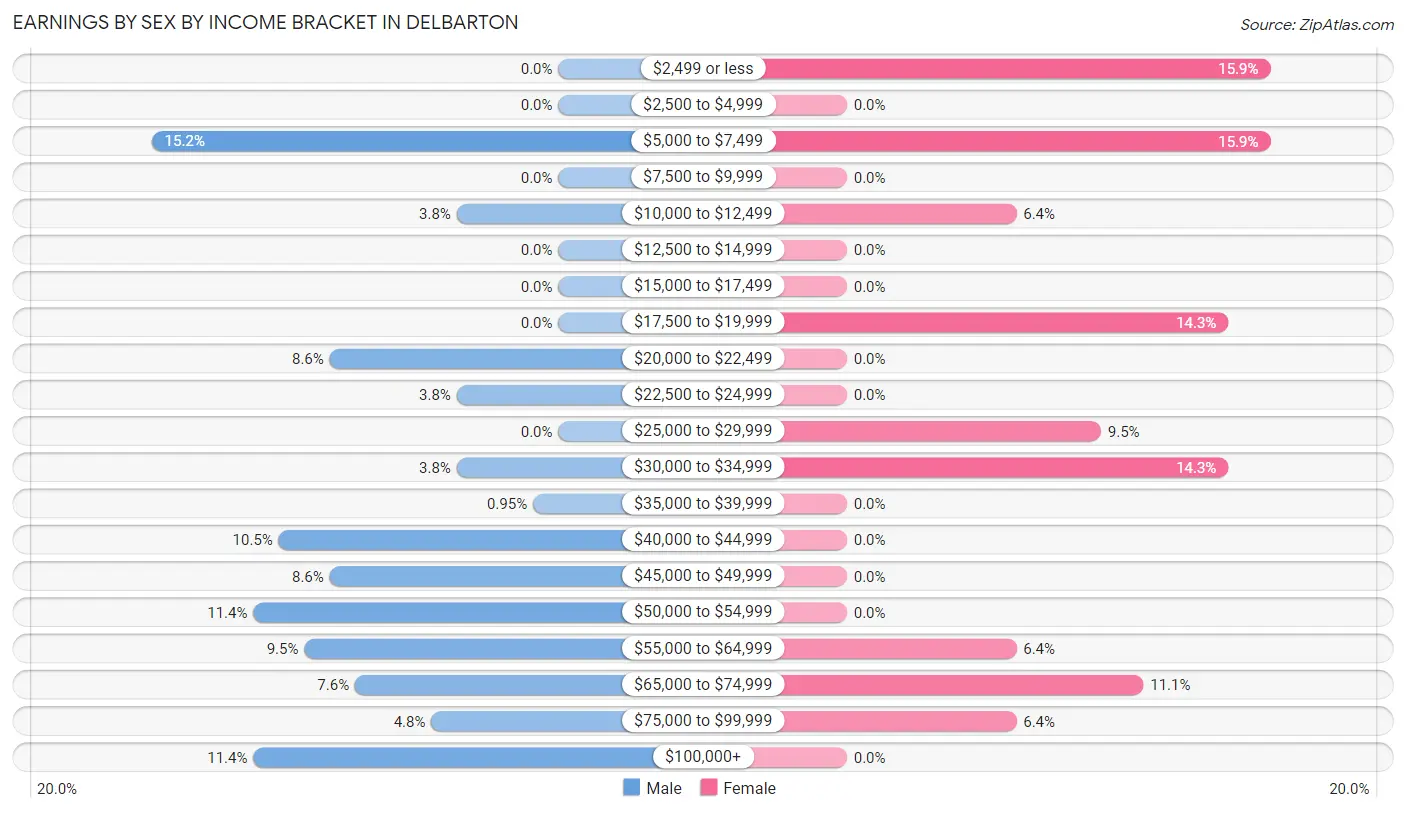
Earnings by Sex by Income Bracket in Delbarton
The most common earnings brackets in Delbarton are $5,000 to $7,499 for men (16 | 15.2%) and $2,499 or less for women (10 | 15.9%).
| Income | Male | Female |
| $2,499 or less | 0 (0.0%) | 10 (15.9%) |
| $2,500 to $4,999 | 0 (0.0%) | 0 (0.0%) |
| $5,000 to $7,499 | 16 (15.2%) | 10 (15.9%) |
| $7,500 to $9,999 | 0 (0.0%) | 0 (0.0%) |
| $10,000 to $12,499 | 4 (3.8%) | 4 (6.4%) |
| $12,500 to $14,999 | 0 (0.0%) | 0 (0.0%) |
| $15,000 to $17,499 | 0 (0.0%) | 0 (0.0%) |
| $17,500 to $19,999 | 0 (0.0%) | 9 (14.3%) |
| $20,000 to $22,499 | 9 (8.6%) | 0 (0.0%) |
| $22,500 to $24,999 | 4 (3.8%) | 0 (0.0%) |
| $25,000 to $29,999 | 0 (0.0%) | 6 (9.5%) |
| $30,000 to $34,999 | 4 (3.8%) | 9 (14.3%) |
| $35,000 to $39,999 | 1 (0.9%) | 0 (0.0%) |
| $40,000 to $44,999 | 11 (10.5%) | 0 (0.0%) |
| $45,000 to $49,999 | 9 (8.6%) | 0 (0.0%) |
| $50,000 to $54,999 | 12 (11.4%) | 0 (0.0%) |
| $55,000 to $64,999 | 10 (9.5%) | 4 (6.4%) |
| $65,000 to $74,999 | 8 (7.6%) | 7 (11.1%) |
| $75,000 to $99,999 | 5 (4.8%) | 4 (6.4%) |
| $100,000+ | 12 (11.4%) | 0 (0.0%) |
| Total | 105 (100.0%) | 63 (100.0%) |
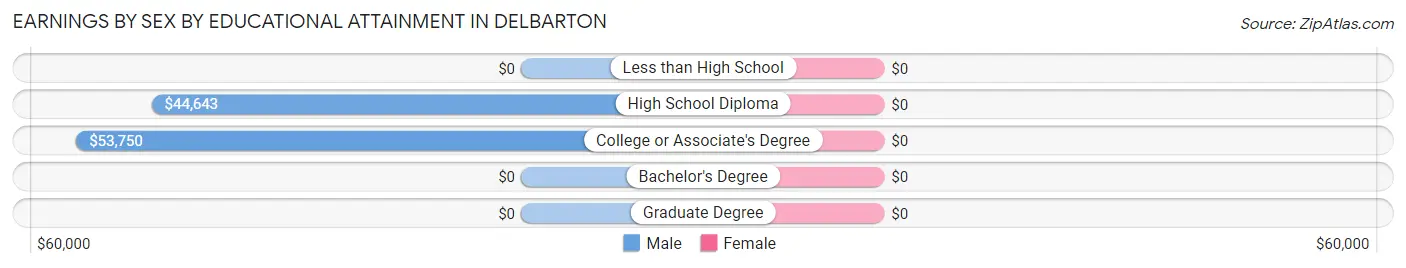
Earnings by Sex by Educational Attainment in Delbarton
| Educational Attainment | Male Income | Female Income |
| Less than High School | - | - |
| High School Diploma | $44,643 | $0 |
| College or Associate's Degree | $53,750 | $0 |
| Bachelor's Degree | - | - |
| Graduate Degree | - | - |
| Total | $48,125 | $0 |
Family Income in Delbarton
Family Income Brackets in Delbarton
According to the Delbarton family income data, there are 25 families falling into the $75,000 to $99,999 income range, which is the most common income bracket and makes up 21.7% of all families.
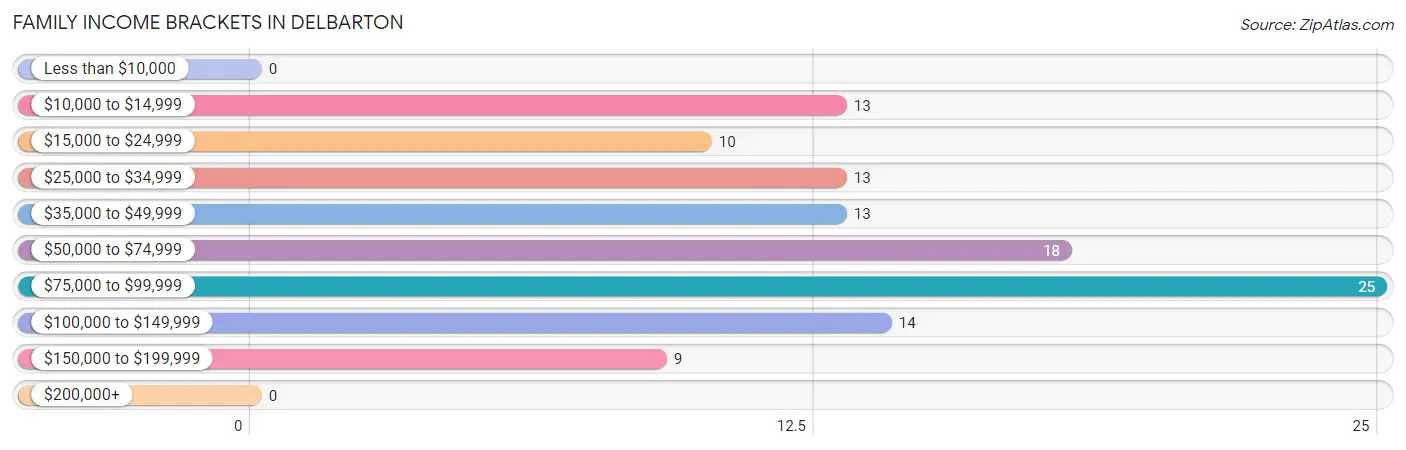
| Income Bracket | # Families | % Families |
| Less than $10,000 | 0 | 0.0% |
| $10,000 to $14,999 | 13 | 11.3% |
| $15,000 to $24,999 | 10 | 8.7% |
| $25,000 to $34,999 | 13 | 11.3% |
| $35,000 to $49,999 | 13 | 11.3% |
| $50,000 to $74,999 | 18 | 15.7% |
| $75,000 to $99,999 | 25 | 21.7% |
| $100,000 to $149,999 | 14 | 12.2% |
| $150,000 to $199,999 | 9 | 7.8% |
| $200,000+ | 0 | 0.0% |
Family Income by Famaliy Size in Delbarton
4-person families (24 | 20.9%) account for the highest median family income in Delbarton with $78,750 per family, while 2-person families (32 | 27.8%) have the highest median income of $32,188 per family member.
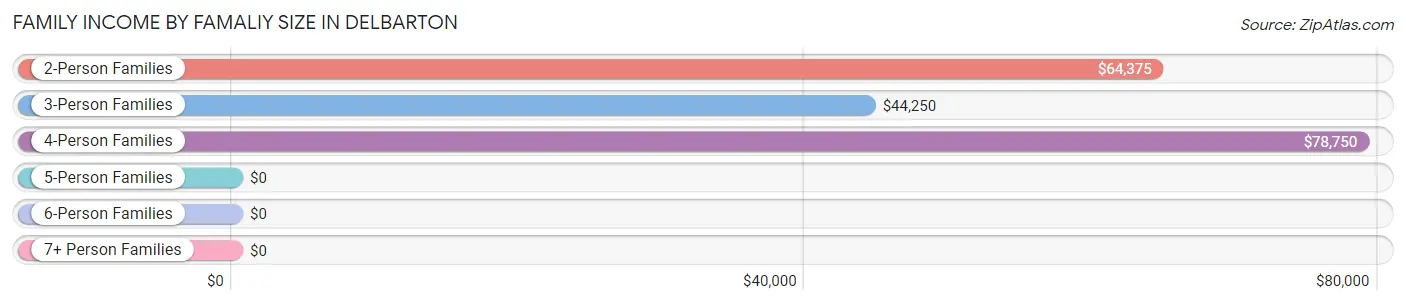
| Income Bracket | # Families | Median Income |
| 2-Person Families | 32 (27.8%) | $64,375 |
| 3-Person Families | 49 (42.6%) | $44,250 |
| 4-Person Families | 24 (20.9%) | $78,750 |
| 5-Person Families | 6 (5.2%) | $0 |
| 6-Person Families | 4 (3.5%) | $0 |
| 7+ Person Families | 0 (0.0%) | $0 |
| Total | 115 (100.0%) | $58,854 |
Family Income by Number of Earners in Delbarton
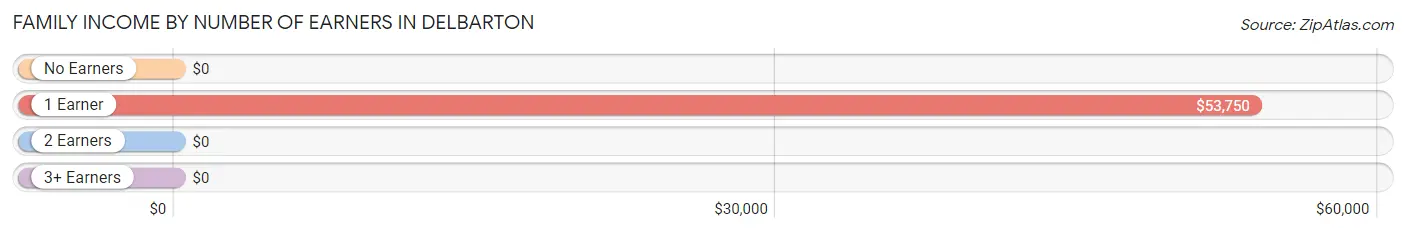
| Number of Earners | # Families | Median Income |
| No Earners | 23 (20.0%) | $0 |
| 1 Earner | 44 (38.3%) | $53,750 |
| 2 Earners | 47 (40.9%) | $0 |
| 3+ Earners | 1 (0.9%) | $0 |
| Total | 115 (100.0%) | $58,854 |
Household Income in Delbarton
Household Income Brackets in Delbarton
With 35 households falling in the category, the $25,000 to $34,999 income range is the most frequent in Delbarton, accounting for 18.7% of all households.
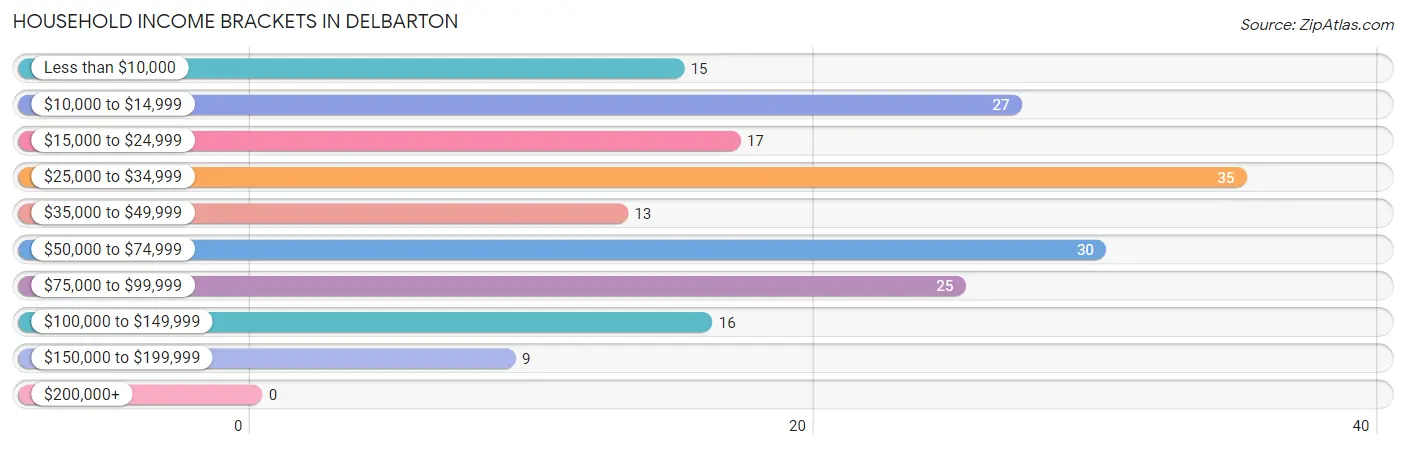
| Income Bracket | # Households | % Households |
| Less than $10,000 | 15 | 8.0% |
| $10,000 to $14,999 | 27 | 14.4% |
| $15,000 to $24,999 | 17 | 9.1% |
| $25,000 to $34,999 | 35 | 18.7% |
| $35,000 to $49,999 | 13 | 7.0% |
| $50,000 to $74,999 | 30 | 16.0% |
| $75,000 to $99,999 | 25 | 13.4% |
| $100,000 to $149,999 | 16 | 8.6% |
| $150,000 to $199,999 | 9 | 4.8% |
| $200,000+ | 0 | 0.0% |
Household Income by Householder Age in Delbarton
The median household income in Delbarton is $34,688, with the highest median household income of $58,125 found in the 25 to 44 years age bracket for the primary householder. A total of 38 households (20.3%) fall into this category.
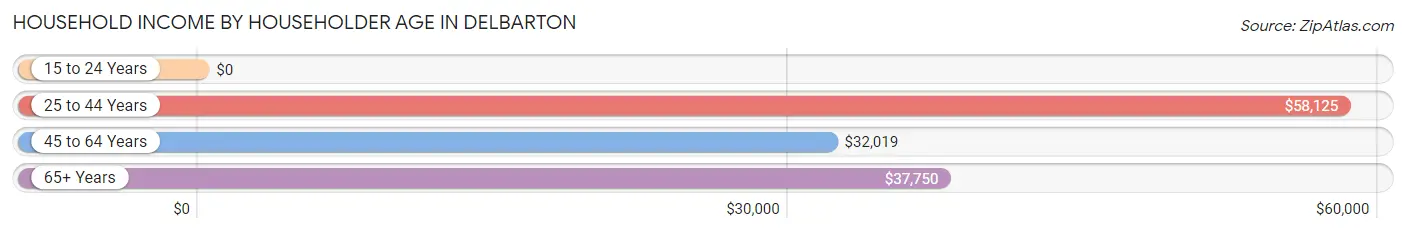
| Income Bracket | # Households | Median Income |
| 15 to 24 Years | 0 (0.0%) | $0 |
| 25 to 44 Years | 38 (20.3%) | $58,125 |
| 45 to 64 Years | 88 (47.1%) | $32,019 |
| 65+ Years | 61 (32.6%) | $37,750 |
| Total | 187 (100.0%) | $34,688 |
Poverty in Delbarton
Income Below Poverty by Sex and Age in Delbarton
With 24.4% poverty level for males and 40.7% for females among the residents of Delbarton, 12 to 14 year old males and 25 to 34 year old females are the most vulnerable to poverty, with 22 males (100.0%) and 40 females (90.9%) in their respective age groups living below the poverty level.
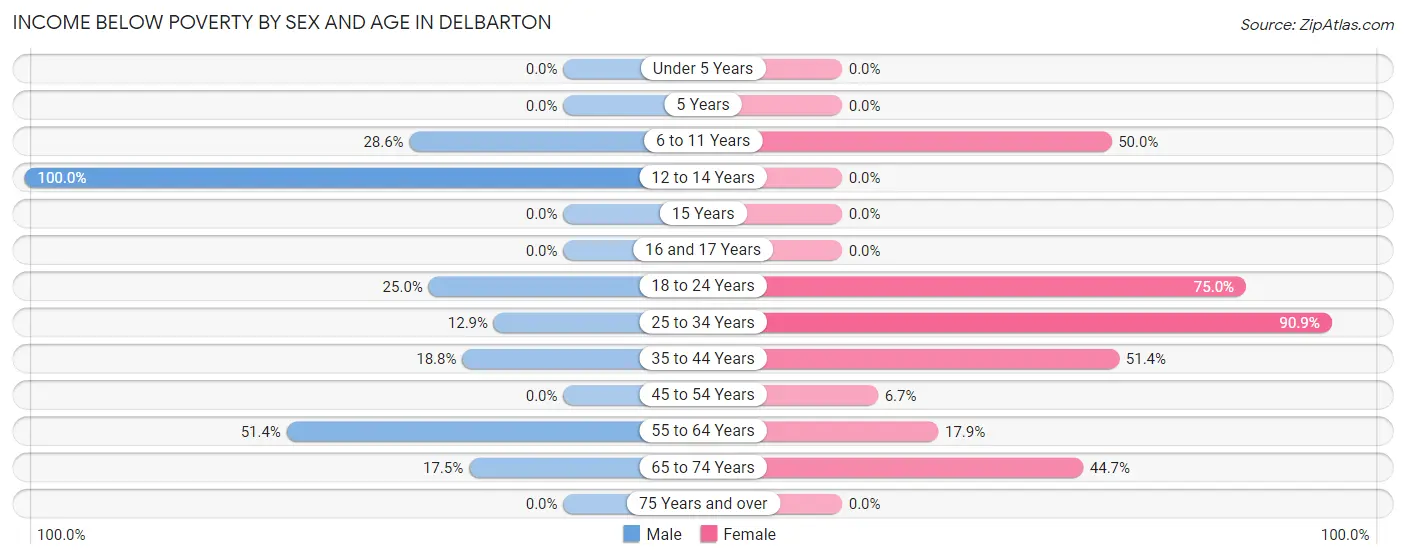
| Age Bracket | Male | Female |
| Under 5 Years | 0 (0.0%) | 0 (0.0%) |
| 5 Years | 0 (0.0%) | 0 (0.0%) |
| 6 to 11 Years | 4 (28.6%) | 10 (50.0%) |
| 12 to 14 Years | 22 (100.0%) | 0 (0.0%) |
| 15 Years | 0 (0.0%) | 0 (0.0%) |
| 16 and 17 Years | 0 (0.0%) | 0 (0.0%) |
| 18 to 24 Years | 5 (25.0%) | 15 (75.0%) |
| 25 to 34 Years | 4 (12.9%) | 40 (90.9%) |
| 35 to 44 Years | 6 (18.8%) | 18 (51.4%) |
| 45 to 54 Years | 0 (0.0%) | 2 (6.7%) |
| 55 to 64 Years | 19 (51.3%) | 5 (17.9%) |
| 65 to 74 Years | 7 (17.5%) | 17 (44.7%) |
| 75 Years and over | 0 (0.0%) | 0 (0.0%) |
| Total | 67 (24.4%) | 107 (40.7%) |
Income Above Poverty by Sex and Age in Delbarton
According to the poverty statistics in Delbarton, males aged under 5 years and females aged 12 to 14 years are the age groups that are most secure financially, with 100.0% of males and 100.0% of females in these age groups living above the poverty line.
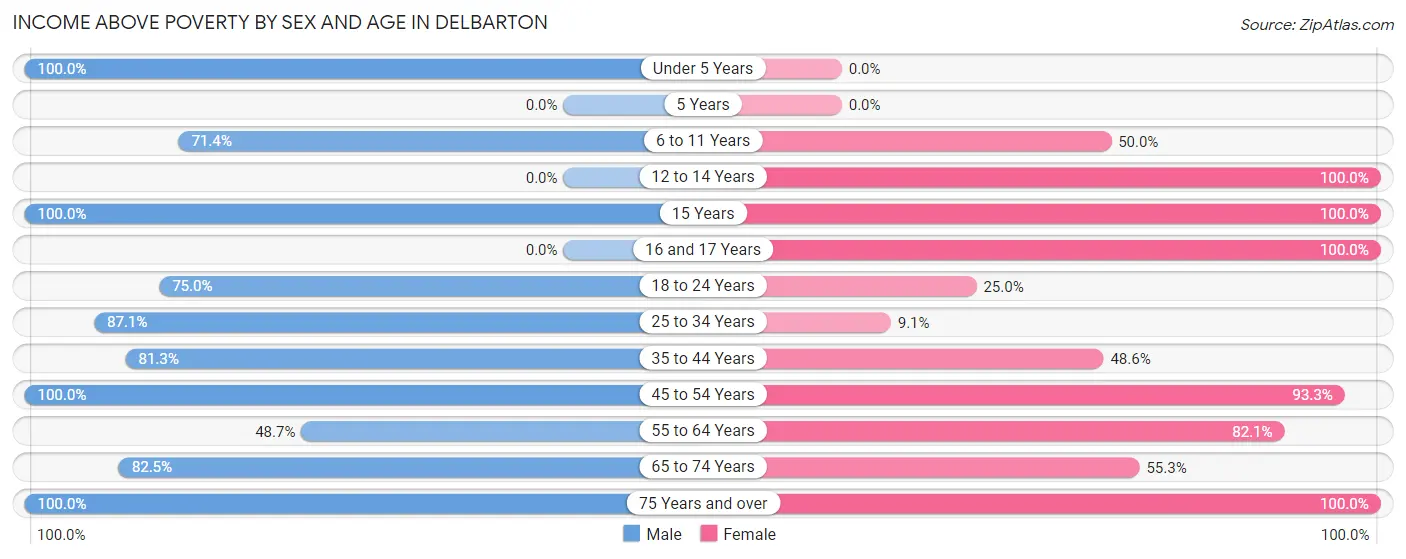
| Age Bracket | Male | Female |
| Under 5 Years | 11 (100.0%) | 0 (0.0%) |
| 5 Years | 0 (0.0%) | 0 (0.0%) |
| 6 to 11 Years | 10 (71.4%) | 10 (50.0%) |
| 12 to 14 Years | 0 (0.0%) | 6 (100.0%) |
| 15 Years | 4 (100.0%) | 10 (100.0%) |
| 16 and 17 Years | 0 (0.0%) | 5 (100.0%) |
| 18 to 24 Years | 15 (75.0%) | 5 (25.0%) |
| 25 to 34 Years | 27 (87.1%) | 4 (9.1%) |
| 35 to 44 Years | 26 (81.2%) | 17 (48.6%) |
| 45 to 54 Years | 43 (100.0%) | 28 (93.3%) |
| 55 to 64 Years | 18 (48.6%) | 23 (82.1%) |
| 65 to 74 Years | 33 (82.5%) | 21 (55.3%) |
| 75 Years and over | 20 (100.0%) | 27 (100.0%) |
| Total | 207 (75.5%) | 156 (59.3%) |
Income Below Poverty Among Married-Couple Families in Delbarton
The poverty statistics for married-couple families in Delbarton show that 15.5% or 15 of the total 97 families live below the poverty line. Families with 3 or 4 children have the highest poverty rate of 100.0%, comprising of 4 families. On the other hand, families with no children have the lowest poverty rate of 9.1%, which includes 5 families.
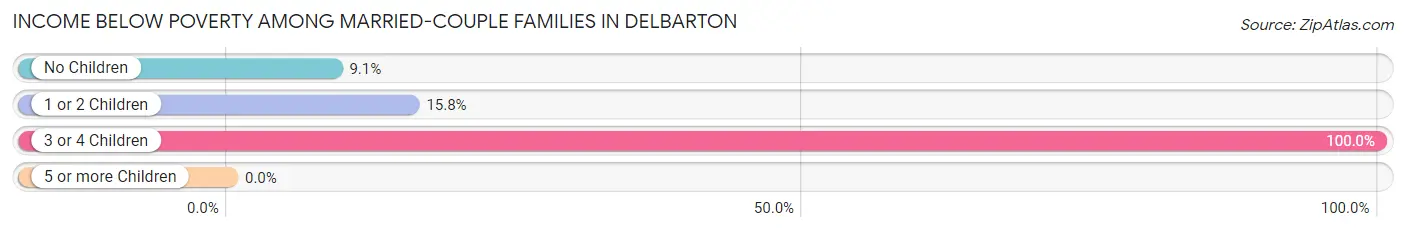
| Children | Above Poverty | Below Poverty |
| No Children | 50 (90.9%) | 5 (9.1%) |
| 1 or 2 Children | 32 (84.2%) | 6 (15.8%) |
| 3 or 4 Children | 0 (0.0%) | 4 (100.0%) |
| 5 or more Children | 0 (0.0%) | 0 (0.0%) |
| Total | 82 (84.5%) | 15 (15.5%) |
Income Below Poverty Among Single-Parent Households in Delbarton
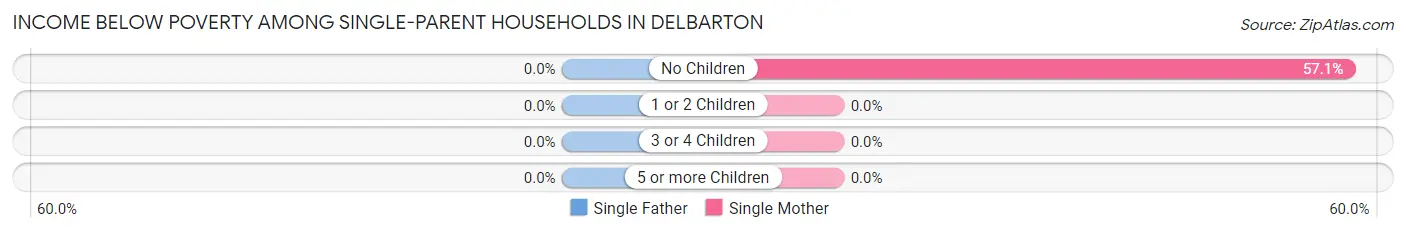
| Children | Single Father | Single Mother |
| No Children | 0 (0.0%) | 8 (57.1%) |
| 1 or 2 Children | 0 (0.0%) | 0 (0.0%) |
| 3 or 4 Children | 0 (0.0%) | 0 (0.0%) |
| 5 or more Children | 0 (0.0%) | 0 (0.0%) |
| Total | 0 (0.0%) | 8 (57.1%) |
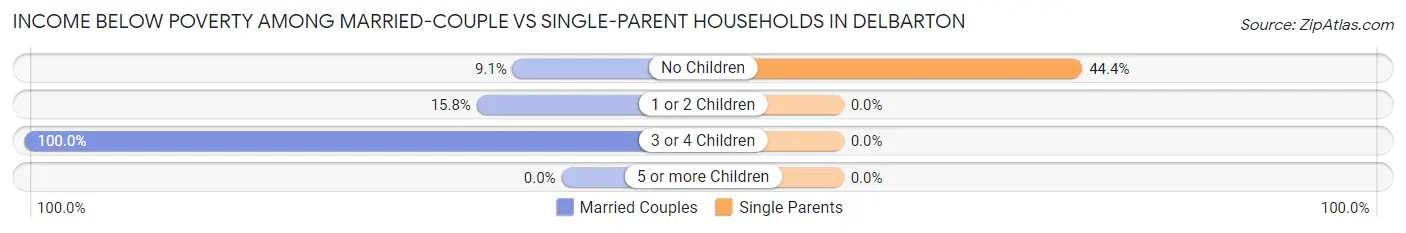
Income Below Poverty Among Married-Couple vs Single-Parent Households in Delbarton
The poverty data for Delbarton shows that 15 of the married-couple family households (15.5%) and 8 of the single-parent households (44.4%) are living below the poverty level. Within the married-couple family households, those with 3 or 4 children have the highest poverty rate, with 4 households (100.0%) falling below the poverty line. Among the single-parent households, those with no children have the highest poverty rate, with 8 household (44.4%) living below poverty.
| Children | Married-Couple Families | Single-Parent Households |
| No Children | 5 (9.1%) | 8 (44.4%) |
| 1 or 2 Children | 6 (15.8%) | 0 (0.0%) |
| 3 or 4 Children | 4 (100.0%) | 0 (0.0%) |
| 5 or more Children | 0 (0.0%) | 0 (0.0%) |
| Total | 15 (15.5%) | 8 (44.4%) |
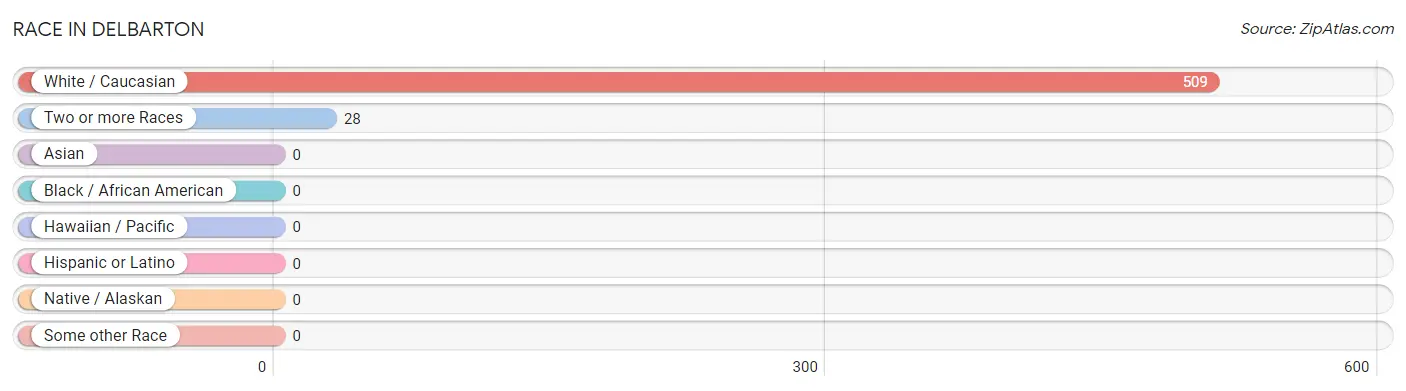
Race in Delbarton
The most populous races in Delbarton are White / Caucasian (509 | 94.8%), and Two or more Races (28 | 5.2%).
| Race | # Population | % Population |
| Asian | 0 | 0.0% |
| Black / African American | 0 | 0.0% |
| Hawaiian / Pacific | 0 | 0.0% |
| Hispanic or Latino | 0 | 0.0% |
| Native / Alaskan | 0 | 0.0% |
| White / Caucasian | 509 | 94.8% |
| Two or more Races | 28 | 5.2% |
| Some other Race | 0 | 0.0% |
| Total | 537 | 100.0% |
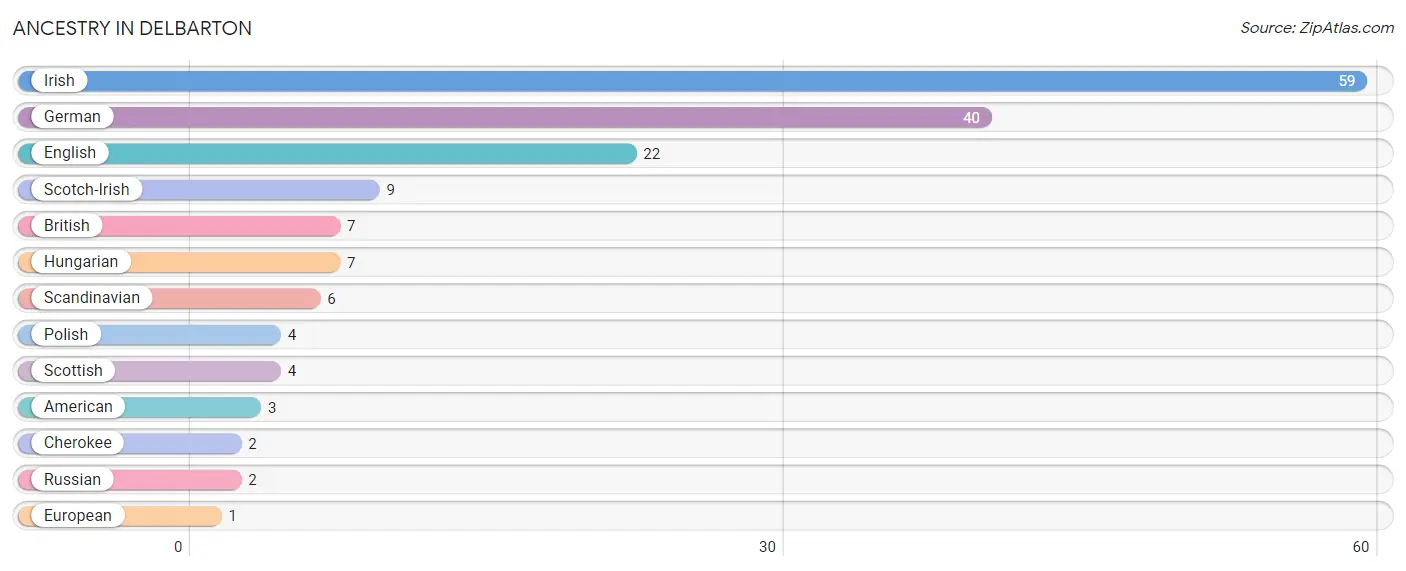
Ancestry in Delbarton
The most populous ancestries reported in Delbarton are Irish (59 | 11.0%), German (40 | 7.4%), English (22 | 4.1%), Scotch-Irish (9 | 1.7%), and British (7 | 1.3%), together accounting for 25.5% of all Delbarton residents.
| Ancestry | # Population | % Population |
| American | 3 | 0.6% |
| British | 7 | 1.3% |
| Cherokee | 2 | 0.4% |
| English | 22 | 4.1% |
| European | 1 | 0.2% |
| German | 40 | 7.4% |
| Hungarian | 7 | 1.3% |
| Irish | 59 | 11.0% |
| Polish | 4 | 0.7% |
| Russian | 2 | 0.4% |
| Scandinavian | 6 | 1.1% |
| Scotch-Irish | 9 | 1.7% |
| Scottish | 4 | 0.7% | View All 13 Rows |
Immigrants in Delbarton

| Immigration Origin | # Population | % Population | View All 0 Rows |
Sex and Age in Delbarton
Sex and Age in Delbarton
The most populous age groups in Delbarton are 50 to 54 Years (33 | 12.0%) for men and 25 to 29 Years (36 | 13.7%) for women.
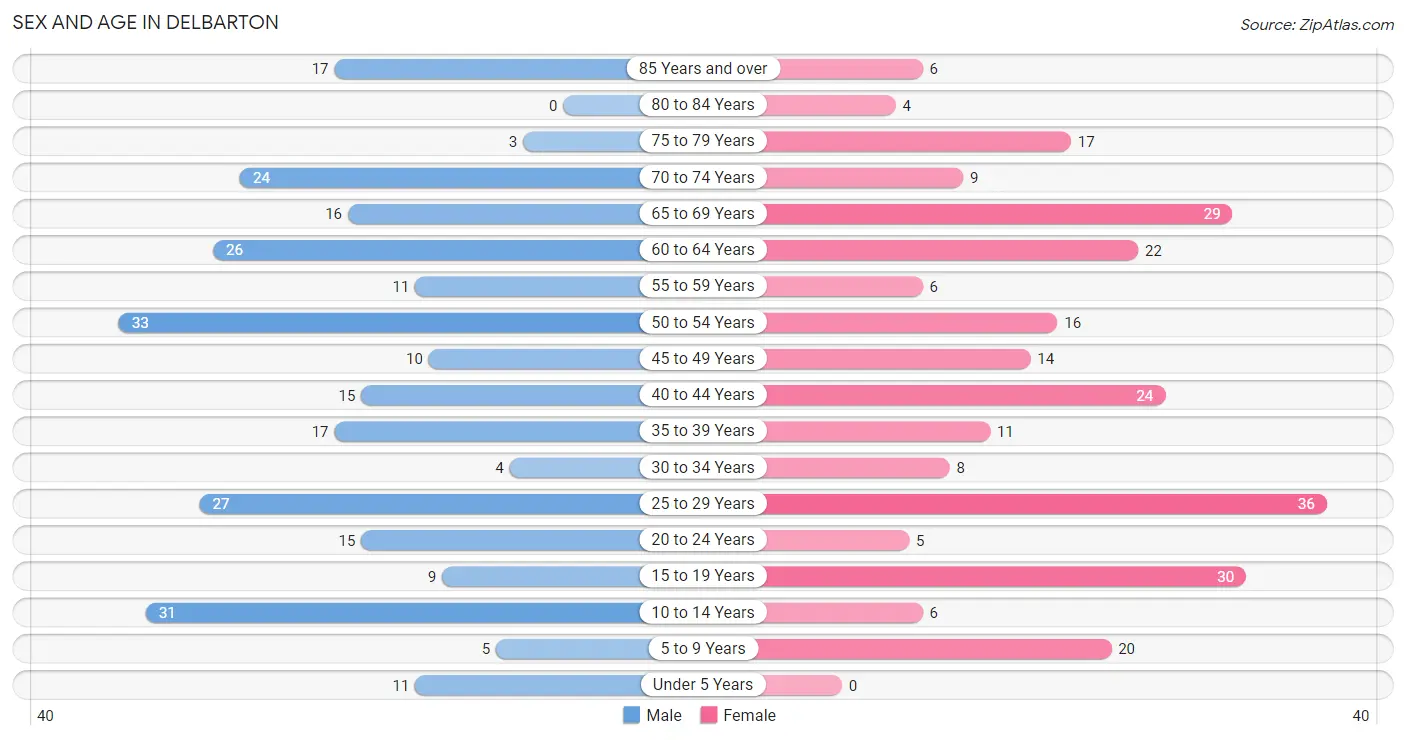
| Age Bracket | Male | Female |
| Under 5 Years | 11 (4.0%) | 0 (0.0%) |
| 5 to 9 Years | 5 (1.8%) | 20 (7.6%) |
| 10 to 14 Years | 31 (11.3%) | 6 (2.3%) |
| 15 to 19 Years | 9 (3.3%) | 30 (11.4%) |
| 20 to 24 Years | 15 (5.5%) | 5 (1.9%) |
| 25 to 29 Years | 27 (9.9%) | 36 (13.7%) |
| 30 to 34 Years | 4 (1.5%) | 8 (3.0%) |
| 35 to 39 Years | 17 (6.2%) | 11 (4.2%) |
| 40 to 44 Years | 15 (5.5%) | 24 (9.1%) |
| 45 to 49 Years | 10 (3.6%) | 14 (5.3%) |
| 50 to 54 Years | 33 (12.0%) | 16 (6.1%) |
| 55 to 59 Years | 11 (4.0%) | 6 (2.3%) |
| 60 to 64 Years | 26 (9.5%) | 22 (8.4%) |
| 65 to 69 Years | 16 (5.8%) | 29 (11.0%) |
| 70 to 74 Years | 24 (8.8%) | 9 (3.4%) |
| 75 to 79 Years | 3 (1.1%) | 17 (6.5%) |
| 80 to 84 Years | 0 (0.0%) | 4 (1.5%) |
| 85 Years and over | 17 (6.2%) | 6 (2.3%) |
| Total | 274 (100.0%) | 263 (100.0%) |
Families and Households in Delbarton
Median Family Size in Delbarton
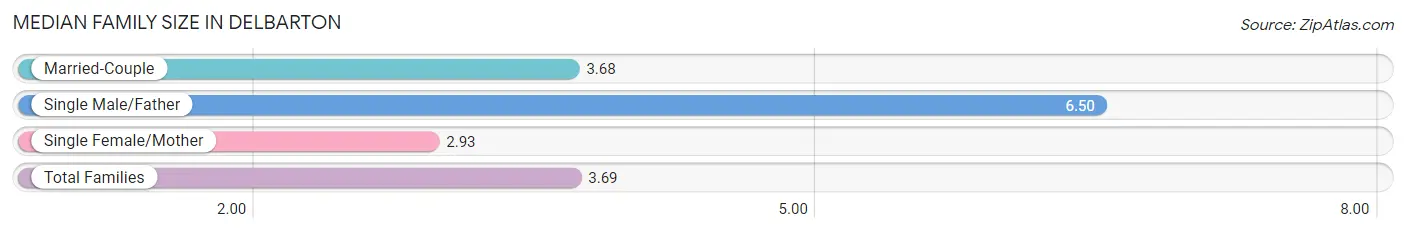
The median family size in Delbarton is 3.69 persons per family, with single male/father families (4 | 3.5%) accounting for the largest median family size of 6.5 persons per family. On the other hand, single female/mother families (14 | 12.2%) represent the smallest median family size with 2.93 persons per family.
| Family Type | # Families | Family Size |
| Married-Couple | 97 (84.4%) | 3.68 |
| Single Male/Father | 4 (3.5%) | 6.50 |
| Single Female/Mother | 14 (12.2%) | 2.93 |
| Total Families | 115 (100.0%) | 3.69 |
Median Household Size in Delbarton
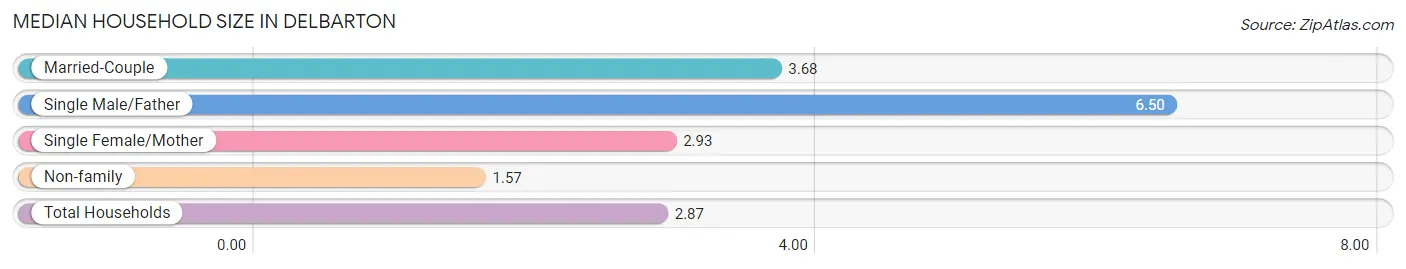
The median household size in Delbarton is 2.87 persons per household, with single male/father households (4 | 2.1%) accounting for the largest median household size of 6.5 persons per household. non-family households (72 | 38.5%) represent the smallest median household size with 1.57 persons per household.
| Household Type | # Households | Household Size |
| Married-Couple | 97 (51.9%) | 3.68 |
| Single Male/Father | 4 (2.1%) | 6.50 |
| Single Female/Mother | 14 (7.5%) | 2.93 |
| Non-family | 72 (38.5%) | 1.57 |
| Total Households | 187 (100.0%) | 2.87 |
Household Size by Marriage Status in Delbarton
Out of a total of 187 households in Delbarton, 115 (61.5%) are family households, while 72 (38.5%) are nonfamily households. The most numerous type of family households are 3-person households, comprising 49, and the most common type of nonfamily households are 1-person households, comprising 54.
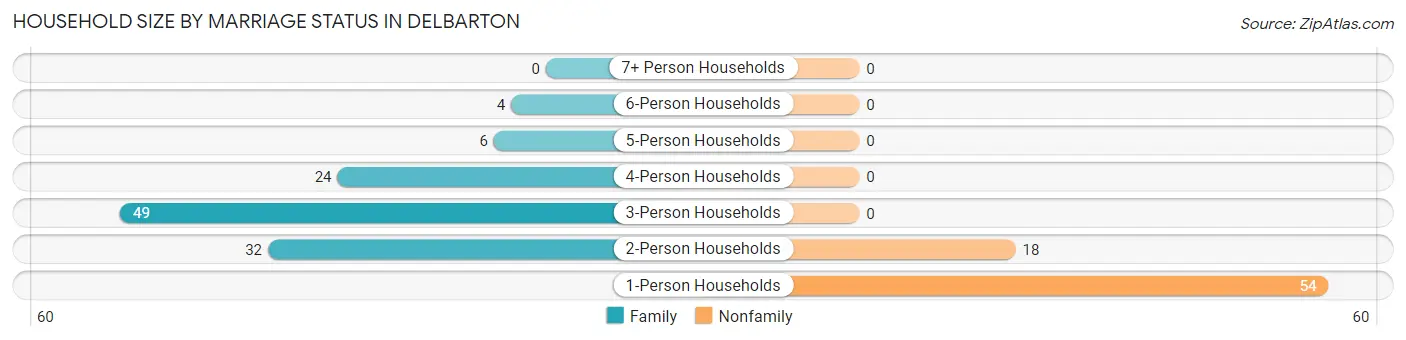
| Household Size | Family Households | Nonfamily Households |
| 1-Person Households | - | 54 (28.9%) |
| 2-Person Households | 32 (17.1%) | 18 (9.6%) |
| 3-Person Households | 49 (26.2%) | 0 (0.0%) |
| 4-Person Households | 24 (12.8%) | 0 (0.0%) |
| 5-Person Households | 6 (3.2%) | 0 (0.0%) |
| 6-Person Households | 4 (2.1%) | 0 (0.0%) |
| 7+ Person Households | 0 (0.0%) | 0 (0.0%) |
| Total | 115 (61.5%) | 72 (38.5%) |
Female Fertility in Delbarton
Fertility by Age in Delbarton
| Age Bracket | Women with Births | Births / 1,000 Women |
| 15 to 19 years | 0 (0.0%) | 0.0 |
| 20 to 34 years | 0 (0.0%) | 0.0 |
| 35 to 50 years | 0 (0.0%) | 0.0 |
| Total | 0 (0.0%) | 0.0 |
Fertility by Age by Marriage Status in Delbarton
| Age Bracket | Married | Unmarried |
| 15 to 19 years | 0 (0.0%) | 0 (0.0%) |
| 20 to 34 years | 0 (0.0%) | 0 (0.0%) |
| 35 to 50 years | 0 (0.0%) | 0 (0.0%) |
| Total | 0 (0.0%) | 0 (0.0%) |
Fertility by Education in Delbarton
| Educational Attainment | Women with Births | Births / 1,000 Women |
| Less than High School | 0 (0.0%) | 0.0 |
| High School Diploma | 0 (0.0%) | 0.0 |
| College or Associate's Degree | 0 (0.0%) | 0.0 |
| Bachelor's Degree | 0 (0.0%) | 0.0 |
| Graduate Degree | 0 (0.0%) | 0.0 |
| Total | 0 (0.0%) | 0.0 |
Fertility by Education by Marriage Status in Delbarton
| Educational Attainment | Married | Unmarried |
| Less than High School | 0 (0.0%) | 0 (0.0%) |
| High School Diploma | 0 (0.0%) | 0 (0.0%) |
| College or Associate's Degree | 0 (0.0%) | 0 (0.0%) |
| Bachelor's Degree | 0 (0.0%) | 0 (0.0%) |
| Graduate Degree | 0 (0.0%) | 0 (0.0%) |
| Total | 0 (0.0%) | 0 (0.0%) |
Employment Characteristics in Delbarton
Employment by Class of Employer in Delbarton
Among the 149 employed individuals in Delbarton, private company employees (79 | 53.0%), not-for-profit organizations (24 | 16.1%), and local government employees (20 | 13.4%) make up the most common classes of employment.
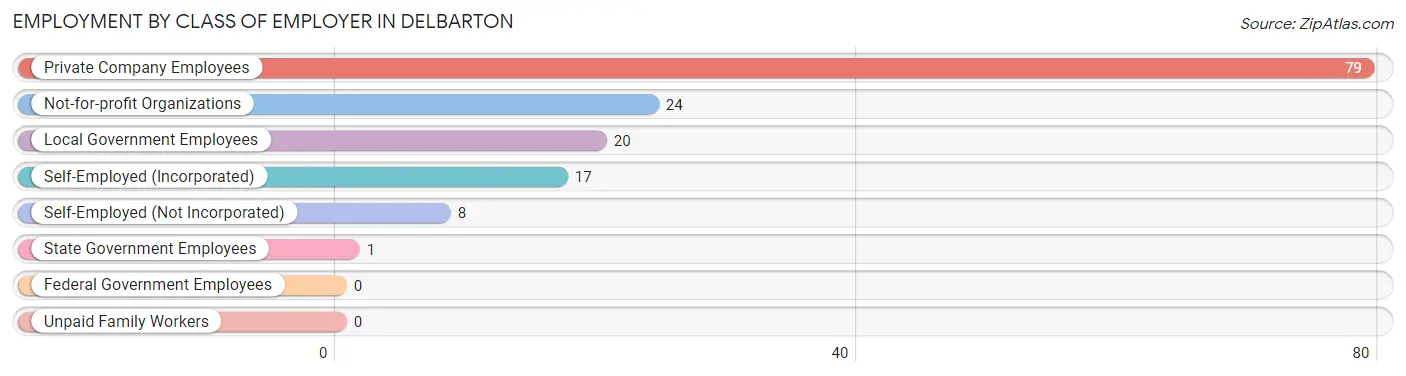
| Employer Class | # Employees | % Employees |
| Private Company Employees | 79 | 53.0% |
| Self-Employed (Incorporated) | 17 | 11.4% |
| Self-Employed (Not Incorporated) | 8 | 5.4% |
| Not-for-profit Organizations | 24 | 16.1% |
| Local Government Employees | 20 | 13.4% |
| State Government Employees | 1 | 0.7% |
| Federal Government Employees | 0 | 0.0% |
| Unpaid Family Workers | 0 | 0.0% |
| Total | 149 | 100.0% |
Employment Status by Age in Delbarton
According to the labor force statistics for Delbarton, out of the total population over 16 years of age (450), 41.1% or 185 individuals are in the labor force, with 19.5% or 36 of them unemployed. The age group with the highest labor force participation rate is 55 to 59 years, with 88.2% or 15 individuals in the labor force. Within the labor force, the 25 to 29 years age range has the highest percentage of unemployed individuals, with 66.7% or 36 of them being unemployed.
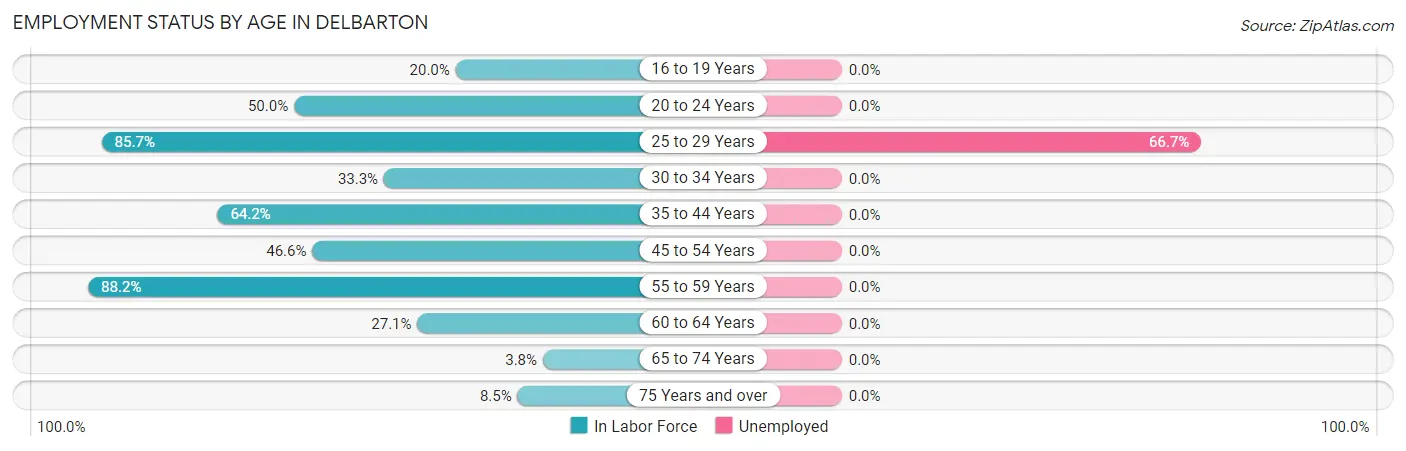
| Age Bracket | In Labor Force | Unemployed |
| 16 to 19 Years | 5 (20.0%) | 0 (0.0%) |
| 20 to 24 Years | 10 (50.0%) | 0 (0.0%) |
| 25 to 29 Years | 54 (85.7%) | 36 (66.7%) |
| 30 to 34 Years | 4 (33.3%) | 0 (0.0%) |
| 35 to 44 Years | 43 (64.2%) | 0 (0.0%) |
| 45 to 54 Years | 34 (46.6%) | 0 (0.0%) |
| 55 to 59 Years | 15 (88.2%) | 0 (0.0%) |
| 60 to 64 Years | 13 (27.1%) | 0 (0.0%) |
| 65 to 74 Years | 3 (3.8%) | 0 (0.0%) |
| 75 Years and over | 4 (8.5%) | 0 (0.0%) |
| Total | 185 (41.1%) | 36 (19.5%) |
Employment Status by Educational Attainment in Delbarton
According to labor force statistics for Delbarton, 58.2% of individuals (163) out of the total population between 25 and 64 years of age (280) are in the labor force, with 22.1% or 36 of them being unemployed. The group with the highest labor force participation rate are those with the educational attainment of less than high school, with 81.7% or 49 individuals in the labor force. Within the labor force, individuals with less than high school education have the highest percentage of unemployment, with 73.5% or 36 of them being unemployed.
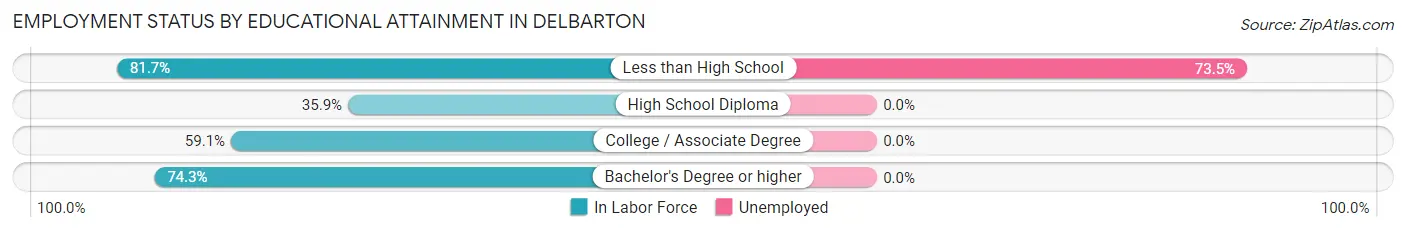
| Educational Attainment | In Labor Force | Unemployed |
| Less than High School | 49 (81.7%) | 44 (73.5%) |
| High School Diploma | 33 (35.9%) | 0 (0.0%) |
| College / Associate Degree | 55 (59.1%) | 0 (0.0%) |
| Bachelor's Degree or higher | 26 (74.3%) | 0 (0.0%) |
| Total | 163 (58.2%) | 62 (22.1%) |
Employment Occupations by Sex in Delbarton
Management, Business, Science and Arts Occupations
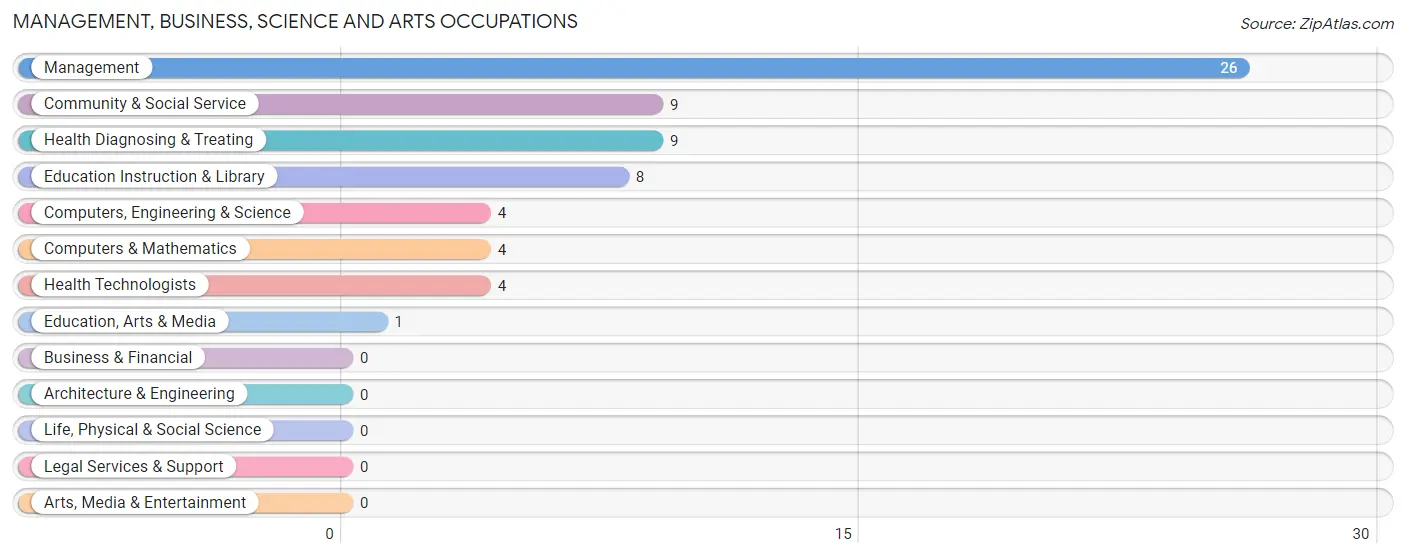
The most common Management, Business, Science and Arts occupations in Delbarton are Management (26 | 17.4%), Community & Social Service (9 | 6.0%), Health Diagnosing & Treating (9 | 6.0%), Education Instruction & Library (8 | 5.4%), and Computers, Engineering & Science (4 | 2.7%).
Management, Business, Science and Arts Occupations by Sex
Within the Management, Business, Science and Arts occupations in Delbarton, the most male-oriented occupations are Community & Social Service (100.0%), Education, Arts & Media (100.0%), and Education Instruction & Library (100.0%), while the most female-oriented occupations are Computers, Engineering & Science (100.0%), Computers & Mathematics (100.0%), and Health Technologists (100.0%).
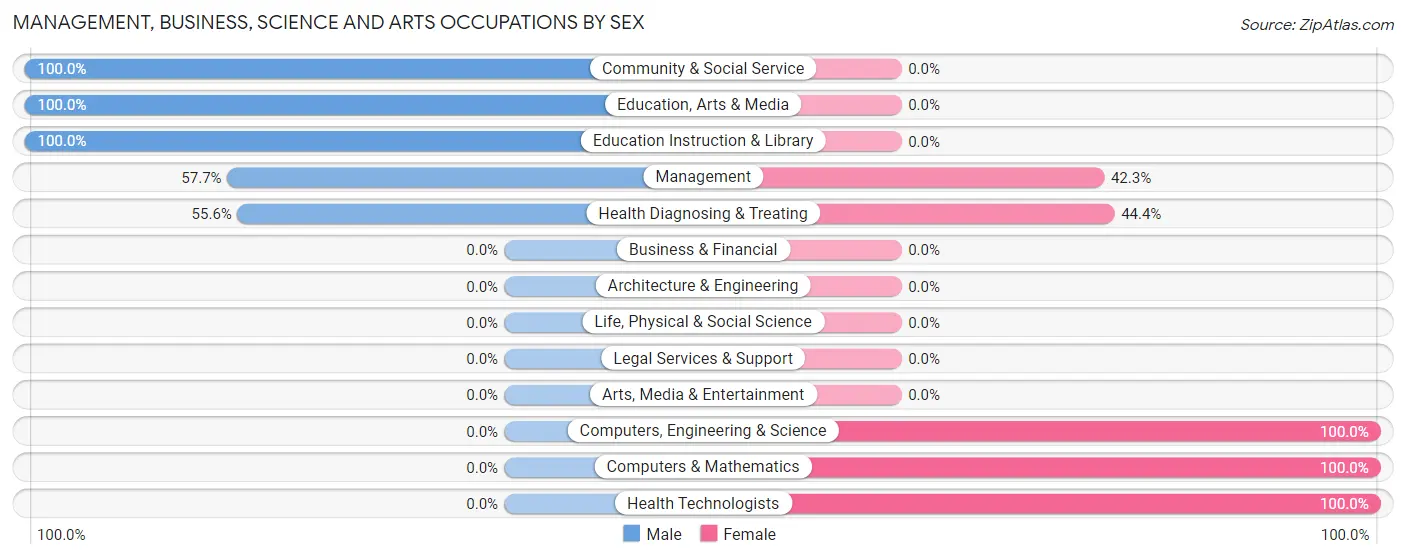
| Occupation | Male | Female |
| Management | 15 (57.7%) | 11 (42.3%) |
| Business & Financial | 0 (0.0%) | 0 (0.0%) |
| Computers, Engineering & Science | 0 (0.0%) | 4 (100.0%) |
| Computers & Mathematics | 0 (0.0%) | 4 (100.0%) |
| Architecture & Engineering | 0 (0.0%) | 0 (0.0%) |
| Life, Physical & Social Science | 0 (0.0%) | 0 (0.0%) |
| Community & Social Service | 9 (100.0%) | 0 (0.0%) |
| Education, Arts & Media | 1 (100.0%) | 0 (0.0%) |
| Legal Services & Support | 0 (0.0%) | 0 (0.0%) |
| Education Instruction & Library | 8 (100.0%) | 0 (0.0%) |
| Arts, Media & Entertainment | 0 (0.0%) | 0 (0.0%) |
| Health Diagnosing & Treating | 5 (55.6%) | 4 (44.4%) |
| Health Technologists | 0 (0.0%) | 4 (100.0%) |
| Total (Category) | 29 (60.4%) | 19 (39.6%) |
| Total (Overall) | 101 (67.8%) | 48 (32.2%) |
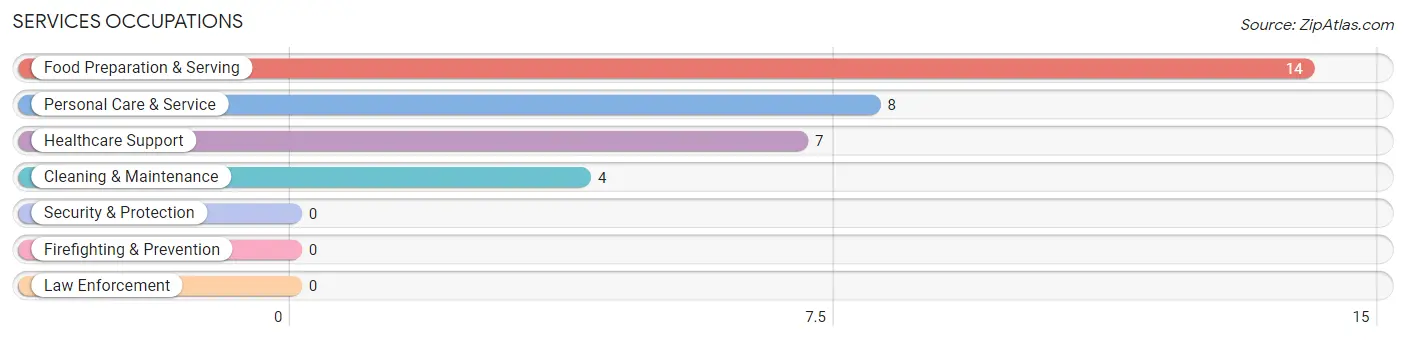
Services Occupations
The most common Services occupations in Delbarton are Food Preparation & Serving (14 | 9.4%), Personal Care & Service (8 | 5.4%), Healthcare Support (7 | 4.7%), and Cleaning & Maintenance (4 | 2.7%).
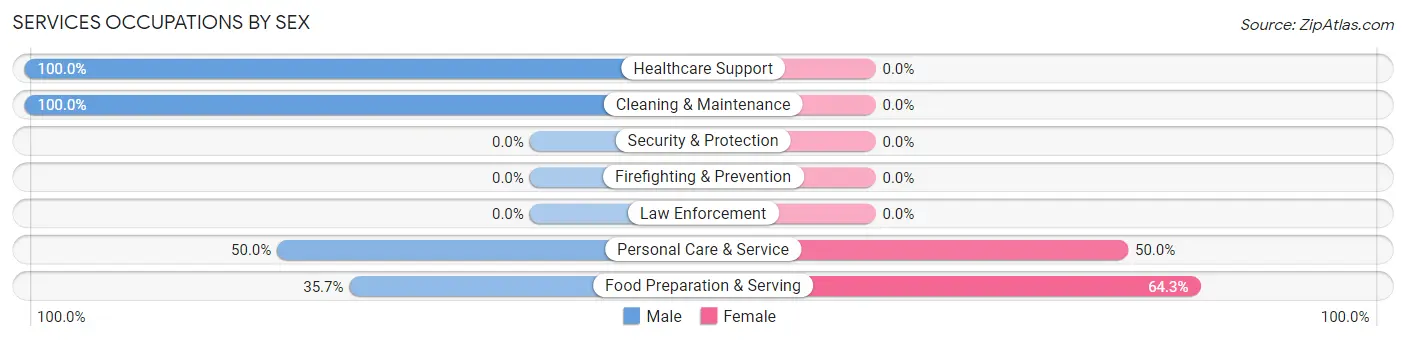
Services Occupations by Sex
Within the Services occupations in Delbarton, the most male-oriented occupations are Healthcare Support (100.0%), Cleaning & Maintenance (100.0%), and Personal Care & Service (50.0%), while the most female-oriented occupations are Food Preparation & Serving (64.3%), and Personal Care & Service (50.0%).
| Occupation | Male | Female |
| Healthcare Support | 7 (100.0%) | 0 (0.0%) |
| Security & Protection | 0 (0.0%) | 0 (0.0%) |
| Firefighting & Prevention | 0 (0.0%) | 0 (0.0%) |
| Law Enforcement | 0 (0.0%) | 0 (0.0%) |
| Food Preparation & Serving | 5 (35.7%) | 9 (64.3%) |
| Cleaning & Maintenance | 4 (100.0%) | 0 (0.0%) |
| Personal Care & Service | 4 (50.0%) | 4 (50.0%) |
| Total (Category) | 20 (60.6%) | 13 (39.4%) |
| Total (Overall) | 101 (67.8%) | 48 (32.2%) |
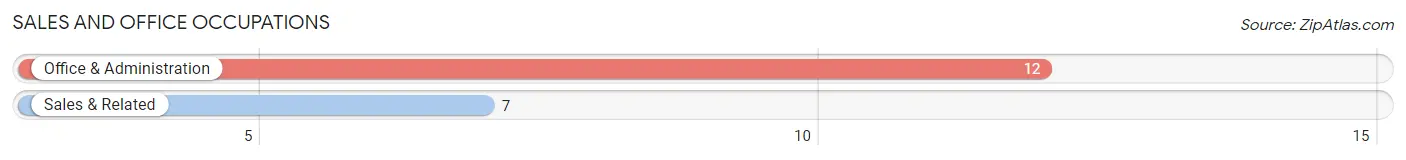
Sales and Office Occupations
The most common Sales and Office occupations in Delbarton are Office & Administration (12 | 8.1%), and Sales & Related (7 | 4.7%).
Sales and Office Occupations by Sex
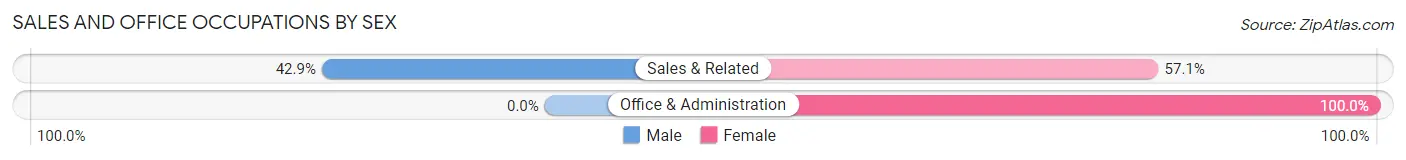
| Occupation | Male | Female |
| Sales & Related | 3 (42.9%) | 4 (57.1%) |
| Office & Administration | 0 (0.0%) | 12 (100.0%) |
| Total (Category) | 3 (15.8%) | 16 (84.2%) |
| Total (Overall) | 101 (67.8%) | 48 (32.2%) |
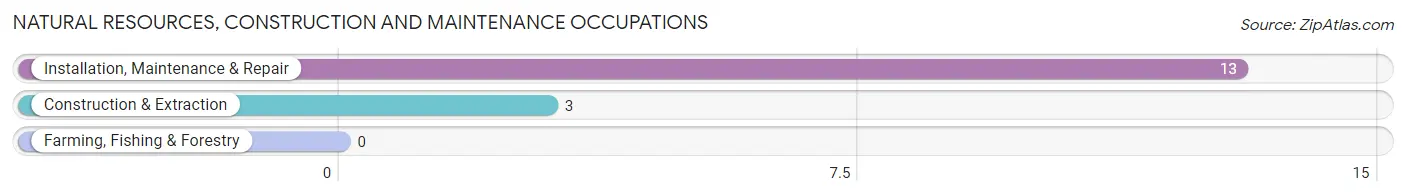
Natural Resources, Construction and Maintenance Occupations
The most common Natural Resources, Construction and Maintenance occupations in Delbarton are Installation, Maintenance & Repair (13 | 8.7%), and Construction & Extraction (3 | 2.0%).
Natural Resources, Construction and Maintenance Occupations by Sex
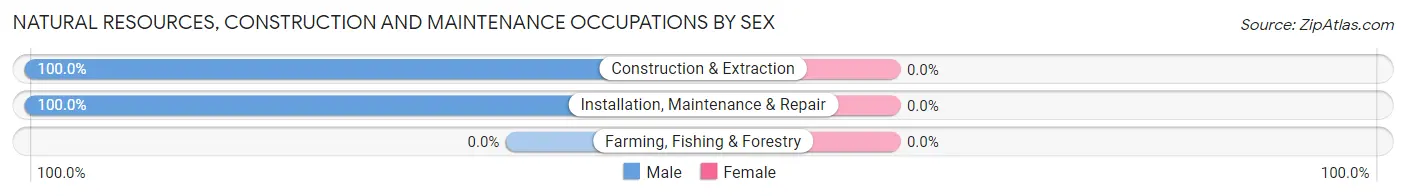
| Occupation | Male | Female |
| Farming, Fishing & Forestry | 0 (0.0%) | 0 (0.0%) |
| Construction & Extraction | 3 (100.0%) | 0 (0.0%) |
| Installation, Maintenance & Repair | 13 (100.0%) | 0 (0.0%) |
| Total (Category) | 16 (100.0%) | 0 (0.0%) |
| Total (Overall) | 101 (67.8%) | 48 (32.2%) |
Production, Transportation and Moving Occupations
The most common Production, Transportation and Moving occupations in Delbarton are Production (18 | 12.1%), Transportation (10 | 6.7%), and Material Moving (5 | 3.4%).
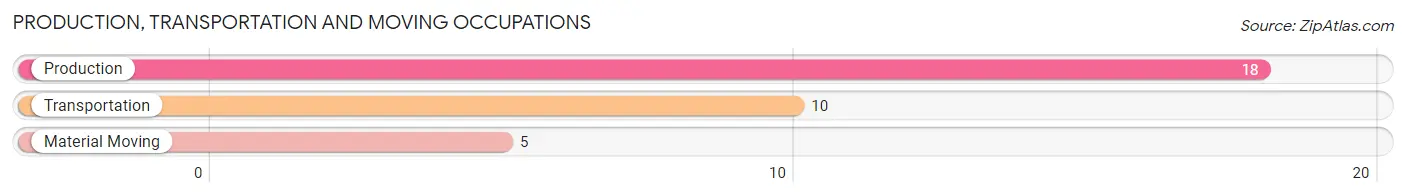
Production, Transportation and Moving Occupations by Sex
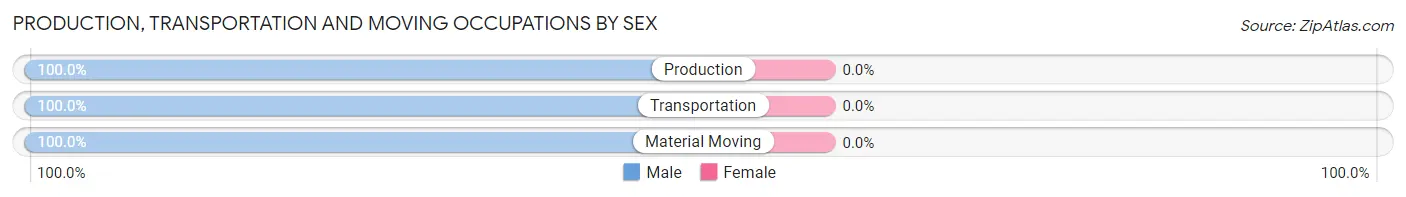
| Occupation | Male | Female |
| Production | 18 (100.0%) | 0 (0.0%) |
| Transportation | 10 (100.0%) | 0 (0.0%) |
| Material Moving | 5 (100.0%) | 0 (0.0%) |
| Total (Category) | 33 (100.0%) | 0 (0.0%) |
| Total (Overall) | 101 (67.8%) | 48 (32.2%) |
Employment Industries by Sex in Delbarton
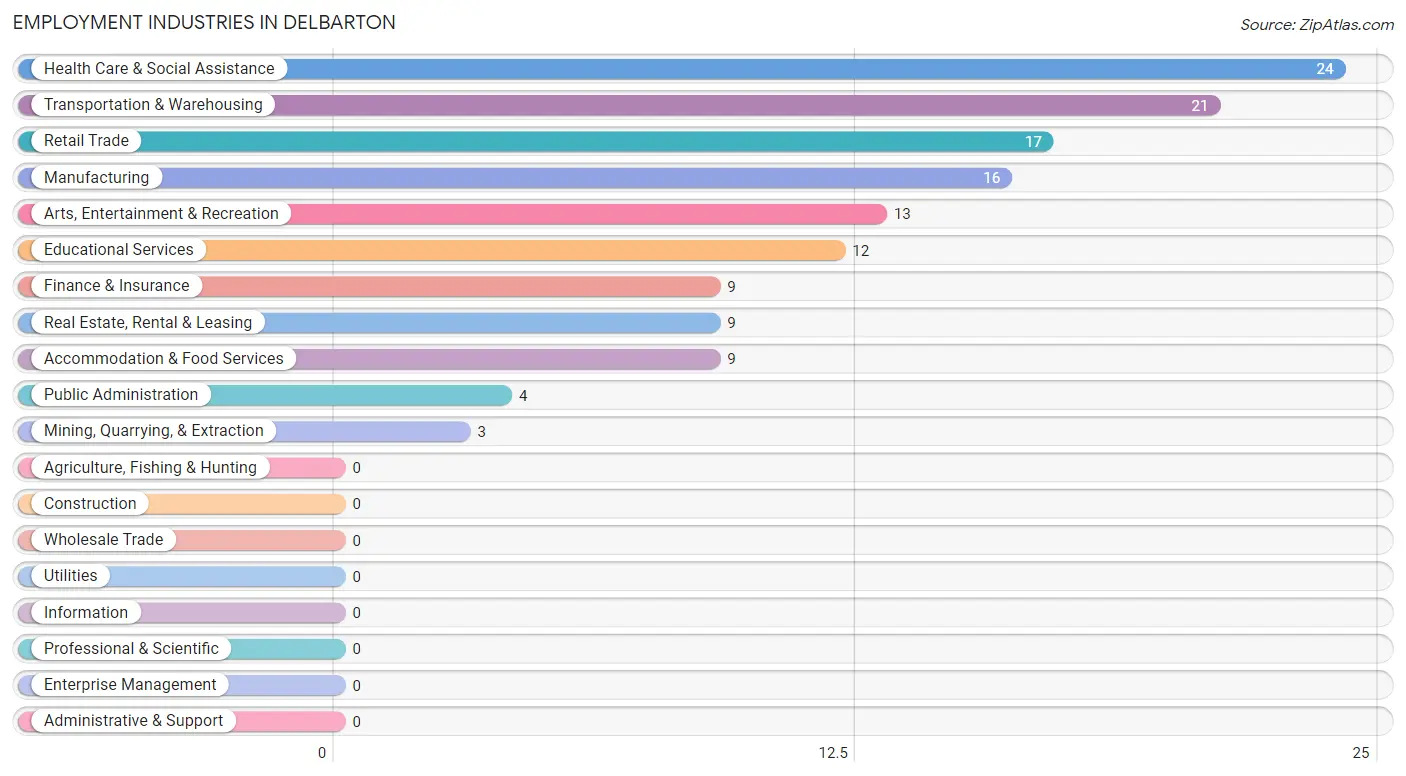
Employment Industries in Delbarton
The major employment industries in Delbarton include Health Care & Social Assistance (24 | 16.1%), Transportation & Warehousing (21 | 14.1%), Retail Trade (17 | 11.4%), Manufacturing (16 | 10.7%), and Arts, Entertainment & Recreation (13 | 8.7%).
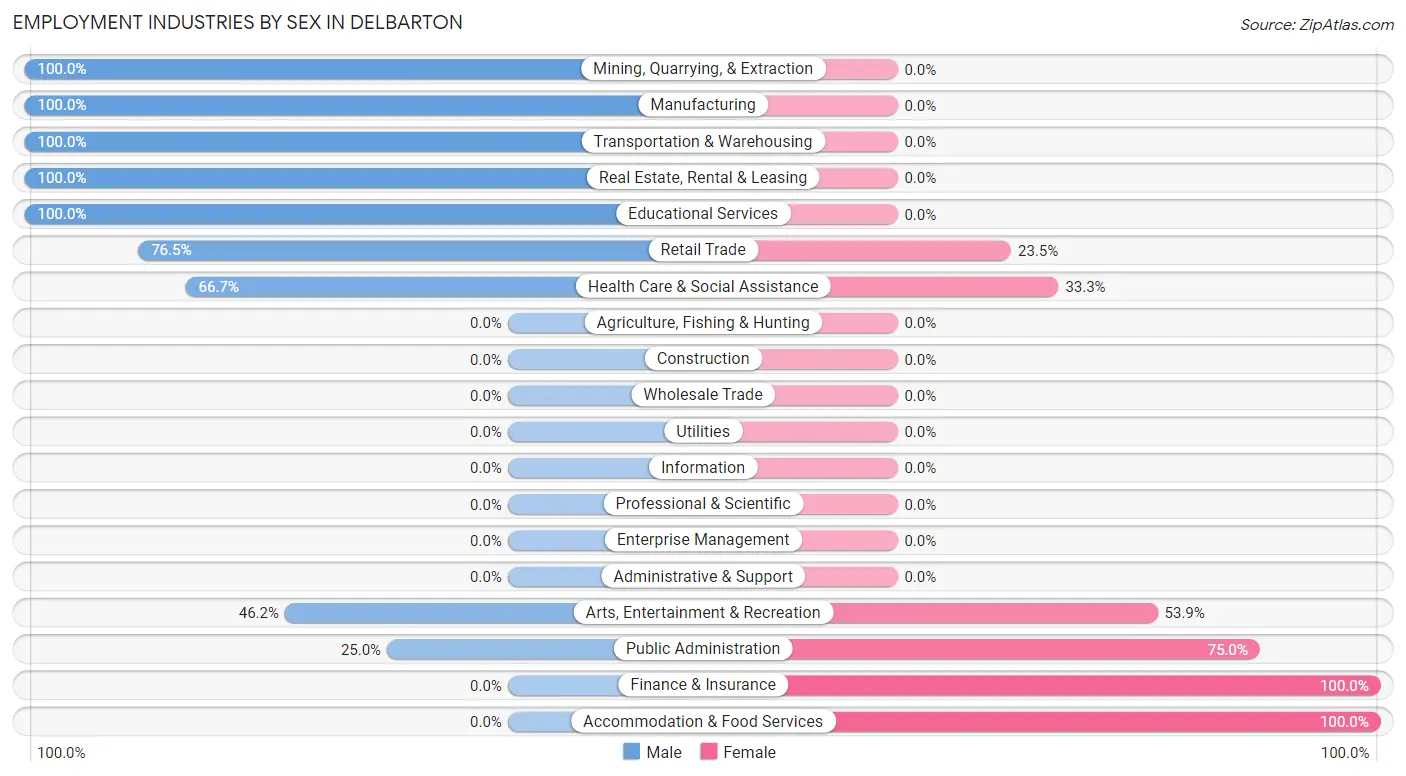
Employment Industries by Sex in Delbarton
The Delbarton industries that see more men than women are Mining, Quarrying, & Extraction (100.0%), Manufacturing (100.0%), and Transportation & Warehousing (100.0%), whereas the industries that tend to have a higher number of women are Finance & Insurance (100.0%), Accommodation & Food Services (100.0%), and Public Administration (75.0%).
| Industry | Male | Female |
| Agriculture, Fishing & Hunting | 0 (0.0%) | 0 (0.0%) |
| Mining, Quarrying, & Extraction | 3 (100.0%) | 0 (0.0%) |
| Construction | 0 (0.0%) | 0 (0.0%) |
| Manufacturing | 16 (100.0%) | 0 (0.0%) |
| Wholesale Trade | 0 (0.0%) | 0 (0.0%) |
| Retail Trade | 13 (76.5%) | 4 (23.5%) |
| Transportation & Warehousing | 21 (100.0%) | 0 (0.0%) |
| Utilities | 0 (0.0%) | 0 (0.0%) |
| Information | 0 (0.0%) | 0 (0.0%) |
| Finance & Insurance | 0 (0.0%) | 9 (100.0%) |
| Real Estate, Rental & Leasing | 9 (100.0%) | 0 (0.0%) |
| Professional & Scientific | 0 (0.0%) | 0 (0.0%) |
| Enterprise Management | 0 (0.0%) | 0 (0.0%) |
| Administrative & Support | 0 (0.0%) | 0 (0.0%) |
| Educational Services | 12 (100.0%) | 0 (0.0%) |
| Health Care & Social Assistance | 16 (66.7%) | 8 (33.3%) |
| Arts, Entertainment & Recreation | 6 (46.2%) | 7 (53.8%) |
| Accommodation & Food Services | 0 (0.0%) | 9 (100.0%) |
| Public Administration | 1 (25.0%) | 3 (75.0%) |
| Total | 101 (67.8%) | 48 (32.2%) |
Education in Delbarton
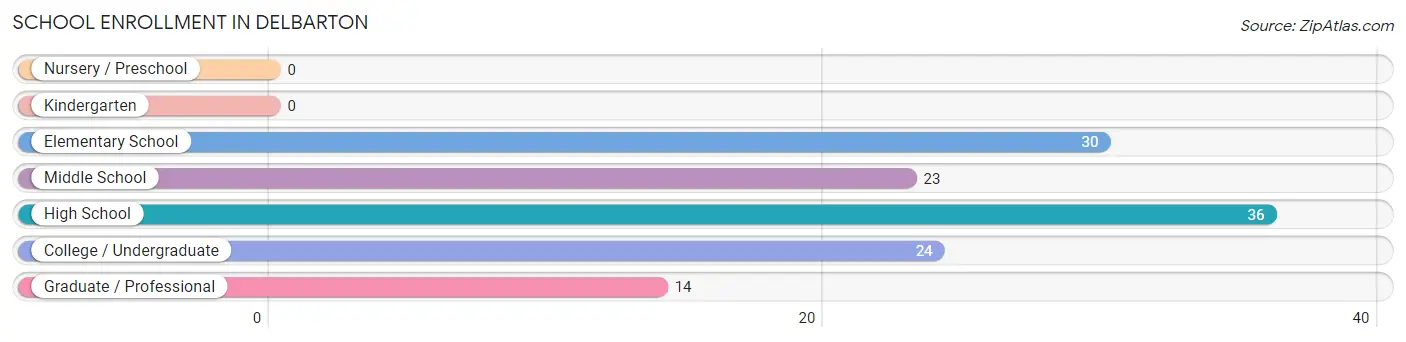
School Enrollment in Delbarton
The most common levels of schooling among the 127 students in Delbarton are high school (36 | 28.3%), elementary school (30 | 23.6%), and college / undergraduate (24 | 18.9%).
| School Level | # Students | % Students |
| Nursery / Preschool | 0 | 0.0% |
| Kindergarten | 0 | 0.0% |
| Elementary School | 30 | 23.6% |
| Middle School | 23 | 18.1% |
| High School | 36 | 28.3% |
| College / Undergraduate | 24 | 18.9% |
| Graduate / Professional | 14 | 11.0% |
| Total | 127 | 100.0% |
School Enrollment by Age by Funding Source in Delbarton
Out of a total of 127 students who are enrolled in schools in Delbarton, 27 (21.3%) attend a private institution, while the remaining 100 (78.7%) are enrolled in public schools. The age group of 20 to 24 year olds has the highest likelihood of being enrolled in private schools, with 5 (100.0% in the age bracket) enrolled. Conversely, the age group of 5 to 9 year old has the lowest likelihood of being enrolled in a private school, with 25 (100.0% in the age bracket) attending a public institution.
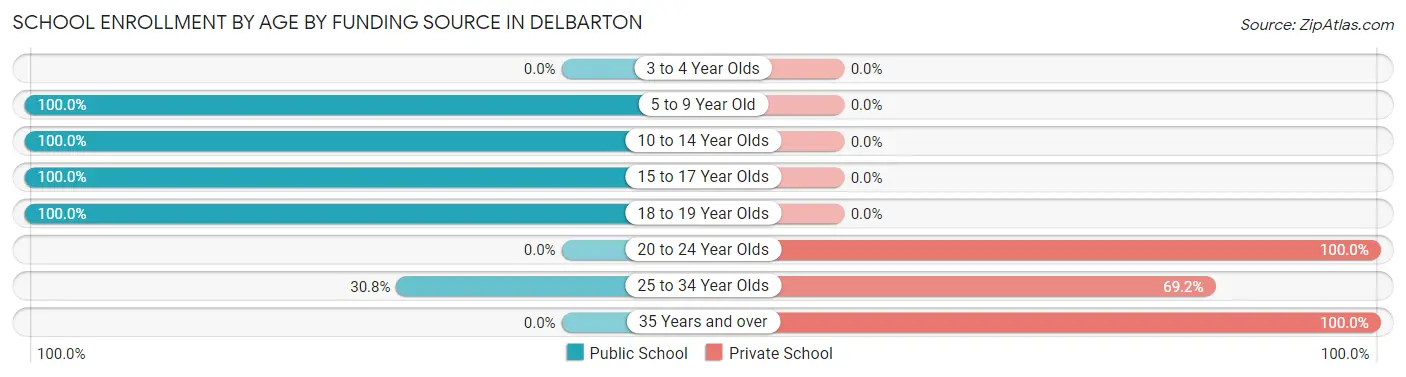
| Age Bracket | Public School | Private School |
| 3 to 4 Year Olds | 0 (0.0%) | 0 (0.0%) |
| 5 to 9 Year Old | 25 (100.0%) | 0 (0.0%) |
| 10 to 14 Year Olds | 37 (100.0%) | 0 (0.0%) |
| 15 to 17 Year Olds | 19 (100.0%) | 0 (0.0%) |
| 18 to 19 Year Olds | 15 (100.0%) | 0 (0.0%) |
| 20 to 24 Year Olds | 0 (0.0%) | 5 (100.0%) |
| 25 to 34 Year Olds | 4 (30.8%) | 9 (69.2%) |
| 35 Years and over | 0 (0.0%) | 13 (100.0%) |
| Total | 100 (78.7%) | 27 (21.3%) |
Educational Attainment by Field of Study in Delbarton
Education (19 | 38.8%), liberal arts & history (13 | 26.5%), literature & languages (9 | 18.4%), science & technology (4 | 8.2%), and business (4 | 8.2%) are the most common fields of study among 49 individuals in Delbarton who have obtained a bachelor's degree or higher.
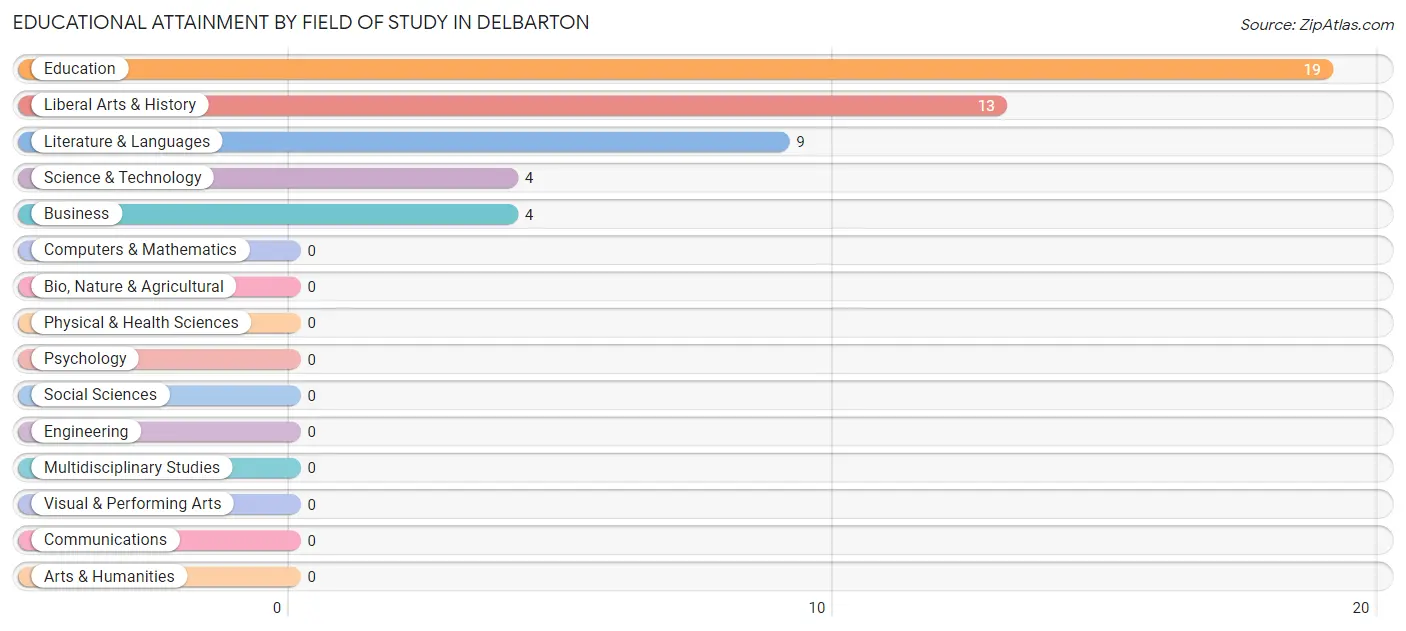
| Field of Study | # Graduates | % Graduates |
| Computers & Mathematics | 0 | 0.0% |
| Bio, Nature & Agricultural | 0 | 0.0% |
| Physical & Health Sciences | 0 | 0.0% |
| Psychology | 0 | 0.0% |
| Social Sciences | 0 | 0.0% |
| Engineering | 0 | 0.0% |
| Multidisciplinary Studies | 0 | 0.0% |
| Science & Technology | 4 | 8.2% |
| Business | 4 | 8.2% |
| Education | 19 | 38.8% |
| Literature & Languages | 9 | 18.4% |
| Liberal Arts & History | 13 | 26.5% |
| Visual & Performing Arts | 0 | 0.0% |
| Communications | 0 | 0.0% |
| Arts & Humanities | 0 | 0.0% |
| Total | 49 | 100.0% |
Transportation & Commute in Delbarton
Vehicle Availability by Sex in Delbarton
The most prevalent vehicle ownership categories in Delbarton are males with 3 vehicles (45, accounting for 44.6%) and females with 3 vehicles (11, making up 93.8%).
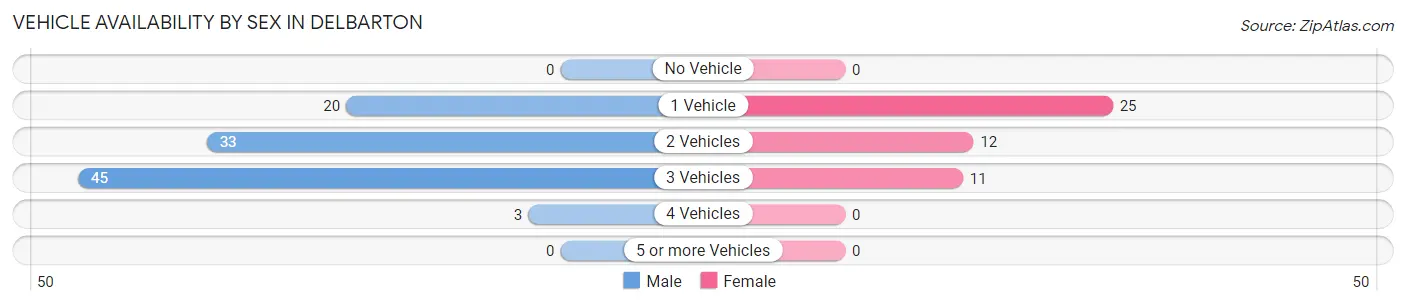
| Vehicles Available | Male | Female |
| No Vehicle | 0 (0.0%) | 0 (0.0%) |
| 1 Vehicle | 20 (19.8%) | 25 (52.1%) |
| 2 Vehicles | 33 (32.7%) | 12 (25.0%) |
| 3 Vehicles | 45 (44.6%) | 11 (22.9%) |
| 4 Vehicles | 3 (3.0%) | 0 (0.0%) |
| 5 or more Vehicles | 0 (0.0%) | 0 (0.0%) |
| Total | 101 (100.0%) | 48 (100.0%) |
Commute Time in Delbarton
The most frequently occuring commute durations in Delbarton are less than 5 minutes (35 commuters, 24.1%), 15 to 19 minutes (25 commuters, 17.2%), and 10 to 14 minutes (24 commuters, 16.6%).
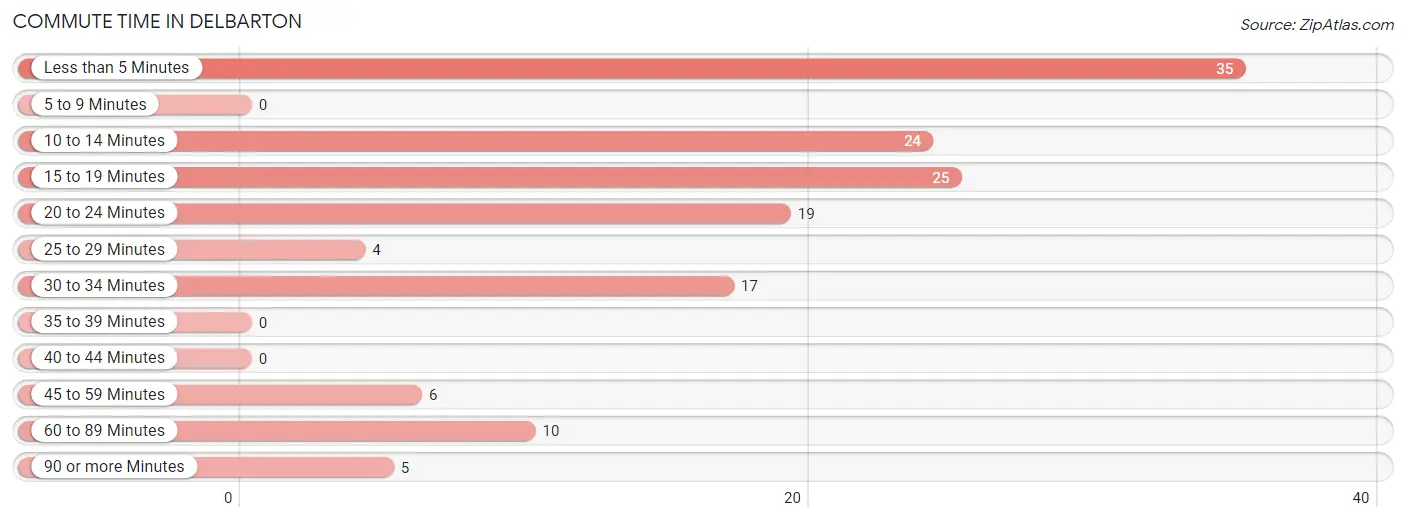
| Commute Time | # Commuters | % Commuters |
| Less than 5 Minutes | 35 | 24.1% |
| 5 to 9 Minutes | 0 | 0.0% |
| 10 to 14 Minutes | 24 | 16.6% |
| 15 to 19 Minutes | 25 | 17.2% |
| 20 to 24 Minutes | 19 | 13.1% |
| 25 to 29 Minutes | 4 | 2.8% |
| 30 to 34 Minutes | 17 | 11.7% |
| 35 to 39 Minutes | 0 | 0.0% |
| 40 to 44 Minutes | 0 | 0.0% |
| 45 to 59 Minutes | 6 | 4.1% |
| 60 to 89 Minutes | 10 | 6.9% |
| 90 or more Minutes | 5 | 3.5% |
Commute Time by Sex in Delbarton
The most common commute times in Delbarton are less than 5 minutes (26 commuters, 25.7%) for males and 10 to 14 minutes (16 commuters, 36.4%) for females.
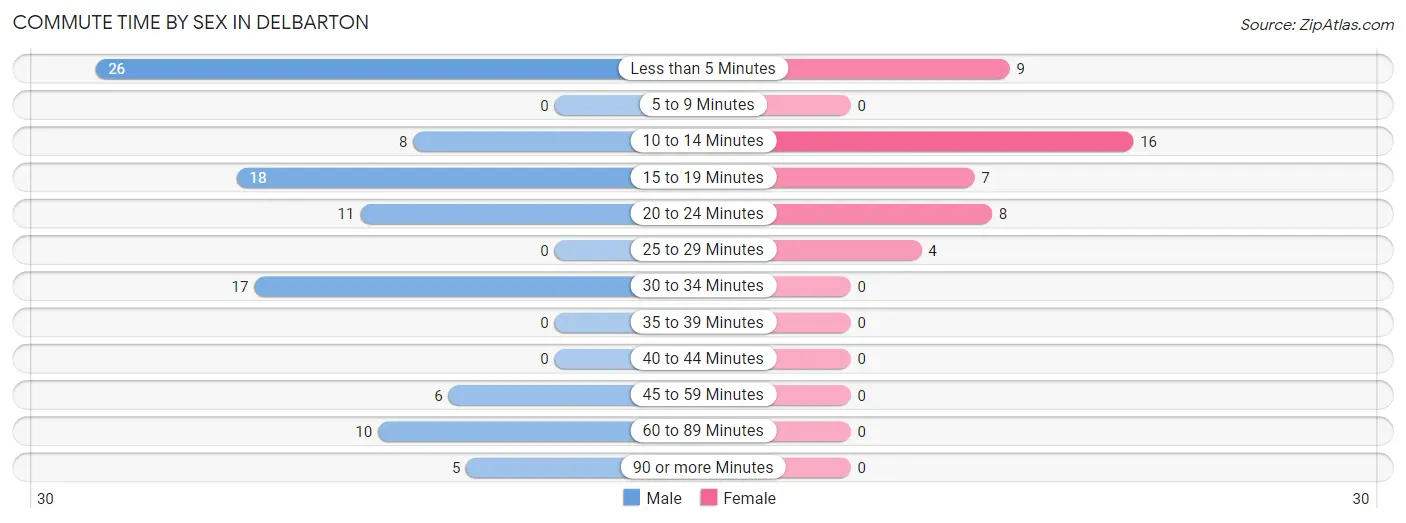
| Commute Time | Male | Female |
| Less than 5 Minutes | 26 (25.7%) | 9 (20.4%) |
| 5 to 9 Minutes | 0 (0.0%) | 0 (0.0%) |
| 10 to 14 Minutes | 8 (7.9%) | 16 (36.4%) |
| 15 to 19 Minutes | 18 (17.8%) | 7 (15.9%) |
| 20 to 24 Minutes | 11 (10.9%) | 8 (18.2%) |
| 25 to 29 Minutes | 0 (0.0%) | 4 (9.1%) |
| 30 to 34 Minutes | 17 (16.8%) | 0 (0.0%) |
| 35 to 39 Minutes | 0 (0.0%) | 0 (0.0%) |
| 40 to 44 Minutes | 0 (0.0%) | 0 (0.0%) |
| 45 to 59 Minutes | 6 (5.9%) | 0 (0.0%) |
| 60 to 89 Minutes | 10 (9.9%) | 0 (0.0%) |
| 90 or more Minutes | 5 (5.0%) | 0 (0.0%) |
Time of Departure to Work by Sex in Delbarton
The most frequent times of departure to work in Delbarton are 6:30 AM to 6:59 AM (18, 17.8%) for males and 8:30 AM to 8:59 AM (13, 29.5%) for females.
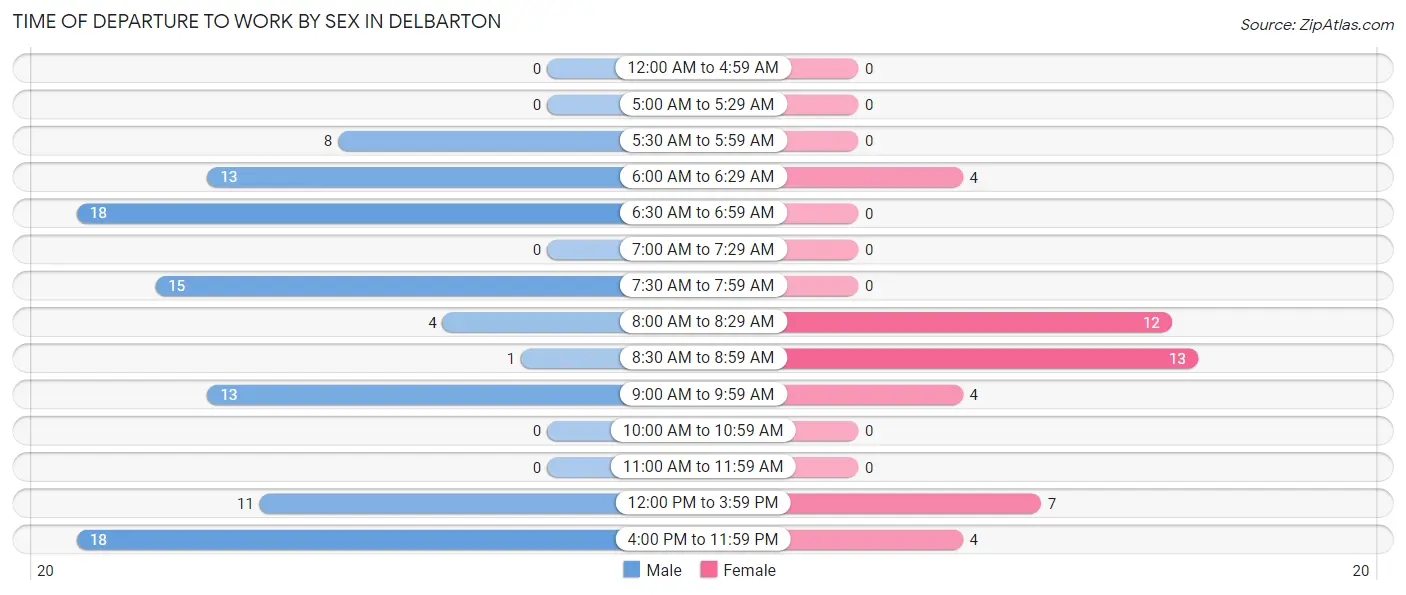
| Time of Departure | Male | Female |
| 12:00 AM to 4:59 AM | 0 (0.0%) | 0 (0.0%) |
| 5:00 AM to 5:29 AM | 0 (0.0%) | 0 (0.0%) |
| 5:30 AM to 5:59 AM | 8 (7.9%) | 0 (0.0%) |
| 6:00 AM to 6:29 AM | 13 (12.9%) | 4 (9.1%) |
| 6:30 AM to 6:59 AM | 18 (17.8%) | 0 (0.0%) |
| 7:00 AM to 7:29 AM | 0 (0.0%) | 0 (0.0%) |
| 7:30 AM to 7:59 AM | 15 (14.8%) | 0 (0.0%) |
| 8:00 AM to 8:29 AM | 4 (4.0%) | 12 (27.3%) |
| 8:30 AM to 8:59 AM | 1 (1.0%) | 13 (29.5%) |
| 9:00 AM to 9:59 AM | 13 (12.9%) | 4 (9.1%) |
| 10:00 AM to 10:59 AM | 0 (0.0%) | 0 (0.0%) |
| 11:00 AM to 11:59 AM | 0 (0.0%) | 0 (0.0%) |
| 12:00 PM to 3:59 PM | 11 (10.9%) | 7 (15.9%) |
| 4:00 PM to 11:59 PM | 18 (17.8%) | 4 (9.1%) |
| Total | 101 (100.0%) | 44 (100.0%) |
Housing Occupancy in Delbarton
Occupancy by Ownership in Delbarton
Of the total 187 dwellings in Delbarton, owner-occupied units account for 169 (90.4%), while renter-occupied units make up 18 (9.6%).
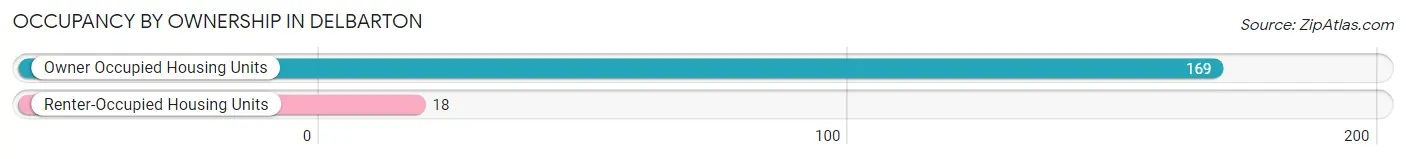
| Occupancy | # Housing Units | % Housing Units |
| Owner Occupied Housing Units | 169 | 90.4% |
| Renter-Occupied Housing Units | 18 | 9.6% |
| Total Occupied Housing Units | 187 | 100.0% |
Occupancy by Household Size in Delbarton
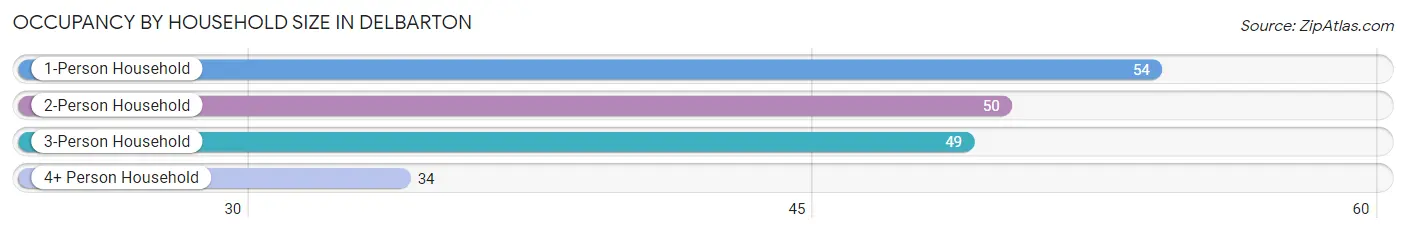
| Household Size | # Housing Units | % Housing Units |
| 1-Person Household | 54 | 28.9% |
| 2-Person Household | 50 | 26.7% |
| 3-Person Household | 49 | 26.2% |
| 4+ Person Household | 34 | 18.2% |
| Total Housing Units | 187 | 100.0% |
Occupancy by Ownership by Household Size in Delbarton
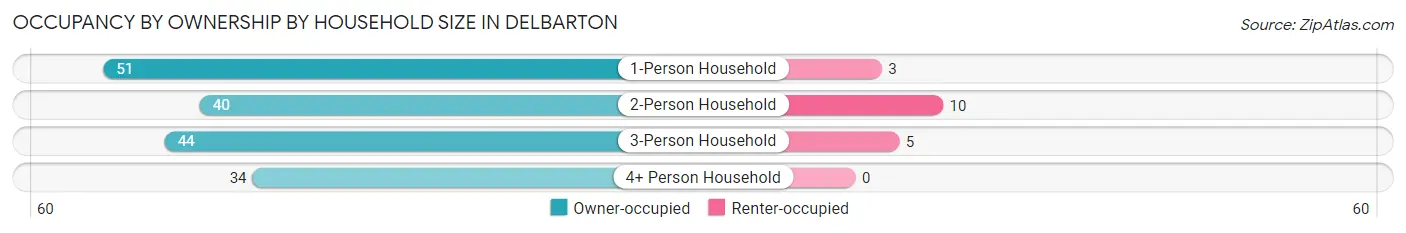
| Household Size | Owner-occupied | Renter-occupied |
| 1-Person Household | 51 (94.4%) | 3 (5.6%) |
| 2-Person Household | 40 (80.0%) | 10 (20.0%) |
| 3-Person Household | 44 (89.8%) | 5 (10.2%) |
| 4+ Person Household | 34 (100.0%) | 0 (0.0%) |
| Total Housing Units | 169 (90.4%) | 18 (9.6%) |
Occupancy by Educational Attainment in Delbarton
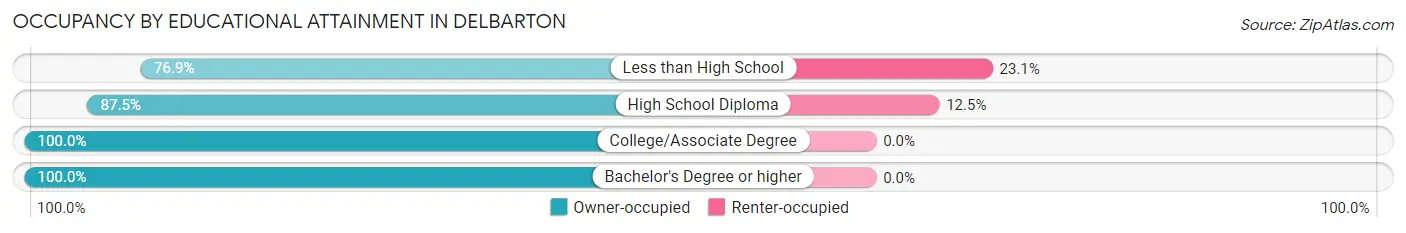
| Household Size | Owner-occupied | Renter-occupied |
| Less than High School | 30 (76.9%) | 9 (23.1%) |
| High School Diploma | 63 (87.5%) | 9 (12.5%) |
| College/Associate Degree | 62 (100.0%) | 0 (0.0%) |
| Bachelor's Degree or higher | 14 (100.0%) | 0 (0.0%) |
Occupancy by Age of Householder in Delbarton
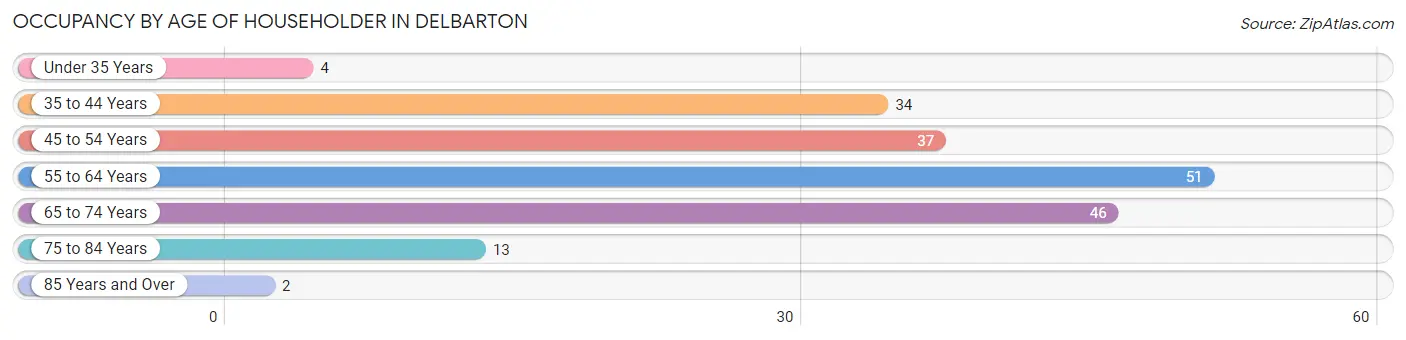
| Age Bracket | # Households | % Households |
| Under 35 Years | 4 | 2.1% |
| 35 to 44 Years | 34 | 18.2% |
| 45 to 54 Years | 37 | 19.8% |
| 55 to 64 Years | 51 | 27.3% |
| 65 to 74 Years | 46 | 24.6% |
| 75 to 84 Years | 13 | 7.0% |
| 85 Years and Over | 2 | 1.1% |
| Total | 187 | 100.0% |
Housing Finances in Delbarton
Median Income by Occupancy in Delbarton
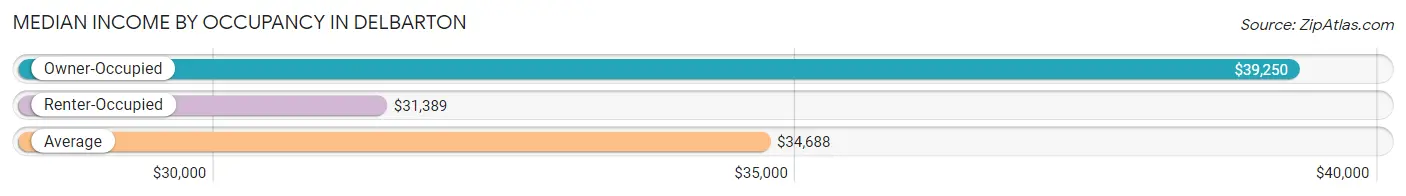
| Occupancy Type | # Households | Median Income |
| Owner-Occupied | 169 (90.4%) | $39,250 |
| Renter-Occupied | 18 (9.6%) | $31,389 |
| Average | 187 (100.0%) | $34,688 |
Occupancy by Householder Income Bracket in Delbarton
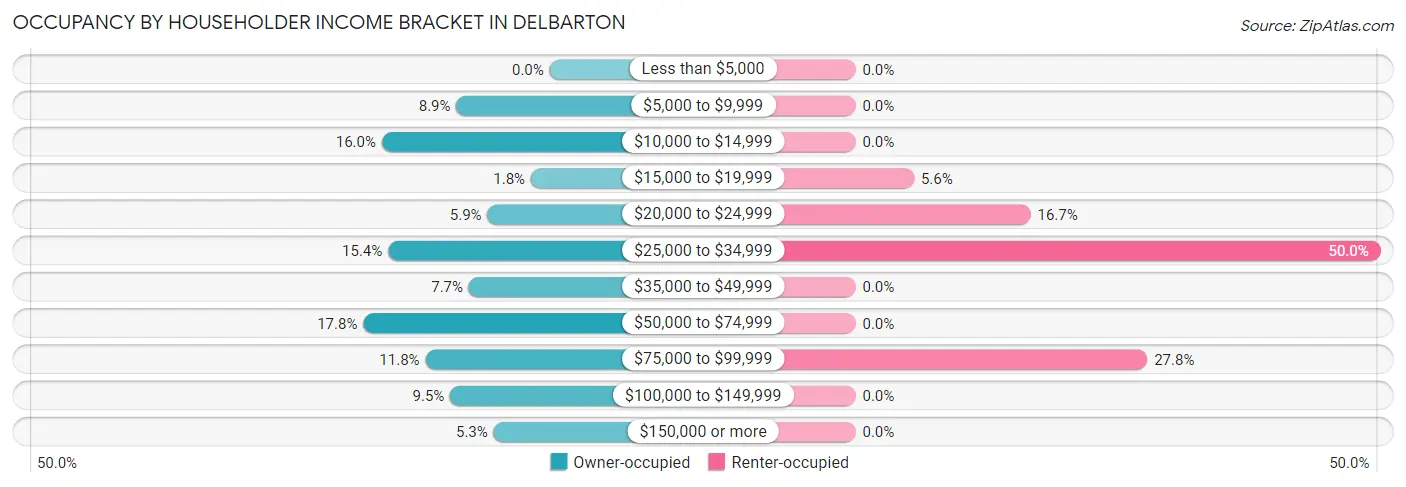
| Income Bracket | Owner-occupied | Renter-occupied |
| Less than $5,000 | 0 (0.0%) | 0 (0.0%) |
| $5,000 to $9,999 | 15 (8.9%) | 0 (0.0%) |
| $10,000 to $14,999 | 27 (16.0%) | 0 (0.0%) |
| $15,000 to $19,999 | 3 (1.8%) | 1 (5.6%) |
| $20,000 to $24,999 | 10 (5.9%) | 3 (16.7%) |
| $25,000 to $34,999 | 26 (15.4%) | 9 (50.0%) |
| $35,000 to $49,999 | 13 (7.7%) | 0 (0.0%) |
| $50,000 to $74,999 | 30 (17.7%) | 0 (0.0%) |
| $75,000 to $99,999 | 20 (11.8%) | 5 (27.8%) |
| $100,000 to $149,999 | 16 (9.5%) | 0 (0.0%) |
| $150,000 or more | 9 (5.3%) | 0 (0.0%) |
| Total | 169 (100.0%) | 18 (100.0%) |
Monthly Housing Cost Tiers in Delbarton
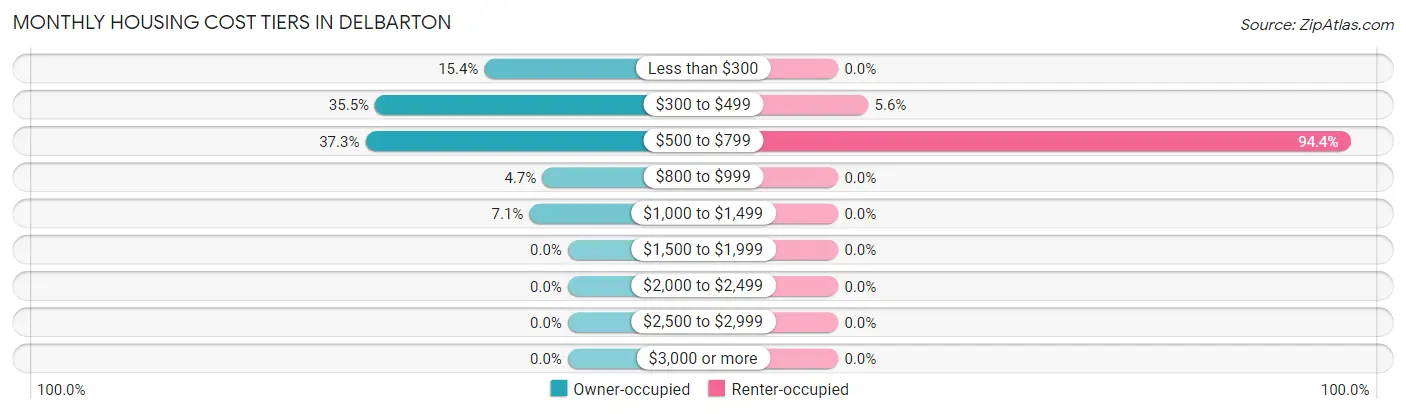
| Monthly Cost | Owner-occupied | Renter-occupied |
| Less than $300 | 26 (15.4%) | 0 (0.0%) |
| $300 to $499 | 60 (35.5%) | 1 (5.6%) |
| $500 to $799 | 63 (37.3%) | 17 (94.4%) |
| $800 to $999 | 8 (4.7%) | 0 (0.0%) |
| $1,000 to $1,499 | 12 (7.1%) | 0 (0.0%) |
| $1,500 to $1,999 | 0 (0.0%) | 0 (0.0%) |
| $2,000 to $2,499 | 0 (0.0%) | 0 (0.0%) |
| $2,500 to $2,999 | 0 (0.0%) | 0 (0.0%) |
| $3,000 or more | 0 (0.0%) | 0 (0.0%) |
| Total | 169 (100.0%) | 18 (100.0%) |
Physical Housing Characteristics in Delbarton
Housing Structures in Delbarton
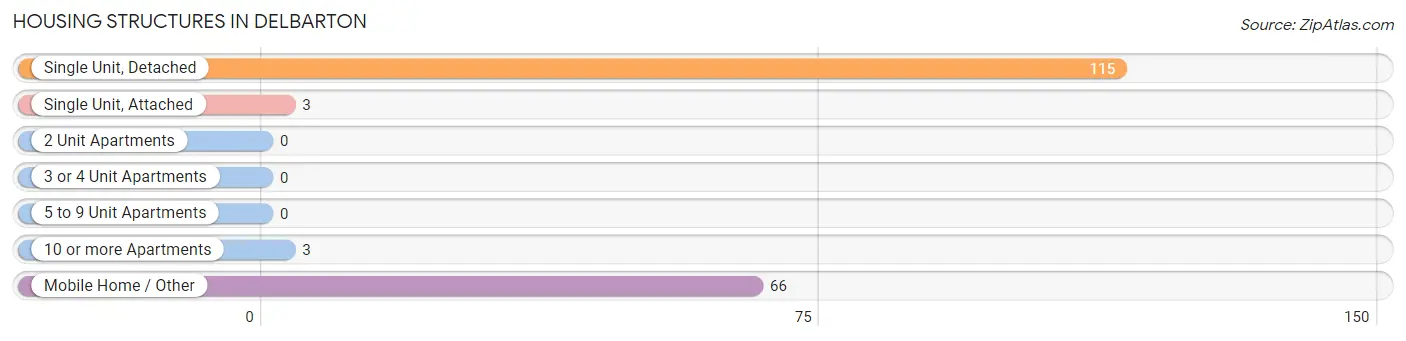
| Structure Type | # Housing Units | % Housing Units |
| Single Unit, Detached | 115 | 61.5% |
| Single Unit, Attached | 3 | 1.6% |
| 2 Unit Apartments | 0 | 0.0% |
| 3 or 4 Unit Apartments | 0 | 0.0% |
| 5 to 9 Unit Apartments | 0 | 0.0% |
| 10 or more Apartments | 3 | 1.6% |
| Mobile Home / Other | 66 | 35.3% |
| Total | 187 | 100.0% |
Housing Structures by Occupancy in Delbarton
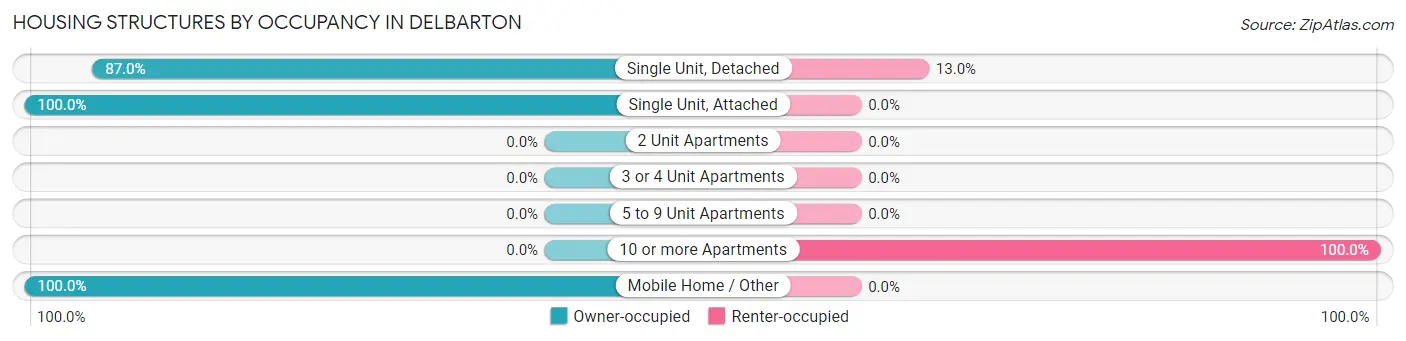
| Structure Type | Owner-occupied | Renter-occupied |
| Single Unit, Detached | 100 (87.0%) | 15 (13.0%) |
| Single Unit, Attached | 3 (100.0%) | 0 (0.0%) |
| 2 Unit Apartments | 0 (0.0%) | 0 (0.0%) |
| 3 or 4 Unit Apartments | 0 (0.0%) | 0 (0.0%) |
| 5 to 9 Unit Apartments | 0 (0.0%) | 0 (0.0%) |
| 10 or more Apartments | 0 (0.0%) | 3 (100.0%) |
| Mobile Home / Other | 66 (100.0%) | 0 (0.0%) |
| Total | 169 (90.4%) | 18 (9.6%) |
Housing Structures by Number of Rooms in Delbarton
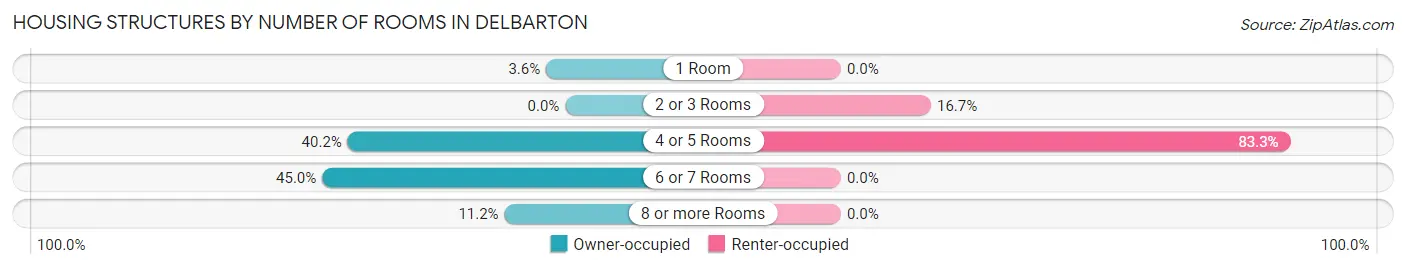
| Number of Rooms | Owner-occupied | Renter-occupied |
| 1 Room | 6 (3.5%) | 0 (0.0%) |
| 2 or 3 Rooms | 0 (0.0%) | 3 (16.7%) |
| 4 or 5 Rooms | 68 (40.2%) | 15 (83.3%) |
| 6 or 7 Rooms | 76 (45.0%) | 0 (0.0%) |
| 8 or more Rooms | 19 (11.2%) | 0 (0.0%) |
| Total | 169 (100.0%) | 18 (100.0%) |
Housing Structure by Heating Type in Delbarton
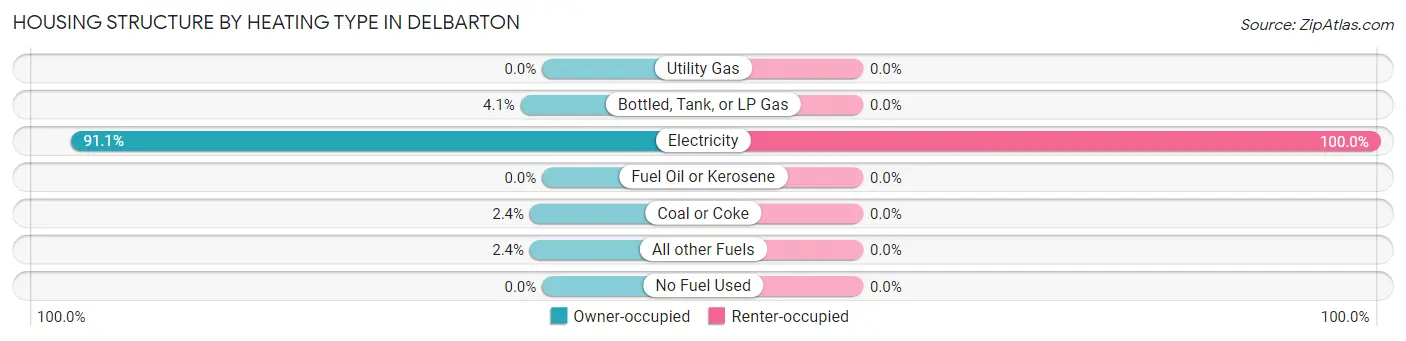
| Heating Type | Owner-occupied | Renter-occupied |
| Utility Gas | 0 (0.0%) | 0 (0.0%) |
| Bottled, Tank, or LP Gas | 7 (4.1%) | 0 (0.0%) |
| Electricity | 154 (91.1%) | 18 (100.0%) |
| Fuel Oil or Kerosene | 0 (0.0%) | 0 (0.0%) |
| Coal or Coke | 4 (2.4%) | 0 (0.0%) |
| All other Fuels | 4 (2.4%) | 0 (0.0%) |
| No Fuel Used | 0 (0.0%) | 0 (0.0%) |
| Total | 169 (100.0%) | 18 (100.0%) |
Household Vehicle Usage in Delbarton
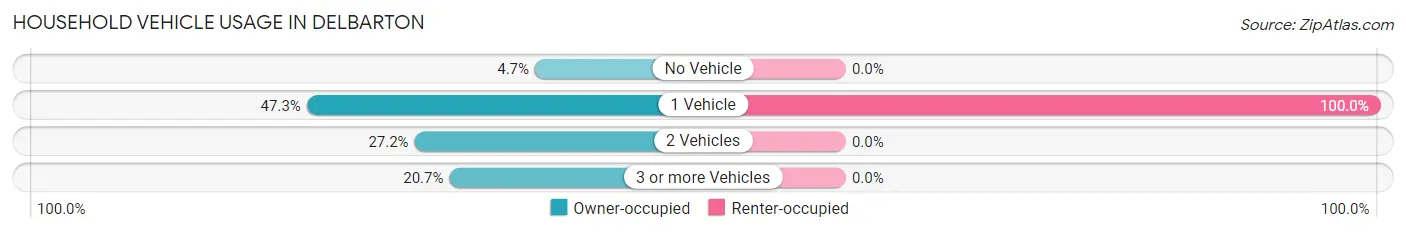
| Vehicles per Household | Owner-occupied | Renter-occupied |
| No Vehicle | 8 (4.7%) | 0 (0.0%) |
| 1 Vehicle | 80 (47.3%) | 18 (100.0%) |
| 2 Vehicles | 46 (27.2%) | 0 (0.0%) |
| 3 or more Vehicles | 35 (20.7%) | 0 (0.0%) |
| Total | 169 (100.0%) | 18 (100.0%) |
Real Estate & Mortgages in Delbarton
Real Estate and Mortgage Overview in Delbarton
| Characteristic | Without Mortgage | With Mortgage |
| Housing Units | 138 | 31 |
| Median Property Value | $79,200 | $0 |
| Median Household Income | $40,000 | $5 |
| Monthly Housing Costs | $461 | $0 |
| Real Estate Taxes | $199 | $17 |
Property Value by Mortgage Status in Delbarton
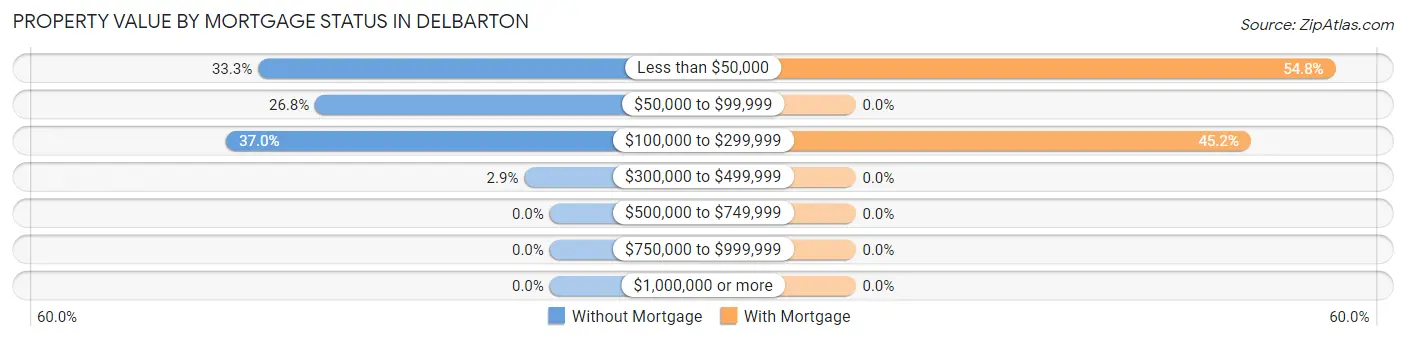
| Property Value | Without Mortgage | With Mortgage |
| Less than $50,000 | 46 (33.3%) | 17 (54.8%) |
| $50,000 to $99,999 | 37 (26.8%) | 0 (0.0%) |
| $100,000 to $299,999 | 51 (37.0%) | 14 (45.2%) |
| $300,000 to $499,999 | 4 (2.9%) | 0 (0.0%) |
| $500,000 to $749,999 | 0 (0.0%) | 0 (0.0%) |
| $750,000 to $999,999 | 0 (0.0%) | 0 (0.0%) |
| $1,000,000 or more | 0 (0.0%) | 0 (0.0%) |
| Total | 138 (100.0%) | 31 (100.0%) |
Household Income by Mortgage Status in Delbarton
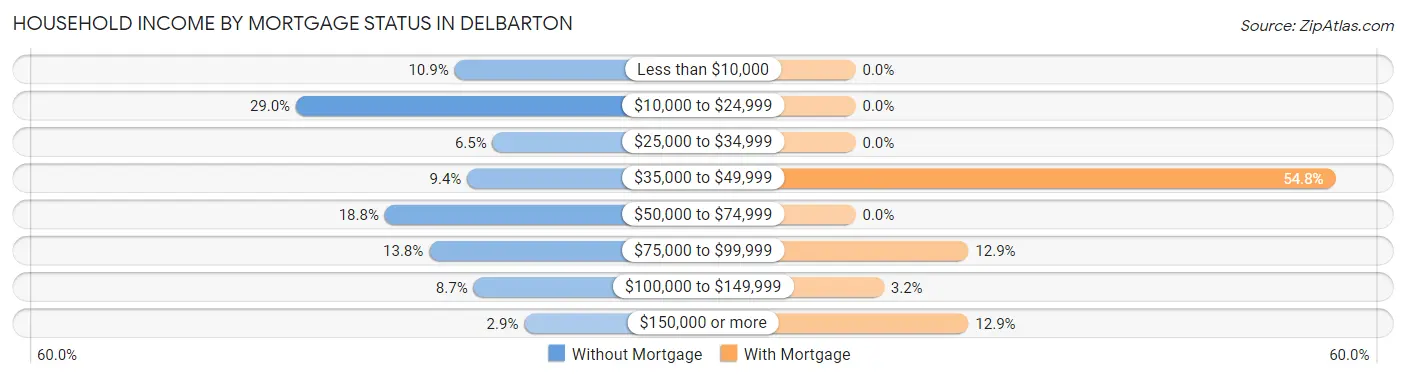
| Household Income | Without Mortgage | With Mortgage |
| Less than $10,000 | 15 (10.9%) | 0 (0.0%) |
| $10,000 to $24,999 | 40 (29.0%) | 0 (0.0%) |
| $25,000 to $34,999 | 9 (6.5%) | 0 (0.0%) |
| $35,000 to $49,999 | 13 (9.4%) | 17 (54.8%) |
| $50,000 to $74,999 | 26 (18.8%) | 0 (0.0%) |
| $75,000 to $99,999 | 19 (13.8%) | 4 (12.9%) |
| $100,000 to $149,999 | 12 (8.7%) | 1 (3.2%) |
| $150,000 or more | 4 (2.9%) | 4 (12.9%) |
| Total | 138 (100.0%) | 31 (100.0%) |
Property Value to Household Income Ratio in Delbarton
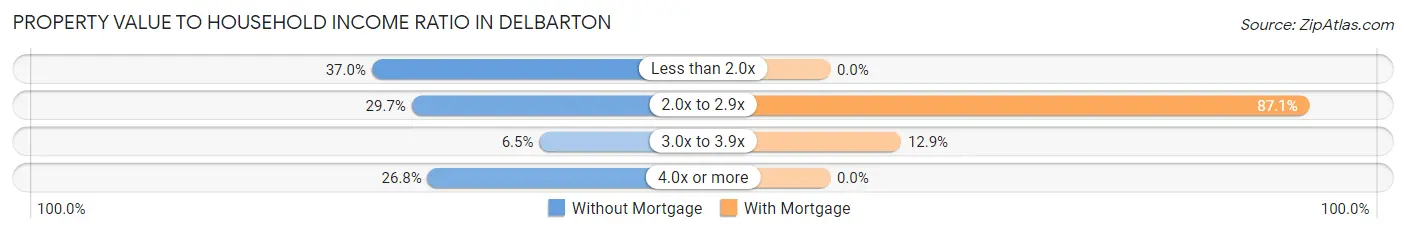
| Value-to-Income Ratio | Without Mortgage | With Mortgage |
| Less than 2.0x | 51 (37.0%) | 0 (0.0%) |
| 2.0x to 2.9x | 41 (29.7%) | 27 (87.1%) |
| 3.0x to 3.9x | 9 (6.5%) | 4 (12.9%) |
| 4.0x or more | 37 (26.8%) | 0 (0.0%) |
| Total | 138 (100.0%) | 31 (100.0%) |
Real Estate Taxes by Mortgage Status in Delbarton
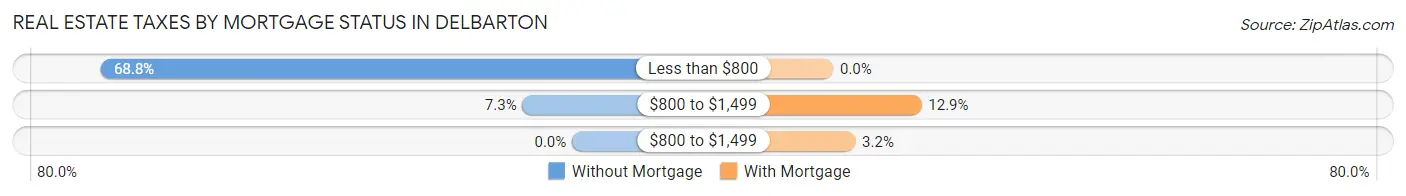
| Property Taxes | Without Mortgage | With Mortgage |
| Less than $800 | 95 (68.8%) | 0 (0.0%) |
| $800 to $1,499 | 10 (7.2%) | 4 (12.9%) |
| $800 to $1,499 | 0 (0.0%) | 1 (3.2%) |
| Total | 138 (100.0%) | 31 (100.0%) |
Health & Disability in Delbarton
Health Insurance Coverage by Age in Delbarton
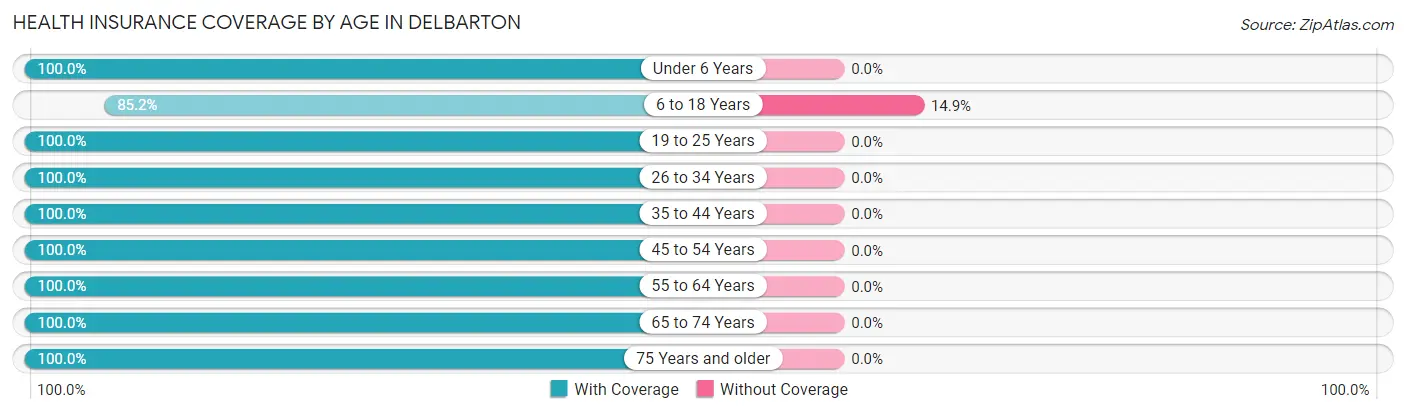
| Age Bracket | With Coverage | Without Coverage |
| Under 6 Years | 11 (100.0%) | 0 (0.0%) |
| 6 to 18 Years | 86 (85.2%) | 15 (14.8%) |
| 19 to 25 Years | 29 (100.0%) | 0 (0.0%) |
| 26 to 34 Years | 66 (100.0%) | 0 (0.0%) |
| 35 to 44 Years | 67 (100.0%) | 0 (0.0%) |
| 45 to 54 Years | 73 (100.0%) | 0 (0.0%) |
| 55 to 64 Years | 65 (100.0%) | 0 (0.0%) |
| 65 to 74 Years | 78 (100.0%) | 0 (0.0%) |
| 75 Years and older | 47 (100.0%) | 0 (0.0%) |
| Total | 522 (97.2%) | 15 (2.8%) |
Health Insurance Coverage by Citizenship Status in Delbarton
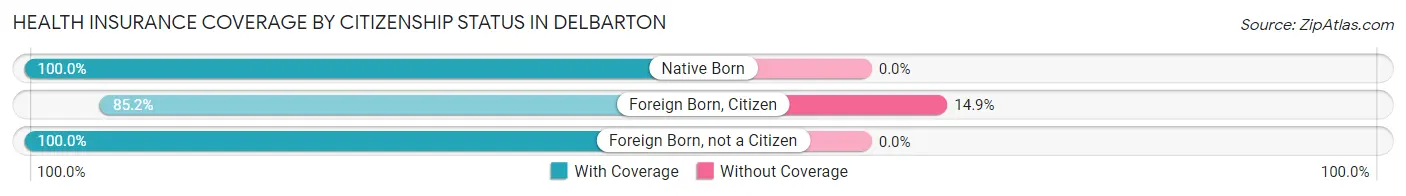
| Citizenship Status | With Coverage | Without Coverage |
| Native Born | 11 (100.0%) | 0 (0.0%) |
| Foreign Born, Citizen | 86 (85.2%) | 15 (14.8%) |
| Foreign Born, not a Citizen | 29 (100.0%) | 0 (0.0%) |
Health Insurance Coverage by Household Income in Delbarton
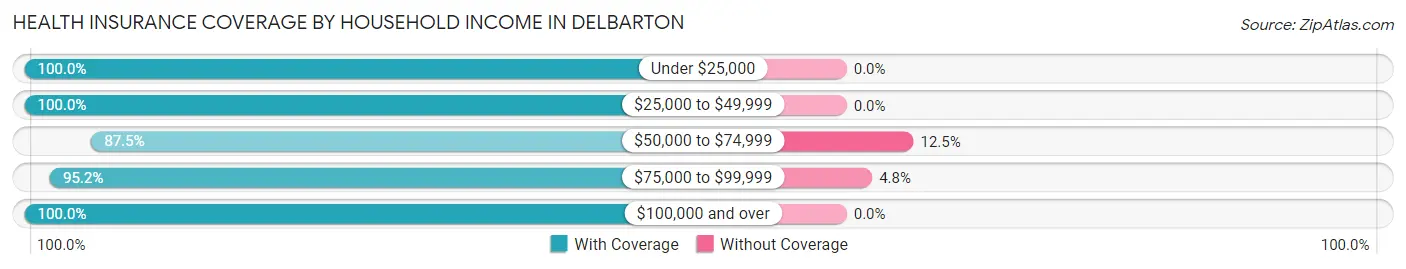
| Household Income | With Coverage | Without Coverage |
| Under $25,000 | 179 (100.0%) | 0 (0.0%) |
| $25,000 to $49,999 | 89 (100.0%) | 0 (0.0%) |
| $50,000 to $74,999 | 70 (87.5%) | 10 (12.5%) |
| $75,000 to $99,999 | 100 (95.2%) | 5 (4.8%) |
| $100,000 and over | 84 (100.0%) | 0 (0.0%) |
Public vs Private Health Insurance Coverage by Age in Delbarton
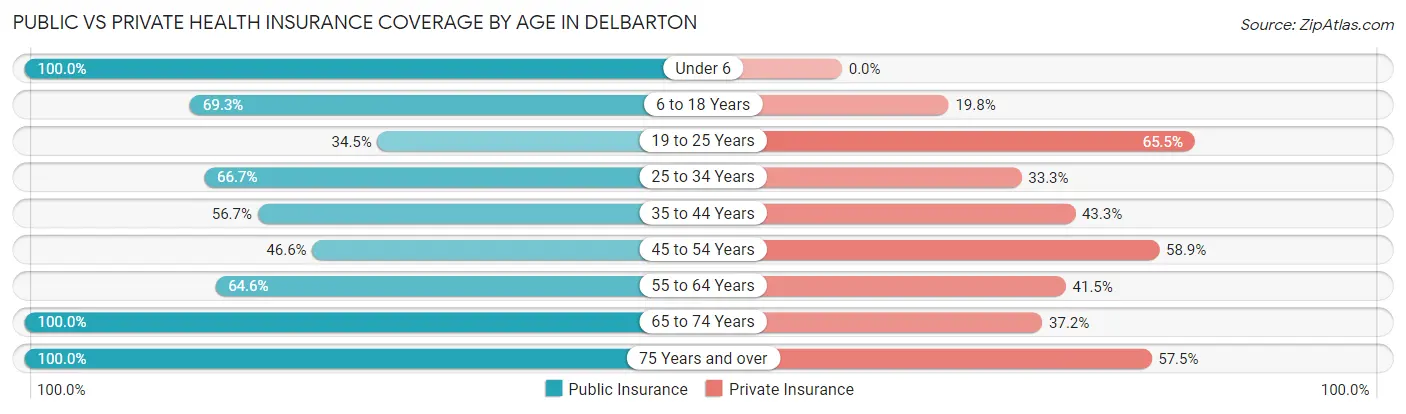
| Age Bracket | Public Insurance | Private Insurance |
| Under 6 | 11 (100.0%) | 0 (0.0%) |
| 6 to 18 Years | 70 (69.3%) | 20 (19.8%) |
| 19 to 25 Years | 10 (34.5%) | 19 (65.5%) |
| 25 to 34 Years | 44 (66.7%) | 22 (33.3%) |
| 35 to 44 Years | 38 (56.7%) | 29 (43.3%) |
| 45 to 54 Years | 34 (46.6%) | 43 (58.9%) |
| 55 to 64 Years | 42 (64.6%) | 27 (41.5%) |
| 65 to 74 Years | 78 (100.0%) | 29 (37.2%) |
| 75 Years and over | 47 (100.0%) | 27 (57.5%) |
| Total | 374 (69.7%) | 216 (40.2%) |
Disability Status by Sex by Age in Delbarton
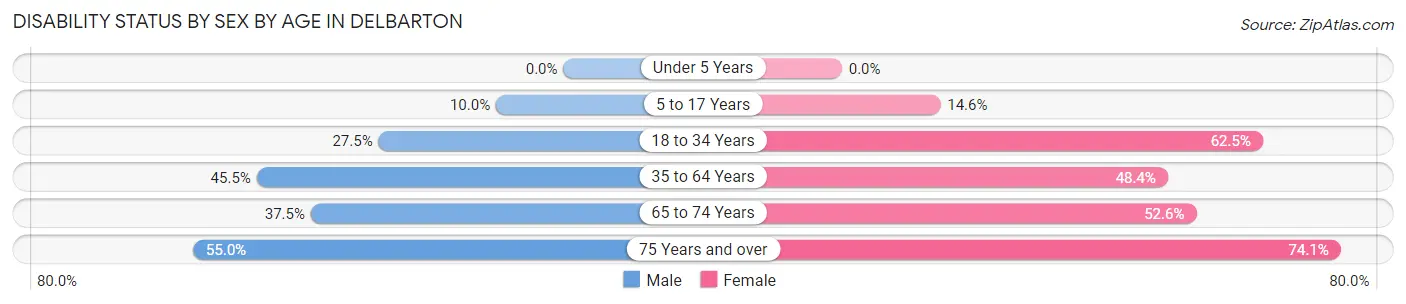
| Age Bracket | Male | Female |
| Under 5 Years | 0 (0.0%) | 0 (0.0%) |
| 5 to 17 Years | 4 (10.0%) | 6 (14.6%) |
| 18 to 34 Years | 14 (27.5%) | 40 (62.5%) |
| 35 to 64 Years | 51 (45.5%) | 45 (48.4%) |
| 65 to 74 Years | 15 (37.5%) | 20 (52.6%) |
| 75 Years and over | 11 (55.0%) | 20 (74.1%) |
Disability Class by Sex by Age in Delbarton
Disability Class: Hearing Difficulty
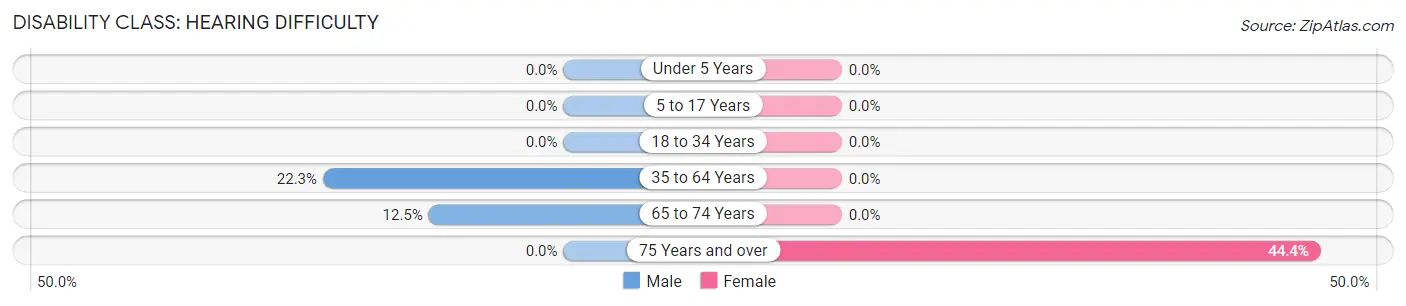
| Age Bracket | Male | Female |
| Under 5 Years | 0 (0.0%) | 0 (0.0%) |
| 5 to 17 Years | 0 (0.0%) | 0 (0.0%) |
| 18 to 34 Years | 0 (0.0%) | 0 (0.0%) |
| 35 to 64 Years | 25 (22.3%) | 0 (0.0%) |
| 65 to 74 Years | 5 (12.5%) | 0 (0.0%) |
| 75 Years and over | 0 (0.0%) | 12 (44.4%) |
Disability Class: Vision Difficulty
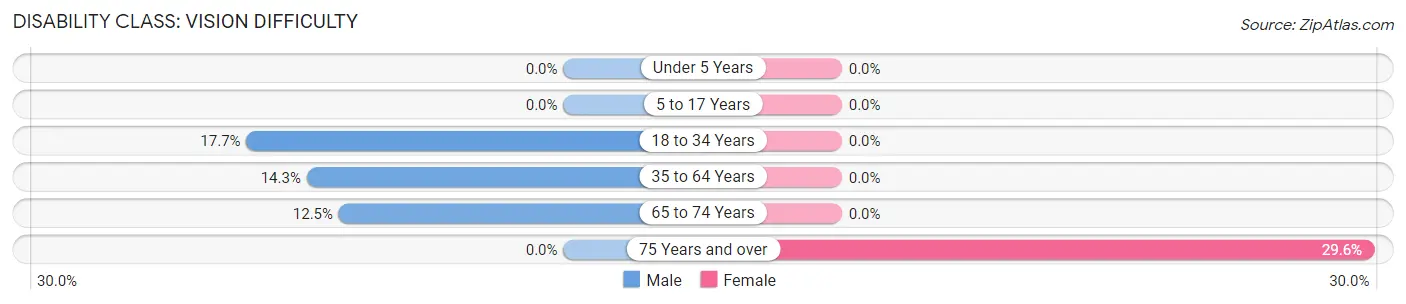
| Age Bracket | Male | Female |
| Under 5 Years | 0 (0.0%) | 0 (0.0%) |
| 5 to 17 Years | 0 (0.0%) | 0 (0.0%) |
| 18 to 34 Years | 9 (17.6%) | 0 (0.0%) |
| 35 to 64 Years | 16 (14.3%) | 0 (0.0%) |
| 65 to 74 Years | 5 (12.5%) | 0 (0.0%) |
| 75 Years and over | 0 (0.0%) | 8 (29.6%) |
Disability Class: Cognitive Difficulty
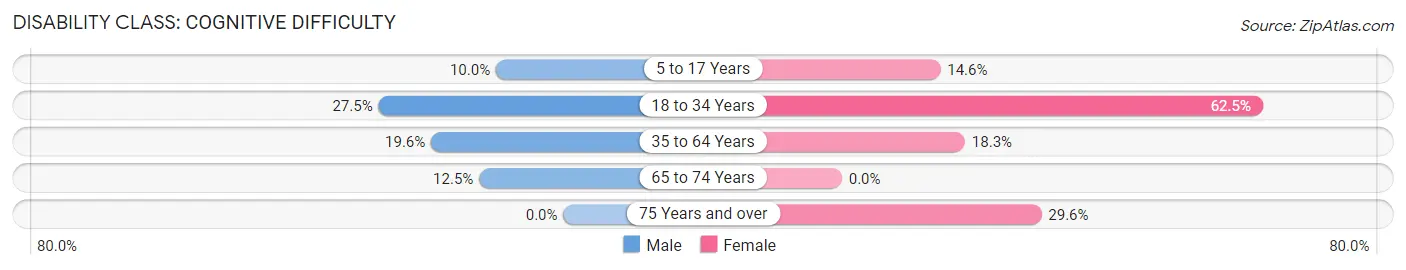
| Age Bracket | Male | Female |
| 5 to 17 Years | 4 (10.0%) | 6 (14.6%) |
| 18 to 34 Years | 14 (27.5%) | 40 (62.5%) |
| 35 to 64 Years | 22 (19.6%) | 17 (18.3%) |
| 65 to 74 Years | 5 (12.5%) | 0 (0.0%) |
| 75 Years and over | 0 (0.0%) | 8 (29.6%) |
Disability Class: Ambulatory Difficulty
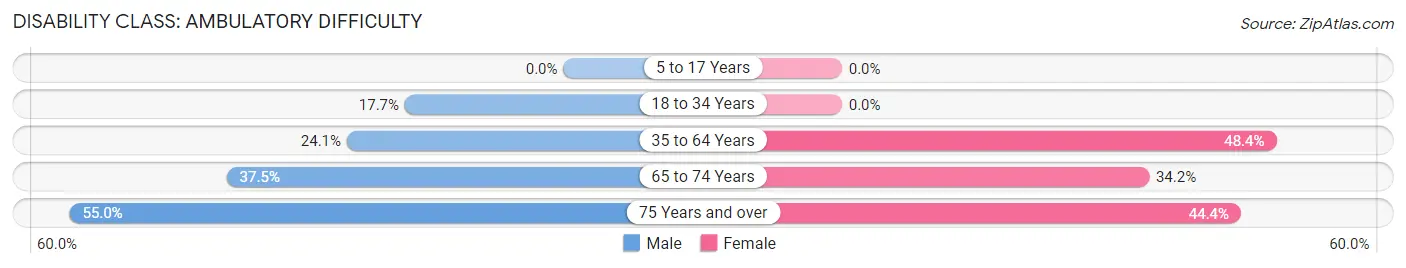
| Age Bracket | Male | Female |
| 5 to 17 Years | 0 (0.0%) | 0 (0.0%) |
| 18 to 34 Years | 9 (17.6%) | 0 (0.0%) |
| 35 to 64 Years | 27 (24.1%) | 45 (48.4%) |
| 65 to 74 Years | 15 (37.5%) | 13 (34.2%) |
| 75 Years and over | 11 (55.0%) | 12 (44.4%) |
Disability Class: Self-Care Difficulty
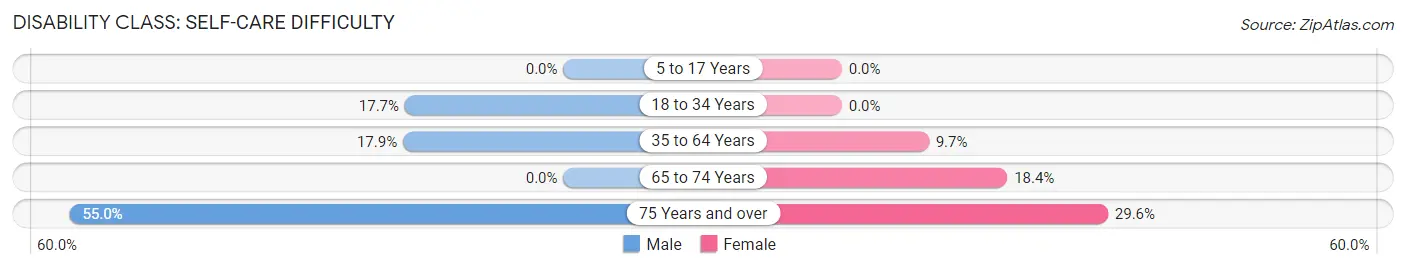
| Age Bracket | Male | Female |
| 5 to 17 Years | 0 (0.0%) | 0 (0.0%) |
| 18 to 34 Years | 9 (17.6%) | 0 (0.0%) |
| 35 to 64 Years | 20 (17.9%) | 9 (9.7%) |
| 65 to 74 Years | 0 (0.0%) | 7 (18.4%) |
| 75 Years and over | 11 (55.0%) | 8 (29.6%) |
Technology Access in Delbarton
Computing Device Access in Delbarton
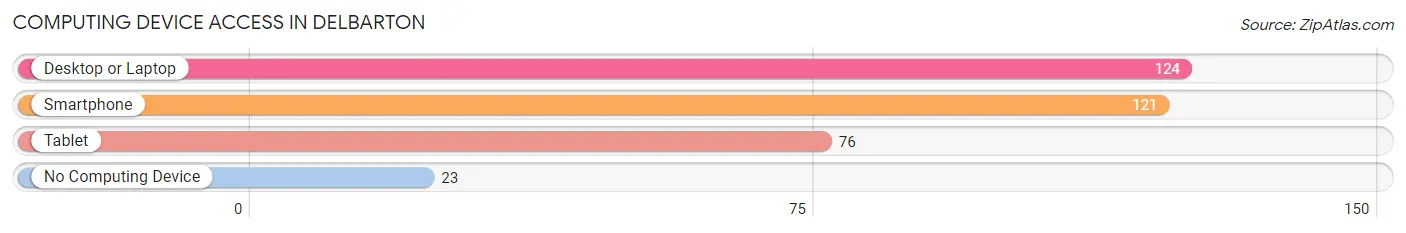
| Device Type | # Households | % Households |
| Desktop or Laptop | 124 | 66.3% |
| Smartphone | 121 | 64.7% |
| Tablet | 76 | 40.6% |
| No Computing Device | 23 | 12.3% |
| Total | 187 | 100.0% |
Internet Access in Delbarton
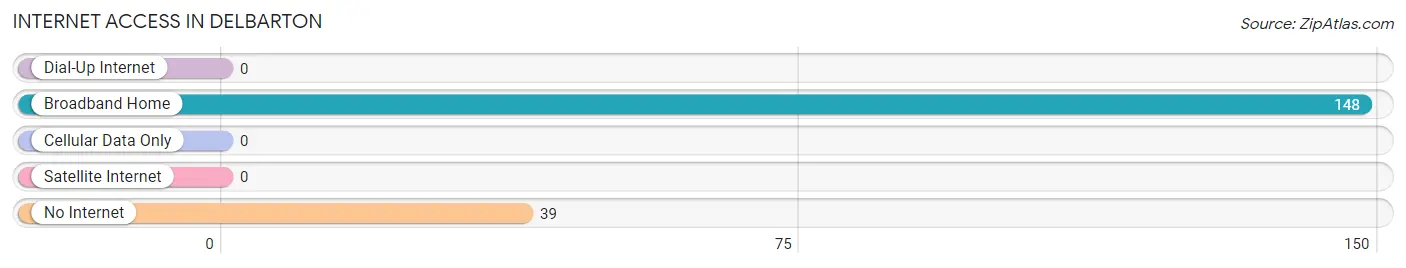
| Internet Type | # Households | % Households |
| Dial-Up Internet | 0 | 0.0% |
| Broadband Home | 148 | 79.1% |
| Cellular Data Only | 0 | 0.0% |
| Satellite Internet | 0 | 0.0% |
| No Internet | 39 | 20.9% |
| Total | 187 | 100.0% |
Delbarton Summary
Delbarton is a small town located in Mingo County, West Virginia. It is situated in the Appalachian Mountains and is part of the Hatfield-McCoy Trail System. The town was founded in the early 1900s and has a population of approximately 1,000 people.
Geography
Delbarton is located in the Appalachian Mountains of West Virginia. It is situated in the Tug Fork Valley, which is part of the Big Sandy River watershed. The town is located at an elevation of 1,400 feet and is surrounded by mountains and hills. The town is located near the Kentucky border and is approximately 30 miles from the city of Williamson.
The climate in Delbarton is humid subtropical, with hot summers and cold winters. The average annual temperature is around 57 degrees Fahrenheit. The average annual precipitation is around 45 inches.
Economy
The economy of Delbarton is largely based on coal mining and timber harvesting. The town is home to several coal mines, including the Delbarton Mine, which is owned by the United States Steel Corporation. The town also has several timber companies, including the Delbarton Lumber Company.
The town also has several small businesses, including restaurants, convenience stores, and a few retail stores. The town also has a few small manufacturing companies, including a furniture factory and a clothing factory.
Demographics
As of the 2010 census, the population of Delbarton was 1,000 people. The racial makeup of the town was 97.2% White, 0.7% African American, 0.3% Native American, 0.2% Asian, and 1.6% from other races. The median household income was $25,000, and the median family income was $30,000.
The town is home to several churches, including the Delbarton United Methodist Church, the Delbarton Baptist Church, and the Delbarton Presbyterian Church. The town also has a public library and a post office.
Conclusion
Delbarton is a small town located in the Appalachian Mountains of West Virginia. The town has a population of approximately 1,000 people and is largely based on coal mining and timber harvesting. The town has a humid subtropical climate and is home to several churches, a public library, and a post office. The median household income is $25,000 and the median family income is $30,000.
Common Questions
What is Per Capita Income in Delbarton?
Per Capita income in Delbarton is $20,896.
What is the Median Family Income in Delbarton?
Median Family Income in Delbarton is $58,854.
What is the Median Household income in Delbarton?
Median Household Income in Delbarton is $34,688.
What is Inequality or Gini Index in Delbarton?
Inequality or Gini Index in Delbarton is 0.44.
What is the Total Population of Delbarton?
Total Population of Delbarton is 537.
What is the Total Male Population of Delbarton?
Total Male Population of Delbarton is 274.
What is the Total Female Population of Delbarton?
Total Female Population of Delbarton is 263.
What is the Ratio of Males per 100 Females in Delbarton?
There are 104.18 Males per 100 Females in Delbarton.
What is the Ratio of Females per 100 Males in Delbarton?
There are 95.99 Females per 100 Males in Delbarton.
What is the Median Population Age in Delbarton?
Median Population Age in Delbarton is 44.6 Years.
What is the Average Family Size in Delbarton
Average Family Size in Delbarton is 3.7 People.
What is the Average Household Size in Delbarton
Average Household Size in Delbarton is 2.9 People.
How Large is the Labor Force in Delbarton?
There are 185 People in the Labor Forcein in Delbarton.
What is the Percentage of People in the Labor Force in Delbarton?
41.1% of People are in the Labor Force in Delbarton.
What is the Unemployment Rate in Delbarton?
Unemployment Rate in Delbarton is 19.5%.