Cowen, WV Map & Demographics
Cowen Map
Cowen Overview
$16,398
PER CAPITA INCOME
$29,250
AVG FAMILY INCOME
$35,272
AVG HOUSEHOLD INCOME
0.37
INEQUALITY / GINI INDEX
589
TOTAL POPULATION
259
MALE POPULATION
330
FEMALE POPULATION
78.48
MALES / 100 FEMALES
127.41
FEMALES / 100 MALES
40.4
MEDIAN AGE
3.4
AVG FAMILY SIZE
2.9
AVG HOUSEHOLD SIZE
163
LABOR FORCE [ PEOPLE ]
30.8%
PERCENT IN LABOR FORCE
31.9%
UNEMPLOYMENT RATE
Cowen Zip Codes
Income in Cowen
Income Overview in Cowen
Per Capita Income in Cowen is $16,398, while median incomes of families and households are $29,250 and $35,272 respectively.
| Characteristic | Number | Measure |
| Per Capita Income | 589 | $16,398 |
| Median Family Income | 125 | $29,250 |
| Mean Family Income | 125 | $44,698 |
| Median Household Income | 203 | $35,272 |
| Mean Household Income | 203 | $40,312 |
| Income Deficit | 125 | $0 |
| Wage / Income Gap (%) | 589 | 0.00% |
| Wage / Income Gap ($) | 589 | 100.00¢ per $1 |
| Gini / Inequality Index | 589 | 0.37 |
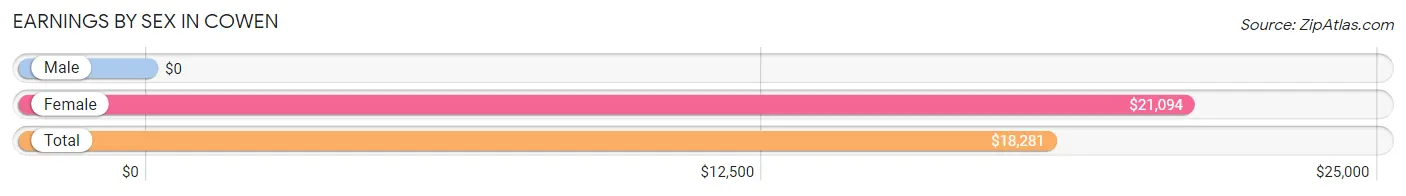
Earnings by Sex in Cowen
| Sex | Number | Average Earnings |
| Male | 112 (63.6%) | $0 |
| Female | 64 (36.4%) | $21,094 |
| Total | 176 (100.0%) | $18,281 |
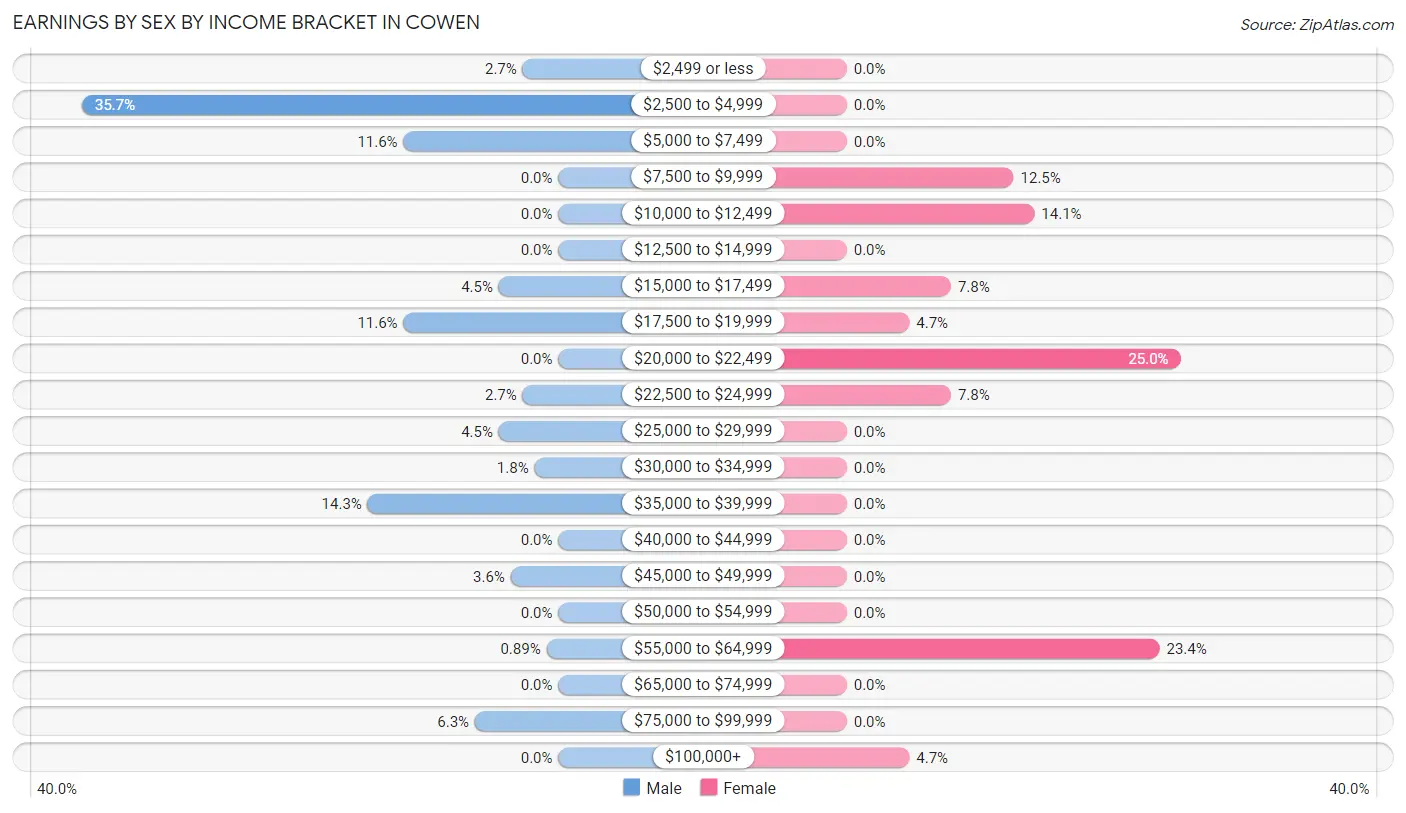
Earnings by Sex by Income Bracket in Cowen
The most common earnings brackets in Cowen are $2,500 to $4,999 for men (40 | 35.7%) and $20,000 to $22,499 for women (16 | 25.0%).
| Income | Male | Female |
| $2,499 or less | 3 (2.7%) | 0 (0.0%) |
| $2,500 to $4,999 | 40 (35.7%) | 0 (0.0%) |
| $5,000 to $7,499 | 13 (11.6%) | 0 (0.0%) |
| $7,500 to $9,999 | 0 (0.0%) | 8 (12.5%) |
| $10,000 to $12,499 | 0 (0.0%) | 9 (14.1%) |
| $12,500 to $14,999 | 0 (0.0%) | 0 (0.0%) |
| $15,000 to $17,499 | 5 (4.5%) | 5 (7.8%) |
| $17,500 to $19,999 | 13 (11.6%) | 3 (4.7%) |
| $20,000 to $22,499 | 0 (0.0%) | 16 (25.0%) |
| $22,500 to $24,999 | 3 (2.7%) | 5 (7.8%) |
| $25,000 to $29,999 | 5 (4.5%) | 0 (0.0%) |
| $30,000 to $34,999 | 2 (1.8%) | 0 (0.0%) |
| $35,000 to $39,999 | 16 (14.3%) | 0 (0.0%) |
| $40,000 to $44,999 | 0 (0.0%) | 0 (0.0%) |
| $45,000 to $49,999 | 4 (3.6%) | 0 (0.0%) |
| $50,000 to $54,999 | 0 (0.0%) | 0 (0.0%) |
| $55,000 to $64,999 | 1 (0.9%) | 15 (23.4%) |
| $65,000 to $74,999 | 0 (0.0%) | 0 (0.0%) |
| $75,000 to $99,999 | 7 (6.2%) | 0 (0.0%) |
| $100,000+ | 0 (0.0%) | 3 (4.7%) |
| Total | 112 (100.0%) | 64 (100.0%) |
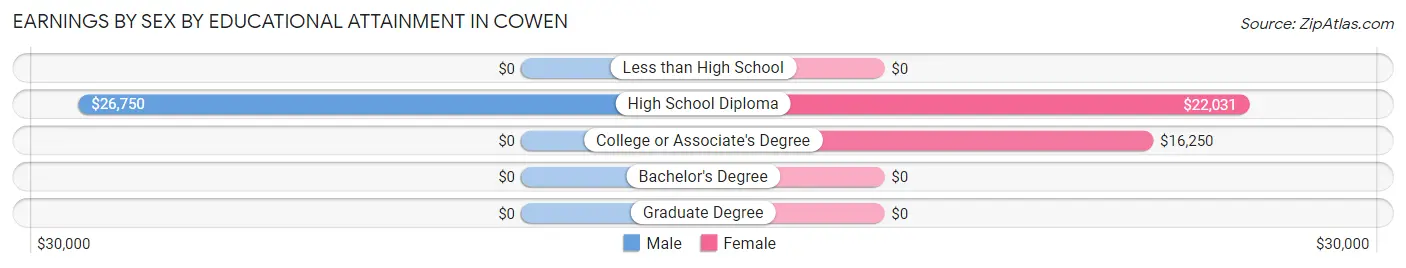
Earnings by Sex by Educational Attainment in Cowen
| Educational Attainment | Male Income | Female Income |
| Less than High School | - | - |
| High School Diploma | $26,750 | $22,031 |
| College or Associate's Degree | - | - |
| Bachelor's Degree | - | - |
| Graduate Degree | - | - |
| Total | - | - |
Family Income in Cowen
Family Income Brackets in Cowen
According to the Cowen family income data, there are 36 families falling into the $15,000 to $24,999 income range, which is the most common income bracket and makes up 28.8% of all families.
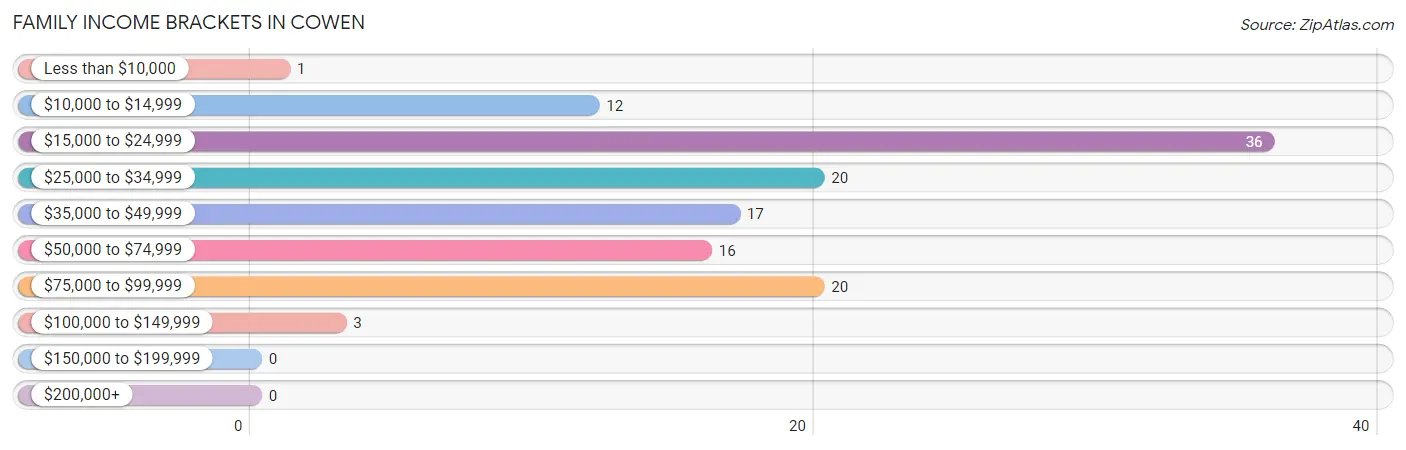
| Income Bracket | # Families | % Families |
| Less than $10,000 | 1 | 0.8% |
| $10,000 to $14,999 | 12 | 9.6% |
| $15,000 to $24,999 | 36 | 28.8% |
| $25,000 to $34,999 | 20 | 16.0% |
| $35,000 to $49,999 | 17 | 13.6% |
| $50,000 to $74,999 | 16 | 12.8% |
| $75,000 to $99,999 | 20 | 16.0% |
| $100,000 to $149,999 | 3 | 2.4% |
| $150,000 to $199,999 | 0 | 0.0% |
| $200,000+ | 0 | 0.0% |
Family Income by Famaliy Size in Cowen
2-person families (72 | 57.6%) account for the highest median family income in Cowen with $28,500 per family, while 2-person families (72 | 57.6%) have the highest median income of $14,250 per family member.
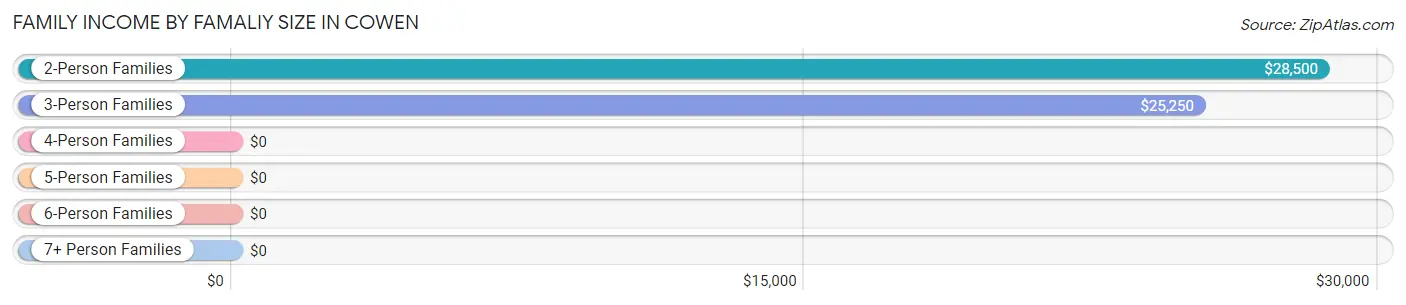
| Income Bracket | # Families | Median Income |
| 2-Person Families | 72 (57.6%) | $28,500 |
| 3-Person Families | 41 (32.8%) | $25,250 |
| 4-Person Families | 5 (4.0%) | $0 |
| 5-Person Families | 7 (5.6%) | $0 |
| 6-Person Families | 0 (0.0%) | $0 |
| 7+ Person Families | 0 (0.0%) | $0 |
| Total | 125 (100.0%) | $29,250 |
Family Income by Number of Earners in Cowen
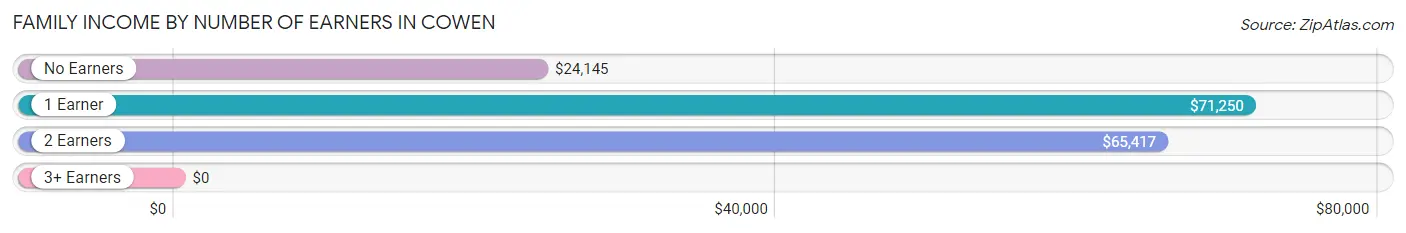
| Number of Earners | # Families | Median Income |
| No Earners | 65 (52.0%) | $24,145 |
| 1 Earner | 40 (32.0%) | $71,250 |
| 2 Earners | 15 (12.0%) | $65,417 |
| 3+ Earners | 5 (4.0%) | $0 |
| Total | 125 (100.0%) | $29,250 |
Household Income in Cowen
Household Income Brackets in Cowen
With 62 households falling in the category, the $35,000 to $49,999 income range is the most frequent in Cowen, accounting for 30.5% of all households.
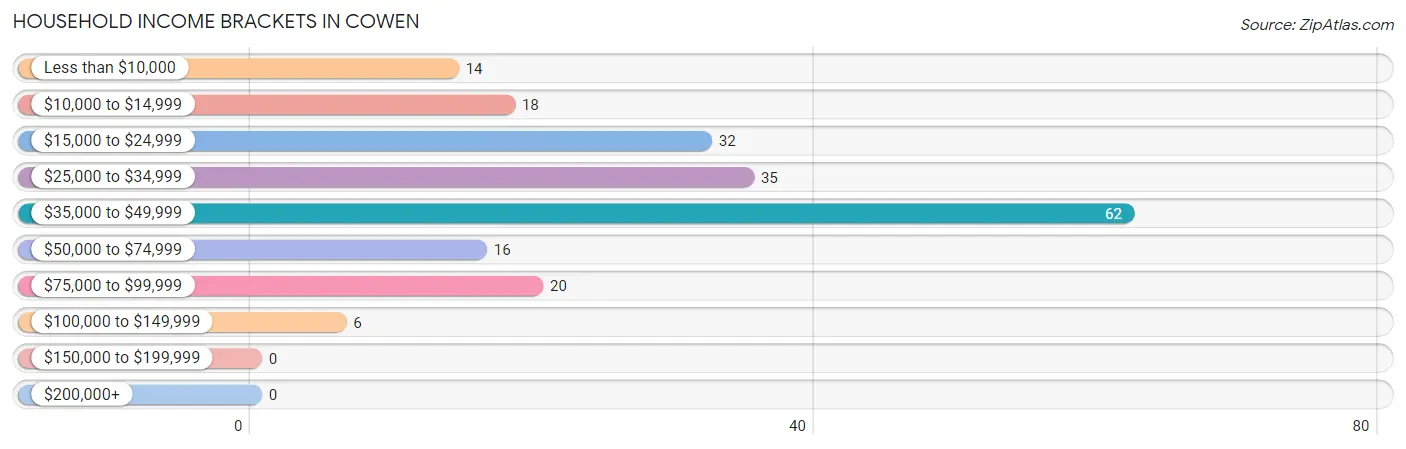
| Income Bracket | # Households | % Households |
| Less than $10,000 | 14 | 6.9% |
| $10,000 to $14,999 | 18 | 8.9% |
| $15,000 to $24,999 | 32 | 15.8% |
| $25,000 to $34,999 | 35 | 17.2% |
| $35,000 to $49,999 | 62 | 30.5% |
| $50,000 to $74,999 | 16 | 7.9% |
| $75,000 to $99,999 | 20 | 9.9% |
| $100,000 to $149,999 | 6 | 3.0% |
| $150,000 to $199,999 | 0 | 0.0% |
| $200,000+ | 0 | 0.0% |
Household Income by Householder Age in Cowen
The median household income in Cowen is $35,272, with the highest median household income of $36,563 found in the 65+ years age bracket for the primary householder. A total of 89 households (43.8%) fall into this category. Meanwhile, the 15 to 24 years age bracket for the primary householder has the lowest median household income of $0, with 6 households (3.0%) in this group.
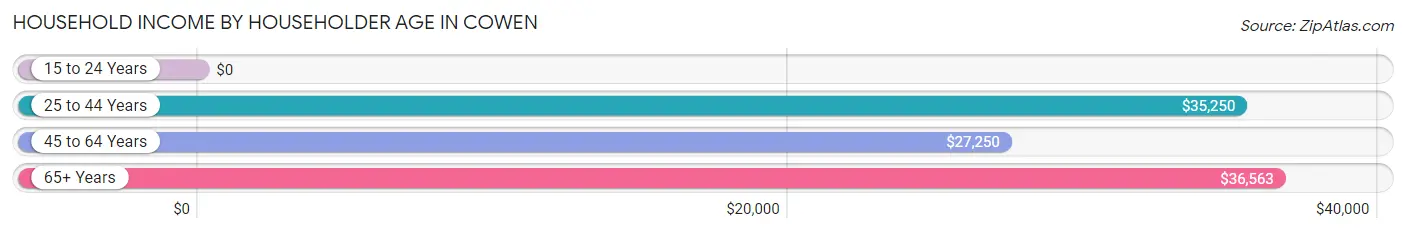
| Income Bracket | # Households | Median Income |
| 15 to 24 Years | 6 (3.0%) | $0 |
| 25 to 44 Years | 31 (15.3%) | $35,250 |
| 45 to 64 Years | 77 (37.9%) | $27,250 |
| 65+ Years | 89 (43.8%) | $36,563 |
| Total | 203 (100.0%) | $35,272 |
Poverty in Cowen
Income Below Poverty by Sex and Age in Cowen
With 26.3% poverty level for males and 25.1% for females among the residents of Cowen, 12 to 14 year old males and 15 year old females are the most vulnerable to poverty, with 3 males (100.0%) and 3 females (100.0%) in their respective age groups living below the poverty level.
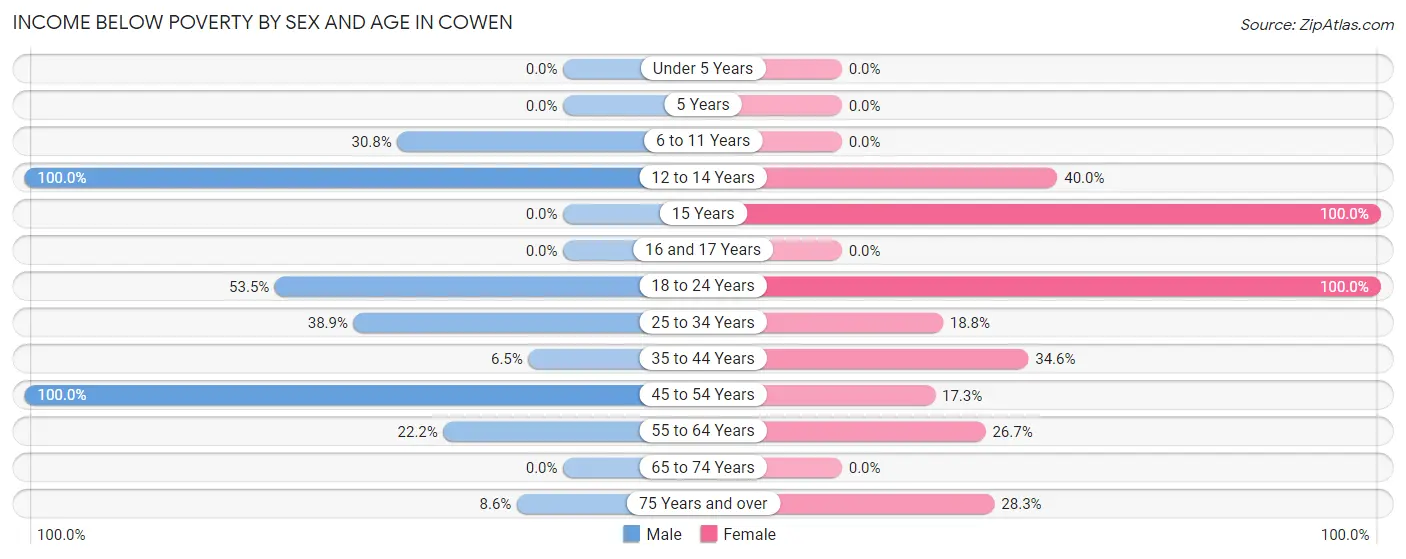
| Age Bracket | Male | Female |
| Under 5 Years | 0 (0.0%) | 0 (0.0%) |
| 5 Years | 0 (0.0%) | 0 (0.0%) |
| 6 to 11 Years | 4 (30.8%) | 0 (0.0%) |
| 12 to 14 Years | 3 (100.0%) | 2 (40.0%) |
| 15 Years | 0 (0.0%) | 3 (100.0%) |
| 16 and 17 Years | 0 (0.0%) | 0 (0.0%) |
| 18 to 24 Years | 23 (53.5%) | 24 (100.0%) |
| 25 to 34 Years | 14 (38.9%) | 9 (18.8%) |
| 35 to 44 Years | 4 (6.5%) | 9 (34.6%) |
| 45 to 54 Years | 11 (100.0%) | 9 (17.3%) |
| 55 to 64 Years | 6 (22.2%) | 8 (26.7%) |
| 65 to 74 Years | 0 (0.0%) | 0 (0.0%) |
| 75 Years and over | 3 (8.6%) | 17 (28.3%) |
| Total | 68 (26.3%) | 81 (25.1%) |
Income Above Poverty by Sex and Age in Cowen
According to the poverty statistics in Cowen, males aged 16 and 17 years and females aged under 5 years are the age groups that are most secure financially, with 100.0% of males and 100.0% of females in these age groups living above the poverty line.
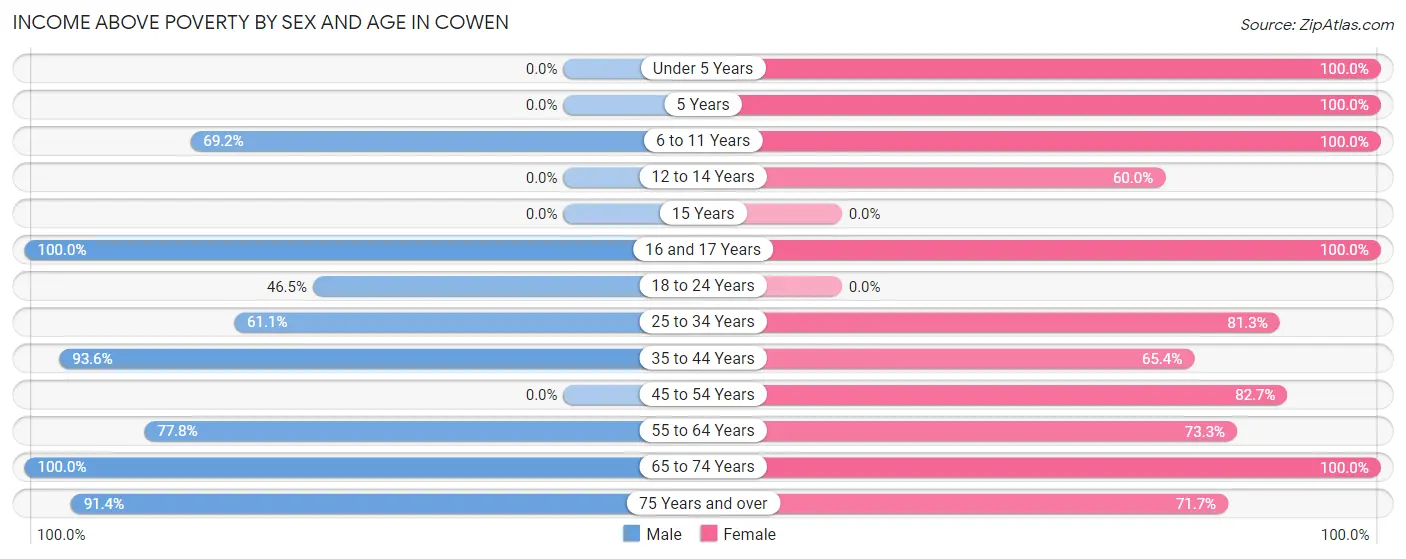
| Age Bracket | Male | Female |
| Under 5 Years | 0 (0.0%) | 11 (100.0%) |
| 5 Years | 0 (0.0%) | 7 (100.0%) |
| 6 to 11 Years | 9 (69.2%) | 10 (100.0%) |
| 12 to 14 Years | 0 (0.0%) | 3 (60.0%) |
| 15 Years | 0 (0.0%) | 0 (0.0%) |
| 16 and 17 Years | 4 (100.0%) | 10 (100.0%) |
| 18 to 24 Years | 20 (46.5%) | 0 (0.0%) |
| 25 to 34 Years | 22 (61.1%) | 39 (81.2%) |
| 35 to 44 Years | 58 (93.5%) | 17 (65.4%) |
| 45 to 54 Years | 0 (0.0%) | 43 (82.7%) |
| 55 to 64 Years | 21 (77.8%) | 22 (73.3%) |
| 65 to 74 Years | 25 (100.0%) | 37 (100.0%) |
| 75 Years and over | 32 (91.4%) | 43 (71.7%) |
| Total | 191 (73.8%) | 242 (74.9%) |
Income Below Poverty Among Married-Couple Families in Cowen
The poverty statistics for married-couple families in Cowen show that 12.8% or 10 of the total 78 families live below the poverty line. Families with no children have the highest poverty rate of 15.4%, comprising of 10 families. On the other hand, families with 1 or 2 children have the lowest poverty rate of 0.0%, which includes 0 families.
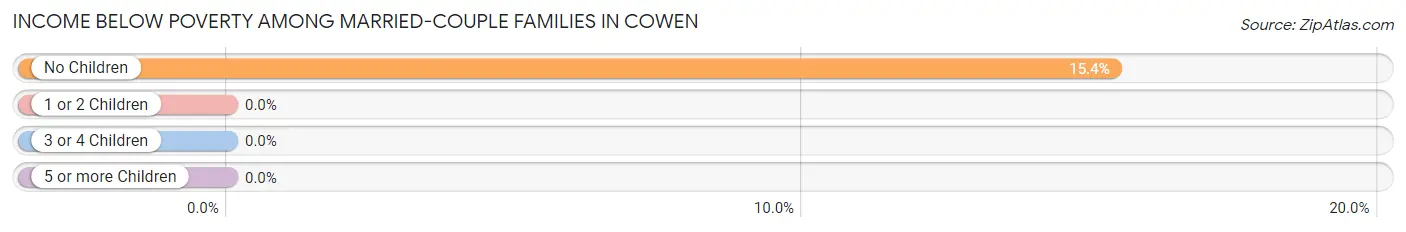
| Children | Above Poverty | Below Poverty |
| No Children | 55 (84.6%) | 10 (15.4%) |
| 1 or 2 Children | 8 (100.0%) | 0 (0.0%) |
| 3 or 4 Children | 5 (100.0%) | 0 (0.0%) |
| 5 or more Children | 0 (0.0%) | 0 (0.0%) |
| Total | 68 (87.2%) | 10 (12.8%) |
Income Below Poverty Among Single-Parent Households in Cowen
According to the poverty data in Cowen, 50.0% or 4 single-father households and 41.0% or 16 single-mother households are living below the poverty line. Among single-father households, those with 1 or 2 children have the highest poverty rate, with 1 households (100.0%) experiencing poverty. Likewise, among single-mother households, those with no children have the highest poverty rate, with 11 households (42.3%) falling below the poverty line.
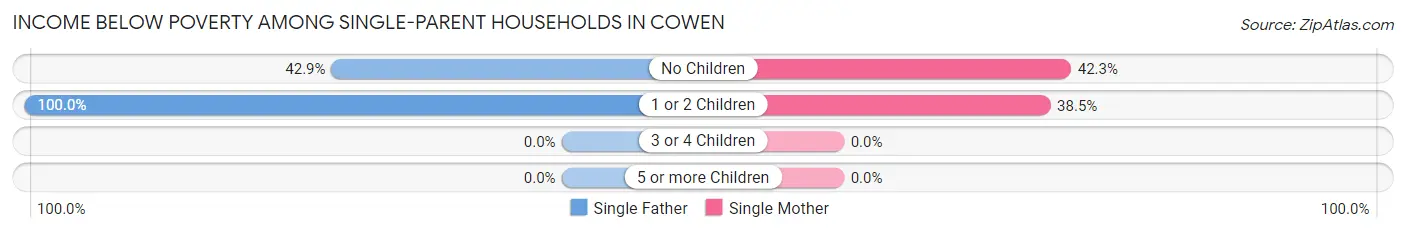
| Children | Single Father | Single Mother |
| No Children | 3 (42.9%) | 11 (42.3%) |
| 1 or 2 Children | 1 (100.0%) | 5 (38.5%) |
| 3 or 4 Children | 0 (0.0%) | 0 (0.0%) |
| 5 or more Children | 0 (0.0%) | 0 (0.0%) |
| Total | 4 (50.0%) | 16 (41.0%) |
Income Below Poverty Among Married-Couple vs Single-Parent Households in Cowen
The poverty data for Cowen shows that 10 of the married-couple family households (12.8%) and 20 of the single-parent households (42.5%) are living below the poverty level. Within the married-couple family households, those with no children have the highest poverty rate, with 10 households (15.4%) falling below the poverty line. Among the single-parent households, those with 1 or 2 children have the highest poverty rate, with 6 household (42.9%) living below poverty.
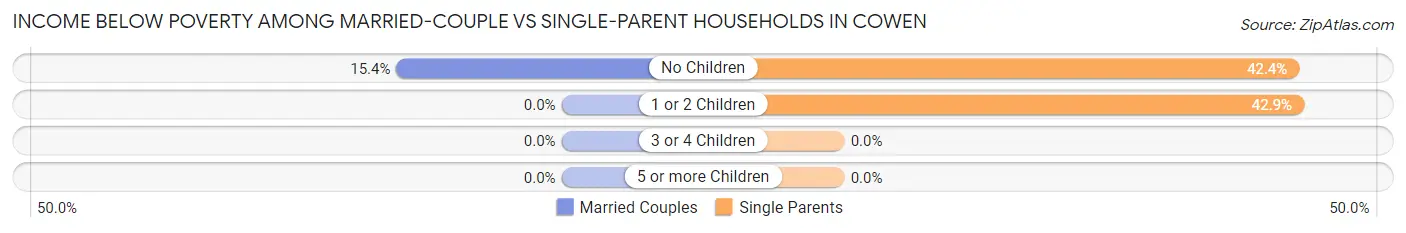
| Children | Married-Couple Families | Single-Parent Households |
| No Children | 10 (15.4%) | 14 (42.4%) |
| 1 or 2 Children | 0 (0.0%) | 6 (42.9%) |
| 3 or 4 Children | 0 (0.0%) | 0 (0.0%) |
| 5 or more Children | 0 (0.0%) | 0 (0.0%) |
| Total | 10 (12.8%) | 20 (42.5%) |
Race in Cowen
The most populous races in Cowen are White / Caucasian (582 | 98.8%), and Two or more Races (7 | 1.2%).
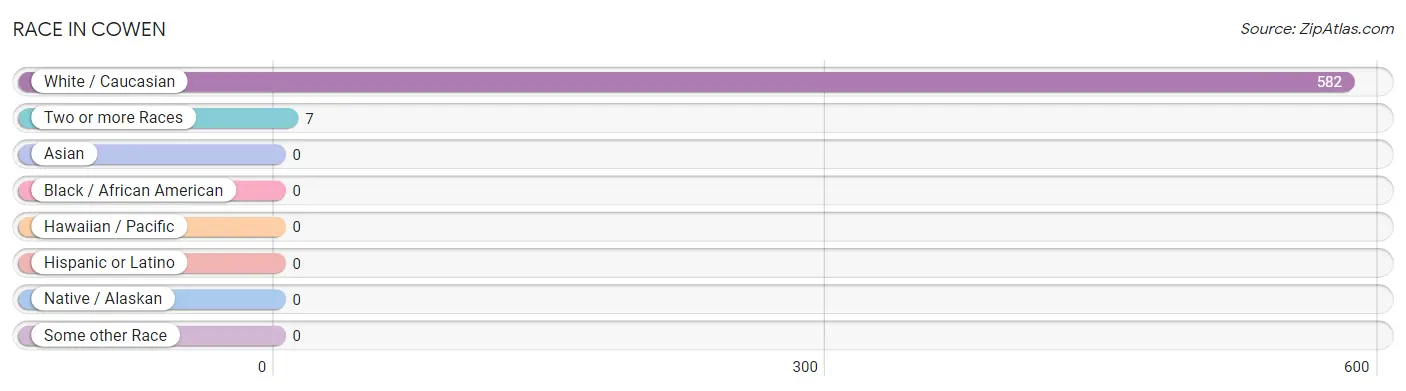
| Race | # Population | % Population |
| Asian | 0 | 0.0% |
| Black / African American | 0 | 0.0% |
| Hawaiian / Pacific | 0 | 0.0% |
| Hispanic or Latino | 0 | 0.0% |
| Native / Alaskan | 0 | 0.0% |
| White / Caucasian | 582 | 98.8% |
| Two or more Races | 7 | 1.2% |
| Some other Race | 0 | 0.0% |
| Total | 589 | 100.0% |
Ancestry in Cowen
The most populous ancestries reported in Cowen are Irish (146 | 24.8%), English (83 | 14.1%), German (74 | 12.6%), American (45 | 7.6%), and Italian (30 | 5.1%), together accounting for 64.2% of all Cowen residents.
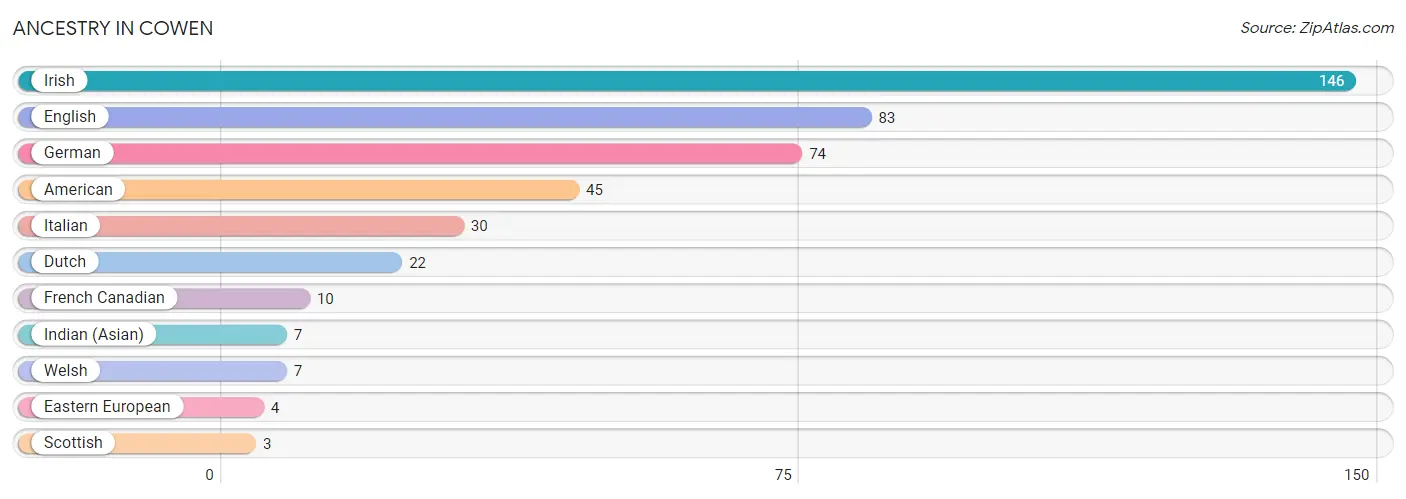
| Ancestry | # Population | % Population |
| American | 45 | 7.6% |
| Dutch | 22 | 3.7% |
| Eastern European | 4 | 0.7% |
| English | 83 | 14.1% |
| French Canadian | 10 | 1.7% |
| German | 74 | 12.6% |
| Indian (Asian) | 7 | 1.2% |
| Irish | 146 | 24.8% |
| Italian | 30 | 5.1% |
| Scottish | 3 | 0.5% |
| Welsh | 7 | 1.2% | View All 11 Rows |
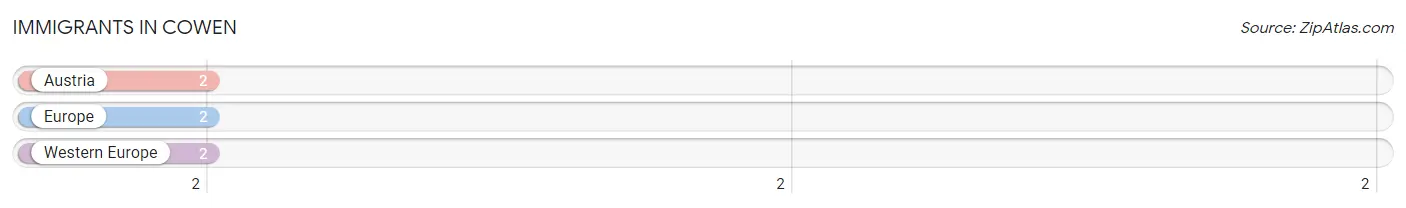
Immigrants in Cowen
The most numerous immigrant groups reported in Cowen came from Austria (2 | 0.3%), Europe (2 | 0.3%), and Western Europe (2 | 0.3%), together accounting for 1.0% of all Cowen residents.
| Immigration Origin | # Population | % Population |
| Austria | 2 | 0.3% |
| Europe | 2 | 0.3% |
| Western Europe | 2 | 0.3% | View All 3 Rows |
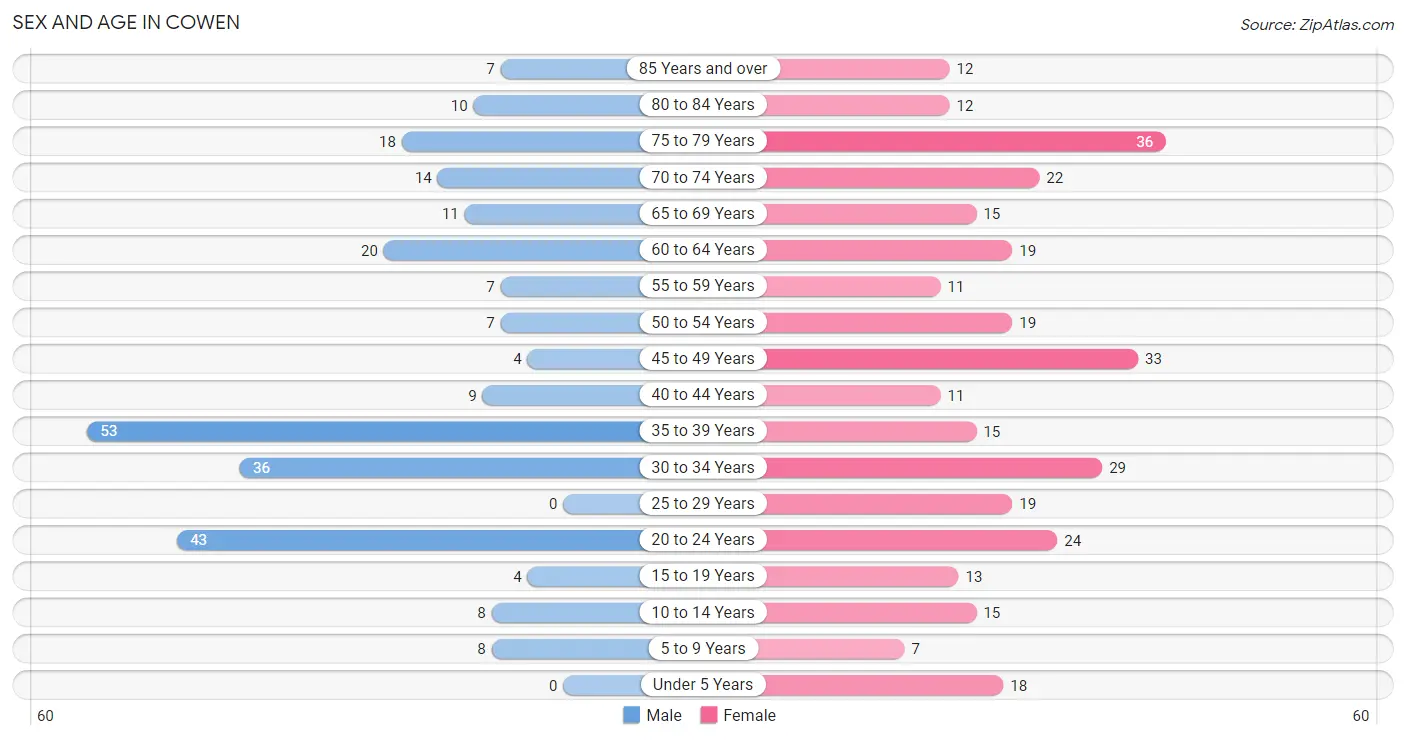
Sex and Age in Cowen
Sex and Age in Cowen
The most populous age groups in Cowen are 35 to 39 Years (53 | 20.5%) for men and 75 to 79 Years (36 | 10.9%) for women.
| Age Bracket | Male | Female |
| Under 5 Years | 0 (0.0%) | 18 (5.4%) |
| 5 to 9 Years | 8 (3.1%) | 7 (2.1%) |
| 10 to 14 Years | 8 (3.1%) | 15 (4.5%) |
| 15 to 19 Years | 4 (1.5%) | 13 (3.9%) |
| 20 to 24 Years | 43 (16.6%) | 24 (7.3%) |
| 25 to 29 Years | 0 (0.0%) | 19 (5.8%) |
| 30 to 34 Years | 36 (13.9%) | 29 (8.8%) |
| 35 to 39 Years | 53 (20.5%) | 15 (4.5%) |
| 40 to 44 Years | 9 (3.5%) | 11 (3.3%) |
| 45 to 49 Years | 4 (1.5%) | 33 (10.0%) |
| 50 to 54 Years | 7 (2.7%) | 19 (5.8%) |
| 55 to 59 Years | 7 (2.7%) | 11 (3.3%) |
| 60 to 64 Years | 20 (7.7%) | 19 (5.8%) |
| 65 to 69 Years | 11 (4.3%) | 15 (4.5%) |
| 70 to 74 Years | 14 (5.4%) | 22 (6.7%) |
| 75 to 79 Years | 18 (7.0%) | 36 (10.9%) |
| 80 to 84 Years | 10 (3.9%) | 12 (3.6%) |
| 85 Years and over | 7 (2.7%) | 12 (3.6%) |
| Total | 259 (100.0%) | 330 (100.0%) |
Families and Households in Cowen
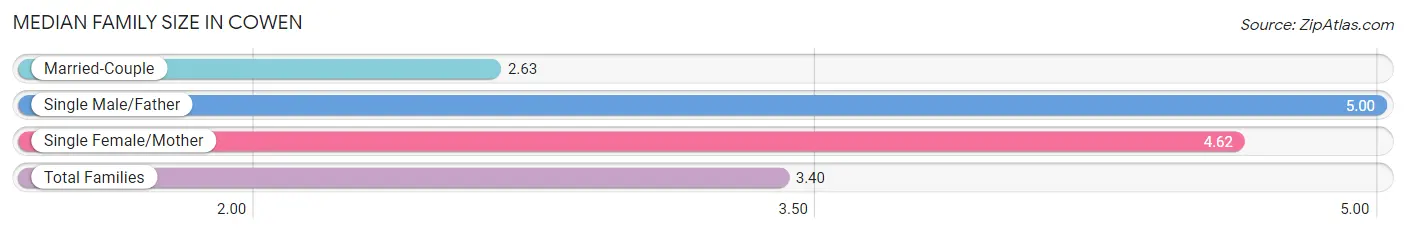
Median Family Size in Cowen
The median family size in Cowen is 3.40 persons per family, with single male/father families (8 | 6.4%) accounting for the largest median family size of 5 persons per family. On the other hand, married-couple families (78 | 62.4%) represent the smallest median family size with 2.63 persons per family.
| Family Type | # Families | Family Size |
| Married-Couple | 78 (62.4%) | 2.63 |
| Single Male/Father | 8 (6.4%) | 5.00 |
| Single Female/Mother | 39 (31.2%) | 4.62 |
| Total Families | 125 (100.0%) | 3.40 |
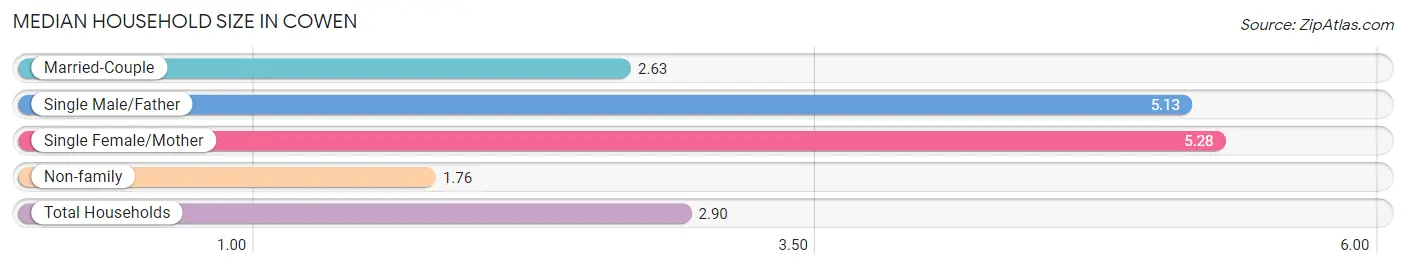
Median Household Size in Cowen
The median household size in Cowen is 2.90 persons per household, with single female/mother households (39 | 19.2%) accounting for the largest median household size of 5.28 persons per household. non-family households (78 | 38.4%) represent the smallest median household size with 1.76 persons per household.
| Household Type | # Households | Household Size |
| Married-Couple | 78 (38.4%) | 2.63 |
| Single Male/Father | 8 (3.9%) | 5.13 |
| Single Female/Mother | 39 (19.2%) | 5.28 |
| Non-family | 78 (38.4%) | 1.76 |
| Total Households | 203 (100.0%) | 2.90 |
Household Size by Marriage Status in Cowen
Out of a total of 203 households in Cowen, 125 (61.6%) are family households, while 78 (38.4%) are nonfamily households. The most numerous type of family households are 2-person households, comprising 67, and the most common type of nonfamily households are 1-person households, comprising 62.
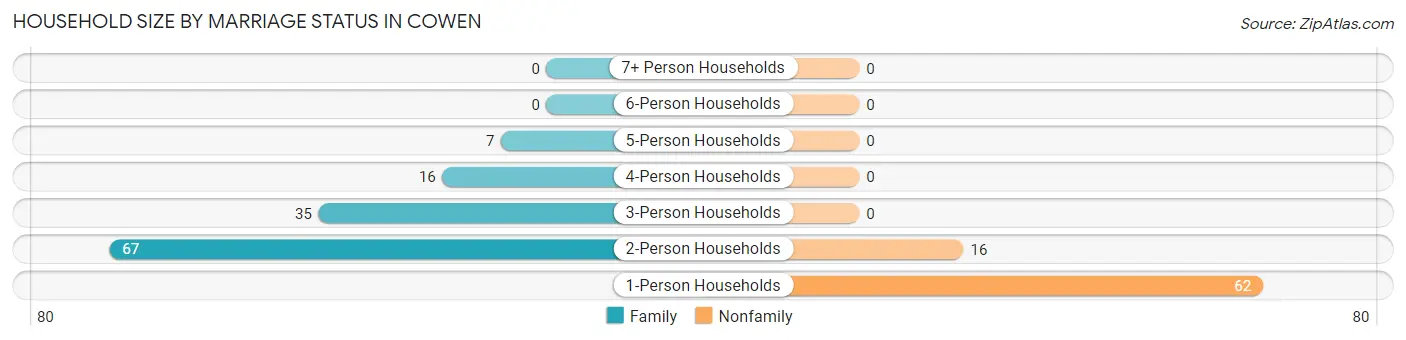
| Household Size | Family Households | Nonfamily Households |
| 1-Person Households | - | 62 (30.5%) |
| 2-Person Households | 67 (33.0%) | 16 (7.9%) |
| 3-Person Households | 35 (17.2%) | 0 (0.0%) |
| 4-Person Households | 16 (7.9%) | 0 (0.0%) |
| 5-Person Households | 7 (3.5%) | 0 (0.0%) |
| 6-Person Households | 0 (0.0%) | 0 (0.0%) |
| 7+ Person Households | 0 (0.0%) | 0 (0.0%) |
| Total | 125 (61.6%) | 78 (38.4%) |
Female Fertility in Cowen
Fertility by Age in Cowen
Average fertility rate in Cowen is 19.0 births per 1,000 women. Women in the age bracket of 20 to 34 years have the highest fertility rate with 42.0 births per 1,000 women. Women in the age bracket of 20 to 34 years acount for 100.0% of all women with births.
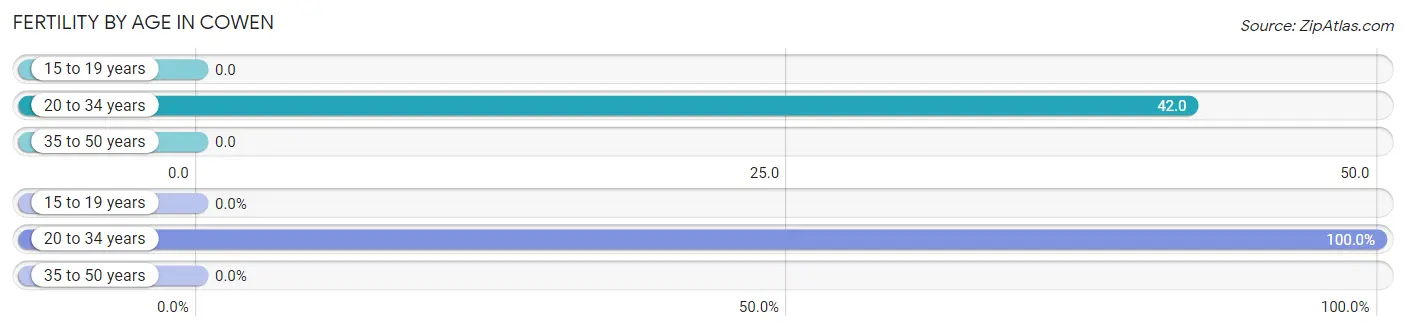
| Age Bracket | Women with Births | Births / 1,000 Women |
| 15 to 19 years | 0 (0.0%) | 0.0 |
| 20 to 34 years | 3 (100.0%) | 42.0 |
| 35 to 50 years | 0 (0.0%) | 0.0 |
| Total | 3 (100.0%) | 19.0 |
Fertility by Age by Marriage Status in Cowen
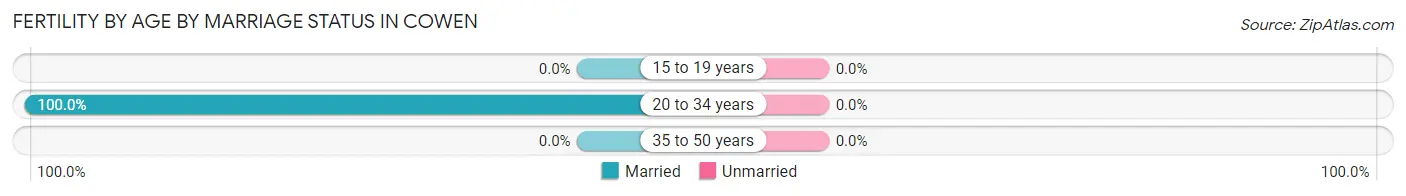
| Age Bracket | Married | Unmarried |
| 15 to 19 years | 0 (0.0%) | 0 (0.0%) |
| 20 to 34 years | 3 (100.0%) | 0 (0.0%) |
| 35 to 50 years | 0 (0.0%) | 0 (0.0%) |
| Total | 3 (100.0%) | 0 (0.0%) |
Fertility by Education in Cowen
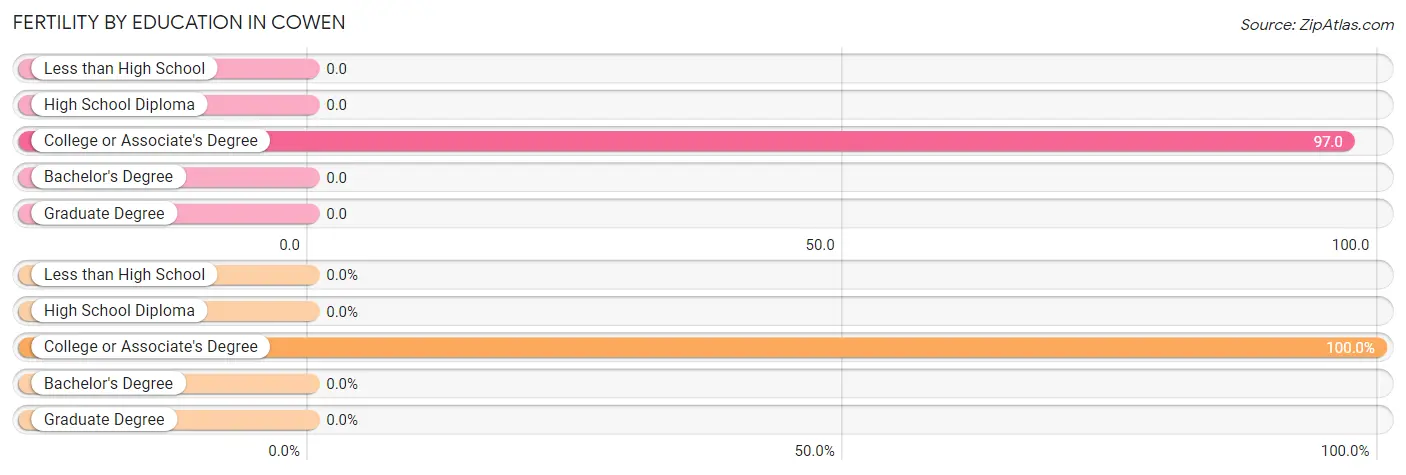
| Educational Attainment | Women with Births | Births / 1,000 Women |
| Less than High School | 0 (0.0%) | 0.0 |
| High School Diploma | 0 (0.0%) | 0.0 |
| College or Associate's Degree | 3 (100.0%) | 97.0 |
| Bachelor's Degree | 0 (0.0%) | 0.0 |
| Graduate Degree | 0 (0.0%) | 0.0 |
| Total | 3 (100.0%) | 19.0 |
Fertility by Education by Marriage Status in Cowen
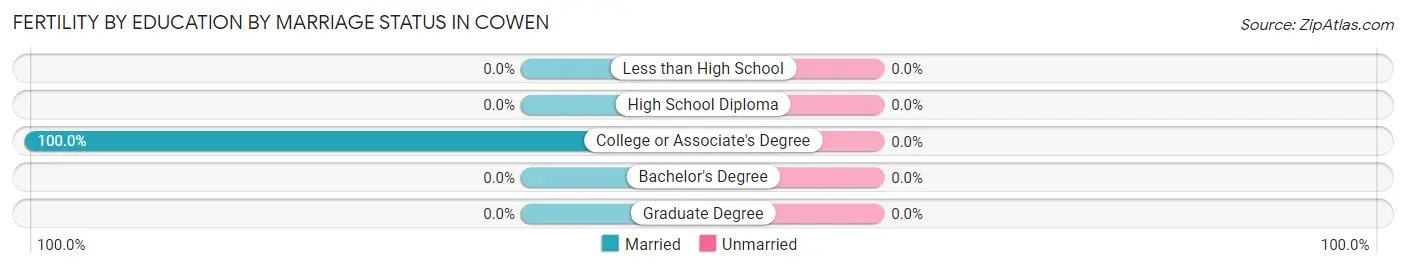
| Educational Attainment | Married | Unmarried |
| Less than High School | 0 (0.0%) | 0 (0.0%) |
| High School Diploma | 0 (0.0%) | 0 (0.0%) |
| College or Associate's Degree | 3 (100.0%) | 0 (0.0%) |
| Bachelor's Degree | 0 (0.0%) | 0 (0.0%) |
| Graduate Degree | 0 (0.0%) | 0 (0.0%) |
| Total | 3 (100.0%) | 0 (0.0%) |
Employment Characteristics in Cowen
Employment by Class of Employer in Cowen
Among the 111 employed individuals in Cowen, private company employees (104 | 93.7%), and self-employed (not incorporated) (7 | 6.3%) make up the most common classes of employment.
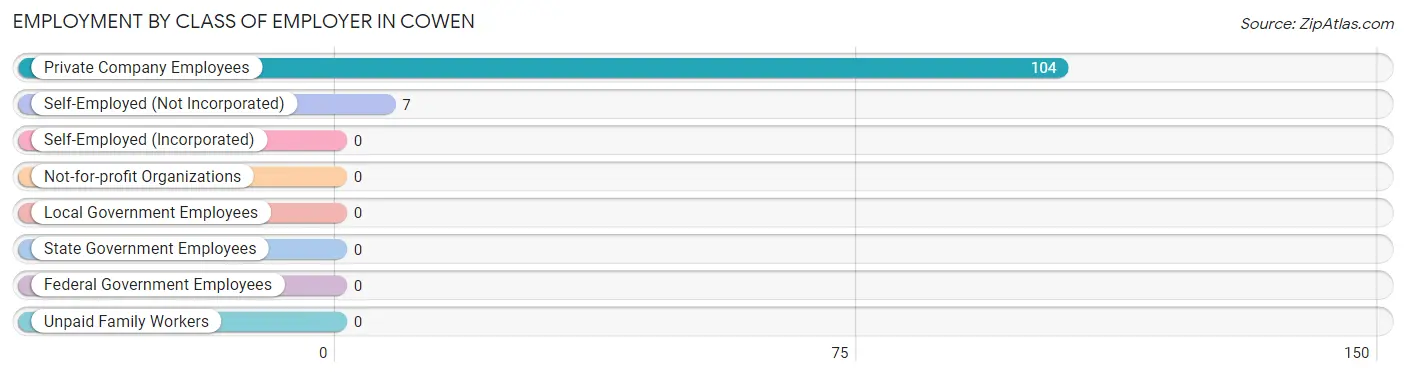
| Employer Class | # Employees | % Employees |
| Private Company Employees | 104 | 93.7% |
| Self-Employed (Incorporated) | 0 | 0.0% |
| Self-Employed (Not Incorporated) | 7 | 6.3% |
| Not-for-profit Organizations | 0 | 0.0% |
| Local Government Employees | 0 | 0.0% |
| State Government Employees | 0 | 0.0% |
| Federal Government Employees | 0 | 0.0% |
| Unpaid Family Workers | 0 | 0.0% |
| Total | 111 | 100.0% |
Employment Status by Age in Cowen
According to the labor force statistics for Cowen, out of the total population over 16 years of age (530), 30.8% or 163 individuals are in the labor force, with 31.9% or 52 of them unemployed. The age group with the highest labor force participation rate is 25 to 29 years, with 100.0% or 19 individuals in the labor force. Within the labor force, the 30 to 34 years age range has the highest percentage of unemployed individuals, with 70.6% or 12 of them being unemployed.
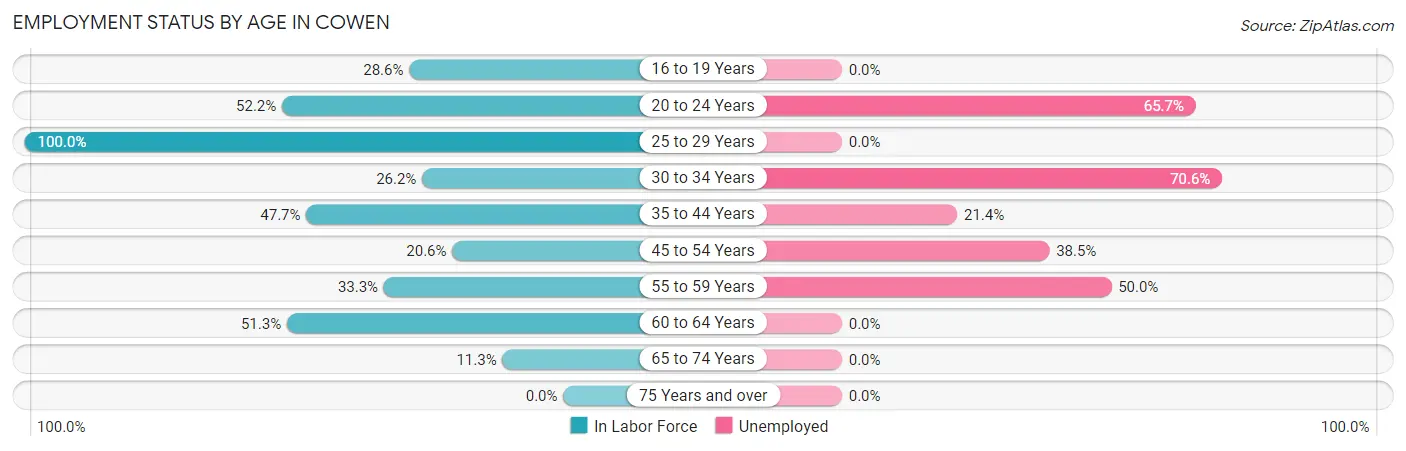
| Age Bracket | In Labor Force | Unemployed |
| 16 to 19 Years | 4 (28.6%) | 0 (0.0%) |
| 20 to 24 Years | 35 (52.2%) | 23 (65.7%) |
| 25 to 29 Years | 19 (100.0%) | 0 (0.0%) |
| 30 to 34 Years | 17 (26.2%) | 12 (70.6%) |
| 35 to 44 Years | 42 (47.7%) | 9 (21.4%) |
| 45 to 54 Years | 13 (20.6%) | 5 (38.5%) |
| 55 to 59 Years | 6 (33.3%) | 3 (50.0%) |
| 60 to 64 Years | 20 (51.3%) | 0 (0.0%) |
| 65 to 74 Years | 7 (11.3%) | 0 (0.0%) |
| 75 Years and over | 0 (0.0%) | 0 (0.0%) |
| Total | 163 (30.8%) | 52 (31.9%) |
Employment Status by Educational Attainment in Cowen
According to labor force statistics for Cowen, 40.1% of individuals (117) out of the total population between 25 and 64 years of age (292) are in the labor force, with 24.8% or 29 of them being unemployed. The group with the highest labor force participation rate are those with the educational attainment of high school diploma, with 49.2% or 61 individuals in the labor force. Within the labor force, individuals with college / associate degree education have the highest percentage of unemployment, with 47.6% or 10 of them being unemployed.
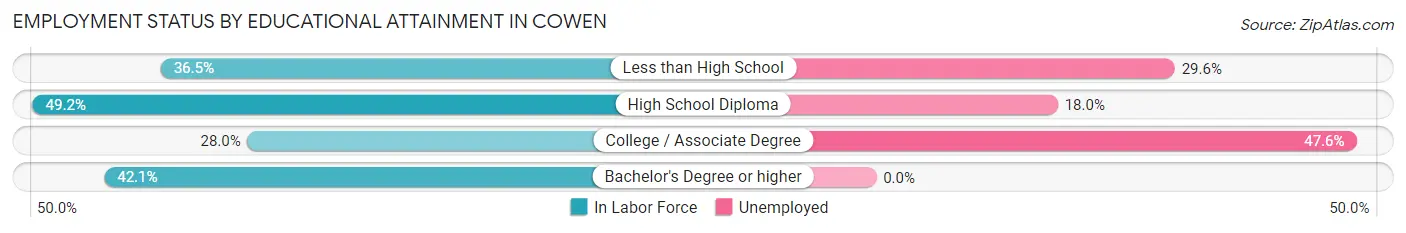
| Educational Attainment | In Labor Force | Unemployed |
| Less than High School | 27 (36.5%) | 22 (29.6%) |
| High School Diploma | 61 (49.2%) | 22 (18.0%) |
| College / Associate Degree | 21 (28.0%) | 36 (47.6%) |
| Bachelor's Degree or higher | 8 (42.1%) | 0 (0.0%) |
| Total | 117 (40.1%) | 72 (24.8%) |
Employment Occupations by Sex in Cowen
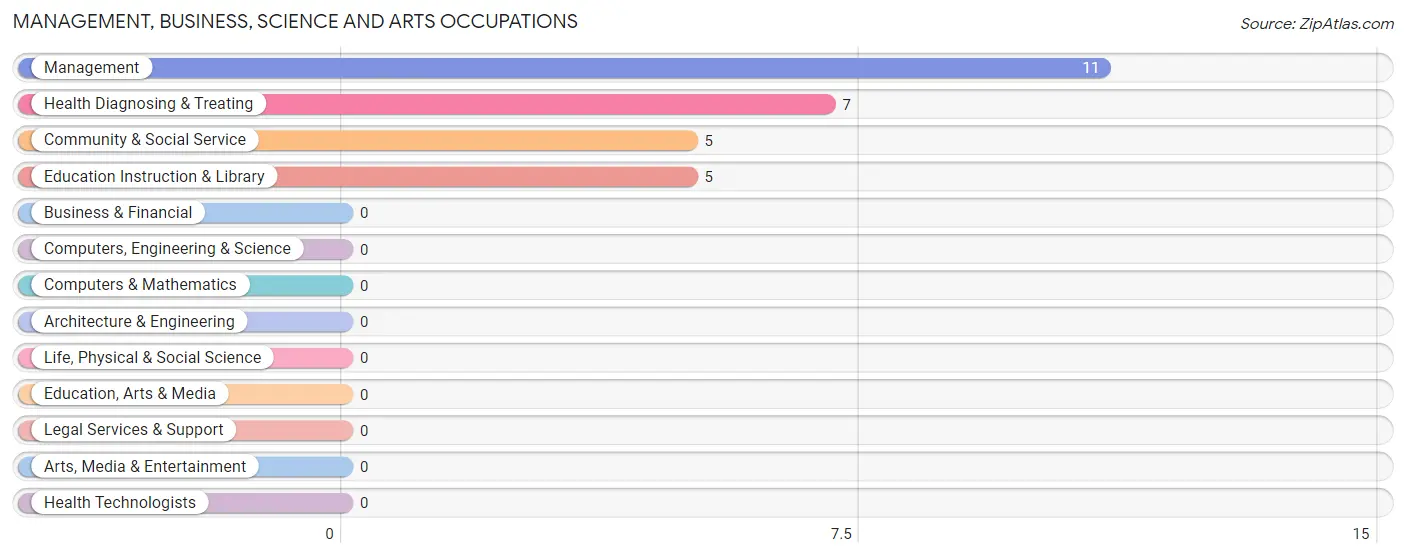
Management, Business, Science and Arts Occupations
The most common Management, Business, Science and Arts occupations in Cowen are Management (11 | 9.9%), Health Diagnosing & Treating (7 | 6.3%), Community & Social Service (5 | 4.5%), and Education Instruction & Library (5 | 4.5%).
Management, Business, Science and Arts Occupations by Sex
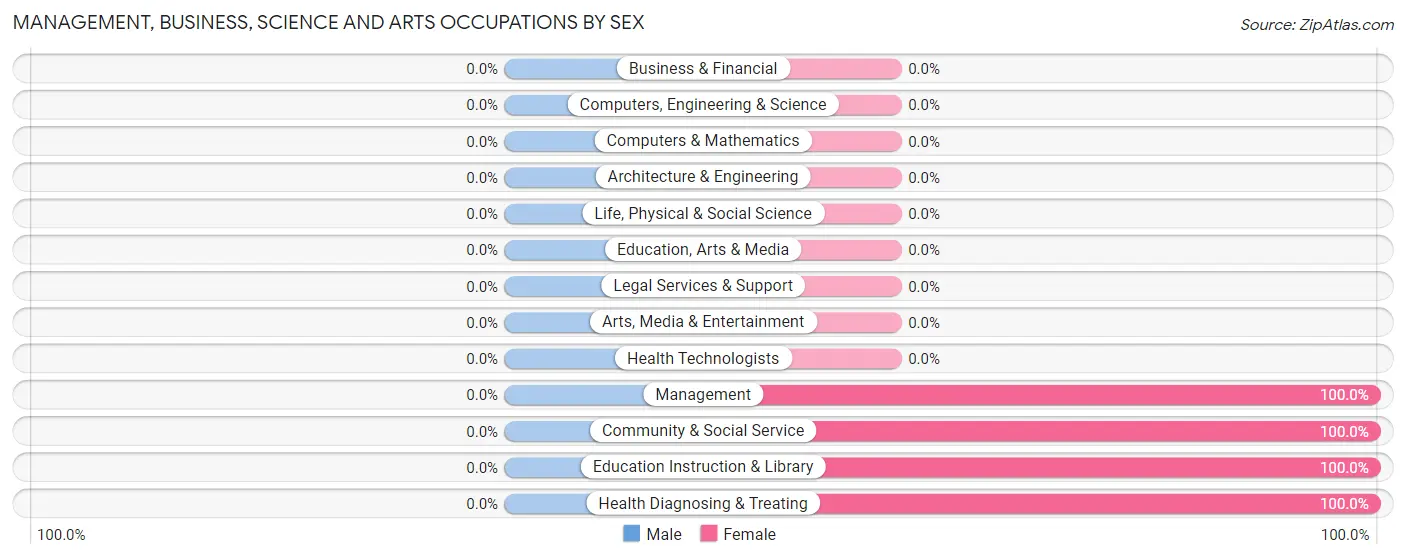
| Occupation | Male | Female |
| Management | 0 (0.0%) | 11 (100.0%) |
| Business & Financial | 0 (0.0%) | 0 (0.0%) |
| Computers, Engineering & Science | 0 (0.0%) | 0 (0.0%) |
| Computers & Mathematics | 0 (0.0%) | 0 (0.0%) |
| Architecture & Engineering | 0 (0.0%) | 0 (0.0%) |
| Life, Physical & Social Science | 0 (0.0%) | 0 (0.0%) |
| Community & Social Service | 0 (0.0%) | 5 (100.0%) |
| Education, Arts & Media | 0 (0.0%) | 0 (0.0%) |
| Legal Services & Support | 0 (0.0%) | 0 (0.0%) |
| Education Instruction & Library | 0 (0.0%) | 5 (100.0%) |
| Arts, Media & Entertainment | 0 (0.0%) | 0 (0.0%) |
| Health Diagnosing & Treating | 0 (0.0%) | 7 (100.0%) |
| Health Technologists | 0 (0.0%) | 0 (0.0%) |
| Total (Category) | 0 (0.0%) | 23 (100.0%) |
| Total (Overall) | 47 (42.3%) | 64 (57.7%) |
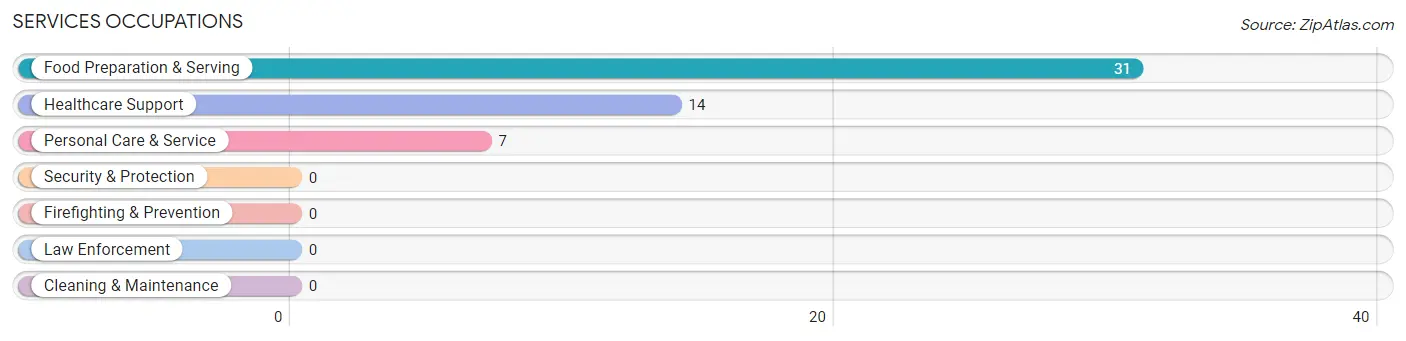
Services Occupations
The most common Services occupations in Cowen are Food Preparation & Serving (31 | 27.9%), Healthcare Support (14 | 12.6%), and Personal Care & Service (7 | 6.3%).
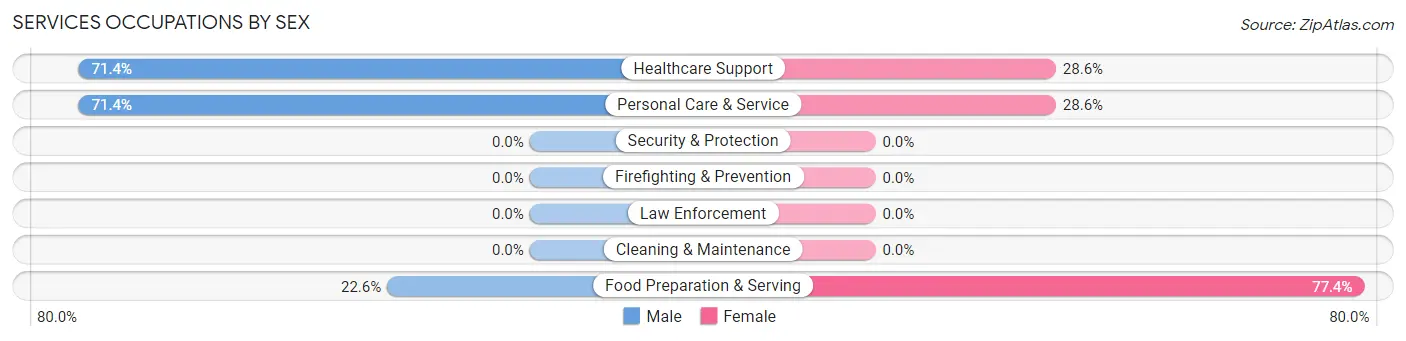
Services Occupations by Sex
Within the Services occupations in Cowen, the most male-oriented occupations are Healthcare Support (71.4%), Personal Care & Service (71.4%), and Food Preparation & Serving (22.6%), while the most female-oriented occupations are Food Preparation & Serving (77.4%), Healthcare Support (28.6%), and Personal Care & Service (28.6%).
| Occupation | Male | Female |
| Healthcare Support | 10 (71.4%) | 4 (28.6%) |
| Security & Protection | 0 (0.0%) | 0 (0.0%) |
| Firefighting & Prevention | 0 (0.0%) | 0 (0.0%) |
| Law Enforcement | 0 (0.0%) | 0 (0.0%) |
| Food Preparation & Serving | 7 (22.6%) | 24 (77.4%) |
| Cleaning & Maintenance | 0 (0.0%) | 0 (0.0%) |
| Personal Care & Service | 5 (71.4%) | 2 (28.6%) |
| Total (Category) | 22 (42.3%) | 30 (57.7%) |
| Total (Overall) | 47 (42.3%) | 64 (57.7%) |
Sales and Office Occupations
The most common Sales and Office occupations in Cowen are , and Sales & Related (11 | 9.9%).
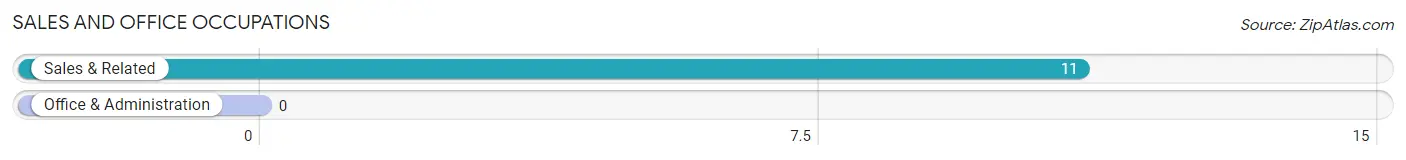
Sales and Office Occupations by Sex
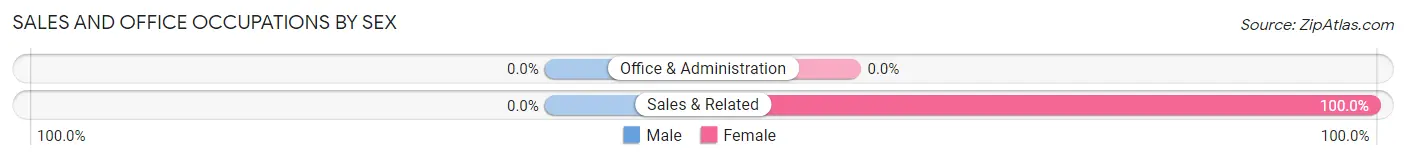
| Occupation | Male | Female |
| Sales & Related | 0 (0.0%) | 11 (100.0%) |
| Office & Administration | 0 (0.0%) | 0 (0.0%) |
| Total (Category) | 0 (0.0%) | 11 (100.0%) |
| Total (Overall) | 47 (42.3%) | 64 (57.7%) |
Natural Resources, Construction and Maintenance Occupations
The most common Natural Resources, Construction and Maintenance occupations in Cowen are , and Farming, Fishing & Forestry (3 | 2.7%).
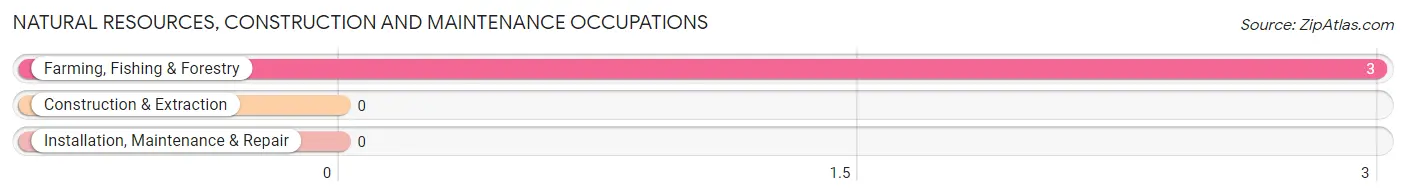
Natural Resources, Construction and Maintenance Occupations by Sex
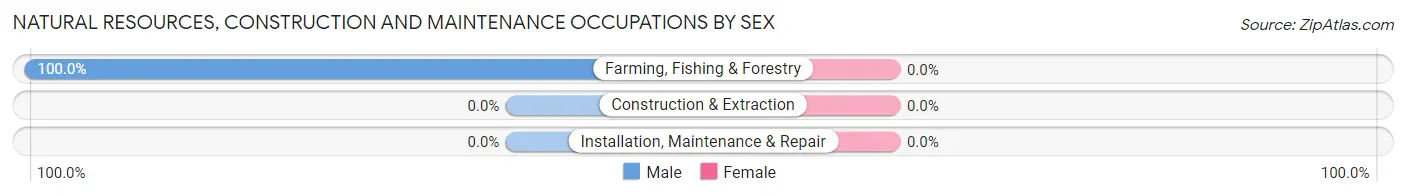
| Occupation | Male | Female |
| Farming, Fishing & Forestry | 3 (100.0%) | 0 (0.0%) |
| Construction & Extraction | 0 (0.0%) | 0 (0.0%) |
| Installation, Maintenance & Repair | 0 (0.0%) | 0 (0.0%) |
| Total (Category) | 3 (100.0%) | 0 (0.0%) |
| Total (Overall) | 47 (42.3%) | 64 (57.7%) |
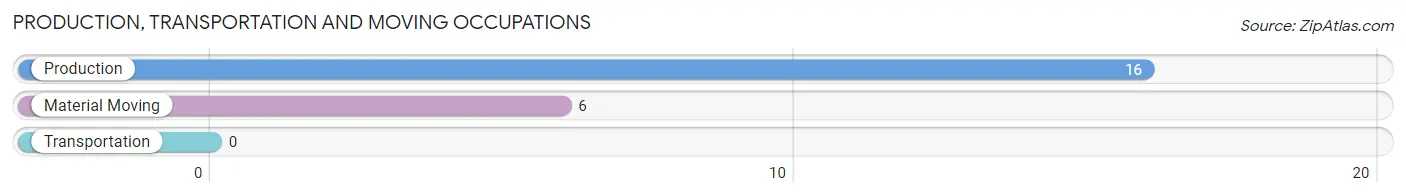
Production, Transportation and Moving Occupations
The most common Production, Transportation and Moving occupations in Cowen are Production (16 | 14.4%), and Material Moving (6 | 5.4%).
Production, Transportation and Moving Occupations by Sex
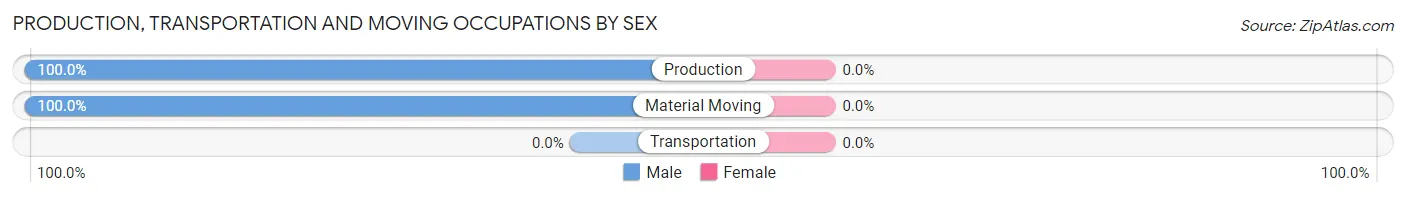
| Occupation | Male | Female |
| Production | 16 (100.0%) | 0 (0.0%) |
| Transportation | 0 (0.0%) | 0 (0.0%) |
| Material Moving | 6 (100.0%) | 0 (0.0%) |
| Total (Category) | 22 (100.0%) | 0 (0.0%) |
| Total (Overall) | 47 (42.3%) | 64 (57.7%) |
Employment Industries by Sex in Cowen
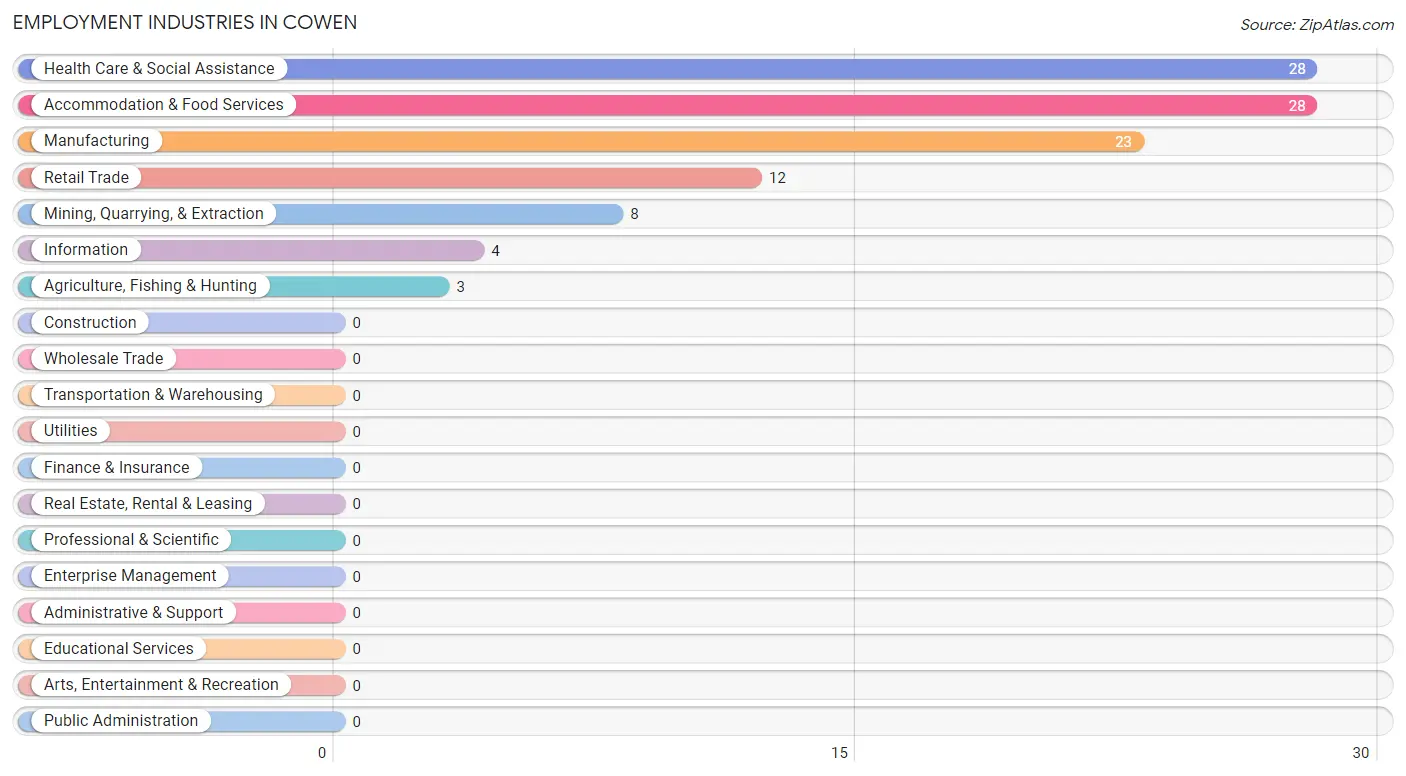
Employment Industries in Cowen
The major employment industries in Cowen include Health Care & Social Assistance (28 | 25.2%), Accommodation & Food Services (28 | 25.2%), Manufacturing (23 | 20.7%), Retail Trade (12 | 10.8%), and Mining, Quarrying, & Extraction (8 | 7.2%).
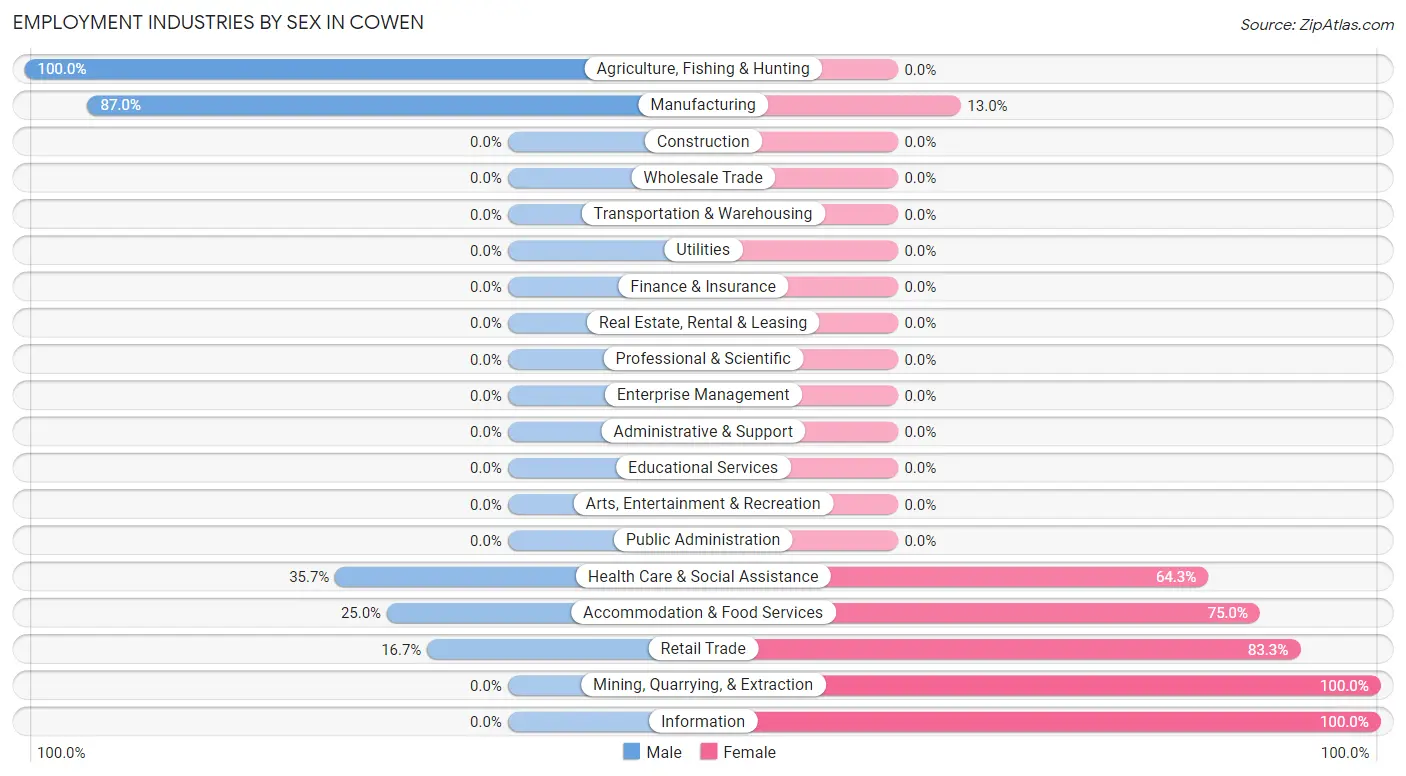
Employment Industries by Sex in Cowen
The Cowen industries that see more men than women are Agriculture, Fishing & Hunting (100.0%), Manufacturing (87.0%), and Health Care & Social Assistance (35.7%), whereas the industries that tend to have a higher number of women are Mining, Quarrying, & Extraction (100.0%), Information (100.0%), and Retail Trade (83.3%).
| Industry | Male | Female |
| Agriculture, Fishing & Hunting | 3 (100.0%) | 0 (0.0%) |
| Mining, Quarrying, & Extraction | 0 (0.0%) | 8 (100.0%) |
| Construction | 0 (0.0%) | 0 (0.0%) |
| Manufacturing | 20 (87.0%) | 3 (13.0%) |
| Wholesale Trade | 0 (0.0%) | 0 (0.0%) |
| Retail Trade | 2 (16.7%) | 10 (83.3%) |
| Transportation & Warehousing | 0 (0.0%) | 0 (0.0%) |
| Utilities | 0 (0.0%) | 0 (0.0%) |
| Information | 0 (0.0%) | 4 (100.0%) |
| Finance & Insurance | 0 (0.0%) | 0 (0.0%) |
| Real Estate, Rental & Leasing | 0 (0.0%) | 0 (0.0%) |
| Professional & Scientific | 0 (0.0%) | 0 (0.0%) |
| Enterprise Management | 0 (0.0%) | 0 (0.0%) |
| Administrative & Support | 0 (0.0%) | 0 (0.0%) |
| Educational Services | 0 (0.0%) | 0 (0.0%) |
| Health Care & Social Assistance | 10 (35.7%) | 18 (64.3%) |
| Arts, Entertainment & Recreation | 0 (0.0%) | 0 (0.0%) |
| Accommodation & Food Services | 7 (25.0%) | 21 (75.0%) |
| Public Administration | 0 (0.0%) | 0 (0.0%) |
| Total | 47 (42.3%) | 64 (57.7%) |
Education in Cowen
School Enrollment in Cowen
The most common levels of schooling among the 65 students in Cowen are high school (24 | 36.9%), middle school (21 | 32.3%), and elementary school (10 | 15.4%).
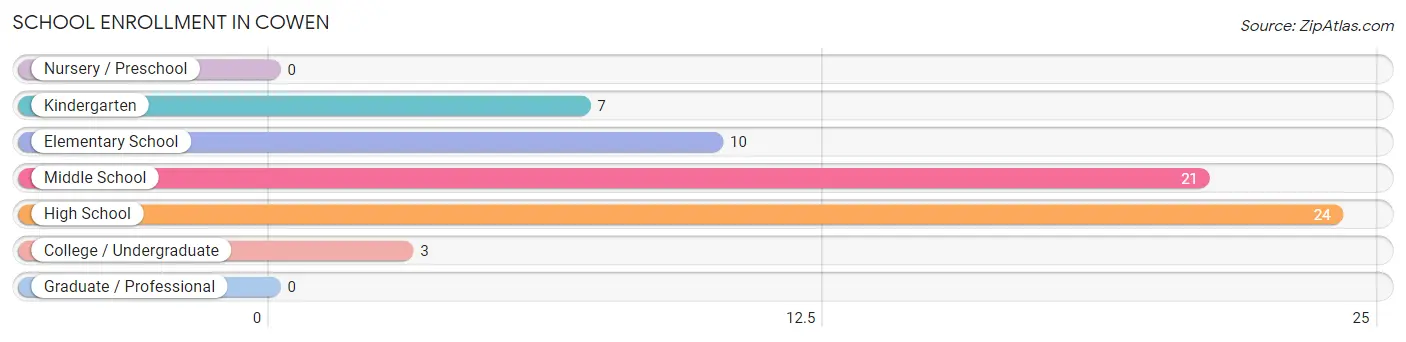
| School Level | # Students | % Students |
| Nursery / Preschool | 0 | 0.0% |
| Kindergarten | 7 | 10.8% |
| Elementary School | 10 | 15.4% |
| Middle School | 21 | 32.3% |
| High School | 24 | 36.9% |
| College / Undergraduate | 3 | 4.6% |
| Graduate / Professional | 0 | 0.0% |
| Total | 65 | 100.0% |
School Enrollment by Age by Funding Source in Cowen
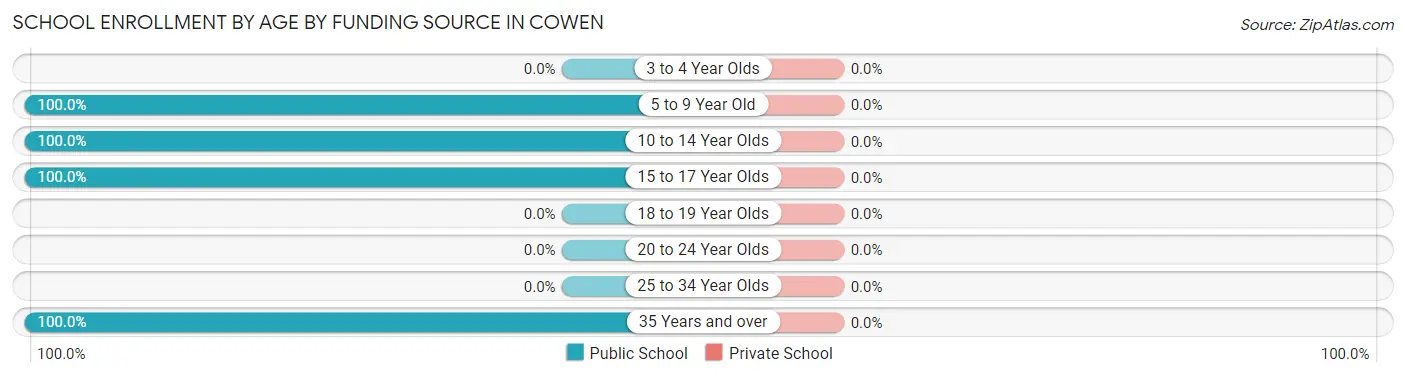
| Age Bracket | Public School | Private School |
| 3 to 4 Year Olds | 0 (0.0%) | 0 (0.0%) |
| 5 to 9 Year Old | 15 (100.0%) | 0 (0.0%) |
| 10 to 14 Year Olds | 23 (100.0%) | 0 (0.0%) |
| 15 to 17 Year Olds | 17 (100.0%) | 0 (0.0%) |
| 18 to 19 Year Olds | 0 (0.0%) | 0 (0.0%) |
| 20 to 24 Year Olds | 0 (0.0%) | 0 (0.0%) |
| 25 to 34 Year Olds | 0 (0.0%) | 0 (0.0%) |
| 35 Years and over | 10 (100.0%) | 0 (0.0%) |
| Total | 65 (100.0%) | 0 (0.0%) |
Educational Attainment by Field of Study in Cowen
Business (11 | 39.3%), arts & humanities (7 | 25.0%), multidisciplinary studies (4 | 14.3%), communications (4 | 14.3%), and education (2 | 7.1%) are the most common fields of study among 28 individuals in Cowen who have obtained a bachelor's degree or higher.
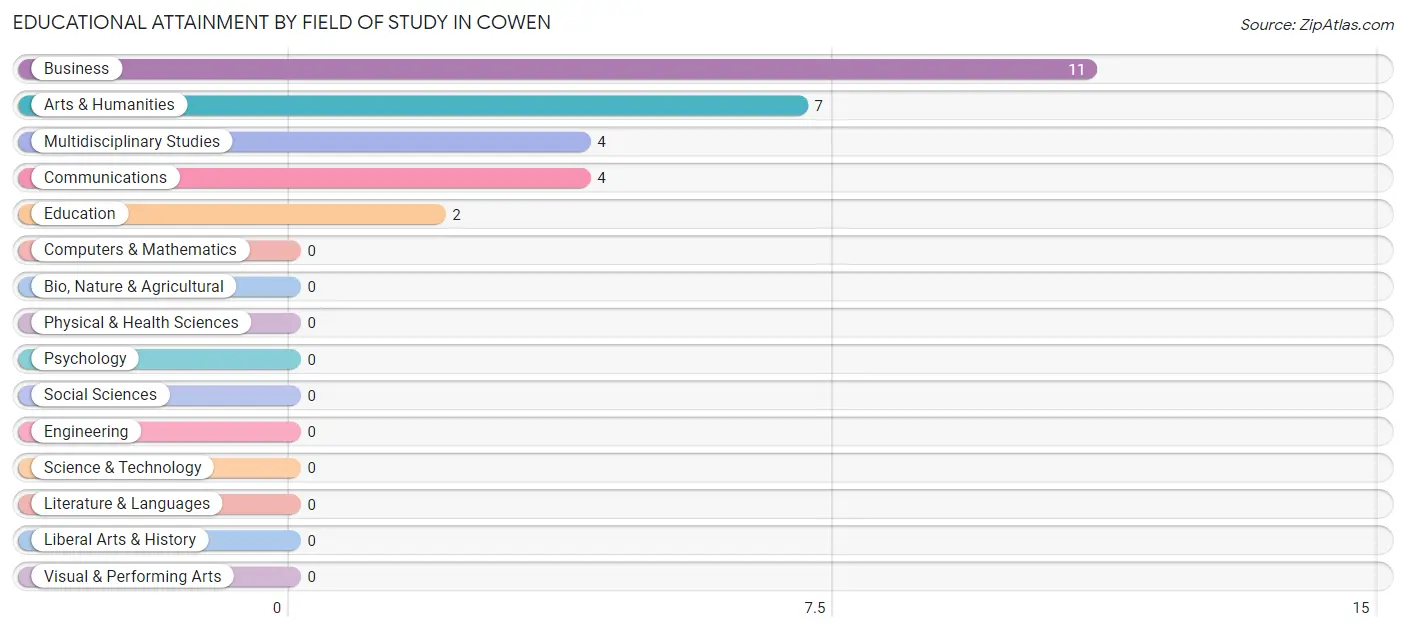
| Field of Study | # Graduates | % Graduates |
| Computers & Mathematics | 0 | 0.0% |
| Bio, Nature & Agricultural | 0 | 0.0% |
| Physical & Health Sciences | 0 | 0.0% |
| Psychology | 0 | 0.0% |
| Social Sciences | 0 | 0.0% |
| Engineering | 0 | 0.0% |
| Multidisciplinary Studies | 4 | 14.3% |
| Science & Technology | 0 | 0.0% |
| Business | 11 | 39.3% |
| Education | 2 | 7.1% |
| Literature & Languages | 0 | 0.0% |
| Liberal Arts & History | 0 | 0.0% |
| Visual & Performing Arts | 0 | 0.0% |
| Communications | 4 | 14.3% |
| Arts & Humanities | 7 | 25.0% |
| Total | 28 | 100.0% |
Transportation & Commute in Cowen
Vehicle Availability by Sex in Cowen
The most prevalent vehicle ownership categories in Cowen are males with 2 vehicles (24, accounting for 51.1%) and females with 2 vehicles (10, making up 37.5%).
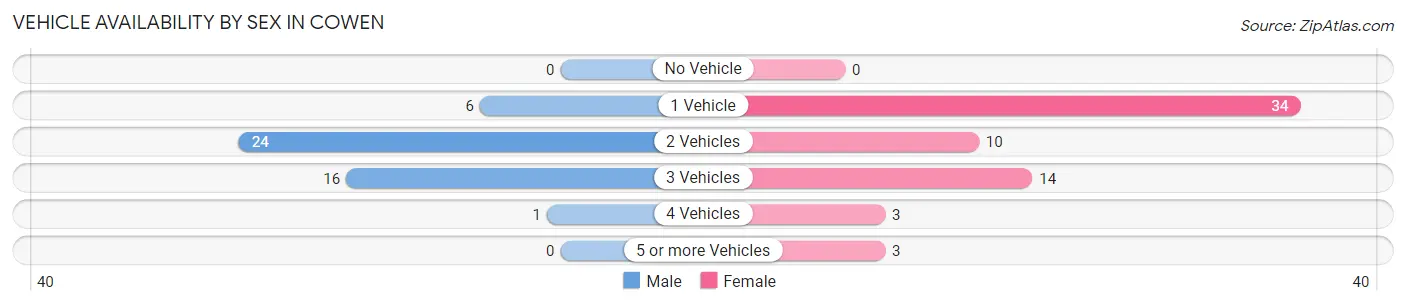
| Vehicles Available | Male | Female |
| No Vehicle | 0 (0.0%) | 0 (0.0%) |
| 1 Vehicle | 6 (12.8%) | 34 (53.1%) |
| 2 Vehicles | 24 (51.1%) | 10 (15.6%) |
| 3 Vehicles | 16 (34.0%) | 14 (21.9%) |
| 4 Vehicles | 1 (2.1%) | 3 (4.7%) |
| 5 or more Vehicles | 0 (0.0%) | 3 (4.7%) |
| Total | 47 (100.0%) | 64 (100.0%) |
Commute Time in Cowen
The most frequently occuring commute durations in Cowen are less than 5 minutes (26 commuters, 25.5%), 5 to 9 minutes (25 commuters, 24.5%), and 60 to 89 minutes (16 commuters, 15.7%).
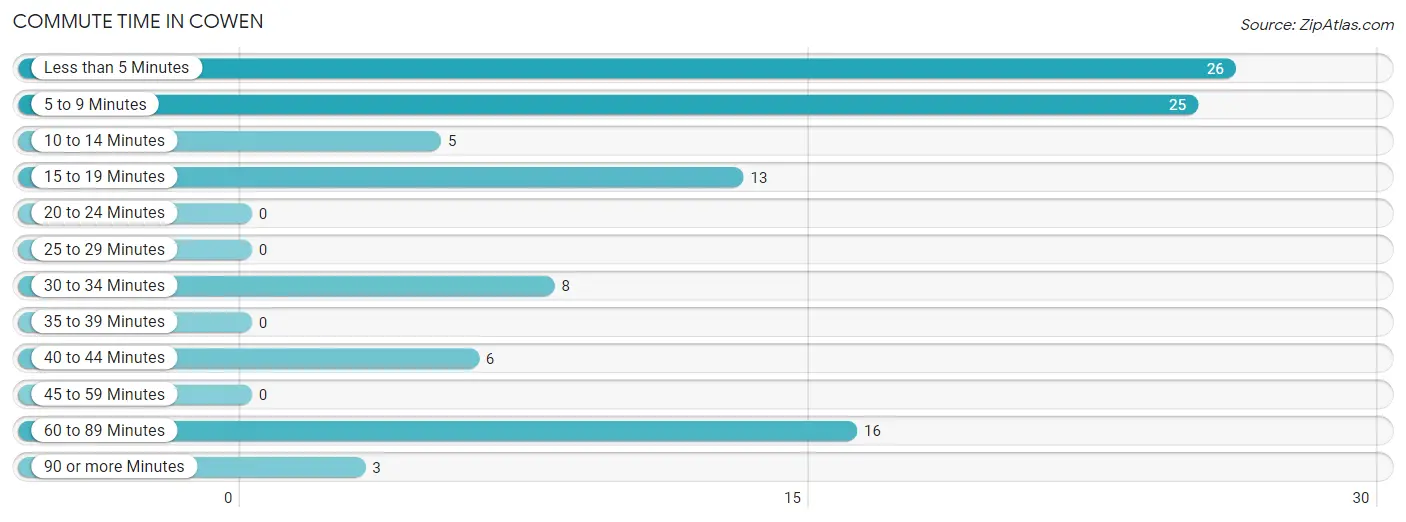
| Commute Time | # Commuters | % Commuters |
| Less than 5 Minutes | 26 | 25.5% |
| 5 to 9 Minutes | 25 | 24.5% |
| 10 to 14 Minutes | 5 | 4.9% |
| 15 to 19 Minutes | 13 | 12.8% |
| 20 to 24 Minutes | 0 | 0.0% |
| 25 to 29 Minutes | 0 | 0.0% |
| 30 to 34 Minutes | 8 | 7.8% |
| 35 to 39 Minutes | 0 | 0.0% |
| 40 to 44 Minutes | 6 | 5.9% |
| 45 to 59 Minutes | 0 | 0.0% |
| 60 to 89 Minutes | 16 | 15.7% |
| 90 or more Minutes | 3 | 2.9% |
Commute Time by Sex in Cowen
The most common commute times in Cowen are 5 to 9 minutes (15 commuters, 31.9%) for males and less than 5 minutes (24 commuters, 43.6%) for females.
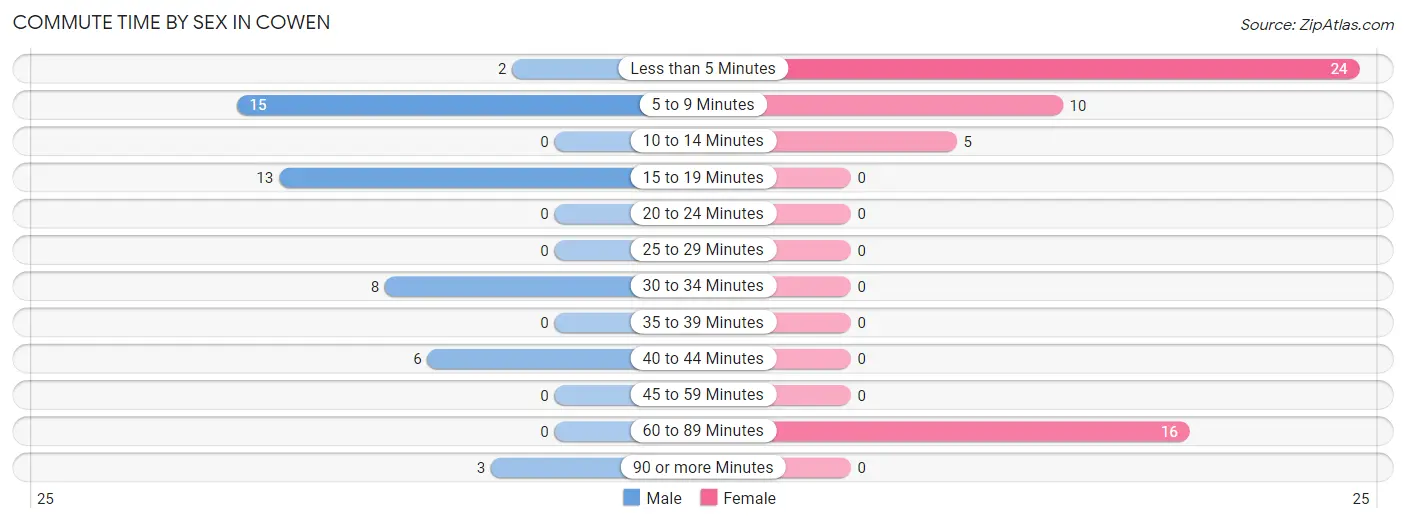
| Commute Time | Male | Female |
| Less than 5 Minutes | 2 (4.3%) | 24 (43.6%) |
| 5 to 9 Minutes | 15 (31.9%) | 10 (18.2%) |
| 10 to 14 Minutes | 0 (0.0%) | 5 (9.1%) |
| 15 to 19 Minutes | 13 (27.7%) | 0 (0.0%) |
| 20 to 24 Minutes | 0 (0.0%) | 0 (0.0%) |
| 25 to 29 Minutes | 0 (0.0%) | 0 (0.0%) |
| 30 to 34 Minutes | 8 (17.0%) | 0 (0.0%) |
| 35 to 39 Minutes | 0 (0.0%) | 0 (0.0%) |
| 40 to 44 Minutes | 6 (12.8%) | 0 (0.0%) |
| 45 to 59 Minutes | 0 (0.0%) | 0 (0.0%) |
| 60 to 89 Minutes | 0 (0.0%) | 16 (29.1%) |
| 90 or more Minutes | 3 (6.4%) | 0 (0.0%) |
Time of Departure to Work by Sex in Cowen
The most frequent times of departure to work in Cowen are 6:00 AM to 6:29 AM (13, 27.7%) for males and 6:30 AM to 6:59 AM (18, 32.7%) for females.
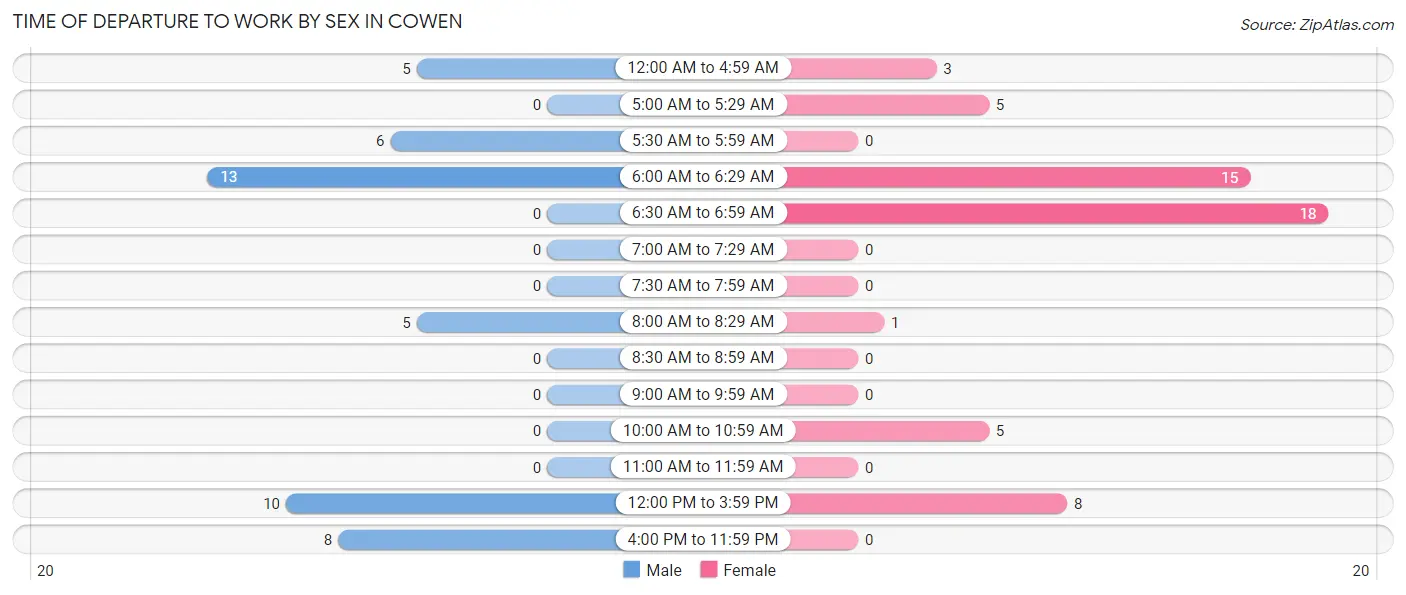
| Time of Departure | Male | Female |
| 12:00 AM to 4:59 AM | 5 (10.6%) | 3 (5.4%) |
| 5:00 AM to 5:29 AM | 0 (0.0%) | 5 (9.1%) |
| 5:30 AM to 5:59 AM | 6 (12.8%) | 0 (0.0%) |
| 6:00 AM to 6:29 AM | 13 (27.7%) | 15 (27.3%) |
| 6:30 AM to 6:59 AM | 0 (0.0%) | 18 (32.7%) |
| 7:00 AM to 7:29 AM | 0 (0.0%) | 0 (0.0%) |
| 7:30 AM to 7:59 AM | 0 (0.0%) | 0 (0.0%) |
| 8:00 AM to 8:29 AM | 5 (10.6%) | 1 (1.8%) |
| 8:30 AM to 8:59 AM | 0 (0.0%) | 0 (0.0%) |
| 9:00 AM to 9:59 AM | 0 (0.0%) | 0 (0.0%) |
| 10:00 AM to 10:59 AM | 0 (0.0%) | 5 (9.1%) |
| 11:00 AM to 11:59 AM | 0 (0.0%) | 0 (0.0%) |
| 12:00 PM to 3:59 PM | 10 (21.3%) | 8 (14.5%) |
| 4:00 PM to 11:59 PM | 8 (17.0%) | 0 (0.0%) |
| Total | 47 (100.0%) | 55 (100.0%) |
Housing Occupancy in Cowen
Occupancy by Ownership in Cowen
Of the total 203 dwellings in Cowen, owner-occupied units account for 124 (61.1%), while renter-occupied units make up 79 (38.9%).
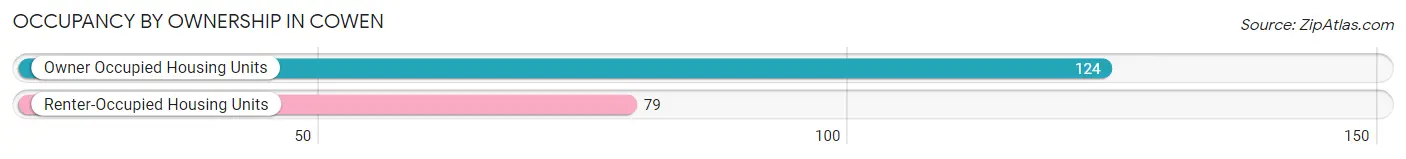
| Occupancy | # Housing Units | % Housing Units |
| Owner Occupied Housing Units | 124 | 61.1% |
| Renter-Occupied Housing Units | 79 | 38.9% |
| Total Occupied Housing Units | 203 | 100.0% |
Occupancy by Household Size in Cowen
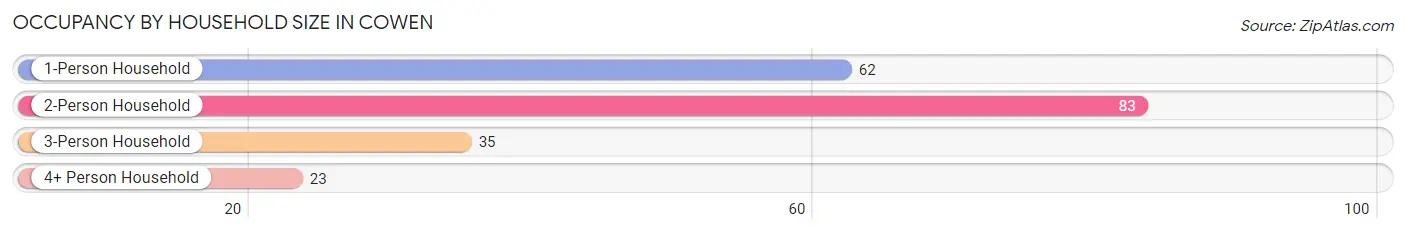
| Household Size | # Housing Units | % Housing Units |
| 1-Person Household | 62 | 30.5% |
| 2-Person Household | 83 | 40.9% |
| 3-Person Household | 35 | 17.2% |
| 4+ Person Household | 23 | 11.3% |
| Total Housing Units | 203 | 100.0% |
Occupancy by Ownership by Household Size in Cowen
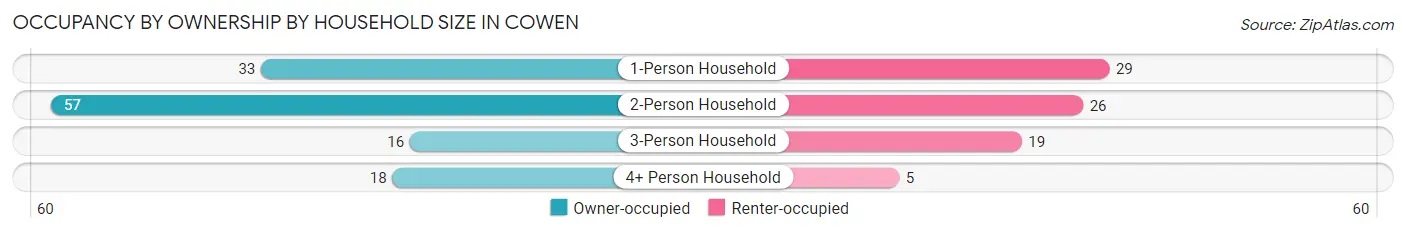
| Household Size | Owner-occupied | Renter-occupied |
| 1-Person Household | 33 (53.2%) | 29 (46.8%) |
| 2-Person Household | 57 (68.7%) | 26 (31.3%) |
| 3-Person Household | 16 (45.7%) | 19 (54.3%) |
| 4+ Person Household | 18 (78.3%) | 5 (21.7%) |
| Total Housing Units | 124 (61.1%) | 79 (38.9%) |
Occupancy by Educational Attainment in Cowen
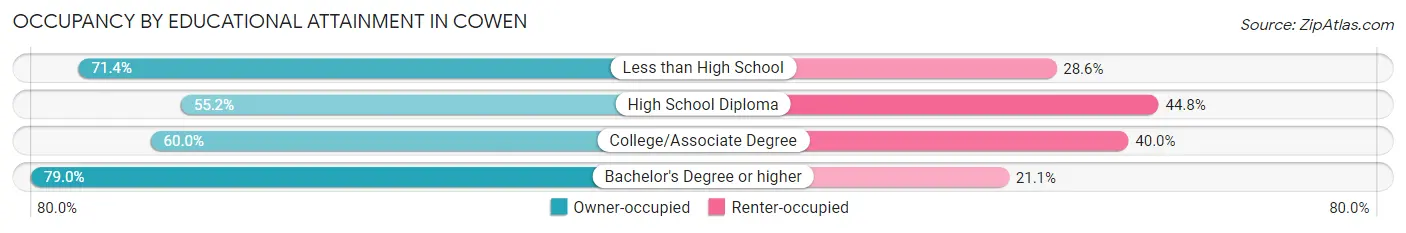
| Household Size | Owner-occupied | Renter-occupied |
| Less than High School | 20 (71.4%) | 8 (28.6%) |
| High School Diploma | 53 (55.2%) | 43 (44.8%) |
| College/Associate Degree | 36 (60.0%) | 24 (40.0%) |
| Bachelor's Degree or higher | 15 (78.9%) | 4 (21.0%) |
Occupancy by Age of Householder in Cowen
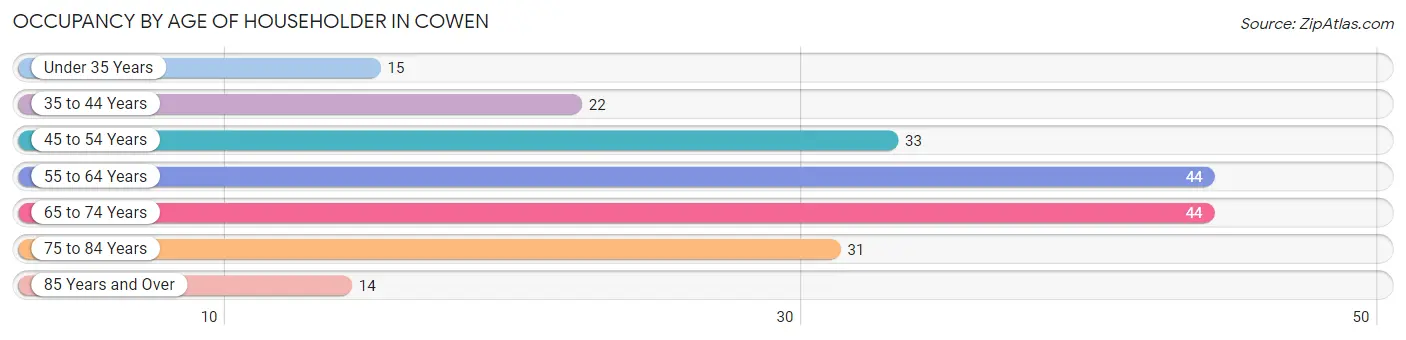
| Age Bracket | # Households | % Households |
| Under 35 Years | 15 | 7.4% |
| 35 to 44 Years | 22 | 10.8% |
| 45 to 54 Years | 33 | 16.3% |
| 55 to 64 Years | 44 | 21.7% |
| 65 to 74 Years | 44 | 21.7% |
| 75 to 84 Years | 31 | 15.3% |
| 85 Years and Over | 14 | 6.9% |
| Total | 203 | 100.0% |
Housing Finances in Cowen
Median Income by Occupancy in Cowen
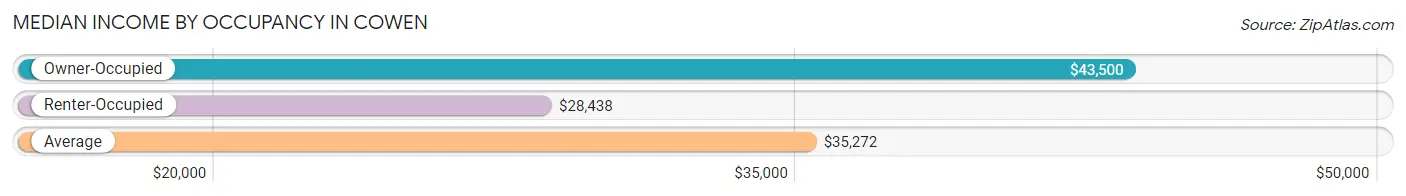
| Occupancy Type | # Households | Median Income |
| Owner-Occupied | 124 (61.1%) | $43,500 |
| Renter-Occupied | 79 (38.9%) | $28,438 |
| Average | 203 (100.0%) | $35,272 |
Occupancy by Householder Income Bracket in Cowen
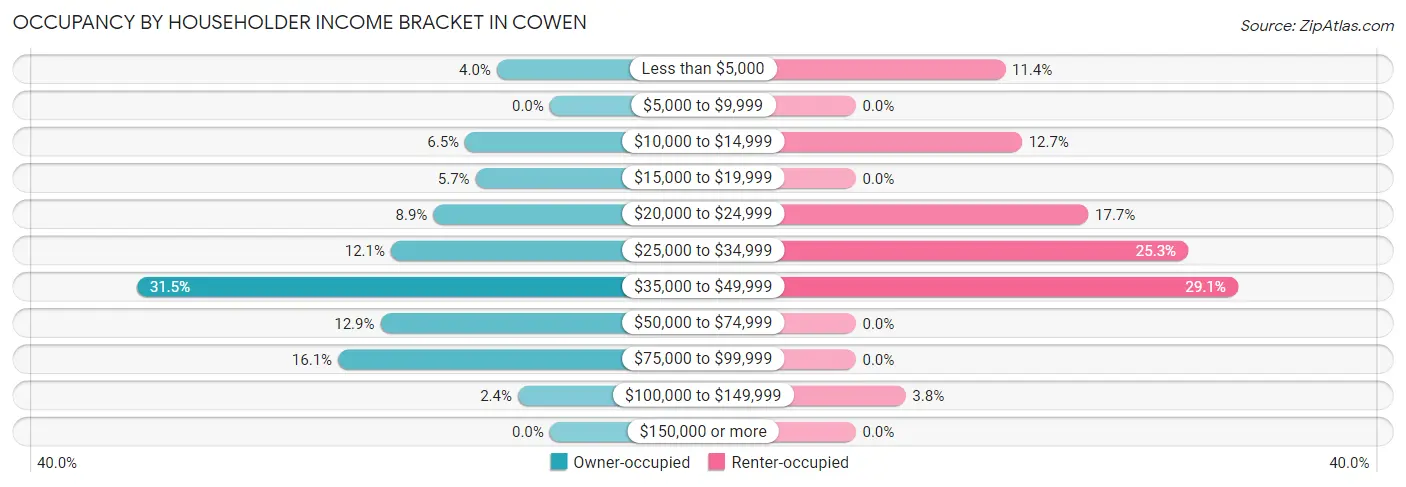
| Income Bracket | Owner-occupied | Renter-occupied |
| Less than $5,000 | 5 (4.0%) | 9 (11.4%) |
| $5,000 to $9,999 | 0 (0.0%) | 0 (0.0%) |
| $10,000 to $14,999 | 8 (6.5%) | 10 (12.7%) |
| $15,000 to $19,999 | 7 (5.7%) | 0 (0.0%) |
| $20,000 to $24,999 | 11 (8.9%) | 14 (17.7%) |
| $25,000 to $34,999 | 15 (12.1%) | 20 (25.3%) |
| $35,000 to $49,999 | 39 (31.5%) | 23 (29.1%) |
| $50,000 to $74,999 | 16 (12.9%) | 0 (0.0%) |
| $75,000 to $99,999 | 20 (16.1%) | 0 (0.0%) |
| $100,000 to $149,999 | 3 (2.4%) | 3 (3.8%) |
| $150,000 or more | 0 (0.0%) | 0 (0.0%) |
| Total | 124 (100.0%) | 79 (100.0%) |
Monthly Housing Cost Tiers in Cowen
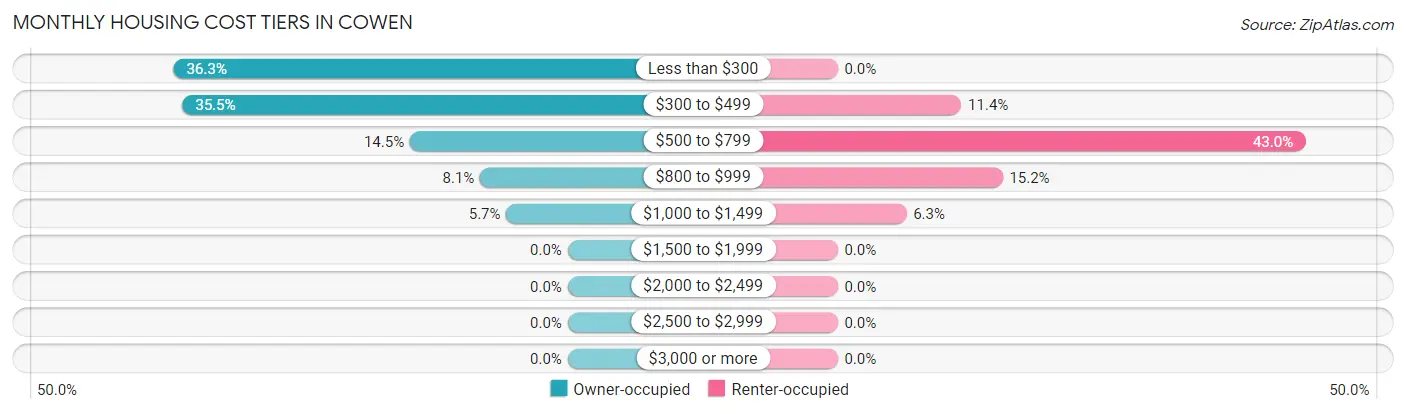
| Monthly Cost | Owner-occupied | Renter-occupied |
| Less than $300 | 45 (36.3%) | 0 (0.0%) |
| $300 to $499 | 44 (35.5%) | 9 (11.4%) |
| $500 to $799 | 18 (14.5%) | 34 (43.0%) |
| $800 to $999 | 10 (8.1%) | 12 (15.2%) |
| $1,000 to $1,499 | 7 (5.7%) | 5 (6.3%) |
| $1,500 to $1,999 | 0 (0.0%) | 0 (0.0%) |
| $2,000 to $2,499 | 0 (0.0%) | 0 (0.0%) |
| $2,500 to $2,999 | 0 (0.0%) | 0 (0.0%) |
| $3,000 or more | 0 (0.0%) | 0 (0.0%) |
| Total | 124 (100.0%) | 79 (100.0%) |
Physical Housing Characteristics in Cowen
Housing Structures in Cowen
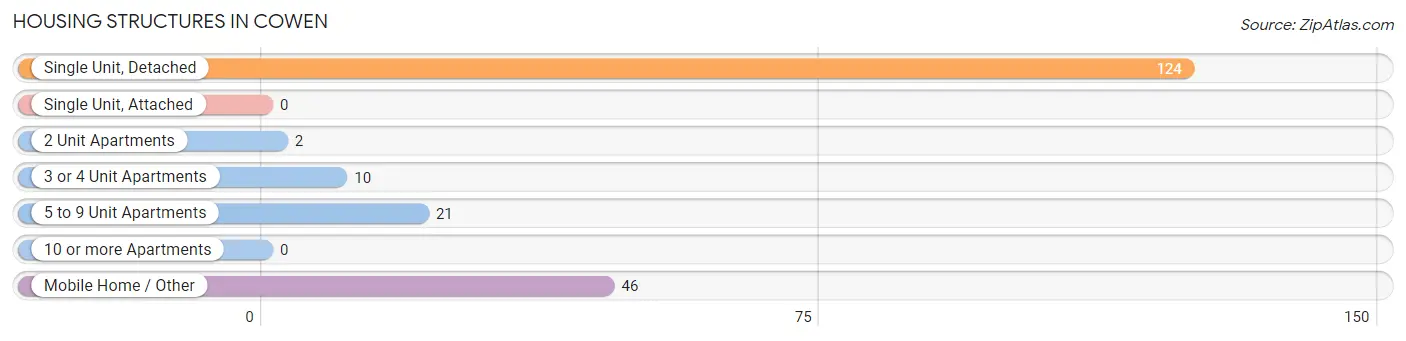
| Structure Type | # Housing Units | % Housing Units |
| Single Unit, Detached | 124 | 61.1% |
| Single Unit, Attached | 0 | 0.0% |
| 2 Unit Apartments | 2 | 1.0% |
| 3 or 4 Unit Apartments | 10 | 4.9% |
| 5 to 9 Unit Apartments | 21 | 10.3% |
| 10 or more Apartments | 0 | 0.0% |
| Mobile Home / Other | 46 | 22.7% |
| Total | 203 | 100.0% |
Housing Structures by Occupancy in Cowen
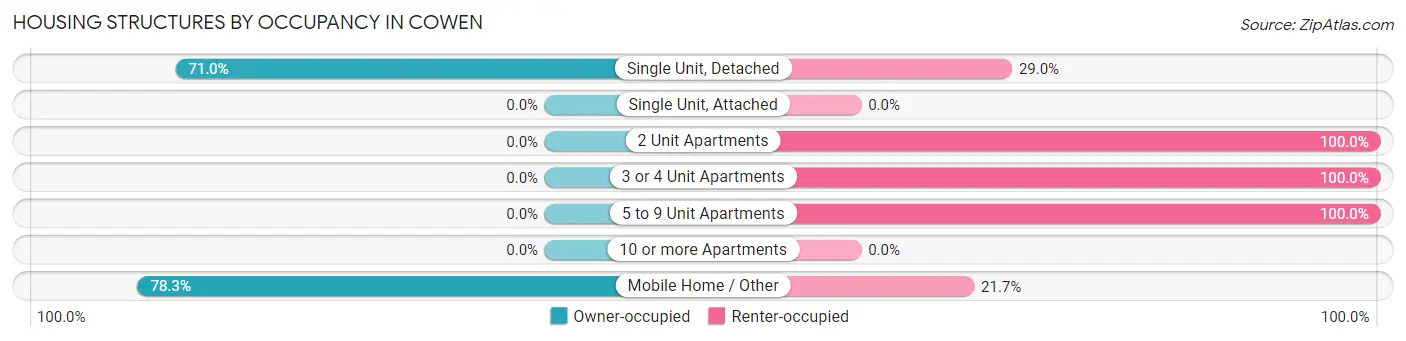
| Structure Type | Owner-occupied | Renter-occupied |
| Single Unit, Detached | 88 (71.0%) | 36 (29.0%) |
| Single Unit, Attached | 0 (0.0%) | 0 (0.0%) |
| 2 Unit Apartments | 0 (0.0%) | 2 (100.0%) |
| 3 or 4 Unit Apartments | 0 (0.0%) | 10 (100.0%) |
| 5 to 9 Unit Apartments | 0 (0.0%) | 21 (100.0%) |
| 10 or more Apartments | 0 (0.0%) | 0 (0.0%) |
| Mobile Home / Other | 36 (78.3%) | 10 (21.7%) |
| Total | 124 (61.1%) | 79 (38.9%) |
Housing Structures by Number of Rooms in Cowen
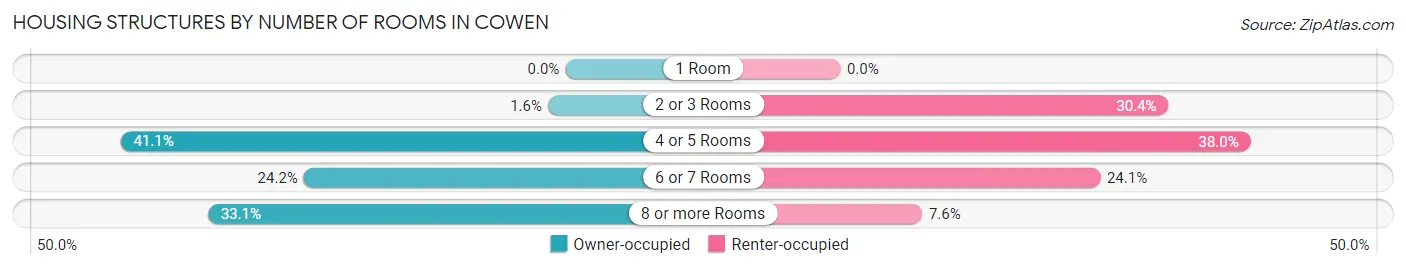
| Number of Rooms | Owner-occupied | Renter-occupied |
| 1 Room | 0 (0.0%) | 0 (0.0%) |
| 2 or 3 Rooms | 2 (1.6%) | 24 (30.4%) |
| 4 or 5 Rooms | 51 (41.1%) | 30 (38.0%) |
| 6 or 7 Rooms | 30 (24.2%) | 19 (24.0%) |
| 8 or more Rooms | 41 (33.1%) | 6 (7.6%) |
| Total | 124 (100.0%) | 79 (100.0%) |
Housing Structure by Heating Type in Cowen
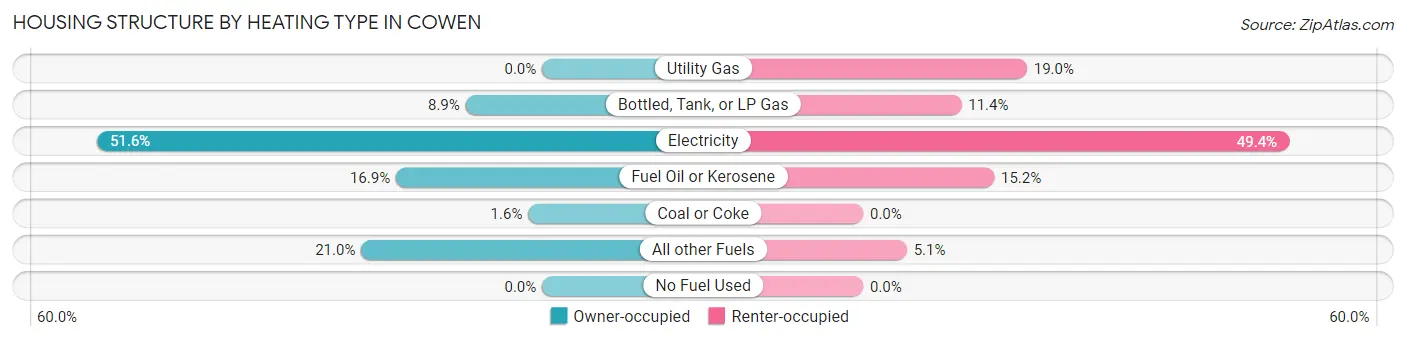
| Heating Type | Owner-occupied | Renter-occupied |
| Utility Gas | 0 (0.0%) | 15 (19.0%) |
| Bottled, Tank, or LP Gas | 11 (8.9%) | 9 (11.4%) |
| Electricity | 64 (51.6%) | 39 (49.4%) |
| Fuel Oil or Kerosene | 21 (16.9%) | 12 (15.2%) |
| Coal or Coke | 2 (1.6%) | 0 (0.0%) |
| All other Fuels | 26 (21.0%) | 4 (5.1%) |
| No Fuel Used | 0 (0.0%) | 0 (0.0%) |
| Total | 124 (100.0%) | 79 (100.0%) |
Household Vehicle Usage in Cowen
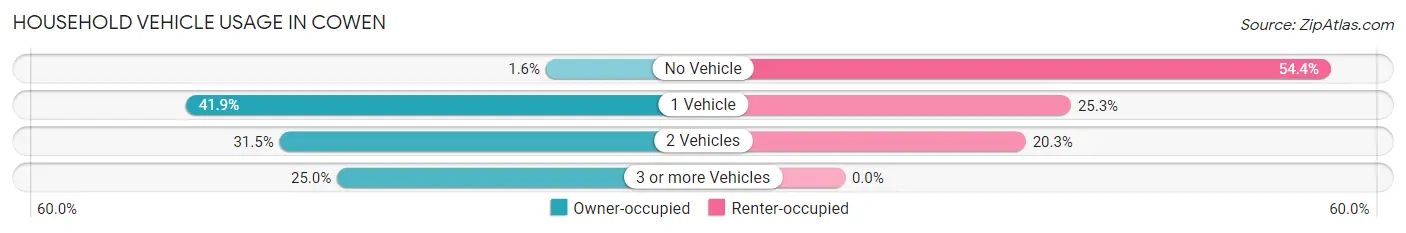
| Vehicles per Household | Owner-occupied | Renter-occupied |
| No Vehicle | 2 (1.6%) | 43 (54.4%) |
| 1 Vehicle | 52 (41.9%) | 20 (25.3%) |
| 2 Vehicles | 39 (31.5%) | 16 (20.3%) |
| 3 or more Vehicles | 31 (25.0%) | 0 (0.0%) |
| Total | 124 (100.0%) | 79 (100.0%) |
Real Estate & Mortgages in Cowen
Real Estate and Mortgage Overview in Cowen
| Characteristic | Without Mortgage | With Mortgage |
| Housing Units | 92 | 32 |
| Median Property Value | $48,000 | $59,100 |
| Median Household Income | $36,000 | $0 |
| Monthly Housing Costs | $303 | $0 |
| Real Estate Taxes | $279 | $0 |
Property Value by Mortgage Status in Cowen
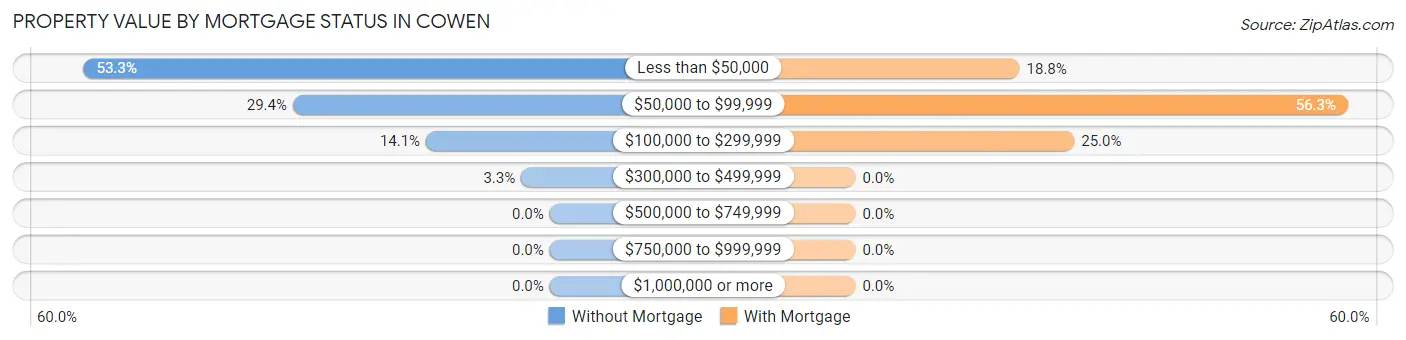
| Property Value | Without Mortgage | With Mortgage |
| Less than $50,000 | 49 (53.3%) | 6 (18.8%) |
| $50,000 to $99,999 | 27 (29.3%) | 18 (56.2%) |
| $100,000 to $299,999 | 13 (14.1%) | 8 (25.0%) |
| $300,000 to $499,999 | 3 (3.3%) | 0 (0.0%) |
| $500,000 to $749,999 | 0 (0.0%) | 0 (0.0%) |
| $750,000 to $999,999 | 0 (0.0%) | 0 (0.0%) |
| $1,000,000 or more | 0 (0.0%) | 0 (0.0%) |
| Total | 92 (100.0%) | 32 (100.0%) |
Household Income by Mortgage Status in Cowen
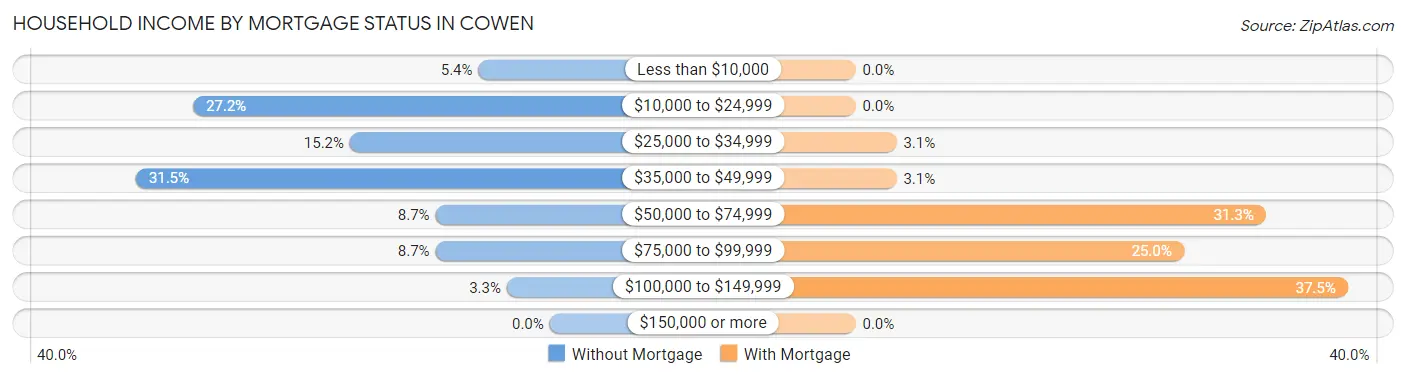
| Household Income | Without Mortgage | With Mortgage |
| Less than $10,000 | 5 (5.4%) | 0 (0.0%) |
| $10,000 to $24,999 | 25 (27.2%) | 0 (0.0%) |
| $25,000 to $34,999 | 14 (15.2%) | 1 (3.1%) |
| $35,000 to $49,999 | 29 (31.5%) | 1 (3.1%) |
| $50,000 to $74,999 | 8 (8.7%) | 10 (31.2%) |
| $75,000 to $99,999 | 8 (8.7%) | 8 (25.0%) |
| $100,000 to $149,999 | 3 (3.3%) | 12 (37.5%) |
| $150,000 or more | 0 (0.0%) | 0 (0.0%) |
| Total | 92 (100.0%) | 32 (100.0%) |
Property Value to Household Income Ratio in Cowen
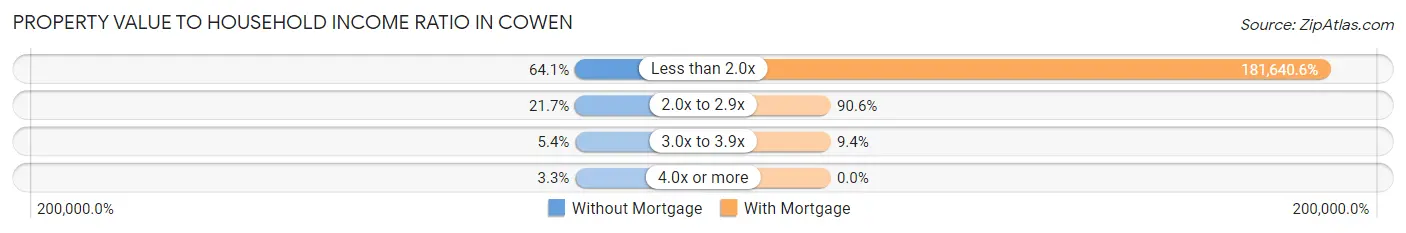
| Value-to-Income Ratio | Without Mortgage | With Mortgage |
| Less than 2.0x | 59 (64.1%) | 58,125 (181,640.6%) |
| 2.0x to 2.9x | 20 (21.7%) | 29 (90.6%) |
| 3.0x to 3.9x | 5 (5.4%) | 3 (9.4%) |
| 4.0x or more | 3 (3.3%) | 0 (0.0%) |
| Total | 92 (100.0%) | 32 (100.0%) |
Real Estate Taxes by Mortgage Status in Cowen
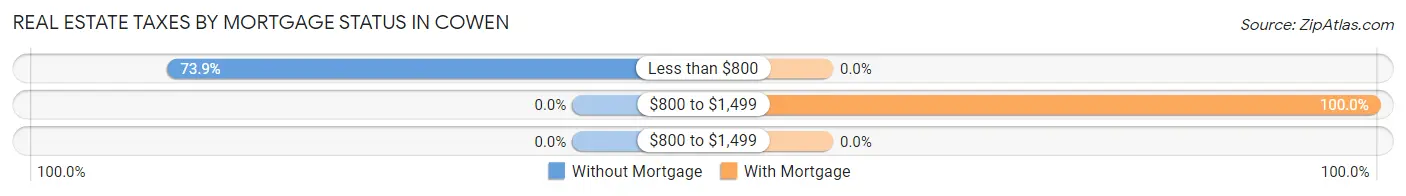
| Property Taxes | Without Mortgage | With Mortgage |
| Less than $800 | 68 (73.9%) | 0 (0.0%) |
| $800 to $1,499 | 0 (0.0%) | 32 (100.0%) |
| $800 to $1,499 | 0 (0.0%) | 0 (0.0%) |
| Total | 92 (100.0%) | 32 (100.0%) |
Health & Disability in Cowen
Health Insurance Coverage by Age in Cowen
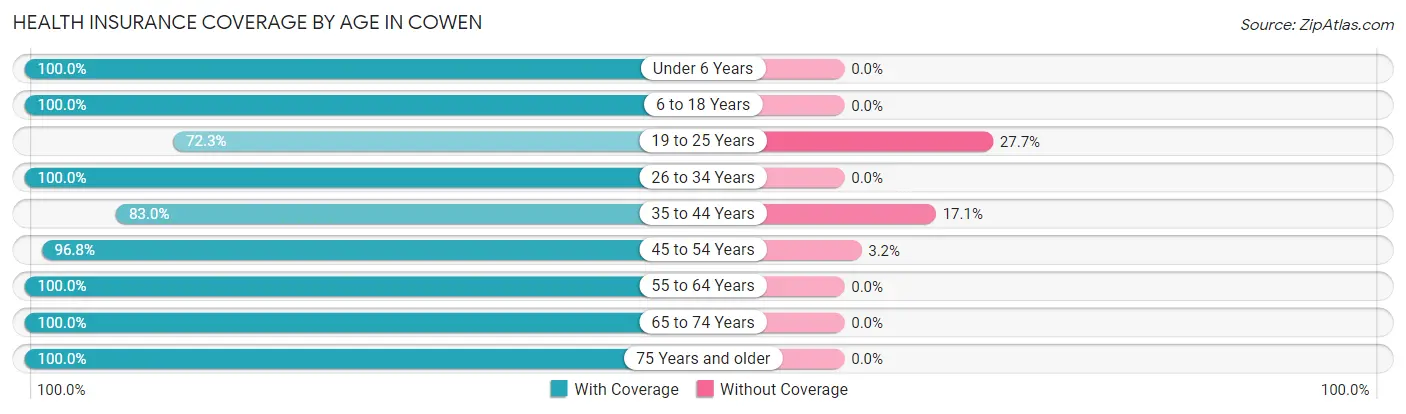
| Age Bracket | With Coverage | Without Coverage |
| Under 6 Years | 25 (100.0%) | 0 (0.0%) |
| 6 to 18 Years | 48 (100.0%) | 0 (0.0%) |
| 19 to 25 Years | 60 (72.3%) | 23 (27.7%) |
| 26 to 34 Years | 68 (100.0%) | 0 (0.0%) |
| 35 to 44 Years | 73 (83.0%) | 15 (17.1%) |
| 45 to 54 Years | 61 (96.8%) | 2 (3.2%) |
| 55 to 64 Years | 57 (100.0%) | 0 (0.0%) |
| 65 to 74 Years | 62 (100.0%) | 0 (0.0%) |
| 75 Years and older | 95 (100.0%) | 0 (0.0%) |
| Total | 549 (93.2%) | 40 (6.8%) |
Health Insurance Coverage by Citizenship Status in Cowen
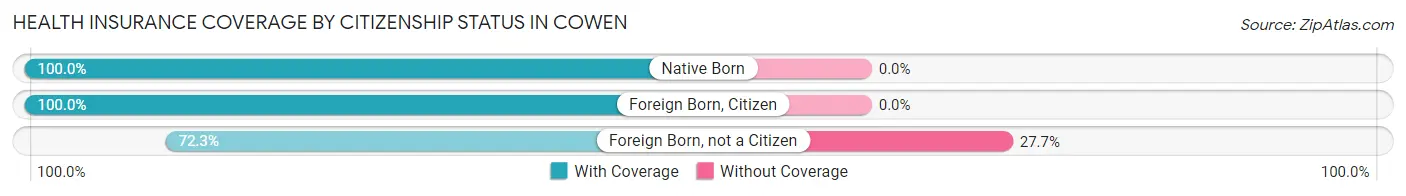
| Citizenship Status | With Coverage | Without Coverage |
| Native Born | 25 (100.0%) | 0 (0.0%) |
| Foreign Born, Citizen | 48 (100.0%) | 0 (0.0%) |
| Foreign Born, not a Citizen | 60 (72.3%) | 23 (27.7%) |
Health Insurance Coverage by Household Income in Cowen
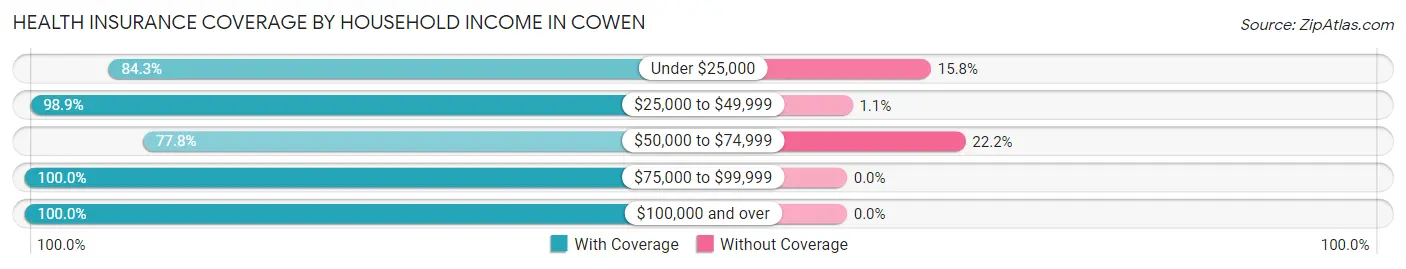
| Household Income | With Coverage | Without Coverage |
| Under $25,000 | 123 (84.3%) | 23 (15.8%) |
| $25,000 to $49,999 | 279 (98.9%) | 3 (1.1%) |
| $50,000 to $74,999 | 49 (77.8%) | 14 (22.2%) |
| $75,000 to $99,999 | 88 (100.0%) | 0 (0.0%) |
| $100,000 and over | 10 (100.0%) | 0 (0.0%) |
Public vs Private Health Insurance Coverage by Age in Cowen
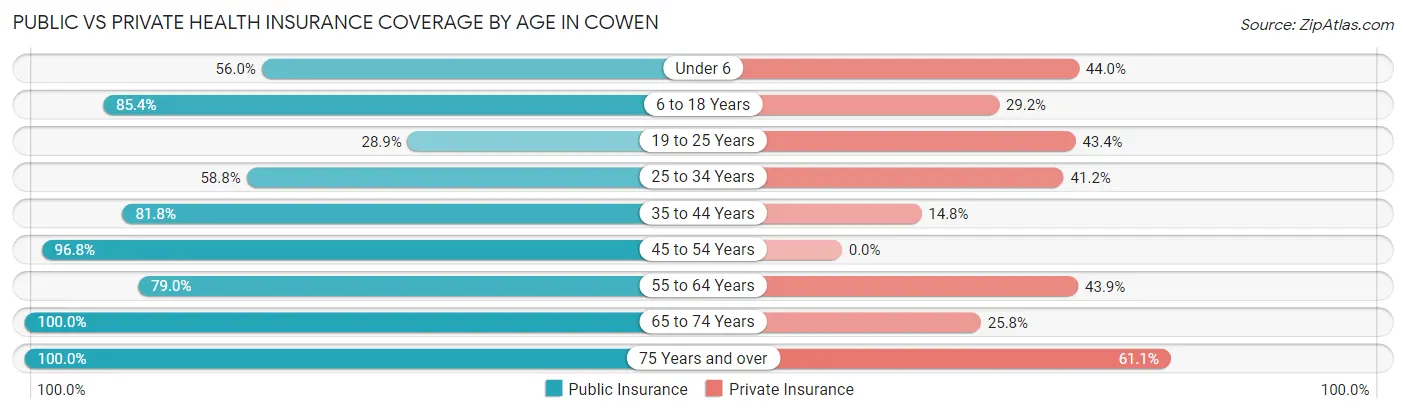
| Age Bracket | Public Insurance | Private Insurance |
| Under 6 | 14 (56.0%) | 11 (44.0%) |
| 6 to 18 Years | 41 (85.4%) | 14 (29.2%) |
| 19 to 25 Years | 24 (28.9%) | 36 (43.4%) |
| 25 to 34 Years | 40 (58.8%) | 28 (41.2%) |
| 35 to 44 Years | 72 (81.8%) | 13 (14.8%) |
| 45 to 54 Years | 61 (96.8%) | 0 (0.0%) |
| 55 to 64 Years | 45 (78.9%) | 25 (43.9%) |
| 65 to 74 Years | 62 (100.0%) | 16 (25.8%) |
| 75 Years and over | 95 (100.0%) | 58 (61.1%) |
| Total | 454 (77.1%) | 201 (34.1%) |
Disability Status by Sex by Age in Cowen
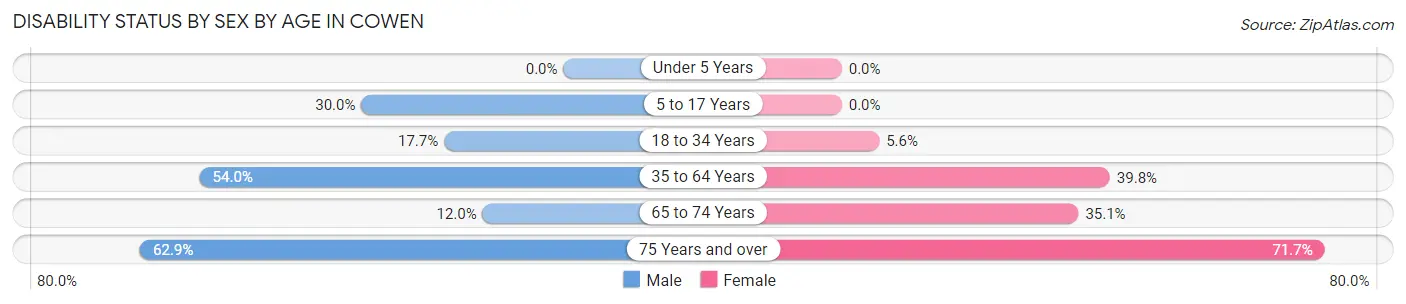
| Age Bracket | Male | Female |
| Under 5 Years | 0 (0.0%) | 0 (0.0%) |
| 5 to 17 Years | 6 (30.0%) | 0 (0.0%) |
| 18 to 34 Years | 14 (17.7%) | 4 (5.6%) |
| 35 to 64 Years | 54 (54.0%) | 43 (39.8%) |
| 65 to 74 Years | 3 (12.0%) | 13 (35.1%) |
| 75 Years and over | 22 (62.9%) | 43 (71.7%) |
Disability Class by Sex by Age in Cowen
Disability Class: Hearing Difficulty
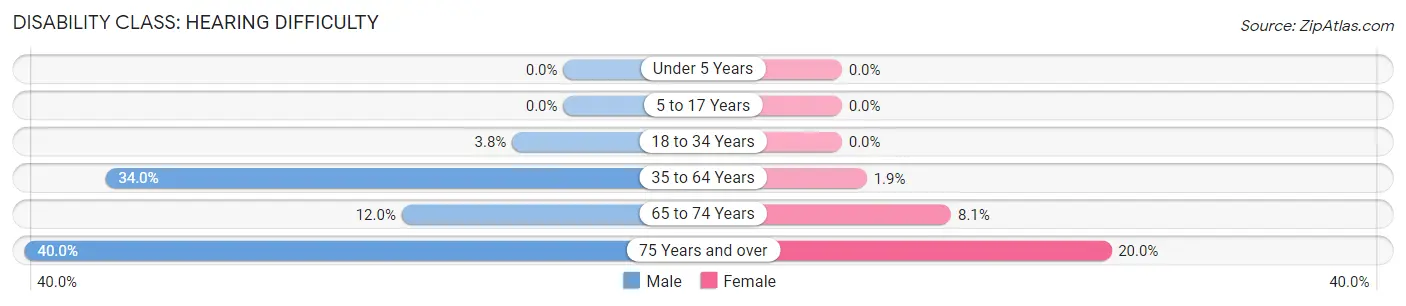
| Age Bracket | Male | Female |
| Under 5 Years | 0 (0.0%) | 0 (0.0%) |
| 5 to 17 Years | 0 (0.0%) | 0 (0.0%) |
| 18 to 34 Years | 3 (3.8%) | 0 (0.0%) |
| 35 to 64 Years | 34 (34.0%) | 2 (1.8%) |
| 65 to 74 Years | 3 (12.0%) | 3 (8.1%) |
| 75 Years and over | 14 (40.0%) | 12 (20.0%) |
Disability Class: Vision Difficulty
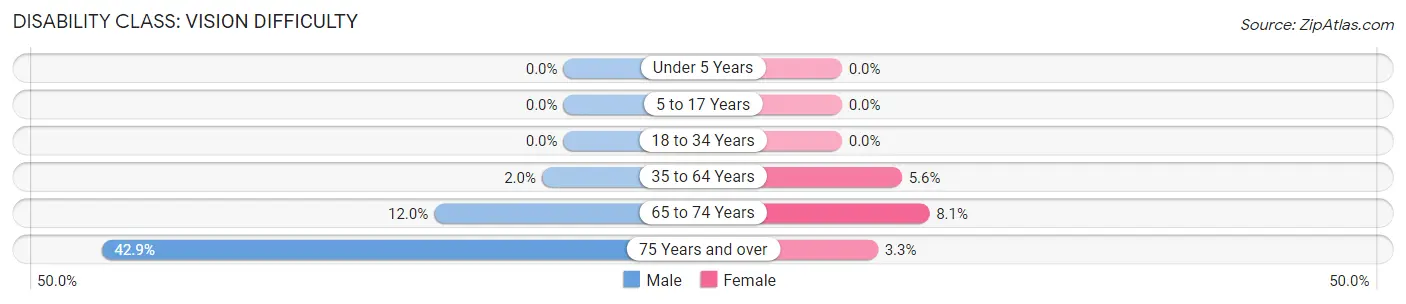
| Age Bracket | Male | Female |
| Under 5 Years | 0 (0.0%) | 0 (0.0%) |
| 5 to 17 Years | 0 (0.0%) | 0 (0.0%) |
| 18 to 34 Years | 0 (0.0%) | 0 (0.0%) |
| 35 to 64 Years | 2 (2.0%) | 6 (5.6%) |
| 65 to 74 Years | 3 (12.0%) | 3 (8.1%) |
| 75 Years and over | 15 (42.9%) | 2 (3.3%) |
Disability Class: Cognitive Difficulty
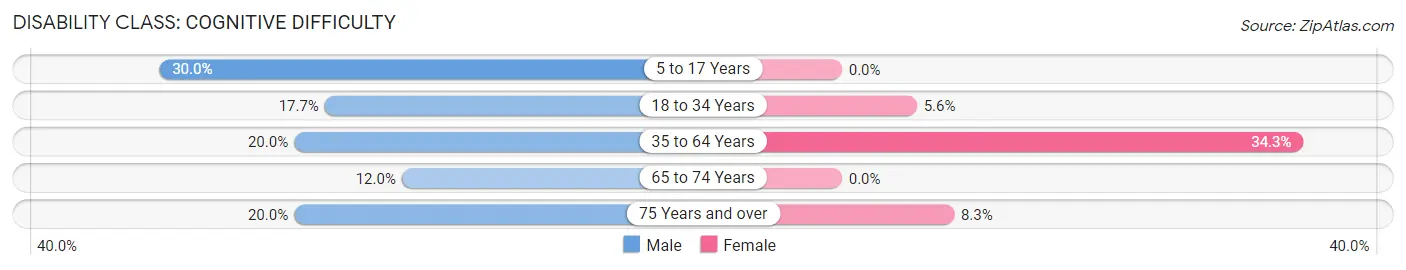
| Age Bracket | Male | Female |
| 5 to 17 Years | 6 (30.0%) | 0 (0.0%) |
| 18 to 34 Years | 14 (17.7%) | 4 (5.6%) |
| 35 to 64 Years | 20 (20.0%) | 37 (34.3%) |
| 65 to 74 Years | 3 (12.0%) | 0 (0.0%) |
| 75 Years and over | 7 (20.0%) | 5 (8.3%) |
Disability Class: Ambulatory Difficulty
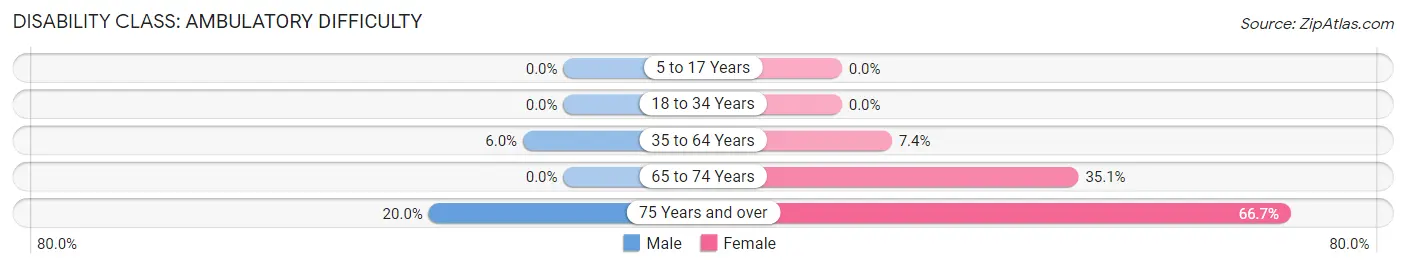
| Age Bracket | Male | Female |
| 5 to 17 Years | 0 (0.0%) | 0 (0.0%) |
| 18 to 34 Years | 0 (0.0%) | 0 (0.0%) |
| 35 to 64 Years | 6 (6.0%) | 8 (7.4%) |
| 65 to 74 Years | 0 (0.0%) | 13 (35.1%) |
| 75 Years and over | 7 (20.0%) | 40 (66.7%) |
Disability Class: Self-Care Difficulty
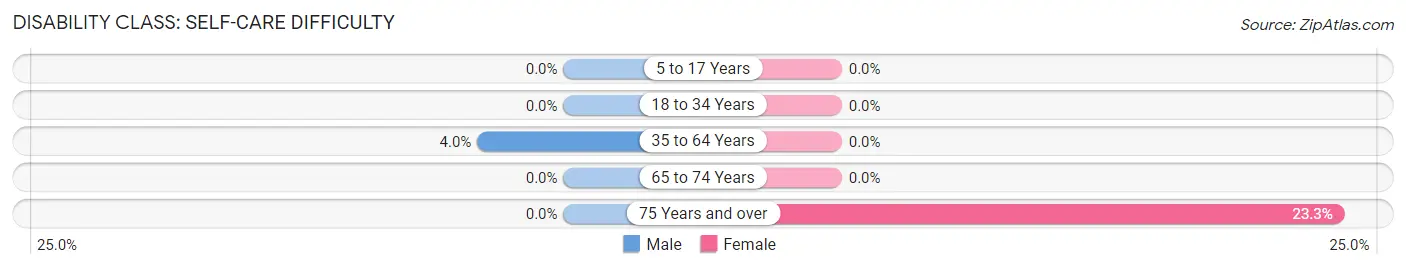
| Age Bracket | Male | Female |
| 5 to 17 Years | 0 (0.0%) | 0 (0.0%) |
| 18 to 34 Years | 0 (0.0%) | 0 (0.0%) |
| 35 to 64 Years | 4 (4.0%) | 0 (0.0%) |
| 65 to 74 Years | 0 (0.0%) | 0 (0.0%) |
| 75 Years and over | 0 (0.0%) | 14 (23.3%) |
Technology Access in Cowen
Computing Device Access in Cowen
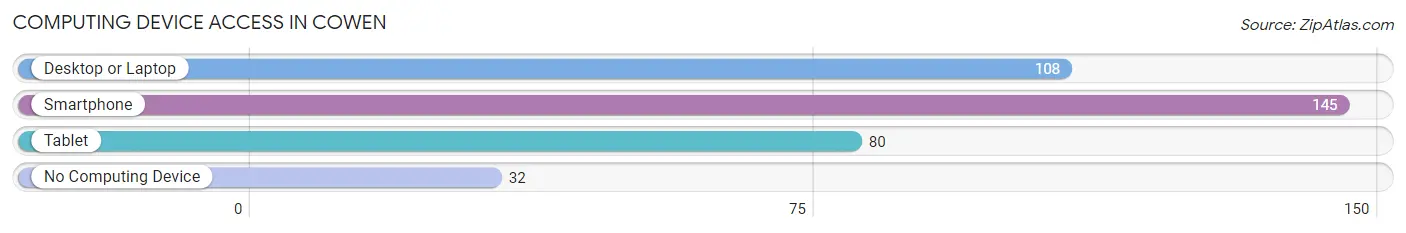
| Device Type | # Households | % Households |
| Desktop or Laptop | 108 | 53.2% |
| Smartphone | 145 | 71.4% |
| Tablet | 80 | 39.4% |
| No Computing Device | 32 | 15.8% |
| Total | 203 | 100.0% |
Internet Access in Cowen
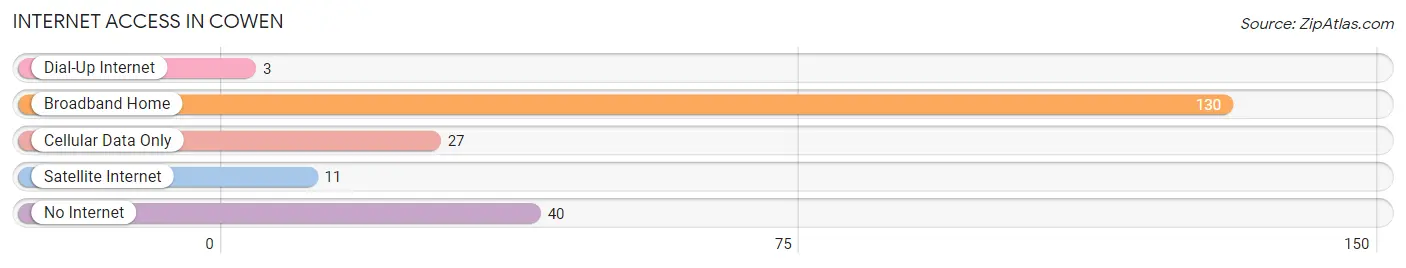
| Internet Type | # Households | % Households |
| Dial-Up Internet | 3 | 1.5% |
| Broadband Home | 130 | 64.0% |
| Cellular Data Only | 27 | 13.3% |
| Satellite Internet | 11 | 5.4% |
| No Internet | 40 | 19.7% |
| Total | 203 | 100.0% |
Cowen Summary
History
The history of Cowen, West Virginia dates back to the early 19th century. The town was founded in 1818 by William Cowen, a settler from Virginia. Cowen was a small farming community that grew slowly over the years. In 1872, the town was incorporated and the first mayor was elected.
The town grew steadily throughout the 19th century, and by the early 20th century, it had become a bustling commercial center. The town was home to several businesses, including a sawmill, a gristmill, a blacksmith shop, and a general store.
In the early 1900s, the town was connected to the rest of the state by the Chesapeake and Ohio Railway. This allowed for the transportation of goods and people to and from Cowen.
The town continued to grow throughout the 20th century, and by the year 2000, it had a population of 1,845.
Geography
Cowen is located in Webster County, West Virginia. It is situated in the Appalachian Mountains, and is surrounded by the Monongahela National Forest. The town is located at the intersection of US Route 19 and West Virginia Route 20.
The town is situated at an elevation of 1,845 feet above sea level. The climate is humid continental, with hot summers and cold winters. The average annual temperature is 54 degrees Fahrenheit.
The town is located near several rivers, including the Elk River, the Gauley River, and the Cheat River. The town is also located near several lakes, including Summersville Lake and Stonewall Jackson Lake.
Economy
The economy of Cowen is largely based on tourism and agriculture. The town is home to several tourist attractions, including the West Virginia State Wildlife Center, the West Virginia State Museum, and the West Virginia State Fairgrounds.
The town is also home to several farms, which produce a variety of crops, including corn, soybeans, hay, and wheat. The town is also home to several small businesses, including restaurants, retail stores, and service providers.
Demographics
As of the 2000 census, the population of Cowen was 1,845. The racial makeup of the town was 97.3% White, 0.7% African American, 0.2% Native American, 0.2% Asian, 0.1% Pacific Islander, 0.2% from other races, and 1.3% from two or more races. Hispanic or Latino of any race were 0.7% of the population.
The median income for a household in the town was $25,938, and the median income for a family was $31,250. The per capita income for the town was $14,845. About 16.2% of families and 19.2% of the population were below the poverty line, including 25.2% of those under age 18 and 11.2% of those age 65 or over.
Common Questions
What is Per Capita Income in Cowen?
Per Capita income in Cowen is $16,398.
What is the Median Family Income in Cowen?
Median Family Income in Cowen is $29,250.
What is the Median Household income in Cowen?
Median Household Income in Cowen is $35,272.
What is Inequality or Gini Index in Cowen?
Inequality or Gini Index in Cowen is 0.37.
What is the Total Population of Cowen?
Total Population of Cowen is 589.
What is the Total Male Population of Cowen?
Total Male Population of Cowen is 259.
What is the Total Female Population of Cowen?
Total Female Population of Cowen is 330.
What is the Ratio of Males per 100 Females in Cowen?
There are 78.48 Males per 100 Females in Cowen.
What is the Ratio of Females per 100 Males in Cowen?
There are 127.41 Females per 100 Males in Cowen.
What is the Median Population Age in Cowen?
Median Population Age in Cowen is 40.4 Years.
What is the Average Family Size in Cowen
Average Family Size in Cowen is 3.4 People.
What is the Average Household Size in Cowen
Average Household Size in Cowen is 2.9 People.
How Large is the Labor Force in Cowen?
There are 163 People in the Labor Forcein in Cowen.
What is the Percentage of People in the Labor Force in Cowen?
30.8% of People are in the Labor Force in Cowen.
What is the Unemployment Rate in Cowen?
Unemployment Rate in Cowen is 31.9%.